Accounting for
Economic Activities
in Large Marine Ecosystems
and Regional Seas
UNEP Regional Seas Reports and Studies No. 181
UNEP/RSP and NOAA LME Partnership
Prepared by:
Porter Hoagland and Di Jin
Marine Policy Center
Woods Hole Oceanographic Institution (WHOI), Woods Hole, MA 02543 USA
UNEP 2006
Foreword
A healthy marine and coastal environment is essential for human well-being and for sustainable
development. It provides many different functions linked to public health, food security, transport,
recreation, and other economic and social benefits. The annual sales value of the goods and
services derived from the marine and coastal environment has been estimated in the tens of
billions of dollars. Some 80% of the pollution load in the oceans originates from land-based
activities, adversely affecting productive areas of the environment. A thorough evaluation of the net
economic value of goods and services that the oceans and coasts provide remains a challenge.
This report has been commissioned within the framework of the RS/LME partnership, which was
developed to link the coastal and marine activities of the global Regional Seas Programmes (RS)
coordinated by UNEP with the Large Marine Ecosystem (LME) approach. The joint initiative
contributes to one of the global Regional Seas Strategic Directions, which calls to "develop and
promote a common vision and integrated management, based on ecosystem approaches, of
priorities and concerns related to the coastal and marine environment and its resources in
Regional Seas Conventions and Action Plans, introducing amongst others proactive, creative and
innovative partnerships and networks and effective communication strategies."
The report compiles estimates of activity levels of the relevant marine sectors (e.g fisheries,
aquaculture, tourism, shipping, oil etc.) of countries bordering the world's LMEs and RSs. The
authors develop an index approach to assess the extent of the human uses of regional ocean
areas and regional socio-economic development. Two case studies have been included exploring
the scale of economic rents (revenues minus costs) and direct output impacts (gross revenues)
that could be a source of sustainable financing for conserving and managing regional marine
environments. It is targeted towards government policy- and decision-makers with the aim of
highlighting the potential value of goods and services provided by the marine and coastal
environment.
Positive actions are required on the part of governments and the civil society to manage and
sustain the marine and coastal environment and its resources. The Regional Seas Programmes
provide a policy framework for the regional implementation of the Global Programme of Action for
the Protection of the Marine Environment from Land-based Activities (GPA). The RS/LME
partnership and the GEF/LME approach to ecosystem-based management are crucial elements in
the implementation of the GPA. In addressing ecosystem approaches among other JPOI targets,
the 2nd Intergovernmental Review Meeting of the GPA (IGR2) provides a step forward in
international action for realistically assessing the value of goods and services provided by the
marine and coastal environment and for increasing ownership and commitment in allocating
sufficient resources for its conservation.
This report will be disseminated at the highest policy level to enhance the understanding of the
value of marine resources and to increase financial commitment and ownership in managing and
conserving the marine and coastal environment in the long-term.
Dr. Veerle Vandeweerd
United Nations Environment Programme
Head, Regional Seas Programme
Coordinator, GPA
Table of Contents
User Guide. . . . . . . . . . . . . . . . . . . . . . . . . . . . . . . . . . . . . . . . . . . . . . . . . . . . . . ii
Executive Summary . . . . . . . . . . . . . . . . . . . . . . . . . . . . . . . . . . . . . . . . . . . . . . .iv
I. Introduction and Purpose . . . . . . . . . . . . . . . . . . . . . . . . . . . . . . . . . . . . . . . .1
II. Marine Activity Database. . . . . . . . . . . . . . . . . . . . . . . . . . . . . . . . . . . . . . . . 3
III. Methodology . . . . . . . . . . . . . . . . . . . . . . . . . . . . . . . . . . . . . . . . . . . . . . . . . 5
A. Total economic value (TEV) as a single metric . . . . . . . . . . . . . . . . . . .5
B. Direct output impacts (DOIs) as a single metric . . . . . . . . . . . . . . . . . .6
C. Marine activity indexes (MAIs) as a single metric . . . . . . . . . . . . . . . . .7
D. The problem of regional aggregation. . . . . . . . . . . . . . . . . . . . . . . . . . .8
IV. Calculation of the Marine Activity Index (MAI) . . . . . . . . . . . . . . . . . . . . . . 10
V.
Results of the Index Approach . . . . . . . . . . . . . . . . . . . . . . . . . . . . . . . . . .14
VI. Discussion. . . . . . . . . . . . . . . . . . . . . . . . . . . . . . . . . . . . . . . . . . . . . . . . . .17
VII. Summary and Conclusions. . . . . . . . . . . . . . . . . . . . . . . . . . . . . . . . . . . . .20
VIII. References . . . . . . . . . . . . . . . . . . . . . . . . . . . . . . . . . . . . . . . . . . . . . . . . .21
Annex I: Case Study: Benguela Current Large Marine Ecosystem. . . . . . . . . A1-1
Annex II: Case Study: Yellow Sea Large Marine Ecosystem. . . . . . . . . . . . . .AII-1
i
USER GUIDE
Our purpose in producing this report is to provide a decision-making tool for international
financial and natural resource management institutions to use in setting priorities for allocating
financial resources toward the sustainable management of Large Marine Ecosystems (LMEs)
located within Regional Seas areas.
We develop an index that is a measure of the intensity of marine activities in these
regions. We compare this marine activity index (MAI) with an index of socioeconomic
development, the UNDP's human development index (HDI), across ocean regions. This
comparison identifies regions that may be capable of achieving on their own the sustainable
development of their regional marine environment and those that are less likely to do so. The
latter may be candidates for international financial or management assistance. We make no
predictions or normative judgments about whether these regions will or should manage for
sustainability.
Our index approach is meant as a tool for setting priorities, given limited international
financial and management resources for assisting regions in moving toward sustainable
development. The tool should be used in conjunction with additional information, such as data
and expertise on environmental conditions and ecological status. Knowledge of the national
and international legal institutions and the political context of each region is obviously important
as well.
The index approach is based on actual industrial and recreational activities occurring at
the national level in coastal nations. We compile publicly available worldwide data on marine
activities occurring in those coastal nations comprising large marine ecosystems (LMEs) and
Regional Seas. Data on marine activities include fish landings, aquaculture production,
shipbuilding orders, cargo traffic, merchant fleet size, oil production, oil rig counts, and tourism
arrivals.
These data can be used to compare activity levels in physical units (quantities, not
prices) for each individual marine activity across the coastal nations of the world. This kind of
comparison is valuable for gauging relative levels of economic activity by marine industrial
sector among coastal nations.
Without additional analysis or information, however, these data cannot be used to
compare the combinations of marine activities occurring in each nation across the coastal
nations of the world. Further, data in this format can provide only a very crude understanding of
activity levels for regional aggregates of all or portions of nations that are included in LMEs
and Regional Seas.
One method of creating a single metric that combines all marine activities is to express
the levels of each activity in units of a common monetary measure. There are several possible
monetary measures. The preferred monetary metric is "total economic value" (TEV). TEV
measures the net benefits (the sum of consumer and producer surpluses) that derive from a
nation's marine activities.
A readily available compilation of TEVs for marine activities in coastal nations does not
exist. TEVs would need to be calculated on activity- and location-specific bases, and there are
few studies that do so. In some cases, estimates of the producer surplus component of TEV
can be compiled. In particular, resource rents, or those producer surpluses (revenues in excess
of all costs) attributable to the exploitation of marine resources, may be estimated. If captured
by governments, resource rents provide a potential basis for financing the sustainable
ii
management of the marine environment. We present an application of the resource rent
approach in the case of the Benguela Current LME in Annex I.
A second possible monetary metric is known as "direct output impact" (DOI). DOI
measures the gross revenues or sales that derive from a nation's marine activities. As the
product of price times quantity, DOI represents the sum of benefits to producers (producer
surplus) and the costs of production. Because it includes costs and excludes benefits to
consumers, DOI is not an accurate measure of economic value. DOI can be conceptualized as
an upper bound on producer surplus, which again is only one component of TEV.
Despite the fact that a DOI metric can be readily calculated for some activities (e.g.,
offshore oil and natural gas production), it is problematic to calculate such an index for other
activities (e.g., tourism visits). As in the case of the resource rent approach, a DOI metric would
need to be calculated on an activity- and location-specific basis. We present an application of
the DOI approach in the case of the Yellow Sea LME in Annex II.
An alternative method for creating a single metric is the index approach that we present
in this report. The marine activity index (MAI) does not rely upon monetary values; it relies
instead on physical values. Each physical value is converted into an index that ranges from
zero to one. These indexes have no dimension; in other words, they are not measured in
specific units of any kind. Decision makers must make assumptions about the weights that
each activity is to be accorded when compiling an aggregate MAI from its individual activities.
Further assumptions must be made to combine each nation's MAI with others' from the relevant
region to produce a regional MAI. We present and rank regional MAIs for both LMEs and
Regional Seas.
Finally, we compare regional MAIs with a socio-economic index. This comparison is
presented in tables and in figures in our report. We classify ocean regions by low, moderate,
and high levels of both marine activity and socio-economic development. We expect that
nations involved in ocean regions characterized by high levels of socio-economic development
and moderate to high levels of marine activity are probably capable of sustainably managing
their marine environments themselves. Alternatively, we expect that nations involved in ocean
regions characterized by low to moderate levels of socio-economic development and moderate
to high levels of marine activity may need assistance in sustainable management. Special
opportunities may exist to place ocean regions that embody low levels of both socio-economic
development and marine activity on a sustainable path.
The framework developed in our study serves as a first step toward more detailed
analyses of socio-economic issues associated with LMEs and UNEP Regional Seas. Thus, the
index approach is a useful first cut at prioritizing regions that deserve closer attention as
candidates for international financial assistance to promote sustainable marine environmental
management. An important next step is to carry out detailed case studies designed to improve
our understanding of any specific ocean region, including its environmental circumstances, its
ecological conditions, its economic value, and the political feasibility of organizing a
collaboration among nations participating in the region to share the costs of sustainable
management.
iii
EXECUTIVE SUMMARY
Sixty-four large marine ecosystems (LMEs) have been identified around the
world's coastal margins. The LMEs are located within the boundaries of 18 Regional
Seas. The large ecological zones of these LMEs are economically important, producing
95 percent of the world's marine fisheries biomass, among other goods and services
valued at many trillions of dollars each year. Counterbalancing these economic benefits
is the fact that pollution is more severe in LMEs than in other ocean areas, and some
LME coastal habitats are among the most seriously degraded on earth. It is in the
world's interest to ensure that those marine resources and habitats at risk are protected
and managed sustainably for both present and future generations.
A pragmatic approach to the sustainable management of LMEs is now being
implemented by nations in Africa, Asia, Latin America, and Eastern Europe, supported
by $650 million in start-up funds from the Global Environment Facility (GEF) and other
international donors. This approach uses suites of environmental indicators to assess
the physical, biological, and human forcings on ecosystem productivity, fish and
fisheries, pollution and ecosystem health, economic development, and governance.
Over the past several years, a rapidly growing literature on LME studies has
emerged, focused mostly on issues of biological conservation; the sources, transport,
and fate of pollutants; and regional governance. In sharp contrast, analysis of the
socio-economic characteristics of LMEs has received relatively little attention to date.
Although a general framework for monitoring and assessing the socio-economic
aspects of LMEs has been developed, few detailed studies grounded in empirical data
iv
have been undertaken. In this report, we take an initial step toward the development of
a global overview of the socio-economic aspects of LMEs and Regional Seas.
We focus on the following two broad questions regarding the sustainable
management of the marine environment in an LME and Regional Sea:
1. Can the level of marine activity in an LME and Regional Sea be considered
sustainable?
2. Are the nations participating in the relevant LME and Regional Sea capable of
financing programs of sustainable management themselves?
In order to begin to address the first question, we develop a measure of marine
industry activities for each LME and Regional Sea. Given the nature of the data on
economic activity that is available on a consistent basis across nations, our preferred
measures of marine activities are sets of indexes. We expect that higher levels of
industrial activity exert greater pressure on the ecosystem, say, through pollution or
resource depletion, and that lower activity levels exert less pressure.
For a given activity level, however, the scale of negative ecological impacts may
not be the same for coastal nations in different stages of economic development, as
measured by income levels or some other metric. For example, the environmental
Kuznets hypothesis suggests that there exists an inverted U-shape relationship in an
economy between pollution intensity and income per capita. At low levels of income,
economic development would lead to increasing levels of pollution emissions. As
economic growth leads to income levels that exceed a threshold, however, a society's
demand for environmental quality increases, and its pollution emissions decline.
In order to begin to address the second question, we examine the relationship
between a measure of socio-economic development, namely UNDP's human
development index (HDI), and measures of marine activity. The HDI measure is useful
v
in thinking about the second question, because we expect that developed nations that
exhibit higher levels of income are more likely to be capable of financing programs of
sustainable LME management themselves.
We develop a ranking of LMEs and Regional Seas by various measures of
marine activity and by socio-economic development. This ranking process should
assist responsible international organizations and donors in developing funding and
assistance priorities based upon the revealed characteristics of LMEs.
Our study results include the following:
∑ the compilation of data and the construction of an international database on
marine activities for all coastal nations relating to fish landings, aquaculture
production, shipbuilding orders, cargo traffic, merchant fleet size, oil production,
oil rig counts, and tourism;
∑ the development of indexes for each of these marine activities, and the
aggregation of sets of activities into industry sector indexes;
∑ the adaptation of these indexes and a separate socio-economic index to
characterize the marine activity levels of LMEs and Regional Seas;
∑ the development of a ranking of LMEs and Regional Seas according to total
marine activity levels, industry sectoral activity levels, and socio-economic status;
∑ a graphical presentation of the rankings to facilitate the identification of
international management and development assistance priorities;
∑ the development of a case study exploring the scale of resource rents in the
Benguela Current LME and the management issues and sustainable
development priorities of the region;
∑ the development of a case study exploring the scale of direct output impacts in
the Yellow Sea LME and the regional management issues and sustainable
development priorities.
We reach six general conclusions relating to the potential for the sustainable
management of marine environments in LMEs or Regional Seas:
∑ Our examination of the two cases--one of an upwelling, the other of a
continental shelf LME--have reinforced our original opinions as to the benefit of
the GEF-sponsored efforts to encourage sustainable management. In particular,
the detailed studies, capacity building, and reorientation of the policy focus from
resource exploitation to sustainable management have been the most positive
vi
effects in these two cases. Based upon what we have been able to learn about
these two cases, we expect that the nations of the region will be fully capable
and willing to continue their programs of sustainable development in the future.
∑ The compilation of data and the development of an international database on
marine activity levels in coastal nations, LMEs, and Regional Seas is likely to be
of considerable value for conducting preliminary screening and prioritization of
marine regions that are in need of international attention and support for
organizing programs of sustainable development.
∑ For those LMEs or Regional Seas that are identified as priorities from the marine
activity and socio-economic development rankings, detailed case studies should
be conducted.
∑ Case studies should focus on the following:
∑ characterizing marine activities at the sub-national level within the LME
and Regional Sea;
∑ estimating the scale of resource rents that could obtain from the efficient
management of the marine resources of the LME and Regional Sea;
∑ clarifying, where relevant and necessary, the need for and the costs
involved in the international regulation of natural resources or the
management of transboundary environmental degradations;
∑ identifying the set of sustainable development policy priorities in each of
the nations of the region (including priorities unrelated to the marine
environment); and
∑ understanding the willingness of the nations participating in the region to
devote some fraction of rents from marine resources to the sustainable
management of their shared ecosystem.
∑ The efforts of international organizations to encourage the sustainable
development of LMEs and Regional Seas is obviously an important goal. We
recognize, however, that decisions about sustainable development are policy
decisions that must be made by each coastal nation independently and, where
feasible, in concert with the other nations of the region.
∑ Whether coastal nations will work together to solve the issues that pervade LMEs
or Regional Seas will depend upon the benefits that each nation expects from its
cooperation with others. Hence, clarifying in detail the nature of the benefits to
individual nations of international cooperation within LMEs and Regional Seas is
of fundamental importance.
vii
ACCOUNTING FOR ECONOMIC ACTIVITIES IN LARGE MARINE ECOSYSTEMS
AND THE REGIONAL SEAS
I. Introduction and Purpose
Over the past several years, a rapidly growing literature on large marine
ecosystems (LMEs) has emerged, focused mostly on issues of biological
conservation; the sources, transport, and fate of pollutants; and regional
governance (Duda and Sherman 2002; Sherman et al. 1996). Increasingly, the
results of scientific research have revealed the degradation of ocean regions,
including coastal pollution, the over-exploitation of fisheries, invasions of exotic
species, and blooms of harmful algae, among other effects. The hope is that
increased attention to these problems will motivate the nations of the relevant
regions to manage their marine environments more sustainably.
In sharp contrast to these scientific studies, analysis of the socioeconomic
characteristics of large ocean regions has received relatively little attention to
date.1 Although a general framework for monitoring and assessing the
socioeconomic aspects of LMEs has been developed (viz., Wang 2004; Sutinen
2000), few detailed studies grounded in empirical data have been undertaken.
Characterizing the socioeconomic features of ocean regions is critical to
developing an understanding of the extent to which nations have the financial
resources to undertake programs of sustainable development.
In this report, we take an initial step toward the development of a global
overview of the socioeconomic aspects of LMEs and Regional Seas. We focus
1 One exception is a calculation of the direct, indirect, and induced economic impacts of the marine sector
in the Northeast Shelf LME (Hoagland et al. 2005).
1
our attention on the development of measures of the intensity of human activities
in the marine environment that may be useful in identifying regions that may
need international assistance to initiate and carry out programs of sustainable
management. Although other types of economic measures may be preferable to
our measure of the intensity of marine activities, their practical use is severely
constrained by data limitations.
We focus on the following two broad questions regarding the sustainable
management of the marine environments of an LME and Regional Sea:
1. Can the level of marine activity in an LME and Regional Sea be
considered sustainable?
2. Are the nations participating in the relevant LME and Regional Sea
capable of financing programs of sustainable management
themselves?
In order to begin to address the first question, we develop a measure of
marine industry activities for each LME and Regional Sea. Given the nature of
the data on economic activity that is available on a consistent basis across
nations, our preferred measures of marine activities are sets of indexes. We
expect that, ceteris paribus, higher levels of industrial activity exert greater
pressure on the ecosystem, say, through pollution or resource depletion, and
vice versa.
For a given activity level, however, the scale of negative ecological
impacts may not be the same across different stages of economic development,
as measured by income levels or some other metric. For example, the
environmental Kuznets hypothesis suggests that there exists an inverted U-
shape relationship in an economy between pollution intensity and income per
2
capita. At low levels of income, economic development would lead to increasing
levels of pollution emissions. As economic growth leads to income levels that
exceed a threshold, however, a society's demand for environmental quality
increases, and its pollution emissions decline (Tisdell 2001; Grossman and
Krueger 1995).
In order to begin to address the second question, we examine the
relationship between a measure of socioeconomic development, namely UNDP's
human development index (HDI), and marine activity. The HDI measure is useful
in helping to answer the second question, because we expect that, ceteris
paribus, developed nations that exhibit higher levels of income are more likely to
be capable of financing programs of sustainable LME management themselves.
We develop a ranking of LMEs and Regional Seas by various measures of
marine activity and by socioeconomic development. This ranking process should
prove useful for responsible international organizations and donors in developing
funding and assistance priorities based upon the revealed characteristics of
LMEs.
II.
Marine Activity Database
This report presents the results of our efforts to compile data on marine
activities in the coastal nations comprising large marine ecosystems (LMEs) and
Regional Seas. In general, LMEs have been defined primarily in terms of
ecological characteristics. In contrast, Regional Seas have been defined
primarily in terms of geographic and political characteristics. Regional Seas tend
3
to be larger than LMEs, and Regional Seas comprise one or more (or
components of) LMEs. The identities of LMEs and Regional Seas (and a rough
concordance between the two types of regions) are presented in the map in Fig.
1.
Data on marine and relevant non-marine activities include fish landings
(metric tons), aquaculture production (metric tons), shipbuilding orders (gross
tons), cargo traffic (metric tons), merchant fleet size (deadweight tons), oil
production (average barrels per day), oil rig counts (numbers of facilities), and
tourism (international arrivals). The published sources, units, and vintage of the
data on marine activities are presented in Table 1. The actual data are
presented in Table 2.2 The data are from the most recent years available (i.e.,
between 2002 and 2004). Most data are measures of quantities, with the
exception of the dimensionless Human Development Index (HDI).
The data presented in Table 2 can be used to compare levels for each
individual marine activity across the coastal nations of the world. This kind of
comparison is valuable for analyzing relative levels of economic development by
industrial sector in coastal nations and, if collected over time, can help in
understanding changes in relative sectoral economic development for these
nations. Without additional analysis or information, however, these data cannot
be easily used to compare across the coastal nations of the world the
combination of marine activities occurring in each nation. Further, data in this
form can provide only a very crude understanding of activity levels for regional
2 We thank Jennifer Skilbred and Chris Vonderweidt for assisting us in the identification and compilation
of these data.
4
aggregates of all or portions of nations that are involved in LMEs or Regional
Seas.
III. Methodology
A. Total economic value (TEV) as a single metric
One method of creating a single metric that combines all marine activities
is to express the levels of each activity in units of a common monetary measure,
such as US dollars. In theory, the ideal monetary metric would be "total
economic value"(TEV).3 To calculate a single metric based upon TEV, one
would estimate the net benefits in dollars that obtain from each of a nation's
marine activities and sum these benefits across all activities. Net benefits are the
sum of consumer surpluses (what consumers are willing to pay over and above
the market price for a good or service) and producer surpluses (what firms earn
from the sale of goods and services over and above their costs of production).
Net benefits from non-market activities, such as environmental services, would
need to be estimated using one of several methods of environmental valuation,
and these benefits should be added to the TEV metric as well. The cost of
implementing government policies to help manage the marine environment
should be subtracted from TEV.
As a single metric, TEV could be compared across all coastal nations.4
Such a comparison would increase our understanding of the economic capacity
3 From the perspective of the theory of welfare economics, economic value is the only theoretically valid
measure of social welfare (viz., Mishan 1980).
4 The most important use of total economic value for each coastal nation or for regional aggregations of
nations would be to understand how it grows or shrinks with changes in both the mix of marine activities
5
of the nations participating in LMEs and Regional Seas Programs to conserve
and manage their marine ecosystems in a sustainable fashion. Unfortunately,
there is no readily available compilation of TEVs for marine activities across all
coastal nations, however, and the calculation of such values has occurred only
on a location- and activity-specific basis to date.
In our case study of the Benguela Current LME, which appears in Annex I,
we estimate for the region the scale of "resource rents," which are a constituent
of the producer surplus component of TEV, for the offshore oil, marine capture
fisheries, and marine diamond dredging activities in the region. Resource rents
are therefore a subset of TEV. In the context of sustainable management of the
marine environment, we note that resource rents could be a relevant source of
financing. We note further, however, that the use of rents for such a purpose is a
political decision that must be agreed upon at both regional (i.e., international)
and domestic levels.
B.
Direct output impacts (DOIs) as a single metric
Another single metric that can be constructed using a monetary measure
is called the "direct output impact" (DOI). DOIs are the product of the physical
quantities of goods or services flowing from marine activities (e.g., fish landings,
oil production, etc.) and their market prices.5 As in the case of calculating TEV,
one estimates a DOI for each activity, and these impacts are summed to create a
and the implementation of government policies. In principle, the combination of activities and policies can
be adjusted so as to maximize total economic value.
5 If the marine activities are "final" goods and services (i.e., they are consumed and not used to produce
another good or service in an economy), then the direct output impact measure would be equivalent to the
marine component of gross national product (GNP).
6
single metric. This metric is less difficult to construct than TEV, but it does not
account for the cost of inputs in production, including the degradation of the
environment, or the depreciation of capital assets or the depletion of natural
resource stocks.6
As in the case of TEV, there is no readily available compilation of DOIs for
all marine activities across all coastal nations, and the calculation of such values
has occurred only on a location- and activity-specific basis to date. Some
estimates of DOI can be calculated (using a world oil price times oil production,
for example) and others have been compiled on an ad hoc basis (FAO has
calculated for most nations the ex-vessel value of landed capture fisheries and
the farmgate value of some aquaculture industries). In our case study of the
Yellow Sea LME, which appears in Annex II below, we calculate and compile a
wider range of DOIs for the marine activities of the region.
C. Marine
activity
indexes
(MAIs) as a single metric
A third approach to the problem of constructing a single metric does not
involve the use of a monetary measure. Instead, indexes, ranging from zero to
one, are created for each marine activity by ranking each nation's activity level
relative to all others on a worldwide basis. These indexes can be combined in a
variety of ways into one or more aggregate indexes by assigning weights to each
6 Much recent effort has been directed at "greening" the national accounts, which would involve accounting
for changes (depletion) in natural resource stocks, such as offshore oil, capture fisheries, or marine minerals
(see Lange 2003). Green accounting involves the use of the net national product (NNP), which is GNP less
depreciation of capital assets. According to this approach, the depletion of natural resources through
changes in resource stocks are viewed as the analog to the depreciation of capital assets. Changes in green
NNP over time can then be used as measures of welfare change.
7
individual index and then summing across weighted index values. (We describe
one way of accomplishing this weighting process below.) The indexes are
dimensionless, but they convey information about the relative activity level (or the
"intensity" of activity) for nations in the marine environment. We develop the
index approach in this report because of data limitations that affect the use of
either the TEV or DOI metrics.
D.
The problem of regional aggregation
Once a single metric has been developed for each coastal nation, a
procedure needs to be established for aggregating individual national metrics to
a regional level.7 There are five possible scenarios to consider: an LME and
Regional Sea comprises: (i) the entire exclusive economic zone (EEZ)8 of only
one coastal nation (e.g., the Iceland Shelf); (ii) a portion of the EEZ of only one
coastal nation (e.g., the Northeast Shelf); (iii) the entire EEZs of two or more
coastal nations (e.g., the Humboldt Current); (iv) the entire EEZ of one or more
coastal nations and portions of the EEZs of one or more other coastal nations
(e.g., the Benguela Current); and (v) portions of the EEZs of multiple coastal
nations (e.g., the Yellow Sea). For each coastal nation, we need a method for
attributing national-level data on its marine activities to the one or more LMEs or
Regional Seas Programs in which it participates. This issue does not present
7 This issue applies to the marine activity indexes as well as to other single metrics that might be utilized,
including the TEV and DOI metrics.
8 We assume here that the geographic coverage of an LME or Regional Sea is limited to EEZs, although
that is not precisely true in practice.
8
itself for scenarios (i) or (iii), because we can readily use the national-level data
in both cases to develop aggregate indexes.
Scenarios (ii), (iv), and (v) involve situations in which only a portion of a
nation participates in an LME or Regional Sea project. In these situations, we
need to find a way in which to attribute only a portion of a nation's marine
activities to the LME or Regional Sea.9 One approach would be to calculate the
length of a nation's coastline within an LME and Regional Sea relative to that
nation's total coastline.10 That ratio could be used to weight national marine
activity.
We encounter two problems with this approach. First, although data exist
on total coastlines for all coastal nations, there are no data that measure the
coastline length of each nation for each LME and Regional Sea.11 Second, even
if such data exist, without a detailed case study of the geographic distribution of
marine activities for each nation, we might assign part of a nation's marine
activities to an LME or Regional Sea, even though those activities might not take
place in that region (e.g., the assignment of US offshore oil and natural gas
exploration and production to the Northeast Shelf, where no such activity occurs).
Given the data constraints, we design a method for weighting the marine
activity for each individual nation that participates in an LME and Regional Sea
relative to the other participating nations in the same LME and Regional Sea.
9 Ideally, we would like to have subnational-level data on marine activities for each coastal nation. With
such data, we could create a single metric for each region.
10 Other measures of national contribution could be used, such as the area of a nation's total EEZ or its
outer continental shelf that lies within an LME or Regional Sea.
11 Data exist in ARCVIEW format that permits the calculation of the shares, but not the length, of each
nation's coastline within any LME or Regional Sea.
9
We calculate the share of the total LME and Regional Sea coastline for each
nation participating in an LME and Regional Sea Program, and we use that share
to weight that nation's marine activity levels as its contribution to the marine
activity of the whole LME and Regional Sea. These shares are presented in
Table 4 for the world's LMEs.12 A concordance exists between LMEs and
Regional Seas (Table 5), and we use the concordance to develop a similar
weighting procedure for the world's Regional Seas based upon the area
coverage of LMEs. We emphasize that this procedure does not resolve the issue
of attributing all of a nation's marine activities to an LME and Regional Sea when
only a portion of that nation has been assigned to the LME and Regional Sea.
Resolution of that issue is an area for future research.
IV. Calculation of the Marine Activity Index (MAI)
Our methodology involves four basic steps: (i) compiling nation-level data
for a set of indicator variables; (ii) converting all indicator variables into indexes;
(iii) constructing weighted average indexes for each LME; and (iv) constructing
weighted average indexes for each Regional Sea Program (RSP). We focus on
two important descriptors for each LME and each RSP: a measure of marine
industry activities and a measure of socioeconomic development.
We construct marine activity indexes by ranking nations within each
activity category. For example, all nations would be ranked in terms of average
barrels per day of oil production from the highest to the lowest. Then each nation
12 We thank Roger Goldsmith (2005) for calculating the shares that appear in Table 4.
10
would be assigned a number that represents its scale of oil production from the
highest to the lowest value. The values for each index for each activity are
standardized to lie between zero and one. Specifically, for any marine industry
activity indicator variable j occurring in nation i, its measure (xij) (from an entry for
nation i in a column for activity j in Table 2) is converted into an index (Iij) as
follows:
x - min(x )
ij
j
I =
(1)
ij
max(x ) - min(x )
j
j
One can then combine indexes for different marine industry activities in
various ways.13 We construct a combined marine industry activity index for each
nation in two steps. First, a weighted average index AIi is calculated across n
related activities for nation i:
n
AI = w I
(2)
i
j ij
j=1
where the wj are weights (please see the last column in Table 3) assigned by the
analyst or decision maker across related marine activities, which are grouped
into "industry sectors" (e.g., fisheries landings and aquaculture production), and
wj = 1.
In our study, as an example, we have grouped related activities into five
marine industry sectors: marine fisheries and aquaculture, tourism, shipbuilding,
shipping, and offshore oil. In the case of the first industry sector, we consider
13 One way to make such a combination is to assign equal weights to each activity index by averaging
across indexes. In principle, unequal weights could be assigned to activity indexes, if such weights could
be estimated.
11
fisheries and aquaculture equally important, and we assign weights of 0.50 to
each. The next two sectors, tourism and shipbuilding, have one indicator each,
so there is no need to assign weights. In the case of the fourth sector (i.e.,
shipping), we consider cargo traffic more important than the size of fleet, and we
assign weights of 0.67 and 0.33, respectively. In a similar vein, we consider
offshore oil production more important than drilling (i.e., rig counts), and we
assign weights of 0.67 and 0.33, respectively, in the last sector.
Next, a weighted average across all m industry sectors is computed:
m
TAI =
v (AI )
(3)
i
k i
k =1
where TAIi is the total marine industry activity index for nation i, and vk is the
weight assigned by the analyst or decision maker for marine industry sector k
(please see the second column in Table 3). In our example, we assign equal
weights of 0.20 to each of the five industry sectors (see Table 3).
For any particular nation i, TAIi will be large if most of its marine industry
indicators are ranked relatively high in comparison with the rest of the world.
Importantly, a nation with only a few highly ranked industry sectors could have a
total activity index close in value to a nation with all of its industry sectors ranked
in the medium category. Thus, the total marine industry activity index (TAIi) can
be interpreted as the overall "intensity" of nation i's marine activities.
We use the Human Development Index (HDI) for each nation reported in
the United Nations Development Program's Human Development Report (UNDP
2004). HDI is a measure of a nation's socioeconomic development. It is based
upon three key indicators: life expectancy (at birth); education (i.e., adult literacy
12
rate and combined gross enrolment ratio for primary, secondary, and tertiary
schools); and GDP per capita (purchasing power parity in US dollars).14
The national-level TAI and HDI can be used to construct relevant indexes
for the LMEs, which often are combinations of nations (or parts of nations), and
then for the Regional Seas, which are in effect combinations of LMEs. As
described above, due to data constraints, the national TAI value must be used
even in cases in which only a portion of a nation's coastline occurs in an LME or
Regional Sea.
For each LME, we compute both the marine industry activity index (MAI)
and the socioeconomic index (SEI) as:
s
MAI
=
(4)
(
)
lTAI
LME RSP
i
i
i =1
s
SEI
=
(5)
(
)
l HDI
LME RSP
i
i
i =1
where i is the index for a nation bordering the LME, and li is the percentage
share of nation i's coastline length relative to the total coastline length of all s
nations bordering the LME (these shares are compiled in Table 4).15
Finally, for each RSP, the LME-level indexes are further aggregated as:
p
MAI
= a MAI
(6)
RSP
q
q
q=1
14 For a detailed description of HDI and its calculation, see UNDP (2004), p.259.
15 LME-level marine activity indexes (MAI) can also be calculated using the activity indexes (AI) for
industry sectors in lieu of the total activity index (TAI). We present calculations for three such industry
sectors in Table 7.
13
p
SEI
= a SEI
(7)
RSP
q
q
q =1
where q is the index for an LME within a Regional Sea (Table 5), and a is the
percentage share of the LME's area (Table 6) relative to the total area of all p
LMEs within the Regional Sea.
V.
Results of the Index Approach
We calculate the marine industry activity index (MAI) and the
socioeconomic index (SEI) for each LME using Equations (4) and (5).16 The
results are summarized in Table 7. Also included in Table 7 are calculations of
marine activity indexes based upon industry sectors: (i) the fishery and
aquaculture index and (ii) the tourism index, both of which depend upon a
relatively clean marine environment, and (iii) the shipping, shipbuilding, and oil
production index, which includes three industry sectors that do not necessarily
depend upon a clean environment and which, in some cases, may in fact be the
cause of environmental degradation.
One can compare LMEs based upon these different indexes. The data in
Table 7 are sorted by the socioeconomic index, which can be used as an
indicator of the potential for LMEs to undertake self-financing management
16 Five LMEs are not included in our analysis because of the paucity of datat on either the socioeconomic
index, marine activity, or both. These five LMEs are: the Arctic Ocean (64); Antarctica (61); the Faroe
Plateau (60); the East Greenland Shelf (19); and the West Greenland Shelf (18). Table 2 does not include
all the countries (or territories) listed in Table 4. This creates a data gap that leads to biased estimates for
LME indexes. To address the issue, we bridged the data gaps with data from related countries as follows:
Morocco for Western Sahara, UK for Falkland Islands, Suriname for French Guiana, US for Puerto Rico,
and Norway for Svalbard. Several countries with missing data and also with very small weights were
excluded from the calculation of weighted average indexes. We assigned HDI values for Liberia (0.3),
North Korea (0.5), Somalia (0.28), and Taiwan (0.9) based mostly on income levels.
14
programs. The Somali Coastal Current (#31), Agulhas Current (#30), Guinea
Current (#28), and Benguela Current (#29) are among the LME regions with
lowest SEI. In contrast, the Norwegian Shelf (#21) and several LMEs along the
Australian coast have the highest SEI.
In Table 8 and Fig. 2, we rank the data by MAI, which can be interpreted
as a measure of the intensity of marine activity in each LME. This ranking is
much different from the ranking in Table 7. Even so, the Somali Coastal Current
(#31), Guinea Current (#28), and Agulhas Current (#30) exhibit the lowest levels
of intensity of marine activity, consistent with their low levels of SEI. In contrast
to the results for the SEI ranking, the Yellow Sea (#48) and the East China Sea
(#47) exhibit the highest MAI levels. In Figs. 3 and 4, we also present rankings
of MAI normalized by total LME area (Fig. 3) and MAI/SEI (Fig. 4).
The precise relationship between marine industry activities and
socioeconomic development is a bit more complex (Figure 5). We group LMEs
according to their socioeconomic development levels and marine industry activity
levels, using data from Tables 7 and 8. We specify three development levels:
high (SEI 80), medium (50 SEI < 80), and low SEI < 50); and three marine
activity levels: high (MAI 30), medium (5 MAI < 30), and low (MAI < 5). The
resulting nine categories are shown in Table 9 and Figure 5.
In Table 9, the top two boxes on the left do not have entries, suggesting
that LME regions with low levels of economic development generally do not have
high levels of marine industry activities. In contrast, LME regions with high levels
of economic development may or may not have high levels of marine industry
15
activities. For example, the Iceland Shelf (#59) is a region with a high level of
socioeconomic development but a low level of marine industry activities, while
the Northeast Shelf (#7) is a region with high levels of both economic
development and marine industry activities. The Yellow Sea (#48) region is
unique in that it has a high level of marine industry activities and a medium level
socioeconomic development. This combination suggests a major management
challenge to achieve sustainability (i.e., balancing economic growth with
environmental and resource protection).
We aggregate the LME index estimates to get the indexes for the
Regional Seas, using Equations (6) and (7). We present the results of the
Regional Sea index estimates ranked in order of SEI (Table 10 and Fig. 6) and
MAI (Table 11 and Fig. 7). Within the Regional Seas Program, the Eastern
Africa region appears to be the least developed, while the Pacific (SPREP)
region has the highest level of socioeconomic development. The Northeast
Pacific and Northwest Pacific Regional Seas exhibit the highest intensities of
marine activity, while the West Central Africa and Eastern Africa Regional Seas
exhibit the lowest.
We develop groupings similar to those for LMEs for the regional seas (see
Table 12). In addition, we plot SEI against MAI for the regional seas in Fig. 8.
The two representative cases pictured in Fig. 8 include the BCLME (West Central
Africa RSP) and the YSLME (Northwest Pacific RSP). The interpretation of the
figure is similar to that for the plot of SEI vs. MAI for LMEs.
16
While the results in Tables 10, 11, and 12 are useful in providing a quick
overview of relative positions across Regional Seas, they must be used with
caution. LMEs are large areas that are often composed of heterogeneous
countries. Regional Seas are much larger areas than the LMEs, and the level of
heterogeneity in economic development and marine activity within a specific
regional sea may be substantial. Disparities in regional heterogeneity are
evident, for example, in the somewhat surprising result that the Pacific (SPREP)
RSP, which is extremely heterogeneous, has a higher level of socioeconomic
development than the much more homogeneous North-East Atlantic Regional
Sea.17
VI. Discussion
We have developed an index approach to provide an overview of the
socioeconomic dimension of different LMEs and Regional Seas. The study is
unique in its global perspective. The results may be used to address
management questions regarding sustainable development and sustainable self-
financing of regional programs.
The results may also be used to identify problem areas. Typically, regions
with high levels of marine industry activities demand high levels of management
attention to address issues related to resource depletion, environmental
degradation, and multiple use conflicts. This is particularly true in regions with
high marine activity levels and medium levels of socioeconomic development.
17 Also of relevance is the fact that only three of the 19 states that participate in the Pacific (SPREP)
Regional Sea Programme--Australia, New Zealand, and Papua New Guinea--border on, and are represented
in the data assembled for, the four LMEs that occur within that region (LMEs 40, 41, 42, and 46).
17
Efforts must be made to coordinate economic development and environmental
and resource protection. Regions with low socioeconomic development levels
and low marine activity levels at the present deserve international assistance in
preparation for possibly rapid development in the future.
The framework developed in our study serves as a first step toward more
detailed analyses of socioeconomic issues associated with LMEs and Regional
Seas. Thus, the index approach is a useful first cut at prioritizing regions that
deserve closer attention as candidates for international financial assistance to
promote sustainable marine environmental management. An important next step
is to carry out detailed case studies designed to improve our understanding of
any specific ocean region, including its environmental circumstances, its
ecological conditions, its economic value, and the political feasibility of organizing
a collaboration among nations participating in the region to share the costs of
sustainable management.
To illustrate this point, we present case studies in the Annexes of the
Benguela Current LME and the Yellow Sea LME. These two LMEs were selected
because they represent different types of marine ecosystems, different levels of
marine economic activity, and different geographic locations. The Benguela
Current LME, located along the southwest coast of Africa, is the world's most
powerful wind-drive coastal upwelling system, and it has a relatively low level of
marine economic activity. In contrast, the Yellow Sea LME, a sub-area of the
Northwest Pacific Regional Sea, is a continental shelf ecosystem with intense
marine activities.
18
The two case studies use two different approaches for estimating a
monetary measure of levels of economic activity in an LME. We present an
application of the resource rent approach in the case of the Benguela Current
LME in Annex I. In particular, we estimate resource rents, or those producer
surpluses attributable to the exploitation of marine resources. If collected by
governments, resource rents provide a potential basis for financing the
sustainable management of the marine environment.
In many cases, however, it can be difficult to obtain estimates of resource
rents. In Annex II, we present an application of the direct output impact (DOI)
approach for the Yellow Sea LME. DOI measures the gross revenues or sales
that obtain from a nation's marine activities; it can be conceptualized as an upper
bound on producer surplus. Although the DOI approach does not result in as
much information about economic value as the resource rent approach, it can be
used to gain a sense of the scale of economic activity and as a rough measure of
the capacity of the nations of an LME to finance sustainable management.
VII. Summary and Conclusions
Examination of the two cases--one of an upwelling, the other of a
continental shelf LME--have reinforced our original opinions as to the benefit of
the GEF-sponsored efforts to encourage sustainable management. In particular,
the detailed studies, capacity building, and reorientation of the policy focus from
resource exploitation to sustainable management have been the most positive
effects in these two cases. Based upon what we have been able to learn about
19
these two cases, we expect that the nations of the region will be fully capable
and willing to continue their programs of sustainable development in the future.
The compilation of data and the development of an international database
on marine activity levels in coastal nations, LMEs, and Regional Seas is likely to
be of considerable value for conducting preliminary screening and prioritization of
marine regions that are in need of international attention and support for
organizing programs of sustainable development.
For those LMEs or Regional Seas that are identified as priorities from the
marine activity and socioeconomic development rankings, detailed case studies
should be conducted. Case studies should focus on the following:
∑ characterizing marine activities at the sub-national level within the LME
and Regional Sea;
∑ estimating the scale of resource rents that could obtain from the efficient
management of the marine resources of the LME and Regional Sea;
∑ clarifying, where relevant and necessary, the need for and the costs
involved in the international regulation of natural resources or the
management of transboundary environmental degradations;
∑ identifying the set of sustainable development policy priorities in each of
the nations of the region (including priorities unrelated to the marine
environment); and
∑ understanding the willingness of the nations participating in the region to
devote some fraction of rents from marine resources to the sustainable
management of their shared ecosystem.
The efforts of international organizations to encourage the sustainable
development of LMEs and Regional Seas is obviously an important goal. We
recognize, however, that decisions about sustainable development are policy
decisions that must be made by each coastal nation independently and, where
feasible, in concert with the other nations of the region.
20
Notwithstanding the priority to devote resource rents from the
development of marine natural resources to improve environmental, public
health, and social welfare conditions, the scale of rents (in the case of BCLME)
and direct output impacts (in the case of YSLME) appear to be sufficient to
continue to support existing efforts to improve marine management. At the very
least, the sustainable management programs, involving scientifically based
assessments, which have been organized by GEF and the nations of both LMEs,
might be continued at the same or even a slightly expanded scale.
Whether coastal nations will work together to solve the issues that
pervade LMEs or Regional Seas will depend upon the benefits that each nation
expects from its cooperation with others. Hence, clarifying in detail the nature of
the benefits to individual nations of international cooperation within LMEs and
Regional Seas is of fundamental importance. In an optimistic future, as the
economies of the nations develop, and hopefully as their social problems begin
to be resolved, any residual problems of marine pollution and resource
misallocations can be accorded a higher priority in national and regional public
policy.
VIII. References
Duda, A.M. and K. Sherman. 2002. A new imperative for improving management
of large marine ecosystems. Ocean and Coastal Management 45:797-
833.
Food and Agriculture Organization of the United Nations (FAO). 2005. FAO
Fisheries Global Information System 2003.
http://www.fao.org/es/ess/meetings/figis.asp.
21
Goldsmith, R. 2005. Dataset concerning the shares of coastlines of nations within
large marine ecosystems. Woods Hole, Mass: Computer and Information
Systems, Woods Hole Oceanographic Institution.
Grossman, G.M. and A.B. Krueger. 1995. Economic growth and the environment.
Quarterly Journal of Economics 110(2):353-377.
Hoagland, P., D. Jin, E. Thunberg and S. Steinback. 2005. Economic activity
associated with the Northeast Shelf Large Marine Ecosystem: application
of an input-output approach. Pages 157-179 in T. Hennessey and J.
Sutinen, eds. Sustaining Large Marine Ecosystems: The Human
Dimension. Elsevier Science.
Institute of Shipping Economics and Logistics (ISL). 2004. Shipping Statistics
Yearbook 2004. Bremen, Germany.
Lange, G-M. 2003. Policy applications of environmental accounting.
Environmental Economics Series Paper No. 88. Washington:
Environment Department, The World Bank.
Mishan, E.J. 1980. Introduction to Normative Economics. New York.
OGJ. 2004. Oil and Gas Journal (OGJ) Databook 2004 Edition. PennWell:
Tulsa, OK.
Sea Around Us Project. 2005. Large Marine Ecosystems.
http://saup.fisheries.ubc.ca/lme/ lme.aspx#.
Sherman, K., N.A. Jaworski and T. J. Smayda. 1996. The Northeast Shelf
Ecosystem: Assessment, Sustainability, and Management. Blackwell:
Cambridge, MA.
Sutinen, J.G. 2000. A framework for monitoring and assessing socioeconomics
and governance of large marine ecosystems. NOAA Technical
Memorandum NMFS-NE-158. Northeast Fisheries Science Center,
Woods Hole, MA.
Tisdell, Clem. 2001. Globalization and Sustainability: Environmental Kuznets
Curve and the WTO. Ecological Economics 39(2):185-196.
United Nations Development Program (UNDP). 2004. Human Development
Report 2004 http://hdr.undp.org/reports/global/2004/.
United Nations Environment Program (UNEP). 2004. Regional Seas Program
linked with Large Marine Ecosystems. NOAA Large Marine Ecosystem
Program. Narragansett, RI.
22
United Nations Environment Program (UNEP) and National Oceanic and
Atmospheric Administration (NOAA). 2005. "UNEP Regional Seas
Programme Linked With Large Marine Ecosystems: Assessment and
Management." Last accessed on 30 March 2005 at
http://www.unep.org/regionalseas/News/Regional_Seas_and_
LMEs/default.asp.
US Department of the Interior, Minerals Management Service (MMS). 2005. OCS
Production. http://www.mms.gov/stats/OCSproduction.htm.
World Bank. 2004. World Development Indicators.
http://www.worldbank.org/data/ wdi2004/
23
or offshore
orld Bank 2004)
(OGJ 2004)
r
c
e
(UNDP 2004)
(ISL 2004)
(ISL 2004)
(ISL 2004)
o
u
S
a
t
a
D
ack of separate statistics f
ent Indicators 2004 (W
e
lopment Report 2004
ies Global Information System 2003 (FAO 2005)
eries Global Information System 2003 (FAO 2005)
Human Dev
Fish
Fisher
World Developm
Shipping Statistics Yearbook 2004
Shipping Statistics Yearbook 2004
Shipping Statistics Yearbook 2004
Oil and Gas Journal Databook 2004 (OGJ 2004)
US Department of the Interior (2005)
Oil and Gas Journal Databook 2004
e
offshore fields and (2) l
r som
24
y
I
ndictors and Data Sources
e
a
r
Y
2002
2003
2003
2004
quarter
2004
2
0
0
2
2
0
0
4
nd 2
Jan. 1, 2004
Dec., 2003
i
ssing data fo
**
)
i
t
T
b
er
t tons, revenue tons, or harbor tons (see ISL 2004).
n
U
e
i
g
h
t
t
o
n
s
e
nsionless
(GT)
m
(DW
Num
Metric tons
b
er of visitors
Di
Gross tonnage
Metric tons
e
a
d
w
Metric tons (MT)
D
v
e
r
a
g
e
b
a
r
r
e
l
/
d
a
y
Table 1. Marine Industr
Num
A
**
*
**
number of
i
cile; ships of 1000 GT and over.
ent Index (HDI)
e
countries are partial due to (1) m
i
c
a
t
o
r
all fraction of ports are in freigh
d
*
**
I
n
t
fleet
a
n Developm
a
ls
Hum
Fishery landings
Aquaculture production
International tourism
arriv
Shipbuilding orderbook
Shipping cargo traffic
Merchan
Offshore oil production
Offshore rig count
* Ships of 100 GT and over.
** Units for a sm
*** By nation of dom
**** Data for som
(vs. onshore) production.
t
0
0
7
0
0
4
0
0
0
0
0
0
0
0
0
1
3
1
0
0
0
5
0
0
1
0
0
0
2
o
un
ber)
um
Offshore
Rig C
(n
0
0
0
0
0
0
0
0
0
0
0
0
0
0
0
0
0
0
0
0
0
0
0
2
3
3
7
5
ay)
3,
,0
uction
65
16
4
4
9
,
4
75
1
8
0
,
5
41
5
0
2
,
50
Offshore Oil
Prod
(bbl/d
0
0
0
0
0
0
0
0
0
0
0
3
0
0
0
0
0
0
0
3
0
0
0
0
0
0
T)
86
32
5,
4
,
7
9
1
4,
4
5,552
Fleet
(
100
DW
Merchant
c
0
0
0
0
7
0
0
0
0
0
0
0
0
0
3
2
0
0
0
20
4
9
0
7
6
09
g
fi
5,
3
,
4
9
3
3
,
4
6
9
3,
,0
5
,
9
9
7
9,
r
af
5
3
7
,
3
91
1
8
8
,
5
44
40
18
1
8
5
,
7
73
0 MT)
1
,
3
1
0
,
82
g
o T
Shippin
(
100
Car
g
0
0
0
0
0
0
0
0
0
0
0
0
0
0
0
0
3
0
8
0
0
0
)
39
3
2
T
2
3
9
1
5
3
1
7
,644
0 G
try Indicators by Nation
Shipbuildin
Orderbook
(
100
0
0
2
0
0
5
0
0
8
0
0
2
0
0
4
0
0
2
0
0
0
0
0
0
0
0
6
0
0
2
0
0
0
0
0
0
0
0
4
0
0
00
4
0
0
o
nal
,8
,2
40
1,
4,
8,
0,
5,
3,
1,
5,
2,
7,
7,
7,
4,
8,
10
24
34
02
54
23
50
21
3
6
,
8
0
0
15
79
80
9
9
8
,
0
00
2
2
3
,
4
00
8
5
,
6
0
0
16
41
50
2
3
,
8
0
0
1
5,167
urism
isitor)
1
,
1
4
5
,
2
00
2
,
5
8
7
,
0
00
5,
1,
1,
3
,
9
3
6
,
6
00
6
,
9
0
5
,
4
00
3,
1
,
0
2
1
,
6
67
3,
,5
1,
To
(v
20
4
9
,885
25
Internati
0
0
0
3
0
0
0
4
0
0
0
0
6
5
8
0
42
6
8
15
31
0
3
5
0
0
2
6
0
41
8,
,3
,5
T)
3
5
,
1
5
4
5
6
,
5
0
3
1
0
,
1
6
0
1
0
9
,
6
15
1
4
2
,
7
71
6
2
9
,
4
93
16
(M
n
omic and Marine Indus
Marine
2
0
,893
Aquaculture
y
7
7
0
0
3
0
5
1
53
5
3
0
5
3
9
58
1
1
1
4
3
0
9
4
3
8
2
0
9
3
1
1
0
7
0
1
63
3
5
1
5
,6
,6
9
0
8
50
,3
19
,8
0
4
6
98
,2
,6
,8
2
6
1
72
3
5
6
,6
,3
,1
1,
1,
1,
2,
3,
9,
12
13
1,
2,
26
5,
11
2,
1,
10
55
52
4,
8,
0,
97
14
2
6
,346
Socioeco
Fisher
T)
14
20
88
21
43
58
32
93
1,
3,
(M
1
4
,588
Marine
Table 2.
1
4
1
0
3
6
6
5
3
9
8
2
7
1
1
5
7
6
8
1
3
7
9
3
0
80
78
86
71
0
.
78
0
.
70
0
.
38
0.
0
.
85
0
.
94
0
.
74
0
.
81
0
.
84
0
.
50
0
.
88
0
.
94
0
.
73
0
.
42
0.
0
.
77
0.
0
.
79
0
.
56
0
.
50
0
.
94
0.
0
.
83
0
.
7
4
5
0
.
77
0
.
53
0
.
4
9
4
HDI
o
v
i
n
a
u
d
a
am
rzeg
tion
a
rb
al
He
Na
n
d B
r
u
ss
n
d
a
n
d
e
a
j
a
n
a
i
n
a
i
a
a
s
n
Da
a
b
i
a
ni
ri
nt
bai
a
d
e
s
h
d
o
s
a
a
l
a
o
r
o
s
ral
n
bodi
e
roo
ba
ge
g
o
l
a
i
g
ua a
ge
a
ham
a
hrai
a
ngl
a
rba
e
l
g
i
u
m
e
l
i
z
e
e
ni
o
sni
r
azi
r
u
n
ei
u
l
g
ari
a
m
a
m
a
n
a
d
a
a
pe Ver
h
i
l
e
in
o
l
o
m
o
m
ngo
Al
Al
An
Ant
Ar
Aust
Azer
B
B
B
B
B
B
B
B
B
B
B
C
C
C
C
C
Ch
C
C
Co
t
0
0
0
0
0
0
4
0
0
0
0
9
0
0
0
0
0
0
0
1
0
0
0
0
0
0
0
0
0
0
o
un
ber)
um
Offshore
Rig C
(n
6
9
0
0
0
0
0
0
0
0
0
0
0
0
0
0
0
0
0
0
0
0
0
0
0
8
0
0
0
0
0
1
8
ay)
,1
0,
0,
,3
6
,
0
0
0
3
,850
uction
16
37
20
1
5,000
16
Offshore Oil
Prod
(bbl/d
0
0
0
0
0
0
0
0
0
0
0
0
0
0
0
0
0
1
0
0
0
3
5
0
0
0
0
0
0
0
T)
64
,3
1
6
,
3
7
3
4,
48
Fleet
(
100
DW
156,385
Merchant
c
0
0
1
6
8
0
0
0
0
0
0
0
0
0
0
0
0
0
0
0
0
73
83
54
0
2
4
2
g
fi
7
,
0
3
3
2
,
5
9
6
7,
9,
4,
,3
,2
r
af
1
4
,
7
2
8
3
7
,
5
2
6
61
3
2
2
,
0
18
2
5
3
,
4
90
10
24,935
0 MT)
g
o T
Shippin
(
100
Car
g
0
0
0
7
0
0
0
0
0
0
0
0
0
0
0
0
0
0
0
2
0
0
0
0
0
0
)
1
5
20
T
24
2
5
7
47
53
2,
1
,
6
6
1
2,
0 G
Shipbuildin
Orderbook
(
100
0
0
0
0
0
8
0
0
8
0
0
0
0
0
0
0
8
0
0
6
0
0
0
0
0
0
0
2
0
0
6
0
0
8
0
0
0
0
0
0
0
o
nal
9,
2,
6,
,2
3,
7,
,6
1,
6,
,00
9,
2,
,000
7,
,2
16
75
99
66
75
71
58
36
03
0
1
,
2
0
0
1
92
8
0
,
2
1
9
28
5
2
,
4
0
0
54
13
53
1
2
6
,
2
00
urism
isitor)
1
,
2
3
7
,
0
00
8
,
5
7
6
,
2
00
1
,
8
9
9
,
6
00
2,
1,
3
,
2
1
9
,
4
00
5,
1
,
0
9
4
,
2
00
1
,
7
1
1
,
0
00
3,
,2
,1
1
,
0
0
4
,
0
00
To
(v
81
19
16,251
26
Internati
0
1
0
5
6
0
0
9
3
0
0
0
0
0
0
0
0
6
0
0
2
26
5
1
05
36
68
89
47
77
16
5,
4,
2,
1
,
7
3
1
,1
3,
T)
7
3
,
5
8
0
5
7
,
4
9
3
4
3
,
4
7
8
10
1
9
7
,
2
74
2
8
,
6
5
3
98,459
Marine
(M
Aquaculture
y
0
1
0
0
0
9
7
4
0
00
2
7
0
3
3
8
2
2
9
1
3
7
1
5
3
1
1
8
6
4
3
4
9
6
,3
,9
,9
,8
74
8
0
3
35
10
,5
4
6
4
4
3
9
,7
50
68
,6
,5
,5
8
4
4
,3
26
2
6
6
7
5
6
54
,8
8
4
5
80
,8
5,
28
45
19
38
1,
8,
1,
16
7,
7,
32
2,
6,
76
34
86
0,
3
5
,269
34
3,
8,
5,
90,221
2,
16
4,
4,
58
Fisher
T)
00
39
11
75
23
31
11
2,
(M
Marine
5
4
9
0
9
3
2
4
3
8
5
3
0
3
9
3
8
5
2
2
9
5
8
5
9
5
0
9
36
83
39
73
72
70
0.
0.
0.
0
.
83
0
.
80
0
.
88
0
.
93
0
.
45
0
.
74
0.
0
.
73
0
.
65
0.
0.
0
.
43
0
.
85
0
.
75
0
.
93
0
.
93
0
.
6
4
8
0
.
45
0
.
73
0
.
92
0
.
56
0
.
9
0
2
0
.
74
0
.
64
0
.
42
0
.
35
0
.
71
HDI
t
h
e
i
c
e
p. of
bl
tion
.
R
e
pu
u
i
n
ea
u
Na
re
G
a
i
ssa
i
ca
oi
al
Iv
c
a
can R
r
al
a
r
k
v
a
d
o
r
a
d
a
a R
i
a
i
ni
i
ni
do
o
ri
b
i
a
any
em
b
o
u
t
i
p
t
t
r
e
a
oni
an
n
c
e
r
gi
n
a
n
a
d
a
n
e
a
n
ea-B
a
n
a
o
n
g
o
, Dem
o
st
Ù
t
e
d'
r
oat
u
b
a
y
p
r
u
s
Sal
uat
ji
nl
a
bon
r
e
e
c
e
C
C
C
C
C
C
Denm
Dji
Dom
Dom
Ecua
Egy
El
Eq
Eri
Est
Fi
Fi
Fra
G
Gam
Geo
Germ
Gha
G
Gre
Guat
Gui
Gui
Guy
t
0
0
0
0
1
9
12
8
0
0
1
0
0
0
0
0
0
0
0
0
0
0
1
0
0
1
4
0
0
0
0
39
o
un
ber)
um
Offshore
Rig C
(n
0
0
0
0
0
0
0
0
0
0
0
0
0
0
0
0
0
0
0
0
0
0
0
0
0
6
1
0
8
5
0
0
0
ay)
5,
,3
0,
uction
30
2
8
2
,
2
67
10
77
2
,
6
0
3
,
8
16
Offshore Oil
Prod
(bbl/d
0
0
0
4
0
0
4
1
0
0
0
0
0
0
0
0
0
0
0
0
0
0
0
0
0
0
T)
60
,9
3
1
,378
1
2
,
1
2
4
4,
8
,
7
0
0
11
2
5
,
3
5
4
9
,
5
6
8
Fleet
(
100
DW
1
0
9
,
5
40
Merchant
c
0
2
0
2
0
0
0
0
0
0
0
0
0
0
0
78
72
1
8
2
6
1
7
0
8
9
4
1
6
7
9
5
9
2
4
7
4
7
3
1
4
1
0
5
5
84
g
fi
5,
1,
8,
,4
,6
,3
,1
4,
,1
,2
5,
,1
,7
0,
5
,2
r
af
21
12
31
33
2
6
8
,
1
36
11
80
14
10
66
51
19
11
3
4
,
7
7
6
0 MT)
g
o T
Shippin
(
100
Car
g
0
0
0
0
0
0
0
0
0
0
0
0
0
3
0
0
0
7
0
0
0
0
0
2
)
25
T
1
9
6
1
0
7
1
8
9
50
1,
3
9
,
3
7
7
4
9
,
9
1
9
0 G
Shipbuildin
Orderbook
(
100
0
0
0
0
0
0
2
0
0
00
6
2
0
2
0
0
0
0
0
6
0
0
0
0
0
5
9
0
2
0
0
4
0
0
0
0
0
8
0
0
6
0
0
0
0
0
0
0
4
0
0
5
0
0
9
0
0
4
0
0
2
0
0
o
nal
8,
,2
8,
4,
9,
9,
8,
7,
2,
2,
9,
4,
7,
,3
0,
3,
1,
4,
1,
3,
,80
1
3
4
,
01
68
33
52
42
80
69
77
1
0
,
0
0
0
31
70
76
87
01
71
85
09
14
22
8
4
,
6
0
0
53
13
7
58
3
7
,
4
0
0
urism
isitor)
2,
5,
1,
6,
,5
1,
5,
1,
4,090,833
6,
1,
1,
,0
1,
,2
To
(v
1
9
,051
43
18
20
27
Internati
0
0
0
0
0
0
0
0
0
0
0
6
2
7
48
,5
4
5
6
1
7
9
8
8
1
2
,7
4
,
3
7
0
7
,
4
6
2
3
,
3
5
9
7
,
0
0
7
T)
16
1
1
3
,
2
40
4
4
0
,
3
73
6
1
,
4
3
5
1
4
8
,
9
62
5
0
4
,
2
95
8
2
6
,
2
45
1
3
5
,
8
60
4
7
,
9
9
1
1
,
2
7
7
,
0
85
Marine
(M
Aquaculture
y
0
0
4
1
2
1
0
5
0
3
0
7
1
8
0
0
,7
0
6
8
4
7
1
1
3
1
1
2
8
7
1
1
99
3
3
1
20
5
9
1
13
09
0
0
0
0
4
3
90
9
7
8
61
,6
2
4
6
7
3
1
3
3
6
4
1
5
13
,0
2
5
0
4
,
5
1
0
10
0,
0,
7,
9,
1,
2,
3,
8,
9,
7,
0,
7,
5,
3,
3,
33
5,
2,
7,
5,
1,
75
1
1
,136
8,
Fisher
T)
1
5
7
,
44
00
92
40
29
30
29
64
20
64
11
15
11
28
15
39
2,
2,
4,
4,
1,
1,
1,
(M
Marine
2
1
5
2
2
6
8
0
4
8
0
8
8
8
3
8
4
2
9
3
2
5
5
2
73
n.a.
88
n
.
a
.
79
0
.
4
6
3
0
.
67
0
.
9
0
3
0
.
94
0
.
59
0
.
69
0.
0
.
93
0
.
90
0
.
92
0
.
76
0
.
93
0
.
75
0
.
7
6
6
0
.
48
0.
0
.
83
0
.
82
0
.
75
0.
0
.
84
0
.
46
0
.
79
0
.
75
0
.
87
0
.
46
0
.
7
8
5
0
.
80
HDI
)
R
e
p.
y
a
S
A
f
s R
e'
ri
a (
a
hi
e
opl
tion
h
in
Rep. o
f
a
m
,
C
.
P
o
Na
i
c
n
b
J
r
a
ong
a
a
m
e
p.
n
a
s
K
d
a
Dem
R
t
a
ni
t
a
ni
c
o
an
a
no
a
n
d
an Ara
y
a
i
c
a
n
v
i
a
r
itiu
a
i
t
i
n
d
u
r
a
s
ong
di
d
onesi
n, Isl
d
a
n
rea,
rea,
wai
al
beri
by
t
hua
a
dagasca
a
l
a
y
s
i
a
a
l
d
i
v
e
s
a
l
t
a
a
uri
e
xi
H
Ho
H
Icel
In
In
Ira
Irel
Israel
It
Jam
Japa
Jor
Kazakhsta
Keny
Ko
Ko
Ku
Lat
Leba
Li
Li
Li
M
M
M
M
M
Mau
M
t
0
0
1
0
4
0
0
8
1
7
0
0
0
0
0
0
0
0
0
6
0
0
0
0
0
0
0
6
0
o
un
ber)
um
Offshore
Rig C
(n
0
0
0
0
0
0
0
0
0
0
0
0
0
0
0
0
0
0
0
0
0
0
4
8
1
ay)
5
,
2
9
2
8,
6
,
6
0
0
uction
2
7
8
,
3
60
14
1
2
,
4
0
1
1
4
,
4
0
0
3,
Offshore Oil
Prod
(bbl/d
0
0
0
0
5
0
0
0
8
8
0
0
0
0
0
0
0
0
0
0
0
0
0
0
0
0
4
3
0
0
T)
04
59
5,
,7
,0
50
5,
1
5
,
2
5
8
12
Fleet
(
100
DW
Merchant
c
0
0
0
0
0
7
0
0
0
0
0
0
0
0
2
1
5
1
31
2
6
9
8
9
0
2
4
9
7
1
g
fi
2
,
7
6
2
,7
,3
2,
,9
,8
,1
,5
5,
9
,
0
6
2
r
af
4
0
4
,
3
48
23
23
1
8
,
9
6
3
2
5
,
8
5
2
12
82
4
2
,
6
9
5
34
40
10
9
6
,
0
8
6
0 MT)
g
o T
Shippin
(
100
Car
g
0
0
0
0
0
1
0
0
0
0
1
0
0
5
3
0
0
0
0
0
0
1
0
)
2
6
32
T
46
7
6
4
43
9
2
5
3
6
1
2,
0 G
Shipbuildin
Orderbook
(
100
0
0
0
0
0
0
0
4
0
0
4
0
0
8
0
0
4
0
0
4
0
0
2
0
0
0
0
4
0
0
0
0
0
4
0
0
2
0
0
0
0
0
0
0
90
o
nal
9,
1,
5,
0,
3,
8,
2,
,9
7,
6,
7,
2,
3,
,4
9,
92
22
1
0
,
6
0
0
33
5
2
1
,
8
00
97
97
69
5
6
5
,
6
00
59
42
92
68
0
2
,
0
0
0
8
2
,
2
0
0
1
0
7
,
7
00
41
31
5
2
,600
25
81
9
5
,
6
0
0
4
5
7
,
4
00
urism
isitor)
4,
,4
2,
2,
1,
,6
,2
3,
8
,
3
3
0
,
0
00
To
(v
10
11
12
28
Internati
2
5
0
0
0
0
0
0
0
2
0
0
0
9
6
9
8
4
54
1
0
2
00
3
5
2
7
4
1
38
1
,
0
7
8
7,
6
,
1
0
5
6
,
8
7
5
9,
T)
1
9
,
1
8
1
5
9
,
5
2
5
8
4
,
6
4
2
5
8
2
,
0
16
1
0
,
0
2
1
1
,
0
7
6
,
1
18
Marine
(M
Aquaculture
y
8
2
2
3
3
6
1
2
2
9
2
1
0
0
6
6
2
9
,1
2
5
2
8
4
7
7
0
8
3
6
2
,9
1
9
4
3
4
7
4
8
2
0
4
0
3
9
8
7
0
2
9
8
6
4
3
8
2
6
0
3
2
3
,0
61
2
3
0
3
7
0
46
,2
28
,9
1
7
4
4,
78
0,
9,
7,
1,
14
0,
6,
1
,
50
8,
9,
3,
4,
0,
9,
0,
3,
11
1,
7,
1,
4
,
78
10
3,
52
8,
Fisher
T)
89
06
66
54
55
30
71
13
39
22
17
06
03
16
21
17
42
1,
2,
6,
2,
3,
(M
Marine
0
4
1
7
2
6
7
6
6
6
0
7
1
2
2
3
0
7
3
8
5
7
1
9
5
8
7
92
72
54
79
77
75
76
64
76
0
.
62
0
.
35
0
.
55
0
.
60
0
.
94
0.
0
.
66
0
.
46
0
.
95
0.
0
.
77
0
.
49
0
.
79
0.
0
.
75
0
.
75
0
.
85
0
.
89
0
.
83
0
.
77
0.
0
.
8
4
4
0.
0.
0.
0.
0.
0
.
43
HDI
pe
i
s
ian
n
ci
t
i
on
tion
u
i
n
ea
d Nev
and the
Pri
d
e
r
n
)
Na
G
dera
q
u
e
an
a
e
s
est
È
and
bi
a
r
a
ncent
W
r
a
b
i
a
g
u
a
n
e
s
a
Fe
a
i
ed Palestin
ries
a
u
ci
in
i
bi
a
n
an
ad
h
e
r
l
a
n
d
s
Zeal
ri
a
n
st
u
a New
u
g
al
a
r
a
ni
t Kitts an
o
a (
d
i
A
gal
o
r
o
c
c
o
o
zam
y
anm
cara
ge
rway
u
l
i
ppi
a
n
d
n
t
L
o
m
u
ssi
r
en
M
M
M
Nam
Net
New
Ni
Ni
No
Occup
Territo
Om
Paki
Panam
Pap
Per
Phi
Pol
Port
Qat
R
R
Sain
Sai
Saint Vi
G
Sam
S„o Tom
Sau
Sene
t
0
0
0
0
0
0
1
0
0
0
0
0
0
0
0
5
0
0
0
3
1
0
0
0
5
2
1
0
0
0
o
un
ber)
1
0
5
um
Offshore
Rig C
(n
0
0
0
0
0
0
0
0
0
0
0
0
0
0
0
0
0
0
0
0
0
0
3
0
0
0
8
0
8
5
0
0
3
8
9
ay)
,1
6
,
1
1
4
5,
7,
uction
20
8
8,503
10
64
2
,
0
0
2
,
94
1,
Offshore Oil
Prod
(bbl/d
0
0
0
0
0
0
9
0
0
0
1
0
0
0
0
0
0
0
0
5
0
0
8
4
7
0
0
0
0
T)
75
73
71
54
,3
2
3
,
0
4
3
4,
5,
2
2
,
6
7
8
8,
3,
1
8
,637
45
Fleet
(
100
DW
Merchant
c
0
0
1
0
0
0
0
0
0
0
0
0
0
0
0
1
0
0
0
1
5
6
43
5
7
6
5
6
6
g
fi
5,
9,
3,
7,
3
,
9
7
6
,60
r
af
33
15
2
4
5
,
8
29
4
0
,
4
8
3
20
3
9,453
2
0
,
0
2
7
2
8
,
5
3
1
8
8
,
4
9
2
3
49
0 MT)
1
,
0
2
8
,
6
06
g
o T
Shippin
(
100
Car
g
0
0
0
0
0
1
6
1
0
0
0
0
0
0
0
0
0
0
0
4
0
4
6
5
0
0
0
)
T
2
0
3
53
45
4
1
8
85
1
,
7
4
7
0 G
Shipbuildin
Orderbook
(
100
0
0
0
0
0
0
8
0
0
4
0
0
0
0
0
7
0
0
0
0
6
0
0
00
6
0
0
6
0
0
00
4
0
0
0
0
o
nal
4,
8,
1,
8,
,2
4,
,6
6,
0,
,0
4,
,4
1
3
4
,
2
00
3
5,600
78
48
55
9
1
,
2
0
0
33
60
0
3
,
0
0
0
69
5
5
9
,
6
00
3
6
,
7
0
0
4
0
,
8
0
0
41
1
5
,
0
0
0
11
0
9
,
9
3
3
07
15
5
1
,
0
0
0
urism
isitor)
7,
1,
6,
,9
,4
1,
5
,
5
1
0
,
6
00
,4
6,
6
,
2
3
3
,
6
00
,0
1,
To
(v
55
10
1
2
,432
14
2
2
,874
47
29
Internati
4
0
0
0
0
7
0
0
2
0
0
0
1
0
0
5
0
0
0
2
3
08
2
0
6
17
00
27
2
3
6
30
1,
4
,
4
2
2
5
,
4
7
4
5
,
9
5
6
2
,
8
0
2
7,
,46
1,
2,
,22
T)
2
7
9
,
7
70
1
4
0
,
1
83
4
52
3
9
,
7
2
6
1
68
1
6
6
,
9
51
Marine
(M
Aquaculture
y
8
5
5
7
0
3
5
0
8
3
0
0
9
9
2
0
8
5
5
0
1
8
0
5
0
8
0
9
4
,7
08
08
,9
,8
0
2
4
8
3
7
4
5
3
00
,9
3
8
9
06
7
4
6
,6
35
,4
43
74
,5
0
7
4
4
3
8
,1
2
5
7
3
6
0
,3
85
8
2
,926
2,
1,
39
17
4,
7,
5,
5,
27
5,
3,
2,
54
22
4,
9,
89
3,
7,
95
1,
6,
31
Fisher
T)
85
88
25
28
13
46
20
7
0
6
,
41
97
11
1,
2
,
6
2
0
,
08
4,
(M
Marine
3
2
5
4
6
2
0
5
0
6
0
7
6
5
7
1
5
1
2
7
4
9
3
9
0
62
n
.
a
.
66
74
71
n
.
a
.
40
43
80
82
93
0
.
85
0
.
2
7
3
0
.
90
0
.
89
0.
0.
0
.
92
0.
0
.
50
0
.
78
0
.
94
0.
0.
0
.
7
6
8
0.
0
.
49
0
.
78
0.
0
.
74
0
.
75
0
.
75
0
.
77
0.
0
.
9
3
6
0.
0
.
83
0
.
70
0
.
57
HDI
i
c
f
es
bl
g
o
e
p. o
i
r
at
oba
tion
e
pu
R
m
e
a
n
d
s
Na
ca
b
R
n
d T
a
n
es
st
at
l
e
s
ri
r
a
b
E
i
n
gdom
a
e
'
Est
a
n
st
u
p
o
r
e
ni
on Isl
nka
e
ni
a
n
n
i
a
, U.
a
n
e
ki
c
hel
r
a
Leon
a
l
i
a
h Af
n
nam
d
e
n
an Ara
o
r l
si
uay
k
ey
k
m
t
e
d
A
t
e
d
St
u
at
nga
ove
o
m
ut
La
d
a
n
ri
w
ailand
g
o
n
g
a
n
i
d
a
d
a
ni
rai
n
ited K
ug
Sey
Sier
Si
Sl
Sol
Som
So
Spai
Sri
Su
Suri
Swe
Sy
Tai
Tanza
Th
Tim
To
To
Tri
Tu
Tur
Tur
Uk
Uni
U
Uni
Ur
Uzbe
Van
t
1
2
9
0
o
un
ber)
um
Offshore
Rig C
(n
0
0
ay)
uction
3
3
0
,
7
00
i
a
for
er
Offshore Oil
Prod
(bbl/d
0
0
0
0
T)
Fleet
(
100
DW
Merchant
c
0
g
fi
r
af
1
2
,
0
7
7
1
7
,
2
0
8
0 MT)
g
o T
Shippin
(
100
Car
g
0
0
)
7
9
T
0 G
Shipbuildin
Orderbook
(
100
notes to Table 1 for data compilation crit
8
0
0
5
0
0
0
0
o
nal
7,
6,
,9
34
07
63
urism
isitor)
2,
To
(v
30
Internati
0
activity. See the
l of
T)
1
4
,
2
5
9
3
6
1
,
7
17
Marine
(M
Aquaculture
y
3
5
9
5
6
0
0
0
0
e
ry low leve
5,
4,
9,
Fisher
T)
47
53
15
a v
1,
(M
Marine
8
1
2
69
0
.
77
0.
0
.
48
HDI
n
in Table 1.
t
colum
tion
Na
a
u
el
Nam
e
n
et
Venez
Vi
Yem
Sources: See las
Note: An entry of zero reflects no activity or
individual industries.
Table 3. Construction of Marine Industry Activity Index
Activity
Indicator
Industry Sector
Weight
Indicator
Weight
(vk)
(wj)
Marine fishery and
Fishery landings
1/2
1/5
aquaculture
Aquaculture production
1/2
Number of international
Tourism 1/5
1
visitors
Shipbuilding
1/5
Orderbook (ships on order)
1
Cargo traffic
2/3
Shipping 1/5
Merchant fleet
1/3
Production
2/3
Offshore oil
1/5
Rig count
1/3
Note: Weights are assigned by the authors as an illustration. These weights may be
adjusted by analysts or decision makers based on different economic or ecological
criteria. See discussions following Eqs. (2) and (3) on pages 10 and 11.
31
Table 4. Coastline Length (as Weights) by Nation and by LME
LME # LME name
% coast
Nation
1 East Bering Sea
100.00 United States
2 Gulf of Alaska
29.64 Canada
2 Gulf of Alaska
70.36 United States
3 California Current
42.96 Mexico
3 California Current
57.04 United States
4 Gulf of California
100.00 Mexico
5 Gulf of Mexico
35.25 Mexico
5 Gulf of Mexico
64.75 United States
6 Southeast U.S. Continental Shelf
24.76 Bahamas, The
6 Southeast U.S. Continental Shelf
75.24 United States
7 Northeast U.S. Continental Shelf
15.78 Canada
7 Northeast U.S. Continental Shelf
84.22 United States
8 Scotian Shelf
100.00 Canada
9 Newfoundland-Labrador Shelf
99.33 Canada
9 Newfoundland-Labrador Shelf
0.67 St. Pierre and Miquelon
10 Insular Pacific-Hawaiian
100.00 United States
11 Pacific Central-American Coastal
11.57 Colombia
11 Pacific Central-American Coastal
10.42 Costa Rica
11 Pacific Central-American Coastal
13.30 Ecuador
11 Pacific Central-American Coastal
4.82 El Salvador
11 Pacific Central-American Coastal
3.59 Guatemala
11 Pacific Central-American Coastal
0.95 Honduras
11 Pacific Central-American Coastal
32.97 Mexico
11 Pacific Central-American Coastal
4.91 Nicaragua
11 Pacific Central-American Coastal
15.42 Panama
11 Pacific Central-American Coastal
2.05 Peru
12 Caribbean Sea
0.18 Aruba
12 Caribbean Sea
9.10 Bahamas
12 Caribbean Sea
0.24 Barbados
12 Caribbean Sea
2.41 Belize
12 Caribbean Sea
0.18 Cayman Islands
12 Caribbean Sea
7.64 Colombia
12 Caribbean Sea
1.29 Costa Rica
12 Caribbean Sea
20.86 Cuba
12 Caribbean Sea
0.45 Dominica
12 Caribbean Sea
5.84 Dominican Republic
12 Caribbean Sea
0.16 Grenada
12 Caribbean Sea
1.12 Guadeloupe
12 Caribbean Sea
0.65 Guatemala
32
LME # LME name
% coast
Nation
12 Caribbean Sea
6.62 Haiti
12 Caribbean Sea
5.22 Honduras
12 Caribbean Sea
2.96 Jamaica
12 Caribbean Sea
0.63 Martinique
12 Caribbean Sea
3.40 Mexico
12 Caribbean Sea
0.81 Netherlands Antilles
12 Caribbean Sea
3.68 Nicaragua
12 Caribbean Sea
4.05 Panama
12 Caribbean Sea
2.55 Puerto Rico
12 Caribbean Sea
0.20 St. Kitts and Nevis
12 Caribbean Sea
0.44 St. Lucia
12 Caribbean Sea
0.15 St. Vincent and the Grenadines
12 Caribbean Sea
2.17 Trinidad and Tobago
12 Caribbean Sea
0.30 Turks and Caicos Islands
12 Caribbean Sea
0.11 United States
12 Caribbean Sea
16.26 Venezuela
12 Caribbean Sea
0.29 Virgin Islands
13 Humboldt Current
2.98 Argentina
13 Humboldt Current
86.37 Chile
13 Humboldt Current
10.65 Peru
14 Patagonian Shelf
69.82 Argentina
14 Patagonian Shelf
0.16 Chile
14 Patagonian Shelf
20.86 Falkland Islands
14 Patagonian Shelf
9.16 Uruguay
15 South Brazil Shelf
99.57 Brazil
15 South Brazil Shelf
0.43 Uruguay
16 East Brazil Shelf
100.00 Brazil
17 North Brazil Shelf
70.85 Brazil
17 North Brazil Shelf
5.27 French Guiana
17 North Brazil Shelf
9.28 Guyana
17 North Brazil Shelf
6.01 Suriname
17 North Brazil Shelf
8.58 Venezuela
18 West Greenland Shelf
100.00 Greenland
19 East Greenland Shelf
100.00 Greenland
20 Barents Sea
15.55 Norway
20 Barents Sea
72.43 Russia
20 Barents Sea
12.02 Svalbard
21 Norwegian Sea
100.00 Norway
22 North Sea
1.06 Belgium
22 North Sea
21.79 Denmark
22 North Sea
0.91 France
22 North Sea
7.60 Germany
22 North Sea
9.49 Netherlands
22 North Sea
24.00 Norway
33
LME # LME name
% coast
Nation
22 North Sea
6.11 Sweden
22 North Sea
29.03 United Kingdom
23 Baltic Sea
9.23 Denmark
23 Baltic Sea
10.87 Estonia
23 Baltic Sea
19.28 Finland
23 Baltic Sea
7.79 Germany
23 Baltic Sea
4.75 Latvia
23 Baltic Sea
1.50 Lithuania
23 Baltic Sea
7.35 Poland
23 Baltic Sea
8.64 Russia
23 Baltic Sea
30.58 Sweden
24 Celtic-Biscay Shelf
21.31 France
24 Celtic-Biscay Shelf
21.29 Ireland
24 Celtic-Biscay Shelf
0.23 Jersey
24 Celtic-Biscay Shelf
1.17 Man, Isle of
24 Celtic-Biscay Shelf
56.00 United Kingdom
25 Iberian Coastal
1.66 France
25 Iberian Coastal
41.14 Portugal
25 Iberian Coastal
57.20 Spain
26 Mediterranean Sea
1.22 Albania
26 Mediterranean Sea
4.80 Algeria
26 Mediterranean Sea
7.19 Croatia
26 Mediterranean Sea
2.25 Cyprus
26 Mediterranean Sea
5.27 Egypt
26 Mediterranean Sea
4.11 France
26 Mediterranean Sea
0.35 Gaza Strip
26 Mediterranean Sea
20.50 Greece
26 Mediterranean Sea
0.84 Israel
26 Mediterranean Sea
19.17 Italy
26 Mediterranean Sea
0.84 Lebanon
26 Mediterranean Sea
7.04 Libya
26 Mediterranean Sea
0.16 Malta
26 Mediterranean Sea
0.09 Monaco
26 Mediterranean Sea
0.57 Montenegro
26 Mediterranean Sea
1.64 Morocco
26 Mediterranean Sea
0.11 Slovenia
26 Mediterranean Sea
7.16 Spain
26 Mediterranean Sea
0.56 Syria
26 Mediterranean Sea
4.57 Tunisia
26 Mediterranean Sea
11.55 Turkey
27 Canary Current
2.14 Gambia, The
27 Canary Current
2.99 Guinea-Bissau
27 Canary Current
17.54 Mauritania
27 Canary Current
29.38 Morocco
34
LME # LME name
% coast
Nation
27 Canary Current
9.98 Senegal
27 Canary Current
16.11 Spain
27 Canary Current
21.87 Western Sahara
28 Guinea Current
1.66 Angola
28 Guinea Current
1.94 Benin
28 Guinea Current
6.20 Cameroon
28 Guinea Current
2.67 Congo-Brazaville
28 Guinea Current
5.74 Equatorial Guinea
28 Guinea Current
16.51 Gabon
28 Guinea Current
8.70 Ghana
28 Guinea Current
6.11 Guinea
28 Guinea Current
4.44 Guinea-Bissau
28 Guinea Current
12.59 Ivory Coast
28 Guinea Current
9.24 Liberia
28 Guinea Current
13.98 Nigeria
28 Guinea Current
1.36 Sao Tome and Principe
28 Guinea Current
7.13 Sierra Leone
28 Guinea Current
1.15 Togo
28 Guinea Current
0.59 Congo-Kinshasa
29 Benguela Current
38.40 Angola
29 Benguela Current
34.08 Namibia
29 Benguela Current
25.73 South Africa
30 Agulhas Current
2.53 Comoros
30 Agulhas Current
47.18 Madagascar
30 Agulhas Current
0.55 Mayotte
30 Agulhas Current
27.61 Mozambique
30 Agulhas Current
20.72 South Africa
30 Agulhas Current
1.41 Tanzania, United Republic of
31 Somali Coastal Current
14.38 Kenya
31 Somali Coastal Current
56.34 Somalia
31 Somali Coastal Current
29.28 Tanzania, United Republic of
32 Arabian Sea
0.45 Bahrain
32 Arabian Sea
1.52 Djibouti
32 Arabian Sea
23.92 India
32 Arabian Sea
16.20 Iran
32 Arabian Sea
0.51 Iraq
32 Arabian Sea
2.20 Kuwait
32 Arabian Sea
13.69 Oman
32 Arabian Sea
7.20 Pakistan
32 Arabian Sea
2.79 Qatar
32 Arabian Sea
4.44 Saudi Arabia
32 Arabian Sea
8.19 Somalia
32 Arabian Sea
6.97 United Arab Emirates
32 Arabian Sea
11.91 Yemen
35
LME # LME name
% coast
Nation
33 Red Sea
0.68 Djibouti
33 Red Sea
25.04 Egypt
33 Red Sea
3.35 Egypt, administered by Sudan
33 Red Sea
17.13 Eritrea
33 Red Sea
0.16 Israel
33 Red Sea
0.27 Jordan
33 Red Sea
34.60 Saudi Arabia
33 Red Sea
9.94 Sudan
33 Red Sea
8.83 Yemen
34 Bay of Bengal
8.09 Bangladesh
34 Bay of Bengal
29.79 India
34 Bay of Bengal
16.82 Indonesia
34 Bay of Bengal
7.17 Malaysia
34 Bay of Bengal
21.81 Myanmar (Burma)
34 Bay of Bengal
11.12 Sri Lanka
34 Bay of Bengal
5.19 Thailand
35 Gulf of Thailand
12.93 Cambodia
35 Gulf of Thailand
19.41 Malaysia
35 Gulf of Thailand
56.32 Thailand
35 Gulf of Thailand
11.34 Vietnam
36 South China Sea
1.54 Brunei
36 South China Sea
27.94 China
36 South China Sea
1.01 Hong Kong
36 South China Sea
21.37 Indonesia
36 South China Sea
11.63 Malaysia
36 South China Sea
12.15 Philippines
36 South China Sea
0.43 Singapore
36 South China Sea
2.99 Taiwan
36 South China Sea
20.95 Vietnam
37 Sulu-Celebes Sea
13.96 Indonesia
37 Sulu-Celebes Sea
8.42 Malaysia
37 Sulu-Celebes Sea
77.61 Philippines
38 Indonesian Sea
100.00 Indonesia
39 North Australian Shelf
100.00 Australia
40 Northeast Australian Shelf
98.53 Australia
40 Northeast Australian Shelf
1.47 Papua New Guinea
41 East Central Australian Shelf
100.00 Australia
42 Southeast Australian Shelf
100.00 Australia
43 Southwest Australian Shelf
100.00 Australia
44 West Central Australian Shelf
100.00 Australia
45 Northwest Australian Shelf
100.00 Australia
46 New Zealand Shelf
100.00 New Zealand
47 East China Sea
44.37 China
47 East China Sea
30.83 Japan
36
LME # LME name
% coast
Nation
47 East China Sea
18.21 South Korea
47 East China Sea
6.59 Taiwan
48 Yellow Sea
70.36 China
48 Yellow Sea
13.65 North Korea
48 Yellow Sea
15.99 South Korea
49 Kuroshio Current
95.48 Japan
49 Kuroshio Current
4.52 Taiwan
50 Sea of Japan
41.93 Japan
50 Sea of Japan
9.35 North Korea
50 Sea of Japan
43.07 Russia
50 Sea of Japan
5.65 South Korea
51 Oyashio Current
26.42 Japan
51 Oyashio Current
73.58 Russia
52 Sea of Okhotsk
4.37 Japan
52 Sea of Okhotsk
95.63 Russia
53 West Bering Sea
89.89 Russia
53 West Bering Sea
10.11 United States
54 Chukchi Sea
0.37 Canada
54 Chukchi Sea
0.91 Greenland
54 Chukchi Sea
38.92 Russia
54 Chukchi Sea
59.79 United States
55 Beaufort Sea
65.62 Canada
55 Beaufort Sea
34.38 United States
56 East Siberian Sea
100.00 Russia
57 Laptev Sea
100.00 Russia
58 Kara Sea
100.00 Russia
59 Iceland Shelf
100.00 Iceland
60 Faroe Plateau
100.00 Faroe Islands
61 Antarctica
100.00 Antarctica
62 Black Sea
4.05 Bulgaria
62 Black Sea
4.77 Georgia
62 Black Sea
6.44 Romania
62 Black Sea
19.81 Russia
62 Black Sea
24.45 Turkey
62 Black Sea
40.48 Ukraine
63 Hudson Bay
100.00 Canada
Data Source: Goldsmith (2005).
37
Table 5. Mapping of LMEs to Regional Seas
Regional Sea
LME #*
Antarctic 61
Arctic
54, 55, 56, 57, 58, 64
Baltic Sea
23
Black Sea
62
Caspian Sea
--
East Asian Seas
35, 36, 37, 38, 39, 44, 45
Eastern Africa
30, 31
Mediterranean 26
North-East Atlantic
19, 20, 21, 22, 24, 25, 59, 60
North-East Pacific
1, 2, 3, 4, 11
North-West Pacific
47, 48, 49, 50, 51, 52, 53
Red Sea and Gulf of Aden 33
ROPME Sea Area
32
South Asian Seas
34
Pacific (SPREP)
40, 41, 42, 46
South-East Pacific
13
South-West Atlantic
14, 15, 16, 17
West and Central Africa 27, 28, 29
Wider Caribbean
5, 6, 12
Source: UNEP (2004).
* See Table 6 for LME names.
Note: In our calculation, LME 19 and LME 60 were excluded from
Northeastern Atlantic Seas and LME 64 was excluded from Arctic Seas for
lack of socioeconomic and marine industry activity data.
38
Table 6. LME Areas
LME # LME
Area (km2)
1 East Bering Sea
1,356,989
2 Gulf of Alaska
1,465,110
3 California Current
2,208,710
4 Gulf of California
221,575
5 Gulf of Mexico
1,529,669
6 Southeast U.S. Continental Shelf
316,855
7 Northeast U.S. Continental Shelf
303,175
8 Scotian Shelf
282,953
9 Newfoundland-Labrador Shelf
896,468
10 Insular Pacific-Hawaiian
979,225
11 Pacific Central-American Coastal
1,982,191
12 Caribbean Sea
3,259,214
13 Humboldt Current
2,544,850
14 Patagonian Shelf
1,163,067
15 South Brazil Shelf
565,471
16 East Brazil Shelf
1,074,984
17 North Brazil Shelf
1,049,727
18 West Greenland Shelf
374,941
19 East Greenland Shelf
319,087
20 Barents Sea
1,714,095
21 Norwegian Shelf
1,116,127
22 North Sea
693,840
23 Baltic Sea
390,077
24 Celtic-Biscay Shelf
755,886
25 Iberian Coastal
303,054
26 Mediterranean Sea
2,516,484
27 Canary Current
1,121,173
28 Guinea Current
1,919,654
29 Benguela Current
1,456,812
30 Agulhas Current
2,622,579
31 Somali Coastal Current
840,709
32 Arabian Sea
3,929,701
33 Red Sea
458,617
34 Bay of Bengal
3,660,127
35 Gulf of Thailand
386,878
36 South China Sea
3,159,956
37 Sulu-Celebes Sea
1,007,498
38 Indonesian Sea
2,261,845
39 North Australian Shelf
778,782
40 Northeast Australian Shelf/Great Barrier Reef
1,281,041
41 East-Central Australian Shelf
651,044
39
LME # LME
Area (km2)
42 Southeast Australian Shelf
1,187,652
43 Southwest Australian Shelf
1,047,703
44 West-Central Australian Shelf
543,733
45 Northwest Australian Shelf
911,306
46 New Zealand Shelf
963,394
47 East China Sea
775,065
48 Yellow Sea
437,376
49 Kuroshio Current
1,316,879
50 Sea of Japan
983,843
51 Oyashio Current
530,381
52 Sea of Okhotsk
1,552,663
53 West Bering Sea
1,992,919
54 Chukchi Sea
556,899
55 Beaufort Sea
772,183
56 East Siberian Sea
926,721
57 Laptev Sea
499,039
58 Kara Sea
797,171
59 Iceland Shelf
315,535
60 Faroe Plateau
149,946
61 Antarctic
4,328,522
62 Black Sea
460,151
63 Hudson Bay
841,214
64 Arctic Ocean
6,048,285
Source: The Sea Around Us Project (2005).
40
0.106
0.900
0.560
2.461
3.812
1.999
2.698
4.902
6.892
2.241
45.369
20.299
6.102
4.827
4.798
6.838
2.865
6.616
6.589
4.128
4.128
4.128
Marine
Industry
Activity
Index
*
0.025
0.604
0.718
2.791
0.806
1.381
2.766
4.088
3.872
2.197
36.865
14.902
3.268
3.212
6.284
7.634
1.176
8.716
8.679
3.122
3.122
3.122
Index
Ship & Oil
0.357
1.813
0.294
2.127
14.278
5.583
2.300
4.571
6.686
3.603
44.410
22.269
13.395
4.420
3.364
8.856
7.941
4.676
4.662
0.385
0.385
0.385
Index
Tourism
0.098
0.878
0.350
1.805
2.365
0.268
2.895
7.675
16.159
1.010
71.837
34.521
7.309
10.078
1.772
2.431
2.859
2.257
2.249
10.891
10.891
10.891
Index
Activity Indexes for LMEs
Fishery &
Aquaculture
try
mic
34.710
47.616
47.619
53.103
61.160
62.564
62.635
63.400
69.200
73.177
73.442
73.777
73.826
74.778
77.055
77.304
77.323
77.500
77.525
79.500
79.500
79.500
41
Index
(HDI)
Socioecono
#
E
31
30
28
29
27
33
32
34
38
12
48
36
35
37
17
11
62
16
15
56
57
58
M
L
(ranked in order of the Socioeconomic Index)
o
cioeconomic and Marine Indus
S
Table 7:
E
M
L
erican Coastal
ea
land
a
li Coastal Current
Som
Agulhas Current
Guinea Current
Benguela Current
Canary Current
Red Sea
Arabian Sea
Bay of Bengal
Indonesian Sea
Caribbean S
Yellow Sea
South China Sea
Gulf of Thai
Sulu-Celebes Sea
North Brazil Shelf
Pacific Central-Am
Black Sea
East Brazil Shelf
South Brazil Shelf
East Siberian Sea
Laptev Sea
Kara Sea
5.426
19.823
7.901
3.499
8.413
17.744
11.976
8.409
41.821
5.249
26.422
32.158
33.825
3.468
31.282
11.854
17.048
1.235
32.514
9.142
41.448
41.448
36.360
8.989
31.891
13.775
Marine
Industry
Activity
Index
*
5.071
23.096
7.251
0.178
4.595
23.976
14.904
9.972
42.147
5.085
27.524
35.002
36.611
2.378
33.082
3.155
14.639
0.403
45.846
5.227
43.969
43.969
37.861
12.540
32.496
16.405
Index
Ship & Oil
0.675
24.923
6.199
1.721
27.192
3.529
2.138
1.288
30.773
8.225
34.858
43.729
46.271
8.086
44.030
47.324
38.841
2.876
6.705
25.182
57.893
57.893
52.758
6.491
48.248
14.384
Index
Tourism
11.245
4.907
11.553
15.241
1.087
13.262
13.031
10.839
51.891
2.763
14.683
12.055
13.021
2.120
13.131
2.482
2.482
2.092
18.324
4.848
17.438
17.438
15.456
0.833
13.716
5.275
Index
Fishery &
Aquaculture
mic
80.125
80.200
80.956
83.015
83.262
83.263
83.278
83.939
84.076
86.846
87.433
88.015
89.071
90.324
90.830
91.188
92.204
92.600
93.628
93.668
93.900
93.900
93.963
94.006
94.019
94.021
42
Index
(HDI)
Socioecono
#
4
3
5
6
9
1
7
2
E
52
53
13
26
50
51
20
47
14
54
23
25
24
46
49
10
40
22
M
L
E
M
L
u
rrent
y Shelf
nd-Labrador Shelf
i
c-Hawaiian
u
stralian Shelf/Great Barrier Reef
a
boldt Current
-Bisca
Sea of Okhotsk
Gulf of California
West Bering Sea
Hum
Mediterranean Sea
Sea of Japan
Oyashio Current
Barents Sea
East China Sea
Patagonian Shelf
Chukchi Sea
California C
Gulf of Mexico
Baltic Se
Southeast U.S. Continental Shelf
Iberian Coastal
Celtic
New Zealand Shelf
Kuroshio Current
Newfoundla
East Bering Sea
Insular Pacif
Northeast U.S. Continental Shelf
Northeast A
Gulf of Alaska
North Sea
1.474
20.289
9.204
9.204
9.121
9.121
9.121
9.121
9.121
9.121
19.654
Marine
Industry
Activity
Index
*
0.029
18.570
5.262
5.262
12.727
12.727
12.727
12.727
12.727
12.727
27.969
Index
Ship & Oil
0.417
36.539
25.351
25.351
6.587
6.587
6.587
6.587
6.587
6.587
3.662
Index
Tourism
6.865
9.198
4.880
4.880
0.836
0.836
0.836
0.836
0.836
0.836
10.703
Index
Fishery &
Aquaculture
mic
94.100
94.163
94.300
94.300
94.600
94.600
94.600
94.600
94.600
94.600
95.600
43
Index
(HDI)
Socioecono
#
8
E
59
55
63
39
41
42
43
44
45
21
M
L
ulated using Eqs. (3) and (4) on pages 11 and 12.
lc
es the indexes ca
E
0 tim
M
h
elf
h
elf
L
r
e 10
u
stralian Shelf
a
lues a
Iceland Shelf
Beaufort Sea
Scotian Shelf
Hudson Bay
North Australian Shelf
East-Central Australian Shelf
Southeast A
Southwest Australian S
West-Central Australian Shelf
Northwest Australian S
Norwegian Shelf
* Including shipbuilding, shipping, and offshore oil.
Note: All v
45.369
41.821
41.448
41.448
36.360
33.825
32.514
32.158
31.891
31.282
26.422
20.299
20.289
19.823
19.654
17.744
17.048
13.775
11.976
11.854
9.204
9.204
Marine
Industry
Activity
Index
*
36.865
42.147
43.969
43.969
37.861
36.611
45.846
35.002
32.496
33.082
27.524
14.902
18.570
23.096
27.969
23.976
14.639
16.405
14.904
3.155
5.262
5.262
Index
Ship & Oil
44.410
30.773
57.893
57.893
52.758
46.271
6.705
43.729
48.248
44.030
34.858
22.269
36.539
24.923
3.662
3.529
38.841
14.384
2.138
47.324
25.351
25.351
Index
Tourism
71.837
51.891
17.438
17.438
15.456
13.021
18.324
12.055
13.716
13.131
14.683
34.521
9.198
4.907
10.703
13.262
2.482
5.275
13.031
2.482
4.880
4.880
Index
Activity Indexes for LMEs
Fishery &
Aquaculture
try
mic
73.442
84.076
93.900
93.900
93.963
89.071
93.628
88.015
94.019
90.830
87.433
73.777
94.163
80.200
95.600
83.263
92.204
94.021
83.278
91.188
94.300
94.300
44
Index
Socioecono
#
1
7
5
3
2
6
4
8
E
48
47
10
49
54
36
55
21
50
24
22
51
25
63
M
L
(ranked in order of Marine Activity Index)
o
cioeconomic and Marine Indus
S
Table 8:
E
M
L
i
c-Hawaiian
u
rrent
y Shelf
-Bisca
Yellow Sea
East China Sea
East Bering Sea
Insular Pacif
Northeast U.S. Continental Shelf
Gulf of Mexico
Kuroshio Current
California C
Gulf of Alaska
Southeast U.S. Continental Shelf
Chukchi Sea
South China Sea
Beaufort Sea
Gulf of California
Norwegian Shelf
Sea of Japan
Celtic
North Sea
Oyashio Current
Iberian Coastal
Scotian Shelf
Hudson Bay
9.142
9.121
9.121
9.121
9.121
9.121
9.121
8.989
8.413
8.409
7.901
6.892
6.838
6.616
6.589
6.102
5.426
5.249
4.902
4.827
4.798
4.128
4.128
4.128
3.812
3.499
Marine
Industry
Activity
Index
*
5.227
12.727
12.727
12.727
12.727
12.727
12.727
12.540
4.595
9.972
7.251
3.872
7.634
8.716
8.679
3.268
5.071
5.085
4.088
3.212
6.284
3.122
3.122
3.122
0.806
0.178
Index
Ship & Oil
25.182
6.587
6.587
6.587
6.587
6.587
6.587
6.491
27.192
1.288
6.199
6.686
8.856
4.676
4.662
13.395
0.675
8.225
4.571
4.420
3.364
0.385
0.385
0.385
14.278
1.721
Index
Tourism
4.848
0.836
0.836
0.836
0.836
0.836
0.836
0.833
1.087
10.839
11.553
16.159
2.431
2.257
2.249
7.309
11.245
2.763
7.675
10.078
1.772
10.891
10.891
10.891
2.365
15.241
Index
Fishery &
Aquaculture
mic
93.668
94.600
94.600
94.600
94.600
94.600
94.600
94.006
83.262
83.939
80.956
69.200
77.304
77.500
77.525
73.826
80.125
86.846
63.400
74.778
77.055
79.500
79.500
79.500
61.160
83.015
45
Index
Socioecono
#
9
E
39
41
42
43
44
45
40
26
20
53
38
11
16
15
35
52
14
34
37
17
56
57
58
27
13
M
L
E
M
h
elf
h
elf
L
erican Coastal
nd-Labrador Shelf
u
stralian Shelf
u
stralian Shelf/Great Barrier Reef
land
boldt Current
Newfoundla
North Australian Shelf
East-Central Australian Shelf
Southeast A
Southwest Australian S
West-Central Australian Shelf
Northwest Australian S
Northeast A
Mediterranean Sea
Barents Sea
West Bering Sea
Indonesian Sea
Pacific Central-Am
East Brazil Shelf
South Brazil Shelf
Gulf of Thai
Sea of Okhotsk
Patagonian Shelf
Bay of Bengal
Sulu-Celebes Sea
North Brazil Shelf
East Siberian Sea
Laptev Sea
Kara Sea
Canary Current
Hum
3.468
2.865
2.698
2.461
2.241
1.999
1.474
1.235
0.900
0.560
0.106
Marine
Industry
Activity
Index
*
2.378
1.176
2.766
2.791
2.197
1.381
0.029
0.403
0.604
0.718
0.025
Index
Ship & Oil
8.086
7.941
2.300
2.127
3.603
5.583
0.417
2.876
1.813
0.294
0.357
Index
Tourism
2.120
2.859
2.895
1.805
1.010
0.268
6.865
2.092
0.878
0.350
0.098
Index
Fishery &
Aquaculture
mic
90.324
77.323
62.635
53.103
73.177
62.564
94.100
92.600
47.616
47.619
34.710
46
Index
Socioecono
#
E
23
62
32
29
12
33
59
46
30
28
31
M
L
ulated using Eqs. (3) and (4) on pages 11 and 12.
lc
es the indexes ca
E
0 tim
M
L
r
e 10
ea
a
lues a
a
a
li Coastal Current
Baltic Se
Black Sea
Arabian Sea
Benguela Current
Caribbean S
Red Sea
Iceland Shelf
New Zealand Shelf
Agulhas Current
Guinea Current
Som
* Including shipbuilding, shipping, and offshore oil.
Note: All v
l
f
t
f
an Shel
l
f
r
a
li
80)
Labrador Shelf
Aust
(
SEI
e
xico
r
al
h
elf
t Australian Shelf/Great
-Biscay She
ent
-
C
High socio- developmen
r
Reef
1. East Bering Sea
2. Gulf of Alaska
3. California Current
5. Gulf of M
6. Southeast U.S. Continental Shelf
7. Northeast U.S. Continental She
10. Insular Pacific-Hawaiian
47. East China Sea
49. Kuroshio Current
4. Gulf of California
8. Scotian S
9. Newfoundland-
14. Patagonian Shelf
20. Barents Sea
21. Norwegian Shelf
22. North Sea
24. Celtic
25. Iberian Coastal
26. Mediterranean Sea
39. North Australian Shelf
40. Northeas
Barrie
41. East
e
r
i
c
a
n
m
f
< 80)
cioeconomic
l
Shel
SEI
e
n
t
r
a
l
-
A
azi
development
(50
Br
a
c
i
f
i
c
C
47
Medium so
Classification of LMEs
48. Yellow Sea
1
1
.
P
Coastal
15. South Brazil Shelf
16. East
35. Gulf of Thailand
36. South China Sea
38. Indonesian Sea
Table 9:
< 50)
socioeconomic
(
SEI
development
Low
none
n
o
n
e
i
ty
< 30)
30)
activ
(
MAI
MAI
Medium marine
industry activity
(5
High marine industry
t
Shelf
80)
(
SEI
dt Current
ea
aland Shelf
bol
High socio- developmen
e
st-Central Australian Shelf
e
st Bering Sea
42. Southeast Australian Shelf
43. Southwest Australian Shelf
44. W
45. Northwest Australian
50. Sea of Japan
51. Oyashio Current
52. Sea of Okhotsk
53. W
54. Chukchi Sea
55. Beaufort Sea
63. Hudson Bay
13. Hum
23. Baltic S
46. New Ze
59. Iceland Shelf
< 80)
cioeconomic
SEI
ea
development
(50
48
Medium so
12. Caribbean Sea
17. North Brazil Shelf
27. Canary Current
29. Benguela Current
32. Arabian Sea
33. Red Sea
34. Bay of Bengal
37. Sulu-Celebes Sea
56. East Siberian Sea
57. Laptev S
58. Kara Sea
62. Black Sea
r
e
nt
< 50)
socioeconomic
(
SEI
development
a
li Coastal Cur
Low
28. Guinea Current
30. Agulhas Current
31. Som
)
i
ty
< 5
activ
(
MAI
marine industry
w
Lo
Table 10: Socioeconomic and Marine Industry Activity Indexes for Regional Seas
(ranked in order of the Socioeconomic Index)
RSP Socio-
Fishery &
Tourism
Ship & Oil
Marine
economic Aquaculture
Index
Index*
Industry
Index
Index
Activity
Index
Eastern Africa
44.483
0.688
1.459
0.463
0.708
West-Central Africa
52.771
1.324
4.374
1.411
1.986
Red Sea and Gulf of Aden
62.564
0.268
5.583
1.381
1.999
ROPME Sea Area
62.635
2.895
2.300
2.766
2.698
South Asian Seas
63.400
7.675
4.571
4.088
4.902
Black Sea
77.323
2.859
7.941
1.176
2.865
East Asian Seas
77.887
17.733
12.137
9.810
11.860
Wider Caribbean
79.034
5.360
18.895
14.424
13.505
South-West Atlantic
80.203
2.276
5.388
6.952
5.704
South-East Pacific
83.015
15.241
1.721
0.178
3.499
Mediterranean 83.262
1.087
27.192
4.595
8.413
North-West Pacific
83.332
20.584
9.238
21.476
18.850
Arctic 83.931
11.117
13.649
10.306
11.137
North-East Pacific
87.160
10.545
37.170
28.314
26.531
Baltic Sea
90.324
2.120
8.086
2.378
3.468
North-East Atlantic
90.402
7.957
12.271
14.642
12.831
Pacific (SPREP)
93.942
1.132
5.681
9.761
7.219
*Including shipbuilding, shipping, and offshore oil.
Note: All values are 100 times the indexes calculated using Eqs. (5) and (6). The Caspian Sea
Regional Sea is not on this list because there is no corresponding LME. The Antarctic
Regional Sea is not on this list because there is little economic activity.
49
Table 11: Socioeconomic and Marine Industry Activity Indexes for Regional Seas
(ranked in order of the Marine Industry Activity Index)
RSP Socio-
Fishery &
Tourism
Ship & Oil
Marine
economic Aquaculture
Index
Index*
Industry
Index
Index
Activity
Index
North-East Pacific
87.160
10.545
37.170
28.314
26.531
North-West Pacific
83.332
20.584
9.238
21.476
18.850
Wider Caribbean
79.034
5.360
18.895
14.424
13.505
North-East Atlantic
90.402
7.957
12.271
14.642
12.831
East Asian Seas
77.887
17.733
12.137
9.810
11.860
Arctic 83.931
11.117
13.649
10.306
11.137
Mediterranean 83.262
1.087
27.192
4.595
8.413
Pacific (SPREP)
93.942
1.132
5.681
9.761
7.219
South-West Atlantic
80.203
2.276
5.388
6.952
5.704
South Asian Seas
63.400
7.675
4.571
4.088
4.902
South-East Pacific
83.015
15.241
1.721
0.178
3.499
Baltic Sea
90.324
2.120
8.086
2.378
3.468
Black Sea
77.323
2.859
7.941
1.176
2.865
ROPME Sea Area
62.635
2.895
2.300
2.766
2.698
Red Sea and Gulf of Aden
62.564
0.268
5.583
1.381
1.999
West-Central Africa
52.771
1.324
4.374
1.411
1.986
Eastern Africa
44.483
0.688
1.459
0.463
0.708
*Including shipbuilding, shipping, and offshore oil.
Note: All values are 100 times the indexes calculated using Eqs. (5) and (6). The Caspian Sea
Regional Sea is not on this list because there is no corresponding LME. The Antarctic
Regional Sea is not on this list because there is little economic activity.
50
Table 12: Classification of Regional Seas
Low
Medium socioeconomic
High socioeconomic
socioeconomic
development
development
development
(50 SEI < 80)
(SEI 80)
(SEI < 50)
High marine
North-East
Pacific
industry
activity
(MAI 20)
Wider
Caribbean
North-West Pacific
Medium marine
East-Asian Seas
South-West Atlantic
industry
Pacific (SPREP)
activity
Mediterranean
(5 MAI < 20)
Arctic
North-East Atlantic
Eastern Africa
West & Central Africa
Baltic Sea
Low marine
Red Sea & Gulf of Aden South-East Pacific
industry
ROPME Sea Area
activity
Black Sea
(MAI < 5)
South Asian Seas
51
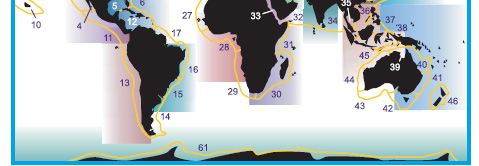
Figure1:
Regional seas and large marine ecosystems
Source: UNEP and NOAA (2005).
REGIONAL SEAS, WEST TO EAST:
North-East Pacific South-East Pacific Wider Caribbean South-West Atlantic
West & Central Africa Mediterranean Black Sea Eastern Africa Red Sea & Gulf of Aden
ROPME Sea Area South Asian Seas East Asian Seas North-West Pacific Pacific (SPREP)
INDEPENDENT PARTNERS:
Arctic North-East Atlantic Baltic Sea Caspian Sea Antarctic
64 LMES OF THE WORLD
48
Yellow
Sea
1 East Bering Sea
17 North Brazil Shelf
33 Red Sea
49 Kuroshio Current
2 Gulf of Alaska
18 West Greenland Shelf
34 Bay of Bengal
50 Sea of Japan
3 California Current
19 East Greenland Shelf
35 Gulf of Thailand
51 Oyashio Current
4 Gulf of California
20 Barents Sea
36 South China Sea
52 Sea of Okhotsk
5 Gulf of Mexico
21 Norwegian Shelf
37 Sulu-Celebes Sea
53 West Bering Sea
6 Southeast US Continental Shelf
22 North Sea
38 Indonesian Sea
54 Chukchi Sea
7 Northeast US Continental Shelf
23 Baltic Sea
39 North Australian Shelf
55 Beaufort Sea
8 Scotian Shelf
24 Celtic-Biscay Shelf
40 Northeast Australian Shelf/ 56 East Siberian Sea
9 Newfoundland-Labrador Shelf
25 Iberian Coastal
Great Barrier Reef
57 Laptev Sea
10 Insular Pacific-Hawaiian
26 Mediterranean Sea
41 East-Central Australian Shelf
58 Kara Sea
11 Pacific Central-American Coastal
27 Canary Current
42 Southeast Australian Shelf
59 Iceland Shelf
12 Caribbean Sea
28 Guinea Current
43 Southwest Australian Shelf
60 Faroe Plateau
13 Humboldt Current
29 Benguela Current
44 West-Central Australian Shelf
61 Antarctic
14 Patagonian Shelf
30 Agulhas Current
45 Northwest Australian Shelf
62 Black Sea
15 South Brazil Shelf
31 Somali Coastal Current
46 New Zealand Shelf
63 Hudson Bay
16 East Brazil Shelf
32 Arabian Sea
47 East China Sea
64 Arctic Ocean
52
Figure 2: Ranking of LMEs by Marine Industry Activity
Somali Coastal Current
Guinea C rren
u
t
Agulhas C r
u rent
New Zeala d
n Shelf
Iceland Shelf
Red e
S a
Caribbean Se
Benguela Current
a
Arabian e
S a
Black
Sea
Baltic Sea
Humboldt Current
Canary C r
u rent
Kara Sea
Laptev e
S a
East Siber a
i n Sea
North Brazil Shelf
Sulu- elebes
C
Sea
Bay of Bengal
Patagonia S
n helf
Okh
Sea of
otsk
Gulf of Thailand
South Brazi S
l helf
East Brazil Shelf
Pacific Central-American o
C astal
Indonesian e
S a
West Bering e
S a
Barents Sea
Mediterranean Sea
Northeast Australian Shelf/Great Barrier Reef
Northwest Australian Shelf
West-C tral Au
en
stralian Shelf
Southwest Australian Shelf
Southeast Australian Shelf
East-Central Australian Shelf
North Australian Shelf
Newfoundland-Labrador Shelf
Hudson Bay
Sco
S
tian helf
Iberian Coastal
Oyashio Current
North Sea
Celtic-Biscay S e
h lf
Sea of Japan
Norwegian Shelf
Gulf of Cali or
f nia
Beaufort Sea
South C i
h na Sea
Chukchi Sea
Southeast U.S. Continenta S
l helf
Gulf of l
A aska
California C rren
u
t
Kuroshio u
C rrent
Gulf of Mexico
Northeast U.S. Continental Shelf
Insular Pacific-Hawaiian
East Bering e
S a
Eas Ch
t
ina Sea
Yellow Sea
0.000
5.000
10.000
15.000
20.000
25.000
30.000
35.000
40.000
45.000
50.000
marine industry activity
53
Figure 3: Ranking of LMEs by Area-adjusted Marine Industry Activity
Somali Coastal Current
u
G inea Current
Agulhas u
C rrent
Arab a
i n e
S a
Caribb a
e n e
S a
New Zealand Shelf
Bay of B n
e gal
Humboldt C r
u rent
Benguela Current
Indonesian Sea
Mediter a
r nean Sea
a
C nary C r
u rent
Pacific Central-American Coastal
Sea of Okhotsk
West Bering Sea
Red Sea
East Siberian Sea
Patagonian Shelf
North Brazil Shelf
Iceland Shelf
Sulu-Cele e
b s Sea
Barents Sea
Kara Sea
East Brazil Shelf
Black Sea
South China Sea
Northeast Australian Shelf/Gre t
a Barrier Reef
Southeast Australian h
S elf
Laptev Sea
Southwest Australi n
a Shelf
Baltic Sea
Northwest Australian Shelf
Newfoundland-Labrador Shelf
Hudson Bay
South Brazil Shelf
North Australian Shelf
East-Central Australian Shelf
California Current
Gulf of Thailand
West-Central Australi n
a Shelf
Norwegian Shelf
Se
a of Japan
North Sea
Gulf of A a
l ska
Gulf of e
M xico
Celtic-Bisca
y Shelf
Oyashio u
C rrent
Kuroshio Current
Beaufort Sea
East Bering Sea
otia
Sc
n Shelf
Iberian Coastal
Insular Pacific-Hawaiian
Chukchi Sea
East China Sea
Gulf of C
alifornia
Southeast U.S. Continent l
a Shelf
Yellow Sea
Northeast U.S. Continental Shelf
0.000
20.000
40.000
60.000
80.000
100.000
120.000
140.000
marine industry activity/area
54
Figure 4: Ranking of LMEs by MAI/SEI
Somali Coastal Current
Guinea C rrent
u
New Zeala d
n Shelf
c
I eland Shelf
Agulhas u
C rrent
Caribbean Sea
Red Sea
Black Sea
Ba
ltic Sea
Humboldt Current
Ar b
a ian Sea
Benguela u
C rrent
East Siberian e
S a
Kara Sea
Laptev e
S a
Patagonia
n Shelf
North Brazil Shelf
Canary Current
Sulu-Cele e
b s Sea
Se
a of Ok o
h tsk
Bay of B n
e gal
Gulf of Thailand
South Brazil Shelf
East r
B azil Shelf
Pacific Central-American Coastal
Northeast Australian Shelf/Great Barrier Reef
Southeast Australian Shelf
South e
w st Australian Shelf
Northwest Australian Shelf
North Australian Shelf
East-Central Australian Shelf
West-Central Australian Shelf
West Bering Sea
Newfoundland-L br
a ador Shelf
Hudson Bay
Sc
n
otia Shelf
Indonesian Sea
B r
a ents Sea
Mediterranean Sea
Iberian Coastal
Oyashio Current
North Sea
Celtic-Bisca
y Shelf
Norwegian Shelf
Se
a of Japan
Beaufo t
r Sea
Gulf of a
C lifornia
South China Sea
Chukchi Sea
Gulf o
f Alaska
Southeast U.S. Continen a
t l Shelf
Kuroshio Current
Californi
a Current
Gulf of Mexico
Northeast U.S. Continental Shelf
East Bering Sea
Insular Pacific-Hawaiian
East China Sea
Yellow Sea
0
0.1
0.2
0.3
0.4
0.5
0.6
0.7
MAI/SEI
55
Figure 5:
Intensity of activity in large marine ecosystems: indexes showing
the relationship between marine industry activity and socioeconomic
development. The data for four representative LME cases are labelled on
the graph.
100
Scotian
Northeast
Shelf
Shelf
90
80
t
Yellow
en
Sea
70
ic developm
60
Benguela
Current
50
socio-econom
40
30
0
10
20
30
40
50
marine activity
56
Figure 6: Ranking of Regional Seas by Marine Industry Activity
Eastern Africa
West-Central Africa
Red Sea and Gulf of Aden
ROPME Sea Area
Black Sea
Baltic Sea
South-East Pacific
South Asian Seas
South-West Atlantic
Pacific (SPREP)
Mediterranean
Arctic
East Asian Seas
North-East Atlantic
Wider Caribbean
North-West Pacific
North-East Pacific
0.000
5.000
10.000
15.000
20.000
25.000
30.000
marine industry activity
57
Figure 7: Ranking of Regional Seas
by MAI/SEI Ranking
Eastern Africa
Red Sea and Gulf of Aden
Black Sea
West-Central Africa
Baltic Sea
South-East Pacific
ROPME Sea Area
South-West Atlantic
Pacific (SPREP)
South Asian Seas
Mediterranean
Arctic
North-East Atlantic
East Asian Seas
Wider Caribbean
North-West Pacific
North-East Pacific
0.000
0.050
0.100
0.150
0.200
0.250
0.300
0.350
MAI/SEI
58
Figure 8: Intensity of activity in Regional Seas: indexes showing the
relationship between marine industry activity and socioeconomic
development. The data for two representative Regional Seas are labelled
on the graph.
100
90
Northwest Pacific
I
)
80
E
S
dex (
i
c
i
n
70
om
on
ec
o-
s
o
ci
60
West Central Africa
50
40
0
5
10
15
20
25
30
marine activity index (MAI)
59
Annex I
Case Study: Benguela Current Large Marine Ecosystem1
I. Introduction
This case study focuses on characterizing the potential for the nations of
the Benguela Current large marine ecosystem (BCLME), which include Angola,
Namibia, and South Africa, to manage and conserve the marine environment in a
sustainable fashion. We identify the ocean-related activities of the nations in the
region, review the literature relating to the potential effectiveness of political
institutions, and develop an estimate of the scale of resource rents that obtain
from the use of marine resources. We rely upon a rapidly growing body of
literature that describes the economic, social, and political features of the region
(e.g., Cullinan et al. 2005; Prochazka et al. 2005; Sumaila et al. 2005; Lange
2004, 2003; Russo et al. 2004; Blackie and Tarr 1999; Shannon and O'Toole
1999; Tapscott 1999; UNDP et al. 1999), as well as published and unpublished
data from both international and domestic sources (Anon. 2005, 2003; BAA
2005a, b, c; Coakley 2003a, b; FAO 2004, 2002, 2001; McLean 2005).
We find that the scale of resource rents from the use of BCLME resources
is significant, on the order of $4 billion a year. Annual rents are expected to grow
with expanding worldwide demand for petroleum products, especially natural gas,
and forage fish landings, especially pilchards and mackerels. At present, the
1 Chris Vonderweidt assisted in the initial literature searches and discussions about this case study.
AI-1
source of rents from ocean resources is heavily skewed toward Angola, deriving
mainly from offshore oil production. In the future, we expect this distribution to
persist, although increasingly the production of oil will take place off South Africa,
and natural gas will be produced off the coastlines of all three nations.
Although the typical range of marine pollution problems exists on a small
scale, the clearest market failure involves the historical overexploitation of the
fisheries, particularly those in the potentially most productive upwelling region, off
the coast of Namibia (Prochazka et al. 2005). Importantly, with efficient
management, considerable potential exists for the continued recovery of the
capture fisheries, particularly in Namibia and Angola. Rational fishery
management in this region may require international cooperation on
transboundary straddling stocks (Sumaila et al. 2005). Expansion of the offshore
hydrocarbon sector could continue to be a source of resource rents for all three
nations.
The implementation of a program of sustainable management of the
marine environment is a political decision, involving gains and losses to different
sectors of a nation's economy and to the peoples of the region now and in the
future. The three BCLME nations continue to face significant environmental,
public health, and social welfare problems, which are mostly unrelated to the
status of the marine environment. These problems may deserve the priority
attention of political leaders, ahead of issues of marine policy.
Notwithstanding the priority to devote resource rents from the
development of marine natural resources to improve social welfare, the scale of
AI-2
these rents is sufficient to continue to support existing efforts to improve marine
management. At the very least, the sustainable management programs,
involving scientific research and capacity building, which have been organized by
GEF and the BCLME nations, might be continued at the same or even a slightly
expanded scale. In an optimistic future, as the economies of these nations
develop, and hopefully as their social problems abate, any residual problems of
marine pollution and resource misallocations can be accorded a higher priority in
national and regional public policy.
II. Background
A. Benguela
Current
Region
The Benguela Current large marine ecosystem is located along the
southwest coast of Africa (Fig. 1). It runs along the western coast of South
Africa, including its two Cape Town provinces, past the coast of Namibia, and up
to and including Angola. The Angolan enclave of Cabinda is considered to be a
part of both the BCLME and the adjacent Guinea Current large marine
ecosystem to the north. Cabinda is a small enclave that is not contiguous with
the main Angolan state. It lies to the north of the short coast of the Democratic
Republic of the Congo (formerly Zaire). The coast of the Congo is not
considered to be a part of the BCLME.
The geographic region has been described by Clark et al. (1999) and
Crawford et al. (1989). The BCLME is one of the world's four major eastern
boundary current systems. It is the world's most powerful wind-driven coastal
AI-3
upwelling system, characterized by annual upwelling along the coast of southern
Namibia and seasonal upwelling to the north and south. It is bounded by sharp
fronts where it abuts warm-water regimes to the north (the south equatorial
eastern Atlantic counter current) and the south (the Agulhas current), making it
somewhat unique in that respect. The main Benguela Current runs from south to
north along the coasts of the three BCLME nations.
Climate is the primary driver of the BCLME system, and evidence is
beginning to mount that environmental variability is increasing as a consequence
of climate change. Teleconnections have been theorized between the Benguela
Current and ocean-climate processes in the North Atlantic and the Pacific
(including El NiÒo). The BCLME is very productive, and satellite primary
production samples rate this region as a Class I (high biological productivity)
ecosystem (>300gC/m2/yr). For decades, the BCLME has been exploited heavily
for pelagic forage stocks, especially pilchards and mackerels, and for other
species, including groundfish, rock lobster, high seas tunas, shrimps, and
deepsea species (Nichols 2004). Total yields of all stocks are reasonably stable,
although regime shifts have been experienced, probably exacerbated by heavy
commercial exploitation. The area now comprising the Namibian fisheries zone
was especially overfished by distant water fleets prior to Namibian independence
in 1990. Pollution is mainly localized in small harbor environments, but all major
forms of pollution and ecosystem degradation are known to exist, including
excessive nutrient inputs in coastal waters, hazardous wastes from mine tailings,
AI-4
dredge spoils, coastal mangrove deforestation, soil erosion, oil spills, marine
debris, and invasive species.
B. Marine
Industries
Table 1 identifies the array of marine activities by nation as discussed by
Tapscott (1999) and others. Fig. 2 compares BCLME index values of some of
these activities with the world average across all large marine ecosystems (see
section 1 of this report). This comparison suggests that, although the BCLME is
known to have significant development potential, levels of marine activities are
relatively minor to date. In the future, we expect to see these activity levels
expand, particularly through the further development of offshore hydrocarbon
resources, more effective exploitation of the capture fisheries, and growth in the
tourism sector.
Tables 2-5 present the annual scale of various activities in physical
quantities and, where available, as direct output impacts (US dollars). Fig. 3
depicts the scale of direct output impacts by resource type for the BCLME region
taken as a whole. These data are updates of estimates provided by Tapscott
(1999) that have been obtained from a variety of international data sources.
Offshore oil production in Angola (~$10 billion per year) and offshore diamond
dredging in Namibia (~$2 billion per year) are unquestionably the most
economically important marine activities in the region. Coastal tourism in
Namibia (~0.7 billion per year) and Cape Town (scale unknown) are the next
most significant economic activities.
AI-5
Fisheries in Namibia (~$0.4 billion per year) and Cape Town (~$0.2 billion
per year) are valuable as well. Fisheries in Angola are less important (less than
$0.2 billion per year), and continued pressure on the pilchard stocks by South
Africa may limit their growth in the near term (Str¯mme and SÊtersdal 1986).
Small-scale coastal fisheries in Angola play important social and food security
roles, however (Sumaila et al. 2003). None of these nations has a merchant fleet
to speak of, and none has a shipbuilding capacity. Only South Africa reports
significant shipping and cargo traffic. There are very significant efforts to explore
for offshore hydrocarbons; these efforts are well advanced in both near shore
and deep offshore environments on the outer continental shelves of Angola,
southwestern Namibia, and Cape Town.
C. Socio-Political
Issues
The three nations of the BCLME are relatively young and developing. All
three are characterized by dichotomous economies in which a well-developed
industrial sector (oil in Angola, mining in Namibia and South Africa, and industrial
agriculture in South Africa) is mirrored by an undeveloped, agrarian sector.
Although civil wars and insurgencies appear to have dissipated, all three
countries continue to experience a number of serious political and social
problems. These problems make it more difficult for the issue of sustainable
marine resource management to be accorded a priority in the foreseeable future,
except on paper.
AI-6
Notwithstanding the policy and management challenges posed by these
problems, three regional characteristics do encourage some optimism about the
more distant future. These characteristics include a mutual recognition that the
marine environment is highly productive; growing evidence of slow but
measurable progress in resolving some political issues; and the interest of
international development agencies in providing foreign aid.
Angola is still in the early stages of shaking off the debilitating effects of a
multi-decadal civil war that ended only in 2002. Roughly ten percent of the
Angolan population was killed in the war, and another 40 percent was displaced
from their homes and lands. The World Bank has committed some $100 million
to assist Angola in the resettlement of internally displaced persons. Angola has
experienced recent floods and droughts, both of which have led to famine in
certain locations. Ironically, Angolan lands have the potential to be highly
productive for agriculture, but many areas continue to be riddled with land mines,
which has stalled the rehabilitation of the agricultural sector and exacerbates the
hunger problem. A clear near-term priority is the rebuilding of the transportation
infrastructure, which was severely damaged during the civil war and is needed to
help move oil resources to markets.
Namibia's situation is brighter than Angola's, but the country still faces a
wide array of economic development issues. Namibian minerals and fisheries
are potentially among the most valuable in the world, which bodes well for the
country's future. One legacy of the historical South African occupation is a
largely inadequately trained workforce, inexperienced in corporate and public
AI-7
administration (McLean 2005). Namibia also has one of the most skewed
income distributions in Africa. Land redistribution is a major policy hurdle, as
nearly one-quarter of a million people require resettlement and most farmers are
reluctant to sell their private lands. Current policy mandates the sale of private
farmlands to the government, which will then be redistributed to internally
displaced persons. This policy necessitates sources of hard currency to fund the
compensation of private farmers. About 40 percent of Namibia's arable land
remains in a communal status, and there are proposals to establish property
rights for these lands. As the future ownership status of communal lands is as
yet undetermined, incentives for their efficient management have disappeared
(Blackie and Tarr 1999).
South Africa is much further along in the process of economic
development than either Angola or Namibia, yet it faces continuing pervasive
unemployment (just under 30 percent) and associated impoverishment,
difficulties with the redistribution of wealth, and the curse of widespread disease.
The South African government has boosted spending on public infrastructure,
particularly in the transportation sector, in an effort to grow the economy and
reduce unemployment. Like Namibia, South Africa also faces the problem of
redistributing private lands to the disenfranchised, and government budgetary
constraints have seriously slowed the implementation of this policy. Cape Town
is not as densely populated as the eastern sections of the country, but issues of
dense coastal development, including nutrient pollution, habitat destruction, and
shoreline erosion, have emerged. Cape Town represents about 15 percent of
AI-8
South Africa's GDP, and its two western coastal provinces have the lowest
unemployment rate in the country (about 17 percent).
D. Management
Organizations
Several recent studies have assessed the legal regimes and institutional
capacities of the three BCLME nations for managing the marine environment.
Russo et al. (2004) find that the national constitutions, public policies, and long-
term planning efforts provide evidence that these countries are seriously
concerned with managing their marine resources in ways that protect the marine
environment. In particular, a formal assessment of environmental impacts is
required by all three nations before the initiation of any significant marine activity.
Unlike Namibia and South Africa, Angola has not implemented its policy of
requiring environmental management plans for marine activities. Angola is party
to the relevant international conventions, however, whereas Namibia and South
Africa lag to some extent in signing, ratifying, or implementing agreements such
as the Convention on Oil Pollution Preparedness, Response and Cooperation
(OPRC).
The recognition of the BCLME as a large marine ecosystem, which has
led to significant funding from GEF (US$15 million) and the three BCLME nations
(US$18 million), sends a strong signal that these nations are sincere about the
sustainable management of the BCLME system. Notwithstanding this signal,
Russo et al. (2004) find that institutional capacity is lacking with respect to the
enforcement of marine policies in these nations. In particular, pollution controls
AI-9
are undeveloped, and the potential for transboundary impacts from marine
activities is ignored. A more critical problem is that the relevant managing
agencies face internal conflicts of interest, being assigned roles for both
promotion and regulation of exploitative activities. In their study of sustainable
development policies in Namibia, Blackie and Tarr (1999) find that the impact of
such policies on decision-making needs improvement. Cullinan et al. (2005)
echo these criticisms, reporting that national and international ocean governance
are inadequate for long-term protection and sustainable use of the BCLME.
To be fair, all three nations are just now emerging from significant internal
tribulations, and even the existence on paper of institutions for the sustainable
management of marine resources in the region seems nothing short of a miracle.
International funds will help to clarify institutional inadequacies and scientific
uncertainties, thereby revealing the path to improvements in marine policy. For
example, Sumaila et al. (2005) demonstrate the need for transboundary
management of the shared commercial fish stocks of the BCLME, and they
calculate the economic benefits from such an effort. Cullinan et al. (2005)
present a number of options for international cooperation in the BCLME, and they
develop a strong argument for the establishment of a formal Benguela Current
Commission.
III.
Resource Rents from Marine Activities
In this section we elaborate on marine activities in the BCLME, and we
present estimates of resource rents from the most important activities, including
AI-10
offshore oil production, marine diamond mining, and marine fisheries. Our
estimates of rents in all of these categories are presented in Table 6. Resource
rents by type of resource are depicted in Fig. 4. Where relevant, we explain
possible alternative sources of data that can be used to estimate resource rents.
In the next section, we discuss the distributional issue of whether resource rents
from marine activities ought to be used to enable the sustainable management of
marine resources in the BCLME in the future.
A. Offshore
Hydrocarbons
Only Angola has offshore oil concessions that are currently in production.
Exploration efforts are underway in southern Namibia, particularly in the Kudu
gas field to the west of Alexander Bay, South Africa. Exploration efforts are also
well advanced off the coast of Cape Town. There they focus on the Ibhubesi
natural gas field, which may be geologically connected to the Kudu prospect, and
on oil fields both inshore and further offshore of Ibhubesi. There is no current
production of either oil or natural gas in this part of the BCLME to date, although
there is considerable potential for the future.
Angola relies predominantly on the development of offshore oil in the
northern section of the country off the Cabinda enclave and slightly further south
off the province of Zaire. Angolan production amounts to approximately $10
billion annually, and this production is second only to Nigeria's in sub-Saharan
Africa. The terms of each Angolan oil concession are unique to that concession,
but there are general policies in place calling for income taxation, royalty
AI-11
payments, and profit sharing arrangements. Sonangol, the state oil company, is
a partner in many of these concessions. Without specific information on the
costs of production, it is impossible to estimate resource rents from this sector.
Quite a bit of exploration effort is now focused on deepwater prospects, and it is
to be expected that rents will be comparatively smaller for these plays.
Recently, Angola has hired KPMG, an international accounting firm, to
conduct an assessment of the Angolan petroleum sector (KPMG International
2004). Part of the assessment is an accounting of incoming revenue from
Angolan oil production for the year 2000. The incoming revenue totaling
US$5,472 million in that year is broken down into the following categories: (1)
taxes collected from private concessionaires (including profit oil,2 the petroleum
income tax, and the petroleum transactions tax) amounting to US$1,697 million;
(2) taxes collected from Sonangol (US$1,355 million); (3) profit oil for the
concessionaires (US$1,075 million); (4) payments to the provinces of Cabinda
and Zaire (US$149 million); (5) signature bonus payments (US$0); (6) loans
received (US$1,000 million); (7) loans between states (US$94 million); and (8)
sales by Sonangol of petroleum products (US$102 million).
We assume that the first five categories represent resource rent. This
amounts to US$4,276 million, or roughly 78 percent of incoming revenues. (Note
that the total incoming revenue does not equal total sales of Angolan oil, because
the private concessionaires sell much of the oil that has been produced.) In
Table 6, we sum only categories 1, 2, 4, and 5 as an estimate of resource rent
2 "Profit oil" represents that portion of production that remains after all costs have been covered, including
income taxes, royalties, and profit sharing. As such, it represents a portion of economic rent.
AI-12
from Angolan oil fields. While category 3, relating to profit oil for the
concessionaires, is legitimately counted as a portion of resource rent, we assume
that it is unavailable to the Angolan government for use in the sustainable
management of marine resources. Thus we estimate annual resource rent to be
approximately US$3 billion, which amounts to about one-third of Angolan
offshore oil revenues. We expect that this estimate of rent is conservative
because oil prices have increased within the last year, production from Angolan
oil fields has been growing, and typically one-time bonus payments are made to
obtain concessions. The latter did not appear in the year 2000 incoming revenue
accounts, but earlier payments represent a not insignificant proportion of
resource rent.
B. Living
Resources
Sumaila et al. (2005) [hereinafter referred to as "SMK"] develop an
estimate of the potential resource rents that could obtain from the marine
fisheries in the BCLME nations. Their first objective is to demonstrate that some
of the important commercial stocks in the region are transboundary in geographic
distribution. Because some of the stocks are transboundary, the efficient
management of these stocks necessitates international cooperation.
International cooperation, in turn, requires the establishment of an international
institutional capacity. The authors compare potential resource rents from efficient
management with three alternative institutional scenarios.
AI-13
In estimating resource rents for commercial fisheries, SMK rely upon the
work of Lange (2003) on selected Namibian fisheries. Lange has developed
estimates of annual and capitalized resource rents for the Namibian pilchard,
hake, and horse mackerel fisheries for the period 1990-98. Lange's purpose is to
enable the incorporation of values in the Namibian national accounts for the
economically most important capture fishery stocks. Using national data,
Lange's measure of resource rent is total revenues minus average costs for each
of the three fisheries. Lange assumes a normal profit of 30 percent as one
element of average cost.
We rely upon Lange's estimate of total rent for the three fisheries
combined of N$816 million in 1998 (equivalent to $205 million in 2005 US
dollars). This estimate differs from that reported by SMK in that the latter use an
average of total rent over the five-year period from 1994 to 1998, and they
assume a normal profit of only 20 percent. The effect of the average is to lower
the estimate of total rent, while the effect of the lower profit assumption is to raise
the estimate. The net effect of the two assumptions leads to an estimate of
N$602 million. We prefer the higher estimate because it incorporates Lange's
preferred profit of 30%, it is the most recent estimate available, and the
combination of improved fishery management and expanded demand in the
forage fish market are likely to lead to higher estimates of resource rent in the
Namibian fisheries in the future.
SMK develop an estimate of rent in the South African fisheries that relies
upon the ratio of rents to revenues in the Namibian fisheries. Using our higher
AI-14
estimate of rent in the Namibian fisheries, we calculate that ratio to be 68 percent
(the ratio used by SMK is 51 percent). Applying this ratio to South African
landings of R1,291 million, we calculate resource rents in the South African
fisheries of R879 million (equivalent to $176 million in 2005 US dollars).
SMK use a similar technique to calculate resource rents in the Angolan
fisheries, assuming that those fisheries are only 75 percent as efficient as the
South African fisheries due to the significant proportion of artisanal fishermen in
the former. Seventy-five percent of 68 percent is 51 percent. Applying this ratio
to Angolan landings of K11.9 billion, we calculate resource rents in the Angolan
fisheries of K6.1 billion (equivalent to about 68 million in US dollars). Notably,
another estimate of resource rents is possible in the case of Angola, which is the
only BCLME nation to enter into an agreement with the European Union to allow
access to its fish stocks.3 During 1993-97, The EU and private European fishing
firms paid Angola about 11 million annually (equivalent to $13 million in 2005 US
dollars) for access primarily to shrimp and groundfish stocks (IFREMER 1999).
C. Marine
Minerals
Marine mineral development in the BCLME is limited mainly to diamond
mining off the coast of Namibia. The production of phosphate derived from
seabird guano deposited on platforms off the Namibian coast takes place on a
small scale, but these operations gross only about $1 million annually. There are
3 In their analysis of European fishery policy in West Africa, Kaczynski and Fluharty (2002) suggest that
there has been an underpayment of license fees to African coastal nations, especially in the case of the tuna
fisheries. Further, they anticipate that subsidization of the European distant water fishing fleets and
excessive bycatch, among other factors, will lead eventually to the overexploitation of the coastal fisheries
of Africa. As a consequence, the value of these fisheries may decline.
AI-15
marine diamond exploration efforts occurring in both South Africa and Angola, but
we are unaware of any significant production in the latter at present. Marine
diamond mining in South Africa4 occurs at a small scale (about US$17 million in
sales per year) relative to Namibia and is thought to be declining relative to
onshore and fluvial operations.
Diamond mining is important to Namibia in both onshore and offshore
locations, but, as onshore deposits are played out, the production share from
marine deposits has increased. According to reports in the trade media, in 2002,
about 1,569,882 carats of diamonds were produced in Namibia. Of this total,
807,036 carats (52%) were produced from marine operations, 65,932 (4%) were
produced from inshore beach mining and shallow water deposits, and 696,914
(44%) were produced from onshore mines. Ninety-five percent of the marine
production is of high-valued gem-quality diamonds.
NamDeb, a 50-50 joint venture with De Beers Centenary AG and the
Namibia government, is the largest diamond producer. In 2004, NamDeb's total
production was 1.9 million carats with sales totaling about N$4 billion. Using the
2004 figures and the 2002 production share (56%), we estimate that sales of
marine diamonds totaled about N$2.22 billion in 2004, or approximately $338
million in US dollars. Other producers, including Samicor, Diamond Fields, Diaz,
and Reefton, operate offshore, but their total production is relatively minor at
present. Production from these producers could expand in the future. Coakley
4 In Table 6, we calculate annual economic rents of about US$4 million for South Africa by using the ratio
of rents to sales revenues for marine diamond mining in Namibia of 27 percent.
AI-16
(2003b) provides a current description of the industry's structure and its
exploration and production activities.
In March of 2003, Namibia established a new policy to encourage the
sustainable development of its minerals and to ensure that such development
would contribute to the nation's socioeconomic development. Consistent with
this policy, the Namibian Diamond Act No. 13 imposes a tax of 55 percent of
taxable income plus a 10 percent royalty of the market value of diamonds
(Coakley 2003b). The royalty can be applied to reduce the size of the income
tax. If taxable income were publicly available, we could estimate the size of rents
from this sector. This information is unavailable, however. Lange (2003)
calculates rents in the Namibian mineral sector of about $13 billion for 1998, but
these rents include diamond mining as well as mining for uranium and zinc.
To develop an estimate of resource rents from the Namibian marine
diamond mining sector, we rely instead upon a report in the industrial trade
literature for NamDeb's total payments to shareholders (Inambao 2005).
Because Namibia is a "shareholder," these payments include royalties, income
tax, non-resident's shareholder's tax, and dividends. Total payments of
shareholders are N$1.05 billion. We estimate the marine share of these
payments as 56 percent of the total, or N$580 million. Using the current
exchange rate of N$6.35, we estimate annual marine diamond mining rents of
approximately $90 million in US dollars. We note that there may be fluctuations
in this value over time, and that this estimate is likely to be an underestimate, as
NamDeb is not the only offshore producer.
AI-17
IV. Conclusions
The three nations bordering the BCLME already garner significant
resource rents from the use of their marine resources. These rents are expected
to grow in the future as the demand for oil and natural gas continues to expand,
as the growth of livestock and aquaculture markets calls for increased supplies of
fishmeal, and as the BCLME nations develop coastal tourism industries.
Pollution problems have been identified in the region, but these are believed to
be relatively minor at present when compared with the same problems faced by
other large marine ecosystems. Overexploitation of the forage fisheries may be
the most significant market failure and source of unsustainability. As the
economies of the region continue to develop, more attention will need to be paid
to the potential for the imposition of social costs of oil production and coastal
development on the coastal and marine environments of the BCLME.
The distribution of resource rents is important, as Angolan oil production
is the largest source of this value in the region. Angola might use a portion of its
offshore oil and gas rents to encourage South Africa to reduce its exploitation of
the pilchard stocks, thereby enabling the potential expansion of a coastal fishery
in Angola with potential for benefiting the local population.
Even with other activities operating at orders of magnitude smaller than
offshore oil production in Angola, any one of the three nations could easily
continue the existing GEF program at currently funded levels to help refine and
operationalize a plan for sustainable development of the marine sector. More
AI-18
work is required to understand the costs of implementing sustainable
management programs, which should be compared with resource rents. Sumaila
et al. (2005) have taken an important first step along these lines in the area of
capture fisheries, showing that fisheries management at existing scales is
economically justified in the three nations and arguing that international
cooperation could exploit economies in the management of transboundary
stocks.
A final caveat concerns the pressing need to devote the resource rents
from marine resources to begin to resolve some of the very serious public health,
human rights, and social welfare problems faced by all three of these nations.
The notion of sustainable management surely must involve prioritizing the needs
of the present generation in the BCLME region when their situation is so dire.
Establishing public policy priorities is a political decision to be debated and
agreed upon by each of the jurisdictions independently and, where relevant, in
concert. As these debates ensue, the importance of the BCLME as a source of
economic value that could be used to mitigate social problems should be
recognized and nurtured. In particular, the marine environment should not be
despoiled and thereby wasted through unnecessarily shortsighted policy choices.
V. References
Anonymous. 2005. South Africa: integrated coastal management profile. Last
accessed on 3 October at
http://www.globaloceans.org/country/safrica/safrica.html.
Anonymous. 2003. The mineral industry of South Africa. Minerals Yearbook.
Vol. III. Reston, Va.: Minerals Information, US Geological Survey. Last
accessed on 29 September 2005 at
AI-19
http://minerals.usgs.gov/minerals/pubs/country/2003/ sfmyb03.pdf.
Blackie, R. and P. Tarr. 1999. Government policies on sustainable development
in Namibia. Research Discussion Paper No. 28. Windhoek, Namibia:
Directorate of Environmental Affairs, Ministry of Tourism, Republic of
Namibia.
Bureau of African Affairs (BAA). 2005a. Background note: Angola. Washington:
Electronic Information and Publications Office, Bureau of Public Affairs,
US Department of State. Last accessed on 28 September 2005 at
http://www. state.gov/r/pa/ei/bgn/6619.htm.
Bureau of African Affairs (BAA). 2005b. Background note: Namibia. Washington:
Electronic Information and Publications Office, Bureau of Public Affairs,
US Department of State. Last accessed on 28 September 2005 at
http://www. state.gov/r/pa/ei/bgn/5472.htm.
Bureau of African Affairs (BAA). 2005c. Background note: South Africa.
Washington: Electronic Information and Publications Office, Bureau of
Public Affairs, US Department of State. Last accessed on 28 September
2005 at http://www. state.gov/r/pa/ei/bgn/ 2898.htm.
Clark, B.M., W.F. Meyer, A. Ewarth-Smith, A. Pulfrich and Hughes, J. 1999.
Synthesis and Assessment of Information on the BCLME. Thematic
Report 3. Integrated Overview of Diamond Mining in the Benguela
Current Region. Last accessed on 3 October 2005 at:
http://www.bclme.org.
Coakley, G.J. 2003a. The mineral industry of Angola. Minerals Yearbook. Vol.
III. Reston, Va.: Minerals Information, US Geological Survey. Last
accessed on 29 September 2005 at
http://minerals.usgs.gov/minerals/pubs/country/2003/ aomyb03.pdf.
Coakley, G.J. 2003b. The mineral industry of Namibia. Minerals Yearbook. Vol.
III. Reston, Va.: Minerals Information, US Geological Survey. Last
accessed on 29 September 2005 at
http://minerals.usgs.gov/minerals/pubs/country/2003/ wamyb03.pdf.
Crawford, R.J.M., L.V. Shannon and P.A. Shelton. 1989. Characteristics and
management of the Benguela as a large marine ecosystem. In K.
Sherman and L.M. Alexander, eds., Biomass Yields and Geography of
Large Marine Ecosystems. AAAS Selected Symposium No. 111. Boulder,
Colo.: Westview Press, Chap. 7, pp. 169-219.
Cullinan, C., S. Munkejord and H. Currie. 2005. Institutional study regarding the
establishment of a regional organisation to promote integrated
management and sustainable use of the BCLME. Last accessed on 3
October 2005 at: http://www.bclme.org.
Institut FranÁais de Recherche pour l'Exploitation de la Mer (IFREMER). 1999.
Evaluation of the fisheries agreements concluded by the European
Community. Summary Report. EC Contract No. 97/S 240-152919. Brest,
AI-20
France (August). Last accessed on 30 September 2005 at
http://europa.eu.int/comm/fisheries/
doc_et_publ/liste_publi/studies/rsen.pdf.
Food and Agriculture Organisation (FAO). 2004. Fishery country profile: the
Republic of Angola. FID/CP/ANG. December. Last accessed on 20
September 2005 at: http://www.fao.org/fi/fcp/en/AGO/profile.htm.
Food and Agriculture Organisation (FAO). 2002. Fishery country profile: the
Republic of Namibia. FID/CP/NAM. November. Last accessed on 20
September 2005 at: http://www.fao.org/fi/fcp/en/NAM/profile.htm.
Food and Agriculture Organisation (FAO). 2001. Fishery country profile: the
Republic of South Africa. FID/CP/SAF. January. Last accessed on 20
September 2005 at: http://www.fao.org/fi/fcp/en/ZAF/profile.htm.
Inambao, C. 2005. Diamond giant achieves record production. All Africa Global
Media (28 July). Last accessed on 19 August 2005 at
http://allafrica.com/stories/ printable/ 200507280721.htm.
Kaczynski, V. M. and D. L. Fluharty. 2002. European Policies in West Africa:
Who Benefits From Fisheries Agreements? Marine Policy 26:75-93.
KPMG International. 2004. Assessment of Angolan petroleum sector--final
report. Vol. 1b: Executive Summary. Luanda, Angola: Ministry of Finance,
Republic of Angola. Last accessed on 4 October 2005 at
http://www.angola.org/referenc/ reports/oildiagnostic.
Lange, G-M. 2004. Wealth, natural capital, and sustainable development:
contrasting examples from Botswana and Namibia. Environmental and
Resource Economics 29:257-83.
Lange, G-M. 2003. Fisheries accounting in Namibia. In C. Perrings and J.V.
Vincent, eds., Natural Resource Accounting and Economic Development:
Theory and Practice. Cambridge: Cambridge University Press, pp. 214-
233.
McLean, B.L. 2005. Namibia: integrated coastal management profile. Last
accessed on 3 October at
http://www.globaloceans.org/country/Namibia.html.
Nichols, P. 2004. Marine fisheries management in Namibia: has it worked? In
U.R. Sumaila, D. Boyer, M. Skogen and S.I. Steinshamn, eds., Namibia's
Fisheries: Ecological, Economic and Social Aspects. Delft, The
Netherlands: Eburaon, pp. 319-332.
Prochazka, K., B. Davies, C. Griffiths, M. Hara, N. Luyeye, M. O'Toole, J.
Bodenstein, T. Probyn, B. Clark, A. Earle, C. Tapscott and R. Hasler.
2005. Benguela Current, GIWA regional assessment 44. Kalmar
Sweden: University of Kalmar and Nairobi, Kenya: United Nations
Environment Programme.
Russo, V., L. Campos, P. Tarr, G. Kegge, T. Winstanley and C. Cullinan. 2004.
AI-21
Harmonisation of national environmental policies and legislation for marine
mining, dredging and offshore petroleum exploration and production
activities in the BCLME region. BCLME Project BEHP/LA/03/03.
(December). Last accessed on 1 October 2005 at: http://www.bclme. org.
Shannon, L.T. and M.T. O'Toole. 1999. Synthesis and Assessment of
Information on the Benguela Current Large Marine Ecosystem (BCLME).
Last accessed on 3 October 2005 at: http://www.bclme.org.
Str¯mme, T. and G. SÊtersdal. 1986. Report on the surveys of Angola's marine
fish resources: January 1985 - June 1986. Bergen, Norway: Institute of
Marine Research. Last accessed on 5 October 2005 at:
http://www.fao.org/wairdocs/ fns/aa041e/aa041e00.htm
Sumaila, U.R., G. Munro and H. Keith (SMK). 2005. Benguela Current
Commission (BCC) economic study. Last accessed on 19 September
2005 at: http://www.bclme.org.
Sumaila, U.R., C. Ninnes and B. Oelofsen. 2003. Management of shared hake
stocks in the Benguela marine ecosystem. Mimeo. Vancouver, BC:
Fisheries Centre, University of British Columbia.
Tapscott, C. 1999. An overview of the socio-economics of some key maritime
industries in the Benguela Current region. Last accessed on 3 October
2005 at: http://www.bclme.org.
United Nations Development Programme (UNDP), Global Environmental Facility
(GEF) and UNOPS. 1999. Benguela Current Large Marine Ecosystem
Programme Transboundary Diagnostic Analysis. Last accessed on 4
October 2005 at: http://www.bclme.org.
AI-22
Table 1: Marine Activities in the BCLME Nations [after Tapscott (1999)]
South Africa
Angola
Namibia
(Cape Town)
Offshore Oil and Gas
X
X
Offshore Diamond Mining
X
X
Offshore Guano Mining
X
Industrial Fisheries
X
X
X
Marine Mammal Fisheries
X
Artisanal Fisheries
X
Marine Aquaculture
X
Fish Processing
X
X
X
Recreational Fishing
X
Tourism
X
X
Coastal Real Estate
X
Merchant Fleet
Shipbuilding
Shipping
X
Renewable Energy
Table 2: Marine Living Resource Production Activities for the BCLME Nations
Value of
Value of
Fish
Aquaculture
Fisheries
Aquaculture
Landings
Production
Output
Output
(000MT)
(000MT)
(US$m/yr)
(US$m/yr)
Angola 202
179
-- --
Namibia 670
357 <1 <1
South Africa
854
227
5
24
World Average
593
--
321
415
World Median
77
--
6
23
Note: World average (median) is the average (median) value of non-zero entries for
all countries.
AI-23
Table 3: Shipping and Shipbuilding Activities for the BCLME Nations
Shipping &
Shipbuilding
Merchant Fleet
Cargo Traffic
Orderbook
(000DWT)
(000MT)
(000GRT)
Angola --
--
--
Namibia -- -- --
South Africa
154
--
1
World Average
131
24
2,390
World Median
25
12
50
Note: World average (median) is the average (median) value of non-zero entries for
all countries.
Table 4: Offshore Oil and Mineral Production Activities for the BCLME Nations
Value of
Value of
Offshore
Offshore Oil
Offshore
Rig Count
Offshore Oil
Diamond
Production
Mineral
(oil rigs)
Production
Production
(bbl/day)
Production
(US$m/yr)
(000CT/yr)
($US$m/yr)
Angola 7
653,233
10,252 --
--
Namibia -- --
-- 1,064 2,220
South Africa
1
20,100
315
54
17
World
44 n.a. n.a. n.a. n.a.
Average
World
8 n.a. n.a. n.a. n.a.
Median
AI-24
Table 5: Tourism Activities for the BCLME Nations
Tourism and
Tourist Visits
Travel Demand
(000 visits/yr)
(US$m/yr)
Angola --
38
Namibia -- 723
South Africa
339
19,522
World Average
4,187
34,760
World Median
726
2,918
Table 6: Resource Rents from Marine Activities for the BCLME Nations
(millions of 2005 US dollars)
Capture
Offshore
Offshore Oil
Fisheries
Diamond
TOTALS
Production
Harvests
Mining
Angola 3,201
13 0 3,214
Namibia 0
200
88 288
South Africa
0
175
4
179
TOTALS 3,201 388 92 3,681
AI-25
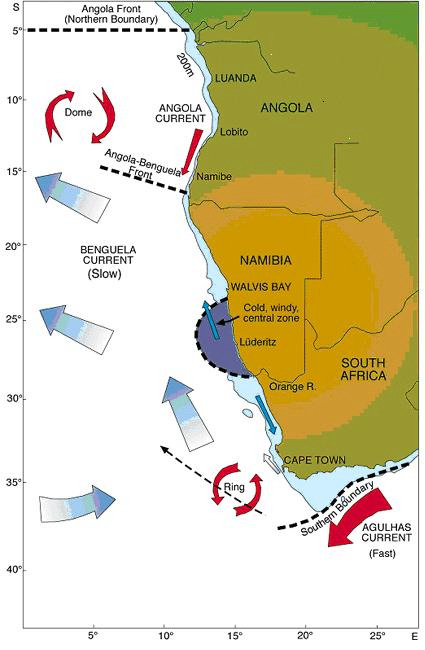
Figure 1: The Benguela Current large marine ecosystem. Source: Benguela
Current Large Marine Ecosystem Programme. Last accessed on
March 30, 2006 at http://www.bclme.org/.
AI-26
Socio-economic
Shipping & Offshore Oil
Fisheries & Aquaculture
Tourism
Benguela Current
LME World Average
Figure 2: Marine activity index comparison between the BCLME region (red)
and the world average (gray). This comparison suggests that marine
activities in the BCLME region occur at a relatively low level in
comparison with other large marine ecosystems of the world.
AI-27
0.01%
4.98%
0.16%
14.59%
Fisheries
Aquaculture
11.33%
Offshore Oil
Tourist Arrivals
Offshore Diamond
Dredging
Guano Platforms
68.93%
Figure 3: Economic significance of BCLME marine activities. The pie chart
depicts a percentage breakdown across activities of total direct output
impacts of ~$15 billion per year out of a total GDP for the BCLME
nations of ~$300 billion per year. (The total direct output impact of an
industry is the gross output value, or revenue from sales, of that
industry.)
AI-28
2%
11%
Offshore Oil
Capture Fisheries
Offshore Diamond Dredging
87%
Figure 4: Resource rents arising from BCLME marine activities. The pie chart
depicts a percentage breakdown across activities of resource rents of
~$4 billion per year, which is about 27 percent of total direct output
impacts for the region. Offshore oil production dominates the estimate,
and all of this production occurs in Angola.
AI-29
Annex II
Case Study: Yellow Sea Large Marine Ecosystem1
I. Introduction
The Yellow Sea LME (YSLME) is a potentially valuable focus for a case
study for two reasons. First, the Yellow Sea is a continental shelf ecosystem and
has been selected as a representative LME for this major ecosystem type. In
addition, it is bordered by developing nations, which poses a particular set of
challenges for managing the LME.
The Yellow Sea LME is a semi-enclosed sea surrounded on three sides
by countries with large populations and rapidly growing economies. One of the
key challenges is to coordinate economic growth with environmental and natural
resource protection to achieve sustainability. In recent decades, there has been
a lack of solid balance between economic development and environmental
protection in the Yellow Sea region. Most management policies did not connect
water quality problems with land-use management and economic development,
nor did they correlate fishery depletion with pollution or habitat loss (Lee 1998).
In this case study, we examine whether or not the Yellow Sea region is on
a sustainable path for marine resource use and, if so, whether it has the
capability to continue on this course; or, if not, what measures are needed to
enhance the prospects for sustainability.
1 Jennifer Skilbred contributed to the background research and writing of an initial draft of this Annex.
AII-1
II. Background
A. YSLME
Region
YSLME is a subsection of the Northwest Pacific Regional Sea (Fig. 1). It is
a continental shelf ecosystem bordered by the People's Republic of China
(China), the Democratic People's Republic of Korea (North Korea), and the
Republic of Korea (South Korea).2
The Yellow Sea is dominated by the interactions of the high temperature
and high salinity Kuroshio Current with the coastal cold-water masses from some
of the regional spawning and feeding grounds. The weather in the Yellow Sea is
dominated by strong northerly monsoon winds from late November through
March. Cold-temperate fish species often dominate the Yellow Sea, particularly
in its northern and central parts (Biodiversity Clearinghouse 2005). Due to
marked seasonal variations, the sea can support both cold-temperate and warm
water species (NOAA 2004). The northern portion of the Yellow Sea, the semi-
enclosed Bohai Sea, is a spawning and nursing ground for many commercially
important fish and shrimp.
The Yellow River is a major source of sediments and industrial wastes into
the Yellow Sea. The discharges from the Yellow River and the Yangtze River
flow across the continental shelf and introduce large quantities of sediment that
affect the salinity and hydrography of the Yellow Sea. Other rivers, including the
Han, Datung, Yalu, Guang, Sheyang, Liao He, and Hai He rivers, all discharge
into the Yellow Sea (YSLME Project 2005).
2 Throughout this case study, we use the term "Korea" either in reference to South Korea (especially when
discussing economic data, which are unavailable for North Korea), or, occasionally, in reference to the
entire Yellow Sea coast of the Korean Peninsula.
AII-2
Fully five percent of the world's population inhabits the area that drains
into the Yellow Sea. According to the 2000 China census, there were close to
300 million people living in the Yellow Sea coastal regions of Beijing, Tianjin,
Hebei, Liaoning, Jiangsu, and Shangdong, in China (NBS 2005). Coastal cities
are growing rapidly in the region (Li 2003). Large metropolitan areas on the
Yellow Sea include Qiangdao, Tianjin, Dalian, and Shanghai in China, as well as
Seoul/Inchon in South Korea and Pyongyang-Nampo in North Korea (YSLME
Project 2005).
B. Marine
Industries
The economies of the Yellow Sea region have been growing rapidly over
the last several decades. Table 1 and Fig. 2 illustrate the increase in marine
industry output in Yellow Sea coastal regions in China from 1996 to 2004, when
the output value of the Bohai region was 412 billion Yuan (US$ 50 billion; Fig. 2).
Fig. 3 compares YSLME index values of some of these activities with the world
average across all large marine ecosystems (see section 1 of this report). This
comparison suggests that the YSLME has much higher than average marine
activity levels for most of its major marine industries. One implication of this
comparison is that, relatively speaking, the YSLME environment has been
utilized at levels that may be unsustainable.
Fisheries is an important economic sector throughout the entire region.
China is the world's top fish producer (FAO 2005),3 and the fishing industry in
3 The accuracy of the Chinese figures for fish production has been called into question by some researchers;
see Watson and Pauly (2001) and Watson et al. (2001). FAO and China are examining this issue.
AII-3
Korea averages about tenth largest in the world (Kwak et al. 2005). In 2003, fish
landings in five major Yellow Sea coastal cities in Korea amounted to 66
thousand metric tons (MT) valued at 250 billion Won (US$ 210 million; see Table
2). Fish landings in Yellow Sea coastal regions in China were 5.6 million MT in
2000 (see Table 4). Seafood is an essential dietary component for people in the
region. Mariculture is one of the main industries in the region and has been
greatly increasing in recent decades (Tables 3 and 4). China has been the
world's leader in marine aquaculture, and its aquaculture industry is continuing to
develop (FAO 2001).
Tourism is an infant industry in the coastal Yellow Sea, but there is much
promise for its future (Cheong 2003; China Oceanic Information Network 2005).
The Republic of Korea has been working to increase tourism, especially coastal
and marine tourism (Tyrrel et al. 1999). The declining availability of fish
resources is leading small Korean fishing villages to concentrate more effort in
developing the local tourism industry (Cheong 2003), and the economy in these
areas is becoming more dependent on tourism. As shown in Table 5, the
number of tourists in the cities of Mokpo and Inchon grew from nearly 3.8 million
in 1996 to 6.7 million in 2003. In Mokpo, the value of coastal tourism rose from
526 billion Won (US$ 375 million) in 1998 to 1 trillion Won (US$ 872 million) in
2003 (KORDI 2005).
Coastal tourism by domestic and foreign visitors has been on the rise in
China as well. Revenue from international tourists increased from US $620
AII-4
million in 1997 to US $879 million in 2000 in the five Yellow Sea coastal regions
(Table 6).
The waters of the Yellow Sea are heavily used for shipping, which is an
important component of growth for the region's economies. Table 7 depicts the
growth in shipping vessel traffic in five major Korean ports on the Yellow Sea.
The ports of Tianjin, Qingdao, Inchon, Dalian, and Qinhuangdao are among the
top 25 in the world in terms of cargo throughput (ISL 2004). Shipbuilding is also
a very important industry in the region, with Korea and China ranking as the first
and the third shipbuilding countries in the world, respectively (ISL 2004). Major
shipyards in the region include Dalian, New Century, and Nantong (ISL 2004).4
Offshore oil and gas activities are concentrated mostly in the Bohai Sea
and northern part of the Yellow Sea. China's oil and gas revenue from the Yellow
Sea was 10.9 billion Yuan (US$ 1.3 billion) in the year 2000. Other important
industries that comprise China's marine industry output revenue structure for the
Yellow Sea coastal area include sea salt production and sand and gravel mining
(Table 8).
C. Management
Organizations
There are a number of governmental and non-governmental organizations
in the Yellow Sea region that are involved in the protection of the YSLME through
donations and/or management help. The infrastructure necessary to make
4 Note that major Korean Shipyards (e.g., Hyundai, Samsung, and Daewoo) are located on the southeastern
coast.
AII-5
positive management changes for the marine resources of the area is steadily
growing. The Partnership in Environmental Management for the Seas of East
Asia (PEMSEA), a GEF/UNDP/IMO (International Maritime Organization)
partnership, is a significant infrastructure-building and information-sharing
agency in the Yellow Sea region. All three countries surrounding the Yellow Sea
are participating members of PEMSEA. Relevant national governmental
agencies include the State Oceanic Administration (SOA) and the State
Environmental Protection Administration (SEPA) in China, and the Ministry of
Maritime Affairs and Fisheries (MOMAF) in South Korea. China and South
Korea have both ratified UNCLOS--the UN Convention on the Law of the Sea--
and the two nations have relied mainly on fishery agreements to resolve fisheries
disputes (Kang 2003).
D. Political
Issues
The historical relationships among the nations surrounding the Yellow Sea
are complex, and the three countries have significant differences in terms of their
political institutions. According to a World Bank Institute study on governance,
South Korea, China, and North Korea are ranked from relatively high to low,
respectively, on various indicators for voice and accountability, government
effectiveness, regulatory quality, rule of law, and control of corruption (Kaufmann
et al. 2005). These differences have led to complications in working together to
manage a shared ecosystem.
AII-6
One area of contention among the countries has been the delimitation of
their individual exclusive economic zones (EEZs) (Kim 2003). Temporary
agreements have been made until final delineations can be agreed upon. Along
with these debates, there has been an often violent ongoing dispute between
North Korea and South Korea, as to where the land boundary between their
nations lies.5
III. Management
Issues
The health of the YSLME has changed greatly over the past five decades,
due to the ever-increasing pressures on the marine resources of the region
(Bohai Sea Environmental Management Program 2005). Some of these
changes include a decreased number of fish, a lowering of trophic levels of the
remaining individuals (Fig. 4), and a smaller average size of fish. The most
common species have also changed over the years. Increasing pollution in the
Yellow Sea as the surrounding nations continue to develop quickly is having a
strong negative effect on the health of this marine ecosystem. In recent years,
the frequency of harmful algal blooms has increased as well (Tang et al.
forthcoming).
5 These disputes are the result of high tensions following the unresolved Korean War, a disputed boundary,
and hence disputed rights to a highly valued blue crab species (Van Dyke et al. 2003).
AII-7
A. Living
resources
The YSLME is one of the most intensively exploited LMEs in the world
(Fig. 5). Living resources in the Yellow Sea are severely threatened due to
overfishing. The major fisheries are at extremely low levels today compared with
three decades ago, and are now no longer economically or ecologically
sustainable (NOAA 2004). There have been significant changes in catch
composition due to overfishing and destructive fishing methods, such as trawling,
which can destroy benthic habitats.
Subsidies were often granted to fishermen in both China and Korea (Pak
and Joo 2002).6 Since the 1960s there has been a steady increase in the
number of fishing boats and the improvement of fishing gear, both of which leads
to excessive fishing efforts and overfishing (Biodiversity Clearinghouse 2005).
This has caused a decrease in high-value species and an increase in the amount
of low-value species caught. The biological characteristics of some species have
also changed, and there are many instances of smaller individuals with a
reduced average age of spawning populations.
Habitat destruction has also impacted the Yellow Sea. Reclamation of
land throughout the 1960s has harmed biodiversity in China, and reclamation is a
major cause of habitat destruction in South Korea as well. With land
reclamation, fisheries declined due to a loss of nursery grounds and an increase
in pollutant inputs (Cicin-Sain and Knecht 1998).
6 Forms of subsidies include tax-free oil for fisherman to run boats, construction of fishing ports, and
support for fishing technology improvement.
AII-8
Mariculture production has been greatly increasing in the region in recent
decades. In many coastal areas mariculture activities are intensive. Although
growth in aquaculture has increased the total seafood supply and reduced the
pressure on wild stocks, this has come at the cost of biodiversity reduction
(Biodiversity Clearinghouse 2005). Modern aquaculture practices are often
unsustainable, due to water pollution and other environmental effects (Midlen
and Redding 1998).
B. Marine
Pollution
YSLME is threatened by both land- and sea-based pollution. The
increasing amount of international shipping traffic has led to collisions and spills,
and the region has also been severely impacted by eutrophication. The
occurrence of red tides is increasing in frequency and has become all too
common over the past ten years or so (Tang et al. forthcoming). Pollution
problems are most severe in the Bohai Sea. Since the 1970s, water quality in
the area has been quickly deteriorating due to the offshore oil industry, as well as
the direct drainage of industrial and domestic wastes into the sea. Such
problems have led to a sharp decline in the environmental services functioning of
the sea. This environmental degradation has been a result of rapid economic
development in the region. Currently there is an extremely high rate of land-
based pollutants discharged into the Bohai Sea (Xin 2004). The pollution
problems are exacerbated by the fact that the system is semi-enclosed and fairly
shallow.
AII-9
There has also been a distinct loss (or in some cases modification) of
ecotones, including the disappearance of some species and the concentration
(bioaccumulation) of pollutants in other species. These problems threaten
human health (e.g., through seafood poisoning), aquatic production, and the
recreational and aesthetic value of the sea.
IV. Management
Efforts
A. Environmental
Awareness
For a region of developing nations, the marine environment of the Yellow
Sea offers many important resources and chances for economic development. It
is an essential area for ocean transportation as well as an essential food source.7
South Koreans as well as Chinese citizens are now seeing greater incomes and
more leisure time then ever before, which has increased the importance of the
Yellow Sea coastline as a recreational area as well (Lee 1998). At the same
time, there has been an increase in environmental awareness in the region.
South Korea has created a national ocean governance policy entitled
Ocean Korea 21 (OK 21), which is administered by the Ministry of Maritime
Affairs and Fisheries (MOMAF). The objectives of OK 21 involve enhancing the
vitality of territorial waters, developing knowledge-based maritime industry, and
promoting sustainable development of marine resources (Kwak et al. 2005).
Similar ocean management policy has been developed by China's State Oceanic
7 Seafood has been an essential staple of the Korean diet. It is essential in Korean cultural foods, and it is
the main source of protein for the majority of the nation's people.
AII-10
Administration (SOA) as well, and is enshrined in a Marine Environmental
Protection Law adopted in April 2000.
A key source of support for the YSLME has been the Global Environment
Facility (GEF), which is funding a project entitled, "Reducing Environmental
Stress in the Yellow Sea Large Marine Ecosystem." This project, as well as a
number of related GEF, World Bank, and PEMSEA projects, is focused on the
sustainability of marine resource use in this region. The project was designed to
enhance cooperation among the coastal countries by building on existing policies
as well as the planning and implementation elements of UNEP's Regional Seas
Programme. The objective for this project involves ecosystem-based
environmentally sustainable management and use of the Yellow Sea. The
program promotes the reduction of development stress and the sustainable use
of marine resources in this densely populated, heavily urbanized, and heavily
industrialized semi-enclosed continental shelf LME (YSLME Project 2005). To
date, GEF has devoted approximately $13 million to support and enchance the
efforts of regional governments on projects designed to reduce environmental
stress and improve the sustainability of marine resource use in the YSLME (GEF
Council, n.d.).
B.
Protecting Living Resources
There have been growing efforts to control fishing capacity in the region.
Government subsidies in fisheries are being provided in both China and South
Korea (Pak and Joo 2002). South Korea has implemented a program to reduce
AII-11
fishing fleet capacity in which the government pays fishing vessel owners to
decommission their vessels (FAO 2003). To control the intense fishing
pressures, starting in 1995 China has practiced a midsummer moratorium in July
and August for their fishery (Information Office 1998). All fishing vessels are
docked during the moratorium to allow the fish stocks to recover.
Coastal fishing communities in the region are now exploring other
economic opportunities. For example, the declining fish resources in the region
have led many small traditional fishing villages in South Korea to look to tourism
to boost their economies (Cheong 2003).
C. Pollution
Control
Pollution
discharge
and
water quality in the YSLME region are now being
monitored. China's SEPA has enacted laws on air and water pollution, which
involve the polluter pays principle. The Bohai environmental management
project, with a budget of 27.66 billion Yuan (US$3.4 billion) for 2001-2005, has
halted the upward trend in the discharge of several major pollutants (e.g., COD
and petroleum) (SEPA 2005).
D. Green
Accounting
Green accounting has been promoted by the United Nations as a step
toward sustainability (UN Statistics Division 2004). China is a participant in the
UN program and has begun to bring environmental costs into the accounting
framework (Xie 2000; Wang et al. 2005). According to the China Daily (2005),
AII-12
green GDP calculations are underway for ten municipalities and provinces.
Integrated coastal management efforts are ongoing in both South Korea and
China (PEMSEA 2005).
E. Regional
Cooperation
China and South Korea have been actively participating in and
implementing several LME program plans, such as the Yellow Sea GEF
program. International, national, and non-governmental organizations, such as
PEMSEA, SEPA, and Friends of the Earth China, are sharing information on the
Yellow Sea and its marine resource sustainability issues (YSLME Project 2005).8
V.
Conclusion
The YSLME region faces a very challenging task to achieve sustainable
development. Rapid economic growth in the densely populated region has led to
severe marine pollution, habitat destruction, and fish stock depletion. As
environmental conditions deteriorate, however, public environmental awareness
grows. There have been some significant efforts by governments in the region to
control pollution discharge and to improve resource management. Nonetheless,
there remains a great deal to be done.
Financial and technical support from GEF and other international
organizations has played a vital role in the last decade in setting up the
management framework for YSLME, in facilitating collaboration among countries
8 Although there is a recent report on North Korea's state of the environment (UNEP 2003), there are few
YSLME-related data available from North Korea.
AII-13
in the region, in developing local demonstration projects for sustainable
development, and in prompting local governments to invest in LME management.
The push for a more sustainable path for marine resource use and a
cleaner environment in the YSLME is expected to become stronger as people's
standard of living rises. The growing economies in the region should further
improve local management agencies' capability to self-finance future ecosystem
management projects, although continued technical support from international
organizations will remain essential in the years to come.
VI. References
Biodiversity Clearinghouse (China). 2005. Aquatic Products.
http://www.biodiv.gov.cn.
Bohai Sea Environmental Management Program. 2005. Bohai Declaration on
Environmental Protection. http://www.pemsea-bohai.net.cn/index.html
China Daily. 2005. Green GDP Calculation Piloted. March 1.
http://www.china.org.cn/english/2005/Mar/121445.htm.
China Oceanic Information Network. 2005. Seashore Tourism.
http://www.coi.gov.cn.
Cheong, S. 2003. Privatizing tendencies: fishing communities and tourism in
Korea. Marine Policy 27:23-29.
Cicin-Sain, B. and R.W. Knecht. 1998. Integrated Coastal and Ocean
Management: Concepts and Practices. Island Press, Washington, D.C.
Food and Agriculture Organization of the United Nations (FAO). 2001.
Information on Fisheries Management in the People's Republic of China.
http://www.fao.org/fi/fcp/en/CHN/body.htm.
Food and Agriculture Organization of the United Nations (FAO). 2003. Fishery
Country Profile: the Republic of Korea.
http://www.fao.org/fi/fcp/en/KOR/profile.htm.
AII-14
Food and Agriculture Organization of the United Nations (FAO). 2005. FAO
Fisheries Global Information System 2003.
http://www.fao.org/es/ess/meetings/figis.asp.\
Global Environmental Facility (GEF) Council. No date. "Project Brief: Reducing
Environmental Stress in the Yellow Sea Large Marine Ecosystem." Accessible at
<<
http://www.gefweb.org/COUNCIL/GEF_C15/WP/Yellow%20Sea%20Project%20
Part1.doc.>>
Global Environmental Facility (GEF). 2002. "Responses to GEF Council
Comments on Yellow Sea Large Marine Ecocsystem," Annex IX, accessible at
http://www.thegef.org/
Documents/Project_Proposals_for_Endorsem/PP_Archives/Regional
Yellow_Sea_Large Marine_Ecosystem.pdf
Information Office of the State Council (China). 1998. Development of China's
Marine Programs. http://www.lib.noaa.gov/china/programs.htm.
Institute of Shipping Economics and Logistics (ISL). 2004. Shipping Statistics
Yearbook 2004. Bremen, Germany.
Kang, J. 2003. The United Nation Convention on the Law of the Sea and fishery
relations between Korea, Japan, and China. Marine Policy 27:111-124.
Kaufmann, D., A. Kray and M. Mastruzzi. 2005. Governance Matters IV:
Governance Indicators for 1996-2004. World Bank Policy Research Working
Paper Series No. 3630. World Bank, Washington, DC.
Kim, S.P. 2003. The UN convention on the law of the sea and new fisheries
agreements in north East Asia. Marine Policy 27:97-109.
Korea Ocean Research & Development Institute (KORDI). 2005. Personal
communications with Dr. Sukjae Kwon and Ms. Yumi Kim.
Kwak, S., S. Yoo and J. Chang. 2005. The role of the maritime industry in the
Korean national economy: an input-output analysis. Marine Policy 29:371-383.
Lee, J. 1998. Policy issues and management framework of Chinhae Bay,
Republic of Korea. Ocean and Coastal Management 38:161-178.
Li, H. 2003. Management of coastal mega-cities ≠ a new challenge in the 21st
century. Marine Policy 27:333-337.
Midlen, A. and T.A. Redding. 1998. Environmental Management for Aquaculture.
Dordrecht, The Netherlands: Kluwer Academic Publishers.
AII-15
National Bureau of Statistics of China (NBS). 2005. Population data.
http://www.stats.gov.cn.
National Oceanic and Atmospheric Administration (NOAA). 2004. LME 48:
Yellow Sea. Silver Spring, Md.: NOAA, Large Marine Ecosystem Program, US
Dept. of Commerce. Last accessed on 30 March 2006 at
http://na.nefsc.noaa.gov/lme/text/lme48.htm.
Pak, M. and M. Joo. 2002. Korea's fisheries industry and government financial
transfers. Marine Policy 26:429-435.
Partnerships in Environmental Management for the Seas of East Asia
(PEMSEA). 2005. Program Components: Integrated Coastal Management.
http://www.pemsea.org.
Sea Around Us Project. 2005. Large Marine Ecosystems: LME: Yellow Sea.
http://saup.fisheries.ubc.ca/lme/SummaryInfo.aspx?LME=48#
State Environmental Protection Administration (SEPA) of China. 2005. "Recent
developments on major marine environmental management projects."
Environmental Protection No. 333(July):33.
State Oceanic Administration (SOA) of China. 2005. Ocean Economy.
http://www.soa.gov.cn/hyjj/index.html and http://www.pemsea-
bohai.net.cn/hyjj/table2000.htm.
State Oceanic Administration (SOA) of China.. 2000. China's Ocean Policies.
White Paper, April.
Tang, D., H. Kawamura, I.S. Oh and J. Baker. Forthcoming. Satellite evidence of
harmful algal blooms and related oceanographic features in the Bohai Sea during
autumn 1998. Advances in Space Research.
Tyrrell, T., Y. Chang, S. Kim. 1999. Coastal tourism development and EXPO
2010 in Korea. Korea Observer 30(1):187-210.
United Nations Environmental Programs. 2003. DPR Korea: State of the
Environment. Klong Luang, Thailand: Regional Resource Center for Asia and
the Pacific.
United Nations Statistics Division. 2004. Questionnaire 2004 on Environmental
Statistics. << http://unstats.un.org/unsd/environment/questionnaire2004.htm>>
Van Dyke, J.M., M.J. Valencia and J.M. Garmendia. 2003. The North/South
Korea boundary dispute in the Yellow Sea. Marine Policy 27:143-158.
AII-16
Wang, J., F. Yu, H. Jiang, S. Zou and X. Guo. 2005. Establishment of green GDP
accounting in China: opportunities, challengers and countermeasures.
Environmental Protection No. 331(May):56-60.
Watson, R., L. Pang, and D. Pauly. 2001. The Marine Fisheries of China:
Development and Reported Catches. Fisheries Centre Research Reports vol.9
no. 2. University of British Columbia, Vancouver, Canada.
Watson, R. and D. Pauly, 2001. Systematic distortions in world fisheries catch
trends. Nature 414:534-536.
Xie, J. 2000. An environmentally extended social accounting matrix.
Environmental and Resource Economics 16:391-406.
Xin, W. 2004. Would Bohai become a dead sea? China Business Herald May 11.
Yellow Sea Large Marine Ecosystem (YSLME) Project Management Office.
2005. About the Yellow Sea. http://www.yslme.org/intro/ys.htm.
AII-17
Table 1. Marine Industry Output Value by Yellow Sea Coastal Areas in China
($US millions)
Year Shandong Liaoning Tianjin Jiangsu Hebei Total
1996 6,179
2,496
1,340
1,499
656
12,170
1997 6,873
3,176
1,395
1,985
728
14,156
1998 8,176
3,328
1,116
2,069
727
15,416
1999 8,880
3,359
1,251
1,721
684
15,895
2000 8,912
3,945
1,675
1,764
836
17,132
2001 10,159 4,380
3,247
2,079
1,399
21,263
2002 12,035 5,558
5,035
2,681
1,541
26,848
Note: Marine industries include marine fisheries, mariculture, offshore oil and gas,
marine transportation, tourism, shipbuilding, sea salt, and sand and gravel.
Source: SOA (2005).
Table 2. Marine Fisheries Landings and Value by Yellow Sea Coastal Cities in
Korea
Year
Mokpo Inchon Kunsan
Seosan Total
MT
$US mill
MT
$US mill
MT
$US mill
MT $US mill
MT
$US mill
1996 47,798
223 51,000
237
--
--
10,238
19 109,036
479
1997 40,498
139 43,600
189
--
--
6,333
14 90,431
342
1998 35,940
56 38,900
89
32,391
46
2,573
4 109,804
195
1999 38,956
69 45,400
148
34,564
51
2,082
4 121,002
271
2000 33,874
71 41,258
164
58,058
49
5,601
7 138,791
292
2001 31,444
55 35,889
138
26,776
43
4,271
3 98,380
239
2002 28,981
58 39,221
160
18,276
43 16,065
16 102,543
276
2003 23,840
56 25,079
119
13,610
29
3,081
6 65,610
210
Source: KORDI (2005).
AII-18
Table 3. Mariculture Output Value by Yellow Sea Coastal Cities in South Korea
($US millions)
Year Mokpo Inchon Kunsan Seosan Total
1997 4
16
17
8
45
1998 3
11
11
6
31
1999 3
12
11
6
31
2000 3
10
9
5
27
2001 2
11
8
4
26
2002 3
13
9
5
30
2003 4
19
14
7
44
Source: KORDI (2005).
Table 4. Fishery and Mariculture Outputs by Yellow Sea Coastal Areas in China
(000 MT)
Year
1997
1998
1999
2000
Shandong Fishery 2,975
3,326
3,325
3,078
Mariculture 2,384
2,340
2,698
2,872
Liaoning Fishery 1,457
1,606
1,577
1,502
Mariculture 1,123
1,208
1,391
1,521
Tianjin
Fishery 29
30
34
35
Mariculture 2
3
3
5
Jiangsu
Fishery 711
708
683
660
Mariculture 139
174
219
249
Hebei
Fishery 261
302
328
327
Mariculture 77
83
95
155
Total
Fishery 5,433
5,972
5,947
5,602
Mariculture 3,725
3,808
4,406
4,802
Source: SOA (2005).
AII-19
Table 5. Coastal Tourism by Yellow Sea Coastal Cities in Korea (number of
visitors)
Year Mokpo Inchon
Total
1996 1,977,519
1,800,087
3,777,606
1997 1,993,160
1,630,285
3,623,445
1998 2,120,826
2,564,498
4,685,324
1999 2,660,614
2,672,046
5,332,660
2000 2,950,735
2,952,436
5,903,171
2001 2,978,681
2,697,414
5,676,095
2002 3,077,562
2,912,454
5,990,016
2003 3,639,807
3,062,542
6,702,349
Source: KORDI (2005).
Note: Including domestic and foreign visitors.
Table 6. Coastal Tourism Revenues by Yellow Sea Coastal Areas in China
($US millions)
Year Shandong
Liaoning Tianjin Jiangsu Hebei Total
1997 160.88 178.74
180.09
51.67
49.02
620.40
1998 179.63 163.07
201.76
58.30
49.25
652.01
1999 209.33 191.51
209.03
49.72
67.23
726.82
2000 254.97 256.76
231.76
64.03
71.44
878.96
Source: SOA (2005).
Note: International visitors only.
AII-20
Table 7. Shipping Vessel Traffic by Yellow Sea Coastal Cities in Korea (000 GT)
Year Mokpo Inchon Kunsan Seosan Total
1996 10,155 222,883
26,257
39,728
299,023
1997 11,471 239,621
33,113
44,285
328,490
1998 10,446 202,388
33,291
53,797
299,922
1999 11,452 222,613
40,147
69,907
344,119
2000 13,121 240,086
45,416
79,166
377,789
2001 17,479 251,701
43,043
82,541
394,764
2002 26,324 261,721
41,082
61,545
390,672
2003 25,456 264,597
50,274
58,824
399,151
Source: KORDI (2005).
Note: The sum of inbound and outbound coastal and ocean-going vessels.
Table 8. Marine Industry Output Value by Yellow Sea Coastal Areas in China,
2000 ($US millions)
Industry Shandong
Liaoning Tianjin Jiangsu
Hebei
Total
Percent
Fishery and Mariculture
6,665
2,553
80
1,321
399
11,018
64.3
Port & Shipping
548
453
462
136
235
1,834
10.7
Offshore Oil & Gas
438
59
815
0
0
1,312
7.7
Shipbuilding 315
571
28
117
33
1,064
6.2
Sea Salt
691
53
58
126
97
1,025
6
Tourism*
255
256
232
64
71
878
5.1
Sand & Gravel
1
0
0
0
0
1
0
Total
8,912
3,945
1,675
1,764
836
17,132
100
Source: SOA (2005)
* International visitors only.
AII-21
Figure 1: Map of the Yellow Sea region, comprising a large marine
ecosystem.
Source: GEF (2002).
AII-22
60
50
40
30
S Billions
U
$
20
10
0
1996
1997
1998
1999
2000
2001
2002
2003
2004
Year
Figure 2: Bohai Region Marine Industry Output Value. Note: (1) Including
Shandong, Liaoning, Tianjin, and Hebei in China. (2) Domestic
tourism value has been included since 2001. In 2004, the values of
fishery, mariculture, tourism, and marine transportation accounted for
70% of the total. Source: SOA (2005).
AII-23
Socio-economic
Shipping & Offshore Oil
Fisheries & Aquaculture
Tourism
Yellow Sea LME
LME World Average
Figure 3: YSLME activity index values for three major marine sectors and the
HDI ("socioeconomic") in comparison to the LME world average.
AII-24
3.4
3.3
3.2
3.1
3
c Level
2.9
Mean Trophi
2.8
2.7
2.6
2.5
1950
1953
1956
1959
1962
1965
1968
1971
1974
1977
1980
1983
1986
1989
1992
1995
1998
2001
Year
Figure 4: Marine Trophic Index for YSLME. Source: Sea Around Us Project
(2005).
AII-25
8,000,000
7,000,000
6,000,000
5,000,000
4,000,000
a
tch (1000 MT)
C
3,000,000
2,000,000
1,000,000
0
1950 1953 1956
1959
1962
1965
1968
1971 1974 1977
1980
1983
1986
1989 1992
1995
1998
2001
Year
China
Japan
S. Korea
N. Korea
Others
Figure 5: Fish Landings in YSLME by Country. Note: the category "Others"
includes Taiwan, Hong Kong, Russian Federation, and Macau. Source:
Sea Around Us Project (2005).
AII-26

Document Outline
- c.FINAL Forword - RB5.pdf
- 4-FINAL Marine Activity Indexes RB.pdf
- 6-FINAL Annex II YSLME Case Study-UNEP changes [050306].pdf