

LAND-OCEAN INTERACTIONS IN THE COASTAL ZONE (LOICZ)
Core Project of the
International Geosphere-Biosphere Programme: A Study of Global Change (IGBP)
and the
International Human Dimensions Programme on Global Environmental Change (IHDP)
Nutrient fluxes in transitional zones of the Italian coast
Compiled and edited by G. Giordani, P. Viaroli, D.P. Swaney,
C.N. Murray, J.M. ZaldĒvar and J.I. Marshall Crossland
LOICZ REPORTS & STUDIES NO. 28
TABLE OF CONTENTS
Page
1.
OVERVIEW OF WORKSHOP AND BUDGETS RESULTS
1
2.
NORTH-EASTERN ITALIAN COASTAL SYSTEMS
18
2.1 Lagoon of Venice Ł Gianpiero Cossarini, Chiara Castellani, Andrea
18
Barbanti, Alberto Giulio Bernstein, Giovanni Cecconi, Flaviano Collavini,
Stefano Guerzoni, Laura Montobbio, Roberto Pastres, Sandro Rabitti,
Giorgio Socal, Cosimo Solidoro, Marina Vazzoler and Luca Zaggia
29
2.2 Sacca di Goro Ł Martina Austoni, Gianmarco Giordani, Giuseppe
Castaldelli, JosĶ Manuel ZaldĒvar, Dimitar Marinov and Pierluigi Viaroli
2.3 Pialassa Baiona Lagoon, Ravenna Ł Massimo Ponti, Saverio Giaquinta and
41
Marco Abbiati
3.
SOUTH-EASTERN ITALIAN COASTAL SYSTEMS
49
3.1 Lagoon of Lesina Ł Elena Manini, Paolo Breber, Raffaele D'Adamo,
49
Federico Spagnoli and Roberto Danovaro
3.2 Lagoon of Varano Ł Elena Manini, Paolo Breber, Raffaele D'Adamo,
55
Federico Spagnoli and Roberto Danovaro
3.3 Torre Guaceto wetland Ł Alessandro Pomes, Ilaria Cappello, Luigi
59
Palmisano, Maurizio Pinna, Giuseppe Cal“, Roccaldo Tinelli, Alessandro
Ciccolella and Alberto Basset.
3.4 Torre Guaceto Bay Ł Luigi Palmisano, Alessandro Pomes, Ilaria Cappello
69
and Alberto Basset
3.5 Acquatina Lake Ł Ilaria Cappello, Luigi Palmisano, Alessandro Pomes,
75
Maria Rosaria Vadrucci and Alberto Basset
4.
COASTAL SYSTEMS OF SICILY AND SARDINIA
80
4.1 Rada di Augusta, eastern coast of Sicily Ł Filippo Azzaro, Maurizio Azzaro,
80
Alessandro Bergamasco and Salvatore Giacobbe
4.2 Capo Feto marshland, south-west SicilyŁ Giuseppe Pernice, Ignazio Patti,
85
Vincenzo Maccarrone and Francesca Apollo
4.3 Stagnone di Marsala Lagoon, western Sicily Ł Sebastiano Calvo, Giuseppe
91
Ciraolo, Goffredo La Loggia, Antonio Mazzola, Agostino Tomasello and
Salvatrice Vizzini
4.4 Marinello coastal system, north-eastern Sicily Ł Marcella Leonardi, Filippo
95
Azzaro, Maurizio Azzaro, Alessandro Bergamasco and Franco Decembrini
4.5 Ganzirri Lake, north-eastern Sicily Ł Alessandro Bergamasco, Maurizio
103
Azzaro, Giuseppina Pulican“, Giuseppina Cortese and Marilena Sanfilippo
4.6 S'Ena Arrubia Lagoon, western Sardinia Ł Felicina Trebini, Bachisio Mario
111
Padedda, Giulia Ceccherelli and Nicola Sechi
5.
COASTAL SYSTEMS OF THE TYRRHENIAN SEA (WEST COAST)
118
5.1 Lagoon of Orbetello, Tuscany Ł Paola Gennaro, Mauro Lenzi and Salvatore
118
Porrello
6.
COASTAL SYSTEMS OF GENOA AND THE LIGURIAN COAST
123
6.1 Ligurian Coast (Gulf of Genoa) Ł Paolo Povero, Nicoletta Ruggieri,
123
Cristina Misic, Michela Castellano, Paola Rivaro, Osvaldo Conio, Ezio
Derqui and Mauro Fabiano
6.2 Port of Genoa: Old Port, Multedo Oil Terminal and Voltri Container
128
Terminal Ł Paolo Povero, Nicoletta Ruggieri, Cristina Misic, Michela
Castellano, Paola Rivaro, Osvaldo Conio, Ezio Derqui, Stefania Maggi and
Mauro Fabiano
i
Page
7. REFERENCES
136
APPENDICES
143
Appendix I
List of Participants and Authors contributing to this Report
143
Appendix II
Workshop Report
148
Appendix III Creation of a Southern European Lagoon Observational Network
150
Appendix IV A proposal of a Typology for Mediterranean transitional waters
152
Appendix V
List of acronyms
157
ii


Nutrient fluxes in transitional zones of the Italian coast
compiled and edited by
Gianmarco Giordani & Pierluigi Viaroli
Department of Environmental Sciences, University of Parma, Italy
Dennis P. Swaney
Boyce Thompson Institute for Plant Research
and Department of Ecology and Evolutionary Biology, Cornell University
Ithaca, NY, USA
Nicholas Murray & Josķ Manuel Zaldivar Comenges
Institute for the Environment and Sustainability, Joint Research Centre, Ispra, Italy
and
Janet I. Marshall Crossland
LOICZ International Project Office
Texel, The Netherlands
LOICZ REPORTS & STUDIES NO. 28
Published in the Netherlands, 2005 by:
LOICZ International Project Office
Royal Netherlands Institute for Sea Research
P.O. Box 59
1790 AB Den Burg - Texel
The Netherlands
Email: loicz@nioz.nl
The Land-Ocean Interactions in the Coastal Zone Project is a Core Project of the International Geosphere-
Biosphere Programme: A Study Of Global Change (IGBP) and the International Human Dimensions Programme
on Global Environmental Change (IHDP), of the International Council of Scientific Unions (ICSU).
The LOICZ IPO is financially supported through the Netherlands Organisation for Scientific Research (NWO)
by: the Ministry of Education, Culture and Science (OCW); the National Institute for Coastal and Marine
Management of the Ministry of Transport, Public Works and Water Management (V&W RIKZ); the Netherlands
Ministry of Housing, Spatial Planning and the Environment (VROM), and the Royal Netherlands Institute for Sea
Research (NIOZ).
This report and allied workshops are contributions to the LOICZ biogeochemical budgeting and modeling core
project which started with global assessments under the name "United Nations Environment Programme project:
The Role of the Coastal Ocean in the Disturbed and Undisturbed Nutrient and Carbon Cycles (Project Number
GF 1100-99-07), financially supported by the Global Environment Facility (GEF) and implemented by IGBP-
LOICZ. This core project is being continued as work in progress into LOICZ II and the study presented has been
co-supported by the European Commission (Joint Research Centre, Ispra, Italy).
COPYRIGHT ® 2005, Land-Ocean Interactions in the Coastal Zone Core Project of the IGBP and the IHDP.
Reproduction of this publication for educational or other, non-commercial purposes is authorized
without prior permission from the copyright holder.
Reproduction for resale or other purposes is prohibited without the prior, written permission of
the copyright holder.
Citation:
G. Giordani, P. Viaroli, D.P. Swaney, C.N. Murray, J.M. ZaldĒvar and J.I. Marshall Crossland.
2005. Nutrient fluxes in transitional zones of the Italian coast. LOICZ Reports & Studies No. 28,
ii+157 pages, LOICZ, Texel, the Netherlands.
ISSN: 1383
4304
Cover:
The cover shows an image of Italy (GTOPO30 elevation map, courtesy Professor S.V. Smith),
with the budgeted estuaries indicated.
Disclaimer: The designations employed and the presentation of the material contained in this report do not
imply the expression of any opinion whatsoever on the part of LOICZ or the IGBP and the IHDP
concerning the legal status of any state, territory, city or area, or concerning the delimitations of
their frontiers or boundaries. This report contains the views expressed by the authors and may
not necessarily reflect the views of the IGBP and the IHDP.
_________________________________
The LOICZ Reports and Studies Series is published and distributed free of charge to scientists involved in global
change research in coastal areas.
1.
OVERVIEW OF WORKSHOP AND BUDGETS RESULTS
The key objectives of the Land-Ocean Interactions in the Coastal Zone (LOICZ) core project of the
International Biosphere-Geosphere Programme (IGBP) are to:
Ę gain a better understanding of the global cycles of the key nutrient elements carbon (C), nitrogen
(N) and phosphorus (P);
Ę understand how the coastal zone affects material fluxes through biogeochemical processes; and
Ę characterize the relationship of these fluxes to environmental change, including human intervention
(Pernetta and Milliman 1995).
To achieve these objectives, the LOICZ programme of activities has two major thrusts. The first is the
development of horizontal and, to a lesser extent, vertical material flux models and their dynamics
from continental basins through regional seas to continental oceanic margins, based on our
understanding of biogeochemical processes and data for coastal ecosystems and habitats and the human
dimension. The second is the scaling of the material flux models to evaluate coastal changes at spatial
scales to global levels and, eventually, across temporal scales.
It is recognized that there is a large amount of existing and recorded data and work in progress around
the world on coastal habitats at a variety of scales. LOICZ is developing the scientific networks to
integrate the expertise and information at these levels in order to deliver science knowledge that
addresses our regional and global goals.
LaguNet is an example of such a scientific observational network studying the fluxes of nutrients and
other contaminants from lagoon catchments to the near-coastal environment. The idea of developing a
network of Italian researchers involved in the study of lagoons and coastal transitional ecosystems was
developed during a workshop "Coastal and estuarine systems of the Mediterranean and Black Sea
regions: carbon, nitrogen and phosphorous fluxes" organized in Athens (2-5 February 2001) by LOICZ
(Land Ocean Interactions in Coastal Zones) with the support of UNEP and ELOISE. In the
proceedings of the workshop is included a first series of estimates on the fluxes of nitrogen and
phosphorus from selected transitional ecosystems of the Italian coast (Dupra et al. 2001) which
contributed to filling an information gap on information on the Mediterranean region.
LaguNet was inaugurated during the workshop "Nutrient fluxes in the transition zones along the Italian
Coast: evaluation of fluxes and derived ecosystem functions " held in Venice 14-15 April 2002, and
has the following objectives:
i.
Provide a forum for discussion and cooperation between researchers who are studying
biogeochemical processes in lagoons, wetlands and salt- marshes at sites along the Italian coast.
ii.
Evaluate available information and present understanding of the biogeochemistry of carbon,
nitrogen and phosphorous in transitional and coastal waters under the influence of catchment basins.
iii.
Discuss the feasibility of the application of the LOICZ Biogeochemical Model to such areas.
iv.
Promote an agreed common approach to studies of biogeochemical processes in these
transitional ecosystems that can provide support to management or policy applications.
Consider the feasibility of developing one or more projects either in Italy or in Europe (with
Mediterranean EU partners and eventually from Eastern Europe and North Africa).
At present, LaguNet (www.dsa.unipr.it/lagunet ) comprises sites distributed around the entire Italian
peninsula and islands (Figure 1.1). Some, such as the Port of Genoa and the Marinello lakes, consist of
several independent systems (see Table 1.1). There are currently 22 ecosystems under investigation in
which the LOICZ Biogeochemical Model has been applied for a well-defined time period. In total, 94
flux estimations have been undertaken considering a wide range of systems and different time periods.
For some sites (for example, the S'Ena Arrubia Lagoon) it has been possible to compare the results
obtained with the model for different periods of time to obtain valuable information on the evolution of
the lagoon. Some results have already been published in LOICZ Reports and Studies Volume 19
1
(Dupra et al. 2001), while others are reported here. The preliminary results of the exercise have been
presented in various national and international conferences:
Ę Viaroli, P., G. Giordani, C.N. Murray and J.M. Zaldivar: LaguNet: Italian Lagoon
Observational Network. Presentation at the First Italian IGBP Conference: Mediterraneo e Italia
nel Cambiamento Globale: un ponte fra scienza e societÓ Paestum (Salerno) 14-16 November 2002
Ę Viaroli, P., G. Giordani, C.N. Murray, J.M. Zaldivar, S. Guerzoni, A. Bergamasco, C. Solidoro, S.
Rabitti, G. Castaldelli, M. Abbiati, M. Ponti, E. Manini, R. Danovaro, A. Basset, M. Azzaro, A.
Mazzola, T.L. Maugeri, S. Porrello, M. Lenzi, M. Innamorati, C. Melillo, M. Fabiano, P. Povero, P.
Magni, G. De Falco, F. Trebini and N. Sechi. Nutrient fluxes in the transition zones along the
Italian Coast: evaluation of fluxes and derived ecosystemic functions. Presentation at the III
National Congress of Marine Sciences, Bari, Italy, 27-30 November, 2002.
Ę Giordani, G., P. Viaroli, C.N. Murray, J.M. Zaldivar, M. Ponti, M. Abbiati, A. Barbanti, C.
Castellani,, A. Basset, I. Cappello, A. Pomes, L. Palmisano, S. Bencivelli, A. Bergamasco, M.
Azzaro, G. Carrada, G. Castaldelli, M. Mistri, A. E. Fano, A. Castelli, C. Lardicci, F. Maltagliati, G.
Ceccherelli, F. Trebini, B.M. Padedda, N. Sechi, S. Guerzoni, S. Rabitti, F. Collavini, L. Zaggia, R.
Zonta, R. Danovaro, A. Pusceddu, M. Fabiano, P. Povero, N. Ruggieri, S. Fonda Umani, P.
Giordani, M. Ravaioli, F. Frascari, P. Giordano, T.S. Hopkins, V. Hull, M. Falcucci, M. Innamorati,
S. Marsili-Libelli, G. Izzo, C. Creo, M. Lenzi, P. Magni, G. De Falco, E. Manini, F. Spagnoli, M.
Mauri, X.F. Niell, R. Pastres, G. Pernice, S. Porrello, P. Gennaro, V. Saggiomo, C. Solidoro, G.
Cossarini, M. Vazzoler, A. Mazzola, T.L. Maugeri, A. Bernstein, G. Cecconi, L. Montobbio.
Evaluation of fluxes and derived ecosystem functions in the transition zones along the Italian
Coast. Poster at the XIII National Congress of the Italian Society of Ecology (S.It.E.), Como 8-10
September 2003.
Ę Giordani, G., P. Viaroli, C.N. Murray, J.M. Zaldivar, M. Ponti, M. Abbiati, A. Barbanti, C.
Castellani,, A. Basset, I. Cappello, A. Pomes, L. Palmisano, S. Bencivelli, A. Bergamasco, M.
Azzaro, G. Carrada, G. Castaldelli, M. Mistri, A. E. Fano, A. Castelli, C. Lardicci, F. Maltagliati, G.
Ceccherelli, F. Trebini, B.M. Padedda, N. Sechi, S. Guerzoni, S. Rabitti, F. Collavini, L. Zaggia, R.
Zonta, R. Danovaro, A. Pusceddu, M. Fabiano, P. Povero, N. Ruggieri, S. Fonda Umani, P.
Giordani, M. Ravaioli, F. Frascari, P. Giordano, T.S. Hopkins, V. Hull, M. Falcucci, M. Innamorati,
S. Marsili-Libelli, G. Izzo, C. Creo, M. Lenzi, P. Magni, G. De Falco, E. Manini, F. Spagnoli, M.
Mauri, X.F. Niell, R. Pastres, G. Pernice, S. Porrello, P. Gennaro, V. Saggiomo, C. Solidoro, G.
Cossarini, M. Vazzoler, A. Mazzola, T.L. Maugeri, A. Bernstein, G. Cecconi and L. Montobbio.
LaguNet, the Italian lagoon observational network. Evaluation of fluxes and derived
ecosystem functions in the transition zones along the Italian Coast. Poster at the 17th Biennial
Conference of the Estuarine Research Federation (ERF). Estuaries on the Edge. Seattle, WA, USA,
September 14-18, 2003.
Ę Giordani, G., C.N. Murray, J.M. Zaldivar, P. Viaroli. LaguNet, the Italian lagoon observational
network. Evaluation of fluxes and derived ecosystem functions in the transition zones along the
Italian Coast. Presentation at the International Conference: Southern European Coastal Lagoons:
The Influence of River Basin-Coastal Zone interactions. Castello Estense (Ferrara, Italy), 10-12
November 2003.
Ę Viaroli P., The Italian network: LaguNet. Presentation at the national workshop: the Greek
lagoons in the framework of the European networks. Mytilini, Lesvos, Greece. March 20, 2004.
2
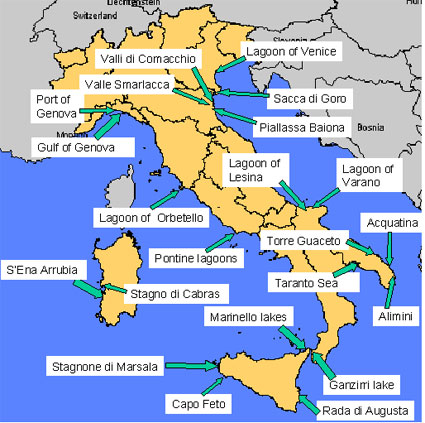
Figure 1.1 Map of Italy showing estuaries for which budgets are presented in this report.
The common element in the site descriptions is the use of the LOICZ approach for biogeochemical
budget development, which allows for global comparisons and application of the typology approach.
The differences in the descriptive presentations reported here reflect the variability in richness of site
data, the complexity of sites and processes and the extent of detailed process understanding for the
sites. Support information for the various estuarine locations, describing the physical environmental
conditions and related forcing functions including history and potential anthropogenic pressure, is an
important part of the budgeting information for each site. These budgets, data and their wider
availability in electronic form (CD-ROM, LOICZ web-site) will provide opportunities for further
regional and global assessment, comparisons and potential use in evaluating patterns of coastal system
responses to human pressures. A LaguNet workshop organized by G. Carrada and A. Basset was held
17-19 June 2004 in Naples (Italy) to discuss the typology of coastal systems at national, southern
Europe and Mediterranean scales, (http://www.ecologia.ricerca.unile.it/TWTypology/). The final
document of the meeting is in Appendix IV.
The biogeochemical budget information for sites shown in Figure 1.1 is discussed individually in the
text that follows, and is reported as average daily rates for the period studied. To provide for an
overview and ease of comparison, the key data are presented in "annualized" form and non-
conservative fluxes are reported per unit area (Tables 1.1 and 1.2).
Due to the shape of the Italian peninsula, it has been possible to study systems that cover a wide range
of latitudes: from the Lagoon of Venice in the North (45.40░ N) to the Rada di Augusta in the South
(37.21░N) (Figure 1.1). Although the distances between these ecosystems are relatively modest
compared to other LOICZ studies that have been organized at continental scales, the network of sites
presented here represents a very wide range of characteristics and a very high density of data.
3
The exploitation and management of these systems are very varied: fish farming, oyster or mussel
farming, tourism, recreation and water sports or nature reserves are all represented. Many of the
ecosystems are in protected areas, others are subject to intense anthropogenic pressures, and still others
are exposed to only slight human impact and stress. Further the biological communities are very
diversified; in some systems the dominant primary producers are phytoplankton, whereas in others they
may be macroalgae or rooted phanerogams.
In the first applications of the LOICZ budgeting procedure to these systems, the simplest one-box, one-
layer model was generally applied. However, for some systems, it was necessary to apply more
complex versions of the procedure, such as the 2-box or 2-layer models. In the Old Port area of Genoa,
a mixed model was applied: the inner box of a 2-boxes model was separated in 2 layers. The budget of
dissolved organic phosphorus (DOP) and nitrogen (DON) was calculated for Sacca di Goro for 1992.
Most of the budgets were calculated using a dedicated MS Excel spreadsheet template
(http://www.dsa.unipr.it/lagunet/documenti/calcoliLOICZ.xls ) but an online tool for one-box one-
layer budgets, called LOICZ Calculator, was built and made available by M. Ponti and G. Giordani at
the web-site: http://www.ecology.unibo.it/LOICZ-Calculator/loicz_calculator.htm. This tool
represents yet another piece of software for LOICZ budgeting, to complement CABARET which was
built by L. David (http://data.ecology.su.se/MNODE/Methods/cabaret.htm ).
Most of the watersheds are subjected to intense agricultural exploitation; as a consequence the nutrient
loads are generally richer in DIN than DIP if we consider the theoretically balanced Redfield N:P ratio
(Figure 1.2). Higher loads were found for the Lagoon of Venice which is the largest LaguNet system.
The Sacca di Goro, which was investigated in the 1992 and 1997, shows a considerable decrease in
nutrient loads, partially due to the reduction of the Po di Goro input, a more efficient use of wastewater
treatment plants in the catchment and to the introduction of laws restricting the P concentrations in
detergents (Viaroli et al. in press). Of all the systems studied by LaguNet, the highest external loads of
dissolved inorganic phosphorus and nitrogen were estimated for the Pialassa Baiona Lagoon (290 and
6870 mmol m-2 y-1 respectively) (Figure 1.3), which receives large inputs from industrial wastewater
treatment plants plus many other sources around the city of Ravenna. The loads of S'Ena Arrubia are
rich in DIP even though this system is located in an agricultural area. The case of Torre Guaceto is
quite peculiar because the inputs are dominated by groundwater rich in DIN and poor in DIP. About
50% of the systems receive loads higher than 0.05 or 0.8 mol m-2 y-1 of DIP and DIN respectively,
indicating the heavy anthropic pressure to which they are subjected. Systems with the lowest nutrient
loads are the Stagnone di Marsala and the system of Capo Feto, which are located in areas with
minimal human activities. For all systems, DIP inputs directly from the atmosphere are considered
negligible; for S'Ena Arrubia, where a study on dry deposition was performed, such P input was
estimated at about 0.1% of the total DIP input. In contrast, DIN inputs from the atmosphere are
relevant, in particular in northern Italy where concentration of 100-300 mmol m-3 were measured along
the east coast and 50-60 mmol m-3 along the west coast. These high concentrations are probably
related to human activities which are more developed along the north-east coast of Italy. In southern
Italy, lower DIN concentrations were measured (Mosello 1993) but measuring stations were few and
not uniformly distributed. The DIN loads through precipitation are an important input for many
systems (Table 1.2): they are the main estimated DIN inputs for Valli di Comacchio, about 20 % for
the Lagoon of Venice, 5-10% for the Gulf of Genova and S'Ena Arrubia and 1-5 % for Sacca di Goro.
Sites range from very large ecosystems such as the Venice Lagoon (the area open to tidal expansion
and assessed as relevant for budgeting is 360 km2, the total area of the system is 550 km2) to extremely
small ones such as Marinello - Fondo Porto (0.013 km2), from deep coastal systems such as the Gulf of
Genoa (28 m) to very shallow ones such as Torre Guaceto or S'Ena Arrubia (0.40 m). Figure 1.4
illustrates the geomorphologic and hydrologic variability of the LaguNet systems. Large systems, as
the Lagoon of Venice, have relative low water residence time whilst small systems as the lakes of
Marinello, positioned in a dry area, have relative high . Most of the systems have surface area from 1
to 100 km2 (median value = 2.4 km2) and from 5 days to 1 year.
4
Among LaguNet sites, a relationship between DIP and DIP loads are observed (Figure 1.5). At low
loads, systems are more or less in balance or they act as a source of DIP (positive DIP) while at high
loads they act as sinks of DIP. The case of Pialassa Baiona is peculiar since even at the highest DIP
loads, the system shows a DIP close to zero. This can be due to the presence of heavy metals or other
toxic compound that inhibited P uptake and release. A trend similar to DIP input/DIP can be
observed also for DIN input/DIN (Figure 1.6).
The higher values (both positive and negative) of the estimated Net Ecosystem Metabolism, which
indicate that a system is highly heterotrophic or highly autotrophic, are estimated for systems
dominated by floating macroalgae such as Sacca di Goro and S'Ena Arrubia (-8 and +12 mol C m-2 y-1,
respectively) indicating that this kind of primary producer can be considered as a source of disturbance
within the system. As expected from Figure 1.5, since NEM is estimated from DIP and N/P ratio,
balanced or respiration dominated system prevail at low DIP load while production dominate at high
DIP load (Figure 1.7). No clear relationships exist among NEM and DIN loads (Figure 1.8).
The resulting (nfix-denit) is the difference between nitrogen fixation and denitrification in the system
(Figure 1.9). These 2 microbial processes are linked to the availability of nitrogen rather then to
production and respiration processes. In general, at high nitrogen loads, the LaguNet systems show a
dominance of denitrification over N fixation.
The principal component analysis (PCA) was applied to all the LaguNet sites, considering area, depth,
, annual DIP and DIN inputs and mean concentrations in the system, DIP, DIN, NEM and (nfix-
denit). The first four component explain the 76% of the system variance. The scattergram of the first 2
components (54% of the system variance) shows a separation of the most impacted lagoons from the
well preserved ones (Figure 1.10)
Comparing LaguNet budgets to the global budgets of the LOICZ database as of 2003, we can see
similar general trend (Figures 1.11-1.18). The median area of LaguNet sites is smaller than that of
global dataset (Figure 1.11). Median depth (Figure 1.12) and water residence time (Figure 1.13) of the
two distributions are roughly the same. The nutrient loads of LaguNet sites cover only the lower half of
the overall budget but follow the same trends (Figure 1.14). DIP and DIN distribution of the
LaguNet sites conform to the general global distribution with a dominance of negative values (Figures
1.15-1.16). As for the overall budgets, the LaguNet systems are mostly autotrophic with a dominance
of denitrification (Figures 1.17-1.18).
With this volume, we continue to increase the coverage of nutrient fluxes in much of the global coastal
zone. Some trends are emerging, such as the dominance of autotrophic systems and net-denitrifying
systems in the global coastal zone, though quantitative relationships with other variables seem to be
generally nonlinear and noisy. Other statistical approaches (principal components and cluster analysis)
may be more robust and have to be considered. In any case, extrapolating from individual budget sites
to the "global coastal zone" remains a challenge although the Italian sites appear to reproduce patterns
observed at the global scale
Input to national and European policy
Other than the application of LOICZ methodology for the purpose of studying the impact of climatic
change and human activities on fluxes of nutrients to coastal ecosystems, there is an increasing need of
policy-oriented scientific information.
Information on the impact of watershed processes on nearshore coastal environments is becoming
increasingly important for the protection of biodiversity and sustainability of terrestrial aquatic
ecosystems as well coastal systems under their influence. Such integrated systems require an approach
that closely links science and policy for a more efficient development and implementation of EU
Directives. Too often, available scientific information is not adequately assessed in the development of
5
policy, even if it is well prepared, or alternatively, the information is not presented in a form that can be
easily used for policy development. One role of networks of environmental researchers, such as
LaguNet, is to contribute to bridging the gap between science and policy. Such networks bring together
individual research groups working on similar or common themes, using benchmarked methodologies,
allowing comparison of processes over a wide range of ecosystems (under varying pressures and
impacts), and can thus identify information gaps and build a basis in solid science for the development
and implementation of Directives and input to national or EU policy discussions. We expect that
LaguNet will also provide a strong basis for cooperation with other national or European networks.
List of reference persons for groups collaborating in LaguNet
P. Viaroli, G. Giordani, Dipartimento di Scienze Ambientali, UniversitÓ di Parma (Coordination and
Secretariat). N. Murray, J.M. Zaldivar, JRC, European Commission, Ispra (Italy). M. Ponti, M.
Abbiati, Centro Interdipartimentale di Ricerca per le Scienze Ambientali in Ravenna, UniversitÓ di
Bologna. A. Barbanti, C. Castellani, S. Rabitti, Thetis S.p.A., Venezia. A. Bernstein, G. Cecconi, L.
Montobbio, Consorzio Venezia Nuova, Venezia. A. Basset, I. Cappello, A. Pomes, L. Palmisano, Dip.
di Scienze e Tecnologie Biologiche e Ambientali, UniversitÓ di Lecce. S. Bencivelli, Amministrazione
Provinciale di Ferrara. A .Bergamasco, M. Azzaro, CNR-Istituto Talassografico, Messina. G.
Carrada, Dipartimento di Zoologia, UniversitÓ Federico II, Napoli. G. Castaldelli, M. Mistri, A.E.
Fano Dipartimento di Biologia, UniversitÓ di Ferrara. A. Castelli, C. Lardicci, F. Maltagliati,
Dipartimento di Scienze dell'Uomo e dell'Ambiente, UniversitÓ di Pisa. G. Ceccherelli, F. Trebini,
B.M. Padedda, N. Sechi, Dipartimento di Botanica ed Ecologia Vegetale, UniversitÓ di Sassari. S.
Guerzoni, F. Collavini, L. Zaggia, R. Zonta, I. Scroccaro, G. Umgiesser, CNR-ISMAR, Venezia. R.
Danovaro, A. Pusceddu, Dipartimento di Scienze del Mare, UniversitÓ Politecnica delle Marche. M.
Fabiano, P. Povero, N. Ruggieri, DIPTERIS, UniversitÓ di Genova. S. Fonda Umani, Laboratorio di
Biologia del Mare, UniversitÓ di Trieste. P. Giordani, M. Ravaioli, F. Frascari, P. Giordano, CNR-
ISMAR, Sezione di Geologia Marina, Bologna. T.S. Hopkins, CNR-IAMC, Napoli. V. Hull, M.
Falcucci, Laboratorio Centrale di Idrobiologia, Roma. M. Innamorati, Dipartimento di Biologia
Vegetale, UniversitÓ di Firenze. S. Marsili-Libelli, Dipartimento di Sistemi e Informatica, UniversitÓ
di Firenze. G. Izzo, C. Creo, ENEA, Roma. M. Lenzi, LeaLab, Orbetello. P. Magni, G. De Falco,
IMC, Oristano. E. Manini, F. Spagnoli, CNR-ISMAR, Lesina. M. Mauri, Dipartimento di Biologia
Animale, UniversitÓ di Modena e Reggio. X.F. Niell, Universidad de Malaga (Spain). R. Pastres,
Dipartimento di Chimica Fisica, UniversitÓ di Venezia. G. Pernice, CNR-IAMC, Mazara del Vallo. S.
Porrello, P. Gennaro, ICRAM, Roma. V. Saggiomo, Stazione Zoologica A. Dohrn, Napoli. C.
Solidoro, G. Cossarini, OGS, Trieste. M. Vazzoler, Arpa Regione Veneto. G. Matteucci, CSA
Ricerche, Centro Studi Ambientali, Rimini.
Acknowledgments
This activity was performed with the support of the Joint Research Centre of the European
Commission (Ispra, Italy), the UE Project DITTY (contact n░ :EVK3-CT-2002-00084), Thetis S.p.A.
(Venice, Italy) and the Provincia di Ferrara Ł Settore Ambiente (Italy). We are especially indebted to
A. Barbanti, S. Bencivelli and G.C. Carrada for the organisation of the LaguNet workshops in Venice,
Ferrara and Naples.
6
Table 1.1. Budgeted LaguNet sites for Italy - locations, system dimensions and water exchange
times.
Exchange
System Name/
Lat.
Long. Area Depth
Period
No. of
No. of
Province
time
Description
(+░N)
(+░E)
(km2)
(m)
studied
layers
boxes
(days)
1999,
Lagoon of Venice
Venezia
45.40
12.40
360
1.5
1
1 and 2
10-14
2001
1992
2
Sacca di Goro
Ferrara
44.80
12.29
26
1.5
1 1
1997
7
Ferrara-
Valli di Comacchio
44.60 12.17 114.5 0.8
1997
1
1
247
Ravenna
Valle Smarlacca
Ravenna
44.58
12.23
1.9
0.8
1997
1
1
434
Pialassa Baiona
Ravenna
44.50
12.25
9.9
0.9
2000
1
1
3
Lagoon of Lesina
Foggia
41.88
15.45
51.5
0.8
1998-99
1
1
100
Lagoon of Varano
Foggia
41.88
15.75
64.0
4.0
1997-99
1
1
1032
Torre Guaceto
Brindisi 40.71
17.80 1.19 0.3 2001-02 1
1
26
marshland
Torre Guaceto Bay
Brindisi
40.71
17.80
1.44
4
2001-03
1
1
na
Acquatina Lake
Lecce
40.44
18.24
0.45
1.0
1995
1
1
4
Lake Alimini Grande Lecce
40.20
18.45
1.4
1.5
1998-99
1
1
232
Rada di Augusta
Siracusa
37.21
15.23
23.5
14.9
1998-99
1
1
169
Capo Feto
Trapani
37.68
12.48
1.4
1.75
2001
1
1
105
Stagnone di Marsala
Trapani
37.83
12.45
21.35
0.95
1996
1
1
63
149*
Ganzirri Lake
Messina
38.26
15.62
0.34
2.5
1998-99
1
2
(44-15)
Marinello Lakes-
Messina 38.13
15.05
0.017 1.6 1997-98 1
1
156
Verde
Marinello Lakes -
Messina 38.13
15.05
0.013 1.5 1997-98 1
1
95
Fondo Porto
Orbetello Lagoon
Grosseto
42.44
11.23
25.25
1.0
1999-00
1
1
8
Ligurian Coast
summer
Genova 44.40 8.93 52 28.0
2 1 16
(Gulf of Genoa)
1996
Port of Genoa - Old
summer
11*
Genova 44.40 8.90 2.7 13.2
2/1 2
Port
2002
(20-7)
Port of Genoa
summer
- Multedo oil
Genova 44.40 8.90 1.4 15.0
1 1 60
2002
terminal
Port of Genoa Ł
summer
Voltri Container
Genova 44.40 8.90 2.1 15.0
1 1 99
2002
Terminal
1994,
8
S'Ena Arrubia
Oristano
39.83
8.57
1.2
0.40
1995,
1 1 20
2001-02
4
* for the 2 boxes budgets, of the whole system is indicated with the values of the inner and outer boxes in brackets.
na= not available
7
Table 1.2 Budgeted LaguNet sites for Italy - loads and estimated (nfix-denit) and (p-r). Torre
Guaceto marine area budget is not considered due the uncertainty in the VX estimation (see the
relevant budget).
System Name/
DIP
DIN DIN
(nfix -
V
P
DIP DIN
(p-r)
Description
R
VX
load* load* load#
denit)
106 m3 yr-1 mmol
m-2 yr-1
Lagoon of Venice
-1216 19248 11.5 741 202 9.2 -511 -657 -986
1999
Lagoon of Venice
-1136 12511 12.4 751 202 -3.9 -694 -628 438
2001
Sacca di Goro
-726 6467 42.1
5517
56 3.3
-7230
-7099
1234
1992
Sacca di GoroSG
-361 1717 20.1
1227
58 24.6
1774 916 -8249
1997
Valle di ComacchioVC 18 117 0 0 59 0.4 -72 -80 -40
Valle SmarlaccaVS -2 0VS 4.0
182
58
-3.6
-226
-146 402
-3405 Ł
354-
Pialassa Baiona
-472
667
291.3 6802
66
-3.3
-3459 -3343$ 1117$
Lagoon of Lesina
-45
105
43.3
954
naŻ -43.2 -911 -212 4636
Lagoon of Varano
-24
67
2.2
76
naŻ -2.1 -72 -37 234
Torre Guaceto
-5
0
0.1
3784
naŻ 0.8 -3134
-3146 -88
Acquatina Lake
-15
44
8.9
2300
naŻ -7.3 -651 -526 803
Alimini GrandeAG -2 7
0.2
242
naŻ -0.03 -11 -11
0
Rada di Augusta
-17
741
4.0
914
naŻ -0.4 -827 -818 44
Capo Feto marshland
0.04
8
0.3
8
naŻ 8.6 33 -106 -913
Stagnone di Marsala
7
110
0.0
0
naŻ 0.04 -0.5 -1.1 -18
Ganzirri Lake
-0.5
1.5
3.4
109
naŻ -3.0 -61 -13.2 319
Marinello-Verde -0.02
0.04
5.0
84
naŻ -3.9 -47 14.6 405
Marinello-Fondo
-0.01 0.07 0.6 10 naŻ -0.5 16 25.6 58
Porto
Orbetello Lagoon
-179
995
12.4
576
45
-1.4
1239
1347
1022
Ligurian Coast
198
¦ 15968
¦ 41.7 595 18 -48.9 -825 -44 5183
(Gulf of Genoa)
Port of Genoa Ł
-27 1203
107.3
6558
150
-83
-6227
-4897
8813
Old Port
Port of Genoa Ł
-4 124
8.1
130
149
87
145
-1256
-9271
Multedo oil terminal
Port of Genoa -
Voltri Terminal
-4 113 0 0
149
-1.2
-251
-237
110
Container
S'Ena Arrubia SEA
-9 14
159.1
1048
32
-111
-1034
767
11863
1994
S'Ena Arrubia SEA
-2 7
91.9
215
16
-45
-176
548
4818
1995
S'Ena Arrubia
-8 45
92.5
695
14
-34
-329
212
3599
2000-01
* = sum of loads from runoff (VQ), direct sources (Vo), groundwater (VG) if present and known,
expressed per unit area of the system (not the drainage basin)
# DIN loads from precipitation (Vp) if present and known, expressed per unit area of the system (not the
drainage basin)
naŻ data not available; DINP loads are assumed to be zero.
8
$ lower value obtained using Redfield ratio C:P; Higher value using macroalgal C:P from Atkinson and
Smith,1983
¦ Vdeep is reported for VX; Vsurf-Vdeep for VR
SG see Viaroli et al. 2001b or
http://data.ecology.su.se/mnode/Europe/Med_Aegean_BlackSea/Italy/SaccadiGoro/saccadigorobud.htm
VC see Viaroli and Giordani 2001 or
http://data.ecology.su.se/mnode/Europe/Med_Aegean_BlackSea/Italy/comacchio/comacchiobud.htm
VS see Giordani and Viaroli 2001 or
http://data.ecology.su.se/mnode/Europe/Med_Aegean_BlackSea/Italy/smarlacca/smarlaccabud.htm
AG see Vadrucci et al. 2001 or
http://data.ecology.su.se/mnode/Europe/Med_Aegean_BlackSea/Italy/Alimini/aliminibud.htm
SEA see Giordani et al. 2001 or
http://data.ecology.su.se/mnode/Europe/Med_Aegean_BlackSea/Italy/arrubia/arrubiabud.htm
400
)
Venice
-1
300
l y
o
m6
1
0 200
t
(
u
p
i
n
N
Sacca
100
DI
di Goro
DIN = 16 DIP
0
0
1
2
3
4
5
DIP input (106 mol y-1)
Figure 1.2. DIP and DIN loads to the LaguNet systems.
9
8
Piallassa Baiona
)-1 6
y2
ol m
m
( 4
Torre Guaceto
DIN = 16 DIP
input
I
N
D 2
S'Ena Arrubia
0
0.0
0.1
0.2
0.3
DIP input (mol m2 y-1)
Figure 1.3. DIP and DIN loads to the LaguNet systems per square meter of lagoon.
10000
1000
ays)
100
d
(
10
1
0.0
0.1
1.0
10.0
100.0
1000.0
Surface area (Km2)
Figure 1.4. Surface area and estimated mean water residence time (log scales) among LaguNet
sites.
10
0.10
0.05
)
Piallassa Baiona
-1 y
2
0.00
l
m
o
0.00
0.05
0.10
0.15
0.20
0.25
0.30
m
(
P -0.05
DI
-0.10
-0.15
DIP input (mol m2 y-1)
Figure 1.5. Non-conservative behaviour of DIP in relation to DIP loads among the LaguNet sites.
3
2
1
0
)-1
y -1 0
1
2
3
4
5
6
7
8
2
l
m -2
o
m
( -3
N
DI -4
-5
-6
-7
-8
DIN input (mol m2 y-1)
Figure 1.6. Non-conservative behaviour of DIN in relation to DIN loads.
11
15
10
)-1
5
y2
l
m
o
0
m
(
0.00
0.05
0.10
0.15
0.20
0.25
0.30
M
NE
-5
-10
-15
DIP input (mol m2 y-1)
Figure 1.7. Relationship between NEM and DIP loads in the LaguNet sites. NEM is the
difference between production and respiration processes in the system.
15
10
)-1
5
y2
l
m
o
0
m
(
0
1
2
3
4
5
6
7
8
M
NE
-5
-10
-15
DIN input (mol m2 y-1)
Figure 1.8. Relationship between NEM and DIN loads in the LaguNet sites. NEM is the
difference between production and respiration processes in the system..
12
2
1
0
)-1
y2 -1 0
1
2
3
4
5
6
7
8
l
m
o -2
-3
i
t
r
) (m
e
n -4
x
-
d
-5
fi
(n -6
-7
-8
DIN input (mol m2 y-1)
Figure 1.9. Relationship between (nfix-denit) and DIN loads in the LaguNet sites. (nfix-denit) is
the difference between nitrogen fixation and denitrification in the system.
3
S'Ena Arrubia
2
Old Port
Gulf of
of Genova
Genova
1
Lesina
t
2
n
Venice
e
Varano
0
pon
Piallassa
m
o
Baiona
Orbetello
C
Acquatina
Torre
-1
Sacca di
Guaceto
Alimini
Goro 92
Multedo Oil
-2
Sacca di
Terminal
Goro 97
-3
-4
-3
-2
-1
0
1
2
Component 1
Figure 1.10. Ordination of the LaguNet sites as shown by the Principal Component Analysis of
morphometric data (area, depth, water residence time), DIP and DIN inputs and concentration
in the system, DIP, DIN, NEM and (nfix-denit). Component 1 (33%) correlates with (nfix-denit)
(r = +0.96), DIN (r = +0.92) and DIN input (r = -0.90); Component 2 (20%) correlates with NEM (r =
+0.91), DIP (r = -0.89) and DINsys (r = -0.66). The other 2 components (not indicated) (14 and 10 %)
correlate respectively with DIPsys (r = -0.70) and area (r = -0.88).
13
Figure 1.11. Comparison between the areas of LOICZ (blue) and LaguNet (red) sites as of 2003.
The areas of LaguNet sites span 4 orders of magnitude and the median area is smaller than that of
global budget dataset.
Figure 1.12. Comparison between the depth of LOICZ (blue) and LaguNet (red) sites as of 2003.
The depths of LaguNet sites span 3 orders of magnitude and the median area value is similar to that of
global budget dataset.
14
Figure 1.13. Comparison between water residence time of LOICZ (blue) and LaguNet (red) sites
as of 2003. Residence time distribution of the LaguNet sites spans over three orders of magnitude and
is centred on roughly the same median value as the overall distribution.
Figure 1.14. Comparison between nutrient loads of LOICZ (blue/green) and LaguNet (red) sites
as of 2003. Nutrient loads (unscaled) span over 3+ orders of magnitude. Overall budgets show a
bimodal distribution for both DIN and DIP LaguNet sites follow these general patterns even with low
values related to the smaller catchment areas.
15
Figure 1.15. Comparison between DIP of LOICZ (blue) and LaguNet (red) sites as of 2003.
Both distributions are unimodal and skewed left on a linear scale (negative values). Most LaguNet
sites fall in the same category as the global budget dataset.
Figure 1.16. Comparison between DIN of LOICZ (blue) and LaguNet (red) sites as of 2003.
Both distributions are unimodal and skewed left on a linear scale (negative values). Most LaguNet
sites fall in the same category as the global budget dataset.
16
Figure 1.17. Comparison between (p-r) of LOICZ (blue) and LaguNet (red) sites as of 2003. More
sites are autotrophic than heterotrophic. The distribution of the Italian sites is similar to the general
global distribution. Extreme values (beyond ▒ 104) are questionable.
Figure 1.18. Comparison between (nfix-denit) of LOICZ (blue) and LaguNet (red) sites as of
2003. More sites are denitrifiers. The distribution of the Italian sites is similar to the global
distribution pattern. Extreme values (beyond ▒ 5000) are questionable.
17


2
NORTH-EASTERN ITALIAN COASTAL SYSTEMS
2.1 Lagoon
of
Venice
Gianpiero Cossarini1, Chiara Castellani2, Andrea Barbanti2, Alberto Giulio Bernstein3, Giovanni
Cecconi3, Flaviano Collavini4, Stefano Guerzoni4, Laura Montobbio3, Roberto Pastres5, Sandro
Rabitti2, Giorgio Socal4, Cosimo Solidoro1, Marina Vazzoler6 and Luca Zaggia4
1Istituto Nazionale di Oceanografia e di Geofisica Sperimentale, Trieste;
2Thetis S.p.A., Venezia;
3Consorzio Venezia Nuova;
4Istituto di Scienze Marine, Consiglio Nazionale delle Ricerche, Venezia;
5UniversitÓ di Venezia;
6ARPAV - Agenzia Regionale per la Prevenzione e Protezione Ambientale del Veneto
Study area description
The Lagoon of Venice is the largest lagoon in Italy and one of the largest in Europe. It is located in the
northern part of the Adriatic Sea (45.2░N - 45.6░N 12.2 - 12.6░E). Three narrow inlets connect the
Lagoon of Venice to the Adriatic Sea, subdividing the lagoon into three sub-basins divided by two
watersheds, along which the intensity of the tidal currents is low. Part of the lagoon is devoted to
aquaculture and closed to water exchanges; the surface open to tidal exchange and assessed as relevant
for LOICZ computation (estimated from CVN 1990 bathymetry), is 360 km2, with a volume of 0.540
km3 and an average depth of 1.5 m.
Draina
Drain ge basin
Venice
c Lagoon
P.Marghera
Margher
Venice
Venic
The 3 se
The 3 a
se inl
i ets
et
Adriati
t c se
s a
Figure 2.1. The Lagoon of Venice and its drainage basin (Source: CVN).
18
The drainage basin is densely populated and carries into the lagoon both industrial and agricultural
wastewaters. The loads of nitrogen and phosphorus discharged into the lagoon by the tributaries were
assessed during the DRAIN project (DeteRmination of pollutAnt INputs from the drainage basin;
MAV-CVN 2001), in which the main tributaries were monitored for almost two years (1998 - 2000).
The largest fraction of these loads of nitrogen and phosphorus is discharged into the northern sub-
basin. Other relevant nutrient sources come from the industrial area of Porto Marghera (MAV-SAMA
2000-2002), from a civil wastewater treatment plant located close to the lagoon (ASPIV 2000; VESTA
2002) and from atmospheric deposition, which was investigated within the "2023 project" (MAV-CVN
2000a).
In the last few decades several projects have studied the lagoon environment. Data dealing with the
concentrations of dissolved nitrogen and phosphorus in the lagoon were systematically collected by
MAV-CVN (MELa1 Project, Monitoraggio Ecosistema Lagunare). Analysis of results shows that the
lagoon is a complex system, exhibiting spatial and temporal variability of dissolved nutrients,
chlorophyll a, dissolved oxygen and turbidity (MAV-CVN 2002a, MAV-CVN 2002b). Dissolved
nitrogen and phosphorus are higher in the northern sub-basin than in other sub-basins, while within
each basin concentrations are inversely correlated with salinity, suggesting the importance of nutrient
loads from freshwater sources.
The LOICZ budgeting approach was applied to the datasets presented in Table 2.1. These data allowed
us to estimate annual budgets of salt and nutrients for the years 1999 and 2001, which were computed
under the standard 1-box, steady-state hypothesis (Gordon et al. 1996). We also show and briefly
discuss the results of a seasonal analysis calculated for the year 1999, and of a steady-state analysis of
the 2001 annual budget which was based on the assumption that the lagoon could be divided into two
homogeneous boxes.
Single box analysis: 1999 and 2001 annual budgets
Water and salt budget
In 1999, river discharges (VQ) and direct atmospheric precipitation (VP) accounted for about 70% and
20% of the freshwater input (Table 2.2). The discharges from sewage treatment plants (VO) accounted
for the remaining 10%. The evaporation volume, VE, estimated according to Hargreaves' equation
(Hargreaves 1975) was about 7% greater than direct precipitation. As a result of the water balance, the
residual flow, VR, was -3.33x10⁶ m3 d-1. The exchange flow, Vx, computed on the values of salinity of
system and sea and residual flow, was 52.74x10⁶ m3 d-1.
Lacking more recent data, fluvial and atmospheric input for 2001 were considered to be as for 1999,
since precipitation into the lagoon during the two years was comparable, at least for the model aims
and on annual basis. For 2001, VR = Ł3.11x10⁶ m3 d-1 and VX = 34.28x10⁶ m3 d-1, suggesting a change
with respect to 1999 values: VR increased 7% while VX decreased ~ 35%.
Residence time estimates using LOICZ methodology were 10 days for 1999 and 14 days for 2001.
These values are consistent with estimates of the residence time obtained by hydrodynamic model
simulations previously performed for the Lagoon of Venice (MAV-CVN 1998). LOICZ results are
within the range of variation of the model-simulated residence time of the lagoon, which exhibits
strong variability depending on the spatial heterogeneity of the system and tidal conditions. The net
exchange flow VX accounts about for 9-14% of the average daily volume of water flowing into the
lagoon from the sea through the three inlets (385x106 m3 d-1) (MAV-CVN 2000b). However, any
consideration of the VX and values must take into account their high sensitivity to the average salinity
values attributed to the lagoon and to the sea.
Results of the water and salt budget for the years 1999 and 2001 are summarized in Table 2.2 and
Figure 2.3.
19
Table 2.1. Data used in budget calculations for the Lagoon of Venice.
Frequency of
Year of
Type of data
Spatial resolution
sampling or
Sources
budget
estimation
1999-
V
2001
Q, DIPQ, DINQ
Main inflowing rivers
Monthly 1999 MAV-CVN 2001
Monthly from
1999-
V
August 1998 to MAV-CVN 2000a
2001
P, DIPP, DINP
4 stations in the lagoon
July 1999
Monthly 1999 ASPIV 2000
Campalto sewage treatment plant;
1999 VO, DIPO, DINO
Annual, 1999- MAV-SAMA
P. Marghera industrial discharge
2000
2000
VESTA 2002
Campalto sewage treatment plant;
Monthly 2001
2001 VO, DIPO, DINO
MAV-SAMA
P. Marghera industrial discharge
Monthly 2000 2002
Monthly from
26 stations located in the central January to July MAV-CVN 1999
part of the lagoon
1999
10 stations located near inland of
Sal
1999
sys,
Venice and urban centres of Lido
MAV-SAMA
DIPsys,DINsys
Monthly 1999
and Chioggia, and in southern sub-
2001
basin
7 stations located in northern sub- Monthly 1999 IBM-CNR
basin
Sal
MAV-CVN
2001
sys, DIPsys,
28 stations over the whole lagoon
Monthly 2001
DINsys
2002a,b
Interreg II Project
Sal
(IBM-CNR) and
1999
sea, DIPsea,
Transects along Adriatic coast
Monthly 2000
DINsea
ARPAV coastal
data
Interreg II Project
Sal
(IBM-CNR) and
2001
sea, DIPsea,
Transects along Adriatic coast
Monthly 2001
DINsea
ARPAV coastal
data
Table 2.2. Summary of salt and water budget for the 1-box model for the Lagoon of Venice
* = values estimated from the 1999 data
Year VQ
VO
VP
VE
Salsys Salsea VR
Vx
r
103 m3 d-1 103 m3 d-1 103 m3 d-1 103 m3 d-1 psu
psu
103 m3 d-1 103 m3 d-1 days
1999
2980.8 407.8 846.1 903.5 30.97
32.99
-3,331 52735 10
2001
2980.8*
407.8* 655.5 903.7 30.16
33.03
-3,113 34276 14
20
Budgets of non-conservative materials
The main sources of N and P were the discharges from the rivers, which in 1999 accounted for 67%
and 50% of the total annual inputs respectively (Table 2.4). Atmospheric precipitation was also
important, accounting for 27% and 21% of DIP and DIN inputs respectively. Because recent data are
lacking on inputs from the rivers and from atmospheric deposition, 1999 estimates are also used in the
annual budget for 2001. Inputs from the direct discharges, which were independently estimated for the
years 1999 and 2001, collectively accounted for about 23% and 11% of the total DIP and DIN inputs
for 1999 and 29% and 12% for 2001.
Table 2.3. DIP concentrations in the inflowing rivers, the Lagoon of Venice and the adjacent
Adriatic Sea.
*data obtained from VPDIPP of 1999 and VP 2001
Year DIPQ
DIPP
DIPO
DIPsys
DIPsea
DIPR
mmol m-3
mmol m-3
mmol m-3
mmol m-3
mmol m-3
mmol m-3
1999
1.92 3.56 6.45 0.45 0.08 0.27
2001
1.92 4.59* 8.64 0.38 0.16 0.27
Table 2.4. DIP budget for the Lagoon of Venice.
Year VQ DIPQ
VP DIPP
VO DIPO
VR DIPR
VxDIPx
DIP
DIP
mol d-1
mol d-1
mol d-1
mol d-1
mol d-1
mol d-1
Ąmol m-2 d-1
1999 5723
3012 2630
-899
-19512 9046 25
2001 5723
3009 3523
-841
-7541 -3873 -11
The results of the budget calculations for DIP and DIN, presented in Tables 2.3-2.6 and Figures 2.4 and
2.5 show that VRDIPR and VRDINR obtained for the years 1999 and 2001 are of the same order of
magnitude. However, in 1999, the fluxes of DIP and DIN due to the mixing process (VX), which is the
most significant term, were in both cases higher than those calculated for the year 2001. The
difference is mainly due to the fact that in 1999 the DIP gradient between the system and the sea was
almost twice as high as that in 2001, while DIN was almost 50% higher in 1999 than in 2001. Average
values of the DIP gradient between system and sea were 0.37 mmol m-3 for 1999 and 0.22 mmol m-3
for 2001, while the DIN gradients were 6.49 mmol m-3 in 1999 and 5.44 mmol m-3 in 2001.
As a result of the balance between input and output flows of DIP, the lagoon mobilized 9046 mol d-1 in
1999 but took up 3873 mol d-1 in 2001. DIN estimates for the two years have the same sign, with a
higher consumption during 2001 than during 1999.
Table 2.5. DIN concentrations in the inflowing rivers, the Lagoon of Venice and the adjacent
Adriatic Sea.
*data obtained from VPDINP of 1999 and VP 2001
Year DINQ
DINP
DINO
DINsys
DINsea
DINR
mmol m-3
mmol m-3
mmol m-3
mmol m-3
mmol m-3
mmol m-3
1999
209.95 235.36 258.00 28.39 21.90 25.15
2001
209.95 303.80*
281.48 23.90 18.36 21.13
21
Table 2.6. DIN budget for the Lagoon of Venice.
Year VQ DINQ
VP DINP
VO DINO
VR DINR
VxDINx
DIN
DIN
mol d-1
mol d-1
mol d-1
mol d-1
mol d-1
mol d-1
mmol m-2 d-1
1999 625819 199138 105212 -83775 -342250 -504144 -1.40
2001 625819 199141 114788 -65778 -189889 -684081 -1.90
Stoichiometric calculations of aspects of net system metabolism
The non-conservative fluxes expressed as daily rates per unit area are summarized in Table 2.7. The
system was heterotrophic in 1999 and slightly autotrophic in 2001 as the NEM was -2.7 mmol C m-2 d-1
in 1999 and +1.2 mmol C m-2 d-1 in 2001. The values of (nfix-denit), which represents the balance of
the fixation and the denitrification processes of the two years, are in good agreement. In fact, the
estimation for 2001 was just 5% less than for 1999.
In Figure 2.2 the values of NEM (p-r) of the two annual budget calculations for the Lagoon of Venice
(red bars) are compared with the results from other northern Adriatic lagoons (black medium bars) and
some Mediterranean sites (thin grey bars) (Dupra et al. 2001). The NEM values for the Lagoon of
Venice are rather small relative to other LOICZ sites, implying a state of near-balance between
autotrophic and heterotrophic processes.
Table 2.7. Results of stoichiometric calculations for Lagoon of Venice.
Year NEM
(nfix-denit)
mmol m-2 d-1 mmol m-2 d-1
1999 -2.7
-1.80
2001 1.2
-1.72
20
15
10
5
0
/d
2
-5
-10
-15
-20
-25
mmol/m
Gulf of Lione
S'Ena Arrubia
Sacca of Goro
N-E Aegean Sea
Dnieper Estuary
o
macchio Valley
C
Smarlacca Valley
Inner Thermaikos G.
Malii Adzalik Estuar
Dnieper Bug Estuary
Alimini Grande Lake
Venice lagoon 1999
Venice lagoon 2001
Donuslav River Estua
Moulay Busselham L.
Figure 2.2. Comparison of NEM calculations between Lagoon of Venice and other Adriatic and
Mediterranean LOICZ sites.
22
Single box analysis: 1999 seasonal budget
Salt and water budget
Due to the high monthly variability of data for freshwater flows, lagoon and sea salinity, monthly data
were aggregated in order to obtain seasonal estimations of the residual and mixing flow and of the
residence time.
The results are summarized in Table 2.8, which shows that in 1999 seasonal variability of advective
and mixing fluxes was still quite high. As a consequence, the residence time ranged from 4-5 days in
the spring and autumn to 16-17 days during winter and summer. This can be explained by the higher
VQ and VP fluxes in spring and autumn. However, this pattern can be influenced by the salinity
difference between sea and lagoon, which in autumn and spring was slightly lower than 1 psu, the
minimum suggested value for a good estimation of Vx and .
Table 2.8. Seasonal salt and water budgets for the Lagoon of Venice in 1999.
VQ
VO
VP
VE
Sal sys Sal sea VR
Vx
r
103 m3 d-1 103 m3 d-1 103 m3 d-1 103 m3 d-1 psu
psu
103 m3 d-1 103 m3 d-1 d
Jan-Mar
2542.5 405.9 371.0 437.2 31.64
34.78
-2882 30481 16
Apr-Jun 3002.7 411.8 1039.0 1401.2 29.71 30.49 -3052 117776 4
Jul-Sep 2448.2 404.1 632.7 1350.1 31.48
33.82
-2135 29790 17
Oct-Dec 3574.7 409.4 1341.8 425.6 31.77 32.87 -4900 143971 4
Budgets of non-conservative materials and stoichiometric calculations
The DIP input was higher during summer than in the other seasons, while the advection and mixing
fluxes of DIP with the Adriatic Sea were both at the lowest levels (Table 2.10). This indicates that the
lagoon has a net uptake of DIP only in summer when the net ecosystem metabolism, NEM, was
positive (autotrophy) (see Table 2.13). During all the other seasons the system act as a source of DIP
as DIP was positive. The system was highly heterotrophic during spring and autumn when NEM was
-12.9 and -21.6 mmol d-1 m-2 respectively.
Table 2.9. DIP concentrations in the rivers, the Lagoon of Venice and the adjacent Adriatic Sea.
DIPQ
DIPP
DIPO
DIPsys
DIPsea
DIPR
mmol m-3
mmol m-3
mmol m-3
mmol m-3
mmol m-3
mmol m-3
Jan-Mar
1.46 8.33 6.67 0.41 0.06 0.24
Apr-Jun
1.82 3.16 6.13 0.55 0.09 0.32
Jul-Sep
2.64 6.16 6.85 0.29 0.05 0.17
Oct-Dec
1.88 1.16 6.13 0.69 0.12 0.41
Table 2.10. DIP budget for the Lagoon of Venice Ł 1999.
VQ DIPQ VP DIPP VO DIPO VR DIPR VxDIPx DIP
DIP
mol d-1
mol d-1
mol d-1
mol d-1
mol d-1
mol d-1 Ąmol m-2 d-1
Jan-Mar 3712 3276 2707 -692 -10668
1665
5
Apr-Jun 5465 3283 2524 -977 -54177
43882
122
Jul-Sep 6463 3897
2768 -363 -7150
-5615
-16
Oct-Dec 6720 1556 2510 -2009 -82063
73286
204
23
The seasonal budgets for DIN, summarized in Tables 2.11 and 2.12, indicate that the lagoon is a sink
of DIN during winter, spring and summer when fluxes toward the sea did not remove all DIN loads
that the system received. The maximal negative value of DIN was estimated for summer season,
during which both VXDINX and VRDINR were at the lowest levels and the input was at its maximum.
In autumn the DIN fluxes toward the sea were higher than the input and DIN was positive, indicating
a net release of 871255 mol DIN d-1.
The (nfix-denit) rate was negative in all seasons and maximal during spring (Table 2.13). Even in
autumn the DINexp is positive and higher that the DIN, due to the high heterotrophy of the system.
Also in this season the (nfix-denit) value was negative, meaning that denitrification processes prevail
over N-fixation during all seasons of the year.
Table 2.11. DIN concentrations in the rivers, the Lagoon of Venice and the adjacent Adriatic
Sea, 1999.
DINQ
DINP
DINO
DINsys
DINsea
DINR
mmol m-3
mmol m-3
mmol m-3
mmol m-3
mmol m-3
mmol m-3
Jan-Mar 213.97 341.14 253.84 27.79 16.34 22.07
Apr-Jun 219.58 263.07 264.16 34.26 30.07 32.17
Jul-Sep 135.42 496.14 251.02 12.69 10.04 11.37
Oct-Dec 238.17 63.73 262.31 43.19 31.15 37.17
Table 2.12. DIN budget for the Lagoon of Venice 1999, single-box analysis.
VQ DINQ VP DINP VO DINO VR DINR
VxDINx DIN
DIN
mol d-1
mol d-1
mol d-1
mol d-1
mol d-1
mol d-1
mmol m-2 d-1
Jan-Mar 544019 126563 103034 -63606 -349007 -361003 -1.00
Apr-Jun 659333 273330 108781 -98183 -493481 -449780 -1.25
Jul-Sep
331535 313907 101437 -24275 -78944 -643660 -1.79
Oct-Dec 851386 85513 107390 -182133 -1733411 871255 2.42
Table 2.13. Stoichiometric calculations for the Lagoon of Venice, single-box analysis 1999.
NEM
DINexp
(nfix-denit)
mmol m-2 d-1
mmol m-2 d-1
mmol m-2 d-1
Jan-Mar -0.5
0.08
-1.08
Apr-Jun -12.9 1.95 -3.20
Jul-Sep 1.7 -0.26 -1.53
Oct-Dec -21.6 3.26 -0.84
24
VE= 903.5 (1999)
VP= 846.1 (1999)
903.7 (2001)
655.5 (2001)
SR= 31.98 (1999)
31.60 (2001)
VQ= 2980.8 (1999-2001)
Lagoon of Venice
V
S
R = -3331 (1999)
Q = 0 (1999-2001)
Areasys = 360*106 m2
-3113 (2001)
Vsys = 540*106 km3
Ssys = 30.97 psu (1999)
VO = 407.8 (1999-2001)
30.16 psu (2001)
S
sys = 10 d (1999)
sea= 32.99 (1999)
VO SO = 0 (1999-2001)
14 d (2001)
33.03 (2001)
VX= 52735 (1999)
34276 (2001)
Figure 2.3. Water and salt budgets for the Lagoon of Venice, single-box analysis. Water fluxes
are expressed in 103 m3 d-1 and salinity in psu.
DIPP=3.56 (1999)
VPDIPP=3012 (1999)
4.59 (2001)
3009 (2001)
V
DIP
RDIPR= -899 (1999)
Q= 1.92 (1999-2001)
Lagoon of Venice
-841 (2001)
V
DIPsys = 0.45 mmol m-3 (1999)
DIP
Q DIPQ =5723 (1999-2001)
R = 0.27 (1999-2001)
0.38 mmol m-3 (2001)
DIPsys = 9046 mol d-1 (1999)
DIP
DIP
O = 6.45 (1999)
sea= 0.08 (1999)
- 3873 mol d-1 (2001)
8.64 (2001)
0.16 (2001)
DIPsys = 25 Ąmol m-2d-1(1999)
-11 Ąmol m-2d-1 (2001)
VO DIPO = 2630 (1999)
VXDIPX= -19512 (1999)
3523 (2001)
-7541 (2001)
Figure 2.4. DIP budget for the Lagoon of Venice, single-box analysis. Concentrations are in
mmol m-3 and fluxes in mol d-1.
25
DINP=235.36 (1999)
VPDINP=199138 (1999)
303.8 (2001)
199141 (2001)
VRDINR= -83775(1999)
DINQ= 209.95(1999-2001)
Lagoon of Venice
-65778 (2001)
VQ DINQ =625819 (1999-2001)
DINsys = 28.39 mmol m-3 (1999)
DINR = 25.15 (199)
23.90 mmol m-3 (2001)
21.13(2001)
DINsys = -504144 mol d-1 (1999)
DINO = 258.00 (1999)
-684081 mol d-1 (2001)
281.48 (2001)
DINsys = -1.40 mmol m-2d-1(1999)
DIN
-1.90 mmol m-2d-1(2001)
sea= 21.90 (1999)
18.36(2001)
VO DINO = 105212 (1999)
114788 (2001)
VXDIPX= -342250 (1999)
-189889 (2001)
Figure 2.5. DIN budget for the Lagoon of Venice, single-box analysis. Concentrations are in
mmol m-3 and fluxes in mol d-1.
Two-box 2001 analysis
As was mentioned in the introduction, the Lagoon of Venice has a rather high spatial variability of
salinity and concentrations of DIP and DIN, that can not be taken into account when using the 1-box
steady-state hypothesis. Therefore, the subdivision of the lagoon into boxes should improve the results
of the budget calculations. Furthermore, in order to obtain good results, the salinity gradient should not
be less than 1-2 psu (Gordon et al. 1996). Considering this constraint, only two boxes could be
defined.
The MAV-CVN sampling stations, which covered the whole lagoon for the year 2001, were assigned
to the two boxes by statistical analysis. The results of Principal Component Analysis, Cluster Analysis
and K-means methodology, applied on standard water quality parameters (MAV-CVN 2002b), were
utilized in order to find the composition of the two clusters of stations that minimize the within-group
variability. The two groups of sampling stations identified the areas of the two boxes of the model,
which are indicated in Figure 2.6 as boxes A and B. Box A, close to the edge of the lagoon, has a
surface of 174.86 km2 with a mean depth of 0.85 m; Box B, directly affected by tidal flow from the
Adriatic Sea, has a surface of 185.28 km2 with mean depth of 2.14 m.
Nutrient loads from rivers and sewage systems enter Box A; atmospheric loads were divided between
the boxes in proportion to their surface areas (Table 2.14). The results of water, DIP and DIN budgets
for the two-box model for the year 2001 are given in Figure 2.7.
Table 2.14. Salinity, DIP, DIN concentrations in the two boxes budget for the Lagoon of Venice.
Units: salinity in psu, concentrations in mmol m-3.
Salinity DIPQ DIPP DIPo DIPsys DINQ DINP DINO DINsys
BOX A
27.83 1.92 4.59
8.64 0.53 209.95
303.80 281.48
31.68
(inner box)
BOX B
32.16
-- 4.59
-- 0.24
-- 303.80
-- 17.23
(outer box)
Sea
33.03
-- --
-- 0.16
-- -- -- 18.36
26
1B
1C
BOX A
2B
3B
2C
5B
4B
6B
7B
8B3C
4C
5C
9B
10B
11B12B
6C
BOX B
13B
7C
14B
15B
16B
18B
17B
19B
8C
20B
Figure 2.6. Subdivision of the Lagoon of Venice into two boxes. Sampling stations for MAV-
CVN 2001, used to define the area of the boxes, are superimposed on the bathymetric map.
Subdivision of the system into two boxes permitted the description of some spatial behaviour of the
ecosystem metabolism of the lagoon. Figure 2.7 shows that Box A was autotrophic (NEM positive),
while Box B was heterotrophic (NEM negative). This finding is in agreement with the results of
studies indicating the presence of a strong negative trophic gradient from the inner part to areas close to
lagoon inlets (MAV-CVN 2002b). The trophic gradient is also supported by the fact that on an annual
basis, the nutrient flux is from Box A toward Box B, meaning that Box A was richer in nutrients than
Box B.
The amount of nutrients exchanged with the sea is the second important difference obtained by the use
of the 2-box model compared to the 1-box. While the export of DIP from the lagoon to the Adriatic
Sea obtained with the 2-box model (9957 mol d-1) was in near agreement with the 1-box estimation of
8382 mol d-1, for DIN the two models behaved differently. With the 1-box model, DIN export to the
sea was estimated at 255,667 mol d-1, while with the two-box model a net import of 75933 mol d-1 was
estimated, because Box B received a higher input of DIN through mixing than was exported through
advective flow. This is in agreement with several studies which suggest that the Adriatic Sea could be
a source of DIN for the lagoon, at least for several months of the year and for some parts of the lagoon
close to the inlets (Sfriso et al. 1994, Cossarini et al. 2001). These results again support the idea that
the spatial complexity of the Lagoon of Venice ecosystem cannot be adequately and completely
represented by a single-box model. A higher spatial resolution allows a focus on processes which
otherwise remain hidden at lower resolution.
27
Finally, according to the two-box model, (nfix-denit) was negative in both boxes. For the whole
lagoon, it can be estimated at -2.72 mmol m-2 d-1 (weighted average of the two boxes), 58% greater
than the value estimated by the 1-box model. Therefore, the two-box model highlights the importance
of the denitrification process, which clearly dominates any nitrogen fixation processes.
V
V
P = 318.5 103 m3 d-1
P = 337.4 103 m3 d-1
V
V
PDIPP = 1462 mol d-1
PDIPP = 1549 mol d-1
V
V
PDINP = 96760 mol d-1 VE= 451.9 103 m3 d-1
PDINP = 102502 mol d-1
VE= 478.8 103 m3 d-
V
BOX A
BOX B
V
Q= 2980.8 103 m3
VR= 3255.2 103 m3
R= 3113.8 103 m3 d-1
VO= 407.8 103 m3
A=174.86 km2
V
A=185.28 km2 V
X=22553.3 103 m3 d-1
X=116678.0 103 m3 d-1
= 6 d
= 3 d
VQDIPQ= 5723 mol d-1
DIP=
V
DIP=
RDIPR= 1270 mol d-1
VRDIPR= 623 mol d-1
-17 Ąmol m-2d-1
3 Ąmol m-2 d-1
V
NEM (p-r) =
V
NEM (p-r) =
VXDIPX= 9334 mol d-1
ODIPO= 3523 mol d-1
XDIPX= 6540 mol d-1
1.8 mmol m-2d-1
-0.3 mmol m-2 d-1
VQDINQ=
625819 mol d-1
V
V
RDINR= 55395 mol d-1
DIN=
RDINR= 79622 mol d-1
DIN=
-2.47 mmol m-2 d-1
-3.15 mmol m-2 d-1
VODINO=
(nfix-denit) =
V
(nfix-denit) =
VXDINX=
114788 mol d-1
XDINX= 325895 mol d-1
-2.20 mmol m-2 d-1
-3.20 mmol m-2 d-1 131328 mol d-1
Figure 2.7. Budget calculations using the 2-box model for the Lagoon of Venice.
28
2.2
Sacca di Goro Lagoon
Martina Austoni1, Gianmarco Giordani1, Giuseppe Castaldelli2, JosĶ Manuel ZaldĒvar3, Dimitar
Marinov3, Pierluigi Viaroli1
1Dipartimento di Scienze Ambientali, UniversitÓ di Parma
2 Dipartimento di Biologia, UniversitÓ di Ferrara,
3 Institute for Environment and Sustainability, Joint Research Centre, European Commission, Ispra
Summary
The Sacca di Goro is an eutrophic lagoon located along the North Adriatic coast of Italy in the
southernmost part of the Po River delta. The lagoon was investigated in 1992, when annual and
monthly budgets were estimated with a single-box, single-layer LOICZ model. Exchange flows were
obtained from the application of COHERENS (COupled Hydrodynamical Ecological model for
REgioNal Shelf seas) 3-D model. A mean water residence time of 2 days was estimated. The annual
mean DIP was positive (0.01 mmol m-2 d-1) whereas DIN was negative (-20 mmol m-2 d-1), thus the
system can be considered as a source of DIP and a sink of DIN. Budgets for DOP and DON were
calculated from April onwards (except October). Dissolved nutrients from marine and freshwater
sources were dominated by the organic forms of P and the inorganic forms of N. In 1992, the lagoon
acted as a net sink of DOP and a net source of DON. The imbalance between input and output of
nutrients conformed to the seasonal trends of macroalgal biomass growth and decomposition. From
March to June macroalgal blooms were coupled to negative DIP (except for April), DOP and DIN.
In July and August, during the decay phase of macroalgae, DIP, DOP and DON were positive
indicating a high organic matter mineralisation and a release of inorganic and organic dissolved
nutrients. The C, N and P budgets were estimated considering the C:N:P ratios of both macroalgae and
phytoplankton. On an annual basis, the lagoon can be considered as slightly autotrophic, with a net
ecosystem metabolism (p-r) of about 3 mmol C m-2 d-1. The net nitrogen budget (nfix-denit) was
negative, indicating a dominance of denitrification over N-fixation even with values much higher than
those expected in this ecosystem.
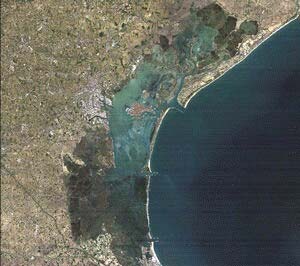
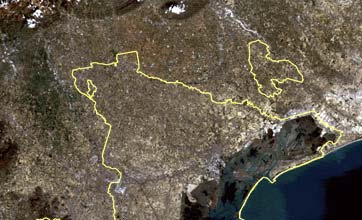
Figure 2.8. Map and location of the Sacca di Goro Lagoon.
29
Study area description
The Sacca di Goro (Figure 2.8) is a shallow-water embayment of the Po River Delta (44.78░N 12.25░E-
44.83░N 12.33░E). The surface area is 26 km2 with a mean depth of 1.5 m and the total water volume
is approximately 39x106 m3. Observation and numerical models have demonstrated a clear zonation of
the lagoon with the low-energy eastern area separated from two higher energy zones, the western area
which is influenced by freshwater inflow from the Po di Volano and the central area influenced by the
sea. Moreover, the eastern zone is very shallow (maximum depth 1 m) and accounts for half of the
total surface area and a quarter of the water volume.
The lagoon is surrounded by embankments. The main freshwater inputs are the Po di Volano River,
and the Canali Bianco-Romanina, Giralda and Bonello. Freshwater inlets are also located along the Po
di Goro River and are regulated by sluices. The freshwater system is mostly located in a subsident area
and is regulated by a system of pumping stations (scooping plants).
The bottom of the lagoon is flat and the sediment is composed of typical alluvial mud; the northern and
central zones exhibit high clay and silt content, while sand is more abundant near the southern
shoreline, and sandy mud occurs in the eastern area.
The climate of the region is mediterranean with some continental influence (wet mediterranean). Wet
deposition is approximately 600 mm yr-1, with late spring and autumn peaks. However, this pattern is
undergoing significant changes with an increase of short-term intense events.
The catchment is heavily exploited for agriculture, whilst the lagoon is one of the most important
aquacultural systems in Italy. About 8 km2 of the aquatic surface were exploited for Manila clam
(Tapes philippinarum) farming, with an annual production of about 15,000 tonnes in 1992.
The system was investigated in 1992 using the one box Ł one layer model at monthly intervals.
Meteorological data from the Volano station were supplied by the Agenzia Regionale Prevenzione e
Ambiente (ARPA, Regione Emilia-Romagna). Temperature, salinity and nutrient concentrations of
coastal waters were provided by the Struttura Oceanografica Daphne, ARPA-Cesenatico (ARPA,
1992). Inorganic nutrient data were recorded at Station 2 (44.7853░N - 12.2625░E; depth: 3 m;
distance from coast 500 m), which is in front of the Sacca di Goro. Data of DON and DOP at stations
4 (44.6628░N - 12.2517░E, depth 3 m, distance from coast 500 m) and 304 (44.6628░N Ł 12.2872░E,,
depth 8 m, distance from coast 3000 m) were used, since these data are not available for Station 2.
Nevertheless, this approach was robust, since no significant differences were observed among budgets
estimated using inorganic nutrient data from stations 2, 4 and 304. Data on freshwater discharge to the
lagoon were supplied by the Consorzio di Bonifica 1░ Circondario Polesine di Ferrara (Consorzi di
Bonifica Ferraresi 1991-1999). Water quality data were recorded by the Province of Ferrara
(Bencivelli 1993). Data of temperature, salinity and nutrient concentrations were recorded at stations 4
and 5-8 in the Sacca di Goro (Colombo et al. 1994; Viaroli et al. 1993; and unpublished data).
Evaporative losses were estimated according to Hargreaves (1975). Water exchange fluxes between
the system and the sea were estimated with the COHERENS 3D model (Marinov et al. 2004).
Water and salt balance
The Sacca di Goro watershed is an artificially regulated network of channels. As a consequence,
freshwater flows are partially independent of rain events but more related to human activities such as
irrigation (summer) and prevention of flooding (rainy season: autumn) (Viaroli et al. in press). In
1992, the main freshwater inputs to Sacca di Goro were Po di Goro (annual mean: 1x10⁶ m3 d-1) and Po
di Volano (0.8x10⁶ m3 d-1). High freshwater loads were detected in October (4x10⁶ m3 d-1), June
(3x10⁶ m3 d-1) and December (3x10⁶ m3 d-1). No direct estimates of freshwater inputs from the Po di
Goro River were available, so we estimated them from the main Po River discharge. The Po di Goro is
a branch of the Po River which contributes about 10% of the Po River discharge. The freshwater
30
discharge to the Sacca di Goro was assumed to be 0.25, 0.5 and 1.0% of the discharge of the main Po
River when the discharge was 1000 m3 s-1, between 1000 and 2000 m3 s-1 or above 2000 m3 s-1,
respectively (Bencivelli pers. comm.). Direct precipitation and evaporation fluxes are very low and
groundwater fluxes are considered negligible in comparison to the other freshwater inputs. High
negative values of VR were calculated; this was expected considering that Sacca di Goro is subjected to
high riverine discharges.. VX fluxes, which are the water mixing flows according to LOICZ notation,
are not calculated from the salinity budget but from the application of the COHERENS 3D
hydrodynamic model (Marinov et al. 2004) to the investigated year. The reported VX values (1.3-
2.2x10⁷ m3 d-1) are of the range of values estimated for the 1980-2000 period with the method indicated
by Yanagi (2000b) and reported in Viaroli et al. (2001b) (Figure 2.9). Considering the volume of the
system and VR and VX, the water residence time is estimated to be about 2 days for the whole period.
This value is of the same order of magnitude of the water residence time estimated with the
COHERENS model (4-5 days on average). The monthly water budgets of the Sacca di Goro are
reported in Table 2.15. The annual budget is shown in Figure 2.10.
Table 2.15. Monthly water fluxes in Sacca di Goro Lagoon. VQ Tot is the sum of the 5 freshwater
inputs. Unit: 103 m3 d-1.
Vvol
Vbon Vgir Vrom Vgor VQ Tot VP VE VR
VX
(d)
Jan
290 18 53 165 207 733 0 6 -727 18800 2
Feb
259 16 41 90 232 638 8 10 -636 19800 2
Mar
299 13 23 67 171 573 9 19 -563 22300 2
Apr
513 9 21 97 673 1313 24 31 -1306 18600 2
May
1656 19 132 11 325 2143 32 48 -2127 18500 2
Jun
1164 16 78 8
2112 3378 45 49 -3374 13200 2
Jul
1145 16 92 13 1032 2298 48 52 -2294 14600 2
Aug
1452 17 126 12 156 1763 12 52 -1723 15100 2
Sep
793 16 79 56 740 1684 40 34 -1690 20100 2
Oct
494 37 99 234 3308 4172 134 18 -4288 16200 2
Nov
288 22 68 125 1181 1684 18 9 -1693 17800 2
Dec
1416 84 195 247 1305 3247 110 6 -3351 17700 2
Annual 818 24 84 94 955 1976 40 28 -1988 17717 2
Budgets of non-conservative materials
Since no monitoring activities were planned for Canali Bianco and Giralda, the relevant nutrient
concentrations of Po di Volano were used for these two channels, because water composition is similar
and the water loads are low in comparison to Po di Volano. No measures were carried out in the Sacca
di Goro in January, February and November, so for January and February we used the mean value of
March and for November, we used the October and December mean values.
DIP budget
The annual and monthly DIP concentrations in the freshwater inputs, system and sea are indicated in
Table 2.16. DIP inputs and outputs are indicated in Table 2.17. No data about DIP deposition from the
atmosphere are available, but this P input can be considered negligible in comparison with other loads
(Viaroli et al. in press). Peaks of DIP inputs were observed from October to December (6000 mol d-1)
and in June (5000 mol d-1). In 1992, the major input of DIP to the lagoon was from the Po di Goro
(annual mean 2037 mol d-1). VRDIPR was negative for the whole period, indicating that it was a
constant output of DIP whilst VXDIPX was either positive or negative depending on the DIP
concentration gradient between the system and the sea. High concentrations of nutrients were detected
in the sea in front of the Sacca di Goro due to the influence of the Po River plume, which can reach this
area. On the annual basis, VXDIPX was negative due to the high negative values observed in summer
when the DIP concentration in the system was high. A net annual export of about 3.2x10³ mol d-1 from
31
the lagoon was estimated (Figure 2.11), whilst the net input of DIP from freshwater was about 3.0x10³
mol d-1. On average, the lagoon was a net source of DIP to the adjacent sea, contributing about 200
mol d-1. However, monthly DIP was negative for a large part of the year but highly positive in
August, July and April. These DIP variations conformed to the seasonal trends of macroalgal growth
and decomposition (Viaroli et al. 2001a and Figure 2.15). From March to June, high macroalgal
growth was recorded. Afterwards, a sudden and rapid decomposition phase took place with high rates
of organic matter mineralisation and DIP release. Further Ulva growth occurred in autumn and winter,
with a DIP uptake.
Table 2.16 Monthly mean concentrations of DIP in mmol m3 in the freshwater inputs, lagoonal
system and sea.
DIPvol DIProm DIPgor DIPsys DIPsea
Jan 0.32 2.10 3.71 0.03 0.39
Feb 0.00 0.32 3.06 0.03 0.37
Mar 0.00 0.00 1.94 0.03 0.19
Apr 1.94 0.00 1.45 0.44 0.12
May 0.48 1.94 1.94 0.10 0.09
Jun 0.65 1.13 2.10 0.13 0.35
Jul
0.48 2.58 2.10 1.56 0.11
Aug 0.48 1.94 2.10 2.27 0.34
Sep 0.48 0.81 1.77 0.06 0.27
Oct 0.00 1.45 1.94 0.15 0.52
Nov 4.36 5.00 3.06 0.31 0.27
Dec 1.61 4.20 2.10 0.47 0.40
Annual
0.89 1.80 2.27 0.47 0.28
Table 2.17. Monthly mean loads of DIP in mol d-1 in the Sacca di Goro; estimates of DIP in mol
d-1 for the whole lagoon and in mmol m-2 d-1 for the unit of surface area.
V(vbg) DIPvol Vrom DIProm Vgor DIPgor VR DIPR VX DIPX
DIP
DIP
mol d-1 mmol
m-2 d-1
Jan
116 347 768 -153
6768
-7846
-0.30
Feb
0 29 710
-127
6732
-7344
-0.28
Mar
0 0 332
-62
3568
-3838
-0.15
Apr
1053 0
976 -366
-5952
4289
0.16
May
867 21 631 -213
-185
-1121
-0.04
Jun
818 9 4435
-810
2904
-7356
-0.28
Jul
602 34 2167
-1927
-21170
20294
0.78
Aug
765 23 328 -2257
-29143
30284
1.16
Sep
427 45 1310
-287
4221
-5716
-0.22
Oct
0 339
6418
-1458
5994
-11293
-0.43
Nov
1648 625 3614 -491
-712
-4684
-0.18
Dec
2729 1037 2741 -1474
-1239
-3794
-0.15
Annual 754 210 2037
-809
-2428
236
0.01
32
DIN budget
The annual and monthly DIN concentrations in the freshwater inputs, system and sea are indicated in
Table 2.18, DIN inputs and outputs in Table 2.19 and the DIN annual budget shown in Figure 2.12.
The annual average DIN concentration in precipitation was obtained from Mosello (1993). Higher
DIN concentrations were measured in the main freshwater inputs in autumn and winter, whilst the
lowest DIN concentrations in the system and in the sea were measured in summer. The monthly DIN
values were negative for most of the year, except for January when VXDINX was negative.
Table 2.18. Monthly mean concentrations of DIN in mmol m3 in the freshwater inputs, lagoonal
system and the adjacent sea.
DINvol DINrom DINgor DINP DINsys DINsea
Jan
566 332 287 97
52 21
Feb
463 225 266 97
52 52
Mar
355 169 202 97
52 65
Apr
269 153 160 97
28 95
May
104 123 125 97
21 23
Jun
117 113 154 97
6 31
Jul
56 108 126 97
5 9
Aug
54 95 112 97
9 9
Sep
83 89 153 97
7 22
Oct
296 214 151 97
32 51
Nov
351 225 174 97
28 18
Dec
571 584 228 97
24 41
Annual 273 203 178 97
26 36
The main inputs of DIN were from the Po di Volano- Canal Bianco- Giralda system (207x103 mol d-1
as annual average). The sea can be considered as an input of DIN for the system since the output of
56x103 mol d-1 of VR was lower than the input of 174x103 mol d-1 estimated from VX fluxes. Thus a net
input of about 120x103 mol d-1 of DIN was estimated from the sea. The lagoon acted as a sink of DIN
with a mean DIN of -20 mmol m-2 d-1.
Table 2.19. Monthly mean loads of DIN in 103 mol d-1 in the Sacca di Goro; estimates of DIN in
103 mol d-1 for the whole lagoon and in mmol m-2 d-1 for the unit of surface area.
V(vbg)
Vrom
Vgor
VPDINP VR
VX
DIN
DIN
DINvol
DINrom
DINgor
DINR
DINX
103 mol d-1 mmol
m-2 d-1
Jan
204 55 59 0 -27 -583
292 11.23
Feb
146 20 62 1 -33 0 -196
-7.54
Mar
119 11 35 1 -33 290 -423
-16.27
Apr
146 15 108 2 -81 1246 -1436
-55.23
May
188 1 41 3 -47 37 -223
-8.58
Jun
147 1 325 4 -64 330 -743 -28.58
Jul
70 1 130 5 -16 58 -248
-9.54
Aug
86 1 17 1 -16 0 -89 -3.42
Sep
74 5 113 4 -25 302 -473 -18.19
Oct
186 50 500 13 -180 308 -877 -33.73
Nov
133 28 205 2 -39 -178 -151 -5.81
Dec
968 144 298 11 -111 301 -1611
-61.96
Annual 207 28 158 4 -56 174 -515 -19.81
33
Dissolved organic nutrients budgets
Monthly dissolved organic phosphorus and nitrogen concentrations for the rivers, Sacca di Goro
lagoon and adjacent Adriatic Sea are summarised in Tables 2.20 and 2.22. Estimates of their
concentrations in the freshwater input are available only for the period from April onwards but
excluding October. Direct measurements were conducted only in the Po di Volano River.
Table 2.20. Monthly mean concentrations of DOP in mmol m3 in the freshwater inputs, lagoonal
system and adjacent sea. nd: not detected
DOPvol DOPsys DOPsea
Jan
nd nd 0.05
Feb
nd nd 0.10
Mar
nd 0.02
0.16
Apr
4.03 0.00 0.05
May
7.20 0.61 0.10
Jun
3.14 0.00 0.16
Jul
4.00 1.25 0.11
Aug
5.67 1.27 0.19
Sep
3.98 0.39 0.08
Oct
nd 0.08
0.03
Nov
2.91 0.08 0.11
Dec
2.91 0.08 0.31
Annual 0.16
DOP budget
A higher DOP load estimated at 15x103 mol d-1 was carried by freshwater in May; values of 5-10x103
mol d-1 were estimated for the other months (Table 2.21). These values are considerably higher than
the DIP inputs (1-6x10³ mol d-1, Table 2.17). In May and from July to September, the exchange flow
with the sea was an output of DOP to the system, in contrast to the rest of the year. Considering also
the inputs from the sea, a mean load of about 10x103 mol d-1 of DOP can be estimated, which is twice
the load of DIP estimated in the same way (about 5x10³ mol d-1 as annual average and 4x10³ mol DIP
d-1 for the period investigated for DOP). DOP was negative for the whole period except for the
summer months (July and August). The monthly evolution of DOP follows the trend of DIP
(Figure 2.13) at least for the months where data are available. This indicate that growth and decay of
Ulva spp. affected also the DOP pools: during the growth phase from April to June, Ulva can use DOP
as an additional source of P, probably through enzymatic hydrolysis with phosphatases, while in July
and August the decomposition of macroalgae can release organic dissolved compounds rich in P. The
negative values of DOP calculated for November and December can be related to the second growth
phases of Ulva observed in these months although with densities lower than the spring blooms (Figure
2.15).
For the period under investigation, the system can be considered as a net sink of DOP with a weighted
mean of -0.15 mmol DOP m-2 d-1.
34
Table 2.21. Monthly mean loads of DOP in mol d-1 in the Sacca di Goro Lagoon; estimates of
DOP in mol d-1 for the whole lagoon and in mmol m-2 d-1 for the unit of surface area.
VQ DOPvol VR DOPR VX DOPX DOP
DOP
mol d-1 mmol
m-2 d-1
Apr
5291 -78 2046 -7259
-0.28
May
15429 -851 -7770 -6808
-0.26
Jun
10607 -135 1056 -11528 -0.44
Jul
9192 -1468
-17812
10088
0.39
Aug
9996 -1189
-17516
8709
0.33
Sep
6702 -592 -1608
-4502
-0.17
Oct
nd -643
2106
-1463
Nov
4901 -220 1780 -6461
-0.25
Dec
9449 -704 4602 -13347 -0.51
Mean
-0.15
DON budget
DON loads from freshwater source ranged from 7-80x104 mol d-1 with a peak in December. VXDONX
was negative for the whole period indicating that the system was exporting DON to the sea (Table
2.23). The DON input to the system was estimated as 3x10⁵ mol d-1, whilst DIN was about 6x10⁵ mol
d-1 assuming a contribution by the sea of about 30% (2x10⁵ mol d-1). DON was positive for the whole
period except for December. The trend was opposite to the DIN (Figure 2.14). To some extent, the
DIN correlated with the macroalgal life cycle. During the growth season, the large DIN uptake was
inversely related to DON, which is typical of macroalgal tissues performing an high photosynthetic
rate. In the subsequent decay phase, no inorganic nitrogen was present in the algal tissue so a large
release of DON was expected. For the whole period investigated, the system can be considered as a net
source of DON with a weighted mean of DON of +7.8 mmol m-2 d-1
Table 2.22. Monthly mean concentrations of DON in mmol m3 in freshwater inputs, lagoonal
system and the adjacent sea. nd: not detected
DONvol DONsys DONsea
Jan
nd Nd 11
Feb
nd Nd 14
Mar
nd 3 18
Apr
121 24 9
May
166 48 22
Jun
129 47 14
Jul
122 49 22
Aug
41 37 12
Sep
82 48 1
Oct
nd 29 2
Nov
255 30 2
Dec
255 31 4
Annual
11
35
Table 2.23. Monthly mean loads of DON in 103 mol d-1 in the Sacca di Goro; estimates of DON
in 103 mol d-1 for the whole lagoon and in mmol m-2 d-1 for the unit of surface area.
nd: not detected
VQ DONvol VR DONR VX DONX DON
DON
103 mol d-1 mmol
m-2 d-1
Apr 159 -22 -279
142
5.46
May 356 -74 -481
199
7.65
Jun 435 -103 -436 104
4.00
Jul
281 -81 -394
194
7.46
Aug 72 -42
-378
348
13.38
Sep
138 -41 -945
848
32.62
Oct
Nd -66 -437
Nov 429 -27 -498
96
3.69
Dec 828 -59 -478
-291
-11.19
Stoichiometric calculations of aspects of net system metabolism
The LOICZ Biogeochemical Model assumes that organic matter production or mineralisation (Net
Ecosystem Metabolism :NEM or p-r) can be directly estimated from DIP and C:P ratio of primary
producers (NEM= -DIP x C:P). C:N:P ratios of macroalgae were directly measured in 1992 (Table
2.24). When macroalgae were not present in the lagoon, the C:N:P ratio for phytoplankton (Redfield
1961) was used. NEM (Table 2.24) related to the seasonal evolution of macroalgae (Figure 2.15).
Positive values of NEM were measured in the whole period (except for April, July and August) with
peaks of 110 mmol m-2 d-1 in June, during the growth phase of Ulva spp (density up to 420 g DW m-2)
when production largely exceeded respiration. In that period, the surficial sediment was oxidised due
to high oxygen concentration in the water column and DIP was actively adsorbed (Giordani et al.
1997). A luxury DIP uptake by macroalgae was also often recorded (Viaroli et al. 1996b). As a
consequence the NEM can undergo unpredictable changes. Negative NEM values down to -120 mmol
m-2 d-1 were detected in July and August, after the collapse of macroalgae when the decomposition of
Ulva biomasses supported high mineralisation rates with net release of DIP, DOP and DON. The
superficial sediment was also reduced due to the anoxic conditions, with a further release of DIP. The
negative NEM value of April was not related to this general trend.
Table 2.24. C:N:P molar ratio and NEM (p-r), DINexp, (nfix-denit), DN , DNexp, (nfix-denit)*
(calculated considering both organic and inorganic dissolved forms). Unit : mmol m-2 d-1
C N P
(p-r)
DINexp (nfix-denit) DN DNexp (nfix-denit)*
Jan
106 16 1 31.80
-4.80 16.03
Feb
106 16 1 29.68
-4.48 -3.06
Mar
323 37 1 48.44
-5.52 -10.75
Apr
600 42 1 -96.02
6.70 -61.93 -49.8 -5.0 -44.7
May
644 40 1 25.75
-1.59 -6.99
-0.9
-11.9 11.0
Jun
399 28 1 111.61 -7.76 -20.82 -24.6 -20.0 -4.6
Jul
113 13 1 -88.44
9.98 -19.52 -2.1
15.0 -17.0
Aug
106 16 1 -122.96 18.56 -21.98 10.0
23.8 -13.9
Sep
106 16 1 23.32
-3.52 -14.67 14.4
-6.2 20.7
Oct
106 16 1 45.58
-6.88 -26.85
Nov
106 16 1 19.08
-2.88 -2.93
-2.1
-6.9 4.8
Dec
106 16 1 15.90
-2.40 -59.56 -73.2 -10.6 -62.6
Annual
3.38 -0.34 -19.45
In the Sacca di Goro Lagoon, growth and decay of macroalgae seemed to affect organic and inorganic
dissolved N and P budgets although DIP was not only related to the balance between production and
36
respiration processes but also depended on water-sediment fluxes, as observed in real and simulated
dystrophic crises (Giordani et al. 1996; Viaroli et al. 1996a).
From stoichiometric arguments, the Sacca di Goro can be considered as having been slightly
autotrophic in 1992, with a NEM annual weighted mean of 3.4 mmol m-2 d-1.
DINexp is the DIN variation expected on the basis of organic matter production and mineralisation and
was calculated as the product of DIP by the N:P ratio of the dominant primary producer. Net
nitrogen fixation minus the denitrification (nfix-denit) was calculated from the difference between the
observed and expected DIN values. Either the LOICZ concept of (nfix-denit) does not seems to be
applicable for the Sacca di Goro, or perhaps an important process affecting the N cycle has not been
considered, because (nfix-denit) values are an order of magnitude higher than the upper values
expected for coastal systems (Table 2.24)- they range from -62 to +16 mmol m-2 d-1. These values are
in agreement with those estimated by Cattaneo et al. (2001) for a ten-year period for the Sacca di Goro.
Even when the dissolved organic nitrogen fraction is included (see, for example, the budget of Tomales
Bay, USA: http://data.ecology.su.se/MNODE/North%20America/ TOMALES.HTM, the problem
remains, in that the observed non-conservative flux of total dissolved N (DN = DIN+DON) is still
high, ranging from -43 to +2 mmol m-2 d-1 (Table 2.24). The non-conservative N flux which can be
calculated from the N:P ratio of the non-conservative P flux (DNexp =(DIP + DOP) x N/P ratio)
ranged from -20 to 24 mmol m-2 d-1. According to the stoichiometric arguments, the discrepancy
between observed and expected DN would be a measure of apparent (nfix-denit) but range from -62 to
20 mmol m-2 d-1 which is a very wide interval. Even if no measurement of N fixation were made in
Sacca di Goro we can consider this process quite slow in a marine system (lower than 1 mmol m-2 d-1)
and direct measures of denitrification found values around 2.5 mmol m-2 d-1 even with peaks of 35
mmol m-2 d-1 in some spots (Bartoli et al. 2001).
109
108
107
)
/d3
(m
AS
F 106
105
104
1980
1982
1984
1986
1988
1990
1992
1994
1996
1998
2000
Year
Figure 2.9. Exchange fluxes calculated following three different procedures. Hollow points
represent the calculations based on the salt budgets (LOICZ), continuous blue line represent the
calculation based on Yanagi's equation (Yanagi 2000b) using Umean value from Ciavola at al. (2000),
discontinuous lines represent the calculation using standard deviation, i.e. U=Umean ▒ U; continuous
red line represent the daily exchange flows based on COHERENS 3D model (Marinov et al. 2004).
37
VP=40
VE=28
V
Q= 1976
SR= 26.64
Sacca di Goro
VR = -1988
SQ = 0
Areasys = 26 km2
Vsys = 39 x 106 m3
Ssys = 25 psu
Ssea= 28.29
sys = 2 d
VX*= 17717
Figure 2.10. Water and salt budgets for the Sacca di Goro for 1992. Water fluxes are expressed in
103 m3 d-1 and salinity in PSU. VX* is estimated from Marinov et al. (2004).
DIPP=0*
VPDIPP=0*
VQ DIPQ = 3000
VRDIPR= -809
Sacca di Goro
DIP
DIP
R = 0.38
sys = 0.47 mmol m-3
DIP
DIPsea= 0.28
sys = 236 mol d-1
DIPsys = 0.01 mmol m-2d-1
VXDIPX= -2428
Figure 2.11. DIP budget for the Sacca di Goro. Concentrations are in mmol m-3 and fluxes in mol
d-1. * assumed.
38
DINP=97
VPDINP=4
VQ DINQ = 393
VRDINR= -56
Sacca di Goro
DIN
DIN
R = 31
sys = 26 mmol m-3
DIN
DIN
sys = -515 x103 mol d-1
sea= 36
DINsys = -19.8 mmol m-2d-1
VXDINX= 174
Figure 2.12. DIN budget for the Sacca di Goro. Concentrations are in mmol m-3 and fluxes in 103
mol d-1.
1.4
1.2
1.0
DIP
DOP
0.8
0.6
0.4
0.2
0.0
-0.2
-0.4
-0.6
Jan Feb Mar Apr May Jun
Jul
Aug Sep Oct Nov Dec
Figure 2.13. DIP and DOP estimates in mmol m-2 d-1 for the Sacca di Goro in 1992. Values of
DOP for January, February, March and October are not available.
39
40
DIN
20
DON
0
-20
-40
-60
-80
Jan Feb Mar Apr May Jun
Jul
Aug Sep Oct Nov Dec
Figure 2.14. DIN and DON estimates in mmol m-2 d-1 for the Sacca di Goro for 1992. Values
of DON for January, February, March and October are not available.
500
NEM
400
Ulva
300
200
100
0
-100
-200
Jan Feb Mar Apr May Jun
Jul
Aug Sep Oct Nov Dec
Figure 2.15. Density of Ulva spp. (g dw m-2) and NEM (mmol m-2 d-1) in the Sacca di Goro in
1992.
40
2.3
Pialassa Baiona Lagoon, Ravenna
Massimo Ponti1, Saverio Giaquinta2 and Marco Abbiati1
1Dipartimento di Biologia Evoluzionistica Sperimentale, Centro Interdipartimentale di Ricerca per le
Scienze Ambientali in Ravenna, UniversitÓ di Bologna.
2Servizio Sistemi Ambientali, ARPA Emilia-Romagna Sezione di Ravenna
Summary
The Pialassa Baiona is an eutrophic lagoon located along the Adriatic coast of Italy. A single-box,
single-layer LOICZ model was applied to data from the year 2000 to estimate the biogeochemical
budget of the Pialassa Baiona. Water turnover time in the lagoon was estimated at 3 days. Both annual
mean DIP and DIN were negative, indicating that the system acts as sink of both DIP and DIN.
Stoichiometric calculations assumed nutrient rations in both Redfield proportions (C:N:P=106:16:1)
and in proportions appropriate for macroalgae (C:N:P=335:35:1). The latter seems more appropriate
for the Pialassa Baiona, which is affected by seasonal blooms of macroalgae. Overall the lagoon can
be considered as "autotrophic", with a net ecosystem metabolism (p-r) varying from 1.0 to 3.0 mmol C
m-2 d-1 considering Redfield or macroalgal ratios respectively. Denitrification dominated over nitrogen
fixation since (nfix-denit) was negative in both cases.
Figure 2.16. Map of the Pialassa Baiona Lagoon with the major water inputs, main inner
channels and ponds, power plants and industrial area indicated (coordinate system: UTM32T
ED50).
41
Study area description
The Pialassa Baiona Lagoon is located along the northern Adriatic Italian coast, between Ravenna
Harbour and the mouth of the Lamone River (44.47░-44.53░N 12.24░-12.27░E, European Datum 1950;
Figures 2.16 and 2.17). Artificial embankments divide the lagoon into several shallow water ponds
connected by channels. Water exchange of some ponds is controlled by adjustable dams. The inner
channels converge into a main channel connected to the sea through the shipway Candiano Channel
(Ravenna Harbour). Total area is 11.80 km2, including the embankments. The average depth varies
from 0.5 m in the shallow areas to 3 m in the channels with a tidal range varying from 0.3 to 1 m,
excluding extreme events. Tides cause large variations in water levels and vast shallow areas emerge
during low tides. On average, the water covers an area of 9.862x10⁶ m2 and the total water volume is
approximately 8.893x10⁶ m3, shared equally between ponds and channels.
The climate of the region is mediterranean with a continental influence. Precipitation is approximately
600 mm per year, with late spring and autumn peaks. The lagoon receives freshwater inputs from five
main channels (Figure 2.16). Taglio della Baiona and Fossatone collect the water released from the
wet woodland Punte Alberete originated from Lamone River. Via Cerba, Canala Ł Valtorto and Via
Cupa drain a watershed of 264 km2, including urban (9%) and agricultural (87%) areas. The water
flow in two channels is controlled by pumping stations. Furthermore, the lagoon receives freshwater
inputs from treatment plants of urban and industrial wastewater and also saltwater inputs from two
power plants that draw water as coolant from the Candiano Channel to the lagoon. Sewage treatment
facilities and power plants are located in the last part of Via Cupa channel and along the south side of
the lagoon.
The lagoon is characterized by large areas of muddy bottom with variable proportions of clay/silt and
organic matter. A pinewood stretches all along the western edge of the lagoon. Sandy sediments are
abundant close to the relict dunes. The dunes are covered with halophile vegetation of Salicornia and
Arthrocnemum. Embankments are covered with halophile herbaceous vegetation such as Agropyron
pungens, with submerged meadows of Ruppia cirrhosa and Potamogeton pectinatus. There are
reedbeds of Phragmites australis, marginal areas with Juncus maritimus and J. acutus wet meadows
(Corbetta 1990; Corticelli et al. 1999). The most abundant species in the phytoplankton is the diatom
Skeletonema costatum. Diatoms prevail from autumn to spring while the abundance of dinoflagellates
rises in summer. Occasionally blooms of diatoms or cyanobacteria occur. The lagoon is affected by
anthropogenic eutrophication, which causes extensive growth of seaweeds, especially the
chlorophyceans Ulva, Enteromorpha and the rhodophyceans Gracilaria. Macroalgal growth and
phytoplankton blooms are responsible for the events of anoxia and dystrophy that occasionally occur in
summer (Boni 1990).
The prevalent human activities in the area include recreational and professional fishing, mollusc
harvesting (mainly of the Manila clam, Tapes philippinarum), hunting, hiking and canoeing (Figure
2.18).
Following the LOICZ guidelines (Gordon et al. 1996), an annual single-box, single-layer model was
applied to the data collected in the year 2000. A single box model was adopted despite the apparent
complexity of the Pialassa Baiona lagoon because the inner dynamics of water and nutrients are not
well defined. Meteorological data for the study period were supplied by the Regional Agency for
Environmental Protection (ARPA Emilia-Romagna 2001). Flux of potential evaporation was
estimated by Hargreaves' equation (Hargreaves 1975) as recommended by Shuttleworth (1993). Data
concerning freshwater flow and nutrient concentration were obtained from Angelini and Strumņa
(1994) and Giaquinta (2001). Direct measures of flows and nutrient concentrations were compared to
theoretical loads based on watershed characteristics (e.g., surface, inhabitants, human activities,
industrial plants), load coefficients and rainfall. Measured and theoretical loads were in good
agreement. Salinity and nutrient concentrations of adjacent coastal waters were obtained from the
annual report of the Struttura Oceanografica Daphne (ARPA Emilia-Romagna 2001). Salinity and
42
nutrient concentrations of the system were provided by the Department of Public Health of the Local
Health Service Agency (AUSL, Ravenna).
Water and salt balance
Water inputs and outputs are summarized in Table 2.25. The main freshwater input is due to runoff
from the watershed. Its volume is comparable to the sewage inputs. The contribution of the channels
is reported in Table 2.26 while the different types of sewage are reported in Table 2.27. Groundwater
flow was negligible compared to the other freshwater inputs and was assumed to be zero in the budget.
Direct precipitation during the study period was estimated to be 574 mm, equivalent to 18.5x10³ m3 d-1
over the whole area. Evaporative loss is about twice the inflow from direct precipitation. A high
unidirectional input of saltwater was provided by cooling water from two power plants. To balance the
water inputs a net water output of 1292x103 m3 d-1 to the sea was calculated (VR).
Table 2.25. Mean flow (V) and salinity (S) of the different water sources.
Sources V
(103 m3 d-1) S
(psu)
Runoff 113 0
Sewages 97 0
Atmosphere 18.5
0
Evaporation -36
0
Power plants
1,099
30.32
System
27.96
Sea (residual)
-1292
29.14
Sea (exchange)
1828
Sea 30.32
In the lagoon, the salinity varies from 0 psu in areas close to the pinewood to 37 psu in the areas with
reduced water exchange during the summer. Average salinity during the study period, taking into
account the water volumes of the different areas, was about 27.96 psu. Salinity of the seawater in front
of the lagoon is low (average during study the period 30.32 psu) due to the Po River influence. Salinity
of the saltwater provided by the power plant was assumed equal to seawater. Using the salinity
gradient between the lagoon system and the sea and other inputs of saltwater, the exchange flux (VX)
was calculated at 1,828x103 m3 d-1 and the estimated average water residence time was about 3 days
(Figure 2.19). This average time does not consider the water circulation within the ponds and
channels; water turnover time is much longer in areas with reduced water exchange and only a tidal
cycle (about 12 hours) in the main channels.
Budgets of non-conservative materials
The relative contributions of the various water flows providing loads of dissolved phosphorus and
nitrogen as runoff and sewage are reported in Tables 2.26 and 2.27 respectively. All the estimated
loads of dissolved inorganic phosphorus (DIP) and nitrogen (DIN) to the system are summarized in
Table 2.28.
DIP balance
Sewage represents the main phosphorus input, followed by cooling water from power plants and then
by runoff from the watershed (Figure 2.20). Atmospheric phosphorus inputs were assumed to be zero
as no data on dry and wet deposition were available. The net phosphorus budget (DIP) was low and
reached values of -9 Ąmol m-2 d-1, equivalent to -90 mol d-1 overall (Figure 2.19). Negative DIP
indicates that the lagoon acts as a net sink of DIP.
43
Table 2.26 Mean runoff (V; 103 m3 d-1) and nutrients flow (VDIP, VDIN; mol d-1) from western
channels, excluding sewages located in the last part of Via Cupa channel.
* approximated to the closest 10 mol d-1 step.
Channels V
VDIP
VDIN
Taglio della Baiona
9
49
277
Fossatone 9 29
1215
Via Cerba
18
65
3016
Canala/Valtorto 26
244 12309
Via Cupa
51
830
39836
Total
113
1220*
56650*
Table 2.27 Mean sewage flow (V; 103 m3 d-1) and nutrient loads (VDIP, VDIN; mol d-1) from
treatment plants of urban, industrial and cottage wastewaters.
* approximated to the closest 10 mol d-1 step.
Sewage V VDIP
VDIN
Civil (treated)
47
1130
24043
Industrial (treated)
49
2660
47986
Fishing cottage
~ 0
18
195
Total 97
3810*
72220*
Table 2.28 Average nutrient concentrations (DIP, DIN; mmol m-3) and loads (VDIP, VDIN; mol d-1)
for the various sources. According to the LOICZ guidelines, residual sea DIP and DIN
concentrations are assumed as average between sea and lagoon concentrations.
* approximated to the closest 10 mol d-1 step.
Sources DIP
DIN
VDIP
VDIN
Runoff 10.74
499.87
1220
56650
Sewage 39.38
746.78
3810
72220
Atmosphere
0 97.00
0 1790
Evaporation
0 0 0 0
Power plants
2.58
49.97
2840
54920
Sea (residual)
1.70
35.07
-2200
-45300
Sea (exchange)
-5580
-46820
Lagoon system 3.22
47.88
Sea 0.17
22.26
DIN balance
Sewage is also the main nitrogen input, followed by runoff from the watershed and cooling water from
power plants (Figure 2.20). Atmospheric nitrogen inputs were estimated from the average DIN
concentration in the rainwater (97 mmol m-3) reported by Mosello (1993). The net nitrogen budget
(DIN) was high and reached values of -9.48 mmol m-2 d-1 equivalent to -93,500 mol d-1 (Figure 2.21).
Negative DIN indicates that the lagoon acts as a net sink of DIN.
Despite the function of the lagoon as a sink of DIP and DIN, a surplus of nutrient terrestrial inputs is
exported to the sea. These flows can be estimated by summing residual and exchange flows reported
in Table 2.28. Overall, the exports accounts for 7,780 mol d-1 of DIP and 92,120 mol d-1 of DIN,
corresponding to 88 tonnes y-1 and 472 tonnes y-1, respectively. These values agree with estimates on
theoretical bases by Marchetti and Verna (1992) for the contribution to the northern Adriatic
eutrophication from the whole Candiano basin (including the harbour channels, the connected small
Piomboni Lagoon and their watersheds).
44
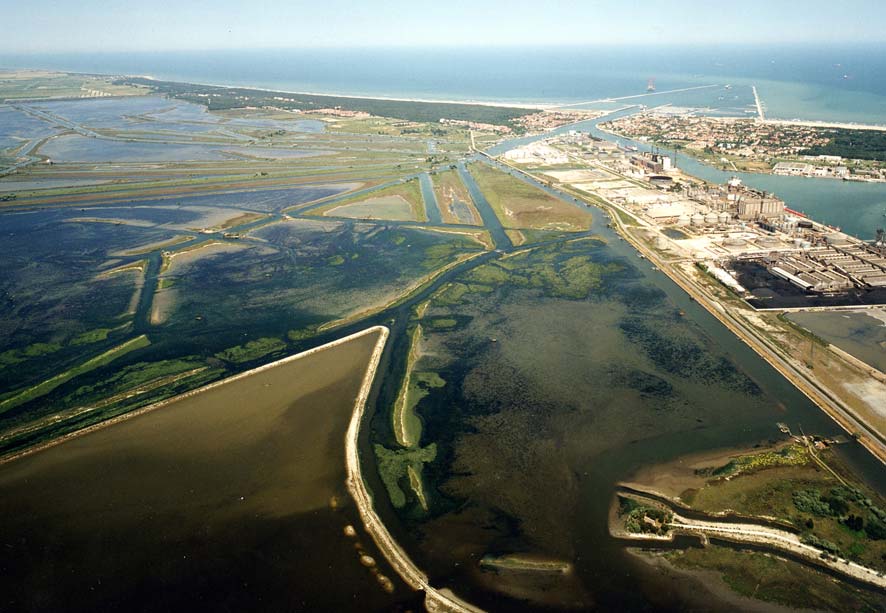
Stoichiometric calculations of aspects of net system metabolism
On an annual basis and in accordance with the assumptions of the model, the lagoon can be considered
an autotrophic system because the negative DIP values calculated can be considered as an estimate of
net DIP assimilation associated with organic matter production. This production could be related to the
development of dense beds of floating macroalgae during the summertime and the recurring
phytoplankton blooms. To consider these phenomena, both the phytoplankton Redfield ratio
(C:N:P=106:16:1) and the ratio for macroalgae (C:N:P=335:35:1) reported by Atkinson and Smith
(1983) were used in the stoichiometric calculations (Table 2.29). Under these assumptions the net
ecosystem metabolism (NEM) can be estimated to be in the range between 0.97 and 3.06 mmol C m-2
d-1, depending on whether calculations are based on phytoplankton or macroalgae as dominant primary
producers. The latter seems more appropriate for the Pialassa Baiona, which is affected by seasonal
blooms of macroalgae, especially in the south side of the lagoon due to the location of the major
nutrient inputs.
Table 2.29. Results of the stoichiometric calculations (mmol m-2 d-1).
Hypothesis NEM
DINexp (nfix-denit)
Phytoplankton 0.97 -0.15
-9.33
Macroalgae 3.06 -0.32 -9.16
The difference between the observed and expected DIN, based on the N:P ratio, was considered to be
the net ecosystem nitrogen fixation minus denitrification (nfix-denit). Negative values using either
phytoplankton or macroalgae nutrient ratios suggest that denitrification losses dominate over nitrogen
fixation inputs (Table 2.29). The relatively high values obtained can be explained by high benthic
respiration rates. However, these results should be considered with caution since they not take into
account the heterogeneity of the lagoon system.
Figure 2.17. View of the Pialassa Baiona Lagoon (photo by Biserni).
45
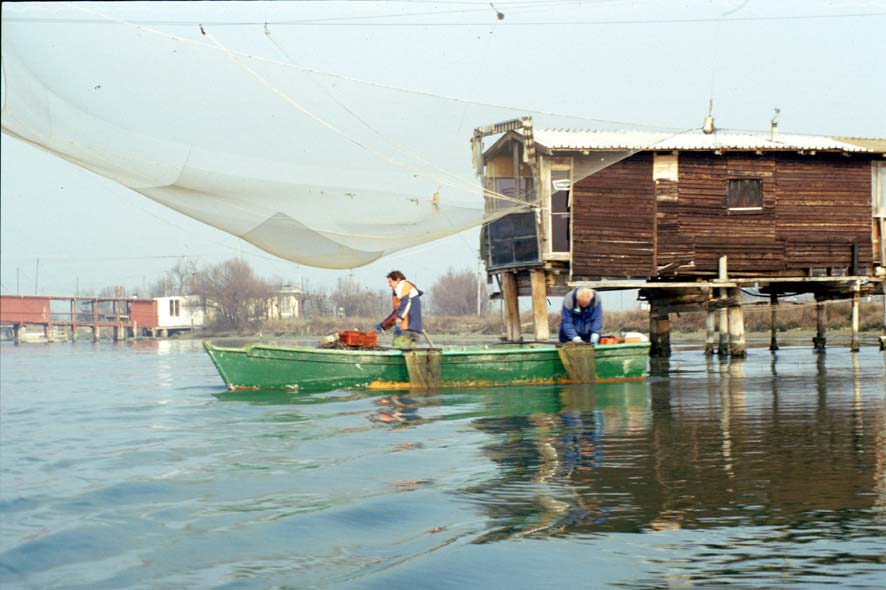
Figure 2.18. Fishing activities in the Pialassa Baiona Lagoon.
VP = 18.5
VE = -36
VQ = 113
SR = 29.14
VQSQ = 0
Pialassa Baiona
VRSR = 37.6
VO1 = 97
VR = -1292
Areasys = 9.862 106 m2
Ssea = 30.32
VO1SO1 = 0
Vsys = 8.893 106 m3
V
Ssys = 27.96
O2 = 1099
VX = 1828
sys = 3 d
VO2SO2 = 33.3
Figure 2.19. Steady-state water and salt budgets for the Pialassa Baiona Lagoon.
P = precipitation; E = evaporation; O1 = sewage; O2 = power plants; Q = runoff; X = exchange; R =
residual. Units: water fluxes in 103 m3 d-1; salt fluxes in 106 psu m3 d-1; salinity in psu.
46
VDIP
14%
36%
Sources
48%
Runoff
34%
16%
Powe
Pow r plants
Atmo
m spher
o
e
VDIN
Sewa
Sew ge
1%
Civil
Indust
n
rial
r
30%
30
13%
39%
30%
26%
Figure 2.20. Relative contribution of the different water inputs to the Pialassa Baiona Lagoon
budgets of DIP and DIN.
DIPP = 0*
VR DIPR = -2200
V
Q DIPQ = 1220
Pialassa Baiona
DIP
DIP
R = 1.7
sys = 3.22
DIP
DIPsea = 0.17
sys = -90 mol d-1
VO1 DIPO1 = 3810
DIPsys = -9 Ąmol m-2d-1
VX DIPX = -5580
VO2 DIPO2 = 2840
Figure 2.21. Steady-state DIP budget for the Pialassa Baiona Lagoon. O1 = sewage; O2 = power
plants; Q = runoff; X = exchange; R = residual. Units: concentrations in mmol m-3, loads in mmol d-1.
* = assumed.
47
DINP = 97 VP DINP = 1790
VQ DINQ = 56650
VR DINR = -45300
Pialassa Baiona
DIN
DIN
R = 35.07
sys = 47.88 mmol m-3
DIN
DIN
sea = 22.26
sys = -93.5 x 10³ mol d-1
VO1 DINO1 = 72220
DINsys = -9.48 mmol m-2d-1
VX DIPX = -46820
VO2 DIPO2 = 54920
Figure 2.22. Steady-state DIN budget for the Pialassa Baiona Lagoon. O1 = sewage; O2 = power
plants; Q = runoff; X = exchange; R = residual. Units: concentrations in mmol m-3, loads in mmol d-1.
48
3.
SOUTH-EASTERN ITALIAN COASTAL SYSTEMS
3.1 Lagoon
of
Lesina
Elena Manini1, Paolo Breber1, Raffaele D'Adamo1, Federico Spagnoli1, Roberto Danovaro2
1Istituto di Scienze Marine, Sezione Ecosistemi Costieri e Lagunari, Consiglio Nazionale delle
Ricerche (CNR), Lesina (Foggia)
2 Dipartimento di Scienze del Mare, UniversitÓ Politecnica delle Marche, Ancona
Study area description
The Lagoon of Lesina is located along the southern Adriatic coast (Puglia region, Italy) on the northern
side of the Gargano promontory (41.88░ N; 15.45░'E) between the Fortore River and Rodi Garganico
(Figure 3.1). This lagoon has an extended and narrow shape, elongated in the east-west direction and
is connected with the Adriatic Sea by means of natural and artificial channels interspersed with sand-
dunes. The economic relevance of this lagoon is mostly related to extensive fish farming. It is also
internationally known as a breeding area for many migratory bird species. The ecosystem covers an
area of 51.5 km2 with an average depth of 0.8 m and a volume of 41.2x10⁶ m3. The lagoon
communicates with the sea through two canals: Schiapparo on the eastern side and Acquarotta on the
western side. The western area of the lagoon is characterized by freshwater inputs receiving both
domestic and agricultural effluents.
ADRIATIC SEA
Acquarotta Canal
Schiapparo Canal
Lauro Canal
LESINA
Figure 3.1. Location and sketchmap of the Lagoon of Lesina.
Since 1997, the flow of the Schiapparo canal has been partially reduced by wooden barriers, while the
Acquarotta canal has been completely closed by a sand barrier. These barriers prevented adequate
water exchange and the free passage of fishfry within and into the lagoon until they were removed in
April 2000. Protective grids (10 mm) were deployed to retain fish within the lagoon. Numerous small
fish and larvae of other species are now visible near these structures indicating a massive immigration
from the sea.
49
The south-eastern side of the lagoon receives freshwater inputs, with seasonal peaks during the winter
rainfall period. The canals collect agricultural drainage water from two pumping stations located south
of Lesina where the land is lower than mean sea level. No freshwater inputs occur in the south-western
part of the lagoon, which only receives water from an intensive aquaculture farm (3 km from the
lagoon), in which both freshwater (Cyprinus sp.) and marine (Anguilla anguilla) fish are reared. The
moderate freshwater inputs and water exchanges with the sea suggest that the hydrological balance in
the Lagoon of Lesina is strongly affected by atmospheric inputs.
The Lagoon of Lesina is eutrophic; nutrient concentrations were influenced by the reduced water
exchange after the closure of the canals, which were re-opened after April 2000. The lagoon exhibits
strong seasonal variations of physical factors such as temperature (ranging from 7░C in winter to 26░C
in summer) and salinity (between 11 and 34 psu); moreover, the western part of the lagoon generally
exhibits higher salinity values than the eastern area.
Values of physical and chemical parameters of the lagoon were used to estimate seasonal and annual
budgets, applying the one-box one-layer LOICZ model for the period from July 1998 to June 1999.
Water samples were collected at 29 stations during the POP Project (Progetto Operativo Plurifondo, a
programme for the reintroduction of the algae Gracilaria verrucosa). Station locations were defined to
cover the entire lagoon. Data on freshwater inputs and water flows were obtained from from Nista
(1994), and data on nutrient concentrations were obtained from ASL FG-3 (Azienda Sanitaria Locale,
Foggia 3). Rainfall measurements were obtained from the meteorological station of Lesina (Consorzio
Bonifica Capitanata, Foggia) and evaporation was calculated using the Hargreaves equation
(Hargreaves 1975). In 1998-99, precipitation was very low, particularly in the summer period (0.5 mm
d-1); in these months, the closure of the canals also caused elevated evaporation rates (3.7 mm d-1), with
consequent hypersalinity of the western area of the lagoon (up to 44 psu) and reduced water depth.
This caused a massive growth of the macroalga Valonia utricularis. Nutrient concentrations were
influenced by the freshwater input, resulting in particularly high concentrations during the rainy period
(0.17 and 29.3 ĄM DIP and DIN, respectively); lower values were measured in the summer period
(0.09 and 4.3 ĄM DIP and DIN, respectively).
Primary producers include phytoplankton and the littoral macrophytes Valonia utricularis, Zostera
noltii, and Ruppia sp. Data collected in this study for the Lagoon of Lesina indicated the presence of a
primary production strongly phosphorus-limited, as suggested by the very high N/P ratios (N:P=199 on
annual average). Therefore the lagoon acts as a sink for dissolved inorganic nitrogen (DIN).
Water and salt balance
For the Lagoon of Lesina, the major freshwater inputs are: five canals (Lauro, S. Nazzario, Caldoli,
Mascolo and Mascione; VQ), two pumping stations (Palude Grande and Lauro; VO) and direct
precipitation into the system (VP). Evaporation (VE) was the only freshwater output from the lagoon.
In the period investigated, direct rainfall to the lagoon was 427 mm y-1 with a strong seasonal pattern
with minima in the summer period when evaporation largely exceeded precipitation (Table 3.1).
Figure 3.2 illustrates the annual water and salt budgets of the lagoon. Net export of water from the
lagoon to the sea, indicated by the negative residual flow (VR), was observed during the entire period.
The highest negative residual flow values were obtained in winter and in autumn during the rainy
period. The Vx values, which indicate the mixing volume between the lagoon and the sea also showed
a maximum in the autumn season. The mean salinity of the system remained low due to moderate
mixing between seawater and freshwater, especially in the eastern parts of the lagoon. The estimated
water residence time was 100 days.
50
Table 3.1. Water flux (precipitation VP, evaporation VE, runoff input VQ, pumping machine input
VO), residual flow (VR), salinity of the lagoon and adjacent sea (SSYST, SSEA), mixing water
volumes between lagoon and sea (VX) and water exchange time () in the Lagoon of Lesina in the
period 1998-1999 (*seasonal data are not available thus mean values were used).
Season VP
VE
VQ
VO
VR
SSYST SSEA
VX
(103 m3 d-1) (psu)
(103 m3 d-1) (days)
Summer
1998
27.7 187.9 98.1* 87.5* -25.4 30.2 36.8 128.9
267
Autumn
1998
150.5 84.0 98.1* 87.5* -252.1 28.6 36.1 1089.1
31
Winter
1998-99 49.1 40.1 98.1* 87.5* -194.6 19.2 37.1 306.6
82
Spring
1999
65.1 200.5 98.1* 87.5* -50.2 19.9 36.8 84.4
306
Annual
average 66.1 128.1 98.1* 87.5* -123.6 23.7 36.7 287.1
100
Budgets of non-conservative materials
DIP balance
The DIP budget for the year 1998-99 is shown in Figure 3.3. On an annual basis, the DIP exchanges
were low, and non-conservative flux of DIP (DIP) was approximately -0.12 mmol m-2 d-1. The main
DIP sources were the moderate inputs from VO that correspond to the two water pumping machines
(Palude Grande and Lauro). DIP concentrations in the system were very low (0.10 ĄM) for most of the
time (Table 3.2). Another reason for low concentration, apart from the low inputs, is that this element
is also sequestered by macrophytes and phytoplankton. DIP values ranged from -0.07 to -0.19 mmol
m-2 d-1 in autumn and summer respectively, when DIP inputs were close to 3400 and 9800 mol d-1.
DIP was negative for the whole investigated period, indicating that the lagoon acts as a net DIP sink
(Table 3.3).
Table 3.2. Nutrient concentrations in the freshwater input, in the Lagoon of Lesina and in the
adjacent sea, 1998-99. Unit: mmol m-3.
*seasonal data are not available thus mean values were used.
Season DIPQ DIPO DIPSYST DIPSEA DINQ DINO DINSYST DINSEA
Summer 1998
44.7 61.5
0.09
0.07
444
1150
4.3
1.5
Autumn 1998
5.0
33.2
0.10
0.13
67
3030
13.6
14.4
Winter 1998-99
17.0 52.0*
0.17
0.10
378
100
29.3
8.0
Spring 1999
12.8 52.0*
0.06
0.03
47
1600
28.6
2.0
Annual average
15.9 52.0
0.10
0.08
156
1363
20.9
5.8
Table 3.3. Seasonal variation of DIP, DIN, DINexp, (nfix-denit) and net ecosystem metabolism
(p-r) in the Lagoon of Lesina, 1998-99). Unit: mmol m-2 d-1
Season
DIP
DIN
DINexp (nfix-denit) (p-r)
Summer 1998
-0.19 -2.79 -3.04 +0.25
+20.1
Autumn 1998
-0.07 -5.23 -1.12 -4.11
+7.4
Winter 1998-99
-0.12 -0.69 -1.92 +1.23
+12.7
Spring 1999
-0.11 -2.75 -1.76 -0.99
+11.7
Annual average
-0.12 -2.50 -1.92 -0.58
+12.7
51
DIN balance
The DIN budget for the year 1998-99 is shown in Figure 3.4. The overall DIN input to the Lagoon of
Lesina was about 20-fold higher than DIP, resulting in a strong imbalance of the N/P ratios.
Ammonium was the dominant form of dissolved inorganic nitrogen in all seasons except winter, when
nitrates were dominant. The lagoon appeared to be a sink for DIN in all seasons (Table 3.3).
Stoichiometric calculations of aspects of net system metabolism
According to the assumptions of the LOICZ biogeochemical model, DIP values allow a direct
estimate of the net energy budget of the system, determining whether the system is a net consumer
(DIP>0 and (p-r)<0) or a net producer (DIP<0 and (p-r)>0) of organic matter. With the assumption
that the system is dominated by phytoplankton and using the Redfield ratio of C:P (106:1) (Redfield et
al. 1963), the system seems to be a net producer of organic matter (Table 3.3).
Using the Redfield ratio of N:P (16:1), the values for (nfix-denit) were positive for summer and winter
and negative for the rest of the year. Considering average behaviour over the whole period, a more
accurate estimation, (nfix-denit) is negative (-0.58 mmol m-2 d-1) indicating that denitrification prevails
over nitrogen fixation processes. The Lagoon of Lesina appeared to be a sink of nitrogen available to
bacterial degradation, re-mineralization and ammonium production. The lagoon also appears to be an
autotrophic system, as indicated by NEM values of +12.7 mmol m-2 d-1 (Table 3.3).
VP=66.1
VE= 128.1
VR= -123.6
VQ= 98.1
Lagoon of Lesina
SR = 30.2
Vsys= 41.2x10⁶ m3
Ssea= 36.7
V
Asys = 51.5 km2
O = 87.5
Ssys = 23.7
= 100 days
VX= 287.1
Figure 3.2. Water and salt budgets for the Lagoon of Lesina in 1998-99. Water fluxes are
expressed as 1000 m3 d-1 and salinity in psu.
52
DIPP= 0
DIPE= 0
DIPQ= 15.9
DIP
Lagoon of Lesina
R= 0.09
VQ DIPQ = 1560
VR DIPR= -11
DIPsys= 0.10 mmol m-3
DIP
DIPsea= 0.08
sys = -6093 mol d-1
DIP = - 0.12 mmol m-2 d-1
DIPO = 52.0
V
VX DIPX= -6
O DIPO= 4550
Figure 3.3. DIP budget for the Lagoon of Lesina in the period 1998-99. Concentrations are in
mmol m-3 and fluxes in mol d-1.
DINP= 0
DINE= 0
DINQ= 156
DINR= 13.35
Lagoon of Lesina
V
Q DINQ = 15.3
VR DINR= -1.7
DINsys= 20.9 mmol m-3
DINsys = -128644 mol d-1
DINO = 1363
DIN = - 2.50 mmol m-2 d-1
VO DINO= 119.3
VX DINX= -4.3
Figure 3.4. DIN budget for the Lagoon of Lesina in the period 1998-99. Concentrations are in
mmol m-3 and fluxes in 103 mol d-1.
53
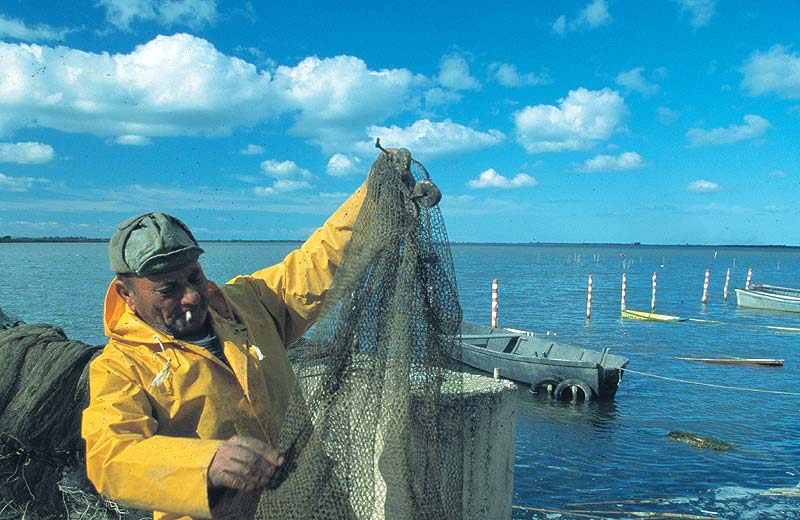
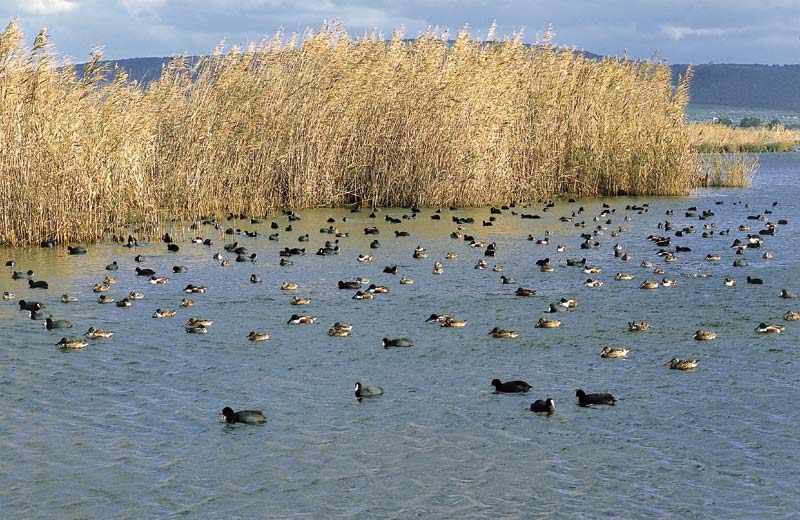
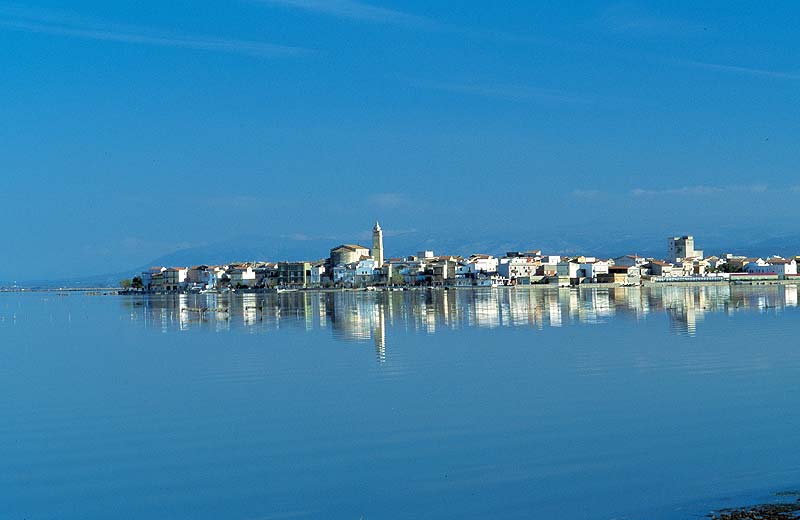
Figure 3.5. Fishing is an important economic activity of the lagoon.
Figure 3.6. Many migratory bird species breed in the lagoon.
Figure 3.7. View of the village of Lesina.
54
3.2
Lagoon of Varano
Elena Manini1, Paolo Breber1, Raffaele D'Adamo1, Federico Spagnoli1, Roberto Danovaro2
1Istituto di Scienze Marine, Sezione Ecosistemi Costieri e Lagunari, Consiglio Nazionale delle
Ricerche (CNR), Lesina (Foggia)
2 Dipartimento di Scienze del Mare, UniversitÓ Politecnica delle Marche, Ancona
Study area description
The Lagoon of Varano is located along the southern Adriatic coast (Puglia region, Italy) on the
northern coast of the Gargano promontory (41.88 ░N; 15.75 ░E; Figures 3.8 and 3.12). It has a rounded
shape and is connected with the Adriatic Sea by means of natural and artificial channels interspersed
with sand dunes. The economic relevance of this lagoon is mostly related to intensive fish and mussel
farming, although recently mussel farming declined and fish became the most intensively exploited
resource (Figure 3.13). The lagoon is an internationally known breeding area for many migratory bird
species. It covers an area of 64 km2, with a perimeter of 33 km. The average depth is 4 m, with
maximum depths of 5 m in the central zone.
ADRIATIC SEA
Capoiale Canal
Varano canal
Acquacult. Coop. Muschiaturo pumping
S. Nicola canal
San Antonio canal
Ospedale canal
Bagno canal San Francesco canal
Figure 3.8. Location and map of the Varano coastal lagoon.
In the last few years, salinity has increased progressively from 21 to 27 psu after a series of mouths
were opened to the sea. The complete hydrological system consists of the lagoon, two artificial canals
connecting the lagoon with the sea (Capoiale and Varano canals located at the north-western and
eastern corner respectively), some freshwater inputs (the main ones are S. Antonino and S. Francesco
Canals and the Muschiaturo drainage pumping station) and some small catchment basins (Bagno,
Irchio, Ospedale and S. Nicola).
Hydrological investigations of the water balance of the lagoon (based on 20 sampling sites) estimated a
freshwater input of approximately 87,000 m3 d-1 with an organic nutrient load mostly originating from
urban and agricultural runoff, fish-farming and livestock rearing activities. The water budget, salinity
55
and nutrient data were determined in the framework of an integrated project for protection and
development of the lagoon (carried out from 1997 to 1999). Data for the total freshwater inputs were
based on the study of Consortium ELTCON (Environmental Characterization of the Lagoon of Varano,
March 1995; see Villani et al. 1999). Rainfall data were collected from a local meteorological station
(Consorzio Bonifica Capitanata, Foggia); and evaporation was calculated using Hargreaves' equation
(Hargreaves 1975).
The trophic conditions of the system are highlighted by relatively low annual mean phosphorus and
nitrogen concentrations (0.16 and 4.60 mmol m-3, respectively), with values comparable to those
typical of oligo-mesotrophic waters.
Water and salt balance
Figure 3.9 shows the water and salt budget for Lagoon of Varano from 1997 to 1999. Because the
lagoon is well-mixed, it was treated as single-box, single-layer system. VQ is the freshwater load from
the canals and VO from the pumping station. Mean annual precipitation was estimated as 138.9x10³ m3
d-1, while evaporation was 159.9 x 10³ m3 d-1. The calculated residual outflow, VR, was -65.1x10³ m3
d-1 (the negative sign indicating a loss from the system).
SQ and SO were 1.8 and 18.0 psu respectively and the mean salinity of the lagoon was 27.0 psu. This is
lower than the salinity of the adjacent sea (36.1 psu) and mixing exchange flow (Vx) was estimated as
183.0x10³ m3 d-1. The salt exported through the residual flow must be replaced through the mixing
volume with the adjacent sea. Due to the low tidal excursion and to the reduced exchange with the
adjacent coastal area, the estimated water residence time was very long: close to 3 years (1032 days).
Budgets of non-conservative materials
DIP balance
Figure 3.10 illustrates the dissolved inorganic phosphorus (DIP) budget from 1997 to 1999,
considering that nutrient loads are delivered largely through the freshwater input (4 and 68 t y-1 of P
and N respectively). The non-conservative DIP flux (DIP) was estimated as the difference between
total inputs and total outputs (residual and exchange fluxes). DIP of the system was -365x103 mmol
d-1 (equivalent to -0.006 mmol m-2 d-1), therefore the system appears to be a net sink for DIP.
DIN balance
Figure 3.11 illustrates the dissolved inorganic nitrogen (DIN) budget from 1997 to 1999. The non-
conservative DIN flux (DIN) of the system was approximately -12.7x10³ mol d-1 (equivalent to -0.20
mmol m-2 d-1). Therefore the system also can be considered a net sink for DIN.
Stoichiometric calculations of aspects of net system metabolism
Stoichiometric estimates of system metabolism can be based on the molar C:N:P ratio of the reactive
organic material of the system. For our estimates, we assumed that this material was plankton, with a
Redfield C:N:P molar ratio of 106:16:1. Stoichiometric analyses of the non-conservative fluxes
indicate that the lagoon can be considered a net producer of organic matter with NEM = +0.64 mmol
m-2 d-1 and also a net denitrifying system with (nfix-denit) = -0.10 mmol m-2 d-1 (Table 3.4).
Table 3.4. DINexp, (nfix-denit) and net ecosystem metabolism (p-r) in Lagoon of Varano for the
period 1997-99.
Parameters Lagoon
of
Varano
DINexp (mmol m-2 d-1) -0.10
(nfix-denit) (mmol m-2 d-1) -0.10
(p-r) (mmol m-2 d-1) +0.64
56
VP=138.9
VE= 159.9
V
VR= 65.1
Q= 71.4
Lagoon of Varano
SR = 31.6
SQ = 1.8
Vsys= 256 x 106 m3
Ssea= 36.1
Asys = 64 x 106 m2
VO = 14.7
Ssys = 27.0
= 1032 days
SO = 18.0
VX= 183.0
Figure 3.9. Water and salt budgets for the Lagoon of Varano in 1997-99. Water fluxes are
expressed in 103 m3 d-1 and salinity in psu.
DIPP= 0
DIPE= 0
DIPQ= 5.07
DIPR= 0.14
Lagoon of Varano
VQ DIPQ = 362
VR DIPR= -9
DIPsys= 0.16 mmol m-3
DIP
DIPsea= 0.12
sys = -365 mol d-1
DIPO = 1.30
DIP = - 0.006 mmol m-2 d-1
VO DIPO= 19
VX DIPX= -7
Figure 3.10. DIP budget for the Lagoon of Varano in the period 1997-99. Concentrations are in
mmol m-3 and fluxes in mol d-1.
57
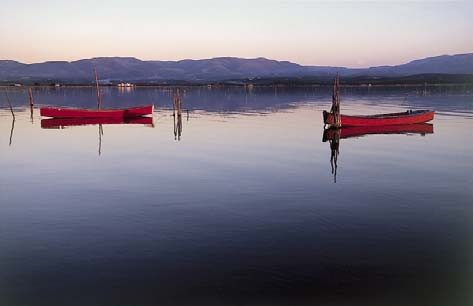
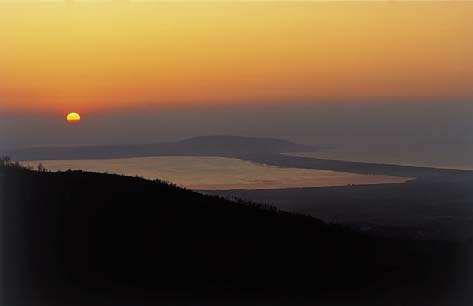
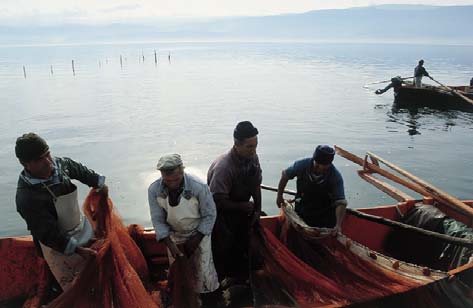
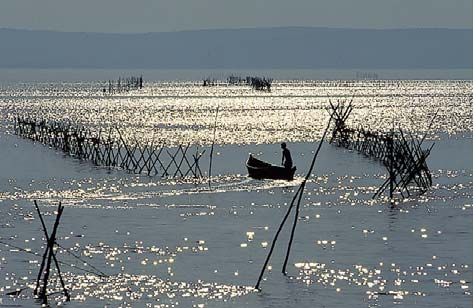
DINP= 0
DINE= 0
DIN
DIN
Q= 171.29
R= 3.37
Lagoon of Varano
V
V
Q DINQ = 12230
R DINR= -219
DINsys= 4.60 mmol m-3
DIN
DIN
sea= 2.13
sys = -12702 mol d-1
DINO = 77.75
DIN = - 0.20 mmol m-2 d-1
VO DINO= 1143
VX DINX= -452
Figure 3.11. DIN budget for the Lagoon of Varano in the period 1997-99. Concentrations are in
mmol m-3 and fluxes in mol d-1.
Figure 3.12. Views of the Lagoon of Varano.
Figure 3.13. Fishing is an important
economic activity of the lagoon.
58
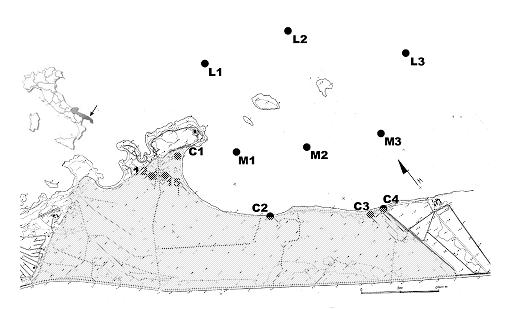
3.3
Torre Guaceto wetland
Alessandro Pomes1, Ilaria Cappello1, Luigi Palmisano1, Maurizio Pinna1, Giuseppe Cal“2, Roccaldo
Tinelli2, Alessandro Ciccolella3, Alberto Basset1
1 Dipartimento di Scienze e Tecnologie Biologiche ed Ambientali, UniversitÓ degli Studi di Lecce
2 Dipartimento di Ingegneria Civile ed Ambientale, Politecnico di Bari
3 Consorzio di Gestione della Riserva Naturale di Torre Guaceto Ł Brindisi
Summary
In this paper, we report a study of the water, salt and nutrients budgets of the wetland part of the Torre
Guaceto Nature Reserve, in which the LOICZ Biogeochemical Budget Model (Gordon et al. 1996) was
applied to estimate the net system metabolism. The reserve is located in the Apulia region of Italy, on
the Adriatic coast, about 15 km north of the city of Brindisi (Figure 3.12 and 3.19). The region is
characterized by Mediterranean-type climatic variations, with meteorologically stable summers and
unstable winters. The study took place between July 2001 and May 2002. The wetland area of the
reserve was treated as a single-box, single-layer system with seasonal variation, following LOICZ
guidelines.
Figure 3.12. Location of Torre Guaceto Nature Reserve and sampling stations. The grey part is
the area considered in this study.
The entire system, consisting of a marine area and the salt marsh, can be considered to be in an oligo-
mesotrophic state on the basis of the classification proposed by HÕkanson (1994), N³rnberg (1996),
Dodds et al. (1998) and the measured dissolved inorganic phosphorus and chlorophyll a concentrations
(0.43„28.90 and 0.088„1.06 mg m-3 respectively).
The water volume of the brackish wetland cannot be considered constant (it varies from 2.39 to
4.54x10⁵ m3) so the formulas of the standard LOICZ approach were modified to account for the
seasonal variability of water volume and the characteristics of the system. Water inputs to the system
are only precipitation and groundwater while outputs are evaporation and transport to sea via numerous
59
small streams. The main inputs of dissolved inorganic nitrogen (DIN) and dissolved inorganic
phosphorus (DIP) are from groundwater.
The estimated water turnover time in the system ranges between 21 and 69 days. Judging from the
DIP and DIN values obtained with the model application, the system acts as a source for DIP and a
sink for DIN; moreover, it seems to be slightly heterotrophic with denitrification processes prevailing
over nitrogen fixation.
The seasonal variations of ecosystem functions appear to be in agreement with vegetative growth and
ageing of the reeds (Phragmites australis (Cav.) Trin ex Steud.), which constitute the predominant
vegetation in the area.
Study area description
The Torre Guaceto Nature Reserve (40.71░N-17.80░E) is located in the Apulia region (Italy), on the
Adriatic coast, about 15 km north of the city of Brindisi and consists of a brackish wetland and a
marine area (Figure 3.12, 3.19, 3.20, 3.21). The LOICZ biogeochemical budget approach was applied
to the wetland, which covers a surface area of 1.19 km2. This wetland is crossed by a network of
canals which were built in an attempt to reclaim the marshy area, and which delineate areas of varying
size. In the dry season, an unsealed road (submerged in the autumn-winter season) divides the wetland
ecosystem into two distinct compartments.
The mean depth of the marshy area is about 20 cm in the summer and 40-45 cm in winter. During the
year of study, the total volume ranged between 2.39x10⁵ m3 and 4.54x10⁵ m3, which means that the
system is not in hydraulic equilibrium during the year. At present, the marshy ecosystem has no
localized surface water inputs and only negligible atmospheric and groundwater inputs.
The system is located in the Canale Reale watershed (surface area 383 km2). The Canale Reale flows
into the protected marine area, to the south of Zone A (the part of the reserve enjoying maximum
protection). However, the Canale Reale is physically separated from the marshy ecosystem by
concrete dykes and a concrete river bed near the canal mouth. The watershed feeds the water-bearing
stratum present under the wetland, delivering considerable freshwater input from precipitation. Tidal
variation in sea levels in the area, according to regional sea charts, is very low and, due to the shallow
coastal dunes, tide does not affect the hydrological budget of the Torre Guaceto marsh. The system is
covered by dense reeds, which probably form the dominant biological element of the system.
Within the marine reserve it is possible to identify an area of about 1.44 km2 with a total volume of
5.73x10⁶ m3 that receives freshwater from the Canale Reale and brackish water from the outflow of the
brackish ecosystem and the groundwater layer. The area, protected to the north by a promontory and to
the east by two islets, consists of a sandy, shallow bay.
For the analysis of the hydrological and nutrient budget of the Torre Guaceto wetland system, an
experimental design was set up with 12 sampling stations: two in the wetland, four corresponding to
the streams flowing into the Nature Reserve and six in the bay. There are thus three transects with a
coast-offshore gradient. At all the stations, samplings were done seasonally and in every sample the
following parameters were determined: salinity, temperature, nitrate, nitrite, ammonium, phosphorus
and chlorophyll (chl_a). In addition, the input of every stream was periodically calculated, with
special attention paid to heavy rains. All the parameters were determined using standard procedures.
The dissolved phosphorus absorbance was measured with a 10 cm cell, in order to increase the
standard sensitivity of the method, the phosphorus concentration being very low both in the system and
in the marine area. Atmospheric temperature and precipitation were obtained from the meteorological
station in the area and from historical data. Evaporation was calculated using Hargreaves' equation
(Hargreaves 1975). Data of temperature and precipitation presented here are averages from twenty and
forty years data sets, respectively.
60
Water and salt balance
For the water and salt balance estimates, the equations proposed by Gordon et al. (1996) were used,
adapting them on the basis of data availability and morphology of the site.
The principal equation, which establishes the relationship between the variation in mass of the water
body and the input and output fluxes for the system, is:
dVsys =V +V +V +V -V +V -V
Q
P
G
O
E
in
out
dt
where Vsys is the volume of the system and VQ is the input flux for the system representing streams
flowing into the body of water under consideration. In the salt marsh of the Torre Guaceto reserve this
input is negligible, because the banks and bed of the only stream that crosses the system are completely
cemented, preventing any influence on the water and salt balance.
VP represents the input deriving from direct precipitation, and VE is the quantity of water evaporating
corrected for evapotranspiration. VE constitutes an output for the system, so in the formula it assumes a
negative sign.
VO is made up of all the water input not included in the preceding factors, i.e. not canalized or surface
flowing. This quantity is considered negligible.
VG is the flow of groundwater from the water layer underlying the body of water under study. It has not
been possible to collect data on groundwater characteristics, so this flux, which is not negligible, is
unknown.
Vin and Vout are hydrographically driven advective inflow and outflow of water between wetland and
sea. In our model we considered the negligible inflow, because there is no visible input of seawater
into the marsh system. The only exchange flux between system and sea is given by the few streams
that carry the marsh water into the sea; so we substituted the model value of Vout with the total output of
the streams.
dV
In the classical applications of the model, the term
sys is considered zero, indicating that the
dt
variations of the water volume of the system are, at least approximately, constant during the period
under consideration. In the case of Torre Guaceto this assumption is not valid, since the saltmarsh
water volume almost doubled from summer to winter in the studied year. Therefore, we needed to take
into consideration the variations of the system volume in the model. This was obtained by describing
the system volume, only for the year studied, through a polynomial function, produced with best fit
techniques, since further observations demonstrate that the system volume variation was not periodic:
y =
582
.
61
4
x -
8
.
3495
3
x + 69262 2
x - 551159x + 2 *106
R = 852
.
0
p < 001
.
0
where y is the system volume, and
x is the time, expressed as the rank of each month in a solar year.
We calculated the derivative of this function and we expressed VG as follows using Gordon's equation:
dVsys
V =
-V +V +V
G
P
E
out
dt
In the LOICZ budget method, the salt budget is used to estimate VX, the volume of sea water
exchanged with the marsh ecosystem. In the present study, VX could not be calculated because,
apparently, there is no direct input of saltwater from the sea into the system.
According to the water balance described above, the Torre Guaceto wetland system should be a
freshwater marsh, with a negligible salt budget. However, water sampling and analyses demonstrated
that the system salinity varied between 5.8 and 13.3 psu (Table 3.5); therefore, a marine input has to
occur in the system. We hypothesized that the marine input occurred via groundwater as a saltwater
61
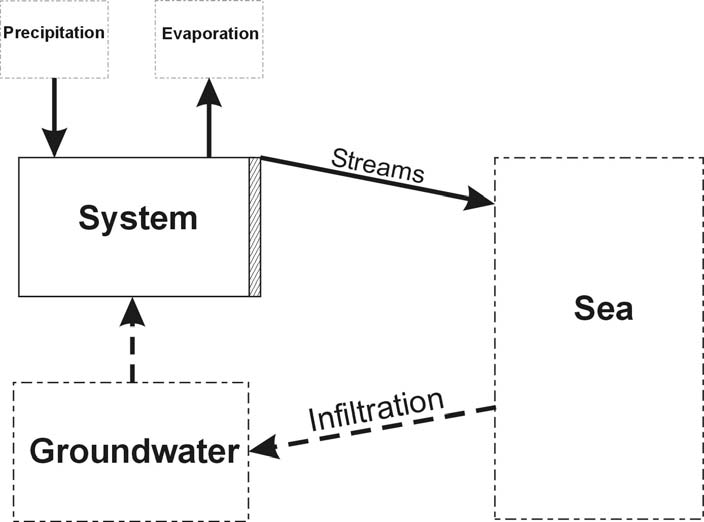
infiltration into the groundwater layer (Figure 3.13), and we verified this assumption through analysis
of the groundwater salinity.
Table 3.5. Salinity in the Torre Guaceto wetland. Ssys = Salinity of the system; Sout = average
salinity in the streams; SG is the salinity estimated for groundwater, Ssea = salinity of the adjacent sea.
Salinity
(psu)
Ssys
Sout
SG
Ssea
winter 6.3 5.3 5.6 39.7
spring 5.8 3.3 2.9 38.0
summer 13.3 5.7 2.1 40.0
autumn 12.0 7.0 7.0 40.0
annual 9.4 5.3 4.4 39.4
Figure 3.13. Scheme of input and output flows in Torre Guaceto wetland system.
According to Gordon's equations (Gordon et al. 1996) it is possible to calculate the groundwater
salinity. The salt balance may be described with the formula:
d V
(
S )
sys
sys
= V S +V S -V S -V S
P
P
G
G
E
E
out
out
dt
In the model, the salinity associated with Vout is the system salinity: in this case, we can provide the
flux salinity, Sout, calculated as the average salinity of the streams. We considered the salt input and
output by precipitation and evaporation to be negligible, thus the salinity of the system is a function of
SG and Sout and it is possible to calculate SG:
62
1 dV
dS
sys
sys
S =
S
V
V S
G
+
+
sys
sys
out
out
V
dt
dt
G
dS
The term
sys can be considered negligible, compared with the other terms, and the groundwater
dt
salinity calculated with the formula ranged between 2.1 and 7.0 psu throughout the year. The
minimum value, 2.1 psu, was calculated for the summer period, which was rather unexpected.
However, the marine input may actually be reduced during summer since the groundwater layer
position and shape do not seem to guarantee a regular groundwater flux into the system during the dry
season.
A number of hydro-geological analyses were performed in the winter period in order to verify this
hypothesis. The analyses were performed at four study sites and showed a groundwater salinity which
ranged between 4.2-5.1 psu in the winter period, very close to the 5.6 psu value calculated with the
Gordon's equation. Moreover, the analysis of the elements in the groundwater supported the marine
infiltration. In fact, at the study sites the water salinity was due to Cl-, Na+ and K+. By comparing the
data with 1950 data on the groundwater it seems that the marine infiltration is increasing in importance
in recent years, probably due to the water management in the area.
According to both calculated and observed groundwater salinity, the groundwater input can be divided
into two parts: one saline, Vsea, of marine origin, and one, Vfreshwater, from the freshwater-bearing stratum
present under the area (Vfreshwater = VG - Vsea). Consequently, the groundwater salinity will be a
weighted average of the salinity values of the two parts:
V
(
-V )S
+V S
G
sea
freshwater
sea
sea
S =
G
VG
This formula permits the calculation of Vsea: considering the preceding equation for SG, we can write
(the freshwater salinity is negligible):
SG
V
=
V
sea
G
Ssea
Therefore, marine input into the Torre Guaceto wetland occurs through the groundwater and can be
estimated by the LOICZ model. This input cannot be considered as Vin in the model, but it actually
represents an exchange flux between marine and wetland ecosystems (Figure 3.13).
Finally, an estimate of the wetland system water exchange time is calculable with the formula (similar
to the hydraulic residence time equation):
Vsys
=
Vout
Table 3.6 shows the values of all water fluxes considered in the model.
Table 3.6 Seasonal and annual system volume, water fluxes and turnover time for the Torre
Guaceto wetland system.
Vsys dVsys/dt VP
VE
VG
Vfreshwater Vout
Vsea
m3
m3 d-1
m3 d-1
m3 d-1
m3 d-1
m3 d-1
m3 d-1
m3 d-1 days
winter 4.54E+05 5.76E+02 2.82E+03 1.85E+03 2.15E+04 1.85E+04 2.19E+04 3.01E+03 21
spring 4.51E+05
-3.27E+02
1.85E+03
4.32E+03 2.15E+04 1.99E+04 1.94E+04 1.63E+03 23
summer 2.39E+05 -2.20E+00
7.66E+02 6.59E+03 9.28E+03 8.79E+03 3.46E+03 4.92E+02 69
autumn 3.94E+05 9.59E+02 2.68E+03 3.33E+03 1.72E+04 1.42E+04 1.56E+04 3.02E+03 25
annual 3.90E+05 2.47E+02 2.04E+03 5.32E+03 1.86E+04 1.65E+04 1.51E+04 2.09E+03 26
63
Budgets of non-conservative materials
The nutrient budget of the wetland system has been calculated for all seasons to produce an annual
budget model. The equations used for the calculation of the nitrogen and phosphorus budgets are as
follows:
dY
V
+ dV
Y
= V Y
- V
Y
+ Y = 0
dt
dt
input input
output output
where Y refers to the concentration of a nutrient, Y is the net non-conservative flux,
V Y
= V Y +V Y and V
Y
= V Y +V Y . The nutrient concentrations for V
input input
P P
G G
output output
E E
out out
E
and VP are considered zero because data are not available.
Yout is the average of nutrient concentrations in the streams that link the system to the sea; for VGYG the
nutrient concentration was calculated with a formula derived from the preceding one for groundwater
salinity:
V
(
-V Y
)
+V Y
G
sea
freshwater
sea sea
Y =
G
VG
The data for the nutrients of the freshwater-bearing stratum, considering sampling stations far from the
coast, are obtained from the literature.
dY
We calculated Y as follows, considering the term V
negligible:
dt
dY
dV
Y
= V
+Y
- V Y
+ V
Y
input input
output output
dt
dt
DIP balance
For the investigated period, the wetland system seems to be a source of DIP during the year, although,
in area-specific units, DIP is very low (Table 3.7).
DIN balance
DIN was negative for the whole period investigated, especially in winter and spring, indicating that
the system is a net sink for DIN. The DIN values are reported in Table 3.8.
Table 3.7 Seasonal and annual values for DIP in the Torre Guaceto wetland system.
DIP
DIP
(mol
d-1) (Ąmol
m-2 d-1)
winter 3.99 3.34
spring 4.80 4.02
summer 0.38
0.32
autumn 0.57
0.48
annual 2.74 2.29
Table 3.8. Seasonal and annual values for DIN in the Torre Guaceto wetland system.
DIN
DIN
(mol
d-1) (mmol
m-2 d-1)
winter -1.04E+04
-8.70
spring -1.15E+04
-9.63
summer -6.41E+03 -5.36
autumn -7.81E+03
-6.54
annual -1.02E+04
-8.58
64
Stoichiometric calculations of aspects of net system metabolism
The model assumes that positive DIP values are an indication of net organic matter mineralisation
and can be directly estimated from the DIP release. The difference between observed and expected
DIN indicates the balance between nitrogen fixation processes and denitrification (nfix-denit).
The expected DIN value was calculated by multiplying the observed DIP by the N:P ratio of the
mineralized organic matter. For the Torre Guaceto wetland, the Redfield C:N:P ratio (106:16:1) was
used for the stoichiometric calculations.
The net ecosystem metabolism NEM or (p-r) was calculated from DIP values utilising a C:P ratio of
the mineralized matter of 106:1.
During the investigated period NEM was negative, indicating a net mineralisation of organic matter and
a slightly heterotrophic state, with consequent release of DIP in the water column. As shown in Table
3.9, the calculated values are very low, so it may be asserted that the system is substantially in
equilibrium.
The water, salt and nutrient budgets for all seasons are shown in Figures 3.14-3.18.
The Torre Guaceto wetland can be compared with other Apulian wetlands such as Alimini Lake and
Acquatina Lake. Alimini Lake is a brackish lake located in southern Apulia. It consists of two basins,
Alimini Grande and Alimini Piccolo, connected through a natural channel 1.5 km long. Previous
studies have established that the system is a source for DIP in spring and a sink in the other seasons.
Since the DIP value is 0, nitrogen fixation minus denitrifications (nfix-denit) is equal to DIN. For
all seasons except summer in Alimini Lake, denitrification prevailed over nitrogen fixation. The
annual (nfix-denit) for Alimini Lake was negative, so the system is net denitrifying (Vadrucci et al.
2001). Acquatina Lake, 15 km from Lecce, Apulia, is an artificial basin created in the 1930s. Previous
studies have established that the system is a sink for N and P (Cappello et al. unpublished data).
Systematic investigations carried out in Acquatina Lake confirmed that primary production and the
phytoplanktonic biomass of the system are limitated by phosphorus. The rate at which nutrients are
renewed in the water column suggested meso-oligotrophic conditions for the system (Vadrucci et al.
1995, Vadrucci et al. 1996).
Because of its low anthropogenic impact, the Torre Guaceto wetland system seems to be very similar
to these other Apulian systems.
Table 3.9. Seasonal and annual values for NEM. DINexp and (nfix-denit). (C:N:P =106:16:1)
(p-r)
DINexp
(nfix-denit)
(mmol
m-2 d-1)
winter -0.35 0.05 -8.75
spring -0.43 0.06 -9.70
summer -0.03
0.01
-5.37
autumn -0.05 0.01
-6.55
annual -0.24 0.04 -8.62
65
Figure 3.14. Steady-state water, salt and non-conservative (phosphorus and nitrogen) budget for
winter in the Torre Guaceto wetland system.
Figure 3.15. Steady-state water, salt and non-conservative (phosphorus and nitrogen) budget for
spring in the Torre Guaceto wetland system.
66
Figure 3.16. Steady-state water, salt and non-conservative (phosphorus and nitrogen) budget for
summer in the Torre Guaceto wetland system.
Figure 3.17. Steady-state water, salt and non-conservative (phosphorus and nitrogen) budget for
autumn in the Torre Guaceto wetland system.
67
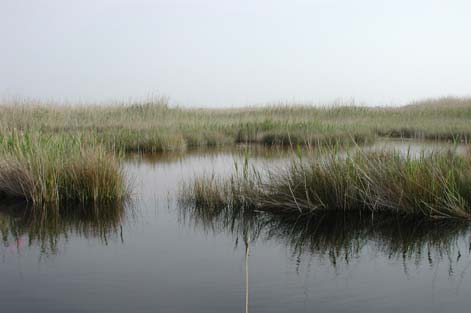
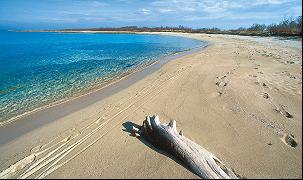
Figure 3.18. Steady-state water, salt and non-conservative (phosphorus and nitrogen) annual
budget for the Torre Guaceto wetland system.
Figure 3.19. Torre Guaceto Nature Reserve.
Figure 3.20. Torre Guaceto wetland system.
Figure 3.21. View of Torre Guaceto.
68
3.4
Torre Guaceto Bay
Luigi Palmisano, Alessandro Pomes, Ilaria Cappello and Alberto Basset
Dipartimento di Scienze e Tecnologie Biologiche ed Ambientali, UniversitÓ degli Studi di Lecce
Summary
We applied the one-box LOICZ Biogeochemical Budget Model to a marine area in the Torre Guaceto
Nature Reserve, comparing a version of Knudsen's method (Gordon et al. 1996) with Yanagi's method
for VX estimation (Yanagi 2000b). The reserve is located in the Apulia region of Italy, on the Adriatic
coast, about 15 km north of the city of Brindisi. The region is characterized by mediterranean-type
climatic variations, with meteorologically stable summers and unstable winters. The data reported
refer to a marine area of 1.44 km2 which was studied for a period of about two years, from summer
2001 to spring 2003.
The two calculated values of VX differ by about an order of magnitude, which affects the ecological
characteristics estimated with the LOICZ method. The estimated water turnover time in the system
varies from 11 hours using Yanagi's method to 83 hours calculated according to LOICZ guidelines.
Neither methods operates properly in the area. The VX estimation through the salinity budget (Gordon
et al. 1996) gives reasonable results but is based on minimal differences of salinity between the system
and the open sea (0.6 psu) and can be affected by high uncertainty. While the result obtained with
Yanagi's (2000b) application do not seem reasonable (VX is ten times bigger and is only 11 hours),
this may be due to the W/H ratio which is borderline between wide-and-shallow and deep-and-narrow
systems and to the relatively small volume of the system. Further investigations are needed to estimate
VX fluxes in this system. Discussion about this application is welcomed (email: loiczmail@virgilio.it).
According to the DIP and DIN values, the system acts as a source for DIP and DIN with the first
approach, and as a sink for DIP and a source for DIN with the second, implying respectively a negative
and a positive NEM value; denitrification processes always prevail.
Values of NEM and (nfix-denit) obtained with Yanagi's estimation of VX are not reasonable for a
system such as this one.
Study area description
The Torre Guaceto Nature Reserve (40.71░N-17.80░E) is located in the Apulia region, on the Adriatic
coast of Italy, about 15 km north of the city of Brindisi and consists of a wetland and a marine area.
The system is located in the Canale Reale watershed (surface area 383 km2). Within the marine part of
the reserve, an area of about 1.44 km2 with a total volume of 5.73x10⁶ m3 receives freshwater from the
Canale Reale, which is affected by wastewater at least in some seasons; it also receives brackish water
from the outflow of the brackish ecosystem and from groundwater. The area consists of a sandy,
shallow bay protected to the north by a promontory and to the east by two islets.
For the analysis of the hydrological and nutrient budget of the Torre Guaceto Bay ecosystem, an
experimental design was set up with eight sampling stations (Figure 3.22), with stations sited at the
mouth of each of four streams flowing into the marine reserve, two in the bay and two in open sea. At
all the stations water sampling was organized on a seasonal basis and from every sample the following
parameters were determined: salinity, temperature, nitrate, nitrite, ammonium, phosphorus and
chlorophyll (chl_a). Freshwater input to the bay was also evaluated by measuring the discharge of
every stream. All the parameters were determined using standard procedures. Dissolved phosphorus
absorbance was measured with a 10 cm cell, in order to increase the standard sensitivity of the method,
as phosphorus concentration was very low. Temperature of the atmosphere and precipitation were
obtained from the meteorological station present in the area and from historical data. Evaporation was
69
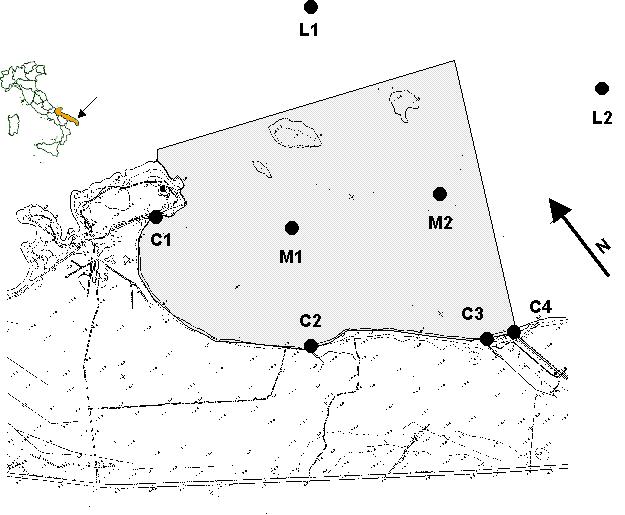
calculated using Hargreaves' equation (Hargreaves 1975). Data of temperature and precipitation
presented here are averages from twenty and forty years data sets, respectively.
Figure 3.22. Location of Torre Guaceto Bay and the sampling stations. The grey shaded part is
the area considered in this study.
The analyses performed have underlined the existence of significant differences between the delimited
marine area and the open sea, mostly for DIN (Table 3.10, Figure 3.23), which is always significantly
higher in the bay than in the open sea (t Student test = 2,99 df = 91 p<0,05), as a result of the high DIN
input from the freshwater and brackish channels.
Table 3.10. Seasonal values of DIN and DIP for the channel (C, in mol d-1), the bay (M, in ĄM)
and the adjacent sea (L, in ĄM).
DIN
DIP
C
6193 202 mol
d-1
Winter M 64.37 0.81 ĄM
L
23.48 0.14 ĄM
C
6205 331 mol
d-1
Spring M
26.25 0.03 ĄM
L
11.73 0.05 ĄM
C
1394 37 mol
d-1
Summer M 28.07 0.06 ĄM
L
4.98 0.11 ĄM
C
5508 446 mol
d-1
Autumn M 60.65 0.04 ĄM
L
33.65 0.17 ĄM
70
DIN
y = 0,3562x - 0,6753
R = 0,9201
p < 0,01
50,00
40,00
M) 30,00
a
( 20,00
Se 10,00
0,00
0,00
50,00
100,00
150,00
Bay (Ą M)
Figure 3.23. Relationship between bay and open sea DIN concentrations.
Water and salt balance
To estimate the water and salt balance, the Gordon et al. (1996) equations were used:
dVsys =V +V +V +V -V +V
Q
P
G
O
E
R
dt
The system is considered in steady-state and the volume (Vsys) is approximately constant. VQ is the
water flux input to the system from four channels flowing out into the bay. VP is the direct
precipitation, with a mean value of 600 mm per year. VE is the output caused by the evaporation of
water, calculated using Hargreaves' equation. VO represents water input not included in the preceding
definitions, considered negligible. VG is the groundwater input, which is not considered in this work
although other investigations have shown a considerable exchange flux between the groundwater layer
and the marine area (Pomes et al., in this volume).
VR is the residual flux of the system, directed from the bay to the open sea or vice versa, required to
balance water input and output. The salinity of this flux, SR, is the average between the salinity of the
open sea, Ssea, and the salinity of the system, Ssys. Annual values for the system are given in Table 3.11.
Table 3.11. Annual values for precipitation, evaporation and freshwater inputs in Torre Guaceto
Bay.
VQ
VP
VE
VR
103 m3d-1 103 m3d-1 103 m3d-1
103 m3d-1
28.7 1.9 -3.8 -26.8
Finally, VX, the exchange flux between the bay and the open sea, is estimated with the salt budget:
V S
+ V S +V S -V S = 0
X
sea
Q
Q
R
R
X
sys
V S + V S
R
R
Q
Q
V =
X
S
- S
sys
sea
where every flux is multiplied for its salinity (SQ is the mean salinity of the channels input).
An estimate of the water residence time, , is given by:
Vsys
=
V + V
X
R
71
The estimated VX flux, water time residence and the salinities used for the calculations are given in
Table 3.12 and Figure 3.24.
Table 3.12. Annual exchange flux (VX), residence time () and salinity (S) of Torre Guaceto Bay
and the open sea according to LOICZ guidelines based on the salinity budget.
SQ
Ssys
Ssea
VX
psu psu psu 106 m3d-1 h
3.86 38.09 38.65 1.64 83
The reduced difference between system and open sea salinities (less than 1 psu) is a weakness of the
application of the Gordon guidelines (Gordon et al. 1996), in that VX is estimated without sufficient
precision. Therefore, we also used an alternative method to evaluate the exchange flux, described by
Yanagi (Yanagi 2000b). His formula expresses the exchange flux VX across the open boundary of the
system as a function of the magnitude of the horizontal dispersion coefficient DH (m2 d-1), estimated by
the following expression (Taylor 1953), which is applicable to wide and shallow systems:
2
4
1 W
U
L
W
D =
with
< 2
> 500
H
120 K
W
H
h
W
or, for deep and narrow systems:
2
4
1 H
U
L
W
D =
with
> 2
< 500
H
120 K
W
H
v
H
where:
W (in m) is the length of the open boundary between the bay and the open sea;
L (in m) is the distance from the center of the system to its mouth;
H (in m) is the average depth of the open boundary of the system;
Kh (in m2 d-1) is the horizontal diffusivity;
Kv (in m2 d-1) is the vertical diffusivity;
U ( in m d-1) is the residual flow velocity at the surface layer of the open boundary.
The marine part of the Torre Guaceto Nature Reserve is a shallow and wide bay, so that the first of the
two equations is the appropriate one to use, although the ratio W/H is technically below the specified
limit of 500 recommended for shallow and wide systems. Kh can be determined using Okubo's
equation (Okubo 1971):
15
.
1
K = 18W
h
while U, measured in Torre Guaceto Bay (Petretti 1988), is 0.039 m s-1.
The resulting expression for VX is a function of the DH coefficient, the area of the open boundary (A, in
m2) and the distance between the geographic centre of the system and the observation point for the
open sea salinity (F, in m):
A
V = D
with A = W * H
X
H F
The calculated value of VX (Table3.13) is about 1.2*107 m3d-1; this implies a residence time for the
system water volume is less than a day, about 11 hours.
72
Table 3.13. Data for the calculation of VX and residence time for Torre Guaceto Bay using
Yanagi's method (Yanagi 2000b).
Variable/system Torre
Guaceto
L (m)
600
W (m)
1900
H (m)
4
A (m2) 7600
L/W 0.3
W/H 475
Classification
Wide and shallow
0.039
U (m s-1)
(Petretti 1988)
Kv, Kh (m2 d-1) Kh = 106x103
DH (m2 d-1)
3.2 x 10⁶
F (m)
2000
VX (m3 d-1) - Yanagi
1.22x10⁷
VX (m3 d-1) - Gordon
1.64x10⁶
Residence time (h)
11
Budgets of non-conservative materials
With these results, we proceeded to evaluating the non conservative budget, following Gordon (Gordon
et al. 1996), from the 2001 summer to 2003 spring:
Y
= -(V Y +V Y +V Y +V Y +V Y +V Y +V Y + Y
Q Q
P P
G G
O O
E E
R R
X ( sea
sys )
where Y is the nutrient concentration of DIN and DIP and Y represents the non conservative
behaviour of the nutrients (Table 3.14). YP and YE, the nutrient concentration of the precipitation and
evaporation, are considered negligible.
Table 3.14. Annual values of DIN, DIP and DIP, DIN for Torre Guaceto Bay using Yanagi's
estimate of VX. values with (*) refer to standard LOICZ calculation of Vx based on salinity budget.
DIPQ DIPsys DIPsea VQDIPQ VRDIPR
VXDIPX
DIP
DIP
mmol m-3 mmol
m-3 mmol
m-3 mol
d-1 mol
d-1 mol
d-1 mol
d-1 mmol
m-2 d-1
6.72 0.23 0.12 193 -5 -1342 1154
0,80
-180* -8* -0.006*
DINQ DINsys DINsea VQDINQ VRDINR
VXDINX
DIN
DIN
mmol m-3 mmol
m-3 mmol
m-3 mol
d-1
mol d-1
103 mol d-1 103 mol d-1 mmol
m-2 d-1
168.31 44.84 18.46 4830 -848
-322 317 221
-43* 39* 27*
Stoichiometric calculations of aspects of net system metabolism
For the estimates of NEM and (nfixŁdenit) we considered the Redfield ratio 106:16:1 suitable for
phytoplankton (Table 3.15). The values obtained with the two approaches result to be different: the
system seems to be highly heterotrophic with the Yanagi estimation of VX (-85 mmol m-2 d-1 which is
73
too high for a system like Torre Guaceto Bay), while, following Gordon's guidelines, it is slightly
autotrophic (0.6 mmol m-2 d-1). Nitrogen fixation processes always prevail over denitrification but with
values which are not realistic.
Table 3.15. Differences between Yanagi and Gordon estimations of net ecosystem metabolism
and nitrogen fixation processes in Torre Guaceto Bay.
NEM (p-r)
DINexp (nfix-denit)
mmol C m-2 d-1 mmol
m-2 d-1 mmol
m-2 d-1
Yanagi
-85 13 208
Gordon
0.6 -0.1 34.5
The small volume of the marine area relative to the area of the open boundary represents a major
problem with Yanagi's estimation of VX in Torre Guaceto Bay, even when compared with other
systems to which the method was applied, such as Dokai Bay (Yanagi 2000a, 2000b), Hakata Bay
(Yanagi 1999, 2000b) and Sacca di Goro Lagoon (Viaroli et al. 2001b); thus, the higher water
exchange flux is likely to be due to a high efficiency in water circulation between the bay and the open
sea.
Acknowledgements
We thank G. Giordani and D. Swaney for their useful comments and suggestions on a previous draft of
this paper.
VP=1.9
VE=-3.8
V
S
Q= 28.7
R= 38.37
Torre Guaceto Bay
S
V
Q = 3.86
R = -26.8
Areasys = 1.44 km2
Vsys = 5.73x10⁶ m3
Ssys = 38.09 psu
Ssea= 38.65
sys (*) = 83 d
V
sys = 11 d
X(*)= 1.64
VX= 12.2
Figure 3.24. Water and salt budgets for Torre Guaceto Bay. Water fluxes are expressed in 103 m3
d-1 and salinity in PSU. Values with (*) refer to standard LOICZ calculation based on salinity budget.
74
3.5 Acquatina
Lake
Ilaria Cappello, Luigi Palmisano, Alessandro Pomes, Maria Rosaria Vadrucci, Alberto Basset
Dipartimento di Scienze e Tecnologie Biologiche ed Ambientali,UniversitÓ degli Studi di Lecce
Summary
Here, we report a study on the water, salt and nutrient balance of a saltmarsh lake: Acquatina Lake,
with a view to the application and implementation of the LOICZ Biogeochemical Model. Acquatina
Lake is located in the South Apulia region of Italy on the Adriatic Sea shore and is a small, meso-
oligotrophic, artificial basin used for scientific experiments and aquaculture. In the lake, two areas
with different salinity have been identified. The main freshwater inputs are from precipitation and
from a diversion of the Giammatteo Canal; the outputs from the system are a canal subject to tidal
influence and fairly intense evaporation. A LOICZ budget was done on data collected from literature
and on unpublished data collected in 1995.
Study area description
The Acquatina Lake area (Figure 3.25) is a coastal marsh lake located on the Adriatic Sea shore of the
Salento Peninsula (40.44░N, 18.24░E). It is connected to the sea by a channel 15 m wide and 400 m
long. The principal freshwater inputs are a lateral ramification of the Giammatteo Canal (on the
northern boundary of the lake) and rainfall. Long ago, the area was part of a system of marsh areas
periodically flooded by the sea. In the 1930s, during reclamation works in the coastal marsh areas, the
perimeter was embanked with brickwork which is still present. Underlying the region is a thick
sedimentary carbonaceous layer of the Jurassic-Cretaceous Age (200-65 million years bp), covered by
quaternary sediments (2 million years bp) known as the Calcareniti del Salento formation.
Figure 3.25. Location and map of Acquatina Lake.
The lake is about 2 km long with a surface area of about 0.45 km2. The maximum depth of the water
barely exceeds 2 m, with a mean value of 1 m. Tidal variation of sea level does not usually exceed 35
cm. The Giammatteo canal is fed by precipitation and groundwater. Input from the canal is highly
75
variable, depending on seasonal rainfall and agricultural use, which can be intensive. The Acquatina
area is characterized by a superficial saltwater-bearing stratum, whose relatively low depth causes its
emergence in depressed areas.
Water and salt balance
The lake comprises two large areas with different salinity, between about 15 and 35 psu (Scalzo et al.
1994; Cal“ et al. 1996). The area of lowest salinity is near the Giammatteo canal, while the most
saline water is close to the sea connection. Communication with the sea allows the lake to receive
seawater twice a day with the incoming tides and to drain water to the sea during the outgoing tide
phases. Rainfall is about 700 mm per year (data from meteorological station of Lecce, Aeronautica
Militare), and is particularly low in summer. Sudden storms may cause a rise in the mean level of the
water and, when this happens during high tide, the water in the lake may rise over its embankments.
The mean annual atmospheric temperature is about 16░C (Cal“ et al. 1996). Acquatina Lake is subject
to intense evaporation, especially in the summer period.
To estimate the water and salt balance, the Gordon et al. (1996) equations were used:
In Acquatina VQ. is represented by the deviation from the Giammatteo canal that flows into the
lake(Vadrucci, unpublished data), VE is calculated using Hargreaves equation and VO and VG are
considered negligible;
The estimated values for VR indicates that the system exports water to the sea during the whole of the
investigated period, with minimum values in summer (8700 m3 d-1). In this season also the exchange
flux (VX) with the sea is scarce (47900 m3 d-1) and the water turnover time is long (8 days) (Table 3.16).
The annual water and salt budget is represented in Figure 3.26.
Table 3.16 Water and salt balance of Acquatina Lake. *Annual values are calculated as the time-
weighted average of seasonal values.
VQ
VP
VE
VR
SQ
Ssys
Ssea
VX
103 m3d-1 103 m3d-1 103 m3d-1 103 m3d-1
psu psu psu 103 m3d-1 d
Winter
76.6 0.9 -0.8 -76.7
2.10
23.44 37.43
155.4
2
Spring
44.8 0.7 -2.1 -43.4
2.05
27.99 38.18
131.9
3
Summer
11.7 0.4 -3.4 -8.7
1.59
32.09 38.06
47.9
8
Autumn
39.7 1.3 -1.7 -39.3
2.02
29.27 37.81
144.8
2
Annual*
43.2 0.8 -2.0 -42.0
1.94
28.20 37.87
119.7
3
Budgets of non-conservative materials
The nutrient concentrations in the flows due to direct precipitation and evaporation are considered zero.
The nutrient data for the sea are taken from Fiocca et al. 1998.
DIP balance
Comparison of these results with those of previous studies (Vadrucci et al. 1995, Cal“ et al. 1996,
Giacobbe et al. 1996; Vadrucci et al. 1996) carried out on Acquatina Lake have confirmed that the
primary production and phytoplankton biomass of the system are limited by the availability of
phosphorus (Table 3.17, Figure 3.27) and that the system seems to be meso-oligotrophic. The largest
76
DIP inputs were observed in winter and spring, due to freshwater fluxes. During the period studied,
Acquatina Lake was a DIP sink, particularly during autumn and winter. The results obtained are likely
to be due to primary production in autumn, while in winter, DIP loss processes were not related to algal
metabolism, but probably to absorption on decaying detritus (Vadrucci et al. 1996).
Table 3.17. DIP budget of Acquatina Lake.
Season DIPQ DIPsys DIPsea
VQDIPQ VRDIPR VXDIPX DIP
DIP
mmol
m-3 mmol m-3 Mmol m-3 Mol d-1 mol
d-1 mol
d-1 mol
d-1 mmol
m-2 d-1
Winter
0.22 0.06 0.09 17 -6 5 -16 -0.035
Spring
0.34 0.13 0.05 15 -4 -10 -1 -0.002
Summer
0.25 0.05 0.05 3
0 0 -2 -0.005
Autumn
0.24 0.08 0.18 10 -5 14 -19 -0.041
Annual
0.26 0.08 0.09 11 -4 2 -9 -0.021
DIN balance
The overall DIN input into Acquatina Lake was about two orders of magnitude larger than the DIP
input. Nitrate was the dominant form of nitrogen in all seasons. DIN values show that the area under
study was, overall, a DIN sink on an annual scale. DIN values were lower during summer than in the
other seasonal periods (Table 3.18, Figure 3.28), probably due to the summer decrease of freshwater
inputs to the lake.
Table 3.18. DIN budget of Acquatina Lake.
Season DINQ DINsys DINsea
VQDINQ VRDINR VXDINX DIN
DIN
mmol
m-3 mmol
m-3 mmol
m-3
mol d-1 mol
d-1 mol
d-1 mol
d-1 mmol m-2 d-1
Winter
57.33 19.87 2.85 4392 -871 -2644
-877 -1.95
Spring
81.93 12.36 1.78 3673 -307 -1396
-1971 -4.38
Summer
64.54 13.32 1.32 754 -64 -575 -116 -0.26
Autumn
64.33 15.82 2.33 2552 -356 -1953
-243 -0.54
Annual
67.09 15.32 2.07 2835 -397 -1636
-802 -1.78
Stoichiometric calculations of aspects of net system metabolism
The difference between the observed and expected DIN was considered to be the net ecosystem
nitrogen fixation minus denitrification (nfix-denit). The expected DIN value was calculated by
multiplying the observed DIP by the N:P ratio of the mineralized organic matter. The Redfield C:N:P
ratio (106:16:1) was used for the stoichiometric calculations.
The net ecosystem metabolism, NEM or (p-r), is always positive (Table 3.19), indicating a greater
productivity in winter and autumn than in spring and summer, when the values are lower than 1 mmol
C m-2 d-1.
In the area the annual value for (nfix-denit) was -1.45 mmol m-2 d-1, indicating that denitrification
processes dominate over nitrogen fixation inputs. The higher value of (nfix-denit) observed in spring
77
seems to be related to a decrease of oxygen concentration linked to an increase of respiration processes
as demonstrated also by the spring NEM value, that was approximately zero, and the higher spring DIP
value observed in the system with respect to the other seasons.
Table 3.19. Values of net ecosystem metabolism (p-r), DINexp and (nfix-denit).
NEM
(p-r)
DINexp
(nfix-denit)
mmol m-2 d-1 mmol
m-2 d-1 mmol
m-2 d-1
Winter
3.8 -0.57 -1.38
Spring
0.2 -0.03 -4.35
Summer
0.5 -0.07 -0.18
Autumn
4.4 -0.66 0.12
Annual
2.2 -0.33 -1.45
V
V
P = 0.8
E = -2.0
VR = -41.8
Acquatina Lake
S
V
R = 33.05
Q = 43.0
Vsys= 0.45x10⁶ m3
Ssea= 37.9
SQ = 1.94
Asys = 0.45x10⁶ m2
S
sys = 28.2
= 3 days
VX= 119.7
Figure 3.26. Water and salt budgets for Acquatina Lake. Water fluxes are expressed in 103 m3 d-1
and salinity in PSU. Annual values are calculated as the time-weighted average of seasonal values.
78
DIPQ = 0.26
VRDIPR = -4
Acquatina Lake
VQDIPQ = 11
DIPR = 0.09
DIP
DIP
sys = 0.08 mmol m-3
sea = 0.09
DIPsys = -9 mol d-1
DIP
V
sys = -0.021 mmol m-2d-1
XDIPX = 2
Figure 3.27. DIP budget for Acquatina Lake. Concentrations are in mmol m-3 and fluxes in mol d-1.
Annual values are calculated as the time-weighted average of seasonal values.
VRDINR = -397
DIN
Q = 67.03
Acquatina Lake
DINR = 8.71
VQDINQ = 2835
DINsys = 15.34 mmol m-3
DINsys = -802 mol d-1
DINsea= 2.07
DINsys = -1.78 mmol m-2d-1
VXDINX= -1636
Figure 3.28. DIN budget for Acquatina Lake. Concentrations are in mmol m-3 and fluxes in mol d-1.
Annual values are calculated as the time-weighted average of seasonal values.
79
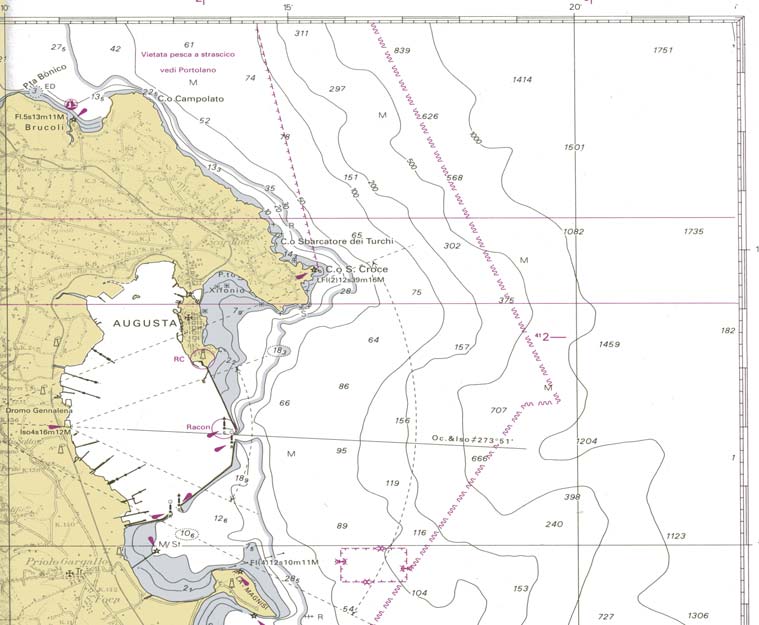
4
COASTAL SYSTEMS OF SICILY AND SARDINIA
4.1
Rada di Augusta, eastern coast of Sicily
Filippo Azzaro1, Maurizio Azzaro1, Alessandro Bergamasco1 and Salvatore Giacobbe2
1 Istituto per l'Ambiente Marino Costiero - Talassografico - CNR, Messina
2 Dipartimento di Biologia Animale ed Ecologia Marina, UniversitÓ di Messina
Study area description
The Rada di Augusta is a wide natural bay which occupies about 30 km of the eastern coast of Sicily.
The bay (37.21░N, 15.23░E) is located between Cape Santa Croce and Peninsula Magnisi. In recent
years, the bay has been almost completely enclosed with breakwaters to form a vast harbour basin
communicating with the sea through two narrow inlets (east and south, Figure 4.1). The bay is about
6.4 km long and 10.25 km wide. The surface area is 23.5 km2 and the total volume is approximately
3.5x10⁸ m3.
As a coastal marine environment with a low water turnover, and with intensive human activities in the
area, the Rada di Augusta is a complex environmental system with a very high state of degradation
which can be ascribed primarily to heavy industrialization and dense urbanization (Figure 4.2).
The main sources of pollution are hydrocarbons deriving from the petrochemical refining plants
(Sciacca and Fallico 1978; De Domenico et al. 1994) and urban wastewaters (70,000 inhabitants)
reaching the bay after only a partial treatment, which lead to a semipermanent condition of
eutrophication. High inputs of N and P come also from industrial (fertilizer production) and
agricultural activities (Azzaro 1993). The basin has been studied for several years because of various
eutrophication phenomena (Andreoli et al. 1987; Decembrini et al. 1993; Magazz∙ et al. 1995).
Figure 4.1. Map showing the location of the Rada di Augusta and the area studied.
80
In this paper a budgetary analysis was conducted using the LOICZ Biogeochemical Modelling
Guidelines (Gordon et al. 1996). Data were collected from November 1989 to October 1990.
Water and salt balance
The water budget for Rada di Augusta was calculated for three periods: November-March, April-June
and July-October and for the whole year, using a single-box single-layer model. In the Rada di
Augusta, the major freshwater inputs are civil, agricultural and industrial discharges (VO) and direct
precipitation (VP).
Riverine (VQ), underground (VG) and other (VO) inputs have been inferred from a Talassographic
Report (1992). Precipitation data (VP) were obtained from a Meteorological Station and evaporation
(VE) was calculated using the Hargreaves' equation (Hargreaves 1975).
In the study area, direct rainfall was 450 mm. The highest values were registered in the first period
(November-March), the lowest in the third period (July-October). Evaporation exceeded precipitation
in the second and third periods, while in the first, they were in balance. The water and salt budgets
during the three periods are shown in Table 4.1 and Figure 4.3.
A net export of water from Rada di Augusta to the sea, indicated by negative residual flows (VR), was
obtained for the three periods, with highest values during the first period. The VX values, which
indicate the mixing volume between the system and the sea, also showed a maximum in the first
period.
The estimate of water residence time () was four months for the first period (winter) and six months
for the second one (spring). During summer (the third period) the estimated exchange time was about
twice that of the spring period. The annual average estimated water residence time was longer than 4
months (Figure 4.2).
Table 4.1. Water fluxes, salinity and water exchange time () in the Rada di Augusta.
*Annual values are calculated as the time-weighted average of seasonal values
Period VQ
VG
VP
VO
VE
VR
Ssyst
Ssea
VX
(103 m3 d-1) (psu)
(103 m3 d-1) (days)
Nov-Mar 6.0 5.0 40.5 100.0 -44.2 -107.3
36.65 38.07
2823.0
119
Apr-Jun 2.4 3.0 18.5 90.0 -105.0 -8.9 38.03 38.20
1995.7
175
Jul-Oct 1.0 0.5 28.8 60.0 -86.9 -3.4 38.03 38.15 1079.2
323
Annual * 3.4
3.0
31.1
84.0 -73.7 -47.8
37.46
38.13
2029.1
169
Budgets of non-conservative materials
The data considered refer to twenty-five stations located in the Rada di Augusta and to ten stations
located in the open sea, which were sampled monthly from March 1989 until March 1990. The
variations of nutrient concentrations during the three periods are reported in Tables 4.2 and 4.3. The
concentrations of DIPQ, DIPG, DIPO, DINQ, DING and DIPO have been calculated from data obtained
from the Talassographic Report (1992).
81
Table 4.2. DIP concentrations (in mmol m-3) in the Rada di Augusta.
*Annual values are calculated as the time-weighted average of seasonal values.
Period DIPQ DIPG DIPO DIPsyst DIPsea
Nov.-Mar. 0.50
0.50
3.00 0.34 0.09
Apr-Jun 0.50 0.50 3.00 0.29 0.33
Jul-Oct 0.50 0.50 3.00 0.04 0.19
Annual* 0.50 0.50 3.00 0.23 0.18
Table 4.3. DIN concentration (in mmol m-3) in the Rada di Augusta.
*Annual values are calculated as the time-weighted average of seasonal values.
Period
DINQ DING DINO DINsyst DINsea
Nov.-Mar. 6.00
6.00
700 5.59 1.33
Apr-Jun 6.00 6.00
700 2.37 1.80
Jul-Oct 6.00 6.00 700 2.52 2.00
Annual* 6.00 6.00
700 3.75 1.67
DIP balance
Data for the DIP budgets in the three examined periods are reported in Table 4.4 and the annual budget
in Figure 4.4. The system acted as a source for the first period (DIP was positive) and as a sink in the
same range of values in the remaining periods. On an annual basis, the system can be considered as a
sink of DIP (Figure 4.3).
Table 4.4. DIP budgets for the Rada di Augusta in 1989-90.
*Annual values are calculated as the time-weighted average of seasonal values.
Period VQDIPQ
VGDIPG
VO DIPO VR DIPR VX DIPX
DIP
(mol
d-1) (mol
d-1) (Ąmol m-2 d-1)
Nov.-Mar.
3.0 2.5 300.0
-23.6
-705.8
423.9
18.04
Apr-Jun
1.2 1.5 270.0
-2.8
79.8
-349.7
-14.88
Jul-Oct
0.5 0.3 180.0
-0.4
161.9
-342.3
-14.57
Annual*
1.7 1.5 252.1
-10.6
-217.5
-27.2
-1.16
DIN balance
Non-conservative fluxes of DIN (DIN) were negative for all of the periods investigated, indicating a
dominance of DIN removal processes (mainly assimilation); the system acts therefore as a net sink for
DIN. Maximal negative values were measured in the spring period (Table 4.5). The annual DIN
budget is shown in Figure 4.5.
Table 4.5. DIN budgets for the Rada di Augusta in 1989-90.
*Annual values are calculated as the time-weighted average of seasonal values.
Period VQDINQ
VGDING
VO DINO VR DINR VX DINX
DIN
(mol d-1) (mol
d-1) (mmol
m-2 d-1)
Nov.-Mar. 36.0
30.0 70000 -371.3
-12026.0
-57669
-2.45
Apr-Jun 14.4 18.0 63000 -18.6
-1137.5
-61876 -2.63
Jul-Oct 6.0 3.0 42000 -7.7
-561.2
-41440 -1.76
Annual* 20.5 17.9 58820 -160.8
-5448 -53249
-2.26
82
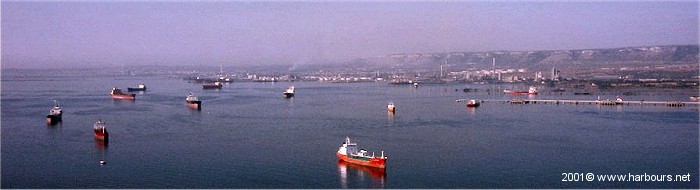
Stoichiometric calculations of aspects of net system metabolism
According to the assumption of the LOICZ biogeochemical model, the DIP values and the C:N:P
ratio of primary producers (in this case phytoplankton, thus the Redfield ratio was used) allow a direct
estimate of the net energy budget of the system, determining whether the system is a net consumer
(DIP > 0 and p-r < 0) or a net producer ((DIP < 0 and p-r > 0) of organic matter.
As indicated in Table 4.6, the Rada di Augusta act as a net consumer in the first period (-1.91 mmol m-
2 d-1 ) and as net producer (1.58 and 1.54 mmol m-2 d-1 ) in the remaining periods.
In all periods denitrification prevailed over nitrogen fixation (i.e., (nfix-denit) <0) especially in the cold
months. On an annual basis, the Rada di Augusta system can be considered as an autotrophic system
with an estimated net production of organic matter of 0.12 mmol C m-2 d-1 and denitrification processes
lead to a net removal of 2.24 mmol m-2 d-1 of DIN.
Table 4.6. Net ecosystem metabolism (p-r), expected DIN and (nfix-denit) for the Rada di
Augusta in 1989-90.
*Annual values are calculated as the time-weighted average of seasonal values.
Period
(p-r)
DINexp (nfix-denit)
(mmol
m-2 d-1)
Nov.-Mar.
-1.91 0.29 -2.74
Apr-Jun
1.58 -0.24 -2.39
Jul-Oct
1.54 -0.23 -1.53
Annual*
0.12 -0.02 -2.24
Figure 4.2. View of the Rada di Augusta.
83
V
V
P = 31.1
E = -73.7
VQ = 3.4
Rada di Augusta
VR = -47.8
V
Asys = 23.5x10⁶ m2
S
O = 84.0
R = 37.8
S
V
sea= 38.1
sys= 350x106 m3
Ssys = 37.6 psu
VG = 3.4
= 169 days
VX= 2029
Figure 4.3. Water and salt budgets for the Rada di Augusta. Water fluxes are expressed in 103 m3
d-1 and salinity in PSU. Annual values are calculated as the time-weighted average of seasonal values.
DIPQ = 0.5
Rada di Augusta
DIPR = 0.21
VQ DIPQ=1.7
VR DIPR = -10.4
DIPO = 3.0
DIPsys = 0.23 mmol m-3
DIP
DIP
sea= 0.20
sys= -27.2 mol d-1
VO DIPO = 252
DIPsys = -1.16 Ąmol m-2 d-1
DIPG = 0.5
VX DIPX= -217
VG DIPG = 1.5
Figure 4.4. DIP budget for the Rada di Augusta. Concentrations are in mmol m-3 and fluxes in mol
d-1. Annual values are calculated as the time-weighted average of seasonal values.
DINQ = 6
Rada di Augusta
DINR = 2.7
VQ DINQ=20
V
DIN
R DINR = -160
O = 700
DINsys = 3.75 mmol m-3
DINsea=
V
DINsys= -53249 mol d-1
O DINO = 58820
1 67
DINsys = -2.26 mmol m-2 d-1
DING = 6
VX DINX= -5448
VG DING = 18
Figure 4.5. DIN budget for the Rada di Augusta. Concentrations are in mmol m-3 and fluxes in mol
d-1. Annual values are calculated as the time-weighted average of seasonal values.
84
4.2
Capo Feto marshland, south-west Sicily
Giuseppe Pernice, Ignazio Patti, Vincenzo Maccarrone, Francesca Apollo
Istituto per l'ambiente marino costiero Consiglio Nazionale delle Ricerche (CNR) Sezione di Mazara
del Vallo, Trapani
Introduction
Capo Feto is a typical marshland located on the south-western coast of Sicily, 5 km west of Mazara del
Vallo (37.68░ N, 12.48░ E). Physical and chemical features of the Capo Feto area were studied from
summer 2000 to summer 2002. Data from 2001 were used to calculate seasonal and annual budgets
using a single-box, single-layer LOICZ Biogeochemical Model (Gordon et al. 1996). Rainfall data
were recorded at a field station near the study area and compared with the long-term time-series data of
E.S.A. (Sicilian Agency of Agricultural Development). Freshwater inputs showed a strong seasonal
variability, and the estimated water exchange time () varied from 77 days during the first quarter of
the year to 115 days during the last quarter of the year. On an annual basis the estimated value of
was 105 days, Concerning the nutrient balance, DIP and DIN were positive for all seasons and, on
an annual basis, DIP is 0.024 mmol m-2 d-1 and DIN is 0.09 mmol m-2 d-1. Net ecosystem
metabolism [NEM or (p-r)] is -2.5 mmol C m-2 d-1 on an annual basis, suggesting a prevalence of
respiration processes. Denitrification prevailed over nitrogen fixation [(nfix-denit)<0].
Study area description
The study area is included in the inner area of the Life-Nature project of protection funded by the
European Union. The marshland has a total extent of 1.4 km2 and an average depth of 1.75 m. The
catchment area of the Capo Feto coastal zone (Figure 4.6) shows typical features of a southern
European wetland habitat (Figure 4.7): in summer it is dry except for the network of reclamation
channels and a few ponds, while in winter the Capo Feto area appears to be a typical wetland (Pernice
et al. 2001). Many ponds and marsh areas are filled with the characteristic wildlife of migratory and
sedentary birds. All drainage of the wetland is currently maintained by a network of 10 artificial
channels: the main channel is oriented east-west with perpendicular secondary channels, assuring the
drainage of groundwater and rainwater.
Figure 4.6. Location and map of Capo Feto.
85
In the 1970s, parts of Capo Feto were subjected to anthropic development related to agriculture,
tourism and urbanization. In the eighties, construction of the underground ItalianŁAlgerian methane
pipeline, which crosses the Capo Feto (Assessorato Territorio Ambiente Relazione 1984-85), strongly
changed the original features of the area. In addition, effects of recent global climate changes have
caused further modifications of the natural habitat.
Capo Feto has a typical mediterranean climate, characterized by high temperatures in summer and mild
conditions in winter. Because of its geographic position on the western coast of Sicily and its
geomorphology, Capo Feto, is exposed to strong and persistent winds (annual average is approximately
6.8 m sec-1) which have a strong influence on the climate (Pusceddu et al. 1997). In winter, winds
mainly blow from the west or north-west, while in spring-summer they are characterized by continuous
changes of direction and force. North winds are the steadiest, coldest and most persistent in duration,
while the "sirocco" is a typical muggy wind from the south-east which lasts 3-5 days and is strongest in
April-June. The wind from the north-west, locally called the "marascata", is cold, intense and has high
salt content. It causes damages to the plants of the coastal landscape. In autumn, the wind blows
mainly from the west ( "ponente").
The annual average temperature is approximately 17.1░C; the highest annual temperature is usually
recorded in August or, less frequently, in July with values of 30-32░C or as high as 37-38░C.
Minimum annual temperatures, on some January and February nights, rarely reach zero.
The average annual rainfall in the last ten years has been 415 mm, distributed over a period of 75 days.
This index of rainfall is among the lowest in Sicily. Moreover, most of the rain often occurs within a
few days, and it is not rare that in a single day 10% of the annual rainfall occurs. The precipitation in
autumn-winter is frequently of stormy origin with high intensity. In spring and summer, precipitation
is quite modest and less frequent.
The watershed of Capo Feto is about 45 km2, and contains an estimated population of about 6000. The
main activity is agriculture, in particular olives and vineyards but also some vegetables and fruit
cultivation. Few industrial activities are present, and these are mainly related to wine production. Due
to its touristic value, there are a lot of summer houses in the area.
For Capo Feto, water and nutrient budgets were estimated for 2001, before the beginning of the Life
Nature reclamation and environmental remediation works.
Water and salt balance
The study area has a long-term annual average rainfall of 124 mm, decreasing in the last fifty years.
Overexploitation of groundwater by agricultural and domestic wells has caused a drop in the average
level of groundwater and salt intrusion into the water table. The entire catchment area is dry in
summer except the network of reclamation channels and a few ponds.
The principal channel is about 5 m wide, with depths from 0.4 to 1.1 m. This channel contains water in
all seasons but while in winter, rainwater flows to the sea, in summer it's dry in the latter part.
The basin of a disused water-scooping machine located at the end of the channels network is full all
year round, and its depth is approximately 0.8 m. This water body collects the water of the channel
network which is not connected to the sea.
The water volume of the system was calculated by utilising the following experimental data: on the
calcareous stratum there are 5 m of palustrine sediments with a porosity average of 0.47 and an average
saturation index of about 70% (Life-Nature Project No. B34/006270/99, 2002). The water column in
the sediment is calculated as 1.65 m high which added to the mean surficial water layer (0.10 m) yields
a value for the mean depth of the system of 1.75 m.
86
The water inputs ( inputs) of the system are:
a) precipitation
(VP)
b) groundwater (VG)
The water outputs (outputs) of the system are:
a) evaporation
(VE)
b) residual and exchange flows with the sea (VR and VX).
The river input, VQ, and other water inputs, V0, are negligible.
The water budget was calculated on annual and seasonal bases for the year 2001, considering the
system in steady-state.
The precipitation data (VP) was collected by the meteorological station "Contrada Ramisella" located
near the Capo Feto wetland. Direct evaporation (VE) was calculated using Hargreaves' equation
(Shuttleworth 1993) and compared to experimental data.
The groundwater inputs (VG) were calculated by estimating seepage into the catchment basin.
The salt mass balance was calculated with data collected during a 4-season survey conducted in 2001
in which the sampling stations were located along three transects in the inner area (Badour 1987). In
summer, the salinity of the system is very high due to evaporation. Salinity of precipitation and
evaporation fluxes are considered zero.
The seasonal and annual budgets of water and salt are summarized in Table 4.7 and Figure 4.8, along
with the estimated water turnover time () of the Capo Feto marshland.
Table 4.7. Seasonal water budgets, salinity and water exchange time in Capo Feto in 2001.
*Annual Vx value is calculated as the time-weighted average of seasonal values.
Season
VG
VP
VE
VR
VX
SG
Ssyst
Ssea
(103 m3 d-1) (psu)
(days)
Jan-Feb-Mar 2.8 2.9 -2.1 -3.6 28.1 8.4 33.6 37.3 77
Apr-May-Jun 2.6 1.5 -3.1 -1.0 21.8 8.6 37.3 38.0 107
Jul-Aug-Sep 2.2 0.5 -6.5 3.8 22.5 9.8 46.3 38.2 93
Oct-Nov-Dec 2.4 1.9 -5.5 1.2 20.1 9.6 41.2 37.7 115
Annual
2.5 1.7 -4.3 0.1 23.1*
9.1 39.6 37.8 105
During the first six months of the year and especially in the first part, a net water export from the
wetland to the sea (VR negative) was estimated; this is because the input of rainfall and groundwater of
the system were greater than evaporation. In summer and in autumn, a net water import from the sea to
the wetland (VR >0) was observed; in fact, rainfall and groundwater inputs are lower than evaporation.
On an annual basis, VR is slightly positive indicating that evaporation prevails over water inputs and a
net water import from the sea are necessary to maintain the water volume of the system.
On an annual basis, the estimated water exchange time () is 105 days.
Budgets of non-conservative materials
The inorganic nutrient amounts for the analysis with the LOICZ budgeting of the Capo Feto wetland
has been determined by executing a series of samplings in the study area and the results of analysis are
summarized in Table 4.8.
87
Table 4.8. Nutrient concentrations in Capo Feto marshland (2001).
Season
DIPG
DIPsyst
DIPsea
DING
DINsyst DINsea
(mmol
m-3)
Jan-Feb-Mar
0.56 1.53 0.03 11.8 8.7 2.00
Apr-May-Jun
0.56 1.50 0.03 11.6 8.8 2.03
Jul-Aug-Sep
0.56 1.47 0.03 11.4 8.7 2.05
Oct-Nov-Dec
0.56 1.50 0.03 11.6 9.0 2.08
Annual
0.56 1.50 0.03 11.6 8.8 2.04
The main income of nutrient in the system has been to the flow of groundwater, because the territory
bordering with the wetland turns out cultivated in vineyard cultivation (European Environment Agency
report, 7/2001), that annually comes fertilized with nitrogen and phosphorus fertilizers. The amount of
inorganic phosphorus and nitrogen due incoming rainwater has bean considered null.
DIP balance
Annual and seasonal budgets for DIP are reported in Table 4.9and Figure 4.9.
Table 4.9. DIP budgets in Capo Feto marshland (2001).
Season VGDIPG
VRDIPR
VXDIPX
DIP
(mol d-1) (mol
d-1)
(mm ol m-2 d-1)
Jan-Feb-Mar 2 -3 -42 43 0.031
Apr-May-Jun 1
-1 -32 32 0.023
Jul-Aug-Sep 1 3 -32 28 0.020
Oct-Nov-Dec 1
1 -30 28 0.020
Annual
1 0 -34
33
0.024
The input of DIP to Capo Feto is assumed to come from groundwater since no data on precipitation are
available. The largest input was observed during the first three months of the year in parallel to the
higher input of groundwater and the agricultural fertilization period.
DIN balance
Annual and seasonal budgets for DIN are reported in Table 4.10 and Figure 4.10.
Table 4.10. DIN budgets for Capo Feto marshland in 2001.
Season VGDING VRDINR VXDINX
DIN
(mol d-1) (mol
d-1) (mmol
m-2 d-1)
Jan-Feb-Mar 33 -19 -188 174
0.12
Apr-May-Jun 30
-5 -148 123
0.09
Jul-Aug-Sep 25 20 -150 105
0.08
Oct-Nov-Dec 28
7 -139 104
0.07
Annual
29 1 -156
127 0.09
The DIN input to Capo Feto comes from groundwater since no data on precipitation are available. As
for DIP, the higher DIN input was observed in the rainy season along with the highest input of
groundwater and the fertilisation activities in the agricultural land. DIN inputs are dominated by
nitrate as for the nitrogen species in the water column of the wetland (Dallocchio et al. 1998).
88
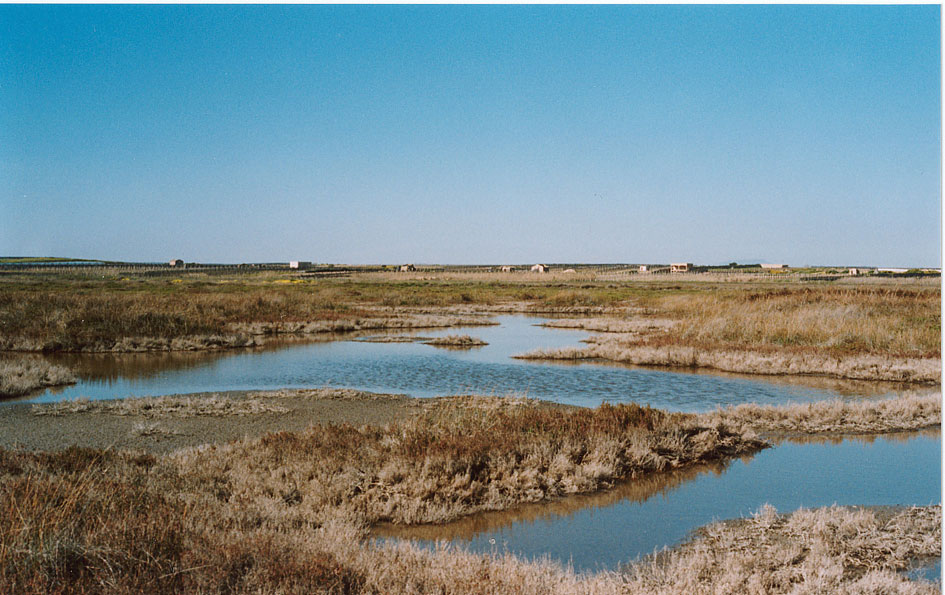
Stoichiometric calculations and aspects of the net system metabolism
On an annual basis, Capo Feto can be considered as a source of DIP and DIN from positive DIP
(0.024 mmol m-2 d-1 ) and DIN (0.09 mmol m-2 d-1 ) values calculated following the LOICZ
procedure.
Assuming a production of organic matter with a Redfield C:N:P ratio, the annual net ecosystem
metabolism (NEM), taken as the difference between ecosystem production and respiration (p-r), was -
2.5 mmol C m-2 d-1 in 2001 indicating that the system can be considered as net heterotrophic. Results
of the seasonal budgets are summarized in Table 4.10. The calculation of (nfix-denit) was negative for
all seasons indicating a dominance of denitrification processes over nitrogen fixation (-0.29 mmol m-2
d-1 on annual basis).
Table 4.10. Seasonal variations of DINexp, (nfix-denit) and net ecosystem metabolism (p-r) in
Capo Feto marshland in 2001 (unit: mmol m-2 d-1).
Season
DINexp
(nfix-denit)
NEM (p-r)
Jan-Feb-Mar 0.50 -0.38 -3.3
Apr-May-Jun 0.37 -0.28 -2.4
Jul-Aug-Sep 0.32 -0.24 -2.1
Oct-Nov-Dec 0.32 -0.25 -2.1
Annual
0.38 -0.29 -2.5
Figure 4.7. View of Capo Feto marshland.
89
VP = 1.7
VE = -4.3
VQ = 0
Capo Feto
VR = 0.1
VQ SQ=0
A
SR = 38.7
sys = 1.4x10⁶ m2
Ssea= 37.8
Vsys= 2.45x10⁶ m3
Ssys = 39.6 psu
VG = 2.5
= 105 days
VX= 23.1
VG SG= 22.75
Figure 4.8. Water and salt budgets for Capo Feto marshland. Water fluxes are expressed in 103
m3 d-1 and salinity in psu. Annual Vx value is the time-weighted average of seasonal values.
DIPP = 0 VP DIPP= 0
DIPQ = 0
DIPR = 0.76
VQ DIPQ=0
Capo Feto
VR DIPR = 0
DIPsys = 1.5 mmol m-3
DIPsea= 0.03
DIPsys= 33 mol d-1
DIPsys = 0.024 mmol m-2 d-1
DIPG = 0.56
VX DIPX= -34
VG DIPG = 1
Figure 4.9. DIP budget for Capo Feto marshland. Concentrations are in mmol m-3 and fluxes in
mol d-1. Annual values are calculated as the time-weighted average of seasonal values.
DINP = 0 VP DINP= 0
DINQ = 0
DINR = 5.42
VQ DINQ=0
Capo Feto
VR DINR = -1
DINsys = 8.8 mmol m-3
DINsea= 2.04
DINsys= 127 mol d-1
DINsys = 0.09 mmol m-2 d-1
DING = 11.6
VX DINX= -156
VG DING = 29
Figure 4.10. DIN budget for Capo Feto marshland. Concentrations are in mmol m-3 and fluxes in
mol d-1. Annual values are calculated as the time-weighted average of seasonal values.
90
4.3
Stagnone di Marsala Lagoon, western Sicily
Sebastiano Calvo1, Giuseppe Ciraolo2, Goffredo La Loggia2, Antonio Mazzola3, Agostino
Tomasello1, and Salvatrice Vizzini3
1Dipartimento di Scienze Botaniche, UniversitÓ di Palermo
2Dipartimento di Ingegneria Idraulica ed Applicazioni Ambientali, UniversitÓ di Palermo
3Dipartimento di Biologia Animale, UniversitÓ di Palermo
Summary
The Stagnone di Marsala is a large oligotrophic brackish lagoon situated on the west coast of Sicily,
Italy. It was studied in 1996, applying a single-box-single-layer LOICZ Biogeochemical Model. The
high salinity difference between the open sea and the system indicates that the water exchange was low
even if the two openings, positioned at the north and south, allow seawater inputs to cross the system.
An unexpectedly long water exchange time was calculated (about 65 days). The nutrient inputs were
from the sea and very low non-conservative fluxes were calculated for both DIN and DIP. The
Stagnone di Marsala seems to act as a net sink for DIN and as a source for DIP. NEM is very low (-
0.05 mmol m-2 d-1) and denitrification appears to prevail over N-fixation.
Study area description
The Stagnone di Marsala (37.83░N, 12.45░E) is a 21.35 km2 long
lagoon (about 1.8 km wide and 11 km long) on the north-western
coast of Sicily (Italy). The lagoon has a northern narrow and
shallow mouth to the sea (400 m wide, 0.3-0.4 m deep) and another
wider and deeper mouth to the south (1200 m wide, 1.0-1.5 m
deep). At the western end of the northern opening a 20 m wide, 1
m deep channel was dredged, enhancing the local flushing
capability. Inside the lagoon, next to the islands of Motia and
Santa Maria, there is a slightly submerged relict of a Phoenician
road which is effective in reducing flow, thus creating a low-
flushing sub-basin to the north-east (Figure 4.11). Because of the
small tidal range (about 0.3 m of astronomical component at spring
tide), lagoonal flushing is expected to be mainly wind- driven.
The climate of the region is mediterranean. Precipitation is
approximately 600 mm yr-1, with early spring and late autumn
peaks.
The basin is oligotrophic with chlorophyll-a concentrations of
about 1.0 Ąg l-1 (SarÓ et al. 1999). No freshwater input is present.
Seagrasses (Posidonia oceanica in the central-southern area and
Cymodocea nodosa in the northern) cover the sand-mud bottom.
C. nodosa and Caulerpa prolifera prairies are probably related to
Figure 4.11. Stagnone di
both low hydrodynamic conditions and different sedimentological
Marsala.
regimes, i.e. muddy bottoms. Indeed, on an empirical basis, such
physical conditions are known to be effective in determining the prevailing aquatic plant species. In
particular, in the northern basin of the lagoon a discontinuous P. oceanica meadow shows surfacing
reef formations ~2-3 m wide and atolls (10-20 m diameter), both representing about 12% of the total
coverage (Calvo et al. 1996).
91
The lagoon represents a biotype of great natural importance in the Mediterranean area, due to the
characteristics of the plant and animal species living in it. In particular, of utmost importance from an
ecological point of view are the P. oceanica meadows (plateau reef and barrier reef) located in the
vicinity of the coastal zone, which contribute to the maintenance of natural lagoon ecosystems (Calvo
et al. 1980). The importance of the bio-hydrodynamic equilibrium of the lagoon should be further
stressed. Qualitative hypotheses based on in situ observations have so far given indications about the
lagoon circulation (Mazzola and SarÓ 1995). Recently a slow but progressive increase in the level of
sedimentation has been detected in the openings between the lagoon and the sea (Agnesi et al. 1993)
due to both natural events (littoral drift and subsidence phenomena) and human interventions (waste
material along the shoreline). The dependence of the extent of coverage of P. oceanica on different
flushing capabilities of the lagoon has also been confirmed by a previous numerical investigation
carried out using a 2-dimensional depth-averaged model (Balzano et al. 2000).
The objective of this paper was to determine the water, salt and nutrient budgets of the Stagnone di
Marsala by applying the LOICZ budget modelling approach (Gordon et al. 1996).
From January to December 1996, temperature and salinity data were recorded within the Stagnone di
Marsala and the open sea. Water samples were collected in the lagoon and open sea and analysed for
nitrate, nitrite, ammonium and phosphorus concentrations using standard procedures (see respectively
Bendschneider and Robinson 1952; Wood et al. 1967; Catalano 1987; Murphy and Riley 1962). Air
temperature data were obtained from the local meteorological station (Areonautica Militare di Birgi,
Trapani). Data on the nutrient concentration of precipitation were not available. Evaporation was
calculated using the Hargreaves equation (Hargreaves 1975).
Water and salt balance
The water and salt budget of Stagnone di Marsala is shown in Figure 4.12. Freshwater inputs to the
lagoon from land are considered negligible since the Birgi River collects continental inputs and flows
into the open sea north, outside the Stagnone di Marsala. Precipitation data (VP) were obtained from
the National Hydrological Service database and evaporation losses (VE) were calculated according to
Hargreaves' equation.
To balance the water losses in evaporation, a net water input of about 19x103 m3 d-1 from the sea was
estimated (VR). Considering the salinity gradient between the lagoon system and the sea, the exchange
flux (VX) was calculated at about 300x103 m3 d-1. Salinity of the seawater connected with the lagoon is
36.80 psu. The estimated water residence time was about 65 days.
These calculated water fluxes are somewhat larger than, but of the same order of magnitude as
previous numerical simulations carried out in the same area (Balzano et al. 2000).
Budgets of non-conservative materials
The Stagnone di Marsala is an oligotrophic system with low nutrient concentrations, similar to those of
the open sea (Table 4.12). Throughout the study year the dominant form of DIN was nitrate, while
ammonium and nitrite concentrations were very low. The inputs of DIP and DIN to the lagoon were
from net water inputs from the open sea (VRDIPR, VRDINR), while outputs were from the water
exchanges between the sea and the lagoon system (VXDIPX, VXDINX). No data on dry deposition were
available, but is probable that atmospheric DIP and DIN inputs are very low in the Stagnone di
Marsala. For this reason these variables were assumed to be zero. Very low non-conservative fluxes
were obtained for both DIN and DIP.
92
Table 4.12. Nutrient concentrations (mmol m-3 ) in the Stagnone di Marsala and the open sea.
Year DIPsys DIPsea DINsys DINsea
1996 0.03
0.02 2.66 2.60
DIP balance
The annual dissolved inorganic phosphorus budgets are reported in Table 4.13 and the mass balance of
DIP are shown in Figure 4.13.
On an annual basis, DIP (non-conservative DIP fluxes) were positive, though very low, close to zero,
when referred to the surface area of the system. Outputs tend to be greater than inputs suggesting that
the Stagnone di Marsala acts as a source of DIP. DIP mobilization processes (DIP release) seem to
prevail over storage (DIP assimilation).
Table 4.13. DIP budget of the Stagnone di Marsala.
Year VRDIPR VXDIPX
DIP
mol d-1 mol
d-1 Ąmol
m-2 d-1
1996 0.47
-2.96
2.49
0.11
DIN balance
The data for the DIN budgets relative to the investigated period are summarized in Table 4.14 and the
mass balance of DIN are shown in Figure 4.14.
As with DIP, the nonconservative flux of DIN (DIN) calculated on surface basis was very low. The
negative value of DIN suggests a slight prevalence of DIN internal removal processes, mainly
assimilation by primary producers. Inputs are prevalent over outputs and the Stagnone di Marsala
tends to act as a net sink of DIN.
Table 4.14. DIN budget of the Stagnone di Marsala.
Year VRDINR VXDINX DIN
mol d-1 mol
d-1 Ąmol
m-2 d-1
1996 49.10 -17.74 -31.36 -1.47
Stoichiometric calculations of aspects of net system metabolism
The primary producers community of the lagoon is mainly represented by C. nodosa dense prairies.
The C:N:P ratio of this seagrass (Atkinson and Smith, 1993) was used for following stoichiometric
calculations, since no large variations of phytobenthic populations were observed during the last
decade.
Table 4.15. Net ecosystem metabolism (p-r) and (nfix-denit) of the Stagnone di Marsala.
Year NEM
(p-r)
DINexp
(nfix-denit)
mmol
m-2 d-1
1996 -0.046
0.002
-0.003
Cymodocea nodosa (C:N:P = 408:15:1)
The net ecosystem metabolism (NEM) or (p-r) was estimated by the DIP value, using the C:P ratio
reported in Table 4.15. The difference between production and respiration was -0.046 mmol m-2 d-1 for
the year under investigation. On the basis of these results, it may be inferred that the lagoon
metabolism is slightly heterotrophic.
93
The expected DIN was obtained by multiplying the DIP by the N:P ratio reported in Tables 4.13 and
4.15. Net nitrogen fixation minus denitrification (nfix-denit) was negative with -0.003 mmol m-2 d-1.
During the year studied, the gap between the observed and expected DIN (nfix-denit) indicates that
the denitrification losses dominated over nitrogen fixation.
VP=37
VE=-56
VQ= 0
SR= 38.00
Stagnone di Marsala
Area
VR = 19
sys = 21x106 m2
S
V
V
sea= 36.8
sys = 20x106 m3
G= 0
Ssys = 39.20 psu
V
X= 296
sys = 65 d
VO= 0
Figure 4.12. Water and salt budgets for Stagnone di Marsala Lagoon for 1996. Water flux units
are 103 m3 d-1 .
VRDIPR= 0.47
Stagnone di Marsala
DIPR = 0.025
DIPsys = 0.03 mmol m-3
DIPsea= 0.02
DIPsys = +2.49 mol d-1
VXDIPX= -2.96
Figure 4.13. Mass balance of DIP. Fluxes are mol d-1. Concentrations in mmol m-3 .
VRDINR= 49.1
Stagnone di Marsala
DINR = 2.63
DINsys = 2.26 mmol m-3
DINsea= 2.60
DIN = -31.4 mol d-1
VXDINX= -17.7
Figure 4.14. Mass balance of DIN in Stagnone di Marsala. Fluxes are mol d-1. Concentrations in
mmol m-3.
94
4.4
Marinello coastal system, north-eastern Sicily
Marcella Leonardi, Filippo Azzaro, Maurizio Azzaro, Alessandro Bergamasco, Franco Decembrini
Istituto per l'Ambiente Marino Costiero, Consiglio Nazionale delle Ricerche (CNR) - Sezione di
Messina
Summary
The Marinello coastal system is located on the Tyrrhenian coast of Messina province, Sicily (Italy) and
includes five ponds. Physical and chemical features of two of them were studied from April 1997 to
March 1998 in order to evaluate water and nutrient budgets using a single-box, single-layer LOICZ
biogeochemical model. Air temperature and rainfall records were obtained from the meteorological
station in Tindari. Estimated water exchange time varied from approximately two months for the outer
basin (Fondo Porto) in the wet period (October-March) to about one year for the inner basin (Verde) in
the dry period (April-September) depending on the variability of the inputs.
The ponds are net exporters of DIP to the sea in both periods, and appear to act as net sinks for DIP
(DIP < 0). High DIN concentrations were measured in both ponds during the wet season with values
four to five times higher than in the dry season.
The system is a net producer of organic matter (DIP<0 and NEM>0); this applies to both periods and
particularly to Verde pond. Nitrogen removal is generally balanced by nitrogen storage processes
during summer, while N-fixation prevails in the wet season.
Study area description
The Marinello coastal system (38.13░N, 15.05░E) is a small littoral area located behind the Tindari
Cliff in Patti Gulf (Messina, Italy), and currently comprises five small, deep ponds whose shape,
number and dimensions are continuously changing due to the rapid evolution of coastal morphology.
At present, the system covers an area of approximately 697,000 m2 (Figure 4.15).
Figure 4.15. Location and map of the Marinello coastal system.
95
Direct urban discharges are completely absent, but in summer the bay is subject to variable levels of
human pressure.
Each basin is affected by different kinds of water inflows. The outermost ponds are mainly influenced
by sea water inflows, through infiltration mechanisms or direct contribution during storms. Conversely,
the most important input to the three inner ponds is surface runoff, carrying dissolved and particulate
matter from the surrounding lands (often used for pasture or agricultural exploitation). The
heterogeneity of allochthonous inputs and inorganic enrichment (Azzaro 1995; Leonardi et al. 2000),
emphasized by the morphologic dynamism of this ecosystem (Leonardi and Giacobbe 2001; Leonardi
et al. 2001) determines the differentiation of trophic levels and salinity values among ponds.
In this paper we compare two very different basins of this coastal system: Fondo Porto pond and Verde
pond. The first features an area of 13,000 m2, a volume of 19,500 m3 and a mean depth of about 1.5 m.
Fondo Porto is a typical coastal pond with high salinity and low nutrient concentrations, its water
balance being strongly conditioned by seawater. Conversely, Verde pond exhibits an area of 17,000
m2, a volume of 27,200 m3 and a mean depth of 1.6 m. It is characterized by lower salinity and higher
nutrient loads from terrestrial and atmospheric sources. Water sources to the Verde pond become
enriched in organic and inorganic compounds due to their passage across the overhanging cliff, which
is heavily colonized by seagulls. This loading scenario combined with specific climatic conditions
(e.g., high summer temperatures) has occasionally resulted in dystrophic crises with anoxia and fish
mortality.
The water budgets were calculated for two periods: the dry one from April to September 1997 and the
wet one from October 1997 to March 1998, using a single-box, single-layer model. The budgetary
analysis was performed according to LOICZ Biogeochemical Budgeting Guidelines (Gordon et al.
1996).
The hydrological data used in the model were collected monthly from April 1997 to March 1998 in the
framework of the Finalized Project Cultural Heritage of the CNR, Italy. Since no water stratification
was observed and because of the shallowness of the basins (maximum depth 4.20 m), water samples
were collected at 0.25 m and assumed to be representative of the whole water column. Air temperature
and wet deposition data were obtained from the Tindari meteorological station (Regione Siciliana
2001). Evaporation was calculated using Hargreaves' equation (Hargreaves 1975).
Water and salt balances
The estimated budgets are shown in Table 4.16, annual budgets are shown in Figures 4.17 and 4.18 for
Verde and Fondo Porto ponds respectively.
The ponds do not receive direct fluvial inputs, so runoff inputs constitute the major contribution to VQ.
Highest values were calculated for the wet period in the Verde pond (VQ= 90 m3 d-1), which has a
wider drainage basin receiving surface runoff from the Tindari cliff (290 m).
Because of the small surface area of the systems, direct rainfall contribution was very low even in the
wet period (VP max= 8 m3 d-1 in the Verde pond).
In the Verde pond, freshwater inflows exceeded evaporation outflow and a net export of water from the
ponds was observed in both periods studied. The residual water flow was higher during October-
March (VR= -93 m3 d-1). In this basin water exchange times varied from three months (wet period), to a
little less than one year (dry period).
In the Fondo Porto pond, the inflow-outflow balance was in equilibrium during the dry period, while a
low outflow was estimated for the wet period. The water exchange times were shorter there than in
Verde pond, ranging between 2 and 8 months.
96
Table 4.16. Water fluxes, salinity and water exchange times for the Verde and Fondo Porto
ponds in the dry (April-September) and wet (October-March) periods (1997-98).
Period VQ
VG
VP
VE
VR
SQ
Ssyst
Ssea
VX
(m3 d-1)
(psu)
(m3 d-1)
(days)
Verde Apr-Sept 65 10 3 -50 -28 2.00
24.07
37.37 55
328
Oct-Mar 90 20 8 -25 -93 2.00
22.07
36.88 173 102
Annual 78 15 5.5 -38 -61 2.00
23.07
37.12 114 156
Fondo Apr-Sept 30 10 3 -40 -3 2.00 36.73 37.37 80
235
Porto
Oct-Mar 40 20 6 -20 -46 2.00
31.56
36.88 281 60
Annual 35 15 4.5 -30 -25 2.00
34.15
37.12 181 95
Balance of non-conservative materials
The DIP and DIN of the systems and their input and output environments are reported in Table 4.17.
DIP system concentrations were different for the two ponds, with highest concentrations in the Verde
pond during dry season. The values measured in Fondo Porto seemed to be close to that of the sea and
approximately half of those observed in the Verde Pond.
High values of DIN are found in both ponds during the wet season with concentrations four to five
times higher than in the dry season.
This contrasting behaviour of DIP and DIN in the two seasons for both ponds resulted in an unbalanced
Ntot/Ptot molar ratio relative to Redfield, with values of 5-7 in the dry period and values of about 36 in
the wet season. Nutrient ratios suggestive of N-limitation were recorded for the sea in both dry (6.6)
and wet (10) periods, but in the ponds the high value during the wet season suggests a switch to a N-
excess condition.
Table 4.17. Nutrient concentrations in mmol m-3 for input waters, in Verde and Fondo Porto
ponds and the adjacent sea in the dry (April-September) and wet (October-March) periods
(1997-98).
Verde Pond
Period DIPQ DIPG
DIPsyst
DIPsea
DINQ
DING DINsyst
DINsea
Apr-Sept 3.00 0.10 0.70 0.24 50 1.00 3.73 1.59
Oct-Mar 3.00 0.10 0.44 0.24 50 1.00 16.14 2.43
Annual
3.00 0.10 0.57 0.24 50 1.00 9.94 2.01
Fondo Porto pond
Period DIPQ DIPG
DIPsyst
DIPsea
DINQ
DING DINsyst
DINsea
Apr-Sept 0.60 0.10 0.31 0.24 10 1.00 2.29 1.59
Oct-Mar 0.60 0.10 0.22 0.24 10 1.00 8.03 2.43
Annual
0.60 0.10 0.27 0.24 10 1.00 5.16 2.01
On the basis of the available data, a first attempt was made to quantify the nutrient loads to the system.
Results are presented in Table 4.18. An annual load of about 20 kg-N year-1 was estimated for the
Verde pond, which corresponds to a specific load of 1.17 g N m-2 year-1; for phosphorus an annual load
of 2.65 kg-P year-1 was estimated, which corresponds to a specific load of 0.16 g-P m-2 year-1.
An annual load of about 1.9 kg-N year-1 was estimated for the Fondo Porto pond, which corresponds to
a specific load of 0.14 g N m-2 year-1; for phosphorus, an annual load of 0.25 kg-P year-1 was estimated,
which corresponds to a specific load of 0.02 g-P m-2 year-1.
97
Table 4.18. Estimated nutrient loads to Verde and Fondo Porto ponds in the dry (April-
September) and wet (October-March) periods (1997-98).
Phosphorus Nitrogen
mol
d-1
kg year-1
mol d-1
kg year-1
Apr-Sept Oct-Mar year
Apr-Sept Oct-Mar
year
Verde
0.196 0.272 2.65 3.26 4.52
19.87
Fondo
0.019 0.026 0.25 0.31 0.42 1.86
Porto
Total
0.215
0.298
2.90
3.57
4.94
21.73
DIP balance
The budgets for DIP are reported in Table 4.19. Annual values are reported in Figures 4.19 and 4.20
for Verde and Fondo Porto ponds respectively.
According to the assumptions of the LOICZ biogeochemical model, the DIP values suggest that both
ponds are moderate producers of organic matter in both periods. Verde pond had values of DIP of an
order of magnitude greater than Fondo Porto pond.
Table 4.19. DIP budgets for the Verde and Fondo Porto ponds in the dry (April-September) and
wet (October-March) periods (1997-98).
Period VQ DIPQ VG DIPG VR DIPR VX DIPX
DIP
(mmol
d-1) (mmol
d-1) (mmol
m-2 d-1)
Verde Apr-Sept
195 1 -13 -25 -158 -0.009
Oct-Mar
270 2 -32 -35 -205 -0.012
Annual
234 1.5 -25 -30 -182 -0.011
Fondo Apr-Sept
18 1 -1 -6 -12 -0.001
Porto Oct-Mar
24 2 -11 6 -
21 -0.002
Annual
21 1.5 -6 0 -17 -0.001
DIN balance
The budgets for DIN are reported in Table 4.20. Annual budgets are shown in Figures 4.21 and 4.22
for Verde and Fondo Porto ponds respectively. The DIN budgets generally show negative values of
DIN except in the wet season for Fondo Porto pond, when a net release of DIN from the system was
detected. On an annual basis this system acts as a net source of DIN.
Table 4.20. DIN budgets for the Verde and Fondo Porto ponds in the dry (April-September) and
wet (October-March) periods (1997-98).
Period VQ DINQ VG DING
VR DINR
VX DINX
DIN
(mol
d-1) (mol
d-1)
(mm ol m-2 d-1)
Verde Apr-Sept
3.25 0.01 -0.07 -0.12 -3.07 -0.18
Oct-Mar
4.50 0.02 -0.86 -2.37 -1.29 -0.08
Annual
3.88 0.015 -0.47 -1.25 -2.18
-0.13
Fondo Apr-Sept
0.30 0.01 -0.01 -0.06 -0.24 -0.02
Porto Oct-Mar
0.40 0.02 -0.24 -1.57 1.39
0.11
Annual
0.35 0.015 -0.13 -0.82 0.58
0.04
98
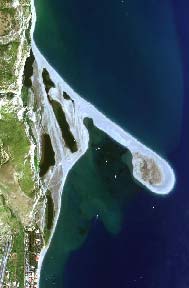
Stoichiometric calculations of aspects of net system metabolism
Both systems are characterized by a net production of organic matter (NEM >0) especially in the wet
period. Values of about 1.3 mmol m-2 d-1 found in Verde pond were an order of magnitude higher than
those of Fondo Porto pond.
The annual (nfix-denit) is close to zero, indicating a balance between denitrification and N-fixation
processes. In the dry season denitrification slightly prevails in Verde pond. In the wet season nitrogen
fixation shows a slight prevalence in both ponds.
Table 4.21. Evaluation of the ecosystem metabolism for Verde and Fondo Porto ponds in the dry
(April-September) and wet (October-March) periods (1997-98).
Period NEM
DINexp
(nfix-denit)
mmol
m-2 d-1
mmol m-2 d-1
mmol m-2 d-1
Verde Apr-Sept
0.95 -0.14 -0.04
Oct-Mar
1.27 -0.19 0.11
Annual
1.11 -0.17 0.04
Fondo Apr-Sept
0.11 -0.02 0.00
Porto
Oct-Mar
0.21 -0.03 0.14
Annual
0.16 -0.03 0.07
Figure 4.16. Aerial image of the Marinello coastal system.
99
VP=5.5
VE=-38
SR= 30.1
VQ= 78
Verde pond
VR = -61
SQ = 2
Areasys = 17000m2
VG = 15
V
Ssea= 37.12
sys = 27200 m3
S
S
sys = 23.07 psu
O = 0
V
sys = 156 d
X= 114
Figure 4.17. Water and salt budgets for Verde pond. Water fluxes are expressed in m3 d-1 and
salinity in psu.
VP=4.5
VE=-30
SR= 35.64
VQ= 35
Fondo Porto pond
VR = -25
SQ = 2
Areasys = 13000m2
V
V
G = 15
sys = 19500 m3
Ssea= 37.12
Ssys = 34.15 psu
S
O = 0
sys = 95 d
VX= 181
Figure 4.18. Water and salt budgets for Fondo Porto pond. Water fluxes are expressed in m3 d-1
and salinity in psu.
100
DIPP = 0
VPDIPP = 0
DIPQ = 3
VRDIPR = -23
Verde pond
VQ DIPQ = 234
DIPR = 0.41
DIPsys = 0.59 mmol m-3
DIP
DIP
G = 0.1
DIP
sea= 0.24
sys = -182 mmol d-1
V
DIP
G DIPG = 1.5
sys = -0.011 mmol m-2d-1
VXDIPX = -30
Figure 4.19. DIP budget for Verde pond. Concentrations are in mmol m-3 and fluxes in mmol d-1.
DIPP = 0
VPDIPP = 0
DIPQ = 0.6
VRDIPR = -6
Fondo Porto pond
VQ DIPQ = 21
DIPR = 0.25
DIPsys = 0.27 mmol m-3
DIP
DIP
G = 0.1
DIP
sea= 0.24
sys = -17 mmol d-1
V
DIP
G DIPG = 1.5
sys = -0.001 mmol m-2d-1
VXDIPX = 0
Figure 4.20. DIP budget for Fondo Porto pond. Concentrations are in mmol m-3 and fluxes in
mmol d-1.
101
DINP = 0*
VPDINP = 0
DINQ = 50
VRDINR = -0.47
Verde pond
VQ DINQ = 3.88
DINR = 5.97
DINsys = 9.94 mmol m-3
DING = 1
DIN
DINsea= 2.01
sys = -2.18 mol d-1
DIN
V
sys = -0.13 mmol m-2d-1
G DING = 0.015
VXDINX = -1.25
Figure 4.21. DIN budget for Verde pond. Concentrations are in mmol m-3 and fluxes in mol d-1.
(* assumed)
DINP = 0*
VPDINP = 0
DINQ = 10
VRDINR = -0.13
Fondo Porto pond
VQ DINQ = 0.35
DINR = 3.59
DINsys = 5.16 mmol m-3
DIN
DIN
G = 1
DIN
sea= 2.01
sys = 0.58 mol d-1
V
DIN
G DING = 0.015
sys = 0.04 mmol m-2d-1
VXDINX = -0.82
Figure 4.22. DIN budget for Fondo Porto pond. Concentrations are in mmol m-3 and fluxes in mol
d-1. (* assumed)
102
4.5 Ganzirri Lake, north-eastern Sicily
Alessandro Bergamasco1, Maurizio Azzaro1, Giuseppina Pulican“2, Giuseppina Cortese2, Marilena
Sanfilippo2
1 Istituto per l'Ambiente Marino Costiero, Consiglio Nazionale delle Ricerche (CNR) - Sezione di
Messina
2 Dipartimento di Ecologia Marina, UniversitÓ di Messina
Study area description
The Capo Peloro (Figure 4.23) is a coastal brackish system located on the north-eastern corner of Sicily
(Italy), 15 km north of Messina. It consists of two basins, Ganzirri Lake (or Pantano Grande) (Figure
4.24) and Faro Lake (or Pantano Piccolo), connected by a channel. Both of them communicate with
the Ionian Sea, and Faro Lake occasionally also exchanges water with the Tyrrhenian Sea.
38░ 16'
15░ 38'
Figure 4.23. The Capo Peloro brackish system, Sicily (Italy). Ganzirri Lake is the southernmost
basin.
Ganzirri Lake (38.26░ N, 15.62░ E) is the larger one, with a surface area of 0.338 km2, a major axis of
1670 m and an average width of 200 m. Its maximum depth is 6.5 m and its estimated volume
0.975x10⁶ m3 (Abbruzzese and Genovese 1952). Due to its location, Ganzirri Lake gathers a
considerable amount of freshwater from the land. As a consequence, and also due to its high surface to
103

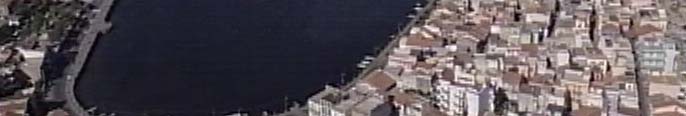
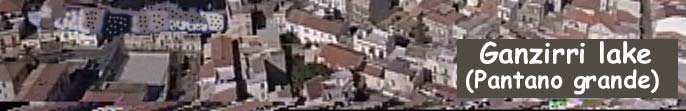
volume ratio, salinity and temperature variations induced by meteorological and climatic conditions are
important.
The northern zone of the lake, which accounts for one quarter of the total surface area, is relatively
shallow (maximum depth 1 m). It features a sandy bottom and large mats of the green alga
Chaetomorpha linum, covered with dense tufts of epiphytes whose decomposition leads in summer to a
significant oxygen uptake and hence to periodic dystrophic crises. Primary production in this zone is
due to both phytoplankton and green and red macroalgae. In the southern zone, human impact is more
direct due to the presence of the urban settlement of Ganzirri (population about 10,000). This zone has
been extensively exploited for over a century for mussel culture. It is characterized by muddy
sediments which become anoxic below the uppermost oxygenated layer. Primary production in the
southern zone is primarily due to phytoplankton.
The objective of this study was to estimate the water, salt and nutrient budgets for Ganzirri Lake by
applying the two-box, single-layer LOICZ budget modelling approach (Gordon et al. 1996). On the
basis of previous investigations, two different steady states were considered which correspond to the
warm and dry period (May-September) and to the cold and wet period (October-April). The data used
in the model were collected from May 1998 to April 1999. Physical and chemical features of the lake
were studied every two weeks in 10 sampling sites distributed throughout the lake and at the
connections between the lake and its input and output environments (Cortese et al. 2000). Standard
sampling and analytical procedures were applied (SIBM 1990). Air temperature and wet deposition
data were obtained from a meteorological station located in Ganzirri at sealevel (Regione Siciliana
2001).
Figure 4.24. Ganzirri Lake (Pantano Grande).
Water and salt balances
From the morphological and bathymetric points of view, Ganzirri Lake can be divided in two sub-
basins. The southernmost and inner basin has an average depth of 3.0 m and covers 0.253 km2,
approximately 75% of the total surface area. This inner basin can be assumed to be disconnected from
the sea and communicates only with the northernmost and shallower part (Figure 4.25).
Ganzirri Lake has no fluvial inputs (VQ=0). Major freshwater inputs in its inner part derive from direct
nonpoint civil discharges (VO inner) coming from urban settlements which are only partially sewered.
These discharges are season-dependent due to the strong increase in population during the summer
period. The outer basin (surface area 0.0846 km2 and mean depth 1 m) exchanges water with Faro
104
Lake through the Canale Margi (VO outer) and with the Ionian Sea through a narrow channel (Canale
Due Torri). Geomorphological features of the drainage area suggests that surface runoff is also
important and that groundwater inputs are present mainly in the inner part (VG), though a precise
evaluation of them is currently unavailable.
During the year considered in the study, direct rainfall to the lake was 705 mm, which is similar to the
typical annual rainfall recorded for the area over the last three decades (734 mm, CV 23). The rainfall
in the two periods was 160 mm in May-September (153 days) and 545 mm in October-April (212
days), a less extreme seasonal pattern than that of a typical year (129 mm and 612 mm in the two
periods).
Evaporation (VE) was estimated using Hargreaves' equation (Hargreaves 1975) and strongly exceeded
precipitation (VP) in the dry period.
V
V
P
E
VO
V
Inner
e
Outer
O
uter
[civil dischar
ha ges]
[f
[ rom
o
Faro Lake]
97
34
95
32
(32)
V
(11
(1 )
1
V
R
R
V
(31)
(11)
G
SEA
6.5m
1m
Figure 4.25. Schematic diagram of Ganzirri Lake showing main assumptions for modelling.
Estimated water exchange times in dry (wet) period are indicated for the two sub-basins.
The estimated budgets are shown in Table 4.22. Net export of water from the lake to the sea, indicated
by negative residual flow (VR), was observed in both periods, with higher values in the wet period
when the exchange flux VX is maximum. The estimated water exchange times are in the order of 1 to 3
months for the inner basin in the wet and dry periods respectively. The water exchange times of the
outer basin are of about 10 to 30 days in the same periods. As expected, the outer basin exhibits a
more dynamic behaviour, with water exchange times three times shorter than those of the inner one.
Time-weighted annual water budget are reported in Figure 4.26.
105
Table 4.22. Water fluxes, salinity and water exchange times for the two sub-basins of Ganzirri
Lake in the two periods considered (1998-99). * time-weighted.
Period
VG
VO
VP
VE
VR
SO
Ssyst
Ssea
VX
(103 m3 d-1) (psu)
(103 m3 d-1) (days)
Outer May-Sept
- 0.70 0.10 0.49 -0.92 32.90 32.60 38.00 1.75
32
basin (153 days)
Oct-Apr
- 0.70 0.19 0.25 -1.86 30.30 30.80 38.00 5.90
11
(212 days)
Annua*l
- 0.70 0.15 0.35 -1.47 31.39 31.55 38.00 4.18
15
Inner May-Sept 1.00 0.80 0.29 1.48 -0.61 0.00 30.00 -
7.34
95
basin (153 days)
Oct-Apr 1.00 0.40 0.56 0.74 -1.22 0.00 29.20 -
22.88
31
(212 days)
Annual* 1.00 0.57 0.45 1.05 -0.96 0.00 29.54 -
16.37
44
Balance of non-conservative materials
Ganzirri Lake exhibits nutrient concentration patterns with features intermediate between the inflowing
waters from the land and the open sea (Table 4.22) and shows evidence of nitrogen enrichment of a
naturally oligotrophic ecosystem.
DINsyst and DIPsyst concentrations are more or less similar for the two sub-basins, with DIN higher in
wet season and DIP higher in dry season according to the input variations and the different
consumption processes.
Table 4.23. Nutrient concentrations for the input waters, Ganzirri Lake and adjacent sea in the
two periods considered (1998-99).
Period DIPO
DIPsyst
DIPsea
DINO
DINsyst
DINsea
(mmol
m-3)
Outer May-Sept 3.00 0.29 0.21 50 6.26 4.00
basin
Oct-Apr
2.00 0.15 0.13 30 11.20 1.61
Inner May-Sept 3.00
0.21 - 150
6.02 -
basin
Oct-Apr
2.00 0.13
-
100 14.76 -
On the basis of the available data, a first attempt was made to quantify the nutrient loads to the Lake.
Results are presented in Table 4.24. For nitrogen, an annual load of 0.51 T yr-1 was estimated, which
corresponds to a specific load of 1.5 g-N m-2 year-1; for phosphorus a load of 0.04 T yr-1 was estimated,
which corresponds to a specific load of 0.1 g-P m-2 year-1.
106
Table 4.24. Estimated nutrient loads to Ganzirri Lake in the two periods considered (1998-99).
Phosphorus Nitrogen
mol
d-1
T yr-1 mol
d-1
T yr-1
May-Sept
Oct-Apr
Annual
Annual
May-Sept Oct-Apr Annual Annual
Outer
2.10 1.40 1.7 0.02 35
21 26.9 0.14
basin
Inner
2.40 0.80 1.5 0.02 120
40 73.5 0.38
basin
Total
4.50
2.20
3.17
0.04
155
61
100.5
0.51
DIP balance
The budgets for DIP are reported in Table 4.25. In both periods, DIP (non-conservative DIP fluxes)
are negative for both sub-basins with absolute values higher during the dry period, when DIP storage
processes prevail (assimilation).
The lake acts as a net exporter of DIP to the sea in both dry and wet periods (VRDIPR<0); in particular
the outer basin seems to feed DIP also to the inner one (VXDIPX inner > 0 and VXDIPX outer <0). Time-
weighted DIP annual budget are reported in Figure 4.27.
Table 4.25 DIP budgets for the two sub-basins of Ganzirri Lake in the two periods considered
(years 1998-99). * time-weighted
Period VO DIPO VR DIPR VX DIPX
DIP
(mol
d-1) (mol
d-1) (mmol
m-2 d-1)
Outer
May-Sept
2.10 -0.23 -0.14 -1.29
-0.015
basin
Oct-Apr
1.40 -0.26 -0.12 -0.73
-0.009
Annual*
1.69 -0.25 -0.13 -0.96
-0.011
Inner
May-Sept
2.40 -0.15 0.59 -2.84
-0.011
basin
Oct-Apr
0.80 -0.17 0.46 -1.09
-0.004
Annual*
1.47 -0.16 0.51 -1.82
-0.007
DIN balance
The budgets for DIN are reported in Table 4.26.
For the outer basin, DIN (non-conservative DIN fluxes) are negative in both periods with absolute
values higher during the wet period. This means that removal processes by primary producers are
prevalent in that basin.
Values of opposite sign were found for the inner basin in the two periods. If compared to the yearly
basis (weighed average) they are close to the balance, so that in the inner basin processes of storage
and removal of DIN seem to balance each other during the year. Time-weighted DIN annual budget
are reported in Figure 4.28.
107
Table 4.26. DIN budgets for the two sub-basins of Ganzirri Lake in the two periods considered
(years 1998-99). * time-weighted
Period VO DINO VR DINR
VX DINX
DIN
(mol
d-1) (mol
d-1) (mmol
m-2 d-1)
Outer May-Sept
35.0 -4.7 -4.0 -28.2 -0.33
basin
Oct-Apr
21.0 -11.9 -57.0 -49.4
-0.58
Annual*
26.9 -8.9 -34.8 -40.5 -0.48
Inner May-Sept
120.0 -3.7 1.8 -118.1 -0.47
basin
Oct-Apr
40.0 -15.8 -81.5 57.3
0.23
Annual*
73.5 -10.7 -46.6 -16.2
-0.06
Stoichiometric calculations of aspects of net metabolism
The system is a net producer [DIP<0 and NEM>0] of organic matter; this seems valid for both sub-
basins and particularly during summer periods (Table 4.27).
The term (nfix-denit) is generally negative. This indicates a prevalence of nitrogen removal processes
(such as denitrification) over N-fixation. Processes of direct removal of algal biomass are also
important, such as the natural export to the sea of free-floating algal sheets and biomass harvesting for
management purposes.
Table 4.27. Evaluation of the ecosystem metabolism for the two sub-basins of Ganzirri Lake in
the two periods considered (year 1998-99). * time-weighted
Period NEM
DINexp
(nfix-denit)
mmol
m-2 d-1
mmol m-2 d-1
mmol m-2 d-1
Outer May-Sept
1.59 -0.24 -0.09
basin
Oct-Apr
0.95 -0.14 -0.44
Annual*
1.22 -0.18 -0.29
Inner May-Sept
1.17 -0.18 -0.29
basin
Oct-Apr
0.42 -0.06 0.29
Annual*
0.73 -0.11 0.05
108
VP= 0.45
VE= 1.05
VP= 0.15
VE= 0.35
VO=0.57
V
Inner box
Outer box
O= 0.70
V
R= -0.96
Ssea= 38
Area= 0.253 km2
Area= 0.085
VR= -1.47
Ssys = 29.54
km2
V
= 44d
Ssys = 31.55
G= 1.00
VX= 16.37
= 15d
VX=4.16
Figure 4.26. Water and salt budgets for Ganzirri Lake. Water fluxes are expressed in 103 m3 d-1
and salinity in psu.
DIPP=0 DIPP=0
DIPO=2.42
DIPO= 2.42
Inner box
Outer box
DIP
V
R= 0.19
DIPsys = 0.21
V
ODIPO= 1.47
ODIPO=1.69
DIPsys = 0.16
DIP = -0.96
DIP = -1.82 mol d-1
VRDIPR= 0.16
mol d-1
DIPR= 0.19
DIP = -7 Ąmol m-2 d-1
DIP = -11 Ąmol
DIP
V
G= 0
m-2 d-1
RDIPR= -0.16
VXDIPX= 0.51
VXDIPX=-0.13
Figure 4.27. DIP budget for Ganzirri Lake. Concentrations are in mmol m-3 and fluxes in mol d-1.
109
DINP=0 DINP=0
DIN
DINO= 38.4
O=121
Inner box
Outer box
DINR= 10.1
DINsys = 9.1
V
VODINO=26.9
ODINO= 73.53
DINsys = 11.1
DIN = -40.5
DIN = -16.2 mol d-1
VRDINR= -10.7
mol d-1
DINR= 5.9
DIN = -60 Ąmol m-2 d-1
DIN = -480
Ąmol m-2 d-1
DIN
VRDINR= -8.9
G= 0
VXDINX= -46.6
VXDINX=-34.5
Figure 4.28. DIN budget for Ganzirri Lake. Concentrations are in mmol m-3 and fluxes in mol d-1.
110
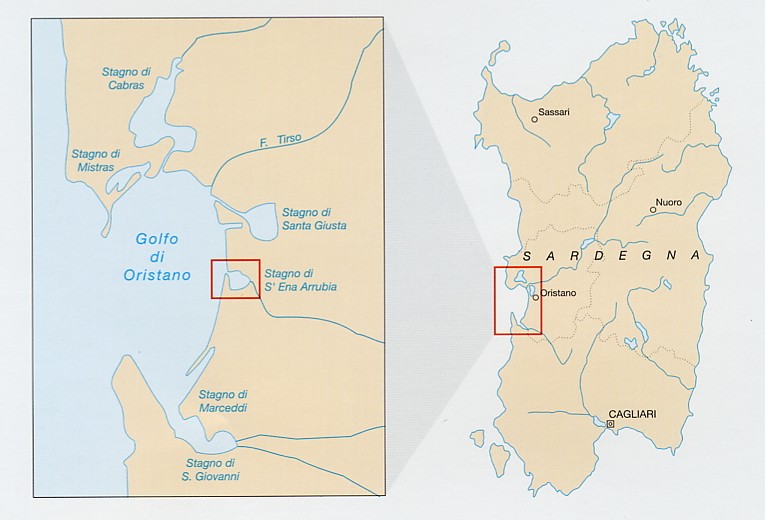
4.6
S'Ena Arrubia Lagoon, western Sardinia
Felicina Trebini, Mario Bachisio Padedda, Giulia Ceccherelli and Nicola Sechi
Dipartimento di Botanica ed Ecologia vegetale, UniversitÓ di Sassari
Study area
S'Ena Arrubia Lagoon (Figures 4.29 and 4.30) is located along the central western coast of Sardinia
(39.83░ N, 8.57░ E); it is 1.2 km2 in area and has a mean depth of 40 cm. Freshwater input is supplied
from the watershed by two rivers: Rio Sant'Anna (also called Diversivo), which drains an area of 78.4
km2 and showed no runoff from April 2001 to March 2002; and the Canale delle Acque Basse, (Figure
4.37) which drains 50 km2 mostly originating from the drying up of a pond over 3000 ha wide and
dedicated mainly to farming and cattle-breeding. This channel is below sea level and water is pumped
from it into the lagoon. The lagoon communicates with the sea through a channel about 40 m wide,
230 m long and 1 m deep. The lagoon is very eutrophic (Sechi 1982; Fiocca et al. 1996) and
dystrophic crises and fish kills occur occasionally. Anoxia and dystrophic crises were observed as
early as the 1960s. Phytoplankton exhibit intense blooms in spring, especially due to Cyclotella
atomus and Chlorella sp. The macroalgal component, mostly consisting of Ulva sp. and Enteromorpha
flexuosa (K³tzing) DeToni, becomes abundant in late spring-summer. Water characteristics show
considerable variations. Salinity, for example, fluctuates greatly depending on the prevalent inputs
(fresh or marine waters), while nitrogen and phosphorus can reach very high and abrupt peaks. The
particular dynamics are determined by the quantity of input waters from the Canale delle Acque Basse,
the source of most of the freshwater to the lagoon. The climate of the lagoon is Mediterranean, with a
long hot summer and short mild rainy winter.
Figure 4.29. Location of S'Ena Arrubia Lagoon.
The LOICZ model was applied to data obtained between April 2001 and March 2002, during which an
intensive investigation was carried out. In this period, precipitation and water inflows were lower than
111
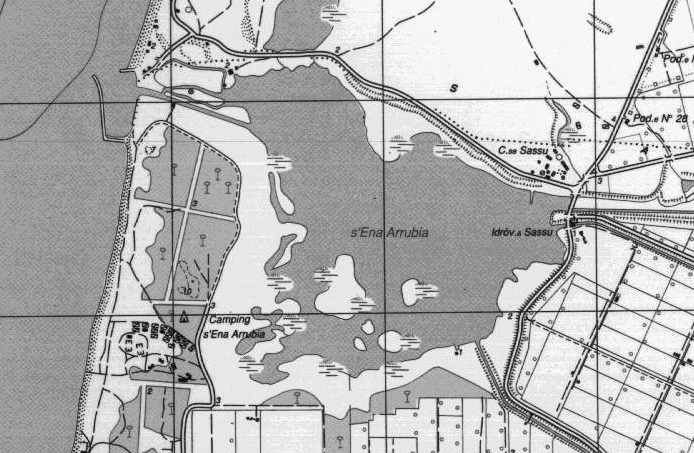
the average of the previous fifty-year period (360 mm versus 650 mm). Samples for phytoplankton
and water chemical analyses were collected at weekly intervals from June to September and each
month for the rest of the period; macroalgal samples were collected monthly in three areas of the
lagoon and repeated three times for each area.
Figure 4.30. Map of S'Ena Arrubia Lagoon.
Budgets were calculated seasonally except for October, which was considered separately, as its
hydrology is very different from that of November and December (see Figure 4.31 for rainfall data).
Because the lagoon is characterized by small size and low depth, the one-box, one-layer model was
used. The LOICZ model has been previously applied in S'Ena Arrubia Lagoon for the 1994-1995
period (Giordani et al. 2001).
Water and salt balance
Inputs showed salinity values between 3 and 5. Evaporation values were calculated according to
Hargreaves' equation (Hargreaves 1975). Data relating to the groundwater supplies (SG) are not
available, but because most of the basin from which inputs flow is below sealevel, they are assumed to
be zero, as are VPSP, VOSO and VPSE. Seasonal budgets are reported in Table 4.28 and the annual
budget is shown in Figure 4.32. VR values were always negative. The November-December period is
distinctive because VX was higher and water exchange faster, whereas the summer quarter exhibits
longer residence time due to lower freshwater inputs.
112
Figure 4.31. Precipitation dynamics in S'Ena Arrubia Lagoon.
Budgets of non-conservative materials
Concentrations of dissolved inorganic phosphorus (DIP) and dissolved inorganic nitrogen (DIN) in
inflow waters, the system and the adjacent sea are reported in Table 4.29.
DIP balance
DIP values present in precipitation waters are considered negligible and so equivalent to zero. DIP
values measured in inflow waters were always rather high, particularly in spring and autumn months,
with a maximum in October (17.7 mmol m-3); in the lagoon, they ranged between 1.1 and 2.6 mmol m-
3. DIP seasonal budgets are reported in Table 4.30 and annual budget is reported in Figure 4.33. DIP
was negative in every period except November-December; in general, inputs were higher than outputs
and this indicates that storing of inorganic phosphorus prevailed over mobilisation.
Table 4.28. Seasonal budgets of water, salinity and residence time in S'Ena Arrubia Lagoon.
Water flux was expressed in 103m3d-1, salinity in psu and residence time in days.
Season VQ
VP
VE
VR
SQ
Ssyst
Socn
VX
Apr-May-Jun 01
25.4 0.6 3.0
-23.0 2.6 29.3 35.6 108.2 4
July-Ago-Sep 01
10.9 0.2 3.2 -7.9 3.2 32.8 37.2 54.9 8
Oct 01
10.8 0.1 1.9 -9.0 2.8 34.6 37.0 121.7 4
Nov-Dec 01
32.9 2.9 1.0
-34.8 1.9 33.6 37.0 342.9 1
Jan-Feb-Mar 02
33.4 1.2 1.4 -33.2 3.8 22.4 37.0 58.8 5
Annual (time-weighted)
23.7 1.0 2.2
-22.5 2.9 29.6 36.7 123.0 3
Table 4.29. Seasonal concentration of nutrients (mmol m-3) in S'Ena Arrubia Lagoon.
Season DIPQ DIPsyst DIPocn DINatm DINQ DINsyst DINocn
Apr-May-Jun 01
15.2 2.6 0.11 46 80.1 3.6 1.30
July-Ago-Sep 01
12.3 1.5 0.08 46 43.6 14.4 0.85
Oct 01
17.7 1.1 0.03 46 49.6 2.9 1.13
Nov-Dec 01
7.7 1.1 0.12 46 75.8 15.4 2.36
Jan-Feb-Mar 02
14.0 1.4 0.08 46 145.0 9.6 2.54
113
Table 4.30. Seasonal DIP budgets in S'Ena Arrubia Lagoon.
V
V
V
Season
Q DIPQ
R DIPR
X DIPX
DIP
DIP
mol d-1
mol d-1
mol d-1
mol d-1
Ąmol m-2 d-1
Apr-May-Jun 01
386 -31 -269
-86 -72
July-Ago-Sep 01
134 -6 -78
-50 -42
Oct 01
191 -5 -130
-57 -47
Nov-Dec 01
253 -21 -336
+101 87
Jan-Feb-Mar 02
468 -25 -78
-365
-304
Annual (time-weighted)
304 -19 -173
-111 -93
DIN balance
In calculating the DIN budget, significant supplies of DIN present in precipitation were considered; as
data of the studied period were not available, data of 1992-1996 relative to the previous study carried
out on the same site are used.
DIN seasonal budgets are reported in Table 4.31 and the annual budget is shown in Figure 4.34.
Table 4.31. Seasonal DIN budgets in S'Ena Arrubia Lagoon.
V
V
V
V
DIN
DIN
Season
atm DINatm
Q DINQ
R DINR
X DINX
mol d-1
mol d-1
mol d-1
mol d-1
mol d-1
mmol m-2 d-1
Apr-May-Jun 01
28 2035
-56 -249
-1758 -1.47
July-Ago-Sep 01
9 475
-60
-744
320 0.27
Oct 01
5 536
-18
-215
-308
-0.26
Nov-Dec 01
133 2494
-309 -4471
2153 1.79
Jan-Feb-Mar 02
55 4843
-202 -415
-4281 -3.57
Annual (time-weighted)
45 2284
-132
-1117
-1080 -0.90
DIN is negative in April-June, October and January-March showing a dominance of uptake processes
over releases, which conversely dominate (positive values) in November-December and July-
September (1.79 mmol m-2 d-1 and 0.27 mmol m-2 d-1 respectively).
Stoichiometric calculations relative to the net metabolism of the system
Studies of biotic data from 2001 to 2002 (Trebini 2003) showed that primary production is mainly
performed by phytoplankton in late autumn and winter and by macroalgae in the remaining period
(Figure 4.35); considering these results two different ratios C:N:P were assumed: the Redfield ratio
(106:16:1) was used in autumn-winter (October, November-December and January-February-March)
whereas the Atkinson and Smith ratio for Ulva sp. (336:35:1) (1983) was preferred for the period from
April to September because Ulva sp. was more abundant then Enteromorpha flexuosa.
Calculations (Table 4.32-A) show that nitrogen fixation generally prevailed over denitrification: the
highest value, 1.74 mmol m-2 d-1, occurred in the July-September quarter. With the exception of
November-December, very high values of net ecosystem metabolism (NEM or (p-r)) were detected
throughout the investigation period, so that there is a prevalence of productive processes. The highest
value is that for the January-March quarter, equivalent to 32.2 mmol m-2 d-1. The negative NEM in
November-December (-9.2 mmol m-2 d-1) could be due not only to the low production rates but also to
high decomposition rates of organic substances produced during the summer months.
114
Because the 1994 to 1995 study used the Redfield ratio (106:16:1) for all the seasons (Giordani et al.
2001), the same was applied to the data from April to September 2001. Results did not show great
differences in the general patterns (Table 4.32-B): lower NEM and (nfix-denit) values were estimated
in the warm months and a slightly negative value for (nfix-denit) was observed during April-June (-
0.32 mmol m-2 d-1).
Table 4.32-A. Seasonal variation of (nfix-denit) and net ecosystem metabolism (p-r) (Atkinson
and Smith ratio and Redfield ratio).
C:N:P
DIN
(nfix-denit)
(p-r)
Season
exp
ratio
(mmol m-2 d-1)
(mmol m-2 d-1)
(mmol m-2 d-1)
Apr-May-Jun 01
336:35:1 -2.52
1.05
24.2
July-Ago-Sep 01
336:35:1 -1.47
1.74
14.1
Oct 01
106:16:1 -0.75
0.49
5.0
Nov-Dec 01
106:16:1 1.39
0.40
-9.2
Jan-Feb-Mar 02
106:16:1 -4.86
1.29
32.2
Annual (time-weighted)
-2.03 1.13 16.41
Table 4.32-B. Seasonal variation of (nfix-denit) and net ecosystem metabolism (p-r) (Redfield
ratio for all seasons).
C:N:P
DIN
(nfix-denit)
(p-r)
Season
exp
ratio
(mmol m-2 d-1)
(mmol m-2 d-1)
(mmol m-2 d-1)
Apr-May-Jun 01
106:16:1 -1.15
-0.32
7.6
July-Ago-Sep 01
106:16:1 -0.67
0.94
4.5
Oct 01
106:16:1 -0.75
0.49
5.0
Nov-Dec 01
106:16:1 1.39
0.40
-9.2
Jan-Feb-Mar 02
106:16:1 -4.86
1.29
32.2
Annual (time-weighted)
-1.49 0.58 9.86
Conclusions
A prevalence of nutrient uptake over release was observed in the lagoon (DIP and DIN were
negative in most of the period); the positive values calculated for November-December for DIP and
also for July -September for DIN indicate that mobilization processes prevailed occasionally.
It can be deduced from the (nfix-denit) values that nitrogen fixation prevailed consistently over
denitrification; these results confirm findings of previous studies relative to the application of the
LOICZ model to the 1994-1995 period (Giordani et al. 2001). Further, (nfix-denit) values were lower
than 2 mmol m-2 d-1 while, in the 1994-95 application, (nfix-denit) values were higher than 2 mmol m-2
d-1 in the autumn months.
NEM was generally positive: the productive processes in the lagoon seem to prevail over respiration
throughout most of the year. These results, as already pointed out by Giordani et al. (2001) confirm
that S'Ena Arrubia Lagoon should be considered an autotrophic system. However, a negative value
between November and December appeared in NEM values, which, while not reported in 1994-1995,
suggests that respiration can prevail over production in some periods.
115
VP = 1.0
VE = -2.2
VQ = 23.7
SR = 33.2
S'Ena Arrubia Lagoon
SQ = 2.9
VR = -22.5
V
Area
Ssea = 36.7
O = 0
sys = 1.2 106 m2
Vsys = 4.8 105 m3
V
V
O SO = 0
Ssys = 29.6 psu
X = 123.0
sys = 4 d
Figure 4.32. Water and salt budgets for S'Ena Arrubia Lagoon. Water fluxes are expressed in 103
m3 d-1 and salinity in psu. Values were calculated as annual weighted averages of seasonal results.
DIPP = 0
VPDIPP = 0
DIPQ = 13.1
VRDIPR = -19
S'Ena Arrubia Lagoon
VQ DIPQ = 304
DIPR = 0.9
DIPsys = 1.6 mmol m-3
DIPO = 0
DIP
DIP
sea= 0.1
sys = -111 mol d-1
DIPsys = -0.09 mmol m-2d-1
VO DIPO = 0
VXDIPX = -173
Figure 4.33. DIP budget for S'Ena Arrubia Lagoon. Concentrations are in mmol m-3 and fluxes in
mol d-1. Values were calculated as annual weighted averages of seasonal results.
DINP = 46
VPDINP = 45
DINQ = 83.6
VRDINR = -132
S'Ena Arrubia lagoon
VQ DINQ = 2284
DINR = 5.7
DINsys = 9.7 mmol m-3
DINO = 0
DIN
DIN
sea = 1.7
sys = -1080 mol d-1
DINsys = -0.90 mmol m-2d-1
VO DINO = 0
VXDINX = -1117
Figure 4.34. DIN budget for S'Ena Arrubia Lagoon. Concentrations are in mmol m-3 and fluxes in
mol d-1. Values were calculated as annual weighted averages of seasonal results.
116
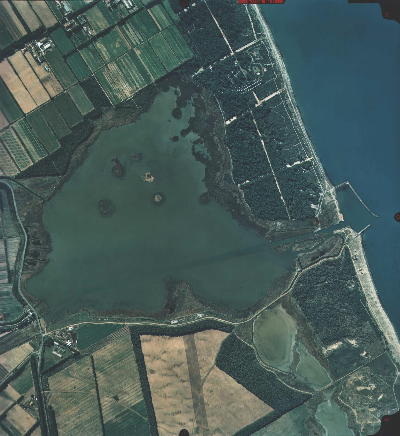
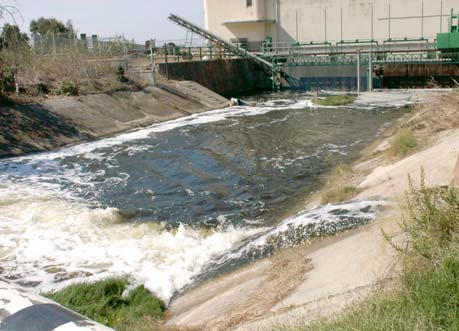
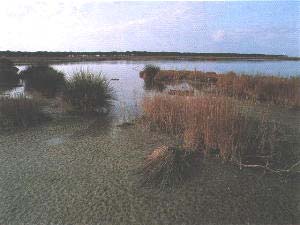
Figure 4.35. Chlorophyll a and macroalgae biomass dynamics.
Figure 4.36. Aerial view of S'Ena Arrubia Lagoon.
Figure 4.37. Canale delle acque basse and
Figure 4.38. View of S'Ena Arrubia Lagoon.
pumping station.
117
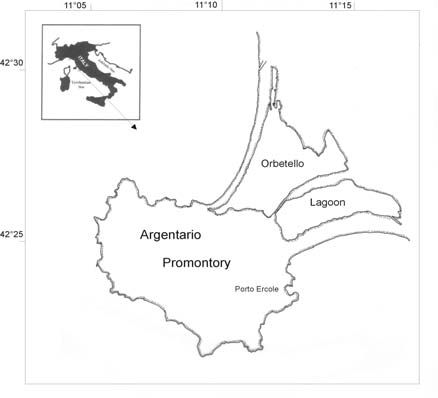
5
COASTAL SYSTEMS OF THE TYRRHENIAN SEA (WEST COAST)
5.1 Lagoon of Orbetello, Tuscany
Paola Gennaro1, Mauro Lenzi2, Salvatore Porrello1
1 Istituto Centrale per la Ricerca scientifica e tecnologica Applicata al Mare (ICRAM), Roma
2 Laboratorio di Ecologia Lagunare e Acquicoltura (LEALab), Orbetello Pesca Lagunare S.r.l.,
Orbetello (Grosseto)
Study area description
The Lagoon of Orbetello is located in southern Tuscany, on the west coast of Italy (Figure 5.1),
between 42.41░ N, 11.17░ E and 42.48░ N 11.28░ E, and covers a total area of 25.25 km2. This lagoon
consists of two communicating basins known as Ponente (West) and Levante (East) measuring in area
respectively 15.25 and 10.0 km2 (values according to Travaglia and Lorenzini, 1985, modified as a
result of recent filling operations), with an average depth of about 1 m.
Over the past thirty years, the Lagoon of Orbetello, as with many other coastal environments in the
world (Morand and Briand 1996) has developed considerable seaweed (macroalgae) proliferation (see
Lenzi 1992 and Bombelli and Lenzi 1996, for detailed reviews).
This phenomenon depends mostly on intensive aquaculture and agricultural activities, as well as the
discharge of treated/untreated urban wastewater, which increased strongly as a consequence of the
development of the tourist trade (Lenzi 1992). The increase in eutrophication has gradually led to
qualitative and quantitative changes in the vegetation from seagrasses (phanerogams) to macroalgae
(Figure 5.2). Various species of opportunistic macroalgae have thus alternated in the dominance of the
submerged vegetation (Lenzi and Mattei 1998). Macroalgal blooms began to appear in the mid-1960s
and have been periodically accompanied by microalgal blooms (Tolomio and Lenzi 1996). The algal
masses produced almost uninterruptedly throughout the year are moved by the winds and accumulate
at high densities, sometimes exceeding 20 kg m-2 (Lenzi, unpublished data). Decomposition of the
seaweed biomass in summer, and the subsequent sulphate reduction processes, cause a drastic decrease
of dissolved oxygen and development of toxic reducing gases, and are the main causes of aquatic
fauna mortality (Izzo and Hull 1991). These harsh environmental conditions led to a reduction in the
quantity and quality of the fish output from the lagoon beginning in the 1980s (Lenzi 1992) and the
outflow of discolored water to the adjacent beach areas caused a problem for tourism.
Figure 5.1. Location and map of the Lagoon of Orbetello.
118
A basin authority (Lagoon of Orbetello Environmental Reclamation Authority, OLERA) was set up to
implement action strategies that could solve the environmental crisis. The OLERA acted in three main
ways: removal of the macroalgal masses from the lagoon; increasing the inputs of clean seawater in
the lagoon; reduction of nutrients originating from human activities (Lenzi and Mattei 1998).
Action was also taken to increase water renewal, through the three sea-lagoon canals. The hydraulic
model proposed by Bucci et al. (1989) was adopted as a basis for the environmental management
activity in the lagoon. This consisted essentially of pumping water from two sea-lagoon canals into the
lagoon, and allowing it to exit through the third canal. After the establishment of the OLERA, the
pumping was boosted from 8000 l s-1 to 20,000 l s-1. The pumping rate is intensified in the warmer
months. All domestic wastewaters, previously discharged directly in the lagoon, are collected and
pumped to a treatment plant. The treatment plant effluent is discharged into a bounded shallow
phytotreatment pond (marginal lagoon area) of about 12 hectares (Figure 5.3). The phytotreatment
effluent water is then discharged into the main lagoon. Using this system it was possible to decrease
the nutrient concentrations of these discharges with benefits to the whole lagoon (Lenzi et al. 1998a).
Four large aquaculture plants discharge their waste water into the lagoon. The two largest plants
discharged their effluent into a semi-closed 9 hectare area that was delimited by an embankment in
1996. The water from the two phytotreatment ponds and the wastewater from the two smallest
fishfarms constitute persistent anthropogenic sources of N and P.
OLERA activities have thus resulted in a significant reduction in algal biomass production in the
lagoon (Lenzi and Mattei 1998; Lenzi et al. 1998a). Since 1996, seagrasses have returned to the
lagoon, and, as of 2000, they cover 60% of the bottom surface.
In this paper, the one-box, one-layer LOICZ biogeochemical model was applied to the Lagoon of
Orbetello considering a period of one year using data collected between August 1999 and July 2000.
Results
The main data for the application of the LOICZ model are reported in Tables 5.1 and 5.2.
Table 5.1. Characteristics of the Lagoon of Orbetello (Lenzi et al. 2003) and the adjacent
Tyrrhenian Sea (unpublished data, collected in 1999). S = salinity; DIN = dissolved inorganic
nitrogen, average; DIP = dissolved inorganic phosphorus, average.
System
Sea
Area (km2) 25.25
average depth (m)
1
Ssys (psu)
35
Ssea(psu) 37
DIPsys (mmol m-3) 0.39
DIPsea(mmol m-3) 0.16
DINsys (mmol m-3) 44 DINsea (mmol m-3) 0.82
Water and salt balance
VO = VO1 + VO2 + VO3 + VO4 + VO5 = 146.84 m3 d-1
VR= - VQ - VP - VG - VO Ł Vsea + |VE| = - 491ū103 m3 d-1
VX= (VRSR + VO1 SO1 + VO2 SO2+ VO3 SO3+ VO4 SO4 + VO5 SO5 + VseaSsea) / (Ssys - Ssea ) = 2725ū103
m3 d-1
= Vsys / (Vx + |VR|) = 8 d
where VR is the residual flow, VX the exchange flow, and is the average residence time. The
annual water budget is shown in Figure 5.4.
119
Table 5.2. Mean water inputs estimated for the Lagoon of Orbetello for 1999-2000 (Lenzi et
al. 2003, and unpublished data for 1999).
Water flow Salinity
DIP
DIN
Source
(103 m3 d-1)
(psu)
(mmol m-3) (mmol m-3)
Precipitation (P)
67.1
0
0.0
46
Evaporation (E)
-28.5
0
0
0
Albegna river (Q)
86.4
0
0.5
147
Subterranean springs (G)
0
Wastewater treatment plant (O1)
5.18
0
77
1052
Nassa fish farm (O2)
12.05
37
4.16
129
La Rosa fish farm (O3)
17.28
35
3.8
147
Ittima fish farm (O4)
51.8
30
2.5
119
Il Vigneto fish farm (O5)
60.5
25
2.26
186
Pumping from the Sea (Vsea)
219.2
37
0.16
0.82
Budgets of non-conservative materials
DIP balance
DIPR = ( DIPsea + DIPsys ) / 2 = 0.28 mmol m-3
DIP = - [VQDIPQ+VP DIPP+ VO1 DIPO1 + VO2 DIPO2+ VO3 DIPO3+ VO4 DIPO4 + VO5 DIPO5 +VE
DIPE+VseaDIPsea + VR DIPR+VX (DIPsea Ł DIPsys)]= -96 mol d-1
DIP = - 96 mol d-1 /( 25.25 km2 ) = -0.004 mmol m-2 d-1
The DIP budget is shown in Figure 5.5.
DIN balance
DINR = ( DINsea + DINsys ) / 2 = 22.41 mmol m-3
DIN = - [VQDINQ+VPDINP+ VO1 DINO1 + VO2 DINO2+ VO3 DINO3+ VO4 DINO4 + VO5 DINO5
+VEDINE+ VseaDINsea + VRDINR+VX (DINsea -DINsys)] = 85723 mol d-1
DIN = 85723 mol d-1 / ( 25.25 km2 ) = 3.39 mmol m-2 d-1
The DIN budget is shown in Figure 5.6.
Stoichiometric calculation of aspects of net system metabolism
The estimated average CNP ratio in lagoonal macroalgae is 712:76:1 (Lenzi et al. 1998a; Lenzi et al.
2003) resulting in the following estimates of metabolism:
NEM = (p-r) = - DIP (C:P) = - ( - 0.004 mmol m-2 d-1ū 712 ) = 2.8 mmol m-2 d-1
(nfix-denit) = DIN - DINexp = DIN - DIP (N:P) = 3.4 mmol m-2 d-1 - (-0.004 mmol m-2 d-1 ū 76) =
3.69 mmol m-2 d-1
where NEM is the net metabolism of the ecosystem, nfix is nitrogen fixation and denit is DIN lost
through denitrification.
For comparative purposes, applying the Redfield ratio (106:16:1), NEM and (nfix-denit) result in
values of 0.24 mmol m-2 d-1 and 3.45 mmol m-2 d-1, respectively (Table 5.3). They are both smaller
than the previous data, NEM by one order of magnitude.
120
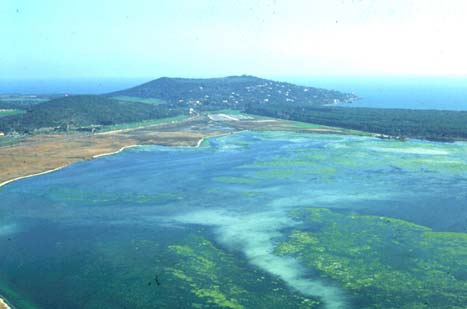
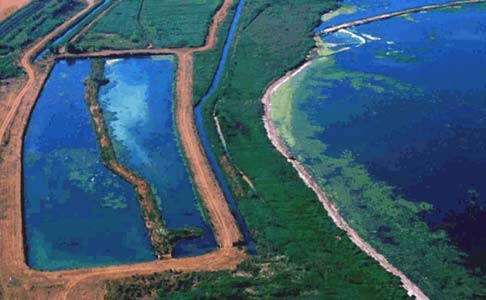
[NEM Redfield = (p-r) = -DIP (C:P) = - ( - 0.004 mmol m-2 d-1ū 106 ) = 0.24 mmol m-2 d-1
(nfix-denit) Redfield = DIN - DINexp = DIN - DIP (N:P) = 3.39 mmol m-2 d-1 - (-0.004 mmol m-2 d-1
ū 16) = 3.45 mmol m-2 d-1 ]
Table 5.3. Results of the stoichiometric calculations considering 2 different CNP ratio values
(experimental and Redfield). Values are in mmol m-2 d-1.
C:N:P
DIN exp
NEM (p-r) (nfix-denit)
712:76:1
-0.30 2.8 3.69
106:16:1
-0.06 0.24 3.45
Conclusions
The positive value of DIN means that the Lagoon of Orbetello can act a source of inorganic nitrogen,
while DIP, which is slightly negative, suggest that for this nutrient, the system can be considered
well-balanced between DIP sources and sinks, although with a slight dominance of processes which
remove inorganic phosphorus from the water column.
These processes could be the precipitation of insoluble orthophosphate compounds in the sediments.
Therefore, this ecosystem acts as a weak DIP sink accumulating phosphorus, which is, according to
Lenzi et al. (1998a, 1999) unavailable for algal blooms.
The positive NEM value means that production prevails over respiration. This result confirms the
environmental improvement of the Lagoon of Orbetello after the OLERA restoration, as reported in
recent papers (Lenzi and Mattei 1998; Lenzi et al. 1998a, 1999, 2003). Finally, the positive value of
(nfix-denit) means dominance of the processes that increase DIN availability.
Figure 5.2. View of the Lagoon of
Figure 5.3. Phytotreatment ponds (photo
Orbetello (photo by M. Lenzi).
by M. Lenzi).
121
VP=67.1
VE=28.5
V
V
Q= 86.4
sea= 219.2
Lagoon of Orbetello
Area
S
sys = 25.25 km2
Q = 0
SR= 36
VO = 146.8
Vsys = 25.25 x10⁶ m3
Ssys = 35 psu
VR = -491.0
VO SO = 4117
sys = 8 d
VX= 2725
Figure 5.4. Water and salt budget for the Lagoon of Orbetello. Water fluxes are expressed in 103
m3 d-1 and salinity in psu.
VPDIPP=0
DIP
VseaDIPsea= 35
Q= 0.5
Lagoon of Orbetello
DIPsea= 0.16
VQDIPQ = 43
DIPsys = 0.39 mmol m-3
DIPR= 0.28
DIPsys = -96 mol d-1
DIPsys = -0.004 mmol m-2 d-1
VRDIPR = -137
VO DIPO = 782
VXDIPX= -627
Figure 5.5. DIP budget for the Lagoon of Orbetello. Concentrations are in mmol m-3 and fluxes
in mol d-1.
VPDINP=3087
DIN
V
Q= 147
seaDINsea= 180
Lagoon of Orbetello
DIPsea= 0.16
VQDINQ = 12701
DINsys = 44 mmol m-3
DIN
DIN
R= 22.4
sys = 85723 mol d-1
DINsys = 3.39 mmol m-2 d-1
VO DINO = 26960
VRDINR = -11003
VXDIPX= -117648
Figure 5.6. DIN budget for the Lagoon of Orbetello. Concentrations are in mmol m-3 and fluxes
in mol d-1.
122
6
COASTAL SYSTEMS OF GENOA AND THE LIGURIAN COAST
6.1
Ligurian Coast (Gulf of Genoa)
Paolo Povero1, Nicoletta Ruggieri1, Cristina Misic1, Michela Castellano1, Paola Rivaro2, Osvaldo
Conio3, Ezio Derqui4, Mauro Fabiano1
1 Dipartimento per lo Studio del Territorio e sue Risorse (DIP.TE.RIS.) Ł UniversitÓ degli Studi di
Genova
2 Dipartimento di Chimica e Chimica Industriale (DCCI) - UniversitÓ degli Studi di Genova
3 Azienda Mediterranea Gas e Acqua s.p.a. Ł Genova
4 Genova Acque - Genova
Introduction
The LigurianŁProvencal Basin, together with the Gulf of Lions and the Catalan Sea, forms the north-
western Mediterranean Basin. This region is characterized by a general cyclonic circulation fed by two
distinct fluxes, one from the Tyrrhenian Sea through the Corsica Channel and the other from the north-
western side of Corsica. The two fluxes merge north of the island generating a very stable current that
closely follows the sea bottom bathymetry along the Italian coast. A marked front, recognizable both
in temperature and salinity, separates the coastal waters from the colder and saltier waters of the basin
interior (Gasparini et al. 1999). Less is known about the coastal circulation of the Ligurian Sea, but it
appears to be associated with the general Mediterranean cyclonic vortex. Clearly, the morphology,
meteorology and hydrodynamics of the area can modify the sub-basin scale circulation features
(Manzella and Stocchino 1982).
The waters of the Ligurian Sea are characterized by a relative lack of nutrient salts and this is an
impediment to greater productivity of the basin. The highest concentrations of nutrients were found
near the coastline or in particular geographical areas such as river estuaries, ports and inlets;
nevertheless high concentrations were also found in the open sea related to the upwelling of the deep,
nutrient rich waters (Dagnino et al. 1990).
This study aims to quantify the fluxes of nitrogen and phosphorus in the coastal area of the Gulf of
Genoa (Ligurian Sea), in order to understand the biogeochemical processes occurring in the system.
The budgetary analysis was performed following the LOICZ Biogeochemical Modelling Guidelines
(Gordon et al. 1996), using a two-layer model (designed for stratified systems) to describe the summer
waters and nutrient dynamics in 1996. To complete the annual cycle, it will be necessary to consider
the remaining seasons. Moreover, in this preliminary study we have not taken into account the coastal
circulation in the area, which can influence nutrient distributions. The data obtained here, however,
can supply preliminary information in order to compare this area with the other coastal systems in
which the LOICZ Model was applied.
Study area description, sample collection and analysis
The study area (44.35-44.45 ░N, 8.70-9.16 ░E) (Figure 6.1), located in the Gulf of Genoa, is delimited
on the north by the coastline between Genoa and the Promontory of Portofino, and on the south by the
50-m isobath. The area was defined according to the sampling strategies for environmental monitoring
of coastal areas (Italian law, D.L.vo 152/99). It has a surface area of 52 km2 and a mean water depth of
28 m.
The shoreline has a surface of about 200 km2 and is largely urbanized (ca. 800,000 inhabitants), with
intense industrial and harbor activity in the central-western part. Therefore, terrestrial sources of
123
nutrients from sewage treatment waters and torrent-like rivers bring a significant supply of nitrogen
and phosphorus to the study area.
Genoa
Voltri
Recco Camogli
Figure 6.1. Location and map of the Gulf of Genoa, Ligurian Sea.
Sampling was carried out in the framework of the SAReF Ge-2 Project - University of Genoa, during
summer 1996. Sampling stations were placed on transects with coast-offshore direction. Salinity and
temperature were detected using a Sea-Bird SBE-9/11 plus. The water samples for nitrate, nitrite,
ammonium and phosphate analysis were collected with a carousel sampler, equipped with Niskin
bottles. Chemical analyses were carried out using a Technicon II AutoAnalyzer according to Hansen
and Grasshoff (1983). All the data are reported in Castellano (1997) and Rivaro et al. (2000).
Air temperature and wet deposition data were obtained from Dipartimento di Ingegneria Ambientale-
UniversitÓ di Genova (DIAM 2002) Evaporation losses were calculated according to Hargreaves'
equation (Hargreaves 1975). Riverine flows and nutrient concentrations used for these budgets and
sewage nutrient loads were obtained from Amga S.p.A. (AAVV 1998). Atmospheric nitrogen input
was obtained from Rete Italiana per lo studio delle deposizioni atmosferiche (RIDEP) (Mosello 1993),
while phosphorus input was assumed to be zero since no data was available.
Water and salt balance
The water and salt budget for the study area was calculated using the two-layer model (Figure 6.2) to
estimate the volume transfer between the system and the sea and between the surface and the deep
layer of the system. In the figure, the upper solid box and the lower dashed box represent the upper
and lower layers. The depth used for the upper mixed layer, determined following the temperature and
salinity profiles, was 15 m. Surface area , mean depth and volume are indicated in Table 6.2.
Because of the specific characteristics of the input of treated sewage effluent to the system, we have
modified the standard 2-layer LOICZ biogeochemical model, which assumes that all freshwater inputs
occur in the surface layer. Here, the sewage piping systems are placed about at 50 m depth, so they
occur in the lower layer. Following a diffusion model for sea outfalls in the Gulf of Genoa (Granelli et
al. in press), we have estimated that about 30% of sewage treatment water occurs in the surface layer
(VGs), while 70 % remains on the bottom (VGf).
Moreover, we have considered another input (VQ'), coming from a dock in the port of Genoa (Old
Port), where a sewage treatment water discharge flows and mixes with the resident sea water. This
input of salt water (36.4 psu) occurs in the surface layer because it flows through a mouth with a depth
lower than 15 m (above thermocline).
124
Results of the freshwater balance indicate that there is a net freshwater input into the study area of
543x103 m3 d-1. VR considers both marine and freshwater inputs from the land and is the sum of river
runoff (VQ = 343x103 m3 d-1), discharges of treated sewage effluent (VGs = 30x103 m3 d-1 and VGf=
70x103 m3 d-1), the water coming from Old Port (VQ'= 68x103 m3 d-1), precipitation (VP = 43x103 m3 d-
1) and evaporation (VE = -11x103 m3 d-1).
In the upper layer, a residual surface flow of 44290x103 m3d-1(Vsurf) compensates the net freshwater and
saltwater inputs (VQ, VP, VE, VGs and VQ') and water entrained between the lower layer of the water
column (VD'). In the bottom layer, sea inflow (VD) is balanced by vertical flow to surface layer (VD').
Vz is the mixing volume between the layers, and its magnitude is the same in both vertical directions.
The water exchange time () is 11 days for the upper mixed layer and 18 days for the lower layer. The
water exchange time for the whole area is 16 days.
Budgets of non-conservative materials
Non-conservative dissolved inorganic phosphorus (DIP) and nitrogen (DIN) fluxes were calculated
using the estimated volume transports. Nutrients content of the system, of its inputs and of the output
environment are reported in Table 6.1. Results of the budget are summarized in Table 6.2.
Table 6.1. Nutrients content of the system, its inputs and the adjacent sea. (* = assumed)
P
DIPQ
DIPQ'
DIPGs
DIPGf
DIPP
DIPsyst
DIPsyst
DIPsea
Rivers
Dock
Discharge Discharge
Upper
Lower
Sea
mmol m-3
2.61
0.61 50 50 0*
0.140
0.138
0.140
DIN
DIN
DIN
DINGf
DIN
DIN
DIN
N
Q
Q'
Gs
syst
sea
sea
Rivers
Dock
Discharge Discharge
DINP
Upper
Lower
Sea
mmol m-3
25.9 12 750 750 60 0.770
0.640
1.00
DIP balance
Figure 6.3 and Table 6.2 summarize the two-layer DIP budget. Non-conservative processes yielded a
net sink for DIP (DIPsystem = -0.134 mmol P m-2 day-1). This value is simply the sum of the DIP's of
upper and lower boxes. In fact, both in surface and bottom layers DIP is negative, suggesting that net
DIP uptake prevails in the system during summer.
DIN balance
Figure 6.4 and Table 6.2 present the two-layer DIN budget for the study area. As is the case for DIP,
the area is a net sink for DIN (DIN = -2.26 mmol N m-2 day-1), in both surface and bottom layers.
Stoichiometric calculations of aspects of net system metabolism
The parameter (nfix-denit) is estimated using inorganic imbalances (DIP, DIN,). With the
assumption that the system is dominated by phytoplankton and using the Redfield ratio of N:P (16:1)
(Redfield et al. 1963), the (nfix-denit) obtained is positive for the upper layer, where the N2 fixation
process dominates, and negative for the lower, where the denitrification process prevails. Considering
the whole system, the denitrification process slightly dominates and the study area appears to be a sink
of fixed nitrogen.
125
The net ecosystem metabolism NEM (p-r), based on the C:P (106:1), is positive for the whole area: the
system is interpreted to be autotrophic by about 14.2 mmol C m-2 d-1 and appears to be a net producer
of organic matter.
Table 6.2. Summary of water exchange time, non-conservative nutrient fluxes, apparent net
metabolism (p-r) and nitrogen fixation minus denitrification (nfix-denit) in the Gulf of Genoa.
(* weighted mean between mean depth of surface and bottom layers)
Parameters Surface
Bottom
System
Area (km2) 52
40
52
Mean depth (m)
11
22
28*
Volume (109 m3) 5.72
8.80
14.52
(days)
11 18 16
DIP (mol d-1 )
-2272 -3589 -5861
DIP (mmol m-2 d-1 )
-0.044 -0.090 -0.134
DIN (mol d-1 )
-27998 -68926 -96924
DIN (mmol m-2 d-1 )
-0.54 -1.72 -2.26
(p-r)plankton (mmol m-2 d-1 ) 4.7
9.5
14.2
(nfix-denit)plankton (mmol m-2 d-1 ) 0.16 -0.28
-0.12
VP=43 VE=-11
VPSP=0 VESE=0
VQ=343
VQSQ=0
V
Surface
V
Q'=68
surf=-44290
V
V
Q'SQ'=2475
A
surSsyst-s=-1664861
syst=52 km2
S
V
syst-s=37.59
Gs=30
VGsSGs=0
VZ=5554
VZ(Ssyst-d-Ssyst-s)=1722
VD'=43817
VD'Ssyst-d=1660664
Bottom
VG=70
S
S
ocn-d=38.00
syst-d=37.90
V
GfSGf=0
VD=43747
VDSsea-d=1662386
syst=16 days
Figure 6.2. Two-layer water and salt budgets for the Gulf of Genoa. Water fluxes in 103 m3 d-1,
salinity in psu
126
VPDIPP= 0
VsurDIPsyst-s =- 6201
VQDIPQ = 896
Surface
VQ'DIPQ' = 41
DIPsyst-s = 0.140
DIPsyst-s = -2272
VGsDIPGs = 1500
V
VZ(DIPsyst-d-DIPsyst-s) =-11
D'DIPsyst-d = 6047
DIPsea-d = 0.140
Bottom
VGfDIPGf=3500
DIPsyst-d = 0.138
DIPsyst-d = -3589
VDDIPsea-d = 6125
DIPsyst = -5861
Figure 6.3. Two-layer dissolved inorganic phosphorus budget for the Gulf of Genoa. Fluxes in
mol d-1 and concentrations in mmol m-3 .
VPDINP= 2580
V
VsurDINsyst-s=-34103
QDINQ=8884
Surface
VQ'DINQ' = 816
DINsyst-s=0.770
DINsyst-s=-27998
VGsDINGs=22500
VD'DINsyst-d=28043
VZ(DINsyst-d-DINsyst-s)=722
DINsea-d = 1.00
VGfDINGf=52500
Bottom
DINsyst-d=0.640
DINsyst-d=-68926
V
DDINsea-d=43747
DINsyst=-96924
Figure 6.4. Two-layer dissolved inorganic nitrogen budget for the Gulf of Genoa. Fluxes in mol
d-1 and concentrations in mmol m-3.
127
6.2
Port of Genoa: Old Port, Multedo Oil Terminal and Voltri Container Terminal
Paolo Povero1, Nicoletta Ruggieri1, Cristina Misic1, Michela Castellano1, Paola Rivaro2, Osvaldo
Conio3, Ezio Derqui4, Stefania Maggi5, Mauro Fabiano1
1 Dipartimento per lo Studio del Territorio e sue Risorse (DIP.TE.RIS.) Ł UniversitÓ degli Studi di
Genova
2 Dipartimento di Chimica e Chimica Industriale (DCCI) - UniversitÓ degli Studi di Genova
3 Azienda Mediterranea Gas e Acqua S.p.A. Ł Genova
4 Genova Acque Ł Genova
5 AutoritÓ Portuale - Genova
Study area description
The Port of Genoa (44.40-44.43░N, 8.75-8.94░E) (Figure 1), located in the Gulf of Genoa, extends over
a surface of 7 km2 along about 20 km of coastline; it is composed of independent systems with a mean
water depth between 9 and 15 m and with a maximum of 50 m in the Multedo Oil Terminal for
supertankers. The harbour receives domestic and industrial effluents from watercourses and through
sewage treatment discharges. Therefore, significant amounts of nutrients are released in a semi-
enclosed basin, resulting in phosphorus and nitrogen enrichment.
On the basis of its morphology, the Port of Genoa can be subdivided into three different areas, each
with specific characteristics, separated from the sea: the Old Port Area, the Multedo Oil Terminal and
the Voltri Container Terminal (Figure 6.5). Each area can be considered as an independent system.
The budgetary analysis used to quantify fluxes of nitrogen and phosphorus, following the LOICZ
Biogeochemical Modelling Guidelines (Gordon et al. 1996), has been performed on each system
individually in order to understand the biogeochemical processes occurring in each one. Due to
available data, models are representative of the summer conditions encountered in September 2002. To
complete the annual cycle, it will be necessary to consider the remaining seasons. Moreover, in this
preliminary study we have not taken into account the close coupling between the water column and the
sediment, which can strongly influence the biogeochemical nutrient cycles. The data obtained,
however, can supply preliminary information in order to estimate and to compare these areas with the
other coastal systems where the LOICZ Model was applied.
MULTEDO OIL
OLD PORT
TERMINAL
BASIN
OUTER
PORT
VOLTRI
CONTAINER
TERMINAL
Figure 6.5. Location and map of the Port of Genoa, Gulf of Genoa.
128
Old Port area
This is the old area of the port of Genoa. It includes the ferry terminal, a small tourist port and a
restructured zone, converted into exhibition area (aquarium, congress centre, cinema). In the outer port
some shipyards are present. It has a surface area of 2.7 km2 and a mean water depth of 13 m. Sewage
treatment discharge (for about 220,000 inhabitants) flows into this dock, remaining in the surface layer
(about 0.5 m) of the inner part because of its low salinity. It carries a large quantity of phosphorus and
nitrogen, primarily as ammonium.
Multedo Oil Terminal
The Multedo Oil Terminal is one of the biggest in Italy and the Mediterranean; it is well sheltered from
the sea by a long breakwater, a quiet water channel and the esplanade of a large airport. It has a
surface area of 1.4 km2 and a mean water depth of 15 m. A highly polluted watercourse (Chiaravagna)
flows into the Oil Terminal, bringing a large amount of nutrients to the basin.
Voltri Container Terminal
The Voltri is one of the most important container terminals of the Mediterranean sea. It has a surface
area of 2.1 km2 and a mean water depth of 15 m. This basin receives no freshwater input, but on the
outside of its entrances flow two sewage treatment water discharges (for about 94,000 inhabitants),
which can enrich the nutrient content of its waters.
Water samples were collected in September 2002, inside the harbor and in the adjacent sea. Chemical
analysis of nutrients were carried out using a Technicon II AutoAnalyzer according to Hansen and
Grasshoff (1983). Salinity and temperature were detected using a multiparametric CTD (Idronaut
Ocean Seven 316). Air temperature and wet deposition data were obtained from Dipartimento di
Ingegneria Ambientale-UniversitÓ di Genova (DIAM 2002). Evaporation losses were calculated
according to Hargreaves' equation (Hargreaves 1975).
Riverine flows and nutrient concentrations used for these budgets and sewage nutrient loads were
obtained from Amga S.p.A (AAVV 1998). Atmospheric nitrogen input was estimated from "Rete
Italiana per lo studio delle deposizioni atmosferiche (RIDEP)" (Mosello 1993), while phosphorus input
was assumed to be zero, as no data were available.
Water and salt balance
The water and salt budget for Genoa Harbour was calculated using the single-layer model for Voltri
Container Terminal and Multedo Oil Terminal. A two-box model was used for the Old Port area,
which presents a more complex morphology. In fact, it can be subdivided into two systems, the Old
Port Basin and the outer port, which is directly connected to the sea through a large entrance. The Old
Port Basin is more isolated and receives a freshwater discharge, which remains partly in the surface
layer because of its low salinity; we have estimated that this layer is about 0.5 m deep (area-weighted
mean value). Therefore the inner box of the two-box model has been considered as a two-layer system.
This approach allows a simplification of the description of a complex site, where various processes and
conditions are present, which must be taken into account when the results are evaluated.
Surface area, mean depth and volume of the systems are indicated in Table 6.3, while Figure 6.6
summarizes the salt and water budget for the three areas.
Old Port area
In the inner system, the freshwater input comes mainly from a discharge of treated sewage waters (V0 =
63x103 m3d-1). This input, together with the water entrained between the lower layer (VD' = 250x103
m3d-1) and precipitation (VP = 7.5x10³ m3d-1), causes a residual surface flow (Vsurf) of 318x103 m3d-1
toward the outer system.
129
The water exchange time () of the inner system is 2 days for the upper layer and 42 days for the lower
one. The water exchange time for the whole area is 20 days. The low exchange time of the upper layer
is due to the continuous flux of freshwater in the surface water. These water residence times are not
representative of the whole area, because they do not consider its irregular shape; probably, for some
inner docks is higher than we have found.
The outer system receives a surface flow coming from the inner one (Vsurf). This input is partially
balanced from the flow entraining in the lower layer of the inner system (VD = 250x103 m3d-1).
Together with precipitation (VP = 11x103 m3d-1), it causes a residual surface flow (VR outer) of 75x 103
m3d-1 toward the sea. The salinity gradient between the outer system and the sea can be maintained by
a water exchange flow of 3297x 103 m3d-1. The water exchange time () of the outer system is 7 days.
Multedo Oil Terminal
This basin receives a freshwater input from Chiaravagna torrent (VQ = 5 x10³ m3 d-1) and from
precipitation (VP = 9.5x10³ m3 d-1); it has a residual flow toward the sea of 11.4x10³ m3d-1(VR). Vx was
estimated as 339x103 m3d-1. The water exchange time for the whole area is close to 2 months.
Voltri Container Terminal
The only freshwater input in this area comes from precipitation (VP = 14.3x10³ m3 d-1) and the residual
flow is low (VR = 9.6x10³ m3d-1) and Vx is 310x 103 m3d-1. The water exchange time () is about 100
days.
Budgets of non-conservative materials
Non-conservative dissolved inorganic phosphorus (DIP) and nitrogen (DIN) fluxes were calculated
using the estimated volume transports. Nutrient content of the three systems, of their inputs and of the
outer sea are reported in Table 6.3. Figures 6.7 and 6.8 summarize the DIP and DIN budgets for the
three areas.
Table 6.3. Nutrient concentrations (mmol m-3) in the systems, in their inputs and in the outer
sea. (* assumed)
DIP
DIP
DIP
DIP
DIP
DIP
DIP
DIP
P
Q
P
O
sys
sys
sys
sys
sea
Rivers Precipitation Discharges System Upper Lower Outer
Sea
Old Port
- 0* 12.6
-
1.8
2.0
0.65
0.61
area
Multedo Oil 6.1 0*
- 1.59 - - - 0.55
Terminal
Voltri
Container
-
0*
- 0.52 - - - 0.56
Terminal
DIN
DIN
DIN
DIN
DIN
DIN
DIN
DIN
N
Q
P
O
sys
sys
sys
sys
sea
Rivers Precipitation Discharges System Upper Lower Outer
Sea
Old Port
-
60
770
- 26.0 27.0 12.6 11.8
area
Multedo Oil 100 60
- 22.9 - - - 18.8
Terminal
Voltri
Container
-
60
- 8.8 - - - 11.0
Terminal
130
DIP and DIN balance
Old Port area
Non-conservative processes yielded a net sink for DIP (-0.66 mmol m-2 d-1) and DIN (-43 mmol m-2d-1)
in the upper layer of the inner system, while the lower is a source for the two elements (0.31 and 3.3
mmol m-2 d-1 respectively). The very high DIN value in the upper layer is due to the great amount of
nitrogen from discharges that remains in the surface. In the outer system, DIP (-0.14 mmol m-2d-1)
and DIN (-1.4 mmol m-2d-1) are negative, and the system appears a sink for both the elements.
Multedo Oil Terminal
This basin is a source for DIP and DIN (0.24 and 0.4 mmol m-2d-1 respectively).
Voltri Container Terminal
This basin is a weak sink for DIP (-0.003 mmol m-2d-1) and DIN (-0.7 mmol m-2d-1).
Stoichiometric calculations of aspects of net system metabolism
Using to the LOICZ method (Gordon et al. 1996), the net ecosystem metabolism NEM (p-r) has been
estimated on the basis of the Redfield ratio of C:P (106:1), while the parameter (nfix-denit) is estimated
using inorganic imbalances (DIP, DIN) and the Redfield ratio of N:P (16:1) (Redfield et al. 1963).
Results of the budget are summarized in Table 6.4.
Old Port area
The net ecosystem metabolism is highly positive for the entire inner compartment of the Old Port area
(37.1 mmol m-2d-1) indicating a net production of organic matter. The inner box shows a negative
value of NEM in the lower layer (-32.9 mmol m-2d-1) and a very high positive value in the surface layer
(70.0 mmol m-2d-1), due to the great amount of nutrients carried from discharges. The calculation may
not in fact correspond to the real productivity of the system, because the waters of the basin are highly
polluted, which can limit production.
The outer system has a NEM of 14.8 mmol m-2 d-1, but also this value seems to be too high for this area
for the same reason of the inner one.
The (nfix-denit) obtained is negative for both upper and lower layers of the inner box (-32.5 and -1.7
mmol m-2 d-1 respectively), so it appears to be denitrifying more nitrogen than it is fixing. The highly
negative (nfix-denit) value in the upper layer is due to the great amount of nitrogen carried by
discharges. The outer box has a positive value of (nfix-denit), meaning that N2 fixation dominates here.
Multedo Oil Terminal
This basin shows a negative value of NEM (-25.4 mmol m-2d-1) and can be considered as a
heterotrophic system. The (nfix-denit) obtained is negative and denitrification prevails.
Voltri Container Terminal
The net ecosystem metabolism is slightly positive (0.3 mmol m-2d-1) and indicates good balance
between production and respiration. The (nfix-denit) obtained is negative and the system is
denitrifying.
131
Table 6.4. Summary of water turnover time, non-conservative nutrient fluxes, net ecosystem
metabolism (p-r) and nitrogen fixation minus denitrification (nfix-denit).
Old Port area
Voltri
Multedo Oil
Container
Terminal
Inner box
Outer box
Terminal
Parameters
Surface Bottom System System System System
Area
1.1 1.1 1.1 1.6
1.4
2.1
(km2)
Mean depth
0.5 10.0 10.5 15.0
15.0
15.0
(m)
Volume
0.55 11.0 11.5 24.0
21.0
31.5
(106 m3)
2 42 20 7
60
99
days
DIP
-725 340 -385 -230
334
-7
(mol d-1 )
DIP
-0.66 0.31 -0.35 -0.14
0.24
-0.003
(mmol m-2 d-1 )
DIN
-47454 3613 -43841 -2225
557
-1445
(mol d-1 )
DIN
-43.1 3.3 -39.8 -1.4
0.4
-0.7
(mmol m-2 d-1 )
(p-r)plankton
70.0 -32.9 37.1 14.8
-25.4
0.3
(mmol m-2 d-1 )
(nfix-denit) plankton
-32.5 -1.7 -34.2 0.8
-3.4
-0.6
(mmol m-2 d-1 )
132
V
P=7.5 VE=-2.5
VP=11 VE=-3.6
VPSP=0 VESE=0
VPSP=0 VESE=0
Old Port
V
V
surf=318
R-o=-75
Outer Port
V
VsurfSsyst-s=9222
R-oSR-o=-2800
Surface
V0=63
Asyst=1.1 km2
V
0S0=0
Ssyst-s=29.00
Surface
=2 day
Asyst=1.6 km2
Ssea=37.75
Ssyst-o=36.90
V
D'=250
V
=7 days
Z=13
VD'Ssyst-d=9125
VZ(Ssyst-d-Ssyst-s)=98
V
X-o=3297
VR-o(Ssea-Ssyst-o)=2802
Bottom
A
syst=1.1 km2
Ssyst-d=36.50
=42 days
VD=250
VDSsys-o=9225
VP=9.5 VE=-3.1
VPSP=0 VESE=0
VR=-11.4
VRSR=-423
VQ=5
VQSQ=0
Multedo Oil
Terminal
Ssea=37.75
Asyst=1.4 km2
Ssyst=36.50
V
X=339
VX (Ssea-d-Ssyst)=424
syst=60 days
VP=14.3 VE=-4.7
VPSP=0 VESE=0
VR=-9.6
VRSsyst=-351
Voltri Container
Terminal
Ssea=37.75
Asyst=2.1 km2
Ssyst=36.60
VX=310
V
X (Ssea-d-Ssyst)=357
syst=99 days
Figure 6.6. Water and salt budgets for the Port of Genoa. Fluxes in 103 m3 d-1, salinity in psu
133
VatmDIPatm= 0
VatmDIPatm= 0
Old Port
VsurfDIPsyst-s = 572
Outer Port
VR-oDIPR-o=-47
Surface
V
0DIP0 = 794
DIP
syst-s = 1.80
DIPsyst-s = -725
Surface
DIPsyst-o = 0.65
DIPsea= 0.61
VD'DIPsyst-d = 500
DIPsyst-o =-230
VZ(DIPsyst-d-DIPsyst-s)=3
Bottom
DIPsyst-d = 2.00
DIPsyst-d = 340
VDDIPsys-o= 163
VX-o(DIPsea-d-DIPsyst-o)=-132
VatmDIPatm= 0
VRDIPR=-12
VQDIPQ = 31
Multedo Oil Terminal
DIPsyst= 1.59
DIPsyst= 334
DIPsea=0.55
VX (DIPsea-d-DIPsyst)=-353
VatmDIPatm= 0
VRDIPR=-5
Voltri Container
Terminal
DIPsea=0.56
DIPsyst= 0.52
DIPsyst= -7
VX (DIPsea-d-DIPsyst)=12
Figure 6.7. Dissolved inorganic phosphorus budget for the Port of Genoa. Fluxes in mol d-1 and
concentrations in mmol m-3
134
VatmDINatm= 449
VatmDINatm= 660
Old Port
VsurfDINsyst-s = 8268
Outer Port
VR-oDINR-o=-915
Surface
V
0DIN0 = 48510
DINsyst-s = 26.0
DINsyst-s = -47454
Surface
DINsea= 11.8
V
DINsyst-o = 12.6
D'DINsyst-d = 6750
V
DINsyst-o = -2225
Z(DINsyst-d-DINsyst-s)=13
Bottom
DINsyst-d = 27.0
DIN
V
syst-d = 3613
V
X-o(DINsea-d-DINsyst-o)=-2638
DDINsys-o= 3150
VatmDINatm= 571
VRDINR=-238
V
Multedo Oil
QDINQ = 500
Terminal
DINsyst= 22.9
DINsea=18.8
DINsyst= 557
VX (DINsea-d-DINsyst)=-1390
VatmDINatm= 858
VRDINR=-95
VX (DINsea-d-DINsyst)=682
Voltri Container
Terminal
DINsea=11.0
DINsyst= 8.8
DINsyst= -1445
Figure 6.8. Dissolved inorganic nitrogen budget for the Port of Genoa. Fluxes in mol d-1 and
concentrations in mmol m-3.
135
7 REFERENCES
AAVV (Autori Vari) 1998 Il mare di Genova. A.M.G.A. S.p.A.-AutoritÓ Portuale di Genova-RSTA
SCRL, Genova, 176 pages.
Abbruzzese, D. and Genovese, S. 1952 Osservazioni geomorfologiche e fisico-chimiche sui laghi di
Ganzirri e di Faro. Bolletino Pesca, Piscicoltura, Idrobiologia 7, Roma.
Agnesi, V., Macaluso, T., Orr∙, P. and Ulzega, A. 1993 Paleogeografia dell'arcipelago delle Egadi
(Sicilia) nel Pleistocene Sup.-Olocene. Naturalista siciliano 17: 3-22.
Andreoli, C., Ferito, V., Geraci, C., Guglielmo, L., Magazz∙, G., Nicoletti, G. and Zerbo, G. 1987
Ciclo annuale di osservazioni chimico-fisiche e biologiche in un ambiente costiero
eutrofizzato. Mem. Biol. Mar. Ocean. 16: 49-77.
Angelini, R. and Strumia, F. 1994 Il bacino idrografico della Pialassa Baiona. Descrizione del
territorio dal punto di vista delle fonti di carico inquinante. Pages 157-200 in Soprani, S. and
Ricci, C. (eds) Analisi dello stato ambientale e sanitario nelle valli ravennati. La Pialassa
Baiona. Azienda U.S.L., Dipartimento dei Servizi di Prevenzione, Ravenna, 425 pages.
ARPA (Agenzia Regionale Prevenzione e Ambiente) Emilia-Romagna - Struttura Oceanografica
Daphne 1992 Eutrofizzazione delle acque costiere dell'Emilia-Romagna. Rapporto Annuale
1992. Assessorato Territorio, Programmazione e Ambiente, 201 pages
ARPA Emilia-Romagna - Struttura Oceanografica Daphne 2001 Eutrofizzazione delle acque costiere
dell'Emilia Romagna - rapporto annuale 2000. Regione Emilia Romagna, Assessorato
Agricoltura, Ambiente e svilupo sostenibile, 195 pages.
ASPIV (Azienda Servizi Pubblici Idraulici e Vari) 2000 Relazione annuale 1999 impianto di
depurazione di Campalto. Venezia Servizi Territoriali Ambientali.
Assessorato Territorio ed Ambiente della Regione Siciliana, Relazioni, 1,7░ Zona, Indagine
oceanografica e correntometrica nelle acque costiere della Sicilia, 1984-85.
Atkinson, M.J. and Smith, S.V. 1983 C:N:P ratios of benthic marine plants. Limnology and
Oceanography 28: 568-574.
Azzaro, F. 1993 Concentrazioni di nutrienti nella Baia di Augusta (Sicilia). Pages 93-108 in
Atti I Workshop "Risorsa mare: un Progetto per il Mezzogiorno. Salvaguardia e
valorizzazione delle acque costiere del Salento". Lecce 8 luglio 1991.
Azzaro F. 1995 Osservazioni biennali sull'ecosistema degli stagni costieri di Oliveri - Tindari
(Messina): Nutrienti e Clorofilla-a. S.It.E. Atti 16: 495-497.
Badour N. 1987 Contribution Ó l'ķtude physico-chimique de la lagune de Moulay Bousselham.
Mķmoire de fin d'Etudes, IAV Hassan II, Rabat, 58 pages.
Balzano, A., Calvo, S., Ciraolo, G. and La Loggia G. 2000 Remote sensing as a tool to
calibrate hydrodynamic-transport numerical models. In Maione, U (ed.) New Trends
in Water and Environmental Engineering for Safety and Life. Balkema, Rotterdam.
Bartoli M., Castaldelli G., Nizzoli D., Gatti L.G. and Viaroli P., 2001 Benthic fluxes of oxygen,
ammonium and nitrate and coupled-uncoupled denitrification rates within
communities of three different primary producer growth forms. Pages 227-235 in
Faranda, F.M., Guglielmo, L. and Spezie, G. (eds): Structure and processes in the
Mediterranean ecosystems. Springer Verlag Italia, Milano.
Bencivelli, S. 1993 Indagine quali-quantitative delle acque superficiali dei bacini Burana-
Volano e Canal Bianco. Monitoraggio biologico di qualitÓ dei corpi idrici metodo
E.B.I.(anno 1992). Dimensione Ambiente Provincia di Ferrara, 207 pages.
Bendschneider, K. and Robinson, R.J. 1952 A new spectrophotometric determination of nitrite
in seawater. J. Marine Research 11: 87-96.
Bombelli, V. and Lenzi, M. 1996 Italy. The Orbetello Lagoon and the Tuscany Coast. Pages
331-337 in Schramm, W. and Nienhuis, P.N. (eds) Marine benthic vegetation.
Springer-Verlag, Ecological Studies 123, Berlin Heidelberg.
Boni, L. 1990 Macro e microalghe nelle zone salmastre dell'Emilia-Romagna. Pages 107-121 in
Corbetta, F. (ed.): Aspetti naturalistici delle zone umide salmastre dell'Emilia-Romagna.
Regione Emilia-Romagna, Bologna 274.
136
Bucci, M, Gorelli V. and Vincenzi, D. 1989 Metodologia di intervento per la caratterizzazione
idrodinamica della laguna di Orbetello. AttivitÓ 1987-1988. RT/PAS/89/18: 10-60,
ENEA, Casaccia, Roma.
Calvo, S., Ciraolo, G., La Loggia, G., Malthus, T.J., Savona, E. and Tomasello, A. 1996 Monitoring
Posidonia oceanica meadows in the Mediterranean Sea by means of airborne remote sensing
techniques. Proc. Second International Airborne Remote Sensing Conference and Exhibition,
San Francisco, California, 24-27 June 1996, 3: 659-668.
Calvo, S., Drago, D. and Sortino, M. 1980 Winter and summer submersed vegetation maps of the
Stagnone. Revue de Biologie-ecologie mķditerranķenne T. VII, n░ 2:89-96.
Cal“, E., Sambati, A., Sammarco, P. and Magazz∙, G. 1996 Caratterizzazione chimicoŁfisica in serie
temporale dello stagno salmastro di Acquatina (Lecce) dal 1991 al 1995. S.It.E. Atti 17: 461-
465.
Carrada, G.C., Cicogna, F. and Fresi, E. 1988 Le lagune costiere: ricerca e gestione. CLEM, Massa
Lubrense (Napoli), 254 pages.
Castellano, M. 1997 Caratterizzazione ambientale di acque costiere liguri: aspetti chimico-biologici.
Degree thesis, University of Genoa, Italy.
Catalano, G. 1987 An improved method for the determination of ammonia in seawater. Marine
Chemistry 20: 289-295.
Cattaneo, E., Zaldivar, J.M., Murray, C.N., Viaroli, P. and Giordani, G. 2001 Application of LOICZ
methodology to a Mediterranean coastal lagoon: Sacca di Goro (Italy). European Communities
Report No. EUR 19921 EN, 29 pages
Ciavola, P., Gonella, M., Tessari, U. and Zamariolo, A. 2000 Contributo alla conoscenza del clima
meteomarino della Sacca di Goro: misure correntometriche e mareografiche. Studi Costieri 2:
153-173.
Colombo, G., Bisceglia, R., Castaldelli, G., Gaiani, V. and Zaccaria, V. 1994 Risultati di quattro anni
di monitoraggio mensile delle acque di una laguna del Delta del Po: la Sacca di Goro. Biol.
Mar. Medit. 1(1): 405-406.
Consorzi di Bonifica Ferraresi 1991-1999 Riepilogo dei rilievi climatici e dei dati relativi allo scolo e
alla derivazione irrigua. Rapporti Annuali: 1991-1999. 1░ Circondario Polesine di Ferrara.
Corbetta, F. 1990 Flora e vegetazione delle zone umide salmastre dell'Emilia-Romagna. Pages 71-105
in: Corbetta, F. (ed) Aspetti naturalistici delle zone umide salmastre dell'Emilia-Romagna.
Regione Emilia-Romagna, Bologna.
Cortese, G., Pulican“, G., Manganaro, A., Potoschi, A., Giacobbe, S., Giacobbe, M.G., Gangemi, E.,
Sanfilippo, M. and Span“, N. 2000 Fluttuazioni ed anomalie abiotiche e biotiche nei Pantani di
Capo Peloro. 2nd Convegno Nazionale delle Scienze del Mare, Genova, 22-25 Novembre 2000.
CoNISMa ed., 169 pages.
Corticelli, S., Piccoli, F. and Merloni, N. 1999 Carta della Vegetazione del Parco Regionale del Delta
del Po. Servizio Cartografico e Geologico, Regione Emilia-Romagna, Bologna.
Cossarini G., Solidoro C. and Pastres R. 2001 Modello tridimensionale di qualitÓ dell'acqua della
laguna di Venezia: analisi numerica del funzionamento dell'ecosistema e del ciclo dell'azoto.
In Atti del XI Congresso S.It.E.
Dagnino, I., Della Croce, N., Fabiano, M. and Zunini Sertorio, T. 1990 The Ligurian Sea:
oceanographic features. Pages 217-232 in Smith, H.D. and Vallega, A. (ed.) The management
of semi-enclosed seas: the emerging global pattern and the Ligurian case. IGU, CMG
Regione Liguria, Genova.
Dallocchio, F., Ghion, F., Milan, C. and Viaroli, P. 1998 Variazioni temporali delle caratteristiche
chimico fisiche delle acque delle Valli di Comacchio. Laguna suppl. 5/98: 4-15.
Decembrini, F., Azzaro, F. and Magazz∙, G. 1993 Studio delle condizioni trofiche della Rada di
Augusta per il monitoraggio automatico dei fenomeni di eutrofizzazione. Atti I Workshop
"Risorsa mare: un Progetto per il Mezzogiorno. Salvaguardia e valorizzazione delle acque
costiere del Salento". Lecce 8 luglio 1991, 109-127.
De Domenico, L., Crisafi, E., Magazz∙, G., Pugliesi, A. and La Rosa, A. 1994 Monitoring of
petroleum hydrocarbon pollution in surface water by a direct comparison of
fluorescence spectroscopy and remote sensing techniques. Marine Polution Bulletin 10:
587-591.
137
DIAM (Dipartimento di Ingenieria Ambientale, UniversitÓ di Genova) 2002 Meteorologic data.
In: http://www.diam.unige.it/~meteo/cambiaso
Dodds, W.K., Jones, J.R. and Welch, E.B. 1998 Suggested classification of stream trophic state:
distributions of temperate stream types by chlorophyll, total nitrogen, and phosphorus. Water
Research 32: 1455-1462.
Dupra, V., Smith, S.V., Marshall Crossland, J.I. and Crossland, C.J. 2001 Coastal and estuarine
systems of the Mediterranean and Black Sea regions: carbon, nitrogen and phosphorus fluxes.
LOICZ Reports & Studies N░ 19, LOICZ, Texel, The Netherlands.
EEA (European Environment Agency) 2001 Eutrophication in Europe's coastal waters. Topic report
7/2001 http://reports.eea.eu.int/topic_report_2001_7/en/Topic_Report_7_2001.pdf
Fiocca, F., LugliĶ, A. and Sechi, N. 1996 The phytoplankton of S'Ena Arrubia Lagoon (central-
western Sardinia) between 1990 and 1995. Giorn. Bot. Ital. 130: 1016-1030.
Fiocca, A., Sammarco, P. and Sambati, A. 1998 Monitoraggio delle condizioni ambientali delle coste
adriatiche del Salento, 1995-1997. Parametri chimico-fisici e sali nutritivi. B o
i l. Mar. Medit.
5(1): 620-626.
Gasparini, G.P., Zodiatis, G., Astraldi, M., Galli, C. and Sparnocchia, S. 1999 Winter intermediate
water lenses in the Ligurian Sea. Journal of Marine Systems 20: 319Ł332.
Giacobbe, M.G., Vadrucci, M.R., Pugliesi, A., Maimone, G. and Magazz∙, G. 1996 Ciclo annuale del
fitoplancton nello stagno di Acquatina in relazione alle condizioni ambientali. S.It.E. Atti 17:
451-454.
Giaquinta, S. 2001 Progetto di caratterizzazione del bacino del canale Candiano e revisione delle
stazioni di monitoraggio. ARPA, Servizio Sistemi Ambientali, Sez. Ravenna, 53 pages.
Giordani, G., Bartoli, M., Cattadori, M. and Viaroli, P. 1996 Sulphide release from anoxic sediments
in relation to iron availability and organic matter recalcitrance and its effects on inorganic
phosphorus recycling. Hydrobiologia 329: 211-222.
Giordani, G., Azzoni, R., Bartoli, M. and Viaroli, P. 1997 Seasonal variations of sulphate reduction
rates, sulphur pools and iron availability in the sediment of a dystrophic lagoon (Sacca di Goro,
Italy). Water, Air and Soil Pollution 99: 363-371
Giordani, G., and Viaroli, P. 2001 Valle Smarlacca.. Pages 50-54 in: Dupra, V., Smith, S.V., Marshall
Crossland, J.I. and Crossland, C.J. (eds): Coastal and estuarine systems of the Mediterranean
and Black Sea regions: carbon, nitrogen and phosphorus fluxes. LOICZ Reports & Studies No.
19, LOICZ, Texel, The Netherlands.
Giordani, G., De Falco, G., Baroli, M., Guerzoni, S. and Viaroli, P. 2001 S'Ena Arrubia Lagoon,
Oristano, western coast of Sardinia. Pages 61-66 in: Dupra, V., Smith, S.V., Marshall
Crossland, J.I. and Crossland, C.J. (eds): Coastal and estuarine systems of the Mediterranean
and Black Sea regions: carbon, nitrogen and phosphorus fluxes. LOICZ Reports & Studies No.
19, LOICZ, Texel, The Netherlands.
Gordon, D.C. Jr, Boudreau, P.R., Mann, K.H., Ong, J.-E., Silvert, W.L., Smith, S.V., Wattayakorn, G.,
Wulff, F. and Yanagi, T. 1996 LOICZ Biogeochemical Modelling Guidelines. LOICZ
Reports & Studies No 5, 96 pages.
Granelli, V. Coppo, S. Siri, R. and Fabiano, M. in press Studio sugli effetti ambientali relativi alla
messa in opera di nuove condotte sottomarine nell'area genovese. IA-Ingegneria ambientale.
Hansen, H.P. and Grasshoff, K. 1983 Automated chemical analysis. Pages 347-379 in Grasshoff, K.,
Ehrhardt, M. and Kremling, K. (eds) Methods of seawater analysis (2nd edn), Verlag Chemie,
Weinheim.
Hargreaves, G.H. 1975 Moisture availability and crop production. Trans. Am. Soc. Agric. Eng. 18(5):
980-984.
HÕkanson, L. 1994 A review of effect-dose-sensitivity models for aquatic ecosystem. Internationale
Revue der Gesamten Hydrobiologie 79: 621-667.
Izzo, G. and Hull, V. 1991 The anoxic crises in dystrophic processes of coastal lagoon: an energetic
explanation. Pages 559-572 in Rossi, C. and Tiezzi, E. (eds) Ecological Physical Chemistry.
Elsevier Science Publishers B.V., Amsterdam.
Lenzi, M. 1992 Experiences for the management of Orbetello Lagoon: eutrophication and fishing.
Science of the Total Environment (suppl. 1992): 1189-1198. Elsevier Science Publishers B.V.,
Amsterdam.
138
Lenzi, M. and Mattei, N. 1998 Risultati di quattro anni di gestione dell'ecosistema lagunare di
Orbetello attraverso la raccolta delle biomasse algali. Biologi Italiani 28(2): 7-12.
Lenzi, M., Costa, A. and Giannerini, S. 1998a Variazioni di dominanza nei popolamenti algali della
laguna di Orbetello. Un'ipotesi che ne individua le cause. Atti della SocietÓ toscana di
Scienze Natuali, Memorie, Serie B, 105: 35-43.
Lenzi M., Mattei N. and Solimeno P. 1998b Lagunaggio degli effluenti civili depurati in un'area
marginale della Laguna di Orbetello (Toscana) appositamente conterminata. Biologi Italiani
28(3): 23-28.
Lenzi, M., Costa, A., Porrello, S. and Dibitetto, M. 1999 Monitoraggio dei flussi di azoto e fosforo
nella laguna di Orbetello tra il 1997 e il 1998. Biologi Italiani 11: 31-34.
Lenzi, M., Palmieri, R. and Porrello, S. 2003 Restoration of the eutrophic Orbetello Lagoon
(Tyrrhenian Sea, Italy): water quality management. Marine Pollution Bulletin 46:1540-1548.
Leonardi, M., Azzaro, F., Azzaro, M., Decembrini, F. and Monticelli, L.S. 2000 Ciclo della sostanza
organica nell'ecosistema lagunare di Tindari (ME). Biol. Mar. Medit. 7(1): 222-232.
Leonardi, M. and Giacobbe, S. 2001 The Oliveri-Tindari Lagoon (Messina, Italy): Evolution of the
trophic-sedimentary environment and mollusc communities in the last twenty years. Pages
305-310 in Faranda, F.M., Guglielmo, L. and Spezie, G. (eds) Mediterranean ecosystems:
structures and processes. Springer-Verlag Italia.
Leonardi M., Cavalli, R.M., Pignatti, S. and Ratta., F. 2001 Shapes and colours in the Tindari coastal
ecosystem: new prospects for preservation and management. Proc. 3rd Int. Cong. on "Science
and technology for the safeguard of cultural heritage in the Mediterranean Basin" 2:770-774.
Magazz∙, G., Romeo, G., Azzaro, F., Dicembrini, F., Oliva, F. and Piperno, A. 1995 Chemical
pollution from urban and industrial sewages in Augusta Bay (Sicily). Wat. Sci. Tech.
32(9-10): 221-229.
Manzella, G. and Stocchino, C. 1982 Trasporto costiero nel Mar Ligure tratto da Ventimiglia al
promontorio di Piombino. Parte seconda. Istituto Idrografico della Marina I.I. 3066,
Genova.
Marchetti, R. and Verna, N. 1992 Quantification of the phosphorus and nitrogen loads in the minor
rivers of the Emilia-Romagna coast (Italy). A methodological study on the use of theoretical
coefficients in calculating the loads. Pages 315-336 in Vollenweider, R.A., Marchetti, R. and
Viviani, R. (eds) Marine Coastal Eutrophication, Elsevier, Amsterdam.
Marinov, D., ZaldĒvar J.M. and Norro A. 2004 Hydrodynamic investigation of Sacca di Goro coastal
lagoon (Po River delta, Italian Adriatic Sea shoreline). European Communities Report No.
EUR 21178 EN, 79 pages.
MAV-CVN (Magistrato alle Acque di Venezia- Consorzio Venezia Nuova) 1998 Interventi per
l'arresto del degrado connesso alla proliferazione delle macroalghe in Laguna di Venezia Ł
Studio delle cinetiche idrauliche connesse ai processi di immissione e trasporto degli inquinanti
nella Laguna di Venezia. Relazione finale
MAV-CVN 1999 Interventi per l'arresto del degrado connesso alla proliferazione delle macroalghe in
Laguna di Venezia Ł Trattamento ed analisi dei dati anche mediante un modello di qualitÓ
dell'acqua. Relazione finale. Pastres, R. and Solidoro, C. editors
MAV-CVN 2000a Progetto 2023-AttivitÓ A. Contributo di fall-out atmosferico alle immissioni in
laguna. Relazione finale. Guerzoni, S. editor.
MAV-CVN 2000b Progetto 2023-AttivitÓ F. AttivitÓ di formazione delle condizioni ambientali
dell'ecosistema lagunare. Valutazione preliminare dello stato attuale dell'ecosistema lagunare
veneziano. Thetis S.p.A. editor.
MAV-CVN 2001 Progetto DRAIN. Trasferimento di acqua dolce e inquinanti dal bacino scolante alla
laguna di Venezia. Documento di Progetto 15A. Collavini, F., Zonta, R., Bettiol, C.,
Fagarazzi, O. and Zaggia, L. editors.
MAV-CVN 2002a AttivitÓ di monitoraggio ambientale della laguna di Venezia (MELa1). Trattamento
ed analisi dei dati, elaborazioni in linea ed interpretazioni spazio temporali. Pastres, R.,
Ciavatta, S. and Petrizzo, A. editors.
MAV-CVN 2002b AttivitÓ di monitoraggio ambientale della laguna di Venezia (MELa1).
Interpretazione della dinamica spazio temporale dei dati mediante un modello di produttivitÓ
139
primaria. Rapporto 1░ anno. Trattamento ed analisi dei dati, elaborazioni in linea ed
interpretazioni spazio temporali. Solidoro, C., and Cossarini, G. editors.
MAV-SAMA (Magistrato alle Acque di Venezia - Sezione Antinquinamento del Magistrato alle
Acque) 2000 Relazione sulle caratteristiche degli scarichi idrici dell'area di Porto Marghera.
Dati Relativi al 1999.
MAV-SAMA 2001 Campagna di monitoraggio delle acque della Laguna di Venezia. Dati Relativi al
1999.
MAV-SAMA 2002 Relazione sulle caratteristiche degli scarichi idrici dell'area di Porto Marghera.
Dati Relativi al 2000.
Mazzola, A. and SarÓ, G. 1995 Caratteristiche idrologiche di una laguna costiera mediterranea
(Stagnone di Marsala - Sicilia occidentale): ipotesi di un modello qualitativo di circolazione
lagunare. Naturalista siciliano 19: 229-277.
Morand, P. and Briand, X. 1996 Excessive growth of macroalgae: a symptom of environmental
disturbance. Botanica Marina 39: 491-516.
Mosello R. 1993 Rete Italiana per lo studio delle deposizioni atmosferiche (RIDEP). Pubblicazione
n.11: Situazione degli studi sulla chimica delle deposizioni atmosferiche umide in Italia nel
1991. Documento dell'Istituto Italiano di Idrobiologia Vol: 42, 46 pages
Murphy, J. and Riley, J.P. 1962 A modified single solution method for the determination of phosphate
in natural waters. Analytica Chimica Acta 27:31-36.
Nista, M.G. 1994 Studio idrologico ed idraulico del Lago di Lesina. PhD thesis, University of Aquila,
Italy, 723 pages.
N³rnberg, G.K. 1996 Trophic state of clear and colored, soft- and hard-water lakes with special
consideration of nutrients, anoxia phytoplankton and fish. Lakes and Reservoir Management
12: 432-447.
Okubo, A. 1971 Oceanic diffusion diagrams. Deep-Sea Research 18: 789-802
Pernetta, J.C. and Milliman, J.D. (eds) 1995 Land-Ocean Interactions in the Coastal Zone:
Implementation Plan. IGBP Global Change Report 33. IGBP, Stockholm, 215 pages.
Pernice G., Patti I. and Caltagirone, P. 2001 Capo Feto Ł Analisi del degrado di un biotopo naturale,
N.T.R.- I.R.M.A. Ł Special Publication No. 7 Ł 2001, IRMA-CNR - Mazara del Vallo.
Petretti, F. 1988 Torre Guaceto - Indagini preliminari per l'istituzione di una riserva marina.
Pusceddu, A., Sara, G., Mazzola, A., Fabiano, M. 1997 Relationships between suspended and
sediment organic matter in a semi-enclosed marine system: The Stagnone di Marsala Sound
(Western Sicily). Water, Air and Soil Pollution 99-1: 343-352.
Progetto Life-Nature 2002 Ripristino e riqualificazione del biotope Capo Feto IV Rapporto intermedio
No. B4/006270/99.
Redfield, A.C., Ketchum, B.H. and Richards, F.A. 1963 The influence of organisms on the
composition of seawater. Pages 26-49 in Hill, M.N. (ed): The Sea, ideas and observations on
progress in the study of the seas. Interscience Publ., New York.
Regione Siciliana, Assessorato Agricoltura e Foreste, Gruppo IV, Servizi allo Sviluppo, UnitÓ di
Agrometeorologia, 2001. "Climatologia della Sicilia".
Rivaro, P., Grotti, M., Povero, P., Misic, C. and Castellano, M. 2000 Environmental quality evaluation
of Ligurian Sea coastal waters. Annali di Chimica 90: 113-128.
SarÓ, G., Leonardi, M. and Mazzola A. 1999 Spatial and temporal changes of suspended matter in
relation to wind and vegetation cover in a Mediterranean shallow coastal environment.
Chemistry and Ecology 16: 151-173.
Scalzo, P.D., Belmonte, G. and Grasso, M. 1994 Rapporto sull'andamento stagionale delle
caratteristiche chimico-fisiche del lago di Acquatina. Marzo 1985-Febbraio 1986. Thalassia
Salentina 20: 49-60.
Sciacca, S. and Fallico, R. 1978 Presenza e concentrazione di sostanze inquinanti di origine industriale
nella Rada di Augusta (Siracusa). Inquinamento 20: Vol.6.
Sechi, N. 1982 Lo stato trofico di alcuni stagni salmastri costieri della Sardegna. Boll. Soc. Sarda Sci.
Nat. 21: 285-295.
Sfriso, A.., Marcomini, A. and Pavoni B. 1994 Annual nutrient exchanges between the central lagoon
of Venice and the northern Adriatic Sea. The Science of the Total Environment 156: 77-92.
140
Shuttleworth, W.J. 1993 Evaporation. Chapter 4 in Maidment, D.R. (ed.) Handbook of
Hydrology, McGraw-Hill, various pagings.
SIBM (SocietÓ Italiana di Biologia Marina) 1990 Metodi nell'ecologica del plankton marino.
Nova Thalassia 11, 372 pages.
Talassographic Report 1992 Sistema integrato per il monitoraggio automatico della Rada di
Augusta. Istituto Sperimentale Talassografico (CNR), Rapporti 6, 1-120.
Taylor, G.I. 1953 Dispersion of soluble matter in solvent slowly flowing through a tube.
Proceedings of the Royal Society of London A219: 186-203
Tolomio C. and Lenzi M. 1996 "Eaux colorķes" dans les lagunes d'Orbetello et de Burano
(Mer Tyrrhķnienne du Nord) de 1986-1989. Vie Milieu 46(1): 25-37.
Travaglia, C. and Lorenzini, M. 1985 Monitoring algae growth by digital analysis of
LANDSAT data: the Orbetello Lagoon case study. RSC Series, FAO, Rome, 19
pages.
Trebini, F., Ceccherelli, G. and Sechi, N. 2003 Variazione temporale delle macroalghe e del
fitoplancton nella laguna eutrofica di S'Ena Arrubia (Sardegna centro-occidentale).
Biologia Marina Mediterranea 10:742-744.
Vadrucci, M.R., Decembrini, F. and Magazz∙, G. 1995 Ruolo limitante del fosforo sulla produzione
primaria nello stagno salmastro di Acquatina.
S.It.E. Atti 16: 225-228.
Vadrucci, M.R., Fiocca, A., Decembrini, F. and Magazz∙, G. 1996 Biomassa e produzione
fitoplanctonica frazionate in un ambiente salmastro meso-oligotrofico del Salento (Stagno di
Acquatina 1991-1994). S.It.E. Atti 17: 455-459.
Vadrucci, M.R, Fiocca, A., Negro, O., Sangiorgio, F., Semeraro, A. and Basset, A. 2001 Lake Alimini
Grande, Lecce. Pages 55-60 in: Dupra, V., Smith, S.V., Marshall Crossland, J.I. and
Crossland, C.J. (eds): Coastal and estuarine systems of the Mediterranean and Black Sea
regions: carbon, nitrogen and phosphorus fluxes. LOICZ Reports & Studies No. 19.
VESTA (Venezia Servizi Territoriali Ambientali) 2002 Relazione annuale 2001: impianto di
depurazione di Campalto. Venezia Servizi Territoriali Ambientali.
Viaroli, P., Naldi, M., Christian, R.R. and Fumagalli, I. 1993 The role of macroalgae and detritus in
the nutrient cycles in a shallow-water dystrophic lagoon. Verh. Internat. Verein. Limnol. 25:
1048-1051.
Viaroli, P., Bartoli, M., Bondavalli, C., Christian, R.R., Giordani, G. and Naldi, M. 1996a Macrophyte
communities and their impact on benthic fluxes of oxygen, sulphide and nutrients in shallow
eutrophic environments. Hydrobiologia 329: 105-119.
Viaroli, P., Naldi, M, Bondavalli, C. and Bencivelli, S. 1996b Growth of the seaweed Ulva rigida C.
Agardh in relation to biomass densities, internal nutrient pools and external nutrient supply in
the Sacca di Goro (Northern Italy). Hydrobiologia 329: 93-103.
Viaroli, P., Azzoni, R., Bartoli, M., Giordani, G. and Taje', L. 2001a Evolution of the trophic
conditions and dystrophic outbreaks in the Sacca di Goro lagoon (Northern Adriatic Sea).
Pages 443-451in Faranda, F.M., Guglielmo, L. and Spezie, G. (eds): Structure and processes in
the Mediterranean ecosystems. Chapter 56, Springer Verlag Italia, Milano.
Viaroli, P., Giordani, G., Cattaneo, E., Zaldņvar, J.M. and Murray C.N. 2001b Sacca di Goro Lagoon.
Pages 36-45 in: Dupra, V., Smith, S.V., Marshall Crossland, J.I. and Crossland, C.J. (eds):
Coastal and estuarine systems of the Mediterranean and Black Sea regions: carbon, nitrogen
and phosphorus fluxes. LOICZ Reports & Studies 19, LOICZ, Texel, The Netherlands.
Viaroli, P., Giordani, G. 2001c Valli di Comacchio. Pages 46-49 in: Dupra, V., Smith, S.V., Marshall
Crossland, J.I. and Crossland, C.J. (eds): Coastal and estuarine systems of the Mediterranean
and Black Sea regions: carbon, nitrogen and phosphorus fluxes. LOICZ Reports & Studies 19,
LOICZ, Texel, The Netherlands.
Viaroli, P., Giordani, G., Bartoli, M., Naldi, M., Azzoni, R., Nizzoli, D., Ferrari, I., ZaldĒvar, J.M.,
Bencivelli, S., Castaldelli, G. and Fano, E.A. (in press) The Sacca di Goro lagoon and an arm
of the Po River. Submitted to The Handbook of Environmental Chemistry (Ed. in Chief: O.
Hutzinger) Volume 5. Water pollution: estuaries. Volume editor: P.J. Wangersky
Villani, P., Carapella, G., Scirocco, T., Specchiulli, A., Maselli, M., Schiavoni, R., Spagnoli, F.,
Marolla, V., Casolino, G., Franchi, M., Schiavoni, P. and Deolo, A. 1999 Environmental
141
characterization of the Varano Lagoon. Consortium ELTCON Project, Final Scientific Report,
29 pages.
Wood, E.D., Armstrong, A.J. and Richards, F.A. 1967 Determination of nitrate in seawater by
cadmium-copper reduction to nitrite. Journal of the Marine Biological Association of the U.K.
47: 23-31
Yanagi, T. 1999 Seasonal variation in nutrient budgets in Hakata Bay, Japan. Journal of
Oceanography 55: 439-448
Yanagi, T. 2000a Dokai Bay. Pages 20-25 in Dupra, V., Smith, S.V., Marshall Crossland, J.I. and
Crossland, C.J. 2000 Estuarine systems of the East Asia region: carbon, nitrogen and
phosphorus fluxes. LOICZ Reports and Studies 16, LOICZ, Texel, The Netherlands.
Yanagi, T. 2000b Simple method for estimating VX from mixing equations in a 1-dimensional, steady-
state system for LOICZ biogeochemical modelling. Pages 108-110 in Dupra, V., Smith, S.V.,
Marshall Crossland, J.I. and Crossland, C.J. 2000 Estuarine systems of the East Asia region:
carbon, nitrogen and phosphorus fluxes. LOICZ Reports and Studies 16, LOICZ, Texel, The
Netherlands.
142
APPENDICES
Appendix I
List of Participants at LaguNet Workshops, and Authors contributing to
this Report
A. Participants at the Venice LaguNet workshop (14-15 April, 2002)
Abbiati, Marco - abbiati@ambra.unibo.it, Dipartimento di Zoologia, UniversitÓ di Bologna
Azzaro, Maurizio - dedalus@ist.me.cnr.it, Istituto per l'ambiente marino costiero- Talassografico,
CNR,Messina
Barbanti, Andrea - barbanti.a@thetis.it, Thetis S.p.A., Venezia
Basset, Alberto - abasset@ unile.it, Dipartimento di Scienze e Tecnologie Biologiche e Ambientali,
UniversitÓ di Lecce
Bocci, Martina - bocci.m@thetis.it, Thetis S.p.A., Venezia
Cappello, Ilaria - ilaria.cappello@tin.it, Dipartimento di Scienze e Tecnologie Biologiche e
Ambientali, UniversitÓ di Lecce
Carafa, Roberta - robertacara@tiscali.it, Dipartimento di Scienze Ambientali, UniversitÓ di Parma
Carlin, Anna - carlin.a@thetis.it, Thetis S.p.A, Venezia
Casselli, Chiara - chiara.casselli@iol.it, Centro Interdipartimentale di Ricerca per le Scienze
Ambientali in Ravenna, UniversitÓ di Bologna.
Castaldelli, Giuseppe - ctg@unife.it, Dipartimento di Biologia, UniversitÓ di Ferrara
Castellani, Chiara - castellani.c@thetis.it, Thetis S.p.A, Venezia
Ceccherelli, Giulia - cecche@uniss.it, Dipartimento di Botanica ed Ecologia Vegetale, UniversitÓ di
Sassari
Ceccherelli,Victor Ugo - victor.ceccherelli@unibo.it, Dipartimento di Zoologia, UniversitÓ di Bologna
Colangelo, Marina - marina.colangelo@unibo.it, Dipartimento di Zoologia, UniversitÓ di Bologna
D'Adamo, Raffaele - raffaele.dadamo@fg.ismar.cnr.it, Istituto di Scienze Marine, CNR, Sezione
Ecosistemi Costieri e Lagunari, Lesina (Foggia)
Facca Chiara - facca@unive.it, Dipartimento di Scienze Ambientali, UniversitÓ di Venezia
Focardi Silvano - focardi@unisi.it, Dipartimento di Scienze Ambientali, UniversitÓ di Siena
Frangipane, Gretel - gretelf@unive.it, Dipartimento di Scienze Ambientali, UniversitÓ di Venezia
Giordani, Gianmarco - giordani@nemo.unipr.it, Dipartimento di Scienze Ambientali, UniversitÓ di
Parma
Guerranti, Cristiana - guerranticri@unisi.it, Dipartimento di Scienze Ambientali, UniversitÓ di Siena
Guerzoni, Stefano - -stefano.guerzoni@ismar.cnr.it, Istituto di Scienze Marine, CNR, Divisione
Lagune e Ambienti costieri di transizione, Venezia
Lenzi, Mauro - lealab2@hotmail.com, Laboratorio di Ecologia Lagunare e Acquicoltura, Orbetello
Pesca Lagunare S.r.l., Orbetello, Grosseto.
Magni, Paolo - p.magni@imc-it.org, Centro Marino Internazionale, Oristano
Manini, Elena - e.manini@univmp.it, Istituto di Scienze Marine, CNR, Sezione Ecosistemi Costieri e
Lagunari, Lesina (Foggia)
Montobbio, Laura - laura.montobbio@consorziovenezianuova.com, Consorzio Venezia Nuova,
Venezia
Mura, Gabriele - dbev@uniss.it, Sassari
Murray, Nicholas - nicholas.murray@wanadoo.fr, European Commission, Joint Research Center,
Institute for Environment and Sustainability, Ispra
Niell, F.Xavier - fxn@uma.es, Departamento de Ecologia, Universidad de Malaga, (Spain)
Padedda,Bachisio Mario - eco8@uniss.it, Dipartimento di Botanica ed Ecologia Vegetale, UniversitÓ
di Sassari
Palmisano, Luigi - l_palmisano@virgilio.it, Dipartimento di Scienze e Tecnologie Biologiche e
Ambientali, UniversitÓ di Lecce
Pastres, Roberto - pastres@unive.it, Dipartimento di Chimica Fisica, UniversitÓ di Venezia
Pessa, Giuseppe - pamag@libero.it, SocietÓ per l'Ecologia delle Lagune e delle Coste (S.E.L.C.)
Venezia-Mestre
143
Pomes, Alessandro - alex_p79@libero.it, Dipartimento di Scienze e Tecnologie Biologiche e
Ambientali, UniversitÓ degli Studi di Lecce
Ponti, Massimo - ponti@ambra.unibo.it, Centro Interdipartimentale di Ricerca per le Scienze
Ambientali in Ravenna, UniversitÓ di Bologna
Povero, Paolo - povero@unige.it, Dipartimento per lo Studio del Territorio e le sue Risorse
(DIPTERIS), UniversitÓ di Genova
Pugnetti, Alessandra - alessandra.pugnetti@ismar.cnr.it, Istituto di Scienze Marine, CNR, Venezia,
Divisione Lagune e Ambienti costieri di transizione
Rabitti, Sandro - sandro.rabitti@thetis.it, Thetis S.p.A., Venezia
Sfriso, Adriano - sfrisoad@unive.it, Dipartimento di Scienze Ambientali, UniversitÓ di Venezia
Socal, Giorgio -giorgio.socal@ismar.cnr.it, Istituto di Scienze Marine, CNR, Divisione Lagune e
Ambienti costieri di transizione, Venezia
Solidoro, Cosimo - csolidoro@ogs.trieste.it, Istituto Nazionale di Oceanografia e di Geofisica
Sperimentale - OGS, Sgonico Trieste
Spagnoli, Federico - federico.spagnoli@fg.ismar.cnr.it, Istituto di Scienze Marine, CNR, Sezione
Ecosistemi Costieri e Lagunari, Lesina (Foggia)
Tagliapietra Davide, davide.tagliapietra@ve.ismar.cnr.it , Istituto di Scienze Marine, CNR, Divisione
Lagune e Ambienti costieri di transizione, Venezia
Trebini, Felicina,- fetre@uniss.it, Dipartimento di Botanica ed Ecologia Vegetale UniversitÓ di Sassari
Vazzoler, Marina - mvazzoler@arpa.veneto.it, Agenzia Regionale per la Prevenzione e Protezione
Ambientale del Veneto
Vezzulli, Luigi - vezzulli@dipteris.unige.it, Dipartimento per lo Studio del Territorio e le sue Risorse
(DIPTERIS), UniversitÓ di Genova
Viaroli, Pierluigi - pierluigi.viaroli@unipr.it, Dipartimento di scienze Ambientali, UniversitÓ di Parma
Volpi, Ghirardini - Annamaria voghi@unive.it, Dipartimento di Scienze Ambientali, UniversitÓ di
Venezia
Zaggia, Luca - zaggia@isdgm.ve.cnr.it, Istituto di Scienze Marine, CNR, Divisione Lagune e Ambienti
costieri di transizione, Venezia
Zaldivar, Comenges Jose Manuel - jose.zaldivar-comenges@jrc.it, European Commission, Joint
Research Center, Institute for Environment and Sustainability, Ispra
Zonta, Roberto - r.zonta@ismar.cnr.it, Istituto di Scienze Marine, CNR, Divisione Lagune e Ambienti
costieri di transizione, Venezia
B. Authors contributing to this Report
Abbiati, Marco - marco.abbiati@unibo.it, Scienze Ambientali, Ravenna, UniversitÓ di Bologna
Apollo, Francesca - Istituto per l'ambiente marino costiero, CNR, Sezione di Mazara del Vallo, Trapani
Austoni, Martina - martina.austoni@jrc.it, Dipartimento di Scienze Ambientali, UniversitÓ di Parma
Azzaro, Filippo - azzaro@ist.me.cnr.it, Istituto Ambiente Marino Costiero - CNR, sezione di Messina
Azzaro, Maurizio, dedalus@ist.me.cnr.it, Istituto Ambiente Marino Costiero - CNR, sezione di
Messina
Barbanti, Andrea - barbanti.a@thetis.it, Thetis S.p.A., Venezia
Basset, Alberto - abasset@ unile.it, Dipartimento di Scienze e Tecnologie Biologiche e Ambientali,
UniversitÓ degli Studi di Lecce
Bergamasco, Alessandro - bergamasco@ist.me.cnr.it, Istituto Ambiente Marino Costiero - CNR,
sezione di Messina
Bernstein, Alberto Giulio - albertogiulio.bernstein@consorziovenezianuova.com, Consorzio Venezia
Nuova, Venezia
Breber, Paolo - paolo.breber@fg.ismar.cnr.it, Istituto di Scienze Marine, CNR, Sezione Ecosistemi
Costieri e Lagunari, Lesina (Foggia)
Cal“, Giuseppe - Dipartimento di Ingegneria Civile ed Ambientale, Politecnico di Bari
Calvo, Sebastiano - Dipartimento di Scienze Botaniche, UniversitÓ di Palermo, calvo@unipa.it
Cappello, Ilaria - ilaria.cappello@tin.it, Dipartimento di Scienze e Tecnologie Biologiche e
Ambientali, UniversitÓ di Lecce
Castaldelli, Giuseppe - ctg@unife.it, Dipartimento di Biologia, UniversitÓ di Ferrara
144
Castellani, Chiara - castellani.c@thetis.it, Thetis S.p.A., Venezia
Castellano, Michela - castella@dipteris.unige.it, Dipartimento per lo Studio del Territorio e le sue Risorse
(DIPTERIS), UniversitÓ di Genova
Ceccherelli, Giulia - cecche@uniss.it, Dipartimento di Botanica ed Ecologia Vegetale, UniversitÓ di
Sassari.
Cecconi, Giovanni - giovanni.cecconi@consorziovenezianuova.com, Consorzio Venezia Nuova,
Venezia
Ciccolella, Alessandro - Consorzio di Gestione della Riserva Naturale di Torre Guaceto, Brindisi
Ciraolo, Giuseppe - Dipartimento di Ingegneria Idraulica ed Applicazioni Ambientali, UniversitÓ di
Paler o,
m
Collavini, Flaviano - f.collavini@ismar.cnr.it, CNR-ISMAR, Venezia, Divisione Lagune e Ambienti
costieri di transizione
Conio, Osvaldo - Azienda Mediterranea Gas e Acqua (AMGA) s.p.a., Genova
Cortese, Giuseppina - Dipartimento di Ecologia Marina, UniversitÓ di Messina
Cossarini, Gianpiero - gcossarini@ogs.trieste.it, Istituto Nazionale di Oceanografia e di Geofisica
Sperimentale - OGS, Sgonico, Trieste
D'Adamo, Raffaele - raffaele.dadamo@fg.ismar.cnr.it, Istituto di Scienze Marine, CNR, Sezione
Ecosistemi Costieri e Lagunari, Lesina (Foggia)
Danovaro, Roberto - danovaro@univpm.it, Dipartimento di Scienze del Mare - UniversitÓ Politecnica
delle Marche, Ancona
Decembrini, Franco - decembrini@ist.me.cnr.it, Istituto per l'Ambiente Marino Costiero, CNR,
Sezione di Messina
Derqui, Ezio - Genova Acque, Genova
Fabiano, Mauro - fabianom@unige.it, Dipartimento per lo Studio del Territorio e le sue Risorse (DIPTERIS),
UniversitÓ di Genova
Gennaro, Paola - p.gennaro@icram.org, Istituto Centrale per la Ricerca scientifica e tecnologica
Applicata al Mare, ICRAM, Roma
Giacobbe, Salvatore - Dipartimento di Biologia Animale ed Ecologia Marina, UniversitÓ di Messina,
Giaquinta, Saverio - Servizio Sistemi Ambientali, ARPA Emilia-Romagna Sezione di Ravenna
Giordani, Gianmarco - giordani@nemo.unipr.it, Dipartimento di Scienze Ambientali, UniversitÓ di
Parma
Guerzoni, Stefano - stefano.guerzoni@ismar.cnr.it, Istituto di Scienze Marine, CNR, Divisione Lagune
e Ambienti costieri di transizione, Venezia
La Loggia, Goffredo - Dipartimento di ingegneria Idraulica ed Applicazioni Ambientali, UniversitÓ di
Paler o
m
Lenzi, Mauro - lealab2@hotmail.com, Laboratorio di Ecologia Lagunare e Acquicoltura, Orbetello
Pesca Lagunare s.r.l. Orbetello, Grosseto.
Leonardi, Marcella - leonardi@ist.me.cnr.it, Istituto Ambiente Marino Costiero - CNR, sezione di
Messina
Maccarrone, Vincenzo - Istituto per l'ambiente marino costiero, CNR, Sezione di Mazara del Vallo,
Trapani
Maggi, Stefania - AutoritÓ Portuale, Genova
Manini, Elena - e.manini@univmp.it, Istituto di Scienze Marine, CNR, Sezione Ecosistemi Costieri e
Lagunari, Lesina (Foggia)
Mazzola, Antonio - amazzola@unipa.it, Dipartimento di Biologia Animale, UniversitÓ di Palermo
Misic, Cristina - misic@dipteris.unige.it, Dipartimento per lo Studio del Territorio e le sue Risorse
(DIPTERIS) - UniversitÓ di Genova
Montobbio, Laura - laura.montobbio@consorziovenezianuova.com, Consorzio Venezia Nuova,
Venezia
Padedda, Bachisio Mario - eco8@uniss.it, Dipartimento di Botanica ed Ecologia Vegetale, UniversitÓ
di Sassari
Palmisano, Luigi - l_palmisano@virgilio.it, Dipartimento di Scienze e Tecnologie Biologiche e
Ambientali, UniversitÓ degli Studi di Lecce
Pastres, Roberto - patres@unive.it, Dipartimento di Chimica Fisica, UniversitÓ di Venezia
Patti, Ignazio - Istituto per l'ambiente marino costiero, CNR, Sezione di Mazara del Vallo, Trapani
145
Pernice, Giuseppe - pernice@irma.pa.cnr.it, Istituto per l'ambiente marino costiero, CNR, Sezione di
Mazara del Vallo, Trapani
Pinna, Maurizio - Dipartimento di Scienze e Tecnologie Biologiche ed Ambientali, UniversitÓ degli
Studi di Lecce
Pomes, Alessandro - alex_p79@libero.it, Dipartimento di Scienze e Tecnologie Biologiche e
Ambientali, UniversitÓ degli Studi di Lecce
Ponti, Massimo - ponti@ambra.unibo.it, Centro Interdipartimentale di Ricerca per le Scienze
Ambientali in Ravenna, UniversitÓ di Bologna
Porrello, Salvatore - s.porrello@icram.org, Istituto Centrale per la Ricerca scientifica e tecnologica
Applicata al Mare ICRAM, Roma
Povero, Paolo - povero@unige.it, Dipartimento per lo Studio del Territorio e le sue Risorse (DIPTERIS),
UniversitÓ di Genova
Pulican“, Giuseppina - Dipartimento di Ecologia Marina, UniversitÓ di Messina
Rabitti, Sandro - sandro.rabitti@thetis.it, Thetis S.p.A., Venezia
Rivaro, Paola - Dipartimento di Chimica e Chimica Industriale (DCCI) - UniversitÓ degli Studi di
Genova
Ruggeri, Nicoletta - castella@dipteris.unige.it Dipartimento per lo Studio del Territorio e le sue Risorse
(DIPTERIS), UniversitÓ di Genova
Sanfilippo, Marilena - Dipartimento di Ecologia Marina, UniversitÓ di Messina
Sechi, Nicola - sechi@uniss.it, Dipartimento di Botanica e Ecologia Vegetale, UniversitÓ di Sassari
Socal, Giorgio - socal@ibm.ve.cnr.it, Istituto di Scienze Marine, CNR, Divisione Lagune e Ambienti
costieri di transizione, Venezia
Solidoro, Cosimo - csolidoro@ogs.trieste.it, Istituto Nazionale di Oceanografia e di Geofisica
Sperimentale - OGS, Sgonico Trieste
Spagnoli, Federico - federico.spagnoli@fg.ismar.cnr.it, Istituto di Scienze Marine, CNR, Sezione
Ecosistemi Costieri e Lagunari, Lesina (Foggia)
Tinelli, Roccaldo - Dipartimento di Ingegneria Civile ed Ambientale, Politecnico di Bari
Tomasello, Agostino - Dipartimento di Scienze Botaniche, UniversitÓ di Palermo. agtoma@unipa.it
Trebini, Felicina - fetre@uniss.it, Dipartimento di Botanica ed Ecologia Vegetale UniversitÓ di Sassari
Vadrucci, Maria Rosaria - Dipartimento di Scienze e Tecnologie Biologiche ed Ambientali, UniversitÓ
di Le c
c e
Vazzoler, Marina - mvazzoler@arpa.veneto.it, Agenzia Regionale per la Prevenzione e Protezione
Ambientale del Veneto
Viaroli, Pierluigi - pierluigi.viaroli@unipr.it, Dipartimento di scienze Ambientali, UniversitÓ di Parma
Vizzini, Salvatrice - vizzini@unipa.it, Dipartimento di Biologia Animale, UniversitÓ di Palermo
Zaggia, Luca - zaggia@isdgm.ve.cnr.it, Istituto di Scienze Marine, CNR, Divisione Lagune e Ambienti
costieri di transizione, Venezia
Zaldivar, Comenges Jose Manuel - jose.zaldivar-comenges@jrc.it, Joint Research Center, Institute for
Environment and Sustainability, Ispra, Varese
C. Participants at the Naples LaguNet workshop (17-19 June 2004)
Abbiati, Marco - abbiati@ambra.unibo.it, Dipartimento di Zoologia, UniversitÓ di Bologna
Andresini, Annamaria - a.andresini@libero.it, Istituto di Scienze Marine, CNR, Sezione Ecosistemi
Costieri e Lagunari, Lesina (Foggia)
Bahri, Sihem - Sihem.bahri@fst.rnu.tn, Facultķ des Sciences de Tunis, Dķpartement de Biologie,
Tunisia
Basset Alberto - abasset@ unile.it, Dipartimento di Scienze e Tecnologie Biologiche e Ambientali,
UniversitÓ di Lecce
Bergamasco, Alessandro - bergamasco@ist.me.cnr.it, Istituto Ambiente Marino Costiero, CNR,
sezione di Messina
Breber, Paolo - paolo.breber@fg.ismar.cnr.it, Istituto di Scienze Marine, CNR, Sezione Ecosistemi
Costieri e Lagunari, Lesina (Foggia)
Cabrini, Marina - cabrini@univ.trieste.it, Laboratorio di Biologia Marina UniversitÓ di Trieste
Carrada, Gian Carlo - carrada@unina.it, Dipartimento di Zoologia UniversitÓ di Napoli Federico II
146
Casazza, Gianna - casazza@apat.it, Agenzia per la Protezione dell'Ambiente e per I Servizi Tecnici
(APAT), Roma
Cau, Angelo - cau@unica.it, Dipartimento Biologia Animale ed Ecologia UniversitÓ di Cagliari
Como, Serena - serena@discau.unipi.it, Dipartimento di Scienze dell'Uomo e dell'Ambiente,
UniversitÓ di Pisa
Cutolo, Arsenio - Dipartimento di Zoologia UniversitÓ di Napoli Federico II
Di Rosa, Matteo - Dipartimento di Zoologia UniversitÓ di Napoli Federico II
Do Chi Thang - dochi@univ-montp2.fr, EcosystĶmes Lagunaires. Universitķ Montpelier II, France
Fauci, Anna - anna_fauci@hotmail.com, Dipartimento di Zoologia UniversitÓ di Napoli Federico II
Franchi, Enrica - franchie@unisi.it, Dipartimento di Scienze Ambientali UniversitÓ di Siena
Georgescu, Lucian P. - georgl@ugal.ro, Dunarea de Jos University, Galati, Romania
Giordani, Gianmarco - giordani@nemo.unipr.it, Dipartimento di Scienze Ambientali, UniversitÓ di
Parma
Giunta, Giulio - giulio.giunta@uniparthenope.it, Istituto di Matematica, UniversitÓ di Napoli
Parthenope
Grieco, Maria - Dipartimento di Zoologia ,UniversitÓ di Napoli Federico II
Hopkins, Tom S. - tshopkin@gms01.geomare.na.cnr.it, Istituto di Scienze Marine Costiere - CNR
Napoli
Lardicci, Claudio - lardic@discat.unipi.it, Dipartimento di Scienze dell'Uomo e dell'Ambiente,
UniversitÓ di Pisa
Laugier, Thierry - thierry.laugier@ifremer.fr, Institut franńais de recherche pour l'exploitation de la
mer (IFREMER), France
Manini, Elena - emanini@univpm.it, Istituto di Scienze Marine, CNR Sezione Ecosistemi Costieri e
Lagunari, Lesina (Foggia)
Mauri, Marina - mauri.marina@unimo.it, Dipartimento di Biologia Animale UniversitÓ di Modena e
Reggio Emilia
Mazzola, Antonio - amazzola@unipa.it, Dipartimento di Biologia UniversitÓ di Palermo
Mouillot, David - mouillot@univ-montp2.fr, EcosystĶmes Lagunaires. Universitķ Montpelier II,
France
Murenu, Matteo - mmurenu@unica.it, Dipartimento Biologia Animale ed Ecologia UniversitÓ di
Cagliari
Murray, Nicholas - nicholas.murray@wanadoo.fr, Joint Research Center, Institute for Environment and
Sustainability, Ispra, Varese
Occhipinti, Anna - occhipin@unipv.it, Dipartimento di Genetica e Microbiologia, Sezione Ecologia,
UniversitÓ di Pavia
Pastres, Roberto - pastres@unive.it, Dipartimento di Chimica Fisica, UniversitÓ di Venezia
Ponti, Massimo - ponti@ambra.unibo.it, Centro Interdipartimentale di Ricerca per le Scienze
Ambientali, Ravenna
Puka, Llukan, FacoltÓ di Scienze, UniversitÓ di Tirana
Reizopoulou, Sofia - sreiz@ncmr.gr, Institute of Oceanography, National Centre for Marine Research
(NCMR) Greece
Karageorgis, Aris - Institute of Oceanography National Centre for Marine Research (NCMR) Greece
Russo, Giovanni - giovanni.russo@uniparthenope.it, Istituto di Meteorologia e Oceanografia
UniversitÓ di Napoli Parthenope
Sabetta, Letizia - letizia.sabetta@unile.it, Dipartimento di Scienze e Tecnologie Biologiche ed
Ambientali, UniversitÓ di Lecce
Saggiomo, Vincenzo - saggiomo@alpha.szn.it, Stazione Zoologica di Napoli A. Dorhn
Santarpia Immacolata
Solidoro, Cosimo - csolidoro@ogs.trieste.it, Dipartimento Oceanografia, Istituto Nazionale di
Oceanografia e di Geofisica Sperimentale, OGS, Trieste.
Sorrentino, Cristofaro - Dipartimento di Zoologia UniversitÓ di Napoli Federico II
Tagliapietra, Davide - davide.tagliapietra@ve.ismar.cnr.it, Istituto Scienze del Mare - CNR Venezia
Viaroli, Pierluigi - pierluigi.viaroli@unipr.it, Dipartimento di Scienze Ambientali UniversitÓ di Parma
147
Appendix II
Workshop Report
Transport of nutrients in transitional waters of the Italian coast:
evaluation of fluxes and functions of ecosystems
Conference room, Thetis S.p.A.
Venice 14-15 April 2002
The Workshop considered the research aims and objectives of the LOICZ international programme in
the context of national investigations on Italian lagoon and transitional aquatic systems.
In the opening session of the main objectives of the Workshop were presented (P. Viaroli). Two main
points were made:
1. Notwithstanding the important activities of numerous research groups, LOICZ biogeochemical
budgets have not been determined for much of the Mediterranean coast.
2. The LOICZ biogeochemical modelling approach uses data obtained during ecological
investigations of lagoonal ecosystems. A wealth of data exists that is not being optimally
exploited.
From these considerations the objectives of the meeting were defined:
i. To provide a forum for discussion and cooperation between researchers who are studying
biogeochemical processes in lagoons, wetlands and salt- marshes at sites along the Italian coast.
Initiatives of this type had already been initiated between 1976 (Ecologie Mediterranķe) and 1988
(Carrada et al. 1988).
ii. Evaluate the amount of available information and present understanding of the biogeochemistry of
carbon, nitrogen and phosphorus in transitional and coastal waters under the influence of
catchment basins.
iii. Discuss the feasibility of the application of the LOICZ Biogeochemical Model to such areas.
iv. Promote an agreed common approach to studies of biogeochemical processes in these transitional
ecosystems that can provide support to management or policy applications.
v. Consider the feasibility of developing one or more projects either in Italy or elsewhere in Europe
(with Mediterranean EU partners and eventually partners from Eastern Europe and North Africa).
The presentation of S. Guerzoni, who is the focal point for LOICZ for Italy, underlined that the
programme of IGBP and the project LOICZ had not, unfortunately, had strong support in the country.
However, it is now clearly important to develop a more active participation in view of other initiatives,
such as those concerning various observations for global change (GOOS, GTOS and IGBP itself).
The future orientation of the European Union research in the 6th Framework Programme was outlined
by C.N. Murray, in particular the Water Framework Directive. It was emphasised that attention would
be given to Networks of Excellence which considered themes that were outlined in the documents
presented (e.g., hydrographic basins, transitional waters, integrated analysis of areas at risk Ł the
Mediterranean could be one such area).
The scientific and technical aspects of the LOICZ biogeochemical model were presented by G.
Giordani and J.M. Zaldivar.
The introductory session also included the participation of F.X. Niell of the University of Malaga who
gave presentations of the application of the LOICZ model to Spanish estuaries and on the LOICZ
typology for the classification of transitional waters.
148
A description of the challenges and difficulties related to the identification of good ecological
indicators was presented by P. Magni.
In the discussions that followed these presentations A. Basset was asked to outline the guidelines for
the Italian participation to the implementation strategy for monitoring transitional and coastal waters in
the framework of the European Directive on Water. This action, which is developed through an ad hoc
group coordinated by G. Casazza and A. Basset, is particularly relevant because future monitoring
programmes in transitional areas must comply to the guidelines cited earlier.
In successive sections of the Workshop presentations of a series of sites were named where the LOICZ
model had been applied. These included: Laguna di Orbetello (M. Lenzi), Laguna di S'Ena Arrubia (F.
Trebini), la Piallassa Baiona (M. Abbiati), la zona umida di Torre Guaceto (I. Cappello), la Laguna di
Lesina (E. Manini), la Laguna di Venezia (L. Zaggia), complesso lagunare di Capo Peloro (M. Azzaro),
zone umide del ferrarese (G. Castaldelli).
On the basis of further discussions a programme of activities was proposed (with deadlines):
Ę A meeting at the end of May (place to be decided). Discussions of the constitution of
Network of Excellence Ł project with European partners Ł Niell (Spain), PNEC (France),
Greece? Bulgaria? Countries from Northern Europe?
Ę 7 June 2002, proposal of Network of Excellence to the European Commission?
Ę 15 June 2002, confirmation of titles and abstracts for the Report of the Workshop. The full
articles to be prepared by 30 September 2002.
Ę 30 June 2002, send an abstract to the 3rd Congress of the Science of the Seas (Bari, November
2002).
Ę 30 September 2002, Italian LOICZ Report: Publication of an overview report to be presented
in the framework of institutions that are working in the area of coastal systems. Important to
have a reference publication.
Ę 30 September 2002, Italian LOICZ Report: to be published as LOICZ Report in English (a
positive reply to this idea has already been received from C. Crossland Executive Officer,
LOICZ IPO).
Ę Early October 2002, presentation of detailed project to the European Union.
Ę October 2002, informal international meeting on transitional environments in the European
Mediterranean (LOICZ model, indicators, monitoring): Spain, France, Portugal, Greece,
Bulgaria. Develop programme for international meeting in 2003.
Ę November 2002, Presentation 3rd Congress of Science of the Seas (Bari, November 2002).
Presentation of the initiative in the name of all participants.
Ę Mid-2003, Final Workshop. Formal setting-up of national network of lagoon and transitional
waters.
Ę Mid-2003, International Symposium on southern European lagoon and transitional water
environments.
149
Appendix III
Creation of a Southern European Lagoon Observational Network
1. Observational Networks
Southern European Lagoons are increasingly recognised as representing a highly diversified series of
ecosystems ranging over the whole arc of the Mediterranean. They also are often systems of important
economic value to local and regional communities, and as such are often strongly impacted by
anthropogenic pressures. There is considerable scientific interest in understanding the ecological
functioning of lagoons and the external pressures such as agriculture, industrial, tourism and
aquaculture. he Workshop (Venice 14-15 April 2002) "Transport of Nutrients in Transitional Waters
of the Italian Coast: Valuation of Fluxes and Functions of Ecosystems", and the recent international
conference on "Southern European Coastal Lagoons: The Influence of River-Basin Coastal Zone
Interactions", Ferrara, Italy, 10-12 Nov 2003, highlighted some of the information gaps that still need
addressing.
2. Objectives
At present there are three EU national networks/programmes in the southern European arc studying
biogeochemical and ecology processes in lagoons, wetlands and salt marshes. These are PNEC
(France), LaguNet (Italy) and the recently formed network in Greece. International activities such as
LOICZ and the EU thematic network ELOISE also collaborate directly or indirectly with these
networks, as does the coastal initiative of the Global Terrestrial Observing System (GTOS) where
these national initiatives could actively contribute in the future.
Given these developments and through discussions with the various networks, the proposal has been
made to consider the setting up of a series of regional/national networks to support and encourage co-
operation between research groups in the Southern European arc.
The objective of these regional/national networks would be the following:
i.
To provide a forum for discussion and co-operation between research groups who are
studying biogeochemical and ecology processes in lagoons, wetlands and salt marshes in
southern Europe.
ii.
To evaluate available information and current understanding of the biogeochemistry of
carbon, nitrogen and phosphorus flows in transitional and coastal waters influenced by
catchment basins.
iii.
To promote a common approach to studies of biogeochemical and ecological processes
that can provide support to management and policy applications (e.g., EU Water
Framework Directive).
iv.
To discuss the feasibility of providing scientific products to IGBP programmes and other
regional and global monitoring/observation systems.
v.
To consider the feasibility of one or more projects in collaboration with similar networks
in southern Europe such as LaguNet (Italy), PNEC (France), the new Greek network and
DITTY (EU project).
3. Rationale
The development of regional/national (informal) networks would allow a more focussed response to
major policy and science needs such as the implementation of the EU Framework Water Directive or
the assessment of the impact of coastal lagoon ecosystems to local, regional and global anthropogenic
pressures (e.g., LOICZ programme). Such networks could also form a southern European contribution
to the coastal initiative of the Global Terrestrial Observing system (GTOS).
The concept of a number of regional/national networks in the Mediterranean arc is a pragmatic way of
focussing regional scientific and management interests at an effective scale, and allows collaboration
between regional/national networks to develop as mutual interests and concerns are identified.
150
That such networks (over 20 lagoon sites) can effectively be developed is seen through the examples of
the French (PNEC) and Italian (LaguNet, www.dsa.unipr.it/lagunet) networks, which are making a
significant scientific contribution to the understanding of many aspects of river-basin coastal lagoon
functioning. A wider geographical coverage is needed for the southern European arc.
4. Actions
A set of informal meetings could be held with groups already working on coastal lagoons, to discuss
the interest and feasibility of setting up such networks in the Iberian Peninsula (Portugal-Spain)
parallelling those in Italy and France.
Discussions with LOICZ should be held to discuss the possible further role of national networks in the
development of coastal inventories and typology, and with GTOS regarding a southern European arc
contribution to this future global observation system.
A further point for discussion would be the form of the links to be developed with the other
regional/national networks, and the objectives to be identified. As a longer term step the feasibility of
joint collaboration with the EU Network of Excellence (NE) should be considered and potential NE
contributors identified.
151
Appendix IV A proposal of a Typology for Mediterranean transitional waters
A. Basset, L. Sabetta, G.C. Carrada, G.F. Russo, G. Casazza, C. Silvestri, P. Viaroli, G. Giordani, M.
Abbiati, A. Bergamasco, P. Breber, C. Caroppo, M. Cabrini, L. Georgescu, T. Laugier, D. Mouillot, M.
Murenu, N. Murray, A. Occhipinti, S. Reizopoulou, C. Solidoro, Tagliapietra, A. Volpi, S. Bahri
Typology can be defined as the discrimination of surface waters into units "ecosystem types", to ensure
that type-specific biological reference conditions can be reliably derived. It follows that typology has
to focus on the identification of the major sources of variation in the biological quality element
descriptors (mainly abundance, richness and diversity), in order to minimize their intra-type variation
and to be functional for classification of ecological status.
According to this definition and meaning of Typology, an electronic discussion was carried out within
the scientific community in the Mediterranean region, in order to achieve a preliminary evaluation of
the Typology of Mediterranean transitional waters with an expert view approach.
During a week of on-line discussion, some documents were produced, many expert views on factor
relevance were introduced and more than 140 contacts were received by the documents produced,
which led to a hierarchical definition of a simple and reliable a priori Typology.
The major relevance of some factors was recognised: tidal range, salinity (and range), depth (mean),
surface, residence time and substratum conditions (organic fraction and granulometry); agreement was
reached on the first steps of the Typology definition:
1. a subdivision into running (deltas or river mouths) and lentic (still or slow-moving) transitional
waters; and then,
2. a first subdivision of the lentic transitional waters according to tidal range into lagoons [tidal
range 50 cm (micro tidal sensu coastal waters of the EU Water Framework Directive -
WFD)] and non-tidal [tidal range 50 cm (not tidal);
3. a second subdivision of the lentic transitional waters into large (surface 3 km2) and small
(surface 3 km2) lentic transitional waters.
The final document from the on-line discussion was submitted to the Coast Working Group, which
accepted only the first subdivision, in agreement with the decision of some Member States (see Table
IV.1).
Table IV.1. Typology of transitional waters by the Mediterranean Member States.
France
Greece
Italy
River mouth/delta
X
X
X
Microtidal
X
lagoons
Coastal lagoons
X X
Non-tidal
X
lagoons
Italy agreed with the first level subdivision into river delta, micro- and non-tidal lagoons, while France
and Greece considered coastal lagoons as a single group. This differentiation is attributable to a higher
variation of tidal range among Italian lagoons than among both Greek and French lagoons. North
Adriatic lagoons have a tidal range close to 1 m, which is greater than the range occurring in other parts
of the Mediterranean pertaining to UE Member States.
To evaluate the a priori Typology scheme, a preliminary analysis of bibliographic data containing
structural descriptors of biotic quality element (i.e., benthic macro-invertebrates) was performed on a
sample of Italian lagoons. Thirty six Italian lentic transitional waters were selected, according to
152
biological data availability, and a presence/absence matrix including 1084 benthic macro-invertebrate
taxa was obtained in order to analyze relationship between biotic descriptors and structural features of
transitional waters. Some major generalizations, with implications on Mediterranean transitional
ecosystems Typology, arose from the data-set analysis, despite variability in the data-set due to
different sampling effort and methodology, to taxonomic and functional spectra considered, to
taxonomic resolution in published papers and to different number of contributions published on
different lagoons:
1. Taxonomic composition and species richness, which are two quality element descriptors
proposed by WFD, are extremely heterogeneous among lagoons. An analysis of similarity
(Sorensen index) considering two WFD descriptors of quality elements (i.e., taxonomical composition
and richness), emphasized the extreme heterogeneity of taxonomic composition among the considered
coastal Italian lagoons. Average similarity among biotopes was less than 15% and it was always low
even if lagoons very close to each other were compared. Moreover, less than 5% of the 1084 taxa were
found in more than 15 out of the 36 biotopes while more than 50% of taxa were found in only one
biotope.
2. Physiographical and hydrological characteristics of lagoons explain a highly significant
proportion of the quality element descriptor variability. Multivariate analysis (e.g., multivariate
regression) relating the biological data set to an abiotic data set, including physiographic and
hydrological parameters, showed that a four level classification (outlet width/surface, minimum axis,
maximum salinity, range of salinity) explained up to 75% of variation in the biotic data set (Table
IV.2).
Table IV.2. Multivariate regression of taxonomic richness with physiographic and hydrological
characteristics of the lagoons.
Change Statistics
Adjusted
Std. Error of
R Square
Model
R
R Square
R Square
the Estimate
Change
F Change
df1
df2
Sig. F Change
1
.651a
.424
.406
62.684
.424
23.547
1
32
.000
2
.795b
.633
.609
50.855
.209
17.619
1
31
.000
3
.832c
.692
.661
47.371
.059
5.728
1
30
.023
4
.857d
.735
.698
44.693
.043
4.702
1
29
.038
a. Predictors: (Constant), Surface
b. Predictors: (Constant), Surface, max salinity
c. Predictors: (Constant),Surface, max salinity, salinity range
d. Predictors: (Constant),Surface, max salinity, salinity range, min axis
Change Statistics
Adjusted
Std. Error of
R Square
Model
R
R Square
R Square
the Estimate
Change
F Change
df1
df2
Sig. F Change
1
.670a
.449
.431
61.323
.449
26.040
1
32
.000
2
.780b
.608
.583
52.547
.159
12.581
1
31
.001
3
.830c
.689
.658
47.555
.081
7.851
1
30
.009
4
.870d
.757
.723
42.769
.068
8.090
1
29
.008
a. Predictors: (Constant), outlet width
b. Predictors: (Constant), outlet width, max salinity
c. Predictors: (Constant), outlet width, max salinity, min axis
d. Predictors: (Constant), outlet width, max salinity, min axis, salinity range
Outlet width of coastal lagoons and surface area, the latter as a measure of transitional biotope shape,
were found to be the two major factors explaining biological data variation. Minimum axis, probably
accounting for habitat heterogeneity inside transitional biotopes, and both maximum salinity and
salinity range were the other factors contributing to biological data variation.
Canonical Correspondence analysis, performed after a reorganization of all the abiotic parameters into
153
three groups describing sensitivity, heterogeneity and functional size of the transitional ecosystems,
gave a result similar to that shown by multivariate regression, explaining up to 43.3% of the variation
of the macro-invertebrate taxa matrix.
Note that for the analysis we considered only abiotic characteristics of lentic transitional waters, which
are relatively independent of anthropogenic pressures. These latter can affect taxonomic composition
and richness, as well, and are likely to be responsible for the unexplained variation in the data set.
Therefore, a four level factorial classification of transitional waters into types would greatly reduce the
variability of the considered descriptor of biological quality, reaching the goal of improving Typology
for Reference conditions analysis and ecological status Classification. In order to minimize the number
of ecosystem types and to optimize the accuracy of ecological status classification, we think that a two
level factorial definition of Mediterranean lagoon Typology is required and that more detailed
definition, with three or more levels, could provide more accurate definition of monitoring programs at
local and regional scales.
3. The inclusion of lagoon surface area in the proposed a priori Typology of Mediterranean
lagoons is validated by the a posteriori analysis. On the basis of these preliminary results we found
that surface area of lentic transitional waters, as a measure of transitional water shape, which is one of
System B descriptors (WFD, 2000), represented the physiographic feature with the strongest
functional, rather than phenomenological, influence on benthic macro-invertebrates quality element
descriptors. Surface area explained a similar proportion of variation as outlet width but the former has
a stronger theoretical foundation; a significant species area power relationship was observed in the data
set (Figure IV.1). Interestingly, a similar result was found for phytoplankton quality element
descriptors on different data set obtained from a sub-sample of sites (Figure IV.2).
Macrobenthos
3
2.5
a
x
a
t
2
b
e
r
of
1.5
1
y = 0.2422x + 1.4967
0.5
R2 = 0.1923; p < 0.01
Log num
0
-1
-0.5
0
0.5
1
1.5
2
2.5
3
Log Surface Area (Km2)
Figure IV.1. Relationship between surface area (km2) and benthic macroinvertebrate taxa
number recognized in each of the transitional ecosystem selected.
154
Phytoplancton
Phytoplankton
3
2.5
t
a
x
a
2
of
ber 1.5
u
m
1
y = 0.3179x + 1.5943
R2 = 0.3815; p<0.01
Log N 0.5
0
-1
-0.5
0
0.5
1
1.5
2
2.5
3
Log. Surface Area (Km2)
Figure IV.2. Relationship between surface area (km2) and phytoplankton taxa number
recognized in each of the transitional ecosystem of the sub-sample of sites selected.
Accounting for the species/area relationship would greatly reduce the intra-Type variability of a quality
element descriptors such as species composition/richness. Thus, an a posteriori definition of Typology
supported the second subdivision into small and large lagoons i.e., the relevance of surface area has to
be taken into account to reach a consistent definition of transitional water Typology.
An a posteriori evaluation of the threshold between small and large lagoons was performed on an
inventory of the Italian lagoons, including 175 biotopes; 139 having a surface area < 10 m2 (Table
IV.3). Maximum differentiation among groups of small and large lagoons was observed with a
threshold of 2.5 km2 (ANCOVA test, P0.001). Large and small lagoons, divided according to the
above defined threshold, had significantly different number of taxa (t-Student test, P 0,02).
Table IV.3. Distribution of Italian lagoons smaller than 10 km2 into classes of surface area
Surface Class N░ of Lagoons
0.5
57
1.0
28
1.5
11
2.0
8
2.5
4
3.0
3
3.5
4
4.0
4
4.5
4
5.0
1
5.5
2
6.0
1
6.5
0
7.0
5
7.5
0
8.0
0
8.5
4
9.0
1
9.5
1
10.0
1
155
Therefore, the final proposal, reached by a priori evaluation and validated by an a posteriori definition
of Mediterranean lagoons Typology, can be summarized as:
1. running transitional waters
1.1. deltas
1.2. river mouths
2. lentic transitional waters
2.1. micro tidal lagoons [tidal range 50 cm (micro-tidal sensu WFD coastal waters)]
2.1.1. large
(surface
2.5 km2)
2.1.2. small
(surface
2.5 km2)
2.2. non tidal lagoons [tidal range 50 cm]
2.2.1. large (surface 2.5 km2)
2.2.2. small (surface 2.5 km2)
Since the questionnaire produced by the Coast Working Group for inter-calibration purposes takes into
account only the first level of lentic transitional waters discrimination (between micro- and non-tidal
lagoons), we suggest that as minimum requirement the selection of sites for inter-calibration also could
include the surface area of lagoons, thereby providing both small and large examples of reference and
polluted sites within each Member State.
Other factors are relevant to the biological quality element descriptors, as the preliminary analysis on
the Italian lagoon data-base showed i.e., hydrodynamics (e.g., retention time () and water flushing),
sediment features (e.g., granulometry, organic matter content, geological origin), climatic/
meteorological constraints and water salinity. However, their relative importance and independence/
autocorrelation relationships would have to be directly tested within a research project aimed at
defining typology of Mediterranean transitional waters.
We emphasize a key issue regarding the intercalibration. Most of the attention in this first stage of the
WFD implementation was on Typology and Reference Conditions but Intercalibration will be
performed utilizing descriptors. The selection of proper descriptors of ecological status of transitional
waters is by far the most important and difficult challenge of the WFD. There is clearly a need to make
things simple, but also to collect useful information. Some criteria for comparison and evaluation of
descriptors - in terms of scientific concepts, standardization, variability, cost and simplicity - have
already been proposed; we attached to this document two tabular models, which are suggested for the
comparative evaluation.
Acknowledgement
This paper results from the contributions of the participants to the Naples LaguNet Forum on Major
challenges to bridge basic ecology to applications (Naples, June 17-19, 2004) (see Appendix I for list
of participants). The organisers thank all of them for their enthusiasm and effort in discussion of these
topics. Thanks also to Anna Fauci and the staff of the Ecology group of Naples Federico II University
for their invaluable contribution to the organisation of the Forum and the Presidency of the Campania
Region for the grant, which made the Forum possible.
156
Appendix V List of acronyms and abbreviations
a) Scientific terms
DIN
Dissolved inorganic nitrogen
DON
Dissolved organic nitrogen
DIP
Dissolved inorganic phosphorus
DOP
Dissolved organic phosphorus
nfix Nitrogen
fixation
denit Denitrification
p Primary
production
r Respiration
NEM
Net Ecosystem Metabolism
Other terms used are explained within the document.
b) Institutions, agencies and organizations
APAT
Agenzia per la Protezione dell'Ambiente e per i Servizi Tecnici
ARPA
Agenzia Regionale Prevenzione e Ambiente
ARPAV
Agenzia Regionale per la Prevenzione e Protezione Ambientale del Veneto
ASPIV
Azienda Servizi Pubblici Idraulici e Vari
CIRSA
Centro Interdipartimentale di Ricerca per le Scienze Ambientali in Ravenna,
UniversitÓ di Bologna
CNR-IAMC
Istituto Ambiente Marino Costiero, Consiglio Nazionale delle Ricerche
CNR-ISMAR
Istituto di Scienze Marine, Consiglio Nazionale delle Ricerche
COHERENS
COupled Hydrodynamical Ecological model for REgioNal Shelf seas
DIAM
Dipartimento di Ingenieria Ambientale, UniversitÓ di Genova
DIPTERIS
Dipartimento per lo Studio del Territorio e le sue Risorse
DRAIN
DeteRmination of pollutAnt INputs from the drainage basin
EEA
European Environment Agency
ELTCON
Environmental Characterization of the Lagoon of Varano
IBM-CNR
Istituto di Biologia Marina Ł Consiglio Nazionale delle Ricerche
ICRAM
Istituto Centrale per la Ricerca scientifica e tecnologica Applicata al Mare
IRMA-CNR
Istituto di ricerche sulle Risorse Marine e l'Ambiente - Consiglio Nazionale delle
Ricerche
MAV-CVN
Magistrato alle Acque di Venezia - Consorzio Venezia Nuova
MAV-SAMA
Magistrato alle Acque di Venezia - Sezione Antinquinamento del Magistrato alle
Acque
MELa1 Monitoraggio
Ecosistema Lagunare 1
RIDEP
Rete Italiana per lo studio delle deposizioni atmosferiche
SIBM
SocietÓ Italiana di Biologia Marina
S.It.E.
SocietÓ Italiana di Ecologia
S.p.A.
SocietÓ per Azioni
S.r.l.
SocietÓ a responsabilitÓ limitata
VESTA
Venezia Servizi Territoriali Ambientali
157
Document Outline
- ■
- 1CONTENTS.pdf
- 5REST.pdf