

UNDP/GEF Danube Regional Project
Towards a Danube River Basin GIS: Needs
Assessment and Conceptual Design for a
Danube River Basin GIS System
Prepared by:
Fredrik Hannerz and Sindre Langaas, KTH Royal Institute of Technology, Stockholm

UNDP/GEF Danube Regional Project
Strengthening the Implementation Capacities for Nutrient
Reduction and Transboundary Cooperation in the Danube
River Basin
Towards a Danube River Basin GIS: Needs
Assessment and Conceptual Design for a
Danube River Basin GIS System
September 3, 2003
Prepared by:
KTH Royal Istitute of Technology, Stockholm, Department of Land and Water Resources
Engineering. Team of authors:
Fredrik Hannerz
Sindre Langaaas
E-mail: Hannerz@kth.se
E-mail: Langaas@kth.se
Examination of final report:
Per Erik Jansson
PREFACE
During March to July 2003 a user needs assessment and a conceptual design of a Danube River Basin
Geographical Information System was conducted, commissioned by the UNDP/GEF Danube Regional
Project. The purpose of the assignment was to gain a clearer understanding of the needs and priorities
and then subsequent development options, including anticipated costs, as a basis for making decisions
about implementation.
It is increasingly being acknowledged that one core tool for river basin management will be a
Geographical Information System (GIS). The recent EU Water Framework Directive (WFD) is
currently putting strong pressure upon the EU member states and candidate countries in introducing
GIS in the implementation of the WFD. The development and maintenance of consistent and
harmonised multi-thematic GIS databases for river basins is both an institutional and a technical
challenge and especially so in transboundary settings. The results of this report is meant to guide
developers and managers through some of those challenges. The user needs assessment for a Danube
River Basin GIS was primarily conducted by reviewing various relevant ICPDR and WFD documents
and by interviewing selected representatives from the ICPDR secretariat and expert groups and some
key actors. Based on identified needs a conceptual design of the Danube River Basin GIS is proposed.
The report was prepared by Fredrik Hannerz and Sindre Langaas at the Department of Land and
Waster Resources Engineering, KTH Royal Institute of Technology in Stockholm, Sweden. Any
interpretations, recommendations and conclusions in the report are completely those of the authors.
Information about costs and labour needs should be interpreted as rough estimates.
Table of contents
1
EXECUTIVE SUMMARY.............................................................................................. 3
1.1
Why use GIS for transboundary river basin management? ................................................... 4
1.2
User needs assessment ........................................................................................................... 6
1.3
A conceptual design............................................................................................................... 7
1.4
GIS hardware and software considerations............................................................................ 9
1.5
Evaluation of EuroGlobalMap ............................................................................................... 9
2
USER NEEDS ASSESSMENT ..................................................................................... 10
2.1
User needs assessment introduction..................................................................................... 11
2.2
Background.......................................................................................................................... 12
2.3
Needs Assessment methodology.......................................................................................... 14
2.4
User categories and their needs............................................................................................ 21
2.5
Conclusions.......................................................................................................................... 36
3
A CONCEPTUAL DESIGN.......................................................................................... 38
3.1
Introduction.......................................................................................................................... 39
3.2
Component 1. Development of a multi-thematic GIS database covering the Danube River
basin 39
3.3
Component 2. Systems solution to exploit and disseminate GIS data, derived information
products and information services .................................................................................................... 51
4
GIS HARDWARE AND SOFTWARE CONSIDERATIONS................................... 54
4.1
Hardware and software considerations introduction............................................................ 55
4.2
Hardware.............................................................................................................................. 55
4.3
Software ............................................................................................................................... 55
4.4
Conclusions and recommendations...................................................................................... 57
5
EVALUATION OF EUROGLOBALMAP ................................................................. 59
5.1
Evaluation of EuroGlobalMap introduction ........................................................................ 60
5.2
Contents and relevance of EGM .......................................................................................... 60
5.3
Evaluation of EGM based on stated needs in the user needs assessment ............................ 62
5.4
EGM for spatial analysis...................................................................................................... 63
5.5
Conclusions EGM................................................................................................................ 64
6 REFERENCES........................................................................................................... 65
APPENDIX 1-LETTER OF INTRODUCTION - DANUBE GIS NEEDS ASSESSMENT
.................................................................................................................................................. 67
APPENDIX 2 INTERVIEW QUESTIONS ......................................................................... 69
APPENDIX 3: LIST OF INTERVIEWEES, USER NEEDS ASSESSMENT ................. 71
APPENDIX 4: SOME IMPORTANT NEXT STEPS......................................................... 72
UNDP/GEF Danube Regional Project
Abbreviations
EGM EuroGlobalMap
EMIS
Emission Expert Group
EPA
Environmental Proetction Agency
ESRI
Environmental Systems Research Institute Inc.
EU European
Union
FP Flood
Protection
GD Guidance
Document
GEF
Global Environment Facility
GIS
Geographic Information System
GWP
Global Water Partnership
HELCOM Helsinki
Commission
ICPDR
International Commission for the Protection of the Danube River
IMPRESS
IMpact and PRESSure (EG)
IRBM
Integrated River Basin Management
ISO
International Organisation for Standards
JAP Joint
Action
Program
JRC
Joint Research Centre
KTH
Royal Institute of Technology; Stockholm
MLIM
Monitoring. Laboratory and Information Management
MONERIS
Model: MOdelling of Nutrient Emissions In RIver Systems
NGO Non-Governmental
Organisation
PS Permanent
Secretariat
RBM River
Basin
Management
SWB
Surface Water Body
TNMN
Trans-National Monitoring Network
ToR
Terms of Reference
UNDP
United Nations Development Program
UNEP
United Nations Environment Program
VASAB 2010 Vision & Strategies around the Baltic 2010
WFD
Water Framework Directive
WG Working
Group
WWF
World Wide Fund for nature
Needs Assessment and Conceptual Design for a Danube River Basin GIS System
3
1 Executive summary
UNDP/GEF Danube Regional Project
4
1.1
Why use GIS for transboundary river basin management?
It is increasingly being acknowledged that one core tool for river basin management will be a
Geographical Information System (GIS). What are the general reasons to in introduce GIS based
information systems into transboundary river basin management?
Transboundary RBM applications. The GIS enables us to assess past, current and future
development in the drainage basin. Better decisions may be made resulting from the review of
more alternatives prior to committing to a course of action.
Legal justifications - Conventions/ Directives. The recent Water Framework Directive requires
use of GIS.
Information Paradigm Shift: From water monitoring towards River Basin. Integrated river basin
policy-making, management and scientific assessments on strategic levels call for relevant, yet
not too detailed data and information from the entire river basin. The GIS enables us to integrate
different information sources and thereby help us to work with both land and water based
information. The GIS enables integration of Driving Force - Pressure - State - Impact -
Response type information.
Spatial visualisation helps us to interpret and understand the data.
The GIS enables storage and dissemination of data and information
Building common transboundary identity. As GIS is in many aspects visual, it helps us to build
an identity by making maps and transboundary analysis.
Bundled with the Internet, it is the most appropriate environmental information handling,
production and dissemination tool for river basins including water bodies. The web-GIS also
helps us to reach user groups not normally using GIS.
What are the reasons to develop a GIS for the Danube River Basin in particular?
WFD implementation. The WFD is currently putting strong pressure upon the EU member
states and candidate countries in introducing GIS in the implementation of the WFD. ICPDR is
responsible for development of the "roof-report" including required transboundary maps and
therefore need at least some GIS functionality to construct such maps. In many other large river
basins in Europe (e.g. Rhine, Elbe and Odra River Basins) WFD driven GIS work is currently
ahead of Danube in order to reach reporting deadlines in time.
Integration of existing and coming information sources. Valuable existing databases (e.g. EMIS
inventories, TNMN databases etc.) need to be integrated into a common GIS in order to increase
usage and make usage more effective.
The Danube GIS will be the basis for a common data and information base used for various
river basin management applications, e.g.
o Flood forecasting
o Characterisation
o Modelling of transport paths of pollutants
o Source apportionment
o Optimisation of pollution abatement strategies
o Scenario based trend analysis
Mapmaking. Visualisation of spatial information via maps and cartographics is crucial for
decision-making, public awareness rising and strategic assessments
Identity building. The Danube identity will be strengthened by transboundary analysis,
decisions and maps
The main tool within ICPDR to achieve good river basin management is the implementation of the
Water Framework Directive. The ICPDR thus need to fulfil the requirements from the Directive on
GIS related reporting. Even though annex I and annex II of the WFD state that respective maps
should only as far as possible be available for introduction into a GIS, it is obvious that the best way
to provide most of the requested information will be in the form of GIS layers. This is due to the
Fredrik Hannerz and Sindre Langaas, KTH Royal Institute of Technology
Needs Assessment and Conceptual Design for a Danube River Basin GIS System
5
fact that most of the data is to be presented in its spatial context and that questions like `where are
the critical areas?', `how much area is involved?', or `which points are in a designated area?' can
easily be answered when the data are kept in their spatial context and when the background
database has the appropriate design (Vogt, 2002).
Following a detailed analysis of the WFD and its annexes, the WFD GIS Guidance Working Group
arrived at a list of 12 maps based upon 15 primary GIS layers that should be developed and reported
to the European Commission at different occasions until 2009 during the implementation of WFD.
The 12 "GIS maps" that have to be reported to the European Commission are:
River Basin District Overview:
Competent Authorities
Surface Water Bodies (SWB) categories
Surface Water Bodies (SWB) types
Groundwater Bodies
Monitoring Network for Surface Water Bodies
Ecological Status and Ecological Potential of Surface Water Bodies
Chemical Status of Surface Water Bodies
Groundwater Status
Groundwater Monitoring Network
Protected Areas
Status of Protected Areas
The GIS WG in their guidance document does not address how to use GIS in the analysis of
pressures and impacts. This aspect, however, has been dealt with by the WG established to provide
guidance on how to carry out pressure and impact analysis, an important aspect in the development
of the River Basin Management Plans (IMPRESS WG 2003). On this aspect, however, the WFD is
much weaker when it concerns the use of GIS. Thus, the possible use of GIS for such analytical
purposes will be left to the current and forthcoming MS to decide upon. Essentially relevant GIS
related data and information to support Danube River Basin management could be divided into two
groups, which will both be covered in this user needs assessment:
1. GIS data and information required by the WFD (specified in the GIS guidance document)
2. Other GIS data and information supporting activities leading towards the aims of ICPDR (such
as pressure and impact analysis)
There is no real alternative to GIS to collect, handle and disseminate the data needed for the
reporting obligation. Concerning the first point the question is therefore not whether or not to use
GIS to construct the maps or what to include as this is specified in the Directive itself, in annexes
and in guidance documents. The question is rather how and when to do it. Deadlines for the
reporting of "GIS-maps" start already in 2003 and by the end of 2004 several maps are required on
the roof-report level. The integration of data from all member states of the ICPDR is a long lasting
process and will require substantial amount time and monetary resources. If ICPDR intend to fulfil
the requirements on roof-report level actions must be taken very soon to introduce necessary GIS
components to support reporting and map-making.
Implementation success or failure
How can we reach a successful implementation of GIS in ICPDR?
We need to work pragmatically with the implementation. Costs needs to be low, needs must be
prioritised and we need to make use of existing data and infrastructure rather than constructing
yet another set of measurement programs and improvement of technical infrastructure.
Kraemer et al (1989) point out that an organisation in a strategic state such as ICPDR a GIS
project implementation is most likely to succeed if an organisation wide perspective of the
technology and the implication of it is taken into account. For ICPDR that would mean
UNDP/GEF Danube Regional Project
6
including all user groups outlined in the user needs assessment and try to look to the needs with
a broad user definition rather than looking to the needs from ICPDR only.
Listen carefully to GIS skilled experts in the organisation
The development and maintenance of consistent and harmonised multi-thematic GIS databases for
river basins is both an institutional and a technical challenge. Data defined as those most relevant
need to be collected from multiple data providers, such as National Mapping Agencies, Statistical
Agencies, Environmental Protection Agencies, the academic community and others. This obviously
implies a need for organisational, cultural and technical coordination and harmonisation. Beyond
the technical challenges, both institutional and financial arrangements need to be established that
ensure an appropriate institutional solution and resolve the resource issues in the short and longer
term. If technical and organisational challenges are not given appropriate attention, there is a large
risk that GIS work within ICPDR will fail to be successful. We need first to define what a failure is
concerning the DRB GIS implementation in general and the GIS database construction in particular.
A failure is apparent when:
The GIS database is being close to a data graveyard type of database with low usage rate. The
developed GIS remain an expert tool only.
The GIS database is being used for WFD reporting only and not as a basis for relevant
transboundary analysis
What are the reasons for such a failure?
Lack of clearly specified and jointly agreed upon aim and objectives concerning purposes,
users, contents, and distribution policies
GIS work focussed on technology while knowledge of existing GIS data sources, spatial
information policy, diplomacy, political science and project oriented management skills are
given lower priority.
Far too many water managers and decision-makers involved in River Basin Management
leading to:
o Low awareness in the potential of GIS
o Low priority of GIS
o Low willingness to reallocate funding from current environmental information
activities focussing upon State and Impact indicators/variables
Sub-optimal `design' or `decision' of the body that will be responsible to carry out the work
Conflicts between bureaucrats, ivory tower scientists and applied scientists1
Low awareness about how copyright restrictions hinders a widespread use of the GIS database.
1.2
User needs assessment
The user needs assessment for a Danube River Basin GIS, primarily conducted by reviewing
various relevant ICPDR and WFD documents and by interviewing selected representatives of
various ICPDR groups, the GEF/Danube Project and some other major stakeholders, forms the basis
for the conceptual design. Phone interviews revealed that many needs and expectations upon a
Danube RB GIS are similar between most user groups. Four common needs were identified from
the majority of the groups
We need maps.
We need a system on the overview scale.
We need a centrally initiated and developed GIS database.
We need public access.
Stated needs correspond to some strategically important considerations for GIS database
development. Visual components are important such as paper maps and web mapping. The database
should focus on transboundary data and information rather than a detailed composition of national
data. The system should be open and transparent. Interviewees further strongly stated the necessity
Fredrik Hannerz and Sindre Langaas, KTH Royal Institute of Technology
Needs Assessment and Conceptual Design for a Danube River Basin GIS System
7
not to restrict the Danube GIS to WFD reporting but to expand it in order to suit transboundary
analysis based on the database.
1.3
A conceptual design
Based on the needs outlined in the user needs assessment and the conclusions we have made
concerning the organisation and how GIS might be implemented, we describe a conceptual design
of the Danube River Basin GIS. The design is a mixture of technical and organisational
considerations ranging from specific to general. We suggest a multi-component development
approach to meet the needs of the various users and beneficiaries.
Component 1:
Development of a multi-thematic GIS database covering the Danube River
basin. We have further suggested two different ambition levels for this component, termed
Option 1 and Option 2.
Component 2:
A flexible `systems solution' based upon a combination of stand-alone GIS
software, Internet MapServer software and Web server software to exploit and disseminate GIS
data, derived geographic information products, internally at ICPDR and externally
While interrelated, the suggested components can be looked upon as separate activities that can be
considered as externally fundable or stand-alone projects or activities. Of the two proposed
components, component 1 will most likely need considerable new financial resources beyond the
ordinary ICPDR budget or national resource commitments of the Signatories of the Danube
Convention. This component is typically one that can be defined as a time limited project, with
reasonable clear inputs, outputs, resource requirements and a well-defined time schedule.
Component 2 will also require substantive resource inputs, yet this activity can be seen as future
internally funded and operated activities of the ICPDR. Obviously, as will be noted in the more
detailed descriptions, each of these components can be further sub-divided into smaller components,
activities or projects.
Based upon the consultants own experiences from the Baltic Sea region in developing, using, and
disseminating GIS data and derived geographic information products, we have chosen to give most
emphasis to the first component, the initial development of a multi-thematic GIS database covering
the Danube River basin. This initial GIS database will be the core and heart of any `Danube GIS',
however defined. We make recommendations on the thematic contents of the database, on metadata
and on overall technical characteristics and data flow.
1.3.1
Time frame and thematic contents
Based upon the interviews with representatives of the various ICPDR Expert Groups and others,
and reviews of WFD Guidance Documents, it appears that the wishes or needs for thematic maps
and GIS layers are very comprehensive, possibly reaching beyond 40 layers. Thus, there is a clear
need to prioritise within this comprehensive list of needs and wishes. Our proposal is based on three
development periods, the short time frame until 2004, the medium time frame until 2006 and the
long time frame until 2009. These periods are based on ICPDR relevant WFD reporting dates.
Additionally we suggest two options (Table 1) for the contents of the Danube GIS, option 1 being
what we consider the minimum requirement for a `Danube GIS' (what is required by the WFD).
Option 2 is an extended GIS database expanding upon option 1.and include other data that will be
crucial for effective and transboundary use of the GIS database. A lot more layers could be included
in the extended database but time constraints will limit what is possible to achieve.
UNDP/GEF Danube Regional Project
8
Table 1. Suggestion for time frames and contents of the Danube GIS
Timeframe Contents of minimum
Contents of extended database
database (WFD
requirements)
SHORT
WFD reporting Dec. 2004
2004
Layers necessary for
transboundary harmonisation
WFD reporting Dec. 2006
MEDIUM
Most important layers for transboundary
2006
analysis e.g. pressure and impact data that
will be accessible within two years
A number of cartographic layer necessary
for mapmaking
A few additional key needs of some ICPDR
Expert Groups.
LONG
WFD reporting Dec. 2009
Additional layers for more effective
2009
transboundary RBM
More GIS data on pressure and impacts
Some additional key needs of some ICPDR
Expert Groups.
1.3.2
Metadata, overall technical characteristics and data flow
Concerning metadata, overall technical characteristics and data flow the most important
recommendations made were the following:
It is recommended that the upcoming WFD standard profile of ISO 19115 is being used for
metadata.
ICPDR member states should be responsible for updates of metadata for data originating from
national sources while other data must be documented and updated by the constructor of the
central database.
It is recommended to adopt the WFD guidelines on a geodetic framework.
Concerning exchange format ESRI standards are recommended
It is recommended to use the data model outlined in the WFD guidance on GIS for WFD
reporting data and to develop new common data models for other data
1.3.3
Organisation of the development
The following five alternatives were outlined as possible contractors for the database development:
A consultant
A GIS resource person at the ICPDR permanent secretariat
An institute or authority at member state level
A research institute
The following was concluded:
The technical outcome from the five proposals would probably be very similar if adequately
coordinated by the GIS Expert Sub Group
Other factors then merely the contents determine who should be contracted
In our recommendations, we would like to distinguish the period until end of 2004 from the time
after. Considering the short time frame until end of 2004 and the amount of work that needs to be
done very soon we would recommend ICPDR to contract a consultant/consultancy company to
develop the necessary GIS data and maps with a deadline in September 2004. It will be difficult to
arrange a more long-term solution before this date and at the same time produce the requested data
and maps.
Fredrik Hannerz and Sindre Langaas, KTH Royal Institute of Technology
Needs Assessment and Conceptual Design for a Danube River Basin GIS System
9
A long-term solution should be developed from 2004 and onwards. ICPDR would then need a
solution with more continuity in service than the one of a consultant. We believe that such
continuity in service, required skills and suitable professional background will be provided by either
a national institute/authority (such as a hydrometeorological institute) or by a research institute.
1.4
GIS hardware and software considerations
In the report on GIS hardware and software considerations we identify existing technical structure
concerning GIS hardware and software and try to make some recommendations on those aspects for
the Danube River Basin GIS.
It was concluded that:
The importance of hardware and software are generally overestimated. Such problems are today
generally solved at low costs compared to other costs of the information system
Hardware and software needs will become clear during the implementation phase.
ESRI standards should be used for communication between users of the Danube RB GIS.
Practically shapefiles, coverages, ESRI interchange files, alongside with ESRI grids could be
used.
1.5
Evaluation of EuroGlobalMap
Upon request an evaluation of the suitability of EuroGlobalMap (EGM) for the Danube RB GIS
was prepared. The results can be summarised as below:
EGM benefits
Include some very important base data
"Official" data on administrative boundaries
Include updating
EGM drawbacks
It is a compilation of national data and therefore not necessarily thematically harmonised
Only a few of the included GIS layers are relevant for RBM purposes
It is not a public domain dataset and will thereby have strict user rights. Public dissemination of
the data will probably be impossible.
We would like to recommend ICPDR to work further with EGM. It should however be made very
clear what actually concerns dissemination of data to third part both via web and other media
UNDP/GEF Danube Regional Project
10
2 User
Needs
Assessment
Fredrik Hannerz and Sindre Langaas, KTH Royal Institute of Technology
Needs Assessment and Conceptual Design for a Danube River Basin GIS System
11
2.1
User needs assessment introduction
GIS data and derived information have an important role in Integrated River Basin Management.
With the ongoing implementation of the Water Framework Directive (WFD) GIS based information
will be even more widespread as the requirements on existing and forthcoming EU Member States
to report on environmental status in many cases should be done with maps or GIS information.
The main tool within ICPDR to achieve good river basin management is the implementation of the
Water Framework Directive in the Danube River Basin. The ICPDR thus need to fulfil the
requirements from the Directive on GIS related reporting. Essentially relevant GIS related data and
information to support Danube River Basin management could be divided into two groups, which
will both be covered in this user needs assessment:
1. GIS data and information required by the WFD
2. Other GIS data and information supporting activities leading towards the aims of ICPDR
Even though only annex I and annex II of the WFD explicitly state that the respective maps should
as far as possible be available for introduction into a GIS, it is obvious that the best way to provide
most of the requested information will be in the form of GIS layers. This is due to the fact that most
of the data is to be presented in its spatial context and that questions like `where are the critical
areas?', `how much area is involved?', or `which points are in a designated area?' can easily be
answered when the data are kept in their spatial context and when the background database has the
appropriate design (Vogt 2002).
There is no real alternative to GIS to collect, handle and disseminate the data needed for the map
reporting obligation. Concerning the first point the question is therefore not whether or not to use
GIS to construct the maps or what to include as this is specified in the Directive itself, in annexes
and in guidance documents. The question is rather how and when to do it. Deadlines for the
reporting of "GIS-maps" start already in 2003 and by the end of 2004 several maps are required on
the roof-report level. The integration of data from all member states of the ICPDR is a huge work
and will requires some substantial amount time and monetary resources. If ICPDR intend to fulfil
the requirements on roof-report actions must be taken very soon to introduce necessary GIS
components to support reporting and map-making.
Concerning the second group of data and information questions are open and decisions on what,
how and when needs to be taken by the ICPDR. Decisions need to be taken on the long-term goal of
GIS activities to support other river basin management activities. Any decisions on what, how and
when to introduce GIS for river basin management need to be based on user needs for the data and
information. In this user needs assessment you will find stated needs for GIS data and derived
information. Such needs may or may not coincide with the requirements of the WFD. It may
therefore be necessary to expand the GIS activities of ICPDR to other areas than WFD reporting.
Implementation of integrated river basin management needs data, information and an information
and communication system. The system includes the institutional set-up and the personal
knowledge base required for the system to operate efficiently. Furthermore, it is widely recognized
today that participatory approaches in water management yield better overall performance in the
long run (e.g. GWP 2000).
A guidance document on the implementation of the GIS elements in the WFD was issued in
December 2002. The document specifically outlines the 12 GIS data layers required to produce the
15 "GIS maps" for the mandatory reporting requirements. This guidance document, however, does
not provide guidance in how to use GIS for integrated river basin management in a sustainable
manner. Public participation in the WFD is a clear objective in the WFD but the discussion
concerning GIS data to fill the needs of the public or research community is not covered in this
guidance document.
2.1.1
Aims and objectives
The aims and objectives of this assessment are to :
UNDP/GEF Danube Regional Project
12
Identify needs of the ICPDR for the development of a Danube GIS (see section 4.1 of GIS Issues
paper) in cooperation with the GIS ESG, the ICPDR PS as well as other ICPDR Expert Groups.
Identify GIS needs:
o Of the ICPDR for meeting WFD requirements,
o for other RBM tasks,
o for other ICPDR activities,
Consider the suitability of the EGM data.
2.2 Background
2.2.1
Integrated river basin management and GIS
Integrated river basin policy-making, management and scientific assessments on strategic levels call
for relevant, yet not too detailed data and information from the entire river basin. The question of
relevancy needs to be considered in light of the policy and management goals and priorities for the
specific river basin, as well as related scientific issues. The handling, analysis and presentation of
the river basin data and information can be done by means of various types of 'systems' and
'models', ranging from simple map-making tools, via expert and decision support systems to
sophisticated integrated and highly distributed predictive scenario models. It is increasingly being
acknowledged that a core component in many river basin 'information systems' and 'models' will be
a Geographical Information System (GIS). The purposes of the GIS component in the 'systems' and
'models' may vary. It may range from map-making purposes, either stand-alone or as online webGIS
services, as a tool for providing input data for various type of scientific models, or as database
management tool to handle most or all the environmental data from the river basin, including
monitoring data.
Despite the many good application areas (=arguments) for introducing GIS as a core environmental
information technology in integrated river basin policy-making and management, its diffusion into
this particular domain area has not been as widespread as could possibly be expected. A particular
challenge in introducing GIS as an information tool for river basin management is related to the
establishment of GIS databases. The development and maintenance of consistent and harmonised
multi-thematic GIS databases for river basins is both an institutional and a technical challenge. Data
defined as those most relevant need to be collected from multiple data providers, such as National
Mapping Agencies, Statistical Agencies, Environmental Protection Agencies, the academic
community and others. This obviously implies a need for technical coordination and harmonisation.
Beyond the technical challenges, both institutional and financial arrangements need to be
established that ensure an appropriate institutional solution and resolve the resource issues in the
short and longer term. Another likely explanation to why GIS has not been introduced more widely
in river basin management contexts is the lack of GIS usage tradition within those expertise areas
that traditionally have dealt with water management. The introduction of the integrated river basin
policy-making and management paradigm has implied a shift of emphasis from `water' to `river
basin'. This will gradually lead to a shift in the focus of tools and expertise towards those more
suited to describe and analyse variables and indicators from within the river basin. As any other
paradigm shift this may take time. Another reason for the slow progress in introducing GIS in this
context has been the absence of legislative obligations to use comprehensive river basin information
and/or GIS in most national and international legal instruments that regulate river basin
management activities. With the advent of the recent EU WFD this has changed.
2.2.2
EU WFD and GIS
For European countries being EU Member States, Candidate Countries and associated EFTA
countries, there is an increasing number of EU Directives that will have a positive impact upon the
introduction and diffusion of GIS into the area of national and transboundary integrated river basin
management (IRBM). Most of these directives, of which some have entered into force and some are
in the process of being developed, proactively try to improve access to, use and re-use of GIS (and
Fredrik Hannerz and Sindre Langaas, KTH Royal Institute of Technology
Needs Assessment and Conceptual Design for a Danube River Basin GIS System
13
other types of) data and information that have been developed by public authorities. Two existing
Directives with these ambitions are:
The Water Framework Directive (22 December 2000)
Directive 2003/4/EC on public access to environmental information (28 January 2003)
Additionally, a proposed directive on the re-use and commercial exploitation of public sector
information, and another possible future directive that will address the specific key issues related to
data access, the creation and maintenance of spatial data should be mentioned.
Among these, in the short and medium term, the most influential legal instrument on the EU level
that will influence the use of GIS in integrated river basin management is indisputably the WFD. As
the WFD has just started to be implemented across Europe, any analysis at this stage of the impact
of the WFD upon GIS usage in IRBM will primarily be based upon review of the WFD text itself,
its annexes and the recently developed guidance documents. The latter are legally non-binding
documents that have been developed under the common implementation strategy of the European
Water Directors. The main aim of this strategy is to allow a coherent and harmonious
implementation of this Directive. Focus is on methodological questions related to a common
understanding of the technical and scientific implications of the Water Framework Directive. These
guidance documents are targeted to those experts who are directly or indirectly implementing the
Water Framework Directive in river basins.
The WFD is currently putting strong pressure upon the EU member states and candidate countries
in introducing GIS in the implementation of the WFD. The guidance document on implementing the
GIS Elements of the WFD (Vogt 2002) is tailored towards those preparing the geographic datasets
for the preparation of maps required by the Directive, those preparing the final maps as requested
under the WFD, and those reporting the maps and GIS layers to the European Commission as
required by the WFD. The document focuses upon the thematic content and technical specifications
for the GIS layers to be prepared for reporting to the European Commission. It does not, however,
address how to use GIS in the analysis of pressures upon freshwater bodies and their likely impacts,
neither does it cover how to use GIS in the preparation of river basin management plans nor how to
use GIS for public consultation.
Historically, georeferenced data have been reported to the European Commission in the form of
analogue maps. With the introduction of GIS, these maps or the underlying GIS layers can now be
reported in digital form. In the European context experience with digital reporting is limited. The
GIS guidance document, therefore, additionally suggests best practices for the immediate reporting
needs of the WFD and at the same time formulates strategies for the long-term needs. The
recommendations will have to be tested and further developed over the next few years.
Following a detailed analysis of the WFD and its annexes, the GIS WG arrived at a list of 12 maps
based upon 15 primary GIS layers that should be developed and reported to the European
Commission at different occasions until 2009 during the implementation of WFD. The 12 "GIS
maps" that shall be reported to the European Commission are:
River Basin District Overview:
Ecological Status and Ecological Potential
Competent Authorities
of Surface Water Bodies
Surface Water Bodies (SWB) categories
Chemical Status of Surface Water Bodies
Surface Water Bodies (SWB) types
Groundwater Status
Groundwater Bodies
Groundwater Monitoring Network
Monitoring Network for Surface Water
Protected Areas
Bodies
Status of Protected Areas
The GIS WG in their guidance document does not address how to use GIS in the analysis of pressures
and impacts. This aspect, however, has been dealt with by the WG established to provide guidance on
how to carry out pressure and impact analysis, an important aspect in the development of the River
Basin Management Plans (IMPRESS WG 2003). On this aspect, however, the WFD is much weaker
when it concerns the use of GIS. While the WG IMPRESS has given strong emphasis in their
UNDP/GEF Danube Regional Project
14
guidance document to the benefits in using GIS based tools and models in the carrying out an river
basin based pressure and impact analysis, and also provides a number of best practice examples on
how this can be carried out, there are no mandatory obligations upon Member States (MS) to use GIS
tools for such purposes. Thus, the possible use of GIS for such analytical purposes will be left to the
current and forthcoming MS to decide upon.
It is also clear that any MS implementing the WFD could well improve public participation in the
elaboration of the River Basin Management Plan by providing open Internet access to the primary GIS
data, derived geographic information products, such as ready-made digital maps and statistical tables,
and interactive webGIS. The guidance document on public participation explicitly describes this
interactive WebGIS as a useful technique in public participation in particular with respect to public
consultation and outreach purposes, but also in conjunction with possibilities for establishing
interactive dialogues (Public Participation WG 2002).
A quite substantial fraction of the River Basin Districts (RBD) currently being designated by the
current and forthcoming MS will be of transboundary nature. In these cases the requirements upon
WFD implementation are relaxed relative to the pure national RBDs. This also concerns the use of
GIS even for the mandatory reporting requirements. Still, the larger European transboundary rivers
with mature International River Commissions - Oder, Elbe, Rhine and Danube - have strong ambitions
to develop transboundary multi-thematic GIS databases to meet the demands of the WFD and have
already started work in this direction (European Commission 2002). When it concerns most other
transboundary river basin districts without existing or feeble formal regimes and management
structures, the implementation of GIS has weaker prospects. This is in particular the case for
transboundary river basins districts with one or more riparian states being neither current nor
forthcoming MS and thus without strong incentives to comply with the requirements of the WFD.
2.3 Needs
Assessment
methodology
2.3.1 Introduction
A needs assessment:
can be defined as a process for identifying the knowledge and skills necessary for achieving
organizational (e.g., departmental) goals (Brinkerhoff & Gill, 1994).
is a systematic set of procedures undertaken for the purpose of setting priorities and making
decisions about program or organizational improvement and allocation of resources. The priorities
are based on identified needs (Witkin & Altschuld, 1995).
is a process for pinpointing reasons for gaps in performance or a method for identifying new and
future performance needs (Gupta, 1999).
Needs assessments can be carried out with various approaches and should of course be adjusted
depending on the information needs analysed and the structure of the body where needs are assessed.
2.3.2 Approach
The needs were primarily assessed by reading written sources and through semi-structured interviews
of key informants in various ICPDR groups. For resource reasons, the interviews were conducted as
phone interviews. Additionally some Best Practice examples of catchment based GIS on the Internet
were considered.
2.3.2.1
Review of documents
A lot of documents possibly related to GIS user needs were examined. Roughly these documents can
be divided into ICPDR related documents, Water Framework Directive Guidance documents and other
documents.
ICPDR documents
Roughly the following documents related to ICPDR were scrutinized with respect to potential GIS
data and information needs:
Convention text
Fredrik Hannerz and Sindre Langaas, KTH Royal Institute of Technology
Needs Assessment and Conceptual Design for a Danube River Basin GIS System
15
Documents related to the ICPDR expert groups (ToRs, meeting documents, presentations) and in
particular the documents related to the River Basin Management Expert Group.
TNMN yearbooks, Joint Danube Survey reports, Danube Pollution Reduction Programme reports,
Danube watch, ICPDR annual reports
A small ICPDR library search was also conducted in order to screen documents not available via
the DANUBIS system.
WFD Guidance documents
All the relevant guidance documents for the Water Framework Directive implementation were
scanned through with the aim to extract anything of relevance for GIS and river basin information
systems. The guidance document on GIS components was naturally highly relevant but guidance on
pressure and impact analysis and guidance on public participation were found to be of high importance
as well. All guidance documents can be found at the WFD part of CIRCA:
http://forum.europa.eu.int/Public/irc/env/wfd/home
Other documents
A lot of other information was read through
Relevant research papers
Presentations on conferences and meetings related to the management of the Danube drainage
basin.
Recent literature on WFD implementation (e.g. Chave 2002)
Document stating user needs from similar regions.
2.3.2.2
Semi-structured phone interviews
A total of 14 persons inside and outside the ICPDR organisation were interviewed regarding the needs
for GIS data, derived information products, information systems solutions and potential training needs
as seen from their perspectives as representatives of various groups. The interviewees where informed
about the interview shortly on beforehand via e-mail, including also following additional discussion
material:
Letter of introduction (Appendix 1)
Interview questions (Appendix 2)
A proposed list of GIS layers to include in a Danube GIS
A list of interviewees can be found in Appendix 3. The results from the interviews are structured
according to the group the interviewed person represented. There is currently a separate training needs
assessment being conducted by a consultant to ICPDR. Training needs will therefore not be given
priority in this assessment. However, in cases where important views on specific GIS training needs
were expressed these will be mentioned.
2.3.3
Needs for whom?
In this needs assessment the user of information is placed in focus while the type of requested
information is subordinated. The reason for this is that the character of user and the group she/he
represents to a very high degree determine what information is requested, both content and format-
wise. It is for example not very likely that a strategic level decision making group would need monthly
discharge and nutrient fluxes data nor is it plausible that a research group modelling the extent of
Danubian flooding and floodplains would need overview maps on socio-economic parameters to fulfil
their work. In that sense this needs assessment is user oriented, rather than object oriented.
In identifying users, one may use a narrow, exclusive user definition or a broad, non-exclusionary one.
The narrow would include internal ICPDR users in Expert Groups, Expert Sub Groups and the
permanent secretariat while the broad definition would also include all other stakeholders and
interested parties that share the aims and objectives of the ICPDR, e.g. knowledge-makers (Danube
science community) future-makers (Danube school-pupils) and others, e.g. UNDP/GEF. The use of a
UNDP/GEF Danube Regional Project
16
narrow or broad definition makes a big difference during the implementation stage of the information
service. If the narrow definition is used there is no need for public databases and the need for web-GIS
services would be low. If, on the other hand, the broad definition is used, questions concerning
dissemination of information and choices between stand alone GIS and web-GIS becomes more
interesting, as well as issues related to copy-rights of the GIS database and derived information.
Other identified users are all outside the strategic "decision-maker" level. They are composed of
various NGOs, scientists, people in the educational sector, other stakeholders and media.
2.3.3.1 ICPDR
Primarily the needs expressed by ICPDR expert groups are examined and with a special focus on the
River Basin Management Expert Group. The needs expressed by other Expert Groups and Expert Sub-
groups are also considered but then more briefly.
2.3.3.2
Other actors sharing the visions of ICPDR
Beyond the ICPDR expert groups there are several non-governmental organisations in the Danube
drainage basin that are involved in the promotion of sustainable environmental management of the
region. These organisations help to raise the public awareness of the environmental questions and help
rising concerns of the public up to a higher level in the decision making processes. Examples of
important NGOs in the Danube river basin are WWF and Danube Environmental Forum1
Many international research programs deal with the environment and management of the Danube river
basin. The research community plays an active role in producing background facts for development
and decision-making. In order to do this they have a large need for reliable and updated GIS type
information. Current there is a major 5th Framework EU RTD project, Danubs, which work with GIS
integrated tools and have large need for GIS formatted environmental information. The Danube
project is therefore given the role to represent the needs from the science community.
Information needs from UNDP/GEF are dealt with in a separate section.
2.3.4
Needs for what?
Different stakeholders need information for various reasons:
For `information for decision-making, priority setting and
awareness building', e.g. for making a best possible RBM
For `doing a task', e.g. reporting to EU
For `designing a system', e.g. a (so-called) GIS
For `achieving the aim and objectives of the ICPDR'
For every user group defined in the previous section ("Needs
for whom?") we tried to identify possible information needs
through available sources as listed in section ("Approach").
GIS data and derived information have varying usability for
the different user groups. Some users are able/have
time/otherwise want to use the actual GIS data. Others may
need readymade maps and cartographics for use in overview
scale as well as larger scale applications. Some envisage that
their information needs are dynamic and will vary over time.
Figure 1. Nice looking and
These may be in need for a systems solution.
informative maps can be
downloaded at the Baltic Sea Region
2.3.4.1
Information & data
GIS site.
The data in the GIS database and the information derived from
1 Danube Environmental Forum - http://www.de-forum.org/en-home.html
Fredrik Hannerz and Sindre Langaas, KTH Royal Institute of Technology
Needs Assessment and Conceptual Design for a Danube River Basin GIS System
17
the database is not the same thing. Information is generally more aggregated and simplified and
thereby more suited for decision-making and awareness rising. Information derived from the database
should be made available on different levels of aggregation depending on the usage of the information.
The information is the link between the professional part of the river basin information system and the
non-professionals. The importance of comprehensive and easily accessible information products, in
support of integrated river basin management, derived from the GIS data can therefore hardly be
overestimated. The information and data consists of:
GIS data. A database is the core of any GIS; the data contained constitute the base for
information derivation. The data may be detailed or not depending on the scale and content and
will thereby serves different needs.
Maps and cartographics are ready-made products showing the geographical distribution of
various features often used for overview purposes rather than analytic purposes.
Statistics based on the GIS data can be derived with simple or sophisticated GIS methods. They
can be made available in spreadsheet format, as GIS data attributes or in common text document
depending on the preferences of the user. For some users ready-made statistical tables turn out
very useful. Useful statistics can answer questions like: How many people live in Sava River
catchment, How many potential risk spots do we have along river X, how large proportion of
diffuse nutrient leakage into the Danube come from Austria, Hungary or Croatia?
2.3.4.2
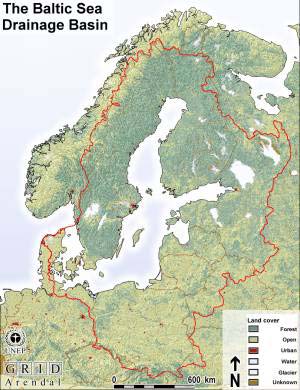
Case study: Baltic GIS
Initially, the Baltic Sea Region GIS database (www.grida.no/baltic, Figure 2) was developed within
the context of an EU environmental research project 1993-94. The original purposes were scientific
and addressed the issue of sources of nutrient loads to the Baltic Sea. At the onset of the project
period, it was decided to make the GIS database publicly available after the project had ended.
Objectives of the project were
to develop a multi-thematic and consistent GIS database focussing on nutrient loads reduction and
to derive information products, such as ready-made maps in various graphics formats, statistics
and documentation, readily accessible to various user categories (Figure 1)
These engagements were driven by a strong recognition of the importance of making available
seamless multi-thematic GIS data for analysis, assessment and map-making of a transboundary region
with joint environmental problems. As such, a database of this kind could be considered a regional
information infrastructure.
UNDP/GEF Danube Regional Project
18
Figure 2 Front page of the Baltic Sea Region GIS site (www.grida.no/baltic). To the left there is a menu
containing data, maps, statistics and documents display and download possibilities. Links are leading to
among other sites the interactive Web GIS: Baltic Environment atlas.
Results and impact
·Better availability of consistent, seamless spatial information (GIS data in several formats,
cartographics in several formats, statistics in several formats) on land cover, population, drainage
basins, administrative units, etc., on the Baltic Sea region.
·Better institutional co-operation among the partners in the EU project.
Dissemination to and adoption/use by users
The 'harder' data, notably the GIS data, have been used extensively by the environmental scientific
community in various projects.
The cartographics and statistics have been used by all sorts of user categories, ranging from school
pupils to scientists.
Additionally, feedback have been received from the intergovernmental bodies and initiatives,
HELCOM, Baltic 21 and VASAB 2010,
40000
that all have used different types of 35000
Views
Visits
information products for various purposes.
30000
The web site has been looked upon as a
25000
'best case' model by UNEP, EEA, US EPA
20000
and others.
15000
The web site was announced widely in
10000
several mailing lists, magazines,
5000
newsletters, search engines, web
directories, both at the launch in August
0
1995 and following new additions and
6
7
-95
96
-96
97
-97
98
-98
99
-99
changes (Figure 3). The number of
okt
feb-9 jun- okt
feb-9 jun- okt
feb-98 jun- okt
feb-99 jun- okt
feb-00
external web sites linking to the site is,
according to AltaVista, about 350.
Figure 3. Total number of visits and views,
Case study conclusions
respectively, per month for the period Oct 95 - Mar
The project started out as a primarily a 00 (incl. humans & robots).
scientific undertaking. The subsequent public
Fredrik Hannerz and Sindre Langaas, KTH Royal Institute of Technology
Needs Assessment and Conceptual Design for a Danube River Basin GIS System
19
dissemination of the resulting GIS data and associated derived information products using the Internet
has proven to be a very successful undertaking. The wide range of types and formats of data and
information products offered makes the information useable to most user categories.
2.3.4.3
Information systems
Some users have preferences regarding not only the contents of the information system but also
concerning the structure of it. Technically the GIS can be a based on a stand-alone structure or on
some kind of Web-GIS solution enabling remote access.
Stand-alone GIS
The stand-alone GIS is the classic technical GIS solution. GIS software such as MapInfo, ArcGIS and
IDRISI (see hardware and software considerations chapter) are installed locally on a computer and
used for various purposes by the GIS expert. There are small possibilities for non-experts to make use
of the data and to derive information. However, if available to the user the stand-alone GIS offer large
analysis capacity, which cannot be compared to the much smaller functionality offered by the web-
GIS.
WebGIS
Web GIS services are becoming increasingly popular as the GIS and Internet technology advances. It
provides the non-GIS experts with an (hopefully) easily understandable interface to the GIS data. It
can be used for simple map making and for overview purposes but gives very little opportunities for
actual analysis of the GIS data.
More advanced types of Web-GIS such as WasserBLIcK2, a German data and communication
platform allow up- and downloading of data as well as data display. Such a service offers unique
possibilities for sharing of uploaded data. It requires a strong centralised organisation for setting of
data exchange formats, contents etc.
Institutional solution
The importance of a good institutional set-up in a well working information system cannot be
overestimated. From an institutional point of view the GIS development can be either centralised or
decentralised. The centralised approach is built up around one institution with GIS skills coordinating
all data gathering, updating, dissemination etc. While in the decentralised approach regional producers
of data add their part of the data to the database. In the case of Danube the decentralised approach
would build on national institutions contribution to the Danube wide GIS theme with the national part
of the drainage basin. A drawback with this approach is the varying data quality and data content in
the different regions. The region wide database will be compiled by data with varying reliability and
level of detail. Positive is that national institutions probably need to have up to date databases for
administration of their resources on national level. The decentralised way of working with databases
therefore probably gives the database a more frequent updating.
GIS Training
Any more advanced use of GIS data and GIS require training. Available GIS software on the market
today are often fairly easily used but very soon even users requesting simple GIS services run into
problems if adequate training in GIS basics are not facilitated. GIS training can be based on literature
review, on-line courses3 or regular GIS courses given by business companies or at universities. For the
Danube GIS matters concerning the transboundary nature of the GIS is of high importance to agree
upon among users. Data models, transboundary harmonisation, metadata standards and data
communication procedures are important topics for GIS training.
2 Wasserblick - http://www.wasserblick.net/
3 Examples of on-line courses can be found at: http://campus.esri.com
UNDP/GEF Danube Regional Project
20
2.3.4.4
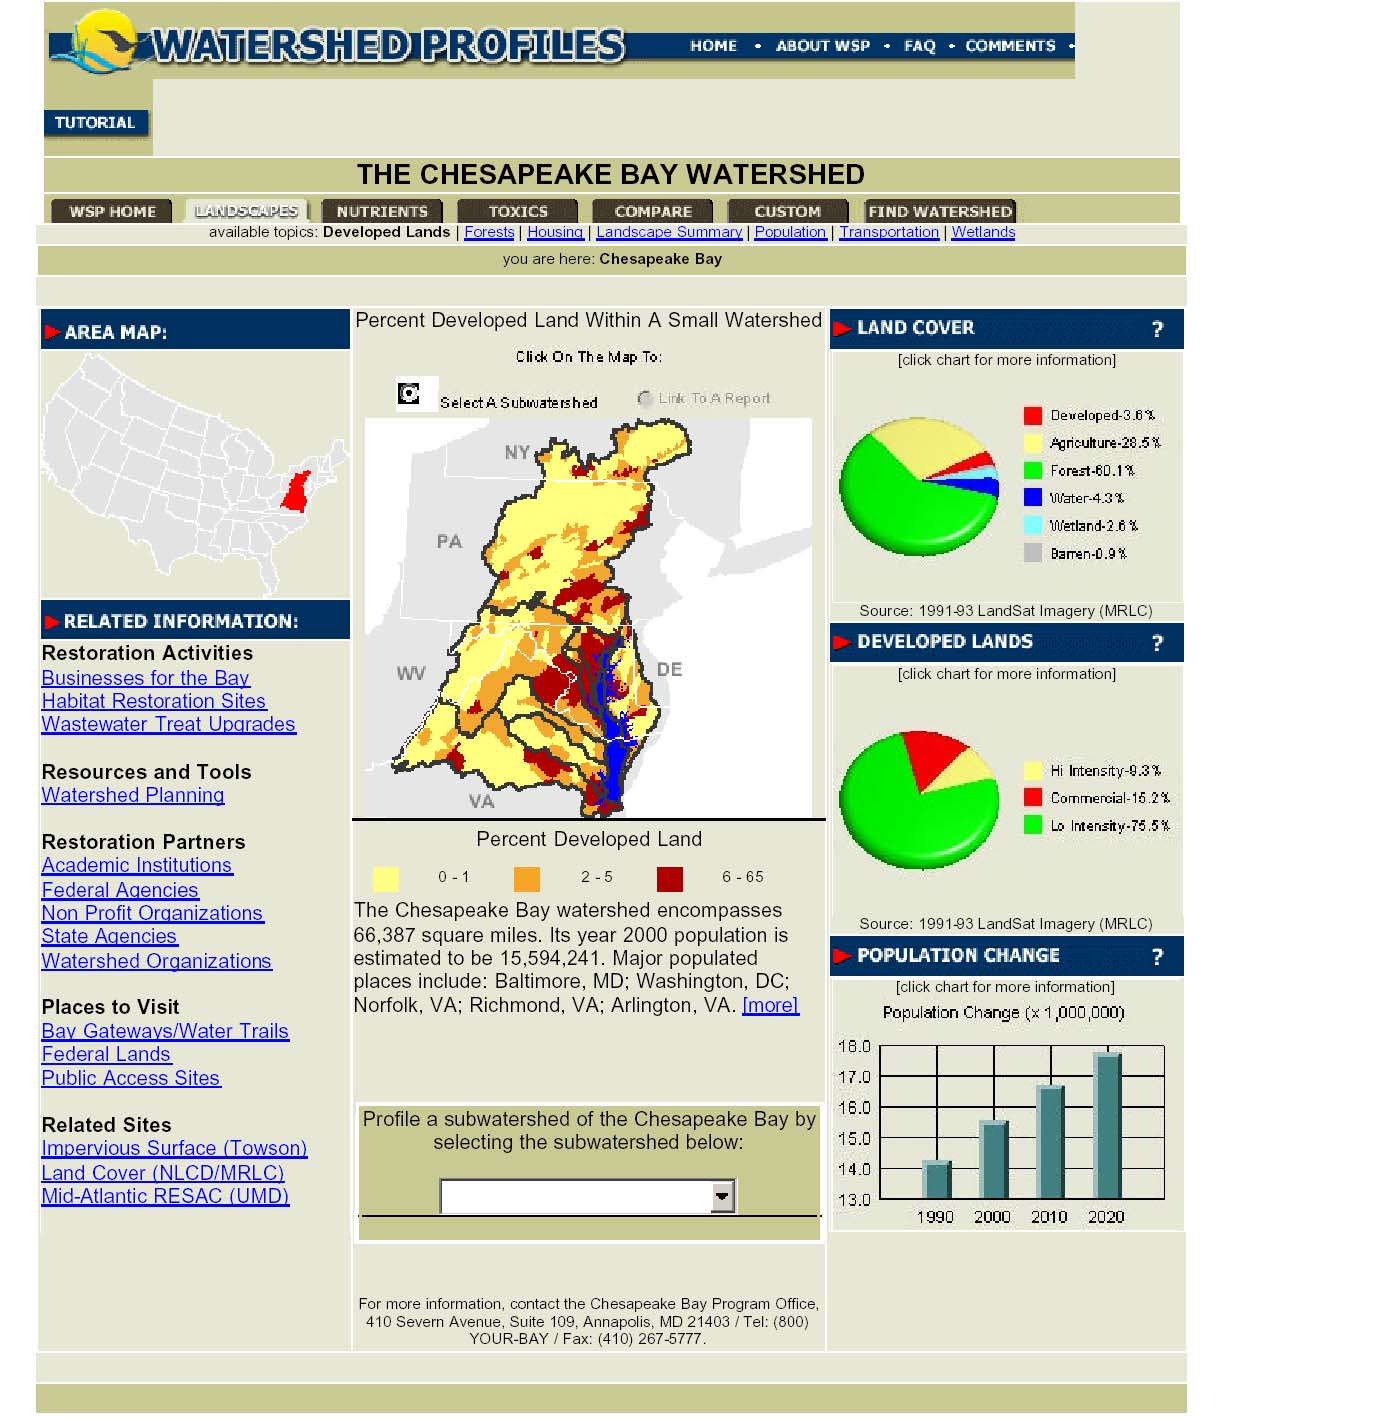
Case study: Chesapeake bay programme web
Chesapeake bay programme web4 is an interactive web site with environmental information on the
catchment scale (Figure 4). It is bundled with web-GIS services for display of raster and vector based
GIS data. It is highly relevant to consider in the light of the development of a Danube GIS as it
represents a nice example of an information product with high impact potential. The reason for this
high potential is the user friendliness of the site even though it contains a huge amount of information.
Chesapeake bay resembles Baltic GIS in that it tries to reach many various user groups. There is
information for all different user categories in a various formats. It does allow the user to download
base data, access information about ongoing activities, background information on catchment and sub
catchment level. Graphics are very appealing. One part of Chesapeake Bay net is the "watershed
profiles". Here the user can zoom in on catchments, view current and past pollution trend, see statistics
on land use fertiliser consumption, nutrient transport etc. One can also compare different catchment
with each other. Watershed Profiles assembles maps, charts and information that portray the
environmental condition of Chesapeake Bay watersheds.
Figure 4. Watershed Profiles. The internet application operates at a variety of scales from the entire
64,000 square mile Chesapeake Bay watershed to small tributary watersheds. Information on landscape
4 Chesapeake bay programme web - http://www.chesapeakebay.net
Fredrik Hannerz and Sindre Langaas, KTH Royal Institute of Technology
Needs Assessment and Conceptual Design for a Danube River Basin GIS System
21
changes, Bay Program activities, other organization activities, and places to visit are some of the
information displayed in easy to read charts, maps, and tables
2.4
User categories and their needs
2.4.1 ICPDR
2.4.1.1 Situational
analysis
A situational analysis is an important step to understand the organisation where a GIS or other types of
technology are being introduced. The analysis is a way of describing the organisation and a help to
understand the present stage of it. The basis is an analysis of technology maturity and organisational
structure that is important for GIS implementation. The analysis is used for the subsequent
implementation planning and conceptual design. The situational analysis framework that will be used
here is described in Huxhold and Levinson (1995) "Managing Geographical information systems
projects". It is designed to uncover "soft" and "hard" aspects of the organisation's makeup relevant for
making decisions on how to implement GIS in that particular organisation. It includes a brief analysis
of eight topics; fundamentals of the organisation, management philosophy and style, the culture or
cultures of the organisation, driving force for GIS, technology maturity, available resources, the
complexity of business functions of the organisation and implementation success risk/uncertainty.
Below is an analysis of the organisational context into which the Danube River Basin GIS would be
introduced. The organisation in this case is ICPDR in a broad meaning, including cooperative bodies
on member state level (but not research institutes, NGOs and the public). The point of making this
analysis is to form the basis on which recommendations of implementation strategy and contents of
the Danube River Basin GIS is made.
Figure 5. Organization structure under the Danube River Protection Convention
Fundamentals of the organisation
ICPDR is a transboundary organisation composed of member state representatives and a
permanent secretariat.
The ICPDR operational work is to a large degree conducted by members of several Expert
Groups.
UNDP/GEF Danube Regional Project
22
It is working on a high level in society and focuses on strategic and effective means for river basin
management.
The result of ICPDR to a large degree depend on non binding and voluntary contributions from
member countries.
Management philosophy and style
The degree of delegation is high.
Personal contributions are crucial due to few forcing regulations.
The culture or cultures of the organisation (political and technical)
Many different cultures are present in the organisation due to the specific and large geographical
area covered, due to the multi disciplinary focus and working methods and due to the multi level
societal relevance of organisation outcomes.
Driving force for GIS
Requirements of the EU Water Framework Directive
A strong will from professionals within the organisation to promote GIS a an effective tool for
river basin management
Technology maturity
The technological maturity is generally high, there exists an advanced information service already
(DANUBIS) used by many professionals cooperating with ICPDR but few outside the
organisation.
IT infrastructure is strong in some parts of the region but weaker in others
Available resources
Monetary resources: there is a low will to finance resource intensive technology and personnel
beyond the already existing financial commitments of the secretariat.
Human resources: Relevant human resources are abundant in the organisation, primarily
represented by the various experts being members of the Expert Groups, but they are available on
a "voluntary" basis.
The complexity of business functions of the organisation
The complexity is high and so is the fraction well educated professionals.
Success or failure within the organisation?
How can one reach a successful implementation of GIS in ICPDR?
We need to work pragmatically with the implementation. Costs needs to be low, needs must be
prioritised and we need to make use of existing data and infrastructure rather than constructing yet
another set of measurement programs and improvement of technical infrastructure.
Kraemer et al (1989) point out that an organisation in a strategic state such as ICPDR a GIS
project implementation is most likely to succeed if an organisation wide perspective of the
technology and the implication of it is taken into account. For ICPDR that would mean including
all user groups outlined in the user needs assessment and try to look to the needs with a broad user
definition rather than looking to the needs from ICPDR only.
Implementation of GIS within ICPDR may well fail if some important aspects are not considered. We
need first to define what a failure is concerning the DRB GIS implementation in general and the GIS
database construction in particular. A failure is apparent when:
The GIS database is being close to a data graveyard type of database with low usage rate. The
developed GIS remain an expert tool only.
The GIS database is being used for WFD reporting only and not as a basis for relevant
transboundary analysis
Fredrik Hannerz and Sindre Langaas, KTH Royal Institute of Technology
Needs Assessment and Conceptual Design for a Danube River Basin GIS System
23
What are the reasons for such a failure?
Lack of clearly specified and jointly agreed upon aim and objectives concerning purposes, users,
contents, and distribution policies
Sub-optimal `design' or `decision' of the body that will be responsible to carry out the work
Far too many water managers and decision-makers involved in River Basin Management leading
to:
o Low awareness in the potential of GIS
o Low priority of GIS
o Low willingness to reallocate funding from current environmental information
activities focussing upon State and Impact indicators/variables
Conflicts between bureaucrats, ivory tower scientists and applied scientists
GIS work focussed on technology while knowledge of existing GIS data sources, spatial
information policy, diplomacy, political science and project oriented management skills are given
lower priority.
Copyright restrictions hindering a vide use of the GIS database.
2.4.1.2 Permanent
Secretariat
The permanent secretariat of ICPDR has twelve members. Members have an overview of the
organisation and work with the transboundary matters of ICPDR. Their tasks are to support the ICPDR
sessions, Expert Groups and project development and implementation, coordinate the work
programme and maintain the ICPDR information system.
Phone interview with Ms. Ms. Ursula Schmedtje, Technical Expert on River Basin Management at the
ICPDR permanent secretariat, Mr. Károly Futaki, Information Management & Admin Officer and Ms.
Mihaela Popovici, Technical Expert on Water Management (Pollution Control)
Concerning GIS data and information needs, all interviewees stated that the Danube GIS should not be
a tool for WFD reporting only but should be extended to include other relevant data and information.
Map-making was seen as a basic feature but more important was transboundary analysis. Mentioned
and prioritised applications mentioned were: planning of action programs, integration of existing
databases, links to other databases, forecasting and vulnerability mapping.
Concerning systems development Mr. Futaki suggested that the development should be outsourced but
that the hardware probably need to be placed at the ICPDR. It would ensure security of the system and
the data. It was stated that the GIS should be finished within a three or four year period.
Public access was said to be of high importance by both Mr. Futaki and Ms. Schmedtje. It was pointed
out that public users might not need analytical tools, rather good thematic maps and graphs presenting
the problems or results. User friendliness was seen as important.
2.4.1.3
River Basin Management Expert Group (RBM EG)
The needs of this group have been identified through analysis of its terms of reference, other RBM
documents, the WFD guidance documents and through phone interviews with Ms. Ursula Schmedtje,
Technical Expert on River Basin Management at the ICPDR permanent secretariat and member of the
RBM EG, Ms. Visnja Omerbegovic, chairman of the RBM/GIS ESG and Mr. Ulrich Schwartz,
technical support to the RBM/GIS ESG.
The RBM EG has a large responsibility within ICPDR to carry out a large part of the work required by
the WFD. RBM EG is given the task to develop a concept for reporting and cartography, including a
Danube GIS. Responsibilities relevant for GIS usage include:
identification of the River Danube Basin District
coordinate the river basin characterisation
review of human pressures and impacts
co-ordinate all activities to set up a River Basin Management Plan
UNDP/GEF Danube Regional Project
24
prepare appropriate information for dissemination to interested bodies and the public.
GIS guidance document
The guidance document on implementing the GIS Elements of the WFD (GIS GD) is of high
importance for the Danube GIS development. The document is clear in its recommendations and the
links to the text in the WFD are comprehensive. It is important to keep in mind that the GIS GD is
exclusively focussed towards the reporting requirements. The document specifies what maps and data
are required for the reporting obligations in the WFD. It can thus be seen as a first core of a river basin
GIS that must be established if their intention is to fulfil the WFD requirements. ICPDR has that
intention and the data and maps specified in the GIS guidance document should therefore be taken as a
first goal in a short time perspective of the Danube GIS. For river basin management purposes (with
GIS implications) beyond the reporting parts it is important to take the other guidance documents into
consideration e.g. on pressure and impact analysis and on public participation.
The WFD requires that Member States report a considerable amount of information in the form of
maps. There is no real alternative to GIS to collect, handle and disseminate the data needed for the
reporting obligation. Concerning the first point the question is therefore not whether or not to use GIS
to construct the maps or what to include as this is specified in the Directive itself, in annexes and in
guidance documents. The question is rather how and when to do it. Deadlines for the reporting of
"GIS-maps" start already in 2003 and by the end of 2004 several maps are required on the roof-report
level. For a general overview, the time schedule for reporting Table 2 and 3 specifying contents and
reporting date can be used, but for a more detailed overview, the tables in Appendix 2 of the GIS GD
should be consulted. In the Appendix all attributes for the required maps are listed along side with
definitions of data, scale and reporting dates.
Pressure and impact analysis guidance document
In the guidance document "Guidance for the analysis of Pressures and Impacts in accordance with the
Water Framework Directive" (IMPRESS) information needs for pressure and impact analysis are
examined. The guidance document indicates what types of data may be useful in the analysis of
impacts and pressures, why the data may be useful, and suggests a European-scale data source, if
available. Section five provides extensive tables of data and information relevant to carry out the
requested analysis in the WFD. It must be stressed that the data are by no means required from
member states as is the case in the GIS guidance document but mostly a recommendation to what data
and information that may be useful for the analysis work. The guidance document recommends that,
where possible, data is collected in digital form and used within a GIS.
Key stakeholders that could be involved in the IMPRESS analysis are in the GD (section 5.1.2)
identified as being:
Experts from Ministries (agriculture, transport, planning, economy)
Water Service Suppliers, Water using sectors & stakeholders (farmers, industrialists, etc.)
Environmental NGOs
Stakeholders/civil society/public
Researchers/Experts (usually as consultants of the mentioned stakeholders)
Clearly there is a broad definition of who might be providing useful input to the pressure and impact
analysis. All these stakeholder groups need to be fed by information for making good and integrated
decisions. In fulfilling the WFD there is likely a strong interest from the RBM EG to involve most of
these groups in the development of river basin management. The stakeholder groups and the RBM EG
would therefore benefit from an information system enabling interaction.
The public participation approach is outlined in the issue paper "Public participation for implementing
the Water Framework Directive in the Danube River Basin". In the paper it is clear that public
participation is an important objective of the RBM EG and that is it seen as cost efficient in the long
run to work with outreaching activities. Public participation with GIS should therefore been seen as a
means for such activities, and a Danube GIS should be amended to suite public participation.
Fredrik Hannerz and Sindre Langaas, KTH Royal Institute of Technology
Needs Assessment and Conceptual Design for a Danube River Basin GIS System
25
Public participation guidance document
Public outreach is important for the RBM EG in their work towards sustainable management of
Danubian waters The guidance document on public participation aims at assisting competent
authorities in the Member States and Accession Countries with the implementation of Article 14 of the
Water Framework Directive about Public Participation. The guidance document on actively mentions
Web-GIStools as being one of thirteen most important public participation techniques.
UNDP/GEF Danube Regional Project
26
T bl 2 S
f GIS
i d b th WFD
T bl 3 S
f GIS
i d b th WFD (
t )
Fredrik Hannerz and Sindre Langaas, KTH Royal Institute of Technology
Needs Assessment and Conceptual Design for a Danube River Basin GIS System
27
Phone
interviews
Phone interviews were carried out with Ms. Ursula Schmedtje, Technical Expert on River Basin
Management at the ICPDR permanent secretariat and member of the RBM EG Ms. Visnja
Omerbegovic, chairman of the RBM/GIS ESG and Mr. Ulrich Schwarz, technical support to the
RBM/GIS ESG.
Concerning the final usage of the GIS database Ms. Omerbegovic and Ms. Schmedtje pointed out that
reporting is not the most important. Data analysis such as modelling related to pressure and impact
analysis and planning for action programs was said to be more important.
Concerning public dissemination of data Ms. Omerbegovic thought that data in a Danube GIS should
be publicly available. This opinion was not stressed by Mr. Schwarz who expressed that the question
of public accessibility to GIS data is sub-ordinate at the moment. Ms. Schmedtje meant that public
access is important but that it might be difficult in the beginning but that with time member states will
probably become more positive to open access.
Concerning web-mapping approaches (similar to the Wasserblick application) Ms. Omerbegovic was
very positive and thought that all stakeholder group would benefit from having that. Mr. Schwarz on
the other hand was more doubtful about web mapping as a solution for Danube GIS. He though that
web mapping is too ambitious and not needed now.
Concerning scale and approach to database construction, Ms. Omerbegovic and Mr. Schwarz
expressed similar opinions. They both thought that a combined approach would be beneficial.
Combined here means a combination of a top-down (cut out form Danube, European wide or global
data) and a bottom-up (national data) approach. Both expressed the need for data on the overview
scale, meaning that very high-resolution data is not important at the moment.
Mr. Schwarz strongly expressed the need for having a GIS person only doing GIS work. This person
should, be placed at ICPDR or at an institution close to ICPDR capable of carrying out the work. Ms.
Schmedtje shared
2.4.1.4
Cartography and Geographical Information Expert Sub-Group of the
River Basin Management Expert Group (GIS ESG)
The role of the GIS ESG is to support the implementation of GIS in ICPDR. The group doesn't really
have any own needs for GIS analysis but instead a need for information to support the coordination.
Such information is e.g. boundaries of administrative regions, crucial for data harmonisation issues.
The GIS ESG are responsible for the development of data models transfer of data and metadata and
therefore has a large need to a functioning communication model.
2.4.1.5
Economics Expert Sub-Group of the River Basin Management Expert
Group
Guidance document
No interview was carried out with members of the ECON ESG. Instead GIS needs were analysed by
reading the WFD Guidance document on Economics and the Environment (Wateco WG 2002). In the
guidance document the economical elements of the WFD are described in a circular flowchart (Figure
6)
UNDP/GEF Danube Regional Project
28
.
Figure 6. Flowchart showing the work plan of economical work within the WFD
The economical analysis is tightly bundled with the results from other activities such as identification
of pressures on water quality, biological biodiversity, hydrological fluxes etc. Nothing is said in the
guidance document about the use of GIS or maps other than that the result should be prepared in
consistency with the maps prepared for Article 7 (of the WFD). A list should be compiled of
economically significant aquatic species as an input to the register of protected areas. As this is one of
the "GIS-maps" required by the WFD the ECON ESG have at least some needs for GIS.
As the GD indicates it is important to include not only indicators from natural science in the drainage
basin characterisation but also economical variables that will differ from place to place in the drainage
basin. Examples of such variables or indicators are GNP, trade balances, income, employment, water
supply, water demand, investments in water quality improving measures etc. Such data are very well
suited for a GIS system.
2.4.1.6
Case study: MARE NEST decision support system
Cost-effect optimisation of pollution abatement strategies is a large issue in many drainage basins, also
in the Danube RB. Pollution abatement options are compared with associated costs for a particular
option and with other options to maximise what will yield the best overall result. Via a modelling
approach cost optimisation can then be carried out on the catchment scale. One example of such an
approach is the MARE NEST decision support system5 focusing on cost effective nutrient pollution
abatement in the Baltic Sea drainage basin. MARE NEST is described in Wullf et al (2001). The main
questions to answer within the decision support systems are:
How should reductions in nutrient load be allocated between measures and countries in order to
minimize total cost?
How are costs and distribution of payments affected by changes in Baltic Sea targets?
How would costs and policy instruments change if we, instead of expressing the targets in
deterministic terms, formulate probabilistic targets?
5 MARE NEST can be found at the MARE research programme web: http://www.mare.su.se/english/index.html
or http://data.ecology.su.se/Models/BEDonWeb/nest/
Fredrik Hannerz and Sindre Langaas, KTH Royal Institute of Technology
Needs Assessment and Conceptual Design for a Danube River Basin GIS System
29
The Danube river basin have many similarities to the Baltic Sea Drainage Basin and questions
regarding optimisation of costs for pollution abatements are probably very similar in the two regions.
GIS based modelling crossing over into economics is an interesting field and could probably be very
useful in the Danube River Basin. Regional economical analysis of pollution abatements strategies
could be substantially improved with a GIS-integration.
2.4.1.7
Accident Prevention and Control Expert Group
E-mail questionnaire results Mr. Anatoliy Shmurak (Ministry for Environmental Protection and
Nuclear Safety, Ukraine), GIS facilitator of the APC Expert Group
Answers from Mr. Shmurak yielded the following conclusions concerning the APC EG:
The APC EG use GIS for creation of thematic maps and analysis of inventory data
The APC EG has needs for maps and GIS layers to support their activities, e.g. a network model of
Danube basin and a watershed model of Danube basin. That would improve the DBAM (Danube
Basin Alarm Model). The DBAM model-system covers the whole river system of the Danube Basin
and provides fast information at selected locations and selected time on the simulated characteristics of
an accidental polluting spill, like travel time, concentration profile, shape of pollutant plume.
The EG think that parts of the data need to be in the public domain but not all. Some of the data will
need to be in the internal working area of DANUBIS.
Concerning scale the EG would benefit from a database with lower spatial precision but higher degree
of harmonisation and more freedom of use.
A web-GIS approach where all users have access to a common GIS database via a web interface
appeals the group.
Terms of Reference:
One of the objectives of the APC EG is to address the operational, organisational, and development
aspects relating to: coordinated, basin-wide communication of alarm/warning and information
messages; accident risk assessment, pollution prevention and precautionary control. The work of the
AEPWS/EG is expected to result in improved response to emergency situations with potential
transboundary effects.
The APC EG has made two inventories for the Danube River Basin:
Inventory of Potential Accidental Risk Spots
Inventory of Contaminated Sites
These inventories could be transformed into GIS format and be the basis for risk assessemnts and
scenario based pollution transport modelling hopefully leading to increased understanding of
accidental prevention priorities.
The group is acting in a short time scale. If an accident occurs transboundary prognoses and action
plans may need to be compiled rapidly. The group could need a lot of map-material to be able to
quickly assess potential actions. The group could further develop a GIS based modelling tool for
assessment of potential impact areas from accidental risk spots.
2.4.1.8
Ecological Expert Group
Some of the major responsibilities of the Ecological EG are to gather information about protected
areas and to disseminate information and support activities concerning conservation, restoration and
sustainable management of wetlands, especially floodplains. "GIS maps" on protected areas required
by the WFD and outlined in the GIS guidance document are:
Drinking water protection areas
Economically significant aquatic species protection areas
Recreational waters
Nutrient-sensitive areas
UNDP/GEF Danube Regional Project
30
Habitat protection areas
Bird protection areas
This is the minimum requirement of "GISmap" deliverables from the ECO EG.
Phone interviews with Mr. Ulrich Schwarz, Technical Experts to the Ecological Expert Group and
technical support to the RBM/GIS ESG
Concerning scale issues of GIS data Mr Schwarz stated the need to data on an overview scale and
meant that the ECO EG cannot collect all national data, it must be relevant on the Danube scale. He
pointed out that the national level should be separated from the ICPDR activities, concerning WFD the
countries will deliver the data to Brussels but ICPDR are not able to involve all that data. Concerning
publicity of data Mr. Schwarz expressed a concern about copyright restrictions. He said that the
national data providers need to decide if the information can be made available and that ICPDR is not
the only owner of the data.
Concerning systems solution Mr Schwarz stated the need for a final database and meant that ICPDR
should not construct a database where core data changes every year. He pointed out that if changes are
to be done to the database they should be of high importance.
2.4.1.9
Emission Expert Group
The overall objective of the EMIS EG is to identify and agree measures that will reduce polluting
emissions to the Danube River Basin. Today, the EMIS EG have an emission database of municipal
and industrial pollution available via DANUBIS.
Phone interview with Mr. Franz Überwimmer, member of the Emission Expert Group
Mr. Überwimmer said that the EMIS EG made some maps from emission tables in order to visualise
the sources. He stated that it was very effective and that the EMIS EG had changed their decisions and
recommendations due to the maps.
Concerning GIS derived maps Mr Überwimmer said that the EMIS EG would like to create maps of:
1 Present
situation.
2
How it could be in the future depending on different decision and scenarios
Mr Überwimmer summarised the GIS data needs of the EMIS EG as being more harmonised data on:
Diffuse pollution
Cities
Differentiation between background and
Meteorological data as rainfall,
human impact
evaporation
Driving forces, pressure and impact
Animals
Priority substances
Fertilisers
Common river names
Pesticides
Land use
Population
Concerning systems solutions and scale Mr Überwimmer said that the EMIS EG would prefer a
centralised approach rather than a national and that this would require a person with GIS skills in order
to support the work within the EGs.
2.4.1.10
Flood Protection Expert Group
The Flood Protection EG is a new group and the work plan is still under elaboration. The role and
ambitions of the group is therefore still uncertain, so are the needs for GIS related data and
information. The major task for the group will be to develop a flood forecasting system and to make
recommendation on how to prevent damages from flooding events. The flood forecasting system will
build on the GIS-integrated LISFLOOD model that defines a large part of the needs for GIS in the EG
today.
Phone interview with Mr. Gabor Balint, member of the Flood Protection EG, chief scientific
researcher at Vituki Consult Rt
Fredrik Hannerz and Sindre Langaas, KTH Royal Institute of Technology
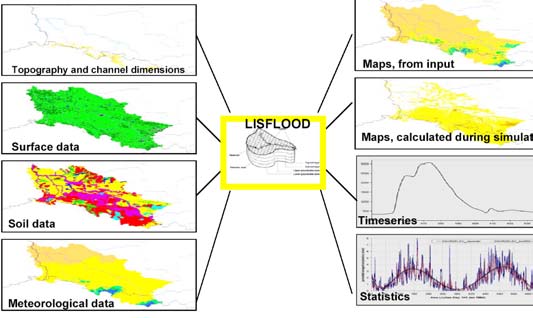
Needs Assessment and Conceptual Design for a Danube River Basin GIS System
31
Concerning scale of GIS data Mr. Gabor said that the FP EG needs a scale similar to the GISCO data.
That would serve most needs for core data in the EG. For some applications e.g. delineation of
floodplains the EG needs more detailed maps. Concerning systems solutions Mr Balint stated that the
FP EG initially needs a centralised effort that works for the whole basin. Mr. Gabor expressed a fear
that the database otherwise will never be finished.
Current GIS data needs in the FP EG are data on:
Hydrometeorological observation.
Structures alongside with the river/streams
Stream length as a attribute besides
(flood embankments, dykes, longitudinal
geographical coordinate
structures)
Crossections of river channels
Dam constructions.
Flooding areas and potentially flooded
Snow coverage and depth
areas.
High-resolution elevation model
Flooding monitoring sites.
Description of LISFLOOD
The flood forecasting system will build upon the LISFLOOD model (De Roo 1999), a distributed and
dynamic GIS integrated hydrological routing model. GIS maps are the basis for model calculation
(Figure 7) and output is also in form of maps alternatively time series of e.g. runoff and flow
accumulation.
Figure 7. LISFLOOD input and output examples
The flood-forecasting model requires a harmonised multi-layer GIS database covering the whole river
basin. Output from the model is partly in GIS format and could therefore easily be added to a Danube
GIS as modelled data layer describing some distributed variables. Relevant input datasets is presented
in Figure 8. The figure also indicates where the GIS data might be taken from both European wide
sources (DEM, Flow network, Land use, Soils) and data from national data providers (on river cross
sections, reservoir data, polder data, discharge data and meteorological data).
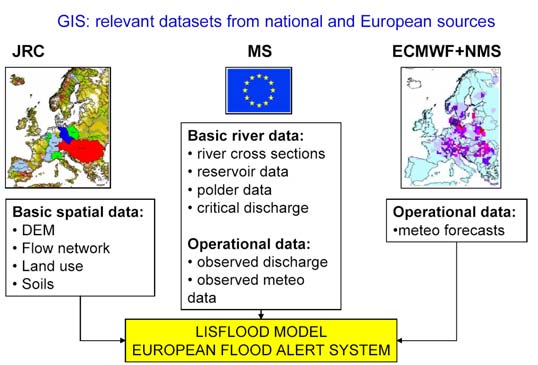
UNDP/GEF Danube Regional Project
32
Figure 8. GIS data input to the LISFLOOD model. From Schmuck et al 2002
Other data necessary for LISFLOOD modelling:
Division Rainfall/Snow
Sub-surface lateral flow
Interception
Groundwater recharge
Evapotranspiration
Groundwater flow
Leaf drainage
Infiltration excess overland flow
Snow melt
Saturation excess overland flow
Glacier melt
River channel flow (kinematic and
Soil freezing
dynamic wave)
Infiltration
Reservoir operations
Vertical soil moisture redistribution
Retention storage
For carrying out the flood-forecasting modelling the FP EG and JRC will jointly need to construct a
GIS database with a considerable amount of data for the entire drainage basin. The data and model
results from this modelling would probably be very useful to include in a Danube GIS for other
purposes outside the group as well.
2.4.1.11
Monitoring, Laboratory and Information Management Expert Group
Today, the EG have three databases (accessible with DANUBIS): the recent TNMN database, the
older Bucharest Declaration Database and the database from the Joint Danube Survey. MLIM EG
communicates information via the annual reports (year book) and via DANUBIS. The yearbooks
contain a small number of maps constructed with GIS. "GIS-maps" required by the WFD, under the
responsibility of the MLIM EG are, as stated by the GIS guidance document:
Surface waters
Operational monitoring sites
Surveillance monitoring sites
Monitoring sites drinking water abstraction points
Investigative monitoring sites
Reference monitoring sites
Ground waters
Groundwater level monitoring network
Operational monitoring network chemical
Surveillance monitoring network chemical
Fredrik Hannerz and Sindre Langaas, KTH Royal Institute of Technology
Needs Assessment and Conceptual Design for a Danube River Basin GIS System
33
The MLIM EG with its current databases seems to have covered much of the required monitoring data
concerning surface waters but not ground waters.
Mail answer by Ms. Juliana Adamkova, member of the MLIM EG, Slovak Hydrometeorological
Institute
Concerning GIS data, map and information material the EG would prefer a GIS based system as it
would ease visualisation of monitoring data and enhance map-making.
Concerning public dissemination and systems solutions Ms Adamkova expressed her opinion that all
data should and could be publicly accessible and that a web-based GIS system were data could be
uploaded, downloaded and distributed would be beneficial to the group.
Concerning needs for additional GIS data the MLIM group would need:
Data on "pressures" put on surface water status for interpretation of monitoring data.
Data on sources of pollution in river basin both point and diffuse.
Data on morphological alterations and alterations of hydrological regime
2.4.2 UNDP/GEF
UNDP/GEF has a strong interest in transboundary processes in the Danube river basin. One of their
aims is to make reinforcements of monitoring, evaluation and information systems to control
transboundary pollution. UNDP/GEF does not have an equally strong focus on the WFD as ICPDR.
Phone interview with Mr. Andy Garner, Environmental Specialist, UNDP/GEF
Concerning currant and forthcoming data holdings of the UNDP/GEF project:
Wetland management activities generate information.
UNDP/GEF will generate data on water quality parameters.
Some economical data exists
The joint Danube and Black Sea project will provide a lot of data and information.
Concerning GIS data and information needs today, Mr. Garner outlined the following needs for the
UNDP/GEF project:
Ready made maps of different scales (Danube, sub basins, national and sub-national)
Various maps made on ad-hoc basis.
Linkage between available data sources
Data, information and maps on pressures and impact
Concerning systems solution Mr. Garner stated the need for:
Public access to GIS databases and derived information
A centralised approach due to many countries that needs to be coordinated and the present large
and multi-disciplinary knowledge at ICPDR about the whole Danube River Basin that would
probably be very beneficial for the GIS work.
A GIS resource person at the ICPDR secretariat or externally skilled in map-making
2.4.3 NGO
2.4.3.1 WWF
Aueninstitut
WWF-Aueninstitut is among other things working with flooding areas mapping in the Danube River
Basin. Within a project, a combination of historical maps and current topographical maps resulted in
GIS data showing current and former floodplains. The relevance of such data for a Danube GIS is
naturally high.
Phone interview with Mr. Detlef Günter-Diringer at WWF-Aueninstitut
Current relevant data holdings at WWF-Aueninstitut:
Current and recent floodplains
UNDP/GEF Danube Regional Project
34
Restoration relevant data on the Danube Delta and lower Danube
Needs for GIS data and related information stated by Mr. Günter-Diringer:
More detailed forest data/information. The three forest classes in Corine are not enough.
A detailed and harmonised linear data set (e.g. EGM) including river network.
One base data source in order to discard many of the harmonisation problems
Detailed DEM (about 1 meter altitude correctness)
Concerning the systems solution Mr. Günter-Diringer strongly stated the need for a centralised
approach and meant that with a decentralised approach it would be very difficult to get harmonised
data. He also stated the need for overview scale data in the database.
2.4.4 Science
Community
2.4.4.1 DANUBS
DANUBS is a EU 5th framework research programme assessing the nutrient load problems in the
Danube river basin. Among other tasks, the project develops quantitative models for calculation of
nutrient transport in the basin and the transport to the Black Sea. One of the models, the MONERIS
model uses GIS maps to derive inputs to the model. GIS maps covering the model input parameters
are thus crucial for the modelling work. The outcomes from MONERIS modelling are maps on sub-
catchment level for important nutrient transport parameters. Nutrient transport, including scenario and
cost analysis are in DANUBS calculated for approximately 390 sub-catchments in the Danube River
Basin.
Phone interview with Ms. Heide Schreiber, PhD student, Leibniz-Institute of Freshwater Ecology and
Inland Fisheries, Berlin
During recent two years an extensive GIS database covering the Danube drainage basin has been built
up within the Danubs project in order to support MONERIS modelling. The contents of the GIS
database are summarised in Table 4.
Fredrik Hannerz and Sindre Langaas, KTH Royal Institute of Technology
Needs Assessment and Conceptual Design for a Danube River Basin GIS System
35
Table 4. List of input maps to MONERIS modelling in the Danube River basin
Theme
Scale
Source data
Administration
1:1 Million
Bartholomew, Macon
Derived on the basis of the TNMN, monitoring station list for
Catchments
1 km grid
each of the Danube countries and the DEM
CORINE landuse
250 m grid
European Centre on Land Cover , Kiruna, Sweden, 1997
Landuse IGBP
1 km grid
IGBP
Landuse USGS
1 km grid
USGS
Waterbodies
1:1 Million
DCW and others
River network
1:1 Million
DCW
Digital Soil Map of the World and Derived Soil Properties (CD
Soil FAO
1:5 Million
ROM), 1998
derived from the Hydrogeological map of Europé, RIVM,
Geology
1:10 Million
Netherlands)
Nitrogen deposition
50 km grid
map from the EMEP, 1996
TNMN and choosen stations for each country (correspoding to
Monitoring stations*
sub-catchments)
Climate
From 200 m griBased on "Atlas der Donauländer"(1970-1989)
Elevation
1 km grid
GTOPO30, USGS
Aspect
1 km grid
GTOPO30, USGS
Topographic index
1 km grid
GTOPO30, USGS
Slope
1 km grid
GTOPO30, USGS
Erosion
5 km grid
Fraunhofer Institute of Ecotoxicology
In addition to the GIS maps (Table 4) the DANUBS have collected considerable amount of GIS
formatted statistics, required by the MONERIS model (e.g. agricultural statistics, population, land use,
sewage water connectivity). Further, a vector data map of geology will be compiled within the project
by digitising of paper maps.
Main problems with existing GIS data and information in the Danube region as outlined by Ms.
Schreiber:
Availability of digital data
Accessibility to available regional and sub-regional data.
Ms. Schreiber summarised further data and information needs for MONERIS modelling within
DANUBS:
Better resolution of soils and geology.
Erosion maps.
Data on nutrients in tile drainage and ground water.
Climate and evapotranspiration data.
Data on the rate of WWTP-connected people, types of systems and exact locations.
Concerning scale Ms. Schreiber stated the need for overview scale data, homogenous for the whole
basin.
2.4.5 Media
Information needs from media should not be underestimated; especially not as effective public
communication is a goal for ICPDR implementation of the WFD. The media is very skilled in
communicating information, even difficult information related to water management. The media thus
play an important role in RBM and should be served useful information. Media will unlikely use the
GIS data itself, as it requires too much time and skills. Statistics is neither a plausible source for the
UNDP/GEF Danube Regional Project
36
media unless it is very information rich. Instead they will use derived maps and well formulated
information.
Phone interview with Ms. Jasmine Bachmann, project manager Danube Watch.
Concerning currant needs for GIS related information Ms. Bachmann stated the need for:
Appealing maps on overview scale for visualisation and for building a common river basin
identity.
Information products
Basis statistics on relevant indicators (e.g. water use, population, income) on national level. The
statistic should be more easy to use than today.
Ms. Bachmann pointed out two information services from the Baltic region, the Baltic Sea Region
GIS, Maps and Statistical Database6 and the Lake Peipsi GIS database7 as being an information
models very useful for her purposes as they contain information on different levels and nice looking
publishable maps
2.5 Conclusions
Stakeholders (all groups identified for he user needs assessment) have different needs for data and
information products. Phone interviews with key person inside and outside the ICPDR organisation
revealed that some needs and wishes upon a DANUBE GIS are similar within most of the groups.
Four common needs were identified from the majority of the groups:
1) We need maps
2) We need a system on the overview scale
3) We need a centrally initiated and developed GIS database
4) We need public access
"We need maps"
The needs for maps are stated by almost everybody. There seams to be a clear lack of maps of the
region. Some state the need for nice looking cartographics for publication in papers, reports and via
the Internet while others point out the need for informative maps for planning and management. The
latter group would probably need some function for making maps on an ad hoc basis. A primary need
is to cover the 15 maps required by the WFD for reporting purposes (Table 2 and Table 3)
"We need a system on the overview scale"
All interviewees stated the need for a system on the overview scale while nobody stated the need for
very detailed data and information in the Danube GIS, at least not in an initial database. In map terms
such an overview scale should probably not be larger than 1:1 000 000.
"We need a centrally initiated and developed database"
All interviewees said that a centralised approach would be better, at least initially, than a decentralised.
After the initial phase, some said we might go further and develop a more decentralised system. Some
of the interviewees said that there are so many countries that will make a decentralised approach to
database building very difficult. The EMIS group has some experience and said that without a
centrally placed person taking care of present and occurring task there would not be any emissions
inventory today.
"We need public access"
6 Baltic Sea Region GIS, Maps and Statistical Database - http://www.grida.no/baltic/index.htm
7 Lake Peipsi GIS database - http://www.mantraeast.org/gis/
Fredrik Hannerz and Sindre Langaas, KTH Royal Institute of Technology
Needs Assessment and Conceptual Design for a Danube River Basin GIS System
37
The importance of having a system with public access functionality is important to most interviewees.
Some groups need data that will likely be difficult to disseminate and therefore stated the importance
of some restrictions.
UNDP/GEF Danube Regional Project
38
3 A conceptual design
Fredrik Hannerz and Sindre Langaas, KTH Royal Institute of Technology
Needs Assessment and Conceptual Design for a Danube River Basin GIS System
39
3.1 Introduction
The user needs assessment for a Danube River Basin GIS, primarily conducted by reviewing various
relevant ICPDR and WFD documents and by interviewing selected representatives of various ICPDR
groups, the GEF/Danube Project and some other major stakeholders, forms the basis for the
conceptual design. Phone interviews revealed that many needs and expectations upon a Danube RB
GIS are similar between most user groups. A majority of the groups stated following needs:
We need maps
We need a system on the overview scale
We need a centrally initiated and developed GIS database
We need public access
The user needs assessment enabled us to identify the following primary needs according to the
following needs categories:
Needs for a multi-thematic GIS database and a series of derived maps and statistical tables based
upon the GIS database featuring the key characteristics of the Danube River Basin. These needs
reflect those for WFD reporting, as well as numerous other purposes.
Needs for `GIS system solutions' to enable the various ICDPR groups and other stakeholder
groups to access, use, exploit, and disseminate the GIS database and thereby facilitate the
development of derived and new spatial information upon demand and according to needs as they
will evolve over time.
Furthermore, the needs assessment enabled us to identify the primary and secondary users and
beneficiaries.
Based upon this we suggest a multi-component development approach to meet the needs of the various
users and beneficiaries.
Component 1: Development of a multi-thematic GIS database covering the Danube River basin.
We have further suggested two different ambition levels for this component, termed Option 1 and
Option 2.
Component 2:
A flexible `systems solution' based upon a combination of stand-alone GIS
software, Internet MapServer software and Web server software to exploit and disseminate GIS
data, derived geographic information products, internally at ICPDR and externally
While interrelated, the suggested components can be looked upon as separate activities that can be
considered as externally fundable or stand-alone projects or activities. Of the two proposed
components, component 1 will most likely need considerable new financial resources beyond the
ordinary ICPDR budget or national resource commitments of the Signatories of the Danube
Convention. This component is typically one that can be defined as a time limited project, with
reasonable clear inputs, outputs, resource requirements and a well-defined time schedule. Component
2 will also require substantive resource inputs, yet this activity can be seen as future internally funded
and operated activities of the ICPDR. Obviously, as will be noted in the more detailed descriptions,
each of these components can be further sub-divided into smaller components, activities or projects.
Based upon the consultants own experiences from the Baltic Sea region in developing, using, and
disseminating GIS data and derived geographic information products, we have chosen to give most
emphasis to the first component, the initial development of a multi-thematic GIS database covering the
Danube River basin. This initial GIS database will be the core and heart of any `Danube GIS',
however defined
3.2
Component 1. Development of a multi-thematic GIS database
covering the Danube River basin
3.2.1 Objective
The objective of this component is to develop a harmonized, multi-thematic GIS database covering the
Danube drainage basin in support of:
UNDP/GEF Danube Regional Project
40
EU Water Framework Directive reporting
Integrated River Basin Management within and outside the ICPDR
Strategic decision-making
Research
Education
Public outreach
The database should contain relevant river basin information with sufficient level of detail and other
characteristics pertinent for the above purposes. To achieve maximum positive impact upon the
Danube river basin environment the GIS database should, with as few exceptions as possible, be made
publicly available. The database design should also encourage reuse and integration of existing data
and GI infrastructure rather than encouraging another monitoring program and more GI hardware and
software
3.2.2
Database contents
3.2.2.1
Time frame and thematic contents
Based upon the interviews with representatives of the various ICPDR Expert Groups and others, and
reviews of WFD Guidance Documents, it appears that the wishes or needs for thematic maps and GIS
layers are very comprehensive, possibly reaching beyond 40 layers. Thus, there is a clear need to
prioritise within this comprehensive list of needs and wishes. The user needs assessment clearly
showed that fulfilling WFD requirement now is highest priority. The database must reflect this priority
and should therefore follow the WFD reporting deadlines. In order to be relevant on the transboundary
scale it should also contain the most important additional layers supporting basin wide analysis of
pressure, state and impact variables. Our proposal is based on three development periods, the short
time frame until 2004, the medium time frame until 2006 and the long time frame until 2009 (Table 5).
These periods are based on ICPDR relevant WFD reporting dates. Additionally we suggest two
options for the contents of the Danube GIS, option 1 being what we consider the minimum
requirement for a `Danube GIS' (what is required by the WFD). Option 2 is an extended GIS database
expanding upon option 1.and include other data that will be crucial for effective and transboundary use
of the GIS database. A lot more layers could be included in the extended database but time constraints
will limit what is possible to achieve.
Table 5. Suggestion for time frames and contents of the Danube GIS
Timeframe Contents of minimum
Contents of extended database
database (WFD
requirements)
SHORT
WFD reporting Dec. 2004
2004
Layers necessary for
transboundary harmonisation
WFD reporting Dec. 2006
MEDIUM
Most important layers for transboundary
2006
analysis e.g. pressure and impact data that will
be accessible within two years
A number of cartographic layer necessary for
mapmaking
A few additional key needs of some ICPDR
Expert Groups.
LONG
WFD reporting Dec. 2009
Additional layers for more effective
2009
transboundary RBM
More GIS data on pressure and impacts
Some additional key needs of some ICPDR
Expert Groups.
Fredrik Hannerz and Sindre Langaas, KTH Royal Institute of Technology
Needs Assessment and Conceptual Design for a Danube River Basin GIS System
41
Short time frame, until December 2004
The minimum content requirements until 2004 corresponds to the most promptly needed maps for roof
report obligations by end 2004. Thematic maps to be included in the roof report are listed in the
ICPDR document "Time line for fulfilling the requirements of the WFD needed by the end of 2004..."
as in Table 6.
Table 6. Thematic maps to be included in the 2004 roof report
Thematic maps8,:
Responsible Deadline
1. Preparation of map content
· Map SW4: Surface water bodies of the Danube
GIS ESG/
Draft: Apr 04
incl. HMWB candidates
RBM EG
Final: Sep 04
· Map D6: Ecoregions
GIS ESG/
"
MLIM EG
· Map SW4A: Surface water body types of rivers
GIS ESG/
"
and lakes in the overview map
MLIM EG
· Map of significant point pressures on the
GIS ESG/
"
overview level
EMIS EG/
· Map of significant diffuse pressures on the
MLIM EG/
overview level
RBM EG
· Map of significant hydromorphological
pressures
· Map of significant impacts on the overview level
GIS ESG/
"
(risk of failure to achieve good status)
MLIM EG
· Map of land use based on CORINE and data
GIS ESG
"
from JRC
· Map(s) on groundwater issues (to be specified)
GW experts/
"
RBM EG
All these maps will be reported by latest in December 2004. A final version of the maps must be
finished in September 2004. As there is no real alternative to GIS to construct and handle the maps
and underlying data the 2004 roof report requirement will constitute a good start for the Danube GIS.
To our understanding the minimum data holdings in order to construct these maps are those listed in
Table 7.
8 Number of maps refers to EU WFDGuidance document on GIS
UNDP/GEF Danube Regional Project
42
Table 7. GIS data layer required to produce the maps for the 2004 roof report.
Layer WFD
Data
Most important attributes
map nr. type
Administration
Administrative boundaries
- Polygon
Code,
Name
(Nuts 0 - 3)
District of competent WFD
D7
Polygon
Name, contact info
authority
Danube River Basin District
SW1 Polygon Name
Hydrology
River basins
SW2 Polygon Code,
Name,
Surface water bodies
SW4 Line,
Code, Name of waterbody, Type of
polygon
surface water body (SW4a), Ecoregion
(D6)
Main rivers
SW3 Line
Code,
Name
Ground water bodies
GW1 Polygon Code
Other River Basin characteristics
Land Cover
- polygon
or
land cover class
raster
Pollution
Diffuse Nitrogen pollution
- Raster
or
Diffuse N inputs per area (per sub-basin)
Polygon
Diffuse Phosphorous
- Raster
or
Diffuse P inputs per area (per sub-basin)
pollution
Polygon
Point pollution sources
-
Point
Type of point (industry, WWTP, town),
amount and type of input
hydromorphological
- Raster
or
pressures
Polygon
Medium time frame, until December 2006
Between 2004 and 2006 the Danube GIS should be developed into an operational system, integrated
with the DANUBIS. The GIS should integrate the information sources already existing within ICPDR
(EMIS inventories, JAP inventories, TNMN database etc), with new data. Such new data may or may
not be required by the WFD depending on the ambition of ICPDR concerning the GIS. One possibility
is to restrict the Danube GIS to include data and map information necessary for the WFD roof-
reporting (minimum option) or to extend the database (extended option) to include useful data for
other transboundary applications as well. The minimum option would be cheaper but less useful, the
extended option more expensive but also more useful. The necessity to expand the Danube GIS
beyond WFD reporting were strongly stressed by many potential users of the Danube GIS during the
user needs assessment. This is also our recommendation.
Fredrik Hannerz and Sindre Langaas, KTH Royal Institute of Technology
Needs Assessment and Conceptual Design for a Danube River Basin GIS System
43
The minimum content of the database at the end of 2006 is specified in Table 8 following
recommendation in the WFD guidance document on GIS.
Table 8. Data required to produce WFD reporting maps by the end of 2006
Layer
WFD Data
Most important attributes
map nr. type
Administration
District of competent
D7
Polygon Name, contact info
WFD authority
Danube River Basin
SW1 Polygon Name
District
Hydrology
River basins
SW2
Polygon Code, Name, Population, land cover
statistics,
Surface water bodies
SW4 Line, Code, Name of waterbody, Type of
polygon surface water body (SW4a),
Ecoregion (D6)
Main rivers
SW3 Line
Code,
Name
Bodies of ground water
GW1 Polygon Code
Monitoring
Monitoring network for
SW5a-e Point
Code, type of measurement point,
Surface Water Bodies
measurements
Groundwater
GW1a-c Point
Code, type of measurement point,
Monitoring Network
measurements
Protected areas
Drinking water
PA1
Polygon Code, Name, Status of protected area
protection areas
Economically significant
PA2
Polygon Code, Name, Status of protected area
aquatic species
protection areas
Recreational waters
PA3
Polygon Code, Name, Status of protected area
Nutrition-sensitive areas
PA4
Polygon Code, Name, Status of protected area
Habitat (Natura 2000)
PA5
Polygon Code, Name, Status of protected area
protection areas and
equivalent
Bird Protection areas
PA6
Polygon Code, Name, Status of protected area
The data in Table 8 are following the minimum WFD requirement. More data will become necessary
for pressure and impact analysis as specified by the Directive and for other transboundary
applications. A proposal for the extended database for 2006 can be found in Table 9. Data for the
extended database was selected according to the following criteria:
Layers necessary for transboundary harmonisation (e.g administrative boundaries)
UNDP/GEF Danube Regional Project
44
Layers possible to finish within two years
Important pressure and impact data that are accessible or will be accessible within two years
(e.g. diffuse N and P loads)
A number of cartographic layer necessary for mapmaking, enabling of a future web-GIS and
for identification of geographical features in the basin.
A few additional key needs of some ICPDR Expert Groups.
Table 9. Contents of the extended database by end of 2006.
Layer
Data type Most important attributes
Administration
Administrative
Polygon Code,
Name
boundaries (Nuts 0 - 3)
Settlements
Point Name,
population
Infrastructure
Roads
Line
Type of road
Dam constructions
Line
Other River Basin characteristics
Soils
Polygon or
Type of soil
raster
Population distribution Raster Population
Land Cover
polygon or
land cover class
raster
Elevation data
Raster Elevation
Pollution
Diffuse Nitrogen
Raster or
Diffuse N inputs per area (per sub-
pollution
Polygon
basin)
Diffuse Phosphorous
Raster or
Diffuse P inputs per area (per sub-
pollution
Polygon
basin)
Point pollution sources Point
Type of point (industry, WWTP,
town), amount and type of input
hydromorphological
Raster or
pressures
Polygon
Long time frame, until December 2009
After the launch of the Danube GIS in 2006 by latest the database should be updated and extended to
cover more of the needed data. A minimum would be the required WFD data (Table ).
Fredrik Hannerz and Sindre Langaas, KTH Royal Institute of Technology
Needs Assessment and Conceptual Design for a Danube River Basin GIS System
45
Table 10. Additional data required by the WFD by the end of 2009
Layer WFD
map
Datatype Most
important
nr.
attributes
Ecological and chemical status and potential
Ecological Status and
SW4b-d
Attribute of SW4
ecological potential of surface
water bodies
Chemical status of surface
SW4e
Attribute of SW4
water bodies
Groundwater status
GW1a-c Attribute
of
GW0
Status of protected areas
PA7
Attribute of PA1-
PA6
A further extension of the non-WFD required data would be important in order to integrate existing
data (e.g. data on accidental risk spots and older pollutant data) and to extend useful data for
transboundary analysis (e.g. flooding areas and meteorological data). A suggestion for the contents of
the extended part of the database can be found in Table 11.
UNDP/GEF Danube Regional Project
46
Table 11. Suggested contents of the extended database, finished by latest by the end of 2009.
Layer
Data type
Most important attributes
Hydrology
Flooding areas
Polygon
Recent floodplains, Former / historical
floodplains
Infrastructure
Railway lines
Line
Other River Basin characteristics
Temperature
Points
Monthly mean temperatures
Precipitation
Raster
Long-term precipitation
Hydrogeology
Raster or polygon
Aquifer type, capacity
Erosion
Raster or polygon
Erosion potential
Pollution
Atmospherically N
Raster
Deposition of NH4 and Nox
deposition
DABLAS project sites Point
Type of site, status, investment amounts
Main contaminated
Point
Site type, Status
Sites
Accidental Risk Spots Point Activity
type
Bucharest
Point
Declaration Pollutant
Data
3.2.2.2
Metadata ISO 19115
Preparation of easy accessible metadata is one of several approaches to stimulate and increase the use
of GIS data for various application areas. This should consequently be an important task of any GIS
database development work aimed towards establishing transboundary river basin GIS databases. Both
the minimum and extended database should be documented with at least two levels of metadata,
namely metadata for discovery and metadata for use. These types of metadata are described in the GIS
guidance document section 3.7. A new metadata standard, ISO 19115 have finally emerged and was
published 2003-05-08. Below is a brief description of the ISO standard as formulated on the ISO Web
site9.
9 ISO (International Organisation for Standards - http://www.iso.org/
Fredrik Hannerz and Sindre Langaas, KTH Royal Institute of Technology
Needs Assessment and Conceptual Design for a Danube River Basin GIS System
47
ISO 19115:2003 defines the schema required for describing geographic information and services. It
provides information about the identification, the extent, the quality, the spatial and temporal schema,
spatial reference, and distribution of digital geographic data.
ISO 19115:2003 is applicable to:
the cataloguing of datasets, clearinghouse activities, and the full description of datasets;
geographic datasets, dataset series, and individual geographic features and feature properties.
ISO 19115:2003 defines:
mandatory and conditional metadata sections, metadata entities, and metadata elements;
the minimum set of metadata required to serve the full range of metadata applications (data
discovery, determining data fitness for use, data access, data transfer, and use of digital data);
optional metadata elements - to allow for a more extensive standard description of geographic
data, if required;
a method for extending metadata to fit specialized needs.
Though ISO 19115:2003 is applicable to digital data, its principles can be extended to many other
forms of geographic data such as maps, charts, and textual documents as well as non-geographic data.
A full description of the standard can be found in the recently published international standards text or
in a summarised format in appendix VII of the GIS Guidance document (written when the standard
was not yet formally published).
The standard contains a huge amount of metadata elements aimed to cover a vide range of purposes.
Most of these elements are optional. There is a large need to develop a standard profile in the light of
the WFD requirements and this is currently being done. A preliminary ISO 19115 profile is already
submitted to the European Commission for comments (Alessandro Annoni, JRC, pers. comm.).
Vendors have tools that are already equipped to handle ISO metadata e.g. ESRI's ArcCatalog,
Intergraph's SMMS and MapInfo being licensed and M3CAT and Enraemed being freely available
tools.
Recommended actions:
ICPDR should decide upon a metadata profile for all data input to the Danube GIS. It is
recommended that the upcoming WFD standard profile of ISO 19115 is being used.
Metadata should be stored centrally in a metadatabase together with the GIS database (Figure 9)
Metadata should be documented in a single language (English) so that all users in connection with
the Metadatabase can understand the data.
ICPDR member states should be responsible for updating of the metadata for data originating
from national sources while other data must be documented and updated by the constructor of the
central database.
UNDP/GEF Danube Regional Project
48
Figure 9. Data and metadata flow into the common Danube GIS database and DANUBIS.
3.2.2.3
Technical characteristics and data flow
During the interviews with various representatives of ICPDR Expert Groups and others it was obvious
that most users were quite relaxed with respect to technical aspects like nominal scale and resolution,
quality aspects like positional and thematic data accuracy. The dominating view was that `best
available and accessible' information should be used. The proposed database will contain data with
variable scale. It is recommended to in this stage develop a database with a scale of 1:1 000 000 or
smaller.
Considering the Guidance Document on GIS, it contains quite detailed recommendations not only on
format, coding and reference systems. It is recommended to adopt the WFD guidelines on a geodetic
framework.
Concerning exchange format ESRI standards are recommended (further discussed in the report on GIS
hardware and software considerations)
A strict data model needs to be followed for the exchange of data (Figure 9). The model needs to be
developed early in the Danube GIS process, by latest in the initial phase of the 2004 2006
development period. Our recommendation is to:
Use the data model outlined in the WFD guidance on GIS for WFD where applicable
Develop new common data models for other data
For data with no WFD reporting obligations it can be generally recommended to use harmonised
interstate data sources, if available, instead of a combination of national data.
Fredrik Hannerz and Sindre Langaas, KTH Royal Institute of Technology
Needs Assessment and Conceptual Design for a Danube River Basin GIS System
49
3.2.3
Development of the GIS database
The database development should include the steps outlined below:
Identify user needs
Develop standards together with the GIS ESG
Inventory & acquisition of data
Harmonisation of data
Documentation and management of metadatabase
Dissemination
A number of meetings will be of high importance to support the development. These meetings are
plotted in the time chart and further explained in Appendix 4.
Concerning the responsibility for development of the GIS database there are some options. The GIS
database construction could be carried out by:
A consultant (Proposal 1)
A GIS resource person at the ICPDR permanent secretariat (Proposal 2)
An institute or authority at member state level (Proposal 3)
A research institute involved in GIS (Proposal 4)
Considering the contents of the database the technical outcome from the five options would probably
not be very different from each other as long as personnel with relevant GIS skills are contracted and
adequately coordinated by the GIS ESG. No matter who will do the work it should be done under
supervision of the GIS ESG that will see to that the interests of ICPDR are properly taken into account
during the whole process.
3.2.3.1
Proposal 1 Consultant
A consultant situated close to or far from Vienna could be hired to do the job.
Advantages
The consultant will not be involved in other ICPDR activities and will therefore not be able to carry
out upcoming tasks such as mapmaking and data collection (that could well be for a person at the
secretariat). The database will thereby more likely be finished in time.
Drawbacks:
The consultant will leave the database at the ICPDR but not the knowledge about how to construct
databases, how to work with it etc. Updating and further development of the database might
therefore be more difficult at a later stage.
A consultant cannot offer the same continuity of services as e.g. a national insitute.
3.2.3.2
Proposal 2 GIS developer at ICPDR permanent secretariat
Hiring a GIS developer skilled in GIS database and applications development is the option that will
bring the GIS database closest to the ICPDR, at least during the development.
Advantages:
Knowledge will be close to the secretariat and integrated into the organisation
ICPDR will increase its know-how about how to work with GIS
GIS database and future applications derived will be influenced by the transboundary focus at the
secretariat and the wide range of expert fields present there.
Long-term continuity
Disadvantages:
There is a larger possibility that a GIS resource person situated at ICPDR will be given other tasks
than the pure GIS database development. There is a large need for maps and other information
UNDP/GEF Danube Regional Project
50
products that will likely delay the development of the database and thereby all derived product of
the final database.
The GIS developer will be alone in the field at the secretariat. The broad GIS knowledge and
support present in a larger organisation working with GIS will therefore not be present.
3.2.3.3
Proposal 3 a member state institute or authority
A relevant institute or authority on national level could be an option, it has been done in other river
basins e.g. in the Rhine and Elbe river basin
In the Rhine river basin the database development is entrusted to a BfG in Germany, (Bundesanstalt
für Gewässerkunde). The Federal Environmental Agency in Vienna was mentioned during the user
needs assessment as another possible partner. Several of the national hydrometeorological institutes
would probably be well suited as well.
Advantages:
Continuity of service
Variety of experiences in the GIS field will probably solve most technical problems
Experience with land and water management related GIS activities
Drawbacks:
Little knowledge of GIS database construction will be transferred to ICPDR
3.2.3.4
Proposal 4 a research institute
A research institute with background in development of transboundary GIS databases and derived
applications could be an option for the development of the Database. The user needs assessment
present some research institutes involved in GIS activities in the Danube River Basin:
The EC Joint Research Centre having a long tradition of development GIS and remote sensing
applications for natural resources management
Leibniz-Institute of Freshwater Ecology and Inland Fisheries (IBG) in Berlin.
Both these institutes are involved in transboundary modelling (flood forecasting and nutrient transport
modelling) with GIS for the whole Danube River Basin. They thus have a good understanding of what
type of information is needed for transboundary analysis. As they are actively involved in the
management on the Danube RB already they have good knowledge of the area, a contact network and
colleagues in various fields in the river basin already. The research background in these institutes
would probably give a very positive input to new RBM applications based on the GIS database.
Drawbacks of this alternative are:
Research institutes are meant to do research and are generally not that positive to commit
themselves to provide permanent services.
Knowledge of developing transboundary GIS databases is not necessarily transferred to the
organisation
3.2.3.5 Recommendations
In our recommendations, we would like to distinguish the period until end of 2004 from the time after.
Considering the short time frame until end of 2004 and the amount of work that needs to be done very
soon we would recommend ICPDR to contract a consultant/consultancy company to develop the
necessary GIS data and maps with a deadline in September 2004. It will be difficult to arrange a more
long-term solution before this date and at the same time produce the requested data and maps.
A long-term solution should be developed from 2004 and onwards. ICPDR would then need a solution
with more continuity in service than the one of a consultant. We believe that such continuity in
service, required skills and suitable professional background will be provided by either a national
institute/authority (such as a hydrometeorological institute) or by a research institute.
Fredrik Hannerz and Sindre Langaas, KTH Royal Institute of Technology
Needs Assessment and Conceptual Design for a Danube River Basin GIS System
51
3.2.4
Estimated resource needs
Development of harmonised transboundary GIS databases takes time and will thereby need some quite
substantial resources.
A rough estimate of the resources needed to develop the database is found in Table 12.
Table 12. Resource needs for database development, measured in man months
Timeframe Task
Minimum
database
Extended database
(WFD requirements)
SHORT
Development
2004
of database
6 man months
of maps
2 man months
MEDIUM
Development of a data
5 man months
2006
and metadata model
Development
18 man months
6 man months
of database
Direct costs
Data
10 000 Euro
5 000 Euro
LONG
Development
7 man months
7 man months
2009
of database
Data
5 000 Euro
5 000 Euro
Costs for GIS hardware and software are not included in the above listed resource needs. Such costs
will depend on choices concerning system solution, where to place hardware and database
development. A rough estimate of yearly costs for a modest GIS could be approximately some 12 000
Euro. This covers one licence of ArcIMS, ArcSDE and ArcInfo (source: ESRI Sweden). It does not
cover the whole cost of purchase of the software but only the yearly licences. Neither does in include
the cost of hardware costs. An initial purchase of hardware and software for such a modest GIS could
be approximately 50 000 Euro10.
3.2.4.1 Deliverables
The GIS database should be made available on the DANUBIS and on CD for public dissemination. If
by strong reasons the data cannot be published on the public part of DANUBIS it should be available
on the internal part and on a separate set of CDs. A description at the public site is recommended
explaining what data are restricted, together with an explanation to why it is restricted and where to
possible get the data via a licensing procedure
Metadata and documentation should be made available in HTML format and published on DANUBIS
together with download facilities of the GIS data.
3.3
Component 2.
Systems solution to exploit and disseminate
GIS data, derived information products and information services
10 Hardware cost 11 000, software cost 39 000 Euro
UNDP/GEF Danube Regional Project
52
3.3.1 Aim
To set up the database information environment so that it can be maximally exploited internally at
ICPDR and externally by various stakeholders inside and outside the Danube river basin.
3.3.2
Contents of the information environment
3.3.2.1
Development of an information package with derived digital maps and
statistics
The GIS database will be the base for any derived geographical information in the basin. All data is in
the database, still somebody needs to extract useful information from it. Many users have stated the
need for maps and statistics at several scales. The usability of nice looking graphics, more specifically
directed informative maps and selected statistics is hard to overestimate. No matter if this work is to be
carried out by the proposed resource person at ICPDR or by a consultant the person should have a
strong profile in map making. For an example of good practice map making for transboundary river
basins have a look at: http://www.grida.no/baltic/htmls/maps.htm where nice and informative maps of
the Baltic can be downloaded.
Resource needs: 4 man months + 2 000 Euro in direct costs
3.3.2.2
GIS resource person at the ICPDR secretariat
Several interviewees stated during the user needs assessment the need for a GIS resource person
situated at the secretariat. Duties for a GIS resource person would be:
Maintenance and updating of the Danube GIS and the link to DANUBIS
Ad-hoc preparation of derived material
GIS knowledge resource for the ICPDR secretariat, expert groups and member states
Having such a resource person would yield a quick response to upcoming needs for important updates,
changes in the information system and for derived products. He or she would further help the
secretariat and expert groups to develop useful GIS applications and to enhance the usability and user
friendliness of the database and information system.
Resource needs: a 50% duty
3.3.2.3 Web-GIS
solution
GIS services bundled with the Internet is an effective means to communicate spatial information
within and outside the organisation. The key added benefit of linking up with the Internet lies in the
ability to provide distributed access to GIS derived data and information and simple analytical and
map-making services to anyone connected to the Internet and equipped with a web browser. If
comparing the Danube River Basin with the Baltic Sea Drainage Basin several useful web-GIS
services can immediately be identified:
A driving forces, pressures, state, impact and response web site with comprehensive
information on causes and effects of pollution loads in the catchment. For en example see:
http://boing.fimr.fi/index.html
An easily used map making facility with base data such as land cover, administrative units,
cities, lakes etc. For an example see: http://maps.grida.no/baltic/
A service with pollution loads, investment programmes and pollution loads follow up. For an
example see: http://maps.grida.no/scripts/esrimap.dll?name=hotspots&cmd=map
To connect GIS software to web servers so-called Internet Map Servers have been developed by most
commercial GIS developers. Freeware alternatives exist as well. These map servers act as
communication bridges between stand-alone GIS software and databases and web servers. While in
principle they allow for full GIS analysis functionality, they are often tailored towards the simpler
functionalities offered by stand-alone GIS, such as zooming (in and out), panning, selection of specific
features.
Fredrik Hannerz and Sindre Langaas, KTH Royal Institute of Technology
Needs Assessment and Conceptual Design for a Danube River Basin GIS System
53
Resource needs: 4-6 man months depending on ambition. in addition to the web-server an Internet
maps server will be required. One alternative would be ArcIMS from ESRI priced at 14 000 Euro and
2 700 Euro per year in addition for maintenance, support and updates, starting from second year
(source: ESRI Sweden).
3.3.2.4
Optimisation of hardware and software
Optimisation of hardware and software will in the future be needed in some parts of the region. Some
collaborating institutions to ICPDR which would be of importance for filling the database with
national contents and which could be identified as potential important users of the database would
benefit from an upgrade of GIS hardware:
Computers
Digitising equipment
Storage capacity
Additionally some suitable software might be necessary:
Soft ware package suitable for GIS data analysis, digitising and data communication. It should
of course be compatible with the agreed format for communication of data within the Danube
GIS.
Resource needs: 0 - 150 000 Euro depending on ambition. An investigation on optimisation would
need to be done when further experiences with data collection, data creation and harmonisation within
the Danube GIS are gathered.
UNDP/GEF Danube Regional Project
54
4 GIS hardware and software considerations
Fredrik Hannerz and Sindre Langaas, KTH Royal Institute of Technology
Needs Assessment and Conceptual Design for a Danube River Basin GIS System
55
4.1
Hardware and software considerations introduction
In this chapter we try to identify existing technical structure concerning GIS hardware and software
and try to make some recommendations on those aspects for the Danube River Basin GIS.
Current software and hardware were assessed mainly with help of two existing questionnaires sent out
and analyses during 2002, namely the survey on the ICPDR information system (DRP 2002) and data
exchange and data inventory questionnaire (GIS ESG 2002).
4.2 Hardware
Hardware technology changes constantly. Computer power is enhanced, storage capacity grows and it
also gets cheaper with time. Any recommendations on GIS hardware are bound to be outdated before
the organisational set-up required for a large GIS initiative is in place. As hardware becomes cheaper
the issue becomes less important to emphasize on during the design phase of a GIS. Therefore we will
in this report not go deep in this issue.
A minimum hardware requirement for an organisation working with GIS analysis, GIS data input and
GIS data dissemination could be:
A server for sharing and storage of data
Desktop computers
Colour and/or monochrome printer
Digitiser
Scanner
GPS unit
A stable and fast internet connection
Are these requirements generally fulfilled in the Danube region? In 2002 the Danube Regional Project
carried out a survey about the DANUBIS and the user experiences of the system, availability of
hardware and software and the Internet connection at user institutions. 60% of the active users of the
Information System answered the survey. It did not specifically assess relevant GIS hardware and
software but the survey answers some important questions concerning relevant equipment and Internet
connections. The survey has resulted in an improvement of hardware at some of the institutions
participating in the survey. Some countries/institutions were identified as having too poor hardware
infrastructure and some resources were therefore used for the improvement of that. Below statements
were made before current hardware improvement were carried out.
Concerning hardware it was concluded that
the average user has exclusive access to a Desktop PC, which is equipped with a 500 MHz
processor, 128 MB memory, 10 GB hard disk, a 17" monitor with a screen resolution of 800x600
pixels, as well as a b/w laser printer.
and concerning Internet connection:
85 % of the users connect to the internet via a Local Area Network.
Download rates vary widely, not only from country to country, but also within the countries. 20%
of the users only achieve download-rates of up to 5 KB/s and 40% of more than 30 KB/s, the rest
is in-between.
The average hardware as outlined by the survey will not really boost the functionality of the GIS
system nor will it be the bottleneck for a well functioning GIS system (as outlined in the report on
conceptual design of the Danube River Basin GIS). Internet connections are probably a more serious
problem for the effective communication needed for a well functioning Danube GIS. Low Internet
connection speeds in parts of the drainage basin call for information and data exchange based on CDs
as an alternative to web-based dissemination.
4.3 Software
UNDP/GEF Danube Regional Project
56
Current use of GIS software was analysed in the questionnaire "Inventory of GIS and Cartographic
Presentation of Spatial Information" part "GIS and database". Distributed by the GIS ESG in 2002.
The questionnaire tries to assess what kind of GIS software (for analysis, storage and distribution) that
is used in ICPDR member countries. The questionnaire is not supposed to cover the use in the whole
member countries but only what is used at authorities linked to the members of the GIS ESG.
Answers are not yet analysed and does not cover all countries in the Danube Drainage Basin. As the
answers of the questionnaires do not cover all countries of institutions/authorities involved in the
Danube GIS work extracted information on the use of GIS software is only a good indicator of the real
usage. Relevant information from available answers included in table 13 below.
Table 13. Results from questionnaire "Inventory of GIS and Cartographic Presentation of Spatial Information"
part "GIS and database"
What is your main GIS- Do you use other GIS-
Country
system?
programs?
Database Data
formats
ArcView, Intergraph
Austria Intergraph
MGE
Oracle, MS-Access
Shape, Designfiles, Dxf...
Geomedia
Bulgaria Arc/Info
ArcView,
MapInfo
Arc/Info ArcView, MapInfo
Bulgaria
Arcinfo, Arcview
Arcview and Arcinfo exportfiles
Croatia
Arcinfo
ArcView
No
E00, Shapefile, coverage
Czech Republic Bently's
ArcView
Oracle
DXF, ASCII, Shapefile
ArcInfo, ArcView IMS,
ArcInfo coverage, Shapefile,
Germany ArcView
Oracle, Access
GeoCad
SICAD-SQD, DXF,DGN
Microstation, CAD
Hungary Arcinfo,
Arcview
Oracle, access
DGN, DXF, coverages, shapefile
system, Mapguide
Romania
Idrisi,
Geo-Media, MicroStation Geo-Media, Access
DXF, TRC/GPS data, DWG
Slovak Republic Arcinfo, Arcview
INGRES, SYBASE
.dbf .txt .xls
Slovenia
Arcinfo, Arcview
Oracle
E00, Shapefile, DXF
The dominance of ESRI based software packages (ArcGIS, Arc/Info and ArcView) is not total but
large. With one exception only, being Romania, institutions either use ESRI software or state that they
regularly export files using ESRI specific file formats. Romania using mainly Idrisi will not have any
problems in exporting and importing ESRI file formats.
Some of the most frequently used and relevant software in the region as outlined by the survey are
described below.
4.3.1 ESRI
products
Recognized as the leader in GIS software, it's been estimated that about seventy percent of GIS users
use ESRI11 products. ESRI overhauled their software packages into an interoperable model called
ArcGIS. The three main GIS software packages available from ESRI are: ArcInfo/ArcView 8.x,
ArcView 3.x and ArcIMS.
ArcInfo was the first software product available from ESRI and is also the most comprehensive
analytical and mapping software offered by ESRI.
ArcView 3.x is the original desktop solution offered by ESRI as an out-of-the box desktop
mapping software product for the end user. More user friendly than ArcInfo, ArcView's editing
11 ESRI - www.esri.com
Fredrik Hannerz and Sindre Langaas, KTH Royal Institute of Technology
Needs Assessment and Conceptual Design for a Danube River Basin GIS System
57
and data manipulation capabilities are extended with each update. In addition, ESRI has developed
plug-ins called extensions which add to the functionality of ArcView.
ArcIMS is a relatively young product from ESRI designed to create out-of-the-box web mapping
but also allowing developers to create more involved, custom browser-based mapping
applications.
4.3.2 Idrisi32
Idrisi3212 is a popular desktop raster GIS and Image Processing system. It is developed and distributed
on a non-profit basis by the Clark Labs, a project within the Graduate School of Geography at Clark
University in Worcester.
4.3.3 Intergraph
Intergraph13 makes several GIS applications. Most of the GIS packages are designed with an Open
GIS in mind and therefore can work with a variety of other GIS software formats. Currently in Version
4.0 the GeoMedia family is made up of following four components:
GeoMedia is the information integrator, serving as a visualization and analysis tool and as an open
platform for custom GIS solution development.
GeoMedia Professional is a product specifically designed to collect and manage spatial data using
standard databases.
GeoMedia WebMap is a Web-based map visualization tool with real-time links to one or more
GIS data warehouses.
GeoMedia WebEnterprise creates dynamic, custom web-mapping applications that can analyse
and manipulate geographic data.
4.3.4 MapInfo
A leading competitor is MapInfo which produces a suite of GIS software. MapInfo Professional is
their leading GIS product containing the most advanced analytical tools. MapInfo also offers plug-ins
called add-ons to enhance the functionality of MapInfo Professional. For the development side,
MapInfo offers Map-X. Through an Active X component, developers can embed mapping applications
into other applications such as Excel.
4.3.5
Pricing of GIS software
The pricing of GIS software varies widely form country to country (personal communication Karina
Nylin, ESRI Sweden) depending on the general price situation in respective country. The largest price
difference however is between research and educational institutions contra commercial actors and
authorities. The discount on ESRI products for research and educational institutions is in the range 80
90 %. A full (including all components) single user licence of ESRI's flagship ArcGIS would cost
about 50 000 Euro in Sweden, while an institution involved in education or research would pay only
10 % of that amount. ArcView, ESRI's most widespread software is more modestly priced at about
2400 and 400 Euros respectively (Arcview 8.1).
4.4
Conclusions and recommendations
Some general conclusions can be made based on the information in this report:
Hardware and software issues should not be viewed upon as the bottlenecks of a Danube GIS.
Problems are today generally solved at low costs compared to other costs of the information
system (e.g. salary, office rental, meetings, database development etc.)
Needs for hardware and software will become visible during the implementation phase. In this
early stage it is difficult to know exactly who will be the most suitable organisation or person to
carry out parts of the work and to assess the needs from all these partners is even more difficult.
12 IDRISI32 is described at Clarklabs' web page - www.clarklabs.org
13 Intergraph - http://imgs.intergraph.com/
UNDP/GEF Danube Regional Project
58
The choice of software is important to the user rather than the system, most important being the
user's experience with the software on beforehand. As long as the software enables
communication with others users of Danube GIS and include basic functionality common in most
modern GIS software there is really no problem in choosing whatever appeals the user/host
institution the most.
Considering the dominance of ESRI produced GIS software in the region we would recommend
the use of ESRI standards for communication between users of the Danube GIS. Practically
shapefiles, coverages, ESRI interchange files, alongside with ESRI grids could be used.
Fredrik Hannerz and Sindre Langaas, KTH Royal Institute of Technology
Needs Assessment and Conceptual Design for a Danube River Basin GIS System
59
5 Evaluation of EuroGlobalMap
Picture source: EuroGeographics
UNDP/GEF Danube Regional Project
60
5.1
Evaluation of EuroGlobalMap introduction
EuroGlobalMap (EGM) is an initiative from EuroGeographics14 with objective to compile a European
base map on the sale 1:1 000 000. The project runs in parallel with an attempt to also construct a base
map on the 1:250 000 scale, EuroRegionalMap. ICPDR have now signed an evaluation licence of
EGM for the coming two years. In the light of the evaluation it is of importance to point out some
positive and negative features of the data and the use of it.
Most important for the understanding of the EGM data is to understand how the data was created and
what usage rights possible users have. EGM is a composite data set, compiled using a "bottom-up"
approach. National Mapping Agencies in every covered country is required to contribute with their
part of the covered area. This is a reasonable approach as is it to some degree ensures the user that the
most reliable and up-dated background data is used for the database. However, data on the national
scale used to construct something at the larger scale will inevitable result in a patchwork of data with
more or less varying characteristics. Every mapping agency have their own definition of large and
small roads, rivers contra streams, city contra village etc and these definition are the reason for the
varying characteristics in the data that also have implication on the use of the data and the results of
analysis based on the data.
When analysing the suitability of the EGM we choose to distinguish between needs stated in the user
needs assessment and data needs for GIS-based large scale analysis. We also try to assess the possible
hindrances for making EGM publicly available since the data have strict user right attached to it.
5.2
Contents and relevance of EGM
Table 14 display the contents of the EGM data. It also contain information on whether the specific
data layers are required for WFD reporting, if it is suggested to be included in the Danube River Basin
GIS (both option 1 and option 2 in the conceptual design paper) and possible other data sources. The
point of making such a simple table is to assess whether the data covers many or few of the reporting
needs, if those needs can be covered by other sources and whether the data is more or less relevant for
the Danube GIS considering other needs than the reporting needs.
Table 14 show that only few layers in EGM are recommended to be included in a Danube GIS. There
are some very important layers, particularly the administrative boundaries, river network and named
locations but most of the layers are of lower importance for river basin management purposes.
14 EuroGeographics - http://www.eurogeographics.org/
Fredrik Hannerz and Sindre Langaas, KTH Royal Institute of Technology
Needs Assessment and Conceptual Design for a Danube River Basin GIS System
Table 14. Contents and evaluation of EGM
61
Required by Suggested for
Coverage Layer
Other possible data sources
WFD?
Danube GIS?
ADMINSTRATIVE BOUNDARIES
ADMIN
Administative boundary
Yes
Yes
Eurostat, DCW, Bartholomew
HYDROGRAPHY
WATER
Sea coastline
Yes
Yes
World Vector shoreline, DCW, Bartholomew
Inland shoreline
No
No
River/Stream
Yes
Yes
Eurostat, DCW, Bartholomew
Canal
No
Yes
Bartholomew
Ditch
No
No
Sea water
No
No
Foreshore
No
No
Island
No
No
WVS, DCW
Lake
Yes
Yes
Bartholomew, DCW
Reservoir
If large enough
If large enough
River/Stream, polygon
No
Yes
Bartholomew
DAMWE
Dam/weir
No ?
Yes
SPRIN
Spring/waterhole
No
No
GLACI
Borderline of an ice feature
No
No
Corine LC
Help Line
No
No
Glacier
No
No
Corine LC
Ice peak
No
No
Ice shelf
No
No
Snow field / Ice field
No
No
Corine LC
FICRI
River / Stream (fictous)
No
No
TRANSPORTATION
Railway
No
Yes
Bartholomew and possibly DCW
Road
No
Yes
Bartholomew and possibly DCW
Ferry route
No
No
Railway station
No
No
Border crossing point
No
No
AIRPO
Airport / airfield
No
No
DCW, Bartholomew
No
BUILT-UP AREAS
SETTP
Buit-up areas as a point
No
Yes
CITYA
Buit-up areas as an area
No
No
Corine Land Cover
ELEVATION
ELEVP
Height point
No
No
ELEVA
Relief portrayals
No
No
USGS, Hydro1K
NAMED LOCATIONS
NAMES
UNDP/GEF Danube Regional Project
62
5.3
Evaluation of EGM based on stated needs in the user needs
assessment
"We need maps"
Concerning mapmaking EGM is probably a good choice. Discrete and well-defined data are relatively
harmonised, there are a lot of named locations in several languages and the data will be updated with
time. There will be no copyright problems with publishing and dissemination of paper maps with
EGM data as long as the source is acknowledged.
"We need a system on the overview scale"
In the user needs assessment intended users of the GIS database stressed the importance of a Danube
GIS on the overview scale, at least initially. The scale of EGM is 1:1 000 000, which likely correspond
to the overview scale mentioned by the users. This scale is probably suitable for a Danube GIS. In
section 1.4 of the technical documentation of EGM it is acknowledged that the positional accuracy of
the data depends on the accuracy of the source data, recommended position accuracy is 1000 meters or
at least better than 2000 meter according to the technical documentation. Some people might think that
1000 - 2000 meters is a large error but for management of the huge Danube drainage basin this
accuracy is enough for most applications.
"We need a centrally initiated and developed GIS database"
The choice between EGM and other available data sources, e.g. the GISCO database will not make a
big difference regarding this need. EGM, GISCO, Digital Chart of the World are all relatively
harmonised and are thus suitable for a centrally initiated database as very little time will need to be
spent on data harmonisation related work.
"We need public access"
There are strict user rights attached to EGM. The user, ICPDR, will by no means be able to
disseminate the vector data freely to third part. ICPDR will however according to the EGM licence be
able to give user rights to cooperative bodies in the region such as national institutions, consultants
and even research programs cooperating with the ICPDR and having a need for working with the
EGM data. Groups with less obvious links to ICPDR such as groups within education, media, NGOs
and the public will have difficulties accessing the data. Why is that a drawback?
Promotion of easily accessible and relevant data leads to an increased use of GI technology, which
will affect the future success of drainage basin management.
Groups not accessing the data will inevitably start working with other data sources leading to
some double work being done and several geographical definitions used for the same features
Users not accessing the data as such and/or users not having enough GIS skills will likely benefit from
having various web-GIS services as described in "towards a Danube River Basin GIS: A conceptual
design". It is not fully clear if the EGM licence will allow ICPDR to publish the data via web-GIS.
Usually such a licence would cost a lot more in addition to a traditional multi-user licence. The licence
however allows publication of pixel-based graphics, e.g. raster maps. If this is true and with no
exceptions the data could in theory be rasterised to a very high resolution raster data set and
disseminated. For most users somewhat skilled in GIS it would not make a bit difference weather the
data is in vector or raster format as the conversion between the formats is a relatively simple task.
Attribute files can be made available separately and can then be linked to downloaded data by the user
after vectorisation. Such actions would however not likely be actively supported by EuroGeographics.
The discussion lead to two important questions that ICPDR need to sort out with EuroGeographics:
What rules apply to the use of EGM for web-GIS applications? Are all kinds of web-GIS
application already supported by the evaluation licence and will they be after the evaluation period
has expired? If not, what will the costs be?
Very specifically, what types of graphical formats and raster formats of the data can be placed in
the public domain and what is, if any, the maximum resolution of such graphics or raster files?
Fredrik Hannerz and Sindre Langaas, KTH Royal Institute of Technology
Needs Assessment and Conceptual Design for a Danube River Basin GIS System
63
5.4
EGM for spatial analysis
EGM is a bottom-up approach data set and is therefore somewhat of a patchwork of data with more or
less varying characteristics. Every mapping agency have their own definition of large and small roads,
rivers contra streams, city contra village etc and these definition are the reason for the varying
characteristics in the data that also have implication on the use of the data and the results of analysis
based on the data. In this section we choose to distinguish between discrete and well defined
geographical objects such as administrative boundaries and coastlines and more vaguely defined
objects/data such as a river, soil data, population data etc. that depend very much on different
definitions and classification procedures.
A river is an example of a vaguely defined object; their characteristics are generally not of high
interest to the general public. No international standards have been elaborated for the mapping of
streams and rivers. Therefore no real effort has been put into harmonised mapping of these objects.
Differences between rivers, streams, ditches etc are by no means clearly defined. On a national level
definitions may be present but not always and there are clear differences in how these objects are
defined in different countries. These differences may create problems for a regional analysis based on
the data.
A study from the Baltic Sea Region (Hannerz 2002) assessed the implications of these vaguely defined
objects on river basin management. The study clearly showed that these ill-defined objects could
mislead a potential user if used on the aggregated scale such as the Baltic or Danube scale. It was
shown that the bottom-up approach datasets (EGM) were highly unsuitable for some applications due
to its low degree of harmonisation.
The aim of the study was to assess if different definitions of streams and rivers within and between
GIS data can give implications on important indicators derived from the GIS data. Drainage density,
defined as the sum of lengths of all rivers divided by area, was chosen as an example of such an
indicator. Drainage density has become an important landscape characterisation indicator now widely
used in hydrological, geomorphological and soil science applications. It can be derived using standard
GIS, which is likely the reason for the increase in usage of the indicator. The density of streams can be
seen as an indicator of how easily nutrients will be transported from a point in the landscape to the sea.
The higher density there is the faster a particle will be transported via the streams downstream towards
the sea. Measuring drainage density is therefore a tool for diffuse and point source apportionment.
For the study MapBSR15 (a sub-set of EGM for the Baltic states) was used as an example of a non-
harmonised bottom-up approach data set while Digital Chart of the World16 was used as an example of
a harmonised top-down approach data set. Results were compared and analysed using expert
knowledge about the physical characteristics of the region. The results were very different from each
other. Analysis based on the MapBSR (EGM) gave high drainage densities in flat areas of the
southeastern part of the basin while it gave very low densities in the northwestern part. Expert
knowledge concluded that the actual drainage density was rather the contrary. DCW on the other hand
gave results on drainage densities very similar to the results form expert knowledge. If the two sources
had been used simultaneously in management situation for e.g. an assessment of nutrient, metal or
other important fluxes with a substance flow model using drainage density as an input parameter they
would probably have yielded very different outputs. One can thus conclude that it is very important for
some applications at this scale to use harmonised input data.
Why is this important for the ICPDR? Many applications on the Danube scale for example flood
forecasting, modelling of nutrients, metals and other substances etc need harmonised data covering the
whole drainage basin rather than more detailed non-harmonised data from national data providers.
This problem does not only apply to river network but many other important data for analysis of
pressure and impact such as soils data, hydrogeology, Canals, ditches, lakes etc, all being subject to
differing classification schemes and definitions.
15 MapBSR - http://www.mapbsr.nls.fi/
16 Digital Chart of the World - http://www.maproom.psu.edu/dcw/
UNDP/GEF Danube Regional Project
64
5.5 Conclusions
EGM
One cannot simply say that EGM is suitable or not for a Danube GIS. It is highly suitable for some
purposes and definitely not suitable for some others. Different users will likely have varying needs for
harmonised data. For well defined features such as administrative boundaries the data set will be
suitable (considering only the quality of data) but for less well defined data it will be important to
include more homogenous data sources in the Danube GIS as an alternative.
A large benefit with EGM is that the data content is "official" data coming from national data sources.
ICPDR thereby leaves responsibility for the data content to EuroGeographics in for example
disputable land areas, which might otherwise be sensitive.
Spatial analysis - Using EGM for analysis will probably be okay as long as the analysis is based on
discrete and well-defined features of EGM such as the administrative boundaries. I other cases one
should bear in mind that EGM is not thematically harmonised.
Public dissemination If dissemination of raster files is allowed with the present EGM licence we see
no large drawbacks regarding EGM and the possibilities to disseminate the data alongside the
information to a general public. Some questions regarding dissemination to third part and web-GIS
publication still need answers since there is a large possibility that such publication might cost large
sums on top of the already available licence. This is important since ICPDR in the future very likely is
going to request some web-GIS services for map display via the web and other more interactive
information services via DANUBIS.
We would like to recommend ICPDR to work further with EGM but first: make very clear what
actually concerns dissemination of data to third part both via web and other media.
EGM benefits
Include some very important base data
"Official" data on administrative boundaries
Include updating
EGM drawbacks
It is a composition of national data and therefore not thematically harmonised
Only a few of the included GIS layers are relevant for RBM purposes
It is not a public domain dataset and will thereby have strict user rights. Public dissemination of
the data will probably be impossible.
Fredrik Hannerz and Sindre Langaas, KTH Royal Institute of Technology
Needs Assessment and Conceptual Design for a Danube River Basin GIS System
65
6 References
Brinkerhoff, R., Gill, S.1994. The learning alliance. San Francisco, CA: Jossey-Bass
Denisov, N. and L. Christoffersen, 2001. Impact of environmental information on decision-making
processes and the environment. UNEP/GRID-Arendal, Occasional paper 01. Arendal, Sweden.
URL: http://www.grida.no/impact/.
DANUBS 2002. Nutrient Management in the Danube Basin and its Impact on the Black Sea
(DANUBS) Executive summary for the period 02.2001-01.2002
Gotlieb, C. C. 1985. The economics of computers: Costs, Benefits, Policies and strategies. Prentice
and Hall, New York.
GWP. 2000. Integrated Water Resources Management. TAC Background Papers No 4, Global Water
Partnership, Stockholm, 67 pp.
Hannerz, F., Langaas, S., Nilsson, S. and Tian, Y. 2002. A multi-thematic GIS database of the
transboundary Narva River / Lake Peipsi catchment in support of strategic science and
management applications. Report 8a, MANTRA-East project. Publisher: KTH Royal Inst of
Technology, Sweden. 50 pages.
Hannerz, F. 2002. Harmonisation and applications of transboundary geographic databases of the Baltic
Sea Region: drainage basin characterisation. KTH, Royal institute of Technology. 79 pp.
Huxhold, W. E., Levinson, A. G. 1995. Managing Geographical information systems projectsOxford
University Press, New York.
IMPRESS WG. 2003. Guidance for the analysis of pressures and impacts in accordance with the
Water Framework Directive. Guidance Document prepared by WG IMPRESS. Available online
at http://forum.europa.eu.int/Public/irc/env/wfd/library
Kammerud, T.A. (1997), Geographical Information Systems for International River Basin
Management in The Third World, Resource and Environmental Geography, University of Oslo,
Serie A, No. 17, 195pp, ISBN 82-7648-018-7
Kraemer, K.L., King, J.L. and Dunkle, D. and Lane, J. 1989. Managing Information Systems: Change
and Control in Organizational Computing. San Fransisco, Jossey Bass.Gupta, K. 1999. A
practical guide to needs assessment. San Francisco, CA: Jossey-Bass
De Roo, A.P.J., 1999. LISFLOOD: a rainfall-runoff model for large river basins to assess the
influence of land use changes on flood risk. In: Balabanis, P. et al. (Eds.), Ribamod: River Basin
Modelling, Management and Flood Mitigation. Concerted Action, European Commission, EUR
18287 EN, pp. 349357.
Schmuck et al 2002. G. Schmuck, A. de Roo, J. San-Miguel and J. Meyer-Roux E. Schulte, F. J.
Molitor and P. Bucella. Coordination during Disaster Management. EU support and actions
related to floods and forest fires. Presentaion at Civil Protection Forum Nov. 2002.
Wateco WG. 2002 Economics and the environment. The implementation challenge of the Water
Framework Directive. A guidance document. Available online at
http://forum.europa.eu.int/Public/irc/env/wfd/library
Vogt, J. (Chairman) 2002. Guidance Document on Implementing the GIS Elements of the WFD.
Water Framework Directive (WFD) Common Implementation Strategy Guidance Document
prepared by WG GIS. Available online at http://forum.europa.eu.int/Public/irc/env/wfd/library
Witkin, B. R., & Altschuld, J. W. (1995). Planning and conducting needs assessment: A practical
guide. Newbury Park, CA: Sage.
Wulff, Fredrik, Bonsdorff, Erik, Gren, Ing-Marie, Johansson, Sif, Stigebrandt, Anders. 2001: Giving
Advice on Cost Effective Measures for a Cleaner Baltic Sea: A Challenge for Science. AMBIO:
A Journal of the Human Environment: Vol. 30, No. 4, pp. 254259.
UNDP/GEF Danube Regional Project
66
Fredrik Hannerz and Sindre Langaas, KTH Royal Institute of Technology
Needs Assessment and Conceptual Design for a Danube River Basin GIS System Appendix 1
67
Appendix 1-Letter of introduction - Danube GIS needs assessment
River basin information in the form of maps or GIS data has an important role to play in Integrated
River Basin Management. The EU Water Framework Directive explicitly requests Member States to
create maps using GIS technology in their reporting to the European Commission, as well in the
development of River Basin Management Plans. Some tasks that can be strongly supported by GIS
beyond the mandatory reporting is the river basin characterisation, pressure and impact analysis and in
conjunction with the Internet for public outreach and consultation purposes.
For the transboundary Danube River Basin District, all countries cooperating under the DRPC have
stated their firm political commitment to support the implementation of the WFD in their countries
and to cooperate in the framework of the ICPDR to achieve a single, basin-wide coordinated Danube
River Basin Management Plan. Consequently, the ICPDR made inter alia the following resolutions at
its 3rd Plenary Session on November 27-28, 2000 in Sofia:
· The implementation of the EC Water Framework Directive is considered as being the highest
priority for the ICPDR
· The ICPDR will provide the platform for the coordination necessary to develop and establish
the River Basin Management Plan for the Danube River Basin.
· The Contracting Parties ensure to make all efforts to arrive at a coordinated international River
Basin Management Plan for the Danube River Basin.
In response to the need for GIS tools in preparing a Danube River Basin Management Plan under the
WFD, the potential need for GIS in other ICPDR tasks, as well as other WFD requirements, the
ICPDR has established a GIS Expert Sub-Group (GIS ESG) within the frame of its River Basin
Management Expert Group. The GIS ESG is currently developing an issues paper "Development of a
Danube GIS for WFD Implementation" that describes the strategy and the implementation steps for
the development of a Danube GIS. In order to support the development of this paper the GIS ESG,
with financial support from the UNDP/GEF Danube Regional Project, has assigned us, a team from
the KTH Royal Institute of Technology, Stockholm, to inter alia carry out a needs assessment for a
GIS database and information system in the Danube river basin. The purpose of this assignment is to
gain a clear understanding of the ICPDR's needs for a Danube River Basin GIS database and system,
and thereby facilitate the development of an implementation proposal. At this preliminary stage we
envisage an implementation proposal that will focus upon four aspects:
1. A technical proposal for the initial development of a harmonised multi-thematic GIS database
primarily to meet the WFD implementation requirements and other ICPDR needs including
public outreach.
2. A organisational proposal for how this GIS database best can be updated and managed in a
sustainable way over time
3. An organisational and technical proposal for how the GIS database best can be exploited by
the various expert groups, other groups and stakeholders to produce management and
decision-support relevant information. Likely alternatives are either as a centralised GIS
solution at the ICPDR PS or elsewhere, or as a decentralised solution, or as a combination of
both.
4. Assuming a decentralised solution; a proposal for capacity building efforts for specific groups
and Contracting Parties with limited GIS capacity so that they be able to exploit the GIS
database for their ICPDR related purposes.
Objectives for the needs assessment
The objectives are to assess the needs of the ICPDR for the development of a Danube GIS in
cooperation with the GIS ESG, the ICPDR PS as well as other ICPDR Expert Groups.
The assessment should identify GIS needs:
UNDP/GEF Danube Regional Project
68
of the ICPDR for meeting WFD requirements
for other RBM tasks
for other ICPDR activities
Why do we contact you?
Besides reviewing various relevant documents such as WFD Guidance Documents and various ICPDR
documents, we would like to conduct semi-structured interviews with relevant representatives of
various ICPDR Expert Groups, the ICPDR Secretariat and some other key actors supporting the work
of ICPDR that may have constructive ideas on the GIS data and information needs in light of the
above objectives. In the enclosed list below you will see whom we plan to interview as representatives
from the various groups. You are identified as a relevant representative for your group for one or more
of the following reasons:
You are one of the key persons in the ICPDR organisational structure
You are identified as having insight into GIS information needs in your expertise area
You represent an NGO, research group or other external group likely to show high interest in
Danube wide environmental information.
How and when do we want to conduct the semi-structured interview with you?
We would like to contact you by phone sometime in the period 8th of April 15th of April for the
interview. We expect that the interview will take around 30 minutes to conduct. For you to be
prepared, we attach a set of questions that will guide the interview and allow you to reflect on
beforehand. In an attached excel sheet you will find a suggestion for the GIS database contents. The
list will be central during the interview, so if you have the possibility to read it though on beforehand
we would be very happy. As there are many interviewees on the list, we will simply proceed by
phoning you during the above period until we catch you at a time that suits you. If you are away on
missions for longer periods, we welcome an email (hannerz@kth.se) specifying when you cannot be
reached. If you would rather answer the enclosed questions via e-mail, please send the answers within
the same time period as assigned for the interviews alternatively as soon as possible to the same email
address as above.
What will happen with the results?
The results from the interviews will be included in the user needs assessment report that later on will
form the basis for the implementation proposal. These documents will become available through
Danubis and can also be sent you directly, if you so wish.
Best regards,
Sindre Langaas and Fredrik Hannerz
Fredrik Hannerz and Sindre Langaas, KTH Royal Institute of Technology
Needs Assessment and Conceptual Design for a Danube River Basin GIS System Appendix 2
69
Appendix 2 Interview questions
Information and data
GIS related information can consist of the GIS data but also of derived information such as maps,
cartographics and statistical tables. The usability of these products differ depending on the users
expertise field and the characteristics of the data (scale, thematic content etc).
GIS data
What types of GIS data does your group possess today?
How do you use it?
Does your group collect any data (not only GIS formatted data but also any kind tabulated data)?
If so, what data is collected and how?
Is the data, or could it be, made publicly available in some format?
Do you except GIS data also use maps, cartographics or statistical tables for your work?
If you were able to freely choose additional data and information, not considering if it is available or
not, to support your group activities, what would that be?.
If such data was available, would that improve the results from your group and do you think it would
contribute to good river basin management?
Attached to the mail is a list with suggestions of with data layers could be included in a Danube GIS.
Do you miss any layer?
Do you have other comments to the list?
Information Systems
A GIS can be set up in different ways. Traditionally the "stand-alone" GIS is used where data and
software is stored locally on a computer and used by the GIS expert. An alternative is to use a webGIS
approach where all users have access to a common GIS database via a web interface.
Would your group benefit from having a central web based GIS were data could be uploaded,
downloaded and distributed?
Do you think that the data and information contained in such a GIS should be publicly available?
One alternative to the "bottom-up" approach for constructing a database, i.e. putting together a
patchwork of national datasets into a Danube wide database is to use more coarse, but hopefully more
homogenous data for the whole region in.
How would your group benefit from having?
a)
A database with high spatial precision but low degree of harmonised data and
possibly data with a lot of user restrictions on it?
b)
A database with lower spatial precision but higher degree of harmonisation and
more freedom of use.
GIS training
In order to successfully work with a Danube River Basin GIS the users need to have enough GIS
skills. Skills required would include data handling (e.g. data editing, data harmonisation) meta data
compilation, data transformation and data analysis.
Considering the above stated requirements, do you think training is needed in your group?
If so, what kind of training and to what extent?
UNDP/GEF Danube Regional Project
70
Considering your group, do you think some of the country representatives in the group have larger
training needs than others in order to fulfil the requirements from a Danube GIS?
Fredrik Hannerz and Sindre Langaas, KTH Royal Institute of Technology
Needs Assessment and Conceptual Design for a Danube River Basin GIS System Appendix 3
71
Appendix 3: List of interviewees, user needs assessment
Following persons were interviewed concerning their respective groups GIS user needs.
Ms. Juliana Adamkova, Slovak Hydrometeorological Institute, member of the MLIM EG
Ms. Jasmine Bachmann, project manager Danube Watch.
Mr. Gabor Balint, chief scientific researcher at Vituki Consult Rt, member of the Flood Protection
EG,
Mr. Károly Futaki, Information Management & Admin Officer, ICPDR permanent secretariat.
Mr. Andy Garner, Environmental Specialist, UNDP/GEF
Mr. Detlef Günter-Diringer, WWF-Aueninstitut
Ms. Visnja Omerbegovic, chairman of the RBM/GIS ESG
Ms. Mihaela Popovici, Technical Expert on Water Management (Pollution Control), ICPDR
permanent secretariat.
Ms. Ursula Schmedtje, Technical Expert on River Basin Management at the ICPDR permanent
secretariat and member of the RBM EG
Mr. Anatoliy Shmurak, Ministry for Environmental Protection and Nuclear Safety, Ukraine, GIS
facilitator of the APC Expert Group
Ms. Heide Schreiber, PhD student, Leibniz-Institute of Freshwater Ecology and Inland Fisheries,
Berlin, co-worker in the Danubs research project
Mr. Ulrich Schwarz, FLUVIUS, technical support to the RBM/GIS ESG
Mr. Franz Überwimmer, Amt der Oberoesterreichischen Landesregierung, Linz, member of the
Emission Expert Group
Appendix 4: Some important next steps
Figure 10. Time chart for GIS database development until 2006.
Meeting
What? Purpose
Contents:
Comments:
u
n mber
Elaborate a final implementation strategy for
1 Final the DRB GIS until end of 2004 in order to
implementation produce necessary GIS data and maps.
strategy
meeting for the
period until
Development of a terms of reference for
end of 2004.
consultant
To get a broad agreement on purpose and
2-4 best practice presentations
2 Seminar
and
scope of a Danube GIS
by inspiring people actively
The seminar and workshop should be directed towards
workshop on
using GIS as a tool for European people involved in the transboundary aspects of river
the role and
transboundary river basin
basin management. National and Expert Group
use of GIS for
Visualise how GIS can be used for sustainable management
Facilitators could be the target group. Especially Expert
sustainable
transboundary river basin management. as a
Group Facilitators are in the position to know the
river basin
tool for analysis, visualisation and outreach
needs/tasks within the EGs.
management
Workshop on how the presented
Via a workshop educate and inspire river
ideas and others can be applied
basin managers to continue with GIS in the
to the Danube River Basin.
Danube RB.
3 Final To elaborate a final implementation strategy
implementation for the DRB GIS until end of 2006 based on
strategy
results from workshop, WFD requirements
meeting for the and proposed extensions of the Danube GIS.
period until
end of 2006
Gain experience from existing transboundary
4 A
planning
GIS database initiatives in the Danube River
A lot of relevant transboundary and DRB wide GIS data
meeting and
Basin
already exists developed for various purposes. It is of
workshop for a
highest importance to integrate available data sources into
few
the Danube GIS. Leibniz-Institute of Freshwater Ecology
stakeholders
To assess how existing DRB wide GIS data
and Inland Fisheries, Berlin involved in the Danubs
and
can be integrated into the DRB GIS.
project have developed a harmonised multi-thematic GIS
contributors to
database for the Danube River Basin already that is of
the Danube BD To integrate knowledge from applied GIS
very high relevance for the proposed database. Joint
GIS.
modelling projects in the region
Research Centre in Italy are involved in GIS integrated
modelling for the Danube and have a lot relevant data
covering the area as well. Another example is WWF
Aueninstitut where relevant floodplains data have been
derive for the Danube. GIS database
developer/developers, a few people from GIS ESG and
RBM EG, relevant representatives from the Danubs
project, JRC, WWF Aueninstitut should be invited to this
meeting.
To check the status of the GIS database
5 GIS
ESG
development
meeting with a
status report on
and evaluation
To discuss activities and applications to be
of the
developed after the initial database
development of development
the Danube RB
GIS so far.
To discuss upcoming questions concerning
data exchange, data access and WFD
reporting
To outline the continuation of the GIS
database until 2009.
To plan the Danube RB GIS launch.
6 Final To elaborate a final implementation strategy
implementation for the DRB GIS until end of 2006 based on
strategy
results from workshop, WFD requirements
meeting for the and proposed extensions of the Danube GIS.
period until
end of 2009
To present the GIS database to the ICPDR
7
Launch of the
EGs
GIS
database
developer,
ICPDR EG representatives,
Danube River
ICPDR PS, UNDP/GEF, relevant NGOs, database
Basin GIS
contributors.
To get publicity for the dissemination of the
database via DANUBIS
Media attention
Document Outline