

September 2004
ASSESSMENT AND DEVELOPMENT OF
MUNICIPAL WATER AND WASTEWATER
TARIFFS AND EFFLUENT CHARGES IN
THE DANUBE RIVER BASIN.
Volume 2: Country-Specific Issues and
Proposed Tariff and Charge Reforms:
The Czech Republic Case Study

AUTHORS
Lenka Camrova / IREAS, o. p. s.
TARIFFS AND CHARGES VOLUME 2

PREFACE
The Danube Regional Project (DRP) consists of several components and numerous
activities, one of which was "Assessment and Development of Municipal Water and
Wastewater Tariffs and Effluent Charges in the Danube River Basin" (A grouping of
activities 1.6 and 1.7 of Project Component 1). This work often took the shorthand
name "Tariffs and Effluent Charges Project" and Phase I of this work was undertaken
by a team of country, regional, and international consultants. Phase I of the
UNDP/GEF DRP ended in mid-2004 and many of the results of Phase I the Tariffs and
Effluent Charges Project are reported in two volumes.
Volume 1 is entitled An Overview of Tariff and Effluent Charge Reform Issues and
Proposals. Volume 1 builds on all other project outputs. It reviews the methodology
and tools developed and applied by the Project team; introduces some of the
economic theory and international experience germane to design and performance of
tariffs and charges; describes general conditions, tariff regimes, and effluent
charges currently applicable to municipal water and wastewater systems in the
region; and describes and develops in a structured way a initial series of tariff,
effluent charge and related institutional reform proposals.
Volume 2 is entitled Country-Specific Issues and Proposed Tariff and Charge
Reforms. It consists of country reports for each of the seven countries examined
most extensively by our project. Each country report, in turn, consists of three
documents: a case study, a national profile, and a brief introduction and summary
document. The principle author(s) of the seven country reports were the country
consultants of the Project Team.
The authors of the Volume 2 components prepared these documents in 2003 and
early 2004. The documents are as up to date as the authors could make them,
usually including some discussion of anticipated changes or legislation under
development. Still, the reader should be advised that an extended review process
may have meant that new data are now available and some of the institutional detail
pertaining to a specific country or case study community may now be out of date.
All documents in electronic version Volume 1 and Volume 2 - may be read or
printed from the DRP web site (www.undp-drp.org), from the page Activities /
Policies / Tariffs and Charges / Final Reports Phase 1.
TARIFFS AND CHARGES VOLUME 2

We want to thank the authors of these country-specific documents for their
professional care and personal devotion to the Tariffs and Effluent Charges Project.
It has been a pleasure to work with, and learn from, them throughout the course of
the Project.
One purpose of the Tariffs and Effluent Charges Project was to promote a structured
discussion that would encourage further consideration, testing, and adoption of
various tariff and effluent charge reform proposals. As leaders and coordinators of
the Project, the interested reader is welcome to contact either of us with questions
or suggestions regarding the discussion and proposals included in either volume of
the Project reports. We will forward questions or issues better addressed by the
authors of these country-specific documents directly to them.
Glenn Morris: glennmorris@bellsouth.net
András Kis: kis.andras@makk.zpok.hu
TARIFFS AND CHARGES VOLUME 2
A Case Study of Municipal Water System Management and the Impacts of Tariff and Effluent Charges
3
Vyskov, The Czech Republic
Table of Contents
Executive Summary ................................................................................................................................ 7
1. Introduction ......................................................................................................................................... 9
1.1. Purpose of the Pilot Case Study................................................................................................... 9
1.1.1. Develop a Case Study........................................................................................................... 9
1.1.2. Data....................................................................................................................................... 9
1.2. The Case Selected ...................................................................................................................... 10
2. Case Settings ..................................................................................................................................... 11
2.1. Service Area of the MU ............................................................................................................. 11
2.2. History of the Current Organization .......................................................................................... 14
2.3. The Current Organization .......................................................................................................... 14
2.3.1. Identification of Water and Wastewater Services............................................................... 14
2.3.2. The Relationship between MU, SUs and RUs.................................................................... 14
2.3.3. Identification of Conflicts among MU, RU and SUs.......................................................... 17
3. Current Operating Accounts of MU.................................................................................................. 19
3.1. Product Quality and Quantity .................................................................................................... 19
3.1.1. Water Production................................................................................................................ 19
3.1.2. Water Processing/Cleaning................................................................................................. 20
3.1.3. Water Distribution .............................................................................................................. 20
3.1.4. Water Purchased ................................................................................................................. 20
3.1.5. Water Consumption ............................................................................................................ 21
3.1.6. Wastewater Production....................................................................................................... 21
3.1.7. Wastewater Collection........................................................................................................ 21
3.1.8. Wastewater Processing ....................................................................................................... 21
3.1.9. Wastewater Effluent ........................................................................................................... 22
3.2. Prices and Other Financial Information ..................................................................................... 22
3.2.1. The Construction of Prices ................................................................................................. 22
3.2.2. Sales.................................................................................................................................... 23
3.2.3. Costs or Purchased Inputs................................................................................................... 23
3.2.4. Grants or Transfers ............................................................................................................. 23
3.2.5. Existing Contracts............................................................................................................... 23
4. Current Capital Accounts of MU ...................................................................................................... 25
4.1. Infrastructure Plant and Equipment ........................................................................................ 25
4.2. Valuation of Infrastructure......................................................................................................... 26
4.3. Capital Accounts........................................................................................................................ 26
5. Current and Capital Accounts of SU................................................................................................. 27
5.1. Current Accounts for Customers................................................................................................ 27
5.2. Capital Accounts for Customers ................................................................................................ 28
5.3. Profile of the Potential Customers ............................................................................................. 28
6. Regulatory Units ............................................................................................................................... 29
7. Tests of the Baseline Model (S1) ...................................................................................................... 30
8. Prospective Policy Developments in VaK Vyskov and their Representation in the ASTEC Models31
8.1. Short-Term Scenario with ,,Sunk Cost" + Price Calculation of VaK Vyskov........................... 31
8.1.2. Cost Recovery with Only Commodity Charges (S2)......................................................... 31
8.1.3. New Investment and With Cost Recovery (S4, S5)............................................................ 32
8.2. Short-Term Scenario with ,,Sunk Cost" + New Price Calculations ........................................... 33
8.2.1. Baseline (T1) ...................................................................................................................... 34
8.2.2. Cost Recovery with Only Consumption Charges (T2)....................................................... 34
8.3. Real Investments........................................................................................................................ 34
8.3.1. Costs Repair and of Infrastructure Replacement Included (U1)......................................... 34
8.3.2. Cost Recovery with Only Consumption Charges (U2) ...................................................... 35
4
UNDP/GEF Danube Regional Project
8.3.3. Full Cost Recovery with Mrginal Cost Pricing (U4, U5) ................................................... 35
9. Pilot Case Study Results Issues and Policies ................................................................................. 38
9.1. Charges Reform as a Result of Using the Model....................................................................... 38
9.1.1. Impact of the New Investment............................................................................................ 38
9.1.2. Impact of the Real Depreciation of the Infrastructure ........................................................ 39
9.2. Burden Indices of SUs ............................................................................................................... 40
Lenka Camrova/IREAS
A Case Study of Municipal Water System Management and the Impacts of Tariff and Effluent Charges
5
Vyskov, The Czech Republic
Abbreviations
ASTEC
Accounts Simulation for Tariffs and Effluent Charges
CZSO
Czech Statistical Office
CR
Czech
Republic
CZK
Czech currency (about 32.9 CZK is 1 Euro 12 February 2004)
EIB
European Investment Bank
EU
European
Union
MU
Management Units - municipalities or companies established or hired by
municipalities to run the system
PWSS&S
Public Water Supply Systems and Sewers - the official title for the MU in the Czech
Republic
RU
Regulatory Units, e.g. the government, Ministries and other offices of the public
administration which impose some regulation on the MU
SU
Service Users are households and businesses
VaK Vyskov Public Water Supply System and Sewerages in Vyskov (selected case site)
VK
Sewage system without treatment
WWTP
Water treatment plant
A Case Study of Municipal Water System Management and the Impacts of Tariff and Effluent Charges
7
Vyskov, The Czech Republic
Executive Summary
The Pilot Case Study for Water and Wastewater Management in the Czech Republic was developed to
examine the opportunities for, and consequences of, possible tariff and effluent charges reform in a
certain water and wastewater service area of the Morava River basin.
The case selected, the Vyskov public water supply system and sewers, represents an average Czech
management unit in the field of water and wastewater services. The analyses of its cost conditions and
decision-making processes regarding future investments helped us to discover some future issues
related to this public sector.
The Pilot Case Study focused mainly on two important cost factors: constructing sewage treatment
plans under the requirements of the EU directive and the impact of real investment needs to ensure the
sustainability of the whole system.
The testing of particular tariff changes was made by using ASTEC, a water spreadsheet model, which
can be considered as an important and useful tool for this type of analysis.
A Case Study of Municipal Water System Management and the Impacts of Tariff and Effluent Charges
9
Vyskov, The Czech Republic
1. Introduction
The Pilot Case Study constitutes a complementary part of the report: National Profile for Water and
Wastewater Management in the Czech Republic. It is focused on the practical functioning of Public
Water Supply and Sewers (PWSS&S) which provides water supply and wastewater services under the
conditions of the current regulation in the Czech Republic.
These analyses were developed under the auspices of the UNDP-GEF Danube Regional Project and
thematically belongs to components 1.6 and 1.7.
1.1. Purpose of the Pilot Case Study
The Pilot Case Study contributes to the analysis of water and wastewater tariffs and effluent charge
designs focusing on nutrient reduction and the control of dangerous substances in the Danube river
basin. The main purpose is to propose a possible country tariffs and effluent charges reform which:
a) enables the ongoing development of the water supply and sewage systems,
b) ensures service providers' financial stability ,
c) meets the environmental criteria stemming from the EU directives.
1.1.1. Develop a Case Study
The Case Study analyses the economic and environmental position of owners of the infrastructure and
service providers in the field of water supply and sewerage. The infrastructure owner is usually a
municipality, the service provider is a person contracted by the owner to provide water supply and
sewage services. Municipalities can run the system themselves.
Several existing forms of MUs can be divided up into 3 groups according to size and ownership.
These are described in the National Profile that accompanies this case study.
The Case Study use the water spreadsheet model to work with the empirical data from a particular
water supply and sewage system. As a result of this modelling, the possible institutional and financial
reforms can be proposed based on different scenarios, but in a realistic content.
1.1.2. Data
In the Czech Republic, the following sources of data are available on individual PWSS&Ss:
Czech Statistical Office (CZSO) provides information divided according to districts and regions. The
Census of Public Water Supply Systems and Sewers was executed in 2002. The study contains the
technical data of districts (length of pipelines and sewers, No. of people connected, water sources ...
etc.).
T. G. Masaryk Water Research Institute is the organization working under the Ministry of the
Environment. It annually publishes data on river basins and PWSS&S, where about 120 of the largest
companies are included. Data on PWSS&S is aggregated for the whole country.
Particular PWSS&S and their private statistics, financial and technical data represent an essential
source of required information. For the purpose of this study balance sheets, tariff calculations,
numbers on production and consumption were used.
Assumptions are important data sources as well. In the Case Study all assumed data are labeled in
italics.
In the pilot case study, all data are related to the year 2002, if it is not mentioned otherwise.
1
UNDP/GEF Danube Regional Project
0
1.2. The Case Selected
Name of the MU:
Vodovody a kanalizace Vyskov, a. s. (VaK Vyskov)
Translation:
Vyskov Public Water Supply System and Sewage, joint-stock company
In the considered territory, the Morava River basin, there are about 22 large MUs, which run under
different ownership structures and operate at diverse levels of infrastructure, which was mostly built
before 1989. From this point of view, the current joint-stock company VaK Vyskov operates over the
entire territory of the former Vyskov District State Company. This fact enables us to analyze the
current position of such a the context of the past level of district investments, which were planned and
financed by the Central Government.
In the Czech Republic tariffs on water supply and sewage are regulated. The country average is about
19.11 CZK/m3 for water and 15.61 CZK/m3 for wastewater, although these tariffs vary enormously
from company to company. In VaK Vyskov, the water rate is about 22.80 CZK/m3 and the sewage
charge is about 14.40 CZK/m3. That means VaK Vyskov charges roughly average tariffs. There are
many institutional and economic factors which influence the level of both tariffs charged by VaK
Vyskov and these will be discussed in the following chapters.
The criteria of MU selection:
a) location in the Morava River basin,
b) historical infrastructure links,
c) Czech average tariff level,
d) data accessibility.
Lenka Camrova/IREAS
A Case Study of Municipal Water System Management and the Impacts of Tariff and Effluent Charges
11
Vyskov, The Czech Republic
2. Case Settings
2.1. Service Area of the MU
VaK Vyskov administrates the whole territory of the former district Vyskov. Only one municipality
not in the district is connected to the system (Ujezd u Brna)
Map 1. The Location of the Vyskov District in the South-Moravian Region
The Vyskov district is a part of the South-Moravian Region. It covers a territory of about 889 km2,
where 5 towns and 77 villages are situated. It has about 86 400 inhabitants. The population density is
97 inhabitant/km2, which is below the average of the Czech Republic (131 inhabitant/km2). The capital
of the area (former district) is the town Vyskov with 22 400 inhabitants. Other towns and villages with
more than 1000 inhabitants are listed in Table 1 and labeled in Map 1.
1
UNDP/GEF Danube Regional Project
2
Table 1
Towns and Municipalities of the Vyskov District with Population up to 1000
Name
Status
Population
Bosovice village
1
073
Bucovice town
6
286
Drnovice village
2
171
Ivanovice na Hane
town
2 892
Krenovice village
1
755
Letonice village
1
438
Nesovice village
1
137
Otnice village
1
409
Pustimer village
1
532
Racice-Pistovice village
1
019
Rousinov town
4
929
Slavkov u Brna
town
5 893
Vyskov town
22
433
Total town
-
42 433
Total -
53
967
Source: Czech Statistical Office, 2002
Lenka Camrova/IREAS
A Case Study of Municipal Water System Management and the Impacts of Tariff and Effluent Charges
13
Vyskov, The Czech Republic
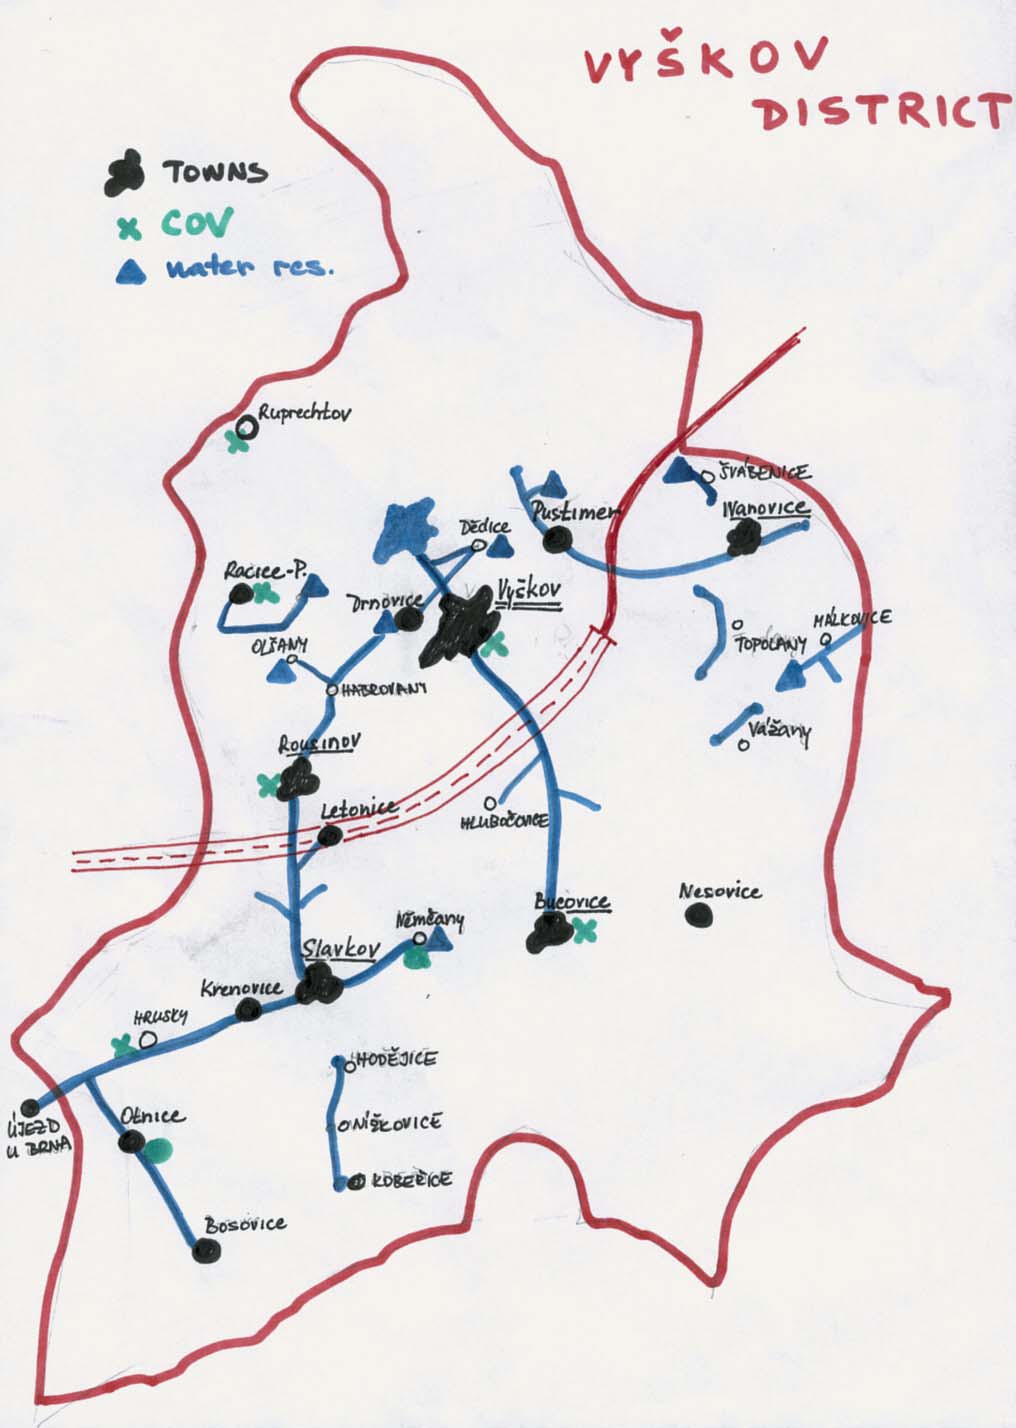
Map 2. Municipalities, Pipelines and Sewage Treatment Plants in the Vyskov District
pipelines
sewage treatment plans
water resources
towns
The population is mostly concentrated in the central part and in the Southwest of the service area. The
Northern part of the Vyskov district is covered by mountains (Drahanska vrchovina). There is a
motorway, which divides the territory into 2 parts the hilly area in the north and flatlands to the
south. As for water resources, there is a large surface reservoir, Opatovice, near the town of Vyskov
and about 15 sources of groundwater of which Dedice, Manerov and Drnovice are the most important.
1
UNDP/GEF Danube Regional Project
4
2.2. History of the Current Organization
The first pipelines in the area of the Vyskov district were built in Slavkov in 1932 and in the town
Vyskov in 1935. From 1955, these pipelines were administrated by the regional organization as public
property.
In 1960, there was institutional reform establishing districts as a second level of the government
administration. In that year, the Vyskov District Watercourse Administration was established for
providing water supply and sewage services. In the following 20 years, large investments into
improving quality and enlarging the network of pipelines and sewers were made. The construction of
the large surface water reservoir in Opatovice had been initiated, the first sewage treatment plants
were constructed.
In 1977, the district organization was assimilated by the South-Moravian Water Supply Systems and
Sewerages within the government idea of the central management of the whole public water service.
This idea of successfully managing 6 large state PWSS&S was not fulfilled.
After 1989, the South-Moravian state company entered into the second wave of voucher privatisation.
It was partly privatized according to the proposal of the Vyskov district towns and municipalities. In
1993, the VaK Vyskov was established as a joint-stock company. VaK Vyskov is considered to be a
"integrated" company, because its ownership consists of both, infrastructure and operating property
such as trucks, pumps, etc. (type one from Chapter 1.1.1.). Both Mayors and the management are
represented on the company Board.. VaK Vyskov owns about 360 km of pipelines, 385 km of
sewerages, 3 water processing plants and 7 sewage treatment plants.
2.3. The Current Organization
2.3.1. Identification of Water and Wastewater Services
Water supply and wastewater services represent the major part of the company's activities. Besides
that, the following services are provided:
- construction works in the field of water management,
- consulting and project creation in the field of water management,
- laboratory testing of water quality.
These services represent about 8% of company revenues.
2.3.2. The Relationship between MU, SUs and RUs
2.3.2.1. Economic Relationships
VaK Vyskov provides water supply and sewage services to all inhabitants and businesses connected to
public pipelines and sewage networks. The services are provided on the basis of individual contracts
between VaK Vyskov and consumers. Prices (water and sewage tariffs) as well as their calculation
must be published annually according to the form set by the Ministry of Agriculture. Manner of the
tariffs and supporting calculation have to be sent to a customer whenever requested. If a customer does
not pay for the service for more than 30 days from the invoice's delivery, the MU is allowed to cut off
their service.
VaK Vyskov has to pay fees for withdrawing surface water, groundwater and discharging wastewater.
These payments have got a different status:
Lenka Camrova/IREAS
A Case Study of Municipal Water System Management and the Impacts of Tariff and Effluent Charges
15
Vyskov, The Czech Republic
1. Payments to Cover Watercourse and River Basin Administration is a price belonging to
the River Board Morava for withdrawing surface water. River Board Morava sets this price
per m3, the current price is about 2.70 CZK/ m3.
2. Charges for the Withdrawing Groundwater are established by the Water Act. For the
purpose of drinking water supply, there is a rate of 2 CZK/ m3. Half of the payment belongs to
the Czech State Environmental Fund and the second half to the State Budget. Until 2001,
PWSS&S had an exemption and were not subject to any payment. So only a charge of about
0.70 CZK/m3 was paid in 2002 and about 1.40 CZK/m3 in 2003. Next year in 2004 the charge
for PWSS&S should be the maximum declared sum.
3. Fees for the Discharge of Wastewater into Surface Water are: a Fee for Pollution of the
Discharged Wastewater calculated according to particular pollutants (see the National Profile
Report), and a Fee for the Volume of the Discharged Wastewater which is paid if the volume
of wastewater exceeds 30 000 m3 in one calendar year. The fee shall be calculated as a
multiple of the discharged wastewater volume and the rate of 0.1 per m3. Fees go to the Czech
State Environmental Fund as revenues.
Sch 1: Scheme of services provided
water
water
River Board
VaK
SU
Morava
wastewater Vyskov
wastewater
-
administrator
-
SU
2.3.2.2. Management Relationships
The description of particular payments by VaK Vyskov was mentioned in the previous chapter. The
flow of the financial resources has to be completed by transfers and subsidies from government and
other public resources. The Czech State Environmental Fund finances smaller investment projects on
sewers. From the State Budget, money is provided for Ministry of Agriculture and Ministry of
Environment programmes. These programmes include building pipelines, construction of sewage
treatment plants ... etc. There is no money for infrastructure re-construction from these sources.
The Czech Government also got a loan from the European Investment Bank. These resources are used
for different purposes in the field of water management. The interest rate is paid by the Government.
1
UNDP/GEF Danube Regional Project
6
Sch 2: Scheme of the Financial Flows
European Investment Bank
Loans
Int.rate Contribution to M of Agr.
STATE
water management ----------
BUDGET
M of Env.
Loans
Loans
Charges-groundwater
Subsidies
Czech State Fees-discharge VaK
S
Envir. Fund
Vyskov Prices
Subsidies
U
Subsidies
s
Prices-surface water
River
Board
Morava
Subsidies
2.3.2.3. Regulatory Relationships
The MU is a subject of regulation and control from different institutions. There is a hierarchy of water
authorities which represents the governance of PWSS&S. This hierarchy is: ,,small districts" regions
Ministry of Agriculture. All of these water bodies imposes different obligation on PWSS&S. If the
territory of a particular PWSS&S overlaps the territory of one "small district", the regional office
works as a local regulator in the first instance.
The regulation and control cover the following areas of activities:
I. Economic Regulation
1. According to Act No. 526/1990 Coll. on Prices, the price calculations of the MU only have to
cover economically eligible costs and an adequate profit. In the interpretation of the Water
Law it is stated that the cost of building pipelines or a sewer network can be included into the
price calculation, if it is in a harmony with the Law on Prices. In the Financial Bulletin of the
Ministry of Finance, the rules on the construction of all regulated prices (see the National
Report) are published annually. The Ministry of Finance and its Financial Offices in regions
are responsible for financial regulation..
2. According to Act. No. 274/2001 Coll. on PWSS&S, once a year the MU has to publish the
clear and entire price calculation (water and sewage tariff) by 30 June the next year. There is
no strict formula on how to meet this obligation. Usually, the company puts the calculation on
its web site or displays it on a information board in the municipality.
3. According to the Water Act, the MU has to compile a Statement of Discharged Water and
submit it to the water authority (region) by the 15th February the following year. In this
statement, the MU has to specify the actual information regarding the number of pollution
indicators subject to a fee, their concentration in the discharged wastewater and the volume of
the discharged water. On the basis of this statement, the water authority assesses the fee for
the previous calendar year and delivers the total sum to the MU, or the financial office and
Czech State Environment Fund. The financial office of Ministry of Finance is responsible for
collecting fees. The control of the wastewater quality and quantity is done intermittently by
the Czech Environmental Inspection.
Lenka Camrova/IREAS
A Case Study of Municipal Water System Management and the Impacts of Tariff and Effluent Charges
17
Vyskov, The Czech Republic
4. According to Act. No. 274/2001 Coll. on PWSS&S, the Regional Office is forced to develop
the regional plan on the future development of pipelines and sewers by the end of 2004. This
document has to be amended by the Ministry of Agriculture. It directly regulates new
investments in the region, because construction offices are not allowed any further
construction than that selected in the plan. Regions (as water authorities at the second stage)
do this work for the Ministry of Agriculture which is responsible to ensure the development of
PWSS&Ss in the CR as a whole. The plan is being processed in these days, so the practical
functioning of this type of regulation has not been checked yet.
5. According to Act. No. 274/2001 Coll. on PWSS&S, the owner of the infrastructure
(municipality) keeps documentation of the property and announces the annually updated
information to the water authority (region). The records are kept on pipelines and the sewage
network, water processing plants and sewage treatment plants. All information is centralized
at the Ministry of Agriculture. The first deadline for this obligation is the end of 2004.
6. According to Act. No. 274/2001 Coll. on PWSS&S, the owner of the infrastructure has to
keep functional (operating) evidence, which contains information on water resources, the
drawn documentation of the infrastructure, price calculations, the plan of the control of the
water quality ... etc. This data is also provided to the water authority (region) and aggregated
at the Ministry of Agriculture. The first deadline for this obligation is also the end of 2004.
7. According to Act. No. 274/2001 Coll. on PWSS&S, the Ministry of Agriculture is allowed to
conduct the technical audit of pipelines and sewerages. This large technical control starts from
an impulse of the municipality, the Ministry of Finance or the Office for the Protection of
Competition. The main task is to justify the cost of a particular network and to adopt measures
for future development and repairs. The MU has to provide all data required by the special
controllers.
II. Environmental Regulation
1. According to Act. No. 274/2001 Coll. on PWSS&S, the quality standards of the water
withdrawn have to be met. Once a year, the MU has to provide all results of these
measurements to the regional office. Czech Environmental Inspection controls these
obligations. If the quality of the water is not sufficient the resource cannot be used.
2. According to Act. No. 274/2001 Coll. on PWSS&S, delivered drinking water has to meet the
hygienic standards of water. The frequency and the process of controls is regulated by a
special law of the Ministry of Health.
3. According to Act. No. 274/2001 Coll. on PWSS&S, the owner of the sewage network has to
develop a sewage regulation plan in which the maximum level of pollutants in wastewater is
stated. This document has to be approved by the water authority ("small district"). The
operator (or the owner) of the sewage network has to regularly measure the pollution of
wastewater.
2.3.3. Identification of Conflicts among MU, RU and SUs
General conflicts are described in Chapter 9 of the National Profile. In brief, the following problems
arise:
a) the price regulation of the MU is mostly a formality,
b) the recording of the MUs (no. of companies, calculations) should be done by the
Ministry of Agriculture, but it is not. The Ministry monitors about 120 of the largest
MUs (including VaK Vyskov), but there are about 800 small ones with concessions
and another 1000 subjects without any permission to run the service, which are not
recorded at all,
1
UNDP/GEF Danube Regional Project
8
c) municipalities put the political pressure on service providers to lower the prices of
services, which leads to infrastructure degradation and no provision for replacement,
d) municipalities should not sell the infrastructure, but the only regulatory tool is the
government ,,golden share" in particular joint-stock companies (PWSS&S), whose
power is limited. The current trend is a great deal of pressure on municipalities that is
done by large private investors, especially in town with more than 10 000 inhabitants,
to sell or privatize the operation and ownership of the water system.
Lenka Camrova/IREAS
A Case Study of Municipal Water System Management and the Impacts of Tariff and Effluent Charges
19
Vyskov, The Czech Republic
3. Current Operating Accounts of MU
Before describing MU current accounts of, it is important to emphasize, that in the Czech Republic in
price calculations, the current and capital accounts are not clearly distinguished and they cannot be
analyzed separately. Every company can also include different types of cost into particular account
categories (especially into ,,other direct cost" and ,,production overheads"), which do no enable a
ready comparison between calculations.
3.1. Product Quality and Quantity
3.1.1. Water Production
In 2002, VaK Vyskov produced 3 869 696 m3 of water, from which 2 100 3791 m3 were from the large
reservoir Opatovice. That means MU withdraws about 54.3% from surface water and 45.7% from
groundwater. Particular resources are listed in Table 2.
Table 2
Aggregated Data on Water Resources of VaK Vyskov in 2002
Groundwater Surface water
Name of the Withdrawal
m3
m3
VaK Vyskov Manerov
195 900
x
VaK Vyskov-Dedice SV (HV 114, 117, 117, 4)
394 200
x
VaK Vyskov-Drnovice
825 300
x
VaK Vyskov-Kasparov
77 700
x
VaK Vyskov-Koberice
33 900
x
VaK Vyskov-Krasenko
9 600
x
VaK Vyskov-Milesovice
10 200
x
VaK Vyskov-Moravske Malkovice
44 400
x
VaK Vyskov-Moravske Prusy
23 500
x
VaK Vyskov-Nemcany
15 100
x
VaK Vyskov-Olsany
25 600
x
VaK Vyskov-Opatovice (VN)
x
2 142 100
VaK Vyskov-Racice
34 200
x
VaK Vyskov-Rasovice
13 300
x
VaK Vyskov-Slavkov Ligary
8 200
x
VaK Vyskov-Slavkov:HV2
10 300
x
VaK Vyskov-Svabenice Detkovice
28 800
x
TOTAL groundwater/surface water
1 750 200
2 142 100
TOTAL
3 892 300
Source: River Board Morava statistics
Water resources of the Vyskov district are currently employed at 70% of capacity. There are no plans
to build other reservoirs and discovering additional groundwater resources is also unnecessary. For
these reasons, development will be made through investments to infrastructure and enlarging the
existing pipelines to connect other villages nearby existing infrastructure (if decided by local
PWSS&S and stated in the development plan by the Ministry of Agriculture).
1 according to VaK Vyskov data
2
UNDP/GEF Danube Regional Project
0
3.1.2. Water Processing/Cleaning
VaK Vyskov owns 3 water processing plants, which are situated at Manerov, Dedice and Lhota (for
the Opatovice reservoir). Unfortunately, there are no additional data of the level of processing or the
operational financial conditions and remaining service life of the current equipment.
3.1.3. Water Distribution
VaK Vyskov operates on 476.5 km of pipelines, from which 389.3 km is in the ownership of the joint-
stock company and the rest (18%) is used on the basis of contracts with pipeline owners. The length of
a company's pipelines has been stable over the last 4 years. In 1998, there was a large increase from
304 km to 377 km of pipelines. There is one large pipeline, the "Composite Pipeline Vyskov", then the
second largest is an independent pipeline Pustimer-Ivanovice (see Map 2) and about 10 small
technically (not financially!) independent pipelines.
Total water loss represented about 16% of the water produced. The loss from the pipelines was about
13% from the water produced and it slowly increases over the time as is visible from Table 3. In
comparison with the national average (23%), VaK Vyskov infrastructure is in good technical
condition.
Table 3
Loss in Pipelines of VaK Vyskov
Year
1998 1999 2000 2001 2002
Loss in pipelines
14.30 11.70 12.11 12.96 13.41
in %
Source: VaK Vyskov
There are about 58 200 inhabitants connected to the water supply, which is about 67.4% of the total
population of the district. This is below the national average (89.9% according to CZSO). Changes in
the number of people connected showed an abrupt decrease in 1998, although during the same year the
length of pipelines was largely increased. During the conversation with the VaK Vyskov managers
these changes were not explained.
Table 4
Population Connected into VaK Vyskov Pipelines
Year
1996 1997 1998 1999 2000 2001 2002
No. of
60 960
69 959
56 159
57 982
58 122
58 336
58 237
inhabitants
Source: VaK Vyskov
3.1.4. Water Purchased
In 2002, VaK Vyskov invoiced 3 234 311 m3 of water. This number corresponds to water production
lowered by the total loss. From the total water invoiced about 58% belonged to households and 42% to
400 businesses connected into the public water supply.
The total revenues from the water supply was about 73 700 thous. CZK, according to the VaK Vyskov
accounts. The water tariff was 22.8 CZK/m3 without VAT in 2002.
In 2002, the total leakage was about 16% from the water produced, which means 635 404 m3.
Lenka Camrova/IREAS
A Case Study of Municipal Water System Management and the Impacts of Tariff and Effluent Charges
21
Vyskov, The Czech Republic
3.1.5. Water Consumption
About 58% of water delivered is consumed by households and about 42 % by industry. The
consumption is slowly decreasing over time. For the unit consumption of particular SUs, see Chapter
5.
3.1.6. Wastewater Production
In 2002, VaK Vyskov collected and treated about 3 842 848 m3 of wastewater, from which 2 967 352
m3 was wastewater produced by households (56.86%) and businesses. 675 642 m3 was storm water
estimated and invoiced according to a special formula (in the Law on PWSS&S there is a formula how
to charge storm water to customers), and the rest (199 854 m3) was public (unidentified) wastewater.
3.1.7. Wastewater Collection
VaK Vyskov operates on 391 km of sewers, from which 363.9 km is in the ownership of the joint-
stock company and the rest (7.4%) is used on the basis of contracts with their owners. The length of
the company's sewers has remained stable over the past decade.
There are about 58 200 inhabitants connected to the sewer network, which is about 67.3% of the total
population of the district. This is also below the national average (77% according to CZSO). The
number of people connected had the same evolution as in the case of pipelines and is displayed in
Table 5.
Table 5
Population Connected to VaK Vyskov Sewerages
Year
1996 1997 1998 1999 2000 2001 2002
No. of
60 910
60 850
56 120
57 915
58 100
58 250
58 200
inhabitants
Source: VaK Vyskov
3.1.8. Wastewater Processing
VaK Vyskov owns 7 wastewater treatment plants (WWTP), from which only 1 is mechanical and the
rest of them are bio-mechanical. The largest treatment plant is situated in the town Vyskov.
2
UNDP/GEF Danube Regional Project
2
3.1.9. Wastewater Effluent
Table 6 represents particular places of wastewater discharge and the volume of discharged water. The
abbreviation ,,VK" indicates a sewage system without treatment.
Table 6
Aggregate Data of VaK Vyskov Discharges in 2002
Discharged
Place of the discharge
water in m3
VaK Vyskov Ruprechtov WWTP
105 100
VaK Vyskov Pistovice WWTP
133 600
VaK Vyskov Rousinov WWTP
155 300
VaK Vyskov Vyskov WWTP
2 449 000
VaK Vyskov Nemcany VK
27 400
VaK Vyskov Otnice VK
29 600
VaK Vyskov Krasensko WWTP
36 600
VaK Vyskov Bucovice WWTP
360 000
VaK Vyskov Hrusky WWTP
71 700
TOTAL
3 368 300
Source: River Board Morava Statistics
Data on the effectiveness of treatment of particular WWTP is not available. Information about the No.
of population connected to every plant is also unavailable. In 2002, the Czech average effluent charge
was 0.48 CZK/m3, which is about 3% of the sewage tariff.
3.2. Prices and Other Financial Information
3.2.1. The Construction of Prices
Prices (water and sewage tariff) are constructed according to the instructions of the Ministry of
Finance under the special regime of regulation (,,factually rectified" prices). The calculation includes
items which have to be published annually. From 2003, there is a new form, which has to be filled in,
through which the Ministry of Agriculture tries to ensure better comparison between calculations from
different MUs. This new form was published in the Financial Bulletin of the Ministry of Finance.
The MU sets out the results of price calculation per m3 for a given year. These prices are invoiced in
the whole period. Subsequently, it compares the real operating cost with this calculation. If there are
differences, the surplus or the shortage has to be given back (or invoiced) to consumers. The clearing
is done once a year.
In VaK Vyskov in 2002, the prices were as shown in Table 7
Lenka Camrova/IREAS
A Case Study of Municipal Water System Management and the Impacts of Tariff and Effluent Charges
23
Vyskov, The Czech Republic
Table 7
Price Calculation of VaK Vyskov in 2002
Item
Water rate CZK/m3
Sewage Charge CZK/m3
Planned Actual Planned Actual
Direct Material
4.16
4.12
0.45
0.30
Direct Wages
2.25
2.31
1.12
1.11
Other Direct Costs
9.68
9.59
9.22
9.92
Production Overheads
1.94
2.06
0.71
0.76
Administration Costs
2.06
2.10
1.06
1.02
TOTAL Cost
20.09
20.18
12.56
13.11
Profit 2.67
2.58
1.82
1.27
Price without VAT
22.76
22.76
14.38
14.38
Source: VaK Vyskov
Prices include only economically eligible costs and an adequate profit (given by the law which is used
for dividends of shareholders or for investment of the PWSS&S). Other Direct Costs means e.g.
depreciation and repairs to the property, electricity, charges on groundwater and surface water, social
insurance of employees... etc.
3.2.2. Sales
In 2002, VaK Vyskov invoiced about 3 234 311 m3 of water and 2 967 352 m3 of wastewater.
Revenues from these categories are listed in Table 8 Considering the price of 22.8 CZK per m3 of
water, there is an inconsistency in data: 70 335 000/22.8 = 3 084 868, which means that the payment
of more than 100 000 m3 is missing. There is no such large a difference in the case of wastewater.
Table 8
Structure of Revenues of VaK Vyskov in 2002
Revenues
Thous.CZK
%
Water rate
70 335
57.5
Sewage charge
42 201
34.5
Rent of the infrastructure
24
0,0
Other services
9 762
8.0
TOTAL
122 322
100.0
Source: VaK Vyskov
3.2.3. Costs or Purchased Inputs
See section 3.2.1.
3.2.4. Grants or Transfers
There are no grants or transfers associated with the current operating accounts of VaK Vyskov.
3.2.5. Existing Contracts
There are about 58 237 inhabitants connected to VaK Vyskov pipelines and about 58 200 inhabitants
connected to the sewers. For the purpose of the model these data were divided by 2.5 inhabitants that
2
UNDP/GEF Danube Regional Project
4
is the average household in the Czech Republic. Assuming that the consumption of every household is
metered and separately invoiced, there are about 22 495 households connected. About 56.6% of
people live in flats rather than in houses2. For Vyskov it means 9 763 households living in houses and
12 732 households living in flats. Besides there are only about 400 households using only the water
supply and the same number of households using the sewers only (they are supplied by a different
drinking water MU to the east).
There are about 400 businesses connected to VaK Vyskov networks. The division between small and
large industries is estimate based on the personal judgment. There are about 364 small businesses and
36 large businesses. The consumption of water is the criteria for such a division (see Chapter 5).
2 According to the CZSO
Lenka Camrova/IREAS
A Case Study of Municipal Water System Management and the Impacts of Tariff and Effluent Charges
25
Vyskov, The Czech Republic
4. Current Capital Accounts of MU
As mentioned in the previous Chapter 4, the capital accounts of VaK Vyskov had to be derived from
given calculations and partly assumed.
In general, establishing the real value of the infrastructure and operational property is very
complicated. The baseline came from the evaluation during the privatisation and in many cases the
book value after the depreciations is zero, although the property still has an additional 10 years or
more of economic life. To deal with ,,old" prices from 1993, a high inflation of more than 10% should
also be considered.
4.1. Infrastructure Plant and Equipment
There is a shortage of data related to the infrastructure of VaK Vyskov, so the division between
particular categories (production, processing, collection) could not be developed. For the purpose of
the spreadsheet model, several assumptions based on the country averages were accepted.
The joint-stock company Vyskov has got 404 900 000 CZK of corporate stock, which represents the
value of issued shares. Every share has got a value of 1000 CZK. The total sum represented the
present value of the property in 1993.
Municipalities of the Vyskov district own about 92.2% of these shares (,,registered shares"), they can
be sold only with the agreement of the Shareholders Meeting. About 7.8% are ,,bearer shares" and
they are owned by the private sector. There is also 1 ,,golden share" of the National Property Fund of
the CR.
The current capital of the company is about 526 140 000 CZK. The annual depreciation is 88 088 000
CZK. The cumulative amortization between 1993 2002 is 158 936 000 CZK. The cumulative repairs
of the property between 1993 2002 are 72 190 000 CZK, and cumulative investments are 249 093
000 CZK.
From these data and further consultations with experts, the following numbers can be estimated:
- functioning (operational) property of VaK Vyskov is about 31 798 000 CZK (value of bearer
shares that went to the voucher privatisation)
- the assumed present value of the infrastructure is 500 057 000 CZK (404 900 000 158 936
000 + 249 093 000), from which 60% is related to water supply and 40% to wastewater
production.
Table 9
Property of the VaK Vyskov
Type of property
Current value Residual lifetime
CZK
Years
Pipelines
240 027 360
15
Water processing plants
60 006 840
10
Sewers
120 013 680
15
Sewage treatment plants
80 009 120
5
TOTAL
500 057 000
-
Source: Assumptions
2
UNDP/GEF Danube Regional Project
6
4.2. Valuation of Infrastructure
See Chapter 4.1.
4.3. Capital Accounts
In VaK Vyskov, most investments are covered by revenues arising from the"depreciation" costs.
These investments include reconstructions and repairs to the property. In 2001, a two-year long large
reconstruction with the up-grade of the Vyskov treatment plant began. This project represented about
93% of investments in 2001 and 90% in 2002. Resources for the self-financing come from the profit
and other direct cost, where the depreciation cost is included.
There is no debt service at present, although VaK Vyskov is applying for a loan from the European
Investment Bank for new pipeline construction. Czech public budgets are not considered as accessible
resources for the future development of the company.
In the future, the town of Rousinov and other municipalities (about 8000 population equivalent in
total) are going to ask for a grant from the EU Cohesion Fund. The purpose is to build a new sewage
treatment plant to meet EU requirements on wastewater treatment. The project costs should be about 1
200 000 thous. CZK, co-financing from their own resources (the budgets of the town) will be about
20%. The WWTP would be operated by VaK Vyskov which is supposed to cover operating cost of the
new facility entering its network.
For the purpose of the model we assume:
· The construction will last about 5 years and it will start in 2006.
· From the total sum, 840 000 thous. CZK is for constructing the plant and 360 000 thous. CZK
is for building additional sewers.
· The lifetime of the investment is 40 years for the network and 20 years for the sewage
treatment plant.
· The construction affects about 3 200 households (1 000 living in flats and 2 200 living in
houses).
· Due to the new treatment plant, operating costs will rise in two categories: direct material to
0.35 CZK/m3, and other direct costs to 10.55 CZK/m3.
Lenka Camrova/IREAS
A Case Study of Municipal Water System Management and the Impacts of Tariff and Effluent Charges
27
Vyskov, The Czech Republic
5. Current and Capital Accounts of SU
In the Czech Republic, customers (SUs) are supplied on the basis of a contract, which is concluded
with the owner of the property connected or with the Association of flat owners (if there is a block of
private flats).
The sealed water meter measures the consumption of every contracted customer and is read quarterly.
If there is a severe inconsistency in time series data (e.g. meter error), the average consumption from
previous periods is used. In the case of a block of flats, the consumption in particular apartments is
usually metered, too. If there is a difference between the central water meter for the whole building
and the sum of individual meters (e.g. water leakage in service pipes), it is distributed among
households.
The amount of wastewater discharged is usually assumed according to target figures set by a special
law. The formula is based on the consumption of drinking water.
5.1. Current Accounts for Customers
As mentioned in Chapter 3.2.5, there are 6 categories of users. The diversification, services provided
and the amount of water and wastewater consumed are stated in Table 10 According to VaK Vyskov
data, the annual average water consumption is 109 m3 per household and 3 650 m3 per industry. Water
use within groups of SUs is based on assumptions.
There is a special category of entities paying for storm water. This annual amount of about 675 642 m3
of wastewater is invoiced separate to the SU accounts. For the purpose of the ASTEC model, the
municipality is considered as the payer.
Table 10
Classification of SU in VaK Vyskov
Annual
Annual water
Type of Number of
wastewater
SU
consumption
service
entities
production
m3
m3
Households -
W S
9 763
87 77
houses
Households flats
W S
12 732
78 71
Households w/o
W 400
83
0
sewers
Households w/o
S 400
0
77
water supply
Industry small
W S
364
1 926
1 810
Industry - large
W S
36
18 358
17 260
Entity paying for
S
1
0 675
642
storm water
Source: VaK Vyskov + Assumption
From the year 2000, there is only one price level for all categories of users. In 2002, the water tariff
was 22.8 CZK/m3 and the sewage tariff was 14.4 CZK/m3.
2
UNDP/GEF Danube Regional Project
8
Analyzing the current account of households, the average wage in CR in 2001 was 14 633 CZK per
month and in the Vyskov district it was about 12 181 CZK per month. There were about 1.2
economically active persons per household.3
The Czech average net income was 93 153 CZK per year per person in 2002, which means 232 883
CZK per household per year4. To count the household's expenses on water supply and sewage
services, prices with VAT % have to be used (23.9 CZK/m3 water rate, 15.1 CZK/m3 sewage charge).
It means that the average household pays annually about 1 984 CZK for water consumption and 1 163
CZK for sewage services. The sum is 3 147 CZK per household per year and it is about 1.4% of their
average net income.
5.2. Capital Accounts for Customers
---
5.3. Profile of the Potential Customers
There are about 28 000 inhabitants of the Vyskov district which are not connected to VaK Vyskov
networks. These people mostly live in smaller villages with an average of 400 inhabitants in the case
of water service and with an average of 700 inhabitants in the case of sewers. These people are served
by small local MUs.
3 according to the CZSO
4 according to the CZSO
Lenka Camrova/IREAS
A Case Study of Municipal Water System Management and the Impacts of Tariff and Effluent Charges
29
Vyskov, The Czech Republic
6. Regulatory Units
See Chapter 2.3. or Chapter 2.4. of the National Profile.
3
UNDP/GEF Danube Regional Project
0
7. Tests of the Baseline Model (S1)
We began the case study simulations by testing the ASTEC spreadsheet model with VaK Vyskov data
using the simplest modelling option: This we call the "baseline" scenario and all data entries
(accounts, tariffs, consumption, costs) remain the same as estimated for current Vak Vyskov
PWSS&S. The result allows us to estimate revenues available, at current tariffs, to pay for the present
system and level of service. This baseline model runs without optimization (minimization of tariffs
subject to various constraints). This means that there are no requirements for marginal cost pricing,
full cost recovery, etc.
Results:
Consumption: the same (water supply: 3 237 629 m3/year, wastewater discharge: 3 642 356 m3/year)
Water tariff: 22.8 CZK/m3
Sewage tariff: 14.4 CZK/m3
Balance of accounts: - 2 212 thous. CZK/year
The results suggest that the implementation in ASTEC parallels the present Vak Vyskov system and
that the system is in rough short-term financial balance. The loss of about 2 212 thous. CZK is less
than 2% of the gross revenues. This balance is at least partly a consequence of the price calculation
and re-calculation of PWSS&S as described in 3.2.1. It suggests that there will be a short term
financial balance if current tariffs are raised by about 2%.
Lenka Camrova/IREAS
A Case Study of Municipal Water System Management and the Impacts of Tariff and Effluent Charges
31
Vyskov, The Czech Republic
8. Prospective Policy Developments in VaK Vyskov and their
Representation in the ASTEC Models
Using the simple spreadsheet model calculation we demonstrated that VaK Vyskov is in a rough short
term financial balance. Now we examine the direct impacts of additional costs when introduced into
the company's prices. Using different scenarios, 2 circumstances will be investigated:
1. the impact of new investment,
2. the impact of real depreciation of the infrastructure.
8.1. Short-Term Scenario with ,,Sunk Cost" + Price Calculation of VaK
Vyskov
In the short-term scenario with "sunk cost" (past investment costs do not have to be repaid and are
considered equal to 0), only the current annual depreciation of 88 088 thous. CZK is considered as the
cost of maintenance of the infrastructure. This sum is included into price calculations in "Other direct
cost" category. The VaK Vyskov calculations of the water and sewage tariffs are used as a data entry,
although such a division between operating and fixed cost is misleading (e.g. other direct cost are
considered as operating cost, although they includes the annual depreciation which reflects change in
the value of fixed assets that is for the most part only modestly related to increase or decreases in
consumption levels). Results of this scenario are introduced in the following sub-chapters.
8.1.2. Cost Recovery with Only Commodity Charges (S2)
During cost recovery commodity charges change so as to assure full cost recovery. Clusters of user
accounts distributed costs to three groups of customers: households, small industry, large industry. For
each of these 3 groups a different water and sewage tariff was calculated according to consumption
and cost assigned to that group.
Results:
Consumption charges (tariffs per unit of water consumed) increased slightly. In all groups of users
actual consumption declined slightly given the increase in tariffs and the demand elasticity used in this
application. Total water production and wastewater discharge also slightly decreased.
Table 11
Water and Sewage Triffs (CZK/m3):
Water
Sewage
SU
tariff
tariff
Households - houses
23.57 15.63
Households flats
23.57 15.63
Households w/o
sewers
23.57 0.00
Households w/o
water supply
0.00 15.63
Industry small
23.58 15.64
Industry large
22.70 15.06
Balance of accounts: 2 965 thous. CZK/year.
3
UNDP/GEF Danube Regional Project
2
As a consequence of cost recovery, the increase of both tariffs for all users is visible (except the water
tariff for the category of large industry). In general changes in tariffs to achieve full cost recovery were
not very large - which is the result suggested by the baseline scenario described in Chapter 7.
8.1.3. New Investment and With Cost Recovery (S4, S5)
The construction of the new sewage treatment plant is incorporated into the cost calculations (data
from the Chapter 4.3.). There are 2 new categories of users (households-houses-NI, households-flats-
NI) which are directly associated with the new investment. Costs are distributed as in the previous
option, which means 3 groups: households, small industry, large industry.
Results:
Consumption: total water supply is 2 865 268 m3/year and total wastewater discharge is 3 301 749
m3/year decreases from the other scenarios..
Table 12
Water and Sewage Tariffs under Scenario S4- (CZK/m3):
Water
Sewage
SU
tariff
tariff
Households houses
23.06 45.11
Households flats
23.06 45.11
Households w/o
sewers
23.06 0.00
Households w/o
water supply
0.00 45.11
Industry small
23.04 15.36
Industry large
23.34 15.56
Householdshouses-
NI
23.06
45.11
Households-flats-NI
23.06
45.11
Balance of accounts: - 820 thous. CZK
From the results, it is obvious that the cost of the new investment constitutes a large burden for the
SUs, although about 80% of it will be financed by the grant. The price for wastewater discharge more
than doubled in the case that all households pay the same tariff. If only these 3 200 households
connected to the new WWTP, bore the burden, the sewage tariff would be about 294 CZK/m3 which
can be considered as an untenable price and maybe not to build the WWTP according to the current
design.
If we consider only one consumption charge level of tariffs, there will be the following impact on cost
of the new investment:
Lenka Camrova/IREAS
A Case Study of Municipal Water System Management and the Impacts of Tariff and Effluent Charges
33
Vyskov, The Czech Republic
Table 13
Water and Sewage Tariffs under Scenario S5 CZK/m3):
Water
Sewage
SU
tariff
tariff
Households houses
23.33 27.33
Households flats
23.33 27.33
Households w/o
sewers
23.33 0.00
Households w/o
water supply
0.00 27.33
Industry small
23.33 27.33
Industry large
23.33 27.33
Householdshouses-
NI
23.33 27.33
Households-flats-NI
23.33 27.33
Regarding these tariff changes, we can conclude that the plan for such a construction of the new
WWTP is more the political declaration of the Mayor than a reasonable investment, because the
benefits are very limited but the wastewater tariffs go up substantially . For a further discussion of this
topic, see the final Chapter 9.
8.2. Short-Term Scenario with ,,Sunk Cost" + New Price Calculations
According to consultations with water management experts the following hypothetical price
calculation of VaK Vyskov costs was developed. This calculation is based on the following
guidelines:
a) the direct material and direct wages remain unchanged
b) the capital (fixed) costs have to represent about 60% of total costs
c) for the calculation of amortization and repairs per m3, real data from VaK Vyskov were used.
Table 14
New Calculation of Operational and Fixed Costs of VaK Vyskov Services
Water tariff
Sewage tariff
CZK/m3
CZK/m3
Operational Costs
Direct Material
4.12
0.30
Direct Wages
2.31
1.11
Electricity + Other direct costs
1.64
3.35
Effluent charge
-
0.48
Fixed Costs
Repairs 1.7
1.7
Amortization + Others
10.41
6.17
TOTAL Cost
20.18
13.11
Profit 2.58
1.27
Price without VAT
22.76
14.38
Source: VaK Vyskov + Assumption
This calculation became an input for the following scenarios.
3
UNDP/GEF Danube Regional Project
4
8.2.1. Baseline (T1)
Results:
Consumption: the same
Water tariff: 22.8 CZK/ (original value)
Sewage tariff: 14.4 CZK/ (original value)
Balance of accounts: - 12 989 thous. CZK/year
There is a higher financial loss of the system than in the case of the previous Baseline scenario, which
means that the roughly balanced budget in S1 probably is the result of underinvestment in the system.
8.2.2. Cost Recovery with Only Consumption Charges (T2)
As a result of the larger loss of about 13 million CZK, the modelling option with cost recovery gave us
higher tariffs. Again, cost clusters of users were distributed as follows: households, small industry,
large industry. For each of these 3 categories a different water and sewage tariff is calculated
according to their assigned costs and consumption.
Results:
Table 15
Water and Sewage Tariffs (CZK/m3):
Water
Sewage
SU
tariff
tariff
Households - houses
24.35 17.35
Households flats
24.35 17.35
Households w/o
sewers
24.35 0.00
Households w/o
water supply
0.00 17.35
Industry small
24.30 17.31
Industry - large
24.89 17.73
Balance of accounts: -937 thous. CZK
The increase in tariffs are about 10 15%.
8.3. Real Investments
Developing the new price calculation of VaK Vyskov enabled us to clearly distinguish between fixed
and operational costs of services. According to the assumptions of the current value of the property
and the residual lifetime from Table 9, a more realistic situation of the company can be calculated in
following scenarios.
8.3.1. Costs Repair and of Infrastructure Replacement Included (U1)
Into the scenario spreadsheets, following fixed cost entered:
Lenka Camrova/IREAS
A Case Study of Municipal Water System Management and the Impacts of Tariff and Effluent Charges
35
Vyskov, The Czech Republic
a) annual depreciation, repairs and other fixed cost (as in T1).
b) current value of the infrastructure (pipelines, water processing plants, WWTP and sewerages)
as assumed in Table 9 First, the effect of the real investment (= annual financial needs to run
the system sustainable) caused a high loss of the system. It means that current price
calculations of VaK Vyskov do not cover the real investment needs, so the property slowly
depreciates.
Results:
Consumption: the same
Water tariff: 22.8 CZK/ (original value)
Sewage tariff: 14.4 CZK/ (original value)
Balance of accounts: - 54 663 thous. CZK
The impact of this financial loss on tariffs will be investigated in following scenarios.
8.3.2. Cost Recovery with Only Consumption Charges (U2)
The cost recovery scenario without marginal cost pricing calculated the new level of commodity
charges to cover the total costs of the company. So, to create a sufficient amount of resources for
repairs, the water tariff should be about 32 CZK/m3 and the sewage tariff about 27 CZK/m3. Clusters
were distributed into 3 groups: households, small industry, large industry, but the difference between
tariffs for particular groups is negligible.
Results:
Consumption: total water supply is 2 792 335 m3/year and total wastewater discharge is 3 237 594
m3/year.
Table 16
Water and Sewage Tariffs (CZK/m3):
Water
TOTAL
Sewage
TOTAL
SU
tariff
CZK/year
tariff
CZK/year
Households - houses
32.97
2 868.39
27.30
2 102.10
Households flats
32.97
2 571.66
27.30
1 938.30
Households w/o
sewers
32.97
2 736.51
0.00
0.00
Households w/o
water supply
0.00
0.00
27.30
2 102.1
Industry small
32.89
63 346.14
27.23
49 286.30
Industry - large
33.57 616 278.06
27.80 479 828.00
Balance of accounts: - 672 thous. CZK
The tariff increase is about 45 50 % in comparison with original values (22.8 water tariff and 14.4
sewage tariff).
8.3.3. Full Cost Recovery with Mrginal Cost Pricing (U4, U5)
The clearer division between fixed and operational cost enables us to develop a scenario in which 2-
composite tariffs are calculated. It means that operating costs are covered by the commodity charge
and fixed costs by the fixed tariffs under the condition of full cost recovery. Clusters of users were
distributed as follows: households, small industry, large industry.
3
UNDP/GEF Danube Regional Project
6
Results:
Consumption: total water supply is 4 135 203 m3/year and total wastewater discharge is 4 453 168
m3/year increase.
Table 17
Water and Sewage Tariffs (CZK/m3):
Water tariff
Sewage tariff
Average
Average
SU
Fixed t.
Comm.
Account
Fixed t.
Comm.
Account
CZK/year
charge
Expenditu
CZK/year
charge
Expenditu
CZK/ m3
re
CZK/ m3
re
CZK/year
CZK/year
Households - houses
1 685.72
10.65
2 612.55
1 378.28
6.99
1916.51
Households flats
1 685.72
10.65
2 516.42
1 378.28
6.99
1874.57
Households w/o
sewers
1 685.72
10.65
2 569.67
0.00
0.00
0.00
Households w/o
water supply
0.00
0,00
0.00
1 378.28
6.99
1916.51
Industry small
39 619.74
10.65
60 131.64
33 949.35
6.99
46 601.25
Industry large
280 133.34
10.65 475 646.04 240 147.36
6.99 360 794.76
Balance of accounts: 0 CZK
Comparing total annual payments of particular SUs, establishing 2-composite price results in lower
payments in all categories. This is possible thanks to the much higher consumption of water, through
which fixed costs are split up into more units (= the water is cheaper).
From the environmental point of view the higher consumption of water (and higher production of the
wastewater) can be considered as a negative feature. But considering the low average water
consumption in the CR per person (about 90 l per day), this increase would not cause over-
consumption in the scale of international level.
Generally, this option can be considered as an optimum, because costs of the system are covered
appropriately. Further, if we suppose industry to cause much higher fixed costs than particular
households, this system is correct, because the industry pays a much higher annual fixed tariff.
If it is not so (and we do not want to consider any social redistribution to households), we can analyze
the effect on average payments while using only one cluster. Through this option, the annual fixed
tariff is the same for every SU.
Lenka Camrova/IREAS
A Case Study of Municipal Water System Management and the Impacts of Tariff and Effluent Charges
37
Vyskov, The Czech Republic
Results:
Consumption: total water supply is 4 013 205 m3/year and total wastewater discharge is 4 341 333
m3/year increase.
Table 18
Water and Sewage Tariffs (CZK/m3):
Water tariff
Sewage tariff
Fixed t.
Comm.
Average
Fixed t.
Comm.
Average
SU
CZK/year
charge
Account
CZK/year
charge
Account
CZK/ m3 Expenditu
CZK/ m3
Expenditu
re
re
CZK/year
CZK/year
Households houses
2 708.78
10.97
3 663.17
2 256.12
8.40
2 902.92
Households flats
2 708.78
10.97
3 564.44
2 256.12
8.40
2 852.52
Households w/o
sewers
2 708.78
10.97
3 619.29
0.00
0.00
0.00
Households w/o
water supply
0.00 0.00
0.00
2 256.12
8.40
2 902.92
Industry small
2 708.78
10.97
23 873.00
2 256.12
8.40
17 460.12
Industry large
2 708.78
10.97 204 096.04
2 256.12
8.40 147 240.12
Balance of accounts: 2 081 thous. CZK
This system of pricing increases the average unit payment for households (water tariff: 42 CZK/ m3)
and decreases the cost of industry (water tariff: 12 CZK/m3). Large consumers can distribute the fixed
payment into more units consumed.
3
UNDP/GEF Danube Regional Project
8
9. Pilot Case Study Results Issues and Policies
The main purpose of the final chapter is to summarize the results of the modelling and to integrate the
tariff calculation with the institutional and legislative framework of the Czech Republic. For the
overall picture of water and wastewater management, Chapter 9 of the National Profile contains the
necessary background material.
9.1. Charges Reform as a Result of Using the Model
Considering water and sewage tariff reforms, the current trends in pricing policies have to be taken
into account. These trends are as follows:
a) one level of pricing for all SUs (no preference to household users as in the past),
b) one-composite price in most PWSS&S (no fixed charge).
9.1.1. Impact of the New Investment
The issue of new construction reflects the situation in the CR the moment before drawing upon the
financial subsidies from EU resources (Structural Funds). This aid will be available from 2004 for
municipalities of more than 2000 population equivalent and the main purpose is to build sewage
treatment plants according to the requirements of the EU directive (91/271/EEC).
From interviews with Czech officials and the management of VaK Vyskov, there is a fear that
selecting the project applying for EU resources will be created by a political decision of the mayors.
To suggest such construction without a deep analysis of their own financial resources and the future
impact on operational costs, constitutes a serious risk for the efficiency of the whole system (e.g. VaK
Vyskov).
The case of a large construction of a sewage treatment plant in Rousinov is an excellent example of
such a possible waste of resources and the serious impact on tariffs. From the analyses (Chapter
8.1.3.), we can see the following results:
Table 19
Impact of the New Investment (NI) on the Sewage Tariff (in CZK/m3)
Impact to
Original
household
Impact to all Impact to all
SU
value
connected to
household
SUs
NI
Households - houses
14.40 14.91
45.11
27.33
Households flats
14.40
14.91
45.11
27.33
Households w/o
water supply
14.40 14.91
45.11
27.33
Industry small
14.40
14.91
15.36
27.33
Industry - large
14.40
14.91
15.56
27.33
Householdshouses-
NI
14.40 293.56
45.11
27.33
Households-flats-NI
14.40
293.56
45.11
27.33
In the third column of Table 19, we can see an enormous increase in the sewage charge for customers
directly connected to the new investment. In the following columns this burden is redistributed to
other SUs, but still the operational and fixed costs of the investment are almost double the original
value even with 80% grant financing of the investment.
Lenka Camrova/IREAS
A Case Study of Municipal Water System Management and the Impacts of Tariff and Effluent Charges
39
Vyskov, The Czech Republic
Fortunately, there are some controlling mechanisms, which can influence the final decision-making of
local officials. First, the co-financing of every investment from EU resources (20-40%) is necessary.
This is mostly impossible to be done from the municipal or company resources, so they have to ask
e.g. for a favorable loan from the Czech government (that serves as an intermediary for the EIB loans).
The government evaluates the efficiency or propriety of an investment.
Second, to any investment financed by the EU, the standpoint of the Czech institutions (Ministry of
the Environment, .. etc.) has been developed. From this standpoint the Ministry should not agree with
a costly and low priority investment. The national plan (or a list) of sufficient construction of sewage
treatment plans will be elaborated at the Ministry of the Environment.
9.1.2. Impact of the Real Depreciation of the Infrastructure
The second important issue related to the financial stability of PWSS&S is: How to persuade/force
owners of the infrastructure to run the system sustainable?.
The problem is that due to the inefficient price regulation the full, real depreciation of the
infrastructure is not included in current tariffs. Because most of the PWSS&S property has been
formally depreciated (through book depreciation in the past), there is no tool to create a financial
reserve for future reconstructions. Although companies are in short term financial balance at present,
in 10 or more years they could get into trouble.
Under our assumptions regarding real depreciation (because VaK Vyskov was not able to provide
real data), the impact on current prices was investigated. Considering tariffs per unit, the increase from
22.80 to 33.00 CZK/m3 in the case of the water tariff and the increase from 14.40 to 27.00 CZK/m3 in
the case of the sewage tariff would ensure the sustainability of the system. In relative numbers, it is a
45% increase of the water tariff and 88% increase of the sewage tariff.
Further analysis was done by the investigation of two-composite tariffs, where the commodity charge
covers operational costs and the fixed annual tariff covers the system's fixed costs. Results are
summarized in the Table 20
Table 20
Annual Average Payment per Account of SUs (in CZK/year)
Water tariff
Sewage tariff
SU
One-
Two-
Two-
One-
Two-
Two-
composite composite composite composite
composite
composite
tariff
tariff I.* tariff II.**
tariff
tariff I.*
tariff II.**
Households - houses
2 868.39
2 612.55
3 663.17
2 102.10
1916.51
2 902.92
Households flats
2 571.66
2 516.42
3 564.44
1 938.30
1874.57
2 852.52
Households w/o
2 736.51
2 569.67
3 619.29
0.00
0.00
0.00
sewerages
Households w/o
0.00
0.00
0.00
2 102.1
1916.51
2 902.92
water supply
Industry small
63 346.14 60 131.64
23 873.00
49 286.30
46 601.25
17 460.12
Industry - large
616 278.06 475 646.04 204 096.04
479 828.00
360 794.76
147 240.12
*) fixed tariff is different for household, small industry and large industry
**) fixed tariff is the same for every SU
As an optimal option, which imposes the lowest payments for all types of SUs, the option with two-
composite tariffs I. can be chosen. In this option, fixed and operational costs of VaK Vyskov are
covered by separate payments. The fixed part of the tariff differs between particular consumers.
4
UNDP/GEF Danube Regional Project
0
9.2. Burden Indices of SUs
The further analysis of SU accounts helps us to assume the possible impact of particular tariff reforms
the on households' standard of living. There are 2 possibilities how to express such an impact:
a) costs as a portion of GDP/household,
b) costs as a portion of the net average income.
According to CZSO statistics, the following data will enter Table 21:
- GDP in 2002: 2 275 600 mil. CZK
- no. of inhabitants in 2002: 10 208 438
- GDP per capita in 2002: 223 000 CZK
- average annual net (=disposable) income per capita in 2002: 93 153 CZK5
- average annual net income of the first decile of households: 51 831 CZK
Table 21
Burden Index Analyses for Households
Year 2002
Indicator
S4
U2
Baseline ( Table 11) ( Table 16)
Water and wastewater absolute annual costs
3 147
5 633.5
5 219
(CZK per year)
Absolute change in annual costs over the Baseline
-
2 486.5
2 072
(CZK per year)
Percentage Change in annual costs over the Baseline
-
79 %
66%
(percent change per year)
Annual cost as a percentage of GDP per household
0.56 %
1.01%
0.94%
Annual cost as a percentage of net average income
1.4%
2.4%
2.2%
Annual costs as a percentage of net average income of the
6.1% 11% 10.1%
first decile of households
From the absolute values we can see, that both changes of tariffs (due to the new investment or the real
pricing) results in large increases in the cost of water and wastewater services. For the average
household the payment for these services does not represent an exorbitant expenditure, but it has to be
considered in relation with other cost of households on housing (e.g. electricity, gas, rent ... etc.). All
these cost are increasing almost every year. The impact on low-income families can be considered as
an especially high burden.
5 For the purpose of the analysis GDP per capita and average annual net income per capita were recalculated per
households (that means multiplied by 2.5)
Lenka Camrova/IREAS
Document Outline