

September 2004
ASSESSMENT AND DEVELOPMENT OF
MUNICIPAL WATER AND WASTEWATER
TARIFFS AND EFFLUENT CHARGES IN
THE DANUBE RIVER BASIN.
Volume 2: Country-Specific Issues and
Proposed Tariff and Charge Reforms:
Romania National Profile

AUTHORS
Dr. Victor Platon
George Dulcu
TARIFFS AND CHARGES VOLUME 2

PREFACE
The Danube Regional Project (DRP) consists of several components and numerous
activities, one of which was "Assessment and Development of Municipal Water and
Wastewater Tariffs and Effluent Charges in the Danube River Basin" (A grouping of
activities 1.6 and 1.7 of Project Component 1). This work often took the shorthand
name "Tariffs and Effluent Charges Project" and Phase I of this work was undertaken
by a team of country, regional, and international consultants. Phase I of the
UNDP/GEF DRP ended in mid-2004 and many of the results of Phase I the Tariffs and
Effluent Charges Project are reported in two volumes.
Volume 1 is entitled An Overview of Tariff and Effluent Charge Reform Issues and
Proposals. Volume 1 builds on all other project outputs. It reviews the methodology
and tools developed and applied by the Project team; introduces some of the
economic theory and international experience germane to design and performance of
tariffs and charges; describes general conditions, tariff regimes, and effluent
charges currently applicable to municipal water and wastewater systems in the
region; and describes and develops in a structured way a initial series of tariff,
effluent charge and related institutional reform proposals.
Volume 2 is entitled Country-Specific Issues and Proposed Tariff and Charge
Reforms. It consists of country reports for each of the seven countries examined
most extensively by our project. Each country report, in turn, consists of three
documents: a case study, a national profile, and a brief introduction and summary
document. The principle author(s) of the seven country reports were the country
consultants of the Project Team.
The authors of the Volume 2 components prepared these documents in 2003 and
early 2004. The documents are as up to date as the authors could make them,
usually including some discussion of anticipated changes or legislation under
development. Still, the reader should be advised that an extended review process
may have meant that new data are now available and some of the institutional detail
pertaining to a specific country or case study community may now be out of date.
All documents in electronic version Volume 1 and Volume 2 - may be read or
printed from the DRP web site (www.undp-drp.org), from the page Activities /
Policies / Tariffs and Charges / Final Reports Phase 1.
TARIFFS AND CHARGES VOLUME 2

We want to thank the authors of these country-specific documents for their
professional care and personal devotion to the Tariffs and Effluent Charges Project.
It has been a pleasure to work with, and learn from, them throughout the course of
the Project.
One purpose of the Tariffs and Effluent Charges Project was to promote a structured
discussion that would encourage further consideration, testing, and adoption of
various tariff and effluent charge reform proposals. As leaders and coordinators of
the Project, the interested reader is welcome to contact either of us with questions
or suggestions regarding the discussion and proposals included in either volume of
the Project reports. We will forward questions or issues better addressed by the
authors of these country-specific documents directly to them.
Glenn Morris: glennmorris@bellsouth.net
András Kis: kis.andras@makk.zpok.hu
TARIFFS AND CHARGES VOLUME 2
National Profile of Municipal Water and Wastewater Management in Romania
3
Table of Content
1 Introduction....................................................................................................................... 7
1.1 General Considerations .............................................................................................................. 7
1.2 Administrative Structure of Romania ....................................................................................... 8
1.3 Aggregate Supply of Raw Water and Production .................................................................. 11
1.4 Quality of Surface Water.......................................................................................................... 13
1.5 Major Sources of Pollution....................................................................................................... 16
2 Legal and Institutional Framework .............................................................................. 16
2.1 Laws of the Water Sector ......................................................................................................... 16
2.2 Institutional Framework; Major RUs in the Water Sector................................................... 18
2.3 Water Permitting....................................................................................................................... 21
2.3.1 Water Management Approval (WMAp) ......................................................................................... 21
2.3.2 Water Management Authorization (WMAu) .................................................................................. 23
3 Water Used by Localities................................................................................................ 24
3.1 Production and Consumption of Drinking Water.................................................................. 24
3.2 Metering and Leakage of Drinking Water.............................................................................. 25
3.3 Wastewater from Localities...................................................................................................... 26
4 Pricing Water and Wastewater ..................................................................................... 27
4.1 Price for Raw Water Abstraction ............................................................................................ 28
4.2 Tariffs for Drinking Water....................................................................................................... 29
4.3 Tariffs for Wastewater.............................................................................................................. 32
5 Water and Wastewater Infrastructure ......................................................................... 32
5.1 Infrastructure for Drinking Water.......................................................................................... 32
5.2 Infrastructure for Wastewater................................................................................................. 33
5.3 Opportunities for Investment in Water and Wastewater Infrastructure ............................ 36
5.3.1 Urban Areas .................................................................................................................................... 37
5.3.2 Rural Areas ..................................................................................................................................... 37
6 Financing Water and Wastewater Services in Romania............................................. 38
6.1 Financing the Current Activities of Drinking Water and Wastewater Services ................. 38
6.2 Financing the Investment in Water and Wastewater Infrastructure ................................... 38
6.3 Water and Wastewater Investment Co-Financed with Foreign Aid .................................... 41
6.4 Bilateral Assistance Granted by Denmark.............................................................................. 44
6.5 Bilateral Assistance Granted by the US .................................................................................. 44
7 Management Units (MUs) .............................................................................................. 45
7.1 Types of Management Units and their Operation.................................................................. 45
7.2 Trends in Formation and Consolidation of MUs.................................................................... 46
8 Policy Issues..................................................................................................................... 47
8.1 Issue 1: Water Consumption and Wastewater Generation ................................................... 47
8.2 Issue 2: Municipal Water Tariffs............................................................................................. 49
8.3 Issue 3: Economic Sustainability of the Water Utility ........................................................... 49
9 ANNEXES ....................................................................................................................... 50
4
UNDP/GEF Danube Regional Project
LIST OF TABLES
TABLE 1: CLASSIFICATION OF LOCALITIES IN ROMANIA (2001) .................................................. 9
TABLE 2: WATER RESOURCES, BY CATEGORIES, IN ROMANIA (2001) ........................................ 11
TABLE 3: RAW WATER DISTRIBUTED TO USERS, IN ROMANIA (1997-2001)............................... 12
TABLE 4: WATER QUALITY OF MONITORED RIVERS IN ROMANIA, 2001 .................................... 14
TABLE 5: WATER QUALITY OF MONITORED RESERVOIRS AND LAKES IN 2001 ........................... 15
TABLE 6: VOLUME OF DRINKING WATER DISTRIBUTED IN NETWORKS, IN 2001 ........... 24
TABLE 7: REGIONAL DISTRIBUTION OF DRINKING WATER AND POPULATION .............. 24
TABLE 8: VOLUME OF THE MUNICIPAL WASTEWATER TREATED ................................................. 26
TABLE 9: VOLUME OF THE MUNICIPAL WASTEWATER AND SLUDGE COLLECTED IN ROMANIA , BY
REGIONS, (2001) .......................................................................................................... 27
TABLE 10: PRICE OF THE RAW WATER (2002 AND 2003), BY SOURCES ..................................... 29
TABLE 11: TARIFF EVOLUTION FOR WATER SUPPLY, FOR HOUSEHOLDS, IN ROMANIA............... 29
TABLE 12: AVERAGE SEWAGE TARIFFS, IN ROMANIA....................................................... 32
TABLE 13: DISTRIBUTION NETWORK FOR DRINKING WATER AND CAPACITY OF DRINKING WATER
TREATMENT PLANTS, IN ROMANIA, BY REGIONS, (2001)................................................. 32
TABLE 14: NETWORK FOR WASTEWATER AND CAPACITY OF THE TREATMENT PLANTS, IN
ROMANIA, BY REGIONS, (2001)..................................................................................... 33
TABLE 15: EXISTING WASTEWATER TREATMENT PLANTS IN ROMANIA, 2001 ............................ 35
TABLE 16: EVOLUTION OF THE SEWERAGE NETWORK AND TREATMENT OF MUNICIPAL
WASTEWATER, IN ROMANIA (1997-2001) ...................................................................... 35
TABLE 17: WATER MANAGEMENT PROJECTS FINANCED BY THE NETHERLANDS ......................... 43
Dr. Victor Platon, George Dulcu
National Profile of Municipal Water and Wastewater Management in Romania
5
LIST OF ANNEXES
ANNEX 1: EVOLUTION OF THE EXCHANGE RATE - ROL/USD OR EURO - ................................. 50
ANNEX 2: EU WATER DIRECTIVES TRANSPOSED IN ROMANIAN LEGISLATION (MARCH 2003).... 52
ANNEX 3: NUMBER OF LOCALITIES WITH DRINKING WATER AND SEWERAGE NETWORKS, IN 2001
.................................................................................................................................... 54
ANNEX 4: DRINKING WATER DISTRIBUTED IN ROMANIA, IN 2001 .......................................... 56
ANNEX 5: LEAKAGE AND METERING OF DRINKING WATER, IN 2001 ....................................... 58
ANNEX 6: DATA ON SEWERAGE AND WASTEWATER FROM LOCALITIES, IN 2001 ....................... 60
ANNEX 7: SETTING UP TARIFFS IN PLOIESTI CITY .................................................................... 62
ANNEX 8: LEVELS OF PENALTIES FOR INFRINGEMENT OF THE NORMS CONCERNING MAXIMUM
POLLUTANT CONCENTRATION ADMITTED IN WASTEWATER DISCHARGED INTO THE SURFACE
WATER RESOURCES........................................................................................................ 64
ANNEX 9: INVESTMENT COSTS FOR THE MODERNIZATION, REHABILITATION AND DEVELOPMENT
OF THE WATER AND SEWERAGE SERVICES IN ROMANIAN TOWNS AND MUNICIPALITIES
(ESTIMATES) .................................................................................................................. 66
ANNEX 10: ESTIMATION OF THE NECESSARY INVESTMENT FOR SUPPLYING DRINKING WATER TO
THE ROMANIAN RURAL LOCALITIES ................................................................................ 68
ANNEX 11: WATER AND WASTEWATER PROJECTS FINANCED WITHIN ISPA FRAMEWORK, IN
ROMANIA ..................................................................................................................... 70
ANNEX 12: WATER AND WASTEWATER PROJECTS CO-FINANCED BY EIB AND EBRD IN ROMANIA
.................................................................................................................................... 72
ANNEX 13: WATER AND WASTEWATER PROJECTS CO-FINANCED BY THE DANISH GOVERNMENT 73
ANNEX 14: STRATEGIES AND ACTION PLANS.......................................................................... 74
6
UNDP/GEF Danube Regional Project
ACRONYMS
Danish Environment Protection Agency
DEPA
European Bank for Reconstruction and Development
EBRD
European Investment Bank
EIB
Construction Authorization
CA
Consumer Price Index
CPI
Environmental Protection Inspectorate -
EPI
Local Authority
LA
Local Council
LC
Management Unit
MU
Ministry of Agriculture, Forestry, Waters and Environment
MAFWE
Ministry of Economy
MoE
Ministry of Health and Family
MHF
Ministry of Public Finance
MPF
Ministry of Transport, Housing and Tourism
MTHT
Memorandum of Understanding
MoU
National Administration Romanian Waters
NARW
National Authority for Municipal Utilities
NAMU
National Environmental Action Plan
NEAP
National Institute for Research and Development of the Environment
ICIM
Pre Accession Instrument for Structural Policy Instrument
ISPA
Regulatory Unit
RU
River Basin Committees
RBC
Romanian Lei
RoL1
Romanian Water Association
RWA
Service User
SU
Unit of Measure
UM
Urbanism Certificate
UB
United State Agency for International Development
USAID
Water and Wastewater
W&WW
Water Management Approval
WMAp
Water Management Authorization
WMAu
1 Evolution of the exchanges rates RoL/ and RoL/$ is illustrated in the Annex 1
Dr. Victor Platon, George Dulcu
National Profile of Municipal Water and Wastewater Management in Romania
7
1 Introduction
This paper was drafted within the framework of the project "Assessment and Development of Water
and Wastewater Tariffs and Effluent Charges Designs for Nutrient Reduction in the Danube River
Basin (DRB)". The main purpose was to give an overview of the organization and functioning of the
management units in the Romanian water sector (Danube basin), regulatory framework, service users
etc. in order to improve both water resource management generally and protection of water bodies
from nutrification and hazardous substances. In this respect was explored the use of water and waste-
water service tariffs and effluent charges, fines and incentives as a tool for nutrient reduction. The
paper ends with policy issues that will need solutions and policies for suggested reforms.
1.1 General Considerations
Despite a relatively small surface area, the natural conditions of Romania are very diverse and the
different geographic areas cover small distances within the territory. The mountains cover most of the
central area of the country, the hills cover 30% of the area and are situated in the central part of the
country and the areas surrounding the mountains (see Map 1). The bigger towns of the country were
established and developed within the contact area situated between the mountains and the hills and in
those situated between the hills and the plains, forming three urban circles. The plains are situated in
the border areas and have a higher population density of important concentrations within the river
valleys.
Map 1. Relief of Romania
The Danube river basin can be divided into four parts: the upper region, the middle region, the lower
region and the Danube Delta. The lower region of the Danube is mainly the Romanian and Bulgarian
plain area and the plateaus and mountains of the higher areas surrounding the plain. From the mouth of
the Timok River to Silistra (km 374), the Danube defines the Romanian-Bulgarian border, flowing
eastward. In this part, the Danube flows as a wide river (800 m), with well-developed alluvial plains
on its left (Romanian) bank. The area flooded during flashfloods may reach a width of up to 10 km.
The right (Bulgarian) bank is a narrow floodplain flanked by a steep bank.
8
UNDP/GEF Danube Regional Project
Romania is a Danube riparian country (see Map 2) and 98% of the territory lies within the Danube
river basin. The Danube river flows over Romanian territory for 1,575 kilometers. Raw water from the
Danube is used in Romania for the preparation of drinking water, for irrigation, industry, fisheries and
navigation.
Map 2. Danube, Riparian Countries
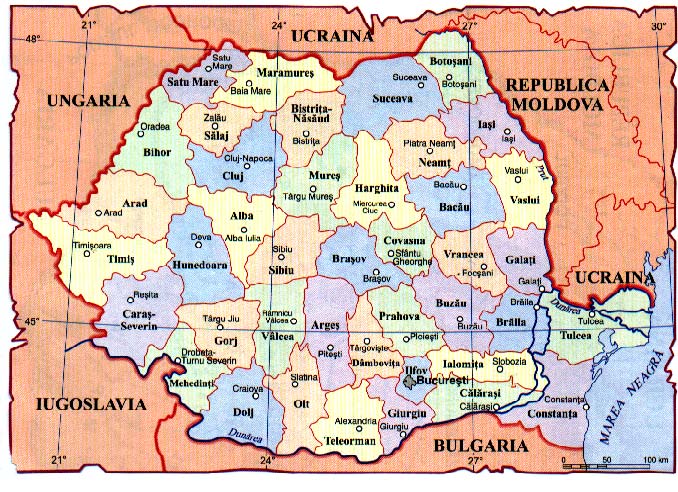
1.2 Administrative Structure of Romania
Romania has three territorial-administrative levels: central level, county level and communal level
(including communes, towns and villages). Romania's entire territory is divided into 41 counties2 plus
the Bucuresti municipality (see Map 3). Bucuresti municipality is the capital of Romania and has the
same standing as a county.
Map 3. Counties of Romania
2 A county consists of a county capital municipality, where the headquarters of the county public administration are located, several
municipalities, and all the towns and communes within that county's territorial limits. Law establishes the territorial limits of the counties,
municipalities, towns or communes, and their modifications.
Dr. Victor Platon, George Dulcu
National Profile of Municipal Water and Wastewater Management in Romania
9
Certain towns can be declared by law municipalities. The distinction between municipalities and
towns is made according the law taking into account the size and number of inhabitants, historical
traditions, and the social, economic and cultural importance. A city could become municipality by law
and this depends mainly on the level of infrastructure3 and could have a larger territory. Communes
may be formed of one or several villages and hamlets.
Table 1: Classification of Localities in Romania (2001)
Groups of
Locality units
Population
administrative
units
Number % Number %
Municipalities and Towns
Total 265
100
12243748
100
Under 2000
1
0.4
1798
0.0
2000 - 4 999
12
4.5
47463
0.4
5000 - 9999
59
22.3
450943
3.7
10000 - 19999
85
32.1
1165881
9.5
20000 - 49999
61
23
1910885
15.6
50000 - 99999
23
8.7
1744334
14.3
100000 - 199999
12
4.5
1729594
14.1
200000 - 999999
11
4.1
3196036
26.1
Over 1000000
1
0.4
1996814
16.3
Communes
Total 2686
100
10164645
100
Under 1000
56
2.1
40936
0.4
1000 - 1999
405
15.1
640850
6.3
2000 - 4999
1626
60.5
5412303
53.2
5000 - 9999
563
21.0
3637391
35.8
10000 and over
36
1.3
433165
4.3
Source: Romanian Statistics Yearbook., 2003
In 2001, in Romania were 265 towns and 2,686 communes (see Table 1). From the total towns the
most numerous group is that of towns with a population between 5,000-10,000 inhabitants and 10,000-
20,000 inhabitants; this group of towns represents 54.4% of the total number of towns but only 13.2%
of the total population. As regarding to communes the most important group is that having 2,000-
4,999 inhabitants; there are 1626 communes of this category cumulating 53.2% of the population
living in communes.
It should be mention that each year a number of villages are declared communes, communes are
declared towns and towns are declared municipalities. In the period 2001-2004 a number of 180
3 According to the law there is the next structure: level 0 Bucuresti, level 1 11 large towns, level 2 95 municipalities, level 3 other
towns (out from 270 towns in Romania).
10
UNDP/GEF Danube Regional Project
villages have been declared communes, 33 communes4 have been declared towns and 10 towns have
been declared municipalities.
According to Romanian legislation, communes, towns, municipalities and counties are legal entities,
have full capacity, own a patrimony, and hold the initiative in everything related to the administration
of local public interests, exercising authority within their established territorial-administrative units.
For the purpose of ensuring local autonomy, the public administration authorities of communes, towns
and counties elaborate and approve the local budget and are entitled to collect local duties and taxes.
Local autonomy could be expressed within the limits of the local budget and other financing sources
as municipal bonds, grants or loans. This implies that W&WW services are not entitled to receive
subsidies from the central budget. All investments in communal and urban W&WW services should
be financed with local sources.
In 2002 there were 268 towns and 1,423 communes with systems for drinking water supply. Sewerage
systems were identified in 266 towns and in 378 communes.
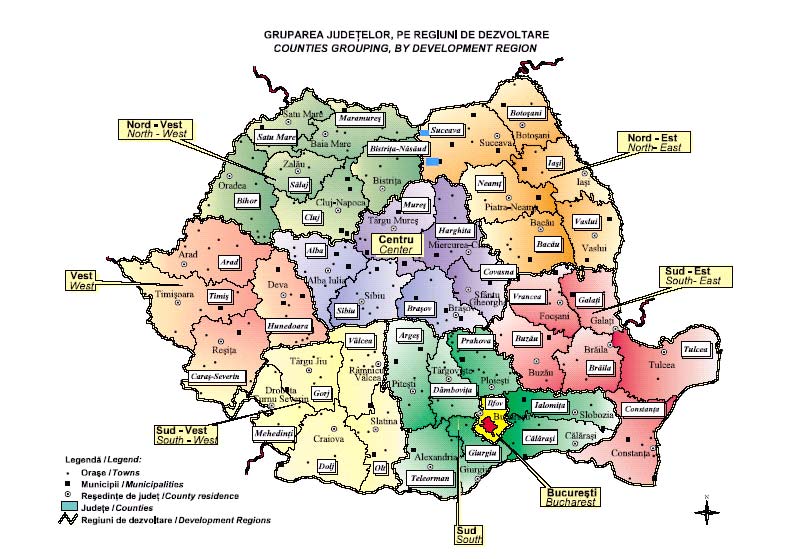
Map 4. Development Regions in Romania
4 According to the law 351/2001 on Spatial Planning, a commune could be declared town if: there are more than 5000 inhabitants and 75%
of them must be involved in non-agricultural activities, 70% of houses should be connected to the water network and 50% of them to have
bath and toilets. Other conditions should be fulfilled as well.
Dr. Victor Platon, George Dulcu
National Profile of Municipal Water and Wastewater Management in Romania
11
The Law 151/1998 on Regional Development introduced in Romania the development regions5 (see
Map 4), the regional development boards and the agencies for regional development (the eight regions
created are not administrative units). The existence and position of compact zones of similar
development characteristics and featuring similar problems has given rise to the need of creating new
development tools for solving problems. The regions (also named macro-regions) have been
delineated not in terms of similar levels of development, but as potential functional units and contain
several counties (see Map 4). The Law 15/1998 concerning the regional development in Romania
establishes the institutional frame, the principles, the purposes, the competence and the specific
instruments necessary for regional development.
At the national level it was created the National Council for Regional Development (NCRD) as a
Steering Body for policy guidelines. The executive body is the General Directorate within the Ministry
for EU Integration; this is entrusted with the elaboration and co-ordination of the policy for social
cohesion and regional development.
At the regional level there are eight Councils for Regional Development (CRD). These councils are
composed of the presidents of the county councils (elected persons) and majors and presidents of some
of the local town councils. The executive body is the Regional Development Agency (eight of them),
subordinated to the CRD.
So far the regional dimension was not important for public water utilities but in the future will play a
bigger role in financing regional infrastructure projects and in the W/WW sector6 as well.
1.3 Aggregate Supply of Raw Water and Production
The raw water industry has in Romania an old history starting with Roman Empire and even before. In
terms of quantity, the water resources are relatively unequally distributed in time and space. The major
sources are surface waters (inland rivers, lakes and reservoirs, the Danube River) and ground waters.
The quantitative structure of the raw water resources is illustrated in the Table 1.
Table 2: Water Resources, by Categories, in Romania (2001)
- Billion m3/ year -
Water resource category
Multi year average- Manageable
water
resource
Inland rivers, lakes
40
34
Danube River
85*
20
Underground water
9
5.8
TOTAL 134
39.8
* half of the annual flow at the country entrance
Source: Ministry of Waters and Environmental Protection., Yearbook on Environment in Romania., National Institute for
Statistics, 2002
The theoretical yield of water resources of the inland rivers and lakes is estimated at about 40 billions
m3/year, of which, in a natural flow regime (without reservoirs), only 5 billions m3/year are utilizable
and 14 billions m3/year, in the existing regime with water works (with reservoirs and dams).
5 These were proposed by the Green Paper for Regional Policy in Romania, published by the Romanian Government and the European
Commissions in May 1997.
6 For instance will be some PHARE projects within the heading PHARE 2004 2006 Economic and Social Cohesion Programme -
Regional Large Scale Infrastructure Projects that will finance W&WW investment.
12
UNDP/GEF Danube Regional Project
Out of the Danube theoretical resources, Romania could get 85 billions m3/year, but the possibilities of
extraction are limited because of the river navigable character and its peripheral position etc.
Thus, only about 40 billions m3/year of the water resources could be used for consumption. The Black
Sea water resources, although very important, cannot be utilized for the time being because of the
technical and economical difficulties of seawater desalination.
Although in Romania there are about 3,450 natural lakes with a water capacity of 2 billions m3, these
are of local importance in water management because only 400 millions m3 are fresh water and the rest
are with salted water in the different degree of salinity.
Because only 12.5 % of the water resource potential can be used in natural flow regime, a lot of
reservoirs were developed to smooth water availability over the seasons. Inter-basin diversions for a
territorial reallocation of the water resources according to the local demands were developed as well.
In 2000, the existing 1300 water reservoirs (400 having a capacity of over 1 million m3 each) stored a
total volume of 14 billions m3 of which 5.5 billions m3 is water supply for population, industry and
irrigation and the rest for flood protection and hydroelectricity. There are also 2000 km of canals and
galleries for inter-basin water diversions and the reallocation of water resources according to the needs
of agricultural irrigation in dry periods and other demands for water. However, more than 70% of the
inland watercourses are in their natural state (unregulated).
Taking into account existing and the future reservoirs, from the inland rivers Romania could have
about 25 billions m3 in a waterless year, which represents the maximum limit that could be increased
only by a successive reuse of the wastewater discharged through the sewage systems, treatment plants
from localities and industrial units, as well as by intensifying the industrial wastewater recycling and
by reducing consumption .
Ground waters, generally have a better quality than that of the surface waters. The quantity being
estimated as available is 9 billions m3/year, of which about 5.8 billions m3/year could be used under
the existing technical and economical conditions. At the present, only 1.5 billion m3/year is used.
The main use of raw water resources is illustrated in
. T
Table 3 he general trend in water use is down.
In the period 1997-2001, the reduction in water use was 1.92 billion m3,( -21%). The biggest reduction
(-27%) was registered by the industry and by the domestic sector (-19%). Only Agriculture recorded a
small increase for irrigation purposes but this amount is small taking into account that before 1990
Romania has had an irrigation system that covered 3 million hectares.
Table 3: Raw Water Distributed to Users, in Romania (1997-2001)
- million m3/year -
Users
1997 1998 1999 2000 2001
2001/1997
Difference
2001-1997
Municipalities
2 946
2 887
2 776
2 609
2 391
81%
- 555
Industrial activities
5 247
4 823
4 728
4 388
3 833
73%
- 1414
(independent extraction
systems)
Agriculture (total) (out of
1 026
1 299
1 027
940
1 090
106%
+ 64
which):
· Irrigation
287 560 266 513 701 244% +
414
· Livestock
farms 92 79 69 46 36 39% -
56
· fishery
647 660 692 381 353 55% -
294
Other
users
45 42 45 30 29 64% -
16
TOTAL
9 264
9 051
8 576
7 967
7 343
79%
- 1921
Source: Ministry of Waters and Environmental Protection, Yearbook on Environment in Romania., National Institute for
Statistics, 2002. Water produced by NARW and distributed.
Dr. Victor Platon, George Dulcu
National Profile of Municipal Water and Wastewater Management in Romania
13
In Romania there are all types of water resources (rivers, lakes and underground water). The biggest
resource is the Danube river and inland rivers. There are 11 basin rivers with various water volume.
The biggest one is Siret basin with 224 m3/second or 7,083 million m3/year representing 17% of the
total water resources. The next basin is Mures with 14% and Olt basin with 13%. These three river
basins provide 44% of the total amount of water resources in Romania. Other basins, with the same
surface, have less water resources.
Another characteristic of the water resources in Romania is related to season variability of water
flows. In the spring the water debit represents 39.7% of the annual water total flow and in fall the
water debit is 14.2% of the annual debit. In the summer the debit is 26.7% and in the winter is 19.4%.
The numerous lakes (3450) have a small contribution to water resources.
1.4 Quality of Surface Water
About 40 physical, chemical, biological and microbiological parameters (such as oxygen content,
BOD - biological oxygen demand, COD - chemical oxygen demand, TDS - total dissolved solids,
nutrients, organic pollutants, heavy metals) are used to categorize the water.
Based on Romanian standard for surface waters (STAS 4706/1988), quality of the watercourses are
categorized as follows:
· Category I very good/drinkable, includes waters that can become drinkable to supply the
population centers or animal breeding units, the food industry, and bathing resorts (pools);
· Category II good, includes surface waters that can be used for industry, fish farms (for fish
that all not as sensitive to pollution as trout, and for urban and recreational use;
· Category III for industrial use, includes waters for irrigating agricultural land, electric
power production in hydroelectric power plants, industrial cooling installations, cleaning
units and other purpose;
· Category D degraded, includes degraded waters improper for development of aquatic
fauna.
Romania has 4864 watercourse with a total length of about 78,900 km, out of which 22,031 km are
monitored for water quality. In 2001, about 7% of the total length of monitored rivers was considered
as degraded (see Table 3).
The worst conditions, falling in degraded class Category D occurred within the following river basins:
Prut (21.9%); Ialomita (20%); Vedea (10.6%) (see Figure 1). In the period 1993-2001, there was a
substantial increase in category I class of total river length, as well as a decrease in category II class of
total river length since 1996, and a relative stabilization of the length of rivers within category III and
Degraded class of total river length.
14
UNDP/GEF Danube Regional Project
Table 4: Water Quality of Monitored Rivers in Romania, 2001
Total number
Class of overall river water quality by Category I sections, 2001
of monitored sections
I II
III
Degraded
No. % No. % No. % No. %
318
198 63.5 64 20.5 25 8.0 25 8.0
Total monitored length, Class category of overall river water quality by monitored length, 2001
km
I II
III
Degraded
km % km % km % Km %
22,031
14,979 68.0 4,117 18,7 1,401 6.3 1,534 7.0
Source: National Company "Apele Române7", ,,Synthesis of water quality in Romania in 2001, 2002
In the past 10 years, water quality in Romania has slightly improved, but not because of increased
pollution control. Due to poor economic conditions, industrial and agriculture water consumption has
decreased, thus decreasing the quantity of wastewater discharged into surface water.
80.0
70.0
60.0
50.0
Class I
40.0
30.0
Class II
20.0
Class III
10.0
Degraded
0.0
1993 1994 1995 1996 1997 1998 1999 2000 2001
Figure 1: Trends in River Water Quality, 1993-2001
Source: The impact on industry, agriculture and local utilities systems of implementing directives
91/271/EEC, 98/83/EC, 76/464/EEC (and the seven "daughter" directives) and 91/676/EEC., Phare Project
RO 9907-02-01: Pre-accession Impact Studies., FINAL Report
Non-point sources have decreased because smaller quantities of fertilizers and pesticides are used, but
ground water contamination, especially by nitrates, remains high. It is difficult to fully characterize
water contamination, because only a limited number of hazardous pollutants are monitored. Existing
7 This is the former name of NARW; owing to various institutional changes the same institution have had different names. In quoting a
range of papers and documents drafted in the past the original name was used.
Dr. Victor Platon, George Dulcu
National Profile of Municipal Water and Wastewater Management in Romania
15
wastewater treatment facilities, half of which are not working properly, will not be able to treat the
additional quantities of wastewater discharges from the industrial and agriculture sectors when
economic growth resumes. Therefore, water quality is likely to worsen.
The overall water quality and the trophic level of the reservoirs and lakes are shown in Table 5. The
percentage of eutrophic reservoirs and lakes could be explained by an existing high potential for
contamination, due to diffuse or "non-point" sources and specific hydraulic conditions, rather than to
point pollution sources.
The worst situation within the category degraded class was registered within the seaside area.
Table 5: Water Quality of Monitored Reservoirs and Lakes in 2001
Class category*)
Total
I II
III
Degraded
number of
monitored
No. %
No.
%
No.
%
No.
%
lakes and
63 67.0
16
17.0
6
6.4
9
9.6
reservoirs
Trophic level*
Oligotrophic Oligo-mesotrophic Mesotrophic
Meso-eutrophic
Eutrophic
No. % No. % No. % No. % No.
%
94
27 28.72 7
7.45 30 31.91 11 11.7 19
20.21
Source: National Company "Apele Române", ,,Synthesis of water quality in Romania in 2001", 2002
*) STAS 4706/1988 for surface waters, quality categories and conditions.
Water Monitoring
In Romania, water authorities8 use to monitor the quality of rivers in 22,000 km out of 78,900 km,
using 318 gauging stations. When flows are high, water quality data are transmitted daily from 65
control stations. When flows are low, surface waters are monitored in the 318 stations once a month.
About 40 physical, biological and microbiological parameters are measured.
Monitoring water quantity is carried out by 1,016 hydrometric stations by measuring the flows.
About 40% of the stations that monitor water quality also use to monitor the quantity. For the other
stations discharge information is transmitted from the nearest hydrometric station.
Groundwater is usually monitored in 3,695 hydrological stations, of which 1,434 take qualitative
measurements. In addition there are some 12,000 survey points situated in the vicinity of pollution
sources, drillings and water wells for water supply, mainly in rural areas. Eighteen general physical-
chemical parameters (temperature, pH, conductivity, total dissolved solids, oxygen regime, nutrients,
etc.) are measured in groundwater. As well, for the drinking water supply, bacteriological parameters
are measured too.
The monitoring of waste-water discharges (emission monitoring) of about 2,100 point pollution
sources is performed by water authorities, including municipalities' discharges points. As well, the
laboratories9 of the Environmental Protection Inspectorate (EPI) can perform environmental audits or
inspections. EPI laboratories can also perform water analyses on a commercial basis.
8 The description of Water Authorities is made in Section 2.2
9 The accreditation process, according to international standards (ISO 9000), has just started in Romania. At present the quality assurance
system consists mainly of parallel sampling and analysing (inter-calibration) between the laboratories of the water authorities and foreign
laboratories, followed by a spatial analysis of the results. Ten of the forty-one provincial laboratories are very close to accreditation at
national level, by RINAR, the national accreditation body.
16
UNDP/GEF Danube Regional Project
1.5 Major Sources of Pollution
In 2001, the total volume of water discharged was 5.03 billion m3. Of this amount 52% are
wastewaters that require treatment.
From the total amount that require treatment (2595.3 m3/year) 16.5% have been adequate treated; out
of the rest 35% are waters not treated and 48.5% is water insufficient treated.
Local water utilities are the main dischargers of wastewaters that requires treatment with 1.87 billions
m3 in 2001; out of this amount 0.8 billion m3 was not treated and 0.91 billion m3 was insufficiently
treated. On the second place is the industry with a volume of 0.64 billion m3 of wastewaters that
requires treatment.
In Romania, the natural raw water resources, while technically utilizable, cannot be used without
making certain significant investments in complex development water works of the hydrographic
basins and in treatment installations because:
· one of the most important water resource, the Danube river, can be used in a small extent,
due to its eccentric position, at the Southern limit of the territory;
· the inland rivers are unequally distributed all over the territory, significant areas remaining
with insufficient resources, presenting at the same time important flow variations in time and
space;
· the pollution of certain inland rivers, exceeds the admissible limits, which makes difficult
and sometimes even prohibitive their use.
From the data presented we may see that municipalities are one important water polluter. The situation
is significant where localities are situated up stream and down stream of a river that is the only water
source. As it is mentioned in the Case Study, Pitesti is situated on the Arges river and, down stream an
agglomeration of more than 2.5 million (mainly Bucuresti city) is getting the drinking water. So, the
MUs should meet effluent standards in order to reduce the nutrient load and allow other entities to take
advantage of a natural resource without excessive processing costs.
2 Legal and Institutional Framework
In Romania, raw waters are considered a natural resource that is managed by a public body. The water
users are municipalities (trough MUs), industry that it is not linked to a municipal network and has its
own water source, agriculture for irrigation and other users. Municipal W&WW operators have to
observe water laws that are general for all users. This section describes the legal and institutional
framework in which the MUs and municipalities should operate. The legal framework is very
important for municipalities especially in this period when the whole environmental "acquis" was
transposed in Romania. As a consequence for municipalities, the targets of water infrastructure
development programmes are, to a large extent, externally determined by the EU laws. Some estimates
say that only for the water sector, Romanian municipalities will have to invest around 9 billion , in
order to implement all EU laws.
2.1 Laws of the Water Sector
I. Water Law
The main legal act regulating the water sector in Romania is the Law no 107 of 25 September 1996 on
waters, published in the Official Gazette Part I, no 244 of 8 October 1996, with its subsequent
modifications. This law aims at water sources preservation, development and protection, protection
against pollution, water quality modification and alteration of surface waters' beds and shores. Also,
the law provides for restoring the quality of surface and ground water, preserving aquatic ecosystems,
securing potable water supply, complex exploiting of water as an economic resource, its rational
distribution and the maintaining of waters' natural productivity, as well as at floods and other hydro-
meteorological risks management.
Dr. Victor Platon, George Dulcu
National Profile of Municipal Water and Wastewater Management in Romania
17
In Romania, waters are public property and their protection, exploitation and sustainable development
should be carried out in accordance with the public interest. For that reason, both the right of use and
corresponding obligations regarding water resources protection and preservation should be exercised
according to the water law, which establishes specific regulations with regard to different types of
water and their beds and shores. Law no 107 on waters, together with adjacent secondary legislation,
also rules on the construction works connected with waters and generating direct or indirect,
permanent or temporary modifications on waters' quality or flowing status. Underground water should
be used in accordance with relevant legal provisions.
Rivers, banks and riverbeds together with tributaries with lengths greater than 5 km or with basin
larger than 10 km2 are public property.
The water law provides for the setting up of special sanitary protected areas around potable water
supply sources and installations (Government Decision no 101 of 3 April 1997 on approving the
Special Norms regarding the characteristics and size of the sanitary protected areas, published in the
Official Gazette no 62 of 10 April 1997). Ministry of Health and Ministry of Water and Environmental
Protection are responsible for sanitary protected areas. Ministry of Health is also in charge of
monitoring drinking water quality. Standards have been set for surface waters intended for abstraction
of drinking water as well as for the quality of water destined for human consumption and bathing. The
law also establishes that in artificial lakes representing potable water supply sources, only natural fish
breeding is permitted, fish foddering and fungicide and veterinary drugs spreading being forbidden.
Even in cases different from above, fish foddering and chemicals utilization is allowed provided that it
does not alter water quality downstream and a valid water management authorization does exist.
The right of utilizing surface or ground water is established through the water management
authorization and is exercised according to the legislation (see details in Section 2.3). This right also
refers to the discharging of wastewater, drain, and storm water into water sources. Water users are
bound to observe certain norms on water consumption per production unit and per activity and to save
water through rational utilization and recycling. They are also legally responsible for ensuring the
maintenance and repair of water installations under their jurisdiction.
Taking into consideration the highest performance of existing technologies, water consumption norms
are proposed by water users, consented by stakeholder ministries and approved by the Ministry of
Water and Environmental Protection. These water consumption norms are regularly updated. In case
of divergences, the RUs should intervene.
On joint proposal of Environment and Health Ministries, limits concerning pollutants concentration in
wastewater discharged into water sources have been set by Government Decision no 730 of 10
November 1997 on approving the Norms10 on establishing limits regarding pollutants concentration in
wastewater discharged into water resources..
Carrying out any new investment on drinking or industrial water supply cannot take place without
appropriate and simultaneous extension of the sewerage network and sanitation equipment. The law
also prohibits the throwing of solid waste into any type of water and the discharging of wastewaters
into ground water or natural and artificial lakes. In cases of new
Potential investors or beneficiaries should apply for the water management approval during the
preparation phase of the feasibility study for a project and should show evidence of other permits11
previously acquired (see Section 2.3 for details).
Water users located in inhabited zones, suburbs or industrial areas may discharge wastewater into the
sewerage network only with the agreement of the sewerage system's administrator, in conformity with
the established conditions and provided that the terminal sanitation station has an adequate capacity
and technologic profile for the wastewater discharged.
10 The NORM "NTPA-001", published in the Official Gazette Part I no 327 of 25 November 1997
11 . An Annex to the Waters and Environmental Protection Minister's Order no 148 issued on 27 February 1997 and published in the
Official Gazette Part I no 100 bis of 26 May 1997 lists a number of nineteen approvals, consents and certificates issued by other
authorities, that may be required, on a case by case basis, before to start the water permitting procedure which is the last one.
18
UNDP/GEF Danube Regional Project
II. Other Laws
Other important laws are:
· Minister's Order no 1100 of 28 December 2001 on the modification and completion of the
Water and Environmental Protection Minister's Order no 706/2001 was issued for approving
the Rules of Procedure regarding the organization of the certifying activity for institutions
specialized in accomplishing studies, projects, consultant work in the field of water
management and technical documentation supporting applications for water management
approvals and authorizations12.
· Law No. 215/2001, Law No. 216/2001, Law No.326/2001, Law No 213/1998 and Law No
219/1998 have created the legal framework for proper management and development of
public services of communal husbandry. The Law No. 326 of 28 June 2001 on the Public
Services for Communal Husbandry, a framework law of modern European conception,
which sets important tasks with regard to the responsibilities of the Government of Romania
and the structures of the central public administration regarding the general policy of the
state in this field. This law was followed by a series of sector regulations which, for the first
time in the post-war Romania, settle administrative, legal and technical rules for every
service of communal husbandry, namely for: drinking water and sewerage, production and
distribution of thermal energy, sanitation, waste management, local public transport for
passengers, roads and green areas and electric energy distribution in localities.
Other EU directives, with impact on the municipal water system, have been transposed so far (for
more details see Annex 2):
· Directive no. 91/271/EEC regarding urban sewage waters approximated by Government
Decision no. 188/2002 regarding some effluent norms regarding water discharged into
natural waters (Official Journal no.187/ 20 March 2002);
· Directive no. 75/440/EEC regarding the quality of surface waters designated for
drinking water is transposed in: Ministerial order no. 377/2001 regarding the approval of
the norms for surface water quality; Gov. Decision no. 100/2002 for the norms to measure
and associated frequency for analysis for the surface water designated for extraction and
preparation of drinking water and Ministerial order no. 1146/2002 for classification of the
quality of the surface waters (Official Journal 197/ 27 March 2003);
· Directive no. 98/83/EC regarding drinking water transposed in Law no. 458/2002
regarding drinking water (OF. Journal no552/29.07.2002);
· Directive no. 80/68/EEC regarding the protection of the underground waters from
pollution with some dangerous substances is transposed in Min. Order no. 1049 from
13.11.2002 for approving the Plan of Measures for reducing and eliminating the risk of
polluting underground waters.
2.2 Institutional Framework; Major RUs in the Water Sector
Public water resources are managed by the National Administration "Romanian Waters" (NARW)
which implements the national strategy and policy. NARW is the major regulatory unit (RU) in the
field of raw water.
Water management activity in Romania is planned and carried out across river basin units within
which surface and ground waters are considered as a unit both from a quantitative and qualitative
perspective, with the view to ensure sustainable development.
Law no 106/1996 refers to the "Romanian Waters" Regie Autonomous, the name of the national
authority on water resources management. Water management authority's name and status have
been changed twice since 1996. In 1998, by the Government Decision no 981/1998 the National
12 It has been published in the Official Gazette no 77 of 31 January 2002
Dr. Victor Platon, George Dulcu
National Profile of Municipal Water and Wastewater Management in Romania
19
Company "Romanian Waters" (joint stock corporation) was created. On 5 September 2002,
Government Decision no 981 has been repealed by the Government Emergency Ordinance no 107 on
the creation of the National Administration "Romanian Waters". This Emergency Ordinance
became effective13 on 20 September 2002, the date when it was published in the Official Gazette.
The National Administration Romanian Waters (NARW) is responsible for preparing water
management plans and programmes. Through its branches for each 11 river basins, (corresponding to
the river basins), it also responsible for enforcing water legislation and policy, monitoring, for
preparation of river basin management plans, floods and drought control etc.
NARW through its basin branches, is also responsible for the prevention and warning of accidental
pollution. In this regard, adequate planning is conducted, taking into consideration the specific
conditions of a hydrographic basin and the nature of hazardous substances involved and in accordance
with the methodology established by the former Ministry of Waters and Environmental Protection.
Water users should devise their own plans on preventing and combating accidental pollution. In case
an accidental pollution occur, the polluter should take urgent measures to address pollution's causes
and consequences, and to inform immediately the closest water management unit.
The public water management body should warn water users and local governments downstream
about the accident. Potential polluting companies, local governments and water management bodies
should be equipped with adequate intervention means for cases of accidental pollution. Downstream
water users suffering material losses from an accidental pollution, that could take place upstream, have
the right to receive compensations from the natural person or legal entity that, according to the law,
bears responsibility for the accident. The polluter should also compensate natural persons and legal
entities, including NARW for their expenses related to the neutralizing of accidental pollution effects.
The implementation and enforcement responsibilities involve other institutions including: ministries,
public institution, institutes and local authorities.
Ministry of Agriculture, Food, Forestry and Environmental Protection14 (MAFWE) plays the
main responsibility for implementing the environmental acquis; as well it has an important role in
implementing the Water Directives trough its Water Department. This ministry and its Water
Department is RU in the field of environment, waters and forestry.
Water Department, along with NARW, was entitled to set limits or suspend temporarily water
utilization in order to face the risk or consequences of accidents, drought and water shortage caused by
depletion of existing resources. Temporary restriction plans can be instituted during periods with water
deficit by NARW, after consultation with authorized users. These plans should be sanctioned by the
Ministry, approved by the water basin committees and made known to the public in a timely manner.
To implement restriction plans, in case of emergency, NARW devises certain measures that are
compulsory on all users and prevail on the provisions of the water management authorization. The
methodology for restriction plans' issuance and public information is established by the Ministry.
Ministry of Economy (ME) has legislative responsibilities related to the industrial sector, develops
strategies and plans etc.
Ministry of Health and Family (MHF) has joint implementation responsibilities for Urban
Wastewater, Nitrates and Air quality Directives, mainly for standards regarding drinking water.
Ministry of Transport, Housing and Tourism (MTHT) has primary responsibility, among others,
for drafting spatial development plans ensuring that the infrastructure works are correlated and issuing
requirements and norms for the implementation of heavy infrastructure investment. This ministry is
mainly responsible for large infrastructure projects at the national level (national roads, highways,
harbors, airports etc.) but not direct related to W&WW investment. It finances the infrastructure under
its authority.
13 It should be mentioned that the instability of the main institutions is significant. For instance, in the last four years, NARW changed its
status and name for several times as well as the regulatory authority, namely the Ministry of Water and Environmental Protection.
14 In mid August 2003, Ministry of Water and Environment Protection was dissolved and water and environmental attributions were
transferred to the Ministry of Agriculture and Forestry. For the time being there is also a Water Department in MAFWE.
20
UNDP/GEF Danube Regional Project
The Ministry of Public Finance (MPF) makes decisions on the state budget, allocations to local
budgets, taxation etc.
The National Institute for Meteorology, Hydrology and Water Management provides technical
support in air quality and emission control, water quality, radioactivity, data collection and emissions
inventory.
The Institute for Public Health is the expert agency of the Ministry of Health and Family, carries out
research, collects and processes data on various aspects of environment that might impact on human
health.
The Romanian Standards Institute develops technical standards for all domains.
The Romanian Research Marine Institute and the R&D Institute of the Danube Delta, play an
important role in conducting research and monitoring for the Black Sea and the Danube Delta,
respectively.
The National Institute for Research and Development for Environment (ICIM) carries out studies,
strategies, actions plans, legislations, norms, lab methodologies, national survey of wastes, water
resources quality, water use and water users.
At local and regional level the following institutions are responsible for the enforcement of water
regulations:
Environment Protection Inspectorates (42 EPIs), corresponding to the 41 counties and Bucharest,
are in charge with permitting, inspection, enforcement and monitoring. They report to the MAFWE,
but are partially self-financed.
Local Authorities (LA), at the county and municipal levels15, have the duty to insure that population
has access to public services and related infrastructure (i.e. wastewater treatment works, water and
sewage networks, landfills); as well LA identify and propose public projects for investment. Local
Authorities have certain obligations aimed at the rational utilization of water and preserving its
quality. They should employ installations with low water consumption and less polluting, to avoid
losses and wasting and reduce effluent concentration. LA as infrastructure owners should also ensure
the maintenance and operation of stations and installations for water quality processing at the
authorized capacity, monitor their efficiency through lab analyses and, in case of non-compliance, take
measures to bring emission/effluent indicators within the limits stipulated in the water management
authorization.
According to the water law, in urban and rural localities, the local authorities should ensure adequate
management of water supply, sewerage and sanitation, as well as storm water drainage, using local
legislation and local budgets. All investment in W&WW should be carried out with the local level
financial resources. There are no subsidies from the state budget in financing W&WW services16. As a
redistribution tools, the central budget is transferring some revenues from the richer counties to poorer
ones in order to cover some expenditures at the county level.
Local Agriculture Agencies at county level enforce and monitor, among other duties, the Nitrates
Directive.
River Basin Committees (RBC). The G.D. No. 1212 11.29.2000 (O.J. No. 644, 12.11.2000) lays
down the rules for the structure and operation of the River Basin Committees. The M.O. No. 678,
07.17.2001 (MWEP), not published in the Official Journal, established 11 River Basin Committees,
actually corresponding to the 11 River Basin Districts under the NCAR. The structure of the River
Basin Committees consists of 15 appointed, elected and selected members (in accordance with
specified procedures), representatives from MWEP, MHF, NCAR, local public authorities, legal water
users, NGOs, and consumer protection offices.
National regulatory units that affect MUs
15 Towns and communes
16 There are direct subsidies from the central budget in the case of local transport and household heating in the winter period.
Dr. Victor Platon, George Dulcu
National Profile of Municipal Water and Wastewater Management in Romania
21
The National Authority for Municipal Utilities17 (NAMU) is a new institution that has important
attributions in the field of communal utility services including water and wastewater. This new
institution has responsibilities in regulating, monitoring and controlling all communal activities that
are natural monopoly. Among other duties, NAMU has to:
· issue licenses to the operators of communal water services;
· collect and publish information regarding the activities of the operators of communal water
services and publish it;
· oversee the mechanism of the adjusting the prices or tariffs to the conditions of the contracts;
· adjudicate solutions in the conflict between the operator and the consumers;
· ask for improvement programs of the activity from the other operators, when their activity
does not meet the standards set by the operator license, namely the contract of delegating the
administration;
· withdraw the operating license, if the operator refuses to consider the measures means to
improve the activity.
NAMU is the RU for all MUs at municipal level in all cases where is a natural monopoly.
2.3 Water Permitting
2.3.1 Water Management Approval (WMAp)
All MUs should have a WMAp when is undertaking an investment or an old facility is modernized.
This rule should be observed by all entities that carry out a water work.
For a new water user or an old one that is undertaking a new investment or retrofitting an old one,
getting the construction emplacement approval does not exclude the obligation to apply for the water
management approval. Consequently, individual works can be performed only on the basis of the
water management approval issued by the territorial branches of the National Administration
"Romanian Waters" after reviewing the required documentation18. Potential investors or beneficiaries
should apply for the water management approval during the phase of preparation of the feasibility
study for a project and should show evidence of other permits previously acquired19. In addition, the
solicitor should present, as the case may be, proposed measures on providing sustainable management
of water resources, proposed measures on minimizing adverse impacts, proposed actions on securing
optimal water flow and aquatic ecosystems preservation. Technical documentation submitted to the
approving authority should be accompanied by a photocopy of the public information letter on the
intended activities that the solicitor should accomplish.
Water management approval - or substantiated refusal - should be issued within sixty days from the
date when the last document required has been submitted. Water management approval is valid
throughout the execution work on the objective for which it was issued; on the condition that full
compliance with the provisions set therein does exist. This permit looses validity after two years if
execution work does not begin within this interval. Yet, water management approval can be renewed
upon request submitted six months before the expiration date. A new water management approval is
required for the development or modernization of some technological processes or existing equipment
of water users if the planned change implies the modifying of the previous approval's provisions. By
water management approval provision, investors can be obliged to perform certain works not included
in the technical documentation but necessary to ascertain that proposed works, constructions and
installations will not cause damage to existing water users or riverside residents.
17 This is subordinated to the Ministry for Administration and Internal Affaires (created in mid 2003).
18 The standard application form is presented in annex 1d of the Procedure on water management approval and authorization issuance,
adopted by the Waters and Environmental Protection Minister's Order no 148 issued on 27 February 1997 and published in the Official
Gazette Part I no 100 bis of 26 May 1997.
19 Annex 1i to the above-mentioned Procedure lists a number of nineteen approvals, consents and certificates that may be required, on a
case by case basis, during the permitting procedure.
22
UNDP/GEF Danube Regional Project
The law allows for performing of some minor works without a water management approval20 on the
basis of a notification to the National Administration "Romanian Waters" 20 days prior to the works'
start. Carrying out these works can take place in similar conditions, i.e. without an authorization but
upon previous notification.
Reference material supporting the application for water management approval21 should draw upon
meteorological, hydrological or hydro-geological studies, as the case may be, as well as on water
management studies and studies on the impact that individual works would have upon water resources
and riparian zones. These studies can be accomplished by authorized public and private institutions22
and should demonstrate that the water approval solicitor is able to comply with relevant legal
provisions.
The law points out that water management approval and construction emplacement approval are
separate permits but have to be in concordance. The same legal act specifies that getting water
management approval and authorization do not exclude the obligation to apply for the environment
approval and environment authorization in accordance with the law.
The steps in having all approvals for an investment or a modernization of an existing plant are in the
next table.
20Categories of works and activities for which the water management approval is not required are listed in annex 1c of the Procedure on
water management approval and authorization issuance. Categories of works and activities for which a water management approval is
required are listed in annex 1b of the same Procedure, which also establishes which is the approving authority for different categories of
works (annex 1g).
21 By the former Waters and Environmental Protection Minister's Order no 277 of 11 April 1997, Norms on the technical documentation
necessary to obtain the water management approval and authorization have been adopted. These norms have been published in the
Official Gazette Part I no 100 bis of 26 May 1997.
22 Minister's Order no 1100 of 28 December 2001 on the modification and completion of the Water and Environmental Protection Minister's
Order no 706/2001 on approving the Rules of Procedure regarding the organization of the certifying activity for institutions specialized in
accomplishing studies, projects, consultant work in the field of water management and technical documentation supporting applications for
water management approvals and authorizations has been published in the Official Gazette no 77 of 31 January 2002.
Dr. Victor Platon, George Dulcu
National Profile of Municipal Water and Wastewater Management in Romania
23
No.
Type of permit
Issuing institution
1. Urbanism Certificate (this document includes a list
Town Hall of the city or the County Council
with all approvals and consents needed in order to get
the CA)
2. Water Management Approval
NARW
3. Environmental Approval
EPI
4. Other approvals, if there are necessary or asked by the
Other institution as power generator, gas
Urbanism Certificate
supplier, MPWTH etc.
5. Construction Authorization (CA) (final document)
Town Hall of the city
The final document is the CA that allows to start construction works; this is usually valid for one year
and could be extended.
2.3.2 Water Management Authorization (WMAu)
All MUs operating in Romania should have a valid WMAu.
MUs and other operating business in the water sector (water extraction, mineral aggregates exploiting
etc.) can take place only after receiving the water management authorization (autorizatia de
gospodarire a apelor). In addition, Ministry of Transport's approval is required in case of works to be
accomplished into the navigable national waters. Applicants should pay for water management
approval and authorization services certain fees and tariffs due to the Water Fund.
As well, the water management authorization includes the discharge limits for water users . Surpassing
these limits is banned by law. The law also prohibits the opening of new economic objectives or
extending of existing ones, constructing new dwellings or replacing production technologies with new
ones that produce increased effluent concentration, without simultaneously opening new sewerage
systems and sanitation installations or taking other measures aimed at complying with the provisions
on wastewater set by the water management authorization.
Water management authorization is issued within sixty days from the application date and at the latest
on the date of inauguration for the economic objective to be authorized, on the basis of technical facts
finding conducted in the presence of the solicitor. WMAu is granted only if legal provisions regarding
water management are observed and information included in the application form23 and supporting
documentation24 prove to be accurate. WMAu can be issued for a period of time varying from one to
ten years, according to the type of activity to be authorized25.
In case of extending of activities, improvements of production technologies, etc., the water user (MUs
as well) have to apply for update the water management authorization.
WMAu is one of the documents that are needed, among other consents and permits from relevant
authorities, in order to have the Environmental Authorization. The Environmental Authorization
allows a company to run.
23 Standard application form for the water management authorization is presented in annex 1f of the Procedure on water management
approval and authorization issuance.
24 Standard application form should be accompanied by the water management approval, previous authorization if existing, a program for
compliance in cases of authorizations issued for a limited timeframe, a general plan of the water works, constructions and installations to
be authorized, mentioning their construction and operation parameters, the operation and maintenance rules of procedure, and the
agreement of the owners of the water supply and sewerage systems involved.
25 For example, mineral aggregates exploiting for individual household or local government's needs may be authorized for maximum one
year, but installations for water abstraction, treatment, pumping, transport, accumulation, distribution and cleaning can be authorized for
maximum five years. Other activities such as energy production, navigation, fish breeding, rafting and entertainment activities can be
authorized for a period up to ten years.
24
UNDP/GEF Danube Regional Project
3 Water Used by Localities
From the 22.4 million inhabitants, living in Romania, only 14.7 million persons (65% of total) have
drinkable water supplied by public service; of this amount 11.3 million persons are in the urban area
(76.9 %) and 3.4 mil. in the rural area (23.1 %). In the last 25 years, there was an increase in the
number of households connected to the network from 29% to 65% of the population.
3.1 Production and Consumption of Drinking Water
A total number of about 304 drinking water treatment plants were identified in Romania by NARW,
during year 2001, operating in general using the classical treatment technology including: coagulation
settling- rapid sand filtration and chlorination (in certain cases pre-chlorination was used). The
capacity of these installations to produce drinking water was of 10.5 million m3/day.
According to the Romanian Statistic Yearbook, in 2001, the volume of drinking water pumped into
networks was 2.4 billion m3 and the volume of drinking water distributed to users was 1.53 billion m3
(for details see Annex 5). The share of water distributed to domestic users was 64.6% in 2001 and to
public users the share was 13.1% (see Table 6).
Table 6: Volume of Drinking Water Distributed in Networks, in 2001
Volume of drinking water distributed
million m3 %
At users, out of which:
1,530
100
· for domestic purpose
988.3
64.6
· for public purpose
200.2
13.1
Source: Data from Annex 5
Table 7: Regional Distribution of Drinking Water and Population
- (%) -
Drinking Water distributed
Population by regions
to users by regions
1. North-East
11.9 17.1
2. South-East
13.3 13.1
3. South
11.8 15.4
4. South-West
7.9 10.7
5. West
9.3 9.1
6. North-West
11 12.7
7. Center
14.8 11.8
8. Bucharest-Ilfov
19.9 10.1
Total
100 100
Source: Processed Data from Annex 5
At regional level, the Region 8 which is a big urban agglomeration, gets 19.9% of the water distributed
but only 10% of the population. The water is distributed across the eight regions in correspondence
with the population living in these regions (see Table 7).
According to the Ministry of Public Administration, by taking into account the losses and the share for
both public and economic uses, the water consumption in Romania has the following pattern: for the
urban area 335 l /inhabitant per day and for the rural area 126 l /inhabitant per day (in 2001). If
the calculation is made eliminating losses than the average consumption of drinking water was
Dr. Victor Platon, George Dulcu
National Profile of Municipal Water and Wastewater Management in Romania
25
160.7 l/inhabitant in urban areas (in 2002). This value is lower than the average consumption in
2001 that was 183 l/inhabitant.
3.2 Metering and Leakage of Drinking Water
In 2001, at national level, metering of drinking water progressed. From the volume of drinking water
distributed to users of 1,530 mil m3, a quantity of 1,124 mil m3 was metered which represented an
average of 73.4% (for details see Annex 5). The metering process started several years ago but in the
last two years it increased in intensity not only for drinking water but for hot water and apartment
heating as well.
For people living in single houses there is not a problem to introduce a meter (for this category of SUs
metering is a standard procedure) but for people living in block of flats there is still no an acceptable
approach. One solution was to introduce a meter at each stair of flats and a cluster of apartments
should divide the water bill. This division could be made according to the number of people living in
each apartment or each apartment to install meters to count the water. This last solution is very
complicated owing to the fact that usually, for each apartment in a block of flats, are needed 3-4
meters for drinking water without taking into account other 3-4 meters for heating. Having so many
meters it is time consuming to read them and to make calculations for the water bills. Not to mention
that in some localities the individual metering is not taken into account by the MUs because high
transaction costs. In such a situation the readings of the apartment meters are used only to split the
water bill among the people living in the same block of flats.
Another solution, experimented in Pitesti, is to install a more advanced meters that send by radio the
data to a central unit that processes these data and calculate the bill for each apartment. In this way the
huge cost of reading individual meters is diminished. This solution could be applied now only in
blocks of flats that have the adequate pipe network.
Across regions, the metering and losses are not uniform (see Figure 2). We could notice that losses of
drinking water are lower than the national average in six regions: South, Centre, North-West, West,
North-East and South-West. Only two regions registered losses higher than the national average:
Bucuresti-Ilfov and South-East. It is important to mention that the biggest consumer of drinking water,
region Bucuresti-Ilfov, has had the most important losses 49.2% (almost half of the 601.2 million m3
introduced into Bucuresti-Ilfov network (in 2001 see Annex 5).
Regarding metering in regions, the situation is next: four regions have a higher degree of metering
than the national average and four have less. In regions as Region South and Region South-West,
where the losses were low, the metering is low as well. In Bucuresti-Ilfov, where is recorded the
biggest loss, it is the highest degree of metering. This situation is explained by the fact that population
and industry installed meters with the naive idea that in this way they will pay only the consumption
and not the losses.
It is obvious that the problem of losses will not be solved by installing meters but only by undertaking
repairs and investment.
Data available are only for the year 2001 and in 2002 and 2003 the metering advanced in all regions
but losses did not change owing to the fact that few investment took place in such a short period.
26
UNDP/GEF Danube Regional Project
90
Percentage of leakage
80
Percentage of metering
70
60
50
%
40
30
20
10
0
y
s
t
age
a
s
t
a
s
t
e
s
t
E
u
t
h
e
s
t
n
t
r
e
v
ountr
So
-
W
We
Ce
C
v
er
A
r
t
h
-
E
c
u
r
e
s
t
i
-
Il
fo
outh-
r
t
h
-
W
No
S
outh
Bu
S
No
Regions
Figure 2: Losses and metering of drinking water, across regions, in Romania (2001)
Source: Data from Annex 5
3.3 Wastewater from Localities
As in the case of supplying with drinkable water, the population that has a sewerage service is far
greater in the urban (10.3 million inhabitants) than in the rural area - 1.15 million inhabitants.
Considering the rural-urban split, the population of the country can be grouped into there categories:
· Households with both services 51%;
· Households that have only water supply but no sewerage 14%;
· Households that have neither water supply nor sewerage - 35%.
The trend in declining drinking water consumption is reflected in the trend in wastewater which is
down by 14% in the period 1997-2001 (see Table 8).
Table 8: Volume of the Municipal Wastewater Treated
Wastewater treated
Year/
(thousands m3)
1997 1,239,888
1998 1,254,453
1999 1,203,558
2000 1,272,556
2001 1,070,695
2001/1997
86%
Source: National Institute of Statistics, 2002
Dr. Victor Platon, George Dulcu
National Profile of Municipal Water and Wastewater Management in Romania
27
As regards the regional distribution of the wastewater treated, the situation is illustrated in the Table 9.
We notice that Region 8 (Bucuresti-Ilfov) has no treatment of wastewater. The biggest amount treated
is recorded in N-E and Central Regions; each account for 19% of the total wastewater treated (in
2001). Regarding the quantities of sludge resulted from the treatment of wastewater it is interesting to
note that the biggest quantity of sludge is collected in the South (34% of total) without correlating with
the quantity of wastewater. Region S-W and Region S-E registered smaller shares of the sludge
compared with the volume of wastewater treated. This situation shows that the procedures of cleaning
the wastewater are not uniform; across regions there are used one, two or three stage purification
plants and not all parameters of the cleaned water are observed (this explains again the term
insufficient treated).
The differences between wastewater generation and sludge collected could be explained as well by the
local conditions as: industrial and urban concentration, population connected to network, prices of
water and wastewater, metering etc.
Table 9: Volume of the Municipal Wastewater and Sludge Collected in Romania , by
Regions, (2001)
Wastewater
treated
Sludge resulted
from treatment
Region
thou m3 %
tons
%
TOTAL Country
1,070,695
100
657,549 100
Region North-East
206,819
19
133,916 20
Region South-East
137,604
13
41,374 6
Region South
165,272
15
226,155 34
Region South-West
64,192
6
5,568 1
Region West
116,753
11
64,519 10
Region North-West
165,126
15
84,559 13
Region Centre
207,781
19
100,914 15
Region Bucharest
7,148
1
544 0
Source: Data from Annex 6
4 Pricing Water and Wastewater
In Romania, economic instruments for water management and protection include fixed service charges
(drinking water treatment and distribution, and sewage network and waste-water treatment), various
water charges, taxes, penalties and allowances (bonus). The major aim is to have a rational and
economical management of waters to ensure that users respect the quality limits for water discharges,
to prevent the depletion of the water resources and to avoid quality damage, and resource
conservation. There are used the next pricing instruments:
· Prices - are the same throughout Romania but differ in accordance with the source of water
(e.g., inner rivers, the Danube, or groundwater) and the category of users (industries,
households, power plants, farms, fisheries, etc.);
· Tariffs - are levied on water pollution to reduce suspended and oxygen-depleting substances
in river flows using limits set by the law. If the limits are exceeded, fines or penalties are
levied. NARW is responsible for establishment of the limits;
· Fines are levied for violation of the laws, standards, regulations;
· Penalties are levied for discharging larger amounts of pollutants or abstracting higher
amount of water than the quantities established by WMau.
28
UNDP/GEF Danube Regional Project
· Bonuses are granted by NARW to water users that take measures to protect waters and
discharge less pollutants that the level granted by WAau; the bonus could be up to 10% of
the raw water bill in one year.
Prices and tariffs are revenues to cover NARW expenditures.
The penalty revenues provide a source of funding for the "Water Fund" created in 1991 and
administered by NARW. The Water Fund was created to finance some improvements in water quality,
in river bed stabilization, flood control, efficient water use, and to cover water management units'
expenses in critical periods (droughts and floods).
4.1 Price for Raw Water Abstraction
Water abstraction charges are the same all over Romania, but differ according to the source of water
(inland rivers, Danube, groundwater) and the category of user (industry, household, power plant,
agriculture, fisheries). In August 2000, the prices of raw water (water abstraction charges) were
approved by the Competition Office26 at a level of 0.09 RoL/m3 for electricity production and 71.2
RoL/m3 for municipal water supply up to 153.6 RoL/m3 for industrial water abstracted from
groundwater.
Water users pay for the quantity of raw water they are entitled to withdraw, specified in their contracts
or their WMAu (except when water is rationed during drought periods). NARW imposes substantially
higher charges for amounts taken in excess of contracted volumes. Based on the Emergency27
Ordinance no. 107/2002 the raw water tariffs, for 2002 and 2003, was and are those in Table 10.
26 In that period the Competition Office has had this responsibility. Today the Competition Office is closed and its attributions have been
transferred to the Ministry of Finance.
27 Emergency Ordinances are legal procedures used by governments to issue legal acts with similar power as those issued by Parliament.
Later on the Parliament must approve or correct these acts issued by Government. This procedure is often used in transposing EU
legislation owing to the fact it is very fast and more accurate than parliamentarian legal documents.
Dr. Victor Platon, George Dulcu
National Profile of Municipal Water and Wastewater Management in Romania
29
Table 10: Price of the Raw Water (2002 and 2003), by Sources
Water source
Price - RoL/ m3
1. Water abstracted from inland rivers
· For municipalities, industry and livestock
238
· For irrigation and fisheries
18
2. Water abstracted from Danube
· For municipalities, industry and livestock
28
· For irrigation and fishery
18
3. Water abstracted from underground
· For industry
264
· For irrigation and fishery
18
· For municipalities
123
· For livestock
156
Source: Data from NARW, 2002
4.2 Tariffs for Drinking Water
Prices of drinking water are set up at municipality level taking into account the local conditions and
costs associated with providing drinking water. Owing to the fact that each town has its own water
sources (various distances to pump the water, various qualities and sources of raw water), its own
network with losses etc. than the tariff for W&WW varies across MUs.
In July 2000, the tariff fluctuated from 3,780 RoL/m3 (or US$ 0.18/m3 in Ploiesti) and 4,670 RoL/m3
(or US$ 0.23/m3 in Bucharest) to 9,904 RoL/m3 (or US$ 0.48/m3 in Petrosani28).
Table 11: Tariff Evolution for Water Supply, for Households, in Romania
1994
250-800 RoL/m3 in the country and 186 RoL/m3 in Bucharest
1995
400 RoL/m3 in Bucharest
1996
786 RoL/m3 in Bucharest
1997
1000 4300 RoL/m3 in the country and 1,400 RoL/m3 Bucharest
1999
6000 RoL/m3 Petrosani (maximum in Romania at that time)
2000
2386 RoL/m3 in Bucharest and in Iasi 6250 RoL/m3
2001
5260 RoL/m3 in Bucharest and 6843 RoL/m3 in Satu Mare
2003
8478 RoL/m3 in Bucharest (September 2003)
Source: National Institute for Environmental Research and Engineering, 2002 and Apa Nova 2003
28 Petrosani has a very poor water abstraction source; the river Jiu is the water source but as well it is used for cleaning the coal at a
nearby coal mine so 8-12 hours/day it is not possible to supply safe drinking water.
30
UNDP/GEF Danube Regional Project
The mechanism for setting water tariffs is mainly regulated by the Governmental Ordinance 32/2002
regarding the Organization and functioning of public services for drinking water and sewage, amended
in 2003 by the Gov. Ordinance 35/2003. These regulations created the framework for W&WW
services. In providing W&WW services, MUs should follow some principles as:
· reliability of the service;
· equitable pricing;
· quality of services;
· transparency and public responsibility;
· consultation.
In providing W&WW services, some conditions must be fulfilled:
· continuity (qualitative and quantitative);
· adaptability to users demand;
· non-discriminatory access;
· observance of norms and regulations in the field.
The framework for W&WW services includes rules for funding the level of prices and tariffs. As a
general rule, prices and tariffs for W&WW are based on production costs, including variable costs and
fixed costs, maintenance and repair costs, amortization, other financial obligations as credit's interest
and principal, percentages for development of the system and profit for the company then is added .
In setting up the tariff's structure, for W&WW, must be observed several ideal conditions:
a) the level and the structure of tariffs are reflecting the full costs of providing the
W&WW services and is correlated with the users' affordability;
b) the financial autonomy of the MU is ensured;
c) MUs have the right to propose a two-part tariff with a fixed component, direct
correlated with the maintenance costs and a variable one linked to the volume of
water consumed;
d) the approval of tariffs is the duty of the local council with the consent of the NAMU.
In practice there are two major ways to get approved a change in the tariff if the local conditions are
changing (electricity price, raw water price, other commodities' price etc.).
I. Operators owned by local councils
The most common case is when a MU, owned by the Local Council is asking for a tariff increase for
W&WW; in this case it is needed a dossier to back up the demand and the consent of the NAMU; if
the Local Council agrees, the change of the tariff could be applied in a predetermined period of time;
if rejected there is no way to appeal but to draft a new dossier and start again the procedure;
The main rule for funding the tariffs for W&WW is based on production costs (operating costs, repairs
and maintenance, amortization of the fixed capital, interest for credits, development quota and a profit.
The profit share is limited at 10% of the total production cost, excluding the development share. The
development portion is limited up to 3% of the production cost but in special cases, local authorities
could establish a higher development quota. The development quota is accumulated in a special
account and could only be used only for the development of the network with the consent of the local
authority.
Adjusting the tariffs
A W&WW operator could ask for an adjustment of the tariff for drinking water or/and wastewater
every three months if the CPI changes with more than 3%. Formula used for adjustment is next:
p1 = p0 + Dp
where:
· p1 - adjusted tariff
· p0 existing tariff
Dr. Victor Platon, George Dulcu
National Profile of Municipal Water and Wastewater Management in Romania
31
· Dp increase of tariff
Dp = [Dct*(1 + r% + d%)]/Q
where
· Dct increase in total expenditure;
· r% - profit quota;
· d% - development quota
· Q quantity of water estimated for the year when adjustment take place.
Changing the tariffs
In cases when a significant increase of the production costs take place (as for instance making
operational a large new installation) or when, due to economic conditions, the operator registered an
increase of its cost more than 5% for three consecutive months, it is allowed a change of the tariff for
drinking water or/and wastewater.
The formula for changing the tariff is next:
p1 = p0 + Dp
where:
· p1 - adjusted tariff
· p0 existing tariff
· Dp increase of tariff
Dp = [Dct*(1 + r% + d%)]/Q
Where:
Dct = Dcv + Dcf
· Dcv increase of the variable costs
· Dcf increase of the fixed costs
Two part tariff
There is the possibility to use two part tariff (called binomial tariff). This tariff has two parts:
· one is the fixed part, depending of the fixed cost of the system;
· another one is the variable component, depending of the quantity of water used or
wastewater discharged by the subscriber.
These tariffs could be established at the demand of operators.
The binomial tariff should be applied if there are three cumulative conditions: there are meters at the
final users, agreement of the local authority, the binomial tariff is part of the supplying contract.
II. Operators that took in concession the W&WW service
In few cases in which W&WW services are in concession to a private company29, then a formula is
negotiated and included in the concession contract30; according to this formula an update of the tariff
could be made each to three months with the agreement of the NAMU and of the Local Council
(formulas for Ploiesti City are exposed in the Annex 7). The formulas have been asked by the
investors as shield to protect their profits.
For instance, in Bucuresti, the company that has the concession of the W&WW service could ask for a
change in tariffs, according to the contract, in three cases:
1. Ordinary adjustment: when inflation rate is higher than 5%, the national inflation rate at the
expenditures is applied in local currency and exchange rate depreciation is applied to
expenditures in EURO;
2. Extraordinary adjustment: it is applied when unexpected situations take place (changes in
legislation, grants available, subsidies etc.);
29 So far only Bucuresti and Ploiesti are in this situation.
30 Formulas are approved by Gov. Decision and published in the Official Gazette
32
UNDP/GEF Danube Regional Project
3. Adjustments necessary to achieve a certain level of services: it is applied according to the
contract
4.3 Tariffs for Wastewater
The level of tariffs for sewage, paid by inhabitants of a city, are determined according with the
formulas presented earlier. Some examples are presented in the Table 12.
Table 12: Average Sewage Tariffs, in Romania
1994
10 20 RoL/m3 in Bucharest and 17 RoL/m3 in the country
1997 350
RoL/m3 in Bucharest and 500-700 RoL/m3 in the country
2001 1165
RoL/m3 in Bucharest and 808 RoL/m3 in Baia Mare
2003 1879
RoL/m3 in Bucharest
Source: National Institute for Environmental research and Engineering, 2002 and Apa Nova 2003
The effluent charges are levied on a set of pollutants and aimed at reducing their content in the rivers
to within the limits set by the law. If the limits are exceeded, fines or penalties are levied. Penalties are
levied for non-compliance with the WMAu or contracts, for both water intakes and discharges of
wastewater. A list of charges and penalties applied by NARW is in Annex 8. From this list is easy to
see that the charges are very low; their main purpose is to raise revenues for NARW and for Water
Fund31 (only penalties).
The penalties are used as income for the Water Fund. The income from all water charges is used to
cover NARW operating costs. It does not include any financial resources for the development of raw
water infrastructures. To improve the economic mechanisms for water resources, the level of service
prices and water charges has been updated recently in line with the inflation rate; the fines for
violations have also been updated as well. The level of tariffs for sewage is presented in the Table 12.
5 Water and Wastewater Infrastructure
5.1 Infrastructure for Drinking Water
In 2001, in Romania, drinking water networks have had a length of 39104 Km and a capacity for
producing drinking water of 10.5 million m3/day (see Table 13). Across regions drinking water
network are even distributed without big discrepancies.
Table 13: Distribution Network for Drinking Water and Capacity of Drinking Water
Treatment Plants, in Romania, by Regions, (2001)
Total length of distribution
Capacity of drinking
networks
water treatment
Region
plants
(km) %
(m3/day) %
TOTAL country
39104 100
10,499,506
100
Region North-East
4452 11
1,249,870
12
Region South-East
6945 18
2,102,852
20
Region South
6473 17
1,137,001
11
Region South-West
3043 8
847,088
8
31 Water Fund is at the disposal of Water Department as a tool to support investment in raw water supply, floods prevention etc.
Dr. Victor Platon, George Dulcu
National Profile of Municipal Water and Wastewater Management in Romania
33
Region West
4864 12
1,164,198
11
Region North-West
6362 16
1,242,209
12
Region Centre
4770 12
1,300,402
12
Region Bucharest-Ilfov
2194 6
1,455,886
14
Source: Data from Annex 4
The National Report on Water Supply and Sewerage Systems in Romania, published by the Romanian
Water Association (RWA) in September 2000 revealed the following data regarding the infrastructure:
Water transport and distribution networks: the main materials used for the drinking water
supply pipes are: asbestos cement (45%), steel (30%) and cast iron processed under high
pressure (21%). Over 50% of the drinking water supply distribution networks are obsolete,
having exceeded their operational lifetime, therefore causing frequent breaks in the provision
of drinking water. The claim for the ineffective operation of meters for all drinking water used
was considered to be one cause of incorrect assessments of water losses.
Storage capacity. The total existing daily storage capacity of the tanks for drinking water
supply of localities at the national level was about 2.5 millions m3; compared to the total
volume of drinking water distributed in 1998, the demand for drinking water supply could be
covered only for about 11 hours/day.
5.2 Infrastructure for Wastewater
In 2001, the lengths of sewerage network was 16590.1 km and the capacity for treating wastewater
was 5.15 million m3/day (see Table 14). The sewerage network has a 15,525.8 km length in towns. The
length of the streets equipped with a sewerage network is of about 12,666.5 km covering about 49% of
the total length of the streets. From the streets that have water supply only 71% are equipped with a
sewerage network.
From regional point of view, the wastewater network is uniform distributed but there are significant
shortages. The biggest one is Region 8 (Bucuresti has no wastewater treatment plant) and in the
Region S-W where the shortage of treating capacity is important (4.5% of total treating capacity in
comparison with 8% of the length of the sewerage network).
Table 14: Network for Wastewater and Capacity of the Treatment Plants, in Romania,
by Regions, (2001)
Capacity of the
Total length of sewerage
Region
wastewater treatment
networks
plants
(km)
%
(m3/day)
%
TOTAL
16,590.1
100
5,151,739
100.0
Region North-East
2,460.6
15
1,113,483
21.6
Region South-East
2,430.6
15
651,818
12.7
Region South
2,005.5
12
882,327
17.1
Region South-West
1,352.5
8
229,746
4.5
Region West
2,054.1
12
731,324
14.2
34
UNDP/GEF Danube Regional Project
Region North-West
2,225.1
13
767,188
14.9
Region Centre
2,175.8
13
752,479
14.6
Region Bucharest
1,885.9
11
23,374
0.5
Source: Data from
Annex 6
Wastewater treatment plants. In 2001, in Romania were identified 1141 facilities for the treating the
wastewater, out of which 313 for treatment of wastewater from localities. From 313 only 162 were
properly operated.
From the total number of 602 wastewater treatment plants ineffectively operating, 61.5% are from the
industry sector, 25.1.0% from localities and 13.5% from agriculture (see Figure 3). There are 47
towns, including important urban centers as Bucureti, Craiova, Drobeta-Turnu-Severin, Brila,
Galai, Tulcea, that do not have wastewater treatment plants and eliminate used waters in the nearby
rivers.
In the period 1997-2001 it has been registered an increase of the sewage network with 1,088 Km (see
Table 16).
Dr. Victor Platon, George Dulcu
National Profile of Municipal Water and Wastewater Management in Romania
35
Table 15: Existing Wastewater Treatment Plants in Romania, 2001
Out of which
Total no. of
plants
Ineffectively
Total under
Activity
Properly operating
operating
construction
Number Number
%
Number
%
Number
Agriculture 111
30
27.0
81
73.0
-
Industry 717
347
48.4
370
51.6
1
Local utilities
313
162
51.8
151
48.2
2
Total WWTP
1,14132 539
42.0
602
58.0 3
Source: Adapted from National Company "Apele Române", ,,Synthesis of water quality in Romania in 2001, 2002"
13.5%
25.1%
Figure 3: Wastewater Treatment Plants
Ineffectively Operating, by Activity, 2001
Agriculture
61.5%
Industry
Local utilities
Source: The impact on industry, agriculture and local utilities systems of implementing directives 91/271/EEC, 98/83/EC,
76/464/EEC (and the seven "daughter" directives) and 91/676/EEC., Phare Project RO 9907-02-01: Pre-accession Impact
Studies., FINAL Report
erage Netw
Table 16: Evolution of the Sew
ork and Treatment of Municipal Wastewater,
in Romania (1997-2001)
(km)
Year/
Total Lengths of Sewerage
Total Lengths of Streets with Sewerage Pipes
Network
1997 15,502
11,684
1998 16,011
11,876
1999 16,080
12,177
2000 16,352
12,540
2001 16,590
12,666
2001/1997
107%
108%
Source: National Institute of Statistics, 2002
32 The ,,Synthesis of water quality in Romania in 2001", carried out by NCAR, includes a number of 304 existing and 9 under construction
"wastewater treatment plants" under the economic activity no.16: Water intake and processing for supplying water (p 135)
36
UNDP/GEF Danube Regional Project
5.3 Opportunities for Investment in Water and Wastewater
Infrastructure33
Because of the very low GDP, the amount of financial resources for water management investments is
not adequate in Romania. Due to this shortage, many important investments in diversion channels,
flood-control reservoirs and waste-water treatment plants have been stopped. For example, 31 waste-
water treatment plants just under construction cannot be completed for lack of finance; only one of
these, in Constanta, has received financial support from EU. In Bucuresti, the construction of the
wastewater treatment plant started in 1988 and has not been completed yet.
The need for new investments in the water sector is very high. For example, work on hot spots
identified under the Joint Action Programme for the Danube River Basin is prioritized for
implementation, and has been retained for financing under ISPA. The financial resources needed to
control the 10 municipal discharge "hot spots" have been estimated at 393 million, while the
consolidated34 State budget for 2000 on investments in water management was only 25 million.
Another 30 million is needed to solve the problems of industrial and agricultural "hot spots".
Most of the 286 projects retained in the 1999 NEAP concern water facilities. ISPA is anticipated to be
the key funding source for those projects. In the short term, ISPA will spend 1,053 million on waste-
water treatment and water management over a period of seven years (2006-2007). The minimum
domestic contribution to any project co-financed by ISPA is 25%, an amount that Romanian
municipalities will find difficult to afford in the present circumstances.
In order to calculate the necessary investment for water supply and sewerage services the following
things have been taken into consideration: the period necessary to be in line with the parameters asked
by the EU concerning water supply and sewerage is of 20 years in urban areas and 28 years for rural
areas, the population who will benefit from these services is in urban areas of about 12.3 mil
inhabitants and in rural areas around 7.9 mil inhabitants.
Romania would be integrated in EU in 2007 and in the negotiation process asked for 15 years
transition period for the EU Heavy Water Directives. Therefore, the time frame for urban areas is
about 20 years.
In 2003 a new National Environment Action Plan was drafted. The new NEAP identified four main
priorities: 1) water quality; 2) air quality and climate change; 3) waste management and 4) nature
protection, biodiversity and forest protection. In the field of water quality 28 project have been
analyzed and prioritized; all these projects are investment in W&WW systems in 28 cities. The total
estimated value is 614.34 million or 22 million /project. It is interesting that NEAP proposed a
financing scheme for all projects: 8% from the state or local budget, 9% own contribution, 12%
environmental fund, 41% foreign financing and 30% other sources. This means that only for water the
Environmental Fund should provide 73.7 million. Taking into account that in 2003 the
Environmental Fund collected approx. 12 million the assumption of the NEAP is unrealistic. As well
the heading "Others" means only for water 184 million . The whole measures in NEAP amounted to
1,9 billion of which from the Environmental Fund 225.2 million , foreign finance 781 million
and from other sources 576.6 million . These financial schemes proposed by NEAP raise serious
question marks one reason being that neither willingness to pay nor a realistic time frame was
estimated.
33 Data and information concerning investments were taken from The Ministry of Public Administration (for details see Annex 14)
34 The Consolidated State Budget includes the State Budget and all other budgets as those of local authorities.
Dr. Victor Platon, George Dulcu
National Profile of Municipal Water and Wastewater Management in Romania
37
5.3.1 Urban Areas
Governmental Strategy for Public Services35 estimated the need for investment in the water supply
sector and wastewater in urban areas. Unit values taken into account for estimating the needed
investment were the following:
· for drinking water stations 40 US $/inhabitant;
· for distributing and transporting drinking water
110 US $/ inhabitant;
· for
sewerage
network
100
US
$/
inhabitant;
· for wastewater plants 90 US $/ inhabitant.
A roughly estimation of the water investment costs is presented in Annex 9 where the number of
inhabitants from towns and municipalities in each county was multiply by unit cost mentioned above
for four categories of water investments. Therefore, the total necessary investment for rehabilitation
and for modernizing the system of water supply and sewerage and the coming into line with European
Water Directives is: total investments 4,173,205 thousand US $, out of which for drinking water
treating 490,965 thousand US $, for drinking water distribution 1,350,155 thousand US $, for
sewerage service 1,227,413 thousand US $ and for wastewater plants 1,104,672 thousand US $.
5.3.2 Rural Areas
The same mentioned paper has estimated the specific investment for new stations to supply drinking
water and sewerage services in rural areas. The total amount needed was calculated taking into
account that supplying water for 10,146,564 inhabitants will be completely achieved in 2017. In a first
stage the systems of supplying drinkable water will be provided by street pumps, and as sewerage is
extended there will follow a second stage for achieving individual connections. The average flow will
be 170 l/person and day. The sewerage network will be finished till 2030 and the wastewater treatment
plants will be built in 2-3 stages, starting with the mechanical part and continuing with the biologic
and a third stage if necessary.
Under these circumstances the specific investment will be: for drinkable water supply 250 US $/ rural
inhabitant and for sewerage and wastewater cleaning 350 US $/ rural inhabitant. For a roughly
estimation of the water investment costs in rural area was prepared the table presented in Annex 9 and
Annex 10 where in each county the number of rural inhabitants was multiply by units costs presented
above.
Therefore the Annexes 9 and 10 and are presenting the figures showing the necessary investments for
extending the system of drinking water supply and sewerage in rural areas. Total investments
5,407,205 thousand US$, out of which for drinkable water service 1,983,713 thousand US $ and for
sewerage 3,423,492 thousand US $ (for details see Annex 10). These strategies use to present very
ambitious goals without taking into account neither the willingness to pay nor the possibility to
mobilize such enormous amount of money (Annex 14).
35 National Strategy for the Development of Communal Public Services., Ministry for Public Administration., Bucuresti 20 august 2001
38
UNDP/GEF Danube Regional Project
6 Financing Water and Wastewater Services in Romania
6.1 Financing the Current Activities of Drinking Water and Wastewater
Services
In Romania, financing local services could be made in several ways, involving only local authorities
and/or MU:
· Granting subsidies trough the local budget for 100% of expenditures (the case of road
maintenance and green areas, parks etc.);
· Granting subsidies that cover a part of the cost of the service (heat and public transport);
subsidies could be granted directly to the service provider or to some social groups with low
revenues (mainly for public transportation and heating in winter period).
· Tariffs and charges that cover the running costs (mainly the W&WW services);
So, for W&WW services there is neither grant nor subsidy available from central government to cover
current costs (the same situation is for waste management). MUs should cover their expenditures only
from tariffs and charges.
According to the law36, tariffs should also provide a share for a development fund and a small benefit
for MU. Owing to the fact that in most of cases Local Councils want to keep tariffs down, many MU
are in red, registering loses. When the situation is aggravated by inflation or increase of the price for
other utilities and the power utilities threaten to switch off the power, Local Councils agree for an
increase of the tariffs and charges. In cases when a formula was agreed, then the increase of the tariffs
is made automatic.
In some areas, of low income or high unemployment, an important problem is that of unpaid bills for
W&WW associated with the bills for hot water and heating. There are cases of non-payment and the
delay in paying the invoices for drinking water supply and sewerage; there are some localities where
the average time until receipt of payment is more than 200 days. This was damaging in the period with
high inflation rate when long delays means a significant devaluation of the money received. In the last
period when inflation rate is down this delay reduced its consequence. In order to cover the lack of
liquidity, MUs use to have short term credits from commercial banks.
This situation has, as the main cause, the difficulties of cutting off from the system of those who do
not pay especially in big buildings with many flats.
On the other hand there are very high production costs generated by the bad technical condition of the
network and of the equipment. Thus, in the winter period when it is added the heat bill, the amount to
be paid becomes too high compared with the income of the population37; so unpaid bills are a severe
problem in areas where is in place an acute restructuring program for the industry. In most cases the
bill for W&WW is not so high, compared with families revenue and usually the bills are paid in due
time. The advance of metering made people more careful in paying their bills.
6.2 Financing the Investment in Water and Wastewater Infrastructure
Financing infrastructure investment, necessary for these services of great importance was made in the
past, by tradition, from the local budgets or transfers from the state budget. The MUs, either
36 Governmental ORDINANCE 32/2002 regarding the Organisation and Functioning of Public Services for Drinking Water and Sewage,
amended in 2003 by the Gov. ORDINANCE 35/2002.
37 For example, the prices for thermal energy, warm water, drinkable water and sewerage represent in wintertime the amount equal with
two medium wages for a family with four members, living in a three-room apartment. If the cost of electric energy, telephone bil and other
important services are added, all the costs represent more than 50% of their monthly income which is very much. The situation is much
worse for retired persons.
Dr. Victor Platon, George Dulcu
National Profile of Municipal Water and Wastewater Management in Romania
39
commercial companies or independent administrations, have very limited financial power due to the
small ratio of the profit (when there is any).
In Romania, environmental infrastructure projects and water projects as well could, in principle, be
financed up-front through the following mechanisms:
· The National Budget;
· Local budgets;
· Commercial loans and private investors;
· International Financial Institutions;
· The National Environmental Fund or Water Fund.
The National Budget
From the National Budget there are financed only investment for managing raw water sources, flood
protection, reservoirs, hydro dams and other water works.
In 1999, the Law on Local Administration established the financial autonomy of local government and
since, most environmental infrastructure is the responsibility of local government. As a consequence,
no funding is available from the central budget to develop local W&WW networks.
This lack of support from central government has until mid 2000 extended to a lack of any sovereign
guarantees for municipally raised loans. The Ministry of Finance has now established a guarantee fund
specifically for ISPA projects.
Local budgets
Local budgets are the main channel to finance water infrastructure and networks in towns and
communes. Even in the larger cities, in general, the local budget does not have the resources to finance
directly environmental infrastructure projects.
The low level of wages, linked with the high inflation rate, mean that consumers of municipal services
cannot afford to pay the increased tariffs which would be required to cover the investment costs for
improvements in infrastructure.
Therefore there is a severe problem throughout Romania in the financing of environmental
infrastructure projects from local budgets. This problem extends to the co-financing of ISPA supported
projects; the 25% minimum which is required as co-financing is still beyond the direct funding
capacity of local budgets (in some fortunate cases Local Councils managed to bring a contribution of
5%). Usually EBRD or EIB provided loans to cover the gap.
Commercial loans and private capital
Romanian municipalities cannot take loans from commercial banks but they could finance various
investment by issuing Municipal Bonds on the internal market with various rates and maturity periods.
Since 2000, LCs could issue municipal bonds on the national and international market within a limit of
20% of the local budget. This new financing method is becoming more and more used by
municipalities to undertake various development projects38. In principle the MUs could borrow,
particularly if supported by a municipal guarantee. Two commercial banks (Romanian Development
Bank and "Tiriac" Bank) have the mechanisms in place to provide this type of loan. As far as official
information is available, no such loans have been established, because of the transaction costs and the
bureaucracy involved.
38 In 2003 have been recorded 21 situations when municipalities issued municipal bonds in order to cover their investment cost. In 2002
the total amount of municipal bonds was 600 billion RoL (around 18 million ). Source: Data from the newspaper Adevarul from 9/02/2004.
40
UNDP/GEF Danube Regional Project
Private capital involvement is at its beginnings. There are some important examples of this kind in
Bucuresti and Ploiesti, in the field of drinking water network and sewage (a French company
negotiated a concession for W&WW services for 25 years, from 2000).
MUs have big difficulties in borrowing due to the fact that most of them operate in the red, the tariffs
are controlled by LCs, there are no miraculous sources, assets are owned by the LC etc. This is why
banks are reluctant to give long term loans for infrastructure projects in W&WW sector. There are
many other profitable business in which a bank could invest its money.
International Financial Institutions and bilateral donors
Loans for environmental infrastructure development must be provided without a sovereign guarantee.
That the only international financial institution that is normally available for this purpose is the
European Bank for Reconstruction and Development (EBRD).
The overall structure of such a financing scheme is next: up to 50% loan from EBRD, 50% grant from
Romanian Government or EU and 5% local sources.
For custom taxes and VAT (19%) the Romanian part is in charge. For projects financed by EU the
MoF could grant VAT exception if MoU is providing for this.
In Romania, various water works and programmes have been financed by bilateral donors as Danish
Government, Dutch Government, US (USAID) etc.
EU Financing (ISPA and PHARE)
EU is the biggest donor to environmental programs and water as well through the PHARE (Economic
and Social Cohesion component) and ISPA grant programmes. The main instrument for water
investment is ISPA, covering up to 75% of the value of the investment (mainly water supply systems
and sewage water and waste management).
The economic and social conditions in Romania mean that most beneficiaries (in the first phase only
towns with more than 250 000 inhabitants were eligible) find it difficult to provide co-financing of
ISPA projects beyond the minimum level of 25%. This is made particularly difficult owing to the fact
that the central Government does not contribute to ISPA co-financing.
However, since a primary objective of the ISPA programme is to maximize the additionally of the
ISPA grants, it will be a strategic objective of the Romanian ISPA Programme to encourage potential
beneficiaries to expect grants of less than 75% wherever this is feasible.
At present the predominant source of co-financing for the ISPA Programme (the 25%) so far has been
EBRD, there are also other sources. EIB is already involved thanks to the special arrangement of the
Ministry of Finance, and in some cases there is a small but significant contribution from the local
budget. Bilateral support has also been used (for example Danish co-financing39 in Piatra Neamt).
The ISPA Strategy will encourage these other sources of co-financing in addition to EBRD and to
support the development of the National Environmental Fund as a major source of ISPA co-financing.
National Environmental Fund and Water Fund
Romania has been the only country in central Europe without an Environmental Fund, which has
limited the country's ability to tackle environmental problems. In May 2000, a law was published and
ratified, then authorized by the President in June, which established a National Environmental Fund.
This Fund could receive financing from the pollution charges, central budget, from environmental fees
and fines, donations etc.
It was anticipated that this Fund will be fully operational in due time, and will represent an important
source of financing of environmental infrastructure projects, including the co-financing of ISPA
projects. This did not take place and the optimistic time limit for starting the operations is late 2004.
39 For details see next section
Dr. Victor Platon, George Dulcu
National Profile of Municipal Water and Wastewater Management in Romania
41
The Fund should do some steps as:
· establish internal mechanisms to finance environmental infrastructure projects, including
ISPA;
· elaboration of an investment strategy;
· elaborating the Project Cycle Manual;
In any case this fund will hardly finance any W&WW investment taking into account that there are no
revenues from the water sector and earmarking of revenues is preferred. As it was mentioned, the
Water Fund is used only for investment carried out by NARW.
Other Instruments
In the future, more than the grant-donation mechanisms should be initiated and completed with
alternative mechanisms such as:
- state-guarantee soft loans combined with revolving funds;
- financing by financial contracts in public-private partnership (BOOT, BOT);
- mixing up with other financial assistance programs (EU or WB programs);
- commercial banks loans and co-financing investment funds;
- better planning by grouping of projects by hydrographic basin basis in order to have a
scale effect.
As well, the privatization/concession process of the water infrastructure has to include the
environmental burden as compulsory. Particularly, the business sector needs to cover increased costs
to comply with EU legislation. For that reason the EU assistance instruments, inclusive ISPA, could
facilitate the investment efforts connected to the environmental standards, disclosed by PEPA reports
(at European level), and twinning reports (at National level).
6.3 Water and Wastewater Investment Co-Financed with Foreign Aid
In the last 3 years several international programmes financed W&WW projects in Romania. We have
to mention that these projects are not special tailored for W&WW but for other general goals as
environmental protection (waste management, drinking water supply and wastewater treatment),
improving municipal facilities, rural development etc.
1. ISPA program
The biggest programme is ISPA, addressing issues in the field of transport and environment (water
and waste management). Up to present, 33 ISPA Financing Memorandums have been signed by
Romanian authorities, with a total amount of 1,6 billion euro, representing 70% of the EU contribution
for the period 2000-2006. There are more than 20 W&WW projects financed under ISPA (see Annex
11). The amount of the W&WW projects financed by ISPA is more than 680 million . Many cities as
Arad, Buzu, Brila, Braov, Cluj-Napoca, Constana, Craiova, Focani, Iai, Oradea, Timioara,
Pacani, Satu-Mare, Sibiu, Piatra-Neam, Târgu-Mure, Valea Jiului will carry out W&WW projects
(see Map 5). The strategy for ISPA was to begin with larger cities with a population bigger than
250000 inhabitants and later on to continue with small cities. As the ISPA financing covers only 75%
of the investment and 25% have to be local contribution, all municipalities have to find ways to cover
their share. For this loans from EBRD and EIB have been used.
2. Loans from EBRD and EIB
EBRD financed several W&WW projects in Romania: in Iai, Braov, Constana and Arad (around 55
million ); a part of these projects have received the state guarantee while others not (see Annex 12).
As well EIB financed projects for improving water networks. Both institutions co-financed several
42
UNDP/GEF Danube Regional Project
ISPA projects. Some of the projects for W&WW received state guarantee while others did not. Several
cities as Brila, Cluj, Craiova, Focani and Pacani got loans from EIB for co-financing W&WW
projects. As well should be mentioned the loan of 25 million from EBRD to rehabilitate the water
supply system in Bucuresti.
3. PHARE co-financing
There are few PHARE programs that finance the modernization municipal infrastructure, including
W&WW infrastructure. One of these is SAMTID program that has a total value of 380 million . The
financing scheme is next: 50% loans (50 million from EBRD, 140 million from IEB) and 50%
grants ( 40 million from the National Fund - local contribution fro the state budget - and 142 million
is EU contribution from the Social and Economic Cohesion fund).
SAMTID was designed to cover investment needs for small and medium towns that do not have
access to ISPA financing. Local authorities will finance costs related to project design, feasibility
study, environmental impact assessment study and other documents needed.
4. SAPARD financing
The Objectives of SAPARD are two fold: to assist in implementing the acquis communautaire in
agriculture and rural development and to solve priority and specific problems related to developing a
sustainable agricultural sector and rural areas. SAPARD has a budget of 150 million for the period
2000-2006 and 50 million from the Romanian Government
From the 11 measures to be financed it is important to mention the Measure 2: Improving
infrastructure for rural development and agriculture. This measure has a total budget of 438.77 million
euro (329.08 million is EU contribution). Two sub-measures are important for W&WW sector:
· Drinking water supply systems for rural areas: building new water supply systems and
upgrading or/and extending the existing ones (spring water catching, water supply, water
treatment stations, tanks for water storage, plumbing stations, distribution network etc.);
· Centralized systems sewerage in rural areas: building new sewerage systems and
extending/upgrading the existing ones (network of wastewater collecting pipelines,
wastewater treatment plants, pumping stations and wastewater evacuation pipelines).
SAPARD projects should be carried out in rural areas and the value of a project should be between 0.1
and 1 million . For projects that do not generate substantial net benefits the contribution from
SAPARD may be up to 100% of the total eligible costs.
5. Bilateral assistance
Apart from the assistance delivered by international institution, Romania took advantage from bilateral
assistance granted by developed countries. In the field of environment countries as US, Denmark and
the Netherlands have a very important contribution.
5.1. PSO the DUTCH programme of cooperation with East-European countries
PSO has been formulated in response to the need of developing sustainable trade relationships and
industrial partnerships with East-European countries. Within this bilateral programme, the projects are
carried out by the Netherlands through SENTER agency of the Ministry of Economic Affairs and
the beneficiary country, on the basis of an Intergovernmental MoU.
For Romania, this Memorandum covers the following cooperation fields: agriculture, industry and
technology; transport and infrastructure, small and medium-sized enterprises; Romania's preparation
for accession to the European Union.
PSO Projects
A PSO project is a package of activities aimed at improving the business performances of the
Romanian partner. To this end, the PSO projects have to be practical, to lead to visible, clear and
Dr. Victor Platon, George Dulcu
National Profile of Municipal Water and Wastewater Management in Romania
43
quantifiable results. The best ways to achieve this are the transfer of technology and improvement of
working methods.
The non-reimbursable financial assistance of the Netherlands covers the activities within PSO, while
the Romanian partners covers the local costs, such as wages of the staff involved in the project, the
working location, local transport or translation services.
The PSO projects have in general a duration of two years and a budget between approx. 250,000
1,000,000 .
Starting with 2001, an ecologic component is binding in all the PSO projects in the field of agriculture,
transport and industry. In the water sector three recent projects should be mentioned (see Table 17):
· The project called Implementation of the Water Framework Directive has the wider
objective to assist Romania with its compliance efforts in relation to the Acquis
Commaunitaire (water sector) and thus facilitate the country's accession into the EU. The
immediate purpose of the project was to support at national level the former Ministry of Water
and Environmental Protection (now the Water Department in Ministry of Agriculture,
Forestry, Waters and Environment) and NARW and at river basin level Directorate Mures
Branch in Tirgu Mures, with the implementation of the Water Framework Directive. This
project, with the pilot activities in the Mures river basin, assists in further developing the skills
of the Romanian experts and other parties in the field of integrated water management at river
basin level.
· The project called System Management for contingency in case of accidental or deliberate
marine pollution with harmful substances has as immediate purpose to assist the Romanian
authorities in the preparation of a National Contingency Plan for combating marine pollution
by harmful substances.
· The project called Implementation of the Water Framework Directive (WFD) and Integrated
Coastal Zone Management (ICZM) in transitional and coastal waters in Romania has the
purpose to help Romanian authorities for the elaboration of an integrated management plan for
sea waters.
Table 17: Water Management Projects Financed by the Netherlands
Title of the project
Budget
Executing Agency
Beneficiary
Duration
Thou.
System Management for
Ministry of Water and January 2003-
contingency in case of
Royal Haskoning BV
Environmental
December
accidental or deliberate
428
and Rijksinstitute voor Protection
2004
marine pollution with
Kust and Zee/RIKZ
NARW
harmful substances
Implementation of the
Ministry of Water and 01/01/2002
Water Framework
Arcadis Euroconsult
Environmental
31/12/2003
Directive
500
Bv (cooperation with
Protection
ICIM and RIZA)
NARW
Implementation of the
Ministry of Water and 01/01/2003-
Water Framework
Environmental
31/12/2004
Directive (WFD) and
Protection
Integrated Coastal Zone
503
Royal Haskoning BV
NARW
Management (ICZM) in
transitional and coastal
waters in Romania
Source: Data from SANTER., 2004
44
UNDP/GEF Danube Regional Project
6.4 Bilateral Assistance Granted by Denmark
In 1990, Danish Government created the following programmes for co-operation with CEE countries:
found for democratization; investment fund; environmental fund; sectoral fund; programme for
administrative assistance; fund for projects.
Since 1998, Danish co-operation was restricted to two areas : environment and pre-accession issues.
General objectives for environment assistance were: Investment in environmental protection,
limitation of the pollution locally and regionally, technological transfer of clean technologies and
sustainable development, democracy support, improving market economy, economic development
environmental friendly.
Selected projects were in the areas such as:
- Modernization of sewage plants (for details see Annex 13);
- Water supply (for details see Annex 13);
- Waste management;
- Reducing air pollution in some industrial sectors as: cement industry, furniture, power plants,
chemical industry etc.;
- Introducing clean technologies;
- Power sector rehabilitation ;
- Managing protected areas.
In 1995, with help from DEPA, Romanian authorities drafted the National Action Plan for
Environment; in 1997 this plan was revised and completed with help from DEPA.
In early stages projects were small ones (total 2 million Euro/year) but now the total assistance
amounted to 8 million Euro/year. All environmental projects financed by Danish Gov. amounted to
more than 20 million Euro.
Latest development
In 2002 was signed the new MoU regarding the assistance granted by Denmark. In principle the
assistance will cover the next areas: agriculture/PAC/SAPARD instrument, internal market, structural
funds, staff training in administration at central and local level;
6.5 Bilateral Assistance Granted by the US
In the field of water management USAID programs have started in Romania since 2001. The most
recent ones are:
· DESWAT project that will create an early warning system in case of floods and accidental
pollution; the project will implement 605automatic monitoring stations for the quantity and
quality of inland waters, realization of some basin centers and a national centre for
forecasting (the project will be implemented in the period 2003-2007); the main beneficiary
is NARW;
· WATMAN project will create an integrated management system of the water resources;
trough this project will be created 11 centers of rapid intervention, modernizing of the
existing informational system, system for allocating water resources; the main beneficiary is
NARW.
Dr. Victor Platon, George Dulcu
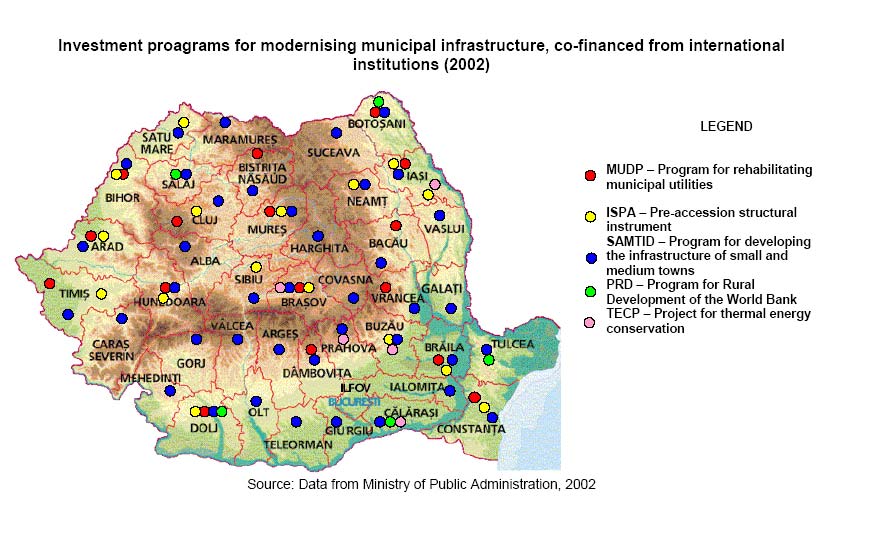
National Profile of Municipal Water and Wastewater Management in Romania
45
Map 5
7 Management Units (MUs)
In Romania, there are 268 municipalities and towns and 1423 communes with systems to distribute
drinkable water. Not all communes have W&WW networks; the peoples use to take the water from the
underground reserves from wells in the soil.
7.1 Types of Management Units and their Operation
In 2001, public services of communal husbandry was offered by a number of 556 MUs, subordinated
to the local public administration authorities or operating with private capital; there were registered 74
Autonomous Regie and 482 commercial companies (Limited Liability Companies, stock companies
etc.). Considering the participation with capital, commercial companies could be divided into the next
categories:
· 216 commercial companies with 100% capital owned by the local authorities;
· 30 commercial companies in which local public authorities have contributed with more than
50% capital;
· 236 commercial companies where local public authorities have contributed with less than
50% capital.
In time the situation changes owing to the fact that a consolidation process is taking place. Taking into
account that some W&WW operators are not efficient due to the small operating size, the Strategy for
sustainable development of the W&WW services estimated that the number of W&WW operators will
decrease up to 80-100 in 2007 and up to 40-50 in 2015.
These companies have a great diversity of their activity profile. The most frequently activities were
waste management, water management, sewerage, sometimes local transport and heating.
In all these companies, in 2000, employed 155,802 persons, and in 2001, employed 152,759 persons.
The wages, paid to the persons working in companies subordinated to the authorities of the local
public administration amounted in 2000 to 5,048,148 RoL, and in 2001 to 6,473,822 RoL. The
average monthly wage in the field, in 2000, was 3,3 million RoL.
46
UNDP/GEF Danube Regional Project
Regarding the economic-financial situation of the companies subordinated to the local public
administration authorities, in 2000, as a result of the balance, 223 operators had profits, while 98
operators had losses.
In localities, all responsibility for organizing, administration, management and monitoring of drinking
water and wastewater services comes under the umbrella of the Local Council, which is the owner of
the public assets, networks etc.
From the administrative point of view the public services of communal water and wastewater are of
local interest. MUs are organized and function in co-operation with the public local authority after the
following principles:
· the public local authority owns public or private assets which it uses to supply the services;
· the operators, irrespective of their juridical status, can operate on the basis of a contract of
delegation won by auction;
· the contract for delegating services and the rules of delegation are made after a model
contract elaborated by the RUs (mainly NAMU);
· all operators will be licensed by the NAMU in accordance with a approved procedure;
· the contract of delegating services and the regulations will be monitored by the local
authorities and supervised by NAMU;
· the tariffs and their indexation are going to be verified by NAMU;
· the activity of the operator managers will be evaluated by contract and performance criteria;
In order to get the performances of quality and costs NAMU has to evaluate the operator's
performances in the field of public services of communal water and wastewater using a benchmarking.
To use the balance between cost and recovering and permanently control the fare which must cover all
costs without exaggerated profits and having a development component. Wages will be at the level
negotiated with the trade unions, observing the regulations and to separate the water and wastewater
services from social protection. The social protection for the population with a low income, have to be
ensured by special programs financed by the local or state budget.
7.2 Trends in Formation and Consolidation of MUs
The provisions of Law No. 215/2001 of the Local Public Administration and Law No. 326/2001 of
Public Services of Communal Husbandry, together with the former regulations namely Law No.
23/1998 regarding public property and its judicial regime and Law No. 219/1998 regarding the
granting regime create a coherent framework, which could support the organizing and administration
of the public services for water and wastewater. The provisions of these laws are very important:
· a distinction can be made between the owner of the assets, namely the public local authority
and the operator, which can have 100% public capital, joint or 100% private;
· no matter the judicial condition of the operator, the local authority delegates the
administration by using a contract and the operator will be selected by a competitive bidding
process;
· the contract delegating system management and operations the labor rules will follow the
model given by the Ministry of Public Administration and put into practice by an order of
the Minister of Public Administration;
· all operators, no matter their judicial status must get an operating license from NAMU;
The transposition of EU legislation will have an important effect on creation of new MUs.
Agglomeration of localities that have a population equivalent bigger that 2000 inhabitants have to
build W&WW networks, according to the latest estimate of the 11 branches of NARW. There are
2609 agglomeration with more than 2000 inhabitants:
· 2346 agglomerations with a population between 2000 10000 inhabitants;
Dr. Victor Platon, George Dulcu
National Profile of Municipal Water and Wastewater Management in Romania
47
· 111 agglomerations with a population between 10000 15000 inhabitants;
· 131 agglomerations with a population between 15001 150000 inhabitants.;
· 21 agglomerations with a population with more than 150000 inhabitants.
Combining small localities for the creation of W&WW networks will be a complicated problem.
Out of the 2609 agglomerations, 453 agglomeration have sewage systems and 340 agglomeration have
wastewater treatment plants. Out of these only 11 wastewater treatment plants and two sewage
systems are in compliance with EU legislation.
8 Policy Issues
Romania's water system is broadly developed and we could say that quantitatively, the water
resources are sufficient to cover the national water demand. In particular, hydro structures have spare
capacity and are generally sufficient to manage floods and droughts. One important problem arise
from the fact that there are geographical differences of the rivers' debit and significant seasonal
variations: there are seasons with high precipitation level and other season when the rain is missing for
long periods. Owing to this peculiarity in Romania many reservoirs have to be developed in order to
retain water.
From the previous sections of the study we have identified the next policy issues.
8.1 Issue 1: Water Consumption and Wastewater Generation
In Romania could be identified three major water pollution problems:
1. The degradation of quality raw water has been caused mainly by untreated waste-water
discharges from municipalities: only 18% of municipal wastewater is treated properly. The
capital city, Bucharest, and other important cities still do not have waste-water treatment
plants;
2. The degradation of groundwater is important;
3. Accidental pollution from industrial tailing ponds is also a serious problem.
We could identify three water allocation problems.
Water allocation problem (I)
Industry (including energy production) is still responsible for 60% of raw water demand. An effort
should be made to reduce this consumption.
The demand for drinking water for household purposes is still at a high level. This is, in fact, due to:
· water losses in the obsolete distribution networks, and
· very largely to water wastage by the consumers caused by:
o the bad state of household plumbing,
o cuts in water supply in some areas.
Water allocation problem (II) a
The result of high drinking water consumption is a correspondingly excessive volume of diluted
wastewater generated by the users. As a consequence, it is needed a correspondingly oversized sewage
network and waste-water treatment facilities, and unnecessary investment
After 2001, when started the process of metering the apartments in block of flats, the water
consumption decreased significantly (in some cases by 40-50%).
Water allocation problem (II) b
After metering process will end and leakages will be reduced than the water consumption could be
stabilized at a lower level (150-250 l/inhabitant/day), comparable with other CEE countries. In this
situation it may result an overcapacity in water supply. On one hand this could be regarded as a
reserve capacity in case of expanding the network or the population will increase. On the other hand
the overcapacity brings important maintenance costs that has an influence on existing tariffs.
48
UNDP/GEF Danube Regional Project
New investments, especially in municipal water supply and waste-water treatment plants, should take
into account the likely drop in water consumption which should be brought about by an improvement
of the water supply network, water metering and pricing system.
Dr. Victor Platon, George Dulcu
National Profile of Municipal Water and Wastewater Management in Romania
49
Reform Proposal (I) a
The reduction of excessive drinking-water use caused by water wastage and losses should be a priority
in the rationalization of water use in Romania. To solve this problem, it is necessary to:
· Rehabilitating the water supply system and ensure continuous supply of drinking water and
hot water where centralized hot water supply systems exist. This implies the rehabilitation
and upgrading the water supply systems and household installations; In this way we may
register joint benefits: 1) reducing losses and 2) improving reliability. The later effect may
increase water consumption but the increased reliability will also increase the value of the
service and the willingness to pay more for that service.
· In case of hot water supply a feasibility study should be carried out in order to show the
viability and the efficiency of this solution40.
Reform Proposal (I) b
· Extending the installation of individual cold and hot water metering;
· Developing economic incentives to encourage owners of buildings and flats to repair their
water infrastructures.
As an example, if a person will improve his water infrastructure to be allowed to deduce the
expenditures from his tax bill, at the end of the year or to provide some subsidized loans to make the
repairs.
8.2 Issue 2: Municipal Water Tariffs
Tariffs and charges are too low to provide resources to MUs for any new investment or the complete
overhaul of obsolete networks. The tight State and local-authority budgets make it impossible to
develop the construction programmes for new water management facilities and waste-water treatment
plants. Available foreign aid is not even sufficient to solve the problems of identified hot spots, and
demand an additional domestic contribution that Romanians are unable to afford.
A vicious circle is in place:
1) losses and impossibility to finance new investment 2) minimum development fund (if any) 3)
minimum investment for replacement 4) significant raise of the maintenance costs owing to old
equipment
5) reducing the profit of the Management Units (MU) 1) losses and impossibility to
finance new investment
To aggravate this circle MU should face significant water losses on the network and delays in payment
of the water and sewage bills.
Reform proposal II
Investing in controlling water losses in order to brake the vicious circle:
1) Financial analysis 2) Investment to reduce losses 3) Benefits resulting from loss reduction
(cost reduction) 4) More revenues for MUs 5) Increasing benefit
By tariff reduction it could be demonstrated that investing in water loss control is valuable.
8.3 Issue 3: Economic Sustainability of the Water Utility
Economic sustainability of MUs is poor. It is very difficult to raise the capital needed for development.
Therefore there is a severe problem throughout Romania in the financing of environmental
infrastructure projects from own MUs sources or from local budgets. This problem extends to the co-
40 In some cases could be preferable individual heaters.
50
UNDP/GEF Danube Regional Project
financing of ISPA supported projects; the 25% minimum which is required is still beyond the direct
funding capacity of local budgets.
On the one hand there are difficulties in raising tariffs owing to limited affordability to pay and on the
other hand private finance is not accessible.
So far, Municipalities are allowed to issue bonds on the internal financial market up to 20% of the
budget value.
Reform proposal III
In the future, taking into account the enormous task to introduce W&WW systems in the rural area and
to upgrade that existing in towns, more than the grant-donation mechanisms should be initiated and
completed with alternative mechanisms such as: state-guarantee soft loans combined with revolving
funds;
State Revolving Fund could complement ISPA grants. This will reflect the growing financing
responsibilities of local authorities and encouraged the increase of efficiency and cost-recovery in
program implementation. State Revolving Fund is a credit mechanisms capitalized from grants (either
from state budget or from EU) and co-financing local contribution in W&WW investment (80 percent
and 20 percent, respectively). The Revolving Fund will provide low-interest rate loans and other non-
grant assistance to local and municipal authorities to build or improve sewage treatment systems and
water supply.
As a result of the change from grant to loan mechanism, the increase in household user fees could be
as high as 20 percent and annual adjustments in charges will become common. Additionally, the
incentive to construct lower cost facilities to minimize the impact of capital costs on user fees will
increase. As a result of shrinking grant funding, states and municipalities will have to find alternative
channels of financing, and were forced to require greater efficiency and greater cost-recovery in
service provision. With increased cost-recovery, market-based financing schemes will gain larger
acceptance.
This fund will be an earmarked fund and all wastewater system costs will be financed from sewer
related revenues accruing to the Fund. Such revenues include sewer service charges, industrial waste
quality surcharges, inspection and other fees.
Taking into account that W&WW service will provide constant revenues in long run, the Fund will not
be short on money. This Fund could be supervised by Min. of Public Administration and Interior.
9 ANNEXES
Annex 1: Evolution of the Exchange Rate - ROL/USD or EURO -
Year USD EURO*
1985 17.14
N.A.
1986 16.15
N.A.
1987 14.56
N.A.
1988 14.28
N.A.
1989 14.92
N.A.
1990 21.56
N.A.
Dr. Victor Platon, George Dulcu
National Profile of Municipal Water and Wastewater Management in Romania
51
Year USD EURO*
1991 76.47
87.81
1992 307.95
400.00
1993 760.01
884.60
1994
1 655.09
1 967.14
1995
2 033.28
2 629.51
1996
3 082.60
3 862.90
1997
7 167.94
8 090.92
1998
8 875.55
9 989.25
1999
15 332.93
16 295.57
2000
21 692.74
19 955.75
2001
29 060.86
26 026.89
2002
33 055.46
31 255.25
Source: Data from the Romanian National Bank, 2003
52
UNDP/GEF Danube Regional Project
Annex 2: EU Water Directives Transposed in Romanian Legislation (March 2003)
1. Directive no. 91/271/EEC regarding urban sewage waters
Transposed by:
· Government Decision no. 188/2002 regarding some norms to discharge used water into
natural waters (Official Journal no.187/ 20 March 2002).
2. Directive no. 75/440/EEC regarding the quality of surface waters designated for
drinking water
Transposed by:
· Ministerial order no. 377/2001 regarding the approval of the norms for surface water
quality.
· Gov. Decision no. 100/2002 for the norms to measure and associated frequency for
analysis for the surface water designated for extraction and preparation of drinking
water.
· Ministerial order no. 1146/2002 for classification of the quality of the surface waters
(Official Journal 197/ 27 March 2003).
3. Directive nr. 91/676/EEC regarding water protection from nitrogen fertilizer
from agriculture sources
Transposed by:
· Ministerial order no. 740/08.08.2001 for the approval of the Commission for the Action
Plan for protecting waters from fertilizer fro agriculture sources.
· Ministerial order no. 918/ 8.10.2002 for approvals of the Code of good practice in
agriculture, for farmers.
4. Directive no. 76/464/EEC regarding pollution from some dangerous substances
discharges into waters (and 7 Daughter Directives).
Transposed by:
· Gov. Decision no.118/2002 for the approval of the Action Plan for protecting waters from
pollution from some dangerous substances discharges into waters.
5. Directive no. 76/160/EEC regarding the quality of water for bathing
Transposed by:
· Gov. Decision no. 459/2002 for approving the Norms regarding the quality of water for
bathing in special places for public recreation.
6. Directive no. 78/659/EEC regarding fresh water quality that support fish live
Transposed by:
· Gov. Decision no. 202/2002 for approving the Norms regarding the quality of water for
supporting fish environment (Official Journal 196 from 22 March 2002).
7. Directive no.79/923/EEC water quality for mollusks
Transposed by:
· Gov. Decision no. 201/2002 for approving the Norms regarding the quality of water for
mollusks.
· Emergency Ordinance 202/2002 for managing coastal area
Dr. Victor Platon, George Dulcu
National Profile of Municipal Water and Wastewater Management in Romania
53
8. Directive no. 98/83/EC regarding drinking water
Transposed by:
· Law no. 458/2002 regarding drinking water (OF. Journal no552/29.07.2002)
9. Water framework directive no. 2000/60/EEC
Transposed by:
· Min. Order no. 913 from 15.10. 2001 regarding the approval of the Plan for Basin Water
Management
· Min. Order no. 1125 from 03.12.2002 for approving the Committee for Coordination and
Monitoring of the implementation of the Water Framework Directive and other water
Directive
10. Directive no. 80/68/EEC regarding the protection of the underground waters
from pollution with some dangerous substances
Transposed by:
· Min. Order no. 1049 from 13.11.2002 for approving the Plan of Measures for reducing and
eliminating the risk of polluting underground waters
54
UNDP/GEF Danube Regional Project
Annex 3: Number of Localities with Drinking Water and Sewerage Networks, in 2001
Number of localities with drinking water Number of localities with sewerage
network
network
Region County
Municipalities and
Municipalities and
Communes
Communes
towns
towns
TOTAL 265
1383
264
383
Region North-East
32
212
32
94
BACAU 8
51
8
39
BOTOSANI 4
39
4
15
IASI 4
22
4
8
NEAMT 4
36
4
9
SUCEAVA 8
28
8
18
VASLUI 4
36
4
5
Region South-East
33
236
33
47
BRAILA 4
31
4
3
BUZAU 4
52
4
3
CONSTANTA 11
48
11
15
GALATI 4
27
4
13
TULCEA 5
36
5
9
VRANCEA 5
42
5
4
Region South
43
218
42
49
ARGES 6
58
6
13
CALARASI 5
27
4
2
DIMBOVITA 6
34
6
4
GIURGIU 3
5
3
1
IALOMITA 4
32
4
1
PRAHOVA 14
54
14
23
TELEORMAN 5
8
5
5
Region South-West
32
126
32
21
DOLJ 5
4
5
3
GORJ 7
25
7
6
MEHEDINTI 5
28
5
6
OLT 7
47
7
2
VILCEA 8
22
8
4
Region West
37
149
37
40
ARAD 8
56
8
13
CARAS-SEVERIN 8
20
8
6
HUNEDOARA 14
18
14
12
TIMIS 7
55
7
9
Region North-West
35
265
35
67
BIHOR 9
54
9
12
BISTRITA-NASAUD 4
23
4
8
CLUJ 6
65
6
23
MARAMURES 8
52
8
16
SATU MARE
4
34
4
6
SALAJ 4
37
4
2
Region Centre
50
159
50
50
ALBA 11
39
11
3
BRASOV 9
24
9
5
COVASNA 5
12
5
7
Dr. Victor Platon, George Dulcu
National Profile of Municipal Water and Wastewater Management in Romania
55
Number of localities with drinking water Number of localities with sewerage
network
network
Region County
Municipalities and
Municipalities and
Communes
Communes
towns
towns
HARGHITA 9
27
9
5
MURES 7
48
7
27
SIBIU 9
9
9
3
Region Bucharest
3
18
3
15
ILFOV 2
18
2
15
BUCURESTI 1
1
1
1
Source: Data from National Institute of Statistics, 2002
56
UNDP/GEF Danube Regional Project
Annex 4: Drinking Water Distributed in Romania, in 2001
Total
Total
Capacity of
Drinking
Drinking water distributed to the users
length of
length of
drinking
water
(thou. m )
3
distribution
streets
water
introduced
Region County
out of which:
networks with water
treatment
in
networks
plants
networks
TOTAL
(km)
Domestic use Public use
(km)
(m /day)
3
(thou m )
3
TOTAL 39,104
30,334.9
10,499,506 2,397,477 1,530,241
988,359
200,,207
Region North-East
4,451.6
3,071.1
1,249,870
272,768
182,040
115,665 18946
BACAU
7
53.4 604.5
137,729
60,739
44,645
30,977 4,276
BOTOSANI 695.3 488.9
191,053
25,648
15,245
8,277 1,319
IASI 957
513.7
358,612
80,939
61,175
36,290 4,452
NEAMT 678.7 528.8
172,661
39,572
21,635
16,494 5,141
SUCEAVA 660.4
472.4
233,985
42,946
24,852
11,872 2,444
VASLUI 706.8 462.8
155,830
22,924
14,488
11,755 1,314
Region South-East
6945
5,665.8
2,102,852
382,261
203,039
150,529 15,692
BRAILA 1,172.4 809.4
150,310
22,602
19,180
14,944 285
BUZAU 1101
1,008.3
165,831
28,249
24,466
19,287 3,920
CONSTANTA 1,982.8
1,660.2
1,218,172
221,566
80,929
52,093 5,805
GALATI 907.2 639.7
348,847
68,647
45,653
36,652 1,115
TULCEA 913.6 810.1
121,556
15,640
15,606
13,224 1,829
VRANCEA 868
738.1
98,136
25,557
17,205
14,329 2,738
Region South
6,473.4
4,850.1
1,137,001
255,656
180,921
131,744 16,623
ARGES 1593
1,013.5
294,232
72,250
47,252
31,350 3,046
CALARASI 694.3 528.6
126,464
12,085
11,572
85,96 2,976
DIMBOVITA 630.7 585.9
137,602
35,543
29,070
22,300 2,263
GIURGIU 150.2 105.8
64,491
9,460
7,931
6,064
174
IALOMITA 769.1 667.2
99,550
21,949
13,297
10,141 1,563
PRAHOVA 2,199.7 1,670.2
237,923
87,097
57,291
42,603 4,496
TELEORMAN 436.4 278.9
176,739
17,272
14,508
10,690 2,105
Region South-West
3,042.9
2,503.7
847,088
163,352
121,180
83,806 16,916
DOLJ 709.1 506.6
397,286
50,042
38,212
26,448 3,780
GORJ 709.3 561.7
85,737
25,849
22,711
15,363 1,352
MEHEDINTI 470.7 394
137,535
31,668
17,538
12,878 812
OLT 632
545.1
118,115
23,034
18,341
13,166 2,840
VILCEA 521.8 496.3
108,415
32,759
24,378
15,951 8,132
Region West
4,864.7
4,097.1
1,164,198
208,571
142,957
98,246 16,828
ARAD 1,552.8 1369.2
297,787
44,957
39,642
26,387 4,891
CARAS-SEVERIN 580.9 440.9
123,753
28,237
21,693
13,199 937
HUNEDOARA 931.3 658.1
374,936
58,213
32,560
22,537 6,494
TIMIS 1,799.7 1628.9
367,722
77,164
49,062
36,123 4,506
Region North-West
6362
4,586.9
1,242,209
225,110
168,188
116,171 29,697
BIHOR 1368 994.7
273,300
45,714
34,671
23,334 2,812
BISTRITA-NASAUD 620.9 329.8
156,171
20,677
12,524
5,922 2,074
CLUJ 1,788.6 1,408.4
378,082
74,904
61,883
42,182 17,310
MARAMURES 1,362.7 859.7
185,750
42,455
30,473
20,961 4,047
SATU MARE
537.9
484.8
155,212
27,965
18,095
15,230 2,865
SALAJ 683.9 509.5
93694
13,395
10,542
8,542
589
Dr. Victor Platon, George Dulcu
National Profile of Municipal Water and Wastewater Management in Romania
57
Total
Total
Capacity of
Drinking
Drinking water distributed to the users
length of
length of
drinking
water
(thou. m3)
Region County
distribution
streets
water
introduced
out of which:
networks with water
treatment
in
TOTAL
(km)
networks
plants
networks
Domestic use Public use
(km)
(m3/day)
(thou m3)
Region Centre
4,770
3,699.3
1,300,402
288,505
226,779
148,390 30,806
ALBA 767.5 625
172,888
48,846
40,448
12,761 3,469
BRASOV 1,293.1 965.3
366,786
65,330
52,426
37,118 6,534
COVASNA 332.2 257.5
86,802
17,685
13,462
8,883 612
HARGHITA 886
713.3
137,856
68,471
60,937
51,862 7,194
MURES 884
643.9
272,751
37,551
26,694
15,211 3,085
SIBIU 607.2 494.3
263,319
50,622
32,812
22,555 9,912
Region Bucharest-
2,194.4 1,860.9
1,455,886
601,254
305,137
143,808 54,699
Ilfov
ILFOV 113.4 89.7
20,886
30,504
4,666
3,792 614
BUCURESTI 2,081
1,771.2
1,435,000
570,750
300,471
140,016 54,085
Source: National Institute of Statistics, 2002
58
UNDP/GEF Danube Regional Project
Annex 5: Leakage and Metering of Drinking Water, in 2001
Drinking water
Percentage
Drinking water distributed to the users (thou cm)
Region County
introduced in
of leakage
networks (thou cm)
Distributed to the users
Percentage of
(%)
Total
with metering devices
metering (%)
TOTAL 2397477
36.2
1530241
1123832
73.4
Region North-East
272768
33.3
182040
148530
81.6
BACAU 60739
26.5
44645
40672
91.1
BOTOSANI 25648
40.6
15245
10215
67.0
IASI 80939
24.4
61175
54190
88.6
NEAMT 39572
45.3
21635
19300
89.2
SUCEAVA 42946
42.1
24852
19090
76.8
VASLUI 22924
36.8
14488
5063
34.9
Region South-East
382261
46.9
203039
138365
68.1
BRAILA 22602
15.1
19180
14561
75.9
BUZAU 28249
13.4
24466
18090
73.9
CONSTANTA 221566
63.5
80929
53122 65.6
GALATI 68647
33.5
45653
36144
79.2
TULCEA 15640
0.2
15606
6876
44.1
VRANCEA 25557
32.7
17205
9572
55.6
Region South
255656
29.2
180921
102593
56.7
ARGES 72250
34.6
47252
32501
68.8
CALARASI 12085
4.2
11572
6085
52.6
DIMBOVITA 35543
18.2
29070
11424
39.3
GIURGIU 9460
16.2
7931
7595
95.8
IALOMITA 21949
39.4
13297
3983
30.0
PRAHOVA 87097
34.2
57291
35208
61.5
TELEORMAN 17272
16.0
14508
5797
40.0
Region South-West
163352
25.8
121180
63585
52.5
DOLJ 50042
23.6
38212
30886
80.8
GORJ 25849
12.1
22711
7093
31.2
MEHEDINTI 31668
44.6
17538
8612
49.1
OLT 23034
20.4
18341
11963
65.2
VILCEA 32759
25.6
24378
5031
20.6
Region West
208571
31.5
142957
111119
77.7
ARAD 44957
11.8
39642
39450
99.5
CARAS-SEVERIN 28237
23.2
21693
11024
50.8
HUNEDOARA 58213
44.1
32560
26861
82.5
TIMIS 77164
36.4
49062
33784
68.9
Region North-West
225110
25.3
168188
126081
75.0
Dr. Victor Platon, George Dulcu
National Profile of Municipal Water and Wastewater Management in Romania
59
Drinking water
Percentage
Drinking water distributed to the users (thou cm)
Region County
introduced in
of leakage
networks (thou cm)
Distributed to the users
Percentage of
(%)
Total
with metering devices
metering (%)
BIHOR 45714
24.2
34671
21166
61.0
BISTRITA-NASAUD 20677
39.4
12524
10349
82.6
CLUJ 74904
17.4
61883
54212
87.6
MARAMURES 42455
28.2
30473
18543
60.9
SATU MARE
27965
35.3
18095
14397
79.6
SALAJ 13395
21.3
10542
7414
70.3
Region Centre
288505
21.4
226779
177265
78.2
ALBA 48846
17.2
40448
34264
84.7
BRASOV 65330
19.8
52426
35023
66.8
COVASNA 17685
23.9
13462
11509
85.5
HARGHITA 68471
11.0
60937
51992
85.3
MURES 37551
28.9
26694
26694
100.0
SIBIU 50622
35.2
32812
17783
54.2
Region Bucharest
601254
49.2
305137
256294
84.0
ILFOV 30504
84.7
4666
3011
64.5
BUCURESTI 570750
47.4
300471
253283 84.3
Source: Data from National Institute of Statistics, 2002
60
UNDP/GEF Danube Regional Project
Annex 6: Data on Sewerage and Wastewater from Localities, in 2001
Total length of Total length of
Capacity of the Wastewater Sludge resulted
Region
sewerage networks
streets with
wastewater
treated from treatment
County
(km)
sewerage
treatment plants
(thou m3)
(tons)
(km)
(m3/day)
TOTAL 16590.1
12666.5
5151739
1070695
657549
Region North-East
2460.6
1956.9
1113483
206819
133916
BACAU
488.7
348.7
164406
48346 14264
BOTOSANI
223.8
199.7
128780
17247 62638
IASI
528.7
486.3
452623
78447 16801
NEAMT
313.8
233.6
58244
19669 17729
SUCEAVA
547.3
332.8
216810
25544 10796
VASLUI
358.3
355.8
92620
17566 11688
Region South-East
2430.6
1544.8
651818
137604
41374
BRAILA
280.4
225.8
5276
517 122
BUZAU
185.8
170.1
113284
22889 28734
CONSTANTA
1030.9
646.3
451203
99028 5661
GALATI
603.9
252.9
17882
2887 658
TULCEA
162.2
91.8
970
351 111
VRANCEA
167.4
157.9
63203
11932 6088
Region South
2005.5
1473.4
882327
165272
226155
ARGES
629.6
348.1
310996
65258 203377
CALARASI
140.6
126.1
81480
6503 983
DIMBOVITA
186.4
127.2
108459
17647 523
GIURGIU
111.7
67.8
38750
5058 1527
IALOMITA
150.4
100
80800
4960 5512
PRAHOVA
582.9
536.8
177982
53795 10874
TELEORMAN
203.9
167.4
83860
12051 3359
Region South-West
1352.5
1067
229746
64192
5568
DOLJ
517.2
362.2
4940
1511 131
GORJ
176.7
147
48764
12775 247
MEHEDINTI
177.3
154.2
3920
983 20
OLT
235.8
165.9
74636
19878 4141
VILCEA
245.5
237.7
97486
29045 1029
Region West
2054.1
1516.3
731324
116753
64519
ARAD
537.2
319
149856
16233 179
CARAS-SEVERIN
280.8
237.4
53262
12645 1442
HUNEDOARA
665.2
401.2
194505
23700 7619
Dr. Victor Platon, George Dulcu
National Profile of Municipal Water and Wastewater Management in Romania
61
Total length of Total length of
Capacity of the Wastewater Sludge resulted
Region
sewerage networks
streets with
wastewater
treated from treatment
County
(km)
sewerage
treatment plants
(thou m3)
(tons)
(km)
(m3/day)
TIMIS
570.9
558.7
333701
64175 55279
Region North-West
2225.1
1601.7
767188
165126
84559
BIHOR
538
391.7
218888
30115 97
BISTRITA-NASAUD
315.3
171.4
57898
12702 73
CLUJ
625.4
490.9
173011
56648 614
MARAMURES
309.2
221.8
154472
34896 48195
SATU MARE
279.3
220.6
105662
23141
35259
SALAJ
157.9
105.3
57257
7624 321
Region Centre
2175.8
1720.4
752479
207781
100914
ALBA
297.6
252.8
52791
17313 10965
BRASOV
574.5
475.6
187951
52163 15974
COVASNA
147.8
99.2
73950
10175 1599
HARGHITA
216.1
174.7
97855
13803 2733
MURES
550.7
436
186996
43211 26525
SIBIU
389.1
282.1
152936
71116 43118
Region Bucharest
1885.9
1786
23374
7148
544
ILFOV
134.9
104.8
23374
7148 544
BUCURESTI
1751
1681.2
0
0 0
Source: National Institute of Statistics, 2002
62
UNDP/GEF Danube Regional Project
Annex 7: Setting up Tariffs in Ploiesti City
I. BASE TARIFFS
Base tariffs are those tariffs existing in force at 1st September 1999 when was signed the concession
contract. The base tariffs do not include VAT or other taxes and are established at the next levels:
- RoL/ m3 -
2001 2002 2003
2004
2005-
2024
Base tariff for drinking water
2888 3300 3850
4400
4675
TBan
Base tariff for sewage
688 1030
1356
1735
2063
TBcn
II. ADJUSTING TARIFFS
· 0 mean base period;
· n means adjusting period;
a) Adjusting the tariff for drinking water
It is used the formula:
Tan = (TBan Aa0)*Kn + Aan
In which:
· Tan - proposed tariff at the date of adjustment;
· Kn adjusting coefficient;
· TBan base tariff defined earlier;
· Aa0 average cost for 12 months for a cubic meter of drinking water calculated with the
formula (unit cost of raw water purchased by the company): Aa0 = EP0/Vo
o EP0 = cost for purchasing underground water (without VAT) for 12 months, before 1st
September 1999;
o V0 = volume of drinking water billed for 12 months, before 1st September 1999;
· Aan = average cost for one m3 of drinking water for 12 months before the date of adjusting
the tariff (unit cost before adjustment);
b) Adjusting the tariff for sewage
It is used the next formula:
Tcn = Tbcn * Kn
In which:
· Tcn = new tariff for sewage;
· Tbcn = base tariff for sewage;
· Kn adjusting coefficient;
Dr. Victor Platon, George Dulcu
National Profile of Municipal Water and Wastewater Management in Romania
63
c) Adjusting coefficient
Kn is determined with the formula:
Kn = a1 x (IPCn/IPC0) + a2 x (Eln/El0) + a3 x (ROLn/RPL0) x (IPCEn/IPCE0)
In which:
· a1 + a2 + a3 = 100%
· a1 = 65%; a2 = 15%; a3 = 20%
· IPC0 = Consumer price index, published by the National Institute for Statistics in September
1999;
· IPCn = Consumer price index, published by the National Institute for Statistics in the month
of adjustment;
· IPCEn = Consumer price index in EU, at the moment of adjustment;
· IPCE0 = Consumer price index in EU in September 1999;
· ROL = official exchange rate EURO/ROL;
· El = average price paid for electricity (VAT excluded).
Source: Gov. Decision nr. 149/20.02.2002 for setting up and adjusting tariffs for W&WW services in
Ploiesti City., Official Gazette nr. 145/26/02.2002
64
UNDP/GEF Danube Regional Project
Annex 8: Levels of Penalties for Infringement of the Norms Concerning Maximum
Pollutant Concentration Admitted in Wastewater Discharged into the Surface Water
Resources
Over passing the maximum admitted concentration in sewage waters
Unit of
Penalty
Measure (UM)
RoL/UM
a. General Chemical Indicators
Total Suspended matters (MTS)
Kg
100
Clorures (Cl-), sulfurs (SO 2-
4 )
Kg
350
Sodium (Na+), potassium (K+), calcium (Ca2+), magnezium (Mg2+)
Kg
350
NO -3
Kg 400
Ammonium (NH4+), nitrogen (N
-
total), (NO2 )
Kg
30 000
CB05
Kg 800
CCOMn
Kg
1 800
(method with potassium permanganate)
CCOCr (method with potassium bi-chrome)
Kg
5 000
PO 3-
4
Kg 8
000
Total Phosphor (P)
Kg
30 000
Manganese (Mn2+)
Kg
9 000
Aluminum (Al3+) and total ionic iron (Fe2+, Fe3+) Kg
9
000
Oil waste
Kg
10 000
Synthetic Detergents
Kg
15 000
Dray Rezidus at 1050 C
Kg
350
b. Specific Chemical Indicators
SO 2-
3 , fluor (F-), phenols (C6H5OH) Kg
30
000
Nickel (Ni2+), chrome (Cr3+)
Kg
150 000
Ammonium (NH3) Kg
150
000
Barium (Ba2+), zinc (Zn2+), cobalt (Co2+) Kg
9
000
Sulfurs (S2-), (H2S) Kg
80
000
c. TOXIC and VERY TOXIC Chemical Compounds
Arsenic (As)
Kg
1 000 000
Cyanide (CN-)
Kg
1 000 000
Mercury (Hg2+), cadmium (Cd2+)
Kg
1 000 000
Lead (Pb2+), silver (Ag+), chrome (Cr6+), cupper (Cu2+), molibden (Mo2+) Kg 150
000
Cl2
Kg 50
000
Carcinogen Substances
Kg
6 000 000
Aromatic Hydrocarbures
Kg
4 000 000
Pesticides - erbicides
Kg
1 000 000
Pesticides - insecticides
Kg
2 000 000
Pesticides - insecticides: organo-phosphorus
Kg
4 000 000
Dr. Victor Platon, George Dulcu
National Profile of Municipal Water and Wastewater Management in Romania
65
Over passing the maximum admitted concentration in sewage waters
Unit of
Penalty
Measure (UM)
RoL/UM
d. BACTERIOLOGICAL INDICATORS
Coli Bacillus - total
106 bacillus/ 100 cm3
1000000
Coli Bacillus - fecal
104 bacillus / 100 cm3
2000000
Fecal Streptococcus
5x10³bacterii / 100 cm3 5000000
Salmonella nr./100
cm3 10000000
e. PHYSIC INDICATORS
Temperature m3x0C*)
10
pH (Hydrogen ion concentration)
m3 x units pH
5
Source: Emergency Ordinance 107/2002 for the creation of the National Administration "Romanian
Waters", Official Gazette nr. 691/September 2002
66
UNDP/GEF Danube Regional Project
Annex 9: Investment Costs for the Modernization, Rehabilitation and Development of
the Water and Sewerage Services in Romanian Towns and Municipalities (Estimates)
Estimation of the costs for the rehabilitation of the water
and sewerage services (thousand USD)
crt
Towns
Inhabitants
From which:
County
and cities
no.
(number)
(number)
Total
Treating
Water
Sewerage Waste
drinking distribution
Water
water
plants
1 ALBA
11
232.664
79.106
9.306
25.593
23.265
20.940
2 ARAD
8 246.172
83.698
9.847
27.079
24.617
22.155
3 ARGES
6 321.706
109.380
12.868
35.388 32.171 28.953
4 BACAU
8 374.417
127.302
14.977
41.186
37.442
33.697
5 BIHOR
9 307.968
104.709
12.319
33.876
30.797
27.717
6 BISTRITA-NASAUD
4
120.172
40.858
4.807
13.219 12.017 10.815
7 BOTOSANI
4 182.199 61.948
7.288
20.042
18.220
16.398
8 BRASOV
9 474.231 161.238
18.969
52.165
47.423
42.681
9 BRAILA
4 255.899 87.006
10.236
28.149 25.590 23.031
10 BUZAU
4 207.765 70.640
8.311
22.854 20.776 18.699
11 CARAS-SEVERIN
8
201.247
68.424
8.050
22.137 20.125 18.112
12 CALARASI
5 130.801 44.472
5.232
14.388
13.080
11.772
13 CLUJ
6 497.098
169.013
19.884
54.680 49.710 44.739
14 CONSTANTA
11 542.322 184.389
21.693
59.655 54.232 48.809
15 COVASNA
5 120.195 40.866
4.808
13.221 12.019 10.818
16 DAMBOVITA
6
172.741 58.732
6.910
19.001 17.274 15.547
17 DOLJ
5 383.881
130.519
15.355
42.227 38.388 34.549
18 GALATI
4 383.844
130.507
15.354
42.223 38.384 34.546
19 GIURGIU
3 90.695 30.836
3.628
9.976
9.069
8.163
20 GORJ
7 168.138
57.167
6.726
18.495
16.814
15.132
21 HARGHITA
9 155.656 52.923
6.226
17.122
15.566
14.009
22 HUNEDOARA
14
402.254 136.766
16.090
44.248 40.225 36.203
23 IALOMITA
4 126.261 42.929
5.050
13.890
12.626
11.363
24 IASI
4
420.942
143.120
16.837
46.304
42.094
37.885
25 ILFOV
2 30.254 10.286
1.210
3.328 3.025 2.723
26 MARAMURES
8
284.207
96.630
11.368
31.262 28.421 25.579
27 MEHEDINTI
5 156.562 53.231
6.262
17.222 15.656 14.091
28 MURES
7 307.892
104.683
12.316
33.868 30.789 27.710
29 NEAMT
4 253.901 86.326
10.156
27.929
25.390
22.851
30 OLT
7
202.712
68.922
8.108
22.298
20.272
18.244
31 PRAHOVA
14 444.135 151.006
17.765
48.855 44.414 39.972
32 SATU
MARE
4
180.262 61.289
7.210
19.829 18.026 16.224
Dr. Victor Platon, George Dulcu
National Profile of Municipal Water and Wastewater Management in Romania
67
Estimation of the costs for the rehabilitation of the water
and sewerage services (thousand USD)
crt
Towns
Inhabitants
From which:
County
and cities
no.
(number)
(number)
Total
Treating
Water
Sewerage Waste
drinking distribution
Water
water
plants
33 SALAJ
4 107.482 36.544
4.299
11.824
10.748
9.673
34 SIBIU
9 303.113
103.058
12.124
33.342
30.311
27.280
35 SUCEAVA
8 252.532 85.861
10.101
27.778 25.254 22.728
36 TELEORMAN
5
157.349 53.499
6.295
17.308 15.735 14.161
37 TIMIS
7 425.067
144.523
17.003
46.757
42.507
38.256
38 TULCEA
5 127.541 43.364
5.102
14.029
12.754
11.479
39 VASLUI
4 199.123 67.702
7.965
21.903
19.912
17.922
40 VALCEA
8 177.910 60.489
7.116
19.570 17.791 16.012
41 VRANCEA
5 148.212 50.392
5.928
16.304
14.821
13.339
42 BUCURESTI
1 1.996.612 678.848
79.865
219.627 199.661 179.695
TOTAL 265
12.274.134
4.173.205
490.965
1.350.155 1.227.413 1.104.672
Source: Ministry of Public Administration., 2001
68
UNDP/GEF Danube Regional Project
Annex 10: Estimation of the Necessary Investment for Supplying Drinking Water to the
Romanian Rural Localities
Inhabitants
Rural localities without centralized
Estimated
systems for drinking water supply
No
investment
Total number
(number)
(thousand
County
of rural
Localities
Inhabitants
Water
USD)
localities
(number)
(number)
Flow
needed
(l/s)
1 ALBA
656
162,989
580
144,106
288
36,026
2 ARAD
273
229,116
215
180,439
361
45,110
3 ARGES
577
350,756
467
283,887
568
70,972
4 BACAU
490
378,336
444
342,819
686
85,705
5 BIHOR
435
307,348
301
212,671
425
53,168
6 BISTRITA.-NASAUD
235
206,090
197
172,765
345
43,191
7 BOTOSANI
336
282,155
274
230,090
460
57,522
8 BRASOV
150
153,569
111
113,641
227
28,410
9 BRAILA
140
129,617
79
73,141
146
18,285
10 BUZAU
482
298,772
354
219,430
438
54,858
11 CARAS -SEVERIN
287
148,832
268
138,979
278
34,745
12 CALARASI
160
202,273
115
145,384
291
36,346
13 CLUJ
420
224,576
229
122,447
245
30,612
14 CONSTANTA
189
204,781
75
81,262
162
20,315
15 COVASNA
122
112,715
98
90,542
181
22,635
16 DAMBOVITA
361
372,233
286
294,899
590
73,725
17 DOLJ
380
360,900
375
356,151
712
89,038
18 GALATI
180
260,184
131
189,356
379
47,339
19 GIURGIU
166
203,609
161
197,476
395
49,369
20 GORJ
414
222,946
349
187,943
376
46,986
21 HARGHITA
236
185,779
160
125,952
252
31,488
22 HUNEDOARA
458
118,532
410
106,110
212
26,527
23 IALOMITA
130
178,512
99
135,944
272
33,986
24 IASI
420
420,187
396
396,176
792
99,044
25 ILFOV
103
246,106
84
200,708
401
50,177
26 MARAMURES
226
246,439
75
81,783
164
20,446
27 MEHEDINTI
344
160,526
291
135,794
271
33,948
28 MURES
486
293,794
421
254,501
509
63,625
29 NEAMT 347
351,249
270
273,306
546
68,326
30 OLT
378
304,007
296
238,058
476
59,514
31 PRAHOVA
405
404,602
271
270,734
541
67,683
32 SATU MARE
226
207,944
183
168,379
336
42.095
Dr. Victor Platon, George Dulcu
National Profile of Municipal Water and Wastewater Management in Romania
69
Inhabitants
Rural localities without centralized
Estimated
systems for drinking water supply
No
investment
Total number
(number)
(thousand
County
of rural
Localities
Inhabitants
Water
USD)
localities
(number)
(number)
Flow
needed
(l/s)
33 SALAJ
281
148,054
142
74,817
150
18.704
34 SIBIU
173
141,827
161
131,990
264
32.998
35 SUCEAVA
396
473,175
358
428,964
858
107.241
36 TELEORMAN
231
298,706
220
284,482
569
71.121
37 TIMIS
317
261,357
210
173,139
346
43.285
38 TULCEA
133
134,055
70
70,555
141
17.639
39 VASLUI
456
268,024
390
229,231
458
57.308
40 VALCEA
564
250,347
502
222,827
446
55.707
41 VRANCEA
331
241,545
211
153,976
308
38.494
TOTAL 13.094
10.146.564
10,328
7,934,854 15,802
1.983.713
Source: Ministry of Public Administration., 2001
70
UNDP/GEF Danube Regional Project
Annex 11: Water and Wastewater Projects Financed within ISPA Framework, in
Romania
- Million -
No Projects
Total Budget
ISPA contribution
2000
Rehabilitation of the sewage network and
Map 1.
70.378 52.783
wastewater treatment facility in Craiova
Rehabilitation of the sewage network and
Map 2.
96.556 72.417
wastewater treatment facility in Constanta
Map 3.Improvement of the W&WW system in Iasi 51.378 38.533
Rehabilitation and modernization of the water
Map 4.
46.755 35.066
supply and sewage network in Cluj
Expanding wastewater treatment capacity in
Map 5.
9.680 7.260
Danutoni biological treatment
Rehabilitation and expansion of the sewage network
Map 6.
59.877 44.908
and building a wastewater treatment plant in Braila
Rehabilitation of the sewage network and
Map 7.
18 13.5
wastewater treatment facility in Arad
Technical Assistance for preparing the project:
Map 8.Finalization and modernization of the wastewater
1.810 1.357
treatment plant in Bucuresti
Map 9.Seminar EIA
8.875
8.875
2001
Rehabilitation of the sewage network and of the
Map 10
15.876 11.748
wastewater treatment plant in Focsani
Rehabilitation of the sewage network and of the
Map 11
23.906 16.734
wastewater treatment plant in Oradea
Rehabilitation of the sewage network and of the
Map 12
49.080 34.136
wastewater treatment plant in Timisoara
Rehabilitation and modification of the sewage
Map 13network and wastewater treatment facility in
16.262 12.196
Pascani
Rehabilitation of the water supply system and of the
Map 14
27.909 20.932
sewage network in Târgu Mures
2002
Modernizing the water distribution network and of
Map 15
37.588 25.559
the sewage system in Sibiu
Rehabilitation of the wastewater treatment plant, of
Map 16the sewage system and the water distribution
28.594 21.159
network in Piatra Neamt
Dr. Victor Platon, George Dulcu
National Profile of Municipal Water and Wastewater Management in Romania
71
No Projects
Total Budget
ISPA contribution
Rehabilitation of the wastewater treatment plant of
Map 17the sewage system and the water distribution
35.433 26.220
network in Buzău
Map 18Improving the W&WW system in Satu Mare
37.355
26.522
Drinking water preparation and wastewater
Map 19
58.708 41.683
treatment in Brasov and nearby localities
Rehabilitation of the wastewater treatment plant, of
Map 20the sewage system and the water distribution
52.006 39.004
network in Bacău
Source: Data from the report ISPA financing in Romania., EU 2003 and data from RAPORT referitor la ,,Stadiul Investitiilor
in Infrastructura Serviciilor de Gospodarie Comunala" Ministerul Administratiei Publice din România 2003
72
UNDP/GEF Danube Regional Project
Annex 12: Water and Wastewater Projects Co-Financed by EIB and EBRD in Romania
No.
Project
Objectives
Total Value of the
IFI Contribution
Project
EIB
1. Project regarding
Rehabilitation of the
municipal water and
water infrastructure and
wastewater
wastewater treatment in
five cities: Braila, Cluj,
224.8 Mil. 55.0
Mil.
Craiova, Focsani and
Pascani.
2. Co-financing of the
Rehabilitation of the
ISPA projects
water infrastructure and
wastewater treatment in
three cities: Buzau, Satu
101.382 Mil. 27.478
Mil.
Mare and Piatra Neamt
EBRD
3. MUDP I program
The program included
with state
five cities: Brasov,
guarantee
Craiova, Tg. Mures and
The program ended in
Timisoara, for improving
60 Mil. USD
28 Mil. USD
2001
and modernising the
W&WW network,
including water
purification plants.
4. MUDP II program The program included 10
with state guarantee cities: Oradea, Cluj,
Co financed by EBRD,
The program
Botosani, Braila, Focsani,
192 Mil. USD
EU - PHARE and
ended in 2002
Targoviste, Bacau,
Romanian Government
Bistrita, Arad, Constanta
5. Program for Jiul
The program included 5
Valley - program with cities for improving the
state guarantee
W&WW systems
50 Mil. USD
...
The program ended in
2002
6. Projects for W&WW
Constanta
100 Mil. 20
Mil.
.
systems without state Iasi
60 Mil. 13.2
Mil.
guarantee, to co-
Arad
18 Mil. 4.5
Mil.
finance ISPA projects
Brasov
60 Mil. 15
Mil.
7. Project for
rehabilitating the
Bucuresti ...
25 Mil.
water supply system
Source: Data from RAPORT on Stage of Investment in Housbandry Infrastructure., Min. of Public Administration and
Interior., 2003
Dr. Victor Platon, George Dulcu
National Profile of Municipal Water and Wastewater Management in Romania
73
Annex 13: Water and Wastewater Projects Co-Financed by the Danish Government
- DKK ($) -
Technical
Investment Total
Danish
Project
Assistance
contribution
Project for water supply in Ramnicu Valcea
564,938.
775,000
1,339,938
first phase (feasibility study)
(76,341)
(104,729)
(181,070)
Project for water supply in Ramnicu Valcea
2,259,980
12,240,000
14,499,980
second phase
(281,000)
(1,526,000)
(1,807,000)
(water supply in the village Goranu)
Improvement of the wastewater treatment plant
619,546
- 619,546
in Suceava phase I (feasibility study)
(83,730)
(83,730)
Improvement of the wastewater treatment plant
684,088
2,990,442
3,674,530
in Suceava phase II (pilot phase)
(82,720)
(361,600)
(444,320)
Improvement of the water system in Craiova
...
...
7,450,150
(1,049,317)
Development of the wastewater treatment plant
... ...
9,526,000
and sewage system in Arad phase I
(1,341,690)
Improvement of the wastewater treatment plant
258,080
258.080
in Arad - phase II
-
(36,349)
(36,349)
Optimization of the drinking water
...
1,990,220
consumption and improving wastewater
...
(280,313)
monitoring in Brasov city
Treatment and disposal of solid residue from
405.405,-
405.405,-
the wastewater treatment plant in Brasov
(57,099.-)
-
(57,099.-)
Braov phase I
Treatment and disposal of solid residue from
1.524.844
5.027.925
6.552.769
the wastewater treatment plant in Brasov
(214,767)
(708,158)
(922,925)
phase II
Water supply in Breaza
...
...
7,853,225
(1,106,088)
Expansion and modernization of the
... ...
10,499,000
wastewater treatment plant in Mangalia
(1,478,732)
Source: Ministry for European Integration, www.mie.ro 2003
74
UNDP/GEF Danube Regional Project
Annex 14: Strategies and Action Plans
In Romania, during the time, various strategies and plans have been drafted. Many of them have been
carried out with the help of foreign institutions such as World Bank, EU etc. Some of these strategies
have important provisions and good intentions for the water sector.
A. The Water Strategy (1995)
The general objective of the 1995 Water Strategy, which is still valid today, is the rational use of water
resources for the benefit of present and future generations. The priorities for water policy have been
defined as follows:
· Reducing the growth rate of water consumption in all branches of the economy;
· Ensuring the drinking water supply to the population and public sanitation;
· Rationally using and saving water within the different utilities, in order to reduce water
demand;
· Protecting water resources and managing them in order to avoid shortage and pollution,
having mainly in regard with the drinking water supply, food production and aquatic
ecosystem conservation;
· Efficiently operating and using the existing facilities;
· Efficiently preventing any disasters such as floods and accidental pollution;
· Improving legislation and management;
· Involving the public in the management of water resources.
B. National Environmental Action Plan (updated in 2000)
In the field of Water Management there is an important document called the National Environmental
Action Plan, adopted by the central Government. In this document the Polluters Pays Principle is seen
as a driven force as it concerns funding of water management infrastructure.
The National Environmental Action Plan (NEAP) defines the national requirements for water
management as follows:
· Ensuring permanent water supply to users
· To develop new water sources, particularly multifunction reservoirs in the poor-water areas;
· To build distinct water supply distribution networks for population and industry;
· To save water and to reduce its cost.
· Improvement the quality of the water resources
· To use new clean, non-polluting technologies;
· To develop new wastewater treatment plants and modernize the existing ones;
· To provide for preventing, reducing and limiting the effects of accidental pollution.
· Ecological reconstruction of the river basins
· To improve and develop adequate habitats for conserving biodiversity;
· To ensure, if possible, adequate water flows in the rivers to protect aquatic eco-systems, and
to facilitate fish migration.
· Reducing flood risk
· To develop multifunction (complex) reservoirs to provide a protection volume against
floods;
· To make embankments which are compatible with wetlands protection;
· To ban the construction of buildings on flood plains.
Dr. Victor Platon, George Dulcu
National Profile of Municipal Water and Wastewater Management in Romania
75
C. Central Government Programme
The new 2001 Government Programme placed a special emphasis on the social aspects of water
management such as water supply and flood protection and on more ecological aspects such as water
quality protection through approximation to the EU Directives on water.
The policy has to be implemented taking into consideration a number of principles:
The river basin is the natural physical entity for water management;
Water quantity and quality management are closely related; therefore they must be tackled jointly by
integrated and cost-effective/efficient solutions;
Water management should be based on the principle of human common interest through close, all-
level collaboration and cooperation of public administrations, water users, representatives of the local
communities, in order to obtain maximum social benefit;
The polluter pays principle should apply;
Water is not an economic good like any other, but rather a precious heritage that must be defended,
protected and treated as such.
Another major objective is improvement in the treatment of wastewater. For instance, the priority
defined in item (b) above is strictly linked to Romania's obligations under the Convention on
Cooperation for the Protection and Sustainable Use of the Danube River. The Joint Action
Environmental Programme for the Danube River Basin, January 2001-December 2005, has identified
as key priorities for implementation 10 hot spots in municipal waste-water treatment (one of which is
in Bucharest), 7 hot spots in industrial effluent control, 3 hot spots in agricultural pollution, and a
number of hot spots related to pollution and potential accidental pollution caused by waste deposit
sites and tailing ponds.
Source: Ministry of Public Administration, 2001
76
UNDP/GEF Danube Regional Project
BIBLIOGRAPHY
· Synthesis of Water Quality in Romania in 2001, 2002; National Company "Apele Române"
· Yearly Report of the Romanian National Bank., 2002
· Statistical yearly reports; National Institute of Statistics 2000-2004
· The National Report on Water Supply and Sewerage Systems in Romania, published by the
Romanian Water Association (RWA), September 2000
· Environmental Performance Review of Romania., United Nations., Economic Commission
For Europe., Committee on Environmental Policy as discussed and approved by the eight
session of the Committee on Environment Policy., September 2001 Economic and Social
Council
· National Strategy for the Development of Communal Public Services., Ministry for Public
Administration., Bucuresti 20 august 2001
· National Strategy for Environment- ISPA implementation., strategic paper of the Ministry of
Waters and Environmental Protection, Revised, May 2001
· Strategy for sustainable development of the water resources., National Forum ORIZONT
2025., 17-18 Nov. 2003, Bucuresti
· Green Paper of the Public Services in Romania., National Forum ORIZONT 2025., 17-18
Nov. 2003, Bucuresti
· Stadiu Florin., Water management, basis for sustainable development of Romania., National
Forum ORIZONT 2025., Febr. 2004, Bucuresti
· Ciomos V., Development of the local infrastructure for sustainable water supply., National
Forum ORIZONT 2025., Febr. 2004, Bucuresti
· How to get EU financing 2003., www.infoeuropa.ro
· Yearly Report 2001 EU programmes for Romania., EU Delegation in Bucuresti., 2002
· National Environmental Action Plan 2003., MAFWE, Oct. 2003
· Popovici, Mihaela, Zinnes, Clifford `The road to creating an integrated pollution charge and
permitting system in Romania", Working paper, Harvard University, (1995)
· Report on the State of the Environment, MWEP, Romania, Bucuresti, 2000-2003
· Statistical Yearbook of Romania, (2003)
· Water pricing in selected Accession Countries to the European Union, current policies and
trends., A report produced for the European Commission DG Environment., Part II Country
Description., Contract number B4-3040/99/130877/MAR/B2., Draft Report 2002
Dr. Victor Platon, George Dulcu
Document Outline