

September 2004
ASSESSMENT AND DEVELOPMENT OF
MUNICIPAL WATER AND WASTEWATER
TARIFFS AND EFFLUENT CHARGES IN
THE DANUBE RIVER BASIN.
Volume 2: Country-Specific Issues and
Proposed Tariff and Charge Reforms:
Hungary Case Study

AUTHORS
Gabor Ungvari
TARIFFS AND CHARGES VOLUME 2

PREFACE
The Danube Regional Project (DRP) consists of several components and numerous
activities, one of which was "Assessment and Development of Municipal Water and
Wastewater Tariffs and Effluent Charges in the Danube River Basin" (A grouping of
activities 1.6 and 1.7 of Project Component 1). This work often took the shorthand
name "Tariffs and Effluent Charges Project" and Phase I of this work was undertaken
by a team of country, regional, and international consultants. Phase I of the
UNDP/GEF DRP ended in mid-2004 and many of the results of Phase I the Tariffs and
Effluent Charges Project are reported in two volumes.
Volume 1 is entitled An Overview of Tariff and Effluent Charge Reform Issues and
Proposals. Volume 1 builds on all other project outputs. It reviews the methodology
and tools developed and applied by the Project team; introduces some of the
economic theory and international experience germane to design and performance of
tariffs and charges; describes general conditions, tariff regimes, and effluent
charges currently applicable to municipal water and wastewater systems in the
region; and describes and develops in a structured way a initial series of tariff,
effluent charge and related institutional reform proposals.
Volume 2 is entitled Country-Specific Issues and Proposed Tariff and Charge
Reforms. It consists of country reports for each of the seven countries examined
most extensively by our project. Each country report, in turn, consists of three
documents: a case study, a national profile, and a brief introduction and summary
document. The principle author(s) of the seven country reports were the country
consultants of the Project Team.
The authors of the Volume 2 components prepared these documents in 2003 and
early 2004. The documents are as up to date as the authors could make them,
usually including some discussion of anticipated changes or legislation under
development. Still, the reader should be advised that an extended review process
may have meant that new data are now available and some of the institutional detail
pertaining to a specific country or case study community may now be out of date.
All documents in electronic version Volume 1 and Volume 2 - may be read or
printed from the DRP web site (www.undp-drp.org), from the page Activities /
Policies / Tariffs and Charges / Final Reports Phase 1.
TARIFFS AND CHARGES VOLUME 2

We want to thank the authors of these country-specific documents for their
professional care and personal devotion to the Tariffs and Effluent Charges Project.
It has been a pleasure to work with, and learn from, them throughout the course of
the Project.
One purpose of the Tariffs and Effluent Charges Project was to promote a structured
discussion that would encourage further consideration, testing, and adoption of
various tariff and effluent charge reform proposals. As leaders and coordinators of
the Project, the interested reader is welcome to contact either of us with questions
or suggestions regarding the discussion and proposals included in either volume of
the Project reports. We will forward questions or issues better addressed by the
authors of these country-specific documents directly to them.
Glenn Morris: glennmorris@bellsouth.net
András Kis: kis.andras@makk.zpok.hu
TARIFFS AND CHARGES VOLUME 2
A Case Study of Municipal Water System Management and the Impacts of Tariff and Effluent Charges: EDV, Hungary
3
Table of Contents
1
Description of the Case Study Area ............................................................................................. 5
1.1
Brief Historic Overview ...........................................................................................................5
1.2
Grouping of Territories and Users inside the Case Study Area ...............................................5
1.2.1
Description of Territories .................................................................................................5
1.2.2
Desription of Management Unit (MU), Operation Units (OU's), and
Regulatory Units (RU's) ...................................................................................................................8
1.2.3 Service Users....................................................................................................................8
1.2.4
User Groups in the Spreadsheet Model ..........................................................................10
2
Scenarios ...................................................................................................................................... 11
2.1
Lines of Investigation.............................................................................................................11
2.2 Economic
Sustainability.........................................................................................................12
2.2.1 The
Current Practice.......................................................................................................12
2.2.2
Comparison of Different Scenarios for Economic Sustainability ..................................12
2.2.3
Future Trends, Policies to Cover the Gap ......................................................................14
2.3
The Extension and Upgrade of the Service - Environmental Scenario ..................................15
2.3.1
System Extension and Upgrade......................................................................................15
2.3.2
The Potential Increase of Sewage Connection Rate.......................................................16
2.4 The
Cost Burden.....................................................................................................................17
2.5
The Distribution of Cost Burden Equity .............................................................................18
2.6
The Potential in Tariff Structure Reform ...............................................................................19
2.7
Sewerage Substitutions or Emission Tax ...............................................................................21
3
Policy Recommendations ............................................................................................................ 23
3.1
Local Decision on Financial Policy, Responsibility of Inter-Generational Burden
Allocation ..........................................................................................................................................23
3.2
Grant / Subsidy Allocation .....................................................................................................23
3.3
Equity and Complexity...........................................................................................................23
4
UNDP/GEF Danube Regional Project
List of Abbreviations
AC Average
Cost
ASTEC Model
Accounts Simulation for Tariffs and Effluent Charges Model
CR Cost
Recovery
D Demand
EDV
Eszak-Dunantuli Vizmuvek, North-Transdanubian Waterworks, the site of the
case study
HUF
Hungarian Forint, the currency of Hungary
MC Marginal
Cost
MCP
Marginal Cost Pricing
MEWM
Ministry of Environment and Water Management
MU Management
Unit
RU Regulatory
Unit
RWW
Regional Water Works
SU Service
User
T1 through T8
The territorial categories applied in ASTEC modelling
Gábor Ungvári, MAKK, Hungary
A Case Study of Municipal Water System Management and the Impacts of Tariff and Effluent Charges: EDV, Hungary
5
1 Description of the Case Study Area
1.1 Brief Historic Overview
The examined area is a sub-system of the North-Transdanubian Waterworks (Eszak-Dunantuli
Vizmuvek, EDV)1. It is situated along the Danube riverbank where two towns and four villages are
located, as well as several small communities uphill from the river. The total population of the district
is around 80 thousand, half of the population lives in the two towns, and the other half in the villages,
with populations between 500 to 5000.
There are different kinds of heavy industry in the region with high volume water consumption
(machinery, glass production and power plant). All of them have their own water extraction facility
and some of them have their own treatment plant as well.
The district is a mix of state and local government owned subsystems, that (except for a few network
elements) are operated by a state owned regional water works company (RWW). The dominant owner
of the network is the state. The basis of the district is the regional water supply network that provides
water from a bank filtered water basis and a carstic well to the whole area and sells water to supply a
handful of small communities on the territory of the neighbouring regional system.
The sewage systems of the district show a more complex picture. The towns and the villages next to
them are serviced by a state owned network, operated by the regional waterworks company . The other
sewage systems service small groups of (one to three) municipalities, these are owned by the
municipalities. The RWW and a private firm run these small networks (based on concession
contracts). The RWW deposits the sewage sludge of its treatment plants on the landfill of the region's
solid waste management firm.
The examined area is part of a bigger service district where the mentioned state owned RWW is the
dominant service provider of both water and wastewater. Its network is separated from other districts
of the region, and it consists of two operation sub-units.
The predecessors of the RWW date back to the 19th century. The unification process of the region's
small waterworks started early in the 60's, and later during the decade a county wide service provider
was organised that operated all of the public water utilities of the county. Due to the development
program of the water utilities in the region its service districts reached beyond the administrative
boundaries of the county. Due to the ownership transfer of state property to the municipalities, some of
the new owners withdrew their sub-systems from the RWW's operation. The examined area has
approximately 25% of the total population serviced by the company.
1.2 Grouping of Territories and Users inside the Case Study Area
1.2.1 Description of Territories
To make the upcoming discussion easier to understand I show a territorial categorisation of the created
service user (SU) groups which reflect the most important patterns of service provision. These groups
will provide the base for the model's territorial differentiation.
T1.
Town A - Centre
T2.
Town A - suburban area
T3. Town
B
1 I would like to acknowledge the time and efforts of the colleagues at the Eszak-Dunantuli Vizmuvek Rt to
provide us the required information to evaluate this case study. The basic data was provided by EDV Rt
regarding a wider territory than of the company. The calculations and the conclusions express the opinion of the
author, not necessarily coincides with of the company.
6
UNDP/GEF Danube Regional Project
T1,T2,T3 are the core settlements of the service area with 53% of the service area's
population. The reason of splitting them into three is the allocation of cost elements. T1 and
T2 have a common drinking water supply branch, while in case of the sewerage network T2
and T3 are components of a local system.
T4. "Mountain" group of 9 villages. These villages are on the same branch of the drinking water
network. There are three small sewage networks that service six of them. In the remaining three
villages sewerage substitution modules have to be developed until 2015.
T5. A village next to Town B, where the sewerage system will be built with connection to the
treatment plant of Town B
T6.
A village at the end of the network where the regional provider supplies drinking water and it
operates the wastewater system of the municipality
T7.
Two villages, where the regional provider supplies the drinking water and a private firm
services the wastewater.
T8. Three off-border villages, the waterworks sell drinking water to another waterworks to supply
these villages.
Basic data in the territory units is organised by households, public institutions, big industrial users (if
there is any) and other industrial users. The grouping inside one territory unit is based on the quantity
and the drinking water/sewage production similarities (the households always appears as an
independent group).
Gábor Ungvári, MAKK, Hungary
A Case Study of Municipal Water System Management and the Impacts of Tariff and Effluent Charges: EDV, Hungary
7
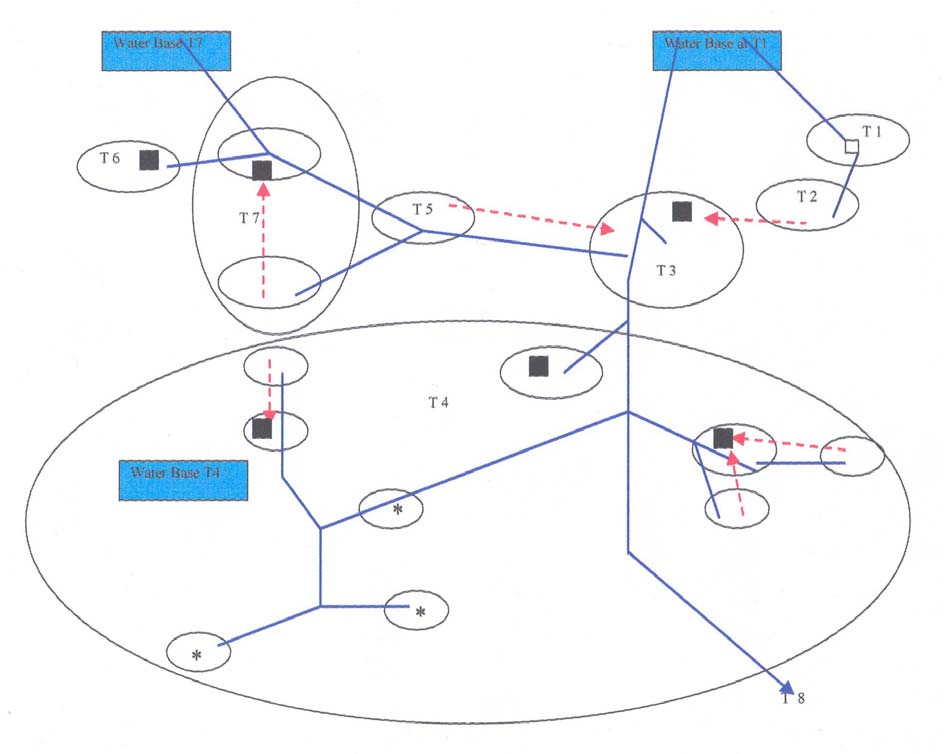
Figure 1
The Map of the Service District
Legend: Circles: municipalities Tx: territorial groups of analysis, the description is in the main text.
Blue (constant) line : drinking water network.
Red (staggered) line : sewerage networks.
Square: treatment plant. Star: there will be no sewerage network, only substitutions
8
UNDP/GEF Danube Regional Project
1.2.2 Desription of Management Unit (MU), Operation Units (OU's), and Regulatory
Units (RU's)
1.2.2.1 Water Supply
The water supply network is one system, although it is operated from two bases. Accordingly, it
consists of two Operation Units. These units are responsible for maintenance, customer relations,
metering and the service of information. OU 1 is responsible for territories T1, T2, T6 and T7, OU 2
comprises T3, T4 and T5.
The MU of the case study district is the centre office of the RWW (that is located outside the area). It
runs the networks, decides on the necessary development investments from a technical point of view,
but it has to reach agreement on financial conditions with the owner - the Ministry of Environment and
Water Management (MEWM). The Ministry has MU licenses as it exercises the right to set prices
(annually by the modification of the concerned decree), decides about the amortisation measures. In
the past it provided financial sources of large development investments through grants and preferential
loans (the details see later).
The RU licences on drinking water supply are delegated to the owner, the Ministry of Environment
and Water Management.
1.2.2.2 Sewage System
Operation Units.
There are seven networks (collection and treatment included) in the area. Two of them (at T1 and T3 )
are owned by the state. The other five networks belong to the municipalities. Six of the networks are
operated by the RWW. One system (at T7.) is operated by a private service provider.
The function defined as of the MUs are allocated among several actors. There are two MU's that have
the responsibility on operation issues. These are the RWW and the private sewage service provider of
T6. The owners of the infrastructure have MU licences on tariff issues. In T1,T2,T3 the Ministry of
EWM has these licenses, in the other areas, from T4 to T7 the municipalities have this right each by
each. The municipalities' have concession contracts with the service providers that define the
algorithm of price modification.
The municipalities and the MEWM have RU licences over the sewerage networks they own.
1.2.3 Service Users
1.2.3.1 Households
The household groups mean residential customers in territory 1 to 7 (except 5). The portion of joint
metered apartment buildings is very low. The division of households follows the territorial units. The
average consumption based on the year 2001 is 84 m3/household(max 100 m3/household, min 75
m3/household).
1.2.3.2 Non-Household Groups, Public Institutions
I create public institution as a single consumer group only in T1 (the biggest town in the area). This is
because public institutions are concentrated in the towns, the proportion of their consumption in the
villages are very low. In T3 however the small scale industry and the public institutions have similar
water consumption/sewage production patterns, therefore there was no reason to differentiate among
them. The group called "other" aggregates their consumption.
1.2.3.3 Industry
Gábor Ungvári, MAKK, Hungary
A Case Study of Municipal Water System Management and the Impacts of Tariff and Effluent Charges: EDV, Hungary
9
There are some big industrial users in the area and several small ones. The big ones locate in T1, T3
and T7. All of them have access to the drinking water network, two have their own water extraction
facilities and all of them have installed pre-treatment devices on wastewater outflow to the public
network.
Industry "A" locates in T1. It is a heavy industry site. It has its own wells, applies advanced water re-
circulation technologies to optimise water consumption. The factory has a pre-treatment plant and
loads the sewage to the public sewerage system. For modelling purposes water use and wastewater
discharge are handled as independent services.
Industry "B" in T1 was distinguished from all other industry. As their consumption pattern differs
from Industry "A", for modelling purposes water use and wastewater discharge are handled as
composite services.
Industry "C" in T3 is a pharmaceutical factory. It has water supply from the public utility and has its
own treatment plant.
In T7 there is a glass producer, that consumption is 12% of the territories' consumption and 62% of
the industrial consumption, but the 15-group model capacity prescribe the compromise of merging all
non-household customer and this is the smallest "big" industrial user. Cost allocation of the
Spreadsheet model is based on the flow quantities a specific network element can be associated with.
Big industrial users' cost structure includes their location's distribution and collection costs with a
smaller weight (20%).
1.2.3.4 Purchase of Water
T8. The regional waterworks purchase water, and transfers it to the neighbouring regional waterworks.
10
UNDP/GEF Danube Regional Project
1.2.4 User Groups in the Spreadsheet Model
Table 1
The Main Characteristics of the Defined User Groups in the Year 2001
User groups
No. of units
Drinking water Sewage quantity Consumption
consumption in in thousand m3
pattern of
thousand m3
drinking water
and sewage
services
Households in T1
7200
626
488
Composite
Public in T1 *
610
313
283
Composite
Industry A in T1
1
31
156
Independent
Industry B in T1 *
322
161
127
Composite
Households in T2
1862
167
103
Composite
Households in T3
4968
387
315
Composite
Industry C in T3
1
356
315
Independent
Other small users in T3
369
163
136
Composite
Households in T4
5529
417
175
Composite
Other users in T4
247
98
8
Independent
Households in T6
295 (12)
26
20
Composite
Households in T7
2948
295
-
-
Other small users in T7
227
105
-
-
Purchasing water to T5
941(53)
99
-
-
Purchasing water to T8
-
174
-
-
* Number of all non-households are divided by their consumption
Gábor Ungvári, MAKK, Hungary
A Case Study of Municipal Water System Management and the Impacts of Tariff and Effluent Charges: EDV, Hungary
11
2 Scenarios
2.1 Lines of Investigation
Baseline scenario
Current operation
This scenario deals with the current operation for up to one year. Computed cost include
variable costs, that change as the serviced volumes change, and fixed costs that do not change
with the volume of the services, but are necessary conditions of running the networks (i.e.
salaries, maintenance). This scenario does not include capital costs of assets or amortisation.
Economic sustainability scenarios
Medium term economic sustainability
This scenario incorporates capital cost elements up to seven year lifetime. Volumes and tariffs
are computed with the Cost Recovery requirement2.
Long term economic sustainability
This scenario consists of all the capital cost of system elements that are shown in the RWW's
book and system elements of municipalities owned networks that the RWW operates on a
contractual basis. Capital costs are computed assuming that the necessary assets to cover
future investments were provided from the capital market (present value of 4% real interest
rate). Because the sewerage network of T5 will be completed next year, the long term
restoration cost of this network part is included. Volumes and tariffs are computed with the
Cost Recovery requirement .
Sub-scenario: Extra Investments for further nutrient load decrease on the long run
Although this service district is not ranked as sensitive territory, the scenario shows increased
economic burdens if third phase (nutrient load reduction) devices were introduced. Volumes
and tariffs are computed with the Cost Recovery requirement.
Distribution of cost burden
This analysis is based on the allocation of costs among the distinguished network parts (T1-T8). In the
current situation there is a flat tariff for all the drinking water users and flat tariffs respectively by
ownership. The baseline scenario spreadsheet model counts the distribution effects of this tariff. The
model reflects the present financial flow, without cost recovery condition.
Efficiency gains of tariff structure reform
The Medium term sustainable scenario is the basis of the comparison of Cost Recovery and Cost
Recovery with marginal cost pricing scenarios. This comparison intends to show the efficiency
changes and the distribution effect of an optimal two-component tariff structure.
Incentive measure to increase connection rate to the sewerage network.
This analysis is based on the previous one. As an additional feature, it counts the volume of a specific
charge targeting households that do not connect to the sewerage network in spite of technical
possibilities.
2 Without Marginal Cost Pricing
12
UNDP/GEF Danube Regional Project
2.2 Economic Sustainability
2.2.1 The Current Practice
During the pre-transition period the development of the system and the large scale maintenance needs
were financed from state sources. The transformation of the service providers into the market
compatible form of joint stock company raised the question of valuing the system's assets. The assets
were revalued in 1996. This forms the basis of our calculation on infrastructure.
The company operates system elements (both water and sewage) on a contractual basis; the
amortisation value of these are negotiated with the owner municipalities. Amortisation is collected as
part of the tariffs and usually the company itself uses the sum for maintenance. No additional funds are
set aside by the municipalities for this purpose.
Although the economic context has changed, some of the pattern of financing still remained. It was the
result of the valuation that an amortisation constant multiplier of 0.3 was created. This is the sum the
owner allows to impose for generating revenues to cover long term investment needs.
Meanwhile, on the average the same amount was transferred to the company from the owner Ministry
year by year for specified investment purposes such as the renewal of treatment sites etc. The
company can negotiate about its view on system needs, but the investment decision, the planning and
the execution of the investment is out of the scope of the management of the company. As years went
by the sum of reallocated investment has decreased. Due to these circumstances the company does not
have a long term financial plan for accumulating the necessary restoration fund.
In the economic sustainability issue emphasis has to be placed on changing the financial burden, if
new elements necessary for long term functioning are to be introduced.
2.2.2 Comparison of Different Scenarios for Economic Sustainability
Economic sustainability scenarios are based on the gross capital assets according to the bookkeeping
of the company. There are network elements that show up in the municipal books, especially in case of
the sewage network, but there is no coherent data on some of these units. Therefore, besides these
elements I use values that are based on the ministerial guidelines of per capita investment cost on
water and sewage development, as well as a guideline of the National Water Chief Directorate that
further elaborates these values based on research studies of development investments3.
3 The missing elements are based on the per capita investment guidelines of the Ministry, and their correction (OVF-Öko Rt,
1999).
Gábor Ungvári, MAKK, Hungary
A Case Study of Municipal Water System Management and the Impacts of Tariff and Effluent Charges: EDV, Hungary
13
Table 2
Comparison of Economic Sustainability Scenarios (total costs million HUF,
commodity charge HUF/m3)
Current revenue Costs of Current Costs of Medium
Long run
Operation
run Scenario, up
scenario with
Scenario up to
to 7 years
"borrow policy"
one year run
Water
supply
639 529 561 661
Sewage
service
254 256 409 701
Total 893
785
971
1
363
Water commodity charges HUF/m3
Uniform (average) price
190
190
163
201
Households T1-T7
171
216
Industry
117
130
Other
177
217
Sewage commodity charges HUF/m3
Uniform (average) price
-
122
227
417
Households T1-T3
122
199
293
Industry 122
148
213
Other* *
199
293
Highest household
290
547 1680
price**
rate 2.3
Rate of highest and lowest household sewage price
2.7
5.7
*There are several tariffs each by treatment plant, in T4 they ranges from 190 HUF to 290 HUF, at one plant charges 390
HUF for industry, in T6 the uniform tariff is 380 HUF
** In the investigated scenarios the highest tariffs resulted in T4, due to this, the basis of comparison at current revenues is
T4 not T6
14
UNDP/GEF Danube Regional Project
Table 3
Balance of Current Revenues and Total Costs of Scenarios (million HUF)
Balance of Current
Short run
Medium run
Long run
Long run
Revenues and:
Operation
Scenario
Scenario with
Scenario with
Scenario
"borrow policy"
expansion and
environmental
upgrade, ,,borrow
policy"*
Water supply
110
78
-22
-14
Sewage
service
-2 -155 -447 -613
Total 108
-77
-470
-627
*The details of this scenario are discussed in the next chapter
The Table 2 shows different angles on the current financial policy. It shows the cost of different
scenarios of water and sewerage service compared to the present revenue stream. The first, Short Run
Operation Scenario indicates that without any amortisation (capital cost replacement) the overall
balance is positive, but there are differences between the two services.
The next column contains data that reveals the current scope of the accounted capital cost
(amortisation). If the capital cost of assets (with lifetime up to seven years) were accounted for, a
negative balance would result, which reaches 8 percent of the Medium run scenario's overall costs.
This reflects the practice that the sum received for amortisation is spent on the maintenance needs of
the network while there is no room for long term accumulation or restoration of the fundamental
elements such as pipes and treatment plant bases.
Next table shows the difference in total cost of the Operation Costs Scenario and the Long Run
Economic Sustainability Scenario with 4% real interest rate on borrowing the necessary funds.
2.2.3 Future Trends, Policies to Cover the Gap
What kind of considerations should be taken into account when deciding on the long-term capital
needs of the operation? The lack of suitable sewage infrastructure is the result of the state's previous
practice. It did not allocate the necessary funds to maintain the already existing networks, and did not
push the expansion of the sewage networks in line with the expanding (state funded) drinking water
supply network. The reason behind the state funded development activity was the sheer fact of income
centralisation.
From this point of view the burden lies on the state to provide for the missing infrastructure, without
any exception as to who owns or runs the regions' existing infrastructure, as there can be no difference
between settlements' financial burden based on whether the state financed the development earlier or
not (as they have to do it themselves now). Meanwhile it is unrealistic to take the position that the
burden of financing lies with the state, in spite of the goals the government issued in the National
Wastewater Program. (There are several other programs that have been halted or substantially delayed
due to the lack of even smaller public resource needs.) It is more reasonable to suppose some kind of
accumulation of own sources of the users themselves.
I consider two policies that aim at accumulating the necessary funds. Both target the full recovery of
capital costs. These scenarios are static ones, as they do not consider the process of gradual
replacement. Both calculate the effect of full capital replacement.
The "borrow" scenario assumes the financial market provides the necessary funds. It reflects the user
pays consideration, and implies that after the replacement of a certain system element the users will
pay the capital cost of investment through the fees. The consumers use the capital market to provide
themselves with the necessary funds for the lifetime of the operation.
Gábor Ungvári, MAKK, Hungary
A Case Study of Municipal Water System Management and the Impacts of Tariff and Effluent Charges: EDV, Hungary
15
The "self-financing" scenario uses the capital market to invest, and thus increase the value of the
accumulated fund that the community raises in advance to finance the necessary developments in the
future.
Both financial policy solutions have their advantages and disadvantages. The factors that have to be
taken into consideration at a local decision are numerous: Technical, geographical patterns, local
economic power, actual co-financing policies and the financial market's condition on long term
borrowing and savings. The decision also relies heavily on the inhabitants view about the future
prospect of their own settlement. Accumulation of local funds for future investments can put the
settlement in a better position in the long run as the local economy (as a whole) may pay less for the
provision of the necessary funds. Although the duration and the margins can change outcome of a
given policy dramatically, even turn it to disadvantageous. Most influential parameters (more precisely
their rate) are the real interest rate on borrowing, real interest rate on savings and the growth of
spending on a specific target due to economic expansion or necessity4. The longer the accumulation
period the more beneficial for a local community to choose savings instead of future use of external
sources. But the threshold of duration that marks the length of savings that could be more
advantageous than borrowing, shows great volatility. Although comparing different rate sets in case of
the around-and-over-25-years-long run savings the possibility that such an outcome is more probable.
As a consequence, such a savings policy will hardly take place without a regulatory frame and an
efficiently working financial market.
2.3 The Extension and Upgrade of the Service - Environmental Scenario
This chapter follows the previous chapter's line of thought. One of the main tasks of the program is
the reduction of nutrient load of the Danube basin. In this context the reduction of nutrient load can be
achieved by
- installation of third treatment phases in the plants and
- the increase of the connected consumers' rate.
2.3.1 System Extension and Upgrade
The next table shows the increase of costs due to the new system elements.
4 Above this calculation of circumstances, a local decision on financial policy even consider the other local activities'
alternative cost of capital use.
16
UNDP/GEF Danube Regional Project
Table 4
The Changes of the Expansion and Upgrade Scenario
Current revenue
Costs of Short Long run Scenario
Run Operation
with expansion
Scenario up to
and
one year run
environmental
upgrade, borrow
policy
Water supply
639
529
651
Sewage service
254
256
867
Total 893
785
1
518
Drinking water commodity charge HUF/m3
Uniform (average) price
190
190
200
Households T1-T7
217
Industry
132
Other
210
Sewage water, commodity charge HUF/m3
Uniform (average) price
-
506
Households T1-T3
122
122
340
Industry 122
264
Other *
340
Highest household price
290
rate 2.3
1888
Rate of highest and lowest household sewage price
5.6
*the same considerations as the description of the other scenarios
2.3.2 The Potential Increase of Sewage Connection Rate
The difference between drinking water supply and sewage water provision is the main problem of the
service, although a considerable number of consumers do not use the sewerage network even if the
possibility of connection is given. In this system there is one village where the sewerage system (T5)
will soon be completed, and there are two small villages in T4 where the National Wastewater
Program does not provide for a sewerage system, only substitution for it, but with no specific deadline.
T5 will be part of the sewage network of T2 and T3, and the expansion of the network is included in
the Long term and environmental scenarios.
Beyond its environmental impact, the increase of connected users has economic benefits as well. The
higher the collected amount the lower the per cubic meter average fixed cost. The next table shows the
potential increase of wastewater at each of the territories and the resulting price changes. I assumed
that the drinking water / sewage water rate changes to 95% in towns, 90% in suburban areas and to
80% in villages.
Gábor Ungvári, MAKK, Hungary
A Case Study of Municipal Water System Management and the Impacts of Tariff and Effluent Charges: EDV, Hungary
17
Table 5
The Comparison of Medium Run CR Scenarios with the Current and a
Plausible Full Sewage Connection Rates
Present
Rate of Medium Run With full
Change of
Change of
Drinking /
D/SW at
CR tariff connect tariff
Total
total annual
Sewage
"full"
(HUF/m3)
(HUF/m3)
Sewage
revenue
Transformati connection
Volume
on rate
Households in T1
78%
95%
199
179
1.23
1.10
Public Inst. in T1
90%
90%
199
179
1.01
0.91
Households in T2
62%
90%
199
179
1.46
1.31
Households in T3
81%
95%
199
179
1.18
1.05
Other small users in T3
83%
90%
199
179
1.09
0.98
Households in T4
38%
69%
547
303
1.86
1.03
Households in T6
77%
80%
426
413
1.04
1.01
Although the connection between sewage collection efficiency and nutrient load reduction of the
Danube is more complex. Fostering connection without suitable third phase installments at the
treatment plants the higher rate of collection may even result the increase of load. Meanwhile the
precautionary principle rather suggests that collecting wastewater is more justifiable than the
prolonged use of leaking sink tanks.
2.4 The Cost Burden
The table below shows the changes of households' cost burden based on different scenarios. It reflects
that the less advantageous small facilities cost increase substantially as the capital intensity of the sites
grow. The comparison is based on the average household net income of the region. If the lower
income groups are considered, water and wastewater costs can have an even higher share. (The lowest
income deciles is 50%, the lowest quintile 62% and the second quintile 80% of the average income).
Moreover the distribution of income is unequal, it tends to be higher in urban areas.
Table 6
The Allocated Cost Burden of Households Compared to the Net Household
Income of the Region in 2001
Households
Current Operation Medium run with Long run scenario Long run scenario
Costs
cost recovery
with "borrow
with expansion and
policy"
environmental
upgrade, borrow
policy
T1 1.7%
2.1%
2.7%
2.9%
T2 1.6%
2.1%
2.7%
2.9%
T3 1.5%
1.8%
2.4%
2.6%
T4 1.4%
2.7%
6.5%
7.2%
T6 2.9%
3.0%
7.4%
8.0%
Households average incomes: KSH, 2001
18
UNDP/GEF Danube Regional Project
2.5 The Distribution of Cost Burden Equity
As a result of the institutional changes of the last decade, the previously existing structure of service
provision was split, and one provider was replaced with several providers. This process was led by the
strong need for low cost areas to gain short term benefits from their geographical or system
advantages. This process has left other areas worse off. The central government answered this problem
by developing a subsidy scheme, which aims to subsidize the households that face the highest cost.
From the government's point of view it is reasonable to prevent the less capable rural population from
facing the exaggerated effect of the price changes. This policy tries to avoid shifting the
(environmental and health) cost to the more exposed segment of the population through the increase of
water use from lower quality local wells. But the current practice gives no incentives to municipalities
for regional co-operation and for finding less costly solutions to their common problems (in sight of
WFD for example). The present situation results in questionable differences between villages in cost
burdens in case of a basic service, as the differences can be random and are not based on the villages
own previous decisions or geographical patterns.
The investigated systems make it possible to determine the effect of further assignment of actual costs
to the users. The wastewater systems are separate local networks where differences in ownership have
resulted in different charges as well. The water system is a single network although there is a
possibility for a virtual separation of the system into smaller systems. The system could be divided by
the three water extraction points into sub districts if we suppose that the production of the wells is
constant in time and that they service only the nearby villages, at levels up to their production
volumes5.
Who finances whom?
The tariff scheme recently defined by the Ministry is quite simple. It defines one-component, flat
tariffs for drinking water provision and for the sewage service as well. There are no different tariff
measures for households and public institutions. This tariff scheme is valid throughout the district for
drinking water provision, and for the sewage systems run by the municipalities which are state owned
(T1, T2, T3), but not for other municipality sewage systems. The municipalities set their own sewage
prices in accordance with the concession contracts they have. Some of them differentiate between
households and other users, other apply a uniform tariff, but all of them have per cubic meter prices
more than twice as high as the uniform price of the state owned system.
The baseline scenarios show that the balance of costs and revenues for drinking water supply shows a
surplus, while sewage provision costs exceed revenues.
The cost allocation models reveal that the uniform tariff results in cross-subsidisation of households at
the expense of industry. The small villages benefit more from the current tariff structure than the cities
of T1, T2 and T3, in spite of the more cost based prices of the sewage service (where, due to the
municipal ownership the tariffs actually are two-three times higher). So the small settlements benefit
more from the uniform drinking water tariffs than they "lose" due to the unequal cross subsidisation of
sewage provision.
5This division results in mixed supply only in case of two municipalities.
Gábor Ungvári, MAKK, Hungary
A Case Study of Municipal Water System Management and the Impacts of Tariff and Effluent Charges: EDV, Hungary
19
Table 7
Rate of Total Revenues (Paid) per Total Costs (Allocated) by Consumer
Groups for Both Services Together
Current situation
Total Revenue / Total Cost ratio
Households in T1
1.09
Public Institutions in T1
1.06
Industry A in T1
1.16
Industry B in T1
1.36
Households in T2
0.91
Households in T3
1.05
Industry C in T3
1.49
Other small users in T3
1.05
Households in T4
0.83
Other users in T4
0.87
Households in T6
0.86
Households in T7
0.99
Other small users in T7
0.99
Purchasing water to T5
0.64
Purchasing water to T8
0.62
T7, T5, T8 only water provision.
The cost recovery scenario that I run to analyse the current situation supports this hypothesis. The
uniform cost recovery price is 8 HUF lower than the actual water tariffs, meanwhile the uniform
sewage tariff of T1, T2, T3 and the industry is 76 HUF higher than the actual tariff.
The revenue / cost ratios show that when considering both services, all the household groups are more
or less in balance, with the costs they are responsible for being roughly equal to the tariffs they pay for
the service, only the industry is worse off.
2.6 The Potential in Tariff Structure Reform
The allocation of costs (to territories T1-T7) revealed that the further reflection of real costs can result
in efficiency gains on network level. To show the effect I compare the shift from a one-component
tariff to a two-component tariff, both with Cost Recovery (the latter one includes marginal cost
pricing, MCP) in case of drinking water provision.
20
UNDP/GEF Danube Regional Project
MCP pricing implicates two-component tariffs. The characteristics of the D, MC an AC curves imply
that the tariff contains a constant element that results in a relatively high burden compared to the
tariff's variable element. The question is whether the MCP pricing in case of infrastructure with big
spare capacity can result in gains that originate from higher levels of consumption6. The table shows
that overall, the proportional change in volume of water exceeds the proportional change of the sum it
costs to the consumers, making the average costs of water lower. That results in a 9% gain. But it is
still not a widely accepted technique due to the conflicts such a tariff change would generate on local
political fields.
The identification of cost elements is a technical problem, meanwhile introducing new cost-sharing
rules is a political one. The result of stricter allocation of costs borne by consumer groups reflects in
tariff differences. One of the arguments against this (two-component, MCP) tariff structure is that
definite customer groups (located in high cost areas or with low level of consumption) will be worse
off. This outcome emerges if the total price these groups pay for their consumption is lower than the
costs delegated to the fixed tariff element in the new tariff regime. This leads them to a
disadvantageous situation that - in case of constrained purchasing ability - has no simple solution to
adjust their consumption. The price increase in low consumption areas can cause an unfortunate
positive feedback. Due to the low consumption the further decrease of consumption results in a
disproportionately large increase in average costs that force the prices even higher... etc. The other
element is a substitution effect: if the only rational response of the consumer to an increase in price
levels is to leave the system and base his consumption on the existing old wells.
Meanwhile, the cross-subsidisation of household consumption contradicts the overall interest of the
region as it puts costs on industry that other regions may not. The political cost of price increase is
high. So tariff structures have to incorporate definite social or local political considerations.
6 The external costs of water extraction are not within the scope of our research, and we are not in a position to judge if this
solution is in accordance with environmental considerations.
Gábor Ungvári, MAKK, Hungary
A Case Study of Municipal Water System Management and the Impacts of Tariff and Effluent Charges: EDV, Hungary
21
Table 8
Volume Change / Total Tariff Payment Change Ratio due to Shift from
Medium Run Cost Recovery Scenario to Medium Run Cost Recovery with
Marginal Cost Pricing
Drinking
water
Households in T1
1.44
Public Institutions in T1
1.51
Industry A in T1
1.09
Industry B in T1
1.09
Households in T2
1.02
Households in T3
1.21
Industry C in T3
1.12
Other small users in T3
1.26
Households in T4
0.84
Other users in T4
0.88
Households in T6
0.80
Households in T7
0.99
Other small users in T7
1.04
Purchasing water to T5
0.65
Purchasing water to T8
1.03
Total 1.09
Drinking Water Cost Clusters: The costs are allocated by territory and inside a given territory the division of costs are based
on the used amount.
The table shows that T4, T5 and T6 would be worse off with this tariff change, these are the villages
that are among mountains, or at the far end of the network. Usually in village areas the average income
is lower.
2.7 Sewerage Substitutions or Emission Tax
A widespread problem of sewerage development is the low connection rate of households to the
existing networks. This feature has an environmental aspect as well, because leakage is a "built-in"
function of these sewerage substitution tanks. The waterworks offer free connection to the sewerage
network, but this has not resulted in an increase in the number of households connected.
How much would the connected user save if all the technically feasible households were connected?
The calculation is based on the above discussed Medium Run scenario with MCP. Except for T5, the
sewerage networks cover the area of the water supply network. It means that the lower number of
sewerage connection indicates the unwillingness of the population to use the service. These
households cause losses to their fellow citizens as the per capita fixed costs are higher for the ones
who co-operate, and they cause environmental damages as well. The remediation or the purification of
the polluted water imposes extra costs on the community. The low sewage water / consumed water
quantity rates of communities show the potential in increased use of the sewerage network.
22
UNDP/GEF Danube Regional Project
A local environmental load fee imposed on the non-connected households can provide an incentive to
co-operate. The possible measures of this fee can be based on the MCP pricing method as this method
calculates by dividing fix and variable costs and gives an efficient quantity / tariff set.
The distribution of the investment cost among all households (connection charge) will bring the
previously non-connected households to a point where the costs they incur and the costs they are
responsible for are balanced (in the medium run). If the local environmental load fee consisted of the
per household fixed costs and the variable cost of an average household's consumption, then it would
be indifferent to the non-connected user if he was connected to the network or not. In fact, if users also
incur some cost of illegal disposal (e.g. maintenance of the septic tank or payment for transport of the
septics) then non-connected users would have an incentive to connect. The average fixed cost per
household in the district is 25,500 HUF (minimum 10,300 HUF, maximum 62,300 HUF) the fine
where the user charges cover the costs (adding the average consumption) is 28,300 HUF annually.
Introduction of such a charge may result in a 20 percent increase in the total collected sewage water
quantity (in case of currently under utilised systems).
Gábor Ungvári, MAKK, Hungary
A Case Study of Municipal Water System Management and the Impacts of Tariff and Effluent Charges: EDV, Hungary
23
3 Policy Recommendations
3.1 Local Decision on Financial Policy, Responsibility of Inter-
Generational Burden Allocation
Experience:
Lacking financial strategies to obtain own sources for investments in the medium and long run.
Recommendations:
1. Regulatory frame in order to oblige owners to start accumulate funds for future investments
2. Provide information to owner municipalities about possibilities of financial markets to better
represent the interest of present and future generations
3.2 Grant / Subsidy Allocation
Experience: misallocation of financial sources of sewerage investments
Recommendation: Tighter supervision by regulators pe.: State Audit Office
3.3 Equity and Complexity
Experience:
1. Efficiency gains on network level makes some user-groups worse off especially ones with small
consumption and less ability to adjust their consumption
2. Worse off groups may leave the system and apply illegal solution that impose extra charges and
costs to the communities
Recommendations:
1. Reconsider the conditions of current subsidy scheme of villages with extra high tariff
2. Tariff changes for efficiency gains have to be issued together in package with local initiatives
that targeted more sustainable environmental resource use of the district.
3. Create guidelines with official backing on proportional allocation of costs between different
consumer groups. These guidelines should provide information on how to match policy goals (express
local values) with suitable rules of financing the operation, in order
· to facilitate self-reorganisation of the network for efficiency gains, or
· to create alternative ways to exit existing technical solutions of the networks on their edge. In form
of: applying new small scale ecology driven solutions for small settlements, adjusting land-use
patterns for safer resource use and harness ecological services of abundant local access to land (pe:
Target oriented use of new financing possibilities of EU)
Document Outline