

September 2004
ASSESSMENT AND DEVELOPMENT OF
MUNICIPAL WATER AND WASTEWATER
TARIFFS AND EFFLUENT CHARGES IN
THE DANUBE RIVER BASIN.
Volume 2: Country-Specific Issues and
Proposed Tariff and Charge Reforms:
Bulgaria National Profile

AUTHORS
Dr. Galia Bardarska / Institute of Water Problems at the Bulgarian Academy of
Sciences
TARIFFS AND CHARGES VOLUME 2

PREFACE
The Danube Regional Project (DRP) consists of several components and numerous
activities, one of which was "Assessment and Development of Municipal Water and
Wastewater Tariffs and Effluent Charges in the Danube River Basin" (A grouping of
activities 1.6 and 1.7 of Project Component 1). This work often took the shorthand
name "Tariffs and Effluent Charges Project" and Phase I of this work was undertaken
by a team of country, regional, and international consultants. Phase I of the
UNDP/GEF DRP ended in mid-2004 and many of the results of Phase I the Tariffs and
Effluent Charges Project are reported in two volumes.
Volume 1 is entitled An Overview of Tariff and Effluent Charge Reform Issues and
Proposals. Volume 1 builds on all other project outputs. It reviews the methodology
and tools developed and applied by the Project team; introduces some of the
economic theory and international experience germane to design and performance of
tariffs and charges; describes general conditions, tariff regimes, and effluent
charges currently applicable to municipal water and wastewater systems in the
region; and describes and develops in a structured way a initial series of tariff,
effluent charge and related institutional reform proposals.
Volume 2 is entitled Country-Specific Issues and Proposed Tariff and Charge
Reforms. It consists of country reports for each of the seven countries examined
most extensively by our project. Each country report, in turn, consists of three
documents: a case study, a national profile, and a brief introduction and summary
document. The principle author(s) of the seven country reports were the country
consultants of the Project Team.
The authors of the Volume 2 components prepared these documents in 2003 and
early 2004. The documents are as up to date as the authors could make them,
usually including some discussion of anticipated changes or legislation under
development. Still, the reader should be advised that an extended review process
may have meant that new data are now available and some of the institutional detail
pertaining to a specific country or case study community may now be out of date.
All documents in electronic version Volume 1 and Volume 2 - may be read or
printed from the DRP web site (www.undp-drp.org), from the page Activities /
Policies / Tariffs and Charges / Final Reports Phase 1.
TARIFFS AND CHARGES VOLUME 2

We want to thank the authors of these country-specific documents for their
professional care and personal devotion to the Tariffs and Effluent Charges Project.
It has been a pleasure to work with, and learn from, them throughout the course of
the Project.
One purpose of the Tariffs and Effluent Charges Project was to promote a structured
discussion that would encourage further consideration, testing, and adoption of
various tariff and effluent charge reform proposals. As leaders and coordinators of
the Project, the interested reader is welcome to contact either of us with questions
or suggestions regarding the discussion and proposals included in either volume of
the Project reports. We will forward questions or issues better addressed by the
authors of these country-specific documents directly to them.
Glenn Morris: glennmorris@bellsouth.net
András Kis: kis.andras@makk.zpok.hu
TARIFFS AND CHARGES VOLUME 2
National Profile of Municipal Water and Wastewater Management in Bulgaria
3
Table of Content
Abbreviations
1. Introduction ......................................................................................................................................... 7
1.1. Purpose of the National Profile.................................................................................................... 7
1.2. Overview...................................................................................................................................... 7
1.3. Overview of the Origins and Status of the Municipal Water and Wastewater Industry ............ 10
1.4. Future Directions ....................................................................................................................... 11
2. Legal and Institutional Setting .......................................................................................................... 13
2.1. National Laws and Regulations Governing Provision of Municipal Water and Wastewater
Service............................................................................................................................................... 13
2.2. Management Units ..................................................................................................................... 20
2.3. Service Users ............................................................................................................................. 22
2.4. Regulatory Units ........................................................................................................................ 22
3. Production Quantity and Quality....................................................................................................... 29
3.1. Water Production, Distribution and Consumption..................................................................... 29
3.2. Wastewater Production, Collection and Discharge.................................................................... 32
4. Economic Data .................................................................................................................................. 38
4.1. Tariffs......................................................................................................................................... 38
4.2. Sales ........................................................................................................................................... 39
4.3. Costs and Purchased Inputs........................................................................................................ 40
4.4. Grants, Subsidies and Transfers................................................................................................. 44
5. Infrastructure of Municipal Water and Wastewater Services............................................................ 47
5.1. Production and Processing of Municipal Water......................................................................... 47
5.2. Collection, Processing and Discharge of Municipal Wastewater .............................................. 51
6. Management Units ............................................................................................................................ 53
6.1. Types and Numbers of Management Units................................................................................ 53
6.2. Financial Conditions of the MUs ............................................................................................... 54
7. Regulatory Units ............................................................................................................................... 57
7.1. National, Basin and Local Planning and Permitting .................................................................. 57
7.2. Economic Instruments and Regulations..................................................................................... 58
7.3. Environmental Regulations and Restrictions ............................................................................. 59
8. Service Users..................................................................................................................................... 61
8.1. Water System Customers ........................................................................................................... 61
8.2. Self-Service Users...................................................................................................................... 61
9. Reform Proposals connected to Tariffs and Charges ........................................................................ 62
9.1. State Reform Proposals.............................................................................................................. 62
9.2. Reform Proposals....................................................................................................................... 64
References ............................................................................................................................................. 67
Annex 1: Objectives of The Strategy and Implementation Measures ................................................... 69
Annex 2 Institutional Organization of the Water Supply and Sewerage Sector.................................. 70
Annex 3: Water Tariffs of Water Supply&Sewerage Companies in 2003............................................ 71
Annex 4: Matrix of the Water Supply&Sewerage Problems in Bulgaria.............................................. 75
Annex 5: Water Supply&Sewerage Action Plan for the period 2003 2015 in Bulgaria .................... 77
4
UNDP/GEF Danube Regional Project
Abbreviations
BGN
Local currency: Bulgarian leva after denomination since 1999
BOD5
Biological Oxygen Demand after 5 days
BOT
Build, Operate, Transfer
Budget
Organizations
COD
Chemical Oxygen Demand
CA Commercial
Act
CoM
Council of Ministers
dka
Dekar or an area of 0.1 ha
EBRD
European Bank for Reconstruction and Development
EIB
European Investment Bank
EMEPA
Enterprise for Management of Environmental Protection Activities
EWSRC
Energy and Water State Regulatory Commission
GDP
Gross Domestic Product
IBRD
International Bank for Reconstruction and Development
ISPA
Instrument for Structural Policies for Pre-Accession
IWWTP
Industrial Wastewater Treatment Plant
LTPSMC
Law for Transformation and Privatization of State and Municipal Companies
LSGLAA
Local Self-government and Local Administration Act
MAF
Ministry of Agriculture and Forests
MoEW
Ministry of Environment and Water
MoH
Ministry of Health
MoRDPW
Ministry of Regional Development and Public Works
MU Management
Unit
NEPF
National Environmental Protection Fund
NSI
National Statistical Institute
NRW
Non Revenue Water
O&M
Operation and Maintenance
USD US
dollars
UWWTP
Urban Wastewater Treatment Plant
PE Population
Equivalent
PWTP
Potable Water Treatment Plant
SCWC
Supreme Consultative Water Council
SS Suspended
Solids
VAT
Value Added Tax
Dr. Galia Bardarska Institute of Water Problems at the Bulgarian Academy of Sciences
National Profile of Municipal Water and Wastewater Management in Bulgaria
5
WB World
Bank
WSSC
Water Supply and Sewerage Company
WWTP
Wastewater Treatment Plant
Exchange Rates
No.
1999
2000
2001
2002
1.
GDP:
1.1. in BGN
2898
3274
3754
4108
1.2. in USD
1577
1542
1718
1978
2.
Exchange rate: BGN for 1 USD
1.838
2.124
2.185
2.077
3.
Exchange rate: BGN for 1 Euro
1.95583
1.95583
1.95583
1.95583
Since July 1, 1997, Bulgaria is under a Currency Board Regime and the currency stabilized around the 1800 leva
per USD till 1999 when the lev was redenominated (three zeros were dropped).
6
GDP increase,%
Inflation, %
d
5
Annual incomes increase, %
an
P
4
D
c
r
e
a
s
e
, %
G
d
s
i
n
3
,
an
o
n
c
o
me
2
ati
i
n
fl
al
u
I
n
n 1
an
0
Year
2003
2004
2005
2006
2007
2008
2009
2010
2011
2012
2013
2014
Inflation, and GDP and annual incomes increase
6
UNDP/GEF Danube Regional Project
Dr. Galia Bardarska Institute of Water Problems at the Bulgarian Academy of Sciences
National Profile of Municipal Water and Wastewater Management in Bulgaria
7
1. Introduction
1.1. Purpose of the National Profile
This report is a compilation of information and data that describe the institutions and conditions that
shape and characterize the provision of drinking water and wastewater service in Bulgaria. The
purpose of this compilation is to provide background and inspiration for proposals to reform both the
current system of water supply and wastewater tariffs and effluent charges and proposals to adjust or
modify the legal and regulatory system within which these tariffs and effluent charges function in
Bulgaria. The aim of the reform proposals is to improve the water supply and sewerage management
in Bulgaria generally, including protection of water resources from nutrient loading and toxic
substances originating from municipal wastewater systems.1
For most of Bulgaria the operation and management of local water and wastewater service is carried
out by Water Supply and Sewerage Companies (WSSCs). The provision of water supply and sewerage
services, associated investment planning, and implementation of those plans are their obligation
The trends in the organization of the water sector reflected the same divergent pressures experienced
by the rest of Bulgarian society. For the last 50 years, the State invested in building water services. 2
Social developments since 1989 can be seen as a process of devolution both in the transfer of power
from national to local (municipal) government, and, in reduction of State support for, and influence
on, local budgets.
1.2. Overview
The Republic of Bulgaria is situated in the northeastern part of the Balkan Peninsula between latitudes
41014' and 44013' North and longitudes 22021' and 28036' East. Its longitudinal extent defines the
climate of the country as a transitional between the typical oceanic climate of Western Europe and the
typical continental climate of the Eurasian land mass. Droughts are a characteristic feature of
Bulgaria's climate. Of highly varying duration and frequency, they strongly affect water run off, as
well the population's way of life and activities (Raev at al., 2003).
The total area of Bulgaria is 110993.6 km2 (land area 110630.9 km2, frontier river and sea islands
areas 101.3 km2 and territorial waters of frontiers rivers 261.4 km2). Administratively, the country
is divided into 6 planning regions, 28 districts and 262 municipalities.
1 A municipal water system includes those regional water systems whose service area includes multiple
municipalities and often also served industrial and commercial customers in that region. As discussed below, the
larger, regionally oriented systems are particularly prominent in Bulgaria.
8
UNDP/GEF Danube Regional Project
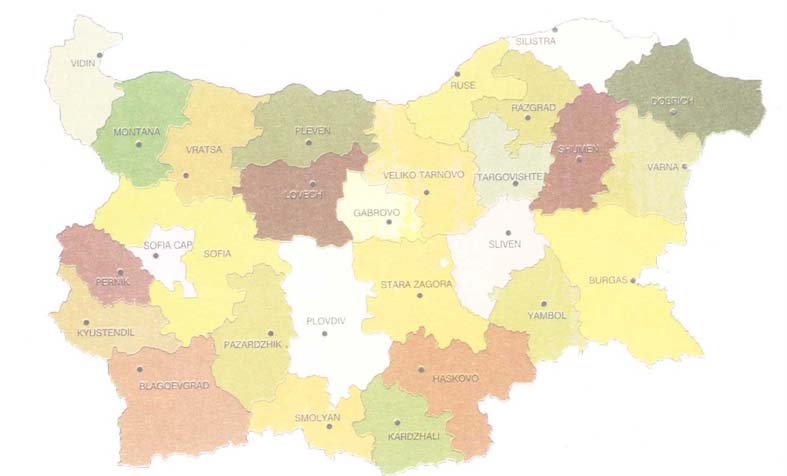
Figure 1.
Administrative Territorial Division of the Republic of Bulgaria 28 Districts
(North West region: district of Varna,Vratsza, Montana; North Central region: district of Veliko
Tarnovo, Gabrovo, Lovech, Pleven, Ruse; North-East Region: district of Varna, Dobrich, Razgrad,
Silistra, Targovishte, Shumen; South-East region: district of Burgas, Sliven, Yambol; South Central
region: district of Kardzali, Pazardzhik, Plovdiv, Smolyan, Stara Zagora, Haskovo; South-West
region: district of Blagoevgrad, Kyustendil, Pernik, Sofia and Sofia capital).
The population's decrease was 12.3% for the period 1985-2002 and was due mostly to emigration of
young people. Most of the population is concentrated in urban areas (64.8% in 1985 and 69.7% in
2002). The average density of the population decreased from 80.6 to 70.7 persons/km2 for the same
period of time.
Table 1. Population at the End of the Year (December 31)
No. Indices/year 1985 1992 2000 2001 2002
1. Total
population, 8948.6 8487.3 8149.5 7891.1 7845.5
thousands,
of which:
1.1.
Urban
5799.9 5704.5 5576.9 5473.0 5469.6
1.2.
Rural
3148.7 2782.7 2572.6 2418.1 2375.9
2.
Density per km2 80.6 76.5 73.4 71.1 70.7
Source: NSI
The population's forecast is for continued decline: from 7,785,091 inhabitants in 2003 to 7,323,708
inhabitants in 2014 e.g. 6% decrease of population (MoEW, 2003).
Dr. Galia Bardarska Institute of Water Problems at the Bulgarian Academy of Sciences
National Profile of Municipal Water and Wastewater Management in Bulgaria
9
Pop 7900
ulati 7800
on, 7700
1000 7600
7500
7400
7300
7200
7100
7000
2003 2004 2005 2006 2007 2008 2009 2010 2011 2012 2013 2014
Year
Figure 2.
Population Forecast for Bulgaria (MoEW, 2003).
The most urbanized parts of the country are: Sofia, with 1,192,031 inhabitants; Plovdiv, 713,060
inhabitants; and Varna 459,931 inhabitants (2002). Unemployment was 16.8% in 2002 and ranged
from 11.8% in the South-West region to 22.8% in the North West region.
According to art. 152, item 1 of the Water Act, the territory of Bulgaria is divided into four river
basins: Danube River Basin, Black Sea River Basin, West Aegean River Basin and East Aegean River
Basin. The Danube River Basin has its administrative centre in Pleven and covers the water catchment
areas of the rivers Iskar, Erma, Nishava, Ogosta and; to the west of the Ogosta river, Vit, Osam,
Yantra and Roussenski Lom, and the territory west of the groundwater watershed of the malm aquifer.
The Danube River Basin covers about 43% of the country and most of northern Bulgaria. Bulgaria
ratified the Convention on the Cooperation for the Protection and Sustainable Use of the Danube River
and implemented it on April 6, 1999.
Bulgaria is a formerly socialist country striving to enter the EU. It has experienced macroeconomic
stability and positive growth rates since a major economic downturn in 1996 led to the fall of the
socialist government. Bulgaria has already adopted most of the basic regulations that are meant to
ensure compliance with EU environmental directives.
10
UNDP/GEF Danube Regional Project
1.3. Overview of the Origins and Status of the Municipal Water and
Wastewater Industry
The national level water management is exclusively the right of the Council of Ministers, performed
by the Ministry of Environment and Water (MoEW). The basin level management within one or
several catchment areas is done by Basin Directorates for River Management, which are bodies to the
above-mentioned Ministry and Basin Councils. The Basin Council is a state public consultative
commission for supporting the activities of the Basin Directorate. The Basin Council includes
representatives of the state administration, the municipal administration, the water users and the
environmental organizations within the range of the basin as well as representatives of the scientific
organizations connected with the water issues. For their activity the members of the Basin Council do
not receive remuneration.
The Supreme Consultative Water Council (SCWC) provides expert consultation to the Ministry of
Environment and Water. It was established on the basis of a Regulation issued by the MoEW. It has
representatives of the Ministry of Environment and Water; Ministry of Regional Development and
Public Works; Ministry of Agriculture and Forestry; Ministry of Industry, Ministry of Transport,
Ministry of Health; Ministry of Finance; Civil Defense; Ministry of Power Engineering and Energy
Resources; many institutes of the Bulgarian Academy of Sciences, municipalities, and NGOs directly
related to waters.
State responsibilities related to the operation, construction, reconstruction and modernization of water
systems and facilities owned or partially-owned by the state are presently allocated to Ministries of the
National Government as follows:
1. The Ministry of Regional Development and Public Works (MoRDPW) water supply and
sewerage systems and facilities of the settlements, protection of the population from the water harmful
impact within settlements;
2. The Ministry of Agriculture and Forests (MAF) irrigation systems and facilities; protection of the
population from the water harmful impact beyond the settlement boundaries;
3. The Ministry of Energy and Energy Resources water energy systems;
4. The Ministry of Environment and Water (beside the above mentioned functions) water abstraction
facilities for mineral water, public state property.
For municipally-owned water and wastewater systems the operation, construction, reconstruction and
modernization of the water supply and sewerage systems is the responsibility of the municipal mayor.
There are currently 29 Regional WSSCs responsible for providing most water and sanitation services
throughout Bulgaria. The State exercises its prerogatives in the state-owned WSSCs according to a
Regulation adopted by Decree of the CoM No 7/1994 and amended several times since then.
According to this Regulation, the rights of the State as owner of a companies that is either wholly
state-owned or where the State has a share are exercised by the Minister responsible for the economic
sector in which the company is active.
The WSSCs have the status of Commercial Companies under the Commercial Act (CA). The
prerogatives of the municipality as owner of WSSCs are exercised under the Local Self-government
and Local Administration Act (LSGLAA). According to Art.21, p.9 of the LSGLAA, the Municipal
Council takes decisions for the creation, transformation and cessation of commercial companies with
municipal participation. The Municipal Council also nominates the representatives of the municipality
for a place on the governing bodies (Boards of Directors) of these companies. The Boards of Directors
of the WSSCs have the power to decide on choices of management or privatization for their
companies. In the Limited Companies, the municipalities are shareholders and have a vote through the
Boards of Directors in proportion to the percentage (%) of their ownership (according to the
Commercial Law).
Dr. Galia Bardarska Institute of Water Problems at the Bulgarian Academy of Sciences
National Profile of Municipal Water and Wastewater Management in Bulgaria
11
In the case of companies that are wholly or majority state-owned, the decision to privatize would be
taken by the Minister of Regional Development and Public Works, following consultation with the
municipalities served by the water companies.
Most dams and surface water reserves are exclusive state property, but WSSCs can use them based on
a contract with the CoM. The water supply and wastewater services assets infrastructure are owned by
the WSSCs. Though different WSSCs may own different parts of local water networks. The WSSCs
may be privatized under the Law for Transformation and Privatization of State and Municipal
Companies (LTPSMC) only through concession, or contracts for lease, management, or `build,
operate, and transfer" (BOT).
1.4. Future Directions
Bulgaria aspires to join the EU and works to harmonize the EU water-related legislation. Bulgaria has
received international technical assistance to support the legislative and institutional reform related to
the water sector and is in the process of transforming this sector, including its organization and tariff
setting process. The future direction will be outlined in the new Water Act that will be proposed by the
MoEW at the end of 2004. It is envisaged that full ownership of the WSSCs will be transferred to the
municipalities and the WSSCs future will be determined by them. This includes possibly granting
concession contracts to run the WSSCs.
The Government of Bulgaria has often expressed its interest in the evaluation of private sector
participation (PSP) options in the operation, management and financing of their water supply and
wastewater services in order to:
- increase the cost-efficiency of operations and development of the cities' water supply and sewerage
systems and introduce current managerial and technical practices;
- reduce contingent liabilities for the municipal governments, by having the private sector contribute
capital (if applicable) and share risks and incentives;
- increase consumer satisfaction and willingness to pay through the provision of a higher quality, more
responsive service;
- better delineate the role of the municipalities as regulator and representative of the customer's
interests and separate the municipalities from the day-to-day management of the WS&WW
companies;
- make tariff decisions more transparent by introducing an arms-length relationship between the
regulator and management.
Under the World Bank (WB) Project "Water Loan" a new study was initiated to examine private
sector participation in the water sector in Bulgaria. The Dutch consulting firm ARCADIS prepared the
concession bidding documents for the WSSCs of Varna and Shumen and the pre-qualification for
prospective bidders was completed. The next steps would be solicitation of bids and selection of a
winning concessionaire. For the time being, however, MoRDPW has stopped the process because of
objections by some members of the tender committee. These members are the mayors of the affected
municipalities they are presently opposed to the award of a private concession.
The Management and Development Strategy for Water Supply and Sewerage Sector in the Republic of
Bulgaria, recently adopted by the Council of Ministers, aims to improve the management of the water
supply and sewerage sector and increase the quality of services (MoRDPW, Annex 1, p. 69 . ). This
strategy would:
- establish a new law on water supply and sewerage;
- introduce an integrated approach to private sector participation, taking into account public interest
and identifying preferred management models for private sector participation;
12
UNDP/GEF Danube Regional Project
- application of a structured management approach, taking into account regional planning and ensuring
economies of scale;
- elaboration of a regulatory act for water pricing.
An Act for Regulation of the Water Supply and Sewerage Services has been drafted. According to the
Art.5 (1) of the act a new Energy and Water State Regulatory Commission (EWSRC) will be
responsible for the quality of water services and for the establishment and control of water tariffs
beginning January 1, 2005 (MoRDPW, Annex 2 p. 70). Under this draft, there are many aspects of a
WSSC's performance that would be regulated. Drinking water quality and discharge wastewater
quality, would continue to be regulated by the relevant Ministries (MoH and MoEW), with regular
consultation with the EWSRC.
In the official EC No. CONF 13/01 position of the Republic of Bulgaria the transition period for the
Directive 91/271/ is proposed as follows as:
· to 01.01.2011 - construction of sewerage systems and WWTPs for settlements with more than
10000 PE;
· to 01.01.2015 - construction of sewerage systems and WWTPs for settlements with 2000-10000
PE.
Dr. Galia Bardarska Institute of Water Problems at the Bulgarian Academy of Sciences
National Profile of Municipal Water and Wastewater Management in Bulgaria
13
2. Legal and Institutional Setting
2.1. National Laws and Regulations Governing Provision of Municipal
Water and Wastewater Service
2.1.1. Common Provisions
Legislation, relevant to levels of services and required to be respected includes the following:
1. Water Act (SG 67/1999, in force since 28.01.2000, as amended in 2000 and 2003);
2. Environment Protection Act (SG 91/25.09.2002);
3. CoM Decree No 169/2003 for Regulation Determining and Impose the Penalties for Pollution
over the Permission Norms;
4. National Standardization Act (SG No. 55/1999 in force since 1999);
5. Act for Limitation of Harmful Impact of Waste on the Environment (SGNo 86/1987);
6. Norms for Designing of Water Supply Systems since 1987;
7. Technical &Building Norms to Control Outbreaks of Fire (SG No33/1994);
8. Regulation No. 11 for the Design and Use Requirements of Waste Treatment Facilities (SG
No. 152/1998);
9. Regulation No. 1 on the Study, Use and Protection of Groundwater (SG No. 57/2000);
10. Regulation No. 2 of Protection of Water against Pollution Caused by Nitrates from
Agriculture Sources (SG No. 87/2000);
11. Regulation No. 3 on Sanitary Protection Zones (SG No. 88/2000);
12. Regulation No. 4 on the Quality of Water for Fish and Shellfish (SG No. 88/2000);
13. Regulation No. 5 on the Operation of Water Monitoring System (SG No. 95/2000);
14. Regulation No. 6 on the Emission Limit of Substances in Wastewater Discharged into Water
Bodies (SG No. 97/2000);
15. Regulation No. 7 on Wastewaters Discharged into Sewer Systems (SG No. 98/2000);
16. Regulation No. 8 on the Quality of Coastal Sea Waters (SG No. 10/2001);
17. Regulation No. 9 on the Quality of Water intended for Drinking and Domestic Purposes (SG
No. 30/2001 and on the Use of Water Supply and Wastewater Systems, 16.03./2002;
18. Regulation No. 10 on Discharge Permits;
19. National Standards 17.13.02-82; 17.13.03-83; 17.13.04-84; 17.13.05-85; 17.13.06-85;
17.13.07-85; 17.13.08-86, obligatory one year after the enforcement of the National
Standardization Act.
These acts and regulations are listed above in rough order of importance. All of them are in accord
with the EU directives.
The Water Act, approved in 1999 by the 38th National Assembly, has undergone numerous
amendments and addenda in the period 2000-2001. An Amendment of and Addendum to the Water
Act was passed by the National Assembly in 2002. Analyses of 1999 legislation and its application
have shown some problems:
In general, no distinction is made between water as a common national and indivisible natural
resource and the use of water for water economic activities and provision of water services;
The rules of protection of waters and water ecosystems are not explicitly defined. Many of the
imperative regulations in the by-laws on water protection in actual fact develop further the
Water Act and that is inadmissible;
14
UNDP/GEF Danube Regional Project
Three years after the enforcement of the Water Act, the provisions regulating the depreciation
of the capital stock and the requirements for submission of information by other institutions
and municipalities for the purposes of setting up an information system (data base) on water
management have not been fulfilled;
The issues related to the ownership rights and joint ownership rights on water infrastructure
and facilities are not adequately regulated;
The basic public relations with respect to the provision of water supply and sewerage as a
public service in human settlements and settlement clusters are not regulated;
The criteria for use of surface waters and water facilities are not adequately regulated and their
linking to public interest remains to be a matter of wishful nature;
After the approval of the 1999 Water Act other laws have been approved, which:
(i)
give new definition of notions, which are an integral part of the Water Act, and that in
actual fact changes the sense of the notion;
(ii)
settle in a new way issues of the ownership rights, thus blocking the application of
certain dispositions of the Water Act related to water management;
(iii)
settle in a different way the water economy activities, which are in principle an
integral part of the subject matter of the Water Act.
The recent passage of the EU Water Framework Directive (WFD) required still further harmonization
than was possible by The Amendment and Addendum to the 1999 Water Act. As noted above, the
Ministry of Environment and Water has drafted a new Water Act in 2004. It is expected that the new
legislation, including full transposition of the WFD into the national legislation, will be adopted by the
end of 2005.
The responsibility for the implementation of the WFD lies with the MoEW Water Directorate, and, for
the associated economic analysis, the MoEW Strategy, European Integration and International
Cooperation Directorate. The economic analysis, part of each WFD-mandated river basin management
plan, will most probably be performed by external consultants selected according to the procedures of
the Public Procurement Law. It is envisaged that the supporting information needed for the analysis
will be collected and managed by the Basin Directorates. These four directorates will also provide
guidance as to the source and availability of useful information. It still has to be decided how the data
provided by the directorates will be organized.
2.1.2. Service Area
The service area of WSSCs corresponds to the administrative regions in the country. As noted above,
there are 29 regional WSSCs set up in Bulgaria. 13 of these companies are 100% state owned, and 16
are jointly owned (51% by the state and 49% by the municipality). Besides these 29 WSSCs, there are
additional 20 municipal water companies serving only small areas and populations ( Table 2. ). These
20 municipal companies are not typical of Bulgaria. They were established due to the lack of
investments from the state (central budget). These municipalities used local financial resources to
provide basic infrastructure to their citizens.
Dr. Galia Bardarska Institute of Water Problems at the Bulgarian Academy of Sciences
National Profile of Municipal Water and Wastewater Management in Bulgaria
15
Table 2. Water Supply and Sewerage Companies with Different Ownership in Bulgaria
100% state ownership
51% state and 49% municipal
100% municipal ownership
1.
Blagoevgrad
Varna
Batak
2.
Burgas
Vratza
Belovo
3.
Vidin
Gabrovo
Berkovitsa
4.
Dobrich
Dimitrovgrad
Botevgrad
5.
Pazardjik
Isperih
Bratsigovo
6.
Pleven
Kardjali
Breznik
7.
Plovdiv
Kjustendil
Velingrad
8.
Razgrad
Lovech
Dupnitsa
9.
Smolyan
Montana
Kresna
10.
Sofia-district
Pernik
Kovachevtsi
11.
Stara Zagora
Russe
Kubrat
12.
Haskovo
Silistra
Panagyurishte
13.
Yambol
Sliven
Petrich
14.
Targovishte
Peshtera
15.
Shumen
Rakitovo
16.
Veliko Tarnovo
Sandanski
17.
Svishtov
18.
Sevlievo
19.
Sofia-city concession
20.
Strelcha
21.
Troyan
Source:MoRDPW
8 0 0 0 0 0
N u m
7 204
In h ab ita n ts s erv ed b y p u b lic w ater s u p p ly
7 0 0 0 0 0
b e r
1 6
o f
In h ab ita n ts c o n n ec ted to th e s ew erag e
4 611
6 0 0 0 0 0
in h a b
4 240
2 6
ita n ts
8 0
3 881
5 0 0 0 0 0
8 2
3 149
2 662
4 0 0 0 0 0
6 5
2 755
2 429
2 340
2 196
2 9
2 259
3 8
2 185
7 5
2 085
0 0
2 148
2 9
8 7
1 654
0 9
8 0
1 493
1 628
3 0 0 0 0 0
2 3
1 566
1 373
1 331
1 427
1 410
1 180
1 480
2 6
8 2
5 1
1 009
1 058
3 1
2 3
9 6
2 2
8 6
1 3
0 0
9 920
2 7
6 7
2 0 0 0 0 0
6 498
4 772
5
1
7
1 0 0 0 0 0
W S S C
B la g o
D im it
S o fia
S ta ra
0
G a b r
D o b r
T a rg
K a rd
K ju s t
P a za
P lo v d
H a s k
e v g ra
B u rg
V e lik
V ra tz
ro v g r
L o v e
P e rn i
P le v e
S ilis t
S m o l
Y a m
V a rn
V id i n
R a zg
o v o
Is p e r
M o n t
R u s s
-
S h u
ic h
S liv e
Z a g o
o v is h
ja li
e n d il
c h
rd jik
iv
ra d
o v o
d
a s
a
o
a
a d
ih
a n a
k
n
e
ra
n
y a n
b o l
d is tri
m e n
ra
te
c t
Figure 3.
Inhabitants Served by Water Supply & Sewerage Companies with State
Share
16
UNDP/GEF Danube Regional Project
1400000
117
757
7
1200000
1094
410
1000000
Inh
abit
ants
serv
800000
ed
by
mun
Inhabitants served by public water supply
icip
Inhabitants connected to the sewerage
al
WS
600000
SC
400000
200000
650
500
517
412
414
2951
439
283
00
3500
3000
250
3870
3419
120
175
1652
2100
00
15
162
03
3600
50
2200
1400
0
310
43
700
0
0
7000
214
57
00
6
0
00
600
5
00 3000
66
01
9
4720
0
0
3000
00
0
0
0
0
0
Sofi
Bat
Belo
Ber
Bote
Veli
Kne
Kub
Pan
Petr
Pes
Svis
Rak
Stre
Dup
San
yska
ak
vo
kovi
vgra
ngr
itov
ja
rat
agy
ich
hter
htov
lcha
nits
dan
vod
tsa
d
ad
uris
a
a
o
ski
a
hte
Municipal WSSC
Figure 4.
Inhabitants Served by Municipal Water Supply& Sewerage Companies
In a singular example of privatization, in 1999 the foreign firm "International Water" signed a 25 year
concession for the water supply and sewerage services with the municipality of Sofia. In 2000
"International Water" and the municipality of Sofia registered a joint stock company, Sofiyska Voda
AD, for water supply and sewerage management.
2.1.3. Conditions of Service
The regional WSSCs are responsible for producing and distributing drinking water and receiving and
treatment of wastewater for all their private and public customers. Conditions of services provided by
WSSCs are specified and defined in the 1999 Water Act and its implementing Regulations. All
consumers shall be supplied with a minimum water pressure 2 bars in the towns and villages,
measured at customers` connection at the time of maximum daily and hourly peak demand. In the
areas with multi-dwelling houses, the minimum pressure shall not be less than 3.4 bars and maximum
water pressure shall not exceed 6 bars.
The WSSCs are responsible for maintaining the distribution network and provide connections at the
request from customers. Also, WSSCs are responsible to ensure inspection, repair, and/or replacement
of consumer meters. The proper functioning of water meters is ensured by establishing an action
program. As a result there is a very high percentage of connections to the drinking water supply
network (98%) and the very high percentage of customers connected to the network with meters (85%
to 90%). There is no "connection" charge. But the cost of monitoring a connection's conditions is
recovered by each WSSC (MoRDPW, 2004). The municipal street cleaners are responsible for
maintaining the municipality's storm sewers, but the WSSC is responsible for maintaining and
cleaning the link between the storm sewer and street's wastewater sewer.
When the user hinders the checking of the water meter the water tariff is based on the continuously
water consumption with water velocity 1.5 m/s (MoRDPW, 2004). In the rare cases when there is not
Dr. Galia Bardarska Institute of Water Problems at the Bulgarian Academy of Sciences
National Profile of Municipal Water and Wastewater Management in Bulgaria
17
possibility to install a water meter the water consumption is calculated on the basis if the number of
persons served by the connection. Here are some other "rules of thumb" for calculating monthly water
quantity (MoRDPW, 2004):
- 6 m3 water consumed per person in heated flat and 5 m3 for an unheated flat;
- 0.15 m3 water per m2 cultivated area;
- 0.1 m3 per m3 of offices, tourist house, villa etc.;
- 0.5 m3 per m3 of buildings during construction.
In drought periods the WSSC informs the regional administration that it is putting into operation water
restrictions to limit the quantity of the water consumed.
There are three tariff components: water supply, sewerage, and water treatment services. There
usually are two rate schedules in regard to these tariffs: one for households and one for non-household
customers. The WSSC has to announce a new water tariff in a popular newspaper for a three days
period (MoRDPW, 2004).
The standards of water services are similar across Bulgaria, with little, if any, variation locally or
regionally. These standards do not vary with a customers' ability to pay for service.
WSSCs are supposed to try to keep the required service levels and quality in order to comply with the
regulations. WSSCs are also supposed to establish tariffs for given time periods to reflect efficient
levels of operation, all with due regard to the affordability of the tariff.
Customers should receive a bill based on the metered consumption every month. If there is not
regular access to the meters during the year, for example in a villa area, the billing cycle may be
longer but should not be longer than a year.2
In multi-apartment buildings the meter reading is done one a month, and the payment is made on the
basis of the reported figures. The difference between the amounts registered on the main (block) water
meter and the sum of the individual apartment's meters is the value of water loss in the block of flats.
To recover all costs, this is divided among the apartments in proportion to the number of inhabitants of
the apartment and added to the amount of water registered on the meter.
For the purpose of reducing the amount of non-revenue water (NRW) produced by the WSSC, all
WSSCs have to establish teams to investigate the reasons for water losses. NRW arose due to physical
and administrative conditions including: illegal connections, bursts, non-metered water quantities, and
lack of pressure reduction valves in the lower zones. 3
There are also investigations into the water loss per km of water supply pipe above a certain diameter
(Dimitrov, Trichkov, 2001).
According to the 1999 Water Act the control of water sector is made by different ministries, basin
directorates and municipalities. The main assignments are as follows:
The mayor of the municipality shall control: the construction, maintenance and the proper operation of
the sewerage networks and of the installations for treatment of household wastewaters; the
construction, maintenance and operation of the water systems; the construction and the registration of
the wells for individual water use from the ground waters on the territory of the municipality.
The Minister of Health shall control: the quality of the water, designated for drinking-communal
needs; the quality of the mineral water, designated for drinking or used for prophylactic, healing and
hygienic purposes, including the bottled mineral waters in the retail trade network; the quality of the
water, designated for bathing.
The Minister of Regional Development and Public Works, the Minister of the Agriculture and Forests,
and the Minister of Power Engineering and Energy Resources shall control the state of the water
bodies, the water systems and installations in the scope of their competence.
2 Villas are, in this case, usually temporary summer residences in a country setting.
3 The definition for non-revenue water percentage is: (total volume distributed water-total volume billed
water)/total volume distributed water x 100 (%) per annum, or semi-annual period.
The total water loss percentage is defined as: (total volume of water loss during transport/ Total volume of
produced water in distribution system) x100 (%) per annum (NSI, 2004).
18
UNDP/GEF Danube Regional Project
The Minister of Environment and Water issues: methodologies for control of the water resources;
preparation of the water balances of the water sources and the National Water Balance; distribution of
the waters from the dams and for use of the water resources; determining of the operational resources
of the ground waters.
The Ministry of Environment and Water shall control: the quantity and the emission status of the
waters; the observance of the requirements of the permit for water use when it is issued by the MoEW;
the observance of the conditions under the concession contracts for waters, which are exclusive state
property; the design parameters of the water installations and systems, elements of which are the
complex and important dams, the condition of their control and measuring devices, the condition of
the networks for quantitative and qualitative characteristics of the waters; the observation of the
prescribed regime for use of the waters of the complex and important dams.
The Director of the Basin Directorate shall: establish the boundaries of the waters and the water
systems which are public state property, together with the technical services cadastre services of the
municipalities; organize the preparation of the management plans for the respective basin; issue the
permits; realize the activity of the National Water Monitoring System at a basin level; keep and
maintain the water and water infrastructure cadastre and the registers of the issued permits; collect the
fees for the permits which he issues; control the observation of the conditions and the requirements of
the issued permits and of the conditions of the granted concessions; carry out supervision over the
control and measurement devices of the hydro-technical installations and the systems for monitoring
of their safety; carry out supervision over the state of the water systems and installations, issue
prescriptions and controls their observation; manage the waters which are exclusive state property and
were not granted as concession; manage the installations for ground waters, which are public state
property.
The Basin Directorates shall control: the condition and the flow capacity of the river beds and of the
discharging installations into the water recipients; the condition and the proper operation of:
a) the water intake installations, the installations for use of the surface and the ground waters
and the facilities for measuring the water quantities;
b) the treatment installations for wastewaters;
c) the sewerage systems;
d) the network for own monitoring of the waters;
e) the control and measuring devices of the hydro-technical installations, the tailings ponds,
the slag ponds, the solid waste deposits and the systems for control of their safety;
f) the implementation of the requirements of the issued permits;
g) the emission status of the waters in the water bodies;
h) the maintenance of the minimum admissible run-off in the rivers;
i) the pollution of the water recipients and the ground waters during emergency situations
and volley discharges; and
j) the wastewater treatment plants.
The Minister of Defense shall control the preparation of the emergency plans and the implementation
of their requirements.
2.1.4. Reporting Requirements
All State owned MSSCs, joint State/Municipal owned MSSCs, and Sofia City have the capacity to
provide regulatory data as, in most cases, the systems are already in place to provide data to the
MoRDPW and/or the World Bank. Annually, the regional (national or partly nationally owned)
WSSC managers report to the MoRDPW financial data including income, expenditure, cash flow, and
calculation of tariffs. Technical reports must be submitted that provide data on water produced, water
billed, water losses, wastewater quality, quantity of discharged wastewaters including charges and
penalties paid in respective year. There is a special department in the MRDPW dealing with state
owned utility companies (not only WSSCs) where these reports are submitting and checked. The
State, through MoRDPW, has majority ownership and could impose new reporting requirements on
Dr. Galia Bardarska Institute of Water Problems at the Bulgarian Academy of Sciences
National Profile of Municipal Water and Wastewater Management in Bulgaria
19
the MSSCs without resort to legislation. The public access to these annual WSSC reports is very
difficult.
The smaller, municipal companies, although making up over 40% of the total number of water
companies, only provide services to about 5% of the population served. They are not required to
supply the same information to the MoRDPW and therefore do not necessarily have in place the
systems of data gathering to provide this information.
Some data are available in a special publication "Environment", printed by National Statistical
Institute. The 2002 water data were published on January 30, 2004. All managers of WSSCs provide
the annual questionnaire of the National Statistical Institute with data on produced and consumed
water quantity, water quality, water tariffs etc. Information collected by the National Statistical
Institute does not differentiate between expenditure by the public sector, the private sector and
specialized producers according to the Eurostat definitions (NACE 90). Nor does it provide enough
information on foreign financial sources, for example, if the sources are loans or grants, etc. There is a
considerable discrepancy in the data published by the NSI, the Ministry of Environment and Water,
regarding foreign donors.
2.1.5. Self-Service of Water and Wastewater
Self service is allowed in accordance with the relevant Acts and Regulations, such as: Water Act,
Regulation No. 9 and the Territory Development Act. The self services include wells, septic tanks, and
public taps. Most of the industrial plants and/or factory utilize self-water supply, from surface or
groundwater sources, but for technological and process purposes only. If the quality meets the
requirements for drinking purpose, then the water could be used for that purpose.
Permission by the regional authorities of the Ministry of Health (Regional Hygienic Epidemically
Inspectorates) and regional authorities of the MoEW (Regional Inspectorate of Environment and
Water) is required in advance of any construction of a water or wastewater service installation.
Independent provision of water and wastewater service is widely used in the villas areas, villages, in
the areas with water rationing, and villages without sewerage systems that rely on septic tanks. The
water quality of self service systems should meet the standard requirements in accordance with the
Regulation No. 9 on the Quality of Water intended for Drinking and Domestic Purposes (SG No.
30/2001 and on the Use of Water Supply and Wastewater Systems, 16.03./2002. Households might
use water from their individual wells without any limitation.
Most of the water used by industry is self-supplied 5,098,693.103 m3 ( Table 3. ). The lower bound on
the quantity of self-supplied water is implied by the data for 2000, a drought year in Bulgaria. There
are no limitations on water quality when used for industrial process purposes, but there may be
quantity limits (see below).
Table 3. Water Used from Self-Supply, 1000 m3
No.
Water
used
1998 1999 2000 2001 2002
1.
Total 6,316,688 5,169,618 3,999,534 4,282,911
5,119,585
1.1.
Agriculture, hunting and forestry 28,033 22,588 18,722 10,332 8,176
(incl. fishing)
1.2.
Industry 6,269,079 5,125,240 3,963,853 4,257,629
5,098,693
1.3.
Domestic sector
19576 21,790 16,959 14,951 12,716
(other activities)
Source: NSI, 2004.
According to the Art. 43. (2) of the 1999 Water Act the owner or the user of an immovable property
has the right to gratuitous water use of the surface or groundwater or under the property in quantity not
20
UNDP/GEF Danube Regional Project
more than 10 m3 per 24 hours. Apart from these cases, for the individual use of waters the user should
pay a water systems fees determined by the Council of Ministers. No fee is paid for water use for anti-
fire needs as well as for water use from surface waters out off the own property for irrigation of
individual farms with area up to 2 dka (0.2 ha) in quantity not bigger than 300 m3 monthly (Art. 194.
(2)). For industrial factories and plants there is a "water fee" for withdrawal quantity. The permission
is given from the MoEW in accordance with the technological needs of the user.
2.2. Management Units
Since 1989 much reorganization of the water supply and sewerage system has been undertaken:
- 1989 : the "Vodokanalproject" was changed by "Vodokanalinvest" (responsible for investment
functions) and "Vodokanalengineering" (for water supply and sewerage design). In this year the
right of municipalities to establish municipal firms for water supply and sewerage was approved
by the Council of the Ministers;
- 1991 : the Council of the Ministers stopped the establishment of municipal firms for water supply
and sewerage but "grandfathered" the existing municipal WSSCs;
- 1995: there were 29 state regional and 14 municipal WSSCs;
- 1995 : according to the signed Water Loan with World Bank the state should transfer 49% of their
shares to the municipalities that received investment financing based on the loan;
- 1995 1999 : 22 companies involved in the Water Loan of World Bank were scheduled for
transfer from state companies to state-municipal companies with 51% state shares and 49%
municipal shares. The allocation of the shares among municipalities was done according to
population. The first stage finished with establishment of 16 state-municipal companies. The aim
of this transition period is the penetration of the municipalities into the water management sector
and all management responsibilities to be taken by the municipalities before transferring of other
51% state shares to them in the near future;
- 1999 : the foreign firm International Water signed a 25-year concession for water supply and
sewerage services with the municipality of Sofia capital;
- 2000 : International Water and the municipality of Sofia registered the joint stock company
"Sofiyska Voda AD" for water supply and sewerage management in the city of Sofia;
- 2000-2001 : the Council of Ministers stopped the transfer of the water shares from the state to the
municipalities. The water management of three regional water supply and sewerage companies in
the towns of Veliko Tarnovo, Burgas and Sliven was transferred to private companies and water
associations;
- 2003 : the 2003 Amendment and Addendum to the Water Act suspended the contracts of Veliko
Tarnovo, Burgas and Sliven WSSCs because their activities had been nontransparent and deemed
contrary to the interests of consumers, the state and the municipalities. This unfavorable
privatization, made by former directors of these three WSSCs, showed the need for a transparent
privatization process.
The MoRDPW is responsible for the State owned WSSCs and acts as a majority shareholder in the
jointly owned WSSCs. It is the general beneficiary of international projects, funded by EU, WB etc.
and its main functions, according to the legislation, include: preparation and realization of the State
policy and conduct of State property in water supply & sewerage companies, overseeing the activities
of WSSCs and appointment of managers of state owned WSSCs, and assignment of concession
contracts.
The executive bodies in the MoRDPW are: the Trade Enterprises Directorate (where the managers
submit their reports) and Water Supply and Sewerage Department.
Finally, the MoRDPW oversees investment planning and implementation, as well as provision of
water and sanitation services. Under its umbrella are all 29 WSSCs, where the managers submit the
annual and semi-annual accounts and incomes and expenditure sheets and the balance of the entities.
Also here, the managers are obligated to announce and defend the new tariff proposals for the WSSC.
Dr. Galia Bardarska Institute of Water Problems at the Bulgarian Academy of Sciences
National Profile of Municipal Water and Wastewater Management in Bulgaria
21
The new tariffs need to be supported by calculations. Beginning in January 2005 a new water tariff
methodology is expected to be established by the new regulatory body, EWSRC.
The 16 Ltd WSSCs are directed by Boards of Directors, and the managers are appointed by these
Boards. The Minister of Regional Development and Public Works directly appoints the managers in
the 13-SPLtd WSSCs. Besides appointing a manager, the Board of Directors of the Ltds has the
power to appoint a controller, the owner's (minister's) representative, and an expert-accountant.
Through management contracts, the Boards of Directors and MoRDPW give a wide managerial
freedom to the 29 regional WSSCs` managers. The WSSC managers can define the internal structure
of their Companies, technical management, marketing and business development policy and financial
management (up to a certain delegated limit). These contracts define the obligations of the managers
vis a vis the MoRDPW: elaboration of a strategic development program, preparation of a program for
technical upgrading, with a secure financing plan, financial reporting, profit and profitability increases.
It is important to observe that in the management contracts there is a clause that sets manager
remuneration as a function of the reduction of water leakages in the service area of the WSSCs. This is
in accordance with their business plans and the World Bank requirements for the Sub-Lon
Agreement. If the managers don't succeed in implementing and/or completing the water leakages
reduction program, they will receive less salary. Such a provision also applies to the salaries of other
management staff.
For the whole-owned municipal WSSCs the managers are appointed by the Municipal Councils and
approved by the mayors. As noted above, they are not required to submit the annual/ semi-annual
reports to the ministry.
The manager is directly responsible for the financial-economic status of the entity; its prospective
running; the profit and profit abilities, receivables, or paying duties, personal salaries, the running and
future investments and construction and reconstructing policy, and so on. According to the manager's
order, the senior staff may organize and provide bids and conclude contracts for fulfillment of works,
supply of goods, consultant services, while properly observing the laws. The implemented project
should be technically feasible, financially affordable and economically viable. In addition to effective
leakage management, strategic planning and operational control of the water supply and distribution
network are used to measure the skills of management and staff of the WSSC.
The Administrative Units of WSSCs are: managers, senior engineers, chief accountant, departments'
chiefs, cashier, and as well as the chiefs of the regions (situated on the municipal territories, served by
that WSSC). All staff is appointed by the manager himself, in accordance with the Labor Code in
Bulgaria.
The World Bank Loan and WSSC Reorganization
In 1995 Bulgarian Government signed a Loan Agreement with the World Bank for USD 45 million
The Bulgarian public contributions was 30% (15% by the MoRDPW and 15% by the participated
WSSCs). The total amount of the investment pool was therefore USD 60 million. 21 WSSCs signed
sub-loans with the MoRDPW. The first condition for the loans was that they be restructured from
100% state-owned to 51% state owned and 49% municipal own WSSCs. Municipal ownership was to
be in proportion to the population served by the WSSC in each municipality. That is why 16 regional
WSSCs were restructured as Ltds, in accordance with the Trade Law.
The permission for this restructuring was given by the Council of Ministers. The WB Project was
successfully closed at the end of April 2003. The Implementation Competition Report (ICR) to the
WB Directors was completed.
In most of the cases the WSSCs are parts of physically integrated systems, encompassing all the
municipalities in the service area. The Operating Units within the MSSC are organized around specific
activities, such as: pumping stations (PS), distribution network, sewerage, WWTP, PWTP, incasso
system, NRW reduction program, illegal connections, water-meter reading, workshops (for calibration
and test of water meters, mechanical, electrical), elimination of bursts, public services, replacement of
depreciated pipes, water meters assembly and so on.
22
UNDP/GEF Danube Regional Project
In accordance with the last amendment of the 1999 Water Act all government assets of the water
distribution and wastewater collection infrastructure with the exceptions of those that serve the
territory of more than one municipality will be municipal property. The state retains the right to most
of the water bodies and water supply and water and flood control infrastructure (1999 Water Act, esp.
Ch. 2).
At the conclusion of a concession contract for waters, water systems, water infrastructure and facilities
- municipal ownership, the municipal council determines:
1. the places for common use of waters and water bodies;
2. the existing rights for use of the waters in the water reservoir.
2.3. Service Users
2.3.1. Classification of Users
The classification of water users varies from institution to institution. According to the National
Statistical Institute, the classification is as follows as:
- agriculture (incl. irrigation), hunting, forestry (incl. fishing);
- industry (mining and quarrying; manufacturing industry- food processing industry, textiles, paper
and paper production, chemicals, refined petroleum, basic metals, transport equipment; electricity,
gas, steam and hot water supply incl. cooling, construction);
- domestic sector (households, other activities).
The Ministry of Regional Development and Public Works, classifies service users as:
- households;
- budgetary organizations,
- public sector.
According to the draft Act for Regulation of Water Supply and Sewerage Services, the users are:
- all legal and physical persons which are owners of property or flats supplied with water;
- enterprises, using the water from the public water supply network;
- enterprises which treat the water and use their own water supply system to distribute not drinkable
water.
All special legal considerations by user are described in Regulation No9/ / 16.03.2002, Territory
Development Act (SG1/2001and amendments: No41 and 111/ 2001; No 43/2002; No20/2003 and the
last one No65/2003) and 1999 Water Act (SG No067/1999, in force since 28.01.2000, as amended in
2000 and the last in 2003).
During the drought periods the drinking water supply used for households has preference when water
is rationed. There are some water quantity limits for industry supplied by a public water supply
system during a drought period. This is one of the reasons for construction of wells by industry and
agriculture farms; it reduces dependence on the less reliable supply of the WSSC.
2.4. Regulatory Units
2.4.1. Environmental Regulation
According to Art. 116. of the 1999 Water Act, all waters and water bodies are preserved from
depletion, pollution, and damage with objective of maintaining the quantity and quality of waters
necessary for a healthy environment, preservation of the ecosystems, preservation of the landscape,
Dr. Galia Bardarska Institute of Water Problems at the Bulgarian Academy of Sciences
National Profile of Municipal Water and Wastewater Management in Bulgaria
23
and prevention of economic damages. The waters and the water bodies are preserved from pollution
and damage through:
·
prohibition of discharge of dangerous substances in quantities threatening the life and the
health of people and biological diversity of water bodies;
·
restriction the discharge of harmful substances;
·
determining sanitary protection zones around the water sources and the facilities for
drinking and household water supply and around the sources of mineral waters;
·
construction of water treatment stations for wastewaters;
·
establishing of a regime for use and preservation of the flooded strips along the banks;
·
regulating prohibitions for depositing wastes and dangerous substances at places where could
happen pollution of waters;
·
determining measures for not admitting artificial mixing of ground waters with different
qualities.
For these purposes the programs for categorization of surface and ground waters, and programs for
decrease of the pollution of the waters have been developed. The persons who produce wastewaters
are obliged to construct the necessary treatment facilities in accordance with the requirements for
discharge into the water body when there is no public sewerage system. The discharge of wastewater,
containing hazardous substances into the ground waters is forbidden or restricted depending on the
degree of danger that they create. The storage of pesticides; the depositing and treatment of wastes; the
construction of cattle-breeding farms; the construction of economic and housing buildings; the
washing and maintenance of transport vehicles and equipment; and the planting of perennial
vegetation with shallow root system is forbidden on river banks and in coastal areas.
The national water management institutions are the Council of Ministers and the Minister of
Environment and Water. The water management bodies at a basin level are the Directors of the Basin
Directorates.
1. The Council of Ministers:
·
approves the National Water Economic Plan;
·
grants concessions for waters which are exclusive state property;
·
approves national programs in the sphere of protection and sustainable use of waters;
·
permits the use of waters for the purposes of the defense and the security of the country;
·
determines restrictions in the use of waters, in exclusive cases, concerning different districts of
the country;
·
determines the quantity of mineral waters, used by public health care institutions at a
grounded proposal by the Minister of Health; and
·
determines the tariffs for the fees, collected on the grounds pointed out in the 1999 Water Act.
2. The Minister of Environment and Water:
·
elaborates the policy of the state in the field of the use and protection of the waters and the
protection from their harmful impact;
·
elaborates the National Water Economic Plan;
·
approves the river basin management plans;
·
develops national programs in the sphere of protection and sustainable use of waters;
·
prepares the water and water economic balances of the country;
24
UNDP/GEF Danube Regional Project
·
issues permits for water use and/or use within the scope of the cases provided for in the
present law;
·
determines the order and the way for use of the waters of the complex and important dams,
determined in appendix No 1 of the 1999 Water Act;
·
establishes the necessary organization, ensure the financing and make proposal for granting of
concessions;
·
organizes the maintenance of the water and water economic cadastre;
·
organizes and manages the National Water Monitoring System;
·
elaborates the state policy for bilateral and multilateral cooperation in the field of use and
protection of waters;
·
publishes a periodical bulletin about the status of the water resources of the Republic of
Bulgaria;
·
approves the design parameters and schemes for the water infrastructure and installations;
·
coordinates the starting of procedures for granting of concessions for water infrastructure and
installations, which are public state property; and
·
approves the exploitation resources and the project obtaining of the ground waters, including
the mineral waters.
2.4.2. Economic Regulation
The financial organization and economic regulation for the use, protection and restoration of the
waters and water infrastructure is guided by the 1999 Water Act in Art 192 is as follows:
1. such organizations and regulations should be devoted to protection of the interests of the population
in their use of water for drinking-communal purposes and mineral waters for drinking, healing -
prophylactic and recreation purposes;
2. payment for water and wastewater service depending on the volume, the quantity and the quality of
the used and discharged waters;
3. the offender pays for the incurred damages, disruptions, pollution and other to the waters and the
water bodies;
4. economic incentives for rational use, protection and restoration of the waters and water bodies.
The implementation of this guidance is changing, however, as new legislation directed at the
regulations of water and water management is, as was noted above, being developed.
he elements of economic regulation include:
- a new organization of WSSCs
- a new Energy and Water State Regulatory Commission. Its aims are to offer new measures for
water sector development and restructuring in order to guarantee effectiveness of all kind of
services in the field of water supply continuity of services and the services quality;
- economic instruments (tariffs, fines, charges, etc) ;
- economic analysis;
- water tariffs set up, using profitability (12% or to 30%);
- methodology for cost recovery tariffs and possibilities for capital investments to be included;
- annual adjustment of tariffs, which will be done by EWSRC;
- institutional strengthening and capacity building program in the WSSCs;
- investment planning and realization of the year program;
Dr. Galia Bardarska Institute of Water Problems at the Bulgarian Academy of Sciences
National Profile of Municipal Water and Wastewater Management in Bulgaria
25
- NRW reduction program;
- renewing the assets.
Water and Wastewater Tariffs
Until 1991, the same water tariff applied for the domestic sector of all country. Before 1991 the tariff
of drinking water for industry via public water supply system was 2-3 times higher than households'
drinking water. Now, each WSSC defines the water tariff according to the methodology adopted with
Decree No. 194/1995 issued by the Council of Ministers and promulgated in the SG No.
40/10.05.1996, amend. SG No. 60/ 02.07.1999. This methodology not refers to geothermal waters
used for heating and greenhouses, for the water used for heating and for the water used for irrigation.
There are other institutions' methodologies for calculation of these types of water supply.
The water tariff setting for different types (i.e. pure, sewage and treated) is based on the rules of: 1999
Water Act, Act for Protection of Users and for Trade Rights (Ordinance No. 85/1999 of the Bulgarian
President), Accountant Act, National Accountant Standards, and Regulation for Water Supply &
Sewerage Systems Use in Populated Sites. The water tariffs are meant to cover their operational
expenses, depreciation, and a certain "profit".4 The drinking water "profit" shall not exceed 12% for
the population and for the business needs and shall not exceed 30% in the cases when it has been
proven that funds are needed for financing an investment program for rehabilitation of the water or
wastewater distribution network and facilities. The water tariff is set on the basis of 1 m3 the three
classes of billed water: water supplied, wastewater collected, and wastewater treated.
WSSCs and municipal councils set tariffs for drinking water and wastewater services. The tariffs are
lower for households and cross-subsidized by other consumers. Currently, the drinking water supply
tariffs vary substantially with the technology of water extraction and delivery pumps, gravity or
mixed systems and on the associated electricity and other costs incurred by the operator. The
wastewater tariff is calculated on the same basis as the water supply tariff. Usually, the operator splits
its wastewater charge into two parts: for taking the water away to the main city collector and the
charge for wastewater treatment (if the WWTP is installed). The WSSC includes into the wastewater
tariff the costs of any effluent charge. The WSSCs make individual contracts with the local factory's
administration and the quantity and quality of wastewaters impact on the costs of wastewater service.
Twenty days after the end of each annual quarter the WSSCs send their report of actual expenditures
for the water services to the MoRDPW. The items that go into the calculation of the experience-based
final tariff are shown in Table 4.
4 The term profit is put in quotations here because it is very doubtful that these rules are guided by the concept of
economic profit. The concept of "profit" here is more likely some net-revenue concept but without a clear
understanding of prevailing accounting rules we can't say more precisely what this net revenue represents
despite the elaboration of some accounting elements below.
26
UNDP/GEF Danube Regional Project
Table 4. Calculation of Water Tariff According to the Adopted Methodology
No. Item
Report for the Proposal for
% of increase
current year
the next year
1.
Expenditures, thousands BGN
of which for:
1.1.
Materials (right for withdrawal water,
buying of water, raw materials and materials
for production, spare parts of long-term
assets)
1.2.
Electricity and fuels
1.3.
Outside services incl. repairs
1.4.
Depreciation (depreciation of physical and
non physical long-term assets according to
the Accountant Act and to the Guideline for
applying of Decree No. 56 for business
activity)
1.5.
Salaries
1.6.
Social insurances
1.7.
Others (business trips, capacity building
courses, exhibitions and fairs participations
etc.)
1.8.
Subsidiary activity (workshop for repairs,
water meters workshop, water quality
laboratories, protection of sanitary zones
around water withdrawal sources etc.)
1.9.
Organization and management
1.10. Incasso (collection of the water bills)
1.11. Payment of loans interests and insurances
2.
Water consumed, thousands m3
3.
Total expenditures for production and
realization (cost), BGN/m3
4.
Profit, %
5.
Water tariff, BGN/m3
Source: 1999 water tariff methodology
Present tariffs levels are inadequate to cover the full cost of service provision, including maintenance
and capital costs e.g. the Art. 193 (1) of the 1999 Water Act "the tariff of water supply, collection
and treatment services includes coverage of expenditures for construction, operation, maintenance and
reconstruction of the installations and the systems, necessary for the provision of the respective
services" doesn't work. This is a main reason for economic and regulatory overhaul of the water
services sector that is currently underway.
Dr. Galia Bardarska Institute of Water Problems at the Bulgarian Academy of Sciences
National Profile of Municipal Water and Wastewater Management in Bulgaria
27
Water Fees
The fee for the right of use of water and water body, named "water fee", was adopted in 2000 and
implemented in 2001. The user of water and water body shall pay a fee for the use of the natural
resource. Access to water in exchange for the fee is guaranteed whether for both natural and legal
persons. A differentiation of fees with respect to the purposes for which the water or water body is
used. The possible fee categories for water use are: for drinking and household needs; for irrigation;
for cooling; for recreation and water sports; for industrial needs, for the production of electric power
by a hydroelectric power plant; for other needs. The fees for the use of mineral water are classified
separately, as follows: for medical treatment, rehabilitation, prophylactics and for drinking; for sports,
recreation, household and hygiene necessities.
Possible fee categories for water bodies are: for recreation and water sports; for fish-breeding,
production and reproduction of aquacultures and other biological recourses (duckweed, shell
organisms etc.); for the production of sand, ballast and other activities disturbing the regime of the
water body.
A specific "water fee" may be determined for each of the purposes in levs (BGN) per cubic meter of
consumed water or in levs (BGN) per square meter of the area of the used water system. There may
also be a correction coefficient. The correction coefficient indicates the category of the water in the
water body, the correspondence between the category and the purpose for which the water body is
used, and the suitability of the water for reuse. The coefficient is "penal" when water of a "higher"
category is used for a "lower category" purpose. The correction coefficient provides an economic
incentive to use water of lower quality for purposes that need water of higher quality.
The administering of the water use fees is connected to the license regime stipulated by the 1999
Water Act. Permit for use is required in all cases except when water is used not more than 10 m3 per
24 hours for own needs. All information necessary for the calculation of the fee is contained within the
license for water use and use of a water body.
Before 2002 the holders of licenses transferred the fees to a special account of the National
Environmental Protection Fund (NEPF) Ministry of Environment and Water.
The Enterprise for Management of Environmental Protection Activities
The Enterprise for Management of Environmental Protection Activities (EMEPA) is proposed as the
full successor to the NEPF. EMEPA is a legal and state-owned entity. It is not a commercial venture;
it is a not-profit organization and does not pay out dividends. EMEPA collects:
·
the fees for water use and/or use of the water bodies;
·
the fees for issuing of permits under the 1999 Water Act;
·
the fees for services; the receipts from the repayment of expenditures;
·
the fines, imposed for violating the provisions of the present act; funds, provided under
international agreements and programs;
·
donations by local and foreign individuals and corporate bodies;
·
receipts from interest;
·
indemnifications, received by individuals and corporate bodies for damages caused by them;
and
·
other receivables on the basis of a normative act.
The collected funds have to be spent by EMEPA for:
·
the construction, maintenance and operation of the National Water Monitoring System;
·
the elaboration and the updating of the National Water Economic Plan and of the river basin
management plans;
·
the activities for control over the waters, water bodies, water infrastructure and installations;
28
UNDP/GEF Danube Regional Project
·
studies and applied scientific investigations according to themes within the scope of the effect
of the 1999 Water Act;
·
direct financing or co-financing of capital costs for acquiring of material long-term assets and
for non tangible long term assets and for major repair, related to activities and measures within
the scope of the effect of the 1999 Water Act;
·
direct financing or co-financing of activities or measures within the scope of the effect of the
1999 Water Act, which are not capital costs;
·
construction of installations for improving the drinking-communal water supply to the
population, for collection and treatment of the communal wastewaters;
·
payment for services of scientific and technical character, expert statements and assessments,
assigned by the competent bodies;
·
supporting of the operational costs of the Basin Directorates, as well as the costs, related to the
material-technical ensuring and the current activities of the Basin Councils.
Effluent Charges
The effluent charges are set by the Regional Inspectorates of Environment and Water at the MoEW on
wastewater discharged into the river body. The effluent charges apply when the water quality is over
the permissible degree of pollution of Categories I, II and III of surface flowing waters. The fines
depend on the exceedance of concentration limits, wastewater quantity and duration of pollution.
An amendment to the Environment Protection Act in September 2002 stimulates the protection
activities of commercial and legal persons. There is a 10% effluent charge reduction after
implementation of protection measures in accord with the MoEW investment programs.
Dr. Galia Bardarska Institute of Water Problems at the Bulgarian Academy of Sciences
National Profile of Municipal Water and Wastewater Management in Bulgaria
29
3. Production Quantity and Quality
Water quality monitoring is done by the National Ecological Monitoring System at the Ministry of
Environment and Water (253 monitoring stations for surface water and 203 monitoring stations for
groundwater). The main groundwater pollutants are: nitrates, sulphates, chlorides, iron, manganese
and some heavy metals. Generally, the industrial restructuring has improved the quality of surface
waters and surface water quality problems are mainly confined to drought periods (Raev et al., 2003).
3.1. Water Production, Distribution and Consumption
16% of the fresh water abstracted was used for public water supply in 2002 ( Table 5. ). 65% of the
public water supply is produced by pumps (groundwater abstraction).
Table 5. Fresh Water Abstraction by Source, thousand m3
No. Fresh
water
1998 1999 2000 2001 2002
abstraction
1.
Total fresh water
7,905,216 6,818,096 6,132,242 5,832,947 6,588,684
abstraction:
1.1.
by fresh surface
7,112,105 6,232,965 5,558,249 5,307,572 6,095,939
water
1.2.
by fresh
793,111 585,131 573,993 525,375 492,745
groundwater
2.
Public water system 1,186,349 1,204,136 1,177,971 1,075,444 1,057,107
abstraction:
2.1.
by fresh surface
609,320 794,065 768,025 695,603 691,822
water
2.2.
by fresh
577,029 410,071 409,946 379,841 365,285
groundwater
Source: NSI, 2004
30
UNDP/GEF Danube Regional Project
392,700 thousand m3 of water was consumed by customers from the public distribution network in
2002 from 10,200 different water sources ( Figure 5). The water distribution loss is about 68% ( Table
6. ).
600000
500000
2000
i
o
n
2001
ct 400000
2002
300000
a
b
s
t
ra
200000
a
t
er
W 100000
0
Water source
Inland
Dams
Shaft,
Drainage
Springs
Drilling
rivers
kettle,
wells
mining
Figure 5.
Water Abstraction (1000 m3/year) for Public Water Supply by Surface and
Groundwater Sources in Bulgaria.
Table 6. Public Water Supply in Bulgaria, 1000 m3/year
No. Water / year
2000
2001
2002
Total water abstraction for public water
1.
supply 1,177,971 1,075,444
1,057,107
2.
Water in distribution network
1,118,543 1,028,210 1,009,651
3.
Water consumed
468,000
424,114
392,700
of which: was drinking water quality
446,183
407,949
376,864
3.1. For households
294,053
273,042
255,411
of which : was drinking water quality
293,952
273,042
255,411
3.2. For industry
83,990
69,982
70,183
of which : was drinking water quality
62,569
55,900
54,496
3.3. For agriculture
1,819
1,656
1,786
of which : was drinking water quality
1,699
1,541
1,684
3.4. For other consumers
88,138
79,434
65,320
of which : was drinking water quality
87963
77466
65273
4.
Total water loss during transport
731508
668112
684715
5.
Water treatment before using:
5.1. By disinfection
674,009
628,909
611,664
5.2. By mechanical treatment and disinfection
13,841
10,817
9,900
5.3. By drinking water treatment plants
487,322
437,654
436,736
Source: NSI, 2004
Dr. Galia Bardarska Institute of Water Problems at the Bulgarian Academy of Sciences
National Profile of Municipal Water and Wastewater Management in Bulgaria
31
The part of population served by public water supply works is 98.8 %, lived in 5031 settlements. The
population receiving centrally supplied drinking water in the cities and towns is 100%. The population
served in the villages is lower 83.5%. There isn't any clear definition of a town and village. The part
of population served by public drinking water treatment plants is 38.3%. The number of drinking
water treatment plants is 42. Table 7. shows the public water supply consumption by different users.
Table 7. Water Used from Public Distribution Network by Supplied Category, 1000 m3/year
No.
Water use by supply category
1998
1999
2000
2001
2002
1.
Agriculture, hunting and 4,889 4,188 1,819 1,656 1,786
forestry (incl. fishing)
2.
Industry 120,721
108,575
83,990
69,982
70,183
3.
Domestic sector, of which:
390,045
371,492 382,191 352,476 320,731
3.1.
Households
301,962 282,788 294,053 273,042 255,411
3.2.
Other
activities
88,083 88,704 88,138 79,434 65,320
4.
Total
515,655 484,255 468,000 424,114 392,700
Source: NSI, 2004
Table 8. Water Consumed by Population per Capita (l/cap/day)
1998 1999 2000 2001 2002
101 95 99 95 90
Source: NSI, 2004
32
UNDP/GEF Danube Regional Project
In 2002 the water consumed in some towns is higher than country average value Kresna 180 l/cap/d;
Black Sea towns ( Primorsko 193 l/cap/d; Sozopol 154 l/cap/d; Nessebar 153 l/cap/d etc.); Sandanski
139 l/cap/d; Sofia 128 l/cap/d etc ( Table 9. ).
Table 9. Public Water Supply by Regions and Towns in 2002
Region Average
Maximum
Minimum
Part of
Part of
water
water
water
population
population
consumed,
consumed,
consumed,
served by public
on water
l/cap/d
l/cap/d
l/cap/d
water supply, %
supply
restrictions,
%
North - West
84 120
39 (Yakimovo)
97.8
36.9
region
(Chiprovci)
North Central
90
126 (Ivanovo)
61 (Gabrovo)
99.5
6.5
region
North-East
75
107 (Vetrino)
39 (Omurtag)
99.6
13.6
Region
South-East
88 193
46 (Kotel)
99.7
9.9
region
(Primorsko)
South Central
80
126 (Strelcha)
43 (Ardino,
97.6 16.5
region
Chernoochene)
South-West
111
180 (Kresna)
52 (Petrich)
98.8
10.1
region
Total
90 193 39 98.8 13.4
Source: NSI, 2004.
The continuity of water supply during the day is one of the most important consumer rights. The part
of the Bulgarian population on water restrictions (lack of water quantity) was 13.4% in 2002. This
percentage is 100% for the population of the towns of Kneja, Dobrich, Rakitovo, Madan, Nedelino,
Zemen and Chavdar. These communities were totally dependent on surface water sources for the
public water supply.
3.2. Wastewater Production, Collection and Discharge
The discharged wastewater is shown in Table 10.
Dr. Galia Bardarska Institute of Water Problems at the Bulgarian Academy of Sciences
National Profile of Municipal Water and Wastewater Management in Bulgaria
33
Discharged Wastewater in 2002
Table 10.
No. Discharged
wastewater
1000
m3 %
1.
Total discharged wastewater, of which:
746,446
100% total
- untreated wastewater
229,612
31% of total
- primary treatment (mechanical stage of treatment)
101,368
13.5% of total
- secondary treatment (biological stage of treatment)
415,466
55.5% of total
1.1.
Discharged wastewater from economic units*, of which:
182,119
24.4% of total
- untreated
57,459
31.6% of 1.1.
- primary treatment
88,905
48.8% of 1.1.
- secondary treatment
35,755
19.6% of 1.1.
1.2.
Discharged wastewater from public sewerage, of which:
500,697
67.1% of total
- untreated
108,523
21.7% of 1.2.
- primary treatment
12,462
2.5% of 1.2.
- secondary treatment
379,712
75.8% of 1.2.
2.
Discharged wastewater from households not connected to
63,631
8.5% of total
urban wastewater collecting system
Source: Estimation on the base of NSI information.
*Economic unit is an enterprise with more than 36000 m3 water consumed per year.
The part of population served by public sewerage collection systems is 68.4% and by WWTPs is
38.6%. Of the 38.6 percent of the population whose sewerage is treated by WWTPs, 37.7% of them
are served by WWTPs that have biological treatment technology. The number of active UWWTPs is
55 for 67 settlements of which 43 plants have biological treatment. The design capacity of UWWTPs
with biological treatment is 1893.103 m3/d but the actual utilization is 1056.103 m3/d e.g. the WWTPs
work at about 56% of their capacity ( Table 11. ). The WSSCs have to meet the requirements for
discharges as defined in the permit issued by the Ministry of Environment and Water (MoEW).
34
UNDP/GEF Danube Regional Project
Table 11. Number of Wastewater Treatment Plants and Part of Served Population
No.
Indices
1998 1999 2000 2001 2002
1.
Active WWTPs, number
51
50
51
55
55
1.1.
Mechanical treatment, number
14
10
10
11
12
1.2.
Biological treatment, number
37
40
41
44
43
2.
Part of population served by
36.7 36.9 37 38.2 38.7
wastewater treatment plants,%
2.1.
By
WWTP,
%
35.9 36.2 36.5 38.1 38.6
2.1.1. with mechanical treatment, %
0.9
0.7
0.7
0.9
0.9
2.1.2. with biological treatment, %
35.0
35.5
35.8
37.3
37.7
2.2.
By industrial wastewater 0.8 0.7 0.5 0.1 0.1
treatment plants (IWWTP), %
3.
Design capacity of existing 1,886 1,919 1,904 1,933 1,933
WWTPs, 1000 m3/d
4.
Capacity utilization of WWTPs,
1,174 1,158 1,113 1,045 1,079
1000 m3/d
5.
Number of settlements served by
59 60 63 67 67
WWTP
Source: NSI, 2004
Dr. Galia Bardarska Institute of Water Problems at the Bulgarian Academy of Sciences
National Profile of Municipal Water and Wastewater Management in Bulgaria
35
Danube River Basin
The Danube watersheds have 22% of the WWTPs, 45.5% of total wastewater collected by public
sewerage systems, and 50% of collected wastewater connected to WWTPs ( Table 12. ).
Table 12. Wastewater (1000 m3), Connected to Public Sewerage in 2002
No.
Total or
Number Wastewater Wastewater Mechanical Biological Discharges
by
of
connected
connected
treatment treatment of treated
watershed UWWTP
to public
to UWWTP
in
in
wastewater
sewerage
UWWTP
UWWTP
1.
Total for
55 502,205
394,626 13,311
380,371
393,118
the country
2.
Danube
12 228,537
197,412 6771 189,717
196,428
watersheds
2.1. Iskur
6
146,805
142,453
1814
139,991
141,805
2.2. Osum -
6605 - - - -
2.3. Yantra
2
19,078
12,983
4090
8893
12,963
2.4. Rusenski
1 17,839 6751 0 6751 6751
Lom
2.5. Vit
1
22,451
22,410
0
22,410
22,410
2.6. Ogosta
2
15,759
12,815
867
11,672
1,2499
Source: NSI, 2004
The surface water quality of the Danube tributaries in 2002 is shown in Table 13. On the base of
expert estimation the Danube basin nutrient load (N and P) is 7030 t/year. This is 39% of the country's
estimated total nutrient load to waters of 18000 t/year (2002).
36
UNDP/GEF Danube Regional Project
Table 13. Surface Water Quality in 2002, mg/l
No. Danube
tributaries BOD5 COD SS NH4 - N
NO2-N NO3-N PO4
1.
Ogosta River
1.1. Max value
3.8
4.1
49
0.17
0.060
3.30
1.21
1.2. Average Value
1.8
2.7
22
0.04
0.025
1.98
0.47
2.
Iskur River
2.1. Max value
6.5
15.3
40
2.93
0.140
4.00
1.81
2.2. Average Value
2.5
5.9
22
0.46
0.047
1.80
1.09
3.
Vit River
3.1. Max value
4.7
57.0
30
0.60
0.160
5.94
2.64
3.2. Average Value
2.9
10.5
21
0.17
0.082
1.54
1.05
4.
Osum River
4.1. Max value
5.7
13.3
50
1.56
0.070
2.40
1.16
4.2. Average Value
2.7
5.3
24
0.20
0.040
1.25
0.54
5.
Yantra River
5.1. Max value
6.1
12.3
104
0.37
0.080
2.72
0.69
5.2. Average Value
3.8
6.7
43
0.09
0.037
1.61
0.40
6.
Rusenski Lom River
6.1. Max value
87.8
73.7
2854
1.48
3.580
8.00
1.15
6.2. Average Value
29.5
22.9
336
0.38
0.575
3.21
0.60
Source: Executive Agency for Environment, www.moew.government.bg
According to the Draft National Program for Some Dangerous Substances the total annual load of
dangerous substance emissions in the Danube River Basin is as follows as:
- Zn : 102011 kg discharged to the receiving waters, and 624.9 kg discharged to the sewerage
network;
- Cu : 1275.5 kg discharged to the receiving waters and 420.3 kg discharged to the sewerage
network;
- Ni : 119.9 kg discharged to the receiving waters and 109.2 kg discharged to the sewerage network;
- Cr : 202.1 kg discharged to the receiving waters and 301.2 kg discharged to the sewerage network;
- Pb : 313.1 kg discharged to the receiving waters and 22.2 kg discharged to the sewerage network;
- As : 8374.8 kg discharged to the receiving waters.
Table 14. Permitted Concentration of Dangerous Substances in the Wastewaters Discharged to
the Sewerage Network, mg/l (Regulation No. 7/1986)
Zn Cu Pb Ni As
Cr
V / Cr
5.0 1.0 1.0 1.0 0.5 0.5
/
2.5
Dr. Galia Bardarska Institute of Water Problems at the Bulgarian Academy of Sciences
National Profile of Municipal Water and Wastewater Management in Bulgaria
37
Table 15. Permitted Concentrations of Dangerous Substances Discharged to the Three
Categories of Flowing Surface Waters, mg/l (Regulation No. 7/1986)
Flowing Surface Water Category
Zn Cu Pb Ni As
CrVI/CrIII
1 0.05 0.02 0.05
0.02 0.02
5 0.1 0.05 0.2
0.05 0.05
10 0.5 0.2 0.5 0.2 0.1
The last categorization of the surface flowing waters into the three categories has been done by Order
272/23.05.2001 of the Minister of Environment and Water. The existing water quality monitoring is
more oriented to mechanical and chemical parameters of water quality. There are many finance and
capacity building problems to implement the ecological monitoring of water bodies according to the
Annex V of the EU WFD.
38
UNDP/GEF Danube Regional Project
4. Economic Data
4.1. Tariffs
The water tariffs of municipal WSSCs are lower than the tariffs of WSSCs with over of 50% state
ownership ( Table 16. ).
Table 16. Water Tariffs of Different WSSCs (31 December)
No. Indices
1998 1999 2000 2001
1.
Tariff of treated drinking water (without
VAT), BGN/m3
1.1.
in WSSCs with state participation
0.4
0.54
0.65
0.74
1.2.
in municipal WSSCs, of which:
0.29
0.35
0.43
0.52
1.2.1. Sofiyska Voda
0.31
0.38
0.4
0.5
2.
Tariff of treated wastewater (without
VAT), BGN/m3
2.1.
in WSSCs with state participation
0.11
0.13
0.14
0.17
2.2.
in municipal WSSCs, of which:
0.03
0.04
0.05
0.07
2.2.1. Sofiyska Voda
0.07
0.09
0.09
0.10
3.
Investments, thousand BGN
3.1.
in WSSCs with state participation
16034
22328
32466
54549
3.2.
in municipal WSSCs, of which:
351
419
793
28147
3.2.1. Sofiyska Voda
0
0
0
27300
Source: Estimation on the base of MoRDPW information.
The average tariffs for public drinking water by Bulgarian districts in 2002 are between 0.36-1.33 or
average BGN 0.68 /m3 (Euro 0.35/m3) without VAT (Table 4.1.2). The price of public drinking water
for households with VAT is between 0.42-1.61 or average BGN 0.78 /m3 (in Euro: between 0.21-0.82
or average Euro 0.40 /m3). The public water supply by surface water (City of Sofia by Iskur dam) is
cheaper than pumping groundwater (Razgrad, Dobrich, Haskovo) ( Table 17. ).
Table 17. Average Tariff of 1 m3 Drinking Water, Supplied by Public Water Supply in 2002
No. Price Industry
with
Industry with
Households
Households
VAT, BGN
VAT, Euro
with VAT,
with VAT,
BGN
Euro
1.
Maximum 1.63
(Haskovo)
0.83
1.61 (Razgrad)
0.82
1.56 (Dobrich)
(Haskovo)
1.44 (Dobrich)
(Razgrad)
1.44 (Razgrad)
0.8 (Dobrich)
1.38
0.74
0.74
(Haskovo)
(Dobrich)
(Razgrad)
0.71
(Haskovo)
2.
Minimum
0.47 (Sofia cap.)
0.24 (Sofia
0.42 (Sofia
0.21 (Sofia
cap.)
cap.)
cap.)
3.
Average
0.83
0.42
0.78
0.40
for country
Source: NSI, 2004.
Dr. Galia Bardarska Institute of Water Problems at the Bulgarian Academy of Sciences
National Profile of Municipal Water and Wastewater Management in Bulgaria
39
Some drinking and wastewater tariffs in 2003 are shown in Annex 3 (p.71) and Table 18.
Table 18. Tariffs for Drinking Water and for Water of Non-Drinkable Quality (BGN/m3),
Distributed by WSSCs in Bulgaria, (31 December 2003) (without VAT)
Gravity water
Mixed (Surface and
from Surface
Pumping water from a
Groundwater with Gravity
No. Item
Source
Groundwater Source
and Pumped Sources)
Drinking
1.
water
0.22 (Kardjali)-
0.55 (Pazardjik, Blagoevgrad)-
0.58 (Montana)-
1.1. Households
0.95 (Bobov dol)
1.47 (Isperih)
1.05 (Gabrovo)
Budgetary
0.22 (Kardjali)-
0.55 (Pazardjik, Blagoevgrad)-
0.65 (Pernik, Smolyan)-
1.2. organizations
1.02 (V.Tarnovo)
1.47 (Isperih)
0.96 (Montana)
0.22 (Kardjali)-
0.55 (Pazardjik)-
0.65 (Smolyan)-
1.3. Public
sector 1.02 (V.Tarnovo)
1.60 (Haskovo)
1.18 (Dimitrovgrad)
Water with
non-drinkable
2.
quality
0.22 (Kardjali)
0.54 (Razgard)
0.60 (Montana)
Source: Estimation on the base of MoRDPW information.
In 2003 the average tariff (without VAT) for wastewater collection for the households was BGN
0.059/m3 and for the public service users BGN 0.09 /m3. Tariffs for wastewater collection and
treatment in 2003 were:
·
households BGN 0.17 (from 0.07 to 0.47) /m3;
·
industry:
o BGN 0.35 (0.13-0.70) /m3 for BOD5 < 200 mg O2/l;
o BGN 0.45 (0.22-0.9) /m3 for BOD5 from 200 to 600 mg O2/l;
o BGN 0.7 (0.3-1.35) /m3 for BOD5 > 600 mg O2/l, and
o BGN 1.70 /m3 for BOD5 > 1000 mg O2/l.
4.2. Sales
More than 90% of customers have water meters measuring of their water consumption. Thus, in
principle, the basis for pricing and invoicing based on actual water consumption is in place. However,
there are many types of water meters and variations in accuracy and reliability across these types is
one of the reasons that the accuracy of water quantity measurements is suspect at the level of both
individual accounts and in the aggregate. The amount of sales by WSSCs with state shares is shown in
Table 19. and Table 20.
40
UNDP/GEF Danube Regional Project
Table 19. Sales by WSSCs for the Period 1998-2001
No. Indices
1998 1999 2000 2001
12. Volume
of
420099 389065 367993 326682
water billed,
1000 m3
13. Sales
(total
19676 28706 45333 55747
WSSC's
services billed),
1000 BGN
13.1. of which :water
16298 25573 35510 44438
sales
14. Profitability
4.92 5.36 4.45 2.01
ratio, %
15. Collection
89.03
86.68 (100
82.9
79.7 (98
efficiency, %
(98.23
Vratza;
(98.24
Kyustendil;
V.Tarnovo;
63.5 Stara V.Tarnovo;
42.72
65.2 Stara
Zagora)
57.4 Stara
Haskovo)
Zagora)
Zagora)
Source: MoRDPW
Table 20. Water Services Billed by WSSCs with State Ownership Participation
in 2002 (1000 BGN)
No. Item 2002
1. Total water services billed: 72,543
1.1. households
41,040
1.2. budget entities
15,851
1.3. others
15,652
Source: Pleven Case Study
4.3. Costs and Purchased Inputs
Cost of water services differs based upon the source of water produced and type of wastewater
treatment facility. The water cost for industry charged by the Pchelina dam in 2000 was 0.110
BGN/m3 (Euro 0.056/m3). This comprised 90% of the resulting water tariff ( Table 21. ).
Dr. Galia Bardarska Institute of Water Problems at the Bulgarian Academy of Sciences
National Profile of Municipal Water and Wastewater Management in Bulgaria
41
Table 21. Costs of Water Production for Industry by the Pchelina Dam in 2000
No. Item
Expenditures in BGN
1.
for:
1.1. Depreciation
25,920.00
1.2. Materials
7,836.00
1.3. Fuels
1,200.00
1.4. Electricity
4,5000.00
1.5. Outside
services
12,000.00
1.6. Salaries
14,400.00
1.7. Insurances
8,400.00
1.8. Others
15,000.00
1.9. Reconstructions
94,476.00
1.10. Organization
13,368.00
2. Cost,
BGN
237,600.00
Invoiced water volume,
3.
2,160,000.00
m3
4. Cost
per
m3, BGN/m3
0.110
5.
Water tariff, BGN/m3
0.122
Source: WSSC of Pernik town
Generally, the estimations are based on the cost data for the invoiced water volumes in a calendar year
and the projected expenses and revenues for the next year. The O&M cost appears to be very low
(Halcrow, 2002).
In addition to production costs the WSSC must pay: withdrawal fee and effluent charge. The
withdrawal fee (named "water fee") depends on the method of abstraction, specifically groundwater,
dams, surface water ( Table 22. ).
T = E x W x K
where:
T- annual fee, BGN;
E fee in BGN for 1 m3, according to the usage;
W the annual volume of withdrawal water, m3;
K correction coefficient, according to the category of surface flowing waters.
42
UNDP/GEF Danube Regional Project
Table 22. Withdrawal Fee
No.
Type of usage
E, BGN/m3 K for I
K for II
K for III
Category
Category
Category
1. Drinking
water
0.02 1 0.5 0.3
2. Irrigation
2.1. surface
waters
0.001 5 1.5 1
2.2. groundwater
0.005 5 1.5 1
3.
Waters for cooling
0.0001 4
2
1
4. For recreation and
0.4 1 0.5 0.3
sports
5. Industry
0.008 5 1.5 1
6. Others
0.01 5 3 2
Source: Regulation No. 154/28.07.2000 in State Gazette No. 65/2000. The categorization of the
surface flowing waters is done by Regulation No. 7/ 1986 (State Gazette No. 96/1986).
Every user is required to have a permit from the MoEW for withdrawing for different uses.
As noted in Chapter 2 (2. Legal and Institutional Setting), the effluent charges are triggered by effluent
levels in excess of permitted levels for at least one pollutant. According to the regulation for
determination of fines for exceeding the effluent limits (SG No. 69/05.08.2003), the fine for 1 kg
pollutant in BGN/Euro is shown in Table 23.
Dr. Galia Bardarska Institute of Water Problems at the Bulgarian Academy of Sciences
National Profile of Municipal Water and Wastewater Management in Bulgaria
43
Table 23. Fine for 1 kg Pollutant in Excess of Permitted Level
No. Pollutant
BGN
Euro
1. BOD5, COD
0.45 0.23
2. NH3-N
1.50 0.77
3. NO3-N
0.15 0.08
4. NO2-N
34 17.4
5. Total
nitrogen
0.5 0.26
6. PO4
1.40 0.72
7. H2S
20 10.2
8.
Suspended solids
0.15 0.08
9. Hydrocarbons
52 26.6
10. pH (for one unit)
0.05 0.03
11. CN
27 13.8
12. Hg
2000 1022
13. Cd
200 102
14. Pb
41 21
15. Cu
4.5 2.3
16. Ni
10 5.1
17. Zn
0.6 0.31
18. Mn
7 3.6
19. Fe
1.4 0.7
20. Cr6+
41 21
21. Cr3+
4.5 2.3
22. As
41 21
23. Phenols
27 13.8
24. Detergents
1.40 0.7
25. Extractible
compounds
0.60 0.31
26. Formaldehyde
2.80 1.43
27. Caprolactam
1.40 0.72
28. Phtalic
acid
1.40 0.72
The effluent charges are paid mainly by the industry. In 2002, the collected amount of fines is BGN
455,000 or Euro 232,737 by 267 factories.
The total planned income to EMEPA in 2004 is BGN 81 million (Euro 41.4 million) of which BGN 20
million (Euro 10.2 million) is expected to be from water charges and fines.
44
UNDP/GEF Danube Regional Project
Some WSSCs purchase water from a neighboring WSSC. The quantity is different and depends on the
needs and the available water and the water demand. For example, for 2002 the total purchased
amount is 74,602,000 m3 This is less
.
than 10 % of total drinking water production. The purchase
price is a matter of negotiation.
Table 24. Purchased Water Quantity by WSSC
WSSC
Purchased water, 1000
3
m
Varna
31,991
Lovech
75
Gabrovo
2700
Pleven
3059
Vratza
18,322
Vidin
165
Plovdiv
1155
Targovishte
7500
Isperih
6
Razgrad
56
Russe
11
Pernik
507
Stara Zagora
3773
Sofia-region
5055
Dimitrovgrad
295
Total
74,602
4.4. Grants, Subsidies and Transfers
Grants to water systems have come from Japan, EC, EBRD (through the ISPA and PHARE programs),
WB, and Swiss Trust Eco Fund (Debt against the Environment). The funds are designated for use in
paying for consultant services, technical assistance, projects design, preliminary studies, and
administration.
As introduced above, the Bulgarian Government recently used a USD 45 million loan from the World
Bank for the Water Companies Restructuring and Modernization Project. This included 30% co-
financing by the country: 15% by the MoRDPW and 15% by the 21 WSSCs. The Loan is guaranteed
by the Government. The loan was completed on 31.05.2003 and the Project's Implementation
Completion Report has been submitted to the WB Board of Directors.
Pre-accession funds are distributed by EU through EBRD, European Investment Bank, UNDP and so
on. These require Bulgaria to co-finance part of each supported project. The percent of co-financing is
from 25-50%. The projects cover rehabilitation of infrastructure and construction of new WWTPs.
More recently, the EC has been a source of water sector grants by PHARE and ISPA programs ( Table
25. ). These are meant to ease the costs of conforming to EU water sector directives. A major
administrative problem has been the inability to co-design projects that meet ISPA grant criteria.
Dr. Galia Bardarska Institute of Water Problems at the Bulgarian Academy of Sciences
National Profile of Municipal Water and Wastewater Management in Bulgaria
45
Table 25. List of ISPA Projects in Bulgaria, Approved by ISPA Management
Committee
Project Total
ISPA
Signed in
Expire date
First
budget,
grant,
disbursement,
million
million
million Euro
Euro
Euro
2000/BG/16/P/PE/003
43 32.5
December
31 December
3.25
WWTPs
2000
2005
StaraZagora &
Dimitrovgrad
2001/BG/16/P/PE/005
16.6 12.4
December
31 December
WWTP Gorna
2001
2006
Oriahovitsa
2001/BG/16/P/PE/006
19.1 12.4
December
31 December
WWTP Pazardjik
2001
2006
2001/BG/16/P/PE/008
12.6 8.8
November
31 December
WWTP Blagoevgrad
2001
2006
2002/BG/16/P/PE/009
10.2 7.7
December
Waster Collection and
2002
Treatment in
Bourgas-Meden
Rudnik
2002/BG/16/P/PE/010
15.2 11.4
December
Wastewater
2002
Collection and
Treatment in
Targovishte
2002/BG/16/P/PE/011
18.4 13.8
December
Wastewater
2002
Collection and
Treatment in Lovech
2002/BG/16/P/PE/012
16.74 12.6 December
Wastewater
2002
Collection and
Treatment in Montana
2002/BG/16/P/PE/014
14 10.5
December
Wastewater
2002
Collection and
Treatment in Sevlievo
2002/BG/16/P/PE/015
11.9 8.9
December
Wastewater
2002
Collection and
Treatment in Popovo
46
UNDP/GEF Danube Regional Project
Project Total
ISPA
Signed in
Expire date
First
budget,
grant,
disbursement,
million
million
million Euro
Euro
Euro
Total 177.74
131 million
3.25
million
million
Euro
Euro
Euro
Source: European Union, Delegation of the European Commission to Bulgaria, ISPA-Bulgaria, 5.02.2003.
There are currently funds provided by the state through MoRDPW for rehabilitation of water system
infrastructure. These rehabilitation projects include replacement of water supply pipes, completion of
sewers, rehabilitation and upgrading of WWTPs. There is currently no state or municipal policy for
directly subsidizing current O&M cost of the WSSCs. However, subsidies for investment by the public
water supply and sewerage sector during 1998-2001 were considerable. These include subsidies from
the State Budget and favorable financing backed with sovereign guarantees such as the World Bank's
Water Companies Restructuring and Modernization Project ( Table 26. ).
Table 26. Subsidies and Credit for Water Supply & Sewerage Sector in 1998-2001,
BGN
No. Indices
1998 1999 2000 2001
1. Total 15,858,470 18,621,882 40,606,037 148,785,769
1.1.
Subsidy from the State
15,858,470 18,621,882 23,534,495 131,785,175
Budget
1.2.
Credit with sovereign
17,071,542
17,000,594
guarantees
Source: MoRDPW
The only form of operating subsidy currently affecting WSSCs is the cross-subsidy between industry
and domestic sectors. Some plan that future domestic tariffs should cover both expenses and a
reasonable profitability element. Cross subsidies among customers may continue to be one of the
features of the tariff structure.
A policy of cross subsidizing water services for poor customers was discussed by Halcrow (2002).
The criteria for defining the poor is given in the Social Assistance Act, and there are existing
Regulations for using that Act. According to the Social Assistance Act, there are different income
groups and different levels of Social Assistance. The Ministry of Labor and Social Policy may manage
the subsidy process as part of other Social assistance.
Dr. Galia Bardarska Institute of Water Problems at the Bulgarian Academy of Sciences
National Profile of Municipal Water and Wastewater Management in Bulgaria
47
5. Infrastructure of Municipal Water and Wastewater Services
5.1. Production and Processing of Municipal Water
The most relevant element in the water demand and supply study is the renewable freshwater resource.
Due to the lack of melting glaciers in Bulgaria, precipitation is the main source of raw freshwater both
for the surface and the groundwater ( Figure 6).
Precipitation 0.8 External rivers
75.5
14.5 Surface
discharge
Evaporation 54.5 20.0 Internal rivers 20.8 Total ----- 20.0
river discharge National
discharge
5.5 Groundwater
drainage into
1.0 intern rivers 0.8 Groundwater discharge
Groundwater into Black Sea and Danube
transboundary discharge
Figure 6.
Water Resource Distribution for a Long - Term Annual Mean Situation (50
years) in km3/year
The available water resources are 2430 m3 per inhabitant. From 6 billion m3 per year fresh
groundwater only 4.9 billion m3 per year is useable. The annual distributed water is 10-12 billion m3:
drinking water supply 8-10%; irrigation 5-35%, industry 20-26% and production of energy 15-35%
(MoRDPW).
The water supply and consumption balance estimated for the year 2020 is shown in Table 27.
48
UNDP/GEF Danube Regional Project
Table 27. Future Fresh Water Supply and Demand in km3 2020 [reference situation -
average dry year, excl. Hydro Power Plant (HPP) and Nuclear Power Plant (NPP)]
No. Water
supply
Self supply
Supplied
Water
Total excl.
according to the
public
irrigation HPP and NPP
sources
water supply
systems**
1. Surface
water
1.707 0.969 2.625 5.301
1.1 Danube
0.116 - - 0.116
1.2 Inland
rivers
0.298 0.404 0.745 1.447
1.3 Dams
0.813 0.565 1.880 3.258
1.4
Lakes and other
0.480 - - 0.480
2. Groundwater
0.982 0.640 - 1.622
3. Other
(marine)
0.007 - - 0.007
4. TOTAL
SUPPLY
2.696 1.609 2.625 6.930
5. Water
demand
5.1 Households
- 0.504 - 0.504
5.2 Services
- 0.599 - 0.599
5.3 Losses
- 0.415 - 0.415
5.4 Agriculture
0.269 - 2.271
2.540
5.4.1 Irrigation
0.152 - 2.271
2.423
5.4.2 Livestock
0.117 - - 0.117
5.5 Industry*
2.427 0.091 0.354 2.872
5.5.1 Potable
0.347 0.091 - 0.438
5.5.2 Non
potable
2.080 - 0.354
2.434
6. TOTAL
DEMAND 2.696 1.609 2.625 6.930
( excl. HPP and NPP )
Source: Experts investigation
* Industry includes fresh water demand for Thermal Power Plant (TPP), including for cooling
** Possible future privatization of Irrigation Systems Company (ISC)
The total amount of drinking water produced in 2001 is 1,141,162.103 m3 of which 80,096.103 m3
(7.02%) was from flowing surface water, 543,516.103 m3 (47.63%) from groundwater and 517,550.103
m3 from impoundments behind dams (MoRDPW). A list of the dams is shown in Table 28.
Dr. Galia Bardarska Institute of Water Problems at the Bulgarian Academy of Sciences
National Profile of Municipal Water and Wastewater Management in Bulgaria
49
Table 28. Dams for Water Supply in Bulgaria
Dam
Water supplied settlement
Volume, million m3
1.
Christo Smirnenski
Gabrovo
18.7
2.
Yovkovci Veliko
Tarnovo
92.2
3.
Borovitsa Kardjali
27.3
4.
Assenovec Sliven
28.2
5.
Kamchya Burgas
and
Varna
228.5
6.
Srecehska bara
Montana and Vratza
16.5
7.
Yasna polyana
South Black Sea
34.7
8.
Novo Panicharevo
South Black Sea
1.8
9.
Studena Pernik
25.2
10.
Iskur Sofia
670
11.
Bely Iskur
Sofia city
15.3
Source: MoRDPW
The ecological NGOs and many academician experts oppose building new dams without further
careful consideration of future water demand. The dam experts and some decision makers are very
supportive of further dam construction. They don't support alternative water supply or conservation
strategies (reduction of water losses, development of other potential water sources, establishment of
water saving programs etc.). Development of deep groundwater is not very attractive because of the
costs of pumps and energy to run them. The situation calls for a more any formal and complete
analysis for the different water development and water saving alternatives.
The water supply system is 70,620 km long of which: 51,771 km (73.3%) asbestos-cement pipes,
10,271 km (14.5%) steel pipes, 1800 km (2.5%) cast iron pipes, 1464 km (2.1%) PVC pipes and 5314
km (7.5%) other pipes. Most asbestos cement pipes are more than 25-30 years old.
Investigations of water losses during distribution in recent years showed them to be considerable,
totaling 30% (small settlements) to 70% (big settlements) of the average daily water use. The total
water loss during transport is 68% in 2002 e.g. the total produced water in distribution network is
1,009,651.103 m3 and the total water loss during transport is 684,715.103 m3 of which: external water
loss 67,764.103 m3 (main pipes) and internal water loss (in buildings) 616,951.103 m3 (NSI, 2004). The
amount of water loss estimated to be 225 m3/km/day shows that the quantity of distributed water is 2-3
times higher than quantity of water consumed (Dimitrov, Trichkov, 2001).
The average NRW value of regional WSSCs with WB Sub-loan is 54.05% in 2002 ( Table 29. ).
Table 29. Percentage of Non Revenue Water
WSSC
Date of
2000
2001
2002
WB
Sub- Goal Actual Goal Actual Goal Actual
loan
Gabrovo
27.11.96 49.00% 45.34% 48.00% 45.34% 47.00%
Dobrich
20.11.96 76.00% 76.00% 75.00% 78.83% 74.00% 80.41%
Kjustendil
29.11.96 64.50% 64.45% 64.00% 67.87% 63.00% 66.87%
Lovech
03.12.96 25.00% 25.89% 24.00% 24.88% 23.00% 24.57%
Varna
23.12.97 60.00% 59.81% 60.00% 65.50% 60.00% 68.78%
50
UNDP/GEF Danube Regional Project
WSSC
Date of
2000
2001
2002
WB
Sub- Goal Actual Goal Actual Goal Actual
loan
Isperih
09.01.98 60.00% 59.49% 59.00% 58.31% 58.00% 61.00%
Vratca
16.02.99 72.00% 69.19% 70.00% 69.37% 68.00% 71.27%
Dimitrovgrad 18.02.99 68.00% 64.95% 61.00% 73.07% 59.00% 59.16%
Kardjali
18.02.99 41.00% 40.74% 40.00% 39.97% 39.00% 39.10%
Sliven
18.02.99 49.00% 46.12% 48.00% 48.35% 47.00% 21.00%
St.Zagora
18.02.99 63.50% 63.37% 62.00% 65.78% 60.00% 67.53%
Shumen
22.03.99 49.50% 49.51% 49.20% 49.56% 49.00% 48.65%
Vidin
08.10.99 58.00% 49.99% 57.00% 46.93% 56.00% 47.44%
Montana
14.10.99 26.00% 23.83% 25.00% 24.48% 24.00% 27.93%
Pernik
12.10.99 53.00% 52.88% 51.00% 48.10% 50.00% 53.00%
Pleven
13.10.99 50.00% 49.66% 49.00% 51.80% 48.00% 51.36%
Russe
20.10.99 51.50% 52.34% 50.50% 50.99% 49.50% 47.06%
Silistra
20.10.99 61.00% 61.50% 60.00% 61.50% 58.00% 61.00%
Smolyan
14.10.99 49.50% 49.16% 48.00% 49.87% 46.00% 50.03%
Targovishte 13.10.99 72.00% 67.88% 71.50% 69.77% 70.00% 70.62%
Yambol
08.10.99 65.50% 70.37% 64.00% 66.84% 63.00% 64.31%
Average
55.43% 54.40% 54.10% 55.10% 52.93% 54.05%
Source: WB
The large difference between the amount of drinking water produced and consumed reflects not only
leakage. Some of the difference is due to the lack of reliable method and equipment for measuring
water before distribution. There are no water meters for water mains. For example, surface water
production is estimated based on depth of water, and for groundwater production is estimated based on
the capacity of the pumps. In addition, because of the lack of measured control of water distribution,
some water is distributed to unknown users and is not covered by consumption statistics.
There are 6087 wells, 3560 pumping stations with capacity 768,219.103 m3 and 6087 water supply
reservoirs with total volume 2,613,735 m3. The annual used energy for drinking water treatment is
30,584.103 kWh. There are 42 potable water treatment plants with annual capacity of 480,505.103 m3
or 42.1% of total distributed water. The total capacity of the existing drinking water plants is not fully
utilized because they have been designed to handle consumption over than 200 l/cap/day.
The recent decline in water consumption by public water supply service users is due to the higher
water tariffs, installation of water meters by customers, and restructuring of industrial production. The
expert opinion is that an increase in the number of self-service water supplies by households,
agriculture and, mainly, industry using groundwater wells has also reduced consumption of public
water supply services.
Dr. Galia Bardarska Institute of Water Problems at the Bulgarian Academy of Sciences
National Profile of Municipal Water and Wastewater Management in Bulgaria
51
5.2. Collection, Processing and Discharge of Municipal Wastewater
Collection and treatment of urban and industrial wastewaters defined according to Art. 13 of Directive
91/271/EC is as follows (MoEW, 2003):
- annual discharged wastewaters to water bodies are 878,555.103 m3 or 2,407,000 m3/d.
- 1,478,000 m3/d are collected by public sewerage systems of which
·
76% are treated by WWTPs and the volume of untreated wastewaters discharged by
public sewers is 355,367 m3/d;
- 1,122, 663 m3/d are treated wastewaters,
·
of which 31,315 m3/d mechanically treated wastewaters and 1,081,838 m3/d biologically
treated;
- 66.8% of population is connected to the sewerage systems;
Wastewater Treatment Plants
There are 61 WWTPs for 40% of population which is equal at 5,282,360 PE. Only 21 of are in good
condition and don't need any reconstruction and modernization. 40 WWTPs work but some of them
are due for reconstruction and others need both reconstruction and modernization.
12 new WWTPs have been constructed to serve 2% of the population. At the same time there is a
need for finishing the 35% sewerage system that would supply the WWTPs.
19 settlements with 1,782,887 PE have been involved in the National Program for WWTPs
Construction. The Program plans to use ISPA, Phare and national funds for construction of these
WWTPs. 80% of their feeder sewerage systems are ready.
For settlements with population > 10000 PE some 55 WWTPs serving 1,730,960 PE need further
planning. 40% of the sewerage system for these WWTPs has to be finished;
For 283 settlements (1,107,757 PE) with population from 2000 PE to 10000 PE WWTPs would be
needed under the mandates of Directive 91/271/EC. Also, the percentage of existing sewerage
systems for these settlements is very small - 25%.
The percentage of population equivalent (PE) with different stage of WWTPs execution is shown in
Figure 7
52
UNDP/GEF Danube Regional Project
2.80%
Working WWTPs
18.60%
WWTPs with projects for execution
51.10%
WTTPs without execution projects for
2000-10000 PE
14.90%
WTTPs without execution projects for
more than 10000 PE
WTTPs in time of construction
12.60%
Figure 7.
Percentage of Population Equivalent (PE) with Different WWTPs
The Black Sea region has many WWTPs: Varna district 16 and Burgas district 11. There aren't any
WWTPs in the districts of Blagoevgrad, Vidin, Kardjali, Lovech, Russe, Pazardjik, Haskovo and
Yambol.
Twenty three industrial enterprises would be covered by Art. 13 of the Directive 91/271/EC. Twelve
of these don't have permits for discharge of wastewaters to water bodies.
Urban Sewerage Systems
The number of the towns with a public sewerage network is 167 or 70.2 % of the total. Only 2.1% of
the villages have public sewerage network.
There aren't any choices about the separation of sewerage for rainwater and for urban wastewater.
The length of the sewers is 9013 km. The total number of sewer connections is 321,983
The sewers are mostly of a gravity type, being constructed with combinations of concrete and
steel/concrete pipes. Bulgarian experts estimated that 20% of the sewerage collection networks need
urgent rehabilitation. Over 40% of them were constructed in the period of 1960-65 (ISPA Strategy,
MoEW, 2002).
The amount of industrial wastewater initially collected, lost in collection, treated, and/or discharged by
WSSCs is not known accurately because these flows are rarely metered or measured with accuracy.
The sewerage system of Sofia was originally constructed around 1897 and has been extended at
intervals, corresponding to the town development to its present state. There are 1550 km of sewers
with total length of the main collector sewers of 423 km, which service approximately 85% of the
city's population.
Dr. Galia Bardarska Institute of Water Problems at the Bulgarian Academy of Sciences
National Profile of Municipal Water and Wastewater Management in Bulgaria
53
6. Management Units
6.1. Types and Numbers of Management Units
The institutional organization of the water supply and sewerage sector was shown above in Chapter 2
(2. Legal and Institutional Setting.)
The WSSCs are purely water supply and sewerage service providers, and do not undertake any other
business activities. The main institution responsible for WSSCs with state shares in Bulgaria is the
MoRDPW but each WSSC has an independent budget.
Distribution by size
Large
Medium
Small
Comments
(> 100 000
(25 000
(< 25 000
inhabitants)
100 000
inhabitants)
inhabitants)
-
- 29 regional Water Supply& Sewerage
Companies : 13 of these companies are 100% state
owned, and 16 are jointly owned (51% by the state
and 49% by the municipality)
-
- 20 municipal water companies serving only
- 27 - 12 - 11
small area and population
-
- in 2000 the concessionaire "International
Water" and the municipality of Sofia registered
the shareholder company Sofiyska Voda AD for
the water supply and sewerage services of Sofia
capital.
Source: MoRDPW
A matrix of water supply and sewerage problems is shown in Annex 4 (p.75.) The main problems are
as follows as:
- the water supply networks are obsolete and dilapidated resulting in high levels of water loss during
distribution;
- 67% of the towns are provided with sewerage networks. Around 20% need reconstruction and
modernization;
- the current water resources are sufficient for normal water supply if they are properly managed and
effectively utilized;
- the number of population (about 1.4 million inhabitants) which are not supplied with water 24 h per
day in drought periods is too high;
- lack of enough in reservoirs to cover drought periods;
- there is a need of construction of a great number of sewerage networks and wastewater treatment
plants.
Demand for water and wastewater services in WSSCs is often overestimated (demand adjusted to
increased tariffs) and capacity designs are too big. The WSSCs haven't shown serious interest to
saving water e.g. their interest seems to be to sell much more water. The new projects frequently do
not produce revenues or reduce other costs enough to cover their costs. Under current conditions,
reducing water loss to 25% according to 1999 Water Act is not realistic until 2010 or later.
Trends in Formation and Consolidation of the MUs
The transposition of the EU WFD, the new water supply and sewerage strategy and the new act for
water supply and sewerage services is designed to better coordinate all water management units. The
54
UNDP/GEF Danube Regional Project
short- and long-term responsibility of each institution and enterprise is clear (see the Action plan for
the period 2003-2015 in Annex 5 (p.77). The linkage between different institutions has to be
improved.
6.2. Financial Conditions of the MUs
Contracts are established between MUs WSSCs and wholly owned municipal water systems - and
suppliers of raw materials, oil, pipes, water-meters adjustment, with post-offices for payment of the
bills, maintenance of hard/software, in accordance with the Law of Public Commissions.
Service contracts between MUs and households are not currently used. It is supposed that such
contracts will established when the new water law establishing EWSRC is promulgated. There are
proper contracts with WSSCs and industrial consumers - factories, plants and budget organizations.
All kind of obligations are placed in these contracts, including the water discharged volume, water
quality limits, water tariffs, effluent charges etc..
The key financial outcomes of WSSCs with over of 50% state shares (state participation) are shown in
the Table 30. These state or state/municipal WSSCs supplied 249 municipalities with 6,422,041
inhabitants.
Table 30. Economic Status of WSSCs with State Participation for the Period 1998-2002
No. Indices 1998 1999 2000 2001 2002
1. Income,
182016 210500 231734 254848 242042
thousand BGN
2. Expenditure,
173423 199369 221575 249872 238404
thousand BGN
2.1. of
which:
14043 19379 21466 25231 31238
depreciation
3. Accounting
profit 8593 11131 10159 4976 3638
(+) Loss (-),
thousand BGN
4. Balance
of
5342 7269 6342 2135 1486
"profit" (+) Loss
(-), thousand
BGN
5. Fixed
assets,
318918 332622 356454 409481 396537
thousand BGN
6. Long
term
assets, 318804 331623 352722 397121
thousand BGN
7. Received
long
10084 18490 34160 49151
term loans,
thousand BGN
8. Received
short
438 312 870 776
term loans,
thousand BGN
9. Average
tariff
of 0.43 0.54 0.65 0.74
0.68*
treated drinking
(0.5-1.41)
(0.41-1.33)
water (without
VAT), BGN/m3
10. Average
tariff
of Households
Households
Households Households Households
treated
0.11
0.13
0.14
0.17
0.17
wastewater
(without VAT),
Dr. Galia Bardarska Institute of Water Problems at the Bulgarian Academy of Sciences
National Profile of Municipal Water and Wastewater Management in Bulgaria
55
No. Indices 1998 1999 2000 2001 2002
BGN/m3
11. Water
losses,
% 56.8 (29.57
57.89
57.53
57.37(39.98
67.8*
Blagoevgrad;
(29.33
(41
Kardjali;
77 Dobrich) Blagoevgrad;
Kardjali;
79 Dobrich)
79 Dobrich)
76 Dobrich)
12. Liabilities
20233 22788 32165 48149 56076
(debts), thousand
BGN
13. WSSCs
with
28 29 28 24 27
profit, number
14.
WSSCs with loss,
1 0 1 5 2
number
15. Average
monthly
215 229 286 303 325
salary, BGN
16. Staff,
number
15335 15314 14849 14208 13551
17.
Investment,
16034 22328 32465 54549 23244
thousand BGN
Source: MoRDPW for 1998, 1999, 2000, 2001, 2002; *NSI.
27 Regional WSSCs reported positive net revenue and 2 (Dobrich and Haskovo) reported loss in their
activities in 2002. The investments in municipal WSSCs (with 1,616,925 water supplied inhabitants
and 1,389,070 inhabitants connected to the sewerage network) are very small.
No.
Indices 1998
1999
2000
2001
1.
Investments in municipal WSSCs, thousand
351 419 793
28147
BGN; of which:
1.1. Sofiyska
Voda*
0
0
0
27300
Source: MoRDPW; *1,150,000 water supplied inhabitants and 1,094,410 inhabitants connected to the sewerage
network of Sofiyska Voda.
Planned investments for the water supply and sewerage sector are shown in Table 31. and Annex 5 p.
77. Main financing sources are expected to be EC accessions grants, concessions, national budget etc.
56
UNDP/GEF Danube Regional Project
Table 31. Investments Needed for Water Supply & Sewerage
Purpose of investments
Investments
Responsible
Implementation terms
Possible investment
needed
institutions
sources
(million
BGN
/Euro)
Rehabilitation of water
3376 / 1726
MoRDPW and
2002-2015 Concessions,
supply networks and
municipalities
accession funds
decrease of water loses
(ISPA), National
budget
Construction of new and
1676 / 857
M0RDPW and
2002-2015
, concessions,
completion of already
municipalities
National Budget
started facilities
Construction of sewerage
1100 / 562
MOEW,
In compliance with the
ISPA, National
networks
MRDPW and
National Program on Sewerage
Budget
municipalities
Networks
Construction of
636 / 325
MOEW and
In compliance with the
ISPA, National
Wastewater Treatment
municipalities
National Program on
Budget
Plans
Wastewater Treatment Plants
I phase
Source: MoRDPW
Collection of Debt Owed to WSSCs.
During the period of economic collapse many factories as well as some residential customers were
debtors of the WSSCs. The WSSCs were forced to use lawsuits to collect these debts. Since March
2004, 3 years prison or tax of BGN 15000 is possible for misappropriated actions of water users (water
theft, water meters decreased data etc.).
Dr. Galia Bardarska Institute of Water Problems at the Bulgarian Academy of Sciences
National Profile of Municipal Water and Wastewater Management in Bulgaria
57
7. Regulatory Units
7.1. National, Basin and Local Planning and Permitting
National Investment Planning
The Action plan in Annex 5 (p.77) estimates the high cost of meeting EU water -related directives and
funding sources to finance investments needed in the water sector. The capacity building at the
ministries is not sufficient to respond to the actions planned. Also, the managers of WSSCs are
political appointees, often without a proper background for determining or executing needed
investments.
Municipal Investment Planning and Regulation
Besides national planning, municipalities themselves establish development plans that include all
public infrastructures. Many representatives of municipalities may not yet have sufficient experience
with issues related to the operation and financing of public services or facilities. This makes it difficult
for them to agree on and execute a common policy. In addition, local officials and private operators of
water companies have a natural tendency to try to retain the most profitable parts of water systems.
Water bureaucracies, on the other hand, encourage large investments that involve high costs even of
they also generate low revenues.
Many water management plans and regulations are unknown to most of water decision makers as well
as many WSSCs administrations. The level of administration and water system management quality
control is not very effective. Some WSSCs and enterprises have various financial links to the
regulatory institutions. Sometimes, for example, permits are issued that don't effectively assure
reduction in water pollution. There are many economic incentives (tariffs, fees and charges etc.) but
their implementation often depends on the water service provider.
Public-Private Partnerships to Improve Management and Financing
There are alternative management models of the water supply and sewerage with private sector
participation. Service contracts, management contracts, concession contracts and , and joint
management companies are summarized below ( Table 32. ).
Table 32. Management Options for Water Supply & Sewerage Sector
Option
Advantages
Disadvantages
Service contract
. It is applied to solve specific problems when: a good
. It can not solve the problems of the non-
management is already achieved; decrease of loses; billing;
effective management
management of Wastewater Treatment Plants , etc.
b. It can not improve the bad repayment of
expenditures
c. It is concluded for a short term
Management
. They can quickly improve the technical capacity and
. Short term of effect
contract
financial indicators
b. It does not ensure capital investments
b. A good effectiveness is achieved for specific tasks
c. The responsibility for operation and maintenance is
transferred to the operator
Lease
.Via it a good profit is achieved if the management is
. It does not ensure investments
improved
b. For planning of capital costs responsible
b. The operator is responsible for the effectiveness of
remains the owner
operation
c. Longer operational period
58
UNDP/GEF Danube Regional Project
Option
Advantages
Disadvantages
Concession and . The whole activity is transferred to the operator
. If the management during the contract
b. Improved is the effectiveness of the management
period if not good, then the risk is higher.
c. Improved are the qualities of services
d. Long-run contracts - over 25 years
e. It Ensures investments for long-run development
f. The new facilities under construction and the improved
existing facilities remain for the owner of the infrastructure
Joint companies
. Private sector participation is restricted to the extent as
. A part of the responsibilities and risks are
identified in the contract .
retained by the owner
b. If there is a good public-private partnership, an increase of
b. In some cases the owner and the
the effectiveness and improvement of the management could
regulatory body are the same state body
be achieved.
which make the management more
c. They are of long standing nature
complicated
d. Capital investments are ensured for the development of
infrastructure
Privatization
. All responsibilities are transferred to the operator
. The sell of assets is carried out.
b. Effectiveness and management are improved
b. A very high extent of regulation is
required
c. Risk for the protection of public interests
Source: MoRDPW
7.2. Economic Instruments and Regulations
Tariff Setting
WSSCs face significant levels of non-payment. This results in concern for the financial viability of
the WSSCs and pressure by WSSCs and their management to introduce higher drinking water and
wastewater tariffs. There is a need for a new approach to setting and collecting waste and wastewater
tariffs. The establishment of new water tariff methodology will be the first obligation of the Energy
and Water State Regulatory Commission.
It can be seen that in the all cases the nominal "profitability" is below 30%, including those companies
receiving loans from the World Bank Project described above. In accordance with the international
practice and the suggestions made by the consulting firm Halcrow in 2002, it is necessary that debt
service and a normal return on the long-term assets be included in the water service provider
accounting calculations. It is necessary that international experts be involved because the question of
pricing the water services is directly linked with the repayment of the capital invested in the WSSCs
under the World Bank loan.
Operating Subsidies
Direct O&M Subsidies are not offered in Bulgaria. There is no consistent information at hand related
to the extent of cross-subsidy between agriculture, industry, and households.
Investment Subsidies
The Bulgarian Government and European Union allocate investment subsidies. Unfortunately, the
absorption of the ISPA funds has proven to be a problem. For example, in 2003 about Euro 40 million
preliminarily allocated for 2 WWTPs Stara Zagora and Dimitrovgrad has been "lost" due to failure
to reach agreement on project terms and conditions. The managers of WSSCs are not involved in the
process of firm selection for distribution of these investment subsidies. Sometimes the urgent need of
one settlement is a drinking water treatment plant, not a WWTP. A more balanced and integrated
approach has to be implement in the water supply and sewerage sector, starting by source of water to
the end discharge to water bodies.
Dr. Galia Bardarska Institute of Water Problems at the Bulgarian Academy of Sciences
National Profile of Municipal Water and Wastewater Management in Bulgaria
59
Water Use Fees
The payers of the fees are only holders of licenses for water use and/or use of water bodies, in
accordance with the 1999 Water Act. The income of the water fees in 2002 to NEPF is BGN
21,664,400 or USD 10,430,621 (Euro 11,076,831). The absolute amount of the fees at present is low.
The main cause for the limitation is the economic sensitivity of the residential and commercial
customers. The revenues from fees that will be received by the NEPF (later EMEPA) from the fees for
the right of water use and/or use of water bodies are to be used in accordance with the provisions of
the Water Act.
Effluent Charges
Industry as well as some WSSCs have had effluent charges levied by the Regional Inspectorates of
Environment and Water when wastewater treatment plants don't work well. The design of these
effluent charges and associated fines is described in detail in the next section.
Effluent charges are paid mainly by the industry. In 2002, the collected amount of fines is BGN
455,000 or Euro 232,737 by 267 factories.
The income from the fines, collected by the Regional Inspectorates of Environment and Water, is split
as follows: 80% for the respective municipal budget and 20% for the Enterprise for Management of
Environmental Protection Activities (EMEPA).
Managers of WSSCs frequently argue that a part of fees and of effluent charges should go directly to
the water sector for renovation.
Direct Regulation
There is an expectation that the new Energy and Water State Regulation Commission will effectively
manage all economic issues as well as water tariffs of WSSCs.
7.3. Environmental Regulations and Restrictions
Under the 1999 Water Act the Minister of Environment and Water is able to order compulsory
administrative measures, in the cases of:
1. emergency or disaster situations, caused by the action or inaction of water users and/or users
in the process of water use and/or use of the water body and the operation of the water
infrastructure and installations;
2. arising of immediate danger from pollution, damage or destruction of the environment, of
people or property of the state, the municipalities, individuals or corporate bodies as a result of
the action or inaction of water users and/or users of water bodies (Art. 199. (1)).
This power has been used when WWTPs didn't work well.
Effluent Charges and Associated Fines for Non-compliance
The effluent charge schedule for individual, corporative body, WSSCs etc. which effluents in excess
of permitted levels is as follows (Art. 200. (1) of 1999 Water Law):
1. uses waters without the necessary justification or in detraction from the provided conditions and
requirements in the permit or the contract: a) for quantity up to 1 l/s - from 150 to 1000 BGN; b) for
quantity from 1 l/s to 10 l/s - from 500 to 5000000 BGN; c) for quantity from 10 l/s to 100 l/s - from
1000 to 10000 BGN; d) for quantity over 100 l/s - from 10000 to 25000 BGN;
2. use of water infrastructure and systems or constructs such without the necessary justification, or in
violation of the provided conditions and requirements in the permit - from 1000 to 10000 BGN;
60
UNDP/GEF Danube Regional Project
3. pollutes the waters, destroys the water beds or the river banks in violation of the bans- from 5000 to
15000 BGN;
4. violates the rules for declaring, accounting and control during the implementation of the water use -
from 150 to 1000 BGN;
5. breaks water and hydro-metric installations and devices or violates the proper operation and the
regulated regimes of their operation - from 500 to 5000 BGN;
6. discharges wastewaters into the water bodies and the sewerage system violating the emission and/or
the emission standards and requirements - from 1000 to 5000 BGN;
7. uses the lands adjacent to the water bodies or the lands of the flooded coastal or river bank areas not
for their designation - from 2000 to 10000 BGN;
8. misrepresents information about emergency situations in the water bodies - from 500 to 5000 BGN;
9. misrepresents design documentation about the facilities which can affect the natural state of the
waters - from 5000 to 10000 BGN;
10. does not provide access of the control bodies for carrying out measurements and analyses - from
150 to 500 BGN;
11. destroys or counterfeits data and information - from 1000 to 10000 BGN;
12. does not execute an obligation to inform the control bodies about circumstances being important
for the water protection - from 200 to 2000 BGN;
13. damages or destroys points or stations from the national monitoring networks - from 10000 to
25000 BGN;
14. does not execute the obligation for announcing the restrictions and the bans - from 200 to 2000
BGN;
15. does not execute the prescriptions - from 500 to 5000 BGN;
16. for all remaining cases of violation of bans or non-execution of obligations under the present law -
from 150 to 1500 BGN.
With the penalty of para 1 also is punished the individual or the representative of the corporate body
ordered or assigned the carrying out of activities of para 1 when the activities themselves represent an
administrative violation. When the violation of para 1, items 2,3, 7 and 13 is construction, the fine or
the sanction is from 10000 to 25000 BGN. For a second violation of para 1 and 2 the fine or the
sanction is from 1000 to 50000 BGN.
Many enterprises prefer to pay the penalties rather than renovate or built the wastewater treatment
plants. Sometimes the control institutions are not so strong.
Drinking Water Quality Standards
The Ministry of Health is responsible for setting and enforcing hygienic limits of drinking water. The
same pollutants levels as required by the EU Drinking Water Directive are regulated by Regulation
No. 9/16.03.2003. There is transition period for certain chemical indicators, and the standards should
be achieved by the latest January 2005 and January 2007, respectively.
Dr. Galia Bardarska Institute of Water Problems at the Bulgarian Academy of Sciences
National Profile of Municipal Water and Wastewater Management in Bulgaria
61
8. Service Users
8.1. Water System Customers
It is evident that the difference in the water tariffs between different customers is not big. The
difference of the water tariff depends mainly on the type of water source and water quality. The high
water tariff doesn't correspond to the high level of water services. pumping groundwater is more
costly for all users.
There are some possibilities for different water tariffs based on the volume of water consumed and
linked to the socio-economic status of the people. For example, wealthy households have swimming
pools, gardens etc. and their water consumption is often relatively high.
8.2. Self-Service Users
There isn't any effective control for the real amount of industrial and agricultural self supply by wells.
This fact decreases the number of public supply users and finally increases the water tariff per
consumer as existing fixed costs must be covered by fewer customers
Households that are not connected to the public sewers use individual septic systems. This kind of
self-service is typical in rural and tourist areas, and small towns. These septic systems are a source of
groundwater pollution by nutrients and bacteria. The water quality monitoring of private wells is not
on-going. There aren't any plans for wastewater treatment for small populated areas with less than
2000 PE.
62
UNDP/GEF Danube Regional Project
9. Reform Proposals connected to Tariffs and Charges
9.1. State Reform Proposals
The EU accession goal provides a strong motivation and context for reform of Bulgarian water policy.
The initial milestone was reached by the adoption of the Water Act in 1999. Some of the short term
measures mentioned in the Action Plan for the period of 2003-2015 will, depending on
implementation, have an impact the level, design, and setting of tariffs and, perhaps, on effluent
charges as well. Some measures are listed in Table 33. and an elaborated listing by MoRDPW is
provided in Annex 5 (p.77).
Table 33. Main Short-Term Measures Planned for Water Supply and Sewerage Sector
No. Measure
Funding
source
Initiation
1.
Development of business plans for
Water Supply & Sewerage
31.03.2004
water and sewerage companies in
Companies
compliance with the new WSSCs
strategy
2.
Development of Act for Regulation of
National financing
30.09.2005
the Water Supply and Sewerage
Services
3.
Taking out the infrastructure assets of
Water Supply & Sewerage
31.12.2004
the water and sewerage companies and
Companies
their conversion into public property
4.
Development of pricing methodology
National financing within
30.06.2004
MoRDPW
5.
Development of standards for the levels National financing within
31.12.2004
of services
MoRDPW
6.
Establishment of Water Supply Fund
National financing within
31.12.2004
MoRDPW
Source: MoRDPW
Energy and Water State Regulatory Commission
The financial support for the new EWRSC will raise the tariff for one cubic meter of public supply
water by BGN 0.001 (Euro 0.0019). This new annual "Water Supply & Sewerage Regulation" charge
will start in January 2005 and will be paid by all water operators (WSSCs).
The Council of the Ministers is expected to approve an ordinance for "Regulation of the Tariffs of
Water Supply & Sewerage Services", including establishment of the EWRSC. This ordinance will
include support for the cost recovery principle and will discourage cross-subsidies across different
water and sewer users. The EWRSC will be given responsibility to set the maximum water tariffs and
determine proper levels of revenue. Water tariffs actually charged would not be higher than the
maximum tariffs. WSSCs that set non-approved water tariffs will pay a fine of BGN 20,000-50,000
(Euro 10,226-25,564).
Under this ordinance it would be the duty of each WSSC to send to the EWRSC an annual business
plan and financial and audit reports. If this duty is performed in time the imposed fine is BGN 10,000-
30,000 (Euro 5113-15,339). Monitoring will be done by EWRSC's employees or by selected experts.
A special web page on the "National Information System" of the EWRSC will provide the public with
all data collected from WSSCs.
Dr. Galia Bardarska Institute of Water Problems at the Bulgarian Academy of Sciences
National Profile of Municipal Water and Wastewater Management in Bulgaria
63
Investment Targets
Generally, infrastructure requirements will put pressure on WSSCs to raise the level of water tariffs to
support investment over the period 2004-2014. The financial forecast of investment for development
of water supply and sewerage activities in Bulgaria is 6931 million Euros ( Table 34. ).
Table 34. Financial Forecast for Development of Water Supply& Sewerage Sector in Bulgaria,
million Euro
Bulgarian sources of investment financing
Foreign sources of investment
financing
Year
Total
Water
State
State
Total
EC
Int. banks
Total per
Supply&
budget enterprise for
(ISPA,
(BRD,IB,WB)
year
Sewerage
infrastructural
Phare,
Companies
projects
Cohesion
funds)
1
2 3 4 5
6
7 8
9
2004
30 5 20 55
5
5
60
2005
30 8 50 88
12
10 22
110
2006
80 10 70 160
65
30 95
255
2007
100 12 80 192
427
55 482
674
2008
200 15 80 295
506
70 576
871
2009
250 20 80 350
560
70 630
980
2010
300 20 80 400
670
80 750
1150
2011
300 25 90 415
445
90 535
950
2012
300 25 90 415
420
50 520
935
2013
250 20 90 360
281
50 381
741
2014
200 15 90 305 -
-
-
305
Total
2040 175 820 3035
3391
505 3896
6931
Source: MORDPW.
Foreign finances:
- BRD: Euro 60 million for WSSCs;
- EIB: Euro 23.5 million for Haskovo UWWTP and Euro 150 million for WSSCS;
- Other sources: Euro 20 million;
- ISPA: Euro 32.5 million for Stara Zagora and Dimitrovgrad UWWTPs and Euro 320 million for
WSSCs;
- Cohesion fund: Euro 154.3 million (2007), Euro 177.4 million (2008), Euro 204 million (2009), Euro
234.6 million (2010), Euro 222.8 million (2011) , Euro 211.7 million (2012), Euro 190.5 million
(2013).
The investment needed for construction of WWTP with biological treatment was estimated by MoEW
as follows as (MoEW, 2003):
· for the settlement with population equivalent from 2000 to 10000 PE 335 Euro/PE;
· from 10000 to 15,000 PE 231 Euro/PE;
64
UNDP/GEF Danube Regional Project
· from 15,000 to 150,000 PE 137 Euro/PE;
· > 150,000 PE 79 Euro/PE.
The investment needed for 100% connection of population to the sewerage system is calculated on the
basis of multiplication of three parameters: number of inhabitants, 9.2 m sewerage per inhabitant for
small settlement and fewer meters than 9.2 m per inhabitant for bigger settlement, and 150,000 Euro
per km (MoEW, 2003).
The total financial expenditures for construction of WWTPs and sewerage systems to meet Directive
91/271/ is estimated to be Euro 2218 million (MoEW, 2003). The needed national financial support
is from 0.15% to 0.42% of GDP. The biggest of this expenditure is in 2009, 2010 and 2012 0.42% of
GDP (MoEW, 2003).
The time schedule of the WWTPs construction by different kind of settlements is shown in Table 35.
(MoEW, 2003).
Table 35. WWTPs Forecast for the Period 2003-2014
No. Number of projects started in
the shown year incl. the
fulfillment of the projects
started in the previous years
2003 2004 2005 2006 2007 2008 2009 2010 2011 2012 2013 2014
1.
determination
of
the
projects 10 14 19 18 13 7 0 0 0 0 0 0
2. New WWTPs > 10000 PE
1
2
7
22
43
53
48
33
0
0
0
0
3. New WWTPs for 2000-10000
PE
0 0 0 0 0 19 87
129
177
196
154
87
4.
WWTPs
for
completion
6 8 7 9 8 5 2 2 0 0 0 0
5. WWTPs for reconstruction and
modernization
6 16 18 29 30 32 20 23 4 2 0 0
6. Sewerage projects in build up
WWTPs
2 2 3 4 6 8 8 7 6 3 0 0
7. Total
25
42
54
82 100 124 165 194 187 201 154
87
9.2. Reform Proposals
Management improved and capacity building
The strategy for improving the quality and scope of Bulgarian water and wastewater services to
European levels and standards are as follows as:
- good conditions for efficient management of the sector by introduction of economic acceptable
integrated approach;
- private sector participation while taking into account public interests.
There is a need of a change in the incentive structure so that WSSCs are managed to control costs and
keep service levels and water tariffs compatible with the demands of their customers. The concept of
integrated water management has to be introduced. The EU principles for economic analysis and
public participation would be translated and disseminated. Water tariffs decisions and investments
needs have to be taken from both the bottom up (from local places to ministries levels) and from the
top down. Key stakeholders should be involved in the investment and water pricing process from the
beginning.
Dr. Galia Bardarska Institute of Water Problems at the Bulgarian Academy of Sciences
National Profile of Municipal Water and Wastewater Management in Bulgaria
65
Less Costly Alternatives
Full implementation of the national investment programs for sewerage and wastewater treatment is not
realistic. The wastewater treatment plants for 430 settlements are planned, of which 121 are for plants
serving more than 10000 PE. Bulgarian experts are concerned about finding the best way to make
investments. Demand is often overestimated (demand adjusts to increased tariffs) and this can result in
designs whose capacity is too big. Such projects frequently do not achieve cost recovery at the
originally projected tariffs. For small towns and villages in particular, cost recovery is not feasible for
the lower income groups. Our main conclusion is that low income limits the level of water and
wastewater tariffs and any increase in the current tariffs should be very gradual and investments must
be well-planned and consistent with these tariff limitations.
Costs can be lowered (and tariff increases avoided) by using cheaper alternatives for drinking water
and wastewater treatment - implementation of affordable, lowest cost systems. The secondary/tertiary
wastewater treatment is not affordable for villages and small towns in Bulgaria. As incomes rise
affordability increases, so more costly schemes can be introduced later. By combining tariffs on water
and wastewater users and charges on beneficiaries we can achieve cost recovery in a more equitable
way.
Construction of new dams will raise the water tariff. Other alternatives could be investigated before
starting of each new project.
Affordability
Affordability is missing in water legislation. There is a possibility to adopt two part or more generally,
multipart tariffs. For example, one affordable tariff for 3 m3 per capita per month and two/three times
higher tariff for over than 3 m3/cap./month. Such social protection is needed to ensure adequate water
availability to poor households.
Information
There is a need to standardize information to meet NACE 90. The sources of environmental finance
including water finance should be set in three groups: own funds, loans and grants. Columns of
"Expenditure by Source" could be as follows:
1. Expenditure/ code of expenditure
2. Total
3. Entity's own funds
4. Loans
4.1. bank loans
4.2. bonds
4.3. national environmental funds
- Enterprise for Environmental Activities Management
- National Trust Eco Fund
- others ("Agriculture", etc.)
4.4. pre-accession funds
- ISPA
- PHARE
- SAPARD
4.5. other loans from residents
4.6. other loans from non-residents
66
UNDP/GEF Danube Regional Project
5. Grants
5.1. state budget
5.2. municipal budgets
5.3. national environmental funds
- EMEPA
- National Trust Eco Fund
- others ("Agriculture", etc.)
5.4. pre-accession funds
- ISPA
- PHARE
- SAPARD
5.5. other grants from residents
5.6. other grants from non-residents
The annual information for "Fines and Sanctions" should be expanded with information on
environmental charges paid by legal entities and could have the following columns:
1. Code
2. Product charges
3. Consumer charges
3.1. solid municipal waste
3.2. water supply, sewerage, wastewater treatment
4. Natural resource charges
4.1. the right for water use and/ or using water body
4.2. according to the Medicinal Herbs Act
4.3. concessions
- forests
- mineral water
- mineral wealth
- others
5. Fines and sanctions paid off according to Environmental Protection Act, article 3
- for water, for air, for soil, for waste, for noise, others
6. Other fines and sanctions paid off
- for water, for air, for soil, for waste, for noise, others
Classification of expenditure by economic activity units. Information published by the NSI does not
differentiate between expenditure by the public sector, the private sector and specialized producers
(NACE 90), as well as between the central and local authorities. The tables should have separate
columns/ rows for the special producers (NACE 90) and for the public sector with sub-columns for
central authorities and local authorities.
Water glossary and Tool Box
There is a need of extend water glossary, including the socio-economic terminology and of a "tool
box" with good practices for water supply & sewerage companies management.
Dr. Galia Bardarska Institute of Water Problems at the Bulgarian Academy of Sciences
National Profile of Municipal Water and Wastewater Management in Bulgaria
67
References
Act for Regulation of the Water Supply and Sewerage Services, draft. MoRDPW, S.
Dimitrov G., I. Trichkov, 2001. For Rational Use of Drinking Water. Water Affairs, 1/2, 20-24
Halcrow Group Limited et al., 2002. Bulgaria - Regulation in the Water and Wastewater Sectors.
PPIAF Grant A06 2900/L/WTS/RF/BG, World Bank, pp. 107
ISPA Strategy for Environment, Ministry of Environment and Water, 2003,
www.moew.government.bg
Management and Development Strategy for Water Supply and Sewerage Sector in the Republic of
Bulgaria, draft. Council of Ministers, S.
MoEW, 2003. Programme for implementation of Directive 91/271/EC for treatment of urban
wastewaters. Draft.
MoRDPW, 2004. Draft Regulation for Conditions and Order of Users Connections and for Water
Supply and Sewerage Systems Usage.
National Program for Some Dangerous Substances, draft. Ministry of Environment and Water, S.
National Statistical Institute, 2004. Environment 2002. S., pp.114
Raev,I., et al., 2003. Drought in Bulgaria: Contemporary Analogue for Climate Changes. Natural,
Economic and Social Dimensions of 1982-1994 Drought. BAS, S., pp.284
National Profile of Municipal Water and Wastewater Management in Bulgaria
69
Annex 1: Objectives of The Strategy and Implementation Measures
General objective
To improve the management of the water and
sewerage sector
and to increase the quality of water and sewerage
services
Creation of conditions for e
effective
Creation o
of c
conditions ffor
Application o
of s
structural m
management
Improvement o
of tthe q
quality o
of water and
management
private sector participation,
approach,
sewerage services
and introduction of integrated
taking into account public interest
taking into account regional planning
and achievement of levels and standards of
approach in problems solving
and ensuring economy of scale
those services which exist in EU countries
Regulation o
of
Planning a
and
Legislative amendments
Institutional o
organization,
water and sewerage services
analysis
ownership and management of
water and sewerage services
Preparation and identification
Law o
on a
amendments a
and
Establishment o
of a
a c
clear
of
supplements of the Water Act
institutional framework
a strategic documents for the
sector
Elaboration o
of rregulatory act
for pricing
Evaluation of water resources
Law o
on w
water s
suppl
y
Identification o
of c
criteria ffor tthe
and sewerage
ownership of
the water and sewerage
network
Establishment of data\base
Identification o
of m
managemen
t
Structure o
of W
Water a
an
d
and
models
sewerage
Development o
of llevels a
and
monitoring systems
standards of the services
for private sector participation
companies - operators
Creation of mathematical
models for
performance of study and
management
Systems for evaluation and
control of loses
70
UNDP/GEF Danube Regional Project
Annex 2 Institutional Organization of the Water Supply and Sewerage Sector
MoRDPW
MoEW
MUNICI-
Basin
Water Supply and
STATE ENTERPRISE IN
PALITIES
S
Directoratee
Sewerage
CHARGE WITH THE WATER
IMPLEMENTING
C
C
C
C
C
C
C
C
O
O
O
O
O
O
O
O
M
M
M
M
M
M
M
M
M
M
M
M
M
S
M
S
S
S
S
S
M
M
S
E
E
E
E
E
E
S
E
E
E
E
E
E
E
E
E
E
R
R
R
W
R
R
R
W
W
W
W
W
R
W
W
R
C
C
C
C
C
C
E
E
E
I
E
C
E
E
C
I
I
I
I
E
E
R
I
R
A
R
A
R
R
A
R
R
A
R
I
R
A
I
R
A
A
L
A
L
A
A
L
A
A
L
A
A
L
OPERATORS
A
L
G
W
G
W
G
W
G
W
W
G
G
W
G
W
E
E
E
A
E
E
A
A
A
A
E
A
E
A
C
T
A
A
C
T
C
T
C
T
C
T
C
C
T
O
E
O
O
E
O
O
E
O
O
E
O
E
O
E
R
R
R
O
R
R
R
O
R
M
M
M
M
M
R
R
M
M
M
P
S
P
P
S
P
P
S
S
P
S
P
S
A
U
A
A
U
A
A
U
U
A
U
A
U
N
P
N
N
P
N
N
P
P
N
P
N
P
I
P
I
I
I
P
E
I
P
I
P
I
E
P
E
E
E
E
I
P
E
L
I
L
L
L
I
P
E
L
L
S
S
L
S
S
E
S
S
S
S
Y
Y
Y
L
S
L
Y
Y
Y
Y
Y
S
Y
A
A
A
A
A
A
A
N
N
N
N
N
N
N
D
D
D
D
D
D
D
Regional Inspection B
Bodies o
on
State Regulatory
Hygiene-epidemic
REGULATORY
Environment and Water
BODIES
S
Commission
Inspection body
Dr. Galia Bardarska Institute of Water Problems at the Bulgarian Academy of Sciences
National Profile of Municipal Water and Wastewater Management in Bulgaria
71
Annex 3: Water Tariffs of Water Supply&Sewerage Companies in 2003
(without VAT)
BGN/m3
No.
Water Supply&Sewerage
Drinking water
Not clean
Sewerage
Treated Wastewater
Company
water
Households
Budget
Public sector
Households
Public sector
Households
BO 5
D
BOD5 from
BOD5
organizations
< 200 mg O2/l
200 to 600
> 600 mg O2/l
mg O2/l
1
2
3
4
5
6
7
8
9
10
11
12
1. Blagoevgrad
Blagoevgrad region
0.45
0.45
0.50
-
- - - -
gravitary water
Gotze Delchev region
0.42
0.42
0.55
- 0.05
0.05
- - - -
gravitary water
Razlog region-
0.38
0.38
0.5
0
-
- - - -
gravitary water
Pumping water
0.55
0.55
0.75
-
- - - -
2. Burgas
Pumping
water
0.72 0.78 0.78 - 0.10 0.14 0.30 0.37 0.43 0.58
3. Varna
Gravitary
water
0.70 0.78 0.78 - 0.14 0.14 0.23 0.23 0.40 0.76
4. Veliko Tarnovo
Gravitary
water
0.90
1.02
1.02
-
0.08
0.08 0.46 0.59 0.80
0.13 (for V.
Tarnovo town)
5. Vidin
Pumping water
0.94
0.94
0.94
- 0.14
0.21/0.25
- - - -
Gravitary water
0.66
0.66
0.6
6
-
0.
11
0.
11
-
- - -
6. Vratza
Pumping water
0.85
0.98
0.98
0.40
0.10 0.10 0.12 0.49 0.55 0.66
Gravitary water
0.40
0.58
0.58
No.
Water Supply&Sewerage
Drinking water
Not clean
Sewerage
Treated Wastewater
Company
water
Households
Budget
Public sector
Households
Public sector
Households
BOD5
BO 5
D from
BOD5
organizations
< 200 mg/l
200 to 600 mg/l
> 600 mg/l
1
2
3
4
5
6
7
8
9
10
11
12
71
72
UNDP/GEF Danube Regional Project
No.
Water Supply&Sewerage
Drinking water
Not clean
Sewerage
Treated Wastewater
Company
water
Households
Budget
Public sector
Households
Public sector
Households
BO 5
D
BOD5 from
BOD5
organizations
< 200 mg O2/l
200 to 600
> 600 mg O2/l
mg O2/l
1
2
3
4
5
6
7
8
9
10
11
12
7. Gabrovo
Mixed water (pumping and
1.05 1.05 1.30 1.10 0.13 0.13 0.20 0.70 0.90 1.35
gravitary)
1.70 (> 1000
mg/l)
8. Dimitrovgrad
Mixed water
0.93
0.93
1.1
8
-
0.
11
0.
11
-
- - -
9. Dobrich
Pumping water
1.22
1.30
1.30
-
0.07 0.07 0.07 0.15 0.25 0.30
Gravitary water
0.50
10. Isperih
Pumping water
1.47
1.47
1.4
7
-
- - - - - -
11. Kardjali
Pumping water and by
0.85 0.85 0.85 0.22
0.04
0.04 - - - -
Borovitza dam
Gravitary water
0.22
0.22
0.22
12. Kjustendil
Kjustendil 0.85
1.25
0.40
Bobov dol
0.95
0.95
0.95
- 0.10
0.10 - - - -
Trekliano
0.85
1.25
1.25
Nevestino
0.85
0.85
0.85
Bobochevo
0.80
0.80
0.80
Rila
0.62
0.62
0.62
cherinovo
0.80
0.80
0.80
Sapareva bania
0.55
13. Lovech
Mixed water
0.80
0.80
0.90
- 0.08
0.08 - - - -
14. Montana
Mixed water (pumping and
0.58 0.96 0.96 0.60
0.16
0.16
gravitary)
Pumping 0.88
0.96
0.96
Gravitary 0.42
0.45
0.45
Dr. Galia Bardarska Institute of Water Problems at the Bulgarian Academy of Sciences
National Profile of Municipal Water and Wastewater Management in Bulgaria
73
No.
Water Supply&Sewerage
Drinking water
Not clean
Sewerage
Treated Wastewater
Company
water
Households
Budget
Public sector
Households
Public sector
Households
BO 5
D
BOD5 from
BOD5
organizations
< 200 mg/l
200 to 600 mg/l
> 600 mg/l
1
2
3
4
5
6
7
8
9
10
11
12
15. Pazardjik
For municipality Pazardjik
Pumping water
0.55
0.55
0.55
-
-
-
-
-
Gravitary water for water
supply group "Debrachica"
0.30
0.30
0.30
For Septemvri and
0.10
0.10
Lesichovo municipality
-
-
-
-
-
High pumping
1.00
1.00
1.00
Low pumping
0.60
0.60
0.60
Water supply "Dinkata-
Charkovo-Pamidovo"
0.80
0.80
0.80
16. Pernik
Gravitary water
0.45
Pernik region
Pumping and mixed water
0.65
0.65
0.70
0.20
0.35
Radomir and Tran region
0.07
0.07
Mixed and pumping water
0.70
0.70
0.75
17. Pleven
Mixed
water
0.93
0.93
0.93
- 0.07 0.07
0.07
0.47 0.57 0.68
Gravitary water
0.40
0.40
0.40
0.47
18. Plovdiv
Pumping water
0.60
0.60
0.60
-
0.05
0.05
0.60
0.80 1.00
0.40 (<25
mg/l)
Gravitary water
0.48
19. Razgrad
Pumping water
1.40
1.40
1.40
0.54
0.062 0.062
0.
07
0.
13
0.
22 0.4
Gravitary water
0.79
0.79
0.79
73
74
UNDP/GEF Danube Regional Project
No.
Water Supply&Sewerage
Drinking water
Not clean
Sewerage
Treated Wastewater
Company
water
Households
Budget
Public sector
Households
Public sector
Households
BOD5
BOD5 from
BOD5
organizations
< 200 mg/l
200 to 600 mg/l
> 600 mg/l
1
2
3
4
5
6
7
8
9
10
11
12
20. Russe
Pumping water
0.70
0.70
0.80
- 0.04
0.06 - - - -
21. Silistra
Pumping water
1.25
1.25
1.25
- 0.06
0.06 - - - -
22. Sliven
Pumping water
0.92
0.92
0.92
-
0.08 0.08 0.31 0.30 0.32 0.34
Gravitary water
0.45
0.45
Chervenakovo water supply
0.144
system for Stara Zagora
23. Smolyan
Pumping water
0.95
0.95
0.95
-
0.05
0.05
Mixed water
0.65
0.65
0.65
-
0.45
Gravitary water
0.65
0.65
24. Sofia district
group
/gravitary/ 0.45
0.45
0.65
-
0.15 0.15
group
/mixed/
0.65
0.65
0.90
-
0.40
group /pumping/
0.80
0.80
1.10
-
25. Stara Zagora
Pumping and mixed water
1.02
1.02
1.05
-
0.05 0.05 0.15
0.50
Gravitary water
0.57
0.57
0.71
26. Targovishte
Pumping water
1.25
1.25
1.36
- 0.08 0.08 - - - -
Gravitary water
0.60
0.60
0.60
-
- - - -
27. Haskovo
Pumping water
1.25
1.25
1.60
- 0.5 0.5
-
- - -
Gravitary water
0.25
0.25
0.25
-
- - - -
28. Shumen
Pumping water
1.13
1.13
1.13
-
0.10 0.10 0.12 0.20 0.35 0.55
Gravitary water
0.42
0.42
0.42
-
Mixed puping water
0.84
0.84
0.84
-
29. Yambol
Pumping water
1.00
1.00
1.00
-
0.083
0.083
- - - -
Source: Ministry of Regional Development and Public Works
Dr. Galia Bardarska Institute of Water Problems at the Bulgarian Academy of Sciences
National Profile of Municipal Water and Wastewater Management in Bulgaria
75
Annex 4: Matrix of the Water Supply&Sewerage Problems in Bulgaria
Matrix of the Water
Consequences
Reasons
Level
Supply&Sewerage
Management
Technical
Legislative
Financial
of
Problems in
signific
BulgariaProblem
ance
1. Non-effective
High % of water losses
Lack of a system for registration of
Emergency cases and
Contradictory and not
functioning of the water
emergency situations and of a system for
leakage due to depreciated
completed legislation
supply networks
management of water losses;
networks, to buildings with
Lack of a digital cadastre map of the
deviations and to facilities;
Lack of a regulator for
constructed networks;
water supply and sewerage
Bad planning;
Not precise measurement.
services, including
Not covered consumers;
imperfect methodology for
Water theft;
pricing and lack of
Frequent change of a management staff;
standards for the definition
The management staff is not trained at a
of the levels of services.
sufficient level.
Lack of sanctions for the
Lack of
operators
enough funds
Non scheduled interruptions of
Lack of digital models of the networks
Emergency cases and
Lack of sanctions for the
3
the water supply
leakage
consumers
Regime of water supply
Non-effective management of the water
High % of water losses;
resources
Not sufficient volumes for
water accumulation;
Low level of tariff's collection
Bad organized billing
by Water and Sewerage
Companies
2. Uncompleted
Public water supply system does Bad planning
Lack of legislation aimed at
construction of water
not meet the quality
promotion of private
Lack of
supply networks
requirements of Regulation
investments
enough funds
2
9/ 16.03.2001
3. Lack of Waste
Wastewater does not meet the
Lack of legislation aimed at Lack of
Water Treatment
requirements of Regulation
promotion of private
enough funds
2
Plants
7/ 1986 for quality of flowing
investments
surface waters
75
76
UNDP/GEF Danube Regional Project
4. Non-effective
Contamination of
Frequent change and not
Bad construction;
Lack of legislation
operation of the
groundwater and
sufficient level of the
Hard sewerage links.
aimed at promotion of Lack of
sewerage networks
groundwater sources and
management staff.
private investments
enough
2
of river valleys. High
Bad planning.
funds
infiltration and ex-
filtration
5. Uncompleted
Contamination of
Lack of legislation
construction of
groundwater and
aimed at promotion of Lack of
sewerage networks
groundwater sources and
private investments
enough
2
of river valleys.
funds
6. Not enough
Contamination of
Lack of legislation
number of Urban
groundwater and
aimed at promotion of
Waste Water
groundwater sources and
private investments;
Lack of
Treatment Plants
river valleys
Lack of models for
enough
according to the
construction and
funds
2
requirements of
operation of Urban
Regulation
Waste Water
6/2000
Treatment Plants for
big and small
settlements.
7. Lack of
Not enough effectiveness
The investments are concentrated
coordination of the
of the investments that
in various institutions and there
investment process
have been done
isn't any coordination between
1
in water and
them.
sewerage sector
Ranging of the problems according to their importance
1 could be overcome, it requires improvement of the management and fairly small amount of investments
2 difficult to be overcome, it requires improvement of the management, average amount of investments and
3 very difficult to be overcome, it requires a lot of time, funds and amendments in legislation
Source: MoRDPW
Dr. Galia Bardarska Institute of Water Problems at the Bulgarian Academy of Sciences
National Profile of Municipal Water and Wastewater Management in Bulgaria
77
Annex 5: Water Supply&Sewerage Action Plan for the period 2003 2015 in Bulgaria
No. Measure Required
funds,
Fund source
Term
Responsible
thousand BGN/
institution
thousand Euro
A.
Short term measures
1. Planning
and
analyses
1.1.
Development of methodology for evaluation and
10 / 5.11
MoRDPW
31.12.2003 MoRDPW
management of water losses
1.2.
Development of business plans for water and sewerage
Water
31.03.2004 MoRDPW
companies in compliance with the new WSSCs
Supply&Sewerage
strategy
Companies
1.3.
Establishment of a digital cadastre of water supply and
150 / 76.7
Water
31.12.2004 MoRDPW
sewerage networks
Supply&Sewerage
Companies
2. Legislation
2.1.
Adoption of Water Act amendments and supplements
National
financing
31.12.2003
MoEW/
by the Parliament
MoRDPW
2.2.
Development of act for the water regulatory body
World bank
30.09.2003 MoRDPW
2.3.
Development of Act for Regulation of the Water
National
financing
30.09.2005
MoRDPW
Supply and Sewerage Services
2.4.
Approximation of the state and municipality property
National
financing
30.09.2005
MoRDPW
act with the water legislation
2.5.
Approximation of the accounting and corporate
National
financing
30.09.2005
MoRDPW
withholding tax act with the water legislation
2.6.
Approximation of the regulation on design,constraction
30.09.2004
MoRDPW
and operation of water supply and sewerage networks
and facilities with the EU standards
3. Institutional
3.1.
Taking out the infrastucture assets of the water and
Water
31.12.2004 MoRDPW
sewerage companies and their conversion into public
Supply&Sewerage
property
Companies
4. Economic
4.1.
Development of pricing methodology
National financing
30.06.2004
MoRDPW/
within MoRDPW
Regulatory body
77
78
UNDP/GEF Danube Regional Project
No. Measure Required
funds,
Fund source
Term
Responsible
thousand BGN/
institution
thousand Euro
4.2.
Development of standards for the levels of services
National financing
31.12.2004 MoRDPW/
within MoRDPW
Regulatory body
4.3.
Establishment of Water Supply Fund
National financing
31.12.2004 MoRDPW
within MoRDPW
B.
Long term measures
1. Planning
and
analyses
1.1.
Development of hydraulic models of water supply and
1000 / 511
Water
31.12.2015 MoRDPW
sewerage networks for settlements with over 10000
Supply&Sewerage
inhabitants
Companies
2.
Programs and projects
2.1.
Completion and construction of new dams for water
500000 / 255646
31.12.2015 MoRDPW
supply
2.2.
Construction of Waste Water Treatment Plants
350000 / 178952
31.12.2015 MoRDPW
2.3.
Reconstruction of water supply networks
1700000 / 869196
31.12.2015 MoRDPW
2.4.
Completion and construction of new sewerage
networks for settlements with population:
2.4.1. over 10000 inhabitants
402486 / 205788
ISPA, Cohesion Fund,
31.12.2010 MoRDPW/MoEW
National Financing
2.4.2. from 2000 to 10000 inhabitants
879705 / 449786
ISPA, Cohesion Fund,
31.12.2015 MoRDPW/MoEW
National Financing
2.5. Completion,
reconstruction and construction of new
Urban Waste Water Treatment Plants for settlements
with population:
2.4.1. over 10000 inhabitants
550383 / 281406
ISPA, Cohesion Fund,
31.12.2010 MoRDPW/MoEW
National Financing
2.4.2. from 2000 to 10000 inhabitants
375583 / 192032
ISPA, Cohesion Fund,
31.12.2015 MoRDPW/MoEW
National Financing
2.6.
Development of a program and model for public
National
financing
MoRDPW
awareness campaign
within MoRDPW
Total required investments
4759317 / 2433400
Source: Ministry of Regional Development and Public Works
Dr. Galia Bardarska Institute of Water Problems at the Bulgarian Academy of Sciences
Document Outline
- 2Bulgaria.NP.23.08.04.pdf