GEF/UNEP PDF-B
Western Indian Ocean
Preliminary
Transboundary
Diagnostic Analysis
For
Land-Based Activities
15 January 2002
DRAFT
Table of Contents
I. INTRODUCTION ..............................................................................................6
II. PHYSICAL AND BIOGEOCHEMICAL SETTING ...........................................8
II. 1 WATERSHEDS.......................................................................................................................... 8
II. 2 GEOLOGY AND GEOMORPHOLOGY ......................................................................................... 9
II. 3 OCEANOGRAPHY................................................................................................................... 10
II. 4 IMPORTANT ECOSYSTEMS..................................................................................................... 12
II. 4. 1 MANGROVES/COASTAL FORESTS ..................................................................................... 12
II. 4. 2 SEAGRASS BEDS................................................................................................................ 12
II. 4. 3 CORAL REEFS .................................................................................................................... 13
II. 5 ENDANGERED SPECIES.......................................................................................................... 14
II. 6 FISHERIES.............................................................................................................................. 14
II. 6. 1 ARTISANAL FISHERIES...................................................................................................... 14
II. 6. 2 COASTAL COMMERCIAL FISHERIES .................................................................................. 15
II. 6. 3 HIGH SEAS COMMERCIAL FISHERIES................................................................................ 15
III. SOCIO-ECONOMIC AND DEVELOPMENT SETTING ................................15
III. 1 HUMAN DEVELOPMENT....................................................................................................... 15
III. 2 TOURISM.............................................................................................................................. 17
IV. LEGAL AND REGULATORY SETTING ......................................................18
V. MAJOR TRANSBOUNDARY PERCEIVED PROBLEMS AND ISSUES......30
V.1 FRESH WATER SHORTAGE AND CONTAMINATION.................................................................. 32
V.2 DECLINE IN HARVESTS OF MARINE AND COASTAL LIVING RESOURCES .............................. 38
V.3 DEGRADATION OF COASTAL HABITATS (MANGROVES, SEAGRASS BEDS, AND CORAL
REEFS), LOSS OF BIODIVERSITY. .................................................................................................. 48
V.4 OVERALL WATER QUALITY DECLINE: DEGRADATION OF COASTAL WATERS, BEACHES
AND LIVING RESOURCES FROM LAND BASED ACTIVITIES............................................................ 60
i
VI. STAKEHOLDER ANALYSIS .....................................................................100
VII. ENVIRONMENTAL QUALITY OBJECTIVES ...........................................104
VIII. BIBLIOGRAPHY ......................................................................................115
ii
List of Figures
Figure 1.
Indian Ocean Area .........................................................................................11
Figure 2. A New Generation: Projected population growth in the Eastern African
Region (1991-2020) .......................................................................................18
Figure 3.
Causal Chain Analysis: Fresh water shortage and contamination.................34
Figure 4.
Causal Chain Analysis: Decline in harvests of marine and coastal living
resources ........................................................................................................40
Figure 5.
Evolution of the catch rates of shrimp on Sofala Bank (Hoguane, 2000) .....43
Figure 6.
Causal Chain Analysis: Degradation of biodiversity and coastal habitats ....50
Figure 7.
Causal Chain Analysis: Overall water quality decline/contamination ..........64
iii
List of Tables
Table 1. Some characteristics of the major rivers of the Western Indian Ocean
Region .................................................................................................................8
Table 2. Coastal plains and continental and island shelf areas of the Western Indian
Ocean...................................................................................................................9
Table 3. Distribution of mangrove forests.......................................................................12
Table 4. The common breeding sites for different species of turtle................................14
Table 5. Human Development Index and Gross Domestic Product for some of the
countries in the Western Indian Ocean Region .................................................16
Table 6. Coastline usage in Mauritius in 1990 and 1996 ................................................16
Table 7. Population and population density for the countries of the region....................17
Table 8. Government Institutions Dealing with Different Aspects of Coastal and
Marine Environment in Zanzibar ......................................................................28
Table 9. Root Causes and Major Perceived Problems and Issues...................................31
Table 10. Number of cases of waterborne diseases reported in coastal provinces of
Mozambique (Anon, 1998). ...............................................................................33
Table 11. Annual river flows in cubic km, 1995...............................................................35
Table 12. Pollution Loads to Ground Water Sources (Kg/Day) in Dar es Salaam ...........37
Table 13. Rural Water Supply and Population Coverage by Administrative Coastal
Regions (Tanzania) in 1993 and Projected Demand to year 2002 ....................37
Table 14. Urban Water Supply/Demand for Coastal Districts (Tanzania) in 1993...........38
Table 15. The number of coastal fishermen deriving their livelihood from fisheries .......39
Table 16. Fishery resources, catch, and level of exploitation in Mozambique .................41
Table 17. Fish Catch (tons) by type of fisheries in Mozambique .....................................42
Table 18. Catch per Fisherman/Day (kg) in Mauritius......................................................44
Table 19. Production and Employment in Mauritius, 1995 ..............................................45
Table 20. Annual Catch from submerged Banks in Mauritius..........................................45
Table 21. Tuna Landing in Mauritius................................................................................45
Table 22. Annual coastal fish catch (tons) in Mauritius....................................................46
Table 23. Total Artisanal Catch (1994-1999) in Metric Tons in Seychelles.....................46
Table 24. Sea cucumber export from Tanzania.................................................................47
Table 25. Total marine fish production (in tons) for Tanzania mainland: 1985 Ł1995. ...47
Table 26. Mangrove degradation in Mozambique, 1972-90 .............................................52
Table 27. Average cases of disease per year for the period 1993-1997 for Dar es
Salaam ...............................................................................................................62
Table 28. For Tanzania, disease incidence per 100,000 population..................................63
Table 29. Number of cases of waterborne diseases reported in coastal provinces of
Mozambique......................................................................................................63
Table 30. Concentration of nitrates (NO3) in wells around Maputo with time
(Casadei et al., 1985).........................................................................................67
Table 31. Concentration of nitrates (NO3) with distance from latrines around Maputo
(Casadei et al., 1985).........................................................................................67
Table 32. Concentration of nitrates (NO3) in wells around Maputo (Casadei et al.,
1985)..................................................................................................................67
iv
Table 33. Concentration of nitrates (NO3) in borehole waters around Maputo and
Matola cities (LNHAA, unpublished) ...............................................................68
Table 34. Summary of pollution loads from Mombasa District (Kenya)..........................70
Table 35. Pollution Load to Surface Water Resources (Kg/Day) in Dar es Salaam .........75
Table 36. Summary of pollution loads from Kwale District (Kenya)...............................81
Table 37. Summary of pollution loads from Kilifi District (Kenya).................................82
Table 38. Summary of pollution loads from Lamu District (Kenya) ................................82
Table 39. Concentration of heavy metals (mg l-1) in sediments of Elephant River at
Mamba (Loc 1) and Baule, in Kruger Park (Loc 2), in February-November
1994 (after Robinson and Avenant-Oldewage, 1994).......................................89
Table 40. Mercury concentration (mg l-1) in the water in Umbeluzi River (LNHAA,
1994)..................................................................................................................89
Table 41. Hot spots identified in the National Reports .....................................................94
Table 42. Sites of current and potential mineral exploitation and quarrying in coastal
areas...................................................................................................................98
Table 43. Environmental Quality Objectives, Targets, and Interventions ......................104
v
I. Introduction
TDA Content and Process
According to GEF guidance, the purpose of conducting a Transboundary Diagnostic
Analysis (TDA) is to scale the relative importance of sources and causes, both immediate
and root, of transboundary `waters' problems, and to identify potential preventive and
remedial actions. The TDA provides the technical basis for development of both the
National Action Plans (NAPs) and the Strategic Action Programme (SAP) in the area of
international waters of the GEF.
This TDA, therefore, summarizes information available from the region, gathered both as
part of ongoing national activities within the littoral states, as well as information made
available since from the variety of internationally supported activities in the region.
The methodology for a TDA consists of the following steps, at a minimum:
Ę Identification of major perceived problems and issues, including status and gaps
Ę Classification as national or Transboundary in nature
Ę Causal chain analysis (including root causes)
Ę Identification of interventions to address the root causes and primary perceived
problems and issues
Because the list of possible interventions and actions arising from the analysis of Western
Indian Ocean (WIO) problems is so large, a mechanism was needed in order to prioritize the
interventions. Borrowing from methodology commonly used in the European Union and
other regions, the present TDA identifies a series of Environmental Quality Objectives
(EQOs), which represent the regional perspective of major goals for the regional
environment. The use of EQOs helps to refine the TDA process by achieving consensus on
the desired status of the WIO. Within each EQO (which is a broad policy-oriented
statement), several specific targets were identified. Each target generally had a timeline
associated with it, as well as a specific level of improvement/ status. Thus, the targets
illustrate the logic chain for eventual achievement of the EQO. Finally, specific
interventions or actions were identified to permit realization of each of the targets, within the
time frame designated.
In summary, this TDA follows the general GEF TDA Guidelines for International Waters
projects. However, an additional step was achieved, that is, use of Environmental Quality
Objectives, in order to facilitate consensus on the desired state of WIO after the next pentade
or decade. The EQOs naturally led to identification of specific targets to be met within the
desired time frame, and from there identification of specific interventions and actions that
can be considered in the framework of the NAPs and SAP.
6
Geographic Scope of the TDA
The present analysis covers a vast region of the Western Indian Ocean from Somalia to
South Africa and includes the following countries: Comoros, Kenya, Madagascar,
Mauritius, Mozambique, Seychelles, Somalia, South Africa, and Tanzania. Only partial
information on the environmental status was provided by each country, so this TDA is a
summary of available information only. Where possible, additional sources of data were
sought.
This TDA relies on the preliminary TDA prepared by the Institute of Marine Sciences,
University of Dar es Salaam in 1998, National reports from the participating countries,
various technical publications available for the region prepared by UNEP, ACOPS, and
other organizations. The major sources of information are listed in the Bibliography
accompanying this TDA. Gaps in information available to this TDA can be filled during
the full GEF project.
This Preliminary TDA identifies the following list of major perceived problems and
issues. It includes four existing problems/issues:
1. Shortage and contamination of fresh water
2. Decline in harvests of marine living resources
3. Degradation of coastal habitats (mangroves, seagrass beds, and coral reefs), loss
of biodiversity.
4. Overall water quality decline: Contamination of coastal waters, beaches and
living resources.
Below, each of these problems and issues is addressed from a status perspective. It
answers the question: what do we know about each problem/issue? What data support the
quantification of the extent of the problem/issue? Do the data support these as real
problems and issues, or just as perceptions? This analysis took place on a scientific level,
including biological, oceanographic, physical, social, and other perspectives on the
problem. This is in effect the "status" assessment.
The next step was to perform the causal chain analysis; the major perceived problems and
issues were analyzed to determine the primary, secondary and root causes for these
problems/issues. Identification of root causes is important because root causes tend to be
more systemic and fundamental contributors to environmental degradation. Interventions
and actions directed at the root causes tend to be more sustainable and effective than
interventions directed at primary or secondary causes. However, because the linkages
between root causes and solutions of the perceived problems are often not clear to
policymakers, interventions commonly are erroneously directed at primary or secondary
causes.
This TDA attempts to clarify the linkages between root causes and perceived problems,
to encourage interventions at this more sustainable level. Fortunately, root causes are
7
common to a number of different perceived problems and issues, so addressing a few root
causes may have positive effects on several problems and issues (Table 9).
This TDA draft faced several challenges, including lack of complete information and
data, short time open for its final preparation, and limited time in the Region.
II. Physical and Biogeochemical Setting
The Western Indian Ocean (WIO) Region is comprised of the continental coastal states
(Somalia, Kenya, Tanzania, Mozambique and South Africa) and the island States
(Mauritius, Comoros, Reunion, Seychelles, and Madagascar). The ten Western Indian
Ocean nations are at different stages of both political and economic development. These
differences are reflected in the range of individual economic indicators from those with a
per capita gross national product of over $ 8,000 per annum, to those with $500 per
capita. Similarly, national institutions reflect comparable variations in strength and
infrastructure.
II. 1 Watersheds
The major watersheds are on the East African mainland and Madagascar. By far, the
largest is the Zambezi River which has a drainage basin estimated at more than one
million km2. Other large waterlands include the basins of the Rufiji, Juba, Limpopo and
Tana rivers.
Table 1.
Some characteristics of the major rivers of the Western Indian Ocean
Region
River Drainage
Area
Highest Recorded Flow
(1000 km2)
(m3/s)
Zambezi 1,300
8,625
Limpopo 358
n/a
Juba
200
n/a
Rufiji
158
5,754
Tana
132
5,400
Wami
36
348
Pangani
36
248
Ruvu
16
1,177
Source: Matondo (1989)
The coastal areas of the continental Western Indian Ocean countries are characterized by
a coastal plain which averages 15-20 km in width, and which rises inland to upland
savannahs and plateaux. In northern Somalia, the coastal plain is extremely narrow but
widens toward the south, where valleys and flood plains of the larger rivers accumulate
sediments. In some areas, the coastal plain ranges from a few hundred meters wide to
around 145 km, in particular in areas such as the Juba and Shebelle, Tana, Rufiji, and
Zambezi deltas.
8
The continental shelf is generally narrow, but varies considerably. On most headlands
and straight stretches of coastline there is virtually no shelf, and steep continental slopes
to the ocean floor are only a few kilometers offshore in many places along the continent.
The shelf sediments are generally sandy, especially in shallow areas, changing to mud in
deeper areas and near river mouths and estuaries.
The shelf surrounding Madagascar varies greatly, with a narrower shelf and steeper
continental slope on the east coast than on the continent. The shelf is wider on the west
side and is widest in the northwest.
Comoros and Mauritius are surrounded by deep waters from a few hundred meters to
several kilometers offshore. There are shallow banks around Rodriguez and other
Mauritian dependencies. The main islands of the Seychelles can be characterized as
steep granitic outcrops with the absence of extensive shelves; however, the Almirantes
Archipelago is basically a shelf area. There is an extensive shelf-platform on the axis
between the Seychelles and Mauritius.
Table 2.
Coastal plains and continental and island shelf areas of the Western
Indian Ocean
Country Land
Area
Coastal %Coastal
Shelf Coastline
(km2) Land Area Land Area
Area
Length
(km2)
(km2)
(km)
Comores
2,236
2,030
100
900
350
Kenya
582,650
32,447
6
655
500
Madagascar 595,790 242,745
41
135,000 4,000
Mauritius
1,865
1,328
100
1,600
200
Mozambique 738,030 162,938
21
120,000 2,500
Seychelles
443
455
100 48,000
600
Somalia
637,657
n/a
n/a 32,500
3,000
Tanzania
939,703
6
6 30,000
800
II. 2 Geology and Geomorphology
Many types of geological formations are found in the region, with ages ranging from 200
million years to recent. For instance, the coastal sediments of Tanzania vary in age from
Jurassic through Cretaceous to Tertiary and Quarternary and are composed of both
marine and terrestrial sedimentary rocks (Kent et al., 1971). The islands of Reunion,
Comoros, and Mauritius are essentially volcanic while those of the Seychelles are
granitic.
In terms of its geological structure, the coastline of Eastern Africa represents a passive
continental margin, from which through geological time continental fragments, large and
small, have separated and migrated across the adjoining oceanic crust. Some of these
detached continental fragments remain within the region, notably the Seychelles Bank
and Madagascar. This structural history has left the mainland states with generally
narrow continental shelves. Exceptions include the coasts of southern Mozambique and
9
central Tanzania in the vicinity of Unguja and Mafia islands. In the island states, wider
shelves exist in western Madagascar and part of the Seychelles. Pleistocene coral
limestones overlap older rocks along much of the mainland coastline and on some of the
islands. These limestones form extensive coastal terraces, cliffs, and intertidal platforms
(Arthurton, 1992).
Fringing, largely intertidal platforms, eroded mostly in these Pleistocene limestones,
dominate the coastal geomorphology in much of the region. Commonly cliff-bounded to
landwards, these platforms extend seawards from a few tens of meters to more than two
kilometers from the back shore, their seaward edges forming breaker zones for ocean
swell. Terraces and platforms alike are incised by major creeks draining the hinterland,
as at Dar Es Salaam and Mombasa. Holocene and Recent beach ridge and bar deposits
overlie the platform rocks in many places. Mangrove forests are developed in many of
the sheltered sedimentary embayments including those in deltaic areas, such as the
outflow of the Rufiji River in Tanzania. Coastal sand dunes are associated with river
mouths where there is a high discharge of terrigenous sediment, as from the Sabaki River
in Kenya (Arthurton, 1992). Water resources, including potable water supplies, are
dominated by groundwater in coastal areas of highly permeable Pleistocene limestone.
II. 3 Oceanography
The Western Indian Ocean is a tropical area where the air temperature at sea level rarely
falls below 20░C and seawater temperature is usually between 20-30░C. Ocean currents
are an important feature that strongly influence the distribution of marine organisms and
the availability of nutrients. The South Equatorial Current which flows at around 12░S is
the principal current flowing from east to west all year round. Part of the Current
branches off northeast of Madagascar to form the southeastward Madagascar Current,
while the main stream splits west of the northern tip of Madagascar into a southward
current which flows through the Mozambique forming the perennial Mozambique
Current, and a northward component which forms the East African Coastal Current
(EACC). EACC flows as far north as southern Somalia, after which its direction depends
on the season, becoming the Somali Current and later joining the Indian Monsoon
Current during the SE monsoon; during the NE monsoon it becomes the eastward
flowing Equatorial Counter Current. South of Madagascar, the East Madagascar Current
and the Mozamibique Current join at about 26░S to form the Agulhas Current.
Based on the Current systems prevailing in the Region, three Large Marine Ecosystems
(LMEs) have been identified, namely the Somali Coastal Current, the Agulhas Current,
and the Mascarene Plateau. These LMEs cover ecosystems and resources shared by
several countries as they extend beyond the boundaries of the EEZs of some countries in
the region.
10
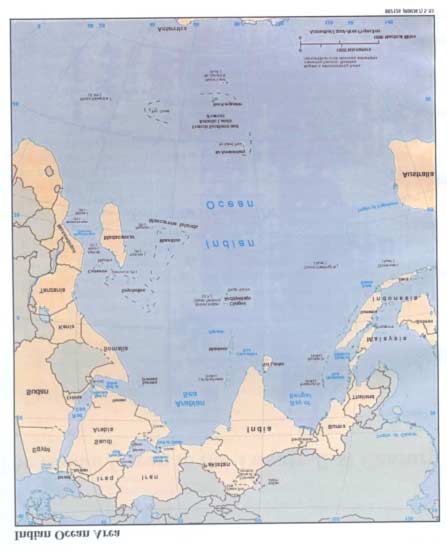
Figure 1. Indian Ocean Area
11
II. 4 Important Ecosystems
The coastal ecosystems of the region are generally both rich in natural resources and
highly productive. Especially important habitats include mangrove forests, coral reefs,
and seagrass meadows. Of the 38 designated marine and coastal habitats, at least one
third are found within each country of the region; the greatest known diversity was
reported in Mozambique where 87% of all habitat types are recorded (UNEP, 1984).
These ecosystems sustain a great diversity of marine life and represent an important food
source for most coastal communities.
The conditions within each ecosystem are influenced by the adjacent ecosystems. For
example, mangrove ecosystems are a nursery ground for a variety of fish, some of which
mature in coral reefs and sea grass meadows. There is also nutrient, sediment, and
organic matter interchange between the ecosystems.
II. 4. 1 Mangroves/Coastal Forests
In the intertidal areas of the Western Indian Ocean, there are many areas with conditions
favorable for mangroves. These areas include estuaries, bays, protected shores, and
lagoons. While mangroves are found scattered along much of the Region shoreline, the
most significant stands occur in Kenya, Tanzania, Madagascar, and Mozambique.
The main species occurring are Rhizophora mucronata, Ceriops tagal, and Bruguiera
gvmnorrhiza. Other species include Avicennia marina, Avicennia officionalis, Heritiera
littolaris, Lumnitzera racemosa, Sonneratia alba, Xylocarpus granatum, and Xylocarpus
moluccensis.
Matthes and Kapetsky (1988) found that the Western Indian Ocean Region has a total of
654 species of algae, molluscs, crustaceans, echinoderms, and fishes of economic
importance which are associated with mangroves.
Table 3.
Distribution of mangrove forests
Country
Mangrove area (ha)
Comoros Negligible
Kenya
62,027
Madagascar
320,700
Mauritius Negligible
Mozambique
84,800
Seychelles Negligible
Tanzania
133,500
II. 4. 2 Seagrass Beds
The seagrass beds which occur throughout the region are a common feature of intertidal
mud and sand flats, coastal lagoons, and sandy areas around the bases of shallow fringing
and patch reefs. They are found in all countries of East Africa, the most extensive beds
12
being around Bazaruto archipelago in Mozambique. In Tanzania, seagrass beds are
found in all bays and the west side of Pemba, Unguija, and Mafia islands. In Kenya,
seagrass and algal beds are prominent in Mombasa, Diani, and Malindi, and in Seychelles
they are dominant in Platte, Coetivy, and Aldabra.
Worldwide there are 58 species of seagrasses of which twelve species are found in the
Western Indian Ocean region. These include Enhalus acoroides, Thalassia hemprichii,
Halophila ovalis, Halophila stipulacea, Zostera capensis, Cymodocea rotundata,
Cymodocea serrulata, Halodule uninervis, Halodule wrightii and Syringodium
isoetifolium.
Shallow-rooted seagrasses forms such as Halodule, Cymnodocea and Syringodium have
colonized unstable sediments in the intertidal as well as in the lagoon waters. Thalassia
sp. and Thalasodentron sp. dominate in lagoons areas with consolidated sediments.
Seagrass beds provide shelter, food and nursery area for some of the important and
valuable species of fish (siganids, lethrinids, lutjanids, scarids), shellfish, dugong
(Dugong dugong) and the green turtle (Chelonia mydas).
In Mozambique, the distribution of dugong and the green turtle are closely associated
with that of seagrass beds (National Report from Mozambique).
II. 4. 3 Coral reefs
Coral reefs are among the most biologically diverse ecosystems typical of the coast of
East Africa from Somalia to Mozambique featuring fringing and patch reefs along the
coastline, with Mozambique, Tanzania, Madagascar, and Kenya having the largest
coverage by area. They provide habitats for a wide variety of marine species and protect
coastal areas from erosion and storm damage. They occur at the margins of the fringing
platforms, mostly on the outer seaward facing slopes and in adjoining lagoons, on
shallow sub-tidal patches isolated from extensive platforms. The island states have a
wide variety of reef formation, including atoll formations such as in Aldabra Seychelles,
Comoros, Mauritius, and Rodriguez. The east coast of Madagascar, Kenya, and Tanzania
all have extensive fringing reefs except where they are broken in the vicinity of rivers and
bay mouths (delta areas of Zambezi and Limpopo in Mozambique and Rufiji in
Tanzania). The barrier reefs along the southern coast of Madagascar extend for 200 km
forming one of the largest true barrier reefs in the world.
According to Sheppard (1987), the total number of coral species recorded in different
parts of the region are as follows:
Kenya-Tanzania coastline
112 Species
Mozambique 149
Species
Reunion l27
Species
Mauritius l36
Species
Tulear, Madagascar
113 Species
13
Like mangrove forests, coral reefs are under pressure from human activities threatened by
land use practices and siltation, water turbidity, fishing practices involving dynamite,
poisoning, and over-harvesting to extract their rich biological and mineral wealth.
II. 5 Endangered Species
Five species of endangered marine turtles have been recorded in the region, of which the
most common ones are the hawksbill turtle and green turtle.
Table 4.
The common breeding sites for different species of turtle
Species Breeding
Area
Hawksbill
Aldabra and other small islands in the region
Green
Mainland and island beaches
Olive Ridley Northern Mozambique
Loggerhead Mozambique, South Africa
Leatherback Northern Natal, South Africa
Another endangered species is dugong. Dugong are normally found in shallow, sheltered
waters close to the coastline in bays and lagoons. There is only one species of dugong
(Dugong dugong). The largest population of dugong along the East African Coast is
found in Mozambique in Maputo Bay, Inhambane Bay, and Bazaruto Archipelago while
in Tanzania they are feared to have disappeared, as there are no recent reports of their
sightings.
II. 6 Fisheries
The marine fishery in the region is divided into three categories: Artisanal Fisheries,
Coastal Commercial Fisheries, and High Sea Commercial Fisheries. Total production
from marine fisheries in the region reached 211,000 tons in 1990, an increase of 72%
over 1980, with an estimated value of about US $670 million.
II. 6. 1 Artisanal Fisheries
The coastal fisheries is dominated by artisanal fisheries, which concentrates its fishing
activities in the coral reefs, seagrass beds, and reef flats. Artisanal fisheries are an
important source of food, employment, and income in most of the coastal communities in
the region.
For Tanzania, Kenya, Comoros, and Madagascar, the artisanal fisheries accounts for
more than 80% of the total marine fish catch. The artisanal fishery catch is dominated by
relatively limited number of specific groups, namely scavengers (rabbitfish, barracudas),
pelagic (sardines and mackerels), crustacea (crabs and lobsters), and molluscs (oysters
and octopus).
14
The productivity of coastal waters is dependent on the health of mangroves, coral reefs,
and seagrass beds as well as the amount and the quality of runoff from the rivers.
II. 6. 2 Coastal Commercial Fisheries
This type of fisheries is mainly dependent on the shrimp fisheries. Shrimp fishing occurs
mainly in the estuarine fishing grounds such as off Rufiji, Wami, and Rufiji rivers in
Tanzania, Ungwana Bay in Kenya, Sofala Bank and Maputo Bay in Mozambique, and off
the west coast of Madagascar. The catch is dominated by the species Penaeus indicus, P.
monodon, and Metapenaeus monoceros. In Madagascar, the shrimp export was the
second largest source of foreign currency in 1995.
II. 6. 3 High Seas Commercial Fisheries
There are two types of high seas fisheries in the region:
Ę
The purse-seine fishery concentrates mainly on surface schools of shipjack,
yellowfin, albacore and bigeye tuna. This fishery is dominated by Spanish and
French fleets.
Ę
The longline fishery concentrates on the larger, deep-swimming bigeye tuna,
yellowfin tuna, and bill fish. Most of the longliners are from Taiwan, Japan, and
Korea.
The tuna fishery based in Port Victoria is operated by foreign vessels. In 1995, there
were between 47 and 55 purse-seines which were licensed in Seychelles, generating total
license fee revenue of more than 47 million Seychelles Rupees. The same year, purse-
seine transhipment in Port Victoria was over 187, 145 metric tons, or about 61% of total
catch. Total net revenue accrued to Seychelles from the activities of tuna fleet (including
license fees, bunkering and other services) was SR. 102.7 million.
The tuna purse seine fishery accounts for about 60% of the total Mauritian annual fish
catch and provides a significant proportion of the raw material for canning industries.
Canned tuna represents more than 90% of the total export of fish. In 1995, the Mauritian
purse seines landed 736 tons of tuna, while 14,772 tons of tuna and related species were
transhipped by longliners during the same period.
III. Socio-Economic and Development Setting
III. 1 Human Development
The GDP of the countries considered in this overview indicates large differences in
economic development, from US$ 810 in Mozambique to US$ 9,000 in Mauritius. The
majority of the countries in the region are classified as 'poor' according to the World
Bank criteria. The social and economic implications of land-based activities are
concerned with water pollution, public health, and the sustainability of coastal resources.
15
Table 5.
Human Development Index and Gross Domestic Product for some of the
countries in the Western Indian Ocean Region
Country
HDI Rank (2000)
GDP/Capita (PPP 1999) ($)
Mauritius 71
8950
Kenya 138
1010
Tanzania 156
500
Madagascar 141
790
Mozambique 168
810
Source: UNDP (HDI) and World Bank (GDP)
The coastal zones of the mainland countries in particular are currently experiencing an
influx of people and expansion of economic activities such as tourism, which are
occurring spontaneously, with no thought given to the planning or provision of basic
infrastructure and services, protection of the marine environment, and sustainable use of
the natural resources base.
For example in Mauritius, residential and tourism development is located more or less
along the coast (Table 6). This is causing conflicts among users, as most of these
developments are blocking accessibility to beaches by fishermen as well as the general
public.
Table 6.
Coastline usage in Mauritius in 1990 and 1996
Coastline
% of Coastline % of Coastline
distribution
1990
1996
Public beaches
5.9
8.2
Hotels 9.0 13.0
Bungalows 16.0
16.0
Coastal Villages
7.7
7.7
Services 4.7 3.9
Agriculture 7.3
6.4
Fodder 5.3 8.9
Natural vegetation 32.4
24.2
Cliffs 3.2 3.2
Cliff/fodder 3.6
3.6
Total 100
100
In 1994 the combined population of the nine countries residing within coastal regions
was estimated at 19 million, of which Kenya, Mozambique, Tanzania, and Madagascar
constituted over 95% of the total (Table 7). The population growth rates of the mainland
states, the Comoros, and Madagascar are generally high, particularly in Kenya (3.3%),
Tanzania (2.8%), and Mozambique (2.8%). Growth rates in the large coastal cities, such
as Dar Es Salaam (6.7% per annum), Maputo (7.2% per annum), and Mombasa (5.0% per
annum), are even higher due to rural- urban migration. In addition to the local
population, the number of coastal tourists visiting the region has increased significantly
in recent years, which has increased the load of domestic sewage.
16
Table 7.
Population and population density for the countries of the region
Country Population
Coastal % of coastal
Population
(millions)
Population
population
Growth rate
1. Comoros
0.54
0.54
100%
2.7
2. Kenya
26.80
2.30
8.1%
3.3
3. Madagascar
12.10
4.80
36.6%
3.0
4. Mauritius
1.10
1.10
100%
1.2
5. Mozambique
18.53
6.50
39.3%
2.8
6. Seychelles
0.07
0.07
100%
1.5
7. Tanzania
28.90
4.61
16.2%
2.8
Source: Abdoulhalik (1997). Government of Kenya (1989). Ranaivoson (1997). National
Institute for Statistics (1996). Government Management and Information System (1996)
Bureau of Statistics, Ministry of Finance, Economic Affairs and Planning (1991).
III. 2 Tourism
Coastal tourism in Kenya accounts for 45% of the coastal economy. Agriculture
contributes 8%, fisheries 6%, forestry and mining another 6%, whereas industry and
harbor activities share the remaining 35%. The Nyali-Bambouri-Shanzu area,
traditionally a fishing economy, is now a tourist resort generating about 24% of all
coastal tourism earnings employing 13,000 people in hotels and another 10,000 in related
activities.
Mauritius is less dependent on tourism given the dominance of sugar production and
processing activities. It has three main tourist zones (a) the northern zone from Balaclava
to Grand Gaube, (b) the eastern zone from Roche Noire to Trout d'eau Douce, and (c) the
south-western zone from Flic-en-Flac to Le Monte. Tourist arrivals in 1995 had reached
422,463, grown by 8% a year since 1992, while foreign exchange receipts had reached
nearly 8,000 million Rupees, grown by 17% a year since 1992. Tourist accommodation
stock is 6,000 rooms plus 2,000 rooms in the informal sector. Hotels offer employment
to about 14,000 people, total tourism-induced employment reaches over 51,000
accounting for 10% of total employment.
Tourism in Comoros is limited. Arrivals in 1993 were 24,000, representing a small share
of only 4% of the arrivals in the countries of the West Indian Commission, totaling
600,000, while direct employment in tourism is about 500 people and 51 in related
activities. Foreign currency earnings are reported at 40 billion CF, roughly just over half
of the earnings from exports.
In Seychelles tourism is a significant activity described as "the mainstay of the
Seychelles economy today" (Lundin & Linden, 1995). Direct revenue from tourism
stand at 18% of the GDP, compared to 5% from agriculture, fishing and forestry,
amounting to 600 million Rupees accounting for 70% of total foreign exchange earnings.
Hotel beds exceed 2,000 and arrivals are estimated at about 60,000 tourists.
17
Figure 2. A New Generation: Projected population growth in the Eastern African
Region (1991-2020)
1991
2020
Each dot represents 25,000 people (source: World Bank)
IV. Legal and Regulatory Setting
In their endeavor to address the problems of their coastal and marine environments,
Governments of the Eastern African Region -Somalia, Kenya, Tanzania, Mozambique,
Comoros, Madagascar, Mauritius, Seychelles and France (Reunion)- came together under
the framework of UNEP's Regional Seas Programme in 1985 and endorsed the Eastern
African Action Plan (also called the Nairobi Convention) and related Protocols. The
Convention was broadly aimed at maintaining essential ecological processes and life
support systems, preserving genetic diversity, and ensuring sustainable utilization of
harvested natural resources.
18
Since then, the region has been contributing to and developing a number of initiatives
including the Arusha Resolution (April 1993) on Integrated Coastal Management in
Eastern Africa including the Island States; the first meeting of the Contracting Parties to
the Nairobi Convention, Mahķ Seychelles, March 1997; the African Process on
Protection, Management and Development of the Marine and Coastal Environment,
which adopted the portfolio of actions arising from the Pan African Conference on
Sustainable Integrated Coastal Management (PACSICOM, Maputo, July 1998), and the
Cape Town Conference, (December 1998). The main activities identified were:
(a) Promotion and monitoring of long-term regional impacts caused by climate change
and adaptation planning to the effects of sea-level rise in the coastal areas,
(b) Inventory of potential hotspots in the region (shoreline changes - - coastal erosion,
land-based and marine sources of pollution, coral reefs and associated ecosystems), and
(c) Establishment and strengthening of regional measures of forecasting and early
warning capabilities to deal with natural disasters.
Today all nine East African countries have ratified the Convention: Comoros, France (La
Reunion), Kenya, Madagascar, Mauritius, Mozambique, Seychelles, Somalia, and
Tanzania. South Africa has asked to join.
Following a regional workshop in Zanzibar (6-9 October 1997), the GPA has produced a
regional overview and action plan on land-based pollution. Among its activities: to
assess pollution loads affecting the marine environment, and their harmful effects; to set
up monitoring programs and development strategies; to prepare and implement a regional
action plan; and to strengthen capacity of coastal States to intervene in case of accidents
and emergencies.
Countries are fulfilling their pledges to the regional Trust Fund in support of their
program, and welcome support for project activities has been forthcoming from
international sources: The EAF/5 project (Protection and Management of the Marine and
Coastal Areas of the Eastern Africa) received support from SIDA (Sweden); Belgium has
funded a series of activities for the preparation of databases and atlas under the project
entitled Eastern African coastal and marine environment resources database and atlas
(EAF/14); and the US has contributed US $30,000 to the UNEP Environment Fund for
the implementation of the International Coral Reef Initiative (ICRI) in Eastern Africa.
The recent high-level political commitment within the continent, as expressed in the
Maputo and Cape Town Declarations, set the stage and context of the second meeting of
the Contracting Parties to the Nairobi Convention, held in Mauritius, November 1999.
New perspectives were developed and priority focus of the Nairobi Convention and
related Action Plan in terms of delivery of services to the participating countries were
identified concurrent with global concerns for the coastal environment. At the second
Contracting Parties meeting in 1999, a joint bureau for the Nairobi and Abidjan (West
19
and Central African) Conventions met and agreed to set up a joint programming unit in
Nairobi to further cooperation on regional projects and international issues.
The Eastern African Regional Coordinating Unit, located in the Seychelles, coordinates
all activities of the Action Plan. UNEP is the secretariat of the Convention, while the
African Ministerial Conference on the Environment (AMCEN) provides guidance, as
well as political support, to the Nairobi Convention and its work program.
The countries of the WIO region are either parties to a number of regional initiatives or
actively participate in the activities promoted under these programs. These initiatives
include:
Ę Intergovernmental Oceanographic Commission's Regional Committee for
Cooperative Investigations in the North and Central Western Indian Ocean
(IOCINCWIO)
Ę Eastern African and the Islands States Integrated Coastal Management Process
Ę Indian Ocean Commission (COI) for the island states
Despite existence of all these initiatives, the region is still faced with a number of
problems including: lack of sufficient capacity to address transboundary issues, poor
coordination among different initiatives, overlapping responsibilities, promotion of
sectoral approaches to coastal and marine environment issues, and lack of sustained
political and financial commitment to the coastal and marine environmental protection.
Below, the over-arching legal environmental context is presented country-by-country.
Mozambique
The Water Law, enacted in 1991, defines the general principles of water management, the
user rights, and the institutional control and monitoring of water use. Water is considered
as a property of the State and the public may be granted rights to the use of the water.
With regard to pollution and environment protection, the law establishes the polluters
pay principle. The law defines the concept of water contamination, to permit the
adoption of protective measures using scientific knowledge. The main objective for the
protection of water quality is stated and some prohibited activities are identified. If
pollution occurs, the law states that appropriate schedules be taken to guarantee that the
polluters gradually reduce the amount of dumping to acceptable standards, and that
whoever cause water pollution, should, at their own expense, restore the site to its normal
condition, and at the same time pay the fines.
In 1995, the government of Mozambique approved a new National Water Policy. The
policy has the same principles defined in the Water Law, but it puts emphasis on the
integrated water resources management to maximize the benefit. This is particularly
20
important during the negotiations with the neighboring countries for an equitable sharing
of water through integrated developments plans. It further ensures the protection of the
environment.
In June 1994, the government of Mozambique approved the National Environmental
Management Programme (NEMP), which is the master plan for the protection of the
environment in Mozambique. It contains a national environment policy, environment
umbrella legislation, and environmental strategy. The NEMP is also a program of
sectoral plans, containing projections for the medium and long term, aiming to lead the
country to sustainable socio-economic development. The Ministry for the Co-ordination
of Environment Affairs has taken the lead for the environmental management in
Mozambique.
One of the priority areas of NEMP is a number of activities related to integrated coastal
zone management. Specifically, the program states that the coastal zone management
should be based on an inter-institutional co-ordination among the relevant stakeholders.
The main objectives of the program are: fisheries, coastal and marine ecosystem
management, coastal and marine protection, marine parks and tourism. The program also
defines the activities for short, medium, and long term.
The creation of the Ministry for the Co-ordination of Environmental Affairs was the first
major step undertaken in the direction of an integrated management strategy for natural
resources. In fact, the co-ordination role that this institution plays stresses the adoption of
the principle of a collective, participatory and harmonized management process rather
than sectoral, isolated and not coordinated. One of the main recent achievements of this
process was the enactment of the Environmental Law by the Parliament in November,
1997. The Law was implemented in January, 1998, with the aim to guarantee that all the
activities related with the management of natural resources are undertaken in a correct
and coordinated way and involving all the stakeholders, including the planning and
decision-making level. This Law is the first attempt to introduce the concept of the
environment and a new vision and strategy for its management, both for the institution's
activities and for the public in general. Due to the comprehensive nature of this law,
complementary sectoral legislation will be produced to respond to specific situations and
needs.
With the objective of multi-sectoral coordination at the highest level, a ministerial body
was created by the enactment of the Environmental Law Ł the National Council for
Sustainable Development. The Council is not yet in place, as there is a need for the
establishment of a proper regulation. However, this is the best way to solve the problems
of institutional relationship between the Ministry for the Coordination of Environmental
Affairs and other relevant Ministries such as the Ministry of Finances and Planning,
Agriculture and Fisheries and State Administration.
While producing national environmental legislation, the country has adopted and ratified
in the last years important international environmental conventions, such as:
21
(i). Biological
Diversity,
(ii). Climate
Change,
(iii). Desertification,
(iv). Basel and Bamako,
(v).
Law of The Sea,
(vi). Protection of the Ozone Layer, and
(vii). Protection, Management and Development of Marine Environment in the Western
African Region (Nairobi Convention)
Comoros
The Ministry of Agriculture, Marine Resources and Environment is the main
governmental body responsible for the protection of the environment in Comoros. The
Government also established a General Directorate for Environment and Regional
Environmental Services for each of the islands.
The government adopted a National Environment Policy as well as National
Environmental Action Plan. The Parliament has ratified the Environmental Law.
The Comoros have ratified the following international conventions:
Ę Ramsar Convention
Ę CITES Convention
Ę Biodiversity Convention
Ę UN Convention on the Law of the Sea
Ę Un Convention on Climate Change
Ę Vienna Convention
Ę Montreal Protocol
Ę Basel Convention
Ę Convention on Desertification
Ę MAB Convention
Seychelles
Water-related environment legislation operates within a general legal framework which is
formed by the constitution, cross-sectoral legislation (i.e. Legislation applying to all
sectors and branches of Government) and general environmental legislation reaching out
into all areas of environment protection and conservation.
Constitution (1993)
The new constitution of the Seychelles in 1993 addresses environmental and conservation
in various respects. The relevant passage solemnly declares that the Seychelles is
committed to preserve a safe, healthy and functioning environment for the present and
future generations.
Article 38 recognizes the right of everyone to a safe environment. The state undertakes
measures to promote the protection, preservation, and improvement of the environment;
22
to ensure sustainable socio-economic development by judicious use and management of
resources; and to promote public awareness of the need to protect, preserve and improve
the environment.
On the other hand, Article 40 of the constitution makes it a duty of every citizen to
protect, preserve and improve the environment. Two Articles concerning property may
be relevant in this context. Article 20 provides that no property be searched without the
owner's consent except where provided by law and in the interest of inter alia nature
conservation. Article 26 guarantees the private right to property; however, it also spells
out the limitations, which must be prescribed by law and may be those "necessary in a
democratic society." More and more it is recognized that the "democratic society"
limitation to fundamental rights includes environment protection and conservation duties.
Maritime Zones Act (1997)
The Maritime Zones Act of 1997 is another basic statute to be taken into account. The
Act declares national prediction over the territorial waters, the continental shelf and the
exclusive economic EEZ zone of the Seychelles. The use EEZ the Seychelles has
"exclusive prediction to preserve and control marines pollution." Furthermore, areas of
the continental shelf and the EEZ may be declared designated areas and special
provisions may be imposed to protect resources and the marine environment and regulate
the entry of foreign ships into the designated areas (section 9). The Maritime Zone Act
has been implemented by the Maritime Zones (EEZ) order (1978) demarcating the limits
of the EEZ, and the Maritime Zone (marine pollution) Regulations (1981).
District Councils Act (1994)
The District Councils Act, which has been amended in 1994 now, makes reference to
environment protection and conservation by establishing such powers and responsibilities
of District Councils.
I. Penal Code
The Penal Code (chapter 73 of the Laws of the Seychelles) contains a series of
environment protection and conservation related provisions.
II. Environment Protection Act 1994
The Environment Protection Act (EPA) of 1994 replacing the EPA of 1988 aims at
protecting improving and preserving the environment and preventing, controlling
pollution. It is mainly but not exclusively pollution control oriented. It establishes the
authority for environmental protection, which shall be the Ministry or the Department
within the Ministry responsible for the environment.
Two authorities have been legally established. In 1995, the Solid Waste Agency was
established (Environment Protection: Designation of Solid Waste Agency population).
More importantly, in 1996 the Marine Parks Authority (MPA) was established as a
parastatal institution (Environment Protection: Marine Parks Authority order 1996).
The 1994 EPA Framework (Major Instruments)
23
Environment Protection Act (1994)
Environment Protection (Designation of Solid Waste Agency Regulations 1995)
Environment Protection (Standard Regulations 1995)
Environment Protection (Marine Parks Authority order 1996)
Environment Protection (Impact Assessment Regulations 1996)
Tanzania
Tanzania lacks a coherent and harmonized coastal legislation for dealing with the marine
and coastal environment. This is further complicated by the existence of two different
types of legislation for Zanzibar Islands and Tanzania Mainland. Although Tanzania is a
federal state comprising Tanzania Mainland and Zanzibar, the latter maintains
administrative independence in most of its government matters. The National Assembly,
which includes members from Zanzibar, legislates on all matters and for the United
Republic of Tanzania on issues such as foreign affairs, finance, defense, immigration and
citizenship. All other matters concerning Zanzibar are within the exclusive jurisdiction
of the Zanzibar government and its legislative body, that is, the House of Representatives.
There are several sectoral legislations that have relevance for the management of marine
and coastal resources on Tanzania Mainland. These cover sectors such as fisheries,
agriculture, forestry, industry and trade, land use planning, culture, marine transport,
environment, energy and tourism.
Tanzania has adopted a wide range of approaches within their legal and regulatory
framework aimed at the protection of the coastal and marine environment. These
include:
Ę Setting out the environmental quality standards
Ę Protection of the key habitats such as coral reefs and mangroves
Ę Environmental impact assessment
Ę Pollutant discharge fee
Ę Monitoring, surveillance and inspection
Ę Penalties.
A number of environmental regulations exist in Tanzania. Such efforts notwithstanding,
serious gaps remain in policy, law and practice. There is also a shortage of reliable
information to guide implementation of both policy and legislation. However, previous
experiences clearly show that while enacting environmental laws with the accompanying
penalties is one thing, enforcing and implementing them is another. More often than not,
the problem lies with enforcement. However, the main contributing factors for weak
enforcement are limited financial and human resources, lack of technological capacity,
insufficient political support, pressure on government from interest groups, lack of
transparency, as well as the practical problems of administering environmental
regulations.
24
The Key Policies, Legislation and Plans Relevant to the Marine and Coastal Environment
of Tanzania are:
Natural Resources
Ę National Fisheries Sector Policy and Strategy Statement, 1997
Ę Fisheries Act, 1970
Ę Marine Parks and Reserves Act, 1994
Ę National Forest Policy, 1998
Ę Forest Ordinance, 1957
Ę National Forest Action Plan, 1990/91--2007/08
Ę Management Plan for the Mangrove Ecosystem in Tanzania, 1991
Ę The Territorial Sea and Exclusive Economic Zone, 1989--Union Government
Ę Deep Sea Fishing Authority Act, 1997
Land Use
Ę National Land Policy, 1995
Ę Town & Country Planning Ordinance, 1956, Cap. 378
Ę The Town & Country (Public beaches planning area) Order, 1991
Ę Government Notice No. 76 reducing the Beach Protection Line from 200 m to
60 m, 1992
Shipping
Ę Merchant Shipping Act of 1967
Cross-cutting
Ę National Environmental Policy, 1997
Ę Water Policy, 1991
Ę Water Utilization (Control & Regulation) (Amendment) No. 10, 1980
Ę National Land Policy, 1995
Ę Land Act, 1998
Ę Village Land Act, 1998
Ę Local Government Reforms
Ę Local Government (District & Urban Authorities) Acts, 1982
Ę Regional Administration Act, 1997
Ę District & Village by-laws
Ę Public Health (Sewerage & Drainage) Ordinance
Ę Mining (Environmental Management & Protection) Regulation, 1999
Similar to Tanzania Mainland, there is a serious deficiency in legislation guiding
development activities of marine and coastal areas in Zanzibar Islands. There is an
urgent need to review the legislation in order to address current and emerging issues as
well as to increase the level of penalties. However, Fisheries legislation has been updated
recently. The development of the Environmental Policy has increased the awareness of
islanders because it was done in a truly participatory manner. This consultative process
which was approved by the House of Representatives in February 1996 and acceded by
25
the President in July 1996 has generated a comprehensive and effective Environmental
Policy Legislation for Zanzibar.
The Key Legislation Relevant to Marine and Coastal Environment of Zanzibar Islands
are:
Natural Resources
Ę The Fisheries Legislation (Revised 1988)
Ę The Forest Reserve Decree (Cap. 120) and Wood Cutting Decree (Cap. 121)
Ę The Wild Animals Protection Decree (Cap. 128)
Ę The Wild Birds Protection Decree (Cap. 129)
Land Use
Ę The Land (Distribution) Decree, 1966
Ę The Town and Country Planning Decree (Cap. 85)
Ę The Public Land Decree (Cap. 93) Removal of Natural Produce Rules
Cross-cutting
Ę The Commission of Lands and Environment Act, 1988
Ę The Investment Promotion Act, 1986
Ę The Administrative Authorities Act, 1981
Ę The Local Government Act, 1986
Ę The Public Health Act (Cap. 73)
Ę The Dangerous Goods Act (Cap. 160)
Ę The Petroleum Act, 1980
Ę The Mining Act, 1979
Environmental Impact Assessment:
Environmental Impact Assessment (EIA) is an important management tool and is a
relatively new management tool in Tanzania. EIAs are widely used to ensure that
development activities are environmentally, socially and economically sustainable.
The National Environment Management Council (NEMC) is the regulatory and
supervisory agency in environmental management. The issuing of a development
permit/license is subject to provision of environmental approval by NEMC. An EIA
Directorate was established at NEMC in 1996 to facilitate and implement the EIA
process. The national EIA guidelines and procedures have been developed by NEMC
since 1997 and they are currently awaiting formal government approval for them to be
legally binding. In addition, the process of development of Mariculture Guidelines is
almost complete.
A few legislations are currently requiring and taking into account the EIA before
approving development projects. These include:
26
Ę The Marine Parks and Reserves Act, 1994, includes provisions for Environmental
Impact Assessment (EIA)
Ę The Tanzania Investment Act, 1997, requires and takes into account EIA
Ę The new Mining Act, 1998, provides for EIA.
Currently, some EIAs have been conducted mainly through the initiative of the donor
community. Such development proposals have included, for instance, the proposed
development of a prawn farm at Rufiji River Delta, and the production of electricity from
natural gas at Songo Songo Island.
Institutional framework:
More than 10 national ministries and offices are mandated to manage some components
of marine and coastal resources and environmental issues. The main ones are:
Ę The Vice President's Office which is responsible for environment
Ę Prime Minister's Office which is responsible for Local Government
Ę The National Planning Commission which is responsible for national planning
Ę The Ministry of Natural Resources and Tourism
Ę Ministry of Transport
Ę Ministry of Agriculture
Ę Ministry of Industries and Trade
Ę The Ministry of Judiciary, Attorney General's Office and the National Assembly
are responsible for law enforcement.
A similar structure exists for the Zanzibar Government (Table 8). Governance for
Tanzania's coastal zone is complicated by the existence of two national jurisdictions Ł
the Zanzibar Government and the Union Government. Whereas certain issues such as
home affairs (law enforcement) and foreign affairs are under joint responsibility of the
Union Government, most of the coastal and marine management issues are non-union
matters. Most of the ministries are not coordinated and do not create a viable system for
managing coastal and marine resources. Authority is fragmented and often overlaps
between different departments, thus causing unnecessary competition. Both the Zanzibar
and the Union governments need to develop sound institutional linkages in order to
optimize the use of limited financial resources and support facilities.
The lack of a comprehensive institutional framework, which could act as a focal point in
coordinating all activities related to marine and coastal areas, is a major drawback in the
formulation of integrated coastal zone management. For example, as pointed above,
fisheries officers at the regional and district levels administratively report to two different
ministries (Prime Minister's Office and Ministry of Local Government) while
technically, they belong to the Ministry of Natural Resources and Tourism. This poses a
major constraint to the efficient implementation and administration of the government's
fisheries development projects. The adoption of the Territorial Sea and Exclusive
Economic Zone Act of 1989 vested substantial powers for the control of coastal resources
in the Ministry of Foreign Affairs. The Ministry is responsible for the development of
27
the necessary framework for an integrated marine policy, but due to the diverse nature of
the coastal zone, progress is slow. However, it should be pointed out that the preparation
of this policy and related legislation should involve local and international interest groups
to ensure the adoption of sound and acceptable management practices.
In an attempt to coordinate environmental management, Tanzania has restructured the
former Ministry of Tourism, Natural Resources and Environment and has moved the
functions of Environment and associated institutions (National Environment Management
Council and Division of Environment) to the Vice President's Office. The Minister of
State responsible for the Environment heads these functions. However, to date, the Vice
President's Office has not issued guidelines on the way in which sector ministries and
parastatals will be engaged in a coordinated manner in addressing environmental issues.
Table 8.
Government Institutions Dealing with Different Aspects of Coastal and
Marine Environment in Zanzibar
Ministry Institution Specific
Responsibilities
Ministry of Water,
Department of
Environmental law
Construction, Energy
Environment
and setting of
environmental
standards
Lands and Environment
Department of Lands
Land
management,
administration, and
control
Department
of
Urban
Urban planning, land
Planning and
use planning,
Surveying
development control
and physical standards
Ministry of State for Regional Coordinates
all
Administration
aspects related to
regional and district
administration
and local government
(municipal councils,
wards and `shehias')
Ministry of Agriculture, Resources, Agriculture,
livestock,
Livestock and Fisheries
natural resources
fisheries and forestry
International Perspective:
Tanzania has signed and ratified several regional and international conventions and
agreements relevant to the marine and coastal management. These include:
28
Ę The African Convention on the Conservation of Nature and Natural Resources,
Algiers, 1968. Tanzania ratified this Convention in 1974.
Ę The Convention on International Trade in Endangered Species on Wild Fauna and
Flora (CITES or Washington Convention), Washington, DC, 1973. Tanzania
ratified this convention in 1980.
Ę The International Convention for the Prevention of Pollution from Ships
(MARPOL), London, 1973. Tanzania is signatory since 1978.
Ę United Nations Convention on the Law of the Sea, 1982. This is the only
convention for which Tanzania has a corresponding national legislation Ł the
Territorial Sea and Exclusive Economic Zone Act of 1989. This act reduces the
territorial waters from the former 50 nautical miles to 12 nautical miles and
extended the EEZ to 200 nautical miles.
Ę The Nairobi Convention on Protection, Management and Development of Marine
and Coastal Environment in the Eastern Africa Region and Related Protocols,
1985. Tanzania ratified it in 1996.
Ę The International Convention on Climate Change. Tanzania is signatory since
1996.
Ę The Convention on Biological Diversity was ratified by Tanzania in 1996.
Tanzania is now developing a National Strategy for the Conservation of
Biological Diversity including compliance to the Jakarta Mandate.
Major International Agreements into which Tanzania has entered include:
Ę The Kenya and Tanzania agreement of 1995 concerning delimitation of territorial
waters boundary. This agreement also gives guidance on matters related to
fisheries.
Ę Fishing agreement between Tanzania and the European Union, which was
adopted in 1990. This agreement requires the parties to coordinate their activities
to ensure the sustainable management and conservation of living resources in the
Indian Ocean particularly with respect to migratory species. This agreement is in
force despite the fact that Tanzania is not party to the UN agreement on straddling
fish stocks and highly migratory fish stocks.
Ę Tanzania is also Member to some of the international and regional organizations
such as the Intergovernmental Oceanographic Commission of UNESCO (IOC),
Regional Committee for Cooperative Investigations in the North and Central
Western Indian Ocean (IOCINCWIO); International Maritime Organization
(IMO); and the Indian Ocean Marine Affairs Commission (IOMAC).
As stated above, almost none of these conventions and agreements (except the Territorial
Sea and EEZ Act) have been translated into corresponding national legislation.
Zanzibar has had little involvement in these conventions although it has ratified some of
them indirectly by virtue of being in the Union Government. It is anticipated that the
Environmental Policy Programme will create a mechanism of sensitization, which will
lead to increased international cooperation, and in turn lead to government interest in the
international conventions of most relevance to it.
29
V. Major Transboundary Perceived Problems And Issues
The identification of the major perceived1 problems and issues (MPPI) is a first step in the
TDA process and it constitutes the justification for the subsequent in-depth analyses. The
significance of the perceived issues and problems should be substantiated on scientific,
environmental, economic, social, and cultural grounds.
The MPPIs represent the perceptions of the scientific and expert community on the
priority environmental issues of the region. The experts may come from the scientific
community, the NGO community, government, and other stakeholder groups. However,
not all stakeholders were included in the development of these MPPIs. Therefore, a
separate stakeholder analysis will be conducted before the finalization of the TDA during
the full GEF project.
This section of the TDA analyzes the MPPIs to identify the technical basis supporting or
refuting each MPPI as a priority issue in the WIO region. The intent is to provide a
technical rationale for prioritizing the MPPIs, to help guide the direction of future
interventions to improve the regional environment. It will be of no use to identify major
intervention efforts for an MPPI if the technical basis supporting its priority is missing. In
such a case, either the MPPI can be dismissed as a non-priority issue, or just as
importantly, gaps in knowledge can be identified, and filling the gaps can become the
next step towards addressing that particular MPPI.
This section, therefore, relies on the preliminary TDA prepared by the Institute of Marine
Sciences, University of Dar es Salaam in 1998, national reports from the participating
countries, various technical publications available for the region prepared by UNEP,
ACOPS and other organizations. The major sources of information are listed within each
individual section as well as in the Bibliography accompanying this TDA.
The Preliminary TDA identified the following list of major perceived problems and
issues. It includes four existing problems/issues:
I. Shortage and contamination of fresh water
II. Decline in harvests of marine and coastal living resources
III. Degradation of coastal habitats (mangroves, seagrass beds, and coral reefs), loss
of biodiversity.
IV. Overall water quality decline. Contamination of coastal waters, beaches and living
resources.
Below, each of these problems and issues is addressed from a status perspective. It
answers the question: what do we know about each problem/issue? What data support the
quantification of the extent of the problem/issue? Do the data support these as real
problems and issues, or just as perceptions? This analysis took place on a scientific level,
1 "Perceived" is used to include issues which may not have been identified or proved to be major problems as yet due to data
gaps or lack of analysis or which are expected to lead to major problems in the future under prevailing conditions.
30
including biological, oceanographic, physical, social, and other perspectives on the
problem. This is in effect the "status" assessment.
The next step was to perform the causal chain analysis; the major perceived problems and
issues were analyzed to determine the primary, secondary and root causes for these
problems/issues. Identification of root causes is important because root causes tend to be
more systemic and fundamental contributors to environmental degradation. Interventions
and actions directed at the root causes tend to be more sustainable and effective than
interventions directed at primary or secondary causes. However, because the linkages
between root causes and solutions of the perceived problems are often not clear to
policymakers, interventions commonly are mis-directed at primary or secondary causes.
This TDA attempts to clarify the linkages between root causes and perceived problems,
to encourage sustainable interventions at this more sustainable level. Fortunately, root
causes are common to a number of different perceived problems and issues, so addressing
a few root causes may have positive effects on several problems and issues (Table 9).
Table 9.
Root Causes and Major Perceived Problems and Issues
Root Causes
Perceived Problems
I. Fresh Water II. Decline in
III. Degradation of IV. Overall water
shortage and
harvests of marine coastal habitats
quality decline.
contamination
and coastal living (mangroves, seagrass Contamination of
resources
beds, and coral reefs) coastal waters,
loss of biodiversity,
beaches and living
resources.
1. Rapid growth in
coastal population and
urbanization
2. Lack of policies and
legal framework
3.Inadequate
knowledge
4. Institutional
Weakness
5. Lack of
management strategies
6. Inadequate
financing mechanisms
and support, lack of
investments
The TDA summary analysis of the major perceived problems and issues follows.
31
V.1 Fresh water shortage and contamination
a. Statement of the problem/issue
Freshwater shortage and the contamination of supplies are the single greatest
environmental constraints to economic and social activities in all countries of the region.
Fresh water shortage is equally serious in all the countries of the region with widespread
environmental and socio-economic impacts. Lack of regional legal agreements and
poorly articulated institutions for implementing effective international river basin
management and ground water conservation, are the dominant problems shared by the
whole region, with Mozambique being the prominent example including 8 of the 12
downstream parts of the region's international basins.
In the case of the Small Islands Developing States (SIDS), the small physical size and
geological nature of many SIDS means that reliable supplies of freshwater can be a major
constraints to development. The economic health of the island states of the WIO of
regional and intra-regional concern, partly as a result of the expanding tourist trade, the
tuna industry, and the fragile nature of the island ecosystems and biodiversity. Water
shortage, contamination and saline intrusions are among the main water problems
affecting SIDS.
b. Transboundary elements
The major transboundary patterns of the fresh water shortage and contamination can be
illustrated as follows:
- The West Indian Ocean region has rivers basins that transcend national
boundaries and the inputs from these rivers have long geographic impacts. The
negative effects experienced in estuarine and coastal areas are the result of
activities carried in upland areas including the landlocked countries.
- Most coastal areas in WIO region are arid; fresh water is therefore a scarce
resource. Many of the industries in the region are located in the coastal urban
centers, which have limited waste treatment facilities resulting in contamination
of freshwater systems. Highly populated urban centers in coastal areas have poor
sanitary conditions that result in high contamination of ground water.
- Land and fresh water are limiting resources in the island states. High population
density and expanding tourism industry exert high demands on fresh water
resulting in depletion of aquifers to levels that allow that the intrusion of salt
water. The lack of effective and efficient sewage treatment results in
contamination of ground waters.
- Potential conflicts over shared water
c. Environmental
impacts
Major environmental impacts of the fresh water shortage include:
- saltwater
intrusion
- down stream erosion
- degradation of coastal ecology
- reduction in biodiversity
- reduction of fisheries resources
32
- decrease of wetlands areas
- reduced capacity to transport sediments
- modification of coastal habitats
Major environmental impacts of the fresh water contamination includes:
- downstream ecological damage
- modification of coastal habitats
- depletion of fish stocks
- loss of biodiversity
- degradation of coastal ecology
d. Socio-economic impacts
The degradation of ground water resources through saline intrusion and contamination
has both social and economic implications for the entire population of the coastal region.
The major impacts are:
Lowering of agricultural production
Shortage of drinking water
Decline in drinking water quality
Reduction of hydro-electric power production
Reduction in industrial production
Increased cost of alternative water supplies
Effects on human health
Increase water intake treatment costs
Socio-economic consequences related to freshwater shortage and contamination are
immense but difficult to assess. For instance, the shortage of fresh water, because it
causes deterioration of the water quality, has severe implications in the human health.
Indeed, most of the causes of death in Mozambique are infectious and parasitic diseases,
all associated with hygiene and water quality. Table 10 presents the number of the cases
of waterborne diseases recorded in Mozambique. Further, the deterioration of the water
quality affects the availability of natural resources (fish, fauna and flora) has implication
in the economy, employment facilities and reduces capacity for the local community to
meet basic needs (subsistence). It should be pointed out that shrimp fishery is one of the
major source of income for the country. The associated destruction of the coastal
environment (e.g. erosion) reduces income from the fisheries and tourism.
Table 10.
Number of cases of waterborne diseases reported in coastal provinces of
Mozambique (Anon, 1998).
Province
1994
1995
1996
Diarrhea
Cholera
Dysentery
Diarrhea Dysentery
Diarrhea Dysentery
Maputo
61750
36
19424
50258
9264
50572
7971
Gaza
16909
8854
14463
2661
16966
2188
Inhambane
8509
2118
8904
1496
13966
1802
Sofala
27405
440
3816
38368
5158
35883
6508
Zambķzia
46759
1
10287
36319
4982
46197
7874
Nampula
40249
12
6311
29851
4940
20523
3475
C. Delgado
17884
212
9311
10901
3239
17479
4298
33
e. Causal chain analysis
Figure 3. Causal Chain Analysis: Fresh water shortage and contamination
Causal Chain Analysis
MPPI-I
Fresh Water shortage and contamination
Deforestation
Pollution of ground water
Increased demand for fresh water
Population growth
Infiltration from saturation wel s
Lack of knowledge
on actual needs
Lack of deversified economy
Deficiency in water
Inadequate planning
management
Lack of alternative
Inadequate control of land use
Lack of regional
fuels
agreement
High agriculture production
Lack of Investment
Use of agro-chemicals
Inadequate agriculture technology
Municipal and industrial
waste discharges
High cost of water treatment
Deficiency in water quality control
Lack of knowledge on the extent of
pollution and impacts
Lack of enforcement of
regulations and laws
34
f. Sectors and Stakeholders
Data not available.
g. Supporting Data
By far the largest river in the region is the Zambezi river with the drainage basin
estimated at more than one million square kilometers. Other large watersheds include
basins of the Limpopo, Juba, Tana and Juba rivers (Table 1).
The coastal regions of the Western Indian Ocean have abundant water resources through
rainfall, regional rivers and groundwater. Rainfall is the dominant factor, which
determines the overall availability of water available in aquifers and rivers. Due to
increase in rural and urban populations and inefficient water supply, the coastal people
are increasingly relying on groundwater resources to supplement reticulated water
supplies, especially in the cities of Mombasa and Dar es Salaam. In Kenya, many of the
middle and higher-class tourist hotels are drilling their own boreholes to augment the
reticulated water supply system.
Table 11.
Annual river flows in cubic km, 1995
Country Total
resource
Annual
river
flow
Annual river flow to
from other countries other countries
Kenya 30.2 10.0 n/a
Madagascar 337.0
0
0
Mauritius 2.2
0
0
Mozambique 208.0
111.0
0
Tanzania 89.0
9.0
n/a
Source: World Resources, 1996-7, World Resources Institute
One of the major problems countries have to contend with is a result of the variation in
rainfall over time. In some countries, along the East African Coast, there are long periods
of drought interspersed with periods of an overabundance of rainfall (Somalia,
Mozambique.) Thus averaged over time water is plentiful but the natural and human
engineered capacity for storing water for use through the dry periods is inadequate.
Many projects have been developed along these rivers for hydropower generation,
irrigation, of water supply, and in some cases flood control. These projects have modified
river flows and have led to increased surface runoff, soil erosion, transport of pollutants
downstream, increased industry, agriculture and urban development in certain areas, and
changes in water storage patterns of aquifers.
For example in Kenya, some parts of coastline have been developed beyond the capacity
of available water resources to supply the demand. This has led to local communities
being accorded a lower priority to receive water than hotels and housing developments
(Salm, 1998).
35
The result of these activities resulted in a reduction of the availability of freshwater for
various uses. The main issues and problems arise from:
-
pollution of water supplies
-
lowering of the water table in some areas
-
reduction in stream flows of major rivers and streams
In Comoros, only islands Anjouan and Moneli have permanent waterways. The major
rivers include Ajano Gege, Trondoni and Tatinga. For the last 50 years the river flow
decreased dramatically. Out of 48 rivers on the Anjouan island, only 11 have a permanent
flow through the year.
Mozambique is a country that shares all its main rivers with other countries and is the
lowest riparian. The main rivers are, from North to South, Rovuma, Zambezi, Pungoķ,
Buzi, Save, Limpopo, Incomati, Umbeluzi, and Maputo. They are all international and
flow in a NW-SE direction, draining the water into the Indian Ocean. The Rovuma River
constitutes the natural border between Mozambique and Tanzania.
The regime of these rivers is characterized as torrential with high runoff during the wet
season, from November to March, and relatively low flows in the dry season, from April
to October. About 60% to 80% of the mean annual flow occurs in a few months of the
year. It is estimated that the flow from the upper riparian represent about 1.5 times that
observed in Mozambique.
The shortage of fresh water is mostly due to the reduction of flow by intensive use in the
neighboring countries. The central and southern part of the country is where the reduction
in flow from hinterland is more critical. It is estimated that South Africa, Swaziland and
Zimbabwe now abstract about 40% to 60% of the border flow. The extent of the
obstruction of water by neighboring countries is illustrated by the distribution of dams in
the Limpopo river basin and in the Incomati, Umbeluzi, and Maputo river basins.
Zambezi River is used in the production of electricity both in Zimbabwe and
Mozambique, and used in intensive agriculture in many countries including Zambia,
Zimbabwe, and Mozambique. Pungoķ River is used for irrigation of the tobacco
plantation in Zimbabwe and to supply water in the cities of Mutare, in Zimbabwe and
Beira, in Mozambique. The Elephant River (a tributary of Limpopo), is heavily used in
South Africa, for cooling at the thermal power stations that serve Gauteng province. In
this sub-catchment there are most of the coal deposits that supply the thermal stations in
South Africa. Apart from the dams constructed to supply the mining industry, power
generation and agriculture, this river also serves as the main supplier of water to
Gaborone, the capital city of Botswana. Incomati and Umbeluzi rivers are extensively
used for irrigation in South Africa and in Swaziland, respectively.
The reduction in flow may cause the deterioration of the water quality down stream, and
may allow for upstream salt intrusion, with consequences in the agriculture (Zambezi,
Limpopo rivers). The reduction in flow is often associated with the reduction in sediment
inflow rate, this may trigger erosion process in the river mouth and affect the estuarine
36
and coastal ecosystems (Zambezi). The dams, because they change the natural regimen of
the river, introduce chronic stresses in the marine living organisms. The shrimp stock in
Sofala Bank is decreasing and such reduction is a reflection of the reduction in the
recruitment population due to incompatible Zambezi runoff. High runoff during the dry
season prevents the migration of larvae and juveniles of prawns to the mangrove, their
nursery areas, and on the other hand low runoff during the wet season results in low
recruitment. Intensive agriculture or mining activity, because it is associated with
intensive use of chemicals, has further implication in water quality. Return flow from
irrigation plantations and/or from mining activity is often polluted. Further, the reduction
in water flow in upstream countries increases the potential for regional conflicts. This is
the case with Zimbabwe (Zambezi, Pungoķ, Buzi rivers), with South Africa (Limpopo,
Incomati rivers) and with Swaziland (Umbeluzi River).
In addition to the reduction of river flow, the efficiency of the production and use of
water is low. The irrigation efficiency is only 50%. A lot of water is lost in the
distribution network of the urban areas, due to inadequate and inefficient distribution
scheme. Some of the pipes and tanks for keeping water are corroded and leaking.
Table 12.
Pollution Loads to Ground Water Sources (Kg/Day) in Dar es Salaam
Type Without
Pit
Septic
Sewer
Losses
Total
Facilities
Latrines
Tanks
Domestic Industry
(Tonnes)
BOD
1,100 15,282 7,641 1,221 1,899
27
COD
1,161 16,131 8,068 1,289 11,994
29
Suspended
1,833 6,116 3,832 2,035 3,148
18
solids
Dissolved
3,258 97,857 61,128 3,618 5,596
196
solids
Total
N
120 4,829 3,018 3,618 5,596
10
Total
P
23 915 572 34 52 2
It is also useful to show the water supply and demand balance in the coastal areas of
Tanzania, which may illustrate a more general pattern at least in some parts of coastal
states (Table 13).
Table 13.
Rural Water Supply and Population Coverage by Administrative Coastal
Regions (Tanzania) in 1993 and Projected Demand to year 2002
Region 1993
Population Coverage
Water
Supply in Demand
Population Coverage
%
Demand
1993
in 2002
(000)
(000)
(cubic
(cubic
meters)
meters)
Coast
682 265 32 30,690
11,939
39,006
Dar-es
228 131 57 10,278
5,895
15,673
Salaam
Lindi
624 309 49 28,089
13,906
33,569
Mtwara
661 522 83 38,785
32,517
43,955
Tanga 1198 715
59
53,910 32,212 64,998
Source: Insitute of Marine Science, Zanzibar
37
Table 14.
Urban Water Supply/Demand for Coastal Districts (Tanzania) in 1993
District Population
Population
Coverage % Water
Demand
Coverage
Supply
(cubic
(cubic
meters)
meters)
Coast
Kibaha 19,386 10,523 92.45 720
779
Dar-es
67.0
191,000
409,500
Salaam
Mtwara
Mtwara
3,600
8,500
Newala
2,400
2,500
Masasi
1,500
2,000
Lindi
Lindi
Urban
52,637 39,749 76
1,500 3,500
Kilwa
10,743 9,050 84
850
2,400
Masoko
Liwale 15,036 13,500 90
255
1,300
Nachingwea
28,021 24,771 88
1,452 3,500
Tanga
Tanga
252,811 128,350 60.6
24,400 40,217
Municipal
Pangani
5,640 4,675 70.8 1,374 1,939
Korogwe
25,869 25,000 25.9 1,469 5,675
Muheza 13,872 12,108 44.9 1,728 3,859
Source: Institute of Marine Science, Zanzibar
V.2 Decline in Harvests of Marine and Coastal Living Resources
a.
Status of the problem/issue
In some countries in the region, there is evidence indicating that the artisanal as well as
the commercial fisheries have exceeded or are about to exceed the point of sustainability.
For example, in recent years, the artisanal and industrial coastal fisheries in Tanzania
have been failing consistently. The artisanal fish landing has decreased from 54527 tons
in 1990 to 32286 tons in 1994.
b. Transboundary
elements
Major transboundary elements of the problem can be summarized as follows:
- Loss of income from regional and global trade of marine products
- Region-wide decrease in biodiversity of the marine living resources including
the disappearance of high quality critical natural resources
- Region-wide destructive fishing techniques degradating coral reefs, mangrove
and seagrass habitats
- Increasing catch effort on pelagic species such as tuna, bill fish, king fish and
sharks
- Non-compliance to the FAO Fisheries Code of Conduct
38
c. Environmental
impacts
- Loss of biodiversity
- Changes in food web
- Changes in community structure due to over exploitation of one or more key
species
- Increased vulnerability of commercially important species
- Long term changes in genetic diversity
- Stock
reduction
- Loss of top predators
- Habitat degradation due to destructive fishing technique
d. Socio-economic
impacts
- Reduced
income
- Loss of employment
- Population
migration
- Conflicts between user groups
- Lost of recreational opportunities
- Decline in protein
Over-exploitation of fishery resources may have impacts on the status of the coastal
communities in a number of ways similar to those of modification/loss of ecosystems and
destructive fishing practices.
Fishing is an important economic activity practised by communities living along the
coast. Artisanal fishing contributes more than 96% of the nation's total marine fish
landings (TCMP, 1999).
According to fishermen, certain types of fish species are not easily available these days
due to overexploitation. Catch figures however do not reflect great changes in catch per
unit effort, which generally declines with a decline in stock. Indeed, although the catches
of certain species, e.g., sardines, scavengers, and mackerels, have increased over the past
decade, current catch rates are less than 50%. Despite the declining catch per unit, the
number of participants in the fishing sector remains high.
Table 15.
The number of coastal fishermen deriving their livelihood from fisheries
Country
No. of Coastal Fishermen
Comoros
8,000
Kenya
8,000
Madagascar 42,556
Mauritius
2,700
Mozambique 80,000
Seychelles
1,000
Tanzania
4,200
Source: Institute of Marine Science, Zanzibar & Country Reports
e.
Causal chain analysis
39
Figure 4. Causal Chain Analysis: Decline in harvests of marine and coastal living
resources
Causal Chain Analysis
MPPI-II
Decline in harvests of marine
and coastal living resources
Free access to the
Inappropriate fishing
Increasing catch
resources
methods and gear
and effort
No Scientific basis
Lack of Policy/legal
High demand
for fishing quotas
framework
National and International
Population growth
Inadequate human
Insufficient Economic
capacity in oceanography
valuation for resources
and fisheries
and habitats
Lack of knowledge
on stock size
Economic Preasure
to allow foreign
Lack of Scientific
fishing fleets
Capacity
Lack of fisheries management
strategies
No Scientific basis
Insufficient
for quotas
Sectoral
Coordination
Lack of policies and
Lack of Public
legal framework
Lack of Sectoral
Participation in fisheries
Coordination
decisions:
Weak Civil Society
Inadequate economic valuation
Lack of knowledge
of natural resources
Lack of Legal/Regulatory
on best-available
and habitats
basis for fisheries
technology
Lack of alternative
Lack of Training
resources
Lack of Public
Involvment
Lack of funds
No Gov't programs to
convert technologies
40
f.
Sectors and Stakeholders
The main government sectors involved in the fisheries issues are the environmental
ministries, agriculture/fishing ministries, and municipal and regional governments. The
Stakeholder Analysis identified the energy ministries as major government sectors
(perhaps for both oil and gas sector impacts as well as hydropower). Affected
stakeholders include local fishermen, coastal zone residents, and scientific community.
g. Supporting
Data
According to Salm, (1998) sharks appear to be over-fished in several areas, including
parts of Somalia and Tanzania. Both shark and ray catches have declined significantly in
Tanzania, particularly at Mafia and Songo Songo Islands. Furthermore, there is evidence
that increased commercialization of octopus, sea cucumber and seashells harvest has
resulted in declines of these species in a number of areas in Tanzania, Kenya and
Mozambique (Salm, 1998 and WWF, 1997).
Table 16.
Fishery resources, catch, and level of exploitation in Mozambique
Resource
Potential (mt) Estimated Catch Level of Exploitation
(mt) 1993
Crustaceans
Shallow-water
19,100 11,522
Intensive on Sofala Bank and
prawns
Maputo Bay. Moderate in zones
only accessible to artisanal fishery
Mundle prawns
4,100
3,154 Intensive
Deep-water prawns
3,500
1,830 Moderate
Deep-water
400
292 Intensive
Lobster
Crayfish
500
450 Moderate
Deep-water crab
800
309 Moderate
Rock lobster
150
20 Low
Mangrove crab
13,300
2,000 Low
Marine Fish
Large Demersals
29,500
7,338 Unexploited on St. Lazarus Bank,
moderate in rest of the country
Large pelagics
37,500
4,212 Very low
Sharks 10,500
2,236
Low
Small demersals
116,500
15,875 Low
Small pelagics
131,300
35,894 Low
Deep-water fish
500
250 Low
Molluscs and other marine resources
Holothurians 750
700
Intensive
Cephalopods 2,000
240
Low
Algae 500
0
Low
Clams & bivalves
2,000
20 Low
Source: Anon., 1994
41
The development of fisheries and agriculture is accompanied by an accelerated
degradation of the environment. If this situation is not controlled, it may result in a
complete destruction of both marine and inland water ecosystems. As mentioned above,
the civil war contributed to the increase of pressure in the coastal resources, including
fisheries. Shrimp, the major fishery in Mozambique, is one of the world's most valuable
fishery resources. Its high price in the international market has led to a rapid development
of the shrimp fishing industry, with a consequent increase in the fishing effort, beyond
the levels of sustainability. The resulting reduction in availability of shrimp led to a low
income that often does not compensate the large investment made. The regulatory
measures applied to date have not yet succeeded in preventing this situation.
Table 17.
Fish Catch (tons) by type of fisheries in Mozambique
Type
of
Fish
1986 1987 1988 1989 1990 1991 1992 1993 1994 1995 1996
INDUSTRIAL
FISHERIES
Total
24951
25284
26735
21585
23912
19050
22701
12522
17690
177217
16281
Shallow w. shrimp
Deep water shrimp
7575
7513
7328
5724
5957
7050
6338
6698
6321
7344
7043
Demersal fish
2412
2285
3726
3154
2841
2350
1652
1833
2250
1770
1771
Deep water lobster
12524
13416
13701
10361
8276
7757
5391
1756
3341
2604
2503
by-catch (S. shrimp)
255
136
170
163
237
203
247
292
294
208
7
by-catch (D. shrimp)
1689
1258
930
753
780
720
369
741
603
623
1150
crabs
21
26
148
30
-
168
332
260
262
266
202
prawn
381
336
259
135
190
257
156
309
328
311
190
squids
46
224
231
167
207
341
186
443
261
179
132
octopus
tuna
49
89
91
64
57
8 6
7338
140
36
60
35
marlins
152
1033
5367
119
19
3914
3347
2461
sharks
51
30
29
36
rock lobsters
312
358
other crustaceans
165
21
194
178
SEMI-INDUSTRIAL
FISHERIES
Total
381
385
342
164
239
941
1271
2834
2405
4184
7123
Shallow w. shrimp
Demersal fish
48
58
94
44
74
179
184
275
222
157
396
By-catch (S. shrimp)
223
223
155
105
111
448
516
1053
892
561
-
Crabs
110
104
93
16
55
313
65
809
361
293
584
Squids
-
3
3
1
0
-
Fresh water fish
1
3
5
4
0
1
Other fish
689
925
3137
5574
568
ARTISANAL
Total
13338
10653
5108
5811
8767
5544
3835
3839
3362
3512
11511
Shallow w. shrimp
143
96
14
135
832
469
237
375
102
199
567
Demersal fish
13195
10557
5093
5676
7436
4900
3447
3300
3205
3044
9987
Lobsters
231
5
30
20
13
40
130
Crabs
198
133
84
95
15
103
374
Squids
2
20
29
42
16
82
329
Holothuria
-
5
0
-
6
54
Shell fish
68
12
9
5
11
38
57
octopus
2
13
Source: Department for Fisheries Administration (DAP)
42
Most of the main rivers in Mozambique emanate from outside the country and most of
them are impounded. These rivers favor the development of fisheries, for their
environmental conditions attract ecological shelter for some economically important fish
species (Bernacsek, 1984). The case of the Cahora Bassa reservoir colonized by Lake
Kariba Kapenta that resulted in development of a semi-industrial fishery, is an example.
On the other hand, intensive agriculture practice along river valley may affect fish
productivity in estuarine areas due to excessive use of agro-chemicals if precautionary
measures are not applied timely. Little is known about estuarine eutrophication in
Mozambique river reservoirs. However, in the view of the current rate of expansion of
agriculture in Mozambique and in the neighboring countries, it should be expected that
eutrophication might be a worrying issue in the near future.
The most affected fish resource is the shallow water shrimp. Its total annual production in
Sofala Bank dropped from about 10,000 tons in late 70s to about 6,000 tons in late 80s
and recovered to about 9,000 tons in 2000. On the other hand, the fishing effort increased
from 10,000 fishing hours in late 70s to about 20,000 in the late 90s. Therefore, the
observed increase in the annual catches does not mean an increase in the stock of shrimp.
In fact the stock of this precious resource is decreasing. This is confirmed by the decrease
in the availability, expressed in catch per unit effort (c.p.u.e), Figure 5.
Figure 5. Evolution of the catch rates of shrimp on Sofala Bank (Hoguane, 2000)
100
90
80
70
60
-1
50
kg hr
40
30
20
10
0
1976
1978
1980
1982
1984
1986
1988
1990
1992
1994
1996
1998
2000
Year
In Kenya, most perceived impacts of over-fishing by commercial trawlers in especially
the Ungwana Bay and Malindi Bay lack supporting documented data. However, various
43
reports on impacts of over-fishing on particularly coral reef systems have been
documented (e.g. McClanahan & Muthiga 1987).
Ę Over-fishing in coral reef habitats has been shown to cause reef degradation and
adversely affect the productivity and biodiversity.
Ę Trawling for shallow water shrimp in the Ungwana Bay has resulted in
destruction of the seagrass habitat, and impacted on productivity and fish diversity
(as evidenced by claims of diminishing catches by artisanal fishermen).
Ę Excessive by-catch and its disposal is an important issue of concern.
Ę Threatened marine species that frequent seagrass beds in Ungwana Bay, namely
dugongs, the green turtles and the hawksbill turtle are at risk from shrimp
trawlers, which often catch them in their trawl nets and kill them.
Artisanal fishery in Mauritius involves lagoon as well as the off-lagoon activities of
fishermen using "pirogues" of 6-10 meters long. It uses traditional means and methods of
fishing. The fishing implements used are hooks and lines, basket traps, large nets, gill
nets, canard nets, cast nets and harpoons. The "pirogues" are propelled mostly by
outboard motors, oars and sails, while the rest are equipped with inboard motors. The
artisanal fishery is the main source of fresh fish supply for the local market. Off-lagoon
fishery is a relatively new activity and professional fishermen are more interested in it as
the catch is higher than that of the lagoon and guarantees a good income to the operators
concerned.
Table 18.
Catch per Fisherman/Day (kg) in Mauritius
Year Lagoon Outside
lagoon
1994 5.5
6.8
1995 4.1
6.4
1996 3.9
5.4
Source: National Report from Mauritius
The value of artisanal fishing represents around 46.3% of the total value of fishery
products. The following table shows the incidence of artisanal fishery compared to the
total output in the sector.
44
Table 19.
Production and Employment in Mauritius, 1995
Sector
Production (Tons) % No. of Fishermen
Artisanal Fishery
2,973 17
2,711
(Mauritius, Rodrigues, Agalega)
Big Game Fishing
650 4
Amateur Fishing
300 2
Aquaculture
155
1
Sub-total 4,078
24
2,711
Bank Fishing
6,768 38
786
Tuna Fishing
6,693 38
TOTAL 17,539
3,497
The above clearly shows that in 1995 artisanal fishery represented only 17% of the total
production but employed 2711 professional fishermen.
There are 61 landing sites in Mauritius, 15 in the North, 22 in the West, and 24 in the
East. In Rodrigues, the landing of fish is done in an informal way near villages and on the
coast.
Table 20.
Annual Catch from submerged Banks in Mauritius
Year Vessels S.
de
Nazareth St.
Chagos Albatross Total
Malha
Brandon
Catch
1993 17
3,173
1,358
590
195
261
5,577
1994 16
3,167
1,591
224
307
232
5,521
1995 15
2,682
1,609
470
218
312
5,291
1996 15
2,283
1,253
432
321
135
4,424
Table 21.
Tuna Landing in Mauritius
Tuna Landing
Year
No. of Landings
TOTAL (Tons)
1993 21 10,279
1994 17
7,689
1995 15
6,179
1996 12
2,815
Lagoon artisanal fishing has been a traditional activity for coastal communities in
Mauritius and Rodrigues. With the ever-increasing demand for marine products and the
incentives given to professional fishermen, the industry has not improved over the past
decades. In fact there has been a significant drop in catch. In Mauritius the fish catch has
dropped from 1597 tons in 1987 to 1246 tons in 1997.
45
Table 22.
Annual coastal fish catch (tons) in Mauritius
YEAR
1986 1987 1988 1989 1990 1991 1992 1993 1994 1995 1996 1997
CATCH 1362 1597 1479 1544 1637 1568 1775 1583 1663 1443 1616* 1246*
Source: Ministry of Economic Development and Regional Co-operation (1997)
* Source: Ministry of Agriculture, Fisheries and Cooperatives (1999)
Some of the species (Octopus) have completely disappeared from the local market as
fresh material but is only available in the frozen form from neighboring countries. The
Rodriguan octopus industry has been heavily affected; there has been a considerable
decline in catch and size over the past years.
In Seychelles, local fishermen exclusively operate the artisanal fisheries sector, where an
estimated 1,000 fishers are active, possessing a fleet of about 400 fishing vessels. After a
sharp decline in fish landings in 1998, the 1999 catch recovered to the highest level since
1993.
Table 23.
Total Artisanal Catch (1994-1999) in Metric Tons2 in Seychelles
1994 1995 1996 1997 1998 1999
4,428 4,313 4,510 4,095 3,334 4,842
For the trap fishery land mostly Rabbit fish (Siganus spp) representing 60 % of landings
and some Scaridae, Lethrinidae, Mullidae and Heamulidae. Studies in 1995 showed that
although there is a decrease in total biomass, processes of recruitment and growth are
believed to be sufficient to allow sustainable yields at the present fishing levels. It should
be emphasized, however, that the yields from heavily fished areas might only be
maintained because larvae can recruit from adjacent and less fished areas. Thus the
collective effects of fishing must be considered. Effects of fishing on reef fish are
unknown.
The National report from Madagascar reveals the decrease in commercial stock of
lobsters, shrimps and sharks, though no data are available. The report also states the
pressure on turtles and Dugong dugong as well as rapid disappearance of shells.
Tanzania
Based on the fishery resources data as well as interviews with fishermen, there are
indications that catches of some fishery resources are declining. Here are some examples:
i)
The total annual catch in Zanzibar has decreased from about 20,000 tons in 1988 to
less than 13,000 tons in 1998. The decline in fish catch has also been observed in
some specific areas such as in Chwaka Bay in Zanzibar (Jiddawi, 1999a) and for
specific components such as the reef fisheries of Zanzibar (Jiddawi, 1998).
2
Source: Seychelles Fishing Authority (SFA) Annual Report 1999
46
ii) The small pelagic fisheries undertaken by Zanzibar fisheries cooperatives have also
experienced significant decline in their catches. Their catch has declined from 600 t
in 1986 to 91 t in 1997 (Jiddawi, 1999b).
iii) According to Ardill (1984), the catch rate of long line fisheries in Tanzania has
declined substantially, in numbers and weight. Also shark fin trade has declined in
Tanzania (Barnett, 1997; Jiddawi and Shehe, 1999). Both shark and ray catches
have declined significantly, particularly at Mafia and Songo Songo islands.
iv) Furthermore, there is evidence that increased commercialization of octopus, sea
cucumber and seashell harvesting has resulted in decline of these species in a
number of areas in Tanzania. The export of sea cucumbers (beche-de-mer or
trepang) is one of the more profitable areas of marine resource extraction associated
with coral reefs (Table 10).
v) Overfishing of the triggerfish, results in a proliferation of sea urchins which are
known to be bioeroders of reefs (Kamukuru, 1997).
vi) Benno (1992) showed that, of the catch landed by beach seining at Kunduchi,
51.3% were immature fish, 37.8% had developing gonads and only 7.8% were in
spawning state. This means that about 90% of the beach seine catch had had no
chance to spawn during their lifetime. The mesh size of most of the seine nets used
did not exceed 12 mm.
Table 24.
Sea cucumber export from Tanzania
Year
Dry weight (kg)
Value (USD)
1992
178 373
411 979
1993
326 620
481 098
1994
530 192
884 169
1995
263 870
353 919
1996
296 410
450 405
Data from the fisheries department MNRT (1996) show that there has been a decrease in
landed catch with a slight increase in the number of fishermen and gear from 1985-1986
to 1995-1996.Table 26 illustrates the fisheries statistics 1985-1995 showing the
downward trend in catch per fisherman for the 10-year period.
Table 25.
Total marine fish production (in tons) for Tanzania mainland: 1985 Ł
1995.
Regions
1985
1986
1987
1988
1989
1990
1991
1992
1993
1994
1995
Total
Tanga
4,547 4,402 4,865 7,618 5,441 5,544 4,187 4,187 4,856 5,373 5,373 56,395
Coast
10740 10745 11402 11950 10998 16500 12632 10659 8,609 9,148 9,148 122531
DSM
6,834 10656 6,352 14002 15256 14557 15452 16502 14867 16616 16616 147711
Lindi
11589 14051 7,325 5,965 8,042 9,886 12071 6,379 3,271 3,606 3,606 85791
Mtwara
7,963 5,327 7,325 7,325 7,408 8,039 8,039 4,455 2,624 2,543 2,543 63591
Total
30084 45182 37269 46860 47145 54527 52381 42183 34226 37286 37286 476019
Commercial
900 1,483 1,799 2,190 2,438 2,015 1,510 1,119 1,223 1,787 1,787 18251
Source: Ministry of Lands, Natural Resources and Tourism. Fisheries Division, 1985 Ł
1995 Annual Reports Statistics.
47
V.3 Degradation Of Coastal Habitats (Mangroves, Seagrass Beds, And Coral
Reefs), Loss Of Biodiversity.
a. Status of the problem/issue
The coastal ecosystems of the region are generally both rich in natural resources and
highly productive. Important habitats include mangrove forests, coral reefs, and seagrass
beds. These ecosystems sustain a great diversity of marine life and are an important food
source for most coastal communities. There is great interconnectivity between the
ecosystems. The integrity of each ecosystem is dependent on the health and influence of
adjacent ecosystems. For example, there is nutrient, sediment, and organic matter
interchange between the coral reefs and mangrove ecosystems.
Coral reefs and mangroves are the most biologically diverse ecosystems and greatly at
risk. Coral reefs grow in clear water and reefs growth is extremely sensitive to pollution,
whether due to chemical contaminants or suspended sediments. The rapid expansion of
coastal populations and consequentially increased loads of domestic sewage, agricultural
runoff and industrial effluent to the marine environment represents a significant threat to
the coral reef habitat and human health.
Mangroves are under threat from both the environment and human activity. Heavy
rainfall and extreme drought can lead to super-dilution and hypersalinisation of the
mangrove swamps, causing disturbance in the regular development of the mangroves.
The increase in salinity threatens the normal growth and the survival of the plants and
animals living in the swamps. Gundry et al. (1981) point out that although salt is
important for growth and survival of mangrove plants, an extreme high salinity would
retard even the most resistant species. River floods and wave action may cause infilling
and blockage of the mangrove creeks with sediments.
Human threat, apart from the small scale subsistence fishing, has been characterized by
destruction of mangroves for buildings, farming, salt mining, port and airport
construction and industrial sites. Often the mangroves are viewed as useless land, and
hence, vulnerable to alternate use or used to dump wastes (John and Lawson, 1990).
b. Transboundary elements
The transboundary elements of the degradation of coastal habitats and loss of the
biodiversity can be describe as follows:
- Marine living resources are often migratory
- Coastal zone habitats are the backbone for the productivity of marine and coastal
habitats.
- The coastal habitats provide feeding and nursery grounds to migratory species
- The coastal habitats are accumulating transboundary pollution
- Degradation of coastal habitats contribute to the overall decline of regional and
global biodiversity
- Regional-wide destructive technique degradating coral reefs, mangroves and
seagrass habitats
48
- The sustainability of marine and coastal biodiversity depends on the integrity of
the interlinked ecosystems that supports all trophic levels in the food chain.
- Incidental and illegal catches of endangered species
- Impact to migratory species and their habitats
- Damage to transboundary ecosystems
c. Environmental
impacts
- Loss of biodiversity
- Loss of natural productivity
- Reduction of fish stocks
- Loss of migratory species
- Changes in coastal ecosystems
- Depletion of mangroves
- Degradation of coral reefs
- Effects on number and distribution of global population of certain migratory
species
- Reduction in value of marine resources
- Degradation of coastal landscape
- Changes of the hydrological regimes
d. Socio-economic impacts
The degradation of coastal habitats by an expending coastal population leads to the
degradation of the interdependent habitats and reduced fish catches. For example, a
reduction in seagrass or mangrove cover can reduce fish spawning, leading to reduced
catches, which has both social and economic implications, particularly for artisanal
fisheries, the income from which represents a significant proportion of GNP. Some of the
most important impacts include:
- Reduction of income from fisheries
- Changes in employment
- Loss of aesthetic value
- Loss of income from tourism industry
- Loss of cultural heritage
e. Causal chain analysis
Degradation of biodiversity and coastal habitats is shown on the next page (Figure 6).
49
Figure 6. Causal Chain Analysis: Degradation of biodiversity and coastal habitats
Causal Chain Analysis
MPPI 3
Degradation of biodiversity
and coastal habitats
Pollution
Climate change
Destructive fishing methods
Overexploitation
Tourism
Industrial development
pressure
and Urbanisation
Untreated point sources
Global warming
Population pressure
Under-valution of the ecosystem
Lack of control and
Lack of ICZM policies
discharges
and its resources
planning tools
Inadequate control on disposal
Poverty
Inadequate knowledge
Inadequate
Weak Legal
and treatment of urban and
and awarness
Sectorasl
Regulatory basis
industrial wastes
coordination
Siltation
Lack of knowledge and
Absence of management policy
training for fishermens
Poor economic
Weak civil
conditions
society, public
Lack of
involvment
Dredging
alternative technologies
Inadequate planning
Agricultural
practices
Lack of
Lack of
knowledge
alternative
agro-chemicals
50
f. Sectors and Stakeholders
Decline in biodiversity is prioritized as a regional issue primarily by agriculture and
fishing ministries, and secondarily by the scientific community, environmental ministries,
NGOs, and fishermen. The primary government stakeholders include regional and
municipal governments, state industries, agriculture/fisheries ministries, and the scientific
community. Primary affected stakeholders include coastal residents, fishermen,
environment ministries, agriculture and fisheries ministries, and NGOs.
g. Supporting Data
Degradation of critical habitat such as mangroves, seagrass beds and coral reefs and
water quality can result from a number of practices, most of which are common to most
of the countries of the region. These include:
- Destructive fishing methods such as dynamite fishing, beach seining and
poisoning. A recent survey in Tanga, Tanzania has shown that dynamite fishing is
responsible for the damage beyond repair of 10% of coral reefs in the REGION,
and 70% show significant amounts of damage but could recover if appropriate
measures are taken in time (Makoloweka and Shurclife, 1997). In southern
Tanzania, dynamiting is conducted in shallow areas from the Songo Songo
archipelago down to Mtwara District to the Mozambique border (Guard and
Masaiganah, 1997).
- The use of weighted seine nets, locally known as "juya," over coral reefs is also
contributing to significant destruction in coral reefs in Tanzania and northern
Kenya.
- Coral mining is practiced along the mainland coast for production of lime or
building blocks. In some areas such as Mafia Island (Dulvy et al., 1995) and
southern Tanzania coast (Guard, 1997), living corals are mined with significant
impact on coral reefs.
- Mangroves have been heavily cut in certain areas of Kenya, Madagascar,
Mozambique. Seychelles, and Tanzania for different purposes. In Tanzania,
mangroves are cleared for the construction of salt works, for lime making), and as
fuel wood. In Kenya, high demand from the tourism and industrial sector for
mangrove wood has been maintained by its low cost and high quality.
- Loss of the coastal forests in Kenya, Mozambique, Madagascar and Tanzania, is
significant. These forests have cleared for a number of reasons including
agriculture, pole cutting, charcoal making, lime making, salt making, grazing, and
urban and rural building development. In Tanzania, the once extensive coastal
forests have been reduced from 59300 km2 to its present size of 1050 km2 or
about 2% of the original area.
- Dugongs and turtles are considered endangered in most of the countries of the
region. This due to increase in incidental catches of these species as well as
51
degradation of their environment; seagrass beds for the dugongs and beaches for
the nesting turtles.
Mozambique
Most of the mangroves in Mozambique are of fringing type, and are distributed almost
along the entire coast of Mozambique. The largest concentration is located in central
Mozambique, in the Provinces of Sofala and Zambezia, central Mozambique. Maputo
Bay has the largest concentration in the southern part of the country. The area of
mangrove vegetation has obviously changed throughout the years. Saket and Matusse
(1994) compiled information of the mangrove vegetation density for different coastal
provinces, using satellite imagery, in two distinct years (1972 and 1990) and worked out
the evolution rate of the mangrove. According to their result (Table 18), the Maputo Bay
showed highest deforestation rate (15.2%) followed by Sofala (4.9%) in 18 years. Higher
deforestation rates around the coastal cities may be related to higher concentration of the
population in these areas in the 80s due to the civil war. However, the annual rate over
the entire coast remained relatively small (0.2%). There is no data available on mangrove
development in the recent years.
Table 26.
Mangrove degradation in Mozambique, 1972-90
Province Area
1972
Area 1990
Area
New Areas
Change %
(Ha)
(Ha)
degraded
(Ha)
(Ha)
Maputo 14,605 12,599 2,217 211
15.2
Gaza 387 387 0 0 0
Inhambane
20,094 19,848 246
0
1.2
Sofala 129,997 125,317 6,334 1,654 4.9
Zambezia
159,417 155,757 3,766 106
2.4
Nampula
55,849 54,336 2,006 493
3.6
Cabo
27,730 27,836 0
106
0
Delgado
Total
408,079 396,080 14,569 2,570 3.9
Source: Integrated Coastal Zone Management in Mozambique, Lundin & Linden ed.
1996
The main causes of mangrove depletion are:
(i)
Removal for firewood and construction, observed all over the coast with main
emphasis in the vicinity of the large cities, Maputo and Beira;
(ii)
Clearing for salt ponds, salt production, and for agricultural practices, observed
most in the northern provinces;
(iii)
Changes due to erosion, observed in the Zambezi Delta;
(iv)
Clearing for building, observed mainly in Maputo;
(v)
Blockage of the creeks connecting the mangrove swamp to the sea water, by the
sand waves caused by the waves or storms, observed in Maputo, Portuguese
Island (Hatton and Couto, 1992).
52
Although there is a regulation protecting the mangroves, its enforcement has been
difficult due to the fact that there is no alternative for building and fuel, main purpose for
which they are used, against the increasing demand due to population subsistence. Other
forms of fuel and building are expensive for the local population with low income. In
addition, the long civil war, and as mentioned above, has greatly reduced the options.
Depletion of mangrove causes the reduction in coastal productivity. Reduction in fish and
crustacean stocks observed in Sofala Bank (Skagen et al., 1997) and in Maputo Bay may
be partially attributed to the reduction in the mangrove forest. Migration pattern of the
species that habit temporary the mangrove swamps (e.g. prawns of Penaid species) is
likely to be affected by the reduction in the mangrove area and along with other species
that are related to this ecosystem. Hence, the species composition is likely to change and
biodiversity affected.
The main source of the destruction of coral reefs are associated with:
(i)
Overexploitation, observed in the northern part. Local population harvests the
coral and the ornamental shell associated for exportation.
(ii)
Use of destructive harvesting techniques, observed all over the country. Tourists
use snorkeling, spearfishing. There is suspicion that people are using dynamite in
the northern part of the country. The dive rate on the reefs of Ponta do Ouro and
surrounding are reportedly to be as high as 30,000 to 40,000 dives a year.
Children use rudimentary spearfishing tools to collect reef fishes from reef flats.
Other damaging fishing techniques used by artisanal fishermen include: beach
seining, gill nets, line fishing, traditional traps, poisoning.
(iii)
Environmental factors such as storms cause severe destruction in the coral reefs.
Erosion and consequent sediment transport cause siltation (Bandeira, 1995; Gove,
1995). Considerable source of sediments comes from erosion of coastal sand
dunes, accelerated in part by the deforestation of the vegetation over the dunes as
reported below.
Corals in the northern Mozambique, because they are much shallower, are more exposed
to the action of storms. While the southern corals, apart from those at Inhaca Island, are
relatively more protected from the storms and the rich of divers, as it requires appropriate
diving equipment. There are reports of sedimentation problems in the corals of Inhaca
Island.
Sewage is not treated and discharged directly into the sea. Industrial and agricultural
residues are also polluting the sea both through sewage and river effluent. The ports do
not have any device for oil spill and tank cleaning. Moreover, the Mozambique Channel
is the route of large oil tankers and there is no control for tank cleaning nor a contingency
plan for oil spills (MICOA, 1995a). The circulation pattern of the coastal water in the
southern Mozambique is northwards, meaning that in case of pollution in the Kwazulo
Natal, industrialized northern province of South Africa, there is a potential danger of the
southern corals of Mozambique being affected. On the other hand, some pollutants from
53
Mozambique may reach the outer slope in the domain of south going Mozambique
current, and thus carried towards South Africa.
The major threats to the seagrass ecosystem are:
- Overexploitation. Because the seaweed are consumed, used in industry and hence
of commercial value, their exploitation in some areas (northern part of the
country) exceed by far the levels of sustainability.
- Destruction by artisanal fisherman and local population. The collection of
invertebrates in the intertidal area, carried by women and children during the low
tide, often involves digging and revolving huge amounts of sand and steeping in
the seagrasses. The revolving of sediments may be beneficial because it enhances
the recycling of nutrients, but if done in higher intensity, as it seems to be in the
shores near high population centers (Maputo Bay), it can result in higher erosion
with consequent siltation and/or destruction of seagrass beds.
- Deforestation of coastal sand dune vegetation. Bare land is vulnerable to erosion.
Sand and dust are transported to the coastal waters by rain and/or winds. This
results in siltation.
Seagrass and seaweed are among the most productive submerged biotopes. They build up
large carbon reserves that are utilized by herbivores such as turtles and dugongs, both
endangered species, and birds. Seagrass meadows are used as nursery ground by many
species of fish and prawns, and so, contributing to the maintenance of biodiversity. They
hold and important artisanal fishery that serves as a basis for subsistence of a large
portion of local population. There is an indication that a considerable large population of
demersal fish, accessible to line fishing found in Southern Mozambique and that is shared
with South Africa, spawn in the seagrass of Southern Mozambique. Hence, management
of seagrass ecosystem in Mozambique may be of transboundary nature.
Kenya
The natural resources of Kenya has a continental type of coastline that stretches 500 km
Kenya's coast include coral reefs, beaches, mangroves, coastal and Kaya forests. Corals
reefs support a rich diversity of species and protect the coastline from wave action. The
mangrove habitat which covers an estimated 530 km2 forms important nursery grounds
for a variety of fishes and crustacean and roosting grounds for various species of sea
birds. In addition to providing stability against erosion, mangroves act as nutrient traps
and help reduce pollution of marine waters. Biodiversity in estuarine and brackish water
in int'ertidal mangrove forests is high. Between the fringing reefs and the shoreline are
biologically productive lagoons which are critical to fishing activities. Kenya's sandy
beaches and seagrasses are ideal habitats for numerous marine creatures, providing
nestling ground for various species of turtles, fishes and molluscs. The lowland and Kaya
forests support a highly diverse flora and fauna.
54
The status of mangrove vegetation, in Kenya can be summarized as follows:
Ę Mangroves are heavily exploited for the traditional uses of providing poles for the
building industry and for fuel wood both for local and export markets. In Lamu
and Gazi in particular, there is noticeable reduction in mangrove cover due to
over-harvesting, though no data is forthcoming due to lack of monitoring.
Ę Due to extensive human activities including pollutant loading both from industry
and domestic sources in the Tudor Creek, compared to the more pristine
mangrove creek of Gazi, the Tudor creek has lower fish diversity.
Ę Complete clearing of the mangrove habitat (over 5,000 ha) has occurred in the
Ngomeni Swamps to pave way for the construction of solar salt pans. Potential
impacts expected, as a result of this action is loss of productivity in the creek and
a decline in recruitment for the Malindi/Ungwana Bay fisheries.
Trawling activities in the Ungwana Bay have had significant negative impacts on the
seagrass beds and on threatened species, which use this habitat. These include the
dugong, Dugong dugon categorized as vulnerable, and the Green Turtle, Chelonia midas
and the Hawksbill Turtle, Eretmochelys imbricata, both categorized as endangered
species. Thus the dugong and turtle species are under threat not only from being strangled
in fishing nets, but also from the destruction of the seagrass meadows occasioned by the
trawling activities. Indeed, dead turtles have been sighted in the Ungwana Bay whose
death has been attributed to incidental catches by trawlers (Wamukoya et al. 1996).
Coral reefs occur along most of the Kenya coast covering approximately 50,000 ha. A
fringing coral reef, broken at the mouths of rivers, creeks and bays extends from Kisite in
the southern part of Kenya to Malindi in the north coast. In the stretch from Lamu
northwards patch reefs and fore reef slopes predominate. The coral reefs are highly
productive with high biodiversity. With an estimated maximum sustainable yield of 5 Ł
10 tons/km2/yr, coral reefs are important fishing grounds for artisanal fishermen. In
addition, the coral reefs, including the sandy beaches and lagoons, form the main
attraction for tourists to the coastal area. Kenyan reefs have experienced degradation due
to over-fishing and bleaching resulting in changes in community structures and coral
deaths.
Anthropogenic activities that impact on the reefs include tourist activities and artisanal
fishing. Over-exploitation of reef resources has been attributed with interference with the
delicate predator-prey ecological balance with adverse effects on the coral reef. Over-
fishing on the inner reef lagoon was attributed with the removal of the coral eroder sea
urchin Echinometra mathaei that enhanced degradation of the reef (McClanahan &
Muthiga 1989, Muthiga & McClanahan 1987). It is generally recognized that most
unprotected coral reefs are subjected to over fishing, shelling and degradation, with
resultant changes in productivity and biodiversity (McClanahan 1997, McClanahan &
Mutere 1994, McClanahan & Obura 1996).
55
Mauritius
The destruction of corals through coral trampling, fishing malpractices, damages by
boats, and natural causes such as bleaching affect the quality and availability of these
habitats for the residing biota. These effects are visible at Grand Baie, Flic en Flac and
Belle Mare. In Flic en Flac, the distribution of corals has altered significantly since it was
first mapped (Montaggionni and Faure, 1981). Quantitative studies carried out in 1994
revealed that the cover was below 40% both at Flic en Flac and Wolmar. In Grand Baie,
the lagoon floor is littered with coral rubbles mostly caused boat anchors. With regard to
bleaching, recent studies (Goorah et al, 2000) suggest that 31-39% of live corals in the
marine parks of Blue Bay and Balaclava were affected by bleaching. This figure could be
higher in regions such as Flic en Flac and Belle Mare. However, Turner et al (2000)
reported that the mass-bleaching event of 1998 did not seriously affect Mauritius with
less than 10% of bleached corals. However, the same report mentioned of the signs of
coral degradation due to boat anchors and cyclones.
The clearing of sea grass meadows, also caused by dredging activities, in particular in
front of hotels for bathing areas or for ski lanes, further impact the sea floor causing loss
of habitats and destabilize bottom sediments (Ramessur, 1991). Sea grass is known to
hold together sediment particles and thus prevent them from being carried by strong
currents. Recent studies carried out at Pointe aux Piments towards the southern end of the
Grand Baie site indicate that disturbed areas have significantly lower biomass values,
higher turbidity, lower biodiversity with only a few rare crabs, and can take four to five
years to recover (Choony, 2001).
Likewise sand mining activities affect the physical status of the habitat. Over 800,000
tonnes of sand are removed from the lagoons annually (NEAP,1999) and the resulting
damages of this practice as evidenced at Pomponette-Riambel are two-fold; ecosystems
are completely destroyed causing migration and death of associated biota in particular
sand dwellers, water currents are changed and sea floor topography modified.
Tanzania
The greatest human impacts on coral reefs are related to destructive or bad fishing
practices (Wagner, 1998b). By far the most destructive type of fishing is dynamiting.
Dynamite fishing has been practised in Tanzania since the 1960s. In the 1990s, dynamite
blasts reached incredible rates. In Mnazi Bay, Mtwara, 441 blasts were recorded over a
two-month period (October-November, 1996), while in the Songo Songo Archipelago, 30
blasts were heard every three hours and, at Mpovi reef (near Kilwa Kivunje), 100 blasts
were recorded during one six-hour period (Darwall et al., 2000).
Besides dynamite fishing, the use of seine nets around coral reefs is destructive in three
ways. Firstly, fishermen sometimes hit the coral heads in order to scare the fish out of
hiding, known as the Kigumi technique, which has been particularly common on Pemba
and the southwestern side of Unguja (Horrill et al., 2000). Secondly, the bottom of the
net is weighted down so it breaks corals as it is dragged over the reef. Thirdly, the small-
mesh size of seine nets results in the capture of many juveniles.
56
Another obviously harmful method is the use of poison. Horrill et al. (2000) reported that
poison (commonly an extract from the Euphoria plant) was used for fishing as far back as
1900 and that its use declined during the 1960s though it is still sometimes used today.
There are no data on its current extent of usage.
In addition, there are several other fishing methods that may be destructive to reefs, if
carried out in an improper fashion. These include octopus fishing, collection of shellfish
(which entails reef walking and diving), and the use of basket traps. Other harmful
activities related to fishing include the dropping of anchors and boat grounding (Wagner,
1999).
While seaweed farming is thought to be relatively environmentally friendly, it has been
reported in Unguja that this activity lowers bacterial production and the abundance of
small animals such as nematodes (Horrill et al., 2000).
In Dar es Salaam, Tanga and Zanzibar town, and to a lesser extent, Bagamoyo, Lindi and
Mtwara, there are many types of pollution, i.e., industrial, institutional, and domestic
discharge; agro-chemical pollutants; and sedimentation brought about by deforestation,
poor agricultural practices, and construction activities. These types of pollution affect
nearby reefs.
Solandt and Ball (1999) reported that, since coral mining has been a major industry in
Mikindani Bay, Mtwara for the past two decades, all Porites above a depth of 2 m have
now been gleaned from its nearby reefs. Coral mining is also common in Mafia.
While tourism is generally beneficial to the country, if uncontrolled and unmanaged, it
may have negative impacts on the environment. If tourists are careless while snorkeling
or SCUBA diving, they may break corals or disturb other organisms in the reef
ecosystem. Others walk along reefs in search of shells, thus causing damage.
Another type of disturbance is the use of motorized vessels, whether by fishermen,
tourists or transporters (e.g., the high speed boats that operate between Zanzibar and Dar
es Salaam), which stir up sediments that can affect coral reef ecosystems.
In Tanzania, various uses of mangroves have led to the modification or loss of mangrove
ecosystems. For many years, villagers have used mangroves on a sustainable basis for
firewood, building poles, boat making, charcoal making and the making of salt by boiling
seawater using mangrove firewood. However, with increased population along the coast,
particularly in urban centers such as Dar es Salaam, Tanga and Zanzibar, the demand for
these resources has increased beyond the capacity of the mangrove ecosystems to
regenerate and thus these uses are no longer sustainable in many areas of the country.
Particularly, the making of charcoal for sale in urban centers has led to severe
degradation of many mangrove areas. In some parts of the country where there is coral
mining, the burning of live coral in kilns using mangrove firewood has put a heavy
demand on the mangrove forests. These uses have caused fragmentation and modification
of many of the mangrove forests in Tanzania.
57
Besides the above-mentioned uses which entail harvesting or selective cutting, other
human activities involve clear cutting of substantial areas of mangrove forests. These
include clearing for aquaculture, solar saltpans, agriculture (particularly rice farming),
and the construction of hotels, industries, roads, houses, etc. Such clear cutting results in
loss of ecosystems or portions of them, which has become serious in the past two or three
decades. Large-scale clear felling of mangroves hinders natural regeneration (Germanis,
1999; Masawe, 1999; Semesi 1987, Semesi et al. 1999) due to alteration of the soil
microclimate and the lack of seed-bearing trees as seed sources.
Yet another way in which human activities have affected mangrove ecosystems is through
modification of patterns of water movement, either freshwater or seawater, which is so vital
to the maintenance of mangrove forests. Related to this are improper agricultural and
forestry practices that have led to soil erosion and change in sedimentation patterns.
Some fishing practices are also harmful to mangroves such as dragging seine nets over the
forest floor under the tree canopy. For example, at Mtoni Kijichi, regular dragging of seine
nets under the large Sonneratia alba trees has resulted in complete lack of seedlings and
intermediates to regenerate the stand (Akwilapo, 2001). Digging in the mangrove mud,
particularly in the Sonneratia and Rhizophora zones, in order to obtain polychaetes for fish
bait also results in ecological damage of the mangroves (Semesi et al., 1999).
Finally, near Dar es Salaam, Tanga and Zanzibar town, there have been various types of
pollution such as domestic, industrial, agro-chemical and solid wastes that have led to
modification of mangrove ecosystems. Boat traffic that increases erosive boat wakes also
may have negative affects on mangroves.
Destructive fishing practices are amongst the human impacts affecting seagrass beds in
Tanzania, particularly beach seining and trawling. Although beach seining is illegal, it is
a very common practice in many areas along the coast of Tanzania. Since the net has
weights to hold the bottom of the net down, as it is dragged up the beach it uproots the
seagrass and scoops up many of the associated organisms. Trawling has a similar effect
on seagrass beds, but in the deeper offshore areas.
Near cities, towns and other concentrations of human populations, excessive movement
of boats and people leads to direct damage of the seagrass beds, particularly in fish
landing sites. Besides direct damage, sedimentation also occurs which is has negative
impacts on seagrasses by blocking of light and interfering with gaseous exchange on the
surfaces of the leaves.
Another human activity which does not have a direct effect on the seagrass itself, but
which affects the integrity of seagrass bed ecosystems is the collection of shellfish which
leads to loss in biodiversity of these habitats.
As with other marine habitats, pollution causes impacts on seagrass beds, particularly
those situated near Dar es Salaam, Tanga and Zanzibar town as well as smaller urban
centers.
58
Seychelles
The modification and loss of habitat poses a great threat to Seychelles biodiversity. In
addition to ecosystem modification directly associated with development related
activities (construction, reclamation, clearing of forests, filling of marshes / mangroves,
etc.), ecosystem modification associated with invasive species is also an important issue.
The relative importance of these issues is illustrated in the following charts, which
estimate the relative importance of the major threats to Seychelles endemic plants,
terrestrial vertebrates and terrestrial invertebrates, respectively.
The coastal areas of the main granitic islands have already undergone extensive
modification, particularly on the coastal plateaus, as a result of human settlement and
development. At the time of first settlement in the late eighteenth century the shores
were fringed with indigenous coconut palms and other plants brought by ocean currents.
Endemic flora is little in evidence, except for occurrences of Vakwa Bord-d-Mer
(Pnadanus balfourii) and Bwa kaful trwa fey (Allocphylus sechellensis).
Over time, the removal of sand and construction has greatly modified the beach
landscape. The same processes have altered the lowland and coastal plains, which were
formerly dominated by species such as Terminalia catappa (Badamier), Casuarina
equisetifolia (Sed), Intsia bijuga (Gayak), Heritiera littoralis (Bwa-d-tab), Calophyllum
inophyllum (Takamaka), Minusops sechellarum (Bwa-d-Nat) and Cordia subcordata
(Porse).
The lowland forests at one time extended up to 200-300 metres up the mountainsides, but
following settlement nearly all the coastal and lowland forests on the granitic islands
were developed for agriculture and cleared for settlement. The greatest remaining
abundance of endemic flora lies at the higher elevations, in the intermediate forests and
mountain mist forests, as well as on granite rock outcrops known as glacis (Inselbergs).
In the last 25 years the modification and loss of coastal ecosystems on the main granitic
islands has accelerated as a result of rapid social and economic development. This is
clearly evident in each of the three prioritized hot spots (the Coastal Plateau of La Digue,
the East Coast of Mahe and Anse Volbert, Praslin), all of which are situated on the
coastal plateaus (one on each of the three main islands), where considerable development
has taken place since independence in 1976.
On the Coastal Plateau of La Digue modification of habitat has occurred primarily as a
result of landŁuse conversion for house construction and tourism development. Other
contributing factors are pollution (to a limited extent) from domestic and tourism
establishments and changes in sand deposition caused by jetty development. Loss of
habitat has occurred mainly as a result of land-use conversion (housing and tourism
development), which affects woodland and sandy foreshore habitats.
In the case of the three prioritized sensitive areas, two are located on the main island of
Mahe (Port Launay and Baie Ternay Marine Parks and adjacent areas, and the Mahe
59
Wetlands) and are subject to similar impacts from social and economic development. In
the case of Cosmoledo Atoll, impacts are different due to the lack of human settlement.
In Cosmoledo, the main impacts are related to the exploitation of fisheries and other
resources (i.e. illegal fishing and poaching of birds and turtles).
V.4 Overall Water Quality Decline: Degradation Of Coastal Waters, Beaches and
Living Resources from Land Based Activities
a. Status of the problem/issue
The majority of coastal degradation in the region is derived from land-based activities
associated with urban and industrial centers and from a cultural practices. Pollution
derived from the marine sector, particularly from tanker spills and discharges, is
important as well. Major sources of pollution in urban and industrial areas include
sewage, industrial processing wastes, and urban run-off. According to UNEP/IMS,
UDSM/FAO/SIDA, (1998), the issues of greatest concern as far as coastal pollution is
concerned are:
- The microbial contamination of groundwater resources by coastal pollution
resulting from on-site disposal systems or poorly development/maintained
sewerage infrastructures. The majority of the population in the region particularly
in Kenya, Tanzania, Mozambique, Madagascar and Comoros, use septic tanks and
pit latrines. According to Mwaguni and Munga, (1997), analyses of water samples
from wells and boreholes indicate that microbial contamination (total and feacal
coliform) of Groundwater in Mombasa. Kenya. Only 3 of the 23 wells samples
passed drinking water standards. Studies in the Maputo Bay, Mozambique have
revealed that feacal coliforms, feacal streptococci and Escherichia coli were
detected in marine water and shellfish tissues. Pathogens causing severe
gastrointestinal illness were also isolated from clams collected in different parts of
the Bay (Fernandes and Hauengue, 1997).
- Degradation of water quality due to the release of untreated sewage, industrial
waste and agrochemicals into coastal and marine environment. Eutrophication
associated with the release of inorganic nutrients (phosphate, nitrate and
ammonia) into coastal waters from domestic sewage around Zanzibar has been
identified as one of the main cause of the decreased cover of coral reef building
algae (Bjork et al., 1995).
- Destruction of coastal habitats through inadequate disposal of domestic wastes.
Solid domestic wastes such as organic wastes, paper and plastics is collected in
some of the larger coastal towns, but the majority is not disposed of in dumps and
represents a hazard to public health when it accumulates in coastal areas. In
Mombasa, Kenya only 53% of the 103,000 tons of annual solid waste production
is collected. The dumping of domestic waste on mangrove forests around Makupa
Creek and in Lamu has been reported (Linden and Lundin, 1997). Also in
Zanzibar, domestic solid wastes is being dumped on Maruhubi mangroves
60
(Dorsch Consult and Ministry of Water, Construction, Energy, Lands, and
Environment, 1992).
b. Transboundary
elements
- Contaminated beaches, coastal waters and seafood affect human health
- Loss of recreational areas
- Loss of regional tourism revenue
- High cost of mitigation
c. Environmental
impacts
- Deterioration of water quality
- Increase of waterborne diseases
- Increase of mortality in marine organisms
- Eutrophication
- Changes in algae community structure
- Loss of biodiversity degradation of genetic diversity
- Depletion of fish stocks and species diversity
- Damage to coral reefs and seagrass beds
- Changes in coastal ecosystems
- Degradation of coastal landscape
d. Socio-economic
impacts
Domestic sewage and garbage in coastal urban centers and diffuse sources of agricultural
pollution represent significant threats to the quality of drinking water, in both short and
long term, for surface and ground water respectively. Health problems are often
associated with limited treatment of sewage in areas of poorly developed sewerage
infrastructures, particularly where local populations relay on groundwater as a source of
potable water.
The perception of a pristine environment and unpolluted water along the beaches is
crucial in maintaining ecosystem health and ensuring the continued success of beach
hotels in attracting tourists, and the associated income. The importance of coastal tourism
throughout the WIO region is highlighted by Kenya where 60-70% of national tourism is
coastal and islands states of Comoros, Mauritius and Seychelles where it accounts for all
tourism.
- Increased risk to human health
- Increased costs for medical treatment
- Loss of market seafood
- Reduce income from fisheries
- Changes in employment
- Loss of recreational value
- Low availability of potable water
- Loss of cultural heritage
- Population
migration
61
Risk to humans through use of contaminated water and seafood is a concern in Tanzania.
As a consequence, waterborne diseases such as cholera, dysentery, gastro enteritis and
diarrhea are prevalent in Zanzibar and Dar es Salaam.
The available information indicates the number of incidences of diseases typically
attributed mainly to poor water quality, which accounts for most of the incidences of
disease in Dar es Salaam (Table 27).
Table 27.
Average cases of disease per year for the period 1993-1997 for Dar es
Salaam
Diseases
No of cases
Malaria
326,000 (55%)
Diarrhea
125,000 (21%)
Skin infections
132,000 (22%)
Dysentery 5,200
(<1.0%)
Cholera 1,500
(<1.0%)
Typhoid 400
(<1.0%)
Total
590,100 (100%)
Tables 28 and 29 are continued on the next page.
62
Table 28.
For Tanzania, disease incidence per 100,000 population
District Water-borne
Diseases
Water-based
Penetrating
Water-washed
Total
Skin
Diseases
Cholera
Diarrhea
Dysentry
Typhoid
Worm
Schistomiasis Skin
Eye
Infection
Diseases
Diseases
Mtwara 7
6,696
99
697
17,295
Tanga 12
13,377
1,190
7
3,488
112
4,541
4,089
23,910
Mtwara 67
2,355
81
226
2,729
Pangani 77
333
18
1,694
4,467
6,843
13,432
Lindi 544
47,450
732
18
403
136
292
1,806
83,022
Bagamo/Kisarawe
28
Dar 61
1,370
72
1
1
1,757,124
8,301,406
7,633
176,912,034
Source: Institute of Marine Science, Zanzibar
Table 29.
Number of cases of waterborne diseases reported in coastal provinces of Mozambique
Province 1994
1995
1996
Diarrhea Cholera Dysent Diarrhea Dysent Diarrhea Dysent
Maputo 61,750 36
19,424 50,258 9,264 50,572 7,971
Gaza
16,909
8,854 14,463 2,661 16,966 2,188
Inhambane
8,509
2,118 8,904 1,496 13,966 1,802
Sofala 27,405 440
3,816 38,368 5,158 35,883 6,508
Zambezia 46,759 1
10,287 36,319 4,982 46,197 7,874
Nampula 40,249 12
6,311 29,851 4,940 20,523 3,475
C.Delgado
17,884 212
9,311 10,901 3,239 17,479 4,298
63
e. Causal chain analysis
Figure 7. Causal Chain Analysis: Overall water quality decline/contamination
Causal Chain Analysis
MPPI -4
Overall water quality decline/contamination
Pollution of river and coastal waters
Land based activities
and sources
Industrial
Agriculture
Domestic
Lack of waste treatment
Use of agro-chemicals
facilities
Lack of waste treatment
Waste disposal directly in
facilities
rivers and streams
Lack of
investments
Lack of
Lack of education
enforcement
Poor ICZM
practies
Lack of legal and
regulatory
Lack of legislation
Lack of investments
basis
Inadequate control
of land use
Institutional weekness
Institutional weakness
Overall poor
economic
Inadequate legal
conditions
regulatory basis and
enforcement
64
f. Sectors and Stakeholders
Stakeholders ranking this issue as one of high priority include public healthcare
providers, multinational corporations, regional and municipal governments, and
fishermen. The major governmental players include Agriculture/fisheries Ministries,
municipal and regional governments, Environmental Ministries, and State industries.
Affected stakeholders include coastal residents, NGOs, public health care providers,
Agricultural and Fisheries Ministries, and Multinational Corporations. Environmental
Ministries are also affected stakeholders, though not to the extent of the above
stakeholders.
g. Supporting
Data
1. Sewage and Domestic Wastes
According to UNEP/GPA (2000), the impacts of municipal wastewater are observed
at three different levels:
Ę Impacts on the living environment. Domestic wastewater is generated by
population activity in a neighborhood of houses, shops, small factories, etc.
Sewage accumulation in settlements poses a serious health risk to the population
leading to the spread of diseases, mortality, morbidity, increased public and
private medical costs and loss of labor force productivity.
Ę Impacts on rivers near cities. Cities and towns without access to on-site or off-
site sewage disposal infrastructure opt to channel sewage into rivers and lakes to
dilute the waste and carry it outside the immediate living environment and often
away from the area of responsibility of the local municipal authorities. The
degradation of river water quality essentially degrades valuable water resources
on which several neighboring and downstream communities draw their water for
domestic and agricultural use.
Ę Impacts on the marine environment. The coastal and marine environment,
being the ultimate recipient of all wastes, is a development resource for tourism,
fisheries and recreation. The effects of degradation undermine income
opportunities and food supply, but the extent of the impacts is often under-
estimated when the full damage is not cost-estimated.
Rapid population growth in the countries in the region and particularly in the coastal
areas have lead to rapid changes in land-use patterns. Natural ecosystems are being
destroyed or replaced by agricultural crops. The large population is also putting
pressure on the marine and coastal resources. Lack of infrastructure and treatment
facilities for the large quantities of domestic sewage generated by expanding coastal
urban populations, and an increasing number of visiting tourists, represents the
greatest threat to public health, coastal habitats and economic development in each
State of the region. Faecal-coliform contamination of surface and ground water
resulting from on-site disposal of domestic waste (septic tanks and pit latrines) has
been reported in wells and bore-holes in Maputo and Mombasa. High faecal coliform
65
and bacteria counts have been reported in Influene River in Mozambique, Faecal
coliform have also been observed in Maputo Bay, both in marine waters and shellfish
tissues.
The concentrations at the bay have been increasing over the years. Consequently,
some areas of the bay are not safe for swimming. Furthermore, the levels of in
ground waters around Maputo are positively correlated with distance to latrines, depth
of the wells and population density. Some bore-holes are contaminated by biological
pollutants. Although monitoring data are not available, there is a perceived link
between domestic sewage and the occurrence of gastro-enteritis in the Comoros and
Zanzibar State of The United Republic of Tanzania. There is an urgent need for
monitoring of microbial contamination of ground waters in coastal areas of all States
of the region to assess the scale of the problem. As was the case for industrial
effluents, the importance of the organic (BOD) load to coastal waters from domestic
sewage cannot be assessed more completely without detailed data concerning the
residence times and mixing rates in coastal areas.
Degradation of coastal habitats caused by the dumping of domestic and industrial
waste in coastal areas, and its transport via near-shore waters, represents a serious
threat to the ecological health, biological diversity of coastal habitats and, in the long
term, the economic prosperity of commercial and artisanal fishing. Domestic waste
also represents a hazard to public health when it is allowed to accumulate in urban
areas. The release of untreated domestic sewage has been associated with the
occurrence of eutrophication in near-shore coastal waters, phytoplankton blooms and
the subsequent degradation of coastal habitats and reduced fish catches. However, it
is not possible to assess the scale of the problem without adequate monitoring data
and detailed scientific research.
Mozambique
Faecal coliform content in the water within the channel adjacent to the Infulene River
in Maputo is higher (4.6 x 10⁵ bacteria counts/100 ml). In the river mouth exceeds
2400 bacteria counts/100 ml. Faecal coliform, faecal streptococci and E. coli were
also detected in both marine waters and shellfish tissues in other places within the
Maputo Bay. The concentrations found in the shellfish were extremely higher.
Bacteria Vibrio parahaemolyticus and Vibrio mimicus were found in clams in the
Incomati river mouth, in the bay adjacent to Polana and near Matola in the Maputo
Estuary. Vibrio sp. are the main cause of severe gastro-intestinal illnesses
(Fernandes, 1996). The water in some places in Maputo Bay, particularly where the
discharge of sewage take place, such as Miramar at the entrance of the Maputo
Estuary, is not safe for swimming. High values of biological pollution have also been
recorded at the Beira Bay and Nacala Bay, although in lower concentrations
compared with the observed in Maputo Bay (Fernandes, 1995).
66
There is only one sewage water treatment plant in the country, located in Maputo city,
in the Infulene River mouth. The plant treats only about 50% of the Maputo's
sewage. The treatment plant consists of a series of anaerobic and facultative tanks,
which are designed to treat organic matter (Buuren and Heide,1995).
The use of pit latrines in high-density peri-urban areas has been shown to cause high
levels of nitrate in shallow ground water. The average concentration of NO3 in wells
around Maputo is about 100 mg l-1, compared with 50 mg l-1, the upper safe limit set
by WHO. Higher concentrations were recorded in the shallow wells located near the
latrines, and they decrease with the depth and with the distance away from the
latrines. Maximum value recorded was about 500 mg l-1.
Table 30.
Concentration of nitrates (NO3) in wells around Maputo with time
(Casadei et al., 1985).
Year Number
of
% of samples with
samples
0-50 mg l-1 51-100 mg l-1 >100 mg l-1
1982 14 92.9 7.0 7.1
1983 31 61.3 12.9 25.8
1984 19 47.4 21.0 31.6
1985 130 36.9 21.6 41.5
Table 31.
Concentration of nitrates (NO3) with distance from latrines around
Maputo (Casadei et al., 1985)
Distance from latrine (m)
Number of wells sampled
Average levels of NO3 (mg
l-1)
1-10 38 108.9
11-20 28
121.6
21-30 21
60.9
>30 21 62.2
Table 32.
Concentration of nitrates (NO3) in wells around Maputo (Casadei et al.,
1985)
Depth (m)
Number
of Average level % of samples with
wells sampled
NO3 (mg l-1)
>50 mg l-1 >100 mg l-1
1-6 25 98.1
64 44
6-15
90 89.4
67 43
>15 6 79.7 50 33
Deeper aquifers also show higher concentrations of nitrate. More than 20% of the
locations sampled by National Laboratory for Food and Water in boreholes and wells
around Maputo and Matola cities had concentrations about 50 mg l-1 (Table 33).
67
Table 33.
Concentration of nitrates (NO3) in borehole waters around Maputo and
Matola cities (LNHAA, unpublished)
Year Number
of
% of samples with
samples
<50 mg l-1 50-100 mg l-1 >50 mg l-1 >100 mg l-1
1992
255 91.4 3.1 8.6 5.5
1994 276 77.5 18.8 22.5 3.6
1995 428 76.2 9.6 23.8 14.3
1996 334 76.6 12.9 23.3 10.5
1997 329 76.6 14.3 23.4 9.7
There is no record of the content of nitrates in the ground water in other urban
centers, but it is believed that the city of Beira and perhaps also of Quelimane would
present a similar situation or close to that of Maputo.
The drop in the water quality due to biological pollution is the main cause responsible
for the most frequent waterborne diseases observed in Mozambique. Table 29
presents some statistics of the cases of these diseases reported in the years 1994 to
1996. In the beginning of this year (1998) there was an epidemic of cholera that
affected about 8,000 people. More than 50% of the cases were observed in Maputo
City.
High levels of BOD and COD, and low content of dissolved oxygen have been
detected in the Infulene River, downstream of the factories. The presence of water
hyacinth and Pistia is a clear evidence of nutrient-rich water (Lambrechts, 1997).
The main reason for higher nutrient content in this region is probably the fact that the
Infulene River receives industrial waste from different industries (see below). There
are no data available for other cities; however, there is an indication that the situation
in the city of Beira would be next to that of Maputo.
Kenya
Increasing pollution from domestic sewage and solid waste is the most severe
pollution challenge in coastal Kenya. About 60% of the population in Mombasa uses
pit latrines, while the rest uses septic tanks and soak pits for sewage and waste water
disposal. The Mombasa municipality has separate systems for domestic sewage and
storm water drainage. The domestic sewerage system serves about 15% of the
population. Sludge from septic tanks and pit latrines is mainly dumped at the
Kibarani landfill site and other mangrove areas. In other coastal urban centres, the
use of pit latrines predominates, with only about 20% of the urban areas being served
by septic tanks and soak pits. As most people rely on pit latrines and septic tank
soakage pit systems for waste disposal, the pollution occurs underground, where it
contaminates ground-water sources. Thus water-borne diseases, including cholera,
dysentery, schistosomiasis, infectious hepatitis, typhoid and malaria have become
important in coastal towns, resulting in significant loss of human productivity.
68
The problem of inadequate/inefficient domestic and municipal solid waste disposal in
Mombasa and the surrounding urban centres is on the increase. For example, in
1992, 61% of refuse generated in Mombasa was collected. Four years later in 1996,
only 53% of the refuse was collected by the municipal machinery. The Mombasa
municipality is the largest producer of solid waste. The waste is dumped at the
Kibarani landfill. It is estimated that 54,750 tons of refuse are dumped here annually.
There are at present no services for collecting and disposing solid waste in coastal
Kenya's urban population centres. Beach hotels and other commercial establishments
make private arrangements for solid waste disposal. Solid wastes, often including
particulate and other non-biodegradable matter that threatens marine life, are carried
by storm-water into marine waters. Improperly disposed of solid waste also litters the
coastal environment and degrades its aesthetic value.
Domestic sewage and storm-water runoff in Mombasa were reported to account for
18 per cent (4,588 tons per year) and 37 per cent (12,802 tons per year) of the total
BOD and suspended solid loads, respectively. Currently, no sewage-treatment
facilities are operational in Mombasa (Mwaguni and Munga 1997) resulting in the
release of untreated domestic sewage and microbial contamination of waters in
Kilindini, Port Reitz and Tudor Creek. Analyses of water samples from wells and
bore-holes indicate that microbial contamination (total and faecal coliform) of
groundwater has occurred in the Mombasa district. Only 3 of the 23 wells sampled
passed drinking water standards, while none of the 11 bore-hole water samples was
classified as potable (data cited in Mwaguni and Munga 1997). Although municipal
solid waste is dumped at the Kibarani dumpsite (Makupa Creek), only 53 per cent of
the 103,000 tones of annual solid waste production in Mombasa is collected. The
dumping of domestic waste on mangrove shores has been reported around Makupa
Creek (Linden and Lundin 1997) and Lamu.
Waste from Beach Hotels Tourism, currently the top foreign exchange earner for the
country, has stimulated activities in other sectors of the Kenyan economy, such as
agriculture and manufacturing. Coastal tourism accounts for 60-70% of the national
tourism industry. Indeed, some of the large coastal urban centres, e.g. Malindi,
Watamu and Diani owe their economic development to tourism. The total number of
beds in the beach hotels in 1996 in Mombasa was estimated at 7600, with an
estimated occupancy of 70% (GoK Hotels and Restaurant Authority 1996). The
contribution of waste from the beach hotels in Mombasa to marine pollution was
estimated to be 100, 85.4, 17.5 and 21.1 tons/year BOD, SS, N and P respectively.
The corresponding BOD, SS, N and P loads for Kwale district (Diani beach area),
with 5350 hotel beds, are respectively, 70.3, 6.1, 12.3 and 1.5 tons/year. Those for
Kilift district were: 76.0, 91.0, 19.0 and 2.0 tons per year. The 60-odd hotels in Lamu
(with 1000 beds) produce an estimated 3.8, 3.2, 0.7 and 0.1 tons/year BOD, SS, N
and P respectively. Two beach hotels, one in Diani and the other in Barnburi, have
recently equipped themselves with biological treatment systems for their sewage.
69
Table 34.
Summary of pollution loads from Mombasa District (Kenya)
Source
B O D
S S
Oil
N
P
Heavy Others
Metals
tn/y
%
tn/y % tn/y %
tn/y % tn/y %
tn/y tn/y
contr#
contr
contr
contr
contr
Domestic 4369 18.0 3964 10 -
622 41.9 94 19
Sewage
Beach
100 0.4 85 0.2 - 18 1.2 2 0.4
hotels
Storm
522 2.2 4447 11.3 -
166 11.2 11 2.3
water
Solid
1846
7.6 - - - - - - -
waste
Industrial 16249 67
21837 55.2 103 100 45 3.0 6 1.3 Cr
Phenol
waste
0.25
0.01
Cu
S:0.12
0.001
Fe 2.9
Ni
0.005
Zn
0.11
Ship
14 0.1 11 0.0
- - 2 0.1
0.2
0.0
waste*
Livestock 1161 4.8 9180 23.2 - -
630 42.5 364 76.3
waste
Totals
24233 100 39524 100 103 100 1483 100 477 100 Cr
Phenol
0.25
0.01
Cu
S:0.1
0.001
Fe 2.9
Ni
0.005
Zn
0.11
# % contribution
* estimated domestic waste
Mauritius
In contrast to the other states of the region, high population densities are not confined
to the large urban centres on Mauritius (Port Louis and Plaines Wilhems), but occur
in rural areas where 55.5 per cent of the total population resides according to the 1990
census. The two large urban centres have sewerage systems, although the system in
Plaines Wilhems constructed in 1960 is inadequate to deal with peak flows during
heavy rainfall, resulting in frequent discharges of raw sewage to surface
70
watercourses. The remainder of the population generally use pit latrines, soakage pits
or septic tanks. No data were available in the national report concerning the
microbial contamination of ground water by domestic sewage. A risk assessment
based on a 20-year period indicated that unacceptable pollution would only result in
four areas following the failure of on-site sanitation systems. However, there remains
a need for monitoring of contamination of ground waters from on-site disposal
systems. The release of domestic sewage to coastal waters from urban areas and
poorly planned housing developments on reclaimed wetlands is recognized as a cause
of eutrophication resulting in growth of algae and the choking of coral. Algal blooms
are observed annually at Trou aux Biches, and isolated cases have been reported at
the sewer outfall at Bain des Dames near Port Louis.
- Northern
Mauritius
Northern Mauritius encompasses the districts of Pamplemousses and RiviĶre du
Rempart, in which nearly 32% of the total rural population resides. The main
population centres in the two districts include: Long Mountain, Pamplemousses,
Plaines des Papayes, Triolet, Grand Baie, Petit Raffray, Grand Gaube, Goodlands,
Riviere du Rempart, Belle Vue Maurel and Roches Noires. Within the major towns
in northern Mauritius, only around 48% of the population has access to a flush toilet
connected to a septic tank or absorption pit; 52% use pit latrines, with only 8% of the
population having a water seal pit latrine. In the northern part of Mauritius which is
relatively dry, there is conflicting demand for water for agriculture and domestic use.
Lack of storage reservoirs in the area as well as an ageing and leaking water supply
network means that the little water available is not being efficiently exploited. There
have been major hotel developments in the Northern Tourist Zone which comprises
the coastal stretches from Balaclava to Grand Gaube. As a result of these
developments, pollution problems are evident in the lagoons.
- Southern
Mauritius
The districts of Grand Port and Savanne comprise southern Mauritius, in which
nearly 28% of the country's total rural population resides. The main population
centres within southern Mauritius, including the towns of Mahebourg, Chemin
Grenier, Rose Belle, Plaine Magnience, RiviĶre des Anguilles, Surinam and New
Grove, accommodate over 50% of the total population of the two districts. Nearly
49% of the total population of Southern Mauritius uses pit latrines. An equivalent
proportion of people do not have piped water supply in their homes. Despite being
the most densely populated region of Mauritius, with 10,382 persons per square
kilometre, Mahebourg is not served by a waterborne sewerage system and about 33%
of its population still uses dry pit latrines.
- Eastern
Mauritius
The districts of Moka and Flacq make up eastern Mauritius. The main population
centres within the region together accommodate 40% of the total population in six
71
districts: Bon Accueil, Bel Air, Central Flacq, St Pierre, Quartier Militaire and Moka.
The region comprises mostly agricultural land, most of which is under sugarcane
cultivation. Besides agriculture there has also been some industrial development in
the area. The MEDIA Industrial Estates are to be found at Central Flacq, Bel Air and
Quartier Militaire. Two textile dye-houses are also located within this region:
Coloutex Dyers near Moka and Tinturia da Ponte near Quartier Militaire. Tourist
hotels have recently been developed along the eastern coast, particularly along the
stretch extending from Belle Mare to Trou d'Eau Douce. Presently, only 46% of the
population of eastern Mauritius has access to a flush toilet connected to a septic tank
or absorption pit. The rest of the people use pit latrines. Only 40% of the people in
this region have piped water inside their houses and a further 42% have water
supplied outside the houses but on their premises. There are as yet no major pollution
problems evidenced in the area. However, the extensive coastal development that is
underway along the stretch from Poste de Flacq to Trou d'Eau Douce may emerge as
a future source of environmental pollution. The on-site waste water disposal facilities
in Centre de Flacq, the most important and rapidly developing town, are inadequate.
The existing housing estates in Centre de Flacq also have serious problems with
sewage disposal, which poses a hazard to public health.
- Western Mauritius
The Black River district of western Mauritius is the driest and most sparsely
populated part of the country, with only 8% of the total rural population residing
there. The main population centres in this district are Petite Riviere, Bambous, Gros
Caillou, Case Noyale - La Gaulette, Tamarin, Grand Riviere Noire, and Flic-en-Flac.
The main activity in the area is fishing. Some agriculture occurs in the northern part,
and industrial activity is confined to the MEDICA estate located at Bambous. Coastal
tourism is an important sector, thanks to the beaches found from Flic-en-Flac to Le
Morne. This South Tourist Zone, as it has come to be known, has already undergone
major hotel developments. Presently, approximately 44% of the population within
western Mauritius has access to a flush toilet connected to an absorption pit or septic
tank. Nearly 55% of the population uses pit latrines. The western district is presently
fed by the Mare aux Vacoas Water Supply System, supplemented by the numerous
boreholes in the area. Because only 32% of the population within this area has piped
water supply, the provision of a water-driven sewerage system cannot be envisaged in
the short term. Furthermore, major improvements to the present supply system are
required. The National Housing Development Company plans to construct some
1700 housing units on 21 ha. of land at Bambous, which at present has a population
approaching 8000. The intention is to create a satellite town here, having a density of
80 houses per hectare with a borehole water supply. It will be important to provide
adequate wastewater facilities, lest the underground aquifer be contaminated. In
recent years, extensive coastal development has taken place at Flic-en-Flac. Eight
major hotels are now located in the area and offer more than 1000 tourist beds per
night. A number of restaurants have also opened in the past few years. The existence
of extensive areas of barren land in the vicinity of the coast has prompted major
residential developments. As a result of such development there are already signs of
72
pollution and degradation of the local environment. There exists the risk of pollution
of the lagoons and fringing coral reefs from seepage of wastewater from local on-site
disposal systems into the sea. Major residential developments have also taken place
within the last decade at Albion, because of its proximity and easy access to Port
Louis.
As has already been pointed out, most of the population of Mauritius relies on on-site
facilities for the waste disposal. The problem areas identified in an earlier study were
revisited for a more rigorous assessment. It was found that: The most common form
of on-site sanitation system in rural Mauritius was the pit latrine with separate soak
region: pits for disposal of sullage. In almost all cases the existing disposal system
was working satisfactorily irrespective of water use, population or housing density.
Cases of failure could be attributed to poor operation and maintenance or to the
system having reached the end of its working life, rather than the inappropriateness of
the system itself. Most of the systems investigated here were aged 10-20 years. In
most cases replacing the pits is all that was necessary revive the disposal system. The
efficiency of the system was not related to the soil conditions. Soil profiles in the
areas studied were, tank mostly thin and either contained or overlaid rocks, boulders
or cobbles. This indicates that the movement of wastes from the pits is
predominantly through fissures rather than through the soil matrix. Water
consumption also appeared to have no effect on sanitation effectiveness. This is
because most people dispose of their sullage in soak pits rather then in toilet pits.
Sanitation effectiveness was not related to the type of flushing unit. However,
households with a simple pour pan used about 4 litres of water whereas those with a
cistern used 20 litres per flushing. Apart from in some areas in the estates, only a few
complaints were recorded from residents about existing latrines causing a nuisance.
Seychelles
Hotels, which are mainly concentrated along the coast, have also been a major source
of water pollution. A survey in 1990 revealed evidence of organic contamination of
coastal waters and deterioration of coral reefs, which was attributed mainly to sewage
effluent from hotels.
Municipal Waste Mixed solid waste (MSW), including residential, commercial area
and workshops waste from five different areas including the greater Victoria was
analyzed. The following thirteen categories of waste were found: 1. Fruit and
vegetable waste; 2. Paper (newspapers, cardboard, stationery and books); 3. Soft
plastics (folies, paper bags made from Polythene, polyvinyl chloride (PVC), and
polypropylene (PP); 4. Hard plastics (bottles, and cups made from polystyrene, PVC,
PP and High density Polythene (HDPE); 5. Glass (clear, green and brown); 6. Iron,
steel and aluminum (cans, bottle tops, nails and vehicle spare parts); 7. Other metal
(including electronic scrap from radios, electrical household articles and wire); 8.
Compound products (packaging made from plastic and metal, and disposable
diapers); 9. Batteries (dry cells and rechargeable batteries); 10. Paint, solvents, acids,
pesticides, oil, chemical and pharmaceutical products); Textiles; 12. Wood, rubber,
73
bones, stones, ceramics, leather; 13. Inorganic material such as sand and gravel. The
study revealed that Seychelles' municipal waste has a relatively high proportion of
packaging material, mainly plastics (9.2%), glass (7.2%), metal (7.8%) and
disposable diapers (6.1%). There is currently in Mahe very little reuse or recycling of
waste products such as cans and bottles, which aggravates the pollution problem in
the country. Recyclable material in Seychelles is not collected, either to provide raw
material for the recycling industry or for direct re-use, as happens in some countries.
Tanzania
The coastal waters off major towns and cities such as Dar es Salaam, Tanga, Mtwara
and Zanzibar are recipients of untreated municipal and industrial wastes.
Measurements of pollution loads and pollutants (coliform bacteria, BOD, COD,
heavy metals, suspended solids and inorganic nutrients) both in the marine
environment have shown high concentrations in these areas.
Various studies conducted in the region have shown that untreated municipal sewage
has caused eutrophication of coastal waters and destruction of important habitats such
as coral reefs. For example, eutrophication that is associated with the release of
inorganic nutrients into coastal waters from domestic sewage around Zanzibar has
been identified as the possible cause of the decreased cover of coral reef-building
algae. Furthermore, it has been shown that calcified algae are sensitive to phosphate
and they disappear from phosphate-rich areas.
According to a number of studies, there appears to be a significant increase in the
levels of pollution along the coastal waters of Tanzania and Zanzibar Island during
the past few years. A baseline study on heavy metal contents in seaweeds that were
collected from different parts of Zanzibar and Dar es Salaam, close and away from
the source of waste effluents, found that in some algal species the heavy metal
contents have increased tenfold since 1989. High levels of nitrates, ammonium and
phosphate on coralline algae have been observed in areas close to the sources of
waste effluents from Zanzibar town. Furthermore, significant levels of aluminum and
cadmium have been observed in the macroalgae collected from Chapwani and
Changuu islands off Zanzibar.
Dar es Salaam has a total of nine waste stabilisation ponds (WSP). The Vingunguti,
Ubungo/Mabibo, and Msasani/Mikocheni ponds serve the four major industrial areas,
namely Ubungo, Pugu Road 1, Pugu Road 2 and Changombe. However, the WSP are
sometimes out of order or are operated inefficiently and do not achieve their intended
purpose. Part of Pugu Road industrial area and all of the Chang'ombe industrial area
are not sewered. The liquid wastes from unsewered industrial areas are either
discharged untreated directly through one of the nearby major drainage streams or
into on-site septic tanks.
Of Dar es Salaam's 2.3 million inhabitants, 13% are served by a central sewerage
system, 11% use septic tanks and 76% use pit latrines. Most of the central business
74
district of Dar es Salaam city is sewered. However, from the screen- house, this
sewage is discharged untreated to the Indian Ocean. The sludge from the septic tanks
is periodically removed using cesspit emptiers or vacuum trucks, which in turn empty
their contents either into the Vingunguti ponds or into a screen-house where the
contents discharge into the Indian Ocean untreated through a 1-km sewer sea outfall
located at Msimbazi Creek. In Tanga the central sewerage system, serving 13% of
the population in Tanga, discharges untreated into the Indian Ocean, at a point
slightly north of Ras Kazone. Untreated sewage discharges directly into the sea spills
over the intertidal area, contaminating habitats where fish, molluscs and crustaceans
are collected for human consumption. Overflow of soak-away pits and septic tanks,
particularly during the rainy season, impacts directly on public health. Water-borne
diseases such as cholera, schistomiasis, and filariasis are some of those associated
with untreated sewage discharges.
Likewise, it has been reported that there is a proliferation of macroalgae in Tanga
coastal waters due to excess nutrient loadings from discharges from a fertilizer
factory and from the municipality (Munissi, 1999). Coastal pollution in Tanga is also
caused by discharge of effluents from sisal decorticating plants in the area. Up to
twenty plants discharge their wastes onto the coast via the Pangani, Sigi,
Mruazi/Mnyuzi and Mkurumzi Rivers (Shilungushela, 1993).
Table 35.
Pollution Load to Surface Water Resources (Kg/Day) in Dar es Salaam
Type Industrial
Pit Latrines
Septic Tanks Without
Total
Effluent
Facilities
BOD
28,330 15,282 3,275 9,897 56,784
COD
29,904 16,131 3,457 10,447 49,776
Suspended
47,216 25,470 5,458 16,495 78,429
solids
Dissolved
83,940 45,280 9,830 29,325 138,923
solids
Total
N
4,145 2,236 479 1,448 6,859
Total
P
787 425 91 275
1,302
Domestic sewage in Dar es Salaam produces pollutants with an annual BOD of
11,681 tons, 12,641 tons of suspended solids (SS), 2,222 tons of oil and 3,320 tons of
phosphorous compounds (P). Approximately 150 kg of non-hazardous domestic
refuse per capita are generated in Tanga municipality, giving a total of 53,588 tons of
domestic refuse generated annually. Only 31% of this waste is collected by the
municipality, with the remaining 69% being dumped on site in pits.
Tanzania-Zanzibar
Domestic waste continues to be the main source of pollution to coastal waters in
Zanzibar. The problem of coastal pollution is compounded by two factors: the ever-
increasing population of the coastal towns, especially in Zanzibar Town and the
inadequate sewerage system, which dates back to the 1920s. People served by this
75
system are connected to septic tanks that empty into a combined sewerage-storm
water system. This system discharges untreated waste into the sea by means of a
series of short out-falls. Many of these out-fall pipes remain in a dilapidated state.
Untreated waste pollutes the waters fronting Zanzibar Town area. The remainder of
the population, including that from surrounding and newly built areas, is served
entirely by pit latrines and soak pits.
The antiquated sewerage system has been plagued by lack of maintenance such that
many of the discharge lines often embed silt to a depth of one meter or more. Illegal
dumping of garbage into the system has compounded the problem. Missing flap
valves at pumping stations often cause ingression of seawater at the stations during
high tides. As a result, severe flooding of storm water and wastewater occurs in some
areas of the Stone Town and some of the newer areas. However, the most affected is
the market area where flooding is a feature of every rainy season. In some areas, the
flood level reaches up to one meter above ground level. Because this is a combined
system, any backup cause faecal pollution in these areas. It is not surprising that
water-borne diseases such as malaria, gastroenteritis and filariasis are a major concern
of health authorities in Zanzibar.
A survey carried out in 1992 in which three sites in Zanzibar Town were sampled for
ten days showed that the per capita amount of solid waste generated by Zanzibar
townspeople is 182 kg (Dorsch Consult, 1993). A high percentage of the waste is
organic biodegradable material; over 80% of it is food waste, mainly vegetable and
fruit waste. The proportion of hazardous waste was very small, reflecting the low
industrial activity on the islands.
Waste collection in the municipality has for a long time been lower than 30 %.
(Dorsch Consult, 1993). The rest of the waste is burned, buried or illegally dumped
at different sites in the municipality, contributing significantly to environmental
pollution. The waste that is collected by the Zanzibar Municipal Council is dumped
at three official dumping sites. These are:
Saateni: The 7000 m2 site lies about 2.5 km north of the municipality, adjacent to a
mangrove forest. Leachate from this site runs directly into the forest and the coastal
waters. The site has been in use for a number of years and the filled-up areas are
currently used to grow vegetables.
Mikunguni: This site lies in an abandoned quarry located in a predominantly
residential area some 2.5 km outside the center of the municipality.
Mwanakwerekwe: Located about 6 km from the central town, this is the largest
dumping site on the municipality. It covers approximately 100,000 m2. However, the
area is not very suitable for dumping of waste as it is located close to a fast-growing
residential district. Part of the dumpsite is almost permanently burning and smog
pollutes the nearby residential areas. The water table on this site is very close to the
76
surface and the surrounding area is almost permanently waterlogged. Consequently,
it is very difficult to control leachates from this site.
Effects of excessive loading of nutrients on reefs, that include decrease in coralline
algal cover, increased community metabolism and gross production and general stress
on corals, have been reported in several studies. Eutrophication associated with the
release of inorganic nutrients (phosphate, nitrate and ammonia) into coastal waters
from domestic sewage around Zanzibar has been identified as one of the main causes
of the decreased cover of coral-reef-building algae (Bjork et al., 1995). Furthermore,
Bjork et al. (1996) showed that calcified algae are sensitive to phosphate and they
disappear from phosphate-rich areas.
Ferletta et al. (1996), who conducted a baseline study on heavy metal contents in
seaweeds collected from different parts of Zanzibar and Dar es Salaam close to and
away from the source of waste effluents, found that in some algal species the heavy
metal content had increased ten times since 1989. Significant levels of aluminum and
cadmium have been observed in the macroalgae collected from Chapwani and
Changuu Islands off Zanzibar (Engdahl et al., 1998).
In Zanzibar, high coliform levels in the waters fronting the historic Stone Town have
rendered these waters unfit for bathing (van Bruggen, 1990).
Munissi (2000) showed that, with increasing distance from the sewage pipe at Ocean
Road, dissolved oxygen increased significantly from 5.79 to 12.93 mg O2/l
(randomized block analysis of variance: F = 61.73, p << 0.0005), while BOD
decreased significantly from 4.4 to 1.88 mg O2/l (F = 4.60, 0.025 << p << 0.05). Ulva
spp. and Enteromorpha spp., used as bioindicators showed a marginally significant
difference at various distances from the sewage pipe (Friedman's test: X2r = 9.333, p
= 0.0533). Ulva was most abundant at the site closest to the sewage pipe, while
Enteromorpha was most abundant at the site second closest to the sewage pipe.
Comoros
There are no centralized systems for the collection and treatment of domestic sewage
and solid waste in the Comoros, which are considered to cause pollution of the water
environment. The majority of the population use septic tanks or soakage pits (79 per
cent), and the remainder pit latrines. Domestic sewage represents the majority of the
BOD (3,248 tons per annum) and TSS load (7,533 tons per annum). The total BOD
load of domestic sewage from hotels is small by comparison (2.23 tons per annum).
Organic pollution from domestic sewage represents a significant threat to marine,
fresh and ground-water resources. The occurrence of eutrophication at Trou du
Prophete (Grand Comoros) has been attributed to domestic waste pollution. Faecal
contamination of waters in the Comoros include drinking water on Anjouan and
Moheli and ground water on Grand Comoros. Solid-waste litter from domestic
sources consists of organic waste (57 per cent), paper cartons (3.5 per cent), plastics
(3 per cent), metals and textiles. It represents a serious threat to public health through
77
the proliferation of flies, bacteria and pathogens. Rainwater infiltrating through such
littered waste is reported to lead to the contamination of ground water with serious
implications for public health.
Madagascar
Few of the larger coastal towns in Madagascar have extensive sewerage systems.
These systems were established in the period 1958-1960. They have not been
renovated except for Antiranana, which serves 40 per cent of the population.
However, the sewers empty waste directly into coastal waters and are poorly
maintained, resulting in a blockage and the stagnation of effluents in surface canals.
Both this and the large quantities of faeces deposited on beaches represent a
significant threat to human health through microbial contamination. Ancestral
customs prevent the storage of human excreta even in septic tanks. An inventory of
sanitary installations in Madagascar made in 1993 indicated that 66 per cent of the
population does not have any such installation. Pit latrines are utilized by between 2
and 40 per cent of the population in the larger coastal towns. Domestic sewage
accounts for the majority of the total BOD and TSS loads to the coastal zone in
Madagascar: 79.9 per cent (10,368 tonnes/year) and 84.6 per cent (15,068
tonnes/year), respectively. However, no reports of algal blooms have been linked to
increased inorganic nutrient concentrations in coastal waters associated with domestic
sewage. Solid domestic waste such as organic matter, paper and plastics is collected
in some of the larger coastal towns, but the majority is not disposed of in dumps and
represents a hazard to public health when it accumulates in urban areas.
2. Industrial Pollution
Although monitoring data on industrial pollution of the water environment throughout
the region are sparse, those data reported to date, with the possible exception of
Mauritius, suggest that currently such sources do not have any serious social or
economic implications. For example, heavy-metal and petroleum-hydrocarbon
concentrations in waters and sediments for Mombasa and Dar es Salaam, two of the
most industrialized areas of the region, indicate that pollution derived from this
source is not currently a major threat to either food security, public health or marine
and coastal resources, ecosystem health and biological diversity. However, this is no
justification for not introducing stricter control measures before widespread damage
commences. Although such pollution derived from industrial activity in ports and
harbours of the other States is likely to be less significant than is the case for
Mombasa, Dar es Salaam and Maputo, no assessment can be made because of the
lack of available monitoring data. However, the data collected in the LOCS provide a
valuable baseline to which subsequent monitoring can be compared.
The high seasonal BOD load associated with the release of effluent to rivers from
sugar-cane processing factories on Mauritius, and its subsequent transfer to longer-
residence-time lagoonal waters, may lead to degradation of coastal habitats. A large
proportion of the BOD load to the coastal waters of the Seychelles is derived from
78
industrial activity, in particular agricultural and livestock production and oil from the
tuna canning industry. Further information is required concerning the disposal of this
effluent before a more thorough assessment can be made of its socio-economic
implications. However, it should be noted that such point sources may result in
deterioration of water quality such as reduced dissolved oxygen concentrations, and
the localized degradation of coastal habitats.
With the exception of Mombasa, more information is required on the residence time
and mixing of industrial effluents in coastal waters of the region to assess the
significance of the BOD load for habitat degradation. Oil spills associated with the
transportation of oil by tankers is not considered in the context of this overview to be
a land-based source of pollution However, tanker oil-spills remain a significant threat
to the coastal waters of the region. A notable example was the complete destruction
of the mangrove forest in Makupa Creek (Mombasa) following an oil spill of 5,000
metric tonnes in 1988. Approximately 470 million tonnes of oil are transported
annually through the waters of the region by 1,200 very large crude carriers (VLCCs)
and 4,000 medium-sized tankers.
Mozambique
Most of the industries in Mozambican are located in the coastal cities: Maputo,
Matola and Beira. Most of these industries do not treat or do not have adequate
treating mechanism of their effluents, which in most of the cases contain toxic
elements. These are discharged directly into the tidal channels or in coastal waters.
The major polluting factories in Maputo are: the textile factory (TEXLOM), the paper
factory (FAPACAR), the brewery (MACMAHON) and the tire factory (MABOR).
These factories discharge their waste into the Infulene River and then into Maputo
Bay. The major pollutant elements are salts; organic matter and faecal organisms
pollute this river. The crops in lower Infulene valley have been found contaminated
with faecal organisms (Buuren and Heide, 1995).
The total number of industrial units listed for Maputo has increased from 11 in 1982
to 29 in 1992 to 137 in 1996. The industries produced a total of 79,388 tons of BOD
in 1996, including an unquantified amount of wastes containing heavy metals such as
mercury, lead, chromium, manganese, nickel and zinc.
Analysis by the National Laboratory for Food and Water and the Maputo Water
Authority have revealed the presence of heavy metals particularly lead in different
locations: Port of Maputo, in the mouths of Matola and Maputo rivers and in Nacala
Bay (Fernandes, 1995).
The main international ports in Mozambique are Maputo, Beira and Nacala. The port
of Beira is the one which handles most petroleum products as it has the largest
petroleum refinery (with a capacity of nearly 110,000 m3). The Pipeline transporting
petroleum to Zimbabwe is connected through the port of Beira. About 1 to 1.5 million
79
tons of petroleum are pumped to Zimbabwe, through this pipeline, every year. There
are more ports in the country with oil deposits, from or to which, oil is pumped with
associate risks for oil spill during the course of the operation.
Pollution from ships along the Mozambican coast is often related to:
- oily bilge water and oil sludge from engine room discharged into sea
- accidental oil spill from damaged tankers
- blasting and cleaning operations.
It is estimated that ca. 450 million tons of hydrocarbon products transit annually
through the Mozambique Channel transported by tankers including large crude
carriers. The potential risk for oil spill is therefore, high. The prevailing winds
(South-easterlies trade winds) make the Mozambican coast most vulnerable, as
evidenced during the Katina-P oil spill in 1992 near Maputo Bay (Massinga and
Hatton, 1997). In this accident, an estimated 3,000 tons of crude oil was spilled in the
entrance of Maputo Bay.
Kenya
Most of the polluting industries occur in Mombasa's industrial area. Other industrial
establishments that contribute to generation of industrial waste are found in Kilifi and
Lamu districts. Very few industries along the coast treat their effluents and such
effluents, some containing toxic chemicals, are allowed to discharge into municipal
sewers and storm water drains to end up in the marine environment. Some industrial
establishments discharge their effluents into vertical drains, which pollutes the
groundwater table. During floods and high tide, the drains sometimes overflow and
seep into the marine environment. The petroleum refinery at Changamwe produces
considerable quantities of hazardous sludge contaminated with oil marcaptans,
tetraethyl lead and rust. These are disposed of on agricultural land within the refinery.
Cashew nut processing factories produces about 15,330 tons/year of solid waste
composed of mainly kernels, which are disposed by burning within the factory site.
The sisal processing factories produce approximately 8,400 tons per year of solid
waste, which is composted and used to fertilize the sisal farms. It also discharges
considerable quantities of liquid waste directly into the sea, thereby exerting a
significant biological oxygen demand (BOD). In Mombasa, the official dumpsite for
solid waste from industries is at the Kibarani landfill at the Makupa creek; there is
also illegal dumping at Miritini. Solid industrial waste is of unknown composition
and quantity, but likely includes hazardous waste. Pollution from solid industrial
waste and effluents is on the increase. The degradation of marine habitats results in
poor fish yields, impacting socio-economically on the local fishing communities.
Marine pollution also threatens public health, as it contaminates seafood and
recreational areas. Poor aesthetics and odors are also increasingly interfering with
other traditional uses of the sea. Due to the proximity of the industrial area to the
natural drainage systems of the Mombasa island and the west mainland, most of the
pollution load from industrial effluents ends up in the Kilindini and Port Reitz creeks.
80
Waste from Shipping Activities contribute significant pollution loads to the marine
environment. The Kilindini harbour is an important port in East Africa, with a
hinterland encompassing Uganda, Burundi and Rwanda. According to the Kenya Port
Authority (KPA), a total of 1,465 ships arrived at the port of Mombasa in 1992, with
a gross average of 4.0 days at port per ship. That year, 15,779 and 12,028 passengers
respectively, disembarked and embarked at Mombasa port. The KPA has no facilities
for the disposal of wastes from ships; however, the Authority does provide passenger
ships with bins for solid waste disposal and make arrangements for the disposal of
liquid wastes whenever required. Oil residue from ship tanks is usually sold to soap
manufacturers and other industries which use it to fuel boilers. An attempt was made
to get an indication of the amount of waste generated from ships. The main
contributors of waste were assumed to be ship crew based on the number of days
spent at port. It was estimated that respectively, 13.5, 1 1.0, 1.8 and 0.2 tons per year
BOD, suspended solids (SS), nitrogen (N) and phosphorus (P) were produced from
ship wastes at the Mombasa harbor in 1992.
Table 36.
Summary of pollution loads from Kwale District (Kenya)
Source
B O D
S S
N
P
tn/y
%
tn/y % tn/y % tn/y %
contr#
contr
contr
contr
Domestic 559 39.5 332 11.2 69 7.5 8.3 1.2
Sewage
Beach
70.7 4.9 60 2.0 12.0 1.3 1.5 0.2
hotels
Storm
142 10.0 1198 40.5 45 4.9 2.8 0.4
water
Solid
321
22.7
waste
Livestock 322 228 1369 46.3 789 86.2 674 98.2
waste
1414 100 2959 100 915 100 687 100
81
Table 37.
Summary of pollution loads from Kilifi District (Kenya)
Source
B O D
S S
Oil
N
P
tn/y
%
tn/y % tn/y % tn/y % tn/y %
contr#
contr
contr
contr
contr
Domestic
648 41 372 13 - 76 23 8.7
15
Sewage
Beach
76 5 91 3 - 19
9 2 3
hotels
Storm
274 17 2166
77 - 88 27 5.9
10
water
Solid
389
25 - - - - - - -
waste
Industrial
144 9
78 3 -
2 0.6 0.4 0.7
waste
Agriculture - - - - - 93.0
29
5.3
9
waste
Livestock
520 3
106 4 3.0 100 47 14 36 62
waste
Totals
1583 100 2813 100 3.0 100 325 100 58 100
Table 38.
Summary of pollution loads from Lamu District (Kenya)
Source
B O D
S S
Oil
N
P
tn/y
%
tn/y % tn/y % tn/y % tn/y %
contr#
contr
contr
contr
contr
Domestic 85 9.4 9 0.3 - - 2 2.2 0.2 1.0
Sewage
Beach
3.8 0.4 3.2 0.1 - - 0.7 0.8 0.1 0.5
hotels
Storm
34 3.8 288 11.2 -
-
11 12.0 0.8 4.0
water
Solid
123
13.6
- - - - - - - -
waste
Industrial 345 37.8 210 8.2 - - 0.0 0.0 - -
waste
Livestock 320
35.2 2063
80 3.6 100 78 85 19 94.5
waste
911 100 2573 100 3.6 100 92 100 20 100
Mauritius
Sugar cane processing produces the largest quantities of industrial waste effluent in
Mauritius There are 18 sugar mills, which discharge large quantities of a variety of
effluents with high BOD values to canals and rivulets during the harvest season. They
include hot condensed water carbon-column workings, fly ash and organic solvents
On the basis of figures for the sugar cane harvest of 1994 (500,209 tons) and average
82
pollution loading for selected streams per ton of sugar cane processed, the total load
of BOD5 and total suspended solids to streams were 358 tons and 683 tons,
respectively. Although a variety of wastewater treatments, including sedimentation,
anaerobic and aerobic lagoons, have been used to reduce the pollutant load of waste
effluent, their relative success has been varied. The release of effluent containing
black soot ash from sugar mills to coastal waters at Bel Ombre leads to high turbidity
of water on the beach, although this has not,been linked directly to ecological
damage. The release of effluents with high BOD into streams has resulted in oxygen
depletion and the death of fauna. The designing process in the textile industry also
produces waste effluent with a high BOD and suspended particulate content, but
represents only a small proportion of the total BOD loads to fresh and coastal waters.
In Mauritius, two sugar factories operate sedimentation ponds, three operate
anaerobic lagoons and one used to operate an artificially aerated aerobic lagoon,
which was not operational by 1997. In 1993, six factories had achieved zero
discharge of wastewater into rivers and the sea by using their wastewater for
irrigation instead. Six sugar factories in Mauritius separate oil and grease from their
wastewater before it is discharged into rivers and the sea. These factories then bum
the recovered oil with bagasse as fuel. Four factories separate the oil and grease from
their effluents then dump them as solid wastes. Six other factories do not have any oil
or grease separator; any oil present in their effluent is discharged into rivers or the
sea.
The most significant pollutant emitted by bagasse-fired boilers is particulate matter.
Fly-ash and unbumt bagasse particles are emitted into the atmosphere through smoke
stacks. The amount of particulate matter emitted depends on the removal efficiencies
of the air pollution control equipment installed on the boilers. It should be noted that
seven boilers in Mauritius have no air pollution-control equipment. The Ringelman
scale of 1-5 was used to evaluate the smoke opacity of the 27 boilers in Mauritian
sugar factories. According to this scale, RI is equivalent to 20 % and R5 represents
100 % smoke opacity.The smoke from chimneys of only 9 out of the 27 existing
boilers had ratings less than 2.0, i.e. 40% opacity. Eleven boilers had a Ringetman
rating of 2.0. The ratings of smoke from the individual stacks of 5 boilers that are not
equipped with any air pollution control equipment, except for the one boiler operating
under low load, exceeded 2.0. The opacity readings from these boilers averaged 2.1 to
3.5, with the corresponding maximum readings averaging 2.9 to 3.9 on the Ringelman
scale. 6.1.2.4 Solid and Hazardous Waste The following types of hazardous wastes
are generated in Mauritian sugar factories: Biocides used for mill sanitation and seed
cane preparation; Organic solvents, resins, adhesives, paint sludge, etc., in mill
workshops; Oil-water emulsions from the mills; Substances containing
Polychlorobenzenes (PCBS) from electrical transformers of factories exporting
electricity to the grid; Batteries; Laboratory chemicals such as lead subacetate and
mercury iodide; Used oil from vehicles and factory machinery; and Acids, alkalis and
other industrial chemicals. Although substitutes to the use of heavy metal-based
chemicals exist, the Mauritian sugar industry continues to use mercuric iodide and
lead acetate for preserving and clarifying laboratory samples of various sugar
83
solutions. The 19 sugar factories together use and dispose of over 108 kg of mercuric
iodide and 2,400 kg of lead subacetate annually.
Liquid wastes from textile mills arise mainly from wet-finishing treatments, where
large volume of water and chemicals are used in textile baths. If the bath is
discharged directly to the surrounding, it becomes a major source of pollutants
hazardous both to human and aquatic life. This is because most dyes and chemicals
used are synthetic and are not readily biodegradable. The desizing process, which
uses enzymes or mineral acids such as sulphuric acid, is particularly significant
because it produces effluent with a high biochemical oxygen demand (BOD) rating,
high total dissolved solids (TDS) and some suspended solids in colloidal form. Other
effects of untreated effluent from dye houses are: color and turbidity which contribute
to the asphyxiation of aquatic life; contamination of aquifers and formation of scale in
pipes, condensers and boilers as a result of sulphate contamination.
Gaseous wastes from the textile industry, often containing solvent vapors, ammonia
and formaldehyde, are normally diffused into the atmosphere. Another form of air
waste originates from boilers. Most of the textile mills use coal or gas as fuel, and
large amounts of gases are liberated into the atmosphere.
The three main industrial zones in Mauritius are Plaine Lauzun, Coromandel and
Vacoas-Phoenix. Most of the polluting industries are found in these zones. There are
about 85 industries in operation in the industrial zone of Plaine Lauzun, including dye
houses, ethanol, distilleries, battery manufacturing, soap and detergent
manufacturing, galvanizing, food canning, and chemical manufacturing industries.
These industries consume about 4000 to 5000 m3 of water daily and their effluent is
discharged to in the Fort Victoria sewerage treatment plant, where only pretreatment
is done. The effluent is released into the sea through a 800-m-long sewage outfall. A
few of the industries, e.g. the galvanizing plant, release toxic effluents into the
sewerage system without any treatment. r and The Coromandel industrial zone
comprises about 70 industries, the most important being dye houses which use the
most water and contribute the most to water pollution. These are followed by the
soap- and food-processing industries, whose daily consumption of water is about
3000m3. Their untreated effluent is discharged through a 600-m-long outfall into the
Pointe aux Sables lagoon. The Industrial zone of Vacoas-Phoenix has 31 industries,
including dairy industries with a daily water consumption of about 2000 m3.
Untreated effluent from these industries is discharged into the sewerage network after
pre-treatment at the St Martin treatment plant.
Seychelles
Water pollution in the Seychelles is on the increase. For example faecal
contamination of rivers in Mahe from defective sewage systems and septic tanks has
been detected. Discharges from pig-rearing facilities is another source of water
pollution. Samples collected from marshes near the Anse Marie Louise piggery have
been found to be significantly contaminated. The major industries in the Seychelles
84
known to be sources of water pollution are: the Seychelles Marketing Board agro-
industry (producing dairy products), The Seychelles Marketing Board food-
processing plant (processing poultry and other meat products), Seychelles Brewery
(producing beer and soft drinks), Indian Ocean Tuna Limited (tuna canning), Penlac
Factory (producing paint), Sodepak (manufacturing soap), cattle and poultry abattoirs,
domestic sewage treatment plants and the electricity-generating plant. The fishing
industry, particularly commercial fishing, also produces significant amounts of
pollutants, notably garbage, fish waste and petroleum products which are dumped in
the sea without treatment.
Calculations of BOD loads to the water environment derived from industrial activities
in the Seychelles indicated that agricultural and livestock production accounts for
71.6 and 88.7 per cent of the BOD and TSS loads, respectively (Radegonde 1997).
The other major contribution is from the fish processing and canning industries,
which account for 17.7 per cent of total BOD, 6.7 per cent of TSS and 95.9 per cent
of the total oil load (130.5 tonnes per annum), although details of disposal (for
example, direct to coastal /fresh waters, refuse sites, etc.) were not reported. Artisanal
fishing in the Seychelles provides employment for the local population, while
industrial fishing of tuna, principally by European vessels, accounts for 90 per cent of
exports. The brewing and tuna canning
industries are reported to contribute 65 and 18 per cent respectively, to the total BOD
load derived from industrial effluent (UNEP 1 995b). However, this accounts for only
17.5 per cent of the total BOD load, of which 72 per cent is derived from storm run-
off and sewage treatment. Industrial waste was reported to constitute 56 per cent of
the total suspended solid load discharged into coastal waters of the Seychelles, the
remainder being derived from domestic sources.
Tanzania
About 80% of the industries in Tanzania, including agro-industries, chemical
factories, breweries, soap and steel- manufacturing establishments, are located in the
coastal city of Dar es Salaam. Pollutants originating from these industries end up in
the sea. Much of the Industrial development in Tanzania was embarked on without
specific provision for handling resultant environmental pollutants. Consequently, few
industries in the country treat their waste. The majority of industries are located in
coastal urban centers, and their effluents are discharged untreated or partially treated
into nearby water bodies. The twelve streams draining through the heavily inhabited
areas of the city constitute the major pollution drainage routes for industrial effluents
into the Indian Ocean. Although the level of industrialization of Tanzania's urban
centers is relatively low, untreated industrial waste causes significant levels of
localized pollution. Out of the 57 industries surveyed in Dar es Salaam, about 68%
contribute to pollution of the Indian Ocean either directly or indirectly.
Industrial pollution in Dar es Salaam consists primarily of biological oxygen demand,
BOD (2,715 tons/year) and suspended solids (SS) (I 5,454 tons/year), equivalent to
19% and 55% of the total BOD and SS loads for the city, respectively. The Msimbazi
85
Creek and Mzinga Creek are thought to be the most heavily polluted spots of the Dar
es Salaam coastline. Tanzania Breweries Limited accounts for 857 tons p. a. of the
BOD5 load discharged into Msimbazi stream. The brewery discharges its effluents
into the stream untreated. On the other hand most of the nutrients, nitrogen (N) and
phosphorus (P) loads originate from the Kimara slaughterhouse and the Vingunguti
abattoir. Rapid assessment of the industries surveyed found that about 67% of the
large industries in Tanga Municipality contribute to water pollution. The Tanga
region has major waterways, such as the Pangani, Soni, Mkulumuzi, Mnyuzi and
Vuga rivers.
Most of the rural sisal estates discharge industrial effluents into these rivers.
However, the Mkulumuzi and Sigi rivers that pass through the heavily inhabited parts
of the Tanga Municipality are not seriously polluted. Grab samples indicate that
Mkulumuzi river has 5.3 nig/i BOD and pH 7.8, whereas the Sigi river has 1.8 mg/i
BOD and pH 9.7. The direct discharge of untreated industrial effluents through rivers
is of economic and health concern. The Msimbazi river in Dar es salaam for instance,
whose water is extensively used for irrigation of numerous smaliscate farms along its
valley, is heavily polluted with industrial effluents.
In Tanga, sludge from the septic tanks as well as the 60% of the pit latrines assumed
to be desludged by the cesspit/vacuum trucks, is emptied into the Indian Ocean either
directly or indirectly. From this source, 5,000 tons of BOD is exerted on the Indian
Ocean annually. Domestic liquid wastes constitute most of the BOD load discharged
into the ocean. The major source for the N in Tanga is domestic liquid wastes, which
exert respectively, 4991.7 and 571.4 tons/year BOD and N. Most of the industrial and
domestic solid waste generated in Dar es Salaam is disposed of on site. Non-
hazardous domestic wastes are disposed of at Vingunguti, the city's official disposal
site. Metal industries lead in recycling wastes, with about 53,000 tons annually
followed by hospitals from which 3,600 tons of putrefiable solid wastes per year are
recycled. The breweries produce 1,190 tons of such waste per year, which is mainly
sold to farmers as animal feed.
Tanzania-Zanzibar
Many of the industries active in 1993 no longer exist. These include Afrochem Ltd.
(manufacturing foam mattresses and detergents), Cotex (Z) Ltd. (yarn and printed
fabrics), the milk factory and the State Leather and Shoe Factory, formerly situated at
the Mtoni industrial area. Furthermore, many of the small scale industries which were
housed under the Jitegemee Small Scale Industrial Complex (paint, aluminum
utensils, hardware and soap) at Amaan, have collapsed. The once-mushrooming soap-
making cottage industries have also folded probably due to competition from cheap
imports.
However, new industries, mainly soap- and edible oil-manufacturing, have been
established at the neighboring Mombasa. An animal feed mill (Zanzibar Poultry
Company, ZAPOCO) started operating at Maruhubi in 1995 and a flour mill has
86
recently been opened at Mtoni. With trade liberalization, a free trade and an export-
processing zone have been established at Fumba, a few kilometers from Zanzibar
Town. It is expected that this area will be the site of various industries.
Comoros
Little information was available concerning chemical pollution of water resources
from industrial sources in the Comoros. Industries are under an obligation to respect
the environment and not to release untreated chemical wastes. Processing industries
associated with agricultural and pastoral production account for 85 per cent (14.41
tons per annum) and 92 per cent of the BOD and total suspended solid load derived
from industrial sources. The loads of BOD, total suspended substances (TSS) and
solid waste produced by industrial sources are small in comparison to domestic-waste
loads.
Madagascar
With the exception of the oil refinery in Toamasina, most of the industrial activity in
Madagascar concerns the processing of agricultural and farmed animal products.
Industrial activity around the coast is focused in the ports of Antsiranana, Ambilbe,
Mahajanga, Tolagnaro and Toamasina, where the majority of the factories do not treat
their waste but discharge it directly to the water environment. Detrimental effects
have been reported in mangrove swamps in the north and north-west of Madagascar
where industrial effluents have been released (Rakotoarinjanahary et al. 1994). One
notable exception is the oil refinery where an efficient wastewater treatment system is
reported to operate. Industrial effluents in the capital city Antananarivo are
discharged into the river Ikopa, although this is considered to be sufficiently far from
the coast to have little impact on coastal habitats. In comparison to domestic effluent,
the pollution load from industry is relatively small. Industrial activity was reported to
account for only 21 .1 and 15.4 per cent of the total BOD and TSS loads,
respectively; domestic sewage accounted for the majority in each case.
3. Agricultural Run-off
According UNEP Regional Sea reports No. 167, only tentative interpretations
concerning the significance of agricultural pollution can be made, because
concentrations of nutrients or pesticides have not been determined for fresh waters,
ground waters or coastal waters in the majority of the States of the region. Data
concerning the sale or application of agricultural fertilizers and pesticides have been
included in several of the national reports. However, in the case of the mainland
States these often do not refer to the whole coastal region, but to specific coastal
districts, generally around large urban centers.
With the exception of Mauritius, the physical effects of siltation resulting from
agricultural activities, most notably along the coasts of Kenya, Madagascar and the
Comoros, are currently of greater concern throughout the region than agrochemical
87
pollution. Further work is required to quantify these physical effects, such as the
extent of destruction of coastal habitats, and their economic implications, including
reduced fish catches and the need to dredge harbor areas.
The lack of monitoring data concerning the concentrations of agricultural nutrients
and pesticides in the coastal and fresh waters of the region makes any assessment of
associated pollution problems quite tentative. Ecological damage and the nitrate
contamination of ground waters have been linked to intensive agricultural production
in Mauritius. The absence of significant concentrations of persistent organochlorine
pesticides in the creek sediments of Mombasa could indicate that fresh waters
draining into the creek systems are not severely polluted. However, this finding may
be explained by the lack of intensive agricultural activity bordering this area or the
short residence times of the creek waters. Therefore, there is insufficient evidence to
indicate whether pesticide pollution in the more intensively farmed coastal areas of
the region poses a significant threat to drinking water supplies, or to coastal habitats
receiving elevated nutrient loads in agricultural run-off.
The trend in increased use of both fertilizers and pesticides in intensive agricultural
production is likely to lead to elevated concentrations of nutrients in agricultural run-
off and ground waters. Although algal blooms have been observed in coastal waters
of the region, an assessment cannot be made regarding the importance of agricultural
run-off for their occurrence, because of a general lack of monitoring of nutrient
concentrations and research into the process of eutrophication. To date, algal blooms
around coastal urban centers have generally been associated with inorganic nutrients
derived from domestic-sewage pollution.
Mozambique
Agricultural activities within the coastal region and in the hinterland areas contribute
to the pollution of coastal, marine and associated freshwater environment, through
sediments and use of pesticides and fertilizers.
Since most of the agriculture activity takes place along or close to the main river
basins, the rivers are the main pathways through which agrochemicals enter the
coastal and marine environments.
The rivers with intensive agricultural activity include: the Monapo (in Nampula
Province), the Zambezi, with agricultural activity of Zimbabwe and Zambia, among
others, the Pungoķ, with tobacco plantations in Zimbabwe, the Limpopo and the
Incomati, used in intensive farming in South Africa and the Umbeluzi, used for sugar
cane plantation in Swaziland (Massinga and Hatton, 1997). The contribution of
Mozambique farming to the pollution of water is negligible if considering that the
mechanized farming in the country occupies only 8% of the total cropland (#39).
However, one should take caution of the current increasing trend of agriculture
activity, resulting from the increasing foreign investment and following the peace
environment in the country.
88
The common pesticide residues identified are: 2,4,5 TCB, pp DDD, pp DDT, pp
DDE, Lindane and HCB. Although DDT is officially banned in Mozambique, it is,
unfortunately, still being used in Mozambique and in the neighboring countries
(Massinga and Hatton, 1997). The average concentrations of copper and chromium in
the Elephant River, an effluent of the Limpopo River, measured at Mamba and Baule,
both in South Africa, is 0.004 mg l-1 and 0.003 mg l-1, respectively for both in the
water and in the sediments. Concentrations in the sediments are shown in Table 40.
Mercury concentrations observed in the water in the Umbeluzi River are shown in
Table 41. There is no data available for the other rivers.
Table 39.
Concentration of heavy metals (mg l-1) in sediments of Elephant River at
Mamba (Loc 1) and Baule, in Kruger Park (Loc 2), in February-November 1994 (after
Robinson and Avenant-Oldewage, 1994).
Element February
May
July
November
Loc 1
Loc 2
Loc 1
Loc 2 Loc 1 Loc 2 Loc 1
Loc 2
Chromium
0.218 0.360 0.249 0.356 0.532 0.335 0.259
0.105
Copper 0.004 0.023 0.041 0.056 0.036 0.036 0.209
0.010
Table 40.
Mercury concentration (mg l-1) in the water in Umbeluzi River (LNHAA,
1994)
Sampling location
Raining day
2 days after rainfall
Boane (at the bridge)
0.0033
<0.0010
Water treatment plant
After treatment
<0.0010
0.0023
Before treatment
0.0013
0.0020
Goba village
0.0020
Goba border
0.0016
Kenya
Although Kenya's coastal region is important for the production of vegetables and
tropical fruits and some livestock rearing, most of its land is not given to commercial
agriculture. Thus, apart from the two large commercial sisal farms located 30-60 km
north of Mombasa which also rear livestock, agricultural activities are by and large
subsistence, with little or no agrochemical usage. Agricultural chemicals and
fertilizers are used by some large-scale farms in Mombasa, Kilifi, and Lamu. In
addition, the use of agricultural chemicals and fertilizers is replacing traditional
farming methods in smallholder farms. River transportation of agro-chemicals
through runoff during the rainy season is the main pathway through which those
chemicals reach the coastal and marine environments. Persistent and ecologically
harmful chemicals with toxicity to fishes, such as organochlorine insecticides, are
widely in use, though on a small scale. Other classes of pesticides such as
organophosphorous, carbamates and pyrethroids are also used on agricultural food
crops. Ecologically harmful herbicides like 2, 4-Diamineand 2,4,5- Triamine are also
used. Only in Kilifi district does agricultural runoff contribute significantly to overall
pollution loads in the region. The contribution of runoff from the Kilifi plantations
89
Ltd and Vipingo Estate Ltd was estimated by applying runoff factors from US
agricultural areas. The combined contribution of N and P from these farms to marine
pollution was found to be 92.5 and 5.3 tons/year respectively. Fairly large amounts of
fertilizers are used in Kenya. The Tana and Athi rivers draining the hinterland
agricultural areas carry significant quantities of nutrients into estuaries and lagoons.
Their adverse effects, though localized, are already evident in the marine ecosystems.
Sediment inputs, through the nutrients they carry, lead to the proliferation of algal
blooms, which consume excessive amounts of dissolved oxygen, making the water
incapable of supporting marine life. The water also becomes unsuitable for
recreational use and can affect public health. Its inability to support marine life
creates seafood scarcity and can lead to poor health in fishing communities who
depend on seafood as their primary source of protein. Marine-based poverty
alleviation activities are also curtailed.
In Mombasa district, the rearing of livestock is practised mostly in smallholdings,
where zero-grazed cattle and limited feedlots for poultry and pigs are maintained. We
estimated that livestock wastes from Mombasa, Kwale, Kilifi and Lamu districts
combined exert a BOD of 1855 tons/year and contain 12,718, 1544 and 1093 In
Kwale district, mainly dairy cattle are kept along the coastline. Other farm animals
are found further inland. The main slaughterhouses in the district are located off the
immediate coastal areas. In Kilifi district, the Vipingo Estate Ltd, Kilifi Plantations
Ltd and the Agricultural Development Corporation farm in Malindi are the major
livestock farms along the coastal areas. These farms manage low-density pasture
units, in iomic which livestock waste is used as pasture manure. However, they also
run some of the busiest slaughterhouses in the area and contribute to marine pollution
through this activity. In Lamu the main contributor of livestock waste is the 3000-odd
donkey population and the slaughterhouses. Liquid waste from the Lamu
Slaughterhouse is disposed into a soakage pit.
Mauritius
Until the late seventies, agriculture was the main foreign exchange earner in
Mauritius. It was also the largest sector both in terms of output and employment. The
area under cultivation in Mauritius (90,100 ha) represents about 48% of the size of
the island. Sugarcane cultivation in Mauritius occupies about 77,000 ha, representing
about 90% of the arable land. The island has a long history of pesticides use.
Approximately 1153 tons of pesticides are imported annually into Mauritius, out of
which 59% represents herbicides, 3 1 % insecticides and 8% fungicides. The annual
importation of fertilizers for the period 1979-1989 averaged 57,500 tons. Ammonium
compounds make up about 50% of the total imports, while potassium compounds
approach a third of the total. The vast majority of the country's 35,000 small scale
farmers use hand sprayers, resulting in wastage and spillage of the pesticides. In
addition, plant growth regulators and fruit and cane ripeners are being increasingly
used. Besides, some unscrupulous agrochemical importers continue to sell banned
pesticides. Preliminary investigations undertaken by the Water Resource Unit indicate
90
that nitrate levels in ground water in some agricultural areas were already
approaching tolerance limits.
Seychelles
Pollution from agricultural activities has not been precisely assessed in Seychelles,
but it is likely that agricultural fertilizers and pesticides constitute a significant source
of coastal water pollution. Large-scale construction, road- building and dredging
activities have been responsible for siltation and damage to corals in some areas along
Seychelles' eastern coast.
Tanzania
The agriculture industry employs about 80% of Tanzania's population and accounts
for about half of the Gross Domestic Product (GDP). Most agricultural activities in
Tanzania take place in river valleys and flood-plains. The combined effects of
sedimentation and turbidity limit filter feeding and photosynthesis of coral reefs.
However, the extent of this source of pollution has not yet been evaluated in
Tanzania. To control pests, diseases and improve farm yields, the agricultural
industry in Tanzania uses a range of synthetic chemicals, many of them imported.
The pesticides commonly used in Tanzania include aldrin, dieldrin, lindane,
endosulfan and heptachlor. Fertilizers include ammonium sulphate, calcium
carbonate, ammonium nitrate, urea, triple super phosphate and NPK. Marine and river
water pollution resulting from leaching of fertilizers and astes pesticide residues
constitutes a direct potential health hazard to animal, plant and human health. Poor
storage and transportation of such chemicals may result in accidental spills into the
fresh and sea water systems.
Tanzania-Zanzibar
Agricultural activities in Zanzibar are still artisanal in nature, dominated by the
cultivation of food crops rather than cash crops. Food crops include banana, cassava,
yams, sweet potatoes, rice, millet and maize. Sugarcane is cultivated in the northern
district, mainly for sugar production.
The use of fertilizers and pesticides has remained relatively low. Fertilizers are used
mainly in rice and sugarcane cultivation. However, given that supply of the
chemicals is often erratic, their use has been severely curtailed. For example, use of
fertilizer dropped from 2800 tons in 1988 to 406 tons in 1996 (Ministry of
Agriculture, Zanzibar).
Mariculture development started in Zanzibar in 1989 and has so far been confined to
in the cultivation of a red algae, Echeuma sp. However, plans are underway to start a
pilot fish culture farm in the Makoba area, north-east of Unguja island. This
development will put more pressure on an area which already suffers increased
organic pollution from a sugar factory operating nearby. It is planned that the
91
experience gained from this pilot venture will be used to initiate farming in other
coastal villages. Discharge from such fish farms has the potential of significantly
increasing the nutrient load of the coastal waters.
According to the Zanzibar Livestock census of 1993, there are about 73,000 domestic
animals on the island. Most of these animals are taken to communal dips, to protect
them against such diseases as the East African fever (ECF), bobesiosis and
anaplasmosis, which are common on the island (Awali et al.) These dips are located
in various areas of Unguja. The chemicals used in these dips include steladone,
saladone, dekatix, spotone and other organophosphates.
Poor management characterizes these dips. Almost all do not have designated
methods of waste disposal. About 70% have simple pits dug in their vicinity, into
which waste solutions from the dips are dumped. The rest of the dips do not have
even such simple arrangements and the waste is simply discarded onto the ground.
According to estimates, about 300,000 liters of waste are disposed of in this way
annually (Alawi et al., 1994). However, given that the majority of smallholders do
their own dipping/spraying, the amount of the waste getting into the environment is
far more than this. Of more serious concern is that many water wells are located near
some of these dips. Consequently, there is a strong possibility of contamination of
these water sources. Furthermore, most of these dips are not fenced, hence the dips
and dip solutions are easily accessible to non-users.
Comoros
Agricultural production occupies approximately 67 per cent of land on the Comoros,
employs between 70 per cent and 80 per cent of the total population, and accounts for
98 per cent of export revenue. The main export crops include vanilla, ylang-ylang and
cloves. Cereals, rice, potatoes, fruits and legumes are also grown for local
consumption. As a general rule, the use of pesticides and fertilizers for market
gardening is limited; the total quantity of pesticides used between 1991 and 1993 was
approximately 70,000 kg (Kouassi 1994). Steep slopes and continuous cultivation
without the provision of fallow fields have led to the impoverishment of the soil and
serious incidents of soil erosion, siltation of the coral reefs with deleterious effects on
fisheries. Agricultural run-off is also considered to have led to the pollution of
groundwater although no data have been reported on which an assessment of the
problem can be based.
Madagascar
Cattle-rearing and rice production are the main agricultural activities in Madagascar,
although small areas of intensive production of sugar cane and cotton are located in
the south-west and north-west of the country, where the greatest quantities of
fertilizers and pesticides are applied. The application of fertilizers in intensive
agricultural areas was reported to be as high as 163 kg/ha in 1990, and has been
linked to localized algal blooms
92
and reduced fish catches in lagoons (Vesseur et al. 1987), particularly around the reef
at Toliara. However, no research has been reported to date to prove cause and effect.
The clearing of forests in Madagascar, resulting in sediment mobilization, siltation
and the destruction of coral-reef habitats has been identified as a major problem
(Linden and Lundin 1997), particularly along the western coastline (Neuvy 1982).
The causes include bush-fires, harvesting of forests for production of charcoal and
clear-felling for agriculture purposes. Little is being done in the way of
reafforestation to reduce soil erosion. Although algal blooms have been observed in
coastal waters of the region, an assessment cannot be made regarding the importance
of agricultural run-off for their occurrence, because of a general lack of monitoring of
nutrient concentrations and research into the process of eutrophication. To date, algal
blooms around coastal urban centers have generally been associated with inorganic
nutrients derived from domestic-sewage pollution.
4. Atmospheric Pollution
In the absence of detailed assessments for atmospheric emissions for the entire
region, the generally low level of industrial development would suggest that socio-
economic problems associated with such sources are likely to be limited. Indeed, the
national reports contained very few references to issues of public health, food
security, ecosystem health or biological diversity associated with atmospheric
pollution. However, in those areas identified as causing the greatest pollution, most
notably around cement factories, further monitoring of pollution plumes and their
impact on their local environment is required.
Out of 79 major industries surveyed in Dar es Salaam, 43 per cent have been found to
cause air pollution. Among these, the cement industry of Wazo Hill is the principal
polluter, emitting approximately 2,831 tons of total suspended particles per year. If
Wazo Hill is a representative model, the same levels of pollution may be expected
from the cement factories in Maputo, Bamburi (Mombasa) and Kaloleni (Kilifi).
Other significant sources of air pollution, in order of importance are charcoal
manufacture and domestic combustion, agricultural activities, and traffic (mobile
sources). With increases in development, communication and tourism, atmospheric
emissions from traffic, particularly of lead, are increasing. The Kibo Paper Mill also
releases significant quantities of hydrogen sulphide. In Zanzibar Town, burning of
waste at the Mwanakwerekwe dump site causes significant pollution to the densely
populated urban area. The other significant sources in Mombasa include road traffic
and the burning of domestic and industrial waste at the Kibarani dump site, although
no data on loads are available. Particulate matter released from bagasse fired boilers
is the most significant atmospheric pollutant emitted during the processing of sugar
cane on Mauritius. However, no assessment was made of the quantities of suspended
particulates released or their impact on the surrounding area. In Madagascar,
atmospheric pollution is mainly caused by dense fumes and gases emanating from
large factories, refineries and textile industries. Old motor vehicles, which are
numerous, also contribute to air pollution. No significant sources of atmospheric
emissions were reported for the Comoros.
93
5. Pollution Hot Spots
The confluence of demographic distribution and population growth rate, industrial
and agricultural development inland far or close to shore, influence pollution load on
aquatic environments. The hot spots represent priority areas for monitoring and
mitigation since they are places where pollutant load is most concentrated and will
have the most impact on natural systems and public health.
Table 41.
Hot spots identified in the National Reports
Location Demography/ Description of problems
Pollution load
Contributing
cities or
subregions
Mozambique
1.
1 430 313
Pollution
of
existing
supplies, BOD: 79,388 t/y
Maputo
Overfishing, Solid Waste
TSS: t/y
bay
Kenya
1.
This hot spot suffers from
Industrial:
Mombasa
microbiological pollution, chemical BOD: 25,800 t/y
pollution, eutrophication, suspended TSS: 20,000 t/y
solids, solid wastes, spills, over- Domestic:
exploitation of fisheries and mangrove BOD: 4,588 t/y
resources and destructive fishing TSS: 12,802 t/y
practices. The port of Mombasa that
serves almost the whole of East Africa
is located here.
2. Lamu
This site suffers from
microbiological pollution, suspended
solids, solid wastes and modification
of ecosystems or ecotones.
3.
Pollution Ł microbiological,
Malindi
eutrophication, suspended solids and
Bay
solid waste; modification of seagrass
habitats, including community structure
and/or species composition, and over-
exploitation of inshore/nearshore fishery
resources.
Tanzania
1. Dar es 2,300.000
The harbor is a protected harbor, thus Industrial:
Salaam
(1997)
the flushing rate is very low so BOD: 2,715 t/y
pollutants are confined within the TSS: 5,454 t/y
harbor area. Being a low-lying area, the Domestic:
beach is very susceptible to erosion. BOD: 11,312 t/y
Degradation include: freshwater
TSS: 18,418 t/y
pollution, destructive fishing practices, Total P: 3,320 t/y
overfishing, fishing of juveniles, Oil: 2,222 t/y
mangrove harvesting and clearing,
94
Location Demography/ Description of problems
Pollution load
Contributing
cities or
subregions
sedimentation due to boat movement,
construction along the coast, and
agricultural activities, coral mining,
solar saltpans, sand mining
2. Tanga
144,181 (1997)
Industrial:
BOD: t/y
TSS: t/y
Domestic:
BOD: 2,287 t/y
TSS: 3,258 t/y
3.
Mtwara
4.
Zanzibar
Mauritius
GRAND
Pollution from household waste water, BOD: t/y
BAY
hotel irrigation waters, boat emissions; TSS: t/y
over exploited area, excessive land
development
Comoros
1.
Industrial:
BOD: 14 t/y
Domestic:
BOD: 3,248 t/y
TSS: 7,533 t/y
Seychelles
1. La
La Digue is the fourth largest granitic BOD: 2, 783 t/y
Digue Ł
island of the Seychelles, and is an TSS: 8,998 t/y
West
important tourism destination. The flat Total N: 5,481 t/y
Coast
plateau on the western side of the island Total P: 4,576 t/y
Plateau
is the main population area of La Digue Oil: 186 t/y
and also house 90% of hotel
establishments. There has been rapid
development over the past five years.
Among the main environmental threats
are the rapid removal of remaining
forest cover, loss and modification of
remaining wetlands, changes in
hydrology (flooding, shortage of
groundwater, etc.), increased pollution
due to human activities, and coral
bleaching.
95
Location Demography/ Description of problems
Pollution load
Contributing
cities or
subregions
East
The East Coast of Mahe is the most
Coast
intensively developed region in
Mahe
Seychelles, and has been subject to
(from
extensive land reclamation, which is
North
still ongoing. The capital city, port,
Point to
airport and most of Seychelles'
Anse
industries are situated in the region.
Forban)
There is also increasing construction of
high-density housing and other
infrastructure. Coastal pollution is
increasing, there is air pollution in
certain areas, and leachates from
landfill. The Ste. Anne Marine Park,
located within five kilometres of the
East Coast Mahe was affected by the
1997/8 El Nino induced coral bleaching,
and flooding of the coastal plateau as a
result of accelerated sea-level rise is
likely to occur.
Anse
The area is located on an extensive
Volbert,
plateau area of the second largest island
Praslin
of Praslin, which is undergoing
significant tourism development. Anse
Volbert is the most developed area of
Praslin in terms of hotels and other
tourism services. The main issues
affected the coastal environment are
coastal erosion, discharge of wastewater
and coral bleaching from elevated sea
surface temperatures experienced during
the 1997/8 EL Nino episode.
Madagascar
1.
BOD: 10,368 t/y
TSS: 15,068 t/y
96
6.
Mining
Mineral extraction and quarrying activities have the potential to damage coastal
habitats, and coral reefs in particular, by increasing the suspended solid load
(turbidity) of coastal waters. Few interpretations can be made of the threat of mining
operations to coastal habitats due to the lack of information concerning the scale of
disturbance caused by specific activities. Although significant damage to coastal
habitats related to mining and quarrying have been reported in Mozambique and
Mauritius, little analysis has been done on the likely impacts of current mineral
development or quarrying activities. Detailed appraisals at the national levels are
required prior to a regional assessment.
Mineral extraction and/or quarrying occurs in the coastal zone of each of the States of
the region. The mineral deposits which are currently worked along the Kenyan coast
include iron ore, lead, baryte, apatite and rock salt. Quarrying is carried out on a large
scale at Bamburi and Kaloleni to supply the respective cement factories. There is also
significant rock-salt extraction at Gongoni in Malindi. Limestone and clay are also
quarried for building and cement manufacture in Tanzania at Wazo Hill. Other
extractive industries include rock salt (Lindi) and kaolin (Pugu Hills).
The main mineral extraction/quarrying activities on Mauritius include sand mining
and rock quarrying, the latter used primarily for the construction industry and road
building. Currently there is an annual demand for 1.5 million tons of fine aggregates
(National Physical Development Plan 1995). The mineral resources extracted from
the sea and the littoral zone consist primarily of sand, including aeolian deposits.
Sand is exploited from the terrestrial quarries, lagoons and beaches and undeclared
sand dunes. The annual mining of approximately 800,000 tons of sand in lagoonal
areas (Ministry of Fisheries and Marine Resources 1995) was reported as one of the
major factors contributing to ecological damage as the entrapment of fine particulate
matter into the water column leads to death of coral.
There are currently no economic mineral deposits in and around the Comoros. The
extraction of sand and gravel for construction, particularly on Moheli and Anjouan,
has resulted in the destruction of part of the coral reef and represents a continued
threat to coastal areas.
Although no quantitative details are available, the mining of heavy mineral sands in
coastal areas of Zambesia (Mozambique) was identified as a threat to coastal habitats
by Linden and Lundin (1996).
Dredging for minerals is conducted along the south coast of Madagascar around
Tolagnaro, although it is considered to be at the experimental stage.
Granite is mined in the Seychelles for aggregate.
97
Artisanal quarrying of coral-bearing limestone occurs in coastal zones of all the
mainland States and Zanzibar State of The United Republic of Tanzania, although by
the small-scale nature of the workings, the effects on coastal habitats are minor and
localized.
Table 42.
Sites of current and potential mineral exploitation and quarrying in
coastal areas
Deposit Country Location
Use/Product
Rock salt
Tanzania
Lindi
Common salt
Limestone Tanzania
Wazo
Hill
Cement
Kaolin Tanzania Pugu
Hills
Gravel Tanzania All
coast
Construction
Sand Tanzania
All
coast
Construction
Limestone Tanzania
All
coast
Construction
Rutile Tanzania All
coast
Menite
Pan salt
Kenya
Gongoni
Common salt
Gypsum
Kenya
Roka and Tula valleys
Cement
Iron Ore
Kenya
Jaribuni
Cement manufacture
Lead Kenya Kinagoni
Lead
Barite Kenya Vitengeni
Lead
Galena Kenya
Vitengeni
Limestone Kenya
All
coast
Chalk, lime, cement and
ballast
Coral
Kenya
All coast
Construction
stone
Pyrochlore Kenya
Mrima Hill
Niobium, iron manganese,
gold
Clay and Kenya Gongoni,
Mazeras
and
Construction and pottery
sand
Mombasa
Apatite
Kenya
Mrima Hills
Bricks and tiles
Rock
Mauritius
Sea and littoral zone
Eolianite
Mauritius
Sea and littoral zone
Fossil
Mauritius
Lime
Coral
Sand Mozambique
Whole
coast
Construction
Titanium Mozambique
Zambezia
province
Industry
Sand Comoros
Construction
Pebbles Comoros
Construction
Gravel Comoros
Construction
7. Emerging Problems
- Coastal
Urbanization
Problems associated with coastal urbanization relate to increasing populations,
including overall national population growth and continued preferential resettlement
of populations in coastal regions, especially migration to coastal urban centers. These
98
changes will have significant consequences for waste management and the threat of
degradation of water supplies.
- Industrial
Growth
Urban and associated industrial growth in coastal regions can be expected to produce
potential new point sources of pollution impacting directly or indirectly on coastal
waters and inlets. Such growth will lead to an increase in the scale of trading and
associated shipping movements and there will be a need to monitor port-related
pollution. With increases in shipping movements, it may be necessary to expand the
present harbors and ports or develop new ones. The dredging in the vicinity of the
near-shore and coastal environment may affect the delicate marine and associated
wetland ecosystems. Hydrocarbon development is another growth area for example at
the Songo Songo gas field in Tanzania: and this may present potential pollution
hazards which could have extensive consequences for the health of coastal habitats.
Even without urban growth, there are existing point emissions which are producing
significant degradation of platform environments, for example at Dar es Salaam in
Tanzania. Some of the coastal urban centers, such as Zanzibar Town, have poorly
developed sewerage systems and increasing population pressures without remedial
action may lead to serious problems. Much of the coastal population relies on
underground sources for water supply. There are serious risks of groundwater
contamination if more effective sewage management is not introduced as a priority.
Effluents from industrial growth in non-coastal parts of catchments will need to be
monitored.
With the increase in population the demand for hydroelectric power is rising. The
general tendency in the region will be to continue impounding river basins. This may
change the river flow and siltation patterns with negative consequences to the
environment. Predicted sea level rises as a consequence of global warming may
exacerbate the problem of groundwater quality due to saline intrusion, particularly
around Mombasa and Zanzibar Town.
- Tourism
Development
The management of waste and the discharge of chlorinated swimming pool waters
from hotel developments on coastal waterfronts is seen as a growing problem,
particularly in locations without significant tidal flushing and unpredictable
expansion in the tourist population. Although individually small, there are many of
these sources on some coastal regions, and their combined long-term impacts on the
health of platform and reef habitats could be considerable. Other tourism-related
activities, which are growing, and possible sources of direct pollution in sensitive
habitats include the use of powerboats and jet skis. The powerboats and skis may
cause physical habitat degradation through accidental running aground in the shallow
waters, through anchors and oil spills.
99
VI. Stakeholder Analysis
The National reports reveled the following major stakeholders of the identified problems:
Shortage and contamination of fresh water
Mozambique
Ę Ministry of Public Work and Housing
Ę Southern Regional Water Administration
Ę National Water Directorate
Ę Ministry of Health
Kenya
Mauritius
Seychelles
Ę Ministry of Health
Ę Ministry of Environment
Ę Vet Services
Tanzania
Comoros
Ę Ministry of Energy
Ę Ministry of Environment
Ę National Center for Scientific Research
Ę ONG
Madagascar
Decline in harvests of marine living resources
Mozambique
Ę Ministry of Agriculture and Fisheries
Ę Institute of Fisheries Research (IIP)
Ę Institute for the Development of Small Scale Fisheries (IDPPE)
Ę National Biodiversity Unit
Kenya
Ę Department of Fisheries
Ę Kenya Marine and Fisheries Research Institute
Ę Kenya Wildlife Service (KWS)
Ę Kenya Sea Turtle Conservation Committee
100
Mauritius
Ę Ministry of Fisheries and Co-operatives, Fisheries Protection Service
Ę Albion Fisheries Research Centre
Seychelles
Ę Seychelles Fishing Authority (SFA)
Ę Nature Protection Trust of Seychelles
Tanzania
Ę Fisheries Department
Ę Institute of Marine Science
Ę Department of Zoology and Marine Biology, University of Dar es Salaam
Ę Tanzania Fisheries Research Institute (TAFIRI)
Comoros
Ę Direction Generale de la Peche
Ę National Institute for Applied Research on Agriculture, Fisheries and Environment
Ę National Centre of Documentation and Scientific Research
Madagascar
Ę MinistĶre de la PĻche et des Ressources Halieutiques (MPRH)
Ę MinistĶre des Eaux et ForĻts (MEF)
Degradation of coastal habitats (mangroves, seagrass beds, and coral reefs), loss of
biodiversity.
Mozambique
Ę Centre for the Sustainable Development (CDS) for Coastal Zones in the Ministry for
the Co-ordination of Environment Affairs (MICOA)
Ę Local coastal management committees created in some Provinces and Districts
Ę National Directorate for Forestry and Wildlife (DNFFB)
Ę Marine Authority (SAFMAR)
Ę Tourism Department
Ę Fisheries Department
Ę Navy
Ę Coastal City Councils
Ę National Directorate for Forestry and Wildlife
Ę Eduardo Mondlane University (Management of Inhaca and Portuguese Island
Reserves)
Kenya
Ę Coast Development Authority (CDA)
Ę Coastal Management Steering Committee (CMSC)
Ę District Development Committees and Local Authorities
Ę Kenya Wildlife Service (KWS)
101
Mauritius
Ę Department of Environment (EIA)
Ę Department of Local Government
Ę Ministry of Fisheries and Cooperatives
Ę Ministry of Home Affairs
Ę Ministry of Housing and Lands
Ę Ministry of Land Transport, Shipping and Ports
Ę Mauritius Marine Authority
Ę Ministry of Tourism and Leisure
Ę Prime Minister's Office
Ę Ministry of Fisheries and Co-operatives, Marine Parks and Reserves Service Division
Seychelles
Ę Marine Parks Authority
Ę International NGOs for Special Reserves
Ę Town and Country Planning Authority
Ę Ministry of Environment and Transport
Ę Seychelles Island Foundation
Ę Nature Protection Trust of Seychelles
Ę Wildlife Clubs of Seychelles
Ę Bird Life Seychelles
Ę Seychelles Bureau of Standards
Tanzania
Ę TCMP, working through the National Environment Management Council (NEMC)
Ę Mangrove Management Project Ł Forestry Bee-Keeping Department
Ę Marine Parks and Reserves Unit (MPRU) within Fisheries Department
Comoros
Ę Direction generale de l'Environment,
Ę Direction generale de la Peche,
Ę Direction generale du Tourisme
Madagascar
Ę National Protected Areas Management Association
Ę Locally mandated bodies
Overall water quality decline. Contamination of coastal waters, beaches and living
resources.
Mozambique
Ę Ministry of Public Work and Housing
Ę Centre for the Sustainable Development (CDS) for Coastal Zones in the Ministry for
the Co-ordination of Environment Affairs (MICOA)
102
Kenya
Mauritius
Seychelles
Ę Ministry of Environment and Transport
Tanzania
Comoros
Ę Ministry of Environment
Madagascar
Ę Ministry of Transport and Meteorology
Ę Ministry of Fisheries
Ę Ministry of Energy
Ę Ministry of Environment
103
VII. Environmental Quality Objectives
Table 43.
Environmental Quality Objectives, Targets, and Interventions
Environmental
Estimated
Type of
Quality
Targets Activities
Interventions Cost
Intervention
Objectives
in U.S. $
Balanced Marine Reduce Land- Establish common
Develop guidelines for methods of Legislative
/
and Riverine
based pollution by methods for assessing water, sediment, and biota monitoring
Regulatory
Ecosystems
10% by the year water and sediment and assessment (including sampling,
2010
quality, including
analysis, risk assessment and mussel-
bioassays of coastal watch type monitoring)
biota
Develop and establish national/regional Data
Management
land-based activities data and
information management system as a
tool for contaminant assessment and
management
Fill gaps in knowledge Conduct regional assessment of priority Scientific
of priority pollutants land-based activities, sources of
Investigations
(contaminant levels)
contaminants , and pollutant levels in
and major sources of water and sediments;
pollutants (contaminant
inputs)
Routine targeted monitoring of Baseline
riverine, estuarine, and coastal waters,
Investment
sediments, and biota for purposes of
identifying major hot spots of pollution
and land-based activities
104
Environmental
Estimated
Type of
Quality
Targets Activities
Interventions Cost
Intervention
Objectives
in U.S. $
Estimate the carrying Using available information from Scientific
capacity of the coastal existing sources, identify the major
Investigation
waters, using an
ecotones of the region, and their
ecosystem-based
biological and physical components
approach
Develop common regional guidelines
Scientific
for risk assessment of coastal waters
Investigation
Periodic risk assessment (5-year) and Baseline
implementing the first risk assessment
Investment
(1993-4)
Strengthen
regional
National review on policy, legal, and Legislative
/
legal basis for
regulatory frameworks, and
Regulatory
preventing degradation institutional structure for addressing
from land-based
land-based activities
activities
Draft Regional EIA process review in a Legislative
/
regional workshop; adopt regional EIA
Regulatory
and submit to CoP for endorsement in
2003
Develop realistic National Plans of Capacity
Building
Action for land-based sources and
activities
Develop and obtain approval for Legislative
/
Protocol to the Nairobi Convention
Regulatory
with Annexes, on Land Based
Activities and Sources of Pollution
105
Environmental
Estimated
Type of
Quality
Targets Activities
Interventions Cost
Intervention
Objectives
in U.S. $
Determine
and
satisfy
Conduct survey on training needs and Capacity
Building
training needs in region conduct training in Land-Based
for LB activities and activities and sources (for high
sources
officials, mid-level government,
community, experts, industry, etc.)
Develop
educational
Conduct survey on educational needs to Capacity
Building
programs at all levels on support reduction of land-based
LB activities and
activities and sources and implement
sources
the activities to address three top
priority regional educational needs, in
appropriate languages
Develop
Integrate private sector into activities of Policy
Regional/Governmental
this project, as appropriate as sub-
/Private Sector/Public contractor, consultant, or co-sponsor of
Sector partnerships on specific activities
LB activities and
sources
Working with private sector, identify Policy
and secure financing to replicate the
demonstration projects in other areas of
the region
Identify, strengthen, and Develop a public participation and Capacity
Building
involve Stakeholders in awareness (PPA) work plan for the
LBS issues in the Project
Region
Decline in the Fill gaps in knowledge Undertake inventory of selected sites to Scientific
quality of selected of priority in protecting establish species composition, extent
Investigations
coral reef sites the coral reefs
and condition of habitat, and
halted by 2010.
management challenges.
106
Environmental
Estimated
Type of
Quality
Targets Activities
Interventions Cost
Intervention
Objectives
in U.S. $
E
Strengthen regi
stablish/link
onal
with
international
Capacity
Building
networks
network(s) of coral community
professionals (scientists, mangers,
private sector) with knowledge of
international trade in coral reef
organisms
Review ecoregion network of MPAs Institutional
and potentially establish new areas
Strengthening
Strengthen
regional
Advocate for the establishment / Legislative
/
legal basis
harmonization of local, national,
Regulatory
regional, and international sectoral
legislation (i.e. fisheries, tourism, trade
in coral reef organisms) relevant to the
conservation and management of coral
reef/community plant and animal
species.
Promote the adoption of measures to Capacity
Building
address global warming and climate
change
Four
medium
Develop site and habitat Promotion of environmental and Capacity
Building
quality and 3 high specific management
community-based tourism
quality coral sites plans through a
have improved by participatory process
at least 1 status which includes local
level by 2010
communities for each
site/seascape
107
Environmental
Estimated
Type of
Quality
Targets Activities
Interventions Cost
Intervention
Objectives
in U.S. $
Strengthen
effectiveness
of
Legal/regulatory
enforcement measures
Promotion of research in key sectors
Capacity
Building
(e.g. habitat restoration, impact of
climate change, tourist carrying
capacities) involving local
communities.
Implementation of coral restoration Incremental
projects.
Investments
Establishment of education and Capacity
Building
awareness programmes
Support sustainable artisanal fishing Capacity
Building
(gear, vessels, loans etc.)
Ban coral mining and find alternative Legislative
/
building materials
Regulatory
Identify and establish alternative Policy
sources of income generation etc to
take the pressure off reefs.
108
Environmental
Estimated
Type of
Quality
Targets Activities
Interventions Cost
Intervention
Objectives
in U.S. $
At
least
100,000
Fill gaps in knowledge Collect and/or verify baseline data on Scientific
ha of healthy, of priority for protection extent, diversity, local uses of
Investigations
viable, and
of mangrove forests
mangrove products, and management
representative
challenges
mangrove forests
spanning the
ecoregion by 2010.
Strengthen
regional
Review, harmonize, and strengthen Legislative/
legal basis for
relevant local, national, regional and
Regulatory
protection of mangrove international conventions, policies and
forests
legislation
Management
plans
Develop national mangrove
Policy
developed for all
management
selected mangrove sites strategies/plans/frameworks (including
of global and
community participation and
ecoregional importance empowerment)
by 2006
Strengthen the capacity of local Institutional
conservation groups to conserve
Strengthening
mangroves
Effective enforcement of closed Legislative/
seasons for mangrove harvesting
Regulatory
109
Environmental
Estimated
Type of
Quality
Targets Activities
Interventions Cost
Intervention
Objectives
in U.S. $
Develop acceptable alternatives to use Incremental
of mangroves for fuel and building
Investments
Decline
in
quantity
Fill gaps in knowledge
Improve knowledge of distribution, Scientific
and quality in sea
condition and management of seagrass
Investigations
grass sites will
communities in priority sites (or in
have been halted
EAME if insufficient information)
by 2010
Strengthen legal basis
Ensure that the importance of sea grass Legislative
/
beds is reflected in national policies
Regulatory
and legislation
Establishing policy and legal
Legislative/
frameworks within and between
Regulatory
countries in regions that protect sea
grass meadows from destructive
practices including trans-border
destructive fishing practices
Harmonize national sectoral legislation Legislative
/
within each country.
Regulatory
Undertake a participatory planning Capacity
Building
process for each site/seascape to
identify challenges and locally
acceptable management mechanisms.
110
Environmental
Estimated
Type of
Quality
Targets Activities
Interventions Cost
Intervention
Objectives
in U.S. $
Develop
site-specific
Implement management plans, monitor Legislative
/
management plans for
and review their success
Regulatory
selected sea grass areas
(could be in the context
of larger management
activities (e.g. MPAs))
Advocate for better regulation of the Capacity
Building
international trade in sea-shells
Raise sea grass as an important Capacity
Building
ecosystem to be considered by the
Nairobi Convention
Link with international sea grass Capacity
Building
conservation initiatives
Establish/compile guidelines to inform Capacity
Building
all seascape(site) based planning
processes
Promote general research on methods Capacity
Building
of restoration.
Support artisanal fishermen in Baseline
undertaking sustainable fishing (gear,
Investments
vessels, loans etc.) Identify and
establish alternative sources of income
generation etc to take the pressure off
sea grass beds.
Sustainable
The economic use Fill gaps in knowledge
Establish current levels and patterns of Scientific
productivity from of threatened or
trade of selected species
Investigations
coastal living
endangered living
resources
resources
stabilized by 2010
111
Environmental
Estimated
Type of
Quality
Targets Activities
Interventions Cost
Intervention
Objectives
in U.S. $
Establish distribution and abundance
Scientific
Investigations
Identify areas where species are and Scientific
are not threatened by over-exploitation
Investigations
Establish criteria for "healthy" Scientific
situation
Investigations
Reduce the use of
Strengthen Legal basis
Ensure that legislation regulating Legislative/
illegal fishing
fishing gear, quotas, size limits,
Regulatory
methods by 50 %
seasons, and allowed fishing areas are
by 2010
in place
Strengthen enforcement of quotas, size Policy
limits, seasons, etc.
Help harmonize fishing regulations Policy
between EAME countries
Establish "no take zones" either Legislative
/
geographically or seasonally
Regulatory
Promote establishment of appropriate Legislative
/
regional fishing international
Regulatory
agreements
Develop site-specific or Ensure management plans are
Legislative/
species-specific
developed, implemented and monitored
Regulatory
management plans that
with local communities and user groups
promote sustainable
utilization and protect
nursery or reproduction
areas
Provide
alternative
Develop and demonstrate mechanisms Policy
technologies
to reduce by-catch
112
Environmental
Estimated
Type of
Quality
Targets Activities
Interventions Cost
Intervention
Objectives
in U.S. $
Stabilized high By 2012, reduce Develop guidelines and Develop common regional guidelines None
Legislative /
quality fresh
degradation from monitoring
for periodic assessment of river water available
Regulatory
water supplies
LB activities by 50
quality .
(surface and
%
groundwater)
Implement a first periodic assessment None
Baseline
(3-year interval) of the river water available
Investment
quality and trends
Sustainable
Develop International
Review and strengthening of existing Legislative
/
allocation of water agreements on shared
international river system agreements.
Regulatory
use by 2010
water basins.
Develop new agreements
Harmonize environmental and
Policy
economic policy
Monitor supply and quality of water in Baseline
major rivers
Investment
Prepare
environmental
impact
Baseline
assessments (EIAs) for major
Investment
investments
Support freshwater resource tenure and Baseline
valuation
Investment
Organize pilot Small Island
Baseline
Developing State (SIDS) groundwater
Investment
governance
By 2012, areas of
Develop common guidelines for None
Scientific
groundwater
periodic assessment of ground-water available
Investigations
contamination
quality trends
declining by 10%
Develop and implement a groundwater None
Baseline
quality trend monitoring programme
available
Investment
113
Environmental
Estimated
Type of
Quality
Targets Activities
Interventions Cost
Intervention
Objectives
in U.S. $
Conduct the first periodic assessment None
Baseline
of groundwater quality and its trends available
Investment
(after 5-6 years)
114
VIII. Bibliography
Abdoulhalik, F. M. 1997. Marine Science Country Profiles: Comoros Intergovernmental
Oceanographic Commission. Paris.
Alusa, A. and Ogallo, L.1992. Implications of Expected Climate Change in the Eastern
African Coastal Region: an Overview. UNEP Regional Seas Reports and Studies No.
149.
Arthurton, R. S. 1992. Beach erosion: Case studies on the East African Coast. In
Proceeding of the International Convention on the Rational Use of the Coastal Zone.
UNESCO-IOC and Bordomer Organization. Bordeaux. pp. 91-95.
Bandeira, S. O. 1995. Marine botanical communities in Southern Mozambique: Sea
grass and seaweed diversity and conservation. Journal of the human environment,
AMBIO, Vol. 24, No. 506-509.
Barra, S. National Coordinator. 1997. Country Report of the Seychelles.
Bjork, M., Mohammed, S. M., Bjorklund M., and Semesi, A. 1995. Coralline algae,
Important Coral Reef Builders Threatened by Pollution. Ambio, Vol. 24, No. 7-8: 502-
505.
Bliss-Guest, P. 1983. Environmental Stress in the East African Region. AMBIO Vol. 12
No. 6: 290-295.
Buuren, J.C.L van and Heide, J. van. 1995. Abatement of the Water Pollution in the
Infulene Basin. Final Report of the Infulene Water Quality Management Project 1991-
94. Universidade Eduardo Mondlane and Delft University of Technology Report no 63.
Casadei E., Costa M., Repetto G., Cardoso C. and Halari J., 1985. Influencia de factores
multiplos sobre os niveis de nitratos em pocos da cidade de Maputo. Proceedings from
the V National Health Research Workshop. Inhambane, 4-9 November 1985.
Coastal Zone Management Centre (CZMC)
Dorsch Consult and Ministry of Water, Construction, Energy, Lands and Environment.
1992. Rehabilitation and improvement of Zanzibar Municipality sewerage, drainage and
solid waste disposal system. Intermediate Report. Zanzibar. 193 pp.
Dulvy, N.K., D. Stanwell-Smith, W.R.T. Darwall, and C.J. Horrill. 1995. Coral mining
at Mafia Island, Tanzania: A management dilemma. Ambio Vol. 24, No. 6: 356-365.
Dulymamode, R., Bhikajee, M. and Sanassee, V. 2001. Mauritius National Report, Phase
1: Integrated Problem Analysis.
115
Fernandes, A. 1995. Pollution in Maputo Bay: Contamination levels from 1968 to
1996. Revista Medica de Mozambique 6 (34). Instituto Nacional de Saide.
Fernandes, A. 1996. Poluicao: Factos e figuras. Proceedings from the Workshop on the
Role of Research in Coastal Zone Management, Maputo, 24-25 de Abril, 1996.
Departamento de Ciencias Biologicas, Universidade Eduardo Mondlane.
Fernandes, A. and Hauengue, M.A. 1997. Protection and management of the marine and
coastal areas of the Eastern African Region (EAF/5): Land-based sources and activities
affecting the coastal marine and associated fresh water environments: Mozambique
National Report. 25 pp.
Food and Agriculture Organization of the United Nations Project for the Protection and
Management of the Marine and Coastal Areas of the Eastern African Region (EAF./5).
Strategic Action Plan for Land-Based Sources and Activities Affecting the Marine,
Coastal and Associated Fresh Water Environment in the Eastern African Region.
Francis, J. and Mwinuka, S. and Richmond, M. 2000. UNEP/FAO. A Schoolteacher's
Guide to Marine Environmental Education in the Eastern African Region.
Francis, J., Wagner, G.M., Mvungi, A., Ngwale, J., Salema R. 2001. Tanzania National
Report, Phase 1: Integrated Problem Analysis (Draft).
Global Environment Facility. 2000. Report of the First Meeting of the Working Group on
Integrated Problem Analysis (WGIPA-I).
Global Environment Facility. 2001. Report of the Second Meeting of the Working Group
(WGIPA-II).
Global Environment Facility. 2001. Report of the Consultations on the Second Phase of
the GEF MSP Sub-Saharan Project.
Government Management and Information Sytem Division. (1996) Seychelles
Goyet, S. and Niang-Diop, I., 2001 (draft). Regional Consolidated Analysis, Phase I Ł
Integrated Problem Analysis.
Guard, M. 1997. An assessment of community dependence on and management of
coastal resources in southern Tanzania. Second Meeting for Preparation of the
Transboundary Diagnostic Analysis of the Western Indian Ocean Nairobi, Kenya, 1-4
December, 1997, UNEP, Nairobi: 16 pp.
Guard, M. and M. Masaiganah. 1997. Dynamite fishing in southern Tanzania.
Geographic variation. Intensity of use and possible solution. Mar. Poll. Bull. (in press)
116
Hatton, J.C. and Couto, A.L. 1992. The effect of coastline changes on mangrove
community structure, Portuguese Island, Mozambique. In: the ecology of mangrove and
related ecosystems. Kluwer Academic Publisher. Hydrobiology, 147, 49-57.
Hoguane, A.M., Motta, H. Lopes, S., and Menete, Z. 2001. Mozambique National
Report, Phase 1: Integrated Problem Analysis (Draft).
Horrill, C. and Kamau, I.. 2001. Proceedings of the Eastern Africa Marine Ecoregion
Visioning Workshop.
Intergovernmental Conference to Adopt a Global Programme of Action for the Protection
of the Marine Environment from Land-Based Activities, 1995. Global Programme of
Action for the Protection of the Marine Environment from Land-Based Activities.
International Coral Reef Action Network. ICRAN.
International Maritime Organization (IMO) Global Ballast Water Management
Programme.
IUCN/UNEP. 1982. Conservation of Coastal and Marine Ecosystems and Living
Resources of the East African Region. UNEP Regional Seas Reports and Studies No. 11.
UNEP Nairobi.
IUCN/UNEP. 2001. Conservation of Coastal and Marine Biodiversity in the Eastern
African Region. Progress in Implementation of the Jakarta Mandate by the Contracting
Parties to the Nairobi Convention.
Jones, T., Payet, R. Beaver, K. and Nalletamby, M. 2001. Seychelles National Report,
Phase 1: Integrated Problem Analysis.
Kazungu, J.M., Munga, D., Mwaguni, S., and Ochiewo, J. 2001. Kenya National Report,
Phase 1: Integrated Problem Analysis (Draft).
Kent, P.E., J. A. Hunt and Johnstone, D. W., 1971. The geology and geophysics of
coastal Tanzania. Geophysical paper No. 3, Natural Environment Research Council.
Institute of Geological Sciences, London. Kivaisi. A.K. and Van Bruggen, J.J.A. 1990.
The quality of drinking water in Zanzibar Town. Prepared for the Zanzibar urban water
supply development plan. Zanzibar, Tanzania.
Lambrechts, N. 1997. Risk evaluation of the Infulene Valley and Monitoring of the
Infulene River Water. Hogeschool's ŁHertogenbosh. The Netherlands.
Lionnet, G. 1983. Islands Not Unto Themselves. AMBIO Vol. 12 No. 6: 288-289.
Lundin, C.G. and Linden, O. (eds.) 1995. Integrated Coastal Zone Management in
Seychelles: Proceedings from a National Workshop, 20-24 February, 1995. Government
117
of Seychelles, Sida. The World Bank. Environment Department, World Bank,
Washington D.C. 1995, pp. 158.
Lundin, C.G. and O. Linden (eds). 1996. Integrated Coastal Zone Management in
Mozambique. Proceedings of the National Workshop on Integrated Coastal Zone
Management in Mozambique. Inhaca Island and Maputo, Mozambique, May 5-10, 1996.
Makoloweka, S. and K. Shurcliff. 1997. Silencing the dynamite fishers. People and the
Planet. 6 (2): 24-25.
Massinga, A. and Hatton, J. 1997. Status of the Coastal zone of Mozambique. In: C.G.
Lundin and O. Linden (eds) Integrated Coastal Zone Management in Mozambique.
Proceedings of the National Workshop on Integrated Coastal Zone Management in
Mozambique. Inhaca Island and Maputo, Mozambique, May 5-10, 1996. 7-68 pp.
Matthes, H. and J.M. Kapetsky. 1988. Worldwide compendium of mangrove-associated
aquatic species of economic importance. FAO Fish.Circ. 814. 236 pp.
MICOA 1995a. Terms of References for the Coastal Zone Management Center in Xai-
Xai in Southern Africa (draft).
Mwaguni, S. and Munga, D. 1997. Land based sources and activities affecting the quality
and uses of the marine, coastal and associated freshwater environments along the Kenya
coast. Coastal Development Authority. Mombasa.
National Institute for Statistics (1996). Maputo. Mozambique.
National Physical Development Plan 1995. Volume I : Strategy and Policies Planning
Division. Ministry of Housing, Lands, and Town and Country Planning. Mauritius.
Olembo, R. 1983. The East African Region: A Collection of Diversity. AMBIO Vol. 12,
No. 6: 284-287.
Rajagopalan, R. , International Ocean Institute Operational Centre, IOI-India. The Indian
Ocean in the Twenty-first Century.
Rakotofiringa, S., Coordonnateur National du Projet TDA Madagascar. 1998.
Ranaivoson, J. 1997. Marine Science Country Profiles: Madagascar Intergovernmental
Oceanographic Commission. Paris.
Richmond, M. and Francis, J. 1999. Marine Science Development in Tanzania and
Eastern Africa. Proceedings of the 20th Anniversary Conference on Advances in Marine
Science in Tanzania. WIOMSA Book Series No. 1.
118
SEACAM, 1999. Environmental Assessment of Coastal Aquaculture Development. A
short guide for policy makers.
SEACAM, 2000. Environmental Assessment of Coastal Tourism, a short guide for
policy makers.
SEACAM, 2000. The Eastern African Coastal Management Database.
Seychelles Centre for Marine Research and Technology Ł Advancing Marine Science for
a Sustainable Future.
Sheppard, C.R.C. 1987. Coral species of the Indian Ocean and adjacent seas a
synonymized compilation and some regional patterns. Atoll Res. Bull. 307 1-32.
Siegel, P. 2001. Eastern African Marine Ecoregion Draft Conservation Plan.
Skagen, D. W., Palha de Sousa, L. and Pacule, H. 1997. The industrial shallow water
fishery at Sofala Bank 1996-97. Instituto de Investigacao Pesqueira, Maputo. Internal
report.
Tanzania Coastal Management Partnership Ł Science and Technical Working Group.
TDA-SAP-WIO. National Reports.
UNEP/GEF, 2000. Development and Protection of the Coastal and Marine Environment
in sub-Saharan Africa. Project Brief.
UNEP/Institute of Marine Sciences, University of Dar es Salaam/FAO/SIOA. 1998.
Overview of Land-based Sources and Activities Affecting the Marine, Coastal and
Associated Freshwater Environment in the Eastern African Region. UNEP Regional Seas
Reports and Studies No. 167.
UNEP/Institute of Marine Sciences, University of Dar es Salaam. 1998. Western Indian
Ocean Transboundary Diagnostic Analysis (Draft).
UNEP, 1998. Water-Related Environmental Issues and Problems of Mozambique and
Their Potential Regional and Transboundary Importance. Preparation of a
Transboundary Diagnostic Analysis and Strategic Action Programme for the Marine and
Coastal Environment of the Western Indian Ocean.
UNEP, EAF tour. Regional Seas. The countries of Eastern Africa.
UNEP/Institute of Marine Sciences, Global Environment Facility, 2001 (draft). Our
Waters, Our Peoples, Strategic Action Programme for the Marine and Coastal
Environment of the Western Indian Ocean Region.
119
UNEP/Institute of Marine Science, Zanzibar, Tanzania, and Global Environment Facility,
1998. Transboundary Diagnostic Analysis for the Marine and Coastal Environment of
the Western Indian Ocean Region (draft).
UNEP Comments on the World Bank Ł Southwest Indian Ocean Fisheries Project
(SIOFP). UNDP Comments on Revised World Bank Concept Note Western Indian
Ocean Fisheries Project (draft). The Southwest Indian Ocean Fisheries Project Concept
Document (draft).
UNEP/WB/GEF. Prayag, R.H. Mauritius Country Report. Water Related Environmental
Issues and Problems of Mauritius and Their Potential Regional and Transboundary
Importance.
UNEP 2001. Eastern Africa Atlas of Coastal Resources. Tanzania.
UNEP, 1985. Convention for the Protection, Management and Development of the
Marine and Coastal Environment of the Eastern African Region and related protocols.
UNEP. Critical Policy Issues Relating to the Future of the Abidjan and Nairobi
Conventions, Requiring Urgent Measures and Decisions by Governments.
UNEP 1998. Eastern Africa Atlas of Coastal Resources. Kenya.
UNEP/IOI. The United Nations Convention on the Law of the Sea in the Twenty-First
Century.
UNEP/IOI. The United Nations Convention on the Law of the Sea in the Indian Ocean.
UNEP. 2000. Regional Seas: A Survival Strategy for Our Oceans and Coasts.
UNEP. Synergies. Issue 2, April 2000. Promoting Collaboration on Environmental
Treaties.
UNEP. Critical Policy Responses Required to Revitalize the Abidjan and Nairobi
Conventions.
UNEP. 1997. Eastern Africa Atlas of Coastal Resources: Kenya. Malindi Sheet.
UNEP. 1997. Eastern Africa Atlas of Coastal Resources: Kenya. Tana River Sheet.
UNEP/1997. Report Prepared for the Global Programme of Action for the Protection of
the Marine Environment from Land-Based Activities in the Eastern African Region and
The Protection and Management of the Marine and Coastal Areas in the Eastern African
Region (EAF/5)
120
UNEP 1998. Water-Related Environmental Issues and Problems of Seychelles and Their
Potential Regional and Transboundary Importance. Preparation of a Transboundary
Diagnostic Analysis and Strategic Action Programme for the Marine and Coastal
Environment of the Western Indian Ocean.
UNEP 1998. Water-Related Environmental Issues and Problems of Comoros and Their
Potential Regional and Transboundary Importance. Preparation of a Transboundary
Diagnostic Analysis and Strategic Action Programme for the Marine and Coastal
Environment of the Western Indian Ocean.
UNEP 1998. Water-Related Environmental Issues and Problems of Madagascar and
Their Potential Regional and Transboundary Importance. Preparation of a
Transboundary Diagnostic Analysis and Strategic Action Programme for the Marine and
Coastal Environment of the Western Indian Ocean.
UNEP 1998. Water-Related Environmental Issues and Problems of Mauritius and Their
Potential Regional and Transboundary Importance. Preparation of a Transboundary
Diagnostic Analysis and Strategic Action Programme for the Marine and Coastal
Environment of the Western Indian Ocean.
Western Indian Ocean Marine Science Association (WIOMSA).
World Bank Proposal. Western Indian Ocean Islands Oil Spill Contingency Planning.
World Meteorological Organization (WMO) and The Intergovernmental Oceanographic
Commission (IOC) of UNESCO. West Indian Ocean Marine Application Project
(WIOMAP) Draft Project Proposal.
WWF Eastern African Marine Ecoregion Ł A large-scale approach to the management of
biodiversity.
121