
The Cover
The cover photograph depicts a child holding an orange and is meant to symbolize a clean
Orange-Senqu River, a river with potential for sustaining future livelihoods
and supporting sustainable economic growth in the basin countries.
Contents
i
Acknowledgements
vii
Abbreviations and acronyms
viii
Glossary of terms
xii
Executive Summary
xv
Priority transboundary concerns
xxi
1. Introduction
1
2. Methodology
2
2.1 Background
2
2.2 Orange-Senqu TDA Methodology
2
2.2.1 Identification of the priority transboundary issues
2
2.2.2 Thematic Reports
4
2.2.3 Development of causal chains for the priority transboundary problems
4
2.2.4 Stakeholder analysis
5
3. Description of the Basin
6
3.1 Physical Characteristics
6
3.1.1 Geology and soils
6
3.1.2 Surface and groundwater resources
6
3.1.3 Climate in the region
9
3.1.4 Water quality
10
3.1.5 Climate change
13
3.1.5.1 Introduction
13
3.1.5.2 Present climatic conditions in southern Africa
14
3.1.5.3 Detecting Climate Change in the Orange-Senqu Basin
16
3.1.5.4 Future climate scenarios and responses in the Orange-Senqu basin
19
3.1.5.5 Potential impacts of climate change in the Orange-Senqu Basin
21
3.1.5.6 Vulnerability and Adaptation to climate change in the Orange-Senqu Basin
27
3.2 Ecological Status
30
3.2.1 Natural Ecosystems and Biodiversity
31
3.2.2 Land-use and ecological threats
33
3.3 Socio-Economic Situation in the Orange-Senqu Basin
37
3.3.1 Demographic Trends
38
3.3.2 Land-use and Economic Indicators
38
3.3.3 Social and health Indicators
41
3.4 Legal and Institutional Setting
41
3.4.1 International law framework
41
3.4.2 Regional policy framework
45
3.4.3 International institutional framework
46
3.4.4 National legislation, policies and institutions
46
3.4.4.1 Botswana
47
3.4.4.2 Lesotho
49
3.4.4.3 Namibia
52
i
Contents
ii
3.4.4.4 South Africa
54
3.4.5 Capacity
57
3.4.6 Conclusion and recommendations
58
4. Priority transboundary problems
59
4.1 Stress on ground and surface water resources
59
4.1.1 Basin Description in terms of water resources
59
4.1.2 Existing surface water resources infrastructure
60
4.1.3 System Management and Operation
62
4.1.4 Water resources
63
4.1.5 Current and projected water demand
65
4.1.6 Water Balance
73
4.1.7 Environmental and socio-economic consequences of the problem
77
4.1.8 Knowledge Gaps
79
4.1.9 Immediate, underlying and root causes
80
4.1.10 Summary and recommendations, including potential short
to medium term interventions
84
4.2. Changes to Hydrological Regime
86
4.2.1 Description of the problem and justification of its transboundary importance.
86
4.2.2 Environmental and socio-economic consequences
93
4.2.3 Linkages with other transboundary problems
95
4.2.4 Immediate, underlying and root causes
95
4.2.5 Knowledge Gaps
100
4.2.6 Summary and recommendations
100
4.3 Deterioration of Water Quality
101
4.3.1 Overview of the Water Quality Situation in the Orange-Senqu Basin
101
4.3.2 Water Quality Management
124
4.3.3 Environmental Impacts and socio-economic consequences:
130
4.3.4 Causal chain analysis
132
4.3.5 Knowledge gaps
134
4.3.6 Summary and recommendations, including potential short-
and medium-term SAP interventions
135
4.4 Land Degradation
141
4.4.1 Description of the problem and a justification of its transboundary importance
141
4.4.2 Major environmental impacts and socio-economic consequences
149
4.4.3 Linkages with other transboundary problems
153
4.4.4 Immediate causes of land degradation
153
4.4.5 Underlying causes of land degradation
155
Poor land-use policies and planning
155
Unsustainable tenure systems and limited land-use options
155
4.4.6 Anthropogenic and natural root causes
157
Increased poverty and human pressure
157
4.4.7 Knowledge and capacity gaps
158
ii
Contents
iii
4.4.8 Summary and recommendations, including potential short-medium
SAP interventions
158
4.5 Increases in the abundance of Alien Invasive Species
160
4.5.1 Description of the problem and justification of its transboundary importance
160
4.5.2 Major ecological impacts and socio-economic consequences
of increased occurrenc and spread of alien invasives
162
4.5.3 Linkages with other transboundary problems
165
4.5.4 Immediate causes of increased alien invasive species abundance
165
4.5.5 Underlying causes of an increase in alien invasive species
165
4.5.6 Anthropogenic and natural root causes
165
4.5.7 Knowledge gaps
166
4.5.8 Summary and recommendations
166
5. Stakeholder analysis (analysis of views and opinions of stakeholders)
168
5.1 Introduction
168
5.2 Variation and reduction of hydrological flow
168
5.3 Deterioration of water quality
169
5.4 Landscape Degradation
170
5.5 Alien invasive species (plants and animals)
171
5.6 General Attitudinal Questions
171
5.7 Recommendations
173
6. Overall conclusions and recommendations
171
References
178
Appendix 1: Plates
189
Appendix 2: List of tables
196
Appendix 3: List of figures
197
iii
Acknowledgements
iv
The Orange-Senqu TDA was compiled by a consulting consortium made up of experts from Tethys Envi-
ronmental Consultants and the Southern African Institute for Environmental Assessment. These were (in
alphabetical order) Peter Adamson, Jon Barnes, Chris Brown, Morgan Hauptfleisch, Mary Mathews, Daniel
Malzbender, John Mendelsohn, Andrew Tanner, Jaqueline Tarr, Peter Tarr, Tim Turner and Bryony Walms-
ley. They were assisted by Messrs Bore Motsamai and Felix Monggae in Lesotho and Botswana respec-
tively.
Funding was provided by GEF through UNDP and guidance and supervision was provided by Orasecom and
technical officials from the four basin countries. The following are acknowledged for their guidance and
contributions: Maria Amakali, Dudley Biggs, Stefan de Wet, Piet Heyns, Viviane Kinyaga, Emmanuel
Lesoma, Magda Ligthelm, Boikanyo Mpho, Martha Mwandingi, Birga Ndombo, Peter Pyke, Seef Rademeyer,
Lawrence Ramosoeu, Alloycious Salagae, Lucy Sekoboto, Thato Setloboko, Khomoatsana Tau, Leo van
den Berg, Peter van Niekerk and Akiko Yamamoto.
The GTZ Orange-Senqu IWR Management Plan provided invaluable supporting information and knowledge
to the TDA team and we would like to thank Horst Vogel and his consultants WRP for their collaboration.
The
hundreds
of
stakeholders
from
across
the
basin
are
thanked
for
contributing
their
knowledge, insights and opinions. Gudrun Denker is thanked for assisting with administrative and
logistical arrangements.
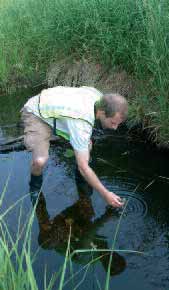
Finally, the following are acknowledged for providing the photographs used in this publication:
CSIR
DWAF RSA
Keith Agar
Morgan Hauptfleisch
Peter Tarr
Bryony Walmsley
iv
Abbreviations and acronyms
v
ACRU model
A modelling system used in conjunction with RCMs (notably the C-CAM) by
modellers to evaluate impacts of climate change on the hydrology and water
resources in Southern Africa.
ARB- Botswana
Agricultural Resources Board
BAT
Best Available Technology
BCLME
Benguela Current Large Marine Ecosystem Programme
BHC
a-Hexachlorocyclohexanine
BWSF
Basin Wide Stakeholder Forum
CBO
Community-based Organisation
CC
Climate change
C-CAM
The Conformal-Cubic Atmospheric Model. This is a regional climate model used
extensively in climate change studies relating to the water sector in South Africa.
CMA
Catchment Management Authority
CMS
Catchment Management Strategy
CEIMP
Consolidated Environmental Implementation Management Plan
CEPF
Critical Ecosystem Partnership Fund
CSIR
Council for Scientific and Industrial Research
CV
Coefficient of variation (expressed as %)
CVS
Contingent Valuation Study
DCPF-Botswana
Department of Crop Production and Forestry
DDC-Botswana
District Development Committee
DDP- Botswana
District Development Plan
DDT
Dichloro-Diphenyl-Trichloroethane
DEAT-SA
Department of Environmental Affairs and Tourism
DIN
Dissolved Inorganic Nitrogen
DO
Dissolved Oxygen
DRM
Directorate: Resource Management (Namibia)
DWA- Namibia
Department of Water Affairs
DWA- Botswana
Department of Water Affairs
DWAF-SA
Department of Water Affairs and Forestry
EIA
Environmental Impact Assessment
EIA
Environmental Impact Assessment
ENSO
El Ni±o/Southern Oscillation
EWR
Environmental Water Requirement
EWT
Endangered Wildlife Trust
FAO
Food and Agriculture Organisation of the United Nations
GCM
General Circulation Model for climate
GDP
Gross Domestic Product
GEF
Global Environment Facility
GHG
Greenhouse gas
GIS
Geographic Information System
GIWA
Global International Waters Assessment
GoB
Government of Botswana
GoSA
Government of South Africa
v
Abbreviations and acronyms
v i
Govt
Government
GTZ
Gesellschaft fur Technische Zusammenarbeit
HadCM2
The UKMO, climate change model developed by the Hadley Centre, UK (termed
HadCM2), a revised version of the original GCM (HadCM).
HIV/AIDS
Human Immunodefficiency virus / acquired immunodeficiency syndrome
IDP
Integrated Development Plan
IPCC
Intergovernmental Panel on Climate Change
ISP
Internal Strategic Perspective
ITCZ
Intertropical Convergence Zone. A belt of low pressure occurring at the equator.
It is formed by the vertical ascent of warm, moist air from the latitudes above and
below the equator
IVRS
Integrated Vaal River System
IW
International Waters
IWRM
Integrated Water Resources Management
LHDA
Lesotho Highlands Development Authority
LHWC
Lesotho Highlands Water Commission
LHWP
Lesotho Highlands Water Project
LORMS
Lower Orange River Management Study
MAP
Mean Annual Precipitation
MAR
Mean annual runoff
MAWF
Ministry of Agriculture, Water and Forestry (Namibia -formerly MAWRD)
MAWRD- Namibia
Ministry of Agriculture, Water and Rural Development
MDG
Millennium Development Goal
MET-Namibia
Ministry of Environment and Tourism
MEWT-Botswana
Ministry of Environment, Wildlife and Tourism
mg/l
Milligrams per litre
MLRR-Namibia
Ministry of Lands, Rehabilitation and Resettlement
Mm3/a
Million cubic metres per annum
MMEWR
Ministry of Mines, Energy and Water Resources (Botswana)
MNR
Ministry of Natural Resources (Lesotho)
MoA- Botswana
Ministry of Agriculture
mS/m
Millisiemens per metre
N
Nitrogen
NACOMA
Namib Coast Biodiversity Conservation and Management Project
NCCRS
National Climate Change Response Strategy (South Africa)
NCSA- Botswana
National Conservation Strategy (Coordinating) Agency
ND
Not determined
NGO
Non-governmental Organisation
NH4
Ammonia
NEMA-SA
National Environmental Management Act
NPC
National Planning Commission
NWA
National Water Act of 1998 ( South Africa)
NWRS
National Water Resources Strategy (South Africa)
NWS
National Water Strategy
v i
Abbreviations and acronyms
v ii
NWSP
National Wetland Strategy And Policy
NWRMR
Namibian Water Resources Management Review
OSRB
Orange-Senqu River Basin
Orasecom
Orange-Senqu River Basin Commission
ORRS
Orange River Replanning Study
P
Phosphorus
PCB
Polychlorinated Biphenyls
PCDD
Polychlorinated Dibenzo-_-Dioxins
PCDF
Polychlorinated Dibenzo-Furans
PDF B
Project Development Facility Block B
PES
Present Ecological Status
PMU
Project Management Unit
PO4
Phosphate
POPs
Persistent Organic Pollutants
PPRI
Plant Protection Research Institute
PSC
Project Steering Committee
PWC
Permanent Water Commission
QC
Quaternary Catchment
QL SHA
Qualitative Stakeholder Analysis
QN SHA
Quantitative Stakeholder Analysis
RCCM
Regional Climate Change Models
RCM
Regional Circulation Model
RM
Risk Management
RQS
Resource Quality Services
RSA
Republic of South Africa
RWQO
Receiving Water Quality Objective
SADC
Southern African Development Community
SACSCC
The South African Country Study on Climate Change
SAPIA
Southern African Plant Invasions Atlas
SCS technique
Soil Conservation Service technique.
SAP
GEF Strategic Action Program
SHA
Stakeholder analysis
SHF
National Stakeholder Forum
SST
Sea surface temperatures
TDA
GEF Transboundary Diagnostic Analysis
TDA
Total Dissolved Solids
TEQ
Total Equivalent Factor
TP
Total Phosphorus
TTG
Technical Task Group (Consulting team)
TTT
Technical Task Team (Orasecom)
UNDP
United Nations Development Program
UNEP
United Nations Environment Programme
VS
Vaal Stem (notation for water quality monitoring points on the main stem of the
Vaal River)
v ii
Abbreviations and acronyms
v iii
WARMS
Water-use Authorisation and Registration
WASA
Water and Sewage Authority (Lesotho)
WMA
Water Management Area
WMS
Water Monitoring System
WQ
Water Quality
WR
Water Resources
WRC
Water Research Commission (South Africa)
WRM
Water resource management
WRPM
Water Resources Planning Model
WRYM
Water Resources Yield Model
WB
World Bank
WRQOs
Water Resource Quality Objectives
WSSD
World Summit on Sustainable Development
WUE
Water Use Efficiencies
WWTP
Waste Water Treatment Plant
WWTW
Waste Water Treatment Works
ZAR
South African currency (Rands)
Ąg/l
Micrograms per litre
v iii
Glossary of tems
ix
Accidental spills: A transboundary issue in the Orange-Senqu River Basin. Accidental spills refer to the
adverse effects of accidental episodic releases of contaminants and materials to the aquatic environment
as a result of human activities.
Causal chain analysis: Examines the sequence of events that cause environmental and socio economic
impacts. The first step of the analysis examines the immediate causes of the issue. The next step studies
the sectoral pressures that underlie the immediate causes including a detailed analysis of current
governance structures that affect the sectoral or immediate causes (e.g. regulations, public
participation, institutions).
Category D status: Wetland classification for habitat integrity, indicating a wetland which has been
largely modified, and in which the losses of natural habitats and basic ecosystem functions are extensive.
Deterioration of water quality: A transboundary issue in the Orange-Senqu River Basin. Deterioration of
water quality refers to the contamination of water bodies as a result of human activities. Contaminants
are here defined as compounds that are toxic and/or persistent and/or bioaccumulating.
Ecological system (ecosystem): A community of living organisms and the environment in which they live,
interacting to form a whole functional system.
Ecosystem degradation: A transboundary issue in the Orange-Senqu River Basin. Ecosystem degradation
refers to anthropogenic interventions in ecosystem resulting in deforestation, land degradation and
losses in species.
Environmental impact: The adverse effect of a transboundary issue on the integrity of an ecosystem.
For example, loss of natural productivity and biodiversity as a result of the loss of an ecosystem or
ecotone.
Governance: A response term embracing regulations, laws, policies, projects and institutions.
The absence of effective governance is not regarded as the cause of pressure on the environment but as
a failure to deal with a pre-existing cause.
Governance analysis (GA): describes the dynamic relations within political and social structures that
underpin such aspects as legislative and regulatory frameworks, decision-making processes and budgetary
allocations.
Hotspot: A source of pollution whose impact results in exceedance of the prescribed limits in water
bodies located within the boundaries of one administrative unit (District), thereby creating a greater
threat for biodiversity and risk for human health, as well as areas of higher environmental danger.
Immediate causes: are the immediate technical causes of the issue. For example, in the case of
eutrophication, the causes might be enhanced nutrient inputs, increased recycling/mobilisation or
trapping of nutrients.
ix
Glossary of tems
x
Institutional barriers to change: These are the barriers identified in the governance study.
They include issues related to insufficiencies in current policy, legislation and its implementation,
institutional capacity, public participation, etc.
International waters: International waters are those shared by one or more nation states.
They are transboundary in nature but provide "free" goods and services to the economies of individual
countries.
Landscape: A territorial system comprising natural and/or natural and anthropogenic components and
groups of lower taxonomic levels that interact with each other.
Resource uses and practices: These are practices that contribute to a particular immediate cause and
transboundary issue. They include such issues as land-use, waste discharges, damaging or unsustainable
practices, uses of water (diversion, storage etc). A typical agricultural practice contributing to
eutrophication for example, would be the excessive application of fertilisers.
Root causes: Beyond the underlying social and economic causes and sectoral pressures are the root
causes of environmental degradation. These underlying causes can be loosely divided into the following
categories: population pressure and demographic change; poverty, wealth and inequality; public policies,
markets and politics; development model and national macro-economic policies; social change and
development biases.
Sectoral approach: The causal chain methodology uses a sectoral approach to examine the pressures
that underlie the immediate causes. The seven sectors are agriculture, industry, urban development,
transport, energy, aquaculture and recreation (including tourism).
Social and economic causes: The causes of resource uses and practices. These include increased sectoral
development, investment, operation and maintenance, waste minimisation procedures, demand and
supply side management etc.
Socio-economic impact: The adverse effect of a transboundary issue on human welfare. For example,
increased costs of water treatment, or illness due to pollution.
Strategic Action Programme: A negotiated policy document, endorsed at the highest level of all relevant
sectors, which establishes clear priorities for action to resolve the priority transboundary issues
identified in the TDA.
Stakeholder analysis: As a prerequisite for Full Project approval, a stakeholder analysis must be
conducted. This goes much further than the initial stakeholder consultation. It seeks to verify the
interest of groups and individuals in the project concept. The analysis must also include information on
affected populations.
Transboundary: the majority of GEF-funded IW projects are concerned with water-related environmental
problems which transcend the boundaries of any one country, hence transboundary. Consequently, the
x
Glossary of tems
xi
environments include marine and freshwaters (including wetlands, lakes, rivers and aquifers) that are
shared by different countries.
Transboundary Diagnostic Analysis: The TDA is an objective assessment and not a negotiated document.
It uses the best available verified scientific information to examine the state of the environment, the
root causes for its degradation. The analysis is carried out in a cross sectoral manner. It focuses on the
transboundary issues without ignoring national concerns and priorities.
Transboundary issue: An environmental problem originating in one country and affecting another (e.g.
eutrophication, chemical pollution). The transboundary impact may be damage to the natural
environment and/or damage to human welfare.
Underlying causes: Those causes that contribute to the immediate causes. They can broadly be termed
as resource uses and practices and their related social and economic causes.
Variation and reduction of hydrological flow: A transboundary issue in the Orange-Senqu River Basin.
Variation and reduction of hydrological flow refers to an increase or decrease in the discharge of streams
and rivers as a direct or indirect consequence of human activity.
Water monitoring: Regular observation and assessment of the state of natural waters.
xi

Executive Summary
xii
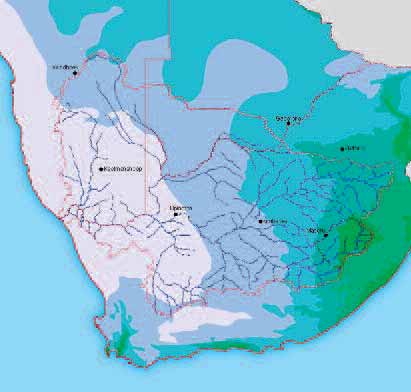
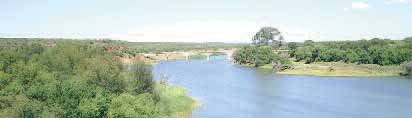
The Orange-Senqu is an internationally significant river system, located in the territories of Lesotho,
South Africa, Botswana and Namibia. These countries rely to varying degrees on the river as a source of
water for industry (mining and manufacturing), agriculture, energy, tourism, conservation and residential
uses. The basin is degraded environmentally and continues to be threatened by anthropogenic factors.
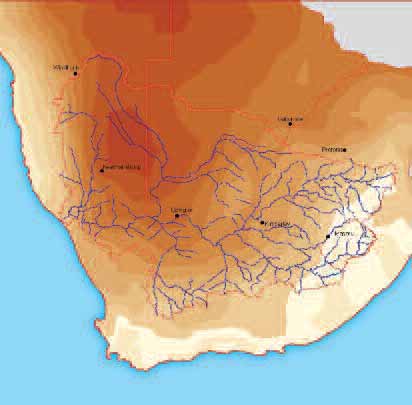
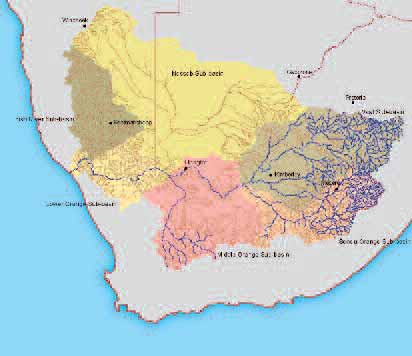
The Orange-Senqu river is important to regional cooperation as it crosses and forms some of the borders
between the riparian states (figure 1) and provides the single largest water resource south of the
Zambezi in a region which is classified as semi-arid and subject to increasing water stress. The highlands
of Lesotho provide the only exception where the climate is temperate and annual rainfall exceeds
evaporation. Elsewhere annual evaporative losses far exceed annual rainfall and to such a degree in the
Lower Orange that the climate is classified as arid to hyper-arid.
Certain areas of the Basin are already densely populated, economic development is significant, and
socio-economic expectations are high. This causes an inevitable high degree of competition for the finite
water resources that are available. Add to this the fact that the urban and industrial demands are
xii
Executive Summary
xiii
geographically concentrated in the upper parts of the Basin and these demands support activities that
make a major contribution to the GDP of South Africa (the largest Basin state) creates a significant
geographical imbalance in the utilization of available water resources. Water quality is impaired by
seepage, runoff and point source discharges of municipal, industrial and agricultural effluents, and by
high sediment loads resulting from land degradation in many areas of the catchment.
As past experience has shown, single sector oriented management of water resources does not solve the
problems of transboundary water resources. Only integrated planning of water resources at the basin
level can address the environmental and socio-economic development needs in the basin. Consequently,
integrated, inter-country efforts are urgently required to comprehensively evaluate the degree of
ongoing degradation of the Orange-Senqu and to take action to halt and reverse damaging trends where
necessary.
Awareness of this fact has promoted the development of a UNDP-GEF sponsored "Transboundary
Diagnostic Analysis (TDA) of the Orange-Senqu River Basin" and Strategic Action Programme development
project among four of the riparian nations. This project aims to ensure that the quality and quantity of
the water throughout the Orange-Senqu river system meets the short and long-term needs of the
ecosystem, the communities and economies relying upon the river and its associated resources. The
project is expected to achieve its objectives by: encouraging regional cooperation; increasing capacity
to address water quality and quantity problems; demonstrating water quality/quantity improvements;
initiating required policy and legal reforms; identifying and preparing priority investments; and
developing sustainable management and financial arrangements.
The GEF IW TDA/SAP "best practice" approach underpins the methodology used in the development of
the Orange-Senqu River Basin TDA. Consequently the methodology for the TDA consists of the following
steps:
Ę Identification and initial prioritisation of transboundary problems
Ę Gathering
and
interpreting
information
on
environmental
impacts
and
socio-economic
consequences of each problem
Ę Causal chain analysis (including root causes)
Ę Completion of an analysis of institutions, laws, policies and projected investments.
It focuses on transboundary problems without ignoring national concerns and priorities and identifies
information gaps, policy distortions and institutional deficiencies. The analysis is cross-sectoral and
examines national economic development plans, civil society (including private sector) awareness and
participation, the regulatory and institutional framework and sectoral economic policies and practices.
Causal Chain Analysis (CCA) is one of the most useful aspects of the TDA for the development of future
corrective actions. The causal chain should relate the transboundary problems with their impacts,
immediate physical causes and their social and economic underlying root causes.
xiii
Executive Summary
xiv
Basin profile
The climate below the Alpine belt in Lesotho is temperate but at higher altitudes can be severe with June
and July temperatures falling below -10o C at night. Temperatures increase westwards with the hottest
areas recording temperatures in the mid 40o C. At the summit of the Drakensberg escarpment in Lesotho,
the mean annual precipitation is 1,600Ł1,800 mm, decreasing sharply westwards to 45mm at Oranjemund
at the Orange River Mouth. Rainfall is highly variable in the western areas which also have the highest
evaporation rates. This results in an average water deficit per year of about 1.9 m in the middle reaches
of the Orange basin to about 2.6 m in the western parts of the lower Orange.
The highlands of Lesotho support Alpine vegetation that consists of climax heather communities
composed mainly of low woody species interspersed with alpine grasses at the highest altitudes.
Grassland habitat dominates the remaining high-lying areas while at lower altitude, mixed sour grassveld
occurs westwards to False Upper Karoo. A series of karooid vegetation types characterize the middle
xiv
Executive Summary
xv
and lower Orange River catchment, including the Fish River tributary in Namibia, ending ultimately in
the Succulent Karoo from the Richtersveld to the coast.
The skewed distribution of rainfall (see Figure 2), the geographical concentration of demand in the upper
half of the system, the significant agricultural demands in the drier parts of the catchment and the
provision of the storage and transmission infrastructure to meet these, is the essence and driving force
of the ensuing transboundary issues.
The water quality in the Orange-Senqu Basin is highly variable due to a combination of natural and
anthropogenic factors. The catchment includes the main urban and industrial conurbations of South
Africa, the main gold mining areas of the country, parts of the Highveld coal fields, some of the country's
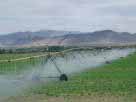
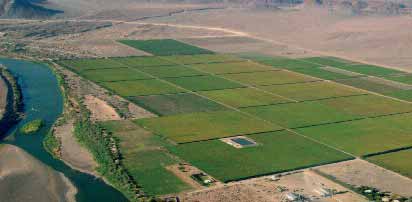
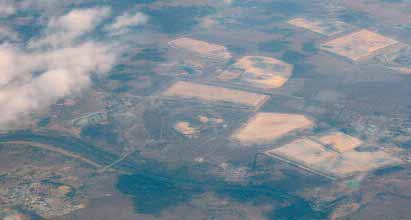
power stations and significant areas of dryland and irrigation agriculture. Although the arid western part
of the catchment is less developed, irrigation agriculture occurs extensively along the lower reaches of
the river.
xv


Executive Summary
xv i
The demand for water in three of the basin countries in Mm3/a are shown in the table below. There are
no detailed demand figures for Botswana.
95% of all water demand is from South Africa of which approximately 60% is from the irrigation sector.
Growth in demand in South Africa is predicted at 1% per annum principally in the Urban, industrial and
mining sectors. Higher demand growth rates are expected in both Namibia and Lesotho, but particularly
in Namibia where an expansion in irrigation is anticipated. Available water resources are currently
sufficient to meet demand however demand growth and the need to meet ecological flows means that
a combination of new water resource development and demand management, particularly in the
irrigation sector, is required in the relatively short-term.
For Namibia, the Orange River is a key resource for the southern region of the country, where commercial
agriculture and mining activities depend on the river as a reliable resource. In Botswana the basin is
very flat and arid and has not contributed water to the main stream in recent history. Nor is the Orange
a very practicable resource for south-eastern Botswana, because the existing demand canters are far
from the river.
In the case of Lesotho the national water demands are relatively small and the downstream impacts of
abstractions would therefore be quite minor and not present a significant downstream conflict risk.
However, the development of the Lesotho Highlands Water Project (LHWP) in Lesotho, transferring water
to the Vaal System, does have a significant impact on the river in Lesotho and South Africa.
The basin had an estimated population of 19 million people in 2004 (Earle et al., 2005). South Africa has
by far the major proportion of the basin's people, with high population densities in its Gauteng province
but significantly fewer people in the arid west. All four countries have undergone significant urbanization
xv i
Executive Summary
xv ii
but population growth rates have slowed because of decreasing fertility and high mortality due to the
very high HIV/Aids prevalence rates.
The South African economy is overwhelmingly dominant with 93% of the total gross domestic product
(GDP) for the four countries. GDP per capita is highest for South Africa and lowest for Lesotho. Between
1975 and 2004 economic growth rates have declined in Botswana and Lesotho but increased in South
Africa and Namibia. Inflation rates have been low and have declined further in recent times.
The following four sectors dominate:
Ę agriculture forestry and fishing,
Ę mining and quarrying,
Ę manufacturing and utilities, and
Ę services (which includes government).
The majority of the populations in the basin countries can be described as poor. Health indicators for the
basin tend to have similar patterns to those for human development, employment and poverty. Compared
with the rural areas, the urban areas have lowest infant mortality rates and better medical services and
facilities. The human development index rose between 1970 and 1990 but has since declined in all
countries. Similarly, life expectancy between 2000 and 2005 is much lower in all countries than it was
between 1970 and 1975. Other indices such as adult literacy, and access to improved water sources,
reflect general improvement over time, in line with the economic growth trends. In South Africa the
general level of human development is highest in the urban centre of Gauteng, and lowest in the arid
west, where traditional, small-scale rainfed land-uses are typical. The incidence of HIV/AIDS is very
high, being 35.8%, 23.6%, 22.6% and 20.0% in Botswana, Lesotho, South Africa and Namibia, respectively
(Ashton & Ramasar 2001). The social and economic impact of this pandemic is currently dire, and will
become even more so in future.
The high level of use of the water resources of the Orange Ł Senqu Basin particularly in the Vaal River
has reduced the total annual flows of the lower Orange River to a fraction of their natural levels along
with corresponding perturbations in their inter-annual variability. The seasonal pattern of the flow
regime is now just a token of what it was, with no discernible flood season in many years and only large
flood episodes being evident when there is spillage from Vanderkloof, though the flood hydrographs are
very much attenuated and maximum discharges and flood durations much less than formerly. The smaller
flood events are captured in the reservoir storages, the overall effect being diminished distinctions
between the seasons and constant regulated flows for months on end. The environmental consequences
are potentially very severe in the long term and could lead to the collapse of the natural riverine
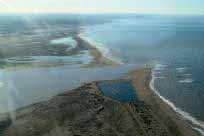
ecosystem and its ability to function. Already, the Orange River Mouth has deteriorated to the extent that
its integrity as a functional Ramsar site is in jeopardy, as a result of a number of factors, perturbations
in flow being just one.
All Orange-Senqu River riparian states have, or are on the process of developing, water policy and
legislation that reflects international trends in water management, particularly the implementation of
Integrated Water Resource Management (IWRM). Once all legislation is in place the four countries are,
from a legal perspective, largely in the position to implement IWRM nationally while taking into account
xv ii
Executive Summary
xv iii
the obligations set forth by applicable international law. It needs to be acknowledged though that all
countries, to different degrees, are faced with serious (human and financial) capacity constraints to
effectively implement the applicable policies and laws in practice. Whereas the required capacity is
arguably highest in South Africa, all countries experience significant capacity challenges and a detailed
assessment of capacity gaps needs to be undertaken.
In order to use the resources of the River System in an "equitable and reasonable" manner, the equitable
share of each country needs to be determined. Only once that has been done the respective national
authorities are able to accurately include international obligations (as far as water resources allocation
is concerned) into their planning and thus comply with international law. The determination of the
"equitable share" requires the joint acceptance of a resource definition as well as of the applicable
criteria to be considered for the determination of the "equitable share". International water law
provides guidance as to the criteria to be used for the determination of each country's equitable share.
From climate records of the past 50 years, elements of climate change for derivatives of rainfall,
temperature and hydrological responses can already be detected in certain regions within southern
Africa. Not all areas display equal change, and in some areas no change can yet be detected. The
following predictions have been made with regard to water resources:
Ę In South Africa, the projected increase in potential evaporation is estimated to be 10-20%.
This increase will be accompanied by enhanced evaporation losses and increased irrigation
demands.
Ę Soils will become drier more often which may result in reduced runoff per mm rainfall, agricultural
land-use changes, reduced crop yields and higher irrigation demands.
Ę Fewer, but larger rainfall events which may result in more groundwater recharge.
Ę Climate change will be accompanied by changes in land-use in the four countries, which will be
superimposed on already existing complex land-use impacts.
Vulnerable communities in southern Africa already have to cope with multiple stresses, of which climate
variability is but one. Climate change impacts, including water resource availability, within the Orange-
Senqu basin require adaptive strategies and adaptation policies Ł co-ordinated between all basin States.
xv iii
Executive Summary
xix
Priority transboundary concerns
The twenty-three common GEF transboundary issues were assessed by the members of the Technical Task
Group (TTG) in order to determine their relevance and transboundary nature in the context of the
Orange-Senqu River Basin. The group was asked to brainstorm and identify the major water-related
transboundary problems. Consequently, the GEF list was narrowed down to 5 major transboundary issues
in the Orange-Senqu River Basin that required further detailed analysis:
Ę Stress on ground and surface water resources
Ę Changes to hydrological regime
Ę Deterioration of water quality
Ę Land degradation
Ę Alien invasives.
When examining the transboundary issues the authors were asked to consider biodiversity and climate
change as cross-cutting issues.
Key findings and recommendations
The key findings of the water resource and hydrological regime studies are:
Ę Surface water resources of the Orange-Senqu Basin are highly utilized to the extent that the
residual flows to the mouth represent only 25% of the natural MAR at the mouth;
Ę The DWAF/Namibian Water Resource Planning Model developed under the LORMS study and which
models the whole basin, indicates that there is already under a significant deficit in the Lower
Orange which may grow to over 400Mm3/a by 2025. This calculation excludes demand from
Botswana and assumes that the current Ecological Water Requirement (EWR) of 1,000 Mm3/a
remains;
Ę The strategy for new infrastructure development is not yet defined with options including
LHWP phase 2, expansion of Thukela- Vaal transfer scheme, a re-regulating dam at Vioolsdrift,
and an upper Orange dam, and therefore the yield cannot be defined with any certainty.
The earliest implementation date for LHWP is 2018 at which time the deficit in the Lower
Orange is forecast to be 374Mm3/a;
Ę Improved resource management in the Vaal and Orange systems could yield up to 223 Mm3/a and
maintain a surplus in the Vaal system until 2015, however, this includes utilisation of spillages from
the Vaal system and there may be double counting;
xix
Executive Summary
xx
Ę Water demand management in the irrigation sector has a forecast potential saving of 226 Mm3/a
deliverable in 5-10 years. There are limited available figures for demand management savings in the
domestic, industrial and mining sectors or estimate of potential transfer and distribution savings.
A detail demand management strategy needs to be established;
Ę Significant improvements are required in the hydrological flow monitoring network, particularly
the low flows;
Ę The Lower Orange and the mouth currently has a category D ecological status and the provisional
EWR is estimated to be 1,000 Mm3/a. From existing data and information it is difficult to establish
whether this requirement is being met. It has been estimated that raising the ecological status of
the mouth to category C will require a further 500 Mm3/a, which will increase the deficits in the
lower Orange accordingly;
Ę The potential impact of climate change on the supply and demand side of the water balance is not
taken into account in the calculation of the water resource balance;
Ę Groundwater resources are limited and it has yet to be established what contribution, if any, they
could make to the water balance.
The key recommendations and conclusions of the water resource and hydrological regime studies are:
Ę To enable the decision makers to clearly understand the issue, a detailed water resource balance
for the whole basin needs to be prepared, based upon agreed planning criteria (assurances,
EWRs etc.), consistent component demand forecasts and climate change scenarios, against which
potential water resource development options and demand management targets can be
superimposed to determine the geographical planning surplus and deficits over a twenty year
planning period.
Ę To undertake an assessment of Ecological Water Requirements in the Lower Orange and mouth and
establish an agreed methodology which can be applied in other key points of the Basin.
Ę Establish a `vision' for the Orange-Senqu River Basin water resources in the national larger economic
planning frameworks of the four countries. The vision should indicate the level of environmental
xx
Executive Summary
xxi
protection the river should be afforded. Can protection be increased from category D to
category C?
Ę Develop and agree criteria for establishing equitable sharing of water resources between the four
countries in order to set bounds on development demand.
Ę Establish
a
decision
framework
for
future
water
allocation
based
on
economic
water
evaluation criteria.
Ę Improve implementation of regulatory functions and responsibilities in all four countries and
strengthen regional coordination through ORASECOM.
Ę Agreed climate change scenarios need to be incorporated into the water balance calculations -
perhaps with different scenarios for different sub-basins - and develop adaptation strategies.
The key findings of the water quality studies are:
Ę The Vaal catchment is highly polluted which has implications for water resource availability and
transboundary impacts. The water quality of the Upper and Lower Orange is said to be good;
however there are insufficient data for certain categories of contaminants to make any
conclusive statements.
Ę There are concerns along all the rivers which flow through towns and villages throughout the
catchment regarding localized micro-biological pollution from untreated and partially treated
sewage entering the rivers;
Ę The increase in Total Dissolved Solids (TDS) in the Vaal and Lower Orange catchments and the
concomitant increase in constituents such as chloride and sulphate, has had major implications for
domestic, industrial and agricultural water use;
Ę The transboundary impacts of POPs, heavy metals and radio-nuclides are unknown due to a lack of
monitoring data and detailed studies, but some level of transboundary transfer of these pollutants
is suspected;
Ę Eutrophication is a severe problem in the Vaal catchment and in isolated pockets in other parts of
the Basin.
xxi
Executive Summary
xxii
The key recommendations and conclusions of the water quality studies are:
Ę Establish basin-wide Receiving Water Quality Objectives (RWQOs) and agree and develop sectoral
short- and medium-term targets to meet the objectives. RWQOs are being set in isolation in priority
catchments; whilst integration of the RWQOs for the Vaal River is being addressed in the Integrated
Water Quality Management Plan (IWQMP) that is being developed by the South African DWAF, there
are no objectives agreed for the whole of the Orange-Senqu basin.
Ę Undertake a water quality assessment of the major aquifers in the basin. There are concerns
regarding the quality of groundwater resources and their protection, however there is insufficient
data to make any conclusive statements in this regard;
Ę Improve compliance monitoring and enforcement in all four countries. Lack of institutional capacity
to effectively manage water quality in their respective countries is a major constraint;
Ę Improve the water quality monitoring network throughout the region. In Lesotho and Namibia,
the water quality monitoring networks are poorly developed and there are no formal sampling
networks or water quality databases. South Africa has a more sophisticated and extensive
monitoring system, but there are still a number of deficiencies in the data sets, the extent of the
network Ł especially along the Lower Orange and in some of the more polluted sub-catchments of
the Vaal River.
Ę Undertake an assessment of Persistent Organic Pollutants, heavy metals and radio-nuclides in
the Vaal and Lower Orange catchments for which there is a general lack of information in
the catchment.
xxii
Executive Summary
xxiii
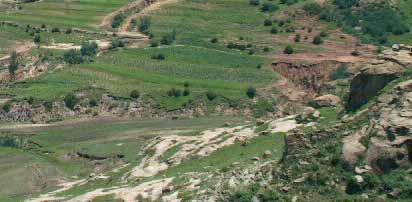
The key findings of the land degradation studies are:
Ę Land degradation poses a risk to ecosystem integrity in fragile highland and dryland environments,
defined in terms of the health, connectivity and stability of both the biotic and abiotic components
of ecosystems and the interconnectedness between them. Ovestocking, caused by communal land
tenure systems and the uneven distribution of water, is a major factor in rangeland degradation
throughout the basin;
Ę The Lesotho highlands are particularly sensitive to land degradation which causes critical impacts
to run-off (e.g. damage of the water sponges) and sediment loadings;
Ę In the Lower Orange, land degradation due to overgrazing and overstocking is widespread but its
economic impact on water resources has not been determined;
Ę Deforestation in the riparian belt and/or invasion by alien species can cause disruption to the
hydrological cycle, but it is unclear to what degree this is prevalent in the Orange-Senqu River
Basin due to a lack of any basin-wide studies in this regard;
Ę Lack of alternative livelihoods and access to market and financial facilities lock the rural
populations into unsustainable range management practices;
Ę Poor
land-use
policies
and
historical
tenure
systems
have
exacerbated
the
land
degradation problem;
Ę There is an urgent need for community-based natural resource management initiatives across the
basin, particularly for rangeland managed areas (under livestock, wildlife or both), involving
integrated approaches in communal and freehold areas.
The key recommendations from the land degradation studies are:
Ę Undertake an assessment of the scale and scope of land degradation in the Orange-Senqu Basin
particularly in the Upper and Lower Orange.
Ę Undertake a more detailed assessment of the water resource implications of existing and potential
future land degradation; the linkage between land-use and water resource management is
fragmentary which makes the development of a strategy to address the problem difficult; there is
a tendency for generic solutions.
xxiii
Executive Summary
xxiv
Ę Strengthen monitoring and evaluation systems need and the dissemination of information and
knowledge to the local level to help develop adaptive management strategies.
Ę Demonstrate various governance models at the community level which will deliver best practice
integrated rangeland and water resource management in various biomes.
The key findings of the invasive species study are:
Ę Increases in the distribution and occurrence of alien invasive species across the basin are
contributing to the environmental degradation of riparian and aquatic ecosystems in the
Orange-Senqu Basin.
Ę The upper catchments of the Basin within Lesotho, and the Eastern Free State and Gauteng
provinces of South Africa show significant riparian infestations of alien species, such as Silver
wattle, Black wattle, Grey poplar, Blue gum, Syringa and Jacaranda. These species are significant
water users, and compound degradation of riparian ecosystems.
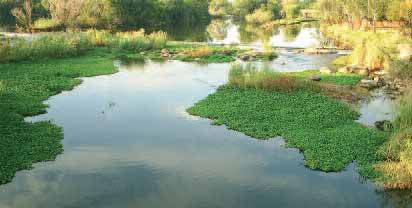
Ę The Vaal River contains sections of dense infestations of aquatic plant species, especially Water
hyacinth. This species disturbs aquatic habitats, alters the flow of the river and blocks water
abstraction, conveyance and irrigation equipment.
Ę The drier middle to lower sections of the Orange River Basin are impacted mostly by growing
infestations of Mesquite. This woody shrub species is commonly encountered in riparian areas,
and is responsible for significant river yield losses, as well as land degradation.
Ę The eradication programmes are fragmented in approach and, with the exception of South
Africa, donor driven.
Key recommendations of the invasive species studies are:
Ę Integrate eradication efforts should across the basin to control common invasive species and
where applicable incorporated them into the national and regional IWRMs.
Ę Strengthen monitoring of alien invasive species throughout the basin and establish a database.
Ę Undertake an assessment of the water resource losses due to invasive species in the Orange-Senqu
and evaluate the economic cost.
xxiv
Executive Summary
xxv
The compilation of a TDA requires a Stakeholder Analysis (SHA) based on GEF International Water Projects
(IWP) Best Practices. The SHA included interviews with 36 stakeholder groups in the basin countries in
February and March 2007. The stakeholders included employees of departments dealing with
environmental affairs, tourism, water affairs, meteorology, forestry, agriculture, national water
managers and parastatals, agronomic boards, mining industry, scientists, NGOs, tour guides, river
communities, officials of ORASECOM, and international organizations working on other ORASECOM
projects, including French GEF, and GTZ. The interviews were followed by a telephonic/face-to-face
questionnaire survey of more that 400 stakeholders from 36 groups across the region.
The Stakeholder Analysis showed that there is concern about the following major issues:
Ę Water quantity;
Ę Impacts of climate change on water regime including quality, quantity and ecosystems;
Ę Water regime influences on biodiversity;
Ę Water quality;
Ę Other social and economic issues impacting project design and implementation.
As a result of the SHA the following recommendations have been made for inclusion in ORASECOM's
Stakeholder Roadmap.
Ę Develop and roll out a concerted national and regional awareness raising and building campaign,
which acknowledges the scarcity of water and the need to implement water use conservation
measures as part of a wider demand management strategy.
Ę Develop inter-sectoral capacity building measures to increase awareness and understanding of the
concepts of sustainable development, IWRM, and environmental economics.
Ę Take steps to decouple the perception of a trade-off between sound environmental management and
economic development.
The findings and recommendations of this TDA will be revisited as part of the UNDP- GEF full-size project
and will feed into the development and negotiation process for the Strategic Action Programme.
xxv
Introduction
1
The Orange-Senqu is an internationally significant river system, located in the territories of Lesotho,
South Africa, Botswana and Namibia. These countries rely to varying degrees on the river as a source of
water for industry (mining and manufacturing), agriculture, energy, tourism, conservation and residential
uses. The basin is degraded environmentally and continues to be threatened by anthropogenic factors.
The Orange-Senqu river is important to regional cooperation as it crosses and forms some of the borders
between the riparian states (figure 1). Water quality is impaired by seepage, runoff and point source
discharges of municipal, industrial and agricultural effluents, and by high sediment loads resulting from
land degradation in many areas of the catchment. Water quantity is constrained by use of water for
domestic, agricultural and hydropower purposes, which impacts upon the river ecosystem, especially in
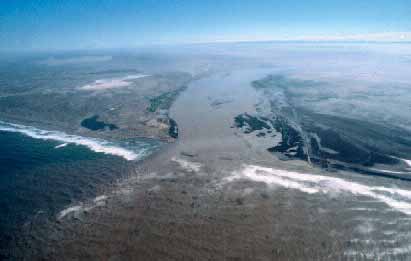
the lower reaches. The river drains into the Atlantic Ocean, where its seasonal influence is thought to
be an important factor in the functioning of the Benguela ecosystem and biodiversity in the area
of the mouth.
As past experience has shown, single sector oriented management of water resources does not solve the
problems of transboundary water resources. Only integrated planning of water resources at the basin
level can address the environmental and socio-economic development needs in the basin. Consequently,
integrated, inter-country efforts are urgently required to comprehensively evaluate the degree of
ongoing degradation of the Orange-Senqu and to take action to halt and reverse damaging trends where
necessary.
Awareness of this fact has promoted the development of a UNDP-GEF sponsored "Transboundary
Diagnostic Analysis (TDA) of the Orange-Senqu River Basin" and Strategic Action Programme (SAP)
development project among four of the riparian nations. This PDF-B funded project aims to ensure that
the quality and quantity of the water throughout the Orange-Senqu river system meets the short and
long-term needs of the ecosystem, the communities and economies relying upon the river and its
associated resources. The project is expected to achieve its objectives by: encouraging regional
cooperation; increasing capacity to address water quality and quantity problems; demonstrating water
quality/quantity improvements; initiating required policy and legal reforms; identifying and preparing
priority investments; and developing sustainable management and financial arrangements.
The TDA is an objective, non-negotiated analysis using best available verified scientific information and
an objective, participatory process that examined the state of the environment and the root causes for
its degradation. It provides the factual basis for the formulation of a Orange-Senqu Strategic Action
Programme, which will embody specific actions (policy, legal, institutional reforms or investments) that
can be adopted nationally, usually within a harmonized multinational context, to address the major
priority transboundary problems identified in the TDA, and over the longer term enable the sustainable
development and environmental protection of the Orange-Senqu river basin.
2
Methodology
2.1
2.1 Background
Historically, advice on TDA and SAP approaches given by GEF has been rather limited. However, the
experiences of senior Implementing Agency (IA) portfolio managers, International Water (IW) Chief
Technical Advisors (CTAs) and practitioners from a number of IW projects, together with GEF IW Focal
Area Programme Study, provided an opportunity to develop more formal guidelines to assist with the
preparation of TDAs and to ensure inter-regional comparability.
Consequently a GEF guidance document was developed to provide a road map for best practice in
formulating a TDA and a SAP as part of a GEF IW project. It was prepared on the basis of discussions
between specialists from UNDP, World Bank, UNEP and the GEF Secretariat, together with practitioners
who had completed the process in freshwater and marine systems. The final document reflected the
experience obtained in conducting TDA/SAPs between 1996 and 2003 but was not intended as a
prescriptive formula, merely a guide that should be adapted to the cultural socio-economic and political
realities of each region.
The GEF IW TDA/SAP "best practice" approach underpins the methodology used in the development of
the Orange-Senqu River Basin TDA. Consequently the methodology for the TDA consists of the following
steps:
Ę Identification and initial prioritisation of transboundary problems
Ę Gathering
and
interpreting
information
on
environmental
impacts
and
socio-economic
consequences of each problem
Ę Causal chain analysis (including root causes)
Ę Completion of an analysis of institutions, laws, policies and projected investments.
It focuses on transboundary problems without ignoring national concerns and priorities and identifies
information gaps, policy distortions and institutional deficiencies. The analysis is cross-sectoral and
examines national economic development plans, civil society (including private sector) awareness and
participation, the regulatory and institutional framework and sectoral economic policies and practices.
2.2 Orange-Senqu TDA Methodology
2.2.1 Identification of the priority transboundary issues
The first step in the TDA process was to agree on the transboundary problems. The initial stakeholder
consultation had highlighted the main problems, but it is important for the TDA Technical Task Group
(TTG) to revisit them, agree on whether or not the list is complete, examine their transboundary
relevance, determine preliminary priorities and examine the scope of each.
The TTG1, made up of experts
from the riparian countries, brainstormed2 the list of 5 priority
transboundary problems (shown in Box 1 below) in order to determine their significance and
transboundary nature in the context of the Orange-Senqu River Basin. The TTG was advised by the
Technical Task Team (TTT) of the Orange-Senqu River Basin Commission (ORASECOM), some ORASECOM
1Team members are listed in the acknowledgments section.
2
3
The first TDA training workshop was held in South Africa (Morula Sun) from 13 16 March 2007 and the CCA training and workshop was held
Methodology
2.2.2
Commissioners and invited experts who have been involved in research and monitoring in the basin over
a number of years. The process benefited greatly from recent studies conducted by projects undertaken
by other research teams in the basin. Noteworthy amongst these was the work by GTZ and InWent
consultants.
The combination of consultants, officials, researchers and basin residents Ł all working together to
identify and analyse common problems, provided powerful energy that resulted in reaching consensus in
a very short period of time. This ability to find common ground bodes well for the future of ORASECOM
and the joint management of the basin.
These priority transboundary problems were identified by assigning a score to each problem of between
0 (no importance), 1 (low importance), 2 (moderate importance) and 3 (high importance) to determine
the relevance of the problem from the perspective of the present day and 15-20 years in the future.
When examining future changes the TTG were asked to consider the effects of climate change. The
scoring activity was based on the following suite of criteria:
Ę Transboundary nature of a problem.
Ę Scale of impacts of a problem on economic terms, the environment and human health.
Ę Relationship with other environmental problems.
Ę Expected multiple benefits that might be achieved by addressing a problem.
Ę Lack of perceived progress in addressing/solving a problem at the national level.
Ę Recognised multi-country water conflicts.
Ę Reversibility/irreversibility of the problem.
2.2.2 Thematic Reports
Thematic Reports were drafted by consultants from the TTG and project team. The list of the Thematic
Reports is shown below:
4
Methodology
2.2.3
Ę Socio-economic situation and land-use in the Orange-Senqu River Basin;
Ę Legal and institutional framework for the water sector in Lesotho, South Africa, Botswana
and Namibia;
Ę Change of climate and evaluation of environmental vulnerability in the Orange-Senqu Basin;
Ę Biodiversity and ecosystems in the Orange-Senqu River Basin;
Ę Deteriorating water quality as a result of pollution and land degradation;
Ę Hydrology of the Orange-Senqu River Basin.
Each review and report used a similar structure and the consultants were asked to produce reports that:
described the particular problem; identified any gaps in knowledge; identified the environmental impacts
and socio-economic consequences; detailed the immediate and underlying causes of the impacts and
consequences; and listed proposed options for addressing the identified problem. Consequently, the
Thematic Reports constituted the main sources of information for the TDA.
2.2.3 Development of causal chains for the priority transboundary problems
Causal Chain Analysis (CCA) is one of the most useful aspects of the TDA for the development of future
corrective actions. The causal chain should relate the transboundary problems with their impacts,
immediate physical causes and their social and economic underlying root causes.
The CCA methodology developed for this TDA was based on the approach used by the Global International
Waters Assessment (GIWA), the Dnipro River Basin and Kura-Ara River Basin TDAs. However, previous
approaches only linked the causes to the transboundary problem, and failed to focus on why a particular
cause results in a given impact. The Orange-Senqu methodology aims to bridge this gap by linking the
sectors and causes of transboundary problems with the impacts of the problem. The advantage of this
approach is that it aids in the identification of well-targeted interventions that can address both
institutional and technical solutions to problems. This is in contrast to existing approaches in which the
interventions in the SAP do not address the findings outlined in the TDA. A simple step by step guide to
the process is shown in Figure 3.
5
Methodology
2.2.4
2.2.4 Stakeholder analysis
The compilation of a TDA requires a Stakeholder Analysis (SHA) based on GEF International Water Projects
(IWP) Best Practices. This SHA included interviews with 36 stakeholder groups in the basin countries in
February and March 2007. The stakeholders included employees of departments dealing with
environmental affairs, tourism, water affairs, meteorology, forestry, agriculture, national water
managers and parastatals, agronomic boards, mining industry, scientists, NGOs, tour guides, river
community members, members of ORASECOM, and other international organizations working on other
ORASECOM projects, including French GEF, and GTZ. The interviews were followed by a telephonic/face-
to-face questionnaire survey of more that 400 stakeholders from 36 groups across the region. The survey
was conducted in the field by the consultant team.
The Stakeholder Analysis showed that there is concern about the following major issues:
Ę Water quantity;
Ę Impacts of climate change on water regime including quality, quantity and ecosystems;
Ę Water regime influences on biodiversity;
Ę Water quality;
Ę Other social and economic issues impacting project design and implementation.
3. Descrition of the Basin
This section provides an overview of the Orange-Senqu River Basin, covering the geographical
characteristics of the basin, its ecological status, a summary of the socio-economic situation and an
introduction to the policy, legal and institutional arrangements within the basin.
3.1 Physical Characteristics
3.1.1 Geology and soils
In the highlands of Lesotho (where the Orange-Senqu originates, the area is characterized by a series
of relatively young rock types belonging to two series of the Karoo system. The upper layer consists
of basalt lavas which can be up to 1,500 m thick, underlain by cave sandstone, molteno beds and the
upper Beaufort beds. Gradients are steep. Moving westwards, the Orange River traverses many geological
units with some of the oldest known rocks exposed in the Orange River valley near the confluence with
the Fish River.
Soils in Lesotho are classed as Mountain Black Clays, shallow at high altitude and easily eroded by
cultivation and overgrazing. During summer, soils on the summit become waterlogged and in winter they
usually freeze, increasing their susceptibility to erosion. Most of the remainder of the Orange River basin
is covered by sands or weakly developed soils. With the exception of mainly the Kalahari component,
most of the basin is regarded as being medium to high risk in terms of soil erosion.
6
Methodology
3.1.2
3.1.2 Surface and groundwater resources
The Orange-Senqu River system provides the single largest water resource south of the Zambezi in
a region which is classified as semi-arid and subject to increasing water stress. The highlands of Lesotho
provide the only exception where the climate is temperate and annual rainfall exceeds evaporation.
Elsewhere annual evaporative losses far exceed annual rainfall and to such a degree in the Lower Orange
that the climate is classified as arid to hyper-arid. Certain areas of the Basin are already densely
populated, economic development is significant, and socio-economic expectations are high. This causes
an inevitable high degree of competition for the finite water resources that are available. Add to this
the fact that the urban and industrial demands are geographically concentrated in the upper parts of the
Basin and these demands support activities that make a major contribution to the GDP of South Africa
(the largest Basin state) creates a significant geographical imbalance in the utilization of available
water resources.
The skewed distribution of rainfall, the geographical concentration of demand in the upper half of the
system, the significant agricultural demands in the drier parts of the catchment and the provision of
the storage and transmission infrastructure to meet these, is the essence and driving force of the ensuing
transboundary issues.
7
Description of the Basin
3.1.2
For Namibia, the Orange River is a key resource for the southern region of the country, where commercial
agriculture and mining activities depend on the river as a reliable resource. In Botswana the basin is
very flat and arid and has not contributed water to the main stream in recent history. Nor is the Orange
a very practicable resource for south-eastern Botswana, because the existing demand canters are far
from the river.
In the case of Lesotho the national water demands are relatively small and the downstream impacts of
abstractions would therefore be quite minor and not present a significant downstream conflict risk.
However, the development of the Lesotho Highlands Water Project (LHWP) in Lesotho, transferring water
to the Vaal System, does have a significant impact on the river in Lesotho and South Africa.
The Orange-Senqu River System comprises three main surface water resource components which are
essentially operated as separate systems, although there are clearly linkages, as discussed below:
(i)
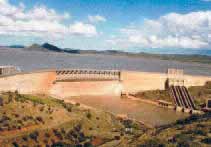
The Lesotho Highlands Water Project (LHWP)
Phase I of the project (Katse and Mohale dams and Matsoku diversion weir) are operated to
transfer an average of 780 Mm3/a at a 98% assurance of supply to the Vaal River System.
That is the agreed nominal annual yield of the Phase I reservoir system. Releases for the
environment are made from the two dams amounting to an average of 100 Mm3, with additional
"spills" from the Matsoku diversion weirs.
(ii)
The Vaal River System
This system, including the imports from other basins, is operated as a separate system to
meet the demands in the Vaal Catchment.
The Vaal River system is operated as a closed system to minimise the impact of poor quality Vaal
water on the cleaner Orange River. Flow in the Orange is thus restricted to high flow periods
and flood events. There are currently no releases for environmental water requirements.
8
Description of the Basin
3.1.2
(iii)
The Orange-Senqu River System, excluding the Vaal River System
The operation of Vanderkloof and Gariep dams does not make any allowances for possible
inflows from the Vaal system.
Ground water of two types can be considered.
Ę Shallow alluvial aquifers along the river;
Ę A variety of deeper non-alluvial aquifers.
The former are essentially re-charged from surface water and are really part of that resource and are
not considered separately. The latter are mainly used for supply to smaller rural towns, rural domestic
use and stock watering. There are no major well fields serving any large concentrated demands.
The high level of use of the water resources of the Orange Ł Senqu Basin particularly in the Vaal River
has reduced the total annual flows of the lower Orange River to a fraction of their natural levels along
with corresponding perturbations in their inter-annual variability. The seasonal pattern of the flow
regime is now just a token of what it was, with no discernible flood season in many years and only large
flood episodes being evident when there is spillage from Vanderkloof, though the flood hydrographs are
very much attenuated and maximum discharges and flood durations much less than formerly. The smaller
9
Description of the Basin
3.1.3
flood events are captured in the reservoir storages, the overall effect being diminished distinctions
between the seasons and constant regulated flows for months on end. The environmental consequences
are potentially very severe in the long term and could lead to the collapse of the natural riverine
ecosystem and its ability to function. Already, the Orange River Mouth has deteriorated to the extent that
its integrity as a functional Ramsar site is in jeopardy, as a result of a number of factors, perturbations
in flow being just one3.
More detailed analysis is given in sections 4.1 and 4.2 of this document.
3.1.3 Climate in the region
The climate below the Alpine belt in Lesotho is temperate but at higher altitudes can be severe with June
and July temperatures falling below -10o C at night. Temperatures increase westwards with the hottest
areas recording temperatures in the mid 40o C.
At the summit of the Drakensberg escarpment in Lesotho, the mean annual precipitation is 1,600Ł1,800
mm, decreasing sharply westwards to 45mm at Oranjemund at the Orange River Mouth. Rainfall is highly
variable in the western areas which also have the highest evaporation rates. This results in an average
water deficit per year of about 1.9 m in the middle reaches of the Orange basin to about 2.6 m in the
western parts of the lower Orange. As a result of these harsh arid conditions, the western region of
southern Africa contains four desert systems, three of which are drained by the catchments of the
Orange, the Succulent Karoo in the extreme south west, consisting of the "winter rainfall" area from
L³deritz south to the Orange River and on into South Africa, and in fact representing an area where
rainfall occurs with almost equal improbability throughout the year; the Nama Karoo, which receives
mainly summer rainfall and comprises a number of different vegetation types; and the Southern Kalahari,
consisting of a deep layer of wind-blown sand, with little run-off from rainfall (Fig.2).
10
3It has been placed on the Montreux Record A Ramsar listed wetland is placed on the Montreux Record if changes in its ecological charac-
Description of the Basin
3.1.4
3.1.4 Water quality
The water quality in the Orange-Senqu Basin is highly variable due to a combination of natural and
anthropogenic factors. The catchment includes the main urban and industrial conurbations of South
Africa, the main gold mining areas of the country, parts of the Highveld coal fields, some of the country's
power stations and significant areas of dryland and irrigation agriculture. Although the arid western part
of the catchment is less developed, irrigation agriculture occurs extensively along the lower reaches of
the river.
Deterioration of the quality of the water resources (both surface and groundwater) in the Basin is mainly
attributable to the following land-use impacts:
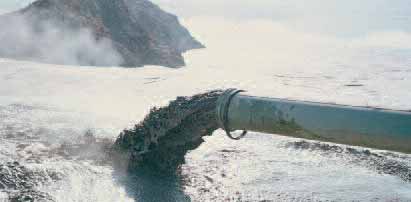
Ę Discharges from waste water treatment works in the numerous small towns and urbanised areas
within the Basin, many of which are not in compliance with the waste water discharge standards and
licence conditions;
Ę Mining pollution from point sources e.g. direct discharge from mine dewatering and effluent
disposal; and non-point or diffuse pollution from runoff and seepage from mining waste dumps;
Ę Runoff and seepage from developed and informal urban areas;
Ę Runoff from agricultural lands and irrigation return flows;
Ę Industrial pollution originating from direct discharges to the water course and stormwater runoff
and seepage from polluted industrial sites;
Ę Overgrazing and poor land management practices, especially on steep slopes and in marginal
agricultural areas (Directorate National Water Resources Planning, 2006).
The key transboundary water quality issues, identified during the TDA/SAP workshops, are:
eutrophication, microbiological organisms and water-borne pathogens, salinity, heavy metals, persistent
organic pollutants (POPs), and to a lesser extent, temperature changes.
While there is localised
pollution in the catchment resulting from acid mine drainage and radio-nuclides, the transboundary
significance of this pollution has not yet been ascertained. The key issues are discussed briefly below but
in more detail in section 4.3.
11
Description of the Basin
3.1.4
Eutrophication occurs because of nutrient enrichment, principally from nitrogen and phosphorus, that
stimulates extreme plant growth, which in turn affects all other components of the ecosystem (Davies
and Day, 1998). Nutrient enrichment promotes the growth of invasive aquatic plant species, with the
main problem plants in the Orange and Vaal systems being algae, floating plants and reeds.
The water of the main stem of the Orange-Senqu is generally of good quality with low levels of nutrients,
except in localised areas where the river runs through small towns. The Vaal River on the other hand is
eutrophic to hypertrophic in many sections, and receives large volumes of sewage effluent, most of
which is not compliant with the licence conditions.
The occurrence of microbiological organisms and water-borne pathogens is closely linked to the
problem of eutrophication. These organisms enter the rivers via untreated and partially treated sewage
effluent and are the cause of various diseases amongst river-dwelling communities. The main impact
and costs of this to society include:
Ę Increasing burden on healthcare facilities;
Ę Loss of income to families;
Ę Cost of funerals;
Ę Loss of production in the economy;
Ę Adverse media attention and its effect on overseas tourism.
Salinity refers to the saltiness of the water (Davies and Day, 1998). All waters contain some naturally
occurring ions as a consequence of the dissolution of minerals in rocks, soils and decomposing plant
material (du Preez et al, 2000). The saltiness of natural waters depends on the geological and climatic
environments through which the rivers flow. As one moves downstream, salinity increases as salts are
continuously being added through natural and anthropogenic processes, whilst very little is removed by
natural precipitation or technological interventions (du Preez et al, 2000).
The main sources of anthropogenic salt load are:
Ę The discharge of sewage effluent from waste water treatment works;
Ę Decant of water pumped from underground mine workings;
Ę Runoff and seepage from areas disturbed by mining and mine waste dumps;
Ę Runoff and seepage from industrial areas;
Ę Runoff and seepage from urban areas, especially those without formal sewerage and sanitation
systems; and
Ę Irrigation return flows.
Changes in the concentration of TDS can affect aquatic organisms at three levels:
Ę Effects on, and adaptations of, individual species;
Ę Effects on community structure; and
Ę Effects
on
microbial
and
ecological
processes
such
as
metabolic
rates
and
nutrient
cycling processes.
12
Description of the Basin
3.1.4
The general trend is an increase in TDS concentrations along the length of the Vaal River up to the
Bloemhof Dam. Although the salt loads in the outflow from the dam are closely correlated with dam
levels, the average TDS of the outflow is generally lower than the inflow condition. However, salinity
levels increase below the Harts River confluence with the Vaal due to high TDS loads in irrigation return
flows from the Vaal-Harts Irrigation Scheme.
Heavy metals occur in various areas the Orange-Senqu system and can be highly toxic, depending on the
chemical species of the metal, the presence of other metals and organic compounds which may have
synergistic, additive or antagonistic effects, the flow rate and volume of water, the physical make-up
of sediments, water temperature, pH and salinity (Davies and Day, 1998). Heavy metals are not broken
down through natural processes and therefore they persist in the environment. The main sources of
heavy metal pollution in the Orange-Senqu are industries and mines though direct discharges of effluent,
and diffuse seepage and runoff from polluted areas and waste dumps. There are many industrial sources
of heavy metal pollution in the Vaal triangle area of the Upper Vaal as well as waste disposal sites Ł all
of which produce a cocktail of heavy metal pollution in their effluents and site runoff and seepage.
Heavy metals also are taken up in urban stormwater runoff from roads, parking areas and other `hard'
surfaces, ending up either in waste water treatment plants, or directly in the river. Heavy metals are also
found in pesticides (Heath and Claasen, 1999).
The consequences of heavy metal pollution for aquatic biota include:
Ę A reduction in biodiversity and species richness;
Ę Changes in species composition, resulting in the selective elimination of less tolerant species;
Ę Irreversible damage to vertebrates;
Ę Bio-accumulation up the food chain, with piscivorous birds such as herons, kingfishers,
ducks and some raptors being the most affected.
Persistent Organic Pollutants (POPs) are another key concern identified in this TDA. POPs are organic
compounds of natural or anthropogenic origin that resist photolytic, chemical and biological degradation
and also have toxic properties. Because of the long persistence times and low volatility, they can be
transported in the environment in low concentrations via water and air movements, as well as within
migrating animals. This means that POPs can be transported to areas far from their source.
The major sources of polychlorinated POP's are combustion processes, especially municipal, hospital
and hazardous waste incineration. The other major source of POPs is from pesticides. Even though the
agricultural use of aldrin (1970), DDT (1976), Dieldrin (1984) and heptachlor (1975) has been prohibited
in South Africa, the persistent nature of these pesticides means that their effects may still be present
in the Orange-Senqu Basin.
The biological effects of POPs (on all organisms, including humans) include:
Ę Impaired reproduction and development;
Ę Immuno-suppression;
Ę Cancer;
Ę P-450 enzyme induction and adrenotoxicity;
Ę Endocrine disruption.
13
Description of the Basin
3.1.5
Radio-nuclides can have severe impacts for all forms of life, including mutagenic and carcinogenic
effects given sufficient doses over a period of time. The pathways include direct uptake of radio-active
particles through ingestion, as well as indirect uptake through the food chain. Because of the lack of a
basin-wide radio-nuclide monitoring programme, the magnitude and significance of the problem is not
known, especially the transboundary effects.
The causes of radio-nuclide contamination in water can mainly be ascribed to a lack of adequate
environmental management and control in the mines (mostly gold and uranium) and at other industrial
sites where radio-active materials may be produced or stored.
Another issue of concern is temperature changes, since less oxygen can dissolve in warm water than in
cold water. However, the rate at which chemical reactions occur increases with increasing water
temperature, thus water temperature can have a profound effect on the rates at which physiological
reactions take place within living tissues. Under conditions of increased temperatures, organisms live at
a higher rate, thus using up more oxygen, even though less oxygen is available because of the warm
water. An increase in water temperature can be caused by: the direct discharge of heated effluent, e.g.
power station cooling water, into the water course; the release of warmer surface water from an
impoundment; and from direct solar warming of the water column due to a reduction in flow depth.
More detailed analysis is given in section 4.3 of this report.
3.1.5 Climate change
3.1.5.1 Introduction
Climate change in the context of this chapter refers to the prospect of significant changes to global
climate induced by anthropogenic emissions of greenhouse gases (GHGs) which are now accepted to be
causing enhanced global warming and changes to the composition of the atmosphere.4
Research has shown that large parts of southern Africa experience amongst the most variable rainfalls
and streamflows worldwide (in Schulze, 2005). Not surprisingly, the Intergovernmental Panel on Climate
Change (IPCC) has identified this region as one of the most vulnerable to anticipated climate change
(IPCC, 2001). As stated in Shultze (2005): "These two factors, together with the juxtaposed mix of
developed and underdeveloped sectors within the region, present major challenges to water resources
and disaster managers alike."
A consequence of the accumulating GHGs is a projected increase in global temperature, estimated to be
about 2.0 - 3.5║ C by the time the CO2 level reaches double its pre-industrial level. Higher temperatures
will lead to changes in precipitation and atmospheric circulation, which are currently hard to predict
with acceptable accuracy.
The anticipated increase in temperature that will (or has already begun to) accompany global warming
will have profound effects on evaporation rates. This in turn will affect atmospheric water storage, and
hence, magnitudes, frequencies and intensities of rainfall events, as well as seasonal and geographical
14
4The most certain aspect of global climate change is that the atmospheric concentration of carbon dioxide (CO2) is increasing at an esti-
mated rate of 0.4% per year (in: Fairbanks and Scholes, 1999). Even if controls are implemented under the Kyoto Protocol (1998), this rise
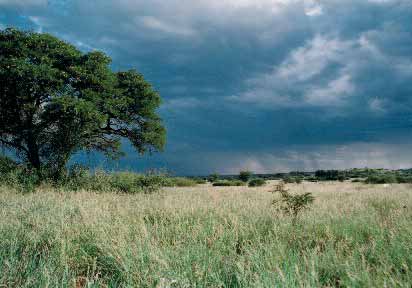
Description of the Basin
3.1.5
distributions of rainfall and its inter-annual variability. All of these impacts will influence the magnitude
and variability of streamflow in river basins (in Warburton and Schulze, 2005). In addition, temperature
directly affects a wide range of processes and activities such as human comfort and demand for heating
and cooling, crop and livestock responses, ecological responses, and incidences of pests and disease
(Schulze, 2003).
The prospect of climate change raises serious concerns about the sustainability of current development
trends and the environment in southern Africa. Several cross-cutting environmental and developmental
issues within the Orange-Senqu River basin will be affected by global warming and climate change.
These include:
Ę Securing sustainable water supply and quality;
Ę Ensuring adequate food security;
Ę Maintaining faunal and floral wildlife resources including the ecological reserve of wetlands;
Ę Preventing and reversing land degradation;
Ę Making efficient use of energy resources;
Ę Ensuring sustainable industrial development; and
Ę Combating rural poverty.
These priority areas possess different vulnerabilities and sensitivities to global warming and climate
change. They echo challenges faced by all countries in the southern African region and call for both
national and collective regional action.
Very little data relating to the potential scenarios, vulnerability and adaptation to climate change exists
specifically for the Orange-Senqu River basin. Therefore, the information presented in this chapter refers
15
Description of the Basin
3.1.5
largely to studies done in South Africa or the southern African region as a whole. Wherever possible, the
author makes reference to the different sub-basins of the Orange-Senqu by extrapolating information
from the extensive research (often pertaining to the administrative provinces of South Africa) presented
in:
Schultze (ed.) 2005; Turpie, et al (2002); the South African Country Study on Climate Change
(SACSCC) and other literature that has been reviewed.
3.1.5.2 Present climatic conditions in southern Africa
Before the potential impacts of climate change on the OrangeŁSenqu Basin can be assessed, the current
South African hydroclimatic circumstances need to be reviewed. The following numbered statements
(summarised from Schulze, 2005(c) and augmented by other referenced resources) highlight the fact
that the natural hydrological system over much of southern Africa is both highly variable and sensitive.
1.In the absence of climate change, the average current climatic conditions in southern Africa
already present a high risk hydroclimatic environment.
Mean annual precipitation (MAP), which represents the simplest index of a region's potential water
resource, ranges from < 50 mm to over 1200 mm, with a mean of 490 mm. This range in MAP has
resulted in about one third of southern Africa having a mean annual runoff5 (MAR) of <10 mm. When
the rainfall to runoff conversion is considered, for approximately half of South Africa this conversion
is < 5% Ł a very low percentage compared to the world mean of 35%. Numerous factors contribute to
this low conversion rate over southern Africa including:
Ę The high level of aridity (which is expressed as the ratio between mean annual potential
evaporation (i.e. atmospheric demand and MAP).
Ę The highly seasonal rainfall regime, with strongly defined winter and summer rainfall regions and
only a small part effectively receiving rainfall in all seasons.
2.An already high inter-annual rainfall variability is amplified by the natural hydrological system
It is the variabilities of rainfall and runoff from year to year, and within a year, rather than the average
amounts per se, that result in complexities and uncertainties in water resource management (WRM).
The simplest index of climate variability is the coefficient of variation (CV%) of annual rainfall. Large
tracts of southern Africa display an inter-annual CV% > 40% which is very high by world standards.
A generally inverse relationship between CV% and MAP exists in South Africa, with the drier areas
impacted doubly with the low rainfall compounded by its inconsistency from year to year.
3.Intra-annual variabilities of hydrological responses are even higher than inter-annual ones
Schulze (1995) demonstrates that the phenomenon of excessively high coefficients of variation of
within-year periods further exacerbates management of both surface and groundwater.
4.Different components of the hydrological system differ markedly in their responses to
rainfall variability.
The amplification by the natural hydrological system of any variation and/or change in climate is not
of the same order for all hydrological responses. For example, during the severe 1982/83 El Ni±o over
southern Africa rainfall was, on average, 60 - 75% of median rainfalls in the region, however, runoff6
was generally only 20-40% of its median.
5
16
Runoff is defined here as the combination of stormflow plus base flow, has been generated at the scale of Quaternary Catchments,
of which 1946 have been delineated in this region and computed with the daily time step ACRU model
Description of the Basin
3.1.5
5.Streamflow variability is high in individual external subcatchments, but in a river system becomes
attenuated in internal and mainstem subcatchments.
The higher the stream order within a river system, the less variable streamflows become because flow
contributions accumulate from different parts of the catchment which do not generate runoff
identically nor at the same time and because flows are attenuated downstream. Research by Dlamini
and Schulze (2004) has suggested the reduction in coefficients of variability along major tributaries
and the mainstem, i.e. the "internal" sub-catchments, when compared to the CV% of "external" sub-
catchments. This is important to bear in mind when major reservoir projects are planned.
6.Degradation of the landscape amplifies hydrological responses, especially higher order responses.
Large tracts of southern Africa are in various stages/degrees of veld degradation Ł a situation that has
a profound impact on runoff and one that is unlikely to improve over time.
3.1.5.3 Detecting Climate Change in the Orange-Senqu Basin
Precipitation and evaporation are the primary drivers of the hydrological cycle, with temperature an
important driver of evaporation. Changes in various temperature parameters have been identified over
many parts of southern Africa (Warburton et al 2005) and, utilising agrohydrological simulations (not
observations), Warburton & Schulze (2005a) have found that potential evaporation appears to have
increased over much of the interior of southern Africa in recent decades. The question that needs to be
asked is: Does this imply that enhanced global warming and climate change are already happening?
Most researchers7 agree that, not only is climate change evident through increasing global mean surface
temperatures (the IPCC reports that global mean surface air temperature has increased by between
about 0.3 and 0.6░C since the late 19th century), but since the 1980s the frequency and intensity
of hydrologically related extreme events has increased markedly (in: Warburton and Schulze, 2005).
Despite these observations, it must be kept in mind that several difficulties face the accurate detection
of global and regional climate change. Warbuton & Schultze, (2005) report that these challenges
are exacerbated in southern Africa by a lack of homogenous, long term, high quality datasets for climate
and streamflows.
Warburton & Schulze, 2005(c), state that basic requirements for rainfall station networks for climate
change studies include at a minimum, one station per Quaternary Catchment (QC) with an already long,
uninterrupted daily rainfall record ( > 50 years) of high reliability. It is evident that the cluster of QCs
in the Drakensberg mountain/Lesotho region (Orange-Senqu sub-basin) Ł an area that is highly sensitive
to climate and land-use change - are represented by rainfall stations with a poor reliability (ibid).
The repercussions of poor data reliability in this high rainfall and high runoff region could be immense,
because this sub-basin supplies water to the Lesotho Highlands Water Scheme and South Africa's
economic heartland of Gauteng, as well as a high percentage of water for the rest of the
Orange-Senqu Basin.
7Not all researchers are in agreement about the occurrence and impacts of global warming. Alexander (2005) characterised the numerical
properties of South Africa's hydrometeorological processes in such a way that the effects of global warming, if any, could be evaluated and
accommodated. Other than increases in rainfall and open water surface evaporation, no other changes were detected, that could be at-
tributed to climate change arising from human activities. Nor is there evidence to support the view that such changes are likely to occur
within the next 30 years. A climate prediction model was developed based on the statistically significant 21-year periodicity in the hydrom-
17
t
l
i
l
d it di
t
i ti
ith
di
i di it i
l
ti it
Thi
h
i
t
id
d t
b
Description of the Basin
3.1.5
Bearing the constraints in mind, the following summary on current climate change detection for
temperature, precipitation and streamflow are summarised from Warbuton and Schultze, (2005). In
addition observations made on impacts to irrigation are discussed.
a) Temperature changes
Ę Globally, the warmest year record is 1998 (up to mid 2007).
Ę Numerous new record temperature highs and lows were recorded over South Africa for 2003, 2004
and 2005.
Ę Although an increase in global mean surface temperature has been established, regional detection
studies for temperature have shown varying results. Hughes and Balling (1997) show that South
Africa has experienced a warming in excess of 1║C during the 20th Century. Hulme et al. (1996),
however, only showed a warming of 0.5║C over southern Africa as a whole during the 20th Century.
This discrepancy is believed to be partly attributable to an urban effect, but with evidence of a
greenhouse signal of warming evident in some locations.
Ę Warburton et al (2005) report a clear cluster of warming from almost every analysis relating to the
Western Cape (including the Lower Orange sub-basin). Another finding is a less severe frost season
over the Free State (incorporating the Vaal sub-basin of the Orange-Senqu River) and Northern Cape
(incorporating the middle Orange sub-basin and lower reaches of the Nossob sub-basin).
While certain changes are evident in temperature parameters, the changes are not uniform across
southern Africa.
b) Precipitation changes
In general, the records reviewed in Warbuton & Schultze (2005) show that:
Ę Significant increases in extreme rainfall events occurred in South Africa during the 1961 Ł
1990 period, compared to the 1931- 1960 period;
Ę Over some areas of South Africa it was found that the intensity of the 10-year high rainfall
event has increased by over 10%;
o
For eastern South Africa (which incorporates the Lesotho highlands and the Orange-Senqu
sub-basin) an approximate 10% decrease in mid-summer rainfall has occurred when comparing
the 1931 - 1960 period with the 1961 -1990 period.
o
Rainfall variability over South Africa appears to be increasing (Hulme, 1996).
Warburton & Schulze (2005b) investigated if hydrological response changes were supported by changes
in rainfall patterns in Quaternary catchments (QCs) over time. Their results show that:
Ę The winter rainfall region (incorporating the lower Orange sub-basin) appears to have experienced
more rainfall in the later 1980 - 1999 period compared to the earlier 1950 - 1969 period;
Ę The south eastern Free State (incorporating the lower reaches of the Vaal sub-basin) indicate a
decrease in rainfall in the later period; and
Ę The North-West Province (incorporating the western Vaal sub-basin and the upper reaches of the
eastern Nossob sub basin) display a decrease in rainfall in the later period.
18
Description of the Basin
3.1.5
Regarding specific observations relevant to the Orange-Senqu Basin, the following statements can be made:
Ę Increases in both hydrological responses and rainfall are evident in the winter rainfall region of
South Africa (incorporating the lower Orange sub-basin); and
Ę Decreases in hydrological responses and rainfall are evident in the southern and western parts of
the Vaal sub-basin, and the southern parts of the Nossob sub-basin.
Ę A number of QCs in the Orange Primary Catchments show decreases in the highest annual rainfall
in 10 years when comparing the periods 1980 - 1999 and 1950 Ł 1969, but not all areas of this
extensive basin are experiencing changes in rainfall as yet, and the direction of rainfall change
is not uniform across the basin.
c) Streamflow changes
Streamflow is not an easily measured variable as it has many interactive drivers8 and is highly sensitive
to changes in precipitation. Warburton & Schulze (2005a) show that:
Ę Streamflows in the `driest' year in 10 have increased in some areas of the Orange-Senqu Basin
- notably the lower Orange, middle Orange, southern Nossob sub-basins and a large part of the Vaal
sub-basin;
Ę Accumulated streamflows in the "wettest" year in 10 have increased over much of the summer
rainfall region, but with a notable decrease over the Vaal sub-basin;
Ę Winter month flows have increased in the "driest" season in 10 in the winter rainfall region
(incorporating the lower Orange sub-basin);
Ę The range of flows between low and high flow years, indicative of a change in flow variability,
has generally increased over the summer rainfall region;
Ę Periods of highest summer flows have tended to be later by 1-2 months over much of the central
and eastern parts of southern Africa (the middle Orange, Orange-Senqu and Vaal sub-basins)
These researchers compare the 1950 - 1969 and 1980 - 1999 timing of the 3 months of highest
accumulated winter streamflows and show that the upper Orange Primary Catchment displays a shift to
2 months later in the latter period. They state that the extent to which these trends over the past 50
years are related directly to climate change is not clear. However, some of the trends are very marked
over large parts of catchments and certainly require consideration in future water resources planning and
management.
d) Impacts on irrigation
Warburton & Schulze (2005a) considered the current impacts of climate change on irrigation.
These authors state that irrigation water demands by crops are controlled by the interplay of
precipitation, soil water content and evaporation (both transpiration and soil water evaporation). Thus,
as temperature has a direct effect on both soil water content and evaporation, it is hypothesized that
with changes in temperature already evident, changes over time in irrigation water demand may already
be evident. It should be noted, however, that with enhanced atmospheric concentrations of CO2 which
are anticipated in a future climate, the CO2 fertilization effect
will not only have an effect on
photosynthetic rates, but that with plant stomatal resistance hypothesized to increase, a reduction in
transpiration is also set to occur. For gross irrigation water demands conveyance losses of 20% and spray
drift losses of 10% were assumed.
8Streamflow is influenced by numerous human activities such as catchment land-use changes, inter-basin water transfers, other water
abstractions, return flows or reservoir construction and by controlled releases. These may conceal, obliterate, or reverse natural trends.
Streamflow is the integration of several aspects of climate over both time and space, hence trends in one driver may be offset by oppo-
site trends in another climate drive (Warbuton & Schultze, 2005)
9An increase in the concentration of CO2 in the atmosphere (as a result of anthropogenic emissions) is believed to cause CO2
19
enrichment in plants or an increase in primary productivity through: increased rates of photosynthesis;
Description of the Basin
3.1.5
These authors made a comparison between median annual gross irrigation demands for 1950 - 1969 and
1980 - 1999. A few catchments in South Africa show an increase in median annual gross irrigation demands
in the later period, while a few show a decrease in the later period, and these increases and decreases
are predominantly in the magnitude of 10 - 30%. No large clusters of QCs showing either an increase or
decrease in the later period are evident. However, it is of interest to note that all QCs showing a change
occur in the summer rainfall region. In their comparison of the median winter months (May Ł Sept) for
gross irrigation demands in 1950 - 1969 vs. 1980 - 1999, the upper Orange Primary Catchment has a
grouping of QCs which show an increase in the later period.
3.1.5.4 Future climate scenarios and responses in the Orange-Senqu basin
Despite continuous improvements in climate change science10 there is still uncertainty regarding the
reliability of regional climate change models (RCCMs). According to Hewitson et al. (2005) these arise
from:
Ę Natural climatic variability:
There is a finite historical record that can be used to provide
baseline data. Consequently, it is not possible to set definitive limits of natural variability, nor the
degree to which this may exacerbate or mitigate the background trend in change of the baseline
climate, nor how much of the change in variability itself may be directly attributable to
anthropogenic factors. In addition, many fundamental aspects of the future climate remain largely
uninvestigated, including the possible changes in the frequency and intensity of El Ni±o events
(Engelbrecht 2005).
Ę Uncertainty regarding future GHG emissions: Little can be done to prevent the continued emission
(in some countries the accelerating emissions) of GHGs. How global society responds in managing
GHG emissions is an important `unknown' which could result in estimated projected changes in
temperature between 2050 and 2100, of anywhere between 1.5║ and 5.6║C of the global mean
(ibid.);
Ę Uncertainty in the science: Current understanding of the dynamics of the southern African climatic
systems is limited. There may well be key components of the system that, under global change, will
result in significant changes in regional climate, possibly leading to rapid nonlinear change, with
unforeseen and sudden increases in regional impacts;
Ę Downscaling: Both Regional Circulation Models (RCMs) and empirical downscaling techniques
introduce uncertainty. GCMs, from which the downscaled RCMs are developed, have known biases
which are carried forward in the RCMs. More than one model should, therefore, be used in climate
change studies to seek consistency/consensus on predicted changes occurring across a region.
An important consideration when using GCMs is to remember that such simulations represent, at
best, a possible evolution of the global climate system.
Bearing in mind these challenges, what then, in broad brush terms, can planners expect to happen in
forthcoming decades in the Orange-Senqu basin as a result of global warming and climate change?
Schultze (2005) illustrates that climate change over southern Africa may result in some marked
geographical shifts in specific homogeneous climatic zones such as those defined by K÷ppen11. Some
zones will be enlarged (mainly in already hot areas) while others will decrease in area, both in absolute
10Schulze et al (2005 [a] ) state that climate scenarios derived from various GCMs, downscaled by different approaches, display an
ever-increasing consistency in patterns of anticipated climate change over southern Africa and can be used with increasing confidence
by climate change impact modellers.
11The K÷ppen (1931) climate classification system was selected ahead of those by Thornthwaite (1948) or the FAO (1996), because of its
20
universality in usage and its relative simplicity with regard to input data requirements. It is a hierarchical system with up to three levels
of detail which is based on rainfall magnitudes rainfall seasonality and rainfall concentration as well as durations above or below
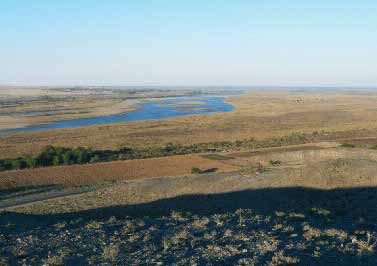
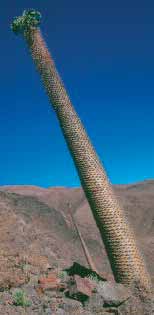
Description of the Basin
3.1.5
(km2) and relative (%) terms when compared with present climatic conditions. K÷ppen zones most likely
to be reduced are in the environmentally already highly sensitive winter (incorporating the lower Orange
sub-basin) and all-year rainfall regions. These shifts, if they occur, will have marked implications for
future hydrological responses in southern Africa.
In Hewitson et al. (2005a) it is reported that regional climate change scenarios for South Africa provide
common messages of consensus around South Africa's future temperature and precipitation regime. In
summary, these scenarios forecast:
Ę An increase in temperature at all localities, with the maximum increase in the interior;
Ę A wetter escarpment in the east, a shorter winter season in the southwest, a slight increase in
intensity of precipitation, and increased drying in the far west of southern Africa
For different components of the hydrological cycle certain areas in southern Africa have also been
identified as more sensitive in their responses than others. Schultze et al (2005b) have identified several
potential `hotspots' where anticipated climate change could have wide-ranging water resource
management implications. One notable hotspot is the present winter rainfall region which incorporates
the lower Orange sub-basin.
Three GCMs were used in South Africa's Country Study on Climate Change (Kiker, 1999). These included:
an older model with simplified oceans (Genesis); a coupled ocean-atmosphere model (HadCM2; a leading
GCM in the last IPCC assessment) and a recent current-generation fully coupled ocean-atmosphere model
(CSM). In all cases the three models indicate an extension of the summer season characteristics.
21
Description of the Basin
3.1.5
In general, the climate projections to 2050 indicate a continental warming of between 1oC and 3oC,
with the maximum focused on regions of aridity. These models show less agreement with regard to
precipitation. The HadCM2 model shows smaller changes than the CSM, with the net significant impact
being a broad reduction in summer rainfall, and less significant positive and negative changes in the
other seasons.
Overall, the HadCM2 indicates the following changes that may occur by 2050:
Ę Rainfall: Summer rainfall is projected to decrease over most of South Africa (projections for the
summer rainfall region lie between a 15% decrease to a 5% increase). The area considered
incorporates most of the Orange-Senqu basin with the exception of the lower Orange sub-basin.
Winter rainfall is projected to decrease by more than 25% in the northern winter rainfall area Ł
an area which incorporates the lower Orange and the Fish sub-basins.
Ę Temperature: Temperature increases are expected for the whole of South Africa and the entire
Orange-Senqu basin. The highest increases (up to 4░C) are predicted over the north-central parts
of South Africa (incorporating the Nossob sub-basin, the northern parts of the middle Orange sub-
basin and the lower reaches of the Vaal sub-basin). On average, the highest projected mean annual
temperature increases could range between 2.5░ and 3░C, with lower increases projected
for the coastal regions.
3.1.5.5 Potential impacts of climate change in the Orange-Senqu Basin
The fact that the hydrological system can amplify changes in climatic drivers (in particular changes
in rainfall characteristics) suggests that climate change manifestations over the Orange-Senqu Basin,
could have serious repercussions for all the key economic sectors (agriculture, mining, tourism, industry,
urban / household) but most specifically for its hydrological responses and future water resource
management (WRM).
The South African Country Study on Climate Change (SACSCC) (Kiker, 1999) suggests that a significant
decrease in river flow in, inter alia, the western catchments of South Africa are likely to occur. To assess
the potential impact of climate change on hydrological responses, the SASCC modified and updated the
ACRU hydrological modeling system to ascertain potential changes based on future climate scenarios
from the HadCM2S model. From the threshold study of runoff it may be concluded that:
Ę The western half of South Africa could experience a 10% decrease in runoff by the year 2015
(including the middle Orange, the Nossob, the Fish and the lower Orange sub-basins).
Ę The year when a 10% decrease in runoff occurs, moves progressively later (to 2060) as one moves
from the western to eastern halves of southern Africa.
Ę A 12 Ł 16% decrease in outflow could occur at the Orange-Senqu river mouth by 2050.
The economic damages of broad-brush impacts on ecosystem functioning and biodiversity, based on the
predicted changes in temperature and precipitation as suggested by the HADCM2 model for year 2050,
are considered in Turpie et al (2002). These authors conclude that there will be:
Ę General aridification of conditions in the western half of southern Africa (including the middle
Orange, the Nossob, the Fish and the lower Orange sub-basins). This aridification will lead to a
22
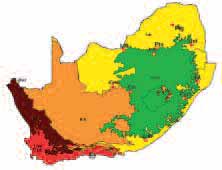
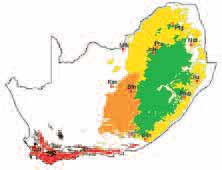
Description of the Basin
3.1.5
shrinkage of South Africa's biomes to between 38% and 55% of their current combined area
(Figure 6), with expected huge losses in biodiversity. The `vacated' areas on the map will support
a much more arid-adapted and relatively fewer species of vegetation.
Ę Changes in terrestrial animal diversity. These could not be predicted accurately, but the SACSCC
suggests huge losses of species due to range shifts.
Ę An increase in the productivity of rangelands due to a CO2 fertilisation effect.
Ę Changes in the ranges and prevalence in vector borne diseases (including malaria)
Ę Increasing incidence of fire, an important determinant of habitat structure and species diversity,
as a result of increasing temperatures.
Some expected impacts ofclimate change are discussed in more detail below.
23

Description of the Basin
3.1.5
The economic impacts reported in Turpie et al (2002) and referred to in the discussion that follows,
make the assumption that the structure of the economy in 2050 is the same as that in 2002, and that any
real growth in the economy will be impacted by proportionately larger losses from climate change
damages. There is no doubt that in the absence of climate change, the country's economic activity would
not remain static, and different sectors may change in different ways. Consequently, because it is
difficult (if not impossible) to predict these changes, it is necessary to work under a general (though
unrealistic) assumption that all else remains equal.
Impacts to biomes and biodiversity
The economic values associated with natural systems12 will vary between biomes and habitats of the
Orange-Senqu Basin, each of which is likely to be threatened to a different extent by climate change.
Turpie et al (2002) concluded that:-
Ę The largest biome and biodiversity losses occur in the western half of South Africa. The findings
suggest a complete loss of the unique succulent Karoo biome (lower Orange sub-basin) by 2050.
This area currently supports 5 500 endemic species;
Ę The Nama Karoo biome (the higher reaches of the lower Orange sub-basin, the entire middle
Orange sub-basin and the western Nossob sub-basin) are also expected to contract radically;
Ę Savannas, which cover a large part of the Nossob sub-basin and, in some areas, are important for
grazing and the subsistence harvest of numerous resources including: fuelwood; edible fruits,
vegetables and herbs; construction timber; carving timber; thatching grass; bush meat; reeds; and
medicinal plants. This biome may be radically reduced by climate change, leading to significant
losses of resources to rural subsistence communities.
Ę Much of the existing grassland biome (Vaal and Orange-Senqu sub-basins) will be susceptible to a
potentially large number of invading savanna tree species. Elevated CO2 may encourage bush
encroachment in much of the eastern part of South Africa, in combination with the increasing
minimum temperatures this will lead to a switch from grassland to woodlands and savannas,
with concomitant loss of fauna.
Ę Tourism may be impacted by climate change due to a loss of habitats and biodiversity as well as
increased risks of malaria (see page 26). South Africa, Namibia and Botswana rely heavily on their
natural resource base to attract tourism, and wildlife is the primary reason for visiting the country
for some 36% of international tourists.
12Turpie et al 2002, state : The value associated with natural systems is based largely on the goods and services they provide.
The total value of these systems can be divided into use values and non-use values, with use values being consumptive (from the harvest of
24
resources), or non-consumptive, (such as from recreation). Non-use values are more intangible, and include option value (potential future
use value) and existence value or the satisfaction that people have from knowing something exists partly for the sake of its being acces
Description of the Basin
3.1.5
Ę The existence value of biodiversity threatened by climate change was measured by using a
Contingent Valuation Study (CVS). Three-quarters of respondents13 were willing to pay towards
biodiversity conservation in South Africa, and the same proportion were in favour of a policy to
reduce the impacts of climate change by passing external costs onto consumers of products such
as fuel. The potential loss of existence value to South Africans was estimated to be R2.63 billion
per year.
Impacts to agricultural systems
Turpie et al (2002) report that agricultural systems are less impacted upon than natural systems by
climate change. These authors state that:
Ę Agricultural crop yields are expected to be affected by changes in precipitation, temperature
and CO2 levels. The most detailed biophysical study was conducted for maize, the country's largest
field crop which predominates in the Vaal sub-basin of the Orange-Senqu Basin. The total value of
lost maize production due to climate change impacts is R681 million without the CO2 fertilisation
effect8, but a considerably smaller loss of R46 million with the effect. Overall, because of the
positive effect of CO2, the impacts on crop production are relatively minor in relation to the value
of the sector as a whole.
Ę Projected increases in potential evaporation will be accompanied by increased irrigation demands
(see detailed information below).
Ę The impact of climate change on rangelands is predicted to be positive, with the fertilisation effect
of CO2 outweighing the negative effects of reduced precipitation. The resultant increase in cattle
productivity is expected to be worth R191 Ł 1344 million per year, but there would also be a loss in
the cattle herd, worth between R100 million and R200 million per year.
Ę Direct impacts of climate change on livestock are likely to include increasing heat stress and water
requirements. A positive direct impact of increasing temperatures will be to reduce stock losses
through extreme low temperatures in the lambing season in the Nama and Succulent Karoo
rangeland areas (incorporating the lower Orange sub-basin, the middle Orange sub-basin and the
western Nossob sub-basin).
Schulze et al 2005 (b) state that most of South Africa is predicted to have a higher relative irrigation
water demand in C-CAM's future climate scenario, irrespective of its being a wet, average or dry year
(ibid). Irrigation at present is the biggest single user of stored water in southern Africa, and increased
demands of the order of 10%, and up to 20% for most of the country and 30% in much of the Free State
(Vaal sub-basin), could lead to substantial stresses on water resources (ibid).
The leaching of fertilizers and other agrochemicals has repercussions regarding water pollution Ł an
impact that that threatens, inter alia, freshwater ecosystems and human health. Irrigated areas have
different soils properties, infiltration rates and seasonal crop biomasses than surrounding dryland areas.
In addition, they have a different soil water budget to those of the surrounding areas. If, therefore, it
rains after a recent irrigation application then, depending on the amount and sequences of the rainfall
and the current soil water status of the land, deep percolation beyond the root zone, or stormflow from
the surface/near-surface can take place, resulting in leaching of fertilizers (mainly N) or wash-off of soil
and fertilizers (mainly P).
13
25
E i t
l
i
t
gl i fl
d b
i
d i t
t i
t
d th
f
t
i d ig ifi
tl
Description of the Basin
3.1.5
Schulze et al (2005 b) show that mean annual deep percolation losses with a projected future climate
would be both reduced in certain areas (e.g. the winter rainfall region, much of Lesotho and parts of the
Free State; areas that incorporate the lower Orange sub-basin, the Orange-Senqu basin and the Vaal
basin, respectively) and increasing slightly in others (e.g. the dry Northern Cape province, incorporating
the middle Orange sub-basin and lower reaches of the Nossob sub-basin). Similarly, mean annual storm
flow losses show both areas of significant potential future increases (notably around, inter alia, the
present Vaal-Harts irrigation scheme) and decreases (e.g. the winter rainfall region incorporating the
lower Orange sub-basin).
These authors also show that virtually the entire South African region will, with a future climate
according to C-CAM (Engelbrecht, 2005) require ~ 10% more irrigation applications per annum. Most of
Lesotho (the Orange-Senqu sub-basin), would require up to 30% more irrigation applications per year.
Finally, Schulze et al 2005 (b) simulated net water requirements from the supplementary mode of
demand irrigation with the C-CAM future climate scenario. In the Lesotho/central Free State area,
increases are around 30%. Irrigation management in those areas is compounded by streamflows that are
predicted to diminish. Inter-annual variability of net irrigation water requirements shows an increase
in the north and west of South Africa, while reductions in CV are predicted over much of the Free State
(incorporating the Vaal sub-basin).
Impacts to human health
The potential impacts to human health, as a result of climate change, are significant. During times of
severe drought, water-borne and water washed diseases increase and poorer communities experience
lowered resistance to disease. Furthermore, a changing climate will also alter the distribution of vector
species that carry potentially fatal vector-borne diseases (including, inter alia, malaria, sleeping
sickness and Schistosomiasis).
Malaria, a potentially fatal disease, has been the focus of many studies on the potential impacts of
climate change on human health. This is because its prevalence is extremely rainfall and temperature
sensitive. In South Africa malaria has displayed exponential growth since the late 1980s (Turpie et al,
2002). This increase is not only due to changes in climate, but also to increasing drug resistance, and an
influx of migrants from neighbouring countries where malaria is not controlled. In summary the literature
reports that:
Ę Habitat suitability for the mosquito Anopholes gambiae (a common vector of malaria) shows a net
increase in southern Africa under all three climate change scenarios14 referred to in Hulme (ed.)
(1996). Under Hulme's `core'scenario the prevalence of A. gambiae is likely to spread into areas
within the Fish river, the Nossob and the middle Orange sub-basins of the Orange-Senqu River.
Ę Turpie et al, (2002) report that some studies indicate a four-fold increase in the size of the South
African population at risk to malaria within the next ten years. With increased incidence,
the proportion of deaths is also expected to increase. If the problem is indeed exaggerated to this
degree, then the expected costs are estimated to be in the order of R1 033 million by 2010,
representing about 0.1% of GDP.
14The scenarios of climate change used here follow the methodology and scientific insights encapsulated in the IPCC reports of 1994 and
1995. Assuming a non-interventionary projection of future GHG emissions, and mid-range values for the parameters of the climate models
employed, the scenario used in this study yields a global warming with respect to the 1961-90 average of 1.7░C by the 2050s decade. The
cooling effect due to atmospheric aerosols has not been included in these calculations. Three patterns of climate change associated with
26
such a global warming are defined from a range of climate model experiments: the UKTR 'core' scenario which sees modest drying over
l
t
f th
i
d h
i
i f ll
i bilit
CCC ` d
'
i
i
hi h th
i
i
i f ll d
li
f
t
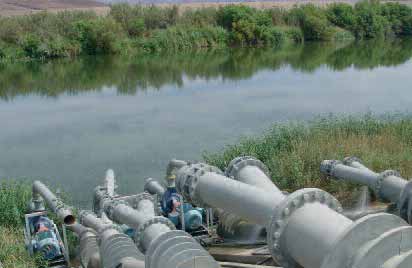
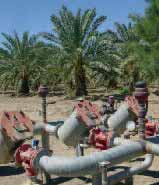
Description of the Basin
3.1.5
Impacts on the water resource sector
Attempting to ascertain climate change impacts on the water resources sector in southern Africa is a
most complex exercise. This is because most hydrological systems in the region are essentially `damaged'
systems, a fact that must not be ignored when considering the impacts of climate change.
More specifically:
Ę Spontaneous regulatory functions of rivers and their catchment areas have been disturbed (through
deforestation, erosion15 and/or dam construction), or removed (e.g. by draining of wetlands),
thereby causing changes of state of the hydrological system;
Ę The manner of exploiting water, and the land from which it is generated, has changed through
intensification of water use (by irrigation, dryland cropping, and urbanisation).
The water resource sector is arguably the most important with respect to vulnerability to climate change
as it cuts across all other sectors. Certainly, in South Africa climate change studies pertaining to future
water resources has been the focus of considerable detailed research16.
As already mentioned, geographical shifts in specific homogeneous climatic zones such as those defined
by K÷ppen9 are likely to occur as a result of climate change. Such shifts in climate zones will have marked
implications for future hydrological responses in South Africa (Schultze, 2005) and, as a consequence, in
the Orange-Senqu Basin.
Schultze, et al (2005a) state that the hydrological impact investigation undertaken in the WRC study,
which considered a 1975 - 2005 `present' and a 2070 - 2100 `future' climate scenario, has identified
several potential hotspots where anticipated climate change could have wide-ranging water resource
(as well as agricultural and other) management implications. This, it is argued, requires the urgent
15Large tracts of South Africa, Lesotho, Namibia and Botswana are in various stages/degrees of veld degradation Ł a situation that
is unlikely to improve over time and could, itself be severely exacerbated by aridification due to climate change. The amplification of soil
erosion by hydrological responses is of major concern to veld conservationists and reservoir design engineers because of the loss of topsoil
and the reduction in the capacity of reservoirs over time. In addition, sediment-laden water adds to the cost of water treatment.
16
27
M
h
f thi
t
h i
l
t d
ithi
S h l
R E ( d) 2005 Cli
t
h
d
t
i
th
Af i
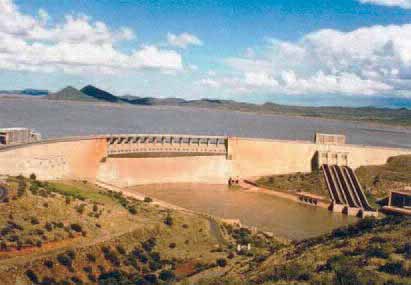
Description of the Basin
3.1.5
attention of planners. One notable hotspot is the present winter rainfall region which covers the lower
Orange and Fish river sub-basins of the Orange-Senqu Basin. For different components of the hydrological
cycle certain areas in southern Africa have also been identified as more sensitive in their responses than
others. More in-depth interpretation of results is still required of the various climate change impacts
which were simulated.
Using the Soil Conservation Services (SCS) equations for determining design stormflows and peak
discharges, Schulze (2005a) shows that marked changes in design floods are possible when K÷ppen
climate zones shift geographically with climate change, with potentially serious repercussions in design
hydrology. These potential changes should be given serious consideration in hydrological design on small
catchments in future.
In summary, South Africa's WRC project (Schulze et al (2005a) shows that global warming (increasing
temperatures) and projected climate change will result in:
Ę Projected increases in potential evaporation by 10 - 20%. This increase will be accompanied by
enhanced dam evaporation losses and increased irrigation demands;
Ę Soils becoming drier more often. This will result in reduced runoff per mm rainfall, agricultural
land-use changes, reduced crop yields and higher irrigation demands;
Ę Fewer, but larger rainfall events which may result in more groundwater recharge;
Ę Shifts in the distribution of streamflows resulting in changes to the ecological reserve and changes
to reservoir operating rules.
No specific qualitative data were available regarding the potential increase in evaporation from
impoundments within the Orange-Senqu basin. However, Schultze et al 2005 (c) show that mean annual
reference potential evaporation in the Thukela catchment (external to the Orange-Senqu), is projected
28
Description of the Basin
3.1.5
to increase by 7.5 - 10% over most of the catchment, and by > 10% in the Drakensberg range where
altitudes exceed 2 000 m.
Based on current findings, there can be no doubt that meeting of water obligations by upstream countries
in the Orange-Senqu Basin to downstream countries is likely to become an even greater international,
legal, environmental and resource-use challenge than it already is at present. In the semi-arid regions
of the Orange-Senqu basin with their already high inter- and intra-annual variability of climate and
streamflow, where water stored in reservoirs is frequently utilised for irrigation of a dominant cash crop,
management challenges are likely to be greater than in more temperate areas of the basin (Schulze &
Dlamini 2005).
3.1.5.6 Vulnerability and Adaptation to climate change in the Orange-Senqu Basin
Global warming and climate change will be the cause of (inter alia) extreme events including heat waves,
droughts and floods. Impacts in southern Africa on both rural and urban communities, particularly in the
absence of effective risk-reduction strategies, are expected to be significant (IPCC, 2001a).
Boardley & Schulze (2005) state that:
"Vulnerability is considered to be a function of exposure and adaptive capacity, with the latter, in turn,
dependent on wealth, technology, education, information, skills, infrastructure, access to resources
and stability as well as management capabilities."
Consequently, the actual human impacts of climate change within the Orange-Senqu basin will depend
on the relative resilience and coping abilities of the different social groups that reside in the region.
Hulme (1996) states that, in general, the commercial sector and the high-income households in communal
areas are best equipped to adjust adequately and in a timely fashion, but that much will depend on the
coping abilities and mechanisms employed by governments. In the case of the Orange-Senqu Basin, such
abilities will be determined by the political and economic stewardship displayed by the South African,
Namibian, Botswana and Lesotho governments in future decades.
Table 1 summarises South Africa's adaptation framework for climate change impacts on the water sector.
With respect to the Orange-Senqu Basin, several challenges face this Adaptation Framework, because:
Ę Changes in CO2, temperature and rainfall take on different significances over the different
sub-basins of the Orange-Senqu river;
Ę Climate change will be accompanied by changes in land-use in four different countries;
Ę Runoff-producing storm flow events are projected to change which implies that there will be lower
inflows into reservoirs in certain areas;
Ę Climate change impacts will be superimposed on already existing complex land-use impacts;
Ę The ecological `reserve' will be impacted. The natural aquatic environment is a legitimate water
user and not a competing resource;
Ę Health services (water quality) will be impacted by changes in the chemical and biological content
of water reserves.
Ę Water availability to the poor will be impacted;
Ę In South Africa international water agreements with neighbouring countries may have to be
re-negotiated Ł particularly in cases where water allocations have been agreed upon.
29
Description of the Basin
3.1.5
30
Description of the Basin
3.2
Conclusions and Recommendations
From climate records of the past 50 years, elements of climate change for derivatives of rainfall,
temperature and hydrological responses can already be detected in certain regions within southern
Africa. Not all areas display equal change, and in some areas no change can yet be detected.
Vulnerable communities in southern Africa already have to cope with multiple stresses, of which climate
variability is but one. Climate change impacts within the Orange-Senqu basin require adaptive strategies
and adaptation policies Ł co-ordinated between all basin States.
Schultze et al 2005 (a) recommend that:
Ę Impact studies of potential climate change on the water sector need to move from baseline
hydrological conditions of catchments to catchment conditions, which include present land-uses,
dams, irrigated areas, inter-basin transfers and return flows.
Ę The hydrological research community needs to focus on more in-depth second order and third order
consequences of possible climate change, e.g. on water quality responses, impacts on terrestrial
and aquatic environments, the water/agriculture linkage and extreme events and potential
international (downstream) impacts.
Ę Adaptation strategies to climate change in the water resource sector of southern Africa need to be
placed on a "higher plane", regarding both policy and implementation.
Ę Relevant stakeholders need to be sensitised to the potential consequences and challenges which are
likely to arise out of a changed future climate in the already high risk natural environment
of southern Africa.
It must be noted that the WRC has seen fit to fund a further 3-year solicited research project on climate
change and water resources, with emphasis not only on improved climate modelling, but also on water-
related environmental and policy issues for southern Africa.
3.2 Ecological Status
The Orange River basin is an extraordinarily diverse system. It drains the highest point in southern Africa
at 3,482 masl Ł and flows westwards for over 2,200 km to the Atlantic Ocean. Its upper catchment falls
within both the highest rainfall and coldest parts of southern Africa, while its lower reaches cross the
driest and hottest areas of the subregion.
Unfortunately (from an ecological perspective) this system is one of the most modified in southern Africa.
The amount of water actually reaching the Orange River mouth is less than 50% of the natural run-off.
The difference is due to extensive water use in the Vaal River basin for mainly domestic and industrial
purposes, and for irrigation, mining, urban supply and transfers out of the river for use within and
outside the basin in the lower sections of the Orange. A number of dams have been constructed in the
catchment and abstraction and transfer systems have marked impacts on the basin and the Orange
River system.
Perhaps the earliest impact on the resources of the basin was the general elimination of most of the large
mammals, first through hunting and later as a consequence of farming and fencing. Overgrazing by
livestock has damaged rangelands and wetlands in large parts of the catchment, causing erosion and
31
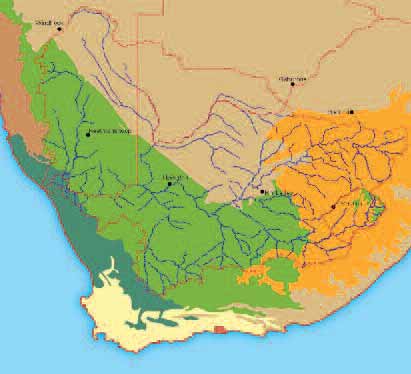
Description of the Basin
3.2.1
changes in species composition. Cropping along river courses has caused a loss of riparian vegetation,
introduced nutrients and pesticides into wetlands via back-flows and increased salinity levels. Alien
plants and animals have invaded ecosystems. As noted earlier, levels of pollution and salinity have
increased dramatically in some stretches as a result of industry, mining and urbanization.
3.2.1 Natural Ecosystems and Biodiversity
The highlands of Lesotho support Alpine vegetation that consists of climax heather communities
composed mainly of low woody species interspersed with alpine grasses at the highest altitudes.
Grassland habitat dominates the remaining high-lying areas while at lower altitude, mixed sour grassveld
occurs westwards to False Upper Karoo. A series of karooid vegetation types characterize the middle
and lower Orange River catchment, including the Fish River tributary in Namibia, ending ultimately in
the Succulent Karoo from the Richtersveld to the coast. The Nossob / Molopo catchment in Namibia and
Botswana drains mainly the Southern Kalahari.
The ecological condition of the Orange River continues to be significantly negatively impacted by human
activities. The main hydrological changes (Marķ in Brown 2004) are:
32


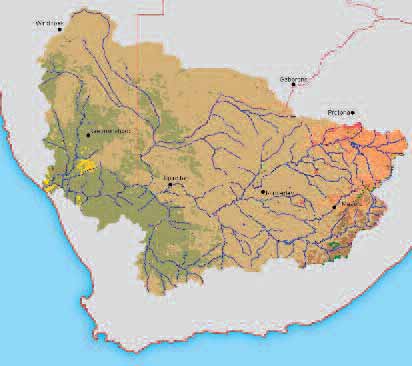
Description of the Basin
3.2.1
Ę A decline in the mean annual runoff of the river. The past 20 years has seen less than half the annual
runoff recorded before 1960
Ę A marked decrease in summer flows (November to March)
Ę A dramatic reduction in seasonal differentiation
Ę A marked decrease in magnitude of inter-annual floods
Ę A virtual elimination of early summer flows (spring freshets)
Ę A marked decrease in variability
Ę An increase in winter flows (mainly July and August) and a lack of very low flow periods.
33
Description of the Basin
3.2.1
The riparian and in-stream vegetation (Boucher in Brown 2004) is negatively impacted and continues to
deteriorate in the following ways:
Ę Floating aquatic plants increase with reduced flow;
Ę Changes to the shape of the wetted perimeter of the river channel, with lower water levels causing
banks to dry out, temporary exposure of unprotected banks and bank collapse;
Ę Enhanced benefit to pioneer reeds (Phragmites australis) under reduced flow, with increased
distribution and patch size, thereby accumulating sediments, blocking channels and resulting
in large disturbances when washed out during large floods, often forming reed mats that case
blockages downstream and exacerbate the effect of floods;
Ę Loss of indigenous trees and gallery forest in the riparian belt because of reduced floods
(moisture), reduced seed dispersal, more frequent hot fires because of more and larger reed beds
and less cooling effect as previously moist riverbanks are dryer;
Ę Increased agricultural encroachment into the riparian belt because of reduced flooding and
waterlogged soils;
Ę Invasion by alien vegetation, notably Prosopis spp., exacerbated by a loss of indigenous
vegetation and disturbance (e.g. through fires and agricultural activities);
Ę Changes is species composition and abundance as a result of fertilizers and salts draining into the
river, with for example P. australis and Tamarix usneoides increasing and having a negative effect
on Salix mucronata.
The situation regarding the aquatic invertebrates (Palmer in Brown 2004) in the middle and lower Orange
River also reflects a degraded system, with further deterioration predicted.
Ę There is an overwhelming and persistent abundance of filter-feeders, in particular the pest
proportion numbers of the blackfly Simulium chutteri. The outbreaks of blackfly are attributed to
stable flow conditions, particularly high winter flow, deterioration in water quality and
encroachment of in-stream vegetation;
Ę Winter releases from Vanderkloof dam were shown to have detrimental impacts on aquatic
invertebrates up to 600 km downstream Ł a significant increase in abundance of blackfly, almost
complete disappearance of a previously abundant midge and a significant drop in the abundance of
a predaceous caddisfly;
Ę A number of aquatic invertebrates have declined and possibly disappeared from the Orange River
system, including mayflies, snails, a large elmid beetle (the only known specialised wood borer
along the Orange River), and a leech species which was known to be parasitic on hippopotami,
the latter becoming extinct in the Orange River in the 1930s. By contrast, an invasive snail
Physa acuta has spread dramatically.
The status of the fish communities (Benade in Brown 2004) in the middle and lower Orange River is
considered to be largely modified and on a negative trajectory. The main reasons for this are the
deviation from the natural flow and deterioration in water quality. The poor ecological status and
negative trends of the Orange River are as a result of both the changed hydrology and out-of-river
activities.
34
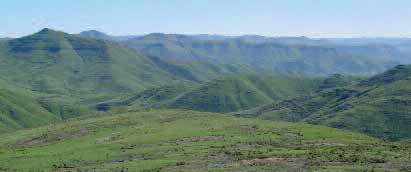
Description of the Basin
3.2.2
3.2.2 Land-use and ecological threats
Lesotho
Some 70% of the globally recognized biodiversity hotspot of the eastern Drakensberg-Maloti mountains
falls within Lesotho, important for their high altitude flora, estimated at about 3,100 species of which
30% is endemic to the mountains. This endemic zone also supports an extensive network of high altitude
wetland bogs and sponges, crucial in the hydrological cycle of the Orange River. Their retention and
slow release of water helps stabilize stream flow, attenuate floods, reduce sedimentation loads and
absorb nutrients. Most of the large mammals of Lesotho were eliminated over a century ago, although a
few antelope species survive in protected and isolated areas. At the present time, just some 0.4% of
Lesotho is protected but future proclamations will increase this to 0.7%. There are also two transfrontier
initiatives with South Africa underway, the Maloti-Drakensberg Transfrontier Conservation and
Development Area Programme and the Letseng-la-letsie Wetlands Protected Area in southern Lesotho.
The main threats to biodiversity and ecosystem stability in the Orange River catchment in Lesotho are:
Ę Rangeland degradation through overgrazing. Lesotho is an egalitarian society and in the rural areas
access to land is unrestricted. Grazing land is therefore open-access and common property, which
means that sustainable management practices are seldom in place and difficult to enforce.
Group grazing schemes known as Range Management Areas have been introduced, but in most areas
the range is overstocked. Sponges and grasslands become degraded, species diversity declines and
soil is exposed to wind and water erosion. The steep terrain and harsh climatic conditions,
particularly at high altitude, have created a fragile ecosystem yet one that is vitally important to
the maintenance of one of southern Africa's most important wetland and river systems;
Ę Less than 10% of the land in Lesotho is suitable for cultivation. Because of human population
pressure large areas unsuited to cultivation, including steep slopes in the highlands, are being
ploughed and cropped. Severe soil erosion is evident, with large dongas and rivulets;
Ę Some 90% of household energy is derived from fuel wood, from dung and from crop residue, such as
maize husks. The pressure on woody vegetation has led to severe deforestation throughout most of
Lesotho, with associated exposure of soil and riparian belts and resulting erosion;
Ę The development of large dams in the highlands, with a predicted increase in pest species
such as blackfly, decline (to possible extinction) of the Maloti Minnow (Pseudobarbus
quathlambae) and explosion in rodent populations.
35
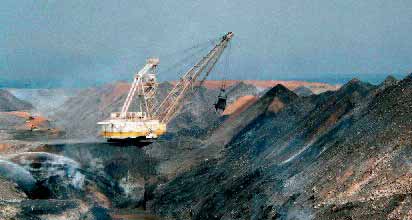
Description of the Basin
3.2.2
South Africa
By far the largest proportion of land within the Orange River catchment lies within South Africa (64%)
amounting to over 5.7 million ha. Habitat types range widely from alpine vegetation in the eastern
highlands adjacent to Lesotho, various types of grassland, to a variety of Karoo and false Karoo
vegetation types in the arid western regions.
High levels of urbanisation and industrialisation in many
areas of the Vaal and Orange River catchments has meant that land has been altered extensively. Urban
settlements, agriculture, mining and rural settlements dominate the riparian zone along the river and
its main tributaries, and consequently very little pristine riparian habitat exists. Land is largely privately
owned, with the agriculture and mining sectors owning and using the highest proportion.
With irrigation and dry-land crop production dominating much of the central basin, land degradation
through inadequate land management is the largest threat to terrestrial ecosystems within the basin.
Priority areas are: (i) the upper reaches of the Orange River and its tributaries where gradient and soil
structure are most susceptible to erosion with the resulting sedimentation of the rivers, and (ii) the arid
lower reaches of the basin where poor land management will impact negatively on threatened
ecosystems. Irrigation and dry-land crop production of cash crops such as maize, wheat and sunflower
are extensive in many of the middle parts, while stock farming utilizes most of the remaining central
parts of the basin, which comprise mostly natural grasslands. To protect crops against flooding, levies
have been constructed in many parts of the river valley, which disturb the ecology of the floodplains,
and prevent natural flooding of systems which require it for survival.
Mining occurs most notably in the Vaal Basin, and the lower Orange River to the mouth, further altering
many habitats within the basin. Effective rehabilitation and environmental management by larger mining
companies has reduced impacts to some degree. Small-scale mining of alluvial diamonds along the lower
Vaal and lower Orange River has had a significant impact on river banks and riparian vegetation.
Although regulations largely restrict mining on river-banks, poor enforcement and lack of capacity to
regulate small mining operations have not been able to curb this problem. Extensive earth-moving
activities with minimal rehabilitation or environmental considerations have degraded much of the habitat
along the rivers.
36
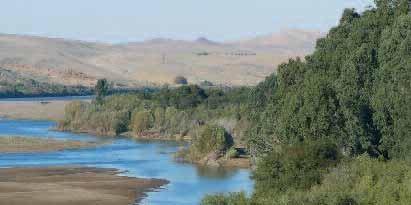
Description of the Basin
3.2.2
Riparian vegetation has been notably disturbed along the Orange-Senqu River and most of its tributaries.
The dominance of riparian woody species such as Cape willow (Salix mucronata), buffalo thorn (Ziziphus
mucronata), wild olive (Olea europaea) and white karee (Rhus viminalis) have been compromised through
a combination of the following factors:
Ę Clearing for small-scale alluvial mining
Ę Wood fuel collecting for cooking and building material
Ę Agriculture on the river banks
Ę Colonisation by alien species.
Much of the Upper and middle Vaal catchment areas are highveld climax grassland habitats, which have
been greatly transformed through commercial agriculture and urbanisation. The remaining grasslands
are some of the most threatened habitats in South Africa, and conservation efforts have recently been
initiated to preserve them. The Orange River Broken Thornveld, and False Orange River Broken
Thornveld, both habitat types in the lower Orange portions of South Africa are regarded by
conservationists to be priority areas for protection. The lower Orange River basin also contains parts of
the succulent Karoo ecosystem. This ecosystem contains the highest diversity of arid flora globally, and
is a declared biodiversity hotspot. Conservation activities within the ecosystem are co-ordinated by the
Succulent Karoo Ecosystem Programme (SKEP). The organisation has identified the spread of alien plants
along the Orange-Senqu as a significant threat to the biodiversity of the area.
Increased invasive alien species are a significant contributor to land degradation. The more arid part of
the basin (the lower Orange River area) is particularly impacted by growing numbers of mesquite
(Prosopis spp.). Dense stands of alien species on river banks and floodplains have reduced basal
vegetation cover, causing erosion of the clayey soils. The link between land degradation and alien
invasives is further explored as part of the causal chain analysis for both problems in sections 4.4 and
4.5 respectively.
Protected areas in the South African part of the Orange River Basin make up just 3% of the area of the
basin in South Africa. Of this, one park Ł the Kalahari Gemsbok Park Ł makes up 80% of the area. This is
a remarkably small proportion of land given that protected areas make up some 10% of South Africa and
37
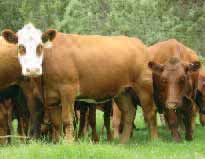

Description of the Basin
3.2.2
that the Orange River basin comprises about 50% of the country. Two main transfrontier areas in the
basin are the subject of international treaties, the Kgalagadi Transfrontier Park with Botswana and the
\Ai-\Ais Ł Richtersveld Transfrontier Park and Conservation Area with Namibia. Areas around major dams
in the Orange River are protected as provincial nature reserves. These reserves, such as Rolfontein and
the Gariep Dam Nature Reserve, are utilised for recreation and conservation, with wildlife having been
introduced to restore populations to historic numbers and species, as part of provincial biodiversity
conservation objectives.
The Orange River mouth carries the status of Ramsar wetland site as a result of its high number of rare
or endangered species, particularly relating to waterfowl, and its uniqueness as ecosystem within the
bioregion.
Through changes in the flow of the river, and particularly the impacts of mining, it is
considered to be in a highly degraded state. Recent initiatives by the Northern Cape Department of
Conservation, Environment and Land in co-operation with the Namibian Ministry of Environment and
Tourism have started to rehabilitate the wetland and provide it with statutory protection.
Botswana
Some 7 million ha of land in south-western Botswana falls within the Orange River basin. This area
comprises the ephemeral Molopo / Nossob system within the Southern Kalahari, a large sand-filled basin
of mainly linear dunes and interspersed pans. The area consists of a generally open lightly wooded
sandveld savanna comprising a number of sub-vegetation types. It falls within the southwest arid bio-
geographic zone which covers a large part of semi-arid southern Africa. While a high proportion of species
are endemic to this large zone, local level endemism (e.g. in the Molopo Basin) is extremely low.
While local surface flows occur in the Molopo / Nossob fossil drainage system after good rainfall events,
the Molopo has not reached the Orange River in the past 1,000 years. Groundwater is exploited via the
Tsabong Groundwater Resources project. While official reports suggest that the environmental impact of
the project is minor, some concerns have been expressed regarding impacts on trees, possibly as a result
of declining groundwater levels.
The main form of land-use in the catchment is traditional livestock rearing. Botswana's national
Biodiversity Strategy and Action Plan lists unsustainable rangeland management from localized overgrazing
as a significant cause of biodiversity loss and habitat destruction and as a major national challenge. Over-
harvesting of natural resources and excessive groundwater abstraction are two other major challenges.
38
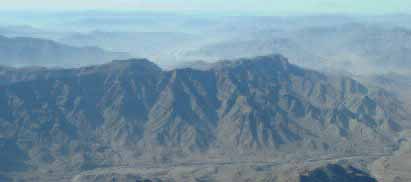
Description of the Basin
3.2.2
Namibia
The southern regions of Namibia contain four desert systems, three of which are drained by the
catchments of the Orange: the Succulent Karoo in the extreme south west, the Nama Karoo in the central
and southern parts, and the Southern Kalahari in the east, the last consisting of a deep layer of wind-
blown sand, with little run-off from rainfall. In the northern and eastern parts of the catchment the
vegetation is semi-arid Acacia tree-and-shrub Savanna, giving way to Dwarf shrub Savanna southwards.
Most of the land in the catchments consists of freehold and communal farmland. Apart from some very
limited and intensive crop production under irrigation the vast majority of the land is extensive rangeland
livestock and wildlife farming within indigenous ecosystems. Cattle predominate in the north, while
mainly sheep and goats are farmed in the more arid south. The mean carrying capacity (stocking biomass)
of this zone is low, ranging from about 25 kg/ha in the extreme north and east of the zone to less than
10 kg/ha in the south and west. Because of the low and highly variable rainfall in this zone, the carrying
capacity also varies considerably from year to year. As a result, over 75% of the Central-South zone is
rated as falling into an area defined as being at "high to very high risk" for conventional farming.
The main environmental challenges are as follows:
Ę Unsustainable land management practices, particularly
o
Overgrazing
o
"Deforestation" (loss of woody vegetation);
Ę Limited and limiting water resources, particularly
o
Limited sources
o
Poor management and infrastructure;
Ę Tenure rights over land and natural resources, with the need for full devolution to the lowest
appropriate level being paramount;
Ę Contradictory policies over land and natural resources;
Ę Need for diversification in land-use, going hand-in-hand with a need for enhanced
entrepreneurial skills;
Ę Limited capacity, skills and access to finances;
Ę HIV/Aids.
A clear manifestation of these challenges is poverty and a poor quality of life, and an inability of rural
communities to extract themselves from the poverty trap.
39
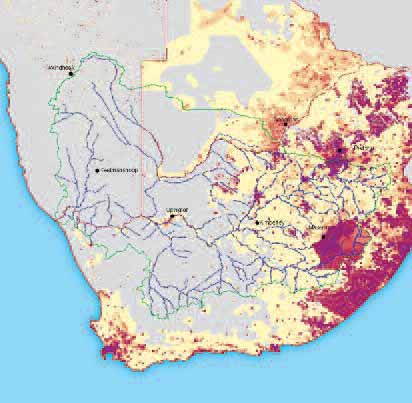
Description of the Basin
3.3
3.3 Socio-Economic Situation in the Orange-Senqu Basin
The basin has been populated from the earliest days of humankind, and hominid fossils (Australopithecus
africanus) have been recovered from within the basin in the Taung area. Humans of the later Stone-Age
(post 125,000 years ago) lived in the basin, and these were later represented by the San hunter-
gatherers, who left evidence in rock paintings and petroglyphs throughout the Karoo and in the
mountains of Lesotho. The San were the only inhabitants of the basin until some 2,500 years ago, when
the Khoi-Khoi pastoralists arrived in the central basin, moving westwards to the arid coast. Agro-
pastoralist Bantu-speaking peoples migrated into the Vaal basin some 1,500 years ago and spread south
and west as far as about the current 200mm isohyet (Earle et al., 2005). After 1690, European semi-
nomadic livestock farmers spread into the basin from the south west, and European settlement
intensified in the late 19th century, accompanied by the development of extensive commercial livestock
farming, rainfed crop and livestock production in the east, and intensive irrigated farming along the
Orange and Vaal rivers.
40
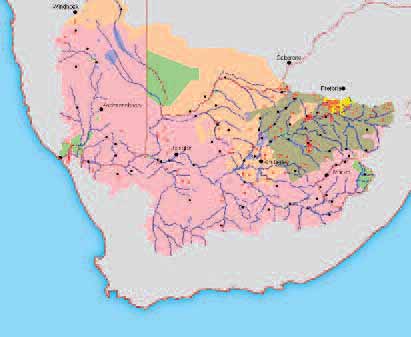
Description of the Basin
3.3.1
3.3.1 Demographic Trends
The basin had an estimated population of 19 million people in 2004 (Earle et al., 2005). South Africa has
by far the major proportion of the basin's people, with high population densities in its Gauteng province
but significantly fewer people in the arid west. All four countries have undergone significant urbanization
but population growth rates have slowed because of decreasing fertility and high mortality due to the
very high HIV/Aids prevalence rates.
3.3.2 Land-use and Economic Indicators
Most of the South African part of the basin is farmed commercially with medium to large stock units.
Rainfed commercial farming ranges from maize and wheat production on the grasslands of the east, to
increasingly extensive rangeland-based livestock systems to the west. Cattle and sheep are important in
the east, while the arid land in the west is suited primarily to sheep and goats.
Much of the Lesotho highlands area is sparsely populated, but the Caledon River valley is densely settled
on both sides of the Lesotho-South African border.
The Orange and Vaal rivers and some of their tributaries have significant intensive, commercial, irrigated
farming practices along their middle and lower reaches. Irrigated agriculture accounts for some 63% of
the water use in the basin (Anon, 2005).
The rest of the Orange basin is characterised by small towns and villages widely scattered throughout
the region serving mainly mining and/or agricultural land-uses (Fig. 10).
41
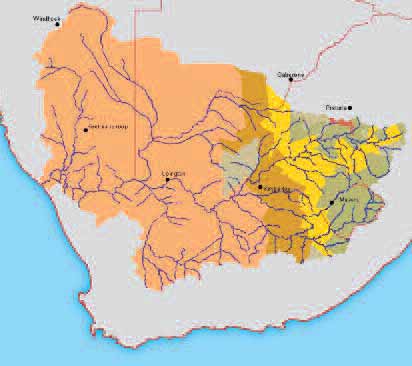
Description of the Basin
3.3.2
Tourism has become an important land-use throughout the basin, displacing or complementing the more
extensive agricultural pursuits. In some areas landowners have invested in wildlife and developed wildlife
and scenery-based tourism products marketed through lodges and guest farms. In certain areas,
particularly the drier western parts of the basin, tourism can have a financial and economic advantage
over agriculture, providing incentives for some land-use change. Gauteng's industrial, mining and
residential conurbation (Johannesburg, Vereeniging, Van der Bijl Park areas) straddles the northern
watershed of the Vaal system. With nine million people, it uses some 20% (the second largest user) of
all water used in the basin (Anon, 2005).
The South African economy is overwhelmingly dominant with 93% of the total gross domestic product
(GDP) for the four countries. GDP per capita is highest for South Africa and lowest for Lesotho. Between
1975 and 2004 economic growth rates have declined in Botswana and Lesotho but increased in South
Africa and Namibia. Inflation rates have been low and have declined further in recent times. The
following four sectors dominate:
Ę agriculture forestry and fishing,
Ę mining and quarrying,
Ę manufacturing and utilities, and
Ę services (which includes government).
42
Description of the Basin
3.3.3
Economic evidence suggests that, for economic efficiency, scarce water in the basin should (all other
things being equal) be reallocated from irrigated agriculture to urban and industrial uses (BKS (Pty) Ltd.
& Ninham Shand (Pty) Ltd, 1998). In addition, BKS (Pty) Ltd. & Ninham Shand (Pty) Ltd (1997b) examined
the expected social impacts of such a reallocation of water. Reallocation would have significant positive
net benefits socially. Redistribution of wealth, and attention to improving water quality, were also found
to be important for enhancement of social wellbeing.
3.3.3 Social and health Indicators
The majority of the populations in the basin countries can be described as poor. Health indicators for the
basin tend to have similar patterns to those for human development, employment and poverty. Compared
with the rural areas, the urban areas have lowest infant mortality rates and better medical services and
facilities. The incidence of HIV/AIDS is very high, being 35.8%, 23.6%, 22.6% and 20.0% in Botswana,
Lesotho, South Africa and Namibia, respectively (Ashton & Ramasar 2001). The social and economic
impact of this pandemic is currently dire, and will become even more so in future. All four countries in
the Orange-Senqu river basin have inequitable distribution of income. Based on the Gini index, Namibia
(74%) is least equitable and South Africa (58%), is most equitable.
The human development index rose between 1970 and 1990 but has since declined in all countries.
Similarly, life expectancy between 2000 and 2005 is much lower in all countries than it was between
1970 and 1975. Other indices such as adult literacy, and access to improved water sources, reflect
general improvement over time, in line with the economic growth trends described above. In South Africa
the general level of human development is highest in the urban centre of Gauteng, and lowest in the arid
west, where traditional, small-scale rainfed land-uses are typical.
3.4 Legal and Institutional Setting
3.4.1 International law framework
The SADC Protocol as a regional framework agreement
Applicable to the Orange-Senqu River are international agreements of a multilateral (regional), basin-
wide and bilateral nature. The legal regime for the basin needs to be understood in the context of the
membership of the basin states in the Southern African Development Community (SADC). All Orange-
Senqu River basin states Ł Botswana, Lesotho, Namibia and South Africa Ł are Member States of SADC. In
Article 22(1) the SADC Treaty provides for Member States to conclude "such Protocols as may be
necessary in each area of co-operation, which shall spell out the objectives and scope of, and
institutional mechanisms for, co-operation and integration". The Protocol on Shared Watercourse Systems
in the Southern African Development Community (hereinafter referred to as the Original Protocol) was
the first Protocol concluded under Article 22 (1) of the Treaty. Following the revision of the Original
Protocol the SADC states have concluded between them the Revised Protocol on Shared Watercourses in
the Southern African Development Community (hereinafter referred to as the Revised Protocol), which
is the regional framework agreement dealing with the management of shared watercourses in the SADC.
The Revised Protocol received the required number of ratifications and entered into force on 22
September 2003 (Barroso, 2007) for all countries that ratified it, which includes all Orange-Senqu River
riparian states.
43
Description of the Basin
3.4.1
The Revised Protocol is drafted largely in line with the provisions of the 1997 UN Convention on the Law
of the Non-Navigational Uses of International Watercourses (hereinafter the UN Convention) Ł which,
although not yet in force, is considered to be an authoritative statement of relevant international law
(Wouters, 2000). Like the UN Convention, the Revised Protocol contains the fundamental principles of
international water law, i.e. "equitable and reasonable utilisation" (Article 3 (7)), the "obligation to
prevent significant harm" (Article 3 (10) (a)) and "notification of planned measures" (Article 4 (1) (b)).
The hydrological scope of the UN Convention as well as the Revised Protocol is the "watercourse".
A watercourse is defined as "a system of surface and ground waters consisting by virtue of their physical
relationship a unitary whole normally flowing into a common terminus such as the sea, lake, or aquifer".
This definition recognises the interrelationship between all parts of the system of surface and
underground waters that form an international watercourse and only excludes so-called "confined"
aquifers. Unlike the 1966 Helsinki Rules on the Uses of the Water of International Rivers developed by
the International Law Association (hereinafter the Helsinki Rules), which had the "drainage basin" -
defined as "a geographical area extending over two or more States determined by the watershed limits
of the system of waters,..." Ł as a hydrological scope, a "watercourse" does not include the related land
area of the basin. Of relevance for the GEF project though is the adoption in international agreements
- including Article 4 (2) (a) of the Revised Protocol - of the so-called "ecosystems approach"
to environmental protection of shared watercourses. The "ecosystems approach" would appear to
enhance legal recognition of the physical unity of drainage basins (McIntyre, 2004) as any attempt to
protect a river ecosystem cannot avoid affecting the surrounding land areas or their environment
(Birnie & Boyle, 2002).
The Revised Protocol contains the generic rules for the management of shared rivers within the SADC
region, but does not contain basin-specific rules. It stipulates in Article 6 (3) that watercourse states may
enter into watercourse specific agreements that apply the provisions of the Protocol to that watercourse
or part thereof. Where a basin specific agreement does not exist, or does not contain provisions
regarding aspects covered in the Revised Protocol, the provisions of the latter one apply (see below on
the Orasecom-Agreement and bilateral agreements in the Orange-Senqu River basin).
The Revised Protocol establishes an institutional framework at the regional level for the implementation
of the instrument. In Article 5 it establishes the SADC Water Sector Organs and mandates them, as well
as Shared Watercourse Institutions, with the implementation of the Revised Protocol.
The relevance of the UN Convention
To date Namibia and South Africa are the only Orange-Senqu River basin states that have ratified the UN
Convention. Currently the UN Convention has not yet received the required minimum number of
ratifications and is not in force Ł but its key principles (equitable and reasonable utilisation, obligation
not to cause significant harm, notification of planned measures) are accepted as customary international
law (McCaffrey, 2001). When the UN Convention enters into force it does not affect the rights or
obligations of a watercourse state arising from agreements in force before it became a party to the UN
Convention (Article 3). Therefore, in the context of the Orange-Senqu River, even if the UN Convention
enters into force, the provisions of the SADC Protocol and applicable bilateral agreements will take
44
Description of the Basin
3.4.1
precedence over the provisions of the UN Convention. The latter one can, however, potentially provide
guidance in the interpretation of the Revised Protocol and basin specific agreements (Malzbender &
Earle, 2007).
The Orasecom Agreement
In 2000 the Orange-Senqu River riparian states have concluded the "Agreement between the
Governments of the Republic of Botswana, the Kingdom of Lesotho, the Republic of Namibia and the
Republic of South Africa on the Establishment of the Orange-Senqu River Commission" (hereafter
Orasecom-Agreement). It is the first basin-wide agreement on the Orange-Senqu River, involving all four
basin states. The Agreement establishes Orasecom as an international organisation with international
and national (in each member state) legal personality (Article 1 (2)).
In its preamble the Orasecom-Agreement makes reference to the Helsinki Rules, the UN Convention and
the Original Protocol on Shared Watercourse Systems. The Orasecom-Agreement was drafted and came
into force at a time when the Revised Protocol was not yet signed, let alone entered into force. The
provisions of Article 7 of the Orasecom-Agreement, however, which stipulates the substantive obligations
of the parties with respect to the utilisation of the "river system", seem to be largely borrowed from
the UN Convention (and thus indirectly from the Revised Protocol, which was under negotiation at the
time and is nearly identical to the UN Convention in this regard). Although not drafted as an agreement
in the sense of Article 6 (3) of the Revised Protocol it can therefore be argued that the Orasecom-
Agreement is de facto an agreement in that sense as it applies the provisions of the Revised Protocol to
the characteristics of a particular shared watercourse, even though the Revised Protocol came into force
only later.
At the same time significant differences in terminology between the Orasecom-Agreement and the SADC-
Protocol remain. The different definition in the two instruments of their respective hydrologic scope -
watercourse in the SADC Protocol, River System in the Orasecom-Agreement Ł is one such example. The
term "system" was used in the Original Protocol, where a "watercourse system" was defined as "the
inter-related hydrologic components of a drainage basin such as streams, rivers, lakes, canals and
underground water which constitute a unitary whole by virtue of their physical relationship". Hence,
the Original and the Revised Protocol, as well as the UN Convention, apply to the hydrologic components
only and not the related land area of a basin (but see reference to the "ecosystem approach" above).
Since the Orasecom-Agreement was influenced by the three instruments above, it appears that despite
using different terminology, it was not the intention of the drafters that the hydrologic scope of the
Orasecom-Agreement should differ from the one defined in the Revised Protocol (van Niekerk, 2007). The
term "river system" should thus be understood as to encompass the same as the term "watercourse" as
used in the Revised SADC Protocol. Yet, in the interest of legal clarity a further harmonisation between
the terminology of the two instruments appears to be desirable, particularly against the background
that the basin states have, or are in the process, of harmonising their national laws with the SADC
Protocol and relevant regional policies, i.e. the SADC Regional Water Policy (RWP) and the SADC Regional
Water Strategy (RWS).
At the same time the Orasecom-Agreement contains a number of provisions that would fall under what
is considered to be the "ecosystem approach" mentioned above. Whereas is does not, like the UN
45
Description of the Basin
3.4.1
Convention (Article 20) and the Revised Protocol (Article 4 (2) (a)), contain a generic provision that
requires states to "protect and preserve the ecosystem (of a shared watercourse)", the Orasecom-
Agreement includes provisions spelling out specific environmental protection obligations, such as to
"protect and preserve the River System" (Article 7.12), to "prevent, reduce and control pollution of the
River System that may cause significant harm to one or more Parties, including harm to the environment,
or to human health or safety, or to the ecosystem of the River System" (Article 7.13), to "protect and
preserve the estuary" (Article 7.14) and to "prevent the introduction of species, alien or new, that have
a detrimental effect to the ecosystem of the watercourse" (Article 7.15).
Meeting these environmental
protection obligations in practice is only possible within the framework of Integrated Water Resources
Management, which extends water management beyond the management of water only and takes related
resources, such as land, into account. With the above provisions the Orasecom-Agreement endorses the
principle of IWRM and allows for the holistic management of resources in the basin.
Bilateral agreements
A number of bilateral agreements relating to the Orange-Senqu River have been concluded between
riparian states over time. Two treaties between Botswana and South Africa deal with border delineation
and the establishment of a Joint Permanent Commission for Cooperation (on several matters, including
water) respectively. The most important bilateral agreements specifically dealing with cooperation on
the development and use of the water resources of the Orange-Senqu River are:
Ę Treaty on the Lesotho Highlands Water Project between the Government of the Republic of South
Africa and the Government of the Kingdom of Lesotho (1986) with Protocols I-VI (concluded between
1988 and 1999). This series of treaties established the Joint Permanent Technical Commission (JPTC)
in 1986, which was in 1999 (through Protocol 6) changed to the Lesotho Highlands Water
Commission (LHWC);
Ę Samewerkingsooreenkoms tussen die Regering van die Republiek van Suid-Afrika en die
Oorgangsregering van Nasionale Eenheid van Suidwes-Afrika/Namibiļ Betreffende die Beheer,
Ontwikkeling en Benutting van die Water van die Oranjerivier (1987)17 ;
Ę Agreement on the Vioolsdrift and Noordoewer Joint Irrigation Scheme between the Government
of the Republic of Namibia and The Government of the Republic of South Africa (1992);
Ę Agreement between the Government of the Republic of South Africa and the Government of the
Republic of Namibia on the Establishment of a Permanent Water Commission (1992).
Article 1 (3) of the Orasecom-Agreement stipulates that the rights and obligations of the parties from
other agreements in force prior to the date of entry into force of the Orasecom-Agreement, remain
unaffected. The rights and obligations provided for in the above-mentioned bilateral agreements
therefore remain effective. A change to the status quo thus established by the respective bilateral
agreements can only be effected if the parties to the bilateral agreements agree to do so, e.g. in the
possible negotiation of a comprehensive basin-wide agreement between all riparian states.
In line with the principle of Article 1 (3) of the Orasecom-Agreement, Article 1 (4) stipulates that the
parties to the agreement can establish river commissions between them with regard to any part of the
river (which shall be subordinate to Orasecom) and that existing Commissions liaise with Orasecom.
46
17The original agreement has been concluded in Afrikaans only, translated to English it stands for "Cooperation Agreement between the
Government of the Republic of South Africa and the Transitional Government of National Unity of South West Africa/ Namibia Concerning
Description of the Basin
3.4.2
Other international environmental agreements
In addition to the above-mentioned water specific international agreement the Orange-Senqu River basin
states are Party to a number of other relevant international (environmental) agreements, among others:
Ę Convention
on
Wetlands
of
International
Importance
Especially
as
Waterfowl
Habitat
(Ramsar Convention);
Ę Convention on International Trade in Endangered Species of Wild Fauna and Flora;
Ę Convention on Biological Diversity;
Ę UN Framework Convention on Climate Change and Kyoto Protocol;
Ę United Nations Convention to Combat Desertification in those Countries Experiencing Serious
Drought and/or Desertification, particularly in Africa;
Ę Stockholm Convention on Persistent Organic Pollutants.
3.4.2 Regional policy framework
The main water related policy documents at SADC level are the Regional Water Policy (RWP) and the
Regional Water Strategy (RWS). They lay down regionally agreed policy guidelines concerning water
resources management, covering a wide range of topics from infrastructure development, information
exchange, capacity building to gender aspects and stakeholder involvement. Chapter 5 of the RWP deals
with water and environmental sustainability and recognises the environment as a resource base and
legitimate user of water.
The RWP and RWS subscribe to the principle of IWRM and emphasise the importance of regional
cooperation over water resources and the need to manage water resources in an integrated manner
(Malzbender & Earle, 2007), specifically highlighting the need for regional integration (Policy 3.1) as
well as cooperation between all affected (water use) sectors (Policy 3.3) (SADC, 2005).
The RWP promotes the establishment and development of transparent institutions and the involvement
of stakeholders in water management decision-making. In line with the provisions of the SADC Protocol,
the policy calls for the establishment of Shared Watercourse Institutions (SWCI) on each shared
watercourse (Policy 9.2.2), which shall promote stakeholder participation in decision-making (Policy
9.2.8). In chapter 10 the policy deals exclusively with stakeholder participation and capacity building,
stating that water resources management and development at all levels shall be based on a participatory
approach (Policy 10.1) and that stakeholders need to be empowered to effectively participate in such
decision-making (10.1.2).
Although, as policy documents not legally binding on the SADC member state; the RWP and RWS provide
important guidance for the ongoing harmonisation of national water policies (and laws) of the SADC
member states. Since all Orange-Senqu River basin states are members of SADC and have thus committed
themselves to meeting the principles and policy objectives set forth in the RWP and RWS, these principles
also need to be observed by Orasecom in the management of the basin.
3.4.3 International institutional framework
The Orasecom is the basin-wide Commission established by the four basin states. The objectives of the
Orasecom Council (the highest decision making body) are to "serve as technical advisor to the Parties on
47
Description of the Basin
3.4.4
matters relating to the development, utilisation and conservation of the water resources in the River
System..." and to "perform such other functions pertaining to the development and utilisation of water
resources as the Parties may agree to assign to the Commission" (Article 4 of the Orasecom-Agreement).
Article 5 of the Orasecom-Agreement singles out a number of areas where the commission is requested
to take the required measures necessary for advising the Parties. These issues are the long-term yield
determination, equitable and reasonable utilisation, studies with regard to the development of the
resources, stakeholder involvement, data collection and sharing, pollution prevention, measures for
emergency situations, information exchange and consultation between parties and measures for the
prevention and settlement of potential disputes as well as any other matters determined by the Parties
(i.e. the four basin states).
In addition to the Orasecom there are a number of bilateral Commissions in place between riparian states
(see above for the legal relationship between the bilateral commissions and ORASECOM), these are:
Ę Lesotho Highlands Water Commission (LHWC) between Lesotho and South Africa;
Ę Permanent Water Commission (PWC) between Namibia and South Africa.
SADC institutions are not mandated with the implementation and enforcement of basin-wide agreements.
Where those have been concluded this is done by Shared Watercourse Institutions such as Orasecom
and/or bilateral institutions as well as the domestic institutions in the countries that are party to the
basin specific agreements. The SADC institutions are mandated primarily with monitoring functions
concerning the application of the Revised Protocol as well as with facilitating the harmonization of water
law and policy between SADC member states.
3.4.4 National legislation, policies and institutions
The legal framework for transboundary water resources management set by the Revised Protocol, the
Orasecom-Agreement and the bilateral agreements is complemented by the domestic laws of the member
states. Essentially, the effective implementation of international agreements depends on the interaction
between international and national laws, as enforcement on the national level has to make use of the
instruments of national laws (Tekateka & Malzbender, forthcoming). In this context domestic legislation
fulfils a number of key functions, the most important ones arguably being that it:
Ę clarifies the entitlements and responsibilities of the state, the users and providers;
Ę formalises the process of water allocation;
Ę establishes an institutional framework for water management and provides legal status for various
water user groups;
Ę clarifies the role of the state in relation to other stakeholders;
Ę provides the legal means for enforcing the rights and obligations of the respective role-players;
Ę ensures sustainability of the resource.
Whereas usually most provisions governing these functions will be found in a country's water legislation,
some elements of the legal framework for water management can be found in other, i.e. not water
specific legislation such as environmental legislation.
48
Description of the Basin
3.4.4
In essence, three broad categories of domestic law provisions are required as minimum standards in
order to effectively implement the Revised Protocol and the applicable basin specific agreements.
These are:
Ę Water allocation provisions in order to comply with equitable utilisation (or, if available, detailed
flow allocations in basin-specific agreements) as far as water quantities are concerned;
Ę Water quality standards as well as monitoring, control and enforcement mechanisms;
Ę Environmental Impact Assessment (EIA) legislation in order to determine the possibility (and degree)
of transboundary harm.
3.4.4.1 Botswana
Legislation
At present water resources management in Botswana is primarily governed by the:
Ę Water Act 34 of 1968; and the
Ę Borehole Act of 1956.
These two Acts are complemented on the water services side by the
Ę Waterworks Act 1962; and the
Ę Water Utilities Corporation Act 1970.
Additional legislation such as the Local Government District Councils Act, the Public Health Act and the
Aquatic Weeds Control Act are also of relevance for water resources management (GoB, 2006).
Whereas the Borehole Act is a short statute that ensures that record is kept of the boreholes drilled
in the country, the 1968 Water Act provides the current framework for water resources management
in the country. The Act defines the status of public water, defines user rights, establishes licensing
criteria, establishes the Water Apportionment Board as a licensing authority and contains provisions on
pollution control.
The 1968 Water Act is outdated and does not account for the now commonly accepted principle of IWRM.
Of relevance in the context of the Orange-Senqu River basin management is that the Act does not make
reference to the country's international rights and obligations. To address the shortcomings of the Act
Botswana is in the process of reforming its water law. A new draft Botswana Water Bill (2005) has been
prepared in is currently being prepared for parliamentary proceedings (Mathangwane, 2007). The draft
bill contains provisions on water resources management as well as pollution control. In recognizing IWRM
principles it reforms the institutional set-up for water management in the country, particularly
strengthening the involvement of stakeholders. It also includes reference to Botswana's rights and
obligations resulting from international agreements related to water.
It needs to be noted though that Botswana does not contribute any surface water flow to the Orange-
Senqu River. In the context of the management of the Orange-Senqu River basin the country's legislation
thus becomes most relevant as far as groundwater is concerned.
Environmental Impact Assessment legislation - important for large-scale water related projects -
in Botswana was previously found within a wide range of Acts (SAIEA, 2003). In May 2005 the
Environmental Impact Assessment Act (No.6 of 2005) was enacted by Parliament, which now provides
the general framework for EIAs.
49
Description of the Basin
3.4.4
Institutional arrangements
Currently, four ministries have roles for different aspects of water development, resource management
and service delivery, the Ministry of Minerals, Energy and Water Resources (MMEWR); Ministry of Local
Government (MLG); Ministry of Environment, Wildlife and Tourism (MEWT); and Ministry of Agriculture
(MOA) (GoB, 2006).
The primary role-player for water resources management is the Department of Water Affairs (DWA) in the
MMEWR, which is responsible for policy formulation, planning, development, and management of water
resources. The DWA is complemented by the Department of Geological Survey (DGS) in the same Ministry
which investigates and monitors groundwater systems. The granting and administration of water rights
is done by the Water Apportionment Board (WAB), a body that draws its powers from the Water Act 1968.
The Director of Water Affairs is the Secretary and Registrar of WAB and also administers the Aquatic
Weeds Control Act (GoB, 2006).
In exercising its responsibility for water resource planning in the country, the DWA also considers
Botswana's rights and obligations from international agreements and includes these into the long term
strategic planning for water resources development. The DWA has developed a National Water Master
Plan for the period 1990-2020, which has recently been reviewed. The National Water Master Plan is
implemented through the five year National Development Plans. At the national level the DWA
coordinates its water resource management planning with the sector policies of other ministries,
e.g. agriculture.
The new Department of Waste Management and Pollution Control (DWM&PC) in the MMEWR that was
established in April 2005 is responsible for the management and administration of legislation and
regulations concerning sanitation, waste management and pollution control.
The implementation of EIA legislation, i.e. the new Environmental Impact Assessment Act does not lie
with the MMEWR but with the Department of Environmental Affairs (DEA) in the Ministry of Environment,
Wildlife & Tourism (GoB, 2006). Close cooperation between the DWA and the DEA is thus required as far
as the implementation of water resources development projects is concerned.
3.4.4.2 Lesotho
Legislation
Water resources management in Lesotho is governed by the Water Resources Act 1978, which defines
water uses and contains some provisions on permit administration and pollution control. All in all the
scope of the Act is very limited, of particular relevance in the context of this study is that the Act does
not recognise international obligations, hence does not provide the Lesotho authorities with adequate
means in domestic law to comply with international obligations. The country has, however, embarked on
a process to reform its water resources legislation and the new Water Resources Management Bill, 2007
is currently going through a public consultation process (Mokorosi, 2007).
The reform trajectory has been set by the country's 1999 Water Resources Management Policy and the
new Lesotho Water and Sanitation Policy of February 2007, which has replaced the 1999 policy and covers
both water resources management and water services provision. Important for the GEF project is that
50
Description of the Basin
3.4.4
the policy contains clear statements regarding environmental protection as part of water resources
management. In its principles the policy states that the management of water resources demands a
holistic approach linking social and economic development with the protection of ecosystems.
Environmental protection is further included in policy statement 1, which recognises environmental
water needs, and policy statement 3 on environmental protection.
In line with IWRM principles and of importance for the GEF project is that the policy emphasises the
need for stakeholder participation and the devolution of (some) water resource management
competencies to lower levels and the involvement of NGOs, CBOs and civil society in integrated water
resources management (policy statement 6). Lesotho has developed a draft IWRM strategy that places
strong emphasis on environmental protection and elaborates further on the practical implementation of
the above principles set forth in the policy.
Unlike the Water Resources Act, the (newer) policy emphasises that in managing water resources
cognisance will be taken of the obligations to downstream users under international law (policy statement
4). Whereas there is no indication that Lesotho has in the past not met its international obligations (e.g.
resulting from the Lesotho Highlands Water Project Treaty), explicit reference in the policy to
international obligations provides greater clarity and sets the principle for subsequent legislation.
Consequently the draft Water Resources Management Bill, 2007 recognises Lesotho's international
obligations related to water. In terms of the Bill, the Commissioner of Water, who is responsible for
decisions concerning the management and utilisation of the country's water resources (Section 14), is
responsible for managing transboundary water resources in compliance with international obligations
taking due cognisance of the obligations to downstream users (Section 15 (c) (vi).
Overall the new draft legislation establishes a comprehensive water resources management framework,
including water use entitlements and administration of water licences (Sections 3-9), pollution
prevention and control (Sections 47-52) and the establishment of a new institutional framework for water
management, which foresees the establishment of Catchment Management Agencies (Sections 41-46).
Of note from an environmental protection point of view are the Bill's specific provisions on the
protection on wetlands and natural springs (Sections 38 and 39), which are of great relevance in the
context of the Orange-Senqu River.
Hence, whereas the currently applicable legislation in Lesotho is outdated, the new policy and draft
legislation, once enacted, will provide a more comprehensive framework for water resources
management in the country, which will be in line with international trends and, most importantly, will
tie in well with policy and legislation in the other Orange-Senqu River riparian states.
As far as water pollution control is concerned, additional draft legislation has been developed with the
Environment Bill, No 15 of 2001 and the Amendment Bill of 2006, the latter of which sets out the laws
relating to pollution control, and makes provision for the development of standards for effluent
discharge. The legislation also provides for the Minister to make EIA regulations (SAIEA, 2003). The
legislation has not been gazetted and is yet to come into force but some of its provisions, such as
guidelines for undertaking EIAs, are already in use (SAIEA, 2003).
51
Description of the Basin
3.4.4
Of important in the context of water resources management are the linkages between land management
and water resources. Lesotho, where overgrazing is a serious problem with negative effects on water
resources, is currently in the process of developing a new Rangeland Management Act, which will replace
the Range Management Regulations of 1980 (with amendments of 1986) (Mokorosi, 2007).
Institutional arrangements
The Lesotho Water and Sanitation Policy provides for a new institutional framework for water
management in the country and the process of establishing the new framework is well underway
(Mokorosi, 2007). The Department of Water Affairs under the Commissioner of Water in the Ministry of
Natural Resources is the principle body responsible for water resources management (see comprehensive
institutional framework of government institutions involved in water management in the diagram below.
52
Description of the Basin
3.4.4
3.4.4.3 Namibia
Legislation
The relevant water resources management legislation in Namibia is currently largely confined in the
Water Act No 54 of 1956. While it is currently still in force, the Act is outdated and does not take modern
water law principles into account. It still contains the principle of private riparian rights to water (for
some water), which has been overcome in most other water laws around the world. The Act does not take
IWRM principles into account, does not accord for environmental sustainability and does not recognise
international obligations.
Other policy and legislation of relevance to water resources management are the:
Ę Water Supply and Sanitation Policy (1993);
Ę The National Water Policy for Namibia (2000);
Ę Namibia Water Corporation Act (No. 12 of 1997); and the
Ę Minerals (Prospecting and Mining) Act (No. 33 of 1992).
In addition to the 2000 Water Policy, numerous other policies exist that bear relevance for integrated
water resources management as promoted by the White Paper and the new Water Resources Management
Act (2004) (see detail on the new Act below).
Namibia is starting the process of developing an IWRM plan for the country towards the end of 2007.
One of the objectives of the IWRM plan will be, in line with the National Water Policy and the new Water
Resources Management Act, to integrate the various sectoral and cross-sectoral policies into a
harmonised planning framework (Amakali et. al., forthcoming).
Namibia promulgated the Water Resources Management Act 24 of 2004, in December 2004 (hereinafter
the Water Act) and is based on the principles set out in the 2000 National Water Policy Paper. The Water
Act has not yet commenced, but this is expected in December 2007 (Amakali, 2007). The Water Act
subscribes to the principle of IWRM and reforms the institutional framework for water management in
the country Ł importantly in this context it places strong emphasis on the involvement of stakeholders
in water resources management, e.g. by providing for the establishment of basin management
committees. The Act also emphasises the need for ecosystem protection. Furthermore, it makes specific
53
Description of the Basin
3.4.4
reference to meeting Namibia's international obligations, thus providing Namibian authorities with the
domestic law means to comply with international agreements related to water resources.
Water quality management in Namibia is currently also governed by the 1956 Water Act and related
regulations. Other legal instruments covering issues of water quality and pollution control are the Public
Health Act, Municipal Drainage Regulations, the Model Sewerage and Drainage Regulations (1996), and
the draft Pollution Control and Waste Management Bill (1999). Once the Water Act commences water
quality management will regulated by the new legislation and related regulations.
The new Environmental Management Act has been approved y parliament and is expected to be gazette
in 2008. Once promulgated as law the new legislation provides a comprehensive framework for EIA in
Namibia, which will be relevant for the implementation of water resource development projects.
Institutional arrangements
Water resources management falls under the responsibility of the Ministry of Agriculture, Water and
Forestry (MAWF) (see institutional diagram of the Ministry below).
Within the Ministry, water resource management falls under the Directorate of Resource Management.
The principal water resource divisions in the Directorate are the Hydrology, Geohydrology and Water
Environment Divisions, of which the latter deals with water quality, pollution control, ecological and
54
Description of the Basin
3.4.4
technical research (MAWRD, 2000). The Law Administration Division is responsible for administering the
regulatory regime concerning abstraction permits, prospecting, licensing of boreholes where appropriate,
and other matters related to abstraction and allocation of the resource, whereas the Planning Division
performs, inter alia, strategic planning and is the division responsible for issues of international waters
(MAWRD, 2000; MWAF, 2007).
3.4.4.4 South Africa
Water legislation and policy
South Africa's water policy is enshrined in the White Paper on a national Water Policy for South Africa".
The principles set out in the White Paper have largely been translated into law and are now contained
in the country's two main water related Acts.
These two Acts that deal exclusively with water management aspects are the Water Services Act (No. 108
of 1997), which provides the regulatory framework for the provision of water services by local
authorities, and the National Water Act (No. 36 of 1998) (hereafter NWA). Replacing the Water Act 54 of
1956, the NWA, in combination with the National Water Resources Strategy (NWRS), establishes the
framework for water resources management and the protection of water resources in the country.
In terms of Section 3 of the NWA the National Government is the trustee of the nation's water resources
and must ensure that water is protected, used, developed, conserved, managed and controlled in a
sustainable and equitable manner, for the benefit of all persons and in accordance with its constitutional
mandate.
The NWA makes provision for only one right to water, the Reserve (DWAF, 2005). The Reserve is the water
required for basic human needs (i.e. water for drinking, cooking and personal hygiene) and the water
required to maintain ecosystem functioning. The Reserve gets the priority allocation and therefore
determines the amount of water available for other uses (DWAF, 2005). All other water uses must be
authorised. Depending on the type and scope of use, different types of authorisations exist, which are
listed in Section 4 of the NWA.
In addition to the NWA's water allocation mechanism, other elements of relevance for the GEF project
are the NWA's provisions on water resources protection including resource quality objectives (see
detailed analysis of water quality management framework in chapter 4.5 of this document), the
provisions establishing an institutional framework (see institutional section below) for water
management in the country as well as provisions dealing with stakeholder participation and meeting
international obligations.
The NWA obliges water management institutions to involve stakeholders in water resource management
activities. Section 80 (e) of the NWA requires catchment management agencies "to promote community
participation in the protection, use, development, conservation, management and control of the water
resources in its water management area". Section 81 (1) of the NWA notes that the governing board of
a catchment management area must be appointed "with the objective of achieving a balance among the
interests of water users, potential water users, local and provincial government and environmental
interest groups".
55
Description of the Basin
3.4.4
Section 2 (i) of the National Water Act expressly recognises meeting international obligations related to
shared water resources as a purpose of the Act. This makes it clear that South Africa is committed to
meeting its international obligations with respect to water management and at the same time provides
South African water resources management authorities with the means to enforce international
obligations domestically and comply with obligations resulting from international agreements. Whereas
the legal basis in domestic law for complying with international obligations is there, South African water
management authorities at all levels can now, and need to, take the necessary steps in practice to ensure
that international obligations are met. The Act furthermore contains specific provisions empowering the
Minister to establish bodies to implement international agreements.
Institutional framework
At national level, the Department of Water Affairs and Forestry (DWAF) is managing the country's water
resources. As required by Chapter 7 of the NWA and the National Water Resources Strategy (NWRS) the
DWAF is in the process of establishing 19 catchment management agencies (CMAs), which will gradually
take over catchment management functions from the DWAF and have to manage water resources at a
regional level in their respective water management areas (WMAs). Five of these CMAs Ł Upper Vaal,
Middle Vaal, Lower Vaal, Upper Orange and Lower Orange Ł will cover the South African part of the
Orange-Senqu River basin. The CMAs will be responsible, among other things, for ensuring that there is
consonance between their water-related plans and programmes and the plans and programmes of all
other role-players in the catchment they manage (DWAF, 2004).
In this context Section 8 of the NWA requires the development of Catchment Management Strategies
(CMSs) for each WMA. The CMSs need to be aligned with the NWRS and other development strategies at
national or regional level. At the national level they need to be aligned with the national policies of
other sectors (e.g. agriculture, environment etc.). The CMSs also need to be aligned with or become an
integrated component of Provincial Development Strategies. At the local level Section 9 (f) of the NWA
is relevant for the integration of Water Services Development Plans into the Integrated Development
Plans (IDPs) that municipalities must prepare in terms of the Municipal Systems Act (No 32 of 2000). As
mentioned above, any resource assessment that forms part of the CMS needs to take the international
obligations relevant for the respective CMA into account. Whereas the planning framework thus provides
for international obligations to be taken into account, there is to date no experience of implementing
this in practice and it needs to be seen how effectively this will be done in the future once the respective
CMAs in the Orange-Senqu River Basin have been established and are fully operational.
Other environmental legislation
Outside this water specific legislation, the National Environmental Management Act (No. 107 of 1998)
(hereafter NEMA), together with those parts of the Environment Conservation Act (No. 73 of 1989) which
have not yet been repealed by the NEMA (DWAF, 2004) is the most relevant piece of legislation for water
resources management in the country. The NEMA defines the DWAF as a department exercising functions
that may affect and which involve the management of the environment (DWAF, 2004). The NEMA requires
the DWAF to prepare (and review and revise every four years) a Consolidated Environmental
Implementation and Management Plan (CEIMP). The CEIMP describes how the DWAF's functions, policies,
plans and programmes comply with environmental legislation and how existing and proposed cooperative
arrangements with other departments will ensure compliance with water-related policy and legislation
56
Description of the Basin
3.4.4
(DWAF, 2004). In the first addition of the plan reference is made to the fact that international obligations
concerning the management of shared rivers need to be respected and that they consequently need to
be accounted for within the environmental management framework under the NEMA (DWAF, 2001).
In the CEIMP the DWAF has committed itself to developing and implementing an integrated environmental
management framework to ensure that its approach to environmental issues is aligned with the national
environmental principles described in NEMA, and complies with the requirements of NEMA and the NWA
(DWAF, 2004). The framework will ensure that environmental considerations are addressed throughout the
life cycle of all water-related projects and activities at both strategic and project levels and a range of
appropriate environmental assessment and management tools, such as strategic environmental
assessment, biophysical, social and health impact assessment, risk analysis and environmental
management plans, will be developed and implemented to facilitate sound environmental practices
(DWAF, 2004). Until recently EIA procedures used to be governed by the Environment Conservation Act.
In 2006, new EIA regulations were promulgated under the NEMA. These regulations list the activities that
would trigger the need for an EIA to be conducted and repeal the erstwhile listed activities identified
under the Environment Conservation Act and significantly add to them (Cliffe Dekker, 2007).
Another relevant Act is the National Disaster Management Act (No. 57 of 2002), which aims at ensuring
regional interaction with neighbouring countries in internationally shared river basins on disaster related
matters (DWAF, 2004).
57
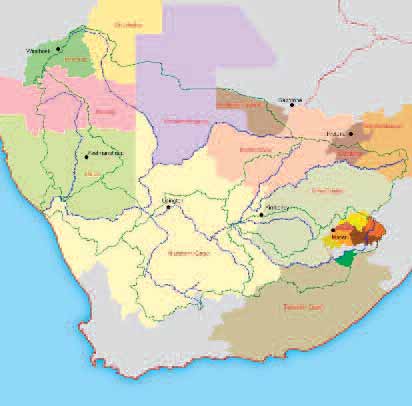
Description of the Basin
3.4.5
3.4.5 Capacity
All Orange-Senqu River riparian states have, or are on the process of developing, water policy and
legislation that reflects international trends in water management, particularly the implementation of
the IWRM concept. Once all legislation is in place the four countries are, from a legal perspective, largely
in the position to implement IWRM nationally while taking into account the obligations set forth by
applicable international law. It needs to be acknowledged though that all countries, to different degrees,
are faced with serious (human and financial) capacity constraints to effectively implement the applicable
policies and laws in practice.
3.4.6 Conclusion and recommendations
The currently applicable (water) legislation in Botswana, Lesotho and Namibia is known to be inadequate
in the context of the sustainable management of the Orange-Senqu River basin according to IWRM
principles. With the coming into force of new legislation in these countries in the near future the legal
situation will change, giving all basin states an adequate legislative framework to take the necessary
actions at national and international level to meet their international obligations. The legislative
framework also provides for the planning framework in which the integrated management of the basin
has to take place in practice.
58
Description of the Basin
3.4.6
The above-mentioned capacity constraints remain a major challenge for implementing the applicable
policies and laws in practice. Whereas the required capacity is arguably highest in South Africa, all
countries experience significant capacity challenges in this regard. A detailed assessment of current
capacity gaps needs to be undertaken in order to develop appropriate interventions to improve on the
available capacity in the basin states.
A further constraining factor to the sustainable management of the basin based on IWRM principles is the
fact that whereas all countries respect international obligations, it is not always clear what these
obligations are. A case in point is water allocation between countries. For example, as illustrated, under
the respective national laws, the national authorities are obliged to meet international obligations and
account for resource allocations to downstream countries (as well as for environmental water
requirements) and include these allocations in their resource planning. In practice the volumes required
for environmental water requirements have not been definitively determined, neither is there basin-
wide agreement on the volumetric allocation of the water resources to each country. In order to use the
resources of the River System in an "equitable and reasonable" manner, the equitable share of each
country needs to be determined. Only once that has been done the respective national authorities are
able to accurately include international obligations (as far as water resources allocation is concerned)
into their planning and thus comply with international law.
The determination of the "equitable share" requires the joint acceptance of a resource determination
model as well as of the applicable criteria to be considered for the determination of the "equitable
share". International water law provides guidance as to the criteria to be used for the determination of
each country's equitable share. It is recommended that during the SAP the required technical information
is gathered and a jointly accepted resource allocation model is agreed on between the basin states, so
that they are technically in the position to determine "equitable and reasonable utilisation" based on
the criteria set forth in international water law.
59
Priority transboundary problems
4.1.1
This Chapter identifies the priority transboundary issues in the Orange-Senqu River Basin, and then
describes each transboundary issue in detail. In particular each section describes the issue and justifies
its transboundary importance; details the environmental impacts and socio-economic consequences of
each problem; highlights the linkages with other transboundary problems; through the causal chain
analysis
identifies
immediate,
underlying
and
root
causes
and
knowledge
gaps;
and
makes
recommendations and conclusions including short-medium term interventions.
The twenty-three common GEF transboundary issues were assessed by the members of the Technical Task
Group (TTG) in order to determine their relevance and transboundary nature in the context of the
Orange-Senqu River Basin. The group was asked to brainstorm and identify the major water-related
transboundary problems. Consequently, the GEF list was narrowed down to 5 major transboundary issues
in the Orange-Senqu River Basin that required further detailed analysis:
1. Stress on ground and surface water resources
2. Changes to hydrological regime
3. Deterioration of water quality
4. Land degradation
5. Alien invasives.
When examining the transboundary issues the authors were asked to consider biodiversity and climate
change as cross-cutting issues. The effects of climate change are discussed separately in section 3.1.5.
4.1 Stress on ground and surface water resources
4.1.1 Basin Description in terms of water resources
Introduction / Background
The Orange-Senqu River system provides the single largest water resource south of the Zambezi in a
region which is classified as semi-arid and subject to increasing water stress. The highlands of Lesotho
provide the only exception where the climate is temperate and annual rainfall exceeds evaporation.
Elsewhere annual evaporative losses far exceed annual rainfall and to such a degree in the Lower Orange
that the climate is classified as arid to hyper-arid. Certain areas of the Basin are already densely
populated, economic development is significant, and socio-economic expectations are high. This causes
an inevitable high degree of competition for the finite water resources that are available. Add to this
the fact that the urban and industrial demands are geographically concentrated in the upper semi-arid
parts of the Basin and these demands support activities that make a major contribution to the GDP of
the largest riparian country creates a significant geographical imbalance in utilization of available water
resources.
The skewed distribution of rainfall, the geographical concentration of demand in the upper half of the
system, the significant agricultural demands in the drier parts of the catchment and the provision of
the storage and transmission infrastructure to meet these, is the essence and driving force of the ensuing
trans-boundary issues.
60
Priority transboundary problems
4.1.2
For Namibia the Orange River is a key resource for the southern region of the country, where the
commercial agriculture and mining activities depend on the river as a reliable resource. In Botswana
the basin is very flat has not contributed water to the mainstream in recent history. Nor is the Orange
a very practicable resource for SW Botswana, the existing demands generally being too far distant from
the river. However, some irrigation development is proposed.
In the case of Lesotho the national water demands are relatively small and the downstream impacts of
abstractions would therefore be quite minor and not present a significant downstream conflict risk.
However, the development of the Lesotho Highlands Water Project (LHWP) in Lesotho, transferring water
to the Vaal System, does have a significant impact on the river in Lesotho and South Africa.
4.1.2 Existing surface water resources infrastructure
Starting with the construction of Vaal Dam in the 1930's and accelerating with of the `Orange River
Development Project' in the early 1960's, huge investments in water resources infrastructure took place
such that now the Orange Ł Senqu and the external river basins which are integrated with the Orange
Basin feature one of the most complex bulk water storage and transfer systems anywhere in the world.
Its major elements are summarised in Table 3 and comprise:
Ę The Lesotho Highlands Water Project (LHWP) moves water within the Orange Basin from the Senqu
in Lesotho via 75 km of tunnels to the Vaal system. It has a combined storage capacity in the Katse
and Mohale dams of 2376 Mm3. The present rate of transfer, from Phase I of the project, is of the
order of 780 Mm3/a, or just over 7% of the overall Basin's natural annual runoff of 1300 Mm3. While
the return flows to the Vaal River, from water users in the Vaal catchment, are significant, only a
very small proportion of this transfer returns to the Orange River downstream of the Vaal.
Ę The Vaal and Bloemhof dams with a combined storage of 3 843 Mm3/a.
Ę Transfers into the eastern sub system of the Vaal from the Usuthu and Thukela river basins
of 853 Mm3/a.
Ę Transfer from the Upper Vaal to the Upper Olifants.
Ę The Gariep and Vanderkloof Dams situated on the mainstream of the Orange River in South Africa,
upstream of the Vaal confluence, with a combined storage of 8500 Mm3, equivalent to 75% of the
total natural flow of the system.
Ę The Orange Ł Fish tunnel which transfers out an average of 575 Mm3/a to the Eastern Cape and
Port Elizabeth for irrigation and urban use.
Ę The largest single water transfer into the system from the Thukela drainage basin of 790 Mm3/a.
61
Priority transboundary problems
4.1.2
It should be noted that the LHWP transfer is effectively an intra-basin transfer, being a transfer from the
Upper Senqu in Lesotho into the Vaal Ł Wilge which is within the basin. However, in terms of the Senqu
and Orange downstream of Lesotho, it is a major transfer out since the water is for consumptive use in
the Vaal catchment with little or no flow from the Vaal to the Orange.
These transfers are significant when compared to the natural total annual flow of the OrangeŁSenqu
system of 11 300 Mm3.
Within the system itself there are some very considerable movements associated with the large irrigation
schemes. Examples are:
Ę long distance transfers to the Sand Vet rivers in the Middle Vaal (60 Mm_);
Ę transfers of 400 Mm_ from Bloemhof dam on the Lower Vaal to the Vaal Harts irrigation scheme;
Ę The major feature of this pattern of water movement and water use is that virtually all of it takes
place upstream of Vanderkloof Dam, leaving a vestigial hydrological regime downstream of this
point along 1400 km of the mainstream to the estuary.
4.1.3 System Management and Operation
The Orange-Senqu River System comprises three main components which are essentially operated as
separate systems, although there are clearly linkages, as discussed below:
(i) The Lesotho Highlands Water Project (LHWP)
Phase I of the project (Katse and Mohale dams and Matsoku diversion weir) are operated to transfer an
average of 780 Mm3/a at a 98% assurance of supply to the Vaal River System. That is the agreed nominal
annual yield of the Phase I reservoir system. Releases for the Environment are made from the two dams
amounting to an average of 100 Mm3, with additional "spills" from the Matsoku diversion weirs.
62
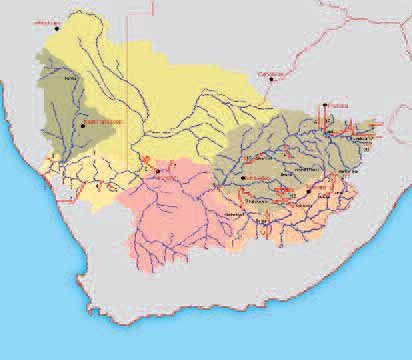
Priority transboundary problems
4.1.3
(ii) The Vaal River System
This system, including the imports from other basins, is operated as a separate system to meet the
demands in the Vaal Catchment.
The Vaal river system is operated to minimise flows into the Orange which are thus limited to spills from
reservoirs during wet periods.
There are currently no releases for environmental water requirements.
(iii) The Orange River System, excluding the Vaal River System
The Gariep and Vanderkloof dams are operated to provide the environmental water requirements
(determined in 1996) of ▒ 28.2 million m3/a at the river mouth, i.e. 2.5% of the natural MAR.
The operation of Vanderkloof and Gariep dams does not make any allowances for possible inflows from
the Vaal system.
63
Priority transboundary problems
4.1.4
4.1.4 Water resources
4.1.4.1 Surface water resources
The Orange-Senqu system, including the LHWP and the Vaal River system have, for planning purposes,
been configured and calibrated as a single system in the Water Resources Yield Model (MRYM) and Water
Resources Planning Model (WRPM) which have both been used to assess the current and future water
balances.
This model has been used for planning in a number of studies and is regularly updated. It is run using both
historical and stochastic hydrological records. In particular the Vaal System model is regularly updated,
at least annually to reflect changing conditions.
It has been set up to allow environmental water requirements to be a "demand" on the system and is
known to have been run for current demands and projected demands up to 2025 for the Orange (PWC
2005) and 2030 for the Vaal System.
The known transfers in and out of the system and system operating rules for internal transfers and
releases from dams are modelled.
The current DWAF study has assessed the current IVRS yield, including transfers from Lesotho at about
2920 Mm3/a with a 98% assurance of supply (LHWC 2007). However, the modelling uses the agreed
assurance of supply for the various use sectors so it cannot be directly compared with the demands.
The historic firm yield of the rest of the Orange River system is about 2220 Mm3/a and it is estimated to
have an assurance of supply equivalent to a 1:100 year recurrence interval.
The stochastic yield analysis for the Orange system, excluding the Vaal, and supplying water in
accordance with the assurances of supply in Table 3, after accounting for river losses of 560 Mm3/a from
the Orange/Vaal confluence to the river mouth, operational losses (i.e. unplanned flows reaching the
estuary) of 270 Mm3/a and transmission losses and allowing 1000 Mm_/a (including spills from the Vaal
system), to reach the river mouth, to maintain a Category D, the maximum target draft would
be 2650Mm3/a.
4.1.4.2 Ground water resources
Ground water of two types can be considered.
Ę That from alluvial aquifers along the river;
Ę That from a variety of non-alluvial aquifers.
The former is essentially re-charged from surface water and are really part of that resource. They are
not considered separately. The latter are mainly used for supply to smaller rural towns, rural domestic
use and stock watering. There are no major wellfields serving any large concentrated demands.
The current understanding of transboundary aquifers is poor and no policies exist for the management
of such resources. Present international law does not adequately address issues concerning cross border
ground water resources and what there is has had limited application worldwide.
64
Priority transboundary problems
4.1.4
Groundwater is of major importance in the Lower Orange Basin and constitutes the only source of water
over large areas. It is mainly used for rural domestic supplies, stock watering and water supplies to some
inland towns. As a result of low regional rainfall, recharge is limited and generally only small quantities
can be abstracted on a sustainable basis.
In the tributaries to the Lower Orange River, about 60% of the water supplied from various groundwater
sources. Most, if not all, of the abstractions near the river are directly from induced river recharge. The
scale of flow reduction in the Lower Orange will in time therefore lead to a reduction in the near river
groundwater resource. Groundwater availability in the coastal region is extremely limited as a direct
result of the lack of rainfall and risk of seawater intrusion
With the surface water resources in many parts of the basin now approaching full utilisation, almost the
only opportunity left for further development lies with the exploitation of groundwater. An obvious
concern therefore is the likelihood of an interaction between groundwater and surface water.
If the interaction is strong then additional use of aquifers may simply reduce the surface water resource
naturally available.
Groundwater provides a strategic resource during droughts to supplement the reduced surface water
availability. With increasing urban populations - rural populations are virtually static Ł municipal subsidy
systems and grants were provided for local reservoir construction while inter regional transfers increased
the availability of the surface water in the central part of the basin.
In the central parts of the basin the general low aquifer permeability and storage and low borehole yield
makes them unsuitable for meeting urban water demands.
In the region as a whole the transboundary implications of groundwater use are not particularly
significant. A major factor, however, is that reduced flows in the Lower Orange will inevitably lead to a
significant reduction in aquifer resources close to the river.
65
Priority transboundary problems
4.1.5
Groundwater development should be encouraged, wherever it is potentially viable, to limit transfer costs
for surface water and evaporation losses.
The immediate causes of this projected increase in surface water use are economically driven and in the
case of the Orange Ł Senqu the major urban and industrial drivers lie almost exclusively in South Africa.
In Namibia there is an increasing demand for an assured resource at acceptable levels of quality for
irrigation development. Sectoral growth in demand in South Africa varies, with the same growth in the
urban sectoral and limited growth being allowed in the agricultural sector for emerging farmers as social
inequalities are addressed. There is also a steadily increasing industrial and power demand in line with
national economic development goals, these two having a very high level of assurance of supply.
However, it is important to note that as a percentage of the system yield the projected increases are very
small, hence the demand curve is relatively flat and any change in either the projected yield of or
demand on the system, will have significant implications for the assurance of supply and timing of
possible interventions.
4.1.5 Current and projected water demand
4.1.5.1 Consumptive water demand
(i.) Sectoral water use
The current and estimated future water requirements of the whole Orange-Senqu River Basin up to 2025
are shown in Table 4. It should be noted that the current study of the Vaal River system (PWC 2005) will
have produced revised demands for that system.
The increased water requirements for Lesotho of 1.5% per annum are due to limited increase in domestic
water use and some agricultural development in the Lower Senqu.
In South Africa, a slow growth in demand from the urban and industrial sectors of less than 1% per annum
is predicted.
There is significant potential for increased water use for commercial irrigation, particularly in the Lower
Orange area, where the climate means that high value crops can be grown using efficient drip or sub
surface irrigation systems.
However, South African Government Policy dictates that water from the Orange River will only be
allocated to resource poor and water for 12000 ha within the Orange River and Eastern Cape, with a net
water requirement of 114 Mm3/a, targeted at poverty relief for the disadvantaged in rural areas. This
volume is included in the 2010 and 2015 values. Unless it is realistically financially supported, with the
provision of reasonable infrastructure and training in water management the efficiency of this water
use will be low.
There are also more "resource poor" farmers and developable agricultural land in the Orange River Basin
in South Africa to whom water would be allocated if it is available. In Namibia, the majority of the
present and future demands are for irrigation, with some increase in demands by mining. The Namibian
water requirements, to be met from the Orange River, are all along the common border area.
66
Priority transboundary problems
4.1.5
A total possible irrigation development for Namibia of 15115 ha, is projected for 2025, with an annual
growth in water requirement of 11%. This estimate was based on the availability of potentially irrigable
land and other resources excluding water. There is also a proposal for irrigation in Botswana with a water
requirement of 100 Mm3/a, which is not shown in Table 4.
The urban and industrial demand for power as well as water of the Johannesburg has its implications for
Orange-Senqu system and 85% of the thermal cooling water required by South Africa's power stations is
drawn from the Vaal River. The high assurance that needs to be associated with this demand has been a
major reason for the development of augmentation and transfer schemes from external drainage areas
such as the Usuthu, with the Tugela-Vaal transfer being the major one.
Irrigation demands are far less centralised, the largest single diversion principally for this purpose being
the 420 Mm3 per annum transferred from the Lower Vaal into the Harts River system, of which 20% may
be recovered by the system as a whole as return flows. There are also 180 Mm3 annual transfers from
Vanderkloof into the Riet Ł Modder system. The Orange Ł Fish transfer is mainly for the provision of
irrigation water in the Eastern Cape, but this is a total loss being an external transfer from the Upper
Orange. Downstream of Vanderkloof there are no major long distance transfers for irrigation, which are
mainly based on local pumped abstractions along the length of the mainstream of the Lower Orange. The
only exceptions are a small (6 Mm3/a) diversion into the Orange River coastal regions of the Northern
67
Priority transboundary problems
4.1.5
Cape and various water supplies to demand centres in Nambia including Springbok, Alexander Bay Port
Nolloth and the Kalahari region to the south of the Molopo/Nossob confluence.
(ii) Assurance of supply
The assurances of supply shown in Table 5 were being applied in the Vaal River System at the time of the
LORMS Study (PWC 2005).
These assurances of supply are typically used when restrictions are imposed during droughts.
(iii) Tariffs
South Africa has a well-developed water pricing policy in terms of its National Water Act of 1998. Details
are set out in the National Water Resource Strategy of 2004. Adequate measures exist in the National
Water Act in respect of licensing of water use to ensure efficiency and equity of use including
environmental and international obligations.
The key challenge is to apply all of these tools within a reasonable timescale taking the constraints of
scarce skills and funding into account. The National Department of Water Affairs and Forestry has for
several decades been involved in a process to raise water tariffs especially for irrigation water use. The
initial target was to at least recover annual operating and maintenance cost and then increasingly the
capital cost and related interest. Due to socio-economic considerations this process has been slow and
has yet to realise any significant changes to water use patterns. No data has been made available for
assurances of supply or tariffs from the other basin countries.
(iv) Efficiency and Economics of water use.
68
Priority transboundary problems
4.1.5
Irrigation
Irrigation water is not widely applied for its highest value uses in terms of the crops that are grown, with
lucerne, maize and wheat commonly grown. Underscoring the dominance of low value fodder crops in
the Eastern Cape is the fact that here annual water use per hectare is considerably higher than in the
Orange River Basin, despite the fact that rainfall is higher and evaporation lower. The most efficient
water users in this regard are those in the hot, dry Lower Orange River where high value grape and
orchard crops tend to dominate.
Many of the crops currently grown under irrigation yield low financial returns, both per hectare and per
cubic metre of water consumed. The efficiency of agricultural irrigation water use is too low and needs
to be improved regionally through increased production returns, improved in standards of water
management and agronomic practices while some change to cropping patterns, particularly the reduction
of areas planted to fodder crops, must be implemented. Only a small proportion of farmers, the top
15%, have been able to increase production in tandem with increased water use efficiency. A substantial
proportion of the remainder who cannot increase production with less water will be unable to cope with
any significant increases in water prices in the future. The gradual introduction of high value crops,
particularly perennial fruit and nut crops, is therefore to be considered as an appropriate initiative in
the medium to long term for significant improvement in agricultural productivity and increased water use
efficiency. Many of the climatic zones within the study area are similar to other areas in the world where
high-value crops have been successfully adopted. The general lack of such initiatives and the poor
economic use of agricultural water on a large scale is a major underlying cause of inefficient irrigation
water use.
Exacerbating the situation is the fact that agricultural water is unrealistically cheap, so there is little
financial incentive to increase its efficient use and water saving is therefore not an `on farm' priority.
Cheap water and therefore the lack of any inducement to reduce volumes `bought' means that any water
savings that might result from enhanced operational control and on field efficiency would simply be
taken up by individual farmers for the purposes of expanding their area under irrigation.
69
Priority transboundary problems
4.1.5
The fact that water delivered to almost all farms is not measured effectively is an additional factor that
discourages reduced usage.
The efficiency of irrigation water delivery systems for the larger schemes is generally high at the primary
and secondary canal levels but much lower at the tertiary and on field level. Transmission losses are
therefore modest, though over long distances evaporative losses can be substantial. Delivery systems to
smallholder irrigation schemes are much less efficient. These are multi-farmer irrigation projects larger
than 5 ha in size that were either established in the former homelands or in resource-poor areas.. Such
schemes provide a growing proportion of the irrigation demand as disadvantaged people are provided
access to water.
The cost of irrigation equipment is a significant limiting factor to efficient water use outside of the
large scale commercial sector. Small scale irrigators favour flood irrigation which is cheap though labour
intensive and has low maintenance costs. More efficient systems such as centre pivots, sprinklers and
drip technology are expensive, maintenance costs are high and specialist and costly expertise required.
The cost benefits of such technology are only viable at the commercial scale.
The primary causes of such a high level of water use in the agricultural sector lie with:
Ę The dominance of flood irrigation and the application of excess water, which also risks salinity
problems and low quality return flow water.
Ę The cultivation of crops that require large applications of water but which yield a low unit area
economic return. Planted areas therefore tend to be large.
Ę High evaporative losses from spray and centre pivot systems, particularly for broad leaved plants
such as maize.
Ę Significant transmission losses in distribution systems.
Ę The lack of any effective demand management and the consequent virtually unrestrained use
of water by farmers.
Ę Unlicensed abstractions.
Domestic
Urban and domestic water in South Africa use is high and unaccounted for water is unacceptably high in
most of if not all Local Authorities, up to 500l/h/d in some areas including transmission losses. Assuming
high level of transmission losses of 50%, consumption is still at 250l/h/d which is high compared to
European levels at approximately 150l/h/d. It is unclear how the consumption is measured and what
proportion of consumption is attributable to leakage within the distribution system. Most domestic
properties are metered but the highest consumers, those with large gardens and swimming pools, are in
a position to pay and there is a low incentive to curtail inappropriate usage. Although they are being
implemented domestic loss reduction programmes suffer from lack of resources, despite having
considerable potential. Under the millennium goals there is commitment to improve access to clean
water for individual households therefore even with demand management measures in place overall
savings in domestic demand are likely to be minimal and compared to other sectors insignificant. There
are no domestic demand figures existing or forecast for Lesotho and it is very minor component of total
demand in Botswana and Namibia.
70
Priority transboundary problems
4.1.5
Mining and Power Generation
The demands for power stations are driven by the fact that they are nearly all coal fired, extremely
large and wet cooled. Efficiency here, however, tends to be high with recirculation occurring until water
temperature becomes too high. Future thermal power-stations will be dry-cooled.
However, while South Africa boasts electrical infrastructure comparable to first world countries. At
around 1.7 US cents per kilowatt hour, it has one of the cheapest electricity costs in the world and this
does not encourage power saving or curtail the rapid growth in electricity demand. This is a contributing
factor to continued growth in cooling water use, although dry cooled stations are now being planned.
The mining industry is inevitably a very large consumer of water with intensive needs for ore washing and
evaporative tailings ponds. There is appreciable savings to made through increased water use efficiency
within the industry including recycling and production of dry tailings..
The industry is being encouraged towards conservation measures by national water pricing policy.
All quoted figures regarding water use and its projection refer to water `requirements' and not to
`demand'.
A demand is seen as the volume requested or "demanded" by a water user whereas a
"requirement" is, or should be, the volume of water required by a user to meet their needs efficiently.
This implies an operational definition of water requirement and includes commitments to reducing the
quantity and or quality of water required to achieve a particular output, where possible. Adjusting the
nature of the task so it can be accomplished with less water or lower quality water and reducing losses
in water movement from source through use to disposal.
(v.) Economic benefits of Water
The economic benefits generated form use of water in various applications (referred to as the economic
productivity of water) in the basin has been estimated in several studies, but not always using the same
measures. CSIR Environmentek (2001) used a natural resource accounting approach to develop water
resource accounts and measure water values for South Africa as a whole. Conningarth Economic
Consultants & Urban-Econ and Agrimodel (Pty) Ltd (2001) developed a preliminary set of water resource
accounts for the whole transboundary Orange-Senqu river basin, excluding the Vaal. These accounts have
been further developed by Lange et al. (2007). In these resource accounting studies, water productivity
is measured as the gross value added to gross domestic product (GDP) generated per unit of water used.
The value added to GDP is the return to internal factors of production in the enterprise, such as capital,
labour and entrepreneurship, or the gross output less intermediate expenditures on all the inputs coming
from outside the enterprise. The water productivity values provide an idea of the relative efficiency of
water use for economic gain at a point in time and with a specific allocation of resources. They have
limited use in indicating what would happen if the resource allocation changed, because prices can be
expected to change with changes in allocation between uses. More complex dynamic models are required
for this, but nevertheless the productivity figures as measured do provide a useful guide.
Table 7 shows the water productivity by country and industry in the Orange-Senqu river basin, excluding
the Vaal, as estimated by Lange et al. (2007). Here, the value added to GDP generated per unit of water
used is estimated for the main water uses in the basin. Breakdown of water productivity values is only
71
Priority transboundary problems
4.1.5
available for Namibian irrigated agriculture. Water productivity for irrigated agriculture was very low,
but highest for grape production, an important horticultural crop in the lower basin. The productivity
for agriculture in the South African part of the basin was also very low, reflecting the dominance of
irrigated agriculture there.
Agriculture in Lesotho and Botswana is nearly all rainfed and its productivity is best compared with that
for livestock in Namibia. Here water use is more efficient. Water use for mining mainly confined to the
South African and Namibian parts of the basin, was moderately to highly efficient. The highest water use
efficiencies were in the urban sectors of manufacturing and services.
Mirrilees et al (2003) conducted a comprehensive analysis of the value of water in the Vaal system. They
divided the Vaal into an upper and a lower section and developed water demand functions for various
uses. Then, using water balance data, they measured the value of water use by estimating the total
willingness to pay for use by each user category. Their measurement of water productivity is different
and only roughly comparable to those of Lange et al (2007), above, and CSIR Environmentek (2001).
Mirrilees et al (2003) used average unit values for water use representing the value of the gross output
plus the consumer surplus generated per unit of water used. Table 8 shows the water productivity
estimated for the Vaal by Mirrilees et al (2003).
72
Priority transboundary problems
4.1.5
Water use productivity, as measured for the Vaal river basin by Mirrilees et al. showed a similar pattern
to that for the rest of the basin in that irrigated agriculture was very inefficient compared to the urban
water uses. Among these, the least productive were those closest to the primary products end of the
value adding chain and the most efficient appeared to be those closest to the consumer end of the value
adding chain. These findings agree with those for South Africa as a whole determined by CSIR
Environmentek (2001). BKS (Pty) Ltd. & Ninham Shand (Pty) Ltd (1998) carried the analysis of water
efficiency further when using multiplier analysis to compare allocation of water to irrigated agriculture
or urban uses in the basin. They confirmed that allocation to urban industrial and service uses was by
the most productive. Mirrilees et al (2003) calculated the total economic value of water in the Vaal
system in terms of willingness to pay. The results of this are shown in Table 9.
CSIR Environmentek (2001) estimated overall employment per unit of water used in the South African
economy. On average, just less than one person was employed per m3 of water used. Between 1991 and
1999, the overall productivity in terms of both GDP and employment generation remained constant,
varying only as a result of variation in rainfall, with efficiency lower in dry years. Mirrilees et al. (2003)
measured price elasticity of demand for water in the Vaal basin and found, as expected, that it was
generally inelastic, which indicates that that a large increase in water tariffs would only result in a
73
Priority transboundary problems
4.1.6
small drop in water use. This was particularly the case for large scale capital intensive industries.
Demand for use of water by urban households was price inelastic, but that for low income urban
households was found to be price elastic. This would suggest that tariffs for high income users could be
raised. Demand for water for irrigation is notably inelastic at low tariffs, and elastic at higher ones.
Thus, high tariffs could be expected to reduce consumption significantly in low income households and
the irrigated agriculture sector. Mirrilees et al (2003) also examined the current policy of cost recovery
in the Vaal basin, and found that in 1998 a normal year in terms of rainfall, tariffs were able to affect
cost recovery.
4.1.6 Water Balance
4.1.6.1 Current (2005) and projected (2025) water balance for the current system
(i)
Vaal River System
The projected water requirements for the Vaal River System are the subject of an ongoing
study by DWAF. It has identified current actual water use to be somewhat greater than authorised
water use.
Apart from some shortfalls in the next few years while the water use situation is regularised,
it is predicted that augmentation will be required from 2015.
However, the shortfalls in the first few years are quite small and a realistic date for augmentation
is 2018.
(ii)
The Orange River System, excluding the Vaal.
The results of the historic yield analysis for the Orange system, excluding the Vaal System,
(for a category D estuary) are given in Table 10 (PWC 2005).
If the target category for the estuary of C is to be achieved the shortfalls will be about
500 Mm3/a greater.
The Water Resources Planning Model (PWC 2005) was used to carry out a planning or operating analysis
(for a Category D estuary) with the projected water use from Table 4 and excludes any development in
74
Priority transboundary problems
4.1.6
Botswana. It also excludes any potential impact of climate change of both resource and the demand side
of the equation. This analysis indicated a deficit from 2006 onwards. These results are regarded as the
most reliable on which to plan.
Thus, actions need to be taken to improve the water balance situation in the Orange River System from
2006 onwards. However, in practice it will not be possible to provide any significant increase in the
system yield until 2015 at the earliest by which time a significant deficit will have arisen without taking
account of any change in category reclassification of the estuary. The proposed management and
development actions to address the temporary shortfall are discussed in subsequent sections.
The inevitable conclusion is that the present levels of water use and the intentions to expand it even
further are not sustainable. The key issue to be addressed is the management of demand, which while
being attended to a degree in the urban / industrial sector, it is in the agricultural sector that action
needs to be taken most urgently since it is here that more than 50% of the total demand lies.
4.1.6.2 Demand management and Resource Development Options
(i) Demand Management
The irrigation sector is the highest consumer of water in the Lower Orange River Management Study area
and it also has the biggest potential for savings.
A conservative estimate of the potential benefits and costs of Water Demand Management initiatives
identified in the LORMS Study (PWC 2005) are summarised in Table 11.
The success of any WCDM measures will depend on:
Ę The creation of clear policies and guidelines pertaining to tariffs;
Ę Effective monitoring and control of water use;
Ę Advice on scheduling;
Ę Training of farmers
These are important measures for which a clear programme of interventions is essential. It is recognised
that such programmes will take some time to yield results and cannot be expected to be fully effective
in less than 5 to 10 years. The expected savings from water demand management in the irrigation sector
in South Africa are presented below in table 11. The total savings are estimated to be 226Mm3/a at
various levels of improved efficiency.
Outside of the agricultural sector the awareness of the real net value of water is growing, though proper
demand management policies need to be implemented. At present they are only at the emergent stage.
A better public grasp of the pressures on the regional water resources, their environmental vulnerability
and their limits needs to be brought about.
The institutional framework for overall water management needs to be more integrated and coherent.
The technical details with respect to the establishment of an effective ORASECOM may be formidable,
particularly if the level of integration were to be so high that the riparian states would have to transfer
75
Priority transboundary problems
4.1.6
power from government departments or agencies such as Catchment Management Agencies in South Africa
and similar organisations in other countries, to such an agency, which most would be reluctant to do.
(i.) Existing infrastructure
While managing the demand side of the equation has to be a priority a number of options for increasing
the efficiency of using the existing system have been identified.
Ę Utilise Vaal River Surplus
As a result of the Lesotho Highlands Water Project and other transfers to augment the Vaal System,
there is a temporary, conditional, surplus in the Vaal System, which can be utilised in several areas,
including support to the Orange River System.
Ę Hydraulic River Modelling and Improved System Operation
Results from the Water Resources Yield Model showed that at 2005-development level, on average,
1 680 Mm3/a enters the Orange River from the Vaal. The monthly flows vary from almost zero to
extremely high flows during periods of high runoff when the major dams are spilling. Currently,
these flows are not taken into account when releases are made from Vanderkloof Dam to supply
downstream requirements. It is possible that the surplus yield in the system could be increased by
80 Million m3/a when real time modelling is used to utilise inflows from the Vaal more effectively.
This potential increase was included in the water balances derived from the WRPM analyses.
Ę Utilisation of Vanderkloof Low Level Storage
There is a significant volume of storage in Vanderkloof Dam below the level of the outlets to the
irrigation systems. This storage can be accessed by installing a pumping system to lift the water into
the irrigation canals. However, this will impact on the energy that can be generated by the
76
Priority transboundary problems
4.1.6
hydropower plant at the dam. A increase in yield of 143 Mm3/a can be achieved by the utilisation
of the lower level storage in Vanderkloof Dam below the minimum operating level defined by the
outlets to the irrigation canals.
(ii) New infrastructure
Two main opportunities have been identified for inter-basin transfers to augment the Vaal System:
Ę Further phases of the Lesotho Highlands Water Project, for which a Feasibility Study is currently
being undertaken. A possible Phase II of the project comprising a dam at Polihali transferring water
to Katse dam, with
a yield of about 500 Mm_/a and an implementation date of 2018 is being
studied. This development would increase the Orange-Senqu system yield by about 280 Mm3/a.
Once the transfers to the Vaal exceed the increase in the Orange-Senqu system yield this development
would clearly have an impact on the resource available in the Orange-Senqu System.
Ę The expansion of the Thukela Ł Vaal transfer scheme for which a feasibility study was completed
about 8 years ago.
Either of these projects is expected to be able to meet the projected water requirement of the Vaal River
System (Excluding EWRS) for about 30 years.
Opportunities for limited imports from other catchments may exist.
A number of possibilities for new infrastructure to increase the Orange River system yield have been
identified and studied. The two favoured options are summarised below:
Ę A re-regulating dam at Vioolsdrift to reduce operating losses catch spills from the Vaal, regulate
flows to the estuary and increase the allocatable yield of the system has been recommended but a
feasibility study has not yet commenced.
An increase in yield of 170 m3/a was estimated
(PWC 2005).
Ę A dam on the Upper Orange at Bosberg, a site just downstream of Lesotho, was identified in the
ORRS [DWAF RSA 1997].
Thereafter there would appear to be limited opportunities for increasing the yield of the system.
77
Priority transboundary problems
4.1.7
4.1.7 Environmental and socio-economic consequences of the problem
The trans-boundary environmental impacts all emanate from the degradation of the hydrological regime
of the Lower Orange downstream of Vanderkloof Dam. This is generating physical, physico-chemical and
biological changes which are widely perceived to be negative and in the long term irreversible. These
may be summarised as follows :
Ę Physical. This aspect refers to the geomorphology and hydraulic functionality of the channel, which
for this type of river is dynamically adjusted to the flood regime and the so-called `bank full
discharge'. These parameters together with the relative ratios and volumes of gravel bed load, silt
and fine grained suspension load, determine the size and morphology of the river channel that is
best suited to accommodate the discharge requirements of the river system. Since the natural flood
regime has all but been removed and the frequency of bank full conditions reduced to a rarity,
changes to the physical nature of the river channel are inevitable. The main impact of generally
lower water levels and reduced flood incidence is an encroachment of river bank vegetation into
the channel causing a ponding effect and a local reduction in water surface gradient. This will
eventually result in increased sediment deposition and a further acceleration of channel gradient
decrease. Deep pools, which are extremely important ecologically, will be filled in as the scouring
effect of floods and the associated water velocities decrease.
Ę Physico-chemical. Under natural conditions the Lower Orange would have an approximately
neutral pH, low TDS, low concentrations of dissolved nutrients (nitrogen and phosphorous) and high
inorganic turbidity. Although water quality as a whole still remains good, increased nutrients,
specifically from irrigation return flows, and the fact that the upstream impoundments act as
growth nurseries for algal development means that algal populations have increased. Conditions
for algal blooms are favoured in the highly regulated, slow moving flow conditions and are further
stimulated by the warm and turbid aquatic environment as well as the fact that reductions in
sediment load increase light penetration. The increased frequency and severity of such algal blooms
will lead to increased local interruptions to water supply, limitations on water use and
potential toxicity.
Ę Biological. The most visual biological changes of much lower flows and reduced flow velocities
concerns the riparian vegetation. Floating aquatics increase and as river banks dry out, vegetation
dies off, leading to bank exposure, collapse and erosion. River reeds have encroached the shallower
water depths, trapped sediment, caused blockages and channel realignment. This encroachment
also leads to an increase in river transmission losses caused by evaporation and evapo-transpiration.
Indigenous riparian tree species are known to have declined due to the much reduced frequency and
magnitude of annual floods and the importance of annual inundation to their life cycle. Increased
areas of land adjacent to the river that are no longer regularly flooded have also led to agricultural
encroachment and the physical removal of the natural vegetation. As far as macro-invertebrates are
concerned by far the greatest problem concerns `blackfly' infestations. The large-scale programme
to control this pest, using aerial applications of insecticides, highlights the extent of the problem.
The outbreaks are attributed to much more stable flow conditions, in particular higher winter flows,
a deterioration in water quality and the encroachment of instream vegetation. However, the scale
of insecticide application has had serious consequences for non target species. Species that appear
78
Priority transboundary problems
4.1.7
to have disappeared all together in some reaches where they were formerly abundant, include the
freshwater shrimp, a consequence that will have a cumulative impact on fish and other fauna.
As flow reductions and their impacts continue the spread of pest species and invasive aliens will
intensify and species diversity will decrease. Deteriorating water quality is conducive to increases
in fish and other aquatically based parasite populations and also puts the fish populations under
environmental stress, making them even more susceptible to parasitic infection. Poor water quality
combined with decreased water depth can also result in fish kills due to habitat requirements not
being met and the reduced availability of natural food resources. The increased frequency of algal
blooms and associated toxicity is also a significant factor in fish kills.
The impacts are most pronounced on the Lower Orange estuary lower, which has suffered from a lower
frequency of fresh water inundation of the salt marsh, which once supported a huge diversity of wildlife.
Over large areas the marsh are now too saline even for the natural vegetation. The dynamics of estuarine
opening and closure to the sea have been a particular focus of change, largely a result of an increased
low flow regime caused by upstream regulation. The last documented `natural' closure event was
in 1995.
The socio-economic consequences of these negative trans-boundary impacts of upstream development
arising from excessive water use, if taken as a whole, are contradictory to the principles of integrated
water resources and catchment management. These principles seek to integrate all environmental,
economic and social factors within the river basin into the overall development and planning process.
Clearly, this has not been the case in the past since there is no sustainable balance between the
components of the process, the result being degradation of resource integrity which is widely viewed as
unacceptable and which urgently needs to be addressed. If it is not then the long term socio-economic
impacts arise from a degraded environment, reduced water and land resources, increasing competition
for those resources, conflict and the inability to meet socio-economic expectations due to restrictions
upon development due to lack of water and the cost of treating a degraded resource.
In parts of the region where water is unavailable in sufficient quantity and of acceptable quality and
cannot be delivered to the end user to the assurance required, depopulation and migration will inevitably
occur since local development will be minimal.
The socio-economic prospects within a degraded environment are always much weaker and the societies
within them vulnerable. Resource scarcity, declining yields and associated inflation/high cost of living
are seen as the major signs of resource degradation. The Lower Orange River region is far from any such
situation but inevitably economic opportunity will be compromised by the reduced quantity and quality
of its water resources. Not only will this apply to the industrial and agricultural sectors but also to
tourism and most particularly eco-tourism which is a major regional activity. Already, the estuary is in
such a deteriorated state that its present attractions cannot compete with those elsewhere. The river
itself has a wide appeal through the image that is promoted of it on the basis of the landscape that it
flows through. Such images and opportunities need to be sustained. In short most economic activities in
Africa are based on its natural resource endowment and their depletion and overuse will inevitably
impede growth and intensify the kinds of socio-economic imbalances that development policies seek
to address.
79
Priority transboundary problems
4.1.8
4.1.8 Knowledge Gaps
Rather than there being any knowledge gaps there is in fact a huge volume of information, studies and
report material. The issue is that synthesizing this and developing a coherent overall perspective at the
appropriate level of detail is extremely difficult. Although there are `overarching studies' of the Orange
Ł Senqu system, these emphasise resource development options and seek to establish the `surplus water'
available for future allocation and many inconsistencies between reports are evident. There is a need
for a strategy document for the Orange-Senqu basin drawing all these studies and works together.
Trans-boundary issues have not been considered in any detail although there have, through ORASECOM,
been initial attempts to establish common information systems. There appears to be nothing that might
be described as an agenda for moving towards integrated and coherent river basin management at the
multi national level. An appropriate water allocation for Namibia, for example, remains to be agreed.
The original agreement defining an "equitable share" for Namibia, agreed at independence, is still the
subject of ongoing negotiations and the volume allocated has been exceeded by users.
The impact of climate change on water resources (see section 3.1.5) of Southern Africa has been studied
in some detail but these studies are not reflected in the water resource plans for the Orange-Senqu.
There to develop a set of climate change scenarios and adaptive management strategies for the Basin.
4.1.9 Immediate, underlying and root causes
Immediate causes of increasing surface and groundwater use.
The immediate causes of increasing surface and groundwater resources are economically driven and
in the case of the Orange Ł Senqu the major drivers by far lie almost exclusively in South Africa, though
in Namibia there is an increasing demand for an assured resource at acceptable levels of quality. Sectoral
growth in demand in South Africa varies, with the fastest growth being in the urban and agricultural
sectors as social inequalities are addressed. There is also a rapidly increasing industrial and power
demand in line with national economic development goals.
The basin wide sectoral water requirements are:
80
Priority transboundary problems
4.1.9
These figures clearly emphasise the dominant role of agriculture in overall regional water usage. The
primary causes of such a high level of use in this sector lie with:
Ę The dominance of flood irrigation and the application of excess water, which also risks salinity
problems and low quality return flow water.
Ę The cultivation of crops that require large applications of water but which yield a low unit area
economic return.
Ę High evaporative losses from spray and centre pivot systems, particularly for broad leaved plants
such as maize.
Ę Significant transmission losses in distribution systems.
Ę Unlicensed abstractions.
Ę Afforestation, particularly of fast growing species such as eucalypts eucalypts.
Generally, the highest water users show the lowest economic returns, especially in the Eastern Cape,
while the highest economic returns tend to coincide with the areas of lowest agricultural water
consumption.
The causes of high levels of water use in the urban, industrial and mining sectors are complex and varied.
Urban water allocation on a per capita basis is and twice acceptable levels in Europe. It is set at 500
litres per capita per day, which includes a 50% transmission loss, but even so the residual 250 litres per
capita per day is high. In a semi arid area the scale of water use for gardens golf courses and swimming
pools is not sustainable on the scale that it occurs.
The demands for power stations are driven by the fact that they are nearly all coal fired, extremely
large and wet cooled. Efficiency here, however, tends to be high with recirculation occurring until water
temperature becomes too high. The mining industry is inevitably a very large consumer of water with
intensive needs for ore washing and evaporative tailings ponds. In both of these sectors there is scope
for increased water use efficiency which needs to be explored more vigorously..
In a region where evaporation can exceed 2000mm a year river losses at the scale indicted in section
4.3.2 are inevitable and therefore a `given'. Non the less, the losses from reservoirs, particularly Gariep
and Vanderkloof , add significantly to the volumes involved as do the impacts of invasive aliens such as
water hyacinth on reservoirs and in river systems. Losses from farms dams are also an issue in this
context. The huge expansion of privately owned farm dams over the last 50 years has had a detectable
effect on tributary water yield and in this regard they should be viewed as a significant regional water
consumer.
81
Priority transboundary problems
4.1.9
Anthropogenic and natural root causes.
In view of the limited availability of water as a resource and the need to allocate it on a national priority
basis, including agriculture, industry and domestic, it is fundamental that awareness that the resource
is indeed finite and that there are environmental demands upon it needs to be brought about. Although
this process is being implemented in the urban and industrial sectors and progress is being made, the
major problems lie within the agricultural sector. Incentives to use irrigation water efficiently and
effectively are not in place.
The cost of water `on farm' is too low and water use efficiency not a general priority. In South Africa,
the most efficient irrigation farms are those which have been developed on the basis of a farmer's own
initiatives. These are generally small scale in contrast to government initiated, large-scale multi farm
/ commercial schemes, such as Vaal Hartz, which have been rife with problems of poor water allocation
and the fact that water is a low cost `given' from government owned infrastructure. "Small-scale"
irrigation is more efficient due to the fact that it is managed and controlled by farmers who are the
users and who have independent access to a water source. Increasing efficiency and incentives to reduce
water use becomes increasingly difficult as the flexibility and independence of farmers' decision-making
decreases. This flexibility and independence, in turn, can be related to the number of participants on a
scheme, the management requirements of the water supply infrastructure (in-scheme) and the nature
of the irrigation technology (in-field).
Another important distinction is the level of risk with which the farmer prefers to operate. Intensive,
highly commercial farming is high risk and therefore large areas are irrigated using the maximum amount
of water available. At this scale water cost is a relatively minor consideration compared to the costs of
equipment and labour. In contrast, small-scale farmers often seek to reduce risk by having lower water
inputs ,and therefore cost, that achieve lower but acceptable crop yields.
Outside of the agricultural sector the awareness of the real net value of water is growing, though proper
demand management policies need to be implemented. At present they are only at the emergent stage.
A better public grasp of the pressures on the regional water resources, their environmental vulnerability
and their limits needs to be brought about. The institutional framework for overall water management
needs to be more integrated and coherent. The current policy in south Africa moving towards `Catchment
Management Associations' is a healthy sign, however, the organizational details may be formidable,
particularly if the level of integration is so high that co-ordination at the level of government
departments is lost.
The natural root causes of high levels of water use are climate driven. Rainfall is highly seasonal and low
compared to evaporation and evapo-transpiration. The associated losses from reservoir storages are high as
are those in open canal transmission systems. River losses in the Orange amount to 27% of water use, second
only to agriculture and seven times that of the combined urban and industrial water usage. In such a climate
field and pasture crop water requirements are extreme, emphasising the need to reconsider cropping
patterns on an appropriate scale. In effect climatic considerations do not affect industrial water demands
or at least it's difficult to see how they might. In the case of urban and domestic water use the irrigation
of gardens and the large scale ownership of swimming pools is an issue that needs to be addressed,
presumably through realistic water pricing and fully implemented demand management policies.
82
Priority transboundary problems
4.1.10
4.1.10 Summary and recommendations, including potential short to medium term interventions
Agricultural water use emerges as the major and most problematic regional water use the impacting
trans boundary flow regime. Irrigation efficiencies are low overall with few
financial or effective
regulatory incentives to reduce demand. All quoted figures regarding water use and its projection refer
to water `requirements' and not to `demand', which is, or should be, the volume of water requested by
a user to meet their needs efficiently. This implies an operational definition of water demand and
includes commitments to reducing the quantity or quality of water required to accomplish a specific
task, adjusting the nature of the task so it can be accomplished with less water or lower quality water
and reducing losses in water movement from source through use to disposal.
A number of facets of the overall picture are `given', in the sense that they are a natural consequence
of the hydrological and climatic environment in which the OrangeŁSenqu system lies. The principal of
83
Priority transboundary problems
4.1.10
these is the fact that river losses, most particularly along the 1400 km of the Lower Orange downstream
of Vanderkloof, amount to 27% of overall water use. Trans-boundary allocations to Namibia needs to take
this into account when delivering the allocation from Vanderkloof.
Trans-boundary environmental flow provisions have not featured in the resource development and
allocation studies in any effective way. The system simulation models upon which these are based are
effectively unconstrained in this respect and seek to identify `optimal' resource options and operational
criteria that maximise water availability independently of realistic environmental flow requirements.
Demand management policy development and implementation has started, with the urban and industrial
sectors as the targets. However, it is in the irrigation sector that a much more rational use of water
needs to be achieved. Irrigation efficiencies are low overall with few financial or effective regulatory
incentives to reduce demand. A more pragmatic level of water use needs to be found in concert with
improved on farm water use and incentives to modify cropping patterns that employ water to its
maximum value would release huge volumes for alternative uses, including the environment.
The short to medium term interventions required to encourage a more sustainable and equitable use of
the water resources of the Orange Ł Senqu and should focus on demand management and agricultural
water use within the wider framework of increased public awareness of water as a finite resource. The
continued focus on identification of additional water resources as the solution will in, the long term
constrain regional socio-economic prospects and degrade the river environment to an unacceptable and
irreversible condition. The interventions proposed are:
Ę The identification of a realistic environmental flow regime for the Lower Orange in association with
the upstream consequences of releasing realistic volumes of water from Vanderkloof upon regional
water availability. This study should exploit the system simulation models, constrained by these
environmental `hands off' requirements. This activity would demonstrate that regionally the pursuit
of integrated water resources management has moved beyond national boundaries and away from
unsustainable and inequitable national interests
Ę Develop surveys and pilot studies as to how the `on farm' productivity of water can be enhanced
through water management interventions, increased efficiency and realistic demand management.
These studies would include evaluating the prospects for cropping patterns that use less water and
yield higher value unit area yields and the kinds of economic incentives required to facilitate the
process. In addition, mobilize and empower communities in the water management process by
developing increased awareness, an appropriate regulatory framework, farmers' associations and
the transfer of ownership of irrigation systems from the state.
Ę Develop policies and practices for the improved measurement of on farm water use, the
identification of an acceptable pricing policy and the reduced assurance of agricultural supply to
more realistic levels and estimate the benefits in terms of increased regional water availability.
Adequate provision is contained in the current legislation in South Africa to implement the
necessary control mechanisms, including compulsory licensing programmes which have been planned
for the Vaal River (2004-2010) and the Orange River (2010 to 2014)
84
Priority transboundary problems
4.1.10
Ę Develop policies and interventions that would contribute to improved livelihoods for the rural poor
by identifying appropriate designs and operational procedures for small-scale irrigation systems
and the financial and technical resources needed to support them and build capacity. This should
be undertaken within the framework of the proposed national priority for irrigation expansion.
Ę Initiate a survey of large commercial farmers with regard to the degree to which water allocations
are monitored and identify the real economic value of the water supplied. Develop policy on the
basis of the survey results.
Ę Promote urban and industrial demand management more vigorously and move towards an
operational definition of water demand that includes commitments to reducing the quantity or
quality of water required to accomplish a specific task. South African water legislation has adequate
provision to ensure the implementation of water metering and the administrative and political will
is required to ensure the implementation of this measure
Ę Once the positive impacts of these water use reduction interventions are revealed, undertake
system simulation studies to estimate the `released' volumes of water and carry out cost-benefit
analyses and disseminate the results to the stakeholders.
Ę Improve River Monitoring and Operation through: significant improvements to the flow monitoring
network, with particular emphasis on low flow monitoring and development of continuous real time
modelling of the Orange-Senqu.
Ę Complete and commission studies into improvement of existing infrastructure and potential new
infrastructure, including:
- utilisation of the low level storage in Vanderkloof Dam as a strategic reserve.
- location and size for a dam in the Orange River to increase the system yield beyond which can be
obtained by a re-regulating dam at Vioolsdrift.
- a new dam at Vioolsdrift.
- location for a major new dam on the system.
Ę Review and if necessary revise the national and international institutional structures for improved
water resources management.
85
Priority transboundary problems
4.2.1
4.2. Changes to Hydrological Regime
4.2.1 Description of the problem and justification of its transboundary importance.
4.2.1.1 Surface water resources under natural conditions
It has been estimated that the natural runoff of the Orange-Senqu Basin is in the order of 11 300 Mm3/a.
As described in section 3.1.5 the distribution of the MAR is very skewed. In addition the runoff originating
from the Orange River downstream of the Orange/Vaal confluence is highly erratic and cannot be relied
upon to support the future downstream water requirements unless regulation is provided. The Fish River
in Namibia flows intermittently and when it does it can support some, but not all, of the downstream
demands, particularly the environmental demands at the river mouth.
In a region where net evaporation varies between 1 100 mm a year in Lesotho to over 2 200 mm a year
at the river mouth, river losses and evaporation from the major reservoirs are inevitable and therefore
a `given'. The significant expansion of privately owned farm dams over the last 50 years has had a
detectable effect on tributary water yield and in this regard they, and the agriculture they support, are
viewed as a significant regional water consumer.
The changes to the hydrological regime of the Lower Orange-Senqu particularly below Vanderkloof dam
have, as a consequence of upstream development, been dramatic and are summarised in Figures 19, 20
and 21. The results are based upon the outputs of the system simulation model which enables a
comparison between the natural regime and the modifications to it, based upon the 2005 levels of
infrastructure and demands.
Ę The structure and seasonal pattern of the flows from month to month have changed completely,
as indicated in the time series plots (Figures 18 and 19). The frequency of flood conditions
is reduced to a trace, with as long as 10 consecutive years with no flood season at all. Only extreme
events are evident, when there is significant spillage from Vanderkloof, though the peak and
duration of these conditions are generally halved. All other floods events are `absorbed' by the
upstream storage dams.
Ę Mean annual flows have been reduced by about 50%, from 11 300 Mm3 to about 5 800 Mm3 and total
flow volumes have a high degree of constancy from year to year and a completely different
frequency distribution. Inter-annual variability is a fraction of the former natural regime
(Figure 20).
Ę Within the year monthly flows show the same order of reduction and a much less distinct seasonal
pattern. Peak flow conditions are now over a month later than formerly and the seasonal variance
of flows from month to month is far less (Figure 21).
86
Priority transboundary problems
4.2.1
87
Priority transboundary problems
4.2.1
Clearly, current flow conditions are just a vestigial remnant of the natural regime. The transboundary
implications of this are vast in terms of the long term degradation of the riverine environment, the
availability and reliability of water resources in the Lower Orange and the sustainability of the ecological
functionality of the mouth.
88
Priority transboundary problems
4.2.1
4.2.1.2 Environmental water requirements (EWRs)
The current status of the assessment of EWRs is as follows:
Ę A comprehensive assessment of EWRs for Phase I of the Lesotho Highlands Water Project (LHWP)
was carried out and a policy and procedures for the operation of Phase I of the LHWP was published
in 2002 and amended in 2003 (LHDA 2003);
Ę EWRs for the Vaal River System have not yet been determined;
Ę EWRs for the Orange River, downstream of Lesotho and upstream of Vanderkloof Dam have not
been determined;
Ę An initial assessment of the EWRs for the Orange River, downstream of Vanderkloof Dam, including
the river mouth was made in 1996 and was adopted for system operation (DWAF RSA 1997);
Ę An intermediate level assessment for the Orange River downstream of Vanderkloof dam and
particularly downstream of Augrabies Falls as well as for the river mouth was carried out in 2004
(PWC 2005);
Ę The historic yield analysis for the Orange River, excluding the Vaal River System, carried out in
2005 (PWC 2005), used the 2004 EWR results, with an allocation of about 1 000 Mm3/a to the mouth.
A number of recommendations for comprehensive assessments of the EWRs for the sub-basins have been
made but have not yet been implemented or the studies are incomplete.
89
Priority transboundary problems
4.2.1
4.2.1.3 Environmental water requirements in the Lower Orange and River Mouth
In the LORMS Study (PWC 2005) updated preliminary assessments were made of the ecological water
requirements for the Orange River, downstream of Augrabies, and the River Mouth, as the releases
currently being made from Vanderkloof Dam for ecological water requirements, were determined before
current methodologies were available. In terms of water resource planning and yield analysis, it is the
estuarine flow requirements which control the allocated yield.
Lower Orange River
The environmental consequences of the current system operation of the Vaal and the Orange are
potentially calamitous in the long term and could lead to the complete collapse of the natural riverine
ecosystem and its ability to function. Already, the Orange River Mouth has deteriorated to the extent
that its integrity as a functional Ramsar site is in jeopardy18 .
The most significant transboundary environmental impacts emanate from the degradation of the
hydrological regime of the Lower Orange downstream of Vanderkloof Dam. This is generating physical,
physio-chemical and biological changes which are widely perceived to be negative and in the long term
irreversible. These may be summarised as follows:
Ę Physical. This aspect refers to the geomorphology and hydraulic functionality of the channel, which
for this type of river is dynamically adjusted to the flood regime and the so-called `bank full
discharge'. These parameters together with the relative ratios and volumes of gravel bed load, silt
and fine grained suspension load, determine the size and morphology of the river channel that is
best suited to accommodate the discharge requirements of the river system. Since the natural flood
regime has all but been removed and the frequency of bank full conditions reduced to a rarity,
changes to the physical nature of the river channel are inevitable. The main impact of generally
lower water levels and reduced flood incidence is an encroachment of river bank vegetation into
the channel causing a ponding effect and a local reduction in water surface gradient. This will
eventually result in increased sediment deposition and a further acceleration of channel gradient
decrease. Deep pools, which are extremely important ecologically, will be filled in as the scouring
effect of floods and the associated water velocities decrease.
These flow related impacts are further exacerbated by the anthropological impacts such as sand
winning, farming and other channel modifications.
Ę Physical-chemical. Under natural conditions the Lower Orange would have an approximately neutral
pH, low TDS, low concentrations of dissolved nutrients (nitrogen and phosphorous) and high
inorganic turbidity. Although water quality as a whole still remains good, increased nutrients,
specifically from irrigation return flows, and the fact that the upstream impoundments act as
growth nurseries for algal development means that algal populations have increased. Conditions
for algal blooms are favoured in the highly regulated, slow moving flow conditions and are further
stimulated by the warm and turbid aquatic environment as well as by the fact that reductions in
sediment load increase light penetration. The increased frequency and severity of such algal blooms
will lead to increased local interruptions to water supply, limitations on water use and
potential toxicity.
90
18The site has been placed on the Montreux Record
Priority transboundary problems
4.2.1
Ę Biological. The most visual biological changes of much lower flows and reduced flow velocities
concerns the riparian vegetation. Floating aquatics increase and as river banks dry out, vegetation
dies off, leading to bank exposure, collapse and erosion. River reeds have encroached the shallower
water depths, trapped sediment, caused blockages and channel realignment. This encroachment
also leads to an increase in river transmission losses caused by evaporation and evapo-transpiration.
Indigenous riparian tree species are known to have declined due to the much reduced frequency and
magnitude of annual floods and the importance of annual inundation to their life cycle. The increase
in areas of land adjacent to the river that are no longer regularly flooded has also led to agricultural
encroachment and the physical removal of the natural vegetation. As far as macro-invertebrates are
concerned by far the greatest problem is `black fly"' infestations. The large-scale programme to
control this pest, using aerial applications of insecticides, highlights the extent of the problem.
The outbreaks are attributed to much more stable flow conditions, in particular higher winter flows,
a deterioration in water quality and the encroachment of in-stream vegetation. As flow reductions
and their impacts continue the spread of pest species and invasive aliens will intensify and species
diversity will decrease. Deteriorating water quality is conducive to increases in fish and other
aquatically based parasite populations and also puts the fish populations under environmental
stress, making them even more susceptible to parasitic infection. Poor water quality combined with
decreased water depth can also result in fish kills due to habitat requirements not being met and
the reduced availability of natural food resources. The increased frequency of algal blooms and
associated toxicity is also a significant factor in fish kills.
The Present Ecological Status (PES) of various river reaches was assessed for a suite of ecological
conditions and generally assessed (using the RSA methodology) to be a `D' category river (largely
modified) for each of the disciplines. The ecological condition of the river was deemed to be on a
negative trajectory19.
The recommended category for the river, if a comprehensive study of Ecological Water Requirements
were carried out, would most likely be a C-Category20, but this will have to be reviewed once the full
EWR has been completed.
The flow-related factors contributing to the PES and negative trajectory were identified as:
Ę unseasonal winter releases;
Ę lack of very low flow periods;
Ę lack of the November freshet (small flood), which occurred in the natural system;
Ę reduction in water volume;
Ę reduction in wet and dry season inter-annual floods; and
Ę lack of flow variability.
The most important aspects of the flow regime for maintaining or improving the current ecological
condition are re-instating the winter low flows (i.e. reducing current flows present during winter), and
re-instating a November freshet. The current manipulation of the flow regime, will eventually lead to
the complete collapse of the ecological system. Particular attention should be given to maintaining the
few remaining and relatively undisturbed sections, such as upstream of Onseepkans. These areas are
considered to be ecologically very important.
19 According to the South African Water Quality Guidelines for Aquatic Ecosystems (DWAF 1997) a category D river is largely modified,
91
and has a large loss of natural habitats and basic ecosystem functioning
Priority transboundary problems
4.2.1
In addition to the flow related issues there are significant anthropogenic impacts.
In particular
controlling the present mechanical manipulation of the river bed, banks, and floodplain is extremely
important as these factors are major contributors towards the decline in the condition of the riverine
ecosystem.
The periodic emptying of the existing small dam at Boegoeberg for maintenance, which releases pulses
of sediment-laden water, has detrimental downstream impacts, and should be managed to minimise the
impact.
River Mouth
The Orange River mouth is considered to be an estuary of high importance. The Orange River Mouth
Wetland is a RAMSAR site and is on the Montreux Record. The desired category would be an A or B, but
the LORMS study (PWC 2005) concluded that the Present Ecological Status of the river mouth is a D+,
largely modified and on negative trajectory. The current inflow is less than 50% of the natural inflow and
the occurrence of significant floods and even elevated flows is very much reduced.
The negative environmental impacts upon the Orange River Mouth arise from both local and upstream
causes. The latter, once again, are a function of the reduced and vestigial remnant of the natural flow
regime. The local causes are associated with mining abstractions, the encroachment of tailings dams,
pollution and the construction of road embankments. All together these factors have led to the much
lower frequency of fresh water inundation of the salt marsh, which once supported a huge diversity of
wildlife. Over large areas the marsh is now too saline even for the natural vegetation. The dynamics of
estuarine opening and closure to the sea have been a particular focus of change.
In practice it will not be possible to reverse the flow modifications and anthropogenic developments to
the extent that would improve the Ecological Category to the desired Category of A or B. The Best
Attainable State for the Mouth is thus considered to be a Category C and the first step would be to
achieve and maintain a Category D state for the river mouth. If the estimated volumes of water are
released to maintain the mouth in either a category D which requires about 1 060 Mm3/a or C requiring
an additional 500 Mm3/a, the necessary variability in flow should be re-introduced to stop the negative
trajectory of the river and the non-flow related issues must be addressed21 .
The Ecological Category of the mouth is very dependent on the flow patterns, particularly seasonality,
and the removal of non-flow related impacts. To achieve an Ecological Category of a C or D and continue
to supply existing irrigation, it would require re-regulation of the river flows and a concerted effort to
address the anthropogenic impact.
It is recommended that an extensive monitoring programme be implemented to improve the
understanding of the ecology and flow regimes of the mouth and river. This will enable comprehensive
ecological flow determinations on the Orange River and mouth, with a reasonable degree of confidence
in the results.
92
21Estimates of EWR for the mouth which were made for the LORMS study are preliminary and have a low level of confidence
Priority transboundary problems
4.2.2
4.2.2 Environmental and socio-economic consequences
The current environmental impacts of such radical modification of the flow regime are both cumulative
and long term. Many if not most, will be irreversible. These include:
Ę Changes to the nature of the river channel as a result of siltation and the reduced incidence of
flushing by floods. Lower water levels will lead to the drying out and loss of the riparian vegetation,
exposing the river banks to erosion and collapse;
Ę The invasion of the river bed by vegetation leading to reduced flow velocities and yet further
acceleration of the siltation process. The hydraulic ability of the channel to convey floods when
they do occur will be diminished resulting in erosion and morphological changes to the river and
could result in higher flooding levels;
Ę Reduced flushing and lower flow velocities will bring about ecological changes and create conditions
favourable to algal blooms. These in turn will increase the risk of local toxic conditions and higher
mortality within the fauna;
Ę Endemic species with life cycles adjusted to the natural hydrological dynamics and environment of
the river will be unable to survive in the long term and will be replaced by a significantly different
flora and fauna, much of which will be invasive aliens;
Ę Water quality will inevitably decrease due to the lower water volumes available for dilution. This
in turn will bring about further ecological changes and add to the reduction of species diversity;
Ę The prevalence of pest species will expand, a process already evident with the annual
black fly infestations;
Ę The mouth, already seriously degraded, will ultimately cease to function as a viable ecological unit
at the standard that merited its recognition as a RAMSAR site.
These impacts will all be interlinked and their integral effects increase at exponential rates until critical
thresholds are crossed and `points of no return' reached. Although bench mark environmental and
ecological data for the Lower Orange are at a premium, it is already known that some species that were
formerly present have already completely disappeared from some reaches of the river. Algal blooms,
pests and invasive species are now far more common and have required expensive interventions to try
to control them.
The socio-economic implications of such potential and evident levels of change are considerable.
Although remote and sparsely populated the Lower Orange River is regarded as an area of outstanding
natural beauty with a significant tourist potential, which is now seriously compromised. The remnant
flow regime is an insufficient basis to sustain environmental integrity and virtually all changes and
impacts will be negative and significantly so. The region is already poor and disadvantaged in terms of.
Without access to reliable irrigation water farming is marginal at best and can only really be carried out
with higher economic returns along the banks of the river using water from it. As the quality and
quantity of this water reduces, crop options and yields will fall in tandem. Current regional development
policy is centred around the expansion of irrigation and mining, both very high water consumers and
reliant on the Lower Orange, the only river in this part of Southern Africa. The irrigation of high value
crops using advanced technology has proved to be a particularly successful activity and one for which
there are significant plans for expansion requiring additional river abstractions.
93
Priority transboundary problems
4.2.3
These in turn will reduce the flows to the estuarine region where mining demands are already significant
and must be assured. Calls for additional releases from upstream are inevitable. These would need to
take account of the levels of river transmission losses and ensure that the required flows are delivered
to the point at which they are needed. The scale of these losses means that the region is seriously
disadvantaged and the upstream perspective may be that additional releases are not the best use
of water.
4.2.3 Linkages with other transboundary problems
Deterioration in water quality is a major linkage with the modified flow regime, not only because there
is 75% less water available for the dilution of salts and organics but also because the water delivered
from upstream is itself of reduced quality. Long residence times in reservoir storages are a factor along
with the presence of some levels of pollution from activities upstream of Vanderkloof. Though apparently
not yet a significant issue, changes in water quality in the Lower Orange have been observed, particularly
with regard to levels of salinity. It is therefore important that flood irrigation and excessive water use
in the region is discouraged since this will lead to the increased risk of salinisation and saline return
flows. These will not be diluted to the levels that might be preferred, given the much reduced flows in
the mainstream. In fact flood irrigation is not a widely used option in the Lower Orange but policies of
providing water preferentially to the disadvantaged sectors of society may result in some increase as
they would not be able to afford the investment required in alternatives. Appropriate financial levels of
support are therefore desirable for the sustainable implementation of such policies.
All of the other transboundary linkages of reduced flows are with environmental factors and the potential
decline of available bio-resources, as has been illustrated. In this regard and given the time and scale
of upstream development it is surprising that minimum flow rates and in-river flow requirements have
not in any way received the attention required, the focus having been on exploratory impact
assessments. The minimum flow rate to be maintained in the Orange-Senqu from Lesotho to South Africa
has still to be established by way of an agreement between the parties. The current perspective
regarding environmental releases from Vanderkloof is that they are a non-consumptive use and can be
satisfied in large part by spillages from the Vaal system.
4.2.4 Immediate, underlying and root causes
The immediate causes (Figure 23) of changes to the hydrological regime lie with the development of
water resources infrastructure, inter-basin transfers and demand abstractions upstream of Vanderkloof.
The Lower Orange is now a fully regulated system with hardly any vestige of the natural regime
remaining. The total volume of reservoir storage in the system is of the order of 16 000 Mm3, or about
19 000 Mm3 including Sterkfontein dam which stores water from the Thukela and not the Orange system.
This can be compared to the average natural annual total flow of the Orange-Senqu itself of 11 300 Mm3.
Of this total system storage, 52% is held within Gariep and Vanderkloof Dams, the most downstream
reservoirs in the system. The figures are huge and underscore the investments in storage infrastructure
that have been made. Along with total water demands and inter basin transfers, they are summarised in
Table 13.
94
Priority transboundary problems
4.2.4
The combined water requirements and transfers out are about half of the available reservoir storage,
which underscores:
Ę The need for `over year storage', given the highly variable nature of the hydrology and therefore
of the flows available for use Ł multi year drought conditions are relatively frequent; and
Ę The need for very large volumes of storage to meet the very high level of water requirements.
Of the total local water requirements in the system about 25% lie within the Lower Orange Water
Management Area, though this is specified as the sub-region downstream of the Orange-Vaal confluence.
Of this, 95% is allocated to irrigation.
The scale of these figures provides the immediate cause of the modifications to the transboundary
hydrology between Lesotho and South Africa and between South Africa and Namibia. In both cases the
magnitude and pattern of the present downstream hydrology is almost entirely a function of reservoir
operation policy, in the former case at Katse and Mohale Dams and in the latter at Vanderkloof.
The underlying causes of hydrological change are the regional water demands which this vast
infrastructure seeks to provide at the required levels of assurance. The geographical distribution of the
resources available for development is a further factor since they are distributed unfavourably in
comparison to the centres of demand. Fifty seven percent of the natural runoff is generated in Lesotho,
33% in the Upper Orange and the remaining 10% in the Lower Orange downstream of the confluence of
the Vaal and Orange Rivers. There is therefore a basic need for the long distance transfer of water
between sub-basins.
95
Priority transboundary problems
4.2.4
By far the largest urban, industrial and thermal power demand is situated in the Vaal system, the
resources of which are now wholly insufficient and transfers in, principally from Lesotho and the Thukela
River, are essential.
The total agricultural demands, 58% of the total demand in the basin, are distributed far more widely
and increase in a downstream direction as the rainfall decreases. Thus the region downstream of the
Orange Ł Vaal confluence consumes the greatest proportion of agricultural water.
The magnitude of these demands is generated by a number of key factors:
Ę South Africa possesses a first world industrial and agricultural infrastructure within a semi-arid
environment which inevitably places great pressure on the regional water resources, which are
relatively limited compared to the inevitable scale of demand;
Ę The major industrial users are water intensive, principally mining;
Ę The thermal power stations are large, even by world standards, and require vast volumes of cooling
water at very high levels of assurance to reliably provide electricity on a first world scale;
Ę Urban water demands and allocations on a per capita basis are high even by world standards, driven
by high domestic usage amongst a large proportion of the population and the need to account for
losses in distribution systems as high as 50%;
Ę The South African agricultural economy is large-scale, sophisticated and well developed. The crop
water requirements are high, given the nature of the climate.
These factors combine to create great pressure on the regional water resources in a region that is
naturally semi arid to arid and the aquatic/riverine environment inevitably suffers. For a long time
environmental concerns have not been at the forefront of planning and operation. Until very recently
demand provision and resource development have had exclusive priority. Even now the environmental
provisions appear, on the face of it, to be assessed and are not delivered in the best interests of
environment.
Based on the instream and estuarine flow requirements determined in the ORRS
(DWAF RSA 1997)
provision has been made for releases from Vanderkloof Dam such that flows, with a equivalent yield in
Vanderkloof Dam of 280mm3/ annum, reach the mouth, after river losses, (transpiration, evaporation
etc.) Keeping in mind that tributary contributions downstream of Vanderkloof are relatively small,
ephemeral and unreliable the resulting flows are not sufficient to sustain the mouth in its present state.
Adding to this issue of the apparently low priority that has been given to environmental releases, the
surplus in Gariep and Vanderkloof dams is determined once a year in May. In addition to the releases for
the environment and consumptive use, surplus water is for power generation. In general this pattern of
releases is not in the best environmental interest since it does not accord with the natural pattern of
the flow regime and would tend to have a negative impact. Finally, the surplus available for new
allocation from the two dams has been utilized, so if there were any new allocations they would utilise
water currently reserved for the environment, unless existing use is curtailed.
High water demand in a semi-arid region with first world levels of urban, industrial and agricultural
development is inevitable. However, an effective process of demand management would also be expected
96
Priority transboundary problems
4.2.4
given the strain that is placed on the available resources. The fact of the matter is that any
acknowledgement of the need for it has been recent and historically the emphasis has lain with maximum
provision of water and not on controlled consumption. Even now additional resources are being sought
although there is already a clear demand deficit in the Lower Orange based on existing EWRs. Re-planning
studies continue to determine `surpluses' and a 1998 study concluded that a maximum of 1 900 Mm3,
equivalent to almost 50% of the 2000 total demand, could still be developed.
The principal root cause of modifications to flow regimes is the unsustainable use of water by the
agricultural sector and the lack of any realistic control over it. The lack of demand management in this
sector is a pivotal factor. In summary, the wider anthropogenic issues are as follows:
Ę Unrealistic water pricing policy, principally within the agricultural sector where the regulation
of abstractions is also poor to non existent and where there are no incentives to reduce water
consumption through alternative cropping patterns and maximise the economic value of the
water used;
Ę High municipal allocations of water and poor incentives to reduce consumption along with
insufficient investment in the reduction of distribution losses;
Ę A continued policy emphasis on resource development;
Ę Policies which seek to maximise supply even further through the reduction of operational and river
transmission losses which often modify the flow regime even further;
Ę Perceptions that all `surpluses' and any savings can be allocated for consumption elsewhere rather
than used to mitigate hydrological and therefore environmental impacts;
Ę A need to recognise the environment as a legitimate water user which must be allocated an
equitable and realistic share of the resources available.
Within an international river basin adhering to the principles of integrated water resources development
and management is fundamental to achieving equitable and environmentally acceptable transboundary
flows. Clearly the present degraded nature of the transboundary hydrology is the antithesis of what
these principles seek to achieve.
97
Priority transboundary problems
4.2.5
4.2.5 Knowledge Gaps
Basically knowledge of what is required in the hydrological context is fairly complete, it is an
understanding of the means of achieving some measure of it that is absent.
A major omission is the lack of any comprehensive analysis of the environmental component of the
overall water requirement although there have been some limited studies in South Africa/Namibia and
a comprehensive study in Lesotho. In some of the studies the simulation models used to evaluate the
system are seemingly unconstrained in this regard and no explicit analysis of in-stream river flow
requirements has been undertaken for large sections of the rivers. Only limited studies of the river
mouth have been undertaken so far although extensive baseline studies are envisaged.
Pilot studies are required that would identify ways and means of allocating more water to the river. It
is acknowledged that the present management and operation of Vanderkloof Dam would need
98
Priority transboundary problems
4.2.6
fundamental revision. One option is a re-regulation dam at Vioolsdrift, for which the emphasis is on
improving the timing and volume of releases for the mouth as well as on making further water available
for consumption at an acceptable assurance of supply.
4.2.6 Summary and recommendations
Excess water use and the lack of effective demand management particularly in the agricultural sector
once again emerges very strongly as the major cause of the degraded hydrological regime. In addition,
reservoir operation procedures, particularly of Gariep and Vanderkloof, do not currently provide
meaningful environmental releases and operation policies are not consistent with the spirit of integrated
water resources management. More water needs to be found for transboundary flow provision and for
environmental water needs if the Lower Orange River.
The recommended short to medium term interventions required that would benefit the hydrological
regime in the transboundary context lie with a reassessment of policies that allocate water with no
meaningful regard to efficient use and the maximisation of its economic value. Once again the argument
applies most strongly to the use of irrigation water. Interventions and pilot studies are required that
seek to change attitudes and demonstrate that improvements are achievable and beneficial to all
stakeholders. Much stronger incentives need to be identified and implemented that reduce water
consumption and release it, not exclusively for other consumptive uses but with significant allocations
to increase transboundary flows and restore some semblance of their natural pattern within and between
years. Many means of achieving this have already been proposed and these generally hold within the
context of improving the hydrological condition of the system. In addition the following specific
recommendations for Environmental Water Management are made:
Ę Develop policies and strategies for agreeing and implementing required environmental flows
for the whole Basin in collaboration with ORASECOM;
Ę Manage the river system to optimise the benefits to the river and mouth of the water available
at the mouth;
Ę The development of operating rules to optimise the benefits to the river and mouth of the water
available at the mouth;
Ę Remove or mitigate the impacts of the anthropogenic impacts on the river and mouth;
Ę Commission a study to assess the feasibility of the removal or mitigation of the impacts of
the anthropogenic impacts on the river and mouth and determine the Ecological Water Requirements
for the river and mouth, including the required monitoring;
Ę Undertake comprehensive assessments of the riverine and estuarine Ecological Water Requirements;
Ę The identification of a realistic environmental flow regime for the Lower Orange in association with
the upstream consequences of releasing realistic volumes of water from Vanderkloof upon regional
water availability.
99
Priority transboundary problems
4.3.1
4.3 Deterioration of Water Quality
4.3.1 Overview of the Water Quality Situation in the Orange-Senqu Basin
The water quality in the Orange-Senqu Basin is highly variable due to a combination of natural factors
such as rainfall, evaporation, geology and soils, and anthropogenic factors which cause man-made
changes to the chemistry of the rivers in the basin. In the case of the Orange-Senqu River, natural
factors play a major role in determining water quality due to the size and extent of the catchment,
stretching across several topographical, geological and climatic zones (see Chapter 3.1).
Against this natural variability in water chemistry, there are significant anthropogenic sources of
pollution in the basin, particularly in the Vaal catchment. This catchment includes the main urban and
industrial conurbations of South Africa, the main gold mining areas of the country, parts of the Highveld
coal fields, some of the country's power stations and significant areas of dryland and irrigation
agriculture (see Plates 1-4).
The Orange River catchment as a whole is less developed, although irrigation agriculture occurs
extensively along the river downstream of the Vanderkloof Dam (Plate 5).
Deterioration of the quality of the water resources (both surface and groundwater) in the Basin is
therefore mainly attributable to one or more of the following land-use impacts, depending on the
location within the Basin:
Ę Discharges from waste water treatment works in the numerous small towns and urbanised areas
within the Basin, many of which are not in compliance with the waste water discharge standards
and licence conditions;
Ę Mining pollution from point sources e.g. direct discharge from mine dewatering and effluent disposal;
and non-point or diffuse pollution from runoff and seepage from mining waste dumps (Plates1-3);
Ę Runoff and seepage from developed and informal urban areas (Plate 6);
Ę Runoff from agricultural lands and irrigation return flows (Plate7;
Ę Industrial pollution originating from direct discharges to the water course and stormwater runoff
and seepage from polluted industrial sites;
Ę Overgrazing and poor land management practices, especially on steep slopes and in marginal
agricultural areas (Plate 8) (Directorate National Water Resources Planning, 2006).
As a result of these developments, the surface water and ground water quality in the Orange-Senqu Basin
has deteriorated significantly over the last 30 years. The problem has been further exacerbated by the
increase in water consumption, which has reduced the ability of river systems to assimilate pollutants
through dilution.
The key transboundary water quality issues, identified during the TDA/SAP workshops, are:
eutrophication, microbiological organisms and pathogens, salinity, heavy metals, persistent organic
pollutants, and to a lesser extent, temperature changes. While there is localised pollution in the
catchment resulting from acid mine drainage and radio-nuclides, the transboundary significance of this
pollution has not yet been ascertained.
100
Priority transboundary problems
4.3.1
The discussion on water quality in this chapter is based on numerous sources and references and
therefore the water quality data lack consistency due to differences in sampling methodologies,
laboratory analytical techniques, monitoring frequencies and data interpretation by the various authors
and researchers. Thus the data provided are merely indicative of the water quality problems in the Basin.
Water quality issues can broadly be classified as follows:
Ę Eutrophication
Ę microbial organisms and water borne pathogens
Ę salinity
Ę heavy metals
Ę persistent organic pollutants (POP's)
Ę radio-nuclides
Ę temperature.
The nature and extent of each of these aspects is discussed below:
4.3.1.1 Eutrophication
The water of the main stem of the Orange-Senqu is generally of good quality with low levels of nutrients,
except in localised areas, where the river runs through small towns where waste water treatment plants
discharge poor quality sewage effluent into the river, for example along the Caledon, a major tributary
of the Senqu, and in the Upington area.
101
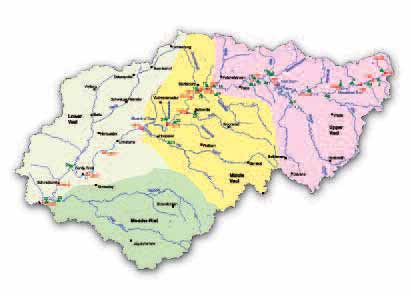
Priority transboundary problems
4.3.1
The Vaal River on the other hand may be classed as eutrophic to hypertrophic along those sections where
the land-use impacts are the greatest, notably the Vaal Barrage, the middle Vaal in the Klerksdorp-
Orkney area Plate 9) and in the reach below the confluence with the Harts River (Directorate National
Water Resources Planning Department, 2006). The Vaal River system receives large volumes of sewage
effluent, amounting to between 500 and 540 million m3/a. Unfortunately the majority of this effluent is
not compliant with the licence conditions and/or the sewage reticulation systems in the catchment are
in a poor state of repair.
The eutrophic status of the river per each Water Management Area (WMA) is summarised below.
The information has been taken from the Integrated Water Quality Management Plan for the Vaal River
System, Task 2: Water Quality Status Assessment of the Vaal River System (Directorate National Water
Resources Planning Department, 2006). Existing data and new sample data for phosphate as PO4 and
Dissolved Inorganic Nitrogen (DIN) were collated for a series of 20 monitoring points along the main stem
of the Vaal River from its source to the Douglas Weir. These points are known as Level 1 points.
Level 2 points were selected for all the main tributary rivers at a point just upstream of the tributary's
confluence with the Vaal. In this way the impact of tributaries on the water quality in the main stem of
the Vaal could be assessed. The average 10-year concentrations of PO4 and DIN are summarised in Table
14 and Figures 25 and 26. For ease of interpretation, the points have been ordered geographically
from upstream to downstream. The location of each point is illustrated in figure 24.
102
Priority transboundary problems
4.3.1
103
Priority transboundary problems
4.3.1
104
Priority transboundary problems
4.3.1
105
Priority transboundary problems
4.3.1
106
Priority transboundary problems
4.3.1
Upper Vaal WMA
The Upper Vaal WMA includes the Vaal Dam and Vaal Barrage and extends down river to the confluence
with the Renoster River, just upstream of Orkney. The water quality of the Vaal headwater tributaries is
generally good with 88Ąg/l phosphate and 0.512 mg/l DIN (Plate 10). The elevated average nitrogen
concentration is probably due to the natural decomposition of organic matter rather than from any
anthropogenic sources. However pollution inputs in the Camden area directly into the river and from the
Witpuntspruit, probably derived from the coal mines in the area, give rise to a more than 100% increase
in phosphate and nitrogen (see Table 14). Downstream, the water quality in the main stem of the Vaal
improves considerably, probably due to inputs of good quality water from the Thukela catchment via the
Zaaihoek Transfer Scheme, before deteriorating significantly again in the Bethal area, upstream of
Grootdraai Dam (Table 14 and Figures 25 and 26), possibly due to extensive coal mining activity and
swage inputs from the numerous small towns in the area.
High loads of phosphate and nitrogen enter the Vaal system via the Blesbokspruit and Leeuspruit
upstream of Grootdraai Dam due to sewage and agricultural pollution. While there is some mixing and
dilution occurring in the dam and phosphate levels are quite low (39Ąg/l), the total phosphorus
concentrations are high (>47 Ąg/l), which is causing algal problems in the dam. This is cause for concern
as water from this dam is transferred north into the Olifants catchment for power station use.
Between the Grootdraai Dam and the Vaal Dam, the main nutrient source is from the Waterval
catchment, which includes the Sasol 2 and 3 plants, the Evander gold mine, several coal mines (Plate 2)
and the towns of Evander and Secunda (Table 14 and Figures 25 and 26).
In spite of the transfer of oligo-trophic water from the Lesotho Highlands Water Project (LHWP) via the
Ash River to the Vaal Dam, the average PO4 concentrations in the dam have increased by 50% over the
last 10 years. A significant increase in TP over the last three years could cause conditions to become
more favourable for cyanobacterial growth, which has serious implications for domestic water supplies.
Indeed indications are that algal blooms are becoming an increasing nuisance in the dam. Based on the
mean annual chlorophyll- concentrations, the Vaal Dam can be classified as eutrophic.
The stretch of river downstream of the Vaal Dam to the confluence with the Renosterspruit is highly
polluted and can be described as eutrophic to hypertrophic. Extremely high loads of both phosphate and
DIN
are
contributed
by
the
tributaries
draining
the
Vaal
triangle
area
of
Johannesburg,
Vereeniging/Vanderbijlpark and Sasolburg (Table 14 and Figures 25 and 26). Point source discharges from
waste water treatment facilities, industrial plants and gold mines, as well as non-point pollution from
urban area runoff, informal settlements, runoff and seepage from industrial sites, landfills and mine
dumps, all contribute to these high nutrient loads. Water hyacinth has become a problem in the Vaal
Barrage and in downstream reaches, as well as algal blooms
In conclusion the phosphate levels in the Upper Vaal WMA increase from 88Ąg/l in the upper reaches
(VS1) to an average of 201Ąg/l at Kromdraai (VS9), an increase of over 100%. Average DIN values have
also shown a significant increase of 86% from 0.512mg/l to 0.95mg/l.
107
Priority transboundary problems
4.3.1
Middle Vaal WMA
Significant loads of phosphate and dissolved inorganic nitrogen (DIN) are contributed to the Vaal River
via the Koekemoerspruit, the Schoonspruit, the Vals and the Sandspruit tributaries (Table 14 and Figures
25 and 26). The Koekemoerspruit and the Schoonspruit drain the Klerksdorp-Orkney-Stilfontein gold
mining area (Plate 11) and the agricultural lands further north around Ventersdorp and Coligny. There are
also several small towns in this area which may be contributing to the nutrient load. The Vals and
Sandspruit catchments are generally agricultural with scattered small towns such as Bothaville,
Kroonstad and Odendaalsrus and therefore the nutrient load may be attributed to the discharge of non-
compliant sewage effluent and agricultural pollution (Plate 4).
Although the contribution of phosphate and nitrogen from the Vet tributary is low, there is evidence of
significant nutrient enrichment higher up in the Sand catchment in particular due to the extensive gold
mining activities in the Welkom-Virginia area (the Free State Gold Mines) and the presence of formal and
informal urban areas. A WRC study by Herold, Pitman, Bailey and Taviv (WRC, 1996) found that nitrogen
and phosphate concentrations in the Sand River (a major tributary of the Vet) were elevated throughout
the affected area.
In summary therefore, in spite of significant loadings throughout the Middle Vaal WMA, the phosphate and
nitrogen concentrations show a 100% and 5-fold decrease respectively. However, it is of concern that
the nutrient levels in most tributaries are showing increasing trends (Table 14).
Lower Vaal WMA
The Bloemhof Dam experiences frequent algal blooms dominated by cyanobacteria and extensive growths
of water hyacinth (Plate 12). The low PO4 levels are thought to be due to uptake by the plants. Blooms
are worst during summer periods and droughts. Based on the last 3 years, the dam may be classified as
hypertrophic due to high chlorophyll- counts. Downstream of the Bloemhof Dam, the nutrient status of
the water quality improves considerably, even with an elevated concentration of DIN contributed from
the Harts River, probably from agricultural return flows.
The nutrient status of the Douglas Weir is considered to be oligo-mesotrophic, due to dilution by good
quality Orange River water via the Louis Bosman transfer canal.
In conclusion therefore, it would appear that the high nutrient inputs in the Upper and Middle Vaal are
not causing a transboundary problem at present. This is due to the fact that the system is being operated
as a closed system, except during flood conditions and also due to the good quality inputs from the
Orange River.
However, the trends in nutrient concentrations are increasing in many of the Vaal
tributaries, which could result in the deterioration in water quality in the Douglas Weir, which may
ultimately cause downstream pollution.
Upper Orange River
The water quality of many of the headwater streams and tributaries of the Senqu in the Lesotho
highlands is generally oligotrophic, with total nitrate ranging from 0-2.5 mg/l and total phosphorus
generally ranging from 0-200 Ąg/l (Rajele, 2004) (see Plate 13). However, the Caledon River which drains
the Lesotho lowlands region, and which forms the border between Lesotho and South Africa for much of
108
Priority transboundary problems
4.3.1
its length, can be classified as oligotrophic in its upper reaches to hypertrophic in river reaches running
through/past towns e.g. Maseru, and areas of livestock concentration. Pollution sources identified by
Rajele (2004) include: stormwater runoff from urban areas, overflow of septic tanks and broken sewerage
systems, effluent discharged from industrial areas, and leachate from cemeteries, landfills and latrines.
Downstream of Maseru the water quality improves as the river winds through relatively under-developed
countryside up to its confluence with the Senqu in the Gariep Dam.
Lower Orange River
The total field area under irrigation in this WMA is 678.4 km2, the bulk of which is in RSA (634.2 km2),
with the balance being found in Namibia (Plate 14). Most of this is found in three main areas:
Ę Douglas weir to Boegoeberg
Ę Boegoeberg to Upington/Kakamas
Ę Kakamas to Vioolsdrift.
The main crops are grapes (~50%), wheat, cotton, maize and lucerne (DWAF, 2004g). It is likely that
there is some localised increase in nutrient concentrations adjacent to and downstream of these
irrigation areas, but there are few monitoring points and the datasets are incomplete (DWAF, 2004g).
There is little industry, but there are some alluvial diamond mines along both banks of the Orange
downstream of Vioolsdrift. Base metal mines (copper, lead, zinc) are found in the region, but they are
located far from the river and therefore have little impact on the nutrient status of the river.
4.3.1.2 Microbiological organisms and water-borne pathogens
Closely linked to the problem of eutrophication are the health effects caused by microbiological
organisms and water-borne pathogens. These enter the rivers via untreated and partially treated sewage
effluent. Many of the waste water treatment plants in the basin produce effluent which is not compliant
with the required standards. This may be ascribed to poor management and maintenance of the sewage
treatment plants or to the fact that many plants are operating beyond their design capacity, resulting
in spills of raw or partially treated sewage into the river systems.
The most common diseases associated with contaminated water and lack of formal sanitation systems in
the Orange-Senqu Basin are: cholera, typhoid, diarrhoea, amoebic dysentery, gastroenteritis and giardia.
These diseases can quickly spread through rural communities via a number of pathways: the direct
consumption of contaminated water; consumption of vegetables and fruit washed or irrigated with
contaminated water, or handled by infected people, or contaminated by flies that have come into contact
with faeces or infected people. Generally, outbreaks of these diseases are confined to localised areas
and are not, therefore, transboundary in nature
Other water-related diseases may be caused by physical changes in a river e.g. the construction of a dam
may create favourable habitat for bilharzia snails, which cause schistosomiasis. The snails favour
vegetation that grows in marginal shallows and stagnant backwaters of dams.
109
Priority transboundary problems
4.3.1
There has been rapid growth in river based tourism along the lower Orange River downstream of
Vioolsdrift in the last decade. However, there are no ablution facilities at all and microbiological
pollution is likely to be occurring at the regularly used camping spots on the river banks. However, there
is no data to support this supposition.
Spatial extent of microbiological pollution:
As indicated above, microbiological pollution manifests itself in rivers downstream from waste water
treatment plant discharge points and where rivers flow through informal settlements and areas where
sewerage infrastructure is poorly maintained. Thus the areas where the problems occur are:
Ę The Upper and Middle Vaal WMAs from the confluence of the Vaal with the Waterval River
to Bloemhof Dam, where the Vaal flows through highly urbanised and densely populated areas;
Ę The upper parts of the Caledon River, where it forms the border between South Africa and Lesotho
to a point downstream of Maseru;
Ę The stretch of the Orange River between Upington and Augrabies Falls;
Ę The Orange River most used by canoeists i.e. from Onseepkans to Aussenkehr.
4.3.1.3 Salinity
The total amount of material dissolved in water is commonly measured as Total Dissolved Solids (TDS),
as electrical conductivity (eC) or as salinity. TDS represents the total quantity of dissolved matter,
organic or inorganic, ionised and un-ionised, in a sample of water. Conductivity is a measure of the
ability of a sample of water to conduct an electrical current and therefore is a measure of the number
of ions in solution. `Salinity' refers to the saltiness of the water (Davies and Day, 1998). In this document,
TDS will be used as the indicator of salinity.
All waters contain some naturally occurring ions as a consequence of the dissolution of minerals in rocks,
soils and decomposing plant material (du Preez et al, 2000). The saltiness of natural waters therefore,
is dependent on the characteristics of the geological and climatic environments through which the rivers
flow. The main ions contributing to the salt load are: sodium, chloride and sulphate, but potassium,
calcium, magnesium, nitrate, bicarbonate and carbonate are also common. As one moves downstream,
the total amount of salt accumulates in the water as salts are continuously being added through natural
(e.g. evaporation and leaching) and anthropogenic processes, whilst very little is removed by natural
precipitation or technological interventions (du Preez et al, 2000). The main sources of anthropogenic
salt load are:
Ę The discharge of sewage effluent from waste water treatment works. The impact of these waste
water discharges is considered to be a major contributor to the salinity problems currently
experienced in the Vaal River (National Directorate: Water Resource Planning, 2006);
Ę Decant of highly saline water pumped from underground mine workings. This is of particular
significance in the Upper and Middle Vaal areas, where many of South Africa's gold and coal mines
are located;
Ę Runoff and seepage from areas disturbed by mining and mine waste dumps (see Plates 1-2, and 11);
Ę Runoff and seepage from industrial areas;
110
Priority transboundary problems
4.3.1
Ę Runoff and seepage from urban areas, especially those without formal sewerage and sanitation
systems. This is especially seen in the Upper and Middle Vaal WMAs where there has been a rapid
increase in urbanisation over the past 15 years, without a concomitant provision of adequate
sewerage and sanitation infrastructure;
Ę Irrigation return flows. The impacts of agricultural activities are particularly noticeable in the
Middle and Lower Vaal WMAs and the Lower Orange WMA, where there are significant areas along
the rivers which are under irrigation (see Plates 4, 9, 12).
Spatial Extent of Salinity:
Vaal River
The general trend is an increase in TDS concentrations along the length of the Vaal River. The ratio of
the median TDS concentrations at the level 1 points to the median concentration at VS1 (headwaters)
listed in Table 14 highlights this trend. The trend is also shown by examining the average TDS
concentrations along the length of the Vaal River. The reach of the Vaal River to Vaal Dam (VS1 to VS7)
has an average TDS concentration of 155 mg/l. There is a significant increase in the average TDS
concentration to 455mg/l between VS7 and VS14 i.e. the outflow from Vaal Dam to the Vals and Vaal River
confluence. There is a slight drop in the average TDS concentration to 338mg/l from the Vals and Vaal
River confluence to the de Hoop weir, but the average TDS concentration increases to 470mg/l at points
VS18 and VS20 below de Hoop weir (National Directorate: Water Resource Planning, 2006) (see Figure 28
and Table 15).
The ionic composition of the Vaal River water also changes along the length of the river. The composition
of the water in the upper Vaal at VS6 (inflow to Vaal Dam at Villiers) is dominated by bicarbonate ions.
The order of prominence is HCO3 > SO4 >Ca > Na >Mg >K.
111
Priority transboundary problems
4.3.1
The ionic composition changes from a HCO3 dominated water to SO4/HCO3 dominated water in the
middle reaches of the Vaal River. The increase in sulphate concentration is an indication of mining
related discharges.
There are also marked seasonal trends in the concentrations of the major cations and anions at Midvaal:
there is a steady upward trend over the low flow winter periods with a sharp reduction with the onset
of the rains in summer (National Directorate; Water Resource Planning, 2006).
Upper Vaal WMA
The upper part of the catchment at VS1 complies with the RWQO targets with regard to TDS (see Figure
28 and Table 15). However, other points in this catchment area show non-compliance to the acceptable
RWQO, with more than 50% of the values showing exceedance. These points are VS2, VS3 and VS6. This
trend would have been carried through to VS5 and VS7, however the situation is alleviated by the
attenuating affects of Grootdraai Dam and Vaal Dam respectively and the inflow of the low salinity water
from the LHWP (National Directorate: Water Resource Planning, 2006).
The catchment upstream of the Vaal Dam is subject to diffuse runoff and seepage from the coal mines
in the area, as well as the effects of atmospheric deposition Ł a direct impact from the emissions from
the coal-fired power stations in the area, as well as from smouldering coal mine discard dumps and old
workings (Plate 3). A study by Herold and Taviv (1997), indicates that by 1995 these effects had increased
the TDS concentration of the Klip River catchment by 24 mg/l (22%) and sulphate concentration by 17
mg/l (1 200%).
112
Priority transboundary problems
4.3.1
Grootdraai Dam itself exhibits good water quality with a mean TDS concentration of 161 mg/l. The dam
levels fluctuate significantly because of water transfers and releases from the dam, but the chemistry
is fairly stable.
Point VS6 on the Vaal River shows a definite increase in TDS concentrations with almost 80% of the values
exceeding the acceptable RWQO TDS concentration of 195 mg/l. Since VS5 displays a low TDS
concentration, it is evident that activities in the Klip and Waterval catchments are contributing to this
increase: extensive mining and industrial activities are present in the Waterval catchment, notably the
Sasol 2 and 3 complexes, the Evander gold mining operations and the towns of Secunda, Kinross, Evander.
There is a discrepancy between the RWQO of this tributary and that of the Vaal main stem regarding
many variables. The acceptable RWQO of the Vaal River main stem at VS6 for TDS is 195 mg/l while that
of the Waterval River 585 mg/l. Thus if the acceptable RWQO concentration of 195 mg/l for TDS is used
for the Waterval River, then there is general exceedance of this management target.
The increase in TDS concentration at VS6 (Villiers) is attenuated by Vaal Dam, as indicated by the
improvement in water quality at point VS7, where TDS levels are within the acceptable RWQO range
limits (see Figure 28 and Table 15). The average TDS concentration of water in Vaal Dam is 154 mg/l. The
water quality of Vaal Dam is not under threat as long as Katse Dam water continues to enter the system
and the current status is maintained.
The catchment between the Vaal Dam and the Vaal Barrage is subject to extensive urban, industrial and
mining development that has resulted in extremely high pollutant loads.
113
Priority transboundary problems
4.3.1
Over the last 20 years the Vaal Barrage catchment contributed nearly half of the salt load of the entire
Upper Vaal WMA, from only 16% of the catchment area. The average TDS concentration of the runoff
from the developed portions of the catchment was 5.4 times higher than that of the Vaal Dam catchment.
Most of the TDS pollutant load (71%) emanated from the Klip River (Gauteng), which comprises 26% of
the catchment area. The Blesbokspruit and the Groot Rietspruit each contributed a further 10%. The
relatively small upper portion of the Klip River catchment, which comprises most of southern
Johannesburg (1 574 km2 - only 2.9% of the WMA) contributed 45% of the salt load. The salt load export
per unit area of this catchment was more than 20 times higher than that of the Vaal Dam catchment.
About 40% of the export load was associated with non-point sources, such as mine dumps, polluted
industrial sites and informal settlements.
The sulphate anion (up to 40% of the TDS) is strongly associated with the TDS loads, due to its
predominance in the water pumped from underground gold mining workings. Calcium tends to be the
predominant cation associated with this gold mining effluent. Sappi's effluent has a greater
preponderance of sodium and chloride, which can be more problematic for irrigation use in the
Blesbokspruit catchment.
Since 1995, Grootvlei Gold mine has resumed pumping, and now has to pump large quantities of
underground water to the Blesbokspruit that were previously discharged to the Klip River catchment via
the now defunct Sallies Gold mine. This source now contributes a further 40x106 m3/a of saline water
(about 4 000 mg/l TDS) to the Blesbokspruit and its Ramsar wetland.
Operating collieries are located in the Vereeniging-Vanderbijlpark-Sasolburg area adjacent to the Vaal
River, while old abandoned coal mine workings are located adjacent to the Blesbokspruit. These
operations also give rise to salinity problems.
The large Lethabo power station is located on the south banks of the Vaal, upstream of the Barrage,
however, significant pollution from this source has not been recorded, mainly because it is a zero
discharge entity, with the entire excess blow down water being absorbed by the ash heaps.
The Sasol I petrochemical industry results in significant discharge of saline effluent, which is discharged
to the Vaal River just downstream of Vaal Barrage. This effluent is also characterised by high fluoride
and boron concentrations. A discharge of about 2.5 m3/s has to be maintained from Vaal Barrage to
ensure dilution of the fluoride and boron to safe levels in the Vaal River.
The Western Areas Gold Mine (WAGM) discharges water to the Groot Rietspruit catchment. The TDS
concentration of this effluent is significantly lower than that of the Central and Eastern Witwatersrand
gold mines e.g. Grootvlei.
Irrigation along the Klip River, Rietspruit and Blesbokspruit and lower Suikerbosrand is adversely affected
by salinity. This is particularly so for the Blesbokspruit / Suikerbosrand since the resumption of pumping
out of highly saline underground water from Grootvlei mine.
114
Priority transboundary problems
4.3.1
Water quality in the Vaal River between Vaal Barrage and its confluence with the Mooi River is dominated
by the discharge from Vaal Barrage. Salinity levels are affected locally by input from the Parys and
Vanderbijlpark wastewater treatment works.
Mining in the West Rand area has led to significant contamination of the Mooirivierloop, a tributary of
the Mooirivier. The average TDS concentration at the confluence with the Mooi River is 1,088 mg/l. The
extensive underlying dolomitic compartments also appear to be significantly contaminated. These
problems have been compounded by earlier attempts to fill sinkholes with mine tailings. The full extent
of the contamination is hard to gauge since the affected dolomitic compartments have been de-watered
by mining activities.
The catchment below the Vaal Barrage contributed about 6.5% to the salt load of the Upper Vaal WMA
during the last 20 years. This was from 8.9% of the catchment area, giving a similar net export to the
Vaal River per km2 of catchment as for the Vaal Dam catchment.
Middle Vaal WMA
From the Vaal Barrage to upstream Bloemhof Dam, TDS loads in the Vaal River level off at around 500mg/l
(see Figure 28 and Table 15). The high levels are due to polluted water releases from the Vaal Barrage
which contributed an annual load of 343,000 tonnes of salt over the 20-year period ending September
1995. Although these average values are within the acceptable RWQO for the Middle Vaal, the RWQOs
are exceeded for 5% of the time at VS10-VS13 and 25% of the time at VS14. DWAF consider the levels to
be "unacceptably high" (DWAF, 2002b).
Although there are several major tributaries to the Vaal in the Middle Vaal WMA up to Bloemhof Dam
(notably the Renoster, Koekemoerspruit, Vierfontein, Schoonspruit, Vals, Sandspruit and Makwassie (Plate
9)), the high levels of TDS in the river are maintained due to inputs of highly saline water from the
Koekemoerspruit, Vierfontein and Schoonspruit tributaries. For example the Koekemoerspruit carries
up to 1000 mg/l TDS, which probably reflects the influence of gold mining activity in the Klerksdorp-
Orkney-Stilfontein area (Plate 11) (National Directorate: Water Resource Planning, 2006). However,
there are no spikes in the TDS of the Vaal at monitoring points VS12, VS13 and VS14 which indicates that
there is sufficient dilution capacity in the Vaal along this reach.
The Sand-Vet Rivers also carry a high TDS load, but the influence on the Vaal is attenuated by the
Bloemhof dam. A WRC study completed by Herold, Pitman, Bailey and Taviv in 1996 found a number of
salt pollution sources in this tributary catchment:
Ę The Free State goldfields, centred on the towns of Welkom and Virginia have caused salinisation
of the groundwater over a large area. The major problem constituents are: TDS, nitrate as N
and fluoride.
Ę These gold fields have also caused widespread surface water pollution along the Lower Sand River.
It was found by Herold et al (1996) that conductivity increases seven-fold from 30 mS/m to
216mS/m in a westerly (down gradient) direction across the gold fields and that median chloride
values increase 20-fold from 18-390mS/m. During a 15-year period from 1980-1995, pollution
115
Priority transboundary problems
4.3.1
sources in the Free State gold fields are estimated to have added about 16,000 tonnes per annum
to the TDS load in the Vet River catchment, representing an increase of 35% in TDS exported from
this catchment. During wet years, the contribution of the gold fields area is significantly higher as
a result of direct runoff over polluted areas (Herold et al 1996). Indeed, Herold et al (1996)
reported that "in some portions of the Sand River, the deterioration [in TDS] is serious enough to
present a very real, acute threat to potential rural or informal users who might use it [water]
for domestic purposes."
The most affected rivers are the: Sand, Mahemspruit, Doring, Theronspruit, Bosluisspruit and
probably the Rietspruit and Merriespruit, although little data was available at the time of the
Herold et al, 1996 study. The main pollutants are sodium, chloride and sulphate.
Ę The Sand-Vet Government Water Scheme covers an area of almost 208km2 mostly along the lower
Vet River. Irrigated crops include wheat, maize, fodder crops, potatoes, vegetables, groundnuts,
sorghum and sunflowers. The catchment is also characterised by significant areas of dryland arable
farming for maize, wheat and fodder crops. However, it is thought that salt is being retained in the
irrigated areas, thus reducing the overall export of salt from the Vet River to Bloemhof Dam by
about 13,800 tonnes per annum (Herold et al, 1996).
Ę Significant amounts of sewage effluent are discharged directly into the Sand River and some of the
pans near Welkom.
Lower Vaal WMA
The quality of the water in the Vaal River improves considerably at the outflow of Bloemhof Dam (Figure
28), with TDS dropping to the range of 350 mg/l (50th percentile value). However, the salinity levels at
the outflow are closely correlated with dam levels, with higher TDS concentrations being experienced
during drought periods.
The TDS concentration of 350mg/l from the outflow of Bloemhof Dam stays approximately constant in the
Vaal River to point VS19 (Schmidtsdrift), where the impact of the Harts River is felt (Figure 28). At this
point TDS levels increase, due to the high TDS loads that the Harts River carries from the irrigation
return flows of the Vaalharts irrigation scheme. At 35,000 hectares, this scheme is the largest in South
Africa. Irrigation water is diverted from the Vaal at the Vaal-Harts weir into a canal system. While the
effects of long-term irrigation (since 1940) in the Harts valley can be seen in the salt load in the lower
reaches of the Harts River (average TDS approximately 800 mg/l), most of the salt in the Vaalharts
irrigation scheme is still held up in the soil and groundwater in the catchment. However, increasing
trends in most of the common ions perhaps indicate that the `salt sink' may be reaching full capacity (du
Preez et al, 2000), which could have a significant impact on all downstream users.
A study done by Ellington, Usher and van Tonder in 2004 found that the TDS of groundwater in the Vaal-
Harts scheme area has increased at a rate of 13 mg/l/annum due to an increase in leaching of
approximately 100,000 tonnes/annum. The main contributor to the salt load in the groundwater is the
water used for irrigation which contributes 130,000 tonnes/annum of salts (compared to only 50,000
tonnes/annum contributed by fertiliser applications) (DWAF, 2004d)
116
Priority transboundary problems
4.3.1
The high loads in the lower Harts account for the peak in TDS levels (average 550 mg/l) in the Vaal, seen
at point VS19 at Schmidtsdrift, downstream of the Vaal-Harts confluence.
There are two other major irrigation schemes downstream of the Vaal-Harts confluence: the Douglas
Weir Irrigation Scheme and the Orange-Riet Government Water Scheme. The Douglas Weir scheme is
entirely dependent on good quality water from the Orange River via the Louis Bosman canal, while the
Orange-Riet scheme receives water via a transfer from the Vanderkloof Dam on the Orange River (du
Preez et al, 2000).
These two schemes are operated as closed systems, whereby inflows and spillages from irrigation areas
are kept to a minimum and under normal operating conditions, these areas only use low salinity water
from the Orange River and not the Vaal. While water is consumed in the schemes, salts are returned to
the rivers as irrigation return flows, which has led to a build up of salts in some parts of the system e.g.
the lower reaches of the Riet River (du Preez et al, 2000) where average TDS levels are 840 mg/l, with
peaks of up to 2,400 mg/l having been recorded at the Aucampshoop weir in the Lower Riet (National
Directorate: Water Resource Planning, 2002c). This input of salinity is evident at monitoring point VS20
in the Douglas Weir, where the average TDS concentration was high (average 500 mg/l), and the
concentrations have increased significantly over recent years. One would expect the TDS levels to
improve more substantially due to the good quality Orange River water that enters the system at this
point, however the high salinity loads of the Riet River minimise this diluting effect (Figure 28). The
resulting situation is that a "salt plug" exists at Douglas Barrage (DWAF, 2006).
The situation in the Lower Vaal WMA relating to compliance with the applicable RWQOs at the strategic
monitoring points depicts a fairly good situation (see Table 15 and Figure 28). Non compliance with
RWQOs appears to occur only 5% of the time for certain variables at points VS16 to VS20. However here
again, although good compliance is indicated, the applicability of the RWQOs, especially for TDS needs
to be determined. These objectives, were set based on the current status of the water quality in the
Lower Vaal River (February 2006) and thus were meant to manage the situation at the current levels and
not to focus on the improvement to better levels or on the sustainability of the system (National
Directorate: Water Resource Planning, 2006).
From the above analysis of salinity in the Vaal River catchment, it is evident that the three key areas of
concern in the study area are the reach of the Vaal River below the confluence of the Waterval River,
the Vaal Barrage/Middle Vaal River section, and the Harts River area. This situation is attributable to the
land-use activities typical of these areas (National Directorate: Water Resource Planning, 2006).
Upper Orange WMA
The salinity of the water in the Orange River has always been relatively low. The reason for this lies in
the fact that most of the water originates in the high rainfall area of Lesotho, where the geology is such
that the water has a low concentration of salt. With the implementation of the Lesotho Highlands Water
Project, substantial volumes of this low salinity water is being diverted to the Vaal River Catchment. This
means that the dilution effect of the water from Lesotho has been diminished, which could lead to
increased salt levels in the Gariep and Vanderkloof Dams. It is not known how serious this effect will be,
and whether or not it will be at all significant.
117
Priority transboundary problems
4.3.1
Lower Orange WMA
The straight line distance from the Vanderkloof Dam to the Orange River Mouth is some 600 km, while
the river length itself is 1 400 km. Over this distance there are significant changes in climate, geology
(soil type) and crops. Together these factors influence the salinity guidelines, and the river was therefore
divided into 3 reaches to account for the different circumstances:
Ę Gariep/Vanderkloof Dam to Boegoeberg Dam,
Ę Boegoeberg Dam to Onseepkans,
Ę Onseepkans to Orange River Mouth.
The Orange River Replanning Study (ORRS) (van Veelen and van Heerden, 1998) indicated the potential
for water quality problems in the Lower Orange WMA, especially in the reaches below Boegoeberg and
Onseepkans. The water quality in the Lower Orange WMA is affected by:
Ę High evaporation;
Ę Low rainfall;
Ę Little and infrequent contribution of flow from the tributaries;
Ę Loss of dilution capacity through the numerous water transfer schemes which take water out of
the Orange;
Ę High salinity irrigation return flows;
Ę Loss of dilution capacity from the Vaal due to the fact that the Vaal is managed as a closed system
for most of the time, except during flood events.
There is also the potential for the addition of approximately 3 million tonnes of salt held up in the Vaal-
Harts Irrigation Scheme. This could cause problems if the storage capacity of this `salt sink' is exceeded
(Volschenk, Fey and Zietsman, 2005).
In this WMA, irrigation accounts for 94% of the total water use, compared to 3%, 2% and 1% for urban,
rural and mining purposes respectively (Plate 14). More than 35,000ha of land is cultivated between
Boegoeberg and Onseepkans, with grapes (60%) and cotton (~20%) being the main crops. Others include
lucerne, wheat and maize. It has been estimated that irrigation return flows may be as high as 30% of
the water applied (Volschenk, Fey and Zietsman, 2005).
Water quality modelling for 1995 and 2030 levels of development done for the Lower Orange River study
(Permanent Water Commission, 2005b) showed that salinity increases from 121mg/l at the Gariep Dam
to 326 mg/l at the Orange River Mouth (ORM), with the most significant increase being in the stretch of
river from Boegoeberg to Kakamas (see Table 17). Simulations using the DWAF salinity model showed
that salt concentrations would increase by 25% at Boegoeberg dam and Kakamas by 2030. At present, the
salinity in this reach of the river regularly exceeds 500 mg/l and often exceeds 750 mg/l. Grapes and
other orchard crops are especially sensitive to salinities over 500 mg/l. A worrying finding of the DWAF
salinity model was that it appears that salt is retained in the system between Kakamas and Vioolsdrift,
which cannot continue indefinitely.
118
Priority transboundary problems
4.3.1
However, at present, only 1.7% of the Lower Orange WMA is too saline for grapevine production without
any loss of yield and only 14% of the area shows poor crop growth due to salinisation (Volschenk, Fey and
Zeitsman, 2005).
4.3.1.4 Heavy Metals
Heavy metals are those metals which have an atomic weight greater than calcium. They typically include:
iron, manganese, mercury, lead, cobalt, copper, zinc, cadmium, nickel, and chromium. Metals which
occur in very small quantities in the environment may also be known as trace metals, such as beryllium,
bismuth, boron, selenium and other rare heavy metals. Most can be highly toxic even in very small
amounts. The toxicity depends on the chemical species of the metal, the presence of other metals and
organic compounds which may have synergistic, additive or antagonistic effects, the flow rate and
volume of water, the physical make-up of sediments, water temperature, pH and salinity (Davies and Day,
1998). For example, many metals only become soluble when the pH of the water is lower than 5.0. Thus
there is a clear correlation in the occurrence of heavy metal pollution and acidification. Furthermore the
toxicity of metals generally increases with increasing water hardness.
Heavy metals are not broken down through natural processes and therefore they persist in the
environment. Often they become adsorbed onto suspended particles in the water column, which in turn
settle out on the bed of the river or dam and remain indefinitely (Davies and Day, 1998). Thus, colloidal
and suspended sediment transport is the main mode of transport of heavy metals in most base river
systems (Vosloo and Bouwman, 2005). However, if the pH of the water drops due to pollution from, for
example, acid mine drainage, the metals may become remobilised and more available for uptake by
aquatic organisms.
The most toxic metals are generally recognised to be (from most toxic): mercury, copper, cadmium, zinc,
tin, aluminium, nickel, iron, barium, manganese, cobalt, lithium, potassium, calcium, strontium,
magnesium and sodium (Hellawell, quoted in Heath and Claasen, 1999).
The main sources of heavy metal pollution are industries and mines though direct, non-compliant
discharges of effluent to the aquatic environment, and diffuse seepage and runoff from polluted areas
and waste dumps. Coal mine runoff and seepage is typically very acidic and contains iron, manganese,
aluminium, boron as well as high salt loads, while the gold mines produce iron, cyanide and radium226,
as well as high salt loads dominated by sulphate. There are numerous diamond mines along the banks of
119
Priority transboundary problems
4.3.1
the Vaal and Orange Rivers, but these contribute suspended sediment rather than any heavy metal
pollution to the rivers. There are a few base metal mines in the catchment e.g. Black Mountain (lead),
Skorpion Zinc and Rosh Pinah (lead-zinc), Sishen iron ore mine, as well as the closed Prieska and O'Kiep
copper mines, which may contribute heavy metal pollution to local groundwater resources (iron, copper,
lead, zinc, nickel), but since they are mostly found in the drier western parts of the Basin, there is little
direct runoff or discharge to the rivers.
There are many industrial sources of heavy metal pollution in the Vaal triangle area of the Upper Vaal
WMA, notably steel mills, power stations, metal refineries, pulp and paper factories, petro-chemical
plants, manufacturing plants, as well as waste disposal sites Ł all of which produce a cocktail of heavy
metal pollution in their effluents and site runoff and seepage. Heavy metals also are taken up in urban
stormwater runoff from roads, parking areas and other `hard' surfaces, ending up either in waste water
treatment plants (WWTPs) in serviced areas or directly into streams in un-serviced areas. The heavy
metals from WWTPs end up in the sewage sludge, which is either land farmed or disposed of in sludge
dams. The concentrations of such metals is such that the sewage sludge can be considered as hazardous
waste, but most of these facilities for disposal are unlined and fail to comply with the basic requirements
for hazardous waste disposal. As a result, heavy metals leach out into the groundwater and find their way
into surface water courses.
Heavy metals are also found in pesticides, typically mercury, arsenic and selenium, and fertilisers, with
the most common being, zinc, copper and boron (Heath and Claasen, 1999).
Spatial extent of heavy metal pollution:
Unfortunately, heavy metals are not monitored on a consistent basis in the catchment. Individual mines
and industries may have water sampling networks in place, but the results are not collated centrally
and in any case, it is difficult to compare the results of samples which have been collected in differing
ways and analysed in different laboratories.
However, industrial heavy metal pollution is most likely to be found in the Vaal catchment in the reach
of the Vaal River below the confluence of the Waterval River and the Vaal Barrage/Middle Vaal River
section. In addition, Herold, et al, 1996 reported significant pollution of the groundwater in the Free
State gold fields area.
The impact of heavy metals from fertiliser and pesticide use in agricultural areas is unknown. Therefore,
the impact of heavy metal pollution on the overall water quality in the Basin, especially transboundary
effects, is not well documented and requires further research.
4.3.1.5 Persistent Organic Pollutants
In 1997, the United Nations Environment Programme initiated a process to develop a global, legally-
binding instrument to reduce the risks to human health and the environment caused by the release and
long-range distribution of persistent organic pollutants (POPs). This has resulted in the Stockholm
Convention on Persistent Organic Pollutants. Of the Orange-Senqu Basin states, South Africa and Lesotho
have both signed and ratified the Stockholm Convention, while Namibia and Botswana have acceded
to it.
120
Priority transboundary problems
4.3.1
However, the Basin states may have committed to the convention under which they will be obliged to act,
without actually knowing the full extent of their contribution to POPs. This lack of knowledge was the
prime motivating factor for a WRC report by Vosloo and Bouwman in 2005. The following sub-sections
draw heavily on this work.
The POPs convention is aimed at eliminating or reducing the production or release of 12 identified POPs,
including a number of pesticides: aldrin, dieldrin, DDT, endrin, heptachlor, chlordane,
hexachlorobenzene, mirex and toxaphene. The other three chemicals are classes of compounds that
include the dioxins (PCDD), dibenzofurans (PCDF) and polychlorinated biphenyls (PCBs).
Nature of the problem:
POPs are considered to be organic compounds of natural or anthropogenic origin that resist photolytic,
chemical and biological degradation and also have toxic properties. They are compounds with low water
solubility, are readily soluble in lipid and can therefore accumulate in fatty tissues of organisms.
Because of the long persistence times and low volatility, they can be transported in the environment in
low concentrations via water and air movements, as well as within migrating animals. This means that
POPs can be transported to areas far from their source.
The major sources of PCDD/PCDF are combustion processes, especially municipal, hospital and hazardous
waste incineration. Incineration of organic and inorganic chlorinated compounds where the flue gas does
not reach a temperature of more than 400░C, combined with a short residence time of the gas at that
temperature can contribute to the formation of PCDD/PCDF. Such conditions also occur in automatic fuel
combustion and this process could also be a significant source of PCDD/PCDF.
PCBs gained notoriety as a contaminant in the 1970s. PCBs used to be used in electrical transformers and
capacitors, as well as in rubberised paints, glues and plastics, before they were banned. However, in
spite of the ban, PCBs are still present in the environment.
The other major source of POPs is from pesticides. Even though the agricultural use of aldrin (1970), DDT
(1976), dieldrin (1984) and heptachlor (1975) was prohibited in South Africa, the persistent nature of
these pesticides means that their effects may still be present in the Orange-Senqu Basin.
121
Priority transboundary problems
4.3.1
A WRC study of pesticides in selected South African rivers by Heath and Claasen in 1999 found that the
highest pesticide loads occur in the following tissues of fish (listed POPs are indicated in bold):
Fat:
DDE, DDD, DDT, primiphos, atrazine;
Testes:
BHC;
Liver:
dieldrin;
Guts:
lindane, endosulfan, aldrin
Unfortunately, the study by Heath and Claasen did not include any rivers in the Orange-Senqu Basin.
Spatial extent of persistent organic pollutants:
The study by Vosloo and Bouwman (2005) selected 22 river sampling sites throughout South Africa
to represent sites with potentially high POP concentrations. Samples of river sediment were sent to an
accredited laboratory in Germany for analysis because there are no suitably equipped laboratories
in South Africa for these determinations. Total concentrations of TEQs (Toxic Equivalent Factors) were
calculated as the sum of individual compounds.
The study found that PCBs and PCDD/PCDF were present in all 22 sites sampled, with the highest TEQ
value (22 ng/kg) being found in the Rietspruit in Vanderbijlpark, a tributary of the Vaal River. Although
this value does not exceed the level of 50 ng/kg which is the action level determined for the USA,
it is nevertheless very high. Results from the other sites in the Vaal and Orange catchments are shown
in Table 19.
The values shown above, especially for the Gariep River mouth (site 1) indicate the real possibility of
long-range riverine transport of these pollutants. Furthermore, the results indicate that the risk is not
limited to the industrial areas only when the normalised TEQs are taken into account.
These results are indicative of a significant transboundary problem and a considerable amount of further
research is required to better understand the nature, extent and significance of POP contamination in
the Basin.
122
Priority transboundary problems
4.3.1
4.3.1.6 Radio-nuclides
Many of the gold mines in the West Rand Basin, the western limb of the Witwatersrand and the Free
State Gold Fields produce uranium as a commercial product or as a waste product (Plate 1). No publicly
accessible literature could be found which quantifies the extent of such pollution in freshwater systems
of the region, possibly because of the sensitive nature of such information (GIWA report on the BCLME
Project). However, the Middle Vaal WMA Water Resources Situation Assessment (DWAF, 2002b) stated
"radio-nuclides have been identified as a potential problem associated with gold mining activities."
The impacts of radio-nuclides in the water can be severe for all forms of life, including mutagenic and
carcinogenic effects given sufficient doses over a period of time. The pathways include: direct uptake
of radio-active particles through ingestion, as well as indirect uptake through the food chain.
Because radio-nuclides are not actively monitored by DWAF, the magnitude and significance of the
problem is not known, especially the transboundary effects.
4.3.1.7 Temperature
Physically, less oxygen can dissolve in warm water than in cold water.
However, the rate at which
chemical reactions occur increases with increasing water temperature, thus water temperature can have
a profound effect on the rates at which physiological reactions take place within living tissues. Under
conditions of increased temperatures, organisms live at a higher rate, thus using up more oxygen, even
though less oxygen is available because of the warm water. As a result, aquatic organisms are placed
under stress. Conversely, more oxygen can physically dissolve in cooler water, but lower water
temperature result in lower metabolic rates which in turn means that organism move more slowly and
take a longer time to reach maturity. Because of the conflicting effects of high and low temperatures,
all organisms have an optimal temperature range at which growth and reproduction are greatest.
An increase in water temperature can be caused by: the direct discharge of heated effluent e.g. power
station cooling water, into the water course; the release of warmer surface water from an impoundment;
and from direct solar warming of the water column due to a reduction in flow depth. The latter can be
caused by natural cycles of drought, but also from increased abstraction and regulation of the system,
resulting in lower flows. For example, the mean annual discharge of the Orange River at the mouth is
over 50% less than virgin flow. This means that the flow in the river along the lower reaches is often very
low and the water temperatures can exceed 25░C on a regular basis (Walmsley Environmental
Consultants, 1997). Although low flows were a feature of the pre-regulated system, especially in winter,
river regulation and hydropower releases have meant that low flows are experienced throughout the
year, even in summer, when under normal circumstances, the water depth would have been greater and
the water cooler. This may have resulted in perturbations in the aquatic ecosystem in the lower,
transboundary reaches of the Orange, but there is little data available to enable the impact
to be quantified.
Low water temperatures may be caused by the release of water from the cold hypolimnion (lowest layer
of water) of a dam. This water is much colder that the normal river temperature and the reset distance
will depend on the degree of dilution, mixing, water velocity, flow depth and ambient temperature.
123
Priority transboundary problems
4.3.2
4.3.2 Water Quality Management
4.3.2.1 Lesotho
Legal and Institutional Framework in Lesotho for Water Quality Management
In Lesotho, water supply and sanitation falls under the Water and Sewage Authority (WASA) for urban
water provision and under the Department of Rural Water Supply for rural areas. While both these
authorities sit within the Ministry of Natural Resources, their areas of jurisdiction are poorly defined,
resulting in confusion over respective responsibilities (Molapo, 2005). The provision of water and water
use is governed by the Water Resources Act, No 2 of 1978 and the Water Resources Regulations of 1980.
However, pollution control falls under the Environment Bill, No 15 of 2001 and the Amendment Bill of
2006. Part VII of the Amendment Bill sets out the laws relating to pollution control, and makes provision
for the development of standards for effluent discharges. While draft effluent discharge standards have
already been developed, the Bill has not yet been gazetted and therefore the standards cannot be
enforced. This situation has been in effect since 2001 because neither the Environment Bill of 2001, nor
the latest amendment, have been formally gazetted.
Water Quality Management in Lesotho
WASA is responsible for the treatment and distribution of treated water in the urban areas of Lesotho,
and the authority uses the WHO guidelines for drinking water standards. WASA conducts analytical
laboratory checks for quality of both raw and treated water countrywide. The frequency of sampling
depends on the severity of potential for pollution. Samples are taken at least once a week for district
plants and once daily for Maseru where most pollutants are produced. WASA (2002) also reports that
external laboratories are sometimes contracted in cases where WASA does not have the capacity, for
quality checks, and although standards are not always met, the water produced by WASA is always of
acceptable quality for consumption (Molapo, 2005). However, independent studies have found that, in
contrast with what WASA officials have reported, the coliform counts in more than half of the towns
surveyed are unacceptable (Chakela, 1999 cited in Molapo, 2005).
Long-term ambient water quality monitoring in the rest of the country is limited to that conducted by
the Lesotho Highlands Development Authority (LHDA) within its affected area (TAMS, 1996) and there is
no national aquatic ecosystem monitoring programme for the country (Rajele, 2006). The LHDA monitors
basic determinants (cations, anions, turbidity, TDS and pH) in order to ensure compliance with the
Lesotho Highlands Treaty which requires Lesotho to provide "good quality water".
Some short-term water quality data have also been collected by individual organisations as part
of their EIA investigations e.g. Letseng and Kao diamond mines, but the extent of monitoring is
extremely localised and this information is not available to the public since there is no national water
quality data base.
Another problem hampering water quality management in Lesotho is the lack of an accredited laboratory
in the country. The Lesotho Food Laboratory recently started analysing microbiological determinants in
water (aerobic plate count and coliforms only), and plans to acquire analytical equipment for inorganic
chemical determinations (Leboela, undated).
124
Priority transboundary problems
4.3.2
However the laboratory is faced with several problems:
Ę it is not accredited yet;
Ę it is difficult to maintain equipment;
Ę there is a high turnover of staff; and
Ę there is a lack of water quality legislation (Leboela, undated).
As a result, samples have to be sent to laboratories in neighbouring South Africa, which adds substantially
to the cost and efficacy of monitoring.
In conclusion, water quality monitoring in Lesotho is poor due to fragmented institutional structures, a
lack of formal legislation and standards, and inadequate laboratory facilities.
4.3.2.2 South Africa
Legal and Institutional Framework in South Africa for Water Quality Management
One of the most important milestones in the revision of the Water Law in South Africa was the publication
of the document the `White Paper on a National Water Policy for South Africa'. This policy document sets
out overarching policy principles regarding water resource management which were later taken up into
the National Water Act (Act No. 36 of 1998) (NWA).
The National Water Policy is firmly founded on the concept of integrated water resource management
(IWRM) on a catchment basis and entrusts the Department of Water Affairs and Forestry (DWAF) with the
custodianship of the water resources of South Africa. Amongst others, the policy together with the NWA,
binds the Department to play a distinctive and pioneering role in promoting and facilitating the
establishment of statutorily directed catchment management in fulfilment of IWRM (DWAF, 1997). This
obligation requires that the Department meets the implementation needs of catchment management by
driving and facilitating catchment management processes and the establishment of related institutions
i.e. the catchment management agencies (CMAs).
The pursuance of IWRM by the Department has thus become the declared goal of water management at
national, regional and catchment level.
IWRM in South Africa is seen to be achieved through a three tiered framework comprising (i) a statutory
framework provided through the NWA, (ii) the National Water Resource Strategy (NWRS) and (iii)
catchment management processes, strategies and plans in Water Management Areas (WMAs) formalised
through the Catchment Management Strategy (CMS) (DWAF, 1998).
The facilitation and co-ordination of catchment management in and between WMAs is achieved at a
national level by the National Water Resource Strategy (NWRS), which forms a coherent planning
framework, and at a catchment or WMA level by Catchment Management Strategies (CMSs). These
strategies link together the management elements required by water quality, quantity and the aquatic
ecosystem components of the water resources in a catchment into a coherent approach that aims to
secure beneficial, equitable and sustainable use of the water resource.
125
Priority transboundary problems
4.3.2
The need for stakeholder participation for the successful implementation of the IWRM process has been
identified and is taken up in the NWA, by the devolution of management of the water resource to regional
and catchment levels via the CMAs and other institutional structures. These structures must include
stakeholders in both the ongoing development of the CMS and in giving effect to the strategy. Apart from
the legal requirement for public consultation, the reason for inclusion of stakeholders is that they are
more likely to identify the issues at hand with respect to the water resource and are more equipped to
ensure implementation of the necessary actions to realise the requirements.
It is recognised that due to a shortfall of skills and resources in South Africa the implementation of
catchment management processes and the establishment of CMAs will be a gradual process, dependent
on the development of management, technical and financial resources within a WMA. Thus in the short
to medium term the Department's Regional Offices have the responsibility of driving the development
CMSs and establishing CMAs (DWAF, 1998).
Water Quality Management in South Africa
Water quality is monitored in South Africa at national, regional, local and company level. DWAF has a
national monitoring system in place across the country, while some of the DWAF regional offices also
collect data within their region. Local authorities and water boards collect data immediately relating to
their operations, while companies are obligated to conduct water quality sampling and submit their
results to DWAF in terms of their Water Use Licence conditions.
The Department as the regulator monitors the water quantity and quality in the parts of the Vaal and
Orange River Systems which fall in South Africa. A national Water Monitoring System (WMS) is currently
in place and is coordinated by the Department's Resource Quality Services (RQS). All data collected for
the national monitoring programmes are stored on the Department's database and information
management system, i.e. the WMS.
In some instances the Directorate Hydrological Information and/or the Regional Offices collect the
samples for the RQS for the national monitoring programmes.
The Regional Offices also have their own regional water quality monitoring programmes for which they
are the lead agents. These programmes are not always integrated into the WMS. For example, the
Gauteng Regional Office has an extensive water quality monitoring programme in place which supports
the national programme, while the Free State Regional Office has recently initiated a regional monitoring
programme, which is not yet integrated into the national system, as WMS is not yet used by the Region.
The Northern Cape Regional Office has also recently initiated a regional monitoring network which has
some minimal integration with the national system.
The Gauteng Regional Office's monitoring network also includes monitoring stations that monitor the
wastewater discharges from point sources. This network is a compliance monitoring network to assist the
Gauteng Regional Office in determining if industries, mines, wastewater treatment plants, etc. in the
catchment are complying with the discharge standards stipulated in their Water Use Licences. The supply
of data is dependent both on the water users themselves and the Department's own compliance
monitoring network. Since the provision of regular water quality data to DWAF is a condition of all Water
126
Priority transboundary problems
4.3.2
Use Licences, most companies submit water quality reports on a regular basis, but it would appear that
this information is not loaded onto the national database timeously. Additional complications include:
the poor quality of the data provided, missing datasets, questionable laboratory findings and lack of
effluent discharge volume data.
The water boards operating in the Vaal catchment (Midvaal, Rand and Sedibeng Water Boards) each have
water quality monitoring programmes. For example, Midvaal Water has a monitoring programme with
sampling points in the Koekemoerspruit and the Vaal River. Samples are taken on a weekly basis and
analysed on site by their own laboratory. Variables analysed range between physical parameters, metals,
micro and macro elements, organics, nutrients, biological parameters and faecal coliforms. However,
there is no alignment to the Departmental monitoring system, or between the different Water Boards
themselves.
There are numerous government, commercial and private water quality laboratories in the river basin,
mostly located in the Vaal catchment. Many of the government and commercial laboratories subscribe
to inter-laboratory quality assurance control systems and many are accredited. However, there are
private laboratories e.g. at the mines and some industrial undertakings which do not have such quality
control systems in place. The larger government and commercial laboratories can analyse for most
inorganic chemicals in soil, sediment and water, but there is less capacity for organic pollutants and no
laboratories have the equipment to analyse for some compounds that include the dioxins, dibenzofurans
and polychlorinated biphenyls (listed as Persistent Organic Pollutants in the Stockholm Convention)
(Vosloo and Bouwman, 2005).
The Water Quality Status Assessment for the Vaal River system (DWAF, 2006) identified the following gaps
and inadequacies in the water quality data and monitoring programmes, which are also relevant to the
entire Orange-Senqu Basin:
Ę There are differences in:
o Variables analysed;
o Time periods and scales of the monitoring;
o Analytical methods;
o Laboratories used for the analysis;
o Differences in data collection and storage formats.
Ę There is a lack of integration between the monitoring programmes of the National Programme and
egional Offices. There is also a lack of integration among the Regional Offices with regards to the
monitoring programmes and monitoring. There is at present no co-ordination between the RQS and
the Departmental Regional Offices regarding the location of monitoring stations, sampling frequency
and analyses performed.
Ę There is also no integration or co-operation between the Department and the Water Boards with
regard to monitoring of the Vaal and Orange Rivers. Efforts are duplicated, uncoordinated
and isolated.
127
Priority transboundary problems
4.3.2
Ę Data from the monitoring stations have in many instances proved to be incomplete (information
gaps) or insufficient (limited data sets). The data sets are fragmented and their reliability
is questionable.
Ę Monitoring stations are not always suitably located and thus in some instances, the most
downstream point on the tributaries was too high up in the catchment. Thus the lower catchment
impacts are not accounted for.
Ę With regard to salinity, the Gauteng Regional monitoring programme monitors eC, while the National
programme and that of the Free State Region monitors TDS.
Ę Analysis of data between various monitoring stations is not always possible because of differing
water quality variables analysed and discrepancies in the analytical techniques used by different
testing laboratories.
Ę The water quality monitoring variables currently analysed are largely concentrated on chemical
constituents. At present very little information is available on the aquatic health of the water
resources of the catchment.
Ę Available Departmental data varies in completeness, accuracy and reliability, which has resulted in
difficulty in isolating and quantifying specific pollution sources.
Ę Not all monitoring points include flow measurements which does not allow the determination
of loads.
Ę No validation processes are in place to verify that the data that have been captured (no validation
of methods, sampling, analysis, etc.). This therefore sometimes raises questions about the validity
of the data that are available on the Department databases.
Ę Limited continuous monitoring of water quality is practised in the Vaal River and its tributaries.
In impacted catchments the continuous monitoring of key water quality variables such as eC
is needed for use with the flow monitoring stations to accurately assess the loads and compliance
with RWQOs.
In conclusion, South Africa has the required policy, legal, institutional and administrative frameworks in
place to monitor water quality, but a considerable amount of work is still required to ensure that the
national water monitoring system is comprehensive, up-to-date, scientifically credible and readily
available to all users.
4.3.2.3 Botswana
Botswana does not have any surface-flowing rivers within the Orange-Senqu catchment and therefore
there are no known transboundary effects.
128
Priority transboundary problems
4.3.2
4.3.2.4 Namibia
Legal and Institutional Framework in Namibia for Water Quality Management
Water management falls under the Department of Water Affairs (DWA) in the Ministry of Agriculture,
Water and Forestry. Water quality management is the responsibility of the Directorate: Resource
Management (DRM), however, the quality of domestic supplies is the responsibility of the Namibian Water
Corporation (Namwater), which is a government-owned, commercial parastatal, set up in 1997 to provide
bulk water to municipalities, industry and mines in the country.
While mines and industries are required to submit regular water quality monitoring reports to the
responsible line ministries e.g. Ministry of Mines and Energy, the results are seldom forwarded to the
Directorate: Resource Management (DRM) for follow-up, enforcement or sanction. In recognition of this
problem, an Inter-Ministerial Committee has recently been set up to improve cooperation between WRM
and the responsible line ministries, but little progress has been made to date.
At present, Namibia regulates water quality under the old South African Water Act, No 54 of 1956 and
the related Regulations of 1962. The new Act, the Water Resources Management Act, No 24 of 2004, has
been approved but has not yet been officially gazetted, but this is likely to happen towards the end of
2007 (pers. comm. Dr de Wet, DWA). This new Act provides for the management, development,
protection, conservation and use of water resources and allows for the establishment of regulatory and
advisory institutions.
Water Quality Management in Namibia
In terms of the old Act, all persons who use and discharge water and effluent (e.g. farmers, mines,
industrial undertakings) must have a permit, but there is little if any enforcement. In the past users
were encouraged to submit samples which were analysed by DWA and the results were provided to the
users for free. This system provided the government with some ad hoc data on the water quality of the
Orange and Fish Rivers, but a new system has recently been introduced which requires the users to pay
for the analysis; the result is that few if any samples are being submitted anymore.
Namwater has monitoring points at its main abstraction points e.g. on the Orange River near Rosh Pinah,
and at the Naute and Hardap dams in the Fish River catchment, but sampling is infrequent. This
information is supposed to be fed into a Water Quality Information System, which contains records on
water quality assessment and pollution control in the country. The suitability of water for human
consumption and domestic use is recorded, but due to the ad hoc nature of sampling, the data base is
incomplete. Attributes assessed and monitored include: pH, Conductivity, Total dissolved solid (TDS),
Silicate, Fluoride, Sodium, potassium, Sulphuric acid, Chlorine, Total alkalinity, Total hardness, Calcium,
Magnesium, Iron, Manganese and Turbidity.
The South African DWAF has a few monitoring points on the Orange River along the Namibian border, but
water quality data from these points are only provided to Namibia when requested by the Namibian
authorities. However, the DWAF office upstream at Upington does notify WRM of any occurrences of toxic
algal blooms or the outbreak of water-borne diseases. Namwater has a laboratory in Windhoek and there
used to be several commercial and private labs, but several of these have closed down in recent years.
129
Priority transboundary problems
4.3.3
In conclusion, the legal and policy requirements for water quality management in Namibia need to be
formalised into law. While the administrative structures are in place to manage water quality in the
country, the quality of the monitoring network, sampling system and database is poor and there is a lack
of inter-ministerial cooperation, compliance monitoring and enforcement of water quality licence
conditions.
4.3.3 Environmental Impacts and socio-economic consequences:
4.3.3.1 Eutrophication
Environmental Impacts:
Increases in nutrient content through poor water quality can result in the following impacts on the
aquatic ecology of the water body:
Ę Rapid population growth of a few fast-growing, adaptive species;
Ę Increase in alien plants;
Ę Decrease in natural species diversity;
Ę Development of algal blooms;
Ę De-oxygenation of the water due to the aerobic decomposition of organic matter
by micro-organisms;
Another effect caused by nutrient enrichment in rivers and dams is the prolific growth of reeds. While
reed growth has the beneficial effect of taking up and thus removing nutrients from the system, it also
can clog up water courses, thus reducing flow velocities and causing sediment deposition. However, slow
moving, clear water is conducive to algal growth and therefore a side effect of reed growth may also be
algal development. Under virgin flow conditions, reed growth in a water course could normally be
expected to be controlled by regular annual floods, but in a system, such as the Vaal, which is highly
regulated, the smaller `flushing' floods do not occur with the same frequency and therefore reed growth
is allowed to continue unchecked.
Socio-economic consequences:
Socio-economic consequences of eutrophication include:
Ę Loss of amenity value of the river and dams. The presence of algae interferes with activities such
as boating, fishing, bird watching and swimming;
Ę The presence of algae is unsightly;
Ę Decaying algae presents a bad odour and imparts a foul taste to the water;
Ę Costly and complex filtration and purification processes are required at water treatment plants to
remove the taste and odour of algae from the water. These costs are then passed on to the user
through higher water tariffs;
Ę Some types of blue-green algae are highly toxic and can result in significant human health effects
and stock deaths;
The presence of algae in a water body means a loss of potable water for rural communities and river
tourists who rely on the river for potable water.
130
Priority transboundary problems
4.3.3
4.3.3.2 Salinity
Environmental Impacts:
Changes in TDS caused by deteriorating water quality affects ecosystems negatively.
Plants and animals possess a wide range of physiological mechanisms and adaptations to maintain the
necessary balance of water and dissolved ions in cells and tissues. This ability is extremely important in
any consideration of the effects of changes in TDS on aquatic organisms. Changes in the concentration
of TDS can affect aquatic organisms at three levels:
Ę Effects on, and adaptations of, individual species;
Ę Effects on community structure; and
Ę Effects on microbial and ecological processes such as metabolic rates and nutrient cycling processes.
The rate of change in TDS concentration, and the duration of change, appears to be more important
than absolute changes in the TDS, particularly in systems which may not be adapted to fluctuations in
salt load. Thus organisms which are adapted to low-salinity habitats are generally more sensitive to
changes than those with a higher tolerance range (National Directorate: Water Resource Planning, 1996).
Socio-economic consequences:
The socio-economic effects of increasing salinisation are considerable:
Water purification costs increase dramatically. In 1984, it was calculated that for every increase of 100
mg/l in TDS in the Vaal River, it would cost R78 million per year in water purification costs (Davies and
Day, 1998).
Increased water salinity can have several severe consequences for irrigation agriculture, such as:
o Reduced crop yield;
o Impaired crop quality;
o Limitation on viable crop types.
o Soil salinisation
o Damage to irrigation equipment (du Preez et al, 2000).
The situation has become so bad that there are concerns in the Lower Vaal WMA over the long-term
sustainability of irrigation farming due to reduced yields in certain crops and the withdrawal of other
profitable crops due to the salt tolerance levels being exceeded (Viljoen and Armour, 2002).
High salt loads can also negatively affect industrial users. High levels of calcium can cause scaling
to equipment, while high sulphate, sodium and chloride levels can result in corrosion. Furthermore, some
industrial processes are sensitive to water quality and have to use desalination plants to purify the water.
Thus an increased salt load in the raw water used by industries will result in higher unit costs of production.
For example, the water quality in the Vaal Barrage is so poor that major industrial users, such as Sasol,
Mittal Steel and Eskom rely on Vaal Dam water instead, which entails additional water transfer costs
and places a further demand on Vaal Dam (National Directorate: Water Resource Planning, 2006).
131
Priority transboundary problems
4.3.4
4.3.3.3 Heavy metals
Environmental Impacts:
The consequences of heavy metal pollution for aquatic biota include a reduction in biodiversity and
species richness, changes in species composition resulting in the selective elimination of less tolerant
species, Irreversible damage to vertebrates, and bio-accumulation up the food chain, with piscivorous
birds such as herons, kingfishers, ducks and some raptors being the most affected.
Socio-economic consequences:
The socio-economic impacts of heavy metal pollution are diverse:
Ę High metal loads increase the cost of water treatment;
Ę There are significant health risks associated with direct heavy metal uptake through untreated
drinking water, or more likely, through the gradual accumulation of metals from diverse sources
e.g. the skin of treated fruits and vegetables, inhalation of particulates, the consumption of
fish and so on;
Ę The cost of water treatment for those industries requiring pure water results in higher unit costs
of production.
4.3.3.4 Persistent Organic Pollutants (POPs)
The environmental effects of POPs (on all organisms, including humans) include:
Ę Impaired reproduction and development;
Ę Immuno-suppression;
Ę Cancer;
Ę P-450 enzyme induction and adrenotoxicity;
Ę Endocrine disruption.
4.3.4 Causal chain analysis
A causal chain analysis (see figure 29) for various aspects of water quality was conducted during the
Gobabeb Workshop (15-18 May, 2007). The aim of the analysis is to obtain a better understanding of the
immediate, underlying and root causes of the problem so that management intervention can be directed
at dealing with the causes of the problem rather than the effects or impacts.
The main cause of microbiological pollution and disease pathogens is the presence of untreated or
partially treated sewage in river water. The main causes of the problem include inadequate government
funding to provide basic sanitation and water-borne sewerage in informal settlements, and inadequate
skills and capacity at local government level to properly operate waste water treatment plants. In the
case of tourism, there appears to be a lack of coordinated planning to deal with the cumulative effects
of river-based tourism operations, especially along parts of the mid-Vaal and the Lower Orange River
which are popular reaches for canoeists.
The major problem with POPs is the lack of data in the Basin states which can allow a meaningful
understanding of the problem and its causes. Again, the root causes can be ascribed to the lack of an
effective enforcement and monitoring inspectorate, high costs of imported technology to deal with
complex pollutants such as PCBs and a general lack of public awareness of the issues.
132
Priority transboundary problems
4.3.4
One of the key factors contributing to heavy metal pollution is the lack of knowledge of the problem due
to a lack of monitoring data. The collection of water samples for heavy metal analyses needs certain
protocols to be followed and the cost of analysis is expensive. There is also a general lack of enforcement
and control on potential polluters by DWAF caused by a lack of government funds for an effective
133
Priority transboundary problems
4.3.5
inspectorate and prosecution of offenders. It is also clear that a significant amount of heavy metal
pollution is caused by poorly located landfills and sewage sludge disposal sites. This has to be attributed
to a failure in planning at local government level.
The causes of radio-nuclide contamination in water can mainly be ascribed to a lack of adequate
environmental management and control in the mines (mostly gold and uranium) and at other industrial
sites where radio-active materials may be produced or stored.
4.3.5 Knowledge gaps
While there is a reasonably good understanding of the degree and extent of eutrophication and salinity
in the Vaal catchment, the relatively few monitoring points upstream of the Gariep Dam in Lesotho and
downstream of the Vanderkloof Dam, means that the degree of understanding of these water pollution
issues are less well known at the upper and lower ends of the Orange-Senqu basin.
There is no formal basin-wide monitoring by DWAF of some of the other potential transboundary water
quality issues identified during the Morula Workshop (Task Team, 2007a), namely: heavy metals, POPs,
radio-nuclides and temperature. Some companies and/or organisations do monitor some of these aspects
on a routine basis, but the results are hard to obtain and would be difficult to calibrate and compare
even if the data were available. It would appear from the literature that POPs and heavy metals are
present in sediments at the Orange River Mouth, suggesting some transboundary movement, which, given
the fact that all the Basin states have ratified or acceded to the Stockholm Convention on POPs, is
disturbing.
4.3.6 Summary and recommendations, including potential short- and medium-term SAP interventions
Legal and Policy Frameworks: Both Lesotho and South Africa have adequate legal and policy instruments
to govern water quality management in their respective countries, however in Lesotho, pollution control
falls under the Environment Management Act and not the Water Resources Act, which complicates
matters. Namibia is still operating under an outdated law (Water Act, No 54 of 1956) which has been
replaced by a new Act which has yet to be gazetted.
Institutional and Administrative Systems: All three countries22 lack institutional capacity to effectively
manage water quality in their respective countries. The lack of capacity is particularly acute in relation
to compliance monitoring and enforcement of water licence conditions. In Lesotho there is poor
definition of responsibilities and areas of jurisdiction between the urban and rural water supply
authorities, while a similar situation exists in Namibia. South Africa has adopted an Integrated Water
Resources Management (IWRM) approach to water and to this end, aims to devolve management down to
the catchment level. However, due to a shortage of skills, the implementation of the Catchment
Management Authorities (CMAs) will take time. In the meantime, management responsibilities are carried
out at the level of regional offices.
Monitoring networks and databases: In Lesotho and Namibia, the water quality monitoring networks
are poorly developed and there are no formal sampling networks or water quality databases.
134
22 Botswana is excluded because it has no surfac water courses and therefore no water quality monitoring network
Priority transboundary problems
4.3.6
Data is, therefore hard to obtain and the quality of such information is often dubious due to variability
in sampling protocols, laboratory analyses and the constituents analysed. What data there is tends to be
confined to basic water quality parameters such as pH, TDS and common cations and anions. The water
supply authorities also analyse for microbiological indicators but the results in Lesotho are highly
questionable. South Africa has a more sophisticated and extensive monitoring system, but there are still
a number of deficiencies in the data sets, the extent of the network Ł especially along the Lower Orange
and in some of the more polluted sub-catchments of the Vaal River, as well as the number of
determinants monitored. Of particular concern here is the lack of information on heavy metals and POPs
in the catchment.
Water Quality in the Vaal Catchment: The DWAF, 2006 study found that the increase in salinity (and
related macro ions) has had the greatest impact on the usage of water in the Vaal River. The increase in
TDS and concomitant increase in constituents such as chloride and sulphate, has had major implications
for domestic, industrial and agricultural water use. The localised occurrence of microbiological
pollutants is also an emerging concern, as well as elevated levels of certain metals. Eutrophication is the
other key water quality problem in the Vaal River System. This problem has resulted in excessive algal
blooms and growth of water hyacinth. Eutrophication has resulted in significant economic implications
for users. The effects of algal blooms on water treatment processes and the quality of potable water may
yet increase in significance.
While the upper part of the catchment has water of fairly good quality, the areas of concern include the
Vaal Barrage, Middle Vaal River, and Lower Vaal River downstream of the Harts River confluence, where
TDS levels are high. Of further concern is the impact of high TDS concentrations on downstream water
users below the Vaal Barrage and those abstracting water from the Barrage. There are several sub-
catchments which are of concern due to their contributions to the deteriorating water quality of the Vaal
River. These include the Waterval, Suikerbosrand, Rietspruit, Klip River (Gauteng), Mooi River,
Koekemoerspruit, Schoonspruit, Vierfontein, Sand, Vet and the Harts River Catchments.
These
catchments must develop water quality management strategies to manage the impacts originating from
them, thereby alleviating the stress currently being placed on the Vaal River.
Water Quality in the Upper Orange River Catchment (upstream of the Vanderkloof Dam): The water
quality in the main stem of the Senqu River (as the Orange is known in Lesotho) and its tributaries is
generally very good, but soil erosion resulting from over-grazing (Plate 8), uncontrolled burning,
cultivation on steep slopes (Plate 15) and alluvial diamond mining (Plate 16) is leading to increasing
turbidity in some rivers. Furthermore, there is no formal sanitation in the rural areas and therefore
water-borne diseases such as gastroenteritis and dysentery are locally common. Rapid migration to the
towns in the Lesotho Lowlands, mostly along the Caledon River and its tributaries, is also placing great
stress on the water quality due to the lack of, or poorly maintained sewerage infrastructure in urban
areas and uncontrolled effluent discharges from industrial areas. Eutrophication and microbiological
pollution are, therefore, the primary water quality issues in the Upper Orange Catchment.
Water Quality in the Lower Orange River Catchment (downstream of the Vanderkloof Dam): In spite
of extensive irrigation agriculture along the banks of the Lower Orange River and a cluster of settlements
in the Upington area, a WRC study found that the water quality of the Lower Orange River between
135
Priority transboundary problems
4.3.6
Boegoeberg and Onseepkans is still good, with limited potential for salinity and sodicity problems and
almost no toxicity problems at all (Volschenk, Fey and Zietsman, 2005). However, there are localised
areas where eutrophication is evident along this stretch of the river. The water quality downstream of
Onseepkans remains of good quality, but salinity increases towards the river mouth as a result of tidal
influences and increasing aridity and evaporation (Plate 17). The quality of water in the ephemeral Fish
River is unknown due to a lack of sampling, but salts are known to be building up in the soils of the
Mariental irrigation scheme, which may be flushed out during high flows (Plate 18).
Transboundary Impacts: The major sources of pollution Ł salinity, eutrophication, acid mine drainage,
heavy metals and radionuclides - lie in the Vaal catchment, which is effectively operated as a closed
system, except during periods of high flow. This means that the potential for pollution from the industrial
heartland of South Africa to affect Namibia is apparently very low. This is, however, not the comforting
situation it appears to be; there are millions of tonnes of salts held up in the major irrigation areas e.g.
the Vaal-Harts scheme and the Sand-Vet catchment which could be released downstream once the
assimilative capacity of the soils is reached.
It is also not clear from the data and limited research undertaken whether there is any transboundary
movement of heavy metals and persistent organic pollutants. A study by Vosloo and Bouwman (2005)
found traces of listed POPs in the sediments of Alexander Bay. Given the fact that they also found
elevated levels of POPs in sediments of one of the main tributaries of the Vaal River, could mean that
there is some transport of these organic compounds through sediment transfer, especially under high
flow conditions. However, there is so little data available that it is difficult to draw any definitive
conclusions. This is one of the areas which needs a considerable amount of further research (see Table
20 below).
Apart from the Vaal, there are localised pockets of severe eutrophication in the Orange-Senqu
catchment, but again there is insufficient data to determine the extent of transboundary transfer of
pollution e.g. along the Caledon River where is forms the boundary with South Africa; downstream of
Lesotho along the Orange; and downstream of the Upington irrigation area to Namibia.
Recommendations for Short- and Medium-term SAP Interventions
Institutional and Administrative Systems
The causal chain analysis identified a number of common underlying causes for pollution relating to
inadequacies in institutional and administrative capacity:
Ę Shortage of skills and manpower in the water authorities to monitor and enforce compliance
by industries, mines, waste water treatment plants etc;
Ę Shortage of agricultural extension officers;
Ę Shortage of experienced technicians to effectively manage waste water treatment plants;
Ę Shortage of manpower and resources at local government level to maintain, upgrade or install
sewerage systems in urban areas;
Ę Lack of inter-ministerial cooperation between authorities responsible for pollution control
e.g. mines, energy, environment, agriculture etc.;
Ę The Basin authority, Orasecom, does not yet operate at a functional level.
136
Priority transboundary problems
4.3.6
Increased funding is required at central, Provincial and local levels to:
Ę Increase manpower resources in all departments and Ministries responsible for water pollution
control and enforcement;
Ę Provide suitable systems, equipment and vehicles for effective monitoring and enforcement;
Ę Provide capacity building and awareness training of key pollution issues;
Ę Provide sewerage infrastructure in urban areas currently without, and to maintain and upgrade
sewerage infrastructure in areas where the current systems cannot cope with increased loads.
Set up inter-ministerial committees to work cooperatively on a broad-based, holistic approach to
pollution management and control;
Provide Orasecom with sufficient powers to ensure cooperation and collaboration between the Basin
states to manage transboundary pollution issues.
Monitoring networks and sharing of data
During the analysis of the water quality data collected in the Orange River Basin, a number of issues
related to data collection were identified:
Ę Data collection is fragmented between countries and institutions;
Ę The locations of some of the water quality monitoring points are not optimal;
Ę There are insufficient sampling points and datasets in Lesotho, downstream of Upington and on
the Fish River in Namibia;
Ę The water quality variables analysed for are not consistent between institutions;
Ę There are not enough accredited analytical laboratories in the region, especially Lesotho and
in the Northern Cape region;
Ę There are no laboratories in the region capable of analysing some of the listed POPs e.g. PCBs.
Ę The sampling frequency and the water quality variables analysed for are insufficient to manage
the Orange River Basin successfully, especially heavy metals, POPs and radio-nuclides;
Ę There is no single or standard data management and reporting system;
Ę Information is difficult to obtain and there are no formal data sharing arrangements
between countries;
Ę Lack of information on discharge volumes and qualities from sewage treatment works, mines and
industries (Golder Associates, 2006).
A coordinated monitoring programme needs to be developed to address:
Ę The establishment of monitoring objectives;
Ę The monitoring point locations;
Ę Frequency of monitoring and water quality variables to be tested for;
Ę The current network of continuous water quality monitoring stations needs to be reviewed
and expanded. In designing the system consideration should be given to real time management
of both water quality and quantity;
Ę Database systems, data management, data sharing and access, and reporting;
Ę Accident and pollution warning system;
Ę Institutional responsibilities and implementation programme.
A series of workshops involving the major role players is the approach recommended to achieve the
objectives listed above.
137
Priority transboundary problems
4.3.6
Once an agreed monitoring programme has been developed, it should be run and managed by Orasecom
according to a formal agreement between the countries.
Integration of Receiving Water Quality Objectives (RWQOs)
The RWQOs are being set in isolation in priority catchments. The integration of the RWQOs for the Vaal
River is being addressed in the Integrated Water Quality Management Plan (IWQMP) that is being
developed by the South African Department of Water Affairs and Forestry. The links between the Vaal and
the Orange, the Caledon and the Orange and the Fish and the Orange Rivers need to be addressed.
RWQOs need to be set for the Senqu River and each of its main tributaries in Lesotho, discrete reaches
of the Orange River downstream of Vanderkloof Dam, as well as for the Fish River in Namibia. This needs
to be done through a series of stakeholder workshops in each of those catchments, with input from
representatives from all countries to ensure that the RWQOs are properly integrated.
Eutrophication
There are three main causes of eutrophication in the Basin:
Ę Non-compliant effluent discharges from waste water treatment works, industries and mines
(point and non-point sources);
Ę Non-point urban runoff;
Ę Non-point agricultural runoff.
The problem is exacerbated by a lack of understanding of the fate of nutrients once they are discharged
to the river. The pathways for the nutrients, organics and algae growth need to be better understood
(Golder Associates, 2006).
The most important intervention required is to prevent pollution at source, especially from the WWTWs.
This requires a combination of:
Ę Plant upgrading to cope with larger volumes of waste water;
Ę Improved plant maintenance;
Ę Installation of sewerage infrastructure or other appropriate technologies e.g. constructed wetlands,
in areas where there is none;
Ę Maintenance and upgrading of existing sewerage infrastructure;
Ę Raising awareness of the problems through skills training and capacity building at local
government level;
Ę Raising awareness amongst farmers to reduce the use of excess fertilisers and to apply better
methods of fertilisation.
In addition, a planning level nutrient model needs to be developed and set up for the Orange River Basin.
The model should allow for cause and affect modelling so that nutrient management strategies can be
developed. The Vaal Barrage catchment is the most impacted and the largest source of nutrients.
A pilot scale project to determine the fate of nutrients within this catchment is proposed. If the pilot
scale project proves to be successful the model can be rolled out to the entire catchment
(Golder Associates, 2006).
138
Priority transboundary problems
4.3.6
Salinity
There are three main causes of salinity in the Basin:
Ę Non-compliant effluent discharges from waste water treatment works, industries and mines
(point and non-point sources);
Ę Non-point urban runoff;
Ę Non-point agricultural runoff.
In addition, reduced flows result in less dilution of the salt load.
The most effective way of treating highly saline discharges is source control, as once salts enter the
water system, they are very costly to remove (DWAF, 2006). This will involve all the strategies listed
above for eutrophication, as well as an investigation into industrial technology to remove salts prior to
discharge.
Projects are being initiated by the South African Department of Water Affairs and Forestry and the Water
Research Commission in South Africa to address the mine closure and water management issue (Golder
Associates, 2006).
A study is required to assess the effects of lower flows in the Orange-Senqu as a result of the LHWP and
its impact on dilution in the Gariep and Vanderkloof dams.
Heavy metals, POPs, and radio-nuclides
There is extensive irrigation practised in the Vaal and Orange Rivers where herbicides and pesticides
are used. These could be present in the return flows and conveyed in the surface runoff to the river
systems. The current water quality database does not support the identification of pesticides and
herbicides in the river water or sediments.
A range of heavy metals are present in industrial and mine effluent discharges, but the monitoring
network does not analyse for these elements in the water column or sediments of the affected rivers.
Given that all the Basin states have ratified or signed the Stockholm Convention on POPs, a study is
urgently required to investigate the occurrence of heavy metals, POPs, radio-nuclides and other organic
pollutants in the Basin. A long-term monitoring programme should be initiated using sediment, water
and fish samples to determine loads. Once the problem has been quantified, a risk assessment should be
done to determine exposure pathways and human and ecological health risks.
139
Priority transboundary problems
4.4
4.4 Land Degradation
The Orange-Senqu basin is one of the most modified and degraded in southern Africa. The wise
management of the terrestrial parts of the basin has historically received little attention. Inappropriate
management has contributed to reduced performance of the catchment in terms of a reduction in water
yield, deteriorating water quality, increased sediment loads as a result of erosion due to poor rangeland
management and cropping practices, a loss of biodiversity and lowered land productivity, all of which
have led to socio-economic hardships, and invasion by alien plant and animal species. Given the Orange
River system's ecological and socio-economic importance in southern Africa, it is self evident that this
system deserves the combined attention of the basin states to address its ecological condition as a
matter of priority.
4.4.1 Description of the problem and a justification of its transboundary importance
Most of the land in the Orange River basin consists of:
Ę Freehold farmland, mainly in South Africa and Namibia;
Ę Communal farmland, in Lesotho, Botswana, parts of Namibia and small pockets in South Africa;
Ę Protected areas, in all four countries, representing a remarkably small component of the basin;
Ę Urban and industrial areas, particularly in the Vaal catchment in South Africa;
Ę Mining areas, in all countries except Botswana.
Rangeland degradation is a significant threat to sustainable land management and biodiversity
conservation. Rangeland degradation manifests itself in two contradictory forms: loss of vegetation
cover on the one hand and bush encroachment on the other. In the south of Namibia, Lesotho and parts
of South Africa, the former is by far the dominant expression of degradation, while in Botswana (and
possibly the adjacent areas of South Africa) bush encroachment is listed as a significant challenge. Loss
of vegetation cover is perhaps the most obvious indicator of rangeland degradation, ranging from the loss
of grass species diversity and perennial grasses, a loss of grass vigour to a loss of ground cover, decreased
soil moisture, soil crust formation and declining land productivity leading to increasing vulnerability to
drought. There are generally two interrelated causes for loss of vegetation cover: overstocking - which
describes the situation where more animals are kept on a certain piece of land than there is fodder
available to feed them; and overgrazing Ł which is caused when animals are concentrated in one specific
area for too long, resulting in over use of the vegetation with inadequate recovery time. Open access to
land, unsuitable distribution of water and boreholes, lack of institutional mechanisms and management
skills are all major factors for the latter.
Deforestation is the second major form of land degradation, and refers to the removal of woody
vegetation cover. Its consequences are loss of habitats and biodiversity, changes in hydrological and
nutrient cycles, and reduction in carbon sinking capacities. Deforestation is most prevalent in Lesotho
and along the riparian belt of the middle and lower Orange River, because of the limited woody resources
in the more arid areas and because of clearing for agricultural purposes. The predominant fuel for
cooking, heating and lighting in communal areas and in low income urban areas, remains fuelwood.
Another set of threats relates to soils: the predominant factors of soil degradation are soil erosion due
to wind and water and declining soil fertility and loss of soil organic matter.
140
Priority transboundary problems
4.4
Soil erosion due to wind and water factors occurs when top soil is blown or washed away by wind or
water (i.e. heavy rainfalls) mainly in areas of poor rangeland management. It leads to the removal of top
soil thus decreasing land productivity. It is widespread in arid and highland areas where soils tend to be
fragile, vegetation cover is naturally fairly sparse and regeneration times are slow due to low moisture
and cold conditions respectively.
Declining soil fertility and loss of soil organic matter refers to the deterioration in the quality of soils
due to loss of nutrient and water retention capacity and leads to loss of soil fertility and ability to
support plant life, which in turn exacerbates vulnerability to wind and water erosion. The soils in arid
areas generally have low natural fertility, are humus-poor, shallow, sandy and stony and have low water
retention capacity. These characteristics impact on the natural soil condition, making it more prone to
fertility degradation. Small-holder cultivation and large-scale irrigated agricultural projects are major
causes of soil productivity loss.
Perhaps the earliest impacts on the resources of the basin was the general elimination of most of the
large mammals, first through hunting and later as a consequence of farming and fencing. Overgrazing
by livestock has damaged rangelands and wetlands in large parts of the catchment, causing erosion and
changes in species composition. Soils in Lesotho are classed as Mountain Black Clays and are derived
from basalt lavas. At high altitude the soils are shallow and easily eroded by cultivation and overgrazing.
During summer, soils on the summit become waterlogged and in winter they usually freeze, increasing
their susceptibility to erosion. Most of the Orange River basin is covered by sands or weakly developed
soils, with the exception of the Vaal catchment. With the exception of mainly the Kalahari component,
most of the basin is classed as at medium to high risk of soil erosion.
In the area of water management, over-abstraction of water has immediate implications for the natural
environment given the intricate relationship between nutrient and water cycles. Disrupting these cycles
through, for example, inappropriate irrigation methods, leads to reduced soil fertility and productivity
through loss of nutrients and/or salinisation and water logging. Lowering of groundwater levels hampers
the ability of plants to take up water and leads to the desiccation of springs and, consequently,
destruction of habitats. Furthermore, it may reduce fluid pressure in confined/artesian aquifers and
cause aquifer deformations through the compaction of geological material. An essential basic additional
`use' of water, often not accounted for in water consumption breakdowns, is the ecological reserve of
water needed to sustain critical wetland and terrestrial ecosystems.
Cropping along river courses has caused a loss of riparian vegetation, introduced nutrients and pesticides
into wetlands via back-flows and increased salinity levels. Alien plants and animals have invaded
ecosystems. And levels of pollution and salinity have increased dramatically in some stretches as a result
of industry, mining and urbanization. The ecological condition of the Orange River is deemed to be
significantly impacted and to be on a generally negative trajectory.
Some of this is a legacy of the past (land tenure and land distribution) others arising from present policy
preferences which adhere to a development paradigm where agriculture is the main land and water use
and is generally (but incorrectly) seen as an engine of growth and poverty eradication. The linkages,
however, are clear. Poverty, inappropriate management, lack of skills and local institutions,
141
Priority transboundary problems
4.4
inappropriate policies, pricing systems and incentives all lead to land degradation. This in turn leads to
increased pressure on the land which leads to further degradation and a downward spiralling of lowered
land productivity and poverty. Given these inter-linkages, combating land degradation in new and
innovative ways must form an integral part of any feasible poverty reduction strategy as well as any
sustainable development strategy.
Country-specific land degradation is discussed below23 :
Lesotho
The biodiversity and conservation challenges of the headwaters of the Orange River are essentially those
of Lesotho as a nation. The vision of Lesotho in biodiversity planning is to "have a country rich in
diversity of life and life forms, economically prosperous, environmentally conscious, and people who
are in balance with their natural environment, caring, appreciating and understanding the complexities
of nature, while deriving benefits from the conservation and sustainable use of its diversity of life".
Some 70% of the globally recognized biodiversity hotspot of the eastern Drakensberg-Maloti mountains
falls within Lesotho, important for its high altitude flora, estimated at about 3,100 species of which 30%
is endemic to the mountains. This endemic zone also supports an extensive network of high altitude
wetland bogs and sponges, crucial in the hydrological cycle of the Orange River. Their retention and
slow release of water helps stabilize stream flow, attenuate floods, reduce sedimentation loads and
absorb nutrients. Most of the large mammals of Lesotho were eliminated over a century ago, although a
few antelope species survive in protected and isolated areas. A few well know endemics include the
endangered Maloti Craig Lizard, Ice Rat, Umbruculate Frog, Maloti Minnow, rare and endangered Water
Lily and the Spiral Aloe, all montane and alpine species. Also iconic to this region is the Bearded Vulture.
At the present time, just some 0.4% of Lesotho is protected, with the Sehlaba-Thebe National Park
dominating at 6,475 ha. A further four areas are under proclamation, which will bring the Lesotho
protected area network to 0.7%. There are also two trans-frontier initiatives with South Africa underway,
the Maloti-Drakensberg Trans-frontier Conservation and Development Area Programme and the Let_eng-
la-letsie Wetlands Protected Area in southern Lesotho.
The main threats to biodiversity and ecosystem stability in the Orange River catchment in Lesotho are:
Ę Rangeland degradation through overgrazing. Lesotho is an egalitarian society and in the rural areas
access to land is unrestricted. Grazing land is therefore open-access and common property, which
means that sustainable management practices are seldom in place and difficult to enforce. Group
grazing schemes known as Range Management Areas have been introduced, but in most areas the
range is overstocked. Sponges and grasslands become degraded, species diversity declines and soil
is exposed to wind and water erosion. The steep terrain and harsh climatic conditions, particularly
at high altitude, have created a fragile ecosystem yet one that is vitally important to the
maintenance of one of southern Africa's most important wetland and river systems;
Ę Less than 10% of the land in Lesotho is suitable for cultivation. Because of human population
pressure (2 million people and annual population growth of 2.6%) large areas unsuited to cultivation,
including steep slopes in the highlands, are being ploughed and cropped. Severe soil erosion is
evident, with large dongas and rivulets;
142
23 Note that there are some repetitions in this text with sectio 3 of the TDA report
Priority transboundary problems
4.4
Ę Some 90% of household energy is derived from fuel wood, from dung and from crop residue, such as
maize husks. The pressure on woody vegetation has led to severe deforestation throughout most of
Lesotho, with associated exposure of soil and riparian belts and resulting erosion;
Ę The development of large dams in the highlands, with a predicted increase in pest species such as
blackfly, decline (to possible extinction) in the Maloti Minnow (Pseudobarbus quathlambae) and
explosion in rodent populations.
South Africa
By far the largest proportion of land within the Orange River catchment lies within South Africa (64%)
amounting to over 5.7 million ha. Habitat types range widely from alpine vegetation in the eastern
highlands adjacent to Lesotho, various types of grassland, to a variety of Karoo and false Karoo
vegetation types in the arid western regions. High levels of urbanisation and industrialisation in many
areas of the Vaal and Orange River catchments has meant that land has been altered extensively. Urban
settlements, agriculture, mining and rural settlements dominate the riparian zone along the river and
its main tributaries, and consequently very little pristine habitat exists. Land is largely privately owned,
with the agriculture and mining sectors owning and using the highest proportion.
With irrigation and dry-land crop production dominating much of the central basin, land degradation
through inadequate land management is the largest threat to terrestrial ecosystems within the basin.
Priority areas are: (i) the upper reaches of the Orange River and its tributaries where gradient and soil
structure are most likely to cause erosion of land and sedimentation of the rivers, and (ii) the arid lower
reaches of the basin where poor land management will impact negatively on threatened ecosystems.
Irrigation and dry-land crop production of cash crops such as maize, wheat and sunflower are extensive
in many of the middle parts, while stock farming utilizes most of the remaining central parts of the
basin, which comprise mostly natural grasslands. To protect crops against flooding, levies have been
constructed in many parts of the river valley, which disturb the ecology of the floodplains, and prevent
natural flooding of systems which require it for survival.
Mining occurs most notably in the Vaal Basin, and the lower Orange River to the mouth, further altering
many habitats within the basin. Effective rehabilitation and environmental management by larger mining
companies has reduced impacts to some degree. Small-scale mining of alluvial diamonds along the lower
Vaal and lower Orange River has had a significant impact on river banks and riparian vegetation.
Although regulations largely restrict mining on river-banks, poor enforcement and lack of capacity to
regulate small mining operations have not been able to curb this problem. Extensive earth-moving
activities with minimal rehabilitation or environmental considerations have degraded much of the habitat
along the rivers.
Riparian vegetation has been notably disturbed along the Orange River and most of its tributaries. The
dominance of riparian woody species such as Cape willow (Salix mucronata), buffalo thorn (Ziziphus
mucronata), wild olive (Olea europaea) and white karee (Rhus viminalis) have been compromised through
a combination of the following factors:
143
Priority transboundary problems
4.4
Ę Clearing for small-scale alluvial mining
Ę Wood fuel collecting for cooking and building material
Ę Agriculture on the river banks
Ę Colonisation by alien species.
Much of the Upper and middle Vaal catchment areas are highveld climax grassland habitats, which have
been greatly transformed through commercial agriculture and urbanisation. The remaining grasslands are
one of the most threatened habitats in South Africa, and conservation efforts have recently been
initiated to preserve them. The Orange River Broken Thornveld, and False Orange River Broken
Thornveld, both habitat types in the lower Orange River valley of South Africa are regarded by
conservationists to be priority areas for protection. The lower Orange River basin also contains parts of
the succulent Karoo ecosystem. This ecosystem contains the highest diversity of arid flora globally, and
is a declared biodiversity hotspot. Conservation activities within the ecosystem are co-ordinated by the
Succulent Karoo Ecosystem Programme (SKEP). The organisation has identified the spread of alien plants
along the Orange River as a significant threat to the biodiversity of the area.
Increased invasive alien species are a significant contributor to land degradation. The more arid part of
the basin (the lower Orange River area) is particularly impacted by growing numbers of mesquite
(Prosopis spp.). Dense stands of alien species on river banks and floodplains have reduced basal
vegetation cover, causing erosion of the clayey soils. The link between land degradation and alien
invasives is further explored as part of the causal chain analysis for both problems.
Protected areas in the South African part of the Orange River Basin make up just 3% of the area of the
basin in South Africa. Of this, one park Ł the Kalahari Gemsbok Park Ł makes up 80% of the area, and this
park is functionally peripheral to the Orange River system. This is a remarkably small proportion of land
given that protected areas make up some 10% of South Africa and that the Orange River basin comprises
about 50% of the country. Two main trans-frontier areas in the basin are the subject of international
treaties, the Kgalagadi Trans-frontier Park with Botswana and the \Ai-\Ais Ł Richtersveld Trans-frontier
Park and Conservation Area with Namibia.
Areas around major dams in the Orange River basin are protected as provincial nature reserves. These
reserves, such as Rolfontein and the Gariep Dam Nature Reserve, are utilised for recreation and
conservation, with wildlife having been introduced to restore populations of locally extinct species as
part of provincial biodiversity conservation objectives.
The Orange River mouth carries the status of a Ramsar wetland site as a result of its high number of rare
or endangered species, particularly relating to waterfowl, and its uniqueness as an ecosystem within
the hyper-arid bioregion. Through changes in the flow of the river, and particularly the impacts of mining
at Alexcor, it is considered to be in a highly degraded state. Recent initiatives by the Northern Cape
Department of Conservation, Environment and Land in co-operation with the Namibian Ministry of
Environment and Tourism have started to rehabilitate the wetland and provide it with statutory
protection.
144
Priority transboundary problems
4.4
Botswana
Some 7 million ha of land in south-western Botswana falls within the Orange River basin. This area
comprises the ephemeral Molopo / Nossob system within the Southern Kalahari, a large sand-filled basin
of mainly linear dunes and interspersed pans. The area consists of a generally open lightly wooded
sandveld savanna comprising a number of sub-vegetation types. It falls within the southwest arid
biogeographic zone which covers a large part of semi-arid southern Africa. While a high proportion
of species are endemic to this large zone, local level endemism (e.g. in the Molopo Basin) is
extremely low.
While local surface flows occur in the Molopo / Nossob fossil drainage system after good rainfall events,
the Molopo has not reached the Orange River in the past 1,000 years. Groundwater is exploited via the
Tsabong Groundwater Resources project. While official reports suggest that the environmental impact of
the project is minor, some concerns have been expressed regarding impacts on trees, possibly as a result
of declining groundwater levels.
About 66% of the Gemsbok National Park in Botswana falls within the catchment (approximately 1.74
million ha) plus parts of three Wildlife Management Areas with a combined size in the catchment of
about 1.2 million ha. The areas both within and outside the Park are rich in wildlife with estimates for
the overall park and relevant districts outside the park of: Gemsbok 43,000 and 21,000 respectively,
Springbok 15,000 and 84,000, Eland 9,800 and 3,000, Red Hartebeest 6,600 and 18,000, Wildebeest 4,400
and 8,500 and Ostrich 3,500 and 15,000. Community-based approaches to wildlife management are being
implemented in a number of areas within the basin in Botswana. This involves the establishment of local
management institutions, the awarding of group rights over wildlife (thereby avoiding a "tragedy of the
commons" situation24 ) and the creation of incentives for sustainable use of wildlife resources. Both
conservation and economic benefits result from this policy approach for local people, who live in the
catchment districts at a density of about 0.7 people per km2.
The main form of land-use in the catchment is traditional livestock rearing. Botswana's national
Biodiversity Strategy and Action Plan lists unsustainable rangeland management from localized
overgrazing as a significant cause of biodiversity loss and habitat destruction and as a major national
challenge. Over-harvesting of natural resources and excessive groundwater abstraction are two other
major challenges.
Namibia
There are five catchments recognized in Namibia that form part of the Orange River system.
They drain the central and eastern parts of southern and central Namibia, as follows:
Ę Fish River catchment;
Ę Auob system, which has its confluence on the South Africa-Botswana border with
Ę The Nossob system; and
Ę Two small catchment areas in the extreme south and south-east of Namibia (Figure 5).
The Fish River is the only system that provides any significant volumes of water into the Orange River
(on average about 480 million m3/a) and this is highly variable because of the arid and unpredictable
24
145
Communal areas often get degraded as a result of fragmented or poor ecosystem management
Priority transboundary problems
4.4
rainfall in southern Namibia. Median annual rainfall ranges from just on 300 mm in the north-eastern part
of the Namibian catchments to less than 50 mm in the extreme south west along the Orange River. Most
of this zone (about 75%) receives less than 200 mm. Rainfall is also highly variable and the highest
evaporation rates in Namibia are experienced in this zone (up to 2.7 m per year).
The southern regions of Namibia contain four desert systems, three of which are drained by the
catchments of the Orange: the Succulent Karoo in the extreme south west, the Nama Karoo in the central
and southern parts, and the Southern Kalahari in the east, the last consisting of a deep layer of wind-
blown sand, with little run-off from rainfall. In the northern and eastern parts of the catchments the
vegetation is semi-arid Acacia tree-and-shrub Savanna, giving way to Dwarf shrub Savanna southwards.
The human population is generally small in the Central-South parts of Namibia. It is estimated that about
170,000 people live in the various catchments of the Orange River in Namibia, with some 45,000 being
urban and about 125,000 rural. The rural population density is about 0.7 people/km2.
Most of the land in the catchments consists of freehold and communal farmland. The communal areas are
centred on Aminuis, Bersiba, near Karasburg and Warmbad. Apart from some very limited and intensive
crop production under irrigation near Mariental (Hardap Dam), at Naute Dam, along the banks of the
Orange River and along the ephemeral Auob River near the village of Stampriet, the vast majority of the
land is extensive rangeland livestock and wildlife farming within indigenous ecosystems. Cattle
predominate in the north, while mainly sheep and goats are farmed in the more arid south. The mean
carrying capacity (stocking biomass) of this zone is low, ranging from about 25 kg/ha in the extreme
north and east of the zone to less than 10 kg/ha in the south and west. Because of the low and highly
variable rainfall in this zone, the carrying capacity also varies considerably from year to year. As a result,
over 75% of the Central-South zone is rated as falling into an area defined as being at "high to very high
risk" for conventional farming.
Land under State Protected Areas (National Parks) in this zone includes the Huns Mountains/Ai-Ais/Fish
River Canyon Park complex, the extreme southern part of the Sperrgebiet National Park (approved by
Namibia's Cabinet as a protected area of some 2.6 million ha, but still to be formally gazetted), the
Naute Dam and Hardap Resort. The Ai-Ais Complex borders onto the Richtersveld Park in South Africa,
immediately south of the Orange River, and the governments of South Africa and Namibia have entered
into an agreement to develop them into a transfrontier conservation area to promote tourism, job
creation and conservation. In addition to the State Protected area network there are a number of
community and private initiatives that enhance biodiversity conservation in the zone. These include
conservancies, both on freehold and communal land, and private nature reserves. There are three
registered and one emerging communal conservancies in the Karas region, and a host of freehold
conservancies mainly in the Khomas and Gobabis areas. In addition, there are a growing number of large
private reserves running wildlife and tourism in the catchment. A recent initiative amongst some 14 local
landowners and the state (Ministry of Environment & Tourism) is currently exploring co-management
approaches to large landscape and biodiversity conservation and socio-economic development in the
"Greater Fish River Canyon Complex", an area of almost 1 million ha.
146
Priority transboundary problems
4.4.2
Over the past five years Namibia has undertaken a plethora of consultations, assessments and reviews
of the main environmental and sustainable development challenges facing the country, particularly in the
semi-arid and arid areas. The results from these consultative processes have been mutually reinforcing,
and the views of local land and natural resource owners and managers, support agencies (government and
civil society) and various specialists are well known, documented and largely in agreement. These
processes have fed into a range of national planning documents, including Namibia's second five-year
National Development Plan, the National Poverty Reduction Strategy and Namibia's 30 year Vision 2030.
Recent consultative assessments in the areas of the Orange River basin in Namibia reconfirm the earlier
findings. The main environmental challenges are as follows:
Ę Unsustainable land management practices, particularly
o Overgrazing
o "Deforestation" (loss of woody vegetation);
Ę Limited and limiting water resources, particularly
o Limited sources
o Poor management and infrastructure;
Ę Tenure rights over land and natural resources, with the need for full devolution to the lowest
appropriate level being paramount;
Ę Contradictory policies over land and natural resources;
Ę Need for diversification in land-use, going hand-in-hand with a need for enhanced
entrepreneurial skills;
Ę Limited capacity, skills and access to finances;
Ę HIV/AIDS.
A clear manifestation of these challenges is poverty and a poor quality of life, and an inability for rural
communities to extract themselves from the poverty trap.
4.4.2 Major environmental impacts and socio-economic consequences
The following are some of the main environmental consequences:
Ę Ecosystem integrity: Land degradation poses a risk to ecosystem integrity in fragile highland and
dryland environments, defined in terms of health, connectivity and stability, biotic and abiotic
components of ecosystems and the interconnectedness between them. This is likely to diminish the
ability of highland and dryland environments to supply vital ecological goods and services, including
climate regulation and water regulation. Efforts to stem loss of woody and other vegetation, and
loss of species diversity help maintain the capacity of soils to maintain moisture and reduce the
release of soil particulates into the atmosphere and run-off. This also helps to maintain air quality
and regulate climate.
Ę The loss of above- and below-ground biomass as a result of deforestation and the increase of
decaying vegetation matter on cleared land contributes to the release of GHGs and the reduced
capacity of ecosystems to function as a carbon sink.
147
Priority transboundary problems
4.4.2
Ę Watershed integrity is severely impaired through deforestation, loss of ground cover and related
forms of degradation. Ground water abstraction locations place additional stress on perennial rivers
in drylands which are all transboundary. In the long-term, uncontrolled abstraction is likely to have
downstream impacts, with economic and ecological consequences.
Ę In the Orange-Senqu Basin land degradation is impairing ecological functions and habitat quality in
critical ecosystems that contain biological diversity of global importance. These being the Eastern
Drakensberg-Maloti Mountains in Lesotho and South Africa contributing some 40% of the water in the
Orange River basin, and the Succulent Karoo in South Africa and Namibia, which represents the only
global arid hotspot and contains the Orange River mouth Ramsar site. Together these two areas,
with the adjacent lower Orange River valley, offer significant tourism development potential and
thus an economic alternative to agriculture.
In areas of low agricultural potential in southern Africa, i.e. areas of low rainfall, high altitude and poor
soils, significantly greater financial and economic returns can generally be earned from land-uses and
enterprises based on indigenous biodiversity and dramatic landscapes than from conventional farming.
Much of the lower Orange River, and also the Highlands of Lesotho, lend themselves to (a) tourism, based
on scenery, wildlife, cultures and rural lifestyles, and a suite of appropriate activities such as rafting and
canoeing, walking and mule/horse trails, mountain biking, fishing, rock climbing, birding, botanizing, etc.,
and (b) wildlife production, based on a suite of indigenous species and sometimes integrated with domestic
stock farming. These sectors are predisposed to expand rapidly in these forms of land-use because:
Ę National policies in some of the basin states (Namibia, South Africa and to a certain degree
Botswana) support investment in, and land-use conversion to, wildlife and tourism, and there is
now sufficient confidence in the sector that a critical mass of land owners/managers have embarked
on these changes to good effect. It would not be difficult to share lessons and experiences with
Lesotho and fast-track similar developments;
Ę The tourism sector is growing rapidly in southern Africa (it is now the second most important
contributor to the national economy after mining in both Namibia and Botswana) and so are the
associated market opportunities;
Ę Governments show commitment to expand and open up the protected area networks by entering into
treaties and agreements on transfrontier parks and conservation areas, joint marketing and other
forms of constructive co-management. The transfrontier co-management areas, linked to
biodiversity hotspots, have high marketing value, provide the anchor points for tourism and wildlife
conservation and act as a catalyst and engine for local, national and regional development;
Ę Governments in the basin show strong support to community-based initiatives in the wildlife and
tourism sector, as foci for sustainable rural development; and
Ę These forms of land-use are pre-adaptations to climate change. Farming will become increasingly
difficult and less viable in arid areas. Tourism and wildlife is becoming increasingly attractive,
produces better returns and places far less pressure on the environment.
148
Priority transboundary problems
4.4.2
The table below (Barnes & Humavindu 2003) provides comparative economic figures for a block of land
of some 100 000 ha in the lower Orange River catchment in Namibia that was under freehold small stock
farming and is now under tourism and wildlife. It was also analysed for its economic performance if it
were to be placed under communal management, such as via a resettlement scheme, using data from the
nearby Warmbad communal area. It is apparent that the net cash income per hectare is some 50 times
greater under tourism than commercial farming. Also significant is that the pro-poor contribution under
tourism is some six times greater than under farming. This is also apparent in the number of jobs Ł under
farming about 15, under tourism over 120 on the same piece of land.
Similar trends are being seen at the level of Namibia's national economy. All forms of farming, in both
communal and commercial areas, contributed some N$1.89 billion to the national economy in 2005.
Tourism and wildlife, in just the commercial sector, contributed N$3.2 billion. Tourism alone (N$2.7
billion) contributed more than all of agriculture. Trophy hunting of just 20,000 animals outperformed by
about 20% the entire small stock farming sector in Namibia which farms with over 2 million head of
smallstock on some 27 million ha. Livestock numbers have halved in Namibia over the past 30 years while
wildlife figures have doubled. Similar trends are seen in tourism arrival figures, which are growing at
about 7% per year, and this is projected to continue for at least the next 10 years. In 2004 there were
some 480 tourism establishments in Namibia (lodges, hotels, camp sites, guest farms, etc). This had
grown to over 700 in 2005 and over 1,000 in 2006.
Two areas of the Orange River basin have a number of special features which, if linked together and
marketed in intelligent and effective ways, would galvanise them to particularly rapid growth based on
their tourism potential. These are the Drakensberg-Maloti Mountain ranges at the one end, and the Lower
Orange River and mouth at the other.
Ę The Drakensberg/Maloti mountains have the highest peaks in southern Africa and unique montane
and alpine vegetation in a globally important biodiversity hotspot;
Ę The lower Orange River passes through the Succulent Karoo - the most plant-diverse desert in the
world, with the Sperrgebiet, Richtersveld, Orange River mouth Ramsar site and Namaqualand
at the other;
Ę Between these are four deserts Ł the Namib, the Succulent Karoo, the Nama Karoo and the Kalahari,
each with a number of diverse vegetation types;
Ę Large and linked protected areas and transboundary initiatives, containing a large component of the
most dramatic and diverse landscapes and wildlife, including the Kalahari, Ais-Ais Ł Richtersveld
and Augrabies Parks;
Ę The world's second largest canyon Ł the Fish River Canyon;
149
Priority transboundary problems
4.4.2
Ę The Orange River valley, cutting through deep gorges, on its way from the Lesotho highlands to the
Atlantic Ocean Ł the next perennial river to the north being the Kunene 1,400 km away;
Ę Good communications - an extremely good road network, linking the four basin countries and all the
basin attractions, as well as to other destinations in SADC states, good air links - international,
within the countries and within the basin, and good telecommunications and internet links;
Ę Good services - ready access to car hire and travel agents, good banking, foreign exchange and
credit card services, and good medical support and back-up;
Ę Established tourism routes and facilities which could be built upon.
All these attributes make the Lesotho Highlands and the lower Orange River extremely suitable areas for
a development focus around unspoiled landscapes, indigenous biodiversity and carefully planned tourism.
Such a development focus would provide the best economic returns to land, best opportunities for pro-
poor livelihood improvements, sustainable land and water management, as well as high value adding to
water use.
The impacts on livelihoods of land degradation in communal areas under current farming systems are
difficult to measure given the complex interactions between the bio-physical environment and socio-
economic conditions, and manifold non-monetary goods and services that local communities derive from
natural resources, not to speak of non-use values (e.g. cultural / spiritual value of resources). However,
one cost estimation of losses of the most basic goods, shows that continuing land degradation severely
impacts on rural livelihoods, as depicted in the Table 21 below.
It has been estimated that, in Namibia, land degradation on commercial farms leads to a loss of 34 000
tonnes of beef production per year (worth R102 million in 1994 prices ibid). This loss, of course, has
direct national economic impacts regarding the overall level of output, export and tax revenues.
Land degradation has a financial cost also in terms of water resource management in the form of:
increased siltation, increased and more rapid run-off, reduced recharge, and increased evaporation
through higher water demanding alien invasive species.
Little if any work has been done on determining the cost of land degradation on the water resources of
the Orange-Senqu Basin. The need for natural resource accounting is one of the main recommendations
from this land degradation report (see section 4.4.8).
150
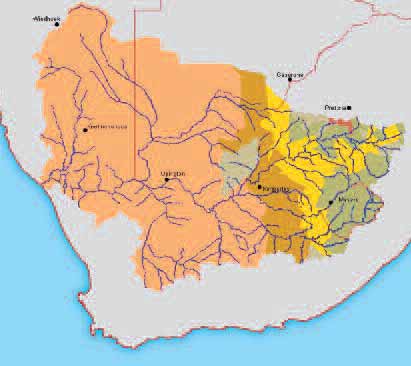
Priority transboundary problems
4.4.3
4.4.3 Linkages with other transboundary problems
There is no doubt that land degradation in the basin has major impacts on other transboundary problems,
notably the availability and quality of both surface and groundwater resources, the spread of alien
invasive organisms and the ecological functioning of many components of the river system. In all cases,
the economic impacts are significant.
4.4.4 Immediate causes of land degradation
As is evident in the accompanying Causal Chain Analysis diagram (see Figure 31), there are a number of
immediate causes for the current state of degradation of the Orange-Senqu catchment area. They are:
overgrazing, overstocking, deforestation, degradation by mining activities, alien invasives and
uncontrolled groundwater abstraction.
151
Priority transboundary problems
4.4.5
4.4.5 Underlying causes of land degradation
Poor land-use policies and planning
The existence of policies that contradict the objective of sustainable land management and rural
development creates incentives that work against sustainable land management. Specific issues that
need to be addressed through policy review are the lack of tenure rights over land, management control
over natural resources, and rural development / agriculture policy.
Most freehold land is used for livestock farming that was heavily subsidized in the past. Many freehold
farms, particularly in the more arid areas, are not economically viable because of low and unreliable
production; in the southern parts of Namibia for example, it has been estimated that as many as 60% of
these farms are not profitable. Again, a number of (policy and economic) reasons can be identified that
lead to the inefficient use of resources (rangeland) on commercial farmland. In the past, livestock
subsidies on commercial farms led to overstocking. Although these subsidies have largely been phased
152
Priority transboundary problems
4.4.5
out, the legacy (land degradation mainly in the form of bush encroachment and overgrazing) is still
apparent. A main challenge is therefore the rehabilitation of farmland to regenerate their productivity.
However, technologies to restore degraded land are complex and often require a reduction in stock to
allow the veld to recover, thereby reducing short-term income. In many arid areas, farming is simply an
inappropriate form of land-use, both economically and ecologically.
Just as pressing as the review of current policy is the process of implementation of policy Ł moving from
paper to practice, while many countries have taken several important steps on paper, these need to be
implemented through appropriate support and enforcement. Finally, where policies are in place, lack of
knowledge and awareness as well as frictions between national and customary law at the local-level,
where many policies need to be executed, create obstacles.
Unsustainable tenure systems and limited land-use options
Traditionally, livelihoods have been based on the use of natural resources through livestock husbandry
and cultivation of land. Land management practices had evolved to adapt to the physical conditions of
Southern Africa climate and historically resource use is considered to have been largely sustainable.
Today, in the Orange-Senqu basin people on communal land still largely lead subsistence lifestyles, due
to the absence of employment and other significant monetary incomes. As affordable alternatives are not
available, food, fuel, housing materials, and even medicines are extracted directly from the land, in
most cases barely covering the needs of the respective resource users. Dependence on the exploitation
of natural resources locks residents into a cycle of short-term over-exploitation of resources. Traditional
land-use practices are increasingly marginalized: rainfall, and therefore the availability of fodder are
highly variable in terms of time and space. In the past, communities employed a flexible rangeland
management system, moving herds to distant pastures to benefit from better rainfall and grazing. Given
severe demographic pressures, sedentarisation is now a reality in most of the communal areas of the
basin, and there is little scope for stock farmers to return to the more nomadic lifestyles of the past.
Land tenure issues and ensuing consequences for land management, are pervasive throughout Sub-
Saharan Africa. Communal land is owned by the State, while its residents have usufruct rights over the
land and its resources such as grazing. Group rights and their enforcement have weakened and this
undermines the ability of many residents to prevent appropriation of their land by wealthy individuals
and settlers and herders from other areas. In many areas previously controlled community management
of land has turned into an open-access system. Open access to resources implies that the value of a
resource is only secured and internalised by individuals through exploitation, while its preservation
induces the risk that the investor incurs a loss when the returns are internalised by other resource users
- the so called free rider problem. Open access, its ensuing risks to investments and the inability of
communities to coordinate land-use planning at a larger scale is impeding sustainable development in
communal areas.
Apart from land tenure, thin or absent markets in the rural economy lead to coping strategies, which are
often sub-optimal from the perspective of sustainable land management. Where markets exist they value
pure extraction but not sustainable use, thus again leading to overexploitation of the resources.
The absence of these markets limits the opportunities of rural people to diversify their livelihoods away
from livestock production or extensive dryland cultivation. At the same time, limited rural financial
153
Priority transboundary problems
4.4.5
facilities restrict saving and borrowing possibilities. Commercial banks do not provide adequate banking
facilities to communal farmers on a regular basis, which leaves farmers with few options other than
to re-invest their money in livestock; also a strategy of maintaining large livestock numbers is favoured
by farmers to minimise risks in times of external shocks. Thus, the absence of credit and insurance
markets again leads to overstocking on the one hand, and diminishes the capacity of farmers to invest
in their land.
Institutional Capacity
Rural people and communities manage the land and its natural resources. Their decisions and actions
will, to a major extent, determine whether land-use options and management will be sustainable and
optimal Ł both for the environment and themselves. Such decisions are taken within various policy
settings, knowledge systems and the day to day modus operandi of the communities and their support
organisations, such as central Ministries and regional government. The management effectiveness of
these institutions is impeded at several levels.
Fragmented centralised management of planning and implementation of activities creates one of the
strongest barriers. Land-use planning and natural resource management fall under the jurisdiction of
several different ministries/departments, including for example Lands, Agriculture, Water, Forestry and
Environment in the respective countries. There are no / few effective mechanisms in place to facilitate
integrated multi-sectoral planning, and ministries/departments often inadvertently undermine one
another's initiatives. Also, on the few occasions that ministries/departments do come together to plan,
the resultant approach is usually heavy-handed, top-down and disempowering for local communities.
Regional and local authorities often have weak institutional mandates and lack the financial resources,
skills and equipment necessary to perform their functions. They consequently fail to provide adequate
support to their constituencies. At the same time, strong institutional mechanisms at local community
level for land and natural resource management are lacking. One solution may be for Basin Management
Institutions to become established with a mandate to take on the task of creating integrated planning
and monitoring units for different parts of the Orange-Senqu River basin, as well as to share experiences
and coordinate / collaborate on strategic higher level issues.
Individual Capacity
The Southern African region has limited human capacity, i.e. skilled individuals capable of turning
rhetoric and goodwill into effective action, particularly in the rural and more remote areas. While these
skill deficits vary across the Orange-Senqu basin, they remain a significant limiting factor to good
management and development. At local and regional level, there is an overwhelming need for general
education, leadership capacity and facilitation skills, while at national level the lack of technical experts
such as experienced water and land technicians and scientists, development specialists and natural
resource economists, is a severe constraint. Across sectors, understanding of the interlinked causes of
land, water and environmental degradation and the principles of integrated land, water and resource
management are lacking.
154
Priority transboundary problems
4.4.6
4.4.6 Anthropogenic and natural root causes
Increased poverty and human pressure
As noted earlier, inappropriate land-uses and agricultural practices are the main factors which underlie
land degradation in large parts of the Orange River basin; however, these causes are only symptoms of
actual root problems at a structural level, which are tightly interlinked with each other. Ultimately, it
is poverty mainly on communal lands, linked to the need for agricultural and industrial expansion at
national levels, but also diversification away from agriculture in the more arid areas that will alleviate
pressure on land and natural resources, combat rangeland degradation and desertification, and start to
counteract poverty.
HIV/AIDS
HIV/AIDS is a major factor that creates a barrier to sustaining institutional and individual capacity for
land and associated resource management. The four countries of the Orange River basin are amongst
the worst affected in the world by HIV/AIDS, with an estimated prevalence rate of above 30% of the
adult population. This has enormous social implications: there are already an estimated population of
AIDS orphans numbering in the millions and it is predicted that by 2020, 26% of the labour force will be
lost to HIV/AIDS. For every person lost, traditional knowledge and mechanisms for coping with climatic
and general variability are lost. When this knowledge disappears basic subsistence becomes more
difficult and the risk to people's livelihoods increases. The loss of skilled and unskilled personnel within
the environmental management sector also has devastating effects on sustainable natural resource
management, reducing its effectiveness and generally threatening those who rely on natural resources
for their livelihoods. Further, losses in time and personnel due to HIV/AIDS are persistent and
compounding, not random or isolated. Thus they weaken institutional memory, reducing the long-term
integrity of natural resource management.
In environmental terms, the loss in time, skills, experience and finances will result in degradation of the
landscape. As the burden of HIV/AIDS increases, people begin to look for short-term solutions that often
involve methods that are less well suited to the environment. For example, the loss of labour, and health,
means that farmers are less able to spend time on moving herds to distant pastures or to take time-
consuming anti-erosion measures. Their options to generate income are compromised as they are forced
to take emergency action by, for example, selling livestock at sub-optimal times. In short, the dual
impacts of HIV/AIDS and environmental degradation lead to a complex self-reinforcing cycle detrimental
to livelihoods. Poverty and reduced livelihood options are interlinked factors influencing land
degradation
As the above analysis shows, the physical impacts of land degradation occur at local-level while much
of the impetus (or root cause policy failures) is derived at the national level. Some of this is a legacy of
the past (land tenure and land distribution), in addition to present policy preferences which adhere to
an economic development paradigm. The latter often focuses on agriculture as the engine of growth and
poverty eradication, implemented through inappropriate projects and schemes (often driven by ill-
informed external agencies such as the Word Bank, African Development Bank and FAO) which is
sub-optimal given much of southern Africa's climatic circumstances. At the bottom line however, it
clearly shows: poverty at local level and ill-judged economic aspirations at national level lead to land
155
Priority transboundary problems
4.4.7
degradation, which in turn erodes livelihoods. Given these inter-linkages, combating land degradation
in new and innovative ways must form an integral part of any feasible poverty reduction strategy as well
as any sustainable river basin and development strategy.
4.4.7 Knowledge and capacity gaps
There is limited access to Monitoring and Evaluation systems which can provide information on
economically and environmentally efficient land, water and natural resource use, and guidelines for
adaptive resource management to the individual. Especially in a climatic environment as diverse as the
Orange-Senqu River basin where successful sustainable resource management is, to a large extent,
dependent on swift adaptation to changes in local conditions, particularly weather conditions. The ability
to monitor and evaluate the risk of degradation is critical, as is the ability to track changes and develop
adaptive management strategies. Information for adaptive management is not generated on a reliable
basis at any level, be it national or local, scientific or applied; secondly, where information is generated
and lessons are learned, these are not communicated and disseminated across the area/country/region
and beyond. Given the uncertainty associated with the impacts of global climate change, information on
changes in resource state becomes even more critical.
4.4.8 Summary and recommendations, including potential short-medium SAP interventions
Currently the capacities of communities to make informed management decisions are limited. An easy
to operate, locally based decision-support system providing information on important parameters like
rangeland condition, bush densities, carrying capacity, livestock condition and rainfall, is urgently
needed. Based on their own information, collected by themselves, resource users should be able to
identify problem areas and make appropriate mitigation decisions (e.g. marketing of livestock,
movement of livestock to key resource areas, additional fodder supply, etc). Knowledge is necessary but
not sufficient for sustainable land management. Especially where sustainable land management involves
investments of time and money (even if only initially), favourable (economic) incentives and respect for
traditional cultural significance of livestock herds are also required.
The following recommendations are made:
Ę A detailed set of natural resource accounts should be developed for the basin, covering
the economics of both land and water use;
Ę An effective monitoring system in the basin should be established for carefully selected and agreed
key indicators both in- and out-of-river. The information should be in the pubic domain and made
both intelligible and accessible to the general public via "State of Orange-Senqu River basin"
reports on a regular basis;
Ę There is a dire paucity of protected landscapes in the upper catchment of the Orange-Senqu River
basin, particularly in Lesotho. The creation of well structured, carefully developed, scientifically
managed and internationally marketed national parks in these areas could create far greater local
and national income and jobs than current land-uses and help protect the valuable water resources
of the Orange-Senqu system;
Ę There is an urgent need for community-based natural resource management initiatives across the
basin, particularly for rangeland managed areas (under livestock, wildlife or both), involving
integrated approaches in communal and freehold areas Ł and bridging this apparent divide;
156
Priority transboundary problems
4.5.1
Ę It would be useful to explore the role of Basin Committees in promoting integrated co-management
approaches through stakeholder participation, with emphasis on planning, promoting collaboration
and monitoring;
Ę The inclusion of a person from the agricultural / forestry / land sector onto the Commission from
each country would substantially assist ORASECOM to engage more effectively with land
management issues within the Orange-Senqu River basin. It is clear that a significant proportion of
basin impacts that cause the health of the system at the mouth to be rated at a D level and
declining are mostly out-of-river issues. More effective ways need to be developed to engage
constructively and efficiently with other priority sectors and bring them into basin planning
and management;
Ę The potential impacts of climate change on different parts of the basin are poorly understood.
A detailed study of the impacts in different sectors across the basin would significantly assist with
the development of appropriate mitigation measures. Section 3.1.5.6 summaries the current
understanding of the impact of climate change in the Basin.
4.5 Increases in the abundance of Alien Invasive Species
4.5.1 Description of the problem and justification of its transboundary importance
Alien invasive species within the Orange-Senqu River Basin can be broadly grouped in two categories:
namely aquatic and riparian.
Riparian Species
Monitoring and research programmes by the CSIR, SANBI and DWAF SA have confirmed that riparian areas
of all Southern African rivers have been invaded by alien plant species (Le Maitre et al. 2000). Severity
of invasions correlates with an increase in average annual rainfall. As a consequence, rivers in the drier
western parts of the subcontinent are less impacted than those in the eastern areas. Tributaries of the
Orange such as the Vaal and the Senqu Rivers have their origins in wetter parts and alien species are a
greater problem in these areas.
In the upper catchments, where rainfall is typically above 600mm per annum, the woody plant species
Acacia dealbata (Silver wattle), Acacia mearnsii (Black wattle), Poplus sp. (Grey poplar), Eucalyptus
spp. (Blue gum), Melia azederach (Syringa) and Jacaranda mimosifolia (Jacaranda) are invasive,
particularly in riparian areas. As the rivers enter more arid areas in the central and western parts of
South Africa, and southern Namibia, the invasion of Prosopis glandulosa (Mesquite) is encountered
predominantly. The Prosopis invasions are mostly found on flat alluvial floodplains, which are often
disturbed by flooding and erosion (DEAT 1999). Prosopis has been identified by the South African National
Botanical Institute (SANBI) as the seventh most invasive plant species in South Africa. Throughout the
course of the rivers, common reed (Phragmites australis) is found on the edges or in shallow sections of
the river channels. The species, although not alien, has increased with the regulation of flood events by
the large dams in the system, as seasonal flooding removes stands of the reeds in river channels. Aerial
photographs have confirmed that the reed infestation had proliferated from virtually none in 1976 to
over 41 000 ha in 1995. Personal observations by farmers along the river suggest that the increase has
accelerated over the past five years (Roux pers. comm.).
157
Priority transboundary problems
4.5.1
From 1942 to 1947 the Lesotho Government Ł through their Tree Planting Scheme Ł established
populations of grey poplar and silver wattle as soil stabilization mechanisms (FAO 2004). These have
since spread to many wetland areas and stream channels across the country. Being one of the least
forested countries in Africa (FAO 2004), invasions are prevented from becoming critical due to the
extensive use of these trees by humans for fuel and building materials. Seed production from silver
wattle is known to be extensive (Bromilow 1995), which contributes to invasions of riparian and
floodplain areas within South Africa to which they are transported by rivers from Lesotho.
The arid climate of the Namibian and Botswana sections of the Orange-Senqu River basin limits the
success of alien plant species in these regions. Although Prosopis is a widespread problem in the arid
areas, it invades areas where land degradation has upset the ecosystem balance, and is therefore a
consequence of the transboundary problem of land degradation.
Burke (2006) identified a number of alien invasive species along the Namibian side of the Orange River,
expressing concern about their impact on the soon to be declared Sperrgebiet National Park. Prosopis is
of major concern, as well as for the Huns-Ai Ais Richtersveld transboundary conservation area, and the
Ramsar Orange River mouth. The Orange River Valley shrubland and Orange River woodland vegetation
types were identified as being of very high conservation value, as a result of their unique biodiversity
and species composition. Prosopis, Nicotiana glauca, Ricinus communis and Datura sp. were found to be
invading parts of these vegetation types, and are regarded as threats to these areas.
Aquatic species
The aquatic plant species Eichhornia crassipes (Water hyacinth) has heavily invaded sections of the Vaal
River. It has spread from the upper-middle parts to areas near the confluence with the Orange River in
recent years. Apart from the large water use of the plant, its ability to cover the surface of the river in
dense stands makes it a physical impediment, blocking abstraction channels and irrigation equipment.
Chemical and biological control measures have proven successful in slowing the invasions, but have not
prevented its spread to the lower Vaal River, and to some sections of the Orange River more recently
(Hughes pers.com). The spread of water hyacinth from the upper / middle reaches of the Vaal River
system to the Douglas Weir near the confluence with the Orange River is of concern and invasions of the
Lower Orange River are a distinct possibility (PPRI, pers. comm.).
Azolla filiculoides (Water fern) has invaded sections of the upper Orange River and its tributaries.
Impacts of invasion by this plant are similar to that of E. crassipes although its distribution is limited to
the upper catchments.
The Working for Water Group (a sub-division of the South African Department of Water Affairs and
Forestry(DWAF)) is working on a systematic programme of eradicating alien invasive vegetation in
riparian areas within the Basin. There are currently a number of small eradication projects within the
Basin. The Agricultural Research Council's Plant Protection Research Institute researches eradication
techniques, and monitors the extent of alien plant invasions.
158
Priority transboundary problems
4.5.2
The introduction of two trout species (Salmo trutta and Oncorhynchus mykiss) to the upper reaches of
the Orange-Senqu River catchment in South Africa and Lesotho has impacted on populations of indigenous
minnow species in these areas. The value of these introduced species (for sport angling), and their
impact on indigenous fish species is a highly debated topic among local ichthyologists. Their distribution
is widespread in streams and rivers of the Maluti Mountains and surrounding highlands, where they
predate on the small populations of indigenous minnow species. Trout have been found in small
populations in the Gariep and Vanderkloof dams, indicating their spread down river.
4.5.2 Major ecological impacts and socio-economic consequences of increased occurrence and spread
of alien invasives
The major ecological impacts of the increase in alien invasive species, as illustrated in the causal chain
(Figure 32) are:
Ę Loss of indigenous species as a result of competition for space and resources with alien species;
Ę Predation of indigenous species by invasive species;
Ę Disruption of aquatic and riparian ecosystems;
Ę Erosion of river banks and riparian areas;
Ę Alterations in the flow of the river;
Ę Alterations in environmental flows as a result of water use by invasive alien plants;
Ę An increased fire risk, which destroys indigenous habitats.
As alien species are pioneer by nature, and have no naturalised enemies in the southern African systems,
they are able to out-compete indigenous species for space, nutrients and sunlight. They often form dense
impenetrable stands thus reducing the production potential of land, reducing basal cover and thereby
assisting erosion. Dense invasions of aquatic plants can alter the flow tempo of rivers and streams,
disrupting the aquatic ecosystem. Reduction of light penetration alters the aquatic environment,
preventing sunlight from reaching benthic areas. Blue gum trees (Eucalyptus spp.) are found along many
sections of the rivers in the Basin, and although invasive, are the preferred nesting tree for African Fish-
eagle (Anderson 2007), thus impacting positively on this threatened raptor species.
Important socio-economic consequences of increased invasion of alien species are:
Ę A reduced aesthetic "sense of place", impacting on the tourism potential of the Basin;
Ę A decrease in the available water resource as a result of the high water use of alien plants;
Ę Increased flood peaks as a result of degraded wetland and riparian systems;
Ę Increased cost of water as water quality and availability is negatively impacted;
Ę Costs associated with eradiation of invasive species;
Ę A decrease in production potential of land.
The main consequence of increases in alien species abundance is the reduction in river yield due to the
associated high water use by invasive plants. The Upper Orange is estimated to have a reduced yield of
13 % and the Lower Orange 7.8% as a result of invasive alien vegetation (Le Maitre et al. 2000). Although
significant, the Orange-Senqu system is one of the least impacted rivers in South Africa, with the Thukela
in Kwa-Zulu Natal most affected with a 66% loss in yield (Le Maitre et al. 2000). It has been estimated
that invasions by Prosopis sp. in the arid parts of South Africa could be using as much as 190 Mm3/a,
significantly
reducing
available
surface
and
groundwater
resources
(Cullis
et
al.
2007).
159
Priority transboundary problems
4.5.3
Allelopathic characteristics of invasive species such as Prosopis sp. and A. dealbata reduce ground cover
and lead to increased erosion of river banks and riparian areas. Increases in abundance of aquatic plants
such as Eichhornia crassipes cause alterations in the flow tempo of rivers and streams and blocking
irrigation and abstraction equipment. However, these invasions have a positive effect on water quality,
due to the absorption of pollutants from the water, reduction in sedimentation and the prevention of
algal growth through reduced sunlight penetration.
4.5.3 Linkages with other transboundary problems
Disturbances in natural systems (aquatic and terrestrial) and degradation of land often make colonization
of new areas by alien invasive species possible. Increases in abundance of alien species were found to
be closely linked to other transboundary problems, such as land degradation, deteriorating water quality,
changed hydrological regime and decreased availability of water. In each of the above mentioned cases,
an ecological system is altered, causing disruptions to habitat balance. Such disruptions cause ideal
conditions for fast growing and reproducing alien species, thus creating a vicious cycle.
160
Priority transboundary problems
4.5.4
4.5.4 Immediate causes of increased alien invasive species abundance
The causal chain depicting increased infestations of alien species (Figure 32) demonstrates that three
sectors (Agriculture, Tourism and Urban / Household) are involved in introductions of alien species.
Introductions are often deliberate. The best growing species provide shade, and their invasive tendencies
were often not predicted when planted. Introductions are also accidental, with plant material carried
in feeds, or attached to animal parts for dispersal. Floods are often responsible for the spread of alien
species beyond areas of initial distribution, and colonization of riverbanks and floodplains by aliens is
prolific in the months following flood events (personal observation Lower Vaal River 2006). Introduction
of the two trout species in the colder upper-reaches of the basin have been deliberate because of their
benefit to tourism as sport angling species. Tourist resorts often stock trout in dams, which are breached
in times of flood, washing populations of trout into surrounding streams and rivers.
4.5.5 Underlying causes of an increase in alien invasive species
The main underlying causes of increased invasions of alien species include the following:
Ę Desirability because of amenity value;
Ę Increased domestic and industrial water use, resulting in changed water flows that create ecological
conditions suitable to the spread of alien species;
Ę Eutrophication;
Ę Disturbances in ecosystem balance, creating disturbed systems ideal for invasion by alien species;
Ę Accidental veld fires, causing disturbances in natural systems.
Increases in nutrients, especially phosphorus and nitrogen in rivers as a result of runoff from industry and
urban areas provide sufficient sustenance for dense invasions of aquatic plants, particularly in the Vaal
River. Any anthropogenic disturbances to riparian systems (fires, overgrazing etc.) lead to altered
ecological states, making colonization by alien species possible. Alluvial mining along the Lower Vaal and
Orange River has also caused large portions of riparian areas to be colonized by alien species.
4.5.6 Anthropogenic and natural root causes
Root causes for the problem are the following:
Ę Inadequate knowledge of introduced species, as well as methods of control or management
of the species;
Ę Inadequate resources to control alien species and prevent their spread to uninfected areas;
Ę Inadequate integrated planning and management to approach the problem;
Ę Ignorance of the problem, and of the impacts of alien species;
Ę Inadequate enforcement of regulations on alien species.
The unintended impacts of the introduction of alien species are often not anticipated and researched
enough. The situation has improved in the past 20 years, with the Plant Protection Research Institute of
the Agricultural Research Council of South Africa and various South African universities continuing to
study the topic widely. Current research is focused on the control and eradication of existing species.
Eradication and control measures are often fragmented, with landowners, government and the
agricultural sector approaching the problem in localised efforts. The establishment of the Working for
161
Priority transboundary problems
4.5.7
Water programme of the South African Department of Water Affairs and Forestry has attempted to
integrate management of the problem across all sectors and areas in a holistic way, and has been
successful, but a lack of capacity within government departments to enforce laws regarding the ongoing
introduction of alien species is compounding the problem.
4.5.7 Knowledge gaps
Monitoring of the distribution and spread of alien invasive species across boundaries is problematic.
Although South Africa has an effective monitoring tool (the SAPIA atlas) for the problem (SAPIA 2007), it
has very little information of the contribution of neighbouring states to the problem.
There is limited knowledge of the effect of alien aquatic fish species on aquatic ecosystems. Although
the topic is extensively debated among ichthyologists, studies of the impact of the problem are limited.
The consideration of the effect of alien species on water yield in the management of water resources is
inadequate. Cost benefit analyses on the eradication of alien species to improve river yield should be
invested in. This would assist in attracting private and public sector donors to invest in control and
eradication programmes.
4.5.8 Summary and recommendations
Increases in the distribution and occurrence of alien invasive species across the basin are contributing
to the environmental degradation of riparian and aquatic ecosystems in the Orange-Senqu River Basin.
As a result of the varied climatic conditions within the basin, the problem varies in severity and nature.
The upper catchments of the Basin within Lesotho, and the Eastern Free State and Gauteng provinces of
South Africa show significant riparian infestations of alien species, such as Acacia dealbata (Silver
wattle), Acacia mearnsii (Black wattle), Poplus sp. (Grey poplar), Eucalyptus spp. (Blue gum), Melia
azederach (Syringa) and Jacaranda mimosifolia (Jacaranda). These species are significant water users,
and compound the problems of reduced flows on aquatic ecosystems. Additionally, the Vaal River contains
sections of dense infestations of aquatic plant species Eichhornia crassipes (Water hyacinth). This species
disturbs aquatic habitats, alters the flow of the river and blocks abstraction and irrigation equipment.
The upper catchment of the Orange River carries populations of exotic trout species (Salmo trutta and
Oncorhynchus mykiss) which predate on small remaining populations of indigenous minnow species.
The drier middle to lower sections of the Orange River Basin is impacted mostly by growing infestations
of Prosopis glandulosa (Mesquite). This woody shrub species is commonly encountered in riparian areas,
and is responsible for significant river yield loss, as well as land degradation.
DWAF-SA's Working for Water programme has initiated various alien species eradication programmes
across its sections of the Basin. The eradication programmes are however fragmented in approach, and
utilize private and public funding when available. Eradication programmes in the remaining three
countries is ad hoc, and donor driven. An integrated approach to the eradication of common alien species
should be investigated. The four basin countries have sufficient legislation regarding the management
of alien species, although capacity to enforce the legislation is inadequate.
Alien invasives are pioneer species; their invasion of areas is a sign of perturbations in natural
162
Priority transboundary problems
4.5.8
ecosystems caused by land degradation and changes to aquatic environments through deteriorating water
quality and changes river flow patterns.
The recommendations to address the problem of increases in alien invasive species in the Basin include
the following:
Ę Adequately address the related transboundary problems of land degradation, altered water flow
and water quality deterioration. This will assist in enhancing the ecological functioning of natural
ecosystems, hampering invasions of pioneer alien species;
Ę Improve financial and human capacity within government departments of the four basin countries
to enforce legislation regarding the spread of alien invasive species;
Ę Integrate eradication efforts across the basin to control common invasive species. The ad hoc
eradication of problem infestations does not enable sustainable improvement of ecosystems.
Re-infestation from seed or plant material carried from other areas by the rivers and other means
are bound to occur;
Ę Raise public awareness of the problem, and entice public involvement in the monitoring and
eradication of alien invasive species;
Ę Improve monitoring of the spread of alien invasives. Monitoring of the spread of alien species,
and the effect of eradication and control efforts is improving in South Africa. Monitoring of the
problem in the other Basin countries is ad hoc and donor driven. There is a need for integrated
monitoring across political boundaries.
163
Stakeholder analysis
5.1
5. Stakeholder analysis (analysis of views and opinions of stakeholders)
5.1 Introduction
The objective of the Stakeholder Analysis is to identify the major stakeholder groups affected by and
impacting the degradation of the OSRB in order to empirically gauge the perceptions of stakeholder
groups and incorporate their concerns, perceptions and priorities in project development. The SHA also
serves as a base for creating a stakeholder involvement plan, public participation strategy and
communication strategy.
The SHA involves identification of major stakeholder groups throughout the region, and their concerns
regarding issues pertaining to IWRM. Following this identification exercise a consultative qualitative
stakeholder survey based on open question interviews was administered to establish an initial baseline
of stakeholder perceptions, referred to as the Qualitative Stakeholder Analysis (QL SHA). This survey
was conducted through a basin-wide ground truthing mission by the SH Analyst, with support of the
National Consultants and Regional Consultant. This initial study serves as the foundation information for
the larger closed question based survey Quantitative Stakeholder Analysis (QN SHA), which was conducted
in March and April 2007. The combined results of these create an empirically valid baseline measure of
the major challenges perceived by multiple stakeholder groups throughout the region.
The objective of QL SHA is to ascertain who the stakeholders are for the project, what their interests
are and how significant those concerns are throughout the region, so as to inform the initial TDA priority
issue identification and to develop the survey for the QN SHA. The objective of the QN SHA, is to more
fully ascertain the wider stakeholder group views and opinions, focusing on the most important issues
for these groups by asking them to rate their level of agreement with a series of statements. The QN SHA
expands the array of stakeholder opinions, provides and empirical baseline of group priorities, and
identifies divergences between stakeholders perceptions and opinions.
5.2 Variation and reduction of hydrological flow
The QL SHA found that stakeholders over all view current water policies to favour short term economic
development needs such as industrial development, energy industry, and non-sustainable agriculture
practices. Stakeholders cited concern about the impacts of the policies for water use in the region that
involved a perceived lack of monitoring of abstraction rates throughout the region, depletion of
groundwater resources, impacts on the natural ecology throughout the region, lack of adequate amounts
potable water for communities in some portions of the river basin, and regulated river flows that are not
in accordance with natural seasonal flow variation.
This was supported by the QN SHA findings. In response to the statement "Economic development in the
short term is important and must use whatever resources possible, including water resources" groups
who make up an environmental elite and have a have a clear understanding of the importance of long
term environmental stewardship combined with a shared belief in cause and effect in ecological
relationships, were in opposition to those who were concerned with more immediate economic
development conditions. It is common for groups that are generally more interested in short term
development issues to be those whose livelihoods depend more directly on availability of water, such
as farmers.
164
Stakeholder analysis
5.3
When focusing more directly on water management issues, and how water is distributed, stakeholders
tend to be in more agreement. In response to the statement "Use of water for affordable energy and
improving economic conditions is more important than environmental protection." The divisions trended
in the same way as above with groups that have a direct interest in meeting short term economic goals
seem to view environmental protection measures as onerous, and interfering with their livelihoods.
There was also notable division among stakeholder groups when asked to respond to the statement
"Communities in the region have enough water for everyone who lives there." There was strong
disagreement from a significant majority of stakeholder groups. In contrast, the one group that strongly
agreed communities in the region have enough water for everyone who lives there were the irrigation
farmers. This discrepancy may be a result of the large amount of water that these farmers use and are
generally entitled to, while others, especially those along the river and in river basin communities, do
not have as much access to the water.
The trends in belief that some sectors should have priority to water use, such as industry and agriculture
was also divided with those who had a more direct immediate investment in the issue being more inclined
to support more access to water resources. It is interesting to note that not all of the groups who tended
to favour environmental considerations over economic development felt that water rights to specific
sectors should be limited.
5.3 Deterioration of water quality
The QL SHA found that some stakeholders, especially those down stream raised concerns about the water
quality of the Orange-Senqu River. While some specifically drew attention to pollution from Blue Green
Algae and municipal wastes, others felt that the water in the Lower Orange-Senqu was quite pristine.
Still others mentioned pollution from mining, from industrial use and from the energy industry as
degrading the waters though this concern was more nationally, rather than internationally relevant to
stakeholders.
The QN SHA demonstrated that the deterioration of water quality was ranked as the third highest priority
for stakeholders. The issue of deteriorating water quality is divisive among stakeholder groups. In
response to the statement "My community always has enough good water for people to drink", the
stakeholder groups were significantly divided. Those in strong disagreement were stakeholders working
closest to the water resources. In contrast, those who agreed that there is enough good water for people
to drink included mainly those who felt that maintaining the perception of good quality water is
important to their economic wellbeing, such as tourism and water management parastatals. It is
interesting to note that the stakeholders who are members of community living near the river disagreed
mildly, though there was significant division within the group that can not be explained through either
rural/urban divisions, or national divisions.
In comparison, the variations between stakeholder groups responding to the statement "People in my
community have had illnesses because of the water" were more significant. At the national level there
is low agreement with this in Namibia, variation in South Africa and Botswana and high level of
agreement in Lesotho. It is interesting to note that given the statements above the stakeholders either
very strongly disagreed or disagreed with the statement "I believe that the water in the Orange-Senqu
165
Stakeholder analysis
5.4
River is safe to drink." In the case of communities living near the river the disagreement was consistent
throughout the group and the disagreement was relatively strong.
This finding is supported by the response to the statement "The water in the Orange-Senqu River is very
polluted in some parts." All groups either agreed or agreed strongly. Those living near the river agreed
very strongly, suggesting that pollution levels are especially challenging for these stakeholders.
Additionally, while pollution is often diluted by the flow of the river, the stakeholders overwhelmingly
disagreed with the statement "Any pollution in the river is diluted so it is not a problem for me."
5.4 Landscape Degradation
The QL SHA Stakeholders also voiced concerns about the biodiversity in the region as it was influenced
by the existing water regime. There was concern that economic development policies reduced available
water for ecosystem health within the river basin. Specific examples were the need to preserve the
ecosystem of the Lesotho highlands, which have been disrupted by human activities. The increase in
human populations and grazing of livestock has diminished soil quality and led to erosion. This was
especially true in reference to the Lesotho Highlands and the Ramsar site in the Lower Orange-Senqu.
In the QN SHA Land degradation such as erosion and desertification was ranked as the second highest
priority concern for stakeholders overall. Within the issue of land degradation, survey respondents
addressed issues pertaining to water availability impacting desertification trends, impacts on personal
and economic interests, and perceptions about availability. There were strong levels of disagreement
from stakeholders in response to the statement "There will always be enough water available to
everyone who needs it."
Two related issues impacted by this decline in the dependence on a regular supply of water are the
perception of the economic importance of water and the importance of a regular water supply for
individual economic wellbeing. In response to the statement "The economy depends on a regular water
supply from rivers and groundwater", all groups were in strong agreement. Similarly, in response to the
statement "My own livelihood depends on a regular water supply from rivers and ground water" all
groups were in strong support.
This suggests that stakeholders throughout the region are aware of limited availability of water,
especially in this arid zone. It also suggests that there is the realization that water resources are not
infinite and that there is competition among users for water use. The acknowledgement of this scarcity
issue will be helpful for raising public awareness, and inducing conservation measures for water use.
Further, consensus on this within the region suggests a high level of receptivity to improved water
management practices. This awareness of limited resources and economic linkages would indicate a
potentially important starting point for social marketing for water conservation efforts.
Stakeholders raised concerns about the potential impacts of climate change as it related to the current
water regime as well, with specific concerns about impacts of reduced water quantity, and quality on
humans, environmental issues and economic development within the region. The potential decline in
rainfall and snowfall in the catchment area could have significant impacts on water resources, and
almost every stakeholder raised concerns about the possible severity of this for economic conditions.
166
Stakeholder analysis
5.5
Stakeholders discussed worries about how climate change could effect human health through severe
weather events, increase in water borne illnesses and other human and economic developmental issues.
Additionally, stakeholders noted that weather patterns seemed to have changed noticeably within their
lifetimes. Many felt that there was a need for pre-emptive planning and for more attention to various
scenarios within the water management process.
5.5 Alien invasive species (new plants and animals)
The issue of the presence of alien invasive species of plants and animals was the lowest priority concern
of stakeholders in the region. This issue paled by comparison to issues of stress on water, degradation
of land and water, and loss of biodiversity. It is not uncommon that the issue of alien invasive species
fails to attract the attention of stakeholders unless it becomes pervasive and interferes with normal
ecological functioning. It should be noted that at the national level, stakeholders in South Africa ranked
this as a higher priority concern than those in other countries. The South African stakeholder ranked
this issue third, above alteration in naturally occurring water flow in the river, land degradation such as
erosion and desertification, climate change impacts (current and future) and loss of biodiversity
(wildlife, including plants and animals). In all other countries it was ranked as the lowest priority
concern.
In response to the statement "There are new types of wildlife Ł plants or animals, in and near the river
now." There was division among stakeholders and within stakeholder groups. Those stakeholders from
South Africa, and to a lesser extent Namibia, tended to see more, while others did not. In addition,
those who are part of the environmental elite strongly agreed. These groups have increased access to
information and are more closely aware of trends in invasive species.
5.6 General Attitudinal Questions
Within the surveys there were several statements presented to stakeholders intended to gauge their
attitudes toward environmental and water management issues. These questions focus on future capacity,
environmental stewardship, responsibility for water management, and decision making in water use.
There was very strong disagreement among all stakeholder groups with the statement "People should
take all they can from nature to survive because there will always be more." This suggests that
stakeholders are aware that there is a finite amount of ecological resources, and that the environment
will not always be replenished. This finding is mirrored by the response to the statement "I feel everyone
is responsible for the environment in the Orange-Senqu River basin." All stakeholder groups were in
strong agreement. This again suggests that not only are the stakeholders aware of the finite resources,
but there is a sense of collective ownership for the environment of the Orange-Senqu River Basin.
Survey participants were asked two questions pertaining to current water practices and those who are
perceived to benefit the most and the least from these existing practices. Responses are presented in
the figures below based on the responses by individuals, rather than groups. The diversity of groups
perceived to benefit most are generally "economic" stakeholders who benefit financially from current
practices, while those who benefit least generally wield less economic influence.
167
Stakeholder analysis
5.6
Stakeholders were also asked what their sources of information were on water and the environment.
Presented below (Figure 35) are the percentages by each group. Main stream media (television, radio
and news papers) account for almost half, while government officials make up twenty percent. Other
sources may include internet, peer review journals, and other sources.
168
Stakeholder analysis
5.7
5.7 Recommendations
Recommendations for the project stemming from this analysis are divided into 4 categories.
Awareness Raising
Ę The awareness of the limited resources and economic linkages would indicate a potentially
important starting point for social marketing for water conservation efforts. The acknowledgement
of water scarcity issues in the SHA will be helpful for building public awareness, and inducing
conservation measures for water use. Using social marketing strategies, with non-judgmental
messages may be effective for linking water conservation with environmental issues and the
importance of long term planning for water resource use in the Orange-Senqu River Basin.
Ę Include students and youth group members in social marketing campaigns to help the project target
and reach future generations.
Sector Specific Recommendations
Ę Develop intersectoral capacity building measures to increase awareness and understanding
of sustainable development, IWRM, and environmental economics within the interministerial
committees.
Ę Take steps to unlink the perception of a trade off between sound environmental management and
economic development,
possibly taking
advantage
of expertise
regarding economic and
environmental losses that result from desertification
Ę Conduct a region wide study of water related impacts on the health of human populations
Ę Increase educational outreach and campaigns in river communities to emphasize the importance of
environmental stewardship in preserving river system health and functions.
Ę Develop a basic environmental awareness training programme for the press and media that
169
Stakeholder analysis
5.7
emphasizes cause and effect relationships of ecology in the region, focusing on water issues and
a press kit with information and expert contacts.
Ę Develop or enhance environmental and water system awareness training for tourism / recreation
stakeholders in order to improve stewardship and reduce impacts of this economically
important industry.
Ę Build broad awareness within the industrial sector regarding environmental and economic benefits
of improving current water use strategies.
Trainings
Ę Work closely with educators and academics to increase awareness and develop age appropriate
curriculum to build an understanding of the importance of ecology and water management within
the region, as well as measures that can conserve water and protect resources.
Ę Provide training and targeted awareness raising on sustainable development measures that include
water conservation measures to members of the Community based organization (CBO)/ Village
development committees.
Ę Work closely with irrigation farmers to assist them in developing low water use crops, water
efficient technologies and to develop water saving measures that will increase profits while
reducing output costs.
Stakeholder Involvement in Project Inputs
Ę In order to build upon the expertise of the NGOs, it will be important to create goal oriented
activities that empower stakeholders to change behaviours.
Ę Inclusion of scientists (including social scientists) on National and Basin Wide stakeholder Forums
will be key to a broader understanding of the forces at work behind the immediate challenges.
Ę Include health care providers in stakeholder forums and in the social marketing campaign,
where possible, to increase linkages between environmental health and human health.
170
Overall conclusions and recommendations
6
6. Overall conclusions and recommendations
In the sections above, the TDA provides for each of the five transboundary issues a set of conclusions and
recommendations and a listing of short to medium term interventions. In this final section these
recommendations and conclusions are brought together and assembled as the basis for the preliminary
Strategic Action Programme (SAP) and Integrated Water Resource Management Plan for the Orange-Senqu
River Basin.
The SAP needs to recognise and balance the social and economic demands of the Basin countries, existing
and future, with the legitimate environmental requirements of the river system. More stringent demand
management in the Basin is long over due, but it should be recognised that this will not bring about a
dramatic reduction in water use from the present levels. The further development of the surface water
resource will reduce the current environmental flows which are already thought to be insufficient and
a decision on where the balance resides needs to be made by the decision makers. In order to make an
informed decision, a more coherent, transparent planning framework needs to be developed since the
current fragmentation of information leads to obfuscation and inaction. The future development
demands particularly in the irrigation sector appear to be unbounded and there is an urgent need for a
basin wide agreement on equitable sharing of water resources in order to establish the demand ceiling.
The review of the water resources and hydrology raised the following key points:
Ę Surface water resources of the Orange-Senqu Basin are highly utilized to the extent that the
residual flows to the mouth represent only 25% of the natural MAR at the mouth mouth;
Ę The system is managed as four components, Lesotho Highlands, Vaal River, Upper and Lower Orange
and the Fish River and water resource balances and development options are addressed separately;
Ę The DWAF/Namibian Water Resource Planning Model developed under the LORMS study and which
models the whole basin, indicates that there is already under a significant deficit in the Lower
Orange which may grow to over 400Mm3/a by 2025. This calculation excludes demand from Botswana
and assumes that the current EWR of 1,000 Mm3/a remains;
Ę Improved resource management in the Vaal and Orange systems could yield up to 223 Mm3/a and
maintain a surplus in the Vaal system until 2015, however, this includes utilisation of spillages from
the Vaal system and there may be double counting;
Ę The strategy for new infrastructure development is not yet defined with options including LHWP
phase 2, expansion of Thukela- Vaal transfer scheme, a re-regulating dam at Vioolsdrift, and an
upper Orange dam, and therefore the yield cannot be defined with any certainty. The earliest
implementation date for LHWP is 2018 at which time the deficit in the Lower Orange is forecast
to be 374Mm3/a;
Ę Water demand management in the irrigation sector has a forecast potential saving of 226 Mm3/a
deliverable in 5-10 years. It needs to be confirmed that these savings will available to meet the high
development demands in Namibia and Botswana and increased EWR of the Lower Orange or, used to
feed demand elasticity in South Africa. There are limited available figures for demand management
savings in the domestic, industrial and mining sectors or estimate of potential transfer and
distribution savings. A detail demand management strategy needs to be established;
171
Overall conclusions and recommendations
6
Ę Significant improvements are required in the hydrological flow monitoring network,
particularly the low flows;
Ę The Lower Orange and the mouth currently has a category D ecological status and the provisional
EWR is estimated to be 1,000 Mm3/a. From existing data and information it is difficult to establish
whether this requirement is being met. It has been estimated that raising the ecological status of
the mouth to category C will require a further 500 Mm3/a, which will increase the deficits in the
lower Orange accordingly;
Ę There is a large number of inconsistencies in the relevant basin literature which makes it difficult
for decision makers to see the whole water resources picture;
Ę The potential impact of climate change on the supply and demand side of the water balance is not
taken into account in the calculation of the water resource balance;
Ę Groundwater resources are limited and it has yet to be established what contribution, if any, they
could make to the water balance.
Key recommendations and conclusions of the water resources analysis are:
Ę To enable the decision makers to clearly understand the issue, a detailed water resource balance
for the whole basin needs to be prepared, based upon agreed planning criteria (assurances,
EWRs etc.), consistent component demand forecasts and climate change scenarios, against which
potential water resource development options and demand management targets can be
superimposed to determine the geographical planning surplus and deficits over a twenty year
planning period.
Ę Undertake an assessment of Ecological Water Requirements in the Lower Orange and mouth and
establish an agreed methodology which can be applied in other key points of the Basin.
Ę Establish a `vision' for the Orange-Senqu River Basin water resources in the national larger economic
planning frameworks of the four countries. The vision should indicate the level of environmental
protection the river should be afforded. Can protection be increased from category D to category C?
Ę Develop and agree criteria for establishing equitable sharing of water resources between the four
countries in order to set bounds on development demand.
Ę Establish
a
decision
framework
for
future
water
allocation
based
on
economic
water
evaluation criteria.
Ę Improve implementation of regulatory functions and responsibilities in all four countries
and strengthen regional coordination through ORASECOM.
The review of water quality issues raised the following key points:
Ę The Vaal catchment is highly polluted which has implications for water resource availability and
transboundary impacts. The water quality of the Upper and Lower Orange is said to be good;
however there are insufficient data for certain categories of contaminants to make any conclusive
statements. There are, however, concerns along all the rivers which flow through towns and villages
throughout the catchment regarding localized micro-biological pollution from untreated and
partially treated sewage entering the rivers;
172
Overall conclusions and recommendations
6
Ę The increase in TDS in the Vaal and Lower Orange catchments and the concomitant increase in
constituents such as chloride and sulphate, has had major implications for domestic, industrial and
agricultural water use;
Ę The transboundary impacts of POPs, heavy metals and radio-nuclides are unknown due to a lack of
monitoring data and detailed studies, but some level of transboundary transfer of these pollutants
is suspected;
Ę Eutrophication is a severe problem in the Vaal catchment and in isolated pockets in other parts
of the Basin.
Ę The receiving water quality objectives (RWQOs) are being set in isolation in priority catchments.
The integration of the RWQOs for the Vaal River is being addressed in the Integrated Water Quality
Management Plan (IWQMP) that is being developed by the South African DWAF, however there are
no objectives agreed for the whole of the Orange-Senqu basin.
Ę There are concerns regarding the quality of groundwater resources and their protection, however
there is insufficient data to make any conclusive statements in this regard;
Ę All four countries lack institutional capacity to effectively manage water quality in their respective
countries. The lack of capacity is particularly acute in relation to compliance monitoring and
enforcement of water licence conditions;
Ę In Lesotho and Namibia, the water quality monitoring networks are poorly developed and there are
no formal sampling networks or water quality databases. South Africa has a more sophisticated and
extensive monitoring system, but there are still a number of deficiencies in the data sets, the
extent of the network Ł especially along the Lower Orange and in some of the more polluted sub-
catchments of the Vaal River, as well as the number of determinants monitored. Of particular
concern here is the general lack of information on heavy metals, radio-nuclides and POPs
in the catchment.
Key TDA recommendations and conclusions regarding water quality are:
Ę Undertake an assessment of Persistent Organic Pollutants, heavy metals and radio-nuclides in the
Vaal and Lower Orange catchments.
Ę Establish basin-wide RWQOs and agree and develop sectoral short- and medium-term targets
to meet the objectives.
Ę Improve compliance monitoring and enforcement
Ę Improve the water quality monitoring network throughout the basin.
Ę Identify pollution hotspots in the Vaal catchment where a comprehensive clean-up could result
in significant improvements in water quality and available water supply.
Ę Undertake a water quality assessment of the major aquifers in the basin.
173
Overall conclusions and recommendations
6
The review of land degradation issues raised the following key points:
Ę Land degradation poses a risk to ecosystem integrity in fragile highland and dryland environments,
defined in terms of the health, connectivity and stability of both the biotic and abiotic components
of ecosystems and the interconnectedness between them. Overstocking, caused by communal land
tenure systems and the uneven distribution of water, is a major factor in rangeland degradation
throughout the basin;
Ę The Lesotho highlands are particularly sensitive to land degradation which causes critical impacts
to run-off (e.g. damage of the water sponges) and sediment loadings;
Ę In the Lower Orange, land degradation due to overgrazing and overstocking is widespread but its
economic impact on water resources has not been determined;
Ę Deforestation in the riparian belt and/or invasion by alien species can cause disruption to the
hydrological cycle, but it is unclear to what degree this is prevalent in the Orange-Senqu River
Basin due to a lack of any basin-wide studies in this regard;
Ę Invasive species can have a serious degrading impact on the land and through changes in
transpiration rates and soil structure reduce available run-off and recharge;
Ę Lack of alternative livelihoods and access to market and financial facilities lock the rural
populations into unsustainable range management practices;
Ę Poor land-use policies and historical tenure systems have exacerbated the land degradation problem;
Ę There is an urgent need for community-based natural resource management initiatives across the
basin, particularly for rangeland managed areas (under livestock, wildlife or both), involving
integrated approaches in communal and freehold areas.
Key TDA recommendations and conclusions regarding land degradation are:
Ę Knowledge of the scale and scope of land degradation in the Orange-Senqu Basin is poor and a
detailed assessment is needed particularly in the Upper and Lower Orange.
Ę The linkage between land-use and water resource management is fragmentary which makes the
development of a strategy to address the problem difficult; there is a tendency for generic
solutions. A more detailed assessment of the water resource implications of existing and potential
future land degradation is required in the final TDA.
Ę Monitoring and evaluation systems need to be strengthened and the information and knowledge
needs to be disseminated to the local level to develop adaptive management strategies.
Ę There is a need to demonstrate various governance models at the community level which will deliver
best practice integrated rangeland and water resource management in various biomes.
The review of invasive species issues raised the following key points:
Ę Increases in the distribution and occurrence of alien invasive species across the basin are
contributing to the environmental degradation of riparian and aquatic ecosystems in the Orange-
Senqu Basin.
174
Overall conclusions and recommendations
6
Ę The upper catchments of the Basin within Lesotho, and the Eastern Free State and Gauteng
provinces of South Africa show significant riparian infestations of alien species, such as Silver
wattle, Black wattle, Grey poplar, Blue gum, Syringa and Jacaranda. These species are significant
water users, and compound degradation of riparian ecosystems.
Ę The Vaal River contains sections of dense infestations of aquatic plant species, especially
Water hyacinth. This species disturbs aquatic habitats, alters the flow of the river and blocks water
abstraction, conveyance and irrigation equipment.
Ę The drier middle to lower sections of the Orange River Basin are impacted mostly by growing
infestations of Mesquite. This woody shrub species is commonly encountered in riparian areas, and
is responsible for significant river yield losses, as well as land degradation.
Ę The eradication programmes are fragmented in approach and, with the exception of South Africa,
donor driven.
Key TDA recommendations and conclusions regarding invasive species are:
Ę The eradication efforts need to be integrated across the basin to control common invasive species,
since ad hoc eradication of problem infestations will not bring about sustainable improvement
of ecosystems. Where applicable these efforts should be incorporated into the national and
regional IWRMs.
Ę More effort needs to be put into monitoring of alien invasive species throughout the basin and
a database established.
Ę An assessment of the water resource losses due to invasive species in the Orange-Senqu needs
to be developed and an evaluation of the economic cost to support increased investment
in eradication measures.
A review of potential climate change scenarios raised the following key points:
Ę In South Africa, the projected increase in potential evaporation is estimated to be 10-20%.
This
increase
will
be
accompanied
by
enhanced
evaporation
losses
and
increased
irrigation demands.
Ę Soils will become drier more often which may result in reduced runoff per mm rainfall, agricultural
land-use changes, reduced crop yields and higher irrigation demands.
Ę Fewer, but larger rainfall events which may result in more groundwater recharge.
Ę Climate change will be accompanied by changes in land-use in the four countries, which will
be superimposed on already existing complex land-use impacts.
The key TDA recommendation is:
Ę Agreed climate change scenarios need to be incorporated into the water balance calculations -
perhaps with different scenarios for different sub-basins - and adaptation strategies developed.
175
Overall conclusions and recommendations
6
A review of regional legal and institutional frameworks raised the following key points:
Ę The currently applicable (water) legislation in Botswana, Lesotho and Namibia is known to be
inadequate in the context of the sustainable management of the Orange-Senqu River basin according
to IWRM principles. With the coming into force of new legislation in these countries in the near
future the legal situation will change, giving all basin states an adequate legislative framework to
take the necessary actions at national and international level to meet their international
obligations. The legislative framework also provides for the planning framework in which the
integrated management of the basin has to take place in practice.
Ę The above-mentioned capacity constraints remain a major challenge for implementing the
applicable policies and laws in practice. Whereas the required capacity is arguably highest in South
Africa, all countries experience significant capacity challenges in this regard. A detailed assessment
of current capacity gaps needs to be undertaken in order to develop appropriate interventions to
improve on the available capacity in the basin states.
Ę A further constraining factor to the sustainable management of the basin based on IWRM principles
is the fact that whereas all countries respect international obligations, it is not always clear what
these obligations are. A case in point is water allocation between countries. For example, as
illustrated, under the respective national laws, the national authorities are obliged to meet
international obligations and account for resource allocations to downstream countries (as well as
for environmental water requirements) and include these allocations in their resource planning.
In practice the volumes required for environmental water requirements have not been definitively
determined, neither is there basin-wide agreement on the volumetric allocation of the water
resources to each country. In order to use the resources of the River System in an "equitable and
reasonable" manner, the equitable share of each country needs to be determined. Only once that
has been done the respective national authorities are able to accurately include international
obligations (as far as water resources allocation is concerned) into their planning and thus comply
with international law.
Ę The determination of the "equitable share" requires the joint acceptance of a resource
determination model as well as of the applicable criteria to be considered for the determination of
the "equitable share". International water law provides guidance as to the criteria to be used for
the determination of each country's equitable share. It is recommended that during the SAP the
required technical information is gathered and a jointly accepted resource allocation model is
agreed on between the basin states, so that they are technically in the position to determine
"equitable and reasonable utilisation" based on the criteria set forth in international water law.
176
Overall conclusions and recommendations
6
In addition to the above, the preliminary Stakeholder Analysis prepared under the TDA made the
following recommendations for inclusion in ORASECOM's Stakeholder Roadmap
(see section 5 and Annex 3).
Ę Develop and roll out a concerted national and regional awareness raising and building campaign,
which acknowledges the scarcity of water and the need to implement water use conservation
measures as part of a wider demand management strategy.
Ę Develop inter-sectoral capacity building measures to increase awareness and understanding of the
concepts of sustainable development, IWRM, and environmental economics.
Ę Take steps to decouple the perception of a trade-off between sound environmental management
and economic development.
177
References
Ref
Alexander WJR 2005, Development of a multi-year climate prediction model. Water SA Vol. 31 No. 2
April 2005. Available on website http://www.wrc.org.za
Amakali,
M.
2007.
Email
Communication
dated
14
September
2007
with
Deputy
Director:
Water Environment in the Department of Water Affairs and Forestry in the Ministry of Agriculture Water
and Forestry.
Ashton, PJ., Earle, A., Malzbender, D., Moloi, MBH., Patrick, MJ. and Turton, AR. 2006. A Compilation
Of All The International Freshwater Agreements Entered Into By South Africa With Other States.
WRC Report No. 1515/1/06. Pretoria, Water Research Commission.
Anderson, M.A. 2007. Personal Communication. Ornithologist for the Department of Agriculture, Land,
Environment and Tourism, Northern Cape Province, South Africa.
Anon. 2003. Southern African Development Community Regional Indicative Strategic Development Plan.
SADC, Gaborone, Botswana. 147pp.
Anon. 2005. Economic value of water in the Orange-Senqu River Basin. ORASECOM Integrated Water
Resources Management Plan (IWRMP) Task 10. 20pp.
Ashton, P.J. & Ramasar, V. 2001. Water and HIV/AIDS: Some strategic considerations in South Africa. In:
Turton, A.R. & Hennwood, R. (Eds.) Hydropolitics in the developing world: A southern Africa perspective.
African Water Issues Research Unit (AWIRU) and International Water Management Institute (IWMI),
Pretoria, South Africa. 22pp.
Barnes, J.I. & Humavindu, M.N. 2003. Economic returns to land use options in Gondwana Ca±on Park,
Karas, Namibia. Unpublished Report, Nature Investments (Pty) Ltd. 73pp.
Barroso, J. 2007. Email Communication with a Senior Legal Advisor in the SADC Secretariat dated 11
June 2007.
Birnie, P. and Boyle, A.E. 2002. International Law and the Environment (2nd ed.). Oxford: Oxford
University Press.
BKS (Pty) Ltd. & Ninham Shand (Pty) Ltd. 1995. Social overview Ł Orange River basin. Orange River
Development Project Replanning Study, Directorate of Project Planning, Department of Water Affairs and
Forestry, Pretoria, South Africa. 149pp.
BKS (Pty) Ltd. & Ninham Shand (Pty) Ltd. 1997a. Regional economic assessment. Orange River
Development Project Replanning Study, Directorate of Project Planning, Department of Water Affairs and
Forestry, Pretoria, South Africa. 180pp.
178
References
Ref
BKS (Pty) Ltd. & Ninham Shand (Pty) Ltd. 1997b. Allocation of Orange River water: Social implications.
Orange River Development Project Replanning Study, Directorate of Project Planning, Department of
Water Affairs and Forestry, Pretoria, South Africa. 180pp.
BKS (Pty) Ltd. & Ninham Shand (Pty) Ltd. 1998. Comparative economic impact analysis of optimal water
allocation. Orange River Development Project Replanning Study, Directorate of Project Planning,
Department of Water Affairs and Forestry, Pretoria, South Africa. 52pp.
Boardley, S. and Schulze, R.E. 2005. Why Adopt a Vulnerability Approach? In: Schulze, R.E. (Ed) Climate
Change and Water Resources in Southern Africa:
Studies on Scenarios, Impacts, Vulnerabilities and
Adaptation. Water Research Commission, Pretoria, RSA, WRC Report 1430/1/05. Chapter 22, 359-363
Bornman, T.G., Adams, J.B. & Bezuidenhout, C. 2005. Present status of the Orange River mouth
wetlands and potential for rehabilitation. Institute for Environmental and Coastal Management,
Department f Botany, Nelson Mandela Metropolitan University, South Africa, Research Report No. 43.
Bromilow, C. 1995. Problem plants of South Africa. Briza Publications, Pretoria.
Brown, C. 2004. Pre feasibility study into measures to improve the management of the Lower Orange
River and to provide for future development along the border between Namibia and South Africa.
Specialist report on environmental flow requirements Ł Riverine. Permanent Water Commission: The
Republic of Namibia and the Republic of South Africa. 137pp.
Burke, A. 2006. The Sperrgebiet: managing its biodiversity. Enviroscience and Namibia Nature
Foundation.
Chutter, F.M., Palmer, R.W. & Walmsley, J.J. 1996. Orange River Development Project Replanning Study:
Environmental Overview of the Orange River. Department of Water Affairs and Forestry.
Conningarth Economic Consultants & Urban-Econ and Agrimodel (Pty) Ltd. 2001. Regional comparative
advantage of water use: The Orange river case study. Natural Resource Accounting Programme of
Southern Africa (NRASA), Department of Agricultural Economics and Extension, University of Pretoria,
Pretoria, South Africa. 139pp.
Cowan, JAC and P Skivington 1993. "Assessment of the Feasibility and Impact of Alternative Water
Pollution Control Options on TDS Concentrations in the Vaal Barrage and Middle Vaal (Vaalsurv)." WRC
Report No 326/1/93.
Craig, M H & Sharp, B L 2000. Health Section. Part 1: Malaria. South African Country Study on Climate
Change Vulnerability & Adaptation Assessment. Pretoria, Department of Environmental Affairs & Tourism.
CSIR Environmentek. 2001. Water resource accounts for South Africa 1991-1998. USAID regional Center
for Southern Africa (RCSA), Gaborone, Botswana. 38pp.
179
References
Ref
Council for Scientific and Industrial Research. Undated. Alien Plants in SA: Invasion Rates and Risks.
http://fred.csir.co.za/plants
Cullis, J.D.S., Gorgens, A.H.M. & Marais, C. 2007. A strategic study of the impact of invasive alien plants
in the high rainfall catchments and riparian zones of South Africa on total surface water yield. Water SA
Vol. 33 No.1.
Davies, B and J Day 1998. "Vanishing Waters". University of Cape Town Press, Cape Town, South Africa.
Department of Environmental Affairs and Tourism. 1999. State of the Environment Report.
www.ngo.girda.no/soesa
Directorate: Environmental Affairs 1994.
A Preliminary assessment of the economic impact of
desertification in Namibia. DEA Research Discussion Paper no. 3, September 1994.
Directorate: National Water Resource Planning 2004. "Internal Strategic Perspective: Middle Vaal
WMA." Dept of Water Affairs and Forestry, Pretoria.
Directorate: National Water Resource Planning 2006. "Integrated Water Quality management Plan for
the Vaal River System: Task 2: Water Quality Status Assessment of the Vaal River System". Dept of Water
Affairs and Forestry, South Africa. May, 2006.
Dlamini, D. and Schulze, R.E. 2004. Meso-scale indicators of water poverty in the Thukela catchment,
South Africa, under baseline land cover conditions. In: Schulze, R.E. and Pike, A. Development and
Evaluation of an Installed Hydrological Modelling System. Water Research Commission, Pretoria, RSA,
WRC Report 1155/1/04. Chapter 9, 150-179.
Du Preez, CC, MG Strydom, PAL le Roux, JP Pretorius, LD van Rensburg, ATP Bennie 2000. "Effect of
Water Quality on Irrigation Farming along the Lower Vaal River: the Influence on Soils and Crops." WRC
Report No. 740/1/00.
Du Toit, A, Prinsloo, M, Durand, W & Kiker, G A 2000. Vulnerability of maize production to climate
change and adaptation assessment in South Africa. Contribution to the Vulnerability & Adaptation project
of the South African Country Study on Climate Change. Pretoria, Department of Environmental Affairs &
Tourism.
DWAF 1995: Vaal Augmentation Planning Study, Department of Water Affairs and Forestry, South Africa.
DWAF 1996a: "South African Water Quality Guidelines: Vol. 7 Aquatic Ecosystems." Pretoria.
DWAF 1996b: Orange River Development Project Replanning Study: Environmental Overview of the Orange River.
DWAF Report.
180
References
Ref
DWAF 1997. Orange River Development Project Replanning Study, Department of Water Affairs & Forestry, South
Africa.
DWAF 2002a. Upper Vaal WMA: Water Resources Situation Assessment (Report number: P WMA 08/000/00/0101),
July, 2002, Pretoria.
DWAF 2002b. Middle Vaal WMA: Water Resources Situation Assessment (Report number: P WMA 09/000/00/0101),
August 2002, Pretoria.
DWAF 2002c. Upper Orange WMA: Water Resources Situation Assessment (Report number: P WMA
13/000/00/0101), August 2002, Pretoria.
DWAF 2002d. Water Resources Situation Assessment (Report number: P WMA 14/000/00/0101), March 2002,
Pretoria.
DWAF 2003a. Upper Vaal WMA: Overview of Water Resources and Utilization (Report number: P WMA
08/000/00/0203), September, 2003, Pretoria.
DWAF 2003b. Middle Vaal WMA: Overview of Water Resources and Utilization (Report number: P WMA
09/000/00/0203), September 2003, Pretoria.
DWAF 2003c. Overview of Water Resources and Utilization (Report number: P WMA 10/000/00/0203), September
2003, Pretoria.
DWAF 2003d. Upper Orange WMA: Overview of Water Resources and Utilization (Report number: P WMA
13/000/00/0203), September 2003, Pretoria.
DWAF 2003e. Overview of Water Resources and Utilization (Report number: P WMA 14/000/00/0203), September
2003, Pretoria.
DWAF 2004a. Upper Vaal Water Management Area: ISP (Report number: P WMA 08/000/00/0303), March 2004,
Pretoria.
DWAF 2004b. Vaal River System Overarching: ISP (Report number: P RSA C000/00/0103), March 2004, Pretoria.
DWAF 2004c. Middle Vaal Water Management Area: ISP (Report number: P WMA 09/000/00/0304), July 2004,
Pretoria.
DWAF 2004d. Lower Vaal Water Management Area: ISP (Report number: P WMA 10/000/00/0304), October 2004,
Pretoria.
DWAF 2004e. Upper Orange Water Management Area: ISP (Report number: P WMA 13/000/00/0303), April 2004,
Pretoria.
DWAF 2004f. Orange River System Overarching ISP (Report number: P RSA D000/00/0104), February 2004, Pretoria.
181
References
Ref
DWAF 2004g. Lower Orange Water Management Area: ISP (Report No P WMA 14/000/00/0304), July 2004, Pretoria.
Earle, A., Malzbender, D., Turton, A. & Manzungu, E. 2005. A preliminary basin profile of the Orange-
Senqu River. African Water Issues Research Unit (AWIRU) Center for International Political Studies (CIPS),
University of Pretoria, Pretoria, South Africa. 40pp.
Engelbrecht, F. 2005. Simulations of Climate and Climate Change over Southern and Tropical Africa with
the Conformal-Cubic Atmospheric Model. In: Schulze, R.E. (Ed) Climate Change and Water Resources in
Southern Africa: Studies on Scenarios, Impacts, Vulnerabilities and Adaptation. Water Research
Commission, Pretoria, RSA, WRC Report 1430/1/05. Chapter 4, 57 - 74.
Fairbanks, D.H.K. & Scholes, R.J. 1999. Vulnerability and adaptation assessment for plantation forestry
in South Africa. South African Country Study on Climate Change Vulnerability & Adaptation Assessment.
Food and Agriculture Organization. 2004. State of forests and plantations, Country Report Ł Lesotho.
FAO Corporate Document Repository.
Fritsch, J.M. & Troy, B. 2006. Hydro-environmental assessment of the Orange River Mouth. Final Report.
Orange-Senqu River Commission. 62 pp.
Heath, RGM and M Claasen 1999. "An Overview of the Pesticide and Metal Levels Present in Populations
of Larger Indigenous Fish Species of Selected South African Rivers." WRC Report No. 428/1/99.
Heath, R., Brown, C., Tego, F., Martel, N. & Hall, D. 2006. Integrated Water Resources Management Plan
for the Orange River: Environmental Task. ORASECOM.
Herold, CE, WV Pitman, AK Bailey, and I Taviv 1996. "Lower Vet River Water Quality Situation Analysis
with Special reference to the OFS Goldfields." WRC Report No. 523/1/96.
Heyns, P. 2004. Achievements of the Orange-Senqu River Commission in Integrated Transboundary Water
Resource Management. Paper presented at the General Assembly of the International Network of Basin
Organisations, 24 to 28 January 2004 in The Martinique.
Hewitson, B., Tadross, M. and Jack, C. 2005. Climate Change Scenarios: Conceptual Foundations, Large-
scale Forcing, Uncertainty and the Climate Context. In: Schulze, R.E. (Ed) Climate Change and Water
Resources in Southern Africa: Studies on Scenarios, Impacts, Vulnerabilities and Adaptation. Water
Research Commission, Pretoria, RSA, WRC Report 1430/1/05. Chapter 2, 21 - 38.
Hewitson, B., Tadross, M. And Jack, C. 2005(a).
Scenarios developed with empirical and regional
climate model-based downscaling.In: Schulze, R.E. (Ed) Climate Change and Water Resources in Southern
Africa: Studies on Scenarios, Impacts, Vulnerabilities and Adaptation. Water Research Commission,
Pretoria, RSA, WRC Report 1430/1/05. Chapter 3, 39 - 56.
182
References
Ref
Hewitson, B., Engelbrecht, F., Tadross, M. and Jack, C. 2005 (b). General Conclusions on Development
of Plausible Climate Change Scenarios for Southern Africa. In: Schulze, R.E. (Ed) Climate Change and
Water Resources in Southern Africa: Studies on Scenarios, Impacts, Vulnerabilities and Adaptation. Water
Research Commission, Pretoria, RSA, WRC Report 1430/1/05. Chapter 5, 75 - 79.
Hewitson, B.C., Tadross, M. and Jack, C. 2005 (c). Historical Precipitation Trends over Southern Africa:
A Climatology Perspective. In: Schulze, R.E. (Ed) Climate Change and Water Resources in Southern Africa:
Studies on Scenarios, Impacts, Vulnerabilities and Adaptation. Water Research Commission, Pretoria,
RSA, WRC Report 1430/1/05. Chapter 18, 319-324.
Hulme, M. (ed.) 1996. Climate change and southern Africa: an exploration of some potential impacts and
implications for the SADC region. Reoprt commissioned by WWF international and co-ordinated by the
Climate Research Unit, UEA,Norwich,UK
Hughes, R. 2007. Personal Communication. Plant Protection Research Institute.
IPCC, IPCC 2001. Climate Change 2001: Impacts, Adaptation and Vulnerability. Working Group II
Contribution to the Third Assessment Report of the IPCC. Geneva, Switzerland.
IPCC 2001(a). Climate Variability 2001. Impacts, Adaptation, and Vulnerability. McCarthy, J.J., Canziani,
O.F., Leary, N.A., Dokken, D.J. and White, K.S. (Eds.) Cambridge Press, Cambridge, UK.
Kiker, GA. (1999). South African County Study on Climate Change Synthesis Report for the Vulnerability
and Adaptation Assessment Section (DRAFT). School of Bioresources Engineering and Environmental
Hydrology University of Natal
Lamberth, S.J. 2003. Draft specialist report on the fish of the Orange River estuary. Unpublished (for
LORMS). 12 pp.
Lange, G-M., Mungatana, E. & Hassan, R. 2007. Water accounting for the Orange River Basin: An
economic perspective on managing a transboundary resource. Ecological Economics 61: 660-670.
Le Maitre, D.C., Versveld, D.B. & Chapman, R.A. 2000. The impact of invading alien plants on surface
water resources in South Africa: A preliminary assessment. Water SA Vol. 26 No. 3.
Lesotho Lowlands Feasiblty Study (LHWC 2007). Lesotho Highlands Water Commission: Lesotho Highlands
Water Project, Consulting Services for the Feasibility Study for Phase II
Levine, S. 2006. Measuring progress towards global poverty goals: Lessons from two "forgotten" datasets
in southern Africa. UNDP, Windhoek, Namibia. 27pp.
LORMS. 2005. Pre feasibility study into measures to improve the management of the Lower Orange River.
Specialist report on the determination of the preliminary ecological reserve on rapid level for the Orange
River estuary. DWA Namibia report No. 400/8/1/P-08.
183
References
Ref
Malzbender, D. and Earle, A.
2007. The Impact and Implications of the Adoption of the 1997 UN
Watercourse Convention for Countries in Southern Africa. Study commissioned by WWF International Ł
Global Freshwater Programme. WWF: Zeist, The Netherlands.
Marais, C. 2007. Personal Communication. Department of Water Affairs and Forestry.
Mathangwane, B. 2007. Email communication
McCaffrey, S. 2001. The contribution of the UN Convention on the law of non-navigational uses of
international watercourses. International Journal of Global Environmental Issues, Vol. 1. Nos 3/4,
pp250-263.
McIntyre, O. 2004. The Emergence of an "Ecosystems Approach" to the Protection of International
Watercourses under International Law. (2004) 13:1 Review of European Community and International
Environmental Law.
Mirrilees, R., Mullins, D., Ringwood, B., Molaika, E., Mosaka, D. & Basson, T. 2003. The value of water
as an economic resource in the Vaal River catchment. Water Research Commission, Pretoria, South Africa.
148pp.
Prochazka, K., Davies, B., Griffiths, C., Hara, M., Luyeye, M., O'Toole, M., Bodenstein, J., Probyn,
T., Clark, B., Earle, A., Tapscott, C. & Hasler, R. 2005. Benguela Current GIWA Regional Assessment 44.
University of Kalmar, Kalmar, Sweden,
Pallett, J (Ed) 1997. "Sharing Water in Southern Africa". Desert research Foundation of Namibia,
Windhoek.
Permanent Water Commission 2005a. "Pre-feasibility Study Into Measures to Improve the Management
of the Lower Orange River and to Provide for Future Developments along the Border Between Namibia
and South Africa." Main Report. DWAF Ref. PB D000/00/4703, September 2005.
Permanent Water Commission 2005b. "Pre-feasibility Study Into Measures to Improve the Management
of the Lower Orange River and to Provide for Future Developments along the Border Between Namibia
and South Africa." Hydrology, Water Quality and Systems Analysis, Vol A. DWAF Ref. PB D000/00/4303,
February 2005.
Pieterse, AJH and A Janse van Vuuren 1997. "An Investigation into Phytoplankton Blooms in the Vaal
River and the Environmental Variables Responsible for their Development and Decline." WRC Report No.
359/1/97.
Roux, C. 2007. Personal Communication. Organic Irrigation Farmer and Environmentalist.
SADC. 2000. Protocol on Shared Watercourses. Gaborone, Southern African Development Community.
184
References
Ref
SADC. 2005. Regional Water Policy. Gaborone, Southern African Development Community.
SADC. 2006. Regional Water Strategy. Gaborone, Southern African Development Community.
SAPIA. 2007.
Southern African Plant Invaders Atlas. ARC Plant Protection Research Institute.
www.agis.agric.za/wip.
Schulze, R.E. 1995. Hydrology and Agrohydrology: A Text to Accompany the ACRU 3.00 Agrohydrological
Modelling System. Water Research Commission, Pretoria, RSA. Report TT 69/95. pp 552.
Schulze, R. E. 1997. South African Atlas of Agrohydrology and-Climatolgy. Water Research Commission,
Pretoria, RSA, Report TT 82/96. pp 276.
Schulze, R. E. 2003. The present is bad enough ... the future is not what it used to be ... and where
to now? Perspectives on climate variability and climate change over southern Africa and adapting
to these. In: Schulze, R. E. (Ed). The Thukela Dialogue: Managing Water Related Issues on Climate
Variability and Climate Change in South Africa. Report to Dialogue on Water and Climate. University
of Natal, Pietermaritzburg, RSA, School of Bioresources Engineering and Environmental Hydrology,
ACRUcons Report, 44, 29-52.
Schulze, R.E. (ed) 2005. Climate change and water resources in southern Africa. Studies on Scenarios,
impacts, vulnerabilities and adaptation. WRC Report No: 1430/1/05. 470 pp
Schulze, R.E. 2005. Case Study 1: Changes in Hydroclimatic Baselines under Different Hypothetical, but
Plausible, Scenarios of Climate Change: Initial Findings on Sensitive and Robust Hydroclimatic Zones in
Southern Africa. In: Schulze, R.E. (Ed) Climate Change and Water Resources in Southern Africa: Studies
on Scenarios, Impacts, Vulnerabilities and Adaptation. Water Research Commission, Pretoria, RSA, WRC
Report 1430/1/05. Chapter 12, 233 - 240.
Schulze, R.E. 2005 (a) Case Study 2: Potential Impacts of Shifts in Hydroclimatic Zone on Design
Hydrology from Small Catchments in Southern Africa. In: Schulze, R.E. (Ed) Climate Change and Water
Resources in Southern Africa: Studies on Scenarios, Impacts, Vulnerabilities and Adaptation.
Water Research Commission, Pretoria, RSA, WRC Report 1430/1/05. Chapter 13, 241 - 247.
Schulze, R.E. 2005 (b) Selection of a Suitable Agrohydrological Model for Climate Change Impact Studies
over Southern Africa. In: Schulze, R.E. (Ed) Climate Change and Water Resources in Southern Africa:
Studies on Scenarios, Impacts, Vulnerabilities and Adaptation. Water Research Commission, Pretoria,
RSA, WRC Report 1430/1/05. Chapter 7, 95 - 110.
Schulze, R.E. 2005 (c). Setting the Scene: The Current Hydroclimatic "Landscape" in Southern Africa.
In: Schulze, R.E. (Ed) Climate Change and Water Resources in Southern Africa: Studies on Scenarios,
Impacts, Vulnerabilities and Adaptation. Water Research Commission, Pretoria, RSA, WRC Report
1430/1/05. Chapter 6, 83 - 94.
185
References
Ref
Schulze, R.E., and Dlamini, D.J.M. 2005. Case Study 3: Potential Impacts of a Hypothetical,
but Plausible, Climate Change Scenario on Within-Country Reservoir Management for Irrigation, and Out-
Of-Country Flow Obligations in the Mbuluzi Catchment, Swaziland. In: Schulze, R.E. (Ed) Climate Change
and Water Resources in Southern Africa: Studies on Scenarios, Impacts, Vulnerabilities and Adaptation.
Water Research Commission, Pretoria, RSA, WRC Report 1430/1/05. Chapter 14, 249 - 254.
Schulze, R.E., Horan, M.J.C. and Gray, R. 2005. Sensitivity Studies of Hydrological Responses in the
Thukela Catchment to Spatial and Temporal Representations When Using a Baseline and a Projected
Future Climate Scenario. In: Schulze, R.E. (Ed) Climate Change and Water Resources in Southern Africa:
Studies on Scenarios, Impacts, Vulnerabilities and Adaptation. Water Research Commission, Pretoria,
RSA, WRC Report 1430/1/05. Chapter 11, 211 - 232.
Schulze, R.E., Hewitson, B.C., Vogel, C. and Engelbrecht, F. 2005 (a). Synthesis and Recommendations
for Future Research. In: Schulze, R.E. (Ed) Climate Change and Water Resources in Southern Africa:
Studies on Scenarios, Impacts, Vulnerabilities and Adaptation. Water Research Commission, Pretoria,
RSA, WRC Report 1430/1/05. Chapter 28, 453-455.
Schulze, R.E., Lumsden, T.G., Horan, M.J.C., Warburton, M. and Maharaj, M. 2005 (b). An Assessment
of Impacts of Climate Change on Agrohydrological Responses Over Southern Africa. In: Schulze, R.E. (Ed)
Climate Change and Water Resources in Southern Africa: Studies on Scenarios, Impacts, Vulnerabilities and
Adaptation. Water Research Commission, Pretoria, RSA, WRC Report 1430/1/05. Chapter 9, 141 - 189.
Science in Africa. 2002. Debate on the Trout Conservancy. Science in Africa Magazine, May 2002.
www.scienceinafrica.co.za/2002/may
State of Rivers Report. 2003. Free State Region River Systems. River Health Programmes Report.
Technical Task Team 2007a. Workshop Report: Inception Workshop and Transboundary Diagnostic Analysis
Training. 13-16 March, 2007, Morula Sun, Pretoria, South Africa.
Technical Task Team 2007b. Workshop Report: Causal Chain Analysis. 15-18 May, 2007, Gobabeb Training
and Research Centre, Namibia.
Tekateka, R. and Malzbender, D. (forthcoming). Transboundary Water Management Issues under the NWA
and Regional Collaboration, Policies and Conventions. Chapter 13 in Schreiner, B. and Rashid, H. (Eds).
A Policy Framework for Transforming Water Management in South Africa. Pretoria, DWAF.
Turpie, J; Winkler, H, Spalding-Fecher & Midgley, G. 2002. Economic Impacts of Climate Change in
South Africa: A Preliminary Analysis of Unmitigated Damage Costs Southern Waters Ecological Research
& Consulting & Energy & Development Research Centre University of Cape Town. Sponsored by USAID and
administered by the Joint Center for Political and Economic Studies Inc. under a subcontract agreement
from Nathan Associates Inc. RSA. 64 pp.
186
References
Ref
Turpie, J.K., Adams, J.B., Joubert, A., Harrison, T.D., Colloty, B.M., Maree, R.C., Whitfield, A.K.,
Wooldridge, T.H., Lamberth, S.J.,Taljaard, S. & Van Niekerk, L. 2002. Assessment of the conservation
priority status of South African estuaries for use in management and water allocation. Water SA 28: 191-206.
Tyson, P. D. 1986. Climatic Change and Variability over Southern Africa. Oxford University Press,
Cape Town, South Africa
Van Veelen, M and JB van Heerden 1998a. Orange River Development Project Replanning Study: Water
Quality Aspects: Orange River Basin. Vol 1: Expected Water Quality Changes. Unpublished Report,
Department of Water Affairs and Forestry.
Van Veelen, M and JB van Heerden 1998b. Orange River Development Project Replanning Study: Water
Quality Aspects: Orange River Basin. Vol 2: Water Quality Guidelines. Unpublished Report, Department
of Water Affairs and Forestry.
Viljoen, MF and RJ Armour 2002. "The Economic Impact of Changing Water Quality on Irrigated
Agriculture in the Lower Vaal and Riet Rivers." WRC Rep No 947/1/02.
Vogel, C. and Reid, P. 2005. Vulnerability, Adaptive Capacity, Coping and Adaptation: A Conceptual
Framework. In: Schulze, R.E. (Ed) Climate Change and Water Resources in Southern Africa: Studies on
Scenarios, Impacts, Vulnerabilities and Adaptation. Water Research Commission, Pretoria, RSA, WRC
Report 1430/1/05. Chapter 21, 351-358.
Volschenk, T, MV Fey and HL Zietsman 2005. "Situation Analysis of Problems for Water Quality
management in the Lower Orange River Region with Special Reference to the Contribution of the Foothills
to Salinisation." WRC Report No. 1358/1/05.
Vosloo, R and H Bouman 2005. "Survey of Certain Persistent Organic Pollutants in
Warburton, M. and Schulze, R.E. 2005. Detection of Climate Change: A Review of Literature on Changes
in Temperature, Precipitation and Streamflow, on Detection Methods and Data Problems. In: Schulze,
R.E. (Ed) Climate Change and Water Resources in Southern Africa: Studies on Scenarios, Impacts,
Vulnerabilities and Adaptation. Water Research Commission, Pretoria, RSA, WRC Report 1430/1/05.
Chapter 15, 257 - 274.
Warburton, M. and Schulze, R.E. 2005 (a). Detection of Trends over Time in Hydrological Drivers and
Responses over Southern Africa. In: Schulze, R.E. (Ed) Climate Change and Water Resources in Southern
Africa: Studies on Scenarios, Impacts, Vulnerabilities and Adaptation.
Water Research Commission,
Pretoria, RSA, WRC Report 1430/1/05. Chapter 17, 297-318.
Warburton, M. and Schulze, R.E. 2005 (b).
Historical Precipitation Trends over Southern Africa: A
Hydrology Perspective. In: Schulze, R.E. (Ed) Climate Change and Water Resources in Southern Africa:
Studies on Scenarios, Impacts, Vulnerabilities and Adaptation. Water Research Commission, Pretoria,
RSA, WRC Report 1430/1/05. Chapter 19, 325-338.
187
References
Ref
Warburton, M. and Schulze, R.E. 2005 (c) . On the Southern African Rainfall Station Network and its Data
for Climate Change Detection and Other Hydrological Studies. In: Schulze, R.E. (Ed) Climate Change and
Water Resources in Southern Africa: Studies on Scenarios, Impacts, Vulnerabilities and Adaptation. Water
Research Commission, Pretoria, RSA, WRC Report 1430/1/05. Chapter 20, 339-348.
Warburton, M., Schulze, R.E. and Maharaj, M. 2005. Is South Africa's Temperature Changing? An Analysis
of Trends from Daily Records, 1950 - 2000. In: Schulze, R.E. (Ed) Climate Change and Water Resources in
Southern Africa: Studies on Scenarios, Impacts, Vulnerabilities and Adaptation. Water Research
Commission, Pretoria, RSA, WRC Report 1430/1/05. Chapter 16, 275-295.
Witt, A. 2007. Personal Communication. Division Manager, Plant Protection Research Institute,
Agricultural Research Council, South Africa.
World Commission on Dams (WCD) Secretariat. 2000. Orange River development project. WCD Pilot
Case Study. www.dams.org
188
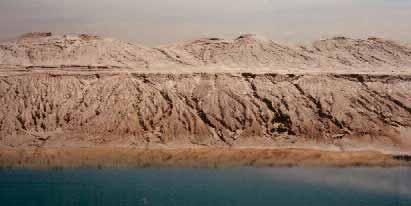

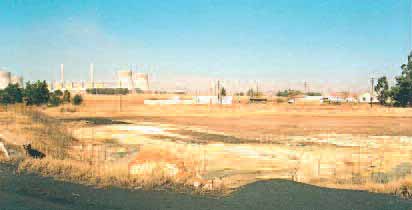
Appendix 1: Plates illustrating section 4.3
App1
189
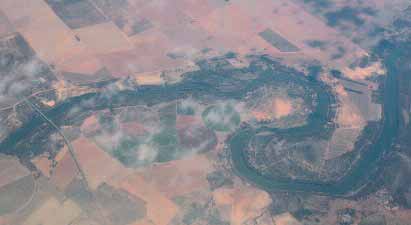
Appendix 1: Plates illustrating section 4.3
App1
190
Appendix 1: Plates illustrating section 4.3
App1
191
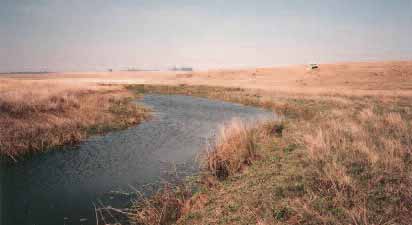
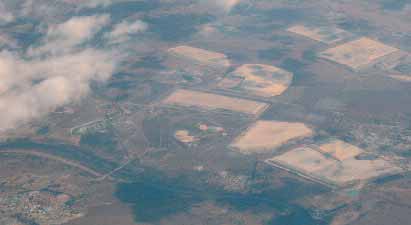
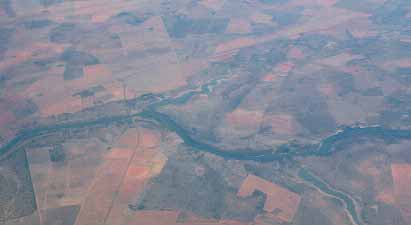
Appendix 1: Plates illustrating section 4.3
App1
192
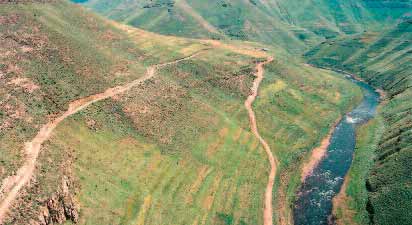
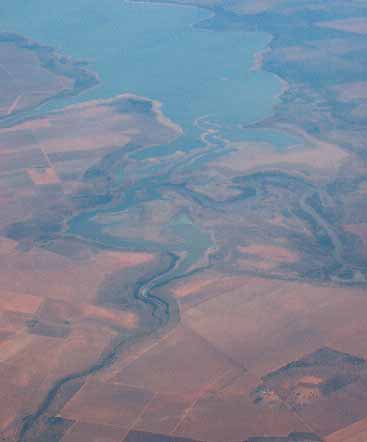
Appendix 1: Plates illustrating section 4.3
App1
193
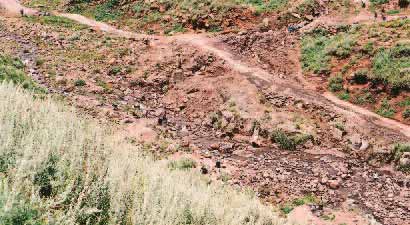
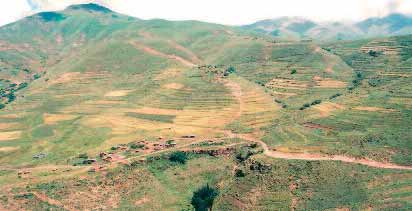
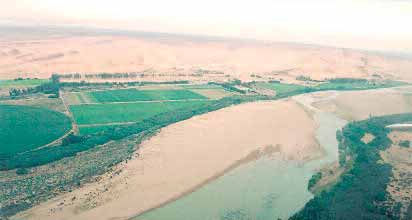
Appendix 1: Plates illustrating section 4.3
App1
194
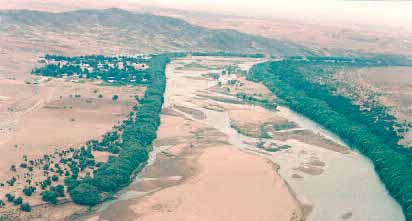
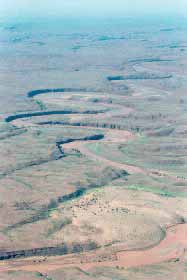
Appendix 1: Plates illustrating section 4.3
App1
195
Appendix 2: List of tables
App2
List of Tables
Table 1: South Africa's Adaptation Framework for Climate Change impacts on the water sector
Table 2: Policies addressing IWRM in Namibia
Table 3: Major bulk water transfers into and out of the Orange-Senqu River system
Table 4: Summary of Water Demands on the Orange-Senqu River System
Table 5: User Categories and Priority Classifications used for the Vaal System
Table 6: User Categories and Priority Classifications for the Orange River System
Table 7: Water productivity by country and industry in the Orange-Senqu river basin, excluding the Vaal
in terms of GDP per m_ of water used per annum, (Rands, 2000)
Table 8: Water productivity for sectors in the Vaal river basin in terms of willingness to pay (1998)
Table 9: The annual economic value of water in the Vaal river system measured in terms of willingness
to pay (1998)
Table 10: Results of Historic Yield Analysis for Different Development Scenarios
Table 11: Summary of Expected Savings through Water Demand Management Initiatives in the irrigation
sector (2004 Values)
Table 12: OrangeŁSenqu water requirements
Table 13: Orange-Senqu System: Total reservoir storage and water requirements in 2005
Table 14: Summary of 10-year average phosphate (PO4) and dissolved inorganic nitrogen (DIN)
concentrations in the Vaal catchment
Table 15: TDS increase as a ratio along the length of the Vaal River from its origin
Table 16: Average TDS Concentrations in the Vaal River compared to Acceptable Water Quality Objectives
Table 17: Salt concentration at various locations along the Orange River
Table 18: Comparison of the main characteristics of synthetic pesticides
(after Hellawell, 1986 reported in Heath and Claasen, 1999)
Table 19: Summary of the PCB-TEQ, PCDD/PCDF-TEQ and total TEQ of the Vaal and Orange catchment
sites (adapted from Vosloo and Bouwman, 2005)
Table 20: Comparative economic figures for a 100 000 ha block of land employing different
land-use activities
Table 21: Some costs of land degradation incurred to households per year
196
Appendix 3: List of figures
App3
List of Figures
Figure 1: Map of the Orange-Senqu basin
Figure 2: Map showing average annual rainfall in the Orange-Senqu basin
Figure 3: Stepwise sectoral analysis approach to developing a causal chain
Figure 4: Map showing evapotranspiration in the Orange-Senqu basin
Figure 5: Map showing the Orange-Senqu Basin and sub-catchments
Figure 6: Current and predicted future distribution of biomes in South Africa
Figure 7: Map showing vegetation biomes in the Orange-Senqu basin
Figure 8: Map showing land cover in the Orange-Senqu basin
Figure 9: Map showing population density in southern Africa
Figure 10: Map showing major land-uses in the Orange-Senqu basin
Figure 11: Map showing land capability in the Orange-Senqu basin
Figure 12: Proposed organisational structure of the water sector in Lesotho
Figure 13: Organogram of WRM in Namibia (Source: Adapted from MWAF, 2007)
Figure 14: Water related planning in the national planning framework (SA); Source: DWAF, 2004
Figure 15: Map showing administrative regions, provinces and districts in the Orange-Senqu basin
Figure 16: Map showing major water infrastructure in the Orange-Senqu basin
Figure 17: Causal Chain Analysis for stress on ground and surface water resources
Figure 18: Time series of monthly flow volumes, 1947 to 1987 - natural
Figure 19: Time series of monthly flow volumes in 2005
Figure 20: Lower Orange River at Augrabies. Sample probability, distribution of annual flow volumes,
1947 to 1987
Figure 21: Lower Orange River at Augrabies. Mean and standard deviation of monthly flow volumes,
1947 to 1987.
Figure 22:Lower Orange River at Augrabies. Sample probability distribution of annual flow volumes,
1947 to 1987
Figure 23: Causal Chain Analysis for changes to the hydrological regime
Figure 24: Map of the Vaal River sub-basin showing the location of monitoring points
Figure 25: PO4 in the Vaal catchment
Figure 26: DIN concentrations in the Vaal catchment
Figure 27: Average DIN concentrations in the Vaal Catchment
Figure 28: Average TDS in Vaal River compared to acceptable RWQO targets
Figure 29: Causal Chain Analysis for declining water quality
Figure 30: Map showing land capability in the Orange-Senqu basin
Figure 31: Causal Chain analysis for land degradation
Figure 32: Causal Chain analysis for the transboundary problem of increases in alien invasive species in
the Orange-Senqu River Basin
Figure 33: Stakeholder perceptions regarding current water management
Figure 34: Stakeholder perceptions on who benefits least from current water management
Figure 35: Stakeholder sources of information on water related matters
197