BLACK SEA TRANSBOUNDARY
DAGNOSTC ANALYSS
May 2007
TABLE OF CONTENTS
EXECUTIVE SUMMARY ...................................................................................................... 1
1.
INTRODUCTION ............................................................................................... 9
2.
METHODOLOGY ............................................................................................ 11
2.1 The 1996 Black Sea TDA ................................................................................... 11
2.2
The 2006 Black Sea TDA ................................................................................... 11
2.3
Identification of priority transboundary issues ................................................. 12
2.4
Development of thematic reports ....................................................................... 12
2.5
Development of causal chains for priority transboundary problems ............ 13
2.6
Hot-spots analysis ................................................................................................ 14
2.7
Stakeholder analysis ............................................................................................ 14
2.8
Governance analysis ........................................................................................... 14
3.
DESCRIPTION OF THE BLACK SEA REGION ........................................... 17
3.1
Physical and geographical characteristics ....................................................... 17
3.1.1 Geographic boundaries ....................................................................................... 17
3.1.2 Bathymetry .......................................................................................................... 18
3.1.3 Coastline characteristics ...................................................................................... 18
3.1.4 River discharge ................................................................................................... 19
3.1.5 Climate, agricultural production and river discharge ......................................... 19
3.2
Socio-economic situation .................................................................................... 22
3.2.1 Demographic trends ............................................................................................ 22
3.2.2 Economic indicators ............................................................................................ 24
3.2.3 Social indicators .................................................................................................. 28
3.3
Biodiversity and ecosystem health .................................................................... 30
3.1.1 Introduction ......................................................................................................... 30
3.1.1 Ecosystem and habitat types ............................................................................... 30
3.3.2 Phytoplankton and zooplankton .......................................................................... 31
3.3.3 Seaweeds and zoobenthos ................................................................................... 33
3.3.4 Large fauna ......................................................................................................... 35
3.3.5 Alien species introduction ................................................................................... 36
3.3.6
Loss/decline of biodiversity at the species level Ł IUCN red list species ...... 37
3.3.7
Protected areas ................................................................................................ 37
3.3.8 Status of fisheries ................................................................................................ 38
3.4
Status of chemical pollutants .............................................................................. 39
3.4.1 Water column ...................................................................................................... 40
3.4.2 Sediment ............................................................................................................. 41
3.5
Status of the nutrient regime .............................................................................. 43
3.6
Institutional setting and stakeholders ................................................................ 45
3.6.1 Institutional setting.............................................................................................. 45
3.6.2 Stakeholders ........................................................................................................ 45
3.7
Public perception of environmental status, causes and responsibilities ..... 47
4.
PRIORITY TRANSBOUNDARY PROBLEMS .............................................. 49
4.1
Key transboundary problems and priority scores ............................................ 49
4.2
Nutrient over-enrichment/eutrophication .......................................................... 50
4.2.1
The problem .................................................................................................... 50
4.2.2
Environmental impacts and socio-economic consequences ........................... 51
4.2.3 Linkages with other transboundary problems ..................................................... 54
4.2.4 Immediate causes ................................................................................................ 55
4.2.5 Underlying causes ............................................................................................... 65
i
4.2.6 Knowledge gaps .................................................................................................. 68
4.2.7 Summary and preliminary recommendations ..................................................... 68
4.3
Changes in commercial marine living resources ............................................ 71
4.3.1
The problem .................................................................................................... 71
4.3.2 Environmental impacts and socio-economic consequences ............................... 74
4.3.3 Linkages with other transboundary problems ..................................................... 77
4.3.4 Immediate causes ................................................................................................ 79
4.3.5 Underlying causes ............................................................................................... 83
4.3.6 Knowledge gaps .................................................................................................. 85
4.3.7 Summary and preliminary recommendations ..................................................... 85
4.4
Chemical pollution, including oil ......................................................................... 88
4.4.1
The problem .................................................................................................... 88
4.4.2 Environmental impacts and socio-economic consequences ............................... 89
4.4.3 Linkages with other transboundary problems ..................................................... 90
4.4.4 Immediate causes ................................................................................................ 91
4.4.5 Underlying causes ............................................................................................... 99
4.4.6 Knowledge gaps ................................................................................................ 103
4.4.7 Summary and recommendations ....................................................................... 104
4.5
Biodiversity changes, including alien species introduction .......................... 107
4.5.1 The problem ...................................................................................................... 107
4.5.2 Environmental impacts and socio-economic consequences ............................. 107
4.5.3 Linkages with other transboundary problems ................................................... 111
4.5.4 Immediate and underlying causes ..................................................................... 112
4.5.5 Underlying socio-economic drivers .................................................................. 118
4.5.6 Knowledge gaps ................................................................................................ 118
4.5.7 Summary and preliminary recommendations ................................................... 119
5.
HOT-SPOTS ANALYSIS ............................................................................... 123
5.1
Identified capital investments completed ........................................................ 123
5.2
Identified capital investments started .............................................................. 125
5.3
Work still required............................................................................................... 125
6.
GOVERNANCE Ł LEGAL AND INSTITUTIONAL ANALYSIS OF THE
BLACK SEA REGION ........................................................................................................ 127
6.1
Introduction .......................................................................................................... 127
6.2
Institutional analysis ........................................................................................... 127
6.2.1 Regional institutions ......................................................................................... 128
6.2.2 National institutions for regional cooperation .................................................. 131
6.3
Policy/legal analysis ........................................................................................... 137
6.3.1 International legislation and agreements .......................................................... 137
6.3.2 National legislation ........................................................................................... 138
6.4
Conclusions ......................................................................................................... 139
7.
STAKEHOLDER ANALYSIS ........................................................................ 141
7.1
Introduction .......................................................................................................... 141
7.2
Environmental perceptions of stakeholders ................................................... 141
7.3
Priority issues for stakeholder groups ............................................................. 146
7.4
Nutrient over-enrichment/eutrophication ........................................................ 148
7.5
Decline in commercial fish species/stocks ..................................................... 151
7.6
Chemical pollution (including oil) ..................................................................... 153
7.7
Habitat and biodiversity changes (including alien species introduction) ... 154
7.8
Summary and preliminary recommendations ................................................ 155
8.
CONCLUSIONS AND NEXT STEPS ............................................................ 157
ii
8.1
Conclusions ......................................................................................................... 157
8.2
Next steps ............................................................................................................ 159
REFERENCES ..................................................................................................................... 161
Annex 1:
GLOSSARY OF TERMS ................................................................................ 167
Annex 2:
ABBREVIATIONS AND ACRONYMS ........................................................ 171
Annex 3:
LIST OF CONTRIBUTING SPECIALISTS................................................... 175
Annex 4:
MAIN BLACK SEA HABITATS AND CRITICAL HABITATS AT
NATIONAL LEVEL ............................................................................................................ 177
Annex 5:
INVENTORY OF AQUATIC AND SEMI-AQUATIC RED LIST SPECIES,
ENDANGERED IN AT LEAST ONE COUNTRY AROUND THE BLACK SEA ........... 180
Annex 6:
INVENTORY OF AQUATIC AND SEMI-AQUATIC ALIEN SPECIES
INTRODUCED TO THE BLACK SEA AND COASTAL HABITATS ............................ 190
Annex 7:
GROUPS USED IN THE STAKEHOLDER ANALYSIS ............................. 212
Annex 8:
MINIMUM FISH SIZES FOR LANDING IN BLACK SEA COUNTRIES . 218
Annex 9:
LANDFILL DATA .......................................................................................... 220
Annex 10:BOD5 LOADS ...................................................................................................... 232
Annex 11:IMPLEMENTATION OF HOT-SPOTS CAPITAL INVESTMENTS
IDENTIFIED IN THE 1996 TDA ........................................................................................ 236
Annex 12:EXISTING PROTOCOLS TO THE BUCHAREST CONVENTION ................ 242
Annex 13:INTERNATIONAL CONVENTIONS AND THEIR RATIFICATION STAGE
244
Annex 14:INTERNATIONAL COOPERATION THROUGH BI/TRI-LATERAL
AGREEMENTS .................................................................................................................... 248
Annex 15:RELEVANT NATIONAL LEGISLATION ........................................................ 250
iii
iv
EXECUTIVE SUMMARY
Introduction
The Black Sea covers an area of 423,000 km2, is over 2 km deep and drains an area of 1.9
million km2 (one-third of continental Europe) containing over 160 million inhabitants. The
coastal zone1 contains a poulation of some 20 or 39 million people, depending on whether
the Istanbul administrative unit is included in the total. This has a short Black Sea coastline.
The Sea has six coastal countries: Bulgaria, Georgia, Romania, the Russian Federation,
Turkey and Ukraine.
The Sea is enclosed by land; its only connection with the World's Oceans being via the
Turkish Bosphorus Strait, which links it with the Mediterranean (via the Sea of Marmara).
Some 90% of the Sea is naurally anoxic (contains no oxygen), but the top 150 m layer
represents an area of great biological productivity, providing the employment basis for
hundreds of thousands of people.
This report represents the second Black Sea transboundary diagnostic analysis (TDA), the
first of which was produced in 1996. It assesses the environmental status of the Sea, focusing
on the major transboundary problems, their causes and what should be done to improve its
status in the future. The structure and content of this document are different to that of the
1996 TDA, since guidance on TDA production has changed in the intervening years and
instead of the original seven major transboundary problems, it now focuses on only four:
Ę Eutrophication/nutrient enrichment
Ę Changes in marine living resources
Ę Chemical pollution (including oil)
Ę Biodiversity/habitat changes, including alien species introduction
For each of these a causal chain analysis is included, to assist in the identification of
solutions for each of the problems. The emphasis of this document is on changes that have
occurred since the original TDA was produced. However, socio-economic developments and
environmental data over a longer period of time are also considered to place the current
status in context, and describe the reasons underlying changes observed.
Socio-economic changes
The Black Sea Region has undergone major socio-economic changes over the past 20 years.
The regional economic collapse at the end of the 1980s, with the resulting break-up of the
Soviet Union and birth of the CIS2 countries, together with a much less dramatic but still
influential economic slow-down in 1997-98 have had major social and environmental
implications. Since 2000, personal wealth has increased, but not as rapidly as inflation.
Furthermore, this increase in wealth has been concentrated in the hands of a small number of
very rich individuals. The size of the middle class remains small. The economies and
infrastructure of all countries have been struggling with the problem of rural-urban migration
since the 1960s, a trend which is continuing and has led to the development of Istanbul,
spanning the Bosphorus Strait, as a city which now contains about 15 million people. The
lack of data provided on pollution inputs (nutrients and toxic substances) to the Black Sea
1 Defined as one `administrative unit' inland from the Sea
2 Commonwealth of Independent States.
1
from both the Bosphorus and Kerch straits is considered a major weakness of this
assessment.
As the economies have changed, so has the importance of different sectors in contributing to
national wealth. In particular, agriculture has slumped as a contributor to national GDP since
1994 (most dramatically in Georgia), with a less dramatic fall in manufacturing industry, but
these have been more than offset by the increase in importance of the service sector (again,
most notably in Georgia).
Ecological changes
For management and reporting purposes it is useful to consider environmental changes in
carefully-defined steps, stages or classes. Indeed, classification schemes are used in this
report. However, in reality the shift from pristine to catastrophic damage is a perfect
glissando; a smooth transition; albeit one in which the rates of change are different in
different areas of the Sea, with emphasis having been placed on the NW Shelf. The Sea is
still degraded, but substantial improvements have occurred over the past 10-15 years. This is
demonstrated by changes in the plankton, fish and benthic invertebrate communities. In
addition, the area affected by oxygen depletion (hypoxia) is now much smaller than in the
1980s and early 1990s, and those areas which are still affected by hypoxia are impacted to a
lesser extent. Ecological change was very rapid in the 1990s and has continued through the
early 2000s, with the emphasis of this change having been on both adaptation and recovery.
The introduction of so many exotic species has meant that even if the chemical environment
of the Sea is restored to its 1960s status, the ecology of the Sea would not return to its former
state.
Eutrophication/nutrient-enrichment
This decrease in the importance of agriculture as an economic powerhouse of the region has
been clearly shown by decreasing trends in livestock numbers and a shift from major
livestock farms to small-scale or subsistence-level farming. Livestock numbers (excluding
poultry) in 2004 were about two-thirds of those present 1997, and about one-third of the
numbers recorded in 1998. Likewise, inorganic fertiliser application rates in Romania in
2004 were about one-third of what they were prior to the collapse of the Soviet Union.
During the early years of this century fertiliser application rates were substantially higher in
Turkey than in other Black Sea countries; Bulgaria, Georgia and Romania formed a middle
group; and the lowest fertiliser application rates were found in the Russian Federation and
Ukraine. Indicators suggest that the decline in agriculture may have bottomed-out, so a
gradual re-intensification of agricultural practices may begin in the near future.
Direct discharges from large municipal/industrial plants to the Sea account for only about
2% of the inorganic nitrogen and 13% of the phosphate load discharged to the Sea via rivers,
of which the Danube is by far the most important. This accounts for about 84% of the river-
borne inorganic nitrogen load and 49% of the river-borne phosphate load, from a river
accounting for 67% of the freshwater input. Available information suggests that atmospheric
deposition of nitrogen to the Sea may be of a similar order of magnitude to river loads, but
there is considerable uncertainty over the data used.
Between 1996 and 2005 river-borne loads of both inorganic nitrogen and phosphate fell by
30. This is very encouraging for the future status of the Sea, but this decrease in nutrient
loads is overwhelmingly the result of economic decline and slump in agricultural
productivity rather than due to improved regional environmental management. For these
2
improvements to be maintained in the future it is essential that procedures and legislation are
put in place to prevent the situation from reversing as regional economic improvements
occur.
The following recommendations are made:
Ę Improve routine Black Sea nutrient monitoring/reporting in at least 3 countries:
Bulgaria, Georgia and Ukraine. All countries should monitor the Black Sea with the
same sampling frequency to improve data comparability.
Ę Measure riverine and municipal/industrial nutrient discharge concentrations (for the
estimation of loads) as total N and total P. Inorganic nitrogen and ortho-phosphate
measurements are a poor substitute for calculating loads.
Ę Place a much greater emphasis on nutrient management in agriculture, notably the
development, adoption and enforcement of best agricultural practice guidelines,
including revised guidance on fertiliser (organic and inorganic) fertiliser application
rates, together with a robust soil nutrient testing programme.
Ę Standardise and harmonise the quantification of river loads. Procedures giving
comparable results should be adopted for the assessment of loads at the most
downstream points in all major rivers discharging into the Black Sea.
Ę Develop a nutrient source apportionment model for the whole Black Basin to
improve existing understanding of nutrient sources.
Commercial marine living resources
Due to over fishing in the early 1970s-1980s, the structure of catches has shifted
significantly. Declining stocks of predatory species such as bonito, horse mackerel and
bluefish resulted in an increase in non-predatory species such as anchovy and sprat.
Consequently, fishing fleets have increasingly targeted these smaller species, resulting in
increased by-catches of larger, less abundant fish species.
Commercially important marine living resources have been greatly affected by alien species
introductions, eutrophication, over-fishing and habitats change/damage. Annual total fish
catch statistics show an improving situation, but these figures are dominated by catches of
anchovy and sprat. There have been recent improvements in catches of some other fish, such
as bonito, but turbot, dogfish and whiting catches have either shown no improvement or have
fallen over the past decade-or-so. Sturgeons remain endangered. There is an absolute need to
develop a regionally agreed fishery policy, for which background work on the development
of a legally binding document has started. This needs to include agreed methods on and
participation in: (i) regional stock assessment exercises, since those countries which
currently undertake these use different methodologies and many of the assessments are out
of date; and (ii) catch per unit effort (CPUE) assessments. No robust CPUE methodology
exists for the same assessments to be made by all coastal countries.
The importance of Rapana, the Japanese Snail has increased and has helped to off-set the
decline in mussel and clam landings (the decline being due, in large part, to predation by
Rapana anyway). The seafood industry is a major coastal employer, particularly in Turkey
which is responsible for some 80% of the total catch from the Sea. Aquaculture is not
strongly developed in the region and there is scope for this to be expanded, providing
environmental considerations are taken into account.
3
There contribution of illegal fishing activities to damage/change of marine living resources is
not clearly understood, but there a general acceptance that this is a causative factor. One
example cited from Romanian waters shows that this is, indeed, a considerable issue which
needs to be addressed.
The following recommendations are made:
Ę A regionally agreed system needs to be developed to match fishing effort to stocks
(prohibition periods, minimum admissible fish length, etc).
Ę Harmonise the methodologies for collection and collation of fisheries statistics at a
regional level
Ę Establish regionally agreed national fishing zones in all Black Sea countries
Ę Prohibit the use of non-sustainable fishing technologies (notably dragging and
bottom trawling).
Ę All countries should take greater effort to combat illegal fishing practices.
Ę Encourage expansion of the mariculture sector, but only if account is taken of
environmental considerations. The precautionary principal should be applied.
Ę Place a higher emphasis on ecological factors when making decisions on coastal
development.
Chemical pollution
Available data on individual pollutants in the water column an sediments are mapped out,
illustrating large differences in the number of sites for which results of individual parameters
are available. In general terms, considerable amounts of data were made available from the
Western edge and NW Shelf, of the Sea, with good spatial coverage but limited sampling
frequency and period of coverage along the Turkish cosat. Data from a surprisingly high
number of Georgian coastal sites were made available, albeit with a low number of
determinations for each site. Relatively few Russian or Ukrainian data were available.
An assessment of pollutant loads from river and large direct municipal/industrial discharges
is also presented. However, the pollution loads data are very incomplete, BOD5 being the
only parameter (apart from nutrients) that is routinely monitored from major point sources
and rivers. Relatively high contamination levels of some pesticides, heavy metals and PCBs
are present at specific sites in the Black Sea. The concentrations of some substances are in or
above the ranges used as Ecotoxicological Assessment Criteria by OSPAR, with illegal
dumping/discharges (particularly of agrochemicals) being recognised as a particular
problem. The historical poor enforcement of discharge standards and a failure to consider the
Sea itself as a receiving waterbody for discharges to river are considered to be the principal
reasons underlying the pollution status of the Sea.
A huge increase in the volume of oil being transported across the Black Sea and oil/gas
extraction from beneath the Sea itself have greatly increased the risk of oil pollution. This
presents two types of problem: (i) localised chronic pollution stemming from frequent but
minor releases of oil; and (ii) acute pollution resulting from major oils spills. Remote sensing
data show that the majority of oil spills occur along major shipping routes, showing that
shipping, rather than land-based oil installations are the principal cause of concern. In
particular, where ships eneter the Sea through the Bosphorus Strait appears to be an area of
frequent ship-derived oil spills, with sediment total petroleum products results supporting the
remote sensing imagery data.
4
The following recommendations are made:
Ę Develop a regionally agreed list of priority pollutants for monitoring purposes.
Ę Develop robust national quality assurance programmes for the
intercomparation/intercalibation of chemical concentration and flow data from point
sources.
Ę Harmonise environmental standards (discharge and environmental water/sediment
quality standards) throughout the Region.
Ę Produce a regional manual for data handling.
Ę Establish national plans to reduce/prevent pollution of the Black Sea.
Ę Build the capacity of environmental authorities to enforce existing regulations on the
discharge of priority pollutants from both point and diffuse sources.
Ę Develop national/regional public awareness programmes to promote bottom-up
pressure on decision makers in order to improve the environmental status of the
Black Sea
Ę Establish an inter-state ministerial mechanism to enable a quick response to major
pollution events.
Ę Develop/adopt an agreed transboundary environmental impact assessment
methodology to assist with transboundary projects in the region
Ę Reduce pollution loads by the application of best available technology and
introduction/enforcement of best agriculture practice.
Ę Provide assistance to industrial sectors (including mining enterprises) to develop
Environmental Management Systems and practice cleaner production activities
Ę Develop a network of farmer support services for raising awareness in the application
of fertilizers, pesticides and herbicides.
Ę Production of a code of practice for data handling and transfer for use by all national
institutions reporting to the BSC and the Premanent Sectretariat itself.
Biodiversity
The structure of marine ecosystems differs from that of the neighbouring Mediterranean Sea
in that species variety is lower and the dominant groups are different. However, the
abundance, total biomass and productivity of the Black Sea are much higher than in the
Mediterranean Sea. Plankton community composition and biomass suggest that
improvements are taking place, albeit that a reduction in organic enrichment is key to this
recovery.
Formerly "dead" areas of the NW Shelf sediment are once again colonised by biota, with
evidence of biodiversity continuing to increase. The once massive area dominated by
Zernov's Phyllophora (a red seaweed) field has decreased hugely in area, having been
replaced by other, opportunistic macroalgae. Similarly, during the last two decades, the area
covered by eelgrass (Zostera) has decreased tenfold in shallow waters.
The Phyllophora field once provided a habitat for 118 species of invertebrates and 47 species
of fish. The Black Sea macrozoobenthos is represented by approximately 800 species, and
the fish fauna by 171 species. There are 320 bird species in the Danube Delta and 4 species
of Mammals are found in the Sea.
Higher species richness in shallower waters is associated with good dissolved oxygen
conditions whilst in deeper areas there is lower diversity due to natural oxygen depletion
5
with increasing depth in the Black Sea. Consequently, the number of macrobenthic species
decreases rapidly with increasing depth - only the polychaete worm Notomastus profundus is
found below a depth of about 120 m.
The invasion of Mnemiopsis leidyi (a comb jelly) contributed to a catostrophic decline in fish
productivity in the 1980s. The subsequent invasion of a another comb jelly (Beroe ovata),
which feeds on the original invader, means that opinions are now split as to whether
Mnemiopsis is still has a major impact on fish communities and catches.
The number of registered alien species at the regional level amounts to 217 (parasites and
mycelium excluded). Nearly half of them (102) are permanently established, a quarter -
highly or moderately invasive (20 and 35 species respectively). This high ratio of invasive
aliens suggests a serious impact on the Black Sea native biological diversity, with negative
consequences for human activities and economic interests.
Between 1996 and 2005 a total of 48 new alien species were recorded, which represents over
22 % of all registered aliens. The majority belong to phytoplankton (16) and zoobenthos
(15), followed by zooplankton (8), fish (5), macroalgae (3) and mammals (1).
Habitat status is a critical component of maintaining high levels of biodiversity within the
Black Sea. The status of marine habitats is therefore assessed. All 5 habitats within the
coastal margin ecotones category are considered to be in a critical status in at least one
country; both types of benthic pelagic habitat (neritic and open sea) are considered critical in
at least one country; and 13 of the 37 types of benthic habitat are considered to be critical in
at least one country. No data were available on Russian Black Sea habitats. The ecosystem(s)
of the Black Sea are, therefore, seriously damaged and in need of legal protection. Those
habitats most at risk include the neritic water column, coastal lagoons, estuaries/deltas and
wetlands/saltmarshes.
The following recommendations are made:
Ę Continue capacity-building and training of marine scientists.
Ę Allow environmentalists greater access to key decision-makers in organisations
throughout the Black Sea region.
Ę Undertake regular re-evaluations of major marine systematic (biological) groups in
each of the BS countries, using the latest IUCN criteria and guidelines for application
at the regional level.
Ę Develop a habitat- and ecosystem- oriented approach to biodiversity management.
Often it is clearer which impacts are responsible for the deterioration of habitats than
it is for individual species
Ę Once national Red Lists on habitats and biota have been completed, a Red Book of
Habitats, Flora and Fauna of the Black Sea should be created. This should serve as a
tool for conservation management at the regional level.
Ę Increase the number and area of Marine Protected Areas.
Ę Improve and back-up management strategies to prevent the introduction of new
invasive species. These should target the priority vectors of introduction Ł ships
(ballast water) and aquaculture.
Causal chain analyses
6
Many of the immediate, underlying and root causes of individual problems are shared with
other problems. In particular, the causal chain analyses for nutrient enrichment and chemical
pollution are very similar, since the majority of sources of chemical pollution are also
sources of nutrients. For biodiversity, the failure to adequately treat ship ballast water is
regarded as being an important cause of the problem, and for changes commercial marine
living resources the remaining three major problems are clearly contributory factors. For
biodiversity-related problems, the importance of eutrophication is considered to have been
greatly under-estimated, both by stakeholders and, indeed, by contributors to this report.
It is clear, therefore that the four transboundary problems cannot be dealt with individually.
Improvements in management of one problem will have knock-on effects for other problems,
and addressing individual causes is likely to improve the situation with regard to at least two,
if not more, of the four environmental problems. For example, one of the causes of all four of
the environmental problems covered in this report is that of poorly regulated coastal
development. A brief tour around the Region reveals the huge scale of this, with the
economic importance of tourism increasing rapidly. The six countries all agree with the
`ecology tenet' underlying integrated coastal zone management, i.e. that coastal development
should take account of marine ecology, conservation and biodiversity, but the underlying
institutional structures vary considerably between countries. There are many examples where
money has spoken louder than words.
Hot-spots analysis
A review of planned and proposed capital investments on pollution point sources identified
from the 1996 TDA has shown disappoint results. Of the 50 investments initially identified,
only 12 have been completed and 2 are no longer required (mis-identification as the reason
for one site, and a change in use of the facility as the reason for the other). A decade later,
work is in progress on another 10 point sources, but over half of the capital investments
originally identified have either been insufficiently funded or not funded at all. Capital
investment costs to address the identified 50 hot-spots were originally estimated to be almost
$400 million. By the end of 2005 at least $143 million had been spent on addressing these
point sources, with a further $340 million planned to be spent by the end of 2015.
Legal and institutional analysis
The results of a legal and institutional analysis of the region are also presented. The major
regional document for protecting the Black Sea is the Bucharest Convention. This now
appears out-dated and is unusual in that it excludes the Sea of Azov, but protocols to the
Convention can (and do) include it. The Convention established a Permanent Secretariat
(PS), which has worked under difficult conditions with respect to the level of staffing and the
uncertainty created by the lack of consistency in receiving national annual contributions. The
PS is supported by sixteen subsidiary bodies: six activity centres (only two of which have
funding to support the PS), seven advisory groups and three ad hoc working groups.
The aims of the Permanent Secretariat have been over-ambitious, given its resources, with
the result that little progress has been achieved. There has been a lack of focus on outputs
from the Advisory Groups, and to date there has been little accountability. The outputs of
Advisory Groups are not generally used by decision makers in the Black Sea countries
because they are seen as being irrelevant to policy making or because national
funding/political back-up has been insufficient. One example of this is the development and
undertaking of the Black Sea Integrated Monitoring and Assessment Programme. Outputs of
this programme, robust monitoring results of the environmental status of the Black Sea,
7
should be one of the most important deliverables of the PS, but national funding of the
laboratories, staff and equipment to undertake this work has been lacking in a number of
countries.
National environmental legislation is relatively strong, but the enforcement of this legislation
has been weak. In Bulgaria and Romania, the EU Accession process has been (and is
continuing to be) good news for the environment. The capital investments (hot-spots)
analysis shows this to be the case, despite the fact that the majority of planned investments
are still to come on-line in the two EU Member States. Turkey is in the initial stages of its
EU accession negotiations and appears keen to comply with the capital investments and best
agricultural practice regulations required, so further environmental improvements should
accrue in the future. However, there is a need for improved cooperation between the
Environment and other Ministries in all countries.
Stakeholders analysis
Environmental management is complex, with huge numbers of individuals, ministries and
organizations involved; political changes further complicate the picture. The level of
complexity is illustrated in a Stakeholders analysis, which involved questioning
representatives of 42 stakeholder groups. This analysis revealed that 61% of respondents
considered the Black Sea to be unhealthy and, surprisingly, over 70% of people thought the
environmental health of the Black Sea region to be more important than economic
development. The vast majority of respondents agreed that the Sea was polluted and that
regional cooperation was important to address this issue. A considerable majority also agreed
that preserving endangered fish species was more important than meeting market demand for
seafood
Some 80% of respondents thought that if people knew more about the causes of
environmental problems they would want to make changes to improve matters, but overall,
they considered eutrophication to be less important than any of the other three transboundary
problems addressed in this document. The results are encouraging, but reveal that further
environmental education is required.
The following recommendations are made:
Ę Develop focused stakeholder involvement strategies for livestock industry and port
and harbour administrators to help them recognize and remedy actions that adversely
impact the Black Sea ecosystem.
Ę Target activities towards helping groups to adjust their current practices to more
environmentally sustainable approaches, in all areas and issues.
Ę Increase outreach efforts that emphasize the importance of biodiversity and habitat
conservation.
Ę Target efforts to inform stakeholder groupss about nutrient loading and
eutrophication, and provide alternative approaches to current waste water and
nutrient management practices.
Ę Develop an outreach programme that includes stakeholders from all fisheries sectors
to take steps towards addressing the causes of over-fishing.
Ę Develop targeted interventions for the tourism and recreation industry to help it to
take steps to avoid negatively impacting the waters of the Black Sea.
Ę Develop an outreach component for the BS Commission that links the economic
well-being of the region with the health of the Black Sea.
8
1. INTRODUCTION
The Black Sea is one of the most remarkable regional seas in the world. It is almost cut off
from the rest of the world's oceans, is over 2200 m deep and receives the drainage from a 1.9
million km2 basin covering about one third of the area of continental Europe. Its only
connection is through the Bosphorus Strait, a 35 km natural channel, as little as 40 m deep in
places. This channel has a two layer flow, carrying about 300 km3 of seawater to the Black
Sea from the Mediterranean along the bottom layer and returning a mixture of seawater and
freshwater with twice this volume in the upper layer. Every year, about 350 km3 of river
water enters the Black Sea from an area covering almost a third of continental Europe and
including significant areas of seventeen countries: Austria, Belarus, Bosnia and Herzegovina,
Bulgaria, Croatia, Czech Republic, Georgia, Germany, Hungary, Moldova, Slovakia,
Slovenia, Romania, Russia, Turkey, Ukraine, Yugoslavia. Europe's second, third and fourth
largest rivers (the Danube, Dnipro and Don) all flow to the Black Sea.
Isolation from the flushing effects of the open ocean, coupled with its huge catchment, has
made the Black Sea particularly susceptible to eutrophication (the phenomenon that results
from an over-enrichment of the sea by plant nutrients). Eutrophication has led to radical
changes in the Black Sea ecosystem in the past three decades with a major transboundary
impact on biological diversity and human use of the sea, including fisheries and recreation.
Prior to the 1990s, little or no action had been taken to protect the Black Sea. Political
differences during the Soviet era, coupled with a lack of general knowledge of the
environmental situation resulted in an absence of effective response. In 1992 the Black Sea
countries signed the Bucharest Convention followed closely by the first Black Sea
Ministerial Declaration (the Odessa Declaration) in 1993. This inspired the GEF and other
donors, particularly the European Union, to provide more than US$17 million support to the
region to help implement the Odessa Declaration and to formulate the longer-term Black Sea
Strategic Action Plan (BS SAP).
The Black Sea Environmental Programme (BSEP) was launched in June 1993. The
Programme included a number of interventions by the GEF, including the development of
the first Black Sea Transboundary Diagnostic Analysis (TDA), finalised in June 1996. On
the basis of this comprehensive report senior government officials negotiated the Black Sea
Strategic Action Plan (BS-SAP), signed on October 31st at a Ministerial Conference in
Istanbul.
Following the signature of the BS-SAP, GEF funding was sustained in order to enable
countries to complete National Black Sea Strategic Action Plans and for the negotiations on
the institutionalisation of the Istanbul Commission's Secretariat to be completed. This was a
very protracted three-year process as countries struggled to overcome technical and legal
issues of establishing the Secretariat. In the meantime however, progress was made in
implementing part of the BS-SAP due to GEF seed money and considerable support from the
European Commission. In October 2000, the Secretariat for the Black Sea Commission
became operational.
Further GEF Full Project funding was secured in 2002 with the commencement of the Black
Sea Ecosystem Recovery Project (BSERP). The project was split into two implementation
phases - Phase I (Apr 2002 - Oct 2004) and Phase II (Nov 2004 - Oct 2007). The project
supports regional aspects of the Black Sea Partnership for Nutrient Control and assists and
9
strengthens the role of the Black Sea Commission.
Further, the project was set up to ensure the provision of a suite of harmonised legal and
policy instruments for tackling the problem of eutrophication, and release of certain
hazardous substances, and to facilitate ecosystem recovery. An important feature of the
project has been its encouragement of broad stakeholder participation.
A cornerstone of this project is the development of a revised Black Sea TDA and SAP based
on the existing 1996 documents. This document is an objective, non-negotiated analysis
using best available verified scientific information and examines the state of the environment
and the root causes for its degradation. It will provide the factual basis for the formulation of
a Black Sea Strategic Action Programme (BS SAP), which will embody specific actions
(policy, legal, institutional reforms or investments) that can be adopted nationally, usually
within a harmonized multinational context, to address the major priority transboundary
problems identified in the TDA, and over the longer term, enable the sustainable
development and environmental protection of the Black Sea.
10
2. METHODOLOGY
2.1
The 1996 Black Sea TDA
The 2006 Black Sea TDA is the first significant update of the original Black Sea TDA
finalized in June 1996 under the GEF Black Sea Ecosystem Protection (BSEP) project.
The 1996 Black Sea TDA was a technical document which examined the root causes of
Black Sea degradation and options for actions which could be taken to address them. It
examined each major environmental problem, the stakeholders involved in the problem and
the uncertainties in the information describing the problem. It then proposed solutions, time
frames and costs.
.
The development of the 1996 TDA was a carefully implemented technical process spanning
more than two years. Initially, a series of thematic analyses were conducted at a national
level and then integrated by a group of regional and international specialists in order to
construct the Transboundary Diagnostic Analysis (TDA) of the Black Sea3. On the basis of
this document, senior government officials negotiated the Black Sea Strategic Action Plan
(BS-SAP) which was signed on October 31st 1996, at the Black Sea Ministerial Conference
in Istanbul.
2.2
The 2006 Black Sea TDA
The 2006 Black Sea TDA was expected to build on the existing 1996 document and it was
anticipated that it wouldn't adhere to the traditional TDA development process (as generally
used in 1st phase International Waters projects). However, current GEF requirements for
TDA development mean that the process needed to follow the GEF IW TDA/SAP "best
practice" approach4. This required careful management of the process between the Black Sea
Project Implementation Unit (PIU) and the Secretariat of the Black Sea Commission.
Consequently, the 2006 Black Sea TDA, developed between 20th December 2005 and xxth
November 2006, is an objective, non-negotiated assessment using best available verified
scientific information which examines the state of the environment and the root causes for its
degradation. It will provide the factual basis for the formulation of the revised Black Sea
SAP, which will embody specific actions (policy, legal, institutional reforms or investments)
that can be adopted nationally, usually within a harmonized multinational context, to address
the major priority transboundary problems, and over the longer term restore or protect the
Black Sea ecosystem.
The process proceeded according to the following `Best Practice' steps:
Ę Identification and initial prioritisation of transboundary problems
Ę Gathering and interpreting information on environmental impacts and socio-
economic consequences of each problem
Ę Causal chain analysis (including root causes)
Ę Completion of an analysis of institutions, laws, policies and projected investments
3 Full reference of 1996 TDA
4 Full reference of the GEF best practice approach
11
The TDA focuses on transboundary problems without ignoring national concerns and
priorities and identifies information gaps, policy distortions and institutional deficiencies.
The analysis is cross-sectoral and examines national economic development plans, civil
society (including private sector) awareness and participation, the regulatory and institutional
framework and sectoral economic policies.
2.3
Identification of priority transboundary issues
The first step in the TDA process was to agree on an initial list of transboundary problems in
the Black Sea, examine their transboundary relevance and scope, and determine preliminary
priorities.
At the first TDA TTT meeting (11th April 2006), the TTT, made up of 22 experts from the
Black Sea countries5, brainstormed the list of 23 common GEF transboundary problems in
order to determine their relevance and transboundary nature in the context of the Black Sea.
The priority transboundary problems were identified by assigning a score to each problem of
between 0 (no importance), 1 (low importance), 2 (moderate importance) and 3 (high
importance) to determine the relevance of the problem from the perspective of the present
day and 10-15 years in the future. When examining future change the TTT were asked to
consider the effects of climate change. The scoring activity was based on the following suite
of criteria:
Ę Transboundary nature of a problem.
Ę Scale of impacts of a problem on economic terms, the environment and human
health.
Ę Relationship with other environmental problems.
Ę Expected multiple benefits that might be achieved by addressing a problem.
Ę Lack of perceived progress in addressing/solving a problem at the national level.
Ę Recognised multi-country water conflicts.
Ę Reversibility/irreversibility of the problem
2.4
Development of thematic reports
Thematic Reports were drafted by selected members of the TTT (Team Leaders). The list of
the Thematic Reports is shown below:
1. Thematic report on Habitat loss/ Biodiversity
2. Thematic report on Causal Chain Analysis
3. Thematic report on Fisheries
4. Thematic report on pollution loads
5. Thematic report on pollution assessment
6. Stakeholders Analysis
7. Socio- economic Assessment
8. Governance Analysis
Each review and report used a similar structure and the Team Leaders were asked to produce
reports that: described the particular problem; identified any gaps in knowledge; identified
the environmental impacts and socio-economic consequences; detailed the immediate and
5 A full list of the TTT experts is shown in Annex <>.
12
underlying causes of the impacts and consequences; and listed proposed options for
addressing the identified problem. Consequently, the Thematic Reports constituted the main
sources of information for the TDA.
2.5
Development of causal chains for priority
transboundary problems
The CCA methodology developed for this TDA was based on that described in the GEF
`Best Practice' approach and tried to relate the transboundary problems with their impacts,
immediate physical causes, underlying causes (divided into resource uses and socio-
economic causes) and root causes. A simple step by step guide to the process is shown in
Figure 2.1.
For a given transboundary problem,
identify the environmental impacts and
socio-economic consequences
For a given environmental impact or
and socio-economic consequence
identify the key sectors
For each sector, identify the immediate,
underlying and socio-economic, legal
and political root causes
Link each sector to the impacts and link
each set of immediate, underlying and
socio-economic, legal and political root
causes
Determine the over-arching root
causes
Figure 2.1
Stepwise sectoral analysis approach to developing a causal chain
The CCA process was iterative and consultative, with several versions being developed by
the CCA team leader after successive consultations with the international consultant, the
Black Sea Project Implementation Unit (PIU), the TDA TTT and CCA National Experts.
Draft CCAs were presented at the second TDA TTT Meeting (July 6th, 2006) and a Delphi
Exercise was performed during the meeting to help identify further causes. Based on this
input, sectoral CCAs were re-drafted.
The revised versions were reviewed by the PIU and the International Consultant and were
then sent to the TDA TTT leaders for further approval. These versions were checked by the
CCA National Experts for relevance in the 6 Black Sea countries.
13
2.6 Hot-spots
analysis
The hot-spots analysis presented in this TDA does not include an update of the list of 50 hot-
spots identified in the 1996 TDA, but rather an assessment of progress made in addressing
the original list of pollution sources in terms of undertaking the capital investments
originally identified. In addition, where data have been provided, the measured pollution
loads from individual hot-spots are calculated. The loads cited in the 1996 TDA were
modelled using the Rapid Assessment Methodology.
2.7 Stakeholder
analysis
The Black Sea Stakeholder Analysis involved conducting quantitative surveys of
stakeholders throughout the region. This analysis identifies stakeholders of the Black Sea
Ecosystem Recovery Project and provides insights into the concerns, priorities, capacities
and perceptions of stakeholder groups throughout the region in regards to specific
transboundary environmental issues. This also identifies where tensions or potential tensions
could emerge as a result of different expectations and priorities for Black Sea resource uses.
The stakeholder analysis methodology involves identifying stakeholder groups through desk
studies, consultation with project staff, and review of issues, thematic reports, historical
project materials socio-economic and government structures throughout the region.
Following this the survey was developed following consultation with earlier stakeholder
analyses in the region, surveys conducted by NGOs, reports from the project. The
conclusions of these were combined with findings of the Causal Chain Analysis conducted
within the scope of the current TDA and based on these sources, survey questions were
developed.
The survey was conducted in all six Black Sea countries among 42 different stakeholder
groups. Surveys were translated into local languages and were administered by national level
stakeholder consultants throughout the region. A total of 368 surveys were collected and
statistically analyzed for trends among and between groups. Areas of notably high and low
priority concern or high levels of variation within groups were detailed and analyzed for the
potential causality and significance of these trends. Issues which showed potential for
conflict between groups were highlighted.
2.8 Governance
analysis
The Governance Analysis involved a regional assessment of the institutional and policy/legal
instruments based on the existing analysis/reports under the Black Sea Ecosystem Recovery
Project. This analysis identifies institutional involvement in Black Sea related environmental
problems, as well as the existing global/regional/national policies and provides insights into
the coordination mechanisms, enforcement capacity and implementation results at regional
level in respect to the priority Black Sea transboundary problems. It also identifies the gaps
and obstacles in adapting or reforming the policy/legal framework.
The Governance Analysis methodology involved a review of the thematic reports as well as
desk studies and consultation with national experts. The Stakeholders Analysis findings and
the Causal Chain Analysis results conducted within the scope of the current TDA are also
included.
A questionnaire was developed in order to review the actual national institutional structures
capacity and resources, together with the current relevant legal instruments, with special
14
emphasis on their actual implementation, compliance and enforcement. The review was
conducted in all six Black Sea Countries by the TDA TTT National Experts.
15
Box 2.1:
Comparative analysis of the 1996 and 2006 TDA components
A comparison between the 1996 and 2007 was always going to be difficult to undertake, not least because the two methodologies are quite different and much
has been learnt about TDA design since the original TDA was produced. However, the table below outlines the key differences between the two approaches.
The 1996 TDA uses a tabular approach with linked tables and a small amount of supporting information. The methodology, although logical, is difficult to
navigate and lacks detail. The 2007 TDA follows a more conventional approach, in line with GEF `best practice'.
Components 1996
TDA
2006/7 TDA
Description of the Black
Ę
No Description of the Black Sea region was presented.
Ę
A detailed description of the Black Sea region was produced.
Sea region
Ę
This included the physical and geographical characteristics,, the socio-economic
situation, biodiversity and ecosystem health, the status of nutrient and toxic
pollutants, the institutional setting and stakeholders, and the public perception of
environmental status, causes and responsibilities
Ę
This description set the scene for the more detailed analysis of the priority problems
Transboundary Problems
Ę
Seven Major Perceived Problems were identified. These were:
Ę
Four Priority Transboundary Problems were identified. These were:
Ę Decline in Black Sea Commercial Fish Stocks
Ę Nutrient over-enrichment/eutrophication
Ę Loss of habitats, notably wetlands and shelf areas, supporting
Ę Decline in natural resources (e.g. fisheries)
important biotic resources
Ę Chemical pollution
Ę Loss or imminent loss of endangered species and their genomes
Ę Habitat and biodiversity changes - including alien species introduction
Ę Replacement of indigenous Black Sea species with exotic ones
Degradation of the Black Sea landscape
Ę Inadequate protection of marine and coastal resources from
maritime accidents
Ę Unsanitary conditions in many beaches, bathing and shellfish-
growing waters.
Environmental impacts
Ę
No analysis of environmental impacts or socio-economic
Ę
An analysis of environmental impacts and socio-economic consequences was
and socio-economic
consequences was carried out
undertaken
consequences
Ę
This was dependent on the level of information and data available and varied from
problem to problem
Causal Chain Analysis
Ę
No Causal Chain Analysis was undertaken.
Ę
A detailed Causal Chain Analysis was carried out. This focused on:
Ę
Five main root causes were identified and briefly described
Ę Immediate causes
Ę Underlying causes
Ę Underlying socio-economic drivers
Ę
The level of information and data available varied from problem to problem
Knowledge gaps
Ę
Uncertainties were identified in the problem matrices
Ę
Knowledge gaps were identified for each transboundary problem
Stakeholder Analysis
Ę
A stakeholder analysis was not presented in the TDA
Ę
A detailed quantitative survey of stakeholders throughout the region was presented
in the TDA
Ę
The analysis identified the stakeholders and provided insights into the concerns,
priorities, capacities and perceptions of stakeholder groups throughout the region in
regards to specific transboundary environmental issues.
Governance Analysis
Ę
A detailed governance analysis was not undertaken
Ę
A detailed governance analysis was presented in the TDA
Ę
The analysis identified institutional involvement in Black Sea related environmental
problems, as well as the existing global/regional/national policies and provided
insights into the coordination mechanisms, enforcement capacity and
implementation results at regional level in respect to priority transboundary problems.
Ę
It also identifies the gaps and obstacles in adapting or reforming the policy/legal
framework.
Actions and
Ę
Detailed actions were outlined in the TDA. The actions were also
Ę
The 2007 TDA was developed using current GEF `best practice' which states that the
recommendations
costed, and products and milestones identified
TDA should be a non-negotiated technical document. Consequently,
recommendations were briefly outlined but further actions, costings and milestones
were consigned to the SAP.
16
3. DESCRIPTION OF THE BLACK SEA REGION
3.1
Physical and geographical characteristics
The geographical scope of the Convention on the Protection of the Black Sea against
Pollution is applied to the Black Sea proper, with the Southern boundary constituted, for the
purposes of this Convention, by a line running between Capes Kelagra and Dalyan6.
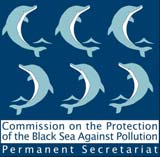
3.1.1 Geographic
boundaries
The Black Sea is an inland Eurasian sea bordering Ukraine and the Russian Federation to the
north, Bulgaria and Romania to the west, Georgia to the east and Turkey to the south (Fig.
3.1). The Black Sea is located between latitudes 40░ 56'N and 46░ 33'N, and longitudes 27░
27'E to 41░ 42'E. It is located in the east-west depression between two alpine fold belts, the
Pontic Mountains to the south and the Caucasus Mountains to the northeast. The topography
of the north western coast (except for Crimea) is relatively low and flat.
Figure 3.1
Geographical boundaries in Black Sea Region
The Black Sea is a semi-enclosed sea connected to the shallow (10Ł20 m) Azov Sea through
the Kerch Straits and to the Mediterranean Sea through the Bosporus Straits, the Marmara
Sea and the Dardanelles Straits. The flat abyssal plain (20% of free surface, depth. 2000 m)
rises to the continental shelves. The northwestern shelf (mean depth 50 m) has a shelfbreak
at about 100 m between the Crimean peninsula and Varna in the South. The Danube and the
Kerch fans are gentle continental slopes. The other portions of the shelf are narrow (20 km),
fractured by canyons, abrupt ridge extensions and steep continental slopes.
The only connection to other marine water bodies is through the winding Istanbul (Bosporus)
Straits, a 35 km natural channel, as little as 40 m deep in places. The Black Sea is up to 2212
metres deep (North of nebolu) and receives the drainage from a 1.9 million km2 basin,
covering about one third of the area of continental Europe. The Bosporus has a two layer
6 http://www.blacksea-commission.org/main.htm
17
flow, carrying about 300 km3 of seawater to the Black Sea from the Mediterranean along the
bottom layer and returning a mixture of seawater and freshwater with twice this volume.
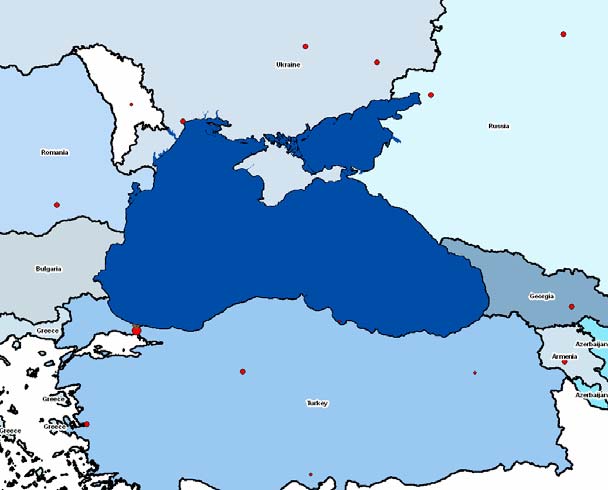
3.1.2 Bathymetry
The seabed is divided into the shelf, the continental slope and the deep-sea depression
(Figure 3.2). The shelf occupies a large area in the north-western part of the Black Sea,
where it is over 200 km wide and has a depth ranging from 0 to 160 m. In other parts of the
sea it has a depth of less than 100 m and a width of 2.2 to 15 km. Near the Caucasian and
Anatolian coasts the shelf is only a narrow intermittent strip. The thin upper layer of marine
water (up to 150 m) supports the unique Black Sea ecosystem. The deeper and more dense
water layers are saturated with hydrogen sulfide that has accumulated over thousands years
as a by-product of decaying organic matter (Figure3.3). Due to the unique geomorphological
structure and specific hydrochemical conditions, very specific organisms, including
protozoa, bacteria, and some multi-cellular invertebrates, inhabit the deep-sea waters.
Knowledge about forms of life in the deep waters of the Black Sea is very limited, but it is
clear that disturbance of the natural balance between the two layers could trigger irreversible
damage to the people and ecosystem of the Black Sea.
Figure 3.2
Black Sea bathymetry
3.1.3 Coastline
characteristics
The length of the Black Sea shoreline is approximately 4,340 km (Table 3.1). The Black Sea
has similar geological properties as the major oceans, and is classified geomorphologically
into three key sections namely: (i) the continental shelf, (ii) the continental side, and (iii) the
abrasion platform (2).The continental shelf covers 24.1% of the Black Sea surface area and
has a 0.5-5 slope. This area generally extends 0-90 m depth from the shoreline. The
continental shelf is very important for fishing, although it is quite narrow along the Anatolian
and Caucasus coasts.
18
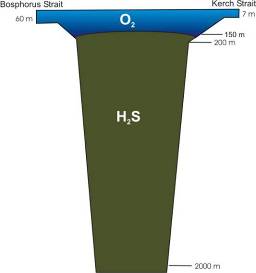
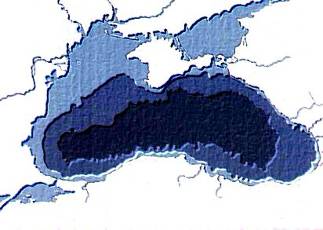
Figure 3.3
Profile of the hydrogen sulfide zone in the Black Sea
The length of national Black Sea costlines is presented in Table 3.1, Ukraine having the
longest coast and Romania the shortest.
Table 3.1
Black Sea shoreline length (km)
Country
Length (km)
Bulgaria 300
Georgia 310
Romania 225
Russian Federation
475
Turkey 1,400
Ukraine 1,628
Total
4,338
3.1.4
River discharge
The main rivers in the Black Sea Region are the Danube, Dnipro, Rioni, Kodori, Inguri
Chorokh, Kizilirmak,Yeshilirmak, Sakarya, Southern Bug and Dnister. Every year, some
350 km3 of river water flows into the Black Sea. Discharges from the main rivers are
presented in Table 3.2, with inflows of water from the Sea of Marmara (via the Bosphorus
Strat) and the Sea of Azov (via the Kerch Strait) shown in Table 3.2. The areas of national
Black Sea sub-basins are shown in Table 3.3.
3.1.5 Climate,
agricultural
production and river discharge
In a major part of the Black Sea Basin, the climate is similar to the Mediterranean (warm
humid winters and hot dry summers) because the geography and macro circulation processes
existing in the Mediterranean influence the climate of the Black Sea Basin. The south-
eastern part, surrounded by the mountains, is characterized by a humid subtropical climate
(abundant precipitation, warm winter, hot summer). Average periods of sunshine vary
throughout the region Ł 2,432 hours in the Bosporus area, 2,237 hours in the Varna area and
2,223 hours per year in the Yalta area. The total amount of precipitation from the Bosporus
to Varna is about 500-700 mm per year, in the north, near Odessa Ł 300-400 mm, in the
19
southern coast of Crimea (Yalta) Ł 586 mm. The amount of annual precipitation increases
eastward Ł 1,600 mm between Novorossiysk and Sukhumi, to 2,465 mm Ł in Batumi. In
general, the Black Sea Basin climate is very favorable for tourism and recreation.
Table 3.2
Annual river discharge into the Black Sea (m3/s)7
Country River
1995 1996 1997 1998 1999 2000 2001 2002 2003 2004 2005
Kamchia
10.3
5.7
46.8
Aheloy
0.1
0.0
0.3
Veleka
4.1
2.2
18.3
Ropotamo
0.1
0.1
0.5
Batova
0.1
0.1
0.7
Bulgaria
Diavolska
0.0
0.0
0.1
Dvoinitza
0.2
0.1
0.9
Hadjiska
0.1
0.1
0.6
Karaach
0.2
0.1
0.7
Rezovska
1.8
1.0
7.9
Rioni
406.0 406.0 406.0 406.0 406.0 406.0 406.0 406.0 406.0 406.0 406.0
Supsa
46.0 46.0 46.0 46.0 46.0 46.0 46.0 46.0 46.0 46.0 46.0
Chorakhi
409.0 409.0 409.0 409.0 409.0 409.0 409.0 409.0 409.0 409.0 409.0
Georgia8
Natanebi
24.5 24.5 24.5 24.5 24.5 24.5 24.5 24.5 24.5 24.5 24.5
Khobi
50.5 50.5 50.5 50.5 50.5 50.5 50.5 50.5 50.5 50.5 50.5
Kubastskali
0.3
0.3
Romania Danube 6223.7 7035.8 6684.2 6654.1 7952.0 6580.6 6304.3 6837.1 5021.0 6524.0 8695.0
Sochi
25.6 15.7 20.1 14.6 15.4 13.6 27.7 18.8 14.4 16.8 14.3
Russian
Mzimta
66.4 49.0 55.1 - 42.8 48.4 63.1 70.9 54.5 60.2 72.3
Federation
Khosta
6.9 4.2 5.3 4.6 4.7 4.0 6.7 5.6 4.6 5.9 5.8
Tuapse
24.3
Sakarya
124.2 94.5 177.8 234.1 117.4 188.3 30.6 217.4 106.0 148.1 138.8
Kizilirmak
21.0
21.0
2.9
21.0
Turkey
Filyos
53.7
139.8
21.0
97.5
21.3
97.0
Yeilirmak
161.7 182.0 121.1 211.2 99.7 105.7 165.0 165.0 165.0 165.1 165.1
Coruh
219.8 279.9 185.9 170.0 151.6 215.0 215.0 210.0 215.0
Dniepro
1149.0 916.0 1160.0 1850.0 1820.0 1290.0 1390.0 1050.0 1100.0 1460.0 1460.0
Southern
Ukraine
70.1 121.0 97.8 109.0 93.7 88.5 94.7 80.5 121.0 81.6 103.0
Bug
Dniester
213.0 295.0 303.0 420.0 342.0 249.0 303.0 265.0 175.0 205.0 269.0
Table 3.3
Annual river discharge into the Sea of Azov (m3/s)
Country River
1995 1996 1997 1998 1999 2000 2001 2002 2003 2004 2005
Russian
Kuban
421.0
382.0
626.0
439.0
317.0
367.0
306.0
544.0
311.0
Federation
Don
666.0
837.0
637.0
679.0
733.0
680.0
648.0
599.0
766.0
7 Data provided by in-country national experts
8 Discharge based on long-term investigations carried out before 1993
20
Table 3.4
Catchment area of the Black Sea (km2) Russian Federation and Ukraine are
only partially included
Country Catchment
Area
(km2)
Bulgaria 22,244
Georgia 32,816
Romania 90,894
The Russian Federation
49,8260
Turkey 246,525
Ukraine
367,230
Total 1,257,969
Because of its climate the Black Sea region is a productive farming area, where many
varieties of plant crops are grown. Thus, for those countries having only a part of their
territory included in the Basin, these national sub-basins represent important components of
their respective national agricultural production balance sheets For example, in Bulgaria,
land draining into the Black Sea contains.about 85% of the national cereal farmland, 76% of
the land on which oil bearing crops are grown, 37% of the land used for forage crops and
47% of the area of national vineyards (Petkova, 2005). The agricultural area in the Turkish
Black Sea sub-basin contains approximately one third of the total agriculture area of Turkey,
supporting the production of a wide range of agricultural crops. For example, all of the tea
grown in Turkey is produced in this area, 71% of national nut production, 57% of tuber
crops, 39% of industrial crops, 33% of cereals, 24% of pulses and vegetables, 18% of fruits
and 9 5% of oil seed production (Ulger 2005). For further comparison about one third of the
agricultural area of Georgia is contained in its Black Sea sub-basin, where all of its national
tea and citrus fruit ptoduction occurs, the vast majority (98%) of the country's volatile oil
bearing plant production, about 80% of nuts, over 50% of other fruits, 40% of cereals, and
over 30% of national vineyard production (Lagidze 2005 Ł data exclude statistics from the
breakaway republic of Abkhazia). Similarly, the Black Sea coastal administrative areas of
the Russian Federation, particularly Krasnodar Krai, constitute a nationally important
agricultural region.
In addition to arable farming, the Black Sea Basin is also an important area for livestock
farming. This is dealt with in more detail in Section 4.2.4.2.
Ocean current circulation in the Black Sea is characterized by a cyclonic system of currents
Fig. 3.4). The dynamic system of the Black Sea has a distinct yearly cycle, with maximum
circulation activity occuring during winter and spring.
21
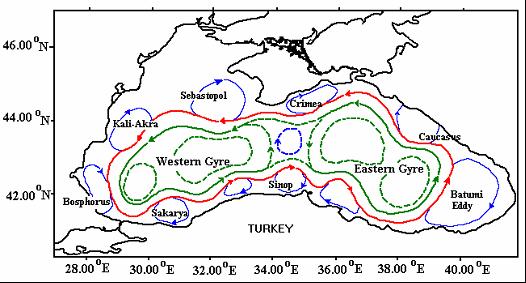
Figure 3.4
Schematic of Black Sea currents9
3.2 Socio-economic
situation
Social and economic changes within the Black Sea Basin both impact the ecosystem and are
impacted by many of the environmental changes that have been brought about during the last
century. The historical socio-economic conditions of the Black Sea have largely shaped
practices that continue to date. The shift from the Soviet economic system to a more free
market system in the Warsaw Pact States, the movement towards EU accession of some
countries, and economic fluctuations in the 1990s have influenced the ecosystem of the
Black Sea.
The Black Sea countries coastal zones10 are estimated to contain about 20 million people in
their coastal areas. However, the situation with regard to Istanbul is confusing, since the
coastal administrative unit which includes Istanbul has a short Black Sea coastline. Thus, if
the population of this area is also included, the value increases to over 39 million people.
The proportion of national populations living within Black Sea coastal administrative areas
varies widely: 0.6% in Russia, 4.5% in Romania, 10.5% in Turkey (excluding Istanbul),
14.4% in Ukraine, 26.5% in Bulgaria, 37.1% in Turkey (including Istanbul) and 38.6% in
Georgia.
Available data suggest the proportions of populations living in coastal administrative areas
which are connected to sewerage systems range from about 53% in Russia, through 70% in
Turkey (excluding Istanbul) to >90% in Bulgaria, Georgia and Romania. (No information
available for Ukraine). However, intuitively these values do appear to be on the high side,
and bear no relationship to the level of treatment that is applied to the wastewater produced.
A coastal population of some 7 million inhabitants are connected to sewerage systems
discharging directly into the Sea.
3.2.1 Demographic
trends
The population growth statistics in Fig. 3.5 demonstrate that the populations of the countries
of the Black Sea Basin are experiencing a negative growth rate, with the exception of
9 Data source: Tugrul and Besiktepe (2006) after Ouz et al, (1993)
10One national administrative unit (oblast, municipal area, etc.) inland from the coast.
22
Turkey. Even Turkey has shown a slowing growth rate since 1995. The years around 1998
and 1999 show a dramatic decline in Bulgaria, and Romania with a recovery in 2001 and
2002. Russia and Georgia both show increasing rates though the increase in Georgia slowed
significantly in 1998. Trends in population growth rate generally reflect the over all
optimism about social and economic development prospects, with people having more
children as they feel more confident about economic development. However in many
industrialized societies, a decline in population growth suggests that costs of living are
increasing, and families are having fewer children in order to provide for those they have.
The regional average (mean of all 5 countries regardless of total country population size) is
low, although with the larger population in Russia and Turkey the overall rate may be
slightly positive. Specific settlement patterns will be addressed below, as they pertain to
urban populations as well as coastal growth rates.
Bulgaria
Georgia
Romania
Russia
Turkey
Ukraine
Regional Mean
2
1
%
0
nnual
A
-1
-2
1995
2000
2005
Year
Figure 3.5
Annual regional population growth statistics11
Table 3.5 shows the total population of the Black Sea countries, and percent of the
population under the age of 15, as well as the density of the populations. While Bulgaria,
Georgia, Romania, Russia and Ukraine have youth populations commensurate with most
industrial developed countries, Turkey's large youthful population (as nearly one third of the
total population) indicates that the country's population is likely to continue to increase
within the coming 20Ł40 years, putting additional pressures on natural resources.
The size of the urban population is increasing in all Black Sea countries (Figure 3.6), and as
many towns and cities are in coastal areas, this will continue to result in increased pressure
on the Sea itself. It should be noted that the increase in Turkey is especially stark, giving
Istanbul the status of a "coastal mega-city" with an estimated population of about 15 million
people. As the populations in Turkey is expected to expand, it is likely that this will have
further impacts on the Sea if more stringent management of marine/coastal resource uses and
better control of pollutant emissions from land do not occur.
11Data source: 2005 World Bank Development Indicators database at http://www.worldbank.org
23
Table 3.5
Regional population statistics (2005)12
Country Total Percentage
Country
Total
Population
Population
of
population
Population
density in
(millions) population
density
in the
the coastal
aged 0-14 (people/km2)
coastal
zone
yrs
zone
(people/km2)
(millions)
Bulgaria 8
14.1
70
2.1
60
Georgia 4 19.5
64 1.713 76
Romania 22
15.9
94
0.97
62
Russia 143 15.7
9 0.8914 100
Turkey 73 29.5 94
7.6
74 (without
(without
Istanbul )
Istanbul)
187
19.3
(Istanbul
(Istanbul
included)
included)
Ukraine 47 15.4
81
6.7
60
Percentage Urban Population
80
70
60
50
40
30
20
10
0
ria
a
gia
ne
ga
ani
ssia
eor
rkey
rai
Bul
G
Rom
Ru
Tu
Uk
1975
2004
2015
Figure 3.6
Regional urban population statistics15
The impacts of these populations are felt through activities that affect the Black Sea, as they
are also impacted by conditions of the Black Sea and the Black Sea basin. The economic
indicators provide an overview of how these populations are impacting the ecosystem of the
Black Sea.
3.2.2 Economic
indicators
Economic development indicators for the region provide a sense of how anthropogenic
activities are driving resource use and therefore impacting ecological conditions.
12 Date source: World Bank World Development Indicators at http://www.worldbank.org and national statistics
provided by in-country experts
13Excluding Abkhazia
14Data only for Krasnodar Krai
15Data source: UN 2006 World Urbanization Prospects, the 2005 revision
24
Gross national income (GNI) per capita, provides a comparable standardized measure of the
changes in the economic conditions across the region (Figure 3.7). There was a positive
trend over all, although the 1997-1998 economic down turn which impacted Russia also had
regional repercussions that slowed down growth. The current trend shows a positive increase
which seems to portend well for populations the region as a whole.
Bulgaria
Georgia
Romania
Russia
Turkey
Ukraine
Regional Mean
4000
3000
$
S
2000
t U
n
r
r
e
1000
Cu
0
1995
2000
2005
Year
Figure 3.7
Gross national income per capita16, Atlas method
While the economic measure of GNI per capita above appears to support significant
economic growth in the region, this must also be compared to the rate of inflation as
indicated through the Consumer Price Index (Figure 3.8). This suggests that inflation
throughout the region is a significant concern, which will have resounding impacts on
government revenues. This is especially significant for Turkey where the cost of a market
basket of goods has more than tripled since the year 2000. While Georgia and Ukraine have
experienced much lower rates of inflation, their lower rate of GNI per capita suggests that
the increases though slight are also impacting populations and government revenues. The
challenges of inflation creates environmental impacts for the Black Sea as governments must
adjust budgets and meet demands for services with less value in the collected revenues than
originally intended, and therefore diminishing the available resources to dedicate to
environmental protection measures.
Bulgaria
Georgia
Romania
Russia
Turkey
Ukraine
Regional Mean
300
200
100
0
1995
2000
2005
Year
Figure 3.8
Consumer price index17 for Black Sea countries
16The sum of values of all resident producers plus any product taxes (less subsidies) not included in the
valuation of output plus net receipts of primary income (compensation of employees and property income)
from abroad. Data source: 2005 World Bank Development Indicators database at http://www.worldbank.org
25
An overall decline in agricultural production has occurred in the region since 1994 (Fig.
3.9A). The most precipitous decrease has been in Georgia, with less severe decreases in
other countries. On average, over the period shown, the importance of agriculture to the
regional economy halved, with a similar, albeit less severe decline in the natural resource
extraction and manufacturing industries (Fig. 3.9B), However, other sectors (notably the
service industry) have increased their importance as contributors to regional GDP (Fig.
3.9C). Of all sectors, the services sector has the lowest direct environmental impact, though
impacts occur indirectly through increase fuel consumption for transportation and energy.
Nonetheless, this increase in the services sector suggests that the economies are shifting
towards less intensive or impacting activities, and there should be an anticipated overall
decline of ecological impacts in the region if this trend persists.
(A)
(B)
Bulgaria
Georgia
Romania
Bulgaria
Georgia
Romania
Russia
Turkey
Ukraine
Russia
Turkey
Ukraine
Regional Mean
Regional Mean
80
50
60
40
P
P
D
D
40
f
G
30
f
G
% o
% o
20
20
0
10
1995
2000
2005
1995
2000
2005
Year
Year
(C)
Bulgaria
Georgia
Romania
Russia
Turkey
Ukraine
Regional Mean
70
60
P
50
D
f
G
40
% o
30
20
1995
2000
2005
Year
Figure 3.9
Regional trends in (A) agricultural18, (B) natural resource extraction and
manufacturing19, and (C) service sector20 contributions to GDP (value
added)
17Changes in the cost to the average consumer of acquiring a fixed basket of goods and services. The year 2000
= 100. Data source: 2005 World Bank Development Indicators database at http://www.worldbank.org
18 Includes forestry, hunting, and fishing, as well as cultivation of crops and livestock production. Value added
is the net output of a sector after adding up all outputs and subtracting intermediate inputs Data source: 2005
World Bank Development Indicators database at http://www.worldbank.org
26
Data from World Bank Development Indicators database (http://www.worldbank.org)
suggest that there has been either no change in the national areas of agricultural land, or only
a minor decrease in agri-land area. This, however, could be misleading, since the
classification of agricultural land used for this purpose includes that which is "temporarily"
fallow. The reality is that land registered as being temporarily fallow could have been fallow
for a long time. The same data source shows that a marginal decrease in inorganic fertilizers
application rates occurred between 1994 and 2002, albeit with an upturn in the most recent
years.
The value of livestock production has been fairly constant (Figure 3.10), though a notable
increase occurred in Georgia prior to 1998, while there was a decline in Russia and Ukraine
during this period. However, after this period the slight upturn in production suggests that
continuation of this trend may be expected.
Bulgaria
Georgia
Romania
Russia
Turkey
Ukraine
Regional Mean
140
120
100
80
60
1995
2000
2005
Year
Figure 3.10 Regional livestock production index statistics21
By comparison, crop production index statistics have been more tumultuous (Fig. 3.11), with
the disruptions of the 1998 economic downturn being evidenced in Russia, Bulgaria, Georgia
and Ukraine. The Georgian rates remained suppressed, while the Romanian increased
significantly since 2000. An upward trend in regional crop production since the late 1980s
suggests that environmental impacts of the arable sector are likely to continue.
19Includes mining, manufacturing, construction, electricity, water, and gas. Data source: 2005 World Bank
Development Indicators database at http://www.worldbank.org
20Wholesale and retail trade (including hotels and restaurants), transport, government, financial, professional,
and personal services (education, health care, etc.), real estate services. bank service charges and import duties.
Data source: 2005 World Bank Development Indicators database at http://www.worldbank.org
21Includes meat and milk from all sources, dairy products such as cheese, eggs, honey, raw silk, wool, hides and
skins. Data source: 2005 World Bank Development Indicators database at http://www.worldbank.org
27
Bulgaria
Georgia
Romania
Russia
Turkey
Ukraine
Regional Mean
140
120
100
80
60
1995
2000
2005
Year
Figure 3.11 Regional crop production index statistics22
A particularly important trend in the Black Sea region is the growth in international tourism,
particularly since 2000 (Fig. 3.12). The lack of data for Russia prior to 2001 alters the
regional mean, but the rise suggests that there is a continuing increase, though this is national
level data. Both standard tourism and eco-tourism within the Black Sea have the potential to
gain status.
Bulgaria
Georgia
Romania
Russia
Turkey
Ukraine
Regional Mean
8.000e+09
6.000e+09
$
4.000e+09
r
ent US
2.000e+09
Cur
0
1995
2000
2005
Year
Figure 3.12 Regional trends in international tourism expenditure23
3.2.3 Social
indicators
There has been a steady increase in human life expectancy in the region (Fig. 3.13) and a
corresponding decrease in infant mortality, suggesting that overall health continues to
improve. However, Russian life expectancy data took a downturn following the 1998
economic disruptions, which then leveled out, but still remains low. Infant mortality in
Georgia remains higher than in other Black countries
22Crop production for each year relative to the base period (1999-2001). Includes all crops except fodder crops.
Data source: 2005 World Bank Development Indicators database at http://www.worldbank.org
23Expenditures by international inbound visitors, including payments to national carriers for international
transport. Data source: 2005 World Bank Development Indicators database at http://www.worldbank.org
28
(A)
(B)
Bulgaria
Georgia
Romania
Bulgaria
Georgia
Romania
Russia
Turkey
Ukraine
Russia
Turkey
Ukraine
Regional Mean
Regional Mean
72
50
70
40
68
Years
30
66
20
64
10
1995
2000
2005
1995
2000
2005
Year
Year
Figure 3.13 Regional trends in (A) life expectancy at birth24 and (B) infant mortality
rates25
The extent of basic education is a commonly accepted indicator of societal heath. Values of
two indicators of this are shown in Fig. 3.14. It should be noted that in all cases the literacy
rate is more than ten percent higher than it is for the US in the same time period. Thus, there
is a regional norm of high literacy rates and relatively high primary completion rates. An
interesting trend that could be inferred from this is the higher level of literacy rates among
those over 15, compared to those in school currently. This suggests that there may be fewer
students completing primary education now that during the soviet era. This trend is
especially dominant in Georgia, Romania, and Ukraine, and should be monitored into the
future.
Education Rates
100
95
90
t
ages
n
c
e
85
per
80
75
ia
ia
a
a
Literacy Rate
org
ani
rkey
m
Tu
raine
Bulgar
Ge
Russi
Ro
Uk
Primary
Completion Rate
Figure 3.14 Regional statistics on the level of education (2004)26
The societal conditions directly influencing and impacted by water conditions in the region
are reflected in Fig. 3.15. Overall the regional mean is high, although lower in Romania and
Georgia. In order to come into compliance with the EU WFD, Romania is taking steps to
improve these conditions in rural areas. Georgia is less able to make substantial
24 Data source: 2005 World Bank Development Indicators database at http://www.worldbank.org
25Number of infants dying before reaching one year of age. Data source: 2005 World Bank Development
Indicators database at http://www.worldbank.org
26 Includes adult literacy (age 15 years and above) and the percentage of students completing the last year of
primary school. Data source: 2005 World Bank Development Indicators database at http://www.worldbank.org
29
infrastructural investments at this time, though efforts are being made at the national level to
develop strategies to improve conditions.
Access to Improved Sanitation and Water
Sources
100
80
n
60
a
t
i
o
40
popul
20
%
0
ia
e
rgia
ss
mania
rkey
rain
sanitation
Bulgaria Geo
Ru
Tu
Ro
Uk
facilities
w ater sources
Figure 3.15 National access to improved sanitation and water sources27
3.3
Biodiversity and ecosystem health
3.1.1 Introduction
The ecological status of the Black Sea has varied greatly in the last 40 years, from a quasi-
pristine environment in the 1960s, to a highly degraded situation in the 1980s, and more
recently a situation of recovery. The following section briefly describes the status of the
Black Sea ecosystem in terms of its biodiversity, habitats, alien species, protected areas and
fisheries.
3.1.1
Ecosystem and habitat types
The Black Sea biota reflects the general historical processes that have influenced the
ecosystem of the sea.
The main biotopes are sandy-bottom shallow-water areas, especially in the north-western
part of the Black Sea and the Sea of Azov. The coasts of the southern Crimea, the Caucasus,
Anatolia, some capes in the south-western part of the Black Sea (Kaliakra, Emine, Maslen
Nos, Galata) and Zmeiny Island are mostly rocky. The sea beds are mostly mud in the zone
between 10 to 20 m and 150 to 200 m depth. The total area of Black Sea coastal wetlands is
about 10 000 km2. There are sites of reproduction and feeding and wintering grounds of
many rare and commercially valuable fish species, including the sturgeon family, and are
therefore biotopes of special importance. Anoxic conditions occurring below about 120-200
m depth delimit the vertical distribution of planktonic and nektonic organisms, as well as
bottom-living organisms. The structure of marine ecosystems differs from that of the
neighbouring Mediterranean Sea in that species variety is lower and the dominant groups are
27Facilities range from simple but protected pit latrines to flush toilets with a sewerage connection. To be
effective, facilities must be correctly constructed and properly maintained. access to at least 20 litres/day of
water from an improved source (within 1 km of the dwelling), such as a household connection, public
standpipe, borehole, protected well or spring, and rainwater collection. Unimproved sources include vendors,
tanker trucks, and unprotected wells and springs. Data source: 2005 World Bank Development Indicators
database at http://www.worldbank.org
30
different. However, the abundance, total biomass and productivity of the Black Sea are much
higher than in the Mediterranean Sea (Alexandrov & Zaitsev, 1998; Zaitsev & Alexandrov,
2000).
3.3.2 Phytoplankton and zooplankton
Black Sea coastal waters and the continental shelf are predominantly eutrophic (rich in
nutrients), the central part is mesotrophic (medium level of nutrients) in character, and
significant parts are hypertrophic (high level of nutrients). The largest hypertrophic areas are
located in the north-western part of the Black Sea in the zone influenced by inflow from the
Danube, Dniester and Dnieper rivers which have high levels of chlorophyll. Phytoplankton
reacts to anthropogenic impacts by alterations in species composition and abundance and the
timing and duration of blooming events. The status of phytoplankton and zooplankton can be
assessed using a range of indicators including abundance, biomass and community
composition The sections below outline briefly their current status.
3.3.2.1
Phytoplankton abundance and biomass28
Phytoplankton abundance and biomass have shown considerable inter-annual variability over
the last two decades (Fig. 16). In 2001, when a temporary return of hypoxic conditions was
observed an increase in abundance occurred equivalent to that observed in the 1980s.
However, when longer-term averages are considered, an emerging pattern of reducing
phytoplankton biomass can be seen. A similar pattern of decreasing phytoplankton biomass
is shown throughout the Black Sea as a whole (1997-2005) by remote sensing imagery of
chlorophyll-like substances29 (http://marine.jrc.cec.eu.int/frames/archive_seawifs.htm).
15
18
.
s
/
l)
)
e
ll
3
c 10
12 /m
6
x
1
0
a
s
s
(
g
c
e
(
m
n
5
6
i
o
da
B
un
b
A
0
0
3
5
7
9
1
3
5
7
9
1
3
5
198
198
198
198
199
199
199
199
199
200
200
200
Figure 3.16 Phytoplankton cell density and biomass (average annual data) offshore of
Constanta, Romania (1983-2005)30
28 Phytoplankton data can be considered both in terms of major taxonomic groups and in terms of cell density
and biomass-related factors. Of the latter two, biomass is the more important indicator, because of the large
variability in size between different species and the fact that phytoplankton community composition changes on
a seasonal basis.
29 Chlorophyll-a typically comprises 1-2 % by dry weight of phytoplankton. Trends in satellite-derived images
of chlorophyll-like substance concentrations therefore provide an indicator of changes in phytoplankton
biomass in surface waters.
30 Data source: Dr A. Cociasu, National Institute for Marine Research and Development, Constanta, Romania
31
3.3.2.2
Phytoplankton community composition31
Plankton community composition also indicates that recovery is starting to taking place.
Unfortunately, taxonomic data are not available from the 1960s reference period, but it is
clear that in terms of the contribution of major taxonomic groups to total phytoplankton
biomass, at least, the status in recent years has returned to a situation resembling that in the
1980s. Post-2000, the situation with regard to cell counts has been rather less
straightforward, since a temporary return of eutrophic conditions in 2001 was reflected very
strongly in phytoplankton community composition results(Anon, 2006).
3.3.2.3 Zooplankton
abundance
Phytoplankton-eating microzooplankton in the Black Sea are dominated by Cladocera and
Copepoda, long-term data for which present an interesting reflection of the biological
changes that have occurred since the 1960s. Figure 3.17 shows a clear long-term trend of
declining abundance, with extrapolation of the long-term linear regression line suggesting
that by 2006, zooplankton abundance would have been a full order of magnitude lower than
that in 1967. However, there is a great deal of inter-annual variability in the figures, and
when only more recent data are considered (1997-2005), these suggest that zooplankton
abundance has actually levelled off or increased over the last decade.
This huge depression (and possible start of recovery) in the zooplankton community can be
related to many different factors Ł mass development of inedible phytoplankton species,
Mnemiopsis (Fig. 3.18) outbursts, increase in small pelagic fish population, etc. (Prodanov et
al, 1997). Of particulat interest is the correspondingly huge increase in Noctiluca abundance
and biomass. Noctiluca scintilans is a large heterotrophic dinoflagellate (and therefore
technically a member of the phytoplankton community), which because of its large size is
monitored as part of the zooplankton community. The growth of thsi organism is stimulated
by organic enrichment, as well increased nutrient levels. During blooms Noctiluca can
account for well in excess of 90% of zooplankton biomass in coastal areas of the NW Shelf.
The first positive sign in the 1990s was a reduction in the summer biomass of phytoplankton
(Mee, 1999).
5
r
/
l
)
be
4
num
e
(
nc
3
1967-2005 data set
bunda
1997-2005 data set
a
Linear (1967-2005 data set)
10
l
og
Linear (1997-2005 data set)
2
6
2
0
6
6
2
196
197
198
198
199
200
Figure 3.17 Long-term summer abundance of Cladocera and Copepoda three
nautical miles offshore of Cape Galata, Bulgaria (1967-2005)32
31 The ratio between major phytoplankton taxonomic groups can also be used as an indicator of ecosystem
status. As with phytoplankton biomass/abundance data there is considerable inter-annual variability.
Nevertheless, grouping data from longer periods of time together can yield interesting results
32Data source: 1967-1994, Prof. A. Konsulov, 1994-2002, Dr. L. Kamburska; 2003-2005, Dr K Stefanova, IO-
BAS. All data provided by Dr Stefanova, Institute of Oceanology Ł Bulgarian Academy of Sciences, Varna.
32
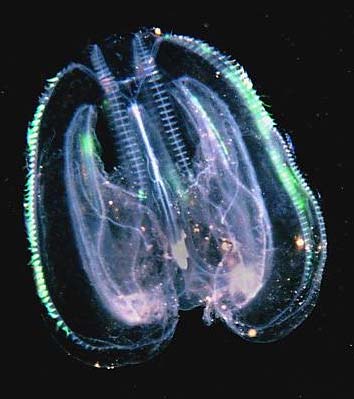
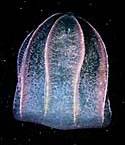
Mnemiopsis, a highly reroductive and fast-growing comb jelly which feeds on zooplankton
and fish larvae, was first identified in the Black Sea during the early 1980s. By the mid
1990s, there was estimated to be approaching one billion tonnes of this organism in the
Black and Azov seas, responsible (in part at least) for a huge decline in fish stocks and fish
yields from the Sea. However, in 1997 another invasive comb jelly, Beroe ovata (Fig. 3.18),
which feeds almost exclusively on Mnemiopsis, was identified in the Black Sea. Since this
time, it appears that the trend of decreasing numbers of phytoplankton-eating zooplankton
has begun to reverse (Fig. 3.17), possibly as a consequence of Beroe's appearence, but the
data are so variable that this is not possible to say with any certainty. The highly seasonal
reproductive pattern of Beroe ovata means that long-term Mnemiopsis eradication due to the
introduction of Beroe ovata is unlikely. Assessment of the comb jelly situation over the past
decade is also complicated by the natural 3-4 year cycle of Mnemiopsis abundance/biomass,
which occurs in both the NE Atlantic (from where Mnemiopsis originates) and the Black
Sea.
Whether Mnemiopsis still constitutes a threat to fishery productivity is a moot point
(Mnemiopsis competes with zooplankton-eating fish for food and also preys directly on fish
larvae) . However, Mnemiopsis abundance values in NW Shelf waters were high during
summer 2006, and conversations with Turkish fishermen suggest that the 2007 anchovy
season was of a shorter duration than usual, resulting in reduced catches (albeit unquantified
at this time). Since anchovy makes a far greater contribution to total fish catch statistics than
any other species, 2007 total catch statistics could be low, reversing the trend of recent years
(Fig. 4.5).
(A)
(B)
Figure 3.18 A tale of two jellies: (A) Mnemiopsis leidyi and (B) Beroe ovata33
3.3.3
Seaweeds and zoobenthos
There are a number of identified benthic habitats of transboundary importance. These
include: Mytilus galloprovincialis habitats; Cystoseira habitats; Zostera beds; and sublittoral
sands.
During the last two decades, the areas covered by eelgrass (Zostera) have decreased tenfold
in shallow waters. The typical 'Zernov's Phyllophora field', in the centre of the north-west
33Photographs courtesy of Lyubomir Klissurov
33
shelf, at 20-50 m depth, is an example of a habitat destruction due to human activity. The red
algae Phyllophora was not only an important generator of oxygen and the nucleus of a
benthic community, which included 118 species of invertebrates and 47 species of fish, but
was also commercially harvested for the extraction of gelatine used as an ingredient for
microbiological cultures, medicine, food industry and other purposes. Phyllophora
dominated an area of the north-west shelf with the combined size of Belgium and the
Netherlands. During the 1970s and 1980s, the north-west shelf ecosystem collapsed suddenly
and catastrophically due to eutrophication, silting and other factors.Eutrophication has led to
an increase of some algae such as the link frond (Enteromorpha) and red algae (Ceramium).
The Black Sea macrozoobenthos is represented by approximately 800 species, the status of
which can be assessed using a range of indicators including abundance, biomass, number of
species present and biological indices. The information presented below is a summary of the
results from the Phase I BSERP research cruises of 2003 and 2006.
3.3.3.1
Zoobenthos abundance and biomass
Although the coastal area is free of hydrogen sulphide, concentrations increase rapidly under
the thermocline due to the restricted ventilation of deeper shelf water. Consequently, the
number of macrobenthic species decreases rapidly with increasing depth - only the
polychaete worm Notomastus profundus is found below about 120 m.
Abundance/biomass increases in front of the Danube delta and Constanta (Romania), with
decreased abundance in front of Odessa (Ukraine), possibly due to contamination by
pesticides, and at more southerly Bulgarian sites. Offshore, abundance/biomass clearly
decreases due to the reduced influence of major rivers (the Danube and Dniester) which
provide an import source of nutrients and organic carbon which are cycled through the food
chain.
3.3.3.2
Zoobenthos species diversity
Higher species richness in shallower waters is associated with good dissolved oxygen
conditions whilst in deeper areas there is lower diversity due to natural oxygen depletion
with increasing depth in the Black Sea. In the shallow Danube delta and Odessa areas low
benthic diversity is preconditioned by the content of silt/clay fraction in sediments and
aggravated by decreased oxygen concentrations associated with anthropogenic
eutrophication. The effect of toxic substances may also play a role in the Odessa area.
Figure 3.19 illustrates the change in zoobenthos status between 1988 and 2003 with a 1960s
reference. Since the mid-1990s, the number of species has doubled although the number is
still somewhat lower than the "reference" situation of the1960s.
34
60
a
x
a
40
f
T
e
r
o
b 20
m
u
N
0
s
60
88
96
98
99
00
01
02
03
19
19
19
19
19
20
20
20
20
Figure 3.19 Number of macrozoobenthos species near Constanta, Romania (1960s-
2003)34
3.3.3.2 Zoobenthos
indices
The Bulgarian coastal area is distinguished by good, occasionally high zoobenthic status.
The Danube plume area is characterised by moderate to poor zoobenthic status, although
improving status is evident in more southerly Romanian wasters (with increasing distance
from the Danube). The Dniester area coastal stations are moderately disturbed with an
improving situation offshore. The zoobenthos status in the Odessa area contradicts those of
other zoobenthic indicators (lowest abundance of crustaceans, lowest species richness,
absence of adult molluscs, etc.). Deep area stations are generally considered to be
undisturbed.
3.3.4 Large
fauna
3.3.4.1
Fish and shellfish
The total fish fauna in the Black Sea was 171 species in 2002 (Zaitsev et al, 2002). This was
an increase from previous numbers as a result of the accidental introduction of the Far-
Eastern haarder Mugil soiuy and the carp Oryzias latipes after escaping from fish farms.
Bottom trawling for the shellfish Rapana thomasiana has become widespread along the
Bulgarian Black Sea coast during the past decade, and has raised significant environmental
concerns. Assessment of its impact on benthic communities reveals disruption of mussel bed
and transformation of the bottom community from epifauna (mussels and crustaceans)
dominated to infauna (clams and polychaetes) dominated, which is generally less diverse
(Konsulova et al., 2003). The status of Black sea fisheries is dealt with in more detail in
Section 3.3.8.
3.3.4.2 Birds
Due to the specific bio-geographic position of the Black Sea in Europe and in the Western
Palaearctic, the Black Sea coasts are situated on main bird migration routes that stretch from
the Arctic to South Africa, therefore the coastal waters provide nesting/wintering/roosting
habitats for a variety of migratory waterfowl The wetlands of the Black Sea basin provide
refuge for 25 million migrating waterfowl every year (Zaitsev et al, 2002). There are about
160,000 pairs of nesting waterfowl and 480,000 individual wintering birds in the Black Sea
wetlands (Chernichko et al., 1993). The most significant habitats are situated in the coastal
34 Data source: Dr C. Dumitrache, National Institute for Marine Research and Development, Constanta,
Romania
35
area of Romania (Danube Delta), Ukraine and the Russian Federation from the Danube Delta
to the Tamansky Peninsula in the Kerch Strait. More than 75 % of the Black Sea birds
concentrate here and one third of their number inhabit the Danube Delta. There are 320 bird
species in the Danube Delta. Of great importance in the Danube Delta are the pygmy
cormorant Phalacrocorax pygmeus; the red-breasted goose Branta ruficollis Ł 275,000 - of
winter winter there (over one tenth of the world's population); the white pelican Pelecanus
onocrotalus; the Dalmatian pelican Pelecanus crispus; and the white-tailed eagle Haliacetus
albicilla (eight pairs of this species in the Romanian part [Green, 1992] and three in the
Ukrainian part of the delta [Zhmud, pers. comm.]). The region's sea birds include gulls
(Larus spp) and terns (Sterna spp). During migration seasons, the bird fauna is diversified by
numerous species of sandpipers and ducks.
3.3.4.3 Mammals
Four species of mammal occur in the Black Sea: the monk seal (Monachus monachus),
which is on the verge of extinction, and three species of dolphins, the bottlenose dolphin
(Tursiops truncatus ponticus), the common dolphin (Delphinus delphis ponticus) and the
harbour porpoise (Phocaena phocaena relicta). At the start of the 1950s the Black Sea was
home to about 1 million dolphins. Although hunting for dolphins has been banned since
1966 their population by the end of the 1980s was less than 50,000 to 100,000.
3.3.5
Alien species introduction
Economic globalisation provided unprecedented opportunities for species to overcome
geographic barriers and establish in new habitats. Enclosed or semi enclosed ecosystems, as
the Black Sea, seem particularly sensitive to biological invasions. With the increased
shipping traffic, aquaculture and trade the Black Sea has become a major recipient of alien
species. The shared marine environment contributes to the spread of alien species from one
national sector to the others. Alien species can cause irreversible environmental impact at the
genetic, species and ecosystem levels in ways that cause significant damage to the goods and
services provided by ecosystems and thus to human interests. For this reason, they are now
recognized as one of the great biological threats to the environment and economic welfare
globally.
An inventory of the aquatic and semi-aquatic alien species recorded in the Black Sea marine
and coastal habitats is given in Annex 6. The number of registered alien species at the
regional level amounts to 217 (parasites and mycelium excluded). Nearly half of them (102)
are permanently established, a quarter - highly or moderately invasive (20 and 35 species
respectively). This high ratio of invasive aliens suggests serious impact on the Black Sea
native biological diversity and negative consequences for human activities and economic
interests.
Figure 3.20 shows the number of permanently, temporarily and recently established alien
species per decade of first occurrence or first published record. Despite the uncertainty
deriving from lag time between actual introduction and first observation/publishing and
many unknown alien species (esp. planktonic) due to low research effort, the figure is still
indicative of the increasing introduction rates throughout the previous century and currently.
During the last decade (1996-2005) a total of 48 new alien species were recorded, which
represent over 22 % of all registered aliens. The majority belong to phytoplankton (16) and
zoobenthos (15), followed by zooplankton (8), fishes (5), macroalgae (3) and mammals (1).
The establishment success and potential impacts of those is mostly unknown yet due to short
36
period after introduction but certainly increasing rate of alien introduction represents an issue
of ecological and economic concern and needs political action and proper management.
40
35
Mam m als
s
30
e
Fis h
eci
25
Zoobenthos
f
sp
20
o
Zooplankton
er
b
15
Macroalgae
m
u
10
Microphytobenthos
N
Phytoplankton
5
0
0
0
0
0
0
0
0
0
0
0
0
0
190
190
191
192
193
194
195
196
197
198
199
200
<
Decade
Figure 3.20 Number of new recorded alien species (Black Sea and coastal aquatic
habitats) per decade
3.3.6
Loss/decline of biodiversity at the species level Ł IUCN red list
species
Extinction is perhaps the most fundamental form of biodiversity loss that has resonance with
the public and decision makers, and which has clear relevance to ecological processes and
ecosystem function. Within the last 100 years, the Black Sea biota has undergone dramatic
change. Since the beginning of the 20th century, species started declining and local/regional
extinctions occurred as early as the 1960s. As an example, at this time (which is now
considered to be the reference period for the Black Sea), commercially important bivalve
molluscs like Ostrea edulis and Solen marginatus and highly prized fish like tuna and
swordfish were already extinct in Romania and Bulgaria.
The list of threatened species in the Black Sea (Annex 5) is far from being complete. It is not
a comprehensive list of all species which need conservation efforts around the Black Sea, but
rather a compilation of what little has been evaluated until now in the surrounding countries.
For most taxonomic groups, except for birds and mammals, the list badly needs significant
inputs.
3.3.7
Protected areas
The Black Sea community has a global responsibility to preserve the character of its varied
ecosystems and landscapes, and to conserve the migratory species that cross the region and
the threatened species that it hosts. Measures taken to conserve or restore habitats and
species in the Black Sea entail the establishment of protected areas as a major approach of in
situ biodiversity conservation.
37
The total surface of Black Sea marine and coastal protected areas by country is given in
Table 3.6. The statistics show that the largest marine protected areas (MPAs) are designated
by Ukraine, while protected wetlands and coastal terrestrial areas are the largest in Romania.
Romania leads in terms of protected marine area per unit shoreline, followed by Ukraine and
Georgia. In Bulgaria, the coverage of MPAs is clearly insufficient. Turkey has no designated
MPAs, and the least coverage of coastal protected areas compared with other Black Sea
countries, albeit that Russian data were not provided.
Table 3.6
Total surface of Black Sea marine and coastal protected areas by country
and marine protected areas (MPA) per unit shoreline
Protected areas (ha)
Shoreline
MPA(ha)/
Country
Coastal
Coastal
Marine
Total
length shoreline(km)
wetlands terrestrial
Bulgaria
1160 16902.23 115589.9 133652.13
300 4
Georgia
15742 0 28571 44313
310 51
Romania
21000 339336.98
226008 586344.98
225 93
Russia
No data
No data
No data
-
475 -
Turkey
0 31335 3000 34335
1400 0
Ukraine
123530.7 92497.7
68658
284686.4
1628 76
Total
161432.7 480071.9 441826.9 1083331.5
4338
-
The majority of protected marine and coastal areas (93%) were declared during the 1990s,
which is indicative of significant recent progress in in situ conservation of biodiversity in the
Black Sea region. Romania ranks first (56%) regarding surface of protected areas designated
during the 1990s, followed by Ukraine (22%) Bulgaria (10 %) and Georgia (4%), while
Turkey has not declared any protected areas during this period.
3.3.8
Status of fisheries
Fisheries and aquaculture provide a vital source of food, employment, recreation and trade
which supports the Black Sea region communities. Both fisheries and aquaculture are critical
to the social and economic health of the region. After 50 years of rapid geographical
expansion of the fishing areas, together with advances in fishing technology, increases in
catches and shifts in fish populations, in combination with the impacts of invasive species,
the greater Black Sea fisheries are at a critical point.
Due to over-fishing in the early 1970s-1980s, the structure of catches shifted significantly.
Declining stocks of predatory species such as bonito (Sarda sarda), horse mackerel
(Trachurus trachurus), bluefish (Pomatomus saltatrix) and others resulted in an increase in
non-predatory species such as anchovy (Engraulis encrasicolus) and sprat (Sprattus
sprattus). Consequently, fishing fleets have increasingly targeted these species.
During this period, the number of commercially (valuable) exploited fish species declined
from twenty to only five. Extensive expansion of fishing fleet capacity, especially of purse
seine and trawlers in the mid 1980s, led to catch rates of between 800,000-900,000 tonnes
per year. Catches have increased since the mid-1990s, but are still only about half of this
amount (Fig. 4.5).
38
The combined factors of over fishing and invasive species led to a near complete collapse of
the Black Sea fisheries in the 1990's. The previous Black Sea SAP sought to address this
issue through the revitalization of marine living resources. Since this time there has been a
slow but continuous process of improvement in many ecosystem components of the Black
Sea. The rehabilitation of marine living resources has been also noted, but it has not been
symmetrical in terms of either geography or species structure.
Since the mid-1990s the number of large fishing vessels in the Black Sea has increased (Fig.
3.21). High value species, such as sturgeon (Acipenseridae), turbot (Psetta maxima) and
spiny dogfish (Squalus acanthias) continue to be threatened by over fishing. Recognizing
that sturgeon stocks in the BlackSea/lower Danube River have been seriously depleted,
Bulgaria, Romania and Ukraine (and Serbia) have requested zero CITES quotas for these
fish in 2007.
. 600
)
1800 s
nne
el
ss
k
t
o
( 400
1200 veg
a
t
c
h
i
n
i
s
h
a
l
c
f
f
200
600
nnu
.
o
o
a
l
a
t
a
l
N
Tot
o
0
T
19
19
19
19
19
20
20
20
0
91
93
95
97
99
01
03
05
Figure 3.21 Total fish landings from and total number of fishing vessels >12 m length
in the Black Sea, 1991-2005
Fish consumption within the region continues to increase and, as market demand increases, it
is expected that this will result in increased pressure on fish (populations) stocks in the Black
Sea. Despite these challenges, the economic importance of Black Sea fisheries remains high,
contributing to employment both directly and in supporting sectors in communities around
the Black Sea coast.
Recently, new "ecosystem-based fisheries management" approaches have been advocated,
but these must also address issues influencing fisheries such as land based pollution, habitat
deterioration, nutrient loading and eutrophication, as well as the impact of industrial fishing
techniques. In addition, consideration related to biodiversity shifts, and climate change will
have impacts on the health of fisheries in the Black Sea.
3.4
Status of chemical pollutants
This section, and Section 3.5, are not intended to provide a thorough overview of water
quality in the Black Sea, but by focusing on specific pollutants it is intended to demonstrate
which areas of the Sea have the highest levels of contamination and where there are
problems in making a regional assessment of pollution status because of the lack of
monitoring data collection/provision.
39
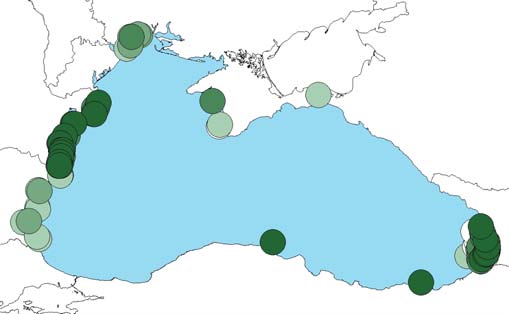
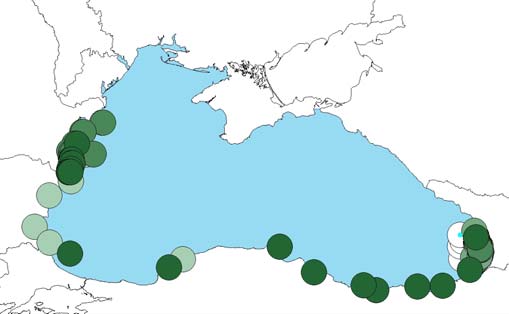
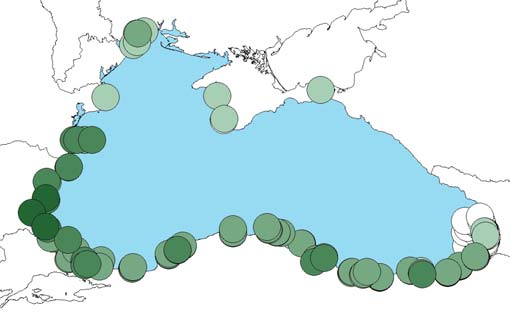
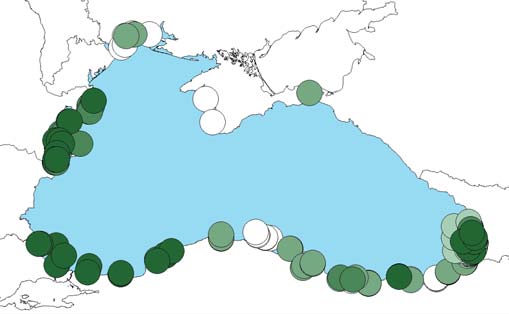
3.4.1 Water
column
Fig. 3.22 shows average concentrations of four parameters in surface waters (0-10 m) of the
Black Sea, with nitrate and phosphate displayed in Fig. 3.24. The data are not de-
seasonalised and are presented with reference to a quantile (5-class) system, such that for
each parameter approximately 20% of the results fall into each class. For each map, the
darker the colour the greater the concentration, with class boundaries as follows:
Colour BOD5
Dissolved copper
Total petroleum
Total suspended
(mg/l)
(Ąg/l)
hydrocarbons
solids
(mg/l)
(mg/l)
<1.125 <1.000 <0.018 <1.550
>1.125-2.137 >1.001-2.667 >0.018-0.020 >1.550-4.194
>2.137-2.948 >2.667-3.000 >0.020-0.050 >4.194-8.031
>2.948-4.780 >3.000-13.346 >0.050-0.180 >8.031-14.853
>4.780 >13.346 >0.180 >14.853
BOD5
Dissolved copper
Total suspended solids
Total petroleum hydrocarbons
Figure 3.22 Mean concentrations of BOD5, dissolved copper, total suspended solids
and total petroleum hydrocarbons in surface waters (0-10m depth) of the
Black Sea, 2000-2005
40
BOD5 levels are elevated along the Romanian coasts, where discharges from the Danube and
Dniester rivers exert their greatest influence, as well as at several sites along the Georgian
coast, due to a combination of untreated municipal and river discharges.
Dissolved copper levels appear to be elevated along much of the Turkish coast, with with
more isolated examples off the Romanian and Georgian coasts. It is not clear whether these
result arise principally from point sources or are due to geological differences. No data were
available for Russian or Ukrainian coastal waters.
Total suspended solids is a measure of the amount of particulate matter (of biological and
geological origin) in the water column. This can be related to trophic status, since
phytoplankton form a proportion of the material measured. Major river inflows tend to result
in turbidity/suspended solids plumes within the Sea, although this is not clear from the scale
of data shown. The pattern which emerges is interesting, however,
Petroleum hydrocarbon levels (a measure of oil pollution) are highest in three distinct areas:
off the Georgian coast (important oil terminals/ports); the west Turkish coast, which ties in
with the pattern of water flow shown in Fig 3.4 and the pattern of likely oil spills reported in
Fig. <4.>; and at several points along the Romanian coast. The latter could be due to
shipping-related oil spills, point source discharges or the influence of high levels of oil in
Danube waters Ł highlighted as a cause of concern in the 1996 TDA, but now probably less
important than it once was.
3.4.2 Sediment
Fig. 3.2.3 shows average concentrations of six parameters in surface sediments (up to 20 cm
depth) of the Black Sea. Data are presented with reference to a quantile (5-class) system,
such that for each parameter approximately 20% of the results fall into each class35. For each
map, the darker the colour the greater the concentration, with class boundaries as follows:
Colour Chromium
Copper
DDT
Total HCHs
Total
Total
(mg/kg)
(mg/kg)
(Ąg/kg)
(Ąg/kg)
organic
petroleum
carbon
hydrocarbons
(mg/g)
(Ąg/g)
<40.00 <21.21 <3.12 <1.12 <0.85 <5.51
40.00-64.00 21.21-32.00 3.12-9.87
1.12-2.31 0.85-1.40 5.51-26.00
>64.00-89.00 >32.00-43.00 >9.87-35.62 >2.31-34.00 >1.40-1.94 >26-60.72
>89.00-112.00 >43.00-68.50 >35.61-106.04 >34.00-54.00 >1.94-4.32 >60.72-190.00
>112.001 >68.501 >106.04 >54.00 >4.32 >190.00
As with Fig 3.23, higher concentration values are plotted on top of lower values to
emphasise where attention needs to be paid in terms of reducing discharges (river, municipal
or industrial) to water.
35A potential "problem" occurs with this method of presentation when many results are the same. This usually
happens when large numbers of values are at or below the limit of detection. In such cases, the values are all
reported as falling into a single class. This has obviously occurred with reporting of DDT levels in ediments
(Fig 3.23) and with nitrate levels in water (Fig. 3.24).
41
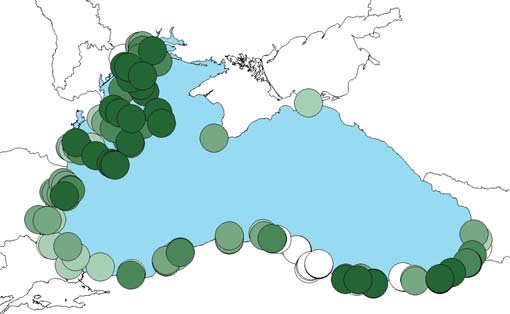
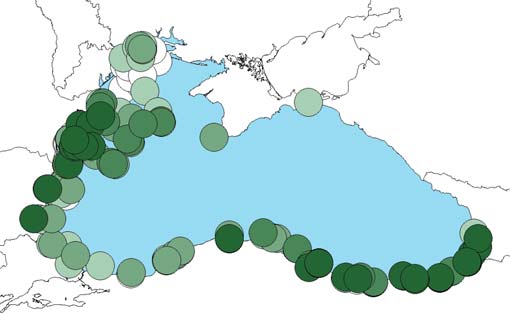
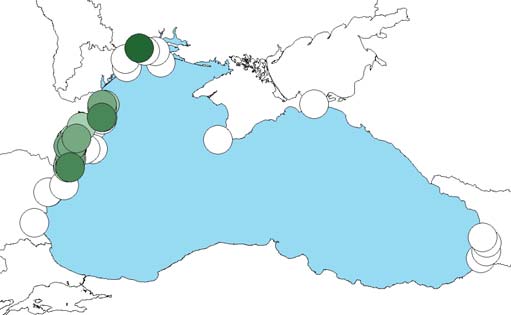
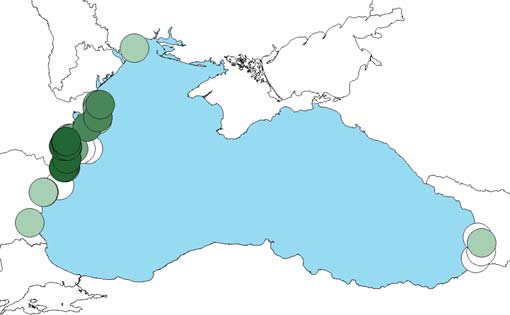
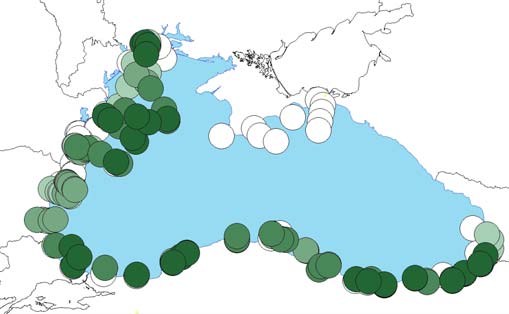
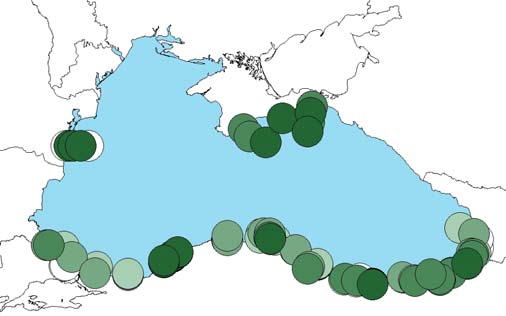
Chromium concentrations are particularly elevated along the western-central area of the NW
Shelf, where the influence of the Danube and Dneister are greatest. There is also a
suggestion that discharges from land in the Odessa and Samsun areas may also be potential
sources.
Chromium
Copper
DDT
Total HCHs
Total organic carbon
Total petroleum hydrocarbons
Figure 3.23 Mean concentrations of chromium, copper, DDT, total HCHs36, total
organic carbon and total petroleum hydrocarbons in sediments of the
Black Sea, 1996-2006
36 Hexachlorocyclohexanes Ł a chemical group of pesticides
42
Copper contamination in sediments mirrors that of copper levels in surface waters (Fig.
3.22), with elevated concentrations along the eastern Turkish and southern Georgian coast
(possibly due to copper of geological origin, but copper mine tailings treatment at Murgul,
Turkey, close to the Georgian border, has not been upgraded, despite the mine having been
identified as a hot-spot in need of capital investment in the 1996 TDA (see Section 5 and
Annex 11). Copper levels are also elevated along the western edge of the Black Sea, where
the Danube and Dneister rivers enter the Sea. Elevated levels are also present in sediments
off the Bulgarian coast, but it is not clear whether these are due to river-borne or direct
municipal/industrial discharges.
DDT is distribution is very patchy in sediments, being alarmingly high at one Ukrainian
coastal site, with less severe but more widespread contamination off the Romanian coast.
The levels of Romanian sediment DDT contamination are mirrored in the Total HCH results.
Total organic carbon, as a measure of organic enrichment, does not follow the exact pattern
that might be expected from previous analyses of zoobenthic communities (e.g. Todorova
and Konsulova, 2006) and dissolved oxygen assessments. However, there is considerable
contamination in the mid-NW Shelf, some way removed from land, suggesting that
phytoplankton blooms are the major source of this enrichment. And, as the status of
zoobenthos communities improves in a general pattern from north to south in the the NW
Shelf, so does the overall level of organic enrichment reduce. Organic enrichment at several
sites along the Turkish coast is also elevated. Here, phytoplankton blooms are not as intense
as those found in the NW Shelf, so it appears that land-derived organic sources could be
more important.
Unlike copper, sediment contamination with total petroleum hydrocarbons does not reflect
the level of contamination in surface waters (cf Figs 2.22 and 2.23). In sediments, levels of
contamination on either side of the Bosphorus are considerably less than those found in
surface waters. Oil contamination in sediments along the east Crimean coast.and
perpendicular to where the Kerch Strait enters the Sea is also particularly high. Presumably,
the elevated Ukrainian results reflect the high level of ship traffic through the Kerch Strait.
Elevated levels of sediment oil contamination at two sites off the Romanian coast do,
however, mirror the high concentrations found in surface waters.
Relatively high contamination levels of some pesticides, heavy metals and PCBs have been
found at sites in the Black Sea (e.g..Parr et al, 2005). The concentrations of some substances
are in or above the ranges used as Ecotoxicological Assessment Criteria (EACs37) by
OSPAR. Whilst the applicability to the Black Sea of EACs developed for the NE Atlantic is
not known, the significance of the detected contamination should be further investigated.
3.5
Status of the nutrient regime
Fig. 3.24 shows average concentrations of nitrate and phosphate in surface waters (0-10 m)
of the Black Sea. The data are presented with reference to a quantile (5-class) system, such
that for each parameter some 20% of the results should fall into each category. For each
map, the darker the colour the greater the concentration, with class boundaries as follows:
37EACs are defined as concentration levels of a substance above which concern is indicated, and have been
used by OSPAR to identify possible areas of concern and to indicate which substances might be a target for
priority action.
43
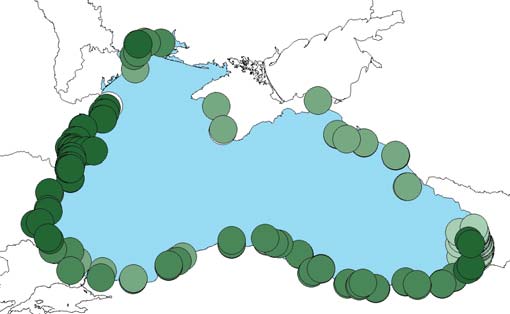
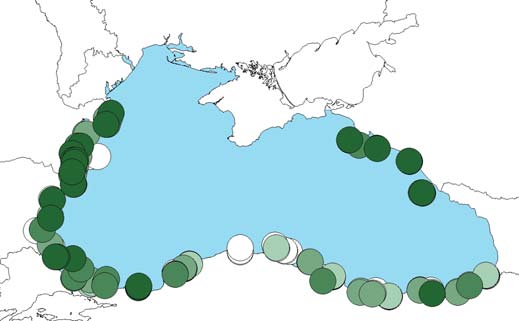
Colour Nitrate
Phosphate
(mg NO3-N/l)
(mg PO4-P/l)
<0.0001 <0.004
0.0001-0.001 >0.004-0.005
>0.001-0.02 >0.005-0.008
>0.02-0.04 >0.008-0.012
>0.04-1.68 >0.012
Nitrate
Phosphate
Figure 3.24 Mean concentrations of nitrate and phosphate in surface waters of the
Black Sea, 200-2005
A clear pattern of nitrate enrichment occurs (despite many of the results falling below the
analytical limit of detection), with high concentrations along the western edge of the sea.
Levels around Odessa are also nitrate-enriched, with moderate levels of contanination along
much of the east Turkish coast. A small number of sites offshore of the Turkish/Georgian
border show high levels of enrichment, which are likely to be the result of either a lack of
summer results (when nitrate levels are lowest) or poor analytical quality control.
A similar pattern emerges with regard to phosphate levels: high along the western edge of
the Sea, albeit with isolated sites of higher contamination along the Turkish coast,
presumably due to local discharges. There is no obvious reason for the elevated phosphate
concentrations recorded off the Russian coast, so these could point to analytical quality
control issues in the laboratory involved38.
38 All laboratories participating in the Black Sea Integrated Monitoring and Assessment Programme (BSIMAP)
have been participating in the QUASIMEME proficiency testing programme for several years now, and results
are improving, particularly with regard to nutrient analyses. However, some of the individual results used in
this assessment are from samples collected before participation in the QUASIMEME scheme started.
44
3.6
Institutional setting and stakeholders
3.6.1 Institutional
setting
Since the beginning of the 1990s, the countries of the region, with financial assistance from
the international community, have started to co-operate in order to promote the sustainable
use of transboundary water resources. The 1992 Bucharest Convention and its Protocols, the
1993 Odessa Declaration and the 1996 Black Sea Strategic Action Programme for the
Protection of the Black Sea against Pollution provided the impetus and framework for co-
operation among the six Black Sea countries. The Ministries of Environment from the six
Black Sea Countries are responsible for the overall implementation, at national level, of the
Bucharest Convention and the Black Sea Strategic Action Programme.
To achieve the purposes of the Bucharest Convention the Black Sea Commission was
established, with one member from each of the six national governments. The Commission
provides a supervisory role over its Permanent Secretariat which, in turn, co-ordinates the
activities of the Commission.
The mandate of the BSC is broad and, with time, has been further expanded to include
additional activities. The functions of the BSC are defined under Article XVIII of the
Bucharest Convention. Existing protocols to the Convention have added some new functions
to the already extensive list, or specified further responsibilities. Additional functions have
also been entrusted to the Commission by two declarations adopted at regular meetings of
Ministers of the Environment of Black Sea states Ł the 1993 Odessa Declaration and the
2002 Sofia Declaration - as well as by memoranda of understanding and cooperation
between the BSC and other international bodies Ł the ICPDR and the European Environment
Agency.
The Permanent Secretariat, which officially started operating in 2000, is supported in
implementing the BSC activities by sixteen subsidiary bodies, some of which are adequately
funded and other not. This is further discussed in Section 6.
For Black Sea riparian countries, ensuring a robust institutional framework is a key element
in the successful protection of the Black Sea. During the last few years some of the Black
Sea countries have made substantial progress in improving this framework for environmental
protection, supported by major changes in the legal framework.
3.6.2 Stakeholders
A list of 42 institutional and stakeholder groups were identified (Annex 7) based on their
specific involvement in/contribution to management and/or protection of the Black Sea.
Table 3.7 presents an initial overview of their level of involvement in management of the
transboundary issues, and the degree to which they are impacted by the conditions. A more
detailed analysis of their roles, perceptions and priorities is presented in Section 7.
45
Table 3.7
Summary of stakeholder involvement and management
STAKEHOLDER INVOLVEMENT AND IMPACT
Management Involvement
Degree Impacted
DESCRIPTION
by Issue
Management of issue:
Degree Impacted:
t
s
t
s
Directly
High
Indirectly
Medium
Not Involved
Low
Nutrien
Fisheries
Pollution
Nutrien
Fisheries
Pollution
Biodiversity
Biodiversity
1.
Water, Hydro-meteorological Department
2.
Environmental Ministry39
3.
Industry Ministry
4.
Energy Ministry
5.
Economic Ministry
6.
Foreign Affairs Ministry
7.
Defence Ministry
8.
Internal Affairs Ministry
9.
Agriculture Ministry
10. Fisheries Agencies
11. Social Welfare / Public Health Ministry
12. Labour Ministry
13. Public Administrator/ planning agency
14. Regulator agent official/ Enforcement agent
15. Shipping Agencies
16. Parliamentary committees40
17. Inter ministerial Committees/Basin Committees
18. Non Governmental Organization
19. Scientists
20. Manufacturing industry
21. Agro-industry
22. Live stock industry
23. Shipping industry
24. Fishing industry
25. Harbour/port administration
26. Regional government official
27. District water management official
28. Environmental Protection Agencies official
29. Municipal Government
30. Municipal waste manager
31. Nature reserve staff
32. Community based organization
33. Worker on a state owned farm
34. Worker on a privately owned farm
35. Fisherman small-scale
36. Educator/teacher
37. Student
38. Public health care provider
39. Member of coastal community
40. Tourism/Recreation industry
41. Press and media
42. International Funding Inst.
39 Natural Resources, Ecology, Water or Environmental Ministry
40 Parliamentary committees for environmental protection
46
3.7
Public perception of environmental status, causes and
responsibilities
In July 2006 over 400 people were randomly questioned from coastal cities and towns
including: Sochi, Novorossijsk and Anapa in Russia; Odessa and Nikolaev in Ukraine; Varna
in Bulgaria, Constanta in Romania; Trabzon, Ordu, and Zonguldak in Turkey; and Batumi,
Kobuleti, Poti and Grigoleti in Georgia. Those questioned were not selected on the basis of
gender, age or occupational considerations; and since the survey was organized through
regional environmental NGOs, respondents would almost certainly have had a higher than
average level of environmental awareness. Nevertheless, this represents the only recent
regional survey of public opinion undertaken on the causes, status and perceived
responsibilities for environmental problems of the Black Sea. Some of these results are
shown in Fig. 3.25.
Encouragingly, over 90% of all respondents from coastal towns and cities around the Black
Sea said the health of the Black Sea was important to them personally, with almost 70%
stating that responsibility for the Sea's problems should be shared by all coastal and Danube
countries. Most people felt that protecting the Black Sea was a responsibility that should be
shared between national governments (27%) coastal municipalities (26%) and all individuals
living along the coast (21%). However, almost a third of people questioned thought the Sea
was either completely dead (14%) or the most polluted sea in Europe (19%). Nearly half of
respondents (46%) felt it was "only occasionally polluted in certain places", but only 6% of
respondents felt it was healthier than it used to be.
Nearly a quarter of people thought the main barrier to protecting the Black Sea was still a
lack of public awareness of the problems and their impacts. Most people felt the factors
having the biggest impact on the health of the Black Sea were: pollution from factories
(21%), untreated sewerage (13%), rubbish and litter (13%), and the over development of
coastal areas (12%). Only 9% of people felt that poor agricultural practices were having a
negative impact on the health of the Black Sea.
In the survey only 7% of respondents viewed over-fishing as a leading cause of damage to
the Black Sea environment and only 13% said they would consider not buying threatened
fish species.
When asked why they thought the health of the Black Sea was important the highest
response was because of the need to protect it for future generations (27%), followed by the
need to protect marine species (23%). Another 22% of people felt it was important to protect
the Sea because of holiday and recreation opportunities. Most people associated the Black
Sea with holidays/recreation (34%) and fishing (20%) but, disturbingly, the next highest
factor associated with the Black Sea was `pollution and litter' (19%), ahead of marine life
(18%).
47
What do you most associate the Black Sea
Is the health of the Black Sea important to
with?
you?
Other
Summer
Not very
Not
9%
holidays
important
important
and
6%
at all
Pollution &
recreation
1%
litter
34%
19%
Quite
important
Very
37%
Marine life
important
18%
Fishing
56%
20%
Do you think the Black Sea is healthy?
Which countries are the main polluters of
the Black Sea?
Only our
Very
country
Mostly
healthy
4%
healthy
No, the sea
1%
All
Our own &
14%
is almost
countries
a few other
Much
dead
combined
coastal
healthier
14%
37%
countries
than it
18%
used to be
Most
A few
6%
polluted
other
sea in
coastal
Europe
Other
countries
Occasional
18%
countries
All coastal 11%
ly polluted
along the
countries
in certain
Danube
23%
places
7%
47%
What are the main causes of damage to the
What are the main barriers to protecting
Black Sea?
the Black Sea?
Radioactiv
Nuclear
More
e waste
power
important
Industry -
Litter &
3%
plants
socio-
1%
pollution/c
Rubbish
economic
hemical
Lack of
People are
13%
problems
spills
support
11%
not aware
21%
Oil spills &
from
of the
Over-
shipping
internat'l
problems
fishing
accidents
community
24%
7%
9%
11%
Animal
Too
wastes
expensive
Introduced
1%
Lack of
to do
species
Agro-
regional
anything
5%
chemicals
cooperatio
7%
8%
n
Untreated
11%
Lack of
sewage
coastal
Lack of
action from
13%
Population
developme
legislation
Governme
growth
nt
against
nt
Tourism
2%
12%
main
19%
5%
polluters
17%
Figure 3.25 Public perception of the Black Sea41
41 Data source: Steven Menzies, BSERP
48
4. PRIORITY
TRANSBOUNDARY
PROBLEMS
This chapter identifies the priority transboundary problems in the Black Sea, and then
describes each transboundary problem in detail. In particular each section describes the
problem and justifies its transboundary importance; details the environmental impacts and
socio-economic consequences of each problem; highlights the linkages with other
transboundary problems; and analyses the immediate underlying, and socio-economic, legal
and political root causes.
4.1
Key transboundary problems and priority scores
Twenty-three transboundary problems were originally identified by the 22 members of the
Technical Task Team (TTT) established to produce this report, in order to determine their
relevance and transboundary nature in the context of the Black Sea. The group was asked to
brainstorm and identify the major water related transboundary problems. This narrowed the
original list down to 7 Black Sea transboundary problems:
1. Decline commercial species/fish stocks
2. Nutrient over-enrichment/eutrophication
3. Alien species introduction
4. Chemical pollution
5. Coastal erosion
6. Changes in the flow regime from rivers
7. Habitat and biodiversity changes
A further cross-cutting problem of global climate change was also identified.
This list was further refined by assigning a score to each transboundary problem of between
0 (no importance), 1 (low importance), 2 (moderate importance) and 3 (high importance) to
determine the relevance of the problem from the perspective of the present day and 10-15
years in the future. When examining future change the TTT were asked to consider the
effects of climate change. The scoring activity was based on the following suite of criteria:
Ę Transboundary nature of a problem.
Ę Scale of impacts of a problem on economic terms, the environment and human
health.
Ę Relationship with other environmental problems.
Ę Expected multiple benefits that might be achieved by addressing a problem.
Ę Lack of perceived progress in addressing/solving a problem at the national level.
Ę Recognised multi-country water conflicts.
Ę Reversibility/irreversibility of the problem
The outcomes of this activity are presented in Table 4.1.
49
Table 4.1
Priority transboundary problems in the Black Sea
Future (10-15
Present day
years)42
Median
Median
Transboundary Problem*
Priority
Priority
Score
Score
Decline in natural resources (e.g. fish
High
High
stocks) 3.0
3.0
Nutrient over-enrichment/eutrophication
3.0
High 3.0 High
Chemical pollution
3.0
High 3.0 High
Habitat and biodiversity changes
2.0
Moderate 2.0 Moderate
Alien species introduction 2.0
Moderate 2.0 Moderate
Coastal erosion
1.0
Low 1.0 Low
Changes in the flow regime from rivers
1.0
Low 1.0 Low
Based on the prioritisation exercise, four priority transboundary problems in the Black Sea
were identified for further detailed study. These were:
1. Nutrient over-enrichment/eutrophication
2. Decline in natural resources (e.g. fisheries)
3. Chemical pollution
4. Habitat and biodiversity changes - including alien species introduction
4.2 Nutrient
over-enrichment/eutrophication
4.2.1
The problem
The justification for nutrient-enrichment being a transboundary problem is that once in the
Sea, nutrients are cycled throughout the whole system as a result of dissolved materials being
transported in water currents and by sequestration by phytoplankton which are also
transported in currents. However, it is not only the problem of eutrophication which are
shared by the surrounding countries, the causes of this problem are also shared. All discharge
nutrients into the Sea both directly (industrial/municipal discharges), through river flows into
the Sea, and indirectly via atmospheric emissions containing nitrogen oxides that contribute
to atmospheric deposition. into the Sea. In addition to sharing the same types of nutrient
sources, the same causal chain analysis can be applied on a regional and/or national basis.
The Black Sea is particularly prone to eutrophication because of its enclosed (land-locked)
nature. During cold winters, relatively nutrient-rich water from the northern continental slope
and shelf probably feeds the cold intermediate layer (CIL) that extends over much of the
Black Sea and has a residence time of about 5.5 years (Stanev et al., 2003). Vertical mixing
from the CIL may feed productivity over large areas of the Black Sea, and thus variations in
winter temperatures on the shelf could have a profound effect over offshore primary
production in the summer. Satellite data have also revealed significant winter phytoplankton
blooms in the southern part of the sea, presumably as a result of mixing of deeper waters.
This winter production may make a greater overall contribution to offshore primary
production in the Black Sea than eutrophication-fuelled summer growth (Sorokin, 2002).
The "natural" conditions of the Black Sea remain unknown (Mee et al, 2005).
42Including the effects of global climate change.
50
Nutrient enrichment by itself is not a cause of concern, since there are no toxicity or other
health-related issues associated with nutrient enrichment of the Sea to current or historical
levels (albeit that unionised ammonia is very toxic). Rather, it is the biological response to
nutrient enrichment that is the problem
The biological response occurs through a number of different mechanisms. Higher nutrient
concentrations in the water column result in higher phytoplankton standing crops, with
consequences higher up the food chain (see Section 4.2.3). The higher phytoplankton density
decreases light penetration to submerged macroalgae, which can then only receive sufficient
light to continue to grow in shallower waters. In addition, growth of epiphytic algae (those
growing on the thalli/fronds of seaweeds attached to the sea floor) is also stimulated, further
reducing light availability to their hosts, and so further the reducing the depth at which such
species/communities can survive. The most famous of these seaweeds is the red alga
Phyllophora, which once formed a huge meadow covering much of the Northwest shelf, but
which is now to confined to a mere fraction of its former area.
However, when the increased amount of biological matter living in the sea begins to die, the
sediment becomes organically-enriched and the microbiological decomposition of this
organic matter strips oxygen out of the water in previously highly oxygenated areas of the
NW shelf. The resulting hypoxia can result in the death of fish, although fish are usually
mobile and aware enough to escape such unfavourable conditions, but the greatest impact is
on those invertebrates living on/in the sediment. Thus, a single hypoxic event, even if it lasts
for only a single day, has the potential to devastate the sediment faunal community for years
to come. This includes shellfisheries. Odessa Bay, once nicknamed the "Kingdom of
Mussels", has some distance to go before it can resume that title, since in extensive areas of
the NW Shelf, mussels have been replaced by other invertebrates (albeit belonging to the
same functional group, ie. filter-feeders), notably ascidians.
Even if hypoxic conditions do not occur in the water column, the organic enrichment of both
water and sediment results in ecological changes, e.g. heterotrophic phytoplankton (notably
Noctiluca spp.) increase greatly in number and biomass and there is a shift to sediment fauna
which are more tolerant of low oxygen conditions away from those requiring higher
dissolved oxygen levels.
4.2.2
Environmental impacts and socio-economic consequences
Eutrophication favours the dominance of some species over others, in fish, benthic
zooplankton, phytoplankton and macroalgal communities. In Zernov's Phyllophora field,
Phyllophora nervosa had previously existed in such large quantities that it was exploited
commercially as a source of alginates. However, preliminary results from the July/August
2006 BSERP research cruise show that while Phyllophora brodiaei is present, it is rarely the
dominant species. At shallow depths, the filamentous red alga Polysiphonia sp. becomes
increasingly prevalent, sometimes growing as an epiphyte on Phyllophora. Huge numbers of
ascidians (sea squirts; primitive filter-feeding vertebrates) are also found in deeper parts of
the former Phyllophora field (abundances as large as 300 individuals/m2), benefiting from
the organically-enriched environment.
In other parts of the former field, Phyllophora has been replaced by filamentous red
(Polysiphonia) and green (Ectocarpus confervodes and Desmarestia viridis) algae; species
indicative of nutrient-enriched conditions. Excessive growth of Cladophora sp, another
51
filamentous green alga indicative of nutrient-enrichment, is also reported in both western and
eastern parts of the Black Sea (e.g. Karkinitsky Bay and Anapa bay, respectively).
Thus, the NW Shelf has not returned to its former (1960s) state, dominated by Phyllophora
nervosa, but is instead now dominated by opportunistic filamentous algae, with very smaller
areas of Phyllophora. This is not necessarily bad, since the opportunistic seaweeds may well
be an intermediate step towards a more stable system. However, they still represent eutrophic
conditions, albeit less serious than those represented by the monospecific phytoplankton
blooms of the 1980s. Indeed the fact that there are fairly abundant benthic algae shows that
transparency of the water column is sufficient to allow Phyllophora to re-establish, providing
the level of nutrient enrichment can be reduced.
Current opinion is that too many niches have been filled by opportunistic and/or invasive
species to make it likely that the Black Sea will ever recover to exactly how it was in the
1960s. The question therefore is whether or not the Black Sea ecosystem is `healthier' than it
was during the `dark' years of the 1980s. There appears greater transparency of the water and
this is leading to renewed growth of benthic algae, albeit species that may have been
regarded as a nuisance at other times (but under the current circumstances have an important
function). Dissolved oxygen concentrations in bottom waters are not as great a cause of
concern as they once were, since hypoxic conditions no longer equate to `dead zones'.
Gelatinous organisms continue to abound in the water column, including the common
jellyfish Aurelia aurita (just above the sea floor), the invasive comb jellies Mnemiopsis leydi
and Beroe ovata, and benthic tunicates. Heterotrophic phytoplankton continue to form
intense blooms, notably at the outer edges of riverine influence, but overall there appears to
be a trend away from dense monospecific phytoplankton blooms to a more diverse
phytoplankton community in many areas.
The NW shelf now appears to contain a heavily altered but relatively functional ecosystem
when compared to the 1960s. Nevertheless, symptoms of dysfunction are still evident, such
as the inability of the system to recycle the high load of organic material it receives/produces
in some areas, and the continuing dominance of monospecific phytoplankton blooms in other
areas. At this stage the Black Sea is a long way removed from being `totally recovered' and
requires further protection from human pressure as it adapts to the new reality and the new
species that have settled in it.
Fisheries productivity almost certainly increased as a consequence of eutrophication, due to
the additional energy provided by increased phytoplankton growth being transported up the
food chain, so is likely to decrease as trophic status falls. The implications of this for the
fishing industry, however, are not clear, since the improved oxygen status of much of the
NW shelf is likely to have had a stimulatory effect on fisheries generally in terms of the
expansion of available spawning nursery areas, but an even more favourable effect on
demersal fish species in particular because of the greater area available for living and
feeding.
The impact of improved trophic status on the existing shellfish industry is likely to have been
great in the NW Shelf area because of the much greater area for shellfish production, but of
lesser importance in other parts of the Black Sea. However, it is essential that bacterial
pollution is tackled in shallow coastal water ecosystems if future benefits are to be accrued,
that environmentally sustainable aquaculture methods are utilised and that non-destructive
52
harvesting methods are employed. Only then will the potential socio-economic benefits be
fully realised.
Available data do not provide clear evidence of whether there has been an impact on the
tourist trade, but the growth of filamentous green algal beds along some shores is unlikely to
have been conducive in persuading tourists to return to coastal hotels/resorts. Improved
biodiversity in coastal waters and fringe wetland ecosystems as a result of reduced trophic
status is likely to result in increased numbers of tourists, albeit a more specialised sub-sector
of tourists than those which the Black Sea has attracted during much of the last 20-30 years.
Eco-tourism advertising, whether directed at single issue customers or as a compenent of
wider rest/relaxation packages, has the potential to generate a small but increasing funding
stream for coastal communities.
The socio-economic impacts of changing agricultural management to control nutrient status
of the Black Sea have probably had a greater impact than the changes which have occurred
in any other economic sector. They therefore require special attention. Change in farming
practices resulted in worsening trophic status during the mid-1970s to 1980s, after which a
very abrupt reversal of those practices occurred. The overall result, pre- and post-1990, has
been a huge population shift and major changes in rural community demographics.
Increased mechanisation/industrialisation of farming during the 1970s and 1980s required
fewer workers, resulting in a large-scale migration of predominantly young male workers
from rural to urban areas. This trend was exacerbated by the economic collapse of the late
80s, its bequest to the 1990s and its continuing impact. Thus, a rural-urban migration trend
still continues, albeit one which has slowed in many countries. This has left a high
percentage of female and older residents in rural villages. One national example of how this
pattern has evolved is shown in Table 4.2 for Romania where, since 1960, the proportion of
the population relying on employment within the agricultural sector has halved.
Table 4.2
Romanian population evolution (1960-2003): urbanŁrural distribution
and percentage of population employed in agriculture
Total
population Urban Rural population
Working
population
population
employed in the
agricultural
sector
1960 18,250,000
5,712,250
12,537,750
8,613,434
(31.3%)
(68.7%)
(69.2%)
1970 20,252,541
8,258,138
11,994,403
7,100,686
(40.8%)
(59.2%)
(49.1%)
1988 23,053,552
11,961,847
11,091,705
3,024,200
(51.9%)
(48.1%)
(28%)
1997 22,545,925
12,404,690
10,141,235
3,322,000
(55.0%)
(45.0%)
(36.8%)
2003 21,733,556
11,600,157
10,133,399
3,286,000
(53.4%)
(46.6%)
(35.7%)
53
4.2.3 Linkages
with
other transboundary problems
Nutrient over-enrichment/eutrophication in the Black Sea is closely linked to the
transboundary problems of changes in marine living resources (Section 4.3), chemical
pollution (Section 4.4) and biodiversity/habitat changes (Section 4.5). For chemical
pollution, the explanation is simple: nutrient and (other) chemical share many of thethe same
causes and sources. However, the links between nutrient enrichment and changes in marine
living resources/ biodiversity are more complex.
In general terms, zooplankton feed on phytoplankton, and young fish/larvae feed on
zooplankton, which are themselves eaten by other fish. Phytoplankton biomass in the 1970s
and 1980s was far greater than in the 1960s, with a decreasing trend since 1990.
However, during the 1970s and 1980s, there should not only have been an increase in the
standing crop of phytoplankton as nutrient levels increased, there should also have been an
increase in the standing crop of zooplankton and fish, as the energy from the increased
biomass of phytoplankton was carried up through the food chain. The problem with such
simple explanations is that nutrient enrichment/eutrophication does not operate in isolation
as an environmental problem. For example, the plankton results presented in Section 3.3.2
clearly show that invasive species impact on trophic status indicators such as phytoplankton
and zooplankton biomass. In Section 4.5.4.3 it is noted that eutrophication has been
underestimated as a threat to biodiversity in the Black Sea because of misunderstandings of
how different factors interact to impact on biota. The Mnemiopsis invasion in the 1980s
(Section 3.3.2) brought with it a decrease in fishery productivity, since fewer fish larvae
survived to grow into adults and there was less food available for those fish that did survive.
Whilst eutrophication is considered to be the result of nutrient-enrichment, one of its most
severe effects is the development of hypoxic conditions as a result of the production and
breakdown of organic matter. A consequence of this is dramatically reduced benthic
biodiversity. Organic matter is produced primarily as a result of photosynthesis by
phytoplankton, but organic (BOD5 and total organic carbon) loads from land, discharged to
the Sea via rivers and outfalls, also exacerbate the problem.
Referring back to Section 3.3.2, organic enrichment has resulted in the development of large
populations of non-phytoplankton eating Noctiluca along the Western edge of the Black Sea.
This planktonic organism has to a large extent occupied the ecological niche formerly
occupied by phytoplankton-eating zooplankton. Thus, remote-sensing imagery of
chlorophyll-like substances indicate higher levels of phytoplankton in this area than in other
shallow areas of the Black Sea, .e.g. Fig. 4.1.
54
Figure 4.1
Chlorophyll-like substance concentrations in the Black Sea, May 200443
All ecological communities demonstrate a resistance to change, resilience, as external
pressures on them change. These pressures come in all sorts of forms, such as invasive
species, nutrient and organic enrichment, toxic pollutants, changes in climatic conditions,
etc. Resilience does have its limits, however, and the collapse of the benthic ecosystem in
huge areas of the NW Shelf throughout the 1970s-early 1990s clearly demonstrated this.
4.2.4 Immediate
causes
Fig. 4.2 shows the results of a causal chain analysis of nutrient enrichment of the Black Sea.
The results of this analysis are described in Sections 4.2.4.1-4.2.4.10 and 4.2.5.
The immediate causes of nutrient enrichment are changes (increases) in the nutrient loads
from different sources. Nutrients are derived from a variety of sources (Table 4.3):
Table 4.3
Sources of nutrients to the Black Sea
Nitrogen Phosphorus
Sewage treatment works
Sewage treatment works
Livestock farming
Livestock farming
Land use-based diffuse sources (e.g. arable Land use-based diffuse sources (e.g. arable
farming)
farming)
Industry Industry
Unsewered population
Unsewered population
Natural N export
Natural P export
Atmospheric deposition
Solid waste
Solid waste
Sediment-water exchange
Sediment-water exchange
Transboundary and national rivers
Transboundary and national rivers
Submarine discharges of groundwater
43 Data source: http://marine.jrc.cec.eu.int/frames/archive_seawifs.htm
55
Direct Causes of
Underlying
Root causes
current elevated
Causes
Socio-economic
Resource uses
nutrient levels
drivers
Elevated nutrient loads resulting
in high levels of nutrient
-lack/ poor enforcement of
accumulation in sediments
environmental protection
regulations in agriculture
-Diminished government control of
privatized farms
-Lack of manure/fertiliser
-Lack/poor planning of agricultural
storage facilities
Hi
storical legacy of poor
use
-Point and diffuse sources of
-Unsustainable/inefficient
land use/water
-Low awareness of negative
effluent from livestock farms
ma
nagement
environmental effects
agricultural and/or animal
-Diffuse pollution from fertilizers
farming practices
-ground/soil water discharges
-Intensive livestock production
(containing elevated levels of
ĘLo w standard of living
-lack/ poor enforcement of
-Historical legacy from over
nitrate) to surface waters
(po verty, unemployment,
environmental protection
application of fertilizers
low incomes)
regulations in industry
-Un-/partially treated effluent
-Poor or no enforcement of trade
discharges from
waste discharge regulations
livestock/farms
-Weak sectoral industrial policy and
ĘPo litical changes and/or
related legislations
instability
-No incentive for pollution
-Untreated industrial effluents
prevention and control
-Discharge of untreated
and/or poorly maintained
industrial effluents
ĘIncreased population in
industrial treatment plants
-Atmospheric emissions of
coastal areas
-Uncontrolled development in
-Absence of / or outdated
nitrogen deposited on land/
coastal areas
treatment technology
directly into the sea
-Low level of user fees (tariffs) and
-anachronistic industrial
ĘLow standard of
technologies and practices
incentives for water use and
environmental education
treatment
and awareness
-Poor management and/ or poor
capital investment and operational
funding for waste water
-Anachronistic and/or
collecting/treatment system
insufficient wastewater
ĘPoor implementation of
treatment plants
-Point and diffuse sources of
sectoral management
- Poor management/ planning
raw and partially treated
planning
Unsustainable tourism practices
/use of landfills and/or unsafe
anthropogenic effluents
Lack/poor enforcement of
wastewater treatment plants
- additional seasonal nutrient
environmental protection
-Lack of operation and
loads to sewage treatment works
regulations in tourism
maintenance control for waste
from tourism
water treatment plants
ĘLack/ mismanagement of public
funds dedicated to improve the
quality of the environment
Figure 4.2
Causal chain analysis for nutrient enrichment
56
4.2.4.1
Direct discharges from sewage treatment works and industry
Coastal development has been recognised as a cause of environmental degradation
throughout Western Europe, with the recent publication of a report by the European
Environment Agency (EEA, 2006) highlighting this issue as a common European concern.
This is regarded as an underlying or immediate cause of coastal habitat destruction, nutrient
and toxic substance export to the sea, and therefore a contributory factor to changes in the
patterns of fish/shellfish production and harvests.
A brief tour around the coast of the Sea illustrates the scale of coastal development. Existing
towns are sprawling further along the coast and new small communities are being built. In
the future these may form the seeds of new villages or merge into the suburbs of expanding
towns. With summer populations in resorts being typically 3 times greater than winter
resident populations, there is a need to build sewerage systems and treatment works that can
cope with the peak seasonal demands placed on them.
The vast majority of industrial plants are connected to municipal sewerage systems, so the
nutrient exported are included within the nutrient loads measured for sewage treatment
works discharging to the sea. Relatively few industrial plants discharge directly to the Sea
and, of these, data were requested only for major industrial discharges Ł those with an
average discharge in excess of 1000 m3/day. Likewise, data were requested from national
experts only for municipal sewage treatment works/sewerage system discharges Łserving a
population of at least 5000 people (i.e. with a dry weather discharge of approximately 1000
m3/day). Summary results of these are shown in Table 4.4. In the case of industry, perhaps,
these results are not surprising, since a manufacturing/processing plant producing that
volume of wastewater is likely to be a large facility and industrial discharge data were not
provided by two countries. However, the load from sewage treatment works/municipal
discharges probably represents the great majority of the load from all coastal sewerage
systems, and these values appear to be relatively low. To put the calculated municipal
nutrient loads into perspective, they represent the expected loads of a population of only
about 1 million people, compared to a coastal population of some 7 million inhabitants that
are actually connected to sewerage systems discharging directly into the Sea (Section 3.2.1).
4.2.4.2 Agriculture
In the 1960s the former Soviet countries developed cooperative agricultural farming
practices, containing relatively small numbers of livestock, bred and maintained using
`traditional' animal husbandry systems. A large part of the manure/waste from these (a
mixture of excreta, bedding and feed residues) was applied on cooperative land, as organic
fertiliser for crops. However, during the 1970s and 1980s large stock-breeding farms were
built, using industrial methods of operation. To give an extreme example of the scale of this
agricultural industrialisation, a single Romanian farm contained over 1.2 million pigs.
These intensive livestock farms were usually located close to rivers, into which the manure
and waste was discharged. The role of livestock excreta as a valuable organic fertilizer was
therefore transformed into one of being a problematic pollution source , particularly for
nutrients and biodegradable organic matter, the breakdown of which strips oxygen out of
fresh and marine waters..
During the 1970s and 1980s the increase of livestock numbers in state cooperative farms
(except Turkey) was often combined with changes in farming practices from farmyard
manure to slurry-based systems Ł producing more nutrient-rich and readily biodegradable
57
waste. Manure/slurry which was not discharged to rivers, was disposed of to land without
being used as fertilizer, and so remained as a potential source of pollution. At the same time
soil nutrient testing was introduced and fertilization rates were first recommended both to
meet the needs of crops and to re-establish soil reserves. However, this type of crop
management was in its infancy, was economically (rather than environmentally) driven and
mistakes were made. The result of these changing policies and practices was to increase
nutrient losses to rivers draining the fields, to ground waters and to the Black Sea itself.
Table 4.4
Nutrient loads to the Black Sea (ktonne/yr) from major direct industrial
discharges and sewage treatment works
Country Pollution
Sources
DIN PO4-P
Bulgaria Urban
sources
0.20 0.01
Industrial
Sources
0.58
0.00
Total Bulgarian major point
0.78 0.01
sources
Georgia
Urban sources
no data
no data
Industrial
Sources
no data
no data
Total Georgian major point sources
n/a
n/a
Romania Urban
sources
1.36 0.18
Industrial Sources
0.49
no data
Total Romanian major point
1.85 0.18
sources
Russian
Urban sources
1.39
0.19
Federation
Industrial
Sources
no data
no data
Total Russian major point sources
1.39
0.19
Turkey
Urban sources
0.30
0.41
Industrial
Sources
0.01
0.01
Total Turkish major point sources
0.30
0.41
Ukraine Urban
sources
2.87 1.36
Industrial
Sources
0.10
0.24
Total Ukrainian major point
2.97 1.60
sources
At about the same time, increasingly greater amounts of inorganic mineral fertilizers began
to be used because they were more economic and easier to apply. Following the economic
crisis, the collapse of the Soviet Union and birth of the independent countries of Bulgaria,
Georgia, Romania, the Russian Federation and Ukraine in the early 1990s, a major increase
in subsistence farming occurred, with the ex-Soviet farms reducing in both number and size.
This occurred in parallel with an end to centralised state subsidies for the use of inorganic
fertilisers.
58
Table 4.5 shows that huge changes in livestock numbers have occurred in Black Sea coastal
countries since 1960. For this table, attention should be diverted away from the actual values
themselves, because of problems involved in obtaining data for the entire national coastal
country Black Sea sub-basins (see footnotes to table). However, percentage changes in
livestock numbers presented in the table can be used as a good indicator of change during the
1960-2003 period. For example, livestock numbers reached a clear maximum in 1988, just
prior to the economic collapse, falling sharply to the situation in 1997, since when numbers
of cattle, pigs, sheep and goats continued to fall further until 2003 (by 33, 26 and 31%,
respectively). Only numbers of poultry increased (by 23% over the same period). Comparing
the 1988-2003 period, numbers of cattle fell by by 64%, pigs by 62%, sheep and goats by
67% and poultry by 21%. The 2003 situation shows a major decrease in mammalian
livestock numbers (44-67%) compared with the 1960 values.
Table 4.5
Dynamics of animal livestock numbers in Black Sea coastal country sub-
basins44
1960
1970
198845 1997 2003
Cattle
47,808,957 56,196,915 65,630,247 35,285,708 23,447,582
Pigs
26,953,591 31,398,593 40,281,973 20,594,509 15,206,424
Sheep &
goats
46,654,418 46,218,158 47,141,410 22,317,543 15,372,116
Poultry
207,712,371 261,990,007 452,444,272 290,550,756 356,534,451
The increasing costs of sheep production in particular have resulted in lower consumer
demand for lamb products. The number of poultry has increased dramatically since 1960 due
to the adoption of more intensive and cheaper production practices, bringing with them
increasing demand.
When compared to the livestock figures (Table 4.5), similarly dramatic changes have
happened with regard to the use of inorganic fertilisers in arable farming. This is shown
dramatically by Romanian data (Table 4.6). In 1960 only very low levels of inorganic
fertilisers were applied, but by 1988 the amount of inorganic nitrogen fertiliser had increased
27-fold and inorganic phosphorus fertiliser 7-fold. Following the economic collapse and
independence of Romania, fertiliser application rates fell to below the levels applied in 1970,
with a continuing decrease still evident in 2003. Levels applied in 2003 were about one third
of those applied in 1988. Statistics from the 2005 World Bank World Development
Indicators database46 show that during the early 2000s fertiliser application rates were
substantially higher in Turkey than in other Black Sea countries. Bulgaria, Georgia and
Romania formed a middle group and lowest fertiliser application rates were found in the
Russian Federation and Ukraine.
44 Includes data from the whole Black Sea sub-catchments of Bulgaria, Romania, Turkey and Ukraine. Data
from Abkhazia (Georgia) are not included, and for the Russian Federation only data for Krasnodar Krai are
included
45 Russian Federeatiion data for 1998 were not available, the values shown therefore include Russian
Federation data from 1990
46http://www.worldbank.org
59
Table 4.6
Application of inorganic fertilizers in Romania (1960-2003)
Total N
Total P
Area of
Area of
Kg N/ ha
Kg P/ ha
applied
applied
agricultural arable land
arable
arable
(tonne)
(tonne)
land (ha)
(ha)
land
land
1960 24,600 46,810 14,600,000 9,797,368 2.5
4.8
1970 366,900 203,200 14,932,161 9,742,623 37.7
20.9
1988 687,300 343,500 15,098,874 10,078,530 68.2
34.1
1997 262,000 129,000 14,798,535 8,541,226 30.7
15.1
2003 252,000 95,000 14,715,447 9,402,597 26.8
10.1
An assessment of fertiliser application rates for Black Sea coastal administrative areas is
effectively impossible to make because only three countries provided any information
(Georgia, Romania and Russia). Even amongst these datasets there were differences in the
manner in which data were reported, crop types and years for which data were available and
differences in how organic/inorganic fertiliser data were combined. Nevertheless, it appears
that between 1997 and 2004, inorganic fertiliser application rates have increased for cereal,
oilseed and leguminous (bean and pea) crop production. So, although based on a weak data
set, and with the need to develop robust arable farming indicators for use by all coastal
countries, the decline in arable productivity may now be reversing. If this is true, then
improved regulation of arable agriculture would be an important step in future environmental
management.
However, changed nutrient applications to land are not generally mirrored by spontaneous
parallel changes in nutrient export from land to rivers, groundwater and the Sea. Changed
application rates are reflected in emissions only after a lag period, as excess nutrients present
in the soil are gradually "flushed out" of the terrestrial system or taken up by crops. Figure
4.3 suggests that much of the excess phosphorus in soils would probably have been exported
from land in surface water runoff within a few years.
800
80
600
60
)
)
y
y
t/
t/
(k
(k 400
40
I
N
l
P
D
t
a
o
200
T
20
0
0
3
5
9
88
9
0
92
4
9
5
97
9
8
99
00
01
2
3
59
88
89
90
91
92
93
94
95
96
97
98
99
00
01
02
03
04
05
-19
19
198
199
1
991
19
199
199
19
1
996
19
19
19
20
20
200
200
2004
2
005
19
19
19
19
19
19
19
19
19
19
19
19
19
20
20
20
20
20
20
1
948
DIN (Q corr.) kt/y
DIN kt/y Almazow
1948-
linear trend
Total P (Q corr.) kt/y
Total P kt/y Almazow
Figure 4.3
River Danube annual inorganic nitrogen and total phosphorus loads
(corrected for annual discharge) to the Black Sea (1989-2005)
However, the far greater solubility of nitrogenous salts (which do not adsorb onto
soil/geological substrates) has meant that much of the organic/inorganic nitrogen applied to
land has leached to groundwater, rather than exported directly to surface waters (rivers, lakes
and the Sea itself). Thus, the contribution of groundwater to river flows and direct submarine
discharges implies that even decades after being applied to land, nitrogen from this original
source could still make a large contribution to the nitrogen budget of the Sea.
60
Even if agricultural management practices are revised, the lengthy delay period introduced
by `storage' of inorganic nitrogen in groundwater before improvements in emissions can be
realised make this a difficult source to tackle, particularly from a political viewpoint, since
costs and benefits are usually assessed over a much shorter timescale. However, this is
essential if eutrophication of the Black is to be tackled seriously by Regional governments.
4.2.4.3 Unsewered
population
The majority of the human population in the Black Sea catchment is not connected to
sewerage systems (e.g. in Turkey only about 35% of the population is connected to sewer).
The vast majority of phosphorus in the wastes of this population will be retained in soils,
since the waste is buried and the phosphate binds to the soil. However, where the population
overlies unconfined aquifers, a relatively large proportion of the nitrogen will be released
into interstitial water within the soil and can migrate to groundwaters. Groundwater acts as
both a storage and transport system for inorganic nitrogen; so, once in an aquifer, it is likely
that the nitrogen will eventually be transported to river or discharged directly to the sea. As
with submarine discharges (Section 4.2.4.9) no estimates can be made of this contribution to
the nutrient budget (Section 4.2.4.10), other than the unsewered population contribution to
in-river loads discussed in Section 4.2.4.8)
4.2.4.4
Natural background export from land
Some export of nutrients from land is natural, but no estimates of this are known to have
been made for the Black Sea region. However, workers in Western Europe have identified
what they judge to be `quasi-pristine' rivers, calculated the instream phosphorus loads and
expressed these as export coefficients47. The values cited may include some contribution
from a limited number of small point sources as well as from anthopogenically-derived
diffuse sources in the catchment.
The larger the drainage basin, the lower the proportion of nutrients that are eventually
transported to seas, so for Black Sea, real natural export coefficients will almost certainly be
lower than those discussed in the footnote below. If natural export coefficients of 0.025 kg
PO4-P/ha and 0.25 kg DIN/ha are selected and multiplied by the catchment area of the Sea
(drainage area minus the surface area of the Sea itself), natural annual loads are
approximately 3,630 tonnes PO4-P and 36,300 tonnes DIN can be estimated, the vast
majority of which are already accounted for in river loads (Section 4.2.4.8). These values
represent approximately 20% of the calculated river-borne P load and 10% of the river-borne
DIN load. These results can be compared with the more complex modelling methodology
employed by Kroiss et al (2005), who estimated natural sources of N and P to represent 8%
of total nutrient emissions to the Danube River.
4.2.4.5
Atmospheric deposition
Atmospheric deposition is a substantial source of nitrogen (deriving principally from the
combustion of fossil fuels [vehicles, power generation, etc] and from agricultural
47 Billen et al (1991) reported export rates of 0.05 - 0.65 kg PO4-P/ha/yr for a range of French rivers, whilst
Vighi and Chiaudani (1985) produced figures of 0.07 - 0.65 kg TP/ha/yr for a range of Italian lakes (median
value 0.31 kg/ha/yr). The figures of Billen et al. are likely to be somewhat higher if expressed in terms of total
phosphorus. Background export coefficients of 0.2 kg TP/ha/yr have been used in Austria and Switzerland,
with a lower value (0.1 kg TP/ha/yr) for Finland, Norway and Sweden. (e.g. Morse et al 1993). Much less effort
appears to have focused on estimating natural/ background export of nitrogen, but Parr et al (1999) calculated
in-stream inorganic nitrogen loads at some 200 river sites in the UK. Those sites having the very lowest export
coefficients (approx 1 kg DIN/ha/yr) can be regarded as being at the upper end of natural/background nutrient
export, from which a "natural" export coefficient of <1 kg total N/ha/yr could be assumed.
61
atmospheric emissions), but not of phosphorus. Previous monitoring studies have suggested
a wide range of atmospheric nitrogen deposition rates for the Black Sea, with modelling
studies also intimating that a broad range of nitrogen deposition rates could be applicable
throughout the region and over the Black Sea itself.
A recent nutrient budget for the NW shelf (Mee et al, 2005), indicated nitrogen deposition
rates of 4.8-10.2 kg N/ha, based on data provided by Sofief et al (1994). Multiplying these
values up from the 50,000 km2 of the NW Shelf as used by Mee et al to the 423,000 km2
surface area of the whole Black Sea (excluding the Sea of Azov) provides an air-borne load
estimate of 203,040Ł431,460 tonnes N/year.
4.2.4.6 Solid
waste
Nutrients may enter the Black Sea from both authorized landfills and illegal dumping of
solid waste near to the shore. Nutrients from this source could enter the Sea either in
overland runoff or via groundwater discharges. However, it has not been possible to make an
estimate of nutrient loads entering the Sea from such sources, since the loads from individual
sites differ enormously, depending on the design criteria of authorized landfills, local
topography, geology, precipitation statistics, mass/volume and type of waste dumped, etc.
4.2.4.7
Sediment-water exchange
Once in rivers and the Sea itself, during periods of elevated nutrient loading, huge reservoirs
of nitrogen and phosphorus build up in the sediment and form a source for years to come. In
the marine environment there is no "rule of thumb" to estimate how long this period will be,
but in lakes which undergo a large sudden decrease in phosphorus loadings, a useful estimate
is that it takes in the order of 5 years for sediments to switch from being a net source to a net
sink of phosphorus (Sas, 1989), but for estuarine and coastal systems, and for nitrogen, the
situation is more complex.
From recent (2006) measurements of sediment-water fluxes in the NW Shelf (Friedrich,
2007) the state of the benthic system along the Romanian and Ukrainian coast of the Black
Sea has improved as the bottom water is now more oxygenated than about 10 years ago.
However, benthic nutrient fluxes resulting from the decomposition of organic matter within
the sediment are still at levels comparable with those from the mid 1990s. The release of
nutrients from the sediments continues to fuel productivity within the Sea itself. Parts of the
Phyllophora field appear to be recovering. A healthy benthic ecosystem with plants and
animals in balance releases less organic and inorganic nutrients to the overlaying water than
a disturbed system without macrobenthic life. Phyllophora (and other benthic macroalgae)
play an important role in taking up nutrients released from the sediments and supplying the
benthic system with oxygen (Friedrich, 2007).
Benthic nutrient recycling is a significant internal nutrient source for the pelagic system of
the NW shelf, sustaining high productivity by the release of nutrients from the sediment. For
phosphorus this sedimentwater flux is of the same order of magnitude as river inputs,
albeit that the sedimentwater flux of nitrogen is only about 10% of the river-borne load
(Mee et al, 2005). However, in 2006 only a very low phosphorus flux from the sediment to
the water column was observed in front of the Dniester mouth, on this occasion/site at least,
since phosphate appeared to be adsorbed by the ferric hydroxides visible at the sediment
surface (Friedrich, 2007).
62
Despite there being quantitative estimates of sediment-water nutrient fluxes for the NW
shelf, similar estimates are not available for other shelf areas around the Black Sea coast and
no information is available on fluxes from deep sediments in the main body of the Black Sea.
Consequently no estimates of sediment-water nutrient exchange can be produced for the Sea
as a whole for comparison with other sources in Section 4.2.4.10.
4.2.4.8
River and strait discharges
Because of missing flow (See Section 3.1.5) and/or concentration data from some years, only
data from a 3-year period (2003-2005) are provided to present a regional overview of
nutrient loads to the Black Sea. This is the period for which most information exists,
although data are still missing for some rivers. For Georgian rivers the flow data used are
long-term averages measured prior to 199348, and flow monitoring of the Tuapse River,
Russia was discontinued in 1996 (Table 3.2). Loads from other rivers are based on very few
concentration data and, worryingly, estimates for other rivers (e.g. the Supsa and Khobi) are
missing due to a complete absence of data. However, these are relatively small rivers and
therefore likely to contribute comparatively small loads.
The absence of data for both the Kerch and Bosphorus Straits represent a major gap in our
knowledge of the Region. This information is collected, but has not been provided.
Moreover, different countries have provided data for different nutrient parameters. For a
robust regional presentation of nutrient loads, total N and total P loads should be used, but
instead values are presented only for ortho-phosphate-P and dissolved inorganic nitrogen
loads (Table 4.7). To further compound this problem Russian river loads data provided as
total P loads have had to be converted to ortho-phosphate loads by assuming a total P:ortho-
phosphate-P ratio of 2:1. This is a very broad assumption, which may result in large errors.
Considering the emphasis placed on river and strait nutrient loads in the 1996 TDA and
SAPs, it is unfortunate that substantially improved data were not provided by all countries
for this analysis.
To assess trends in river-borne nutrient loads to the Black Sea since the last TDA was
produced, Fig. 4.4 shows the total river loads of nutrients in those rivers for which annual
load data are available for every year from 1996 to 2005. For PO4-P, this includes the rivers
Rioni, Tchorokhi, Danube, Sakarya, Dniepro, Southern Bug and Dniester; and for dissolved
organic nitrogen the rivers Rioni, Tchorokhi, Danube, Sakarya, Dniepro, Southern Bug and
Dniester. Assuming that the same pattern of change has applied to all rivers draining into the
Black Sea, a linear regression through these combined annual loads suggests a decrease of
over 30% for river-borne DIN and PO4-P loads entering the Sea during this period.
This substantial decrease in river nutrient loads is overwhelmingly due to the decline in
agricultural intensity/productivity that followed the economic collapse at the end of the
1980s, and which continued during the 1990s/early 2000s (Section 4.2.4.2).
48 There are better methods to estimate recent flow than using long-term averages, for example, use of a linear
regression plot of historical annual precipitation/river flow. The regression formula can then be applied to
precipitation data for the period when flow data are not available. This is particularly useful when there has
been considerable variation in inter-annual flow or an overall trend in flow, as monitored data from the Danube
suggests could have occurred in other Regional rivers
63
Table 4.7
Mean annual river-borne loads (tonnes) of nutrients to the Black Sea
(2003-2005)
% of total
% of total
DIN
Country River
river-borne
PO
river-borne
load
4-P
DIN load
PO4-P load
Kamchia 1981
0.55
198
1.11
Aheloy 17
0.00
3
0.02
Veleka 199
0.05
16
0.09
Ropotamo 8
0.00
2 0.01
Batova 31
0.01
1
0.00
Diavolska 2
0.00
0
0.00
Bulgaria
Dvoinitza 28
0.01
10
0.05
Hadjiska 5
0.00
1
0.00
Karaach 18
0.00
6
0.03
Rezovska 66
0.02
4
0.02
Total
Bulgarian
2354 240
River load
Rioni 256
0.07
5
0.03
Supsa
No data
No data
Tchorokhi 281
0.08 5 0.03
Natanebi No
data 10 0.05
Georgia
Khobi No
data
No data
Kubastskali No
data No data
Total Georgian
537 19
river load
Romania Danube
304,093
83.88
8,796
49.42
Sochi 169
0.05
39
0.22
Khosta 36
0.01
8
0.04
Russian
Mzimta 337
0.09
141
0.79
Federation
Tuapse
296
0.08
131
0.74
Total Russian
839 320
river load
Sakarya
8,377
2.31
3,030
17.02
Kizilirmak 812 0.22 93 0.52
Filyos
3,108
0.86
430
2.42
Turkey
Yeilirmak 6,719 1.85 1,137 6.39
Coruh 5857
1.62
1,437
8.07
Total Turkish
24,873 6,127
river load
Dniepro 23,635
6.52
2,169
12.19
Southern Bug
2,547
0.70
64
0.36
Ukraine
Dniester 3,667
1.01
65
0.37
Total
Ukrainian river
29,849 2,298
load
All countries
Total river load 362,545
100
17,799
100
64
)
700
25
600
t
onne
20
500
t
onne)
(
k
k
d 400
15
a
ad (
l
o 300
l
o 10
I
N 200
-
P
l
D
4
100
5
PO
0
nnua
1
0
A
996
1
997
1
998
1
999
2
000
2
001
2
002
2
003
2
004
2
005
19
19
19
19
20
20
20
20
20
20
nnual
96
97
98
99
00
01
02
03
04
05
A
Figure 4.4
Trends in river nutrient loads to the Black Sea, 1996-2005
4.2.4.9
Submarine discharges of groundwater
No estimate of submarine groundwater discharges of nitrogen are known to have been
undertaken. However, such discharges would be included in diffusive sediment-water fluxes,
as discussed in Section 4.2.4.7.
4.2.4.10
Comparison of the magnitude of different nutrient sources
Table 4.8 shows a comparison of nutrient loads to the Black Sea from four major sources.
The river loads include sub-loads from a variety of land-based sources (agriculture,
sewered/unsewred populations, direct industrial discharges to rivers). The contribution of
natural background export from land is not possible to estimate without a validated and
calibrated model. Nevertheless, the table indicates a huge contribution of nitrogen from
atmospheric deposition, albeit that there is considerable uncertainty about this estimate
(Section 4.2.4.5).
Table 4.8
Estimates of annual nutrient loads to the Black Sea (tonnes)
Pollution Source
DIN
PO4-P
Direct discharges from municipal waste
water treatment plants serving >5000
people 6120
2150
Direct discharges from Industrial sources
discharging >1000 m3/day 1180
250
River loads
362545
17799
Atmospheric deposition
203,040Ł431,460
-
However, a nutrient source apportionment study using the MONERIS model for the entire
Danube basin (Kroiss et al, 2005) provides interesting results. These show that in the
Danube (which provides about 70% of the freshwater inflow to the Black Sea), 45% of the N
and 33% of the P are derived from agriculture (both arable and livestock farming); 32% of N
and 56% of P are derived from urban settlements (both sewered and unsewered settlements):
8% of both N and P emissions are considered to be of natural origin; and 16% of N and 3% P
are derived from other diffuse sources (e.g. forestry and small unsewered communities).
4.2.5 Underlying
causes
The underlying socio-economic drivers for nutrient enrichment can be divided into funding
and policy development/enforcement of the major sectoral groups responsible for nutrient
65
production and export to the sea. These can be largely grouped into two categories
corresponding to point (industry and urbanisation; Section 4.2.5.1) and diffuse (agriculture,
atmospheric deposition, internal loading from sediments; Section 4.2.5.2) sources.
4.2.5.1 Point
sources
There are very few large direct discharges of industrial wastewater to the Black Sea,
However, information on monitoring of and compliance with standards for the discharge of
nutrients to sewer from industry has not been made available, so it is difficult to estimate the
industrial contribution to municipal sewage treatment works effluent.
A wide variety of estimates have been made for domestic sewage treatment works around the
world, but most of these methods rely on subtracting the assumed domestic loads (modelled
using per capita nutrient export coefficients) from the load in raw sewerage entering sewage
treatment works. Given that there is so much uncertainty over the selection of such export
coefficients, with further uncertainties over the contribution of detergent-derived phosphate
to domestic loads, as well as sewer leakage, a broad range of industry-derived nutrient load
estimates is available. Alternative modelling approaches are also available, using industry-
specific nutrient export coefficients. Indeed, one such method was used in the 1996 Black
Sea TDA, but such approaches require detailed knowledge of all industrial operations/plants,
which is rarely available.
Despite it not being possible to differentiate between the relative contributions of municipal
and industrial discharges, the underlying causes for both remain similar:
Ę Poor understanding of the "carrying capacity" of receiving waters downstream of
discharges.
Ę Either a low level of environmental awareness or low positioning of environmental
quality on the political agenda, due to strong competition for funding from other
ministries with more politically urgent requirements.
Ę Lack of consideration of the Sea itself as a receiving waterbody for
municipal/industrial discharges to river.
Ę A lack of willingness to impose more stringent enforcement of legislation because of
the socio-economic consequences (closure of factories, increased unemployment,
etc.).
Ę Low penalties for failing to meet discharge standards, meaning that cost-benefit study
results have been heavily weighted in favour of "no investment required" results
Ę For industrial discharges to sewer, poor regulation (monitoring and enforcement of
existing norms) relating to nutrient loads to sewer and a lack of planning/enforcement
Ę Uncoordinated coastal development and associated tourism, leading to over-loaded
sewage treatment facilities that are able offer only partial treatment of the effluent
they receive.
Ę Poor financing of wastewater treatment facilities, either through low service charges
to industrial or municipal users or through the re-direction of fees collected for other
purposes.
Ę Poor investment in regulation/monitoring of discharges, meaning that quality-assured
results to allow enforcement of existing legislation have often not been available.
4.2.5.2 Diffuse
sources
Historically, agricultural management bore little consideration to environmental impacts;
cost-efficiency and socio-economic considerations (employment) were the major drivers
66
behind decisions that were made at policy level. Thus, state subsidies for inorganic fertiliser
application were available in five of the six Black Sea countries. The amount of fertiliser
applied was, sensibly, based on crop nutrient balances, but the result was widescale over-
fertilisation, leaving nutrient surpluses in soil that were just too great to be contained, so
increasing amounts of nutrients were either leached or exported in surface run-off. The
concept of best agricultural practice, encompassing both economic and environmental
considerations had not been embraced at any level.
Even though some guidance was available to promote improved environmental management
(e.g. on the construction of winter manure stores, to prevent the direct application of manure
to frozen land, from where nutrients and organic waste would be washed off during
snowmelt, if not before) this was often not followed and rarely enforced. The emphasis was
often either on guidance or a failure to enforce legislation, meaning that penalties for non-
compliance were scarcely introduced, thereby stimulating a culture of non-awareness of
environmental consequences. The root causes are once again financial.
Mis-management of livestock farming meant that ever increasing numbers of livestock were
concentrated on fewer major farms. A failure to enforce existing legislation resulted in the
manure generated being insufficiently treated, and unwisely disposed of Ł often by collection
and dumping of large manure piles on land or discharge to rivers. The result was that the
main centres of livestock and arable production became increasingly isolated from each, and
it became uneconomic to transport the huge manure surpluses generated in some areas to
arable farms located large distances away. Because of economic considerations, there was
also a move away from solid manure-based farming practices to slurry-based systems, which
further increased the nutrient content of animal waste, due to changes in animal diet/size.
Then, with the economic collapse, break-up of the Soviet Union and an end to state-
subsidies, the level of inorganic fertiliser usage plummeted, almost overnight. Large-scale
livestock production units decreased in size or closed down completely as the market for
meat products collapsed. Customers could no longer afford this level of "luxury". Trends in
GDP and GNI per capita statistics (Section 3.2) suggest more recent increase in personal
wealth with which to purchase food, but the middle class in Black Sea countries tends be of a
small size, with this increased personal wealth belonging predominantly to a very small but
very wealthy upper class.
Small-scale subsistence farming (a few livestock per household) became increasingly
important, and effectively impossible to regulate or manage. Many farmers on this scale lack
the equipment (tractors) necessary to move the manure produced any distance and apply it to
arable land where it would be useful, although many small farms do exist. The overall result
has been one of diminished government control of farming. In addition to this, the manure
from livestock kept in owners gardens Ł a common feature of urban life - is sometimes
disposed of to sewer, helping to over-burden already struggling municipal sewage treatment
works.
Large areas of once productive arable land were either left fallow or abandoned, with some
begining to convert back naturally to scrubland. However, the new status of Bulgaria and
Romania as EU Member States, combined with the low wages of agricultural workers is
likely to stimulate foreign investment in the agricultural sectors of these countries to produce
food for export.
67
It is unclear why such large changes in the agricultural sector have occurred in Turkey, when
there never were such centralised state subsidies for agriculture and the population has
continued to increase. The regional economic collapse would almost certainly have
contributed to such changes, so once again changes in the import-export balance of
agricultural products or changes in diet appear to be at the root of this change.
Currently, there is a lack of good agricultural management and poor awareness of good
environmental practice. Bulgaria, Romania and Turkey intend to fully comply with the EU
Nitrates Directive, requiring the introduction of Best Agricultural Practice, but the larger the
number of farms and the smaller their size, the more difficult such legislation will be to
enforce. The development of national soil monitoring programmes and improved advice to
optimize inorganic and organic fertilizer application for arable crop production are required.
4.2.6 Knowledge
gaps
Ę No information is known on groundwater flows or direct groundwater loads of
inorganic nitrogen loads to the Black Sea. In addition, the groundwater contribution
to the Danube load is estimated to be 47% of the flow, but the contribution of
groundwater to the loads of other rivers to the Black Sea has not been estimated. This
is important to understanding the likely effectiveness of management options to
control diffuse source-derived nitrogen.
Ę The contribution of industry-derived nutrient loads to municipal sewage treatment
works loads is unknown. Based on available data, modeling of such loads is likely to
produce very inaccurate results.
Ę It is not clear whether the perceived increased importance of subsistence farming in
the region is adequately reflected in official livestock statistics.
Ę There are large differences in proposed national statistics on the nutrient content of
livestock manure, from which potential nutrient loads to the Black Sea are estimated.
Ę The contribution of different sources to river-borne nutrient loads for most rivers is
unclear.
Ę Information on nutrient loads to/from the Black Sea via the Bosphorus and Kerch
straits were not received for this report.
4.2.7
Summary and preliminary recommendations
Ę The river Danube is by far the single largest source of nutrients to the Black Sea.
Ę Relevant authorities should measure riverine and municipal/industrial nutrient
discharge concentrations (for the estimation of loads) as total N and total P. Inorganic
nitrogen and ortho-phosphate measurements are a poor substitute for calculating
loads.
Ę Substantial improvements in river nutrient loads appear to have occurred between
1996 and 2005 (about a 30% reduction in both nitrogen and phosphorus). These
improvements have been primarily the result of the economic downturn at the end of
the 1980s and the resultant decrease in agricultural productivity. For these
improvements to be sustained and built upon in future years, capital investments and
improved regulation of agriculture are required.
Ę The contribution of the Bosphorus Strait to Black Sea is particularly important, since
the majority of wastewater from Istanbul is discharged into this waterway. The
Bosphorus effectively consists of two layers: an upper stratum flowing out of the
Black Sea and a lower, denser layer flowing into the Sea. The contribution from
68
Istanbul (a city of 15 million people) could potentially outweigh the direct point
source discharges calculated in this chapter for the entire Black Sea!
Ę The nutrient loads from coastal point sources (direct municipal and industrial
discharges) are a tiny fraction of the load from rivers to the Sea. This suggests that
capital investments to upgrade coastal hot-spots are likely to have only a negligible
effect on transboundary pollution, although local environmental improvements are
likely to be much greater. This suggest a fundamental problem in the approach of the
1996 TDA, which focused so heavily on direct marine discharges.
Ę Huge changes in agriculture have occurred in all Black Sea countries. The largest
changes occurred between the end of the 1980s and the mid-1990s. However, since
1997 there has been a continued decrease in livestock numbers, and therefore
livestock manure as a source of pollution. Agriculture is now much more extensive
than it was in the late-80s, but some indicators suggest that the decline in arable
agricultural productivity has bottomed-out and the region may be facing a renewed
period of increasing inorganic fertiliser use.
Ę A much greater emphasis on nutrient management in agriculture is required, notably
the development, adoption and enforcement of best agricultural practice guidelines,
including revised guidance on fertiliser (organic and inorganic) fertiliser application
rates, together with a robust soil nutrient testing programme.
Ę The environmental requirements for EU membership should result in substantial
improvements in nutrient emissions from land for Bulgaria and Romania within the
next 15 years. Turkey has only recently started EU accession talks, but it's
willingness to comply with the EU Water Framework Directive, should also bring
about substantial improvements.
Ę However, EU accession/membership is not a one-sided issue in terms of
eutrophication. The EU Urban Wastewater Treatment Directive requires all
populations of 2,000 inhabitants or more to be connected to sewer. For currently
unsewered populations of this size, this is likely to increase nutrient emissions to
rivers and the Sea itself, since the nutrient removal efficiency of sewage treatment
works (for phosphorus at least) is likely to be lower than that currently provided by
soil/groundwater.
Ę It would be of value if the quantification of riverine loads (as well as other pollution
sources) could be standardised and harmonised to obtain a more accurate assessment
of loads entering the Black Sea. Good examples of how this has been undertaken by
other Marine Conventions are the RID and PLC guidelines produced by the OSPAR
and HELCOM Commissions, respectively. The Danube has a very well established
river monitoring network (TNMN) with a load assessment programme that started in
2000. All Danubian countries have agreed to use a standard operational procedure for
the measurement and calculation of riverine loads from the Danube into the Black
Sea. Procedures giving comparable results should be adopted for the assessment of
loads at the most downstream points in other major rivers discharging into the Black
Sea.
Ę An emphasis of the original TDA in 1996 was on nutrient source apportionment and
control, as was the 1996 SAP and the updated SAP in 2003. Efforts have been made
to improve the understanding of this issue, but it is still essential to collect and/or
make available good quality data to quantify the various sources of nutrients in order
to develop robust management plans.
69
Box 4.1
Comparative analysis of the 1996 and 2006 TDAs on the transboundary problem of nutrient enrichment/eutrophication
A comparison between the 1996 and 2007 TDA with regard to nutrient enrichment/eutrophication is presented in the table below. In the 1996 TDA, nutrient
pollution was not considered in isolation from other pollutants, and there was no real description of this as an independent problem. The focus of the 1996 TDA
was on the identification of `point sources' of pollution, with a major focus on direct municipal/industrial discharges as sources of pollution. Little information was
presented on the likely contribution of different emissions to river loads. The biodiversity focus of the 1996 TDA included eutrophication as a causative factor in
ecosystem change, but not as a problem in its own right.
Issue
1996 situation
2006/7 situation
Monitoring
Ę
No integrated regional monitoring programme available for the Sea
Ę
Integrated monitoring programe now set up, but with a mixed response from different
itself or for the nutrient sources discharging to it
countries. Biological monitoring has only recently been incorporated into this
programme.
Ę
A regionally coordinated chemical quality assurance scheme is in place for analysis
of samples collected from within the Sea itself, but this programme does not extend
to quality assurance of loads data.
Impact of eutrophication
Ę
Described in simple terms, but with no real description of status
Ę
Much clearer idea of how eutrophication impacts on biodiversity/habitat change, and
of the effects of nutrient enrichment on the pelagic ecosystem and marine living
resources
Ę
Quantification of nutrient levels within the Sea itself
River loads
Ę
Data absent from many rivers. Estimated of nutrient inputs to the
Ę
Monitoring data (and therefore load estimates) are available for the majority of rivers,
Sea from the Bosphorus Strait included
but flow measurements are not available from Georgia
Ę
River loads are overwhelmingly the major source of nutrients to the
Ę
Annual flow data from a large proportion of River-borne loads of N and P appear to
sea
have reduced by about 30% since 1996.
Ę
A much clearer idea of nutrient source apportionment within this individual source
(River loads) is now available.
Ę
No assessment of nutrient loads to the Sea through the Kerch or Bosphorus Straits.
Direct municipal
Ę
Only modelled estimates of loads available. No specified minimum
Ę Monitored
loads
available
discharges
size/volume/load of dischgarge
Ę
Considerable effoirt made on data-checking to ensure comparability of results from
Ę
Directunicipal discharges responsible for only a very small
individual discharges/countries
proportion of the total nutrient load to the Black Sea.
Ę
A comparison cannot be made between the 1996 and 2007 situations because of
problems in equating modelled loads to monitored loads
Ę Direct
municipal
discharges
responsible for only a very small proportion of the total
nutrient load to the Black Sea.
Direct industrial discharges
Ę
Only modelled estimates of loads available. No specified minimum
Ę Monitored
loads
available for industrial plants producing more than 1,000 m3/day.
size/volume/load of dischgarge
Ę
A comparison cannot be made between the 1996 and 2007 situations because of
Ę
Direct ndustrial discharges responsible for only a very small
problems in equating modelled loads to monitored loads
proportion of the total nutrient load to the Black Sea.
Ę
Direct ndustrial discharges responsible for only a very small proportion of the total
nutrient load to the Black Sea.
Atmospheric deposition
Ę
No estimate provided
Ę
Estimate provided for nitrogen, albeit with considerable uncertainty attached. This
estimate suggests that atmospheric deposition may be responsible for a similar load
of nitrogen to the Sea to that discharged via rivers
Other sources, notably
Ę
Very little information. Not considered as important sources to be
Ę
Much clearer idea of the contibution from diffuse sources to the Black Sea, with a far
agriculture
tackled as part of
better understanding of the contribution of agriculre to this problem
Causal chain analysis
Ę
The causal chain was clearly understood, but not considered as as
Ę
Causal chainancluded. This identifies weaknesses in policies/practices and a
a subject in its own right
broader range of contrubuting factors than included in the original TDA becasue of
the increased emphasis on agriculture
Ę
No regionally agreed list of priority pollutants for monitoring/assessment purposes
70
4.3
Changes in commercial marine living resources
4.3.1
The problem
The topic of fisheries in the Black Sea contains a bewildering array of statistics that are often
either incomplete or incomparable. The exploitation of marine living resources, in particular
fisheries, represents an important economic sector, but also has a substantial social impact
for local communities throughout the Black Sea region. Perhaps more to the point, the issue
of fisheries management seems to be a politically charged issue at national levels throughout
the world, with negotiated international agreements taking many years to come to fruition
and the emerging compromises often offering considerably reduced protection of these
valuable resources.
However, the problem of changing commercial marine living resources (MLR) is not simply
one of resource fluctuations, together with their associated socio-economic consequences.
There are huge implications for marine ecology, biodiversity and the ability of the Sea to
process the nutrient/pollutant loads which it receives. As will be shown later, total catch
statistics by themselves reveal very little about the sustainability of existing
practices/resources.
Major changes continue to occur in the underlying contribution of different species to overall
"total catch" estimates, meaning that total catch statistics, reflecting human responses to the
changing resource, hide an underlying problem. For example, since the early-mid 1990s,
total fish catches have increased in the Black Sea, intimating that the resource has recovered
during the last decade, but this is largely due to increased catches of anchovy and sprat.
Catches of whiting (important for the maintenance of turbot and spiny dogfish communities)
and horse mackerel have declined over the same period (Fig. 4.5). Mullet catches have also
fallen dramatically since 1966, but there are some positive signs: in Romanian waters at
least, red and grey mullet populations appear to be undergoing some recovery, as do bluefish
and horse mackerel populations. Horse mackerel and shad have recently re-appeared in
Georgian waters and during the last decade indicators suggest that turbot stocks may have
begun to recover in Bulgarian waters.
However, Romanian turbot catches have remained depressed and Turkish turbot catches
have been very low since 2002, with only 119 tonnes landed from the Black Sea during
2003, compared to landings of about 2,000 tonnes during the mid-1990s. Likewise, Turkish
spiny dogfish and whiting catches (demersal species, as is turbot) have progressively
dwindled. Sturgeon, sea trout, corb and brown meagre catches are also severely depressed.
71
600
All fish
e)
n
n
400
t
c
h
(
k
t
o
ca
al
u
n 200
t
a
l
an
o
T
0
1990
1992
1994
1996
1998
2000
2002
2004
600
30
Anchovy
e
)
e)
Whiting
n
n
n
n
(
k
t
o
400
20
ch
t
c
h
(
k
t
o
cat
al 200
u
al ca
n
u
10
n
t
a
l
an
o
t
a
l
an
T
o
0
T
0
1990
1992
1994
1996
1998
2000
2002
2004
1990
1992
1994
1996
1998
2000
2002
2004
150
20
e)
Sprat
Spiny dog fish
n
e)
n
n
n 15
(
k
t
o
100
(
k
t
o
ch
ch
cat
10
al
al cat
u
Excludes Russian data
50
n
n
u
5
t
a
l
an
t
a
l
an
o
T
0
T
o
0
1990
1992
1994
1996
1998
2000
2002
2004
1990
1992
1994
1996
1998
2000
2002
2004
80
20
Ho rse mackerel
e)
Mullets
e)
n
n
n
n
60
15
(
k
t
o
(
k
t
o
ch
ch
40
cat
10
al
u
u
al cat
n
Excludes Georgian data
n
20
5
t
a
l
an
o
o
t
a
l
an
T
0
T
Excludes Georgian and Ukrainian data
0
90
92
94
96
98
00
02
04
1990
1992
1994
1996
1998
2000
2002
2004
19
19
19
19
19
20
20
20
Figure 4.5
Trends in Black Sea fish catches, 1990-200449
49 Data source: `all fish' data provided by Dr S Nicolaev. Species data provided by national experts.
72
Of those fish taxa found in the Sea, the following represent the major catches in terms of
weight:
Ę Anchovies (Black Sea and Azov Sea anchovy)
Ę Horse mackerel
Ę Whiting
Ę Bonito
Ę Bluefish
Ę Sprat
Ę Mullets (red, thick lip grey, golden grey, thin-lipped, leaping grey, common grey,
Pacific/haarder and striped red mullet)
Ę Spiny dogfish
Ę Turbot
Ę Shads (Caspian, Danube, pontic, common, twaite and pontic shad).
However, other fish, notably sturgeons (Russian, spiny, starred and common sturgeon, and
sterlet) and beluga (also known as great sturgeon), are of great economic importance.
Furthermore, mussels and Rapana, the Japanese snail, represent the most important
invertebrates from a commercial viewpoint.
The transboundary importance of commercial fish species is supported by both economic
and ecological factors. The majority of fish species with commercial value are shared within
the Economic Exclusive Zones (EEZs) of many states such as sprat, whiting, dogfish, turbot
and others. Migratory species such as anchovy, horse mackerel, bluefish and bonito have
spawning, feeding and wintering areas located in the EEZs of different states depending on
the time of year and lifecycle. Consequently, the management applied in exploitation of
shared and migratory stocks must take into consideration appropriate levels of catches in
each coastal state. The distribution of benefits by coastal countries should reflect the
territorial distribution of the resources. At present, Turkey is responsible for some 80% of
the reported total Black Sea fish catch, but the length of the Turkish coastline is less than
one-third of the entire Black Sea coast (Table 3.1)
The scale of the problem depends over what time-scale the issue is judged, and over what
geographical areas. For example, some statistics from Ukrainian waters (Table 4.9) suggest
that, since the 1960s, the fishery for some species has collapsed almost completely.
Table 4.9
Average annual Ukrainian Black Sea catches of selected fish (tonne), 1950-2004
Year Bonito Bluefish Mullets
1950-1969 672 19 956
1970-1995 0 21 132
1996-2004 0 0.01 35
However, such statistics take no account of fishing effort or changes in fishing practices. For
example, record catches of bonito were achieved by the Bulgarian and Turkish fishing fleets
in 2005 (Fig. 4.7), and Fig. 4.8 provides an illustration of how active fishing practices
(trawling, etc.) have rapidly replaced passive fishing practices (long lines, pound nets, gill
nets and trammel lines) in the Romanian coastal fishery. Thus catch statistics by themselves
are of little use in assessing the status of the fishery (see Section 4.3.4)
73
80
60
a
t
c
h
c
)
40
nnual
a
k
t
onne
s
h
ki
20
Tur
(
0
89
91
93
95
97
99
01
03
05
19
19
19
19
19
19
20
20
20
Figure 4.7
Annual Turkish Black Sea catches of bonito, 1989-2005
While the emphasis of this document is on showing changes that have occurred over the last
decade, since the original 1996 Black Sea TDA was written, it is necessary not to lose sight
of changes over the longer-term. This is especially important because the agreed long-term
target (the EcoQO) of the 1996 SAP was "to take measures... to permit Black Sea
ecosystems to recover to conditions similar to those observed in the 1960s."
)
100
Active fishing
(
%
h
Passive fishing
t
c
80
a
l
c
a
60
nnu
a
40
of
t
i
on
20
por
r
o
0
P
0
3
6
9
2
5
8
1
4
198
198
198
198
199
199
199
200
200
Figure 4.8
Fish catches in Romanian coastal waters by active and passive techniques
expressed as a proportion of the total fishery catch, 1990-2004
4.3.2
Environmental impacts and socio-economic consequences
The recent collapse of the fisheries is directly connected with degradation of the water and
sediment quality, destruction of important spawning grounds, and the outbreak of
opportunistic and invasive species. In addition to these, fishing activities are also
responsible for the decline in commercial fisheries, as the declining ecological condition is
exacerbated by open access to resources, individual countries establishing uncoordinated
management regimes, overfishing and illegal fishing in combination with non-sustainable
technologies.
Although there is currently little information available of the socio-economic impacts of
the decline in Black Sea fisheries as they pertain to income and employment levels, the
following issues warrant consideration:
74
Ę Annual losses of catch value (each hundred thousand tons represents more than
150 million USD).
Ę Additional expenses for replacement of processing capacities (fish meal
production plants, canning facilities, etc.) for adapting at new raw materials.
Ę Additional expenses for restructuring of (existing) fishing fleet capacities, due to
adapting vessels to target new species.
Ę Losses of employment and income for local communities.
Ę Increased fragility of the Black Sea ecosystem from anthropogenic pressures
which directly impact the status of commercial marine living resources.
The information in Table 4.10 is incomplete, but shows that seafood consumption has varied
dramatically since the economic crisis and collapse of the Soviet Union at the end of the
1980s, and is once again increasing. However, demand far exceeds supply from the Black
Sea, so huge volumes of seafood continue to be imported.
Nevertheless, the situation does give reason for optimism, since in some countries at least
this has led to an increase in commercial marine and freshwater aquaculture, thereby
providing increased employment opportunities. For example, Table 4.11 shows that in
Ukraine the number of marine and freshwater fish (Odessa Region) and shellfish (Black Sea
and Kerch Strait) farms has increased strongly over the last decade, as has the productivity of
these farms. Because of the relatively low salinity of the Black Sea, some farmed freshwater
fish can also be found in the Sea. For example, silver carp, Hypophthalmichthys molitrix,
whose production in freshwater farms increased over 5-fold between 2004 and 2005, is
recognised as an invasive species in the Sea itself.
Of course, poor aquacultual practices, as with any kind of farming, can be a cause of serious
environmental problems in their own right. It is, therefore, encouraging that robust scientific/
environmental principles have been developed for Bulgarian mussel farms (Konsulova et al,
2006), particularly in light of the Turkish Eastern Black Sea shellfish industry collapse
(Mediterranean mussels, Mytilus galloprovincialis and clams) as a result of Rapana venosa.
Considering the very under-developed status of mariculture in Bulgaria, these
principles/guidelines have been developed at just the right time!
While sounding disastrous, the Rapana story is an example of how humans have themselves
adapted to the changing ecology of the Black Sea. For example, while Mytilus has not been
collected commercially along the Eastern Turkey Black Sea coast since 2000, landings of
Rapana from the same waters have increased dramatically since then Ł from a yield of 2-
3,000 tonnes/yr during the 1990s to a peak of 12,890 tonnes in 2004 (Table 4.12). From the
whole Turkish Black Sea coast, landings of Mytilus plummeted to a mere 17 tonnes in 2001,
but have since rallied to values approaching 3,000 tonnes/yr, and in one year (2003), even
exceeded 4,000 tonnes. These values are higher than those recorded during the late 1990s
(Table 4.12), but still considerably lower than those produced during the 1992-1995 period
(approx. 6,000 tonnes/year). Clam production from Turkish Coastal waters has resumed to
levels similar to those recorded in the early-mid 1990s (excluding the extremely high 1994
value; Table 4.12)
75
Table 4.10 Seafood production, consumption and employment statistics for Black
Sea coastal countries
Bulgaria
Georgia
Romania
Russian
Turkey Ukraine
Federation
Seafood
Increased
25-30 kg/yr 8 kg/yr
No data
7-8 kg/yr
11-13 kg/yr
consumptio
from 3 to
(1989),
provided
throughout
(2002-
n per capita 4.3 kg/yr
falling to
Turkey as a 2005)
(1990-
2 kg/yr
whole, but
2005).
1990-2000)
>25kg/yr in
and rising
the Black
to 3.5 kg/yr
Sea coastal
(2005), due
region
to
increasing
imports
Proportion
Import far
17-40% Steady No data.
No data.
>50%
of seafood
exceeds
increase
provided
provided
imported
export of
from 12%
fish
in 1995 to
products
78% in
2004
Direct
Approx.
Approx.
Approx.
No data
Approx.
employment 3,500 men
3,200
1,050
provided
4,000
in fisheries/
(only 1% of people
people
people
aquaculture
fishing
sector
licences
held by
Approx.
25,000 part-
women),
the majority
or full-time
on a part-
fishermen50,
time or
crew,
seasonal
seafood
traders,
basis
processing
Secondary
12,260
2,000
No data
No data
plant and
See text
employment people
people
provided
provided
transportati
employed
on workers
seasonally
in seafood
processing
industry
(2005)
While sounding disastrous, the Rapana story is an example of how humans have themselves
adapted to the changing ecology of the Black Sea. For example, while Mytilus has not been
collected commercially along the Eastern Turkey Black Sea coast since 2000, landings of
Rapana from the same waters have increased dramatically since then Ł from a yield of 2-
3,000 tonnes/yr during the 1990s to a peak of 12,890 tonnes in 2004 (Table 4.12). From the
whole Turkish Black Sea coast, landings of Mytilus plummeted to a mere 17 tonnes in 2001,
but have since rallied to values approaching 3,000 tonnes/yr, and in one year (2003), even
exceeded 4,000 tonnes. These values are higher than those recorded during the late 1990s
50 Turkey contains about 100,000 licensed fishermen (freshwater and marine) nationwide.
76
(Table 4.12), but still considerably lower than those produced during the 1992-1995 period
(approx. 6,000 tonnes/year). Clam production from Turkish Coastal waters has resumed to
levels similar to those recorded in the early-mid 1990s (excluding the extremely high 1994
value; Table 4.12)
Table 4.11
Aquacultural production in the Ukrainian Black Sea region for
commercial fish farms and mussel farms, 1996-2005 (tonnes)
1996 1997 1998 1999 2000 2001 2002 2003 2004 2005
No of mussel farms
?
?
?
2
?
14
19
18
25
Number of fish farms
4
4
4
6
8
8
Pontic anchovys
5.5
4.3
Mullets
0.7
4.0
2.2
7.5
15.0
11.2
Pacific mullet/haarder
0.4
1.3
0.1 185.3 228.1 573.4
European flounder
0.2
2.7
Boyer's sand smelt
3.8
7.3
5.7
14.0
17.9
26.0
Goibies
2.0
2.2
1.1
4.4
11.9
13.2
Mediterranean mussel
250.0 37.0
10.0 4.0 85.0 60.0 25.0 127.0 109.0
Baltic prawn
0.1
2.0
0.7
0.1
0.0
TOTAL
for
marine
species
250.0 37.0 0.0 10.0 10.9 99.9 76.6 216.1 400.2 735.6
Table 4.12
Japanese snail, Rapana venosa, Mediterranean mussel, Mytilus
galloprovincialis and clams, Tapes decussatus and Chamelea gallina,
production (landings) from the Turkish Black Sea coast (tonnes)
Year Japanese Mediterranean
Clams
snail
Mussels
1989 10032
2637
1990 6094
2544
1991 3730
26
1145
1992 3439
5678
15061
1993 3668
5914
16989
1994 2599
6038
32412
1995 1198
5741
11540
1996 2447
1400
7647
1997 2020
2952
6094
1998 3997
2435
3550
1999 3588
1584
2400
2000 2140
178
10000
2001 2614
17
7497
2002 6241
2500
9996
2003 5500
4050
19692
2004 14834
2867
16892
2005 12163
2908
10819
4.3.3 Linkages
with
other transboundary problems
The decline of commercial fish stocks is closely linked with other transboundary problems.
It impacts and is impacted by the other transboundary problems and in some cases the
77
linkages are in both directions. From the paragraphs below, it is clear that nutrient
enrichment/eutrophication (Section 4.2) and chemical pollution (Section 4.4) are immediate
causes of changes in commercial marine living resources, as is habitat change (Section 4.5).
In addition marine living resources are a component of biodiversity (Section 4.5)
4.3.3.1 Nutrient
enrichment/eutrophication
Commercial fisheries decline is related to nutrient over enrichment and eutrophication
through the loss of habitat to benthic-feeding fish and macroalgal/higher plant-dominated
habitats which form spawning/nursery areas for young fish. Clearly this has a negative
impact on total fishery production and brings with it a huge change in the ecological balance,
raising major biodiversity issues, as does the by-catch of marine mammals (cetaceans).
Increased nutrient levels tend to result in increased phytoplankton productivity.
Phytoplankton are a direct food source for very few fish species (silver carp being a notable
exception), but increased phytoplankton productivity results in increased numbers and
biomass of the zooplankton, which feed on them. Zooplankton are a major food source for
many young fish and older sprat/anchovy, ultimately resulting in the increased
photosynthetic energy being carried up the food chain and distributed throughout the whole
fish community. Thus, eutrophication results in increased production of both plant and
animal matter.
4.3.3.2 Habitats
The inability of the ecosystem as a whole to effectively "process" the additional organic
matter produced by eutrophication results in a huge increase in organic-feeding micro-
organisms (bacteria, fungi, heterotrophic phytoplankton), which strip oxygen out the water
column faster than it can be replaced by diffusion from the air. The result is oxygen-deficient
lower waters, incapable of supporting many, if not all economically important marine living
resources. Many mobile organisms, such as fish, may move away from such hypoxic areas as
they develop but sedentary organisms, such as shellfish, die.
However, decreasing trophic status throughout the 1990s has resulted in huge improvements
in the dissolved oxygen content of bottom waters overlying the NW shelf. These
improvements have greatly expanded the feeding areas of bottom-dwelling fish, such as
turbot, flounder, whiting and spiny dogfish, as well as increasing the nursery areas available
for them. The status of sediment habitats is, however, also critical to the wider fish
population, since well-oxygenated bottom waters provide the spawning/nursery areas for
some pelagic fish. Without these habitats either adult fish will either not be able to
reproduce, or young fish will not become mature to repeat the breeding cycle.
4.3.3.3 Biodiversity
The fish population itself (including its many sub-communities: pelagic, benthic, migratory,
anadromous, semi-anadromous etc., depending upon which classification systems are used)
makes a very important contribution to biodiversity. This is due to the presence and
abundance of different fish species themselves, as well as their impacts on other biota. The
overall health of the fish community is also dependent on the presence/abundance of other
organisms in the water column, the classic Black Sea example being Mnemiopsis.
4.3.3.4 Chemical
pollution
Pollutants at both ends of the chemical spectrum can affect MLR. At one end, there are those
chemicals (nutrients) which cause damage by over-stimulating plant growth, and at the other
78
end are the toxic substances (heavy metals, pesticides, etc.) that cause damage by poisoning
biota. In addition, endocrine disruptors (e.g. tributyltin, nonylphenol) can affect the
reproductive ability of MLR.
MLR can accumulate some pollutants to levels orders of magnitude above those found in the
marine environment. This increases stresses on fish stocks and can lead to their decline (See
section 4.4.2), as well as damaging the health of organisms higher up the food chain which
feed on them (including humans).
4.3.4 Immediate
causes
The immediate causes of the decline in fish stocks are primarily the result of the three
priority transboundary issues discussed in this document (Section 4.3.4.1-4.3.4.3, Fig. 4.9):
However, alien species introduction (Section 4.3.4.4) and historical over-harvesting of MLR
(4.3.4.5) are also major immediate causes (Fig. 4.9).
4.3.4.1
Nutrient over-enrichment/eutrophication
Nutrient over-enrichment/eutrophication is covered in further detail in Section 4.2. However,
in relation to MLR, the following immediate causes have all been identified as contributing
to this problem.
Ę Point and diffuse sources of effluent from livestock farms
Ę Diffuse pollution from fertilizers
Ę Ground/soil water discharges (containing elevated levels of fertilizers) to surface
waters
Ę Discharge of untreated industrial effluents
Ę Atmospheric emission/deposition of pollutants (principally nitrogen) deposited
onto land/ directly into the sea.
All of the above are immediate causes of nutrient-enrichment. This leads to increased
primary productivity (increased growth of plants, including phytoplankton), and thus
increased food availability to promote growth of all commercially important marine living
resources. Thus nutrient-enrichment can be viewed in a positive light with regard to marine
living resources, but the resulting changes in trophic status result in some native species
being favoured over others and the ensuing ecological imbalance allows opportunistic non-
native species to become established and in extreme cases to dominate whole trophic levels.
These changes also result in a reduced area of seabed occupied by key macroalgal (seaweed)
species Ł taxa which provide critical nursery areas for many fish species. For example, the
Phyllophora field on the NW Shelf sustains more than 40 fish species. In the last 30 years,
its area has decreased more than 20 times (see Sections 3.3.3, 4.2.1 and 4.2.3 for more
details).
79
Root causes
Underlying causes
Direct Causes
Socio-economic drivers
Resource uses
-Point and diffuse sources of effluent
from livestock farms
-Diffuse pollution from fertilizers and
-Lack/ poor enforcement of environmental
-Lack of manure/fertilizer storage facilities
pesticides
protection regulations in agriculture
-Unsustainable/inefficient agricultural and/or
Historical legacy of poor
-Ground/soil water discharges
-Diminished government control of privatized
animal farming practices
land use/water/nature
(containing elevated levels of fertilizers
farms
-Intensive livestock production
protection management
and pesticides) to surface waters
-Lack/poor planning of agricultural use
-Historical legacy from over application of
-Fertilizers and pesticides accumulated
-Low awareness of negative environmental
fertilizers and pesticides
in sediments (historical pollution)
effects
-Un-/partially treated effluent discharges
ĘLow standard of living
from livestock/farms
(poverty, unemployment,
-Lack/ poor enforcement of environmental
ŁDischarge of untreated industrial
low incomes)
protection regulations in industry (including
-Untreated industrial effluents and/or poorly
effluents
energy and extraction of raw materials)
maintained industrial treatment plants
ŁAtmospheric emission/deposition of
ĘPolitical changes and/or
-Poor or no enforcement of trade waste
-Absence of / or outdated treatment
pollutants and nitrogen deposited onto
instability
discharge regulations
technology
land/ directly into the sea
-Weak sectoral industrial policy and related
-Anachronistic industrial technologies and
ŁOil spills
legislations
practices (including energy and extraction of
ŁRemoval of substratum (due to sand
-No incentive for pollution prevention and
ĘIncreased population in
raw materials)
extraction)
coastal areas
control
- Lack/ poor enforcement of environmental
-Absence of or outdated storage and waste
ĘLow standard of
ŁOil spills
protection regulations in shipping and harbors
treatment technology/facilities
Łdumping/discharge of wastes
- No incentive for poll. prevention/ control
-Illegal shipping/harbor operations
environmental education
ŁDischarge of untreated ballast waters
and awareness
-No effective monitoring and intervention plan
ŁExotic species introduction, notably
for pollution from ships
ŁLack of Black Sea fisheries international
-Ageing fleet
Mnemiopsis leidyi
agreements/ regulations
ĘPoor implementation of
-Poor maintenance of vessels
ŁLack/poor enforcement of national fisheries
sectoral management
management and control plans
planning
ŁOverfishing
ŁNo effective control of fishing practices
-Destructive fishing practices
ŁMechanical disturbance of substratum
-Illegal fishing practices Ł poaching
due to bottom trawling/dredging
ĘTraditional food habits,
-Lack of a common and effective monitoring
-Uncontrolled development in coastal areas
ŁDamage to nursery/spawning areas
combined with expanding
system of fishing activities around the Black
-Low level of user fees (tariffs) and incentives
number of consumers
Sea
for water use and treatment
-Poor management and/or poor capital
-Inappropriate disposal of dredging spoil
-Point and diffuse sources of raw and
investment and operational funding for waste
partially treated anthropogenic effluents
ĘInternational demand/
water collecting/treatment system
-Infiltrations from landfills
-Anachronistic and/or insufficient
- additional seasonal nutrient loads to
globalization
- Unsustainable tourism practices
number/capacity of wastewater treatment
sewage treatment works from tourism
- Lack/poor enforcement of environmental
plants
-Municipal waste disposal accidentally
protection regulations in tourism
- Poor management/ planning /use of landfills
reaching the sea
Significant external drivers
and wastewater treatment plants
-Inappropriate solid waste disposal
-Lack of operation and maintenance control
- Maintenance of shipping channels in shallow
for wastewater treatment plants and landfills
ĘSpecific conditions of the
waters
-Lack of operation and maintenance control in
Black Sea (anoxic,
collection of solid waste
- Blocked access to higher river reaches
sulphide-laden lower
resulting in destruction/modification of
- "Hard" civil engineering approach to river
waters)
flood control and hydroelectricity
river habitats for anadromous/
-River regulation (damming of rivers)
catadromous fish
-Land drainage (loss of floodplains)
- Lack/ mismanagement of public funds
ĘBiological drivers
dedicated to improve the quality of the
(historically affected
environment
trophic chain)
ŁDecline in resilience of native/ natural
ecosystems
Figure 4.9
Causal chain analysis for decline in commercial fish species / stocks
80
4.3.4.2 Chemical
pollution
Chemical pollution is covered in further detail in Section 4.4. Chemical pollution acts
through a host of biochemical pathways, with many pollutants being accumulated up through
the food chain to levels which are orders of magnitude higher than those found in the marine
environment itself (Section 4.3.3.). When accumulated to such levels they depress the growth
rate and health of marine biota (especially fauna), can alter the ability of some species to
reproduce, and at high concentrations can ultimately result in localised extinctions of some
species or more general localised mass mortalities in the event of toxic spills/illegal
dumping. The recognised sources of these chemicals are:
Ę Diffuse pollution from pesticides
Ę Ground/soil water discharges (containing elevated levels of pesticides) to surface
waters
Ę Discharge of untreated industrial effluents
Ę Oil spills
Ę Dumping/discharge of wastes
4.3.4.3 Habitat
changes
Habitat change/loss is covered in further detail in Section 4.5. However, in relation to MLR,
the following have all been identified as contributing to this problem:
Ę Sand extraction and habitat destruction as a consequence of land erosion
Ę Coastal wall and port construction
Ę nappropriate disposal of dredging spoil
Ę Damming of rivers (starving shelf areas of fresh sediment and thereby contributing
to erosion of adjacent coastal areas)
Ę Unsustainable MLR harvesting methodologies (e.g. dredge trawling).
4.3.4.4
Alien species introduction
The discharge of untreated ballast waters, and along with it, the introduction of alien species,
about one quarter of which are regarded as either moderately or highly invasive has
historically caused tremendous changes to commercial MLR. Mnemiopsis (Section 3.3.2.3)
is considered to have been introduced to the Black Sea via this route. However, this vector of
introduction is not all bad news, since international shipping is also considered to have been
the introductory vector for both Beroe ovata (Section 3.3.2.3) and Rapana (Section 4.3.2).
See also Annex 6.
4.3.4.5 Fishing
activity
The problem of perceived over-fishing deserves special attention, since this has been a
particularly important cause of major changes in commercial MLR in the past. The total
catch is once again showing an increasing trend, but this still only about half of the level
caught in the 1980s. However, selective fishing for rare and high value species, such as
dogfish, turbot, etc. is undoubtedly damaging/preventing the recovery of these species, as are
by-catches of these species when other species are targeted.
Under-reporting of actual catches is also likely to be problem, due to high taxes (in Turkey at
least) and the fact that fish markets are unevenly distributed along the coast. This casts doubt
on the data presented (e.g. in Figs 4.5 and 4.7). Since fisheries data collection systems
81
(again, in Turkey at least) are not effective and cannot provide the information for robust
fisheries management.
Fishing fleet over-capacity is a continuing problem in the Black. The trend shown in Fig.
3.21 is therefore a problem, since if fishing vessel operators can only make a meagre income,
the tendancy will be for them to spend longer and longer at sea, resulting in unsustainably
higher catches. This could help explain the increasing trend in total cath statistics shown in
the same figure.
Stock assessments have been undertaken by most countries for some fish species and are
used by some as the basis of their allowable catches, but not for all fish species, not
necessarily for the same fish species and many of such assessments are now out of date.
The real problem with determining the extent of over-fishing, however, is the lack of
evidence. A number of methods (indicators) are available, of which catch per unit effort and
stock assessments are the most widely recognised. Fishing effort needs to be estimated
differently for active (trawling) and passive fishing (those where stationary nets are deployed
and fish are trapped within them) techniques.
Clearly more and larger trawlers/nets will catch more fish if they are operated or deployed
for the same length of time, and this fails to account for potential differences in net mesh
size. Thus, a wide range of different "unit effort" estimates can be made (e.g. Fig. 4.10), with
little comparability between the values produced by different countries, and often between
the shape of CPUE time-series plots using different unit effort criteria. A casual glance at
Romanian passive fishing CPUE statistics (Fig. 4.10) provides a very obvious example of
this, with the number of nets deployed varying between 29 and 123 on an annual basis. A
large decrease in average net deployment time around the turn of the century resulted in a
huge increase in CPUE based on net deployment days, but over the same period, there was
almost no change in the average fish catch per net. It is not clear whether net size/mesh size
changed over this period.
450
Active fishing
8
l
)
Passive fishing
)
a
w
45
0.8
e
d
l
)
Tonnes/vessel
e
Tonnes/day fishing
6
e
/
tr
t
/
y
e
a
r
)
oy
Tonne/trap net/
s
n
pl
s
Tonnes/trawl
n
year
e 300
/
v
to
30
Tonne/trap net
t
de
day deployed
4
a
y
/
t
r
a
p ne
0.4
t
onne
e
/d
n
nne
150
n
t
o
/
t
r
a
p ne
h (
15
2
t
o
(
t
c
a
(
h
t
c
h
t
onne
C
(
a
tc
Ca
h
0
0
C
0
198
199
199
199
199
199
200
200
1989
1991
1993
1995
1997
1999
2001
2003
0
a
tc
C
9
1
3
5
7
9
1
3
Figure 4.10 CPUE statistics (total fish catch) for Romanian coastal waters, 1989-2004
For the Black Sea as a whole, the only measure of "unit effort" available is the total number
of fishing vessels >12 m in length. However, more than 7,000 Turkish fishing vessels
operate in the Black Sea, of which 85 % are under 10 m overall length. Values taken from
Fig.(3.21), indicate an increasing trend in CPUE between 1991 and 2005, suggesting a
recovering fishery, but this is largely due to an increase in CPUE during the early 1990s
82
when landings were very much lower than in the 1980s. When only data since 1996 are
considered, there has been almost no change (Fig. 4.11).
l
e 500
s
s
e
)
/
v
e
(
t
onn
250
h
t
c
a
l
c
a
nnu
l
a
0
1991
1993
1995
1997
1999
2001
2003
2005
t
a
o
T
Figure 4.11 CPUE statistics (total annual fish catch/vessel >12 m length) for the
whole Black Sea, 1991-2005
The reality is that despite the catastrophic decline in fish landings during the late 1980s/early
1990s, in large part due to over-fishing, no better understanding of what constitutes
"sustainable" catches (total or for individual species) exists. However, for the now rare
species discussed in Section 4.3.1, any targeted fishing should be classed as over-fishing.
4.3.4.6
River regulation and land management
Anadromous/catadromous, fish (e.g. eels and trout) face further problems, since parts of their
lives are spent in freshwater habitats. Drainage of freshwater wetlands, damming of rivers
and freshwater quality therefore affect where some species are able to spawn, survival of
eggs and young fish, and whether fish are able to travel between the different freshwater and
marine habitats required for the different stages of their reproductive/lifecycles.
4.3.5 Underlying
causes
A number of the identified underlying causes associated with changing marine living
resources are concerned with eutrophication. These are discussed in detail in Sections 4.2.4
and 4.2.5, including poor operational guidance and management of both point and diffuse
sources of nutrients. This includes a failure to use appropriate technologies for the
treatment/disposal of waste from point sources (municipal and industrial) and a failure to
effectively manage nutrient inputs to agriculture, with an emphasis on poor recycling of
nutrients between the two main agricultural sub-sectors Ł livestock and arable farming. The
expansion of coastal populations, and particularly of seasonal resorts needs particular
emphasis, since sewage treatment works and sewerage systems originally planned to serve
resident (winter) populations, may end up having to serve the waste generated by three or
more times the resident population during the peak summer season.
Illegal shipping/harbour operations, particularly in relation to ballast water treatment
(invasive species introduction) and bilge water operations (illegal discharges of oil and other
pollutants are also significant underlying causes. At present there is no effective monitoring
and intervention plan for pollution from ships, and despite ballast water being highlighted in
the 1996 TDA as an important vector of alien species introduction to the Black Sea, little has
been done on ballast water treatment. None of the Black Sea States are party to the 2004
83
International Convention for the Control and Management of Ships' Ballast Water and
Sediments (the BWM Convention).
Unsustainable fishing practices are also identified as an underlying cause. Such practices
include a failure to link fish stocks to fishing fleeting landings, resulting in the over-fishing
of the 1980s, and the direct destruction of seabed communities and habitats through the use
of bottom trawling/dredging gear. The fine particles re-suspended by such practices can be
transported by currents over large distances, reducing water transparency and ultimately
"smothering" benthic organisms. The same effects have resulted from the inappropriate use
of techniques for sand/gravel extraction and disposal of dredging spoil, which have
contributed to the disturbance/destruction of benthic communities long distances from
where the actual extraction took place or the spoil was deposited.
By-catches of non-target species are a continuing problem in the Black Sea, since the
majority of fish caught are of such small size fishes (e.g., anchovy and sprat). Fishing gear
targeting these species is therefore unselective, despite the apparent emphasis on minimum
sizes of fish which are supposed to be caught (Annex 8). For example, pelagic trawl nets for
sprat have a mesh size of 14-15 mm. Pound nets for anchovy and horse mackerel have the
same mesh size. The catches of such fishing gear contain an important percentage of
juveniles of larger size species, such as sturgeons, bonito, bluefish, spiny dogfish and turbot.
Throwing live juveniles back into the water is not a common practice in the Black Sea.
There is limited data for by-catch rates in the Black Sea. Whiting, spiny dogfish, Azov
anchovy and turbot may be harvested as by-catches during trawling for sprat. In contrast, the
sprat catch may reach up to 60% of the Turkish total catch in February, even though anchovy
is the main target. Different fishing methods may all result in relatively high by-catch rates
depending upon the season. Of course, it is not only non-target species of fish which are
caught in fishing nets; dolphins and porpoises are also caught in the gill nets used for turbot
fishing. The main victims of these are harbour porpoises (more then 70% of stranding
records), followed by young common and bottelnose dolphins.
Illegal fishing practices (poaching) focus mainly on high value species (sturgeons, turbot,
spiny dogfish, etc), thereby increasing pressures on them. These practices tend to have a
relatively low effect on total landings statistics, but their impact is magnified on already rare
or endangered species. A secondary effect is that fishing gear from poaching activities tends
to be abandoned as poachers "cut and run" to escape capture and vessel confiscation. This
abandoned gear can continue to trap fish, mammals and birds. For example, during April
2002, a clamp-down by Romanian authorities on illegal fishing activities, resulted in the
retrieval of some 40 km of gill nets, which were estimated to have trapped about 100
porpoises and dolphins.
During the last 50 Ł 60 years, the majority of rivers draining into the Black Sea have been
changed, with an irreversible impact on the spawning habitats and behaviour of
anadromous/catadromous fish. The building of dams and weirs has greatly reduced the
breeding areas for fish such as sturgeons, concentrating them at the base of dams and
increasing their vulnerability to poaching. Likewise, draining of riparian meadows has led to
changes in river flows, currents and losses/blockage of freshwater spawning gravels (by in-
filling with finer substrates), with consequent changes in fish behaviour. The latter leads to
more rapid changes in flow following rainfall, which are countered to some extent by
84
entrapment of rivers behind dams, but the overall effect is of greater river flow, albeit with
reduced seasonality in these flows.
Important changes have also occurred in some countries at the interface between freshwaters
and coastal waters provided by lagoons and limans. These are important feeding and
breeding habitats for both local or migratory species. The results has been a transformation
of these the lagoons/limans into freshwater reservoirs for irrigation or aquacultural reasons;
once again, preventing the passage of migratory fish through them and therefore providing a
physical blockage, separating the inflowing rivers from the Sea itself.
The construction of harbours/marinas has two important consequences: (i) smothering of
adjacent (and further away) communities/habitats with fine sediments (see comments above
regarding unsustainable fishing practices and dredging operations); and (ii) localised changes
in the current regime of the area, with consequent changes in fish behaviour. The latter, in
particular, is believed to have reduced the catch from fixed fishing gear (gill nets, etc) where
such developments have taken place.
4.3.6 Knowledge
gaps
Ę Regional fish stock data is missing entirely, due to a Regional assessment
methodology, and the data gathering to support this, not yet having been agreed
upon.
Ę Fisheries statistics (landings, fishing fleet statistics, etc) and monitoring activities
are fragmented and irregular at national levels. At a regional level the type and
quality of data make inter-country comparisons farcical.
Ę There is no common regional view on criteria and methodologies for evaluation of
marine habitats of importance for marine living resources or for the establishment
of transboundary fishing-free zones.
Ę National reporting on fisheries statistics to the Black Sea Commission Permanent
Secretariat is very incomplete
Ę No quantitative or semi-quantitative estimates are known to have been made of the
contribution of illegal fishing activities to actual, rather than reported, landings.
4.3.7 Summary
and
preliminary recommendations
Ę There is a contradiction between the, increase of fishing effort, lack of information
about fish stocks and the purported increase in knowledge about management of
fisheries in the Black Sea region.
Ę Marine living resources, although renewable, are not infinite and their exploitation
needs to be properly managed.
Ę The majority of fish species with commercial value are shared or migratory
species.
Ę Mortalities of demersal species due to eutrophication-linked hypoxic events still
occur in the North West Black Sea, albeit that such events are less intense and
cover much smaller areas than they previously did.
Ę The restructuring of fishing fleets as response to changing of fish stocks state, is
very slow with very limited aid from governments.
Ę Fisheries management is applied individually by each coastal country. n the case
of shared and migratory species, no regionally agreed system exists to match
fishing effort to stocks (prohibition periods, minimum admissible fish length, etc).
85
Ę Fisheries statistics, fish stock assessment and monitoring activities are fragmented
and irregular at national level; some data and methodologies used at national level
are not compatible for regional purposes.
Ę National fishing zones are not yet established between all coastal Black Sea
countries.
Ę The use of non-sustainable fishing technologies (notably dragging and bottom
trawling) contributes directly to the deterioration of seabed biocenoses.
Ę The extensive use of non-selective fishing gear (small mesh size trawls and pound
nets) increases by-catches of threatened species, such as sturgeon, bluefish and
turbot.
Ę An important threat to marine mammals in the Black Sea (notably the harbour
porpoise) is by the extensive use of gill nets for catching turbot.
Ę Ilegal fishing practicies increase the effect of inadequate fisheries management,
because they are focused on high value species, increasing existing pressure.
Ę Some alien species (notably Mnemiopsis leidyi) act at the food chain level and can
cause a dramatic effect on the marine living resources.
Ę Black Sea mariculture is currently poor developed but of increasing in importance.
Ę Spawning/nursery habitats for anadromous species have been drastically reduced
by the damming of rivers, land drainage, sand extraction and maintenance of
shipping channels.
Ę Many lagoon and liman habitats have been physically separated from the Sea. The
quality of sediments in lagoon/liman habitats has worsened as a result of
eutrophication or toxic pollution from land based sources.
Ę Shelf habitats are damaged by siltation from the building of ports/harbours and
coastal defence works, dragging and bottom trawling. Dumping of polluted
sediments dredged from ports and microbiological pollution of shallow waters is
also likely to impact coastal fisheries.
86
Box 4.2
Comparative analysis of the 1996 and 2006 TDAs on the transboundary problem of changes in commercial marine living resources
A comparison between the 1996 and 2007 TDA with regard to marine living resources is presented in the table below. In the 1996 TDA, this was considered as
an independent problem in its own right, but the issue was divided between different sections of the document. Nevertheless, a good assessment of the problem
was originally made and proposals presented to reverse the situation.
Issue
1996 situation
2006/7 situation
Stocks
Ę
Concerns over depleted or falling stocks of venus clam, Rapana
Ę
Recovery of anchovy and sprat populations appear to have continued. However, a
grey/golden mullets, sturgeons, turbot and spiny dogfish.
possible downturn in anchovy catch during 2007 raises some doubts
Ę
Haarder population expanding since its introduction in the 1970s
Ę
Assumed recovery of bonito reflected in huge increase in landings during 2005.
Ę
Mya clam unexploited, but could be in future.
Ę
Concerns remain over turbot, whiting, spiny dogfish, horse mackerel (albeit with
Ę
Shad populations considered to be recovering.
encouraging signs in some coastal areas), clams, and mullets (native grey/golden
Ę
Anchovy and horse mackerel populations believed to have partially
mullet appear to be faring less well than haarder/Pacific mullet).
recovered from over-fishing/Mnemiopsis invasion, but concerns over
Ę
Concerns remain over mussel and venus clam stocks. Mya clams still unexploited.
spawning areas and population age dynamics/fecundity
Ę
Catches (and export from the region) of Japanese Sea Snail have increased
Ę
Whiting and sprat numbers believed to have remained high,
dramatically. Concerns over damaging harvesting practices (dredging).
particularly in NW Black Sea.
Ę
Stock assessments are not undertaken by all countries and tend to be undertaken
Ę
Not clear whether stock status was implied from catch data or
for only a small number of species. Methodologies employed vary from country to
whether assessments were routinely carried out. No mention of
country.
different stock assessment methologies being used by individual
countries.
Catches
Ę
Total catches known, but no breakdown into species of commercial
Ę
Total catches known and broken down into species of commercial importance.
importance provided.
Ę
Catch per unit effort (CPUE) statistics included to support total catch data, since no
Ę
No CPUE statistics included.
regionally agreed stock assessment methodologies have been decided upon.
Ę
It is worrying that that such a large percentage (approx. 70-80%) of the total catch is
made up by a single species (anchovy) and that typically over 90% of this catch is
made by a single country (Turkey). This does not bode well for the future if anchovy
catches suddenly diminish, as experience from other parts of the world suggests
they may.
Socio-economic factors
Ę
Some statistics included, but no real idea of the importance of
Ę
Importance of marine living resources as a source of regional employment provided.
marine living resources as a source of regional employment.
Fishing fleet status
Ę
Statistics provided on total fishing fleet (vessels >1 ton).
Ę
Total fishing fleet (vessels >12 m long) has increased.
Fishery regulation/
Ę
Fisheries management is applied individually by each coastal
Ę
Still poorly regulated at an international level, with no regional legally binding
management
country. n the case of shared and migratory species, no regionally
document in place. However, negotiations have started over the production of such a
agreed system exists to adjust fishing effort to stocks (prohibition
document
periods, minimum admissible fish length, etc)
Aquaculture
Ę Poorly
developed.
Ę
Still poorly developed, but of increasing importance.
Causal chain analysis
Ę
The causal chain was clearly understood, but not considered as as
Ę
Causal chain analysis undertaken. Major auses include: poor management and
a subject in its own right. Nevertheless, the root causes were
enforcement of existing (inadequate) legislation; existing and historical sources of
(inappropriately identified) as: poor legal framework; inadequate
pollution (encompassing eutrophication); habitat destruction; alien species; coastal
implementation of regulatory instruments; inadequate planning;
development; unsustainable fishing practices; inappropriate river (and lake/liman)
insufficient public involvement; and inadequate financial
regulation, and low levels of environmental awareness.
mechanisms and support.
87
4.4
Chemical pollution, including oil
This section focuses on loads and sources of pollution, links with other transboundary
problems and the causal factors underlying toxic pollutant loads. An overview of Black Sea
toxic contaminant status is presented in Section 3.4, but no impact of contaminants on the
health of Black Sea ecosystems or species can be made, since no bioaccumulation (body
burden) data are available.
4.4.1
The problem
As with nutrients, the main reason for considering chemical pollutants as a transboundary
problem are that once in the marine environment, these pollutants can be carried into
adjacent national and international marine waters., In the case of ship-sourced pollutants
(accidental or deliberate discharges), pollution events may (and do!) occur in international
waters anyway. Their impacts occur not only in the immediate areas of where they originate,
but throughout the Black Sea as a whole.
This section (4.4), unlike Section 4.2, is concerned with pollution by hazardous substances
(toxicants, endocrine disruptors, etc.) and non-hazardous biodegradable organic discharges.
Toxic pollutants can be considered to represent the opposite end of the chemical spectrum to
nutrients, since rather than stimulating overall biological productivity, they inhibit growth,
reproduction and contribute to reduced life-spans of biota. Concentrations of most toxicants
are typically greater in sediments than in water (they adsorb directly onto the surface of
particulate matter or are fat soluble and therefore concentrate in the fat component of
sediments and living cells. The polysaccharide exudates of algae (phytoplankton and
seaweeds) can also accumulate high levels of heavy metals. Upon death or release from the
algae, organic material becomes incorporated into sediment and begins to break down. Once
concentrated in algae and in sediments, filter feeders further concentrate these substances as
they are digested, so increasingly higher levels of toxicants are passed up the food chain via
the animals that feed on them.
Because of the problems and expense of assessing chemical pollutant loads, together with
widely varying degradation rates once in the marine environment, the emphasis of assessing
chemical pollution impact is more closely related to environmental status monitoring than it
is to load monitoring (e.g. see Section 4.4.4.1). Impact assessment of chemical pollution can
be assessed in two main ways: (i) concentration data (as shown in Section 3.4), using
comparisons with agreed environmental quality standards; and (ii) biological/ecological
effects. This latter group can include specialized laboratory bioassays, the use of species-
specific biological effects/indicators (e.g. see Section 4.4.2) and the use of community-based
biological indices, notably of benthic invertebrate communities. The latter represent the most
widely used and accepted indicators of environmental status.
Even if robust methodologies are used, the direct monitoring of pollutant concentrations in
sediments, water or biota, may provide misleading results because not all chemical pollutants
can realistically be monitored there may be the potential additive or synergistic effects of
different pollutants. Thus, ecological monitoring is also required to assess chemical and
habitat status, since the results (particularly of biological indices) provides an assessment of
combined toxicity.
88
4.4.2
Environmental impacts and socio-economic consequences
As discussed above (Section 4.4.1), land-based sources of biodegradable organic matter
contribute to organic enrichment of coastal waters and sediments, in particular those under
influence from waters entering the Sea from the Danube and Dniester. Additional (dissolved)
organic enrichment promotes the growth and dominance of heterotrophic (non-
photosynthetic) phytoplankton, particularly Noctiluca, which during blooms can constitute in
excess of 90% of phytoplankton biomass.51. Particulate organic enrichment provides an
additional food source for filter feeders (notably bivalve shellfish, such as mussels), so high
levels of abundance/biomass could be expected in affected waters. However, the bacterial
decomposition of this matter may result in reduced dissolved oxygen levels; and if this
occurs, rather than an increase in zoobenthic biomass, mass mortality may result.
Furthermore, not only zoobenthos are affected; fish in overlying waters that are not able to
escape will also be killed. In the case of spawning/nursery areas, it is possible that entire
year-classes of some fish could be severely impacted.
In animals, as in humans, hormones have many communications jobs, affecting mood and
memory, reproduction and development, in fact virtually any biological process you can
name. The term endocrine disruptors refers to synthetic chemicals that when absorbed into
the body either mimic or block natural hormones, theerby disrupting the body's normal
functions. Such chemicals can, therefore, be dangerous, even if they don't cause cancer. The
list of endocrine disruptors is long, encompassing insecticides, herbicides, fumigants and
fungicides, some detergents, resins, plasticizers, PCBs and dioxins. Many endocrine
disruptors are persistent in the environment and accumulate in lipids/fats
Endocrine disruptors have been implicated as causative agents in diminished reproduction of
some fish species, thereby contributing to low stocks of fish, such as sturgeon, in the Black
Sea and rivers feeding it. However, proof of this is hard to find for the Black Sea region,
even though incredibly low concentrations of some compounds have been found to have
major effects in laboratory studies. Thus, the Black Sea situation with regard to endocrine
disruptors is unclear, since monitoring of their concentrations is either not undertaken,
further refinement of existing methodologies/adoption of new standardized methodologies is
required, or indicators are not used. Perhaps the most famous example of indicators of
endocrine disruptors is the measurement of imposex in gastropod populations52.as an
indicator of organo-tin concentrations, but there is no coordinated monitoring programme,
unlike in other seas. For example, an EcoQO on imposex in dogwhelks or other selected
gastropods requires routine monitoring to be undertaken in the NE Atlantic.
The production, sale and usage of persistent organochlorine pesticides (e.g. DDT, HCHs) or
herbicides (e.g. aldrin, endrin, dieldrin) has been prohibited in the Black Sea catchment for
many years. For example, in Romania the application of DDT was originally banned in 1972
and "drins" (aldrin, dieldrin, etc.) from 1995. However, such substances have a long half-life
(over 30 years), so the effect on the marine environment is very much a long-term issue.
Perhaps more worrying, though, are results suggesting that fresh DDT has recently been
51 Because of its large size, Noctiluca abundance and biomass are usually measured as part of the zooplankton
community.
52 Some female gastropods, including Rapana venosa, develop male reproductive organs (a phenomenon
known as imposex), in response to organo-tin exposures (TBT and its breakdown product DBT), which results
in some or all of the population becoming sterile.
89
dumped directly into the sea53, dumped into rivers flowing into the sea or is still running off
land to which it has been applied. The evidence for this comes from the high concentrations
found in surface sediment and the high ratios of DDT to its breakdown products.
Organochlorine pesticide contamination is thought to be a contributing factor to the reduced
status and biodiversity of macrozoobenthos communities in northerly areas of the NW shelf,
compared to more southerly sites (Todorova and Konsulova, 2006).
Nevertheless, the main environmental impacts of chemical pollution can be summarized as
follows:
Ę
Increased frequency/severity of hypoxic events.
Ę
Sand/beaches contamination by polluted waters including accumulation of heavy
metals and POPs (persistent organic pollutants) in sediment and biota.
Ę
Degradation of aquatic ecosystems/habitat loss.
Ę
Reduced fish stocks.
Ę
Pollution of ecosystems, particularly coastal wetlands.
The main socio-economic consequences of the Black Sea contamination are:
Ę
Reduced seafood yields, due to slower rates of growth/premature death and reduced
fertility of biota.
Ę
Decreased quality of seafood caught in the Black Sea, due to bioaccumulation of
toxic substances.
Ę
Reduced attraction of the Black Sea and its coastal communities for recreation and
tourism.
Ę
Increased risks to human health.
4.4.3 Linkages
with
other transboundary problems
Black Sea chemical pollution is closely linked to the other three identified transboundary
problems: nutrient over-enrichment/eutrophication (Section 4.2), Decline in commercial fish
species/stocks (Section 4.3) and habitat and biodiversity changes (Section 4.4)
Nutrients loads from rivers discharging in the Black Sea significantly increase the risk to
eutrophication, considered to be an underlying cause of historical hypoxic events. However,
organic over-enrichment, as measured by, TOC (total organic carbon) in sediments and
BOD5 in water is the most important immediate driver of hypoxia. The issue, here, is
whether the organic carbon is derived principally from the growth and senescence of plant
life (notably phytoplankton within the Sea, in which case the organic loads are generated
within the Sea itself, or whether they are due to organic loads exported from land via rivers
and municipal/industrial discharges. Calculations suggest for the Sea as a whole, organic
loads generated by phytoplankton within the Sea far outweigh land-derived sources organic
sources, but near to the coast, loadings from land can be greater than marine-derived loads.
Other pollutants such metals, pesticides and herbicides, contribute to the deterioration of sea
water quality, including their accumulation in sediments and biota, with long-term effects in
the marine ecosystem. Different species and different indifferent individuals within a single
species can display varying levels of susceptibity to pollutants. This means that as pollutant
53 A sediment sample from one site in the NW Shelf was so heavily polluted with DDT that in 2003 the
laboratory in which the sample was analysed had to be closed down for a full week for decontamination!
90
concentrations increase, and those pollutants are accumulated to different levels up the food
chain, communities change from being species-rich to those with very low levels of
biodiversity. A similar pattern emerges with nutrient/organic enrichment Ł from highly
diverse co-dominating benthic/pelagic communities (in shelf waters at least) to pelagic
communities dominated by monospecefic algal blooms and widesread destruction/loss of
benthic ecosystems.
It should also be noted that the increase of oil transportation accross the Sea and through the
Bosphorus Strait will have proportionally increased the flow of ballast water into the Sea,
thereby increasing the threat of novel exotic species introduction, and probably additional
oil/chemical pollution. Likewise, an increase in shipped oil freight would bring with it an
increase in NOx emissions from ships, and thus an increase in atmospheric deposition rates
of nitrogen, particularly along major shipping routes.
4.4.4 Immediate
causes
The results of a causal chain analysis for Black Sea chemical pollution is presented in Fig.
4.12. The major immediate causes of this transboundary problem are briefly discussed below
(Sections 4.4.4.1-4.4.4.10). As for nutrients, the immediate causes of chemical pollution are
divided into individual sources and pathways of entry into the Sea.
When discussing chemical pollutant status (Section 3.4) an important consideration is the
grain size distribution of bottom sediments, since finer grained sediments tend to accumulate
higher levels pollutants, especially heavy metals). Sediment grain size distribution is also an
important consideration when interpreting zoobenthos data.
4.4.4.1
River loads
Taking account of river discharges, the largest contributions would be expected from the
Danube (67% of the total river flow input), Dnipro (13% of river flow input), Corakhi (4%
of river flow input), Rioni (4% of river flow input), Dneister (2% of river flow input), Coruh
(2% of river flow input), Yeilirmak (2% of river flow input), Sakarya (1% of river flow
input) and Southern Bug (1% of river flow input). All other rivers contribute less than 1% of
the freshwater inflow to the Black Sea (Table 3.2).
River-borne BOD5 loads are plotted in Fig. 4.13. Average values for only the two most
recent years for which data are available are presented, since these are the most complete
datasets. The values for Romania are those from Danube, representing 63% of the total river-
borne BOD5 load (573 ktonne/yr) and 70% of the total flow. However, the Danube BOD5
loads during the early 2000s are reported to have decreased to about half of the level during
the late 1990s (Annex 10). This represents a truly remarkable achivement if the results are to
be believed, but the earlier data are from a period when analytical quality assurance
procedures were not so robust as they were during the later years.
The river load for Georgia (1.85 ktonnes) represents only 0.3% of the total load, from 9% of
the total river flow, which, considering the lack of biological treatment in Georgian WWTPs,
appears particularly low. In contrast, the Ukrainian BOD5 load is 29% of the total from 16%
of the river flow. This appears unusually high, and while suspicions may be raised over poor
analytical quality control, there are many sources of BOD5 emissions to rivers; not least
livestock farming and natural BOD5 export from land. Many reviews have been undertaken
91
Root causes
Underlying causes
Direct Causes
Socio-economic drivers
Resource uses
Elevated pollutant loads resulting
in high levels of pollutants
accumulation in sediments
-lack/ poor enforcement of
environmental protection regulations in
agriculture
-Point and diffuse sources of
-Diminished government control of
-Unsustainable/inefficient agricultural
effluent from livestock farms
privatized farms
practices
-Diffuse pollution from
-Lack/poor planning of agricultural use
-Historical legacy from over
Historical legacy of
pesticides
-Low awareness of negative
application of pesticides
polluting activities
-ground/soil water discharges
environmental effects
(containing elevated levels
pesticides) to surface waters
-lack/ poor enforcement of
-Untreated industrial effluents and/or
environmental protection regulations in
poorly maintained industrial treatment
ĘLow standard of living
(poverty, unemployment,
industry (including energy and
plants
-Discharge of untreated
low incomes)
extraction of raw materials)
-Absence of / or outdated treatment
industrial effluents
-poor or no enforcement of trade waste
technology
-Atmospheric emissions of
discharge regulations
-anachronistic industrial technologies
pollutants deposited on land/
-Weak sectoral industrial policy and
and practices (including energy and
directly into the sea
ĘPolitical changes and/or
related legislations
extraction of raw materials)
-Oil spills
instability
-No incentive for pollution prevention
and control
Absence of or outdated storage and
ĘIncreased population in
Oil spills
treatment technology and facilities
coastal areas
Lack/poor enforcement of
Aging fleet
Dumpings/ discharges of wastes
environmental protection regulations
in shipping and harbor activities
Poor maintenance of vessels
Discharges of untreated ballast
ĘLow standard of
No incentives for pollution prevention
No effective monitoring and
waters
environmental education
and control
intervention plan for pollution from
Accidents
and awareness
ships
-Uncontrolled development in coastal
Illegal shipping/ harbor operations
areas
-Infiltrations from landfills
-Low level of user fees (tariffs) and
- Municipal waste disposal
ĘPoor implementation of
sectoral management
incentives for wastes collection,
-Poor management/planning/use of
(including litter) accidentally
planning
storage
landfills
reaching the sea
-Poor management/planning/use of
-Lack of treatment, and/or no
-additional litter loads from
landfills
infrastructure for collecting leachate
tourism
-Poor capital investment and
-Lack of operation and maintenance
-Inappropriate solid waste
operational funding for waste
control in collection of solid waste
disposal
collection/storage and treatment
Lack/ mismanagement of public funds
dedicated to improve the quality of the
environment
Figure 4.12 Causal chain analysis of chemical pollution
92
of BOD5 as a measure of organic pollution, because of uncertainty over results obtained, and
particularly over the issue of `sliding BOD5', but it is still widely accepted as the most
pragmatic test. However, with reference to Fig. 3.22, Turkey does not monitor BOD5 levels in
the Sea as part of the BSIMAP, since its scientists have little confidence in such results.
400
a
d
300
lo5
D
e
/
y
r
)
n 200
.
n
r
BO
(
k
t
o
100
v
e
Ri
0
Bulgaria Georgia Romania
Russia
Turkey
Ukraine
Fgure 4.13 Average river BOD5 loads to the Black Sea, 2004-2005
Manipulation/management of river discharges and climate changes also influence the amount
of pollutants discharged into the Black Sea. Higher river flows are often associated with
higher concentrations of chemical pollutants, so higher flows tend to deliver
disproportionately higher levels of many chemical pollutants. Because of this, there is huge
uncertainty associated with load estimation of many chemical pollutants, especially POPs.
Because of this, values may differ wildly from year to year (depending on exactly when
samples were collected with reference to "local" weather conditions), with confidence limits
for load estimates being so wide that the values produced are meaningless. Thus load
estimates of POPs are rarely made.
River discharges include land-derived loads of pollutants from historical pollution of river
sediments (Section 4.4.4.2), diffuse sources to land (Sections 4.4.4.3, 4.4.4.4 and 4.4.4.6),
direct industrial discharges to rivers (not included in Section 4.4.4.5) and direct municipal
discharges to rivers (not included in Section 4.4.10).
4.4.4.2
Internal loading from sediments
Once in the sea, pollutants generally become associated with sediments, through binding
adsorption, bioaccumulation and decay or direct dissolution in the lipids/fat content of
sediments. Disturbance of the sediments by bioturbation (mixing of different layers of
sediments as benthic invertebrates and bottom-living fish move and feed) and wind-induced
mixing of waters re-mixes particulate matter and interstitial sediment water (containing
elevated levels of pollutants) back into the pelagic system. Diffusion also plays a role in this
release of pollutants.
Thus, historically deposited pollutants may be released back into the overlying water for
many years after they first enter the sediment. For some pollutants, these fluxes may be
exacerbated by increases in temperature and the development of anoxic conditions at the
sediment-water interface. Thus, until organic pollutants break down and/or new layers of less
polluted river-derived sediments cover older layers of more polluted sediment, this release of
pollutants could be a major source of hazardous substances, albeit that no data are available to
make such an assessment.
93
4.4.4.3
Point and diffuse export of POPs from agriculture
Both livestock and arable farming are potential sources of toxicants. For example, pig farms
are often considered to point sources of copper; insecticides, herbicides and fungicides are
applied to crops. High levels of insecticides, fumigants, fungicides and antibiotics may be
used in intensive livestock farming, the waste from which is collected and discharged to
surface waters, with full, partial or no treatment, depending on the type of animals farmed,
national legislation and the extent of enforcement of that legislation. A wide variety of
chemical types of pesticide are available (e.g. carbamates, organochlorines, copper and
mercury compounds, pyrethroids, organophosphosphates, thiocarbamates, etc.), whose
toxicity varies greatly and whose chemistry ensures that their "environmental behaviour" is
very different. Some are therefore much more prone to leaching and to bioaccumulation than
others, e.g. some bind much more readily to organic matter in soils than others, some have a
greater degree of solubility in water than others, and some are much more soluble in
lipids/fats. It is, therefore, almost impossible to generalize about pesticide export from
catchments.
Interestingly, the Stockholm Convention "dirty dozen" POPs includes eight organochlorine
pesticides: aldrin, chlordane, DDT, dieldrin, endrin, heptachlor, mirex and toxaphene.
Bulgaria, Georgia and Romania have signed and ratified this convention, while the remaining
three Black Sea countries are signatories. Public health use of DDT is allowed under the
Stockholm Convention, but only for the control of mosquitoes (the malaria vector).
4.4.4.4
Ground/soil water discharges to surface waters
Some diffuse source derived hazardous substances will be leached into soil and groundwater
(as for nitrates) and are transferred through soil into groundwater or directly into rivers. There
will be some breakdown of POPs in groundwater because of the slow flow of water in
aquifers, but this groundwater will eventually be incorporated into rivers as base-flow or
discharged directly to the Black Sea as submarine freshwater inflows.
4.4.4.5 Industrial/municipal
discharges
The difficulty when calculating industrial discharges to the Black Sea, either from direct
discharges, or from discharges to sewer and emission from municipal WWTPs, is that so few
chemicals are routinely monitored in these discharges. Unless specific discharge permits are
set for individual chemicals, it is very unlikely that they will be monitored.
A very broad range of industries produce effluents containing hazardous substances Ł both
organic and inorganic. In addition to the EU WFD list of 33 (individual or groups of) priority
hazardous substances, EU directives also contain emission limits for:1,2-dichloroethane (1,2-
DCE), BOD5, "drins" (aldrin, dieldrin and/or endrin), cadmium, carbon tetrachloride,
chloroform, DDT, chemical oxygen demand (COD), mercury, pentachlorophenol,
perchloroethylene, trichlorobenzene and trichloroethylene from specified industrial
sectors/plants. These limits apply to Romania and Bulgaria, and will also apply to Turkey in
the future, should it become an EU Member State.
Two industrial chemical groups: hexachlorobenzenes (HCBs) and polychlorinated biphenyls
(PCBs); and two groups of industrial by-products: (dioxins and furans) make up the
remaining four of the Stockholm Convention POP "dirty dozen" (see Section 4.4.4.2 for
details of the remaining eight).
94
As discussed in Section 4.4.4.1, it is not possible to make good estimates of POP loads in
rivers, and while more reliable estimates can be made of POP loads from selected industrial
discharges, they are not often monitored. Heavy metal loads from some industrial facilities
discharging directly to the Black Sea are available, but the number of sites is so few that no
regional assessment can be made. Suspended solids data from a wide number of industrial and
municipal sources, but in their own right these do not represent hazardous substances.
Petroleum hydrocarbon loads are also available for 11 (principally Ukrainian) discharges, but
once again there are insufficient data to present a regional overview.
Pollutant loads were provided by all countries for industrial discharges of > 1000 m3/day. Of
these, BOD5 loads were available for 17 discharges in the six countries (Annex 10). The most
complete datasets were available for the years 2004 and 2005, with the results shown in Fig
4.14 Ł a total average load of 2,837 tonnes/yr. The relatively high results for Turkey are from
two industrial (copper mining/processing) plants, but direct industrial discharges are
responsible for only a tiny proportion (0.5%)of the total land-derived BOD5 load to the Black
Sea (594,895 tonne/yr). Note the different units used in Fig. 4.13, compared to Figs 4.14 and
4.15. Ukraine was the only country to provide relatively complete industrial BOD5 emissions
data, and these show little change since 1995.
2000
d
a
lo
1500
5
D
r
)
O
/y
e 1000
l
B
n
n
t
o
t
r
r
i
a
k
500
I
ndus
(
0
Bulgaria Georgia Romania
Russia
Turkey
Ukraine
Figure 4.14 Average industrial BOD5 loads to the Black Sea, 2004-5
For Bulgaria and Turkey, in particular, BOD5 loads data from municipal WWTP discharges
prior to 2002/2003 were not made available; so, once again, data for only 2004-5 are plotted
in Fig. 4.15, representing the combined load from 48 WWTPs serving a population of >5,000
people or with a daily discharge exceeding 1000 m3. This represents a total average load of
15,448 tonnes/yr. Substantial reductions have been achieved by some countries, with recent
direct municipal BOD5 emissions from Ukraine having fallen by about one-third and from
Romania by about two-thirds since the latter 1990s (Annex 10). However, for Russia the
decrease in direct municipal BOD5 emissions has been negligible over the same time scale.
Georgia does not contain a single functioning coastal sewage treatment plant, but recent
finance plans include the construction of waterwater treatment plans at Poti and Batumi
(Annex 11).
95
8000
d
Loa
6000
5
D
/
y
r
)
4000
l
BO
t
onne 2000
c
i
pa
uni
(
0
M
Bulgaria Georgia Romania
Russia
Turkey
Ukraine
Figure 4.15 Average municipal BOD5 loads to the Black Sea, 2004-5
However, there is no doubt that these data,are misleading. For example, the value presented
for Georgia is a mere 79 tonnes/yr. The coastal poulation of Georgia is 1.7 million people, of
which available data suggest over 90% are connected to sewer (Section 3.2). Based on a
BOD5 per capita production value of 60g/day (as specified in the EU UWWT Directive), this
amounts to an annual load of over 33,000 tonnes per year. No municipal sewage treatment
works in Georgia currently operate with biological treatment, so there would be little
reduction of this load via that route Some of the Georgian WWTP discharges may be to rivers
rather than directly to the Sea, so some degree of self-purification would occur, but the
declared total Georgian value (originating only from Kobuleti Sewerage System) is probably
at least 100-times lower than the real value.
4.4.4.6
Atmospheric emissions of pollutants deposited on land/directly into the
sea
Many pollutants (e.g. heavy metals, PAHs and dioxins) can be released by combustion
processes, including land-based incinerators, power stations and car emissions (as for nitrogen
Ł see Section 4.2.4.5) if the combustion process is incomplete and the gas/smoke produced in
not treated appropriately. These atmospheric emissions eventually return to earth. If the
chimneys releasing the smoke are not tall enough, the risk of nearby re-settlement of particles
greatly increases and can result in highly localized pollution hot-spots. The particulate matter
released has the opposite effect of greenhouse gas emissions, since the particles help shade
the land from sunlight Ł a phenomenon known as `global dimming'. It is these same particles
that water vapour condenses around to form raindrops.
4.4.4.7 Accidental/illicit
marine oil spills
Oil pollution is a concern for the Black Sea environment, in particular due to the increasing
risk of accidental spills that may result from an expected two-fold increase of oil transit by
tankers. The freight flow of this oil resource from middle Asia and Azerbaijan via Georgia is
gradually increasing. Over 20 million tones of oil and petroleum products are transported via
these terminals in Georgia to the west through the Black Sea. The resulting discharge of
ballast water in Georgian ports is estimated to have been 5 million tonnes during 2005. In
terms of oil pollution two distinct threats arise:
(i)
Localized chronic pollution from small but frequent spills at terminals, dockyards
and from ships at sea. This is a major concern over, for example, the oil terminal
currently under construction in the Kolkheti Wetlands, Georgia.
(ii)
The issue of more widespread and acute pollution from a major oil spill at Sea.
96
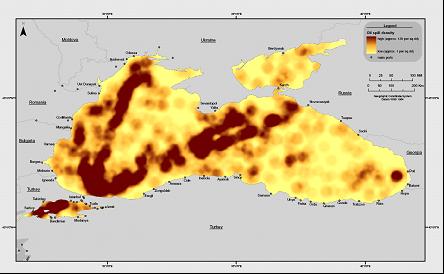
Those who live in close proximity to the Bosphorus and on clear days can see the hundreds of
ships moored close to either end of the channel, waiting for permission to travel through,
should fully appreciate this risk. This represents a huge bottle-neck to marine transport
throughout the region. While the accident record of the Strait has greatly improved in recent
years, largely down to improved management, the constant stream of traffic through it
provides an ever-present reminder of the scale of shipping into and out of the Black Sea, even
without considering the amount of internal traffic. The development of additional overland
pipelines is constantly in the news, but these are across western Black Sea countries that will
not reduce the eastwest flow of oil traffic from the Caspian Sea through Eastern Black Sea
countries. They will help by-pass the Bosphorus bottle-neck and should help reduce pressure
on this shipping channel, but the effect of overland oil transport through Bulgaria, etc. is more
likely to be an increase in internal (eastwest) oil traffic across the Sea.
Illicit discharges due to routine ship operations are among the main sources of marine oil
pollution. The amount of oil released in any single discharge is usually not large enough to
represent a great concern for its immediate impact on the ecosystem, unlike the case for
massive accidental oil spills. On the other hand, illicit discharges pose a cumulative, long-
term threat to the marine and coastal environment. Oil can be discharged at any time and from
any location to the Sea, making remote sensing (satellite imagery) the only pragmatic
monitoring tool for spill evaluation, providing images are collected and processed on a
frequent-enough basis.
The EC Joint Research Centre (Tarchi et al., 2006) undertook an assessment of the sea-based
oil pollution using remote sensing imagery for the period 1999-2004, showing a concentration
of oil spills along the main shipping routes: Odessa Ł Istanbul and Novorossiysk Ł Istanbul. A
substantial concentration of likely oil spills was also detected in the area north of the
Bosphorus Strait (Fig. 4.16).
Figure 4.16 Number of likely oil spills per area of sea54
The annual number of likely number of spills/illicit discharges detected in this study is shown
in Table 4.13. The time-scale over which the study was carried out is too short to determine
whether the situation has improved or not during recent years.
54Remote sensing data from 2000, 2001, 2002 and 2004 (Tarchi et al., 2006).
97
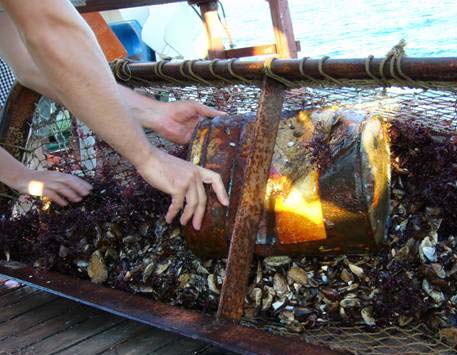
Table 4.13 SAR images analyzed and likely oil spills detected for the years 2000,
2001, 2002, 2004 (after Tarchi et al, 2006)
SAR
No. of
Spills per
Year
Images
likely spills
image
analyzed
detected
2000 710 255 0.36
2001 519 249 0.48
2002 422 200 0.47
2004 1514 523 0.35
TOTAL 3165 1227 0.39
4.4.4.8 Dumping/discharge
of
wastes
Dumping of wastes, particularly persistent organic pollutants, directly into the Black Sea,
whether legally or illegally is a continuing problem in some countries. An example of this
with regard to DDT is provided in Section, 4.4.2, and empty containers of toxic
substances/waste continue to be brought to the surface during bottom trawling exercises (and
research activities; Fig. 4.17). The scale of this dumping/illegal discharge is not known, but a
further recent example was provided on 26 January 2007when Ukrainian television reported
that up to 10,000 tonnes/day of spoiled grain were being dumped into the Sea because of a
saturated domestic market, due to grain import-export quotas.
Figure 4.17 Empty drum of toxic waste picked up from the NW Shelf during the 2006
BSERP research cruise55
4.4.4.9
Municipal solid waste disposal
As with nutrients, hazardous substances can enter the enter the Sea from nearby landills either
in surface water runoff from leachate via groundwaters. In addition, litter from the surface of
landfills can be blown into the Sea; although, with litter, the problem is not so much from
hazardous substances, but rather one of aesthetic pollution. There has been a historical
problem of illegal dumping in all countries surrounding the Black Sea, but the extent to which
this has been dealt with is not known.
55Photograph courtesy of Laurence Mee.
98
Landfill registers exist in Bulgaria, Romania the Russian Federation and Turkey, but data
from the Turkish register was not provided for this report. Georgia is the only Black Sea
country not to have undertaken a landfill census within the last 10 years (a Ukrainian census
is currently underway). Monitoring of surface and/or groundwaters is required as part of
landfill consent conditions in all countries.
Available data on coastal landfills is shown in Annex 9. A large proportion of these were
constructed in the 1960s or 1970s, and most are still operational, but of the 25 Romanian
landfills for which data were received, 14 will be closed down between 2006 and 2017. This
regional data gathered includes information on a total of 91 coastal sites56, of which location
details (latitude and longitude) were provided for 65 (Fig. 4.18). Data from only two Turkish
coastal landfills were provided for this report.
Of the 91 sites 66% are authorised, 12% receive hazardous waste, only 22% were constructed
with a liner and even fewer (8%) have a leachate treatment system, albeit that 18% have a
stormwater diversion system. n only 77% of the landfills is the amount of waste routinely
monitored. This information greatly underplays the historical problem of illegal dumping of
solid waste on shores around the Black Sea, since data on relatively few
unregulated/unofficial dumping sites were included in the information provided.
4.4.4.10
Natural geological origin
The geochemical reserve of heavy metals in existing and fresh sediment transported by rivers
into the Black Sea varies throughout the region. For example, copper levels along the South
Georgion and East Turkish cosats are likely to be naturally elevated, since a copper ore mines
is situated close to the Sea near the Georgion/Turkish border (Section 3.4.2).
4.4.5 Underlying
causes
The majority of underlying causes of chemical pollution in the Black Sea are shared with
those of nutrient pollution/eutrophication and are grouped into four main categories (Fig.
4.12), based around four major sources of chemical pollution:
Ę Shipping/harbour operations (Section 4.4.5.1)
Ę Agriculture (Section 4.4.5.2)
Ę Industrial discharges (Section 4.4.5.3)
Ę Municipal discharges (Section 4.4.5.4)
In addition, a fifth over-arching issue of the lack and/or mismanagement of public funds
dedicated to improve the quality of the environment is also considered in Fig 4.12.
4.4.5.1 Shipping/harbour
operations
The lack (or out-dated nature) of treatment plants at ports and harbours to cope with ship-
generated wastes, particularly the disposal of bilge water (from a chemical pollution
perspective) is an issue. Several of the hot-spots discussed in Section 5 are port wastewater
treatment works dealing with ballast and/or bilge water. Success in completing the necessary
construction work has been mixed. Thus, outdated storage and treatment technology is still in
place at some ports, providing only partial treatment at best. This problem is compounded by
the old age of much of the Black Sea "domestic" fleet. As machinery ages, the risk of
56Data were requested for all landfills within 10 km of the Black Sea coast.
99
mechanical/structural failure increases and corrosion worsens. Older ships are more likely to
pollute, particularly when those vessels have been poorly maintained.
There is also a problem of poor enforcement of regulations in shipping Ł the likely oil spills
map (Fig. 4.16) shows this clearly. At present there is no effective monitoring and
intervention plan for pollution from ships, without which enforcement of existing regulations
is likely to remain very weak.
4.4.5.2 Agriculture
In some of the Black Sea countries, particularly Georgia, Russia and Ukraine, there is either a
lack or poor enforcement of environmental protection regulations in agriculture. The adoption
of best agricultural practice in Bulgaria, Romania and Turkey should improve matters in the
future, even if it hasn't done so yet. Since the break-up of the Soviet Union, the widespread
move to smaller-scale farming has diminished government control of privatized farms, with
controls over land use now appearing to be considerably weaker. It is, however, difficult to
effectively control an economic sector as depressed as agriculture is in the Black Sea Region.
The smaller-scale of farming now practiced is a double-edged sword: it is less efficient in
terms of crops or livestock produced per hectare of land, so less profitable, but should be
better for the environment if managed correctly.
There is a regional legacy from the over application of agro-chemicals, so residues of
historically-applied pesticides/herbicides are still being exported to the Sea from catchments;
and stores of out-dated and highly toxic agro-chemicals are still thought to exist on some
farms. When the economic climate for Black Sea farmers is as bleak as it currently is, the
temptation to use old stocks will increase.
4.4.5.3 Industrial
discharges
There is little incentive for pollution prevention and control Ł emissions-based trading has not
started in the region and the emphasis has clearly shifted from state subsidies for failing
industrial sectors. So, instead of a "carrot and stick" approach, the emphasis is firmly on a
prescriptive basis. This is not sufficiently-well backed-up by monitoring, particularly of small
direct discharges to surface waters and discharges to sewer.
Only a fraction of industrial discharges to sewer are monitored to ensure compliance with
standards, and no comparison of these standards has been undertaken between the six Black
Sea countries. In the past, at least, corruption has been a relatively common feature Ł those
organizations which did not want their emissions to sewer monitored too closely, were able to
ensure this did not happen.
For those industries discharging directly to surface waters, little or no action may have been
undertaken, even if existing standards were not complied with, since socio-economic
considerations (e.g. further unemployment in areas of already high unemployment) are loaded
with political persuasiveness. This includes a lack/poor enforcement of environmental
protection regulations in mining and other natural resource extraction sectors.
100
Figure 4.18 Location of known landfills around the Black Sea coast
101
Key to Fig. 4.18
No. Landfill No.
Landfill
No.
Landfill
1
Varna , village of
22
Negru Voda
48 Yurovka village
Vaglen
2
Bourgas Bratovo
23
RAJAC WWTPs sludge
51 Glebovka village
deposit - Luminita
3
Marinka (Bourgas)
24
SC Lafarge Romcim Medgidia
52 stanbul, Kemerburgaz/Odayeri
4
Varna Beloslav
25
SC Etermed SA Medgidia
53 stanbul, ile/K÷m³rc³oda
5
Varna Solvey Sodi (ash-
26
SC Argus SA Constanta
54 Pervomaisk gully
slug pond)
6 Varna
Polymeri
(slug 28
Marway Fertilchim SA -
55 Gaspra,
Yalta
pond)
Navodari
7 Agrapolychim
Devnjya 29 Agighiol
56 Alushta
8 Bourgas
Luk
Oil
30 Vararie
57 Evpatoria,
9
Bourgas Copper Mine
31
Macin
58 Chernomorskoe
10 Batumi
32 Babadag
59 Sudak
11 Poti
33 Isaccea
60 Feodosia
12 Kobuleti
34 Sulina
61 Koktebel
15 Constanta -Ovidiu
35
SC Alum SA, Tulcea
62 Saki
13 Mangalia - Albesti
36
SC Feral SRL, Tulcea
63 Novoozernoe, GKPSU
Ekologia
14 Costinesti
38
Loo village
64 Krasnoperekopsk, Crimea soda
plant site, Krasnoe lake
15 Constanta port
39
Adler village
Krasnoperekopsk, Brom plant,
Staroe lake
16 Eforie South
40
Tuapse
66 Armyansk, Titan plant
25 Medgidia
41 Lermontovo
village
67 Armyansk
18 Harsova
42
Kabardinka village
68 Primorske
19 Cernavoda
43
Tekos village
69 Primorske
20 Techirghiol
44
Dzhanhot village
21 Basarabi
45
Krasniy village
Comparatively weak sectoral industrial policies (or enforcement of them) exist in some
countries, but the increasing acceptance of BAT (best available technique/technology;
enshrined in the EU IPPC57 Directive) by non-EU Member States is likely to make a
difference in the coming years, since BAT includes both environmental and economic
considerations. Many inefficient manufacturing plants closed down following the break-up of
the Soviet Union, but there is still a (much-reduced) legacy of anachronistic industrial
technologies and waste treatment practices within the region.
4.4.5.4 Municipal
discharges
Poor management and regulation of landfills (including poor differentiation between various
types of waste: hazardous, industrial, municipal, etc.), as well as the widely accepted practice
of illegal dumping along the coastline, were once accepted as the norm in the Black Sea
Region. However, since the first TDA was produced there has been a shift by some
authorities/governments to address this problem, particularly in Romania and Bulgaria as part
of their EU accession process.
The landfill data in Annex 9 show a considerable number of landfills in these countries
scheduled for closure in the coming years because of non-compliance with EU standards,
together with the construction of specialized cells for hazardous waste at selected sites. This
development of the waste industry follows the "polluter pays" principle, but there is still
57Integrated Pollution Prevention and Control
102
overall under-development of the industry in at least three of the countries (Georgia, Russia
and Ukraine), where low user fees (tariffs) mean the solid waste industry is under-funded. The
infrastructure for collecting landfill leachate/stormwater runoff is absent from the vast
majority of landfills, but placing the solid waste industry on a more commercial basis
(particularly in Romania and Bulgaria) should continue to result in greater capital investment
and operational funding to address both current and historical waste management issues.
Uncontrolled development/urbanisation of coastal areas brings with it increased generation of
solid waste. Initially this will result in more rapid filling of existing landfill sites, but a future
risk will be the designation/construction of further landfill sites close to the Sea.
4.4.6 Knowledge
gaps
The Black Sea Commission has standardized regional methodologies for the collection and
analysis of plankton and zoobenthos samples, but little guidance is offered on interpretation of
the data collected. The next logical step is the development or adoption of an existing
macrozoobenthos index for regional reporting purposes, the results of which are easily
understood by non-specialists, including decision makers, and are more informative than
simple biomass and abundance data.
At present, it is obvious that data are still missing/incomplete and of highly variable quality.
This was a fundamental problem with information on nutrient and other chemical loads
presented in the original 1996 Black Sea TDA, and while the situation has improved, there is
still a great deal of progress to be made.
An attempt has been made to gather data on landfills in this report, following the
recommendation given in the 1996 TDA, and there has been some success. The issue of
landfill characterization and assessment is being taken seriously in some countries but, from
the information provided, Turkey appears to be particularly weak in this area. Greater
attention should be paid to this issue by the BSC Advisory Group on Land Based sources of
Pollution. The same advisory group should also pay greater attention to the harmonization of
environmental standards for the Black Sea Ł both discharge and Black Sea water/sediment
quality standards. In the terms of reference for this group, this is stated as one of its primary
objectives, but no progress has so far made.
Although the Black Sea Commission has standardized reporting formats for the data it
collects, the formats are often not followed. A serious re-assessment is required of the
indicator data that the commission collates and passes onto other organizations, notably the
ICPDR and the European Environment Agency (not only on the issue of chemical loads and
pollution status). Data on so-called mandatory parameters within the BSIMAP are frequently
not collected and from some countries there is an unwillingness to pass on additional data
which could be of use to the Commission. Data ownership is a serious problem in the Black
Sea Region. For organizations which are fully or partially funded by national Ministries of the
Environment this should not be a problem, but it continues to be. This situation is not
acceptable.
The issue of standardizing data formats is a major one. Considerable amounts of data were
received for this report which could not be used because of a failure to supply location data
(latitude and longitude), or because incorrect location data were provided. It is the
103
responsibility of the organizations which supply data to quality assure what they provide; not
the receiving institution.
As with nutrients, issues of load estimation have once again surfaced58. There are numerous
ways to calculate/estimate chemical loads and the method(s) adopted for individual rivers
(and other land-based point sources) should be, but aren't compatible. Even such fundamental
issues as the use of commas, spaces or decimal points in reported statistics have caused
problems (e.g. in Annex 9, the surface area of Varna landfill is given as 240 km2 and that of
Bourgas landfill as 133 km2). Then, there are issues of whether to report concentrations in
mass or molar units; failing to state whether water column concentrations are for filtered or
unfiltered samples; and whether sediment pollutant concentrations are reported on a dry- or
wet-weight basis. These are very basic issues that should have been solved long ago.
An important problem appears to be the lack of robust quality assurance systems for pollution
loads data provided by Black Sea Countries. All laboratories participating in the BSIMAP
scheme also participate in the QUASIMEME quality assurance programme coordinated by
the Black Sea Commission.
4.4.7 Summary
and
recommendations
Greater financial investments are required for (re-)construction of wastewater treatment
facilities and management systems. There is a need for capacity building and institutional
strengthening within government institutions in a number of coastal countries. Increasing the
level of public awareness and participation in water resources management and protection is
an important task in the process of resolving this issue.
The following recommendations are also suggested in order to respond to the issue of
reducing and control the pollution of the Black Sea waters:
Ę Identification of a regionally agreed list of priority pollutants. Clearly there will need
to be a considerable overlap with the EU WFD list of priority pollutants, but bearing
in mind the huge capital investments required of EU countries to meet the stipulated
criteria, a much reduced list should be proposed for the Black Sea. The same agreed
list should be used for harmonised monitoring of the marine environment and major
point sources (including rivers). Existing parameters in the BSIMAP should form the
basis of this programe.
Ę Development of robust national quality assurance programmes for the
intercomparation/intercalibation of chemical concentration and flow data for the
estimation of pollutant loads.
Ę Environmental standards (discharge and marine water/sediment quality standards)
vary from country to country. This adds a further layer of difficulty to establishing
regional plans for reducing pollution loads to the Sea. The regional harmonisation of
these standards is required.
Ę Production of a regional manual on data handling guidelines/rules is required. This
should specify the formats for data exchange between the Commission and
national/international bodies, as well as appropriate methodologies/statistical software
for processing such data.
58 Load calculation/estimation can have considerable levels of uncertainty. Some idea of the level of confidence
which can be applied to individual loads is required.
104
Ę Establishment of national plans for the reduction of pollution loads to the Black Sea.
Such plans should contain the measures required to reduce the load/concentration of
each identified pollutant, the competent authority and the financial costs for
implemention.
Ę Build capacity of environmental authorities for enforcing regulations to control the
discharge of priority pollutants from both point and diffuse sources.
Ę A major shift in government awareness of the state of the Black Sea and the economic
value of this resource is required to push environmental issues higher up the political
agenda. Good environmental management costs money Ł lots of it Ł and this is a
major problem in the developing economies of all six coastal countries. However, the
promotion of public awareness programmes should be seen as an important first step
in developing ground-up pressure on decision makers.
Ę Establishment of an inter-state ministerial mechanism for a quick response to
emergency situations.
Ę Development/adoption of an agrreed transboundary environmental impact assessment
methodology for developing transboundary projects in the region.
Ę The approaches of Best Available Technique/Technology and Best Agriculture
Practice should be more widely and forcefully applied in the Region.
Ę Conferring assistance to the industry sectors (and mining enterprises) in developing
Environmental Management Systems and undertaking Cleaner Production Activities
Ę Development of a network of farmer support services to increase the transfer of
knowledge on appropriate application of pesticides and herbicides should be pursued,
together with advice/guidance on the disposal of old pesticide/herbicide stocks
105
Box 4.3
Comparative analysis of the 1996 and 2006 TDAs on the transboundary problem of chemical pollution
A comparison between the 1996 and 2007 TDA with regard to transboundary pollution is presented in the table below. In the 1996 TDA, pollution was
considered to be a driver of all of the Major Perceived Problems, whereas in the 2006 TDA it was considered to be a priority transboundary problem. This
apparent disparity arises because the problems identified in the 1996 TDA are a combination of causes, problems and impacts. Most are related to issues of
biodiversity, whereas others are more specifically causes (e.g. inadequate protection of marine and coastal resources from maritime accidents). However, it is
fully recognised that a one of the drivers of biodiversity and ecosystem loss is pollution. In the 1996 TDA, excess nutrient levels in and nutrient loads to the Sea
were integrated into the pollution theme, unlike the current TDA, where nutrient pollution/ eutrophication has been treated separately to highlight its importance
as a problem in its own right and to help explain the links with other transboundary problems.
Issue
1996 situation
2006/7 situation
Microbiological pollution
Ę
Significant point source discharges.
Ę
Microbiological pollution identified primarily as a significant national (rather than a
Ę
Some national and international riverine inputs considered to be
transboundary) problem. No further assessment made
significant.
Ę
Sewage pollution considered to be a major source, but no real
assessment
Ę
Solid municipal waste disposal considered to represent a problem
with possible transboundary dimensions. However, no supporting
information provided.
Ę
No consideration of livestock as a source
Land-based point source
Ę
Considered only direct municipal/industrial discharges
Ę
Considered only direct municipal/industrial discharges
pollution
Ę
Direct discharge assessment based on modelled data and likely to
Ę
Direct discharge assessment based on monitoring data
have been inaccurate
Ę
Improved quality assurance programmes required to allow regional comparison of
pollutant load data
Ę
Legal landfills identified in most countries (Section <>), but no assessment of their
likely contribution to pollution status
River and strait pollutant
Ę
Data from a large number of rivers missing, but not reported as
Ę
Data from a number of rivers is still not available, but the situation is improving.
loads
such.
Ę
Crucially, data for the Bosphorus and Kerch straits has not been provided.
Ę BOD5 still the only "chemical" pollutant (excluding nutrients) routinely monitored by
all countries
Ę
Provision of flow /discharge data for the estimation of riverine loads highlighted as a
topic requiring attention/capital investment
Diffuse source pollution
Ę Not
included
Ę
Considered, but not assessed due to lack of information.
Ę
Agrochemicals considered an increasing problem.
Dumping activities
Ę
No official information on major dumping activities (legal or illegal)
Ę
No official information still available
taking place in the region. It was assumed that it was taking place
however, and was predominantly caused by a lack of regulation of
potential dumping activities.
Status assessment of the
Ę
No status assessment made
Ę
Preliminary status assessment made.
Sea
Ę
No regionally agreed monitoring programme
Ę
The BSIMAP has been in existence for 6 years now, but national data provision is
variable
Ę
BSIMAP has produced few sediment data so far, but data available from research
activities
Loads assessment
Ę
Assessment incomplete. Based partly on modelled (direct
Ę
Assessment incomplete. Based on measured data
discharges) and partly on measured (riverine) data
Ę
No regionally agreed list of priority pollutants for monitoring/assessment purposes
Ę
No regionally agreed list of priority pollutants for
monitoring/assessment purposes
Operational discharges
Ę
Illegal discharge of harmful substances, especially oil, considered
Ę
The situation is unchanged. No data provided.
(vessels)
important, but no data presented to back up claims
106
4.5
Biodiversity changes, including alien species
introduction
4.5.1 The
problem
Land-based sources of pollution (including nutrients) alter pelagic and benthic habitats of
more than one country, particularly in inland seas where water exchange with other seas and
oceans is constrained. Coastal wetland habitats and communities have also been drastically
modified as a result of upstream water abstraction and changes in the flooding regime.
Impacts on biodiversity extend far beyond national boundaries. A number of activities,
processes, resource uses and practices across the Black Sea riparian countries impact the
Black Sea, the consequences of which result in pressures on marine biodiversity, the most
important of which are: eutrophication, unsustainable fishing/harvesting (overexploitation and
destructive fishing practices), habitat destruction, invasive alien species and chemical
pollution. Waste produced in the catchment areas disperses around the Black Sea via marine
currents. Transboundary effects arise if the impacted habitats are nursery and spawning
grounds for commercially important migratory fishes, marine mammals and birds.
Economic globalisation has also provided unprecedented opportunities for species to
overcome geographic barriers and establish in new habitats. Enclosed or semi enclosed
ecosystems, such as the Black Sea, seem particularly sensitive to biological invasions. With
increased shipping traffic, aquaculture and trade the Black Sea has become a major recipient
of alien species. The shared marine environment contributes to the spread of alien species
from one national sector to the others. Alien species can cause irreversible environmental
impact at the genetic, species and ecosystem levels in ways that cause significant damage to
the goods and services provided by ecosystems and thus to human interests. For this reason,
they are now recognized as one of the great biological threats to the environment and
economic welfare globally.
A comparative analysis of biodiversity change, including alien species introduction with the
findings of the 1996 TDA is presented in Box 4.4 at the end of Section 4.5.
4.5.2 Environmental
impacts and socio-economic consequences
4.5.2.1 Habitat
loss/degradation
and community modification
Habitats of transboundary importance can be defined in a number of ways: (i) those shared by
several countries; (ii) those which suffer change due to causes that originate in or are
contributed by another country; and (iii) those which may or may not be localised in one
country but internationally important feeding/breeding/spawning/nursery/wintering grounds
for migratory organisms. Three particular habitat types have been identified as habitats of
transboundary importance: (i) coastal margin ecotones; (ii) pelagic habitats; and (iii) benthic
habitats. The environmental impacts and socio-economic consequences of habitat
loss/degradation and community modification for each of these habitat types are described
below.
Coastal margin ecotones
Due to human pressures, aquatic coastal habitats have undergone significant modification
during recent decades. The following environmental impacts resulting from habitat
loss/degradation have been documented: frequent and intense algal blooms, modification of
107
community structure and changes in food webs, depletion of fish stocks, loss of migratory
species using the habitat, as well as altered migration patterns, increased mortality of aquatic
organisms and avian mortality, decreased native species diversity, increased proportion of
threatened species, changes in ecosystem stability, alien species establishment and increased
vulnerability to opportunistic invaders, ecosystem degradation.
The socio-economic consequences originating from habitat loss/degradation encompass
reduced options for freshwater use, increased costs of alternative water supplies, increased
costs of water treatment, loss in feral and cultured fisheries, reduced options for aquaculture
development, loss of tourism, recreational and aesthetic value, loss of educational and
scientific value, costs of clean-up and preventive measures, costs of restoration of modified
ecosystems, loss of sanctuary and protected areas and associated wildlife.
Shared habitats utilization may bring about human conflicts at international level. The
controversial construction of a large scale navigable waterway for seagoing vessels in the
Ukrainian section of the Danube River has has diplomatic consequences in Romania, the
principal custodian of the Danube's Black Sea flood plains. The excavation and planned
damming of the mouth of the Bastroe channel of the Danube has alarmed ecologists, who fear
it will drain the estuary and put out of action the present navigable Chilia waterway.
Environment groups estimate the construction work will put at risk the ecosystem of the
delta's two and a half million acres of wetlands, stretching across Romania and part of
Ukraine.
Pelagic habitat
The major environmental impacts of pelagic habitat degradation include algal blooms, water
quality impairment (reduced transparency, jelly and mucous accumulation, hypoxic events),
modification of community structure and food webs (elimination of large top predators via
fishing activities, predominance of small pelagic species exerting top-down control over the
food web, dead ends in the food web as a result of jellyfish), alien species establishment and
ecosystem instability.
The relevant socio-economic consequences of the above comprise reduced income and
reduced employment opportunities in commercial fisheries, loss of recreational values and
potential losses in tourism, increased risk for human health, mitigation, restoration and
treatment costs, reduced capacity to meet basic human needs (food), reduced educational,
scientific, cultural and aesthetic value and potential human conflicts at international level
related to the shared exploitation of marine living resources.
Benthic habitats
Reduced ecosystem stability/resilience and a move towards nutrient enrichment and
phytoplankton growth has had a dramatic effect on the bivalve community (e.g. the
Mediterranean mussel, Mytilus galloprovincialis).. When the degraded bivalve community is
unable to cope with food supplies from phytoplankton blooms and detritus, the excessive
supply creates a huge oxygen demand leading to bottom hypoxia. Degradation of mussel beds
which support diverse epifauna, infauna and interstitial community leads to decline/loss of
species and genetic diversity. Habitat degradation is associated with decrease of food resource
and breeding, spawning and nursery grounds for a range of commercially important species
therefore the following socio-economic consequences arise: reduced capacity to meet basic
human needs (food) for local populations, changes in employment opportunities, loss of
existing income and foreign exchange from fisheries. Water quality impairment is linked to a
108
decrease in recreational and aesthetic value with implications for tourism. Human conflicts
arose on the issue of Rapana venosa fisheries. The scientific community was alarmed by the
use of mobile bottom gears due to their detrimental effect on mussel beds and ultimately,
ecosystem instability (Konsulova et al., 2003). On the other hand the socio-economic
importance of the Rapana shellfishery in terms of processing and export has increased
significantly during the last decade due to high external market demand and also the collapse
of other commercial species stocks since the late 1980s. Clearly the problem is an issue which
needs further research to assess the ecological impacts against the socio-economic benefits
and suggest options for balancing the stakeholders' interests.
Over the last few decades, the reduction of key species distribution and biomass has caused a
subsequent decline in species richness, density and biomass of the associated fauna and flora.
Community structure was modified due to sensitive brown algae (Cystoseira spp.) elimination
and an increased development of tolerant red and green algae (Ceramium, Enteromorpha,
Cladophora), and epiphytic algae. In the mid 1990s the expansion of the alien species
Desmarestia viridis in Ukrainian waters further changed the community structure. Habitat
decline resulted in reduced capacity for local populations to use Cystoseira as a source of
alginates and animal feed or fertiliser. Furthermore, its potential use as a source of bioactive
pharmaceutical products (sulfopolysaccharide, anti-inflammatory drugs) was impacted. A
decline in aesthetic, recreational and educational/scientific value is also a noteworthy social
loss.
The decline in eelgrass (Zostera spp.) beds has resulted in the loss of a habitat and food
source for a number of associated species within the habitat and in surrounding benthic
communities. A consequence of this has been an increase in coastal erosion by wave energy
due to the loss of sediment stabilization by seagrass beds.
Among various sandy bottom inhabitants the bivalve Lentidium mediterraneum has suffered
the most significant decline, especially along the NW coasts of the Black Sea (mainly
Ukraine). The decline in the population of valuable commercial species such as the great
sturgeon, the starred sturgeon and the turbot, is partially associated with the decline in
Lentidium population, on which they feed. The consequence of this is a potential loss in
earnings from fisheries and employment opportunities have been reduced.
Increased catches of the clam Chamelea gallina along the Turkish coast have resulted in over-
fishing at certain localities. The use of destructive fishing gear (dredges) has subsequently
resulted in further habitat degradation (siltation, community modification, diversity decline).
4.5.2.2
Alien species introduction
The environmental and economic consequences of introduced species are considered
generally unfavourable though beneficial effects may also occur. Nearly 10 % of the
established alien species in the Black Sea and coastal aquatic habitats are considered to be
highly invasive and another 16 % as moderately invasive. Highly invasive species are
recognized to have a serious impact on biological diversity due to:
Ę Severe impacts on ecosystem structure and function (e.g. alteration of habitat,
competing with native species, entering food chain, altering energy and nutrient flow
etc.).
Ę Replacement of native species throughout a significant proportion of their range.
Ę Hybridization with native species.
109
Ultimately this has represented a significant threat to the unique biodiversity of the Black Sea.
In addition to their impact on biodiversity invasive aliens also have negative consequences for
human activities, including health and economic interests. They are often considered as pests,
pathogens or vectors of disease, and cause declines in the populations of commercially
important species either through competition or predation. Many also become nuisances
through fouling hydraulic constructions, clogging waterways, reducing water quality, and
reducing aesthetic and recreational value. Conversely, aliens may also integrate well in the
receiver ecosystem and generate positive ecological effects as well as become valuable
commercial resources. A brief overview of the impacts of selected invasive alien species in
the Black Sea is given below.
Among 38 alien phytoplankton species, three are assessed as highly invasive: the diatom
Pseudosolenia calcar-avis, the prymnesiophyte Phaeocystis pouchettii and the cryptogenic
prasinophyte Mantoniella squamata. Several more are deemed moderately invasive. Algal
blooms caused by the listed species have been associated with zoobenthos mortality, fish
asphyxia, pelagic community change and food web disruption. Negative economic
consequences derive from impaired water quality and decreased beach water aesthetics which
imply losses in tourism.
Among the 33 alien zooplankton species two have become central to the Black Sea ecosystem
in the last 2 decades: Mnemiopsis leidyi notorious for its detrimental effect on the pelagic food
web and fisheries collapse; and Beroe ovata reputed to be assisting in the restoration of
ecological balance by reducing the former through selective predation on it. However,
evidence to support this is mixed (see Section.3.3.2) Competition for food resources with
planktivorous fish (e.g. sprat) and predation on fish larvae, together with overfishing resulted
in the collapse of the pontic horse mackerel and anchovy fisheries during the late 1980s/early
1990s. M. leidyi was also indirectly responsible for enhanced harmful algal blooms in the
1980s. Furthermore, it reduced water quality due to mucous/jelly accumulation that caused
visual pollution and hypoxia which impacted on coastal tourism.
The establishment of B. ovata in the Black Sea resulted in a decline in the M. leidyi
population, an increase of plankton fauna diversity and mesozooplankton/fish larvae density
and biomass. However, B. ovata has only narrowed the period of Mnemiopsis impact on the
ecosystem, as it is prone to strong seasonal and interannual fluctuations (Vinogradov et al.,
2000). Consequently when it is not present during the summer period, M. leidyi flourishes
(Shiganova et al. 2001; Kamburska et al., 2003a,b; Kamburska, 2004).
Alien zoobenthos comprise 63 species, which arguably makes this ecological group the most
successful colonizer in the Black Sea. For example, the Janapanes snail Rapana venosa is a
habitat generalist and exploits practically every available prey. It has occupied an empty
ecological niche in the Black Sea and has exerted significant predatory pressure on the
indigenous malacofauna. The impact on bivalve populations is variable and ranges from
rather mild along the Romanian coast possibly due to suboptimal environmental condition,
moderate in Bulgarian and Turkish Black Sea, and severe along Russian and Ukrainian coasts,
where the whelk has been blamed for local exterminations or major declines in the numbers of
other bivalves. R. venosa is well established in the benthic ecosystem of the Bulgarian,
Romanian and Turkish Black Sea and has become a commercially valuable living resource.
Demand for Rapana meat on the international market increased the commercial value of this
resource initially withinin Turkey (1980s) and then in Bulgaria (1990s). In Romania, medium-
large scale `subsistence' harvesting is likely to develop into an export-oriented industrial-scale
110
enterprise in future years. In Ukraine R. venosa uses are limited to local subsistence fishery
and souvenir manufacture/trade.
Positive economic effects from R. venosa fishery are counteracted by negative ecological
side-effects of destructive fishing practices used in Turkey and Bulgaria where R. venosa is
fished with dredges and beam trawls, in the latter country illegaly. In contrast, in Romania R.
venosa is selectively fished by SCUBA divers, a sustainable method which does not disturb
the habitat or involve by-catches of other animals. However, signs of over-harvesting are
already evident in some areas. A new, sustainable, method of harvesting Rapana is currently
being trialled in Turkey, with promising results. This uses baited traps, analagous to
lobster/crab pots, which offer no harm to benthic habitats, with minimal by-catches and
greater control over the size/age of Rapana caught.
Other examples of alien zoobenthos include:
Ę The clam Anadara inaequivalvis, a habitat generalist, highly tolerant of hypoxia, long
lived, with high reproductive output and having the capacity to develop massive
populations where environmental conditions are optimal.
Ę The acorn barnacle Balanus improvisus which increases the self-clearing capacity of
shallow hard-bottom habitats and can form nuisance fouling on underwater
constructions.
Ę The Chinese mitten crab Eriocheir sinensis a benthic predator which causes
considerable erosion to mud/sand banks through burrowing.
A total of 27 aquatic/semi-aquatic alien vascular plants have been identified in Black Sea
wetland and coastal environments. Three are characterised as highly invasive, another 5 - as
moderately invasive. For example, Nuttall's pondweed Elodea nuttallii grows in dense
thickets, attached to the bottom of lakes and slow-flowing rivers and canals and can impede
water flow and navigation. At present the species is spreading in the Danube Delta, Danube
floodplain and major tributaries of the Danube.
Alien fish encompass 33 species, only 3 recognized as highly invasive in freshwater habitats.
In waterbodies inhabited by valuable commercial species and/or by threatened/endemic
species (like the Danube Delta) the highly invasive sunfish Lepomis gibbosus, the Cyprinids
Pseudorasbora parva and Carassius gibelio are pests that cause fisheries nuisance and
outcompete native fish. However, C. gibelio can also be beneficial to fisheries in degraded
and/or heavily modified water bodies, where other, more valuable species do not live.
4.5.3 Linkages
with
other
transboundary problems
Biodiversity changes in the Black Sea are closely linked to each of the other identified
transboundary problems. Eutrophication is recognized among the primary causes of Black Sea
marine and coastal habitats degradation. Phytoplankton blooms are associated with the
decline in species/habitats sensitive to increased turbidity (light attenuation), smothering and
hypoxia. (Section 4.2).
Fisheries exert significant pressure and cause the decline in abundance/biomass/stocks not
only of target commercial fishes but also of non-target by-catch species, including fishes,
mammals and birds. Destructive fishing practices such as the use of mobile bottom gears
111
contribute to habitat degradation by causing physical disturbance, mortality, smothering of
habitats by suspended sediments and discards. (Refer to section 4.3)
Chemical pollution may cause mortalities and sub-lethal effects in biota. Gastropods,
amphipods, infaunal polychaetes and bivalves are particularly sensitive to oil contamination.
The toxicity of oil and petrochemicals to fish ranges from moderate to high (Cole et al.,
1999). Deterioration of sea water quality and accumulation of pollutants in sediments and
biota contribute to the decline in sensitive species and habitat degradation in the Black Sea
(Refer to section 4.4).
4.5.4 Immediate
and underlying causes
The immediate, underlying and root causes of biodiversity change/habitat loss are shown in
the Causal chain presented in Figure 4.19. However, this analysis is expanded upon in Section
4.5.4.1 by considering the causes of biodiversity change in terms of major habitat types. In
Section 4.5.4.2, vectors of alien species introduction (a primary cause of biodiversity change)
are discussed in detail and threats to endangered "red list" species are covered in Section
4.5.4.3. Further detail on the immediate causes of biodiversity change/habitat loss can also be
found in Sections 4.2, 4.3, 4.4, all of which are drivers of this transboundary problem.
4.5.4.1 Habitat
loss/degradation
Coastal margin ecotones
The immediate causes of coastal aquatic habitats loss/degradation over the last decade are: (i)
point and diffuse discharges, and atmospheric deposition of nutrients and COD
(eutrophication); (ii) modification/loss of physical habitats including desiccation of wetlands
and floodplains, modification of river flow regimes, mechanical disturbance of substratum
and increased sedimentation/smothering; (iii) changes in chemical conditions - salinity and
nutrient ratios; (iv) unsustainable exploitation of living resources; (v) accidental or intentional
introduction of alien species; (vi) point and diffuse pollution from chemical contaminants; and
(vii) litter. These pressures derive from a variety of human practices and resource uses related
to:
Ę Agriculture: historical legacy from the over-application of fertilizers and pesticides,
unsustainable/inefficient agricultural and/or animal farming practices, intensive
livestock production, untreated or partially treated effluent discharges from livestock
farms, water abstraction and water diversion.
Ę Land use: land reclamation/drainage operations, deforestation, reed-bed burning.
Ę Urbanization and households: anachronistic and/or insufficient wastewater treatment,
municipal waste disposal (including litter), water abstraction.
Ę Energy: river damming/regulation, water diversion schemes and thermal pollution.
Ę Transport: river regulation and water diversion, navigable channel construction,
maintenance of shipping waterways in shallow waters, shipping activities,
introduction of alien species and associated pathogens, port/harbour development and
operations, absence of or outdated storage and treatment technology/facilities in ports.
Ę Industry: untreated industrial effluents and/or poorly maintained industrial treatment
plants, absence of/outdated treatment technology, anachronistic industrial technologies
and practices (including energy and extraction of raw materials).
112
Direct Causes
Root causes
-Point and diffuse sources of effluents
Underlying causes
from livestock farms
-Diffuse pollution from fertilizers and
Socio-economic drivers
pesticides
Resource uses
-Ground/soil water discharges
-Lack/ poor enforcement of environmental
-Lack of manure/fertilizer storage facilities
(containing elevated levels of fertilizers
protection regulations in agriculture
-Unsustainable/inefficient agricultural and/or
and pesticides) to surface waters
Historical legacy of poor
-Diminished government control of privatized
animal farming practices
-Fertilizers and pesticides accumulated
farms
-Intensive livestock production
in sediments (historical pollution)
land use/water
-Lack/poor planning of agricultural use
-Historical legacy from over application of
management
-Low awareness of negative environmental
fertilizers and pesticides
ŁDischarge of untreated industrial
effects
-Un-/partially treated effluent discharges
effluents
from livestock/farms
ŁAtmospheric emission/deposition of
ĘLow standard of living
pollutants and nitrogen deposited on
(poverty, unemployment,
-Lack/ poor enforcement of environmental
land/ directly into the sea
protection regulations in industry (including
-Untreated industrial effluents and/or poorly
low incomes)
ŁOil spills
energy and extraction of raw materials)
maintained industrial treatment plants
ŁRemoval of substratum (due to sand
-Poor or no enforcement of trade waste
-Absence of / or outdated treatment
extraction
discharge regulations
technology
-Weak sectoral industrial policy and related
-Anachronistic industrial technologies and
ĘPolitical changes and/or
legislations
practices (including energy and extraction of
ŁOil spills
instability
-No incentive for pollution prevention and
raw materials)
Łdumping/discharge of wastes
control
ŁDischarge of untreated ballast waters
ŁExotic species introduction (notably
ĘIncreased population in
Mnemiopsis leidyi)
-Absence of or outdated storage and
coastal areas
- Lack/ poor enforcement of environmental
treatment technology/facilities
protection regulations in shipping and harbors
ŁOverfishing
-No effective monitoring and intervention plan
- No incentive for poll. prevention/ control
ŁMechanical disturbance of substratum
ĘLow standard of
for pollution from ships
-Illegal shipping/harbor operations
due to bottom trawling/dredging
environmental education
-Ageing fleet
ŁDamage to nursery/ spawning areas
and awareness
ŁLack of Black Sea fisheries international
agreements/ regulations
-Poor maintenance of vessels
ŁLack/poor enforcement of national fisheries
-Point and diffuse sources of raw and
management and control plans
-Unsustainable/destructive fishing practices
partially treated anthropogenic effluents
ĘPoor implementation of
ŁNo effective control of fishing practices
-Poaching
-Infiltrations from landfills
-Lack of a common and effective monitoring
- additional seasonal nutrient loads to
sectoral management
system of the fishing activities around the
sewage treatment works from tourism
planning
-Uncontrolled development in coastal areas
Black Sea
(including litter)
-Low level of user fees (tariffs) and incentives
-Municipal waste disposal (including
for water use and treatment
-Anachronistic and/or insufficient wastewater
litter) accidentally reaching the sea
ĘTraditional food habits
-Poor management and/or poor capital
treatment plants
-Inappropriate solid waste disposal
investment and operational funding for waste
- Poor management/ planning /use of landfills
water collecting/treatment system
and/or unsafe wastewater treatment plants
-Lack of operation and maintenance control
ŁCoastal erosion and/or beach
ĘInternational demand/
for wastewater treatment plants and/or
"enhancement"
- Unsustainable tourism practices
globalization
landfills
- Elimination/introduction of
- Lack/poor enforcement of environmental
-Lack of operation and maintenance control in
substratum (modification of the
protection regulations in tourism
physical habitat required by associated
collection of solid waste
community) due to urbanisation, harbor
- "Hard" civil engineering approach to flood
and coastal defense constructions and
-River regulation (damming of rivers)
Significant external drivers
defense/hydroelectricity/ shipping/ coastal
touristic development
-Land reclamation (draining of floodplains)
erosion issues
ŁPhysical and chemical oceanographic
-Building of hard coastal defense works and
changes
harbor protection structures
ĘBiological drivers
-Maintenance of shipping waterways in
- Lack/ mismanagement of public funds
shallow waters
(historically affected
dedicated to improve the quality of the
trophic chain)
environment
ŁDecline in resilience of native/ natural
ecosystems
Figure 4.19 Causal chain analysis of biodiversity changes/habitats loss
113
Ę Fisheries and hunting: unsustainable/destructive fishing and harvesting practices,
poaching.
Ę Tourism: additional seasonal nutrient loads to sewage treatment works from tourism
(including litter), disturbance of wildlife.
Ę Aquaculture: alien species and associated pathogens introduction, aquaculture
emissions (increased nutrient and organic pollution).
Pelagic habitats
The major immediate causes of pelagic habitat degradation during the recent decade include:
(i) point and diffuse discharges, and atmospheric deposition of nutrients and COD
(eutrophication); (ii) overfishing, by-catch and discard; (iii) invasive alien species; (iv) point
and diffuse pollution from chemical contaminants (hydrocarbons, heavy metals etc.); (v)
litter.
The underlying resource uses and practices by economic sectors include:
Ę Agriculture: historical legacy from the over application of fertilizers and pesticides,
unsustainable/inefficient agricultural and/or animal farming practices, intensive
livestock production, untreated or partially treated effluent discharges from
livestock/farms.
Ę Fisheries: unsustainable/destructive fishing and harvesting practices, lack of a
common and effective monitoring system of fishing activities around the Black Sea.
Ę Tourism: additional seasonal nutrient loads to sewage treatment works from tourism
(including litter).
Ę Transport: introduction of alien species and associated pathogens, shipping
waste/oil/ballast disposals, lack of effective monitoring and intervention plans for
pollution from ships, ageing fleet and poor maintenance of vessels, port/harbour
development and operations.
Ę Urbanization and households: anachronistic and/or insufficient wastewater treatment,
municipal waste disposal (including litter), atmospheric emission/deposition of
pollutants and nitrogen deposited on land/ directly into the sea, coastal defence
constructions.
Ę Land use; changes in land cover use that may increase sediment or fertiliser runoff
(erosion).
Ę ndustry: untreated or partially treated industrial effluents and/or poorly maintained
industrial treatment plants, absence of / or outdated treatment technology,
anachronistic industrial technologies and practices (including energy and extraction of
raw materials), atmospheric emission/deposition of pollutants and nitrogen deposited
on land/ directly into the sea.
Ę Aquaculture - accidental or intentional release of alien species, aquaculture by-
products (increased nutrients and organic material).
Climatic variations at interannual-to-decadal time scales are superimposed on anthropogenic
pressures and represent a significant external driving force shaping the processes and
properties in the pelagic environment. Climate control operates on the food web by means of
various physical processes (e.g., vertical mixing, upwelling), which in turn govern the rate of
nutrient supply from the chemocline zone into the surface productive layer. In the Black Sea
the impact of climate forcing is limited to the lowest trophic level (phytoplankton; Oguz &
Gilbert, in press).
114
Natural expansion of alien species from the Mediterranean to the Black Sea can also be
associated with climate change/warming. Thus one of the hypotheses regarding Beroe ovata
introduction is that it was transported by the lower Bosphorus current and had a chance to
acclimatize itself in the Black Sea because of the warm winters during 1997/1998 and
1998/1999 (Zaitsev & ųzt³rk, 2001).
Benthic habitats
The immediate causes of a decline in benthic habitats can be summarized as: (i) point and
diffuse discharges/atmospheric deposition of nutrients and COD (shadowing of macrophytes
and bottom hypoxia due to plankton blooms); (ii) disturbance/modification/loss of physical
habitat - elimination or introduction of substratum, mechanical disturbance of substratum,
increased sedimentation/smothering; (iii) physical oceanographic changes - changes in wave
exposure, currents, depth, littoral drift, accretion/erosion characteristics of shores; (iv)
invasive alien species; (v) unsustainable exploitation of living resources - overfishing, by-
catch and discards, use of destructive fishing gears; (vi) point and diffuse pollution from
chemicals contaminants (hydrocarbons, heavy metals etc.); and (vii) litter .
The underlying resource uses and practices by economic sectors include:
Ę Agriculture:- historical legacy from the over application of fertilizers and pesticides,
unsustainable/inefficient agricultural and/or animal farming practices, intensive
livestock production, untreated or partially treated effluent discharges from
livestock/farms.
Ę Fisheries: unsustainable/destructive fishing and harvesting practices, poaching, lack of
a common and effective monitoring system of fishing activities around the Black Sea.
Ę Transport: shipping waste/oil/ballast disposals, introduction of alien species and
associated pathogens, lack of effective monitoring and intervention plans for pollution
from ships, ageing fleet and poor maintenance of vessels, port/harbour development
and operations, absence of or outdated storage and treatment technology/facilities in
ports, maintenance of shipping waterways in shallow waters.
Ę Urbanization and household: anachronistic and/or insufficient wastewater treatment,
municipal waste disposal (including litter), building of hard coastal defence
constructions.
Ę Tourism: additional seasonal nutrient loads to sewage treatment works from tourism
(including litter), disturbance of wildlife.
Ę Aquaculture: accidental or intentional release of alien species, aquaculture by-products
(increased nutrients and organic enrichment).
Ę Industry: untreated or partially treated industrial effluents and/or poorly maintained
industrial treatment plants, absence of / or outdated treatment technology,
anachronistic industrial technologies and practices (including energy and exaction of
raw materials), atmospheric emission/deposition of pollutants and nitrogen deposited
on land/ directly into the sea.
Ę Land use: changes in land cover use that may increase sediment or fertiliser runoff
(erosion).
4.5.4.2
Vectors of alien species introduction
The analysis of introduction vectors shows that the majority (68 %) of the introductions are
human-mediated and only 13 % are a result of the natural expansion of species (Figure 4.20).
A considerable portion of the aliens have no known vector (see Annex 6). However their
115
native range excludes the option of natural expansion, therefore anthropogenic vectors are
assumed as well. Among human-mediated dispersal mechanisms ships are clearly identified
as the primary vector (30 %) of alien introductions in the Black Sea, followed by aquaculture
(11 %).
aquaculture
unknown
11%
18%
d
t
e
a
ships
unknown
di
e
%
30%
(probably
m
68
n-
human-
a
m
mediated)
natural
hu
12%
expansion
13%
diffusion
9%
natural expansion
unknow n
ships
aquaculture
unknow n (probably human-mediated)
diffusion
agriculture
ornamental
canals
biocontrol
escapes
Figure 4.20 Vectors of alien species introductions in the Black Sea and coastal aquatic
habitats
4.5.4.3
Major threats to IUCN red list species
Pollution, habitat destruction, exploitation (overfishing) and disturbance are recognized as
important threats in all Black Sea countries (Figure 4.21).
Eutrophication is almost certainly underestimated as a threat factor, due to a misunderstanding
of categories by national experts. Many entries which should have gone under eutrophication
were probably listed as agriculture and pollution.
The prevalence of disturbance (due to tourism, trampling and military activity) predominantly
affects waterfowl and shorebirds of the Black Sea wetlands. As birds are the most thoroughly
assessed systematic group in the region, they comprise a large share of the threatened species
list and hence the influence on the ranking of threat factors.
Climate change is clearly not recognized as threat factor and is not assessed properly in most
Black Sea countries, although it is one of the major drivers behind biodiversity change in the
Black Sea at present.
Parasitization and displacement by alien species is either largely overestimated, as it is the
case in Ukraine and Georgia, or not considered at all, as in Turkey.
These inaccuracies/misinterpretations are reflected in the overall picture of threat factors in
the Black Sea, where eutrophication is obviously underestimated as a threat, while minor
factors like parasitisation and displacement by alien species, agriculture and forestry are
overestimated (Figure 4.22).
116
100%
WAT
90%
POL
PAR
80%
HAB
70%
EXL
60%
EUT
50%
DIS
40%
CLI
30%
BIO
20%
FOR
10%
AGR
0%
BULGARIA GEORGIA
ROMANIA
TURKEY
UKRAINE
Figure 4.21 Factors of threat to red list species in each of the Black Sea countries59
AGR
WAT
FOR
4%
8%
2%
BIO
7% CLI
1%
POL
18%
DIS
13%
PAR
EUT
5%
8%
HAB
EXL
18%
16%
AGR
FOR
BIO
CLI
DIS
EUT
EXL
HAB
PAR
POL
WAT
Figure 4.22 Overall picture of threat factors to Red List species in the Black Sea
(legend abbreviations as in Figure 4.22)
59 WAT= water regulation: dyking, coastal defense measures, drainage, land reclamation, rerouting, water extraction, POL=
pollution (pesticides, contaminants, sewage, waste, combustion, oil pollution), PAR= parasites, diseases, competition,
displacement (inclusively by alien species), HAB= loss of habitat through direct destruction, EXL= exploitation: fishing, hunting,
gathering, by-catch, habitat loss or mechanical disturbance due to e.g. bottom trawling, EUT= eutrophication (including
acidification and water turbidity), DIS= disturbance: tourism (including wear, trampling), traffic, military activities, CLI= climate
change, BIO= biological characteristics that make the species vulnerable to other threats (low fecundity, late maturity, limited
dispersal etc.), FOR= changes in forestry (only for species from paramarine wetlands and coastal dunes), AGR= agriculture:
intensive, changing, stop of traditional farming (only for species from paramarine wetlands and coastal dunes)
117
4.5.5
Underlying socio-economic drivers
The underlying socio-economic drivers of the unsustainable practices and resource uses that
cause biodiversity change in the Black Sea encompass legal and institutional incapacity in a
number of sectors:
Ę Agriculture: lack and/or poor enforcement of environmental protection regulations in
agriculture, diminished government control of privatized farms, lack and/or poor
planning of agricultural land use, low awareness of negative environmental effects.
Ę Industry: lack and/or poor enforcement of environmental protection regulations in
industry (including energy and exaction of raw materials), poor or no enforcement of
trade waste discharge regulations, weak industrial policy and related legislations, no
incentive for pollution prevention and control.
Ę Transport: lack and/or poor enforcement of environmental protection regulations in
shipping and harbours, no incentive for pollution prevention/ control.
Ę Fisheries: lack of Black Sea fisheries international agreements/ regulations, lack
and/or poor enforcement of national fisheries management and control plans, no
effective control of fishing practices.
Ę Urbanization: uncontrolled development in coastal areas, low level of user fees
(tariffs) and incentives for water use and treatment, poor management and/or poor
capital investment and operational funding for waste water collecting/treatment
system.
Ę Tourism: unsustainable tourism practices, lack and/or poor enforcement of
environmental protection regulations in tourism.
Ę "Hard" civil engineering approach to flood defence/hydroelectricity/shipping/ coastal
erosion issues.
Ę Lack and/or mismanagement of public funds dedicated to improve the quality of the
environment.
For more details on these underlying socio-economic drivers, refer to Sections 3.2, 4.2, 4.3
and 4.4.
4.5.6 Knowledge
gaps
Knowledge gaps differ among Black Sea countries depending on the variable national
research effort. Georgia was identified as having most serious gaps of information regarding
national habitats, threatened species and alien species. Russia did not provide any of the
requested data on biodiversity change, which impeded the regional assessment.
Generally, data deficiency or knowledge gaps are recognized in the following:
Ę Changes in the spatial extent of habitats are largely unidentified. Habitat
fragmentation is not assessed, changes over time are unknown.
Ę Lack of long term data sets and temporal and spatial patchiness of data on most of the
quantitative indicators to assess diversity change.
Ę Vectors of introduction are unknown for a large number of aliens, a great deal of
speculation and assumption may lead/have led to the development of weak
management strategies and continue to leave invasion windows open.
118
Ę The level of threat to species according to IUCN categories and criteria is evaluated
for a limited number of species. Re-evaluations at regular intervals are absent to
provide assessment of the change in the level of threat over time.
4.5.7 Summary
and
preliminary recommendations
[This section needs some refinement]
Among the considerable diversity of Black Sea marine and coastal habitats the following were
identified as being of transboundary importance: (i) the aquatic coastal margin ecotones
including lagoons, estuaries, deltas, wetlands and saltmarshes; (ii) the pelagic habitat Ł the
neritic in the NW Black Sea and the open sea in the SE Black Sea; (iii) a range of benthic
habitats including Mytilus galloprovincialis beds, the association with Cystoseira spp., the
Zostera beds and the sublittoral sands dominated by various psamophilic bivalves.
Changes in aquatic coastal habitats vary and are dependant on the intensity of environmental
pressures at the sub-regional level. The Danube Delta and the Bulgarian coastal wetlands
probably continue to experience diversity decline and impaired ecological status compared to
the 1960s, despite the considerable reduction in habitat degradation due to the designation of
extensive protected areas and the implementation of management plans aimed at biodiversity
and water quality restoration. The Dnipro Delta and the Turkish coastal aquatic habitats have
continued to decline due to eutrophication and pollution. Often, habitat degradation can only
be inferred from increased anthropogenic pressures rather than systematic studies. A lack of
research and knowledge on Georgian coastal habitats and the Dniester Delta, as well as a
difficulties in obtaining national data represent have weakened this assessment of changes in
the ecological status and diversity of the Black Sea.
Changes in the pelagic ecosystem towards the end of the 1990s reflects healthier conditions,
especially in the NW Black Sea area, where decreased nutrient loads were coupled with
favourable climatic change. However, despite the signs of recovery (rise of zooplankton and
small pelagic fish stocks) the habitat shows a state of ecological instability, as well as
sustained significant stock decline of large pelagic fish species. The Turkish Black Sea area is
in a poor ecological state and biodiversity has decreased during the last decade.
Environmental and biodiversity changes in the SE Black Sea area remain unclear either due to
insufficient research (Georgia,) or a lack of provided data (Russia).
Benthic habitats show local signs of recovery but overall are still degraded compared to the
pristine pre-eutrophication state of the Black Sea.
The presence of invasive alien species has modified the diversity and functioning of both the
pelagic and a range of benthic habitats. Consequently it is likely that it will not be possible to
revert to the ecological conditions of the 1960s, due to the practicalities of eradicating
introduced alien species.
Environmental impacts related to biodiversity change encompass frequent and intense algal
blooms, water quality impairment, modification of community structure and changes in food
webs, depletion of fish stocks, loss of migratory species using the habitat as well as altered
migration patterns, increased mortality of aquatic organisms and avian mortality, decreased
native species diversity, an increased proportion of threatened species, changes in ecosystem
stability, alien species establishment and increased vulnerability to opportunistic invaders, and
ecosystem degradation.
119
The socio-economic consequences originating from habitat loss/degradation include reduced
options for freshwater use, increased costs of alternative water supplies, increased costs of
water treatment, loss in feral and cultured fisheries, reduced options for aquaculture
development, loss of tourism, recreational and aesthetic value, reduced income and reduced
employment opportunities, reduced capacity to meet basic human needs (water, food),
increased risk for human health, loss of educational and scientific value, costs of clean-up and
preventive measures, costs of restoration of modified ecosystems, loss of sanctuary and
protected areas and associated wildlife. These are compounded by potential human conflicts
at the international level related to the shared exploitation of the living resources and habitats.
The immediate and underlying causes of biodiversity change are associated mainly with
eutrophication, pollution, over-exploitation of the living resources, accidental or intentional
introduction of alien species, and the disturbance/modification/loss of physical habitat.
The following preliminary recommendations to decision-makers derive from the analysis of
recent Black Sea biodiversity change:
Ę Marine researchers around the Black Sea require continued capacity building and
training to increase the levels of professionalism.
Ę Scientists should have greater access to key decision-making positions in
organisations which cover the Black Sea region.
Ę Thorough evaluation and regular re-evaluation of major marine systematic groups are
needed in each of the BS countries, using the latest IUCN criteria and guidelines for
application at the regional level. Evaluations must be based on up-to-date, distribution,
population level and structure data. This will require serious funding and capacity
building in all Black Sea countries.
Ę An integrative approach to conservation is required. This necessitates the rethinking of
conservation efforts from a species-oriented to a habitat- and ecosystem- oriented
approach. These often form clear management units. Protection of habitats will in
most cases provide the right conditions for dependent species to survive. Species
protection alone is very difficult in many cases, because of high fluctuations in the
populations from year to year or because of migrations. If it can be made clear which
habitat types are under pressure, these can be placed on a Red List. Often it will be
clear which impacts are responsible for the deterioration of a Red List habitat, and
management can act accordingly. In this way known Red List species and unknown
speices at risk will be simultaneously protected.
Ę Once national Red Lists on habitats and biota have been completed a Red Book of
Habitats, Flora and Fauna of the Black Sea can be created, which can then serve as a
tool for conservation management at the regional level.
Ę An increase in the number and area of Marine Protected Areas including designation
of transboundary reserves is essential.
Ę Improved management strategies to prevent new invasions should target the priority
vectors of introduction Ł ships and aquaculture.
120
Box 4.4
Comparison of the 1996 and 2006 TDAs on the transboundary problem of biodiversity changes, including alien species introduction
A comparison between the 1996 and 2007 TDA with regard to biodiversity change and alien species introduction is presented in Box xx below. In the 1996 TDA, biodiversity
change and alien species introduction was considered as 3 separate Major Perceived Problems. These were: loss of habitats, notably wetlands and shelf areas, supporting
important biotic resources; loss or imminent loss of endangered species and their genomes; and replacement of indigenous Black Sea species with exotic ones.
The transboundary significance of these 3 problems as described in 1996 are very similar to those detailed in Section 4.5.*, namely: biotic resources were considered to be
mobile or migratory; wetlands provide nursery grounds and were likely to assimilate transboundary pollutants; endemic and/or rare species were of regional and global
significance; widespread eutrophication had altered the entire ecosystem, affecting diversity and abundance of biotic resources; exotic species were a global transboundary
problem and the entire Black Sea was likely to become a vector for extra-regional contamination. It is sobering to consider that in the last decade, these MPPs are still considered
to cause significant degradation of the Black Sea environment and little seems to have been done to reduce the impacts of these problems.
Issue
1996 situation
2006/7 situation
Loss or imminent loss of
Ę
The TDA focused on keystone species. These were considered to
Ę
The 2007 TDA also focussed on keystone species.
endangered species and
be at the center of communities which are highly characteristic of
Ę
Decreases in biodiversity and keystone species abundance was still a serious
their genomes
the local environment, and include threatened endemic as well as
concern. A number of activities, processes, resource uses and practices across the
relict species.
Black Sea riparian countries impact the Black Sea, the consequences of which result
Ę
These communities had dramatically decreased due to
in pressures on marine biodiversity, the most important of which are: eutrophication,
eutrophication caused by inflow of untreated sewage from point and
unsustainable fishing/harvesting (overexploitation and destructive fishing practices),
non point sources and otherwise polluted rivers, hypoxia caused by
habitat destruction, invasive alien species and chemical pollution.
eutrophication, increased turbidity, the use of inappropriate types of
Ę
The community dominated by Phyllophora nervosa has not returned to its former
fishing gear, toxic pollution, over-harvesting and destruction of
situation but is instead dominated by opportunistic filamentous algae. Although this is
breeding grounds.
not necessarily bad it still represents a eutrophic condition, albeit less serious than
Ę
The phyllophora community was considered to be 3% of the
that represented by the monospecific phytoplankton blooms of the 1980s. Indeed
reference level on Ukrainian shelf although there was little or no
evidence suggests that transparency of the water column is sufficient to allow
quantitative data on the standing crop in 1990s.
Phyllophora to re-establish, providing the level nutrient enrichment can be reduced.
Ę
The Cystoseira barbata community was considered to be less than
1% of reference level on Romanian and Ukrainian shelf.
Ę
The Mediterranean Mussel (Mytilus galloprovincialis) was at 30 % of
reference level on NWS.
Ę
Few specimens of Monk seal were left although there had been no
recent comprehensive census.
Loss of habitats, notably
Ę
Although loss of habitats was identified as a MPPin the 1996 TDA,
Ę
The impacts on, and causes of, degradation of Coastal margin ecotones, benthic
wetlands and shelf areas,
there is little data to support this , other than the information
habitats and pelagic habitats were analysed in the 2007 TDA. Principly the causes of
supporting important biotic
provided for the loss or imminent loss of endangered species (see
coastal aquatic habitats loss/degradation were attributed to: point and diffuse
resources
above).
discharges, and atmospheric deposition of nutrients and COD (eutrophication); (ii)
disturbance,modification/loss of physical habitats; (iii) changes in chemical
conditions; (iv) unsustainable exploitation of living resources; (v) introduction of alien
species; (vi) point and diffuse pollution and (vii) litter. (viii) physical oceanographic
changes; and (ix) unsustainable exploitation of living resources.
Replacement of
Ę
Introduced opportunistic settlers e.g. ctenophore Mnemiopsis leidyi
Ę
Highly invasive species are recognized to have a serious impact on biological
indigenous Black Sea
had shown outbreaks and had caused negative effects on fish
diversity. Nearly 10 % of the established alien species in the Black Sea and coastal
species with exotic ones.
population and environment.
aquatic habitats are deemed currently as highly invasive and another 16 % as
Ę
Some species, which had adapted to the Black Sea environment
moderately invasive.
and replaced indigenous species, were being harvested as living
Ę
Among 33 alien zooplankton species two has become central to the Black Sea
marine resources.
ecosystem in the last 2 decades- Mnemiopsis leidyi notorious for its detrimental
Ę
It was considered that there was a risk of exportation of
effect on the pelagic food web and fisheries collapse, and Beroe ovata reputed for
opportunistic settlers from the Black Sea into other seas and the
restoring the ecological balance by reducing the former through selective predation
introduction of other opportunistic settlers into the Black Sea in the
on it.
future.
Ę
The majority (68 %) of the introductions are human-mediated and only 13 % are a
Ę
The development of effective control of ships ballast waters and
result of the natural expansion of species Ship ballast waters are clearly identified
fouling organisms was recommended.
as the primary vector (30 %) of alien introductions in the Black Sea, followed by
aquaculture (11 %).
Ę
It is still considered that not enough has been done to reduce these introductions.
121
122
5. HOT-SPOTS
ANALYSIS
50 pollution point sources (hot-spots)60 were originally identified from the 1996 TDA as
requiring capital investments. These are shown in Fig. 6.1, with further details presented in
Annex 9. An assessment of the relative level of success in tackling these sources is made
below in terms of the investments already made and those which are planned to be made by
the end of 2015. The degree of success in tackling these sources is divided into three
categories: identified capital investments completed (Section 5.1), identified capital
investments started (Section 5.2) and those where further work is still required (Section
5.3)61. In Fig 6.1 and Annex 9, hot-spots belonging to these categories are coloured green,
amber and red, respectively. Three of the originally-identified Russian hot-spots (Rostov-on-
Don, Taganrog, and Azov municipal WWTPs) discharge into the Sea of Azov, not the Black
Sea.
Capital investment costs to address the identified 50 hot-spots were originally estimated to
be almost $400 million. By the end of 2005 at least $143 million had been spent on
addressing these point sources, with a further $340 million planned by the end of 2015.
5.1 Identified
capital investments completed
Of the 50 hot-spots originally identified 14 can be considered to have been adequately
addressed in terms of required capital investments or a re-assessment of the impacts
(pollution loads) discharged from the sites. Of these the construction work has either been
completed or was due to have been completed by the end of 2006 at: Rosneta oil terminal
WWTP, Varna Port WWTP, Burgas Port WWTP, Asparouhovo municipal WWTP,
Neftochim oil refinery WWTP, Mangalia municipal WWTP, Sheskhoris oil terminal WWTP
and Gelendzhik municipal WWTP.
At Pivdenni municipal WWTP (Ukraine), over three times the original estimated investment
costs have already been spent improving this facility, so pollution loads from this hot-spot
are considered to have been addressed; however, it is planned to spend a further $37 million
on reconstruction/updating of this plant by the end of 2015. Likewise, in Romania, at
Constanta North, Constanta South and Eforie South WWTPs, greater sums of money have
already been spent on modernisation/updating of the facilities than originally estimated, with
considerable further investments to be spent by the end of 2015.
Closure and a change of use of the Fertilchim fertiliser manufacturing plant in Romania have
greatly reduced its emissions, meaning that the $16,750,000 investment originally identified
is no longer required. In the case of Dzhoubga municipal WWTP (Russia), a re-assessment
of its pollution loads/impacts means that no updating of the plant is required Ł this is also
included in the list of 14 hot-spots successes.
60The Black Sea is sometimes considered to contain 49 hot-spots, as identified from the original TDA. Reasons
for the confusion over the exact number occur because Zonguldak is sometimes to be a single source, and
sometimes two WWTPs serving Zonguldak are considered to be individual hot-spots.
61Due to a lack of supporting information, where capital investments have been made or are planned at a
substantially lower cost than originally planned, it has been assumed that the original envisaged improvement
in pollution loads/impacts have not been or not will not be achieved. Thus, assessments of the likely current or
future level of success of some capital investments in reducing pollution loads could have been underestimated
if cheaper methods of tackling pollution loads have been identified and implemented/planned since 1996.
123
No.
Name of pollution source
Source type
No.
Name of pollution source
Source type
1
Rosenets - oil terminal
Industrial
26
Anapa WWTP
Municipal
2
Port Varna
Industrial
27
Rostov-on-Don WWTP
Municipal
3
Port Bourgas
Industrial
28
Taganrog WWTP
Municipal
4
Solvey SODI AD
Industrial
29
Azov WWTP
Municipal
5
LUKOIL Neftochim
Industrial
30
Dzhoubga WWTP
Municipal
6
Asparuhovo WWTP
Municipal
31
KBI Samsun
Industrial
7
Balchik WWTP
Municipal
32
TUGSAS Samsun, Fertilizer Industrial
8
Tsarevo WWTP
Municipal
33
Trabzon (Pretreatment)
Municipal
9
Sozopol WWTP
Municipal
34
Samsun WWTP
Municipal
10
Chiatura
Industrial
35
Zonguldak WWTP
Municipal
11
Zestafoni
Industrial
36
Giresun WWTP
Municipal
12
Batumi WWTP
Municipal
37
Ordu WWTP
Municipal
13
Poti WWTP
Municipal
38
Bafra WWTP
Municipal
14
Tskhaltobo WWTP
Municipal
39
Zonguldak WWTP
Municipal
15
Zugdidi WWTP
Municipal
40
KBI Murgul
Industrial
16
Kutaisi WWTP
Municipal
41
OJSC "BROM",
Industrial
Krasnoperekopsk
17
Rompetrol Refinery
Industrial
42
Illichivs'k sea trade port
Industrial
18
Constanta Sud WWTP
Municipal
43
OJSC "Kamysh-Burunskiy
Industrial
19
Constanta Nord WWTP
Municipal
44
PMWSF, YALTA
Municipal
20
Eforie Sud WWTP
Municipal
45
PMWSF, GURZUF
Municipal
21
Mangalia WWTP
Municipal
46
North Odessa (Pivnichni)
Municipal
22
Fertilchim
Industrial
47
South Odessa (Pivdenni)
Municipal
23
Ballast water treatment
Industrial
48
PMWSF, Yevpatoriia
Municipal
plant, Tuapse
24
Tuapse WWTP
Municipal
49
Public enterprise
Municipal
"Sevtownwatersewerage"
25
Gelendzhik WWTP
Municipal
50 Balaklava
WWTP
Municipal
Figure 5.1
Location of hot-spots identified from the 1996 TDA
124
5.2
Identified capital investments started
Upgrading of a further 10 of the originally-identified hot-spots can be considered to have
been partially completed. The investment funds originally identified for
upgrading/reconstructing the Bulgarian Sodi soda ash plant and Tsarevo municipal WWTP
appear to have been spent, but construction (in 2006) had not been completed. Hence there is
some confusion over upgrading of these sources. At the Petromidia petrochemical complex
in Romania, capital investments have started, but the majority of
modernisation/reconstruction work is planned for completion by the end of 2015. Similarly,
in Russia, construction/modernization of Tuapse Port WWTP and Anapa municipal WWTP
has started but will not be completed for some years yet.
In Turkey the situation is difficult to assess, since Trabzon municipal wastewater treatment
plant was originally identified as being in need of upgrading, but which exact treatment
works was never identified. Investments have begun at several WWTPs serving Trabzon,
with further funding to complete this modernisation now identified in future capital
investment plans. Work has been undertaken at Zonguldak WWTP, but the amount of money
invested was considerably less than that originally estimated, with no further investments
currently planned before the end of 2015. A similar story to Zonguldak also emerges with
regard to capital investments at Yalta and Gurzuf WWTPs in Ukraine, where the
construction/upgrading of Yevpatoria WWTP has started, and is planned for completion in
the future.
5.3
Work still required
Upgrading/construction of the remaining 26 original hot-spots has not started and is not
planned to be undertaken at Kutaisi, Chiatura, Tskhaltubo and Zugdidi municipal WWTPs,
or Zestaponi industrial WWTP (Georgia). Likewise, investments at Rostov-on-Don,
Taganrog and Azov municipal WWTPs in Russia have not been made and are not planned.
In Turkey, no upgrading of the KBI and TUGSAS industrial WWTPs at Samsum, Murgul
industrial WWTP or municipal WWTPs at Zonguldak and Bafra has been undertaken or
planned. Similarly, no investments have been made or planned for Balaklava municipal
WWTP, Sevastopol municipal WWTP, Kamish Burunski industrial WWTP or Illichevsk
port WWTP (Ukraine).
Work has started and further work is planned to upgrade municipal WWTPs at Samsum and
Giresun (Turkey), but the investments fall far below that originally envisaged. Investments at
Ordu WWTP (Turkey) are completed, with no further work planned, but again at a
considerably lower cost than originally estimated. Some work has also been undertaken at
Krasnoperekopsk WWTP (Ukraine), albeit at a much lower cost than originally estimated,
with no further work planned.
Upgrading of Balchik municipal WWTP (Bulgaria) has started and will continue.
Investments at Pivnichni municipal WWTP (Ukraine) have not started but are planned.
Finally, capital investments are planned for upgrading or construction of municipal WWTPs
at Sozopol (Bulgaria), Batumi (Georgia) and Poti (Georgia), but this work had not started
before 2006.
125
126
6.
GOVERNANCE Ł LEGAL AND INSTITUTIONAL
ANALYSIS OF THE BLACK SEA REGION
6.1 Introduction
This chapter compiles all existing information pertaining to governance at the national level
related to water, nutrient and nature management, fisheries, ICZM and integrated pollution,
prevention and control policies assessing them from regional perspective.
The assessment is based on the analysis of the situation in all 6 Black Sea coastal countries:
Bulgaria, Georgia, Romania, Russian Federation, Turkey and Ukraine and it has been made
in the framework of the Black Sea Convention and of the Black Sea Strategic Action Plan.
Its main objective is to identify the actual status and the progress made since 1996, as well as
the deficiencies/gaps in terms of legal and institutional frameworks, policy/legal
harmonization and implementation of transboundary agreements.
Bulgaria, Romania and Ukraine are also signatory parties of the Danube River Protection
Convention, which forms the overall legal instrument for cooperation and transboundary
water management in the Danube River Basin. The situation is complicated by the fact that
Bulgaria and Romania joined the European Community in 1st of January 2007, so the Black
Sea is now recognized as a European Sea.
The UE status Accession and membership and its implications, Transboundary cooperation
and status of ratification/implementation of relevant international conventions and
agreements have been also considered and assessed from the regional perspective.
An effort was made to emphasize the legal and institutional framework particularly related to
the four identified transboundary problems: nutrient overŁ enrichement/ eutrophication,
changes in commercial marine living resources, chemical pollution (including oil), habitat
and biodiversity changes.
6.2 Institutional
analysis
Since the beginning of the 1990s, the countries of the region, with the financial assistance of
the international community, have started to co-operate in order to promote the sustainable
use of transboundary water resources. The 1992 Bucharest Convention and the 1993 Odessa
Declaration, a set of practical guidelines for which Rio's Agenda 21 supplied the model,
provided the impetus and framework for cooperation among the six Black Sea countries. A
similar movement has taken place among the larger group of countries in the Danube Basin Ł
itself a major part of the Black Sea basin and a major contributor to Black Sea pollution,
having as a result the signature of the Danube River Protection Convention in 1994.
Bulgaria, Romania and Ukraine are signatory parties of both Conventions.
The two conventions have resulted in the establishment of several institutions that are
required to develop concrete measures and inititatives to protect the water environment. The
Black Sea Commision and the International Commission for the Protection of the Black Sea
were set up in order to achieve the purposes of the two Conventions. Co-operation between
the two commissions started in 1997 on a preliminary basis, by establishing a Joint Technical
Working Group.
127
Both Commissions are assisted by Secretariats: the BSC Permanent Secretariat, officially
opened in 2000 and the ICPDR Secretariat, officially opened in 1999. In 2000, the ICPDR
has been nominated the platform for coordination of issues of international importance for
the implementation of the EU Water Framework Directive. Since this time, the Secretariat
supports also the cooperation/coordination between the Danube River Basin countries
towards the implementation of the EU Water Framework Directive.
The ICPDR has joined forces with the Black Sea Commission to remedy the environmental
degradation of the Black Sea through the Danube by establishing a Joint Technical Working
Group. This body is currently drafting guidelines for achieving good environmental status in
the coastal waters of the Black Sea, in line with EU legislation. Co-operation between the
two commissions was reinforced by a Memorandum of Understanding signed at a ministerial
meeting in Brussels in November 2001.
The Black Sea Commission and ICPDR are also members of the DABLAS Task Force,
which was set up in November 2001 as a platform for co-operation between international
financial institutions (IFIs), donors and beneficiaries with regard to the protection of water
and water-related ecosystems along the Danube and in the Black Sea. The task force includes
representatives from the countries in the region, the ICPDR, the Black Sea Commission,
IFIs, the EC, interested EU Member States, and other bilateral donors, as well as other
regional/ and international organisations.
6.2.1 Regional
institutions
The Black Sea Commission has one member from each of the six contracting parties,
Bulgaria, Georgia, Romania, Turkey, Russia and Ukraine. The Chair of the Commission is
rotated on an annual basis among the Contracting Parties. The Commission holds one regular
meeting each year and may hold extraordinary meetings as agreed by the Contracting Parties.
The Commission's decisions are made on the basis of unanimity.
The BSC was created with the main objective "to achieve the purposes" of the Convention.
Under Article XVIII, the BSC is entrusted to:
Ę Promote the implementation of the Convention and inform the Contracting Parties of its
work.
Ę Make recommendations on measures necessary for achieving the aims of the Convention.
Ę Consider questions relating to the implementation of the Convention and recommend
such amendments to the Convention and to the Protocols as may be required, including
amendments to Annexes of the Convention and the Protocols.
Ę Elaborate criteria pertaining to the prevention, reduction and control of pollution of the
marine environment of the Black Sea and to the elimination of the effects of pollution, as
well as recommendations on measures to this effect.
Ę Promote the adoption by the Contracting Parties of additional measures needed to protect
the marine environment of the Black Sea, and to that end receive, process and
disseminate to the Contracting Parties relevant scientific, technical and statistical
information and promote scientific and technical research.
Ę Cooperate with competent international organizations, especially with a view to
developing appropriate programmes or obtaining assistance in order to achieve the
purposes of the Convention.
128
Ę Consider any questions raised by the Contracting Parties.
Ę Perform other functions as foreseen in other provisions of the Convention or assigned
unanimously to the Commission by the Contracting Parties.
Existing protocols to the Bucharest Convention either add some new functions to this already
extensive list or specify concrete actions or activities expected from the BSC in the context
of its broad mandate. Existing protocols protocols are the:
Ę 1992 Protocol on Protection of the Black Sea Marine Environment against Pollution
from Land Based Sources (1992 LBS Protocol).
Ę 1992 Protocol on the Protection of the Black Sea Marine Environment against
Pollution by Dumping (1992 Dumping Protocol).
Ę 1992 Protocol on Cooperation in Combating Pollution of the Black Sea Marine
Environment by Oil and Other Harmful Substances in Emergency Situations (1992
Emergency Protocol), and
Ę 2003 Black Sea Biodiversity and Landscape Conservation Protocol (2003
Biodiversity Protocol; not yet in force).
Based upon the example of the Biodiversity Protocol it can be reasonably expected that the
two new legal instruments Ł the Revised Protocol on Land-Based Sources of Pollution and,
possibly, the Convention on Fisheries Ł will significantly expand the mandate of the
Commission.
Additional functions and responsibilities have been entrusted to the Commission by the two
declarations adopted by the regular Meetings of the Ministers of the Environment of the
Black Sea states Ł the 1993 Odessa Declaration and 2002 Sofia Declaration, as well as by the
memoranda of understanding and cooperation between the BSC and other international
bodies Ł ICPDR and the European Environment Agency.
As can be seen from the above, the mandate of the BSC is fairly broad and with time it has
been further expanded to include additional functions and responsibilities.
The Commission is supported by the Permanent Secretariat, headed by an Executive
Director. The Commission is currently acting in a general supervisory role for the
Secretariat, overseeing the activities conducted.
The Permanent Secretariat is supported in implementing the BSC activities by sixteen
subsidiary bodies: six activity centres, seven advisory groups and three ad hoc working
groups (Fig. 6.1). Each group meets regularly, up to twice per year.
The activity centres were designed as in kind contributions of the Contracting Parties (CPs).
The situation in several of the countries has changed over time due to government
reorganizations and changing budget priorities. Currently, only two of the original six have
funding from the CPs to carry out activities to support the BSC.
129

The Commission for the Protection of the Black Sea Against Pollution
Permanent Secretariat
Advisory Groups
AG ESAS
AG PMA
AG LBS
AG ICZM
AG CBD
AG FOMLR
AG IDE
Environmental Safety
Pollution Monitoring and
Control of Pollution from
Development of the
Conservation of Biological
Environmental Aspects of
Information and Data
Aspects of Shipping (AG
Assessment
Land Based Sources
Common Methodologies for
Diversity
Fisheries and Other Marine
Exchange
ESAS)
Integrated Coastal Zone
Living Resources
Management
Management
Ad-hoc Working Groups
WFD WG
State of Environment 2006 WG
Danube/ Black Sea Joint Technical Working Group
Regional Activity Centrres
Environmental Safety
Pollution Monitoring and
Control of Pollution from
Development of Common
Conservation of Biological
Environmental Aspects of
Information and Data
Aspects of Shipping (AC
Assessment (AC PMA),
Land Based Sources (AC
Methodologies for
Diversity (AC CBD),
Fisheries and Other Marine
Exchange (AC IDE),
ESAS), Varna, Bulgaria
Odessa, Ukraine
LBS), Istanbul, Turkey
Integrated Coastal Zone
Batumi, Georgia
Living Resources
Permanent Secretariat,
Management (AG ICZM),
Management (AG
Istanbul, Turkey
Krasnodar, Russian
FOMLR), Constanta,
Federation
Romania
National Focal Points
Bg, Ge, Ro, Ru, Tr, Ua
Ua, Bg, Ge, Ro, Ru, Tr
Tr, Bg, Ge, Ro, Ru, Ua
Ru, Bg, Ge, Ro, Tr, Ua
Ge, Bg, Ro, Ru, Tr, Ua
Ro, Bg, Ge, Ru, Tr, Ua
Bg, Ge, Ro, Ru, Tr, Ua
Figure 6.1
General structure of the Black Sea Commission
130
The current organization is complex and inconsistent. The Advisory Groups have a number
of issues which need to be addressed including: qualifications of members, continuity in
membership and focus on outputs. The Advisory Groups are all supported by a single
member of the Secretariat which limits the amount of support available, flexibility for
meeting times and other issues. The materials produced by the Advisory Groups are not
generally used by the decision makers in the Black Sea countries because they are not seen
as being relevant to policy making.
The current organizational structure of the BSC is multi layered. There is little accountability
within the existing organizational structure. For example, deadlines missed are often further
extended and incomplete activities are rolled over to the next period. The resources, both
human and financial, required maintaining such a complex organization is neither cost
effective nor sustainable.
For the EU Accession countries the WFD is part of the .acquis communitaire. Since 2000,
the ICPDR is the framework for basin-wide cooperation and serves as the platform for
coordination to develop and establish the Danube River Basin Management Plan. The
Danube River Basin District has been defined and covers: 1) the Danube River Basin; 2) the
Black Sea coastal catchments on Romanian territory; and 3) Black Sea coastal waters along
the Romanian and part of the Ukrainian coasts.
By the time the deadline for the completion of the River Basin Management Plan is reached
in December 2009 two more Danube countries, Bulgaria and Romania, have become EU
Members starting in January 1st, 2007. Although the countries have no reporting obligations
until they become EU-Member States, they have fully cooperated through the ICPDR
framework.
6.2.2 National
institutions for regional cooperation
This assessment of the national institutions presents the situation in 2006. It was carried out
by means of specially designed questionnaires and the processing of returns obtained from
the national consultants. The list of institutions and their main roles/functions in addressing
the four transboundary problems is presented in Tables 6.1-6.4.
Institutional arrangements differ from country to country. The overall responsibility for
environmental protection at national level, in all six countries, belongs to the Ministries of
Environment and their respective implementing/enforcing/controlling agencies organized at
federal/regional and local level. Support is also offered by other Ministries and agencies.
Even if Inter Łcoordination mechanisms are established in four of the Black Sea countries
and different bodies were set up in order to increase the cooperation/coordination between
the different agencies involved with implementation of water related policies at both national
and local level, their effectiveness would remain weak. Further institutional strengthening
and capacity building is needed, particularly with respect to water management, biodiversity
and fisheries. Existing Inter-ministerial coordination bodies and their functions/roles are
presented in Table 6.5
131
Table 6.1
Functions and roles of national institutions dealing with the transboundary problem of nutrient over-
enrichment/eutrophication
Role
Bulgaria Georgia Romania
Russian
Federation
Turkey
Ukraine
International Conventions/
Council of Ministers
Parliament,
Parliament,
State Duma
General Assembly
Parliament
agreements
MoFA,
MoFA
MoFA
Council of Federation
Council of Ministers
MoFA
ratification/signature...
MoEW
MoEPNR
MoEWM,
MoFA,
MoFA
MoEP
MoAFRD
MoNR
MoEF
Formulating national laws,
MoEW
Parliament (Committee
MoEWM
National level: MoNR
SPO
MoEP
regulations and plans for
MoAF
for Environmental
MoAFRD
Regional level: Legislative
MoEF;
Environmental Committee of
limiting and eliminating
MoRD
Protection and Natural
MoTCT
Assembly of Krasnodar kray
Ministry of Agriculture Ł
Ukrainian Parliament
pollution of water resources
Resources).
Ministry of Administration
(AoKK)
MoA
State Committee on Water
MoEPNR,
and Interior Ł MoAI
Saving Ł ScoWT MoA
MoA
Management of Water
MoEW
MEPNR,
MoEWM,
MoNR through
MoEF,
MoEP
resources
MoRD,
MoA,
NAAR & its river basin
FAWR & its territorial bodies
General Directorate of State
SCoWT
River Basin Management
Local Governments
directorates
Hydraulic Works - GDSHW
Directorate - RBMD
Water standards
MoEW, RBMD, REI,
MoHSWL, MEPNR
Environmental Engineering
Federal Environmental,
MoEF MoEP
development
MoRD, MoH
Research Institute (ICIM)
Industrial and Atomic Control
CMU
Service (FEIACS) and its
MoH
territorial bodies
RDEP
AoKK
Scientific and research
institutions
Issuance of
RBMD
MEPNR
National Administration
FAWR & its territorial bodies
MoEF
MoEP, CMU, RA, SCWM
concessions/permits/licenses
MoEW
Apele Romane and its
Water Supply and Sewerage
MoH
on water use and
branches ( NAAR )
Administrations (WSSA),
MoEP, SES, RA
Integrated permits for
+ MoAF
+ Sectoral Ministries
Environmental Protection
MoA
General Directorate of State
Ministry of Construction,
operational plants and
Agencies - EPAs
AoKK
Hydraulic Works (GDSHW)
Architecture and Municipal
facilities and projects,
Economy of Ukraine -
including livestock farms
MoH, MoA, MoEF
MoCAME
Monitoring of surface
NAAR
Federal Service for
MoEF, MoH, MoA,
waters, including:
REI,
MEPNR
+ICIM+ IRCM
Hydrometeorology and
GDSHW
SCWM,MoEP,SHMS,SEI
&
MoHSWL
NAAR
Environmental Monitoring
Ę
bathing waters
MoH
+ MoH
(ROSHYDROMET)
MoEF, MoH,
MoH, SES
Ę
groundwaters
MoRD, WSC &
NAAR
FEIACS & territorial bodies
GDSHW
SCWM,MoEP
Ę
pollution discharge
Municipalities
+ Local EPA's
MoNR through FAWR & its
+Municipalities, MoH,
MoEP, SCWM,RDEP,SEI
Ę
air emmissions
ICIM + Regional & Local
territorial bodies
WSSA
REI
EPA's
MoEF, MoH, Municipalities
MoEP,SHMS
Control & enforcement in
RBMD, MoE, MoRD
MEPNR
NAAR
MoNR - FAWR , FSNRM&
MoEF, Municipalities
MoEP/SES/RDEP/SEI/SEIBSA
water management
MoF
territorial bodies, AoKK
+ WSSA
S
132
Role
Bulgaria Georgia Romania
Russian
Federation
Turkey
Ukraine
Training & capacity building
MoE
MoEPNR,
MoEWM
AoKK
MoEF, MoA
MEP/MA/NGOs
MoAF
MoA
MoAFRD
Kuban State Agricultural
University
Regime/Registration of
MoAF,
MoA,
MoAFRD
MoA
MoA
MoA
Pesticides and
Regional MoAF Offices
MoEPNR
UP
Agrochemicals
CMU
Table 6.2
Functions and roles of national institutions dealing with the transboundary problem of changes in commercial marine
living resources
Role
Bulgaria Georgia Romania
Russian
Federation
Turkey
Ukraine
International
Council of Ministers
Parliament,
Parliament,
State Duma
General Assembly
Parliament
Conventions/
MoFA,
MoFA
MoFA
Council of Federation
Council of Ministers
MoFA
agreements
MoEW
MoEPNR
MoEWM,
MoFA,
MoFA
MoEP
MoAF
MoAFRD
MoNR
MoEF
MoA
ratification/signature...
MoA
MoA
Formulation of
MoAF integrated with
MoA,
MoAFRD
MoA and
MoA
MoA
agricultural policies,
MoEW
MEPNR
its Agency on Fishery
including fisheries
MoH,
AoKK
MRD
Development of
MoAF MEPNR,
MoAFRD
MoA through the Federal
MoA MoA
national program for
MoA
Agency on Fishery
MoEP
developing fisheries and
Cabinet of Ministers of Ukraine
- CMU
aquaculture
Development of action
MoAF &
MEPNR MoAFRD
MoA through the Federal
MoA,
MoEP
plans for the protection
Institute of Fisheries-Varna
Agency on Fishery
MoEF
MoA
of endangered fish
species, including
establishment of their
catch prohibition
Maintenance of the
MoAF &
MoAFRD
MoA through the Federal
MoA
MoEP
Fisheries Database
Institute of Fisheries-Varna
Agency on Fishery
MoA
Maintenance of the
MAF,
Ministry of Economic
MoAFRD
MoA through the Federal
MoA
Ministry of Transport and
Fishing Vessels
Executive Agency on
Development
Agency on Fishery
Comunications - MoTC
Register
Fischeries - EAF
Issuance of permission
Same & Municipalities
Local Authorities
MoAFRD
MoA through the Federal
MoA
MoA
for merchant fishing
Agency on Fishery
MoNR
133
Role
Bulgaria Georgia Romania
Russian
Federation
Turkey
Ukraine
Inspection and control
EAF
MEPNR
National agency for fishing
MoA through the Federal
MoA
MoA
of compliance with
and aquaculture
Agency on Fishery
MoEP
permissions for fishing
MoNR
State Ecological Inspection for
the Black Sea and Azov Sea -
SEIBSAS
Table 6.3
Functions and roles of national institutions dealing with the transboundary problem of chemical pollution
Role
Bulgaria Georgia Romania
Russian
Federation
Turkey
Ukraine
International Conventions/
Council of Ministers
Parliament,
Parliament,
State Duma
General Assembly
Parliament
agreements
MoFA,
MoFA
MoFA
Council of Federation
Council of Ministers
MoFA
ratification/signature...
MoEW
MoEPNR
MoEWM,
MoFA,
MoFA
MoEP
MoAFRD
MoNR
MoEF
Chemical pollution Ł originating from land
Formulating national laws,
MoEW
Parliament (Committee
MoEWM
National level: MoNR
SPO
MoEP
regulations and plans for
MoAF
for Environmental
MoAFRD
MoRD
MoEF;
Environmental Committee of
limiting and eliminating
MoRD,
Protection and Natural
MoTCT
Regional level: Legislative
MoA
Ukrainian Parliament
pollution of water resources,
MUN
Resources).
Ministry of Administration
Assembly of Krasnodar kray
Ministry of Public Works and
State Committee on Water
including those for land use
MoEPNR,
and Interior Ł MoAI
(AoKK)
Settlements (MoPWS)
Saving Ł SCoWT
MoA
Metropolitan Municipalities
MoA,
SCLR
Management of Water
MoEW
MEPNR,
MoEWM,
MoNR through
MoEF,
MoEP
resources, including water
MoRD,
MoA,
NAAR & its river basin
FAWR & its territorial bodies
General Directorate of State
SCoWT
supply and sanitation
River Basin Management
Local Governments
directorates
National level - MoRD
Hydraulic Works Ł GDSHW
Municipal water utilities
Directorate Ł RBMD
MoTCT & Municipalities
Regional level - AoKK
Municipalities, Water Supply
WSC
and Sewerage
Administrations
Monitoring of
NAAR
Federal Service for
MoEF, MoH, MoA,
Ę
surface waters
REI,
MEPNR
+ICIM+ IRCM
Hydrometeorology and
GDSHW
SCWM,MoEP,SHMS,SEI
including:
&
MoHSWL
NAAR
Environmental Monitoring
o
bathing waters
MoH
+ MoH
(ROSHYDROMET)
MoEF, MoH,
MoH, SES
Ę
groundwaters
MoRD, WSC &
NAAR + Local EPA's
FEIACS & territorial bodies
GDSHW
SCWM,MoEP
Ę
water bodies/ resources
Municipalities
+ Local Governments
MoH
MoNR through FAWR & its
+Municipalities, MoH,
MoEP, SCWM,RDEP,SEI
intended for human
territorial bodies
WSSA
consumption
NAAR + Local EPA's
MoH and its territorial bodies
Ę
pollution discharge
MEPNR
Ę
air emmissions
MoHSWL
ICIM + Regional & Local
REI
EPA's
MoEF, MoH, Municipalities
MoEP,SHMS
134
Role
Bulgaria Georgia Romania
Russian
Federation
Turkey
Ukraine
Control and enforcement
RBMD, MoE,
MEPNR
NAAR
MoNR - FAWR , FSNRM&
MoEF, Municipalities
MoEP/SES/RDEP/SEI/SEIBSA
MoRD,MoEW
MoF , MoED
MoTCT&Municipalities
territorial bodies,
+ WSSA, GDoSHW
S
FEIACS & territorial bodies
Municipalities
AoKK
Regime/Registration of
MAF, Regional MAF
Ministry of Agriculture,
Ministry of Agriculture,
Ministry of Agriculture
Ministry of Agriculture
MA/UP/CMU
Pesticides and
Offices
MEPNR
Forests and Rural
Agrochemicals
Development
Identification of
MOEW integrated with all
Ministry of Agriculture,
MEWM
Ministry of Environment and
MEP
sensitive and less
other cited institutions,
MEPNR
Forestry
sensitive areas
depending on the specific
case
Chemical pollution Ł originating from sea
Formulation of
MT,
Ministry of Economic
MoTCT
Ministry of Transport (MoT)
Undersecretariat for Maritime
UP
laws/regulations for
Executive Agency "Port
Development (MoED),
Affairs (UMA)
MoTC
shipping activities,
Authorities" (EAPA)
Parliament
MoEP
Executive Agency "Sea
including contingency
Administration" (EASA)
planning
Implementation of
MT,
Port Administration,
MoTCT,
MoT MoEF,
Ministry for Emergency
Contingency plans on
EAPA,
MoED
Romanian Naval Authority
UMA,
Situations (MoES)
pollution from tankers
EASA
(RNA)
General Directorate of
Coastal Safety and Salvage
and/or accidents on sea
Administration (GDoCSSA),
Metropolitan
Municipalities(depending on
the scale)
Inspection and control
MT,
Port Administration,
MoTCT,
MoT MoEF,
MoTC,
on ships and
EAPA,
MoEPNR
RNA
UMA,
SEI,
compliance with IMO
EASA
SEIBSAS
Regulations regarding
ballast waters
135
Table 6.4
Functions and roles of national institutions dealing with the identified transboundary problem of biodiversity changes,
including alien species introduction
Role
Bulgaria Georgia Romania
Russian
Federation
Turkey
Ukraine
International
Council of Ministers
Parliament,
Parliament,
State Duma
General Assembly
Parliament
Conventions/
Ministry of Foreign
MoFA
MoFA
Council of Federation
Council of Ministers
MoFA
agreements
Affaires - MoFA,
Ministry of Environment
Ministry of Environment and
MoFA,
MoFA
Ministry of Environmental
Ministry of Environment
Protection and Natural
Water Management -
Ministry of Natural Resources
Ministry of Environment and
Protection - MoEP
ratification/signature...
and Waters - MoEW
Resources - MoEPNR
MoEWM,
- MoNR
Forestry - MoEF
Ministry of Agriculture,
Forests and Rural
Development - MoAFRD
Formulating national
MoEW
Parliament (Committee
MoEWM
National level: MoNR
MoEF;
MoEP
laws, regulations and
Ministry of Agriculture
for Environmental
Regional level: Legislative
State Planning Organization -
Environmental Committee of
plans
and Forests - MoAF
Protection and Natural
Assembly of Krasnodar kray
SPO
Ukrainian Parliament
Ministry of Regional
Resources).
Development -MoRD
MoEPNR
Development of
MoEW
Ministry of Economic
MoEWM
Administration of Krasnodar
SPO
MoEP
regional plans and
MoAF
Development - MoED
MoAFRD
kray (AoKK)
MoEF
& it's
strategies
MoRD
MoEPNR
Ministry of Transport,
Regional Department of
Constructions and Tourism -
Environmental Protection
MoTCT
Regional Administration
Management of Natural
MoEW
MoEPNR
MoEWM
MoNR MoEF
State Service of Nature Reserves
Parks/Reserves
Regional Environmental
Management - SSNRM
Inspectorate - REI
Enforcement
MoEW
MoEPNR
MoEWM
MoNR through Federal
MoEF
SSNRM
REI
Environment Guard - EG
Agency for Water Resources
(FAWR),
Federal Service for Nature
Resources Management
(FSNRM) & its territorial
bodies
136
Table 6.5
Functions and roles of existing inter-ministerial coordination bodies
Role/function
Bulgaria Georgia Romania Russian
Federation
Consultative
Supreme
National
Consultative
Consultative
Water Council
Commission for
Integrated
Coastal Zone
Management
Consultative/decision Ł making in
Basin Councils
Basin
Basin Councils
the field of water management at
Committee
basin level
Consultative/decisional (ICZM
National
Plans&programmes, EIA, etc. )
Committee for
Coastal Zone
WFD Implementation
MoEW, MAF,
Interministerial
MRDPW,
Council of
MEER and MH
Waters
under
Memorandum
of
Understanding
Issuance of licenses/permits
Inter-agency
Inter-ministerial
Council for
Committee
Water Use
Enforcement of the National
Commission
Action Plan for water protection
(MoWEP,
against the pollution caused by
MoAF and
nitrates from agricultural source
MoH)
6.3 Policy/legal
analysis
6.3.1 International
legislation and agreements
The Black Sea States' activities in the field of environmental protection take place under the
`umbrella' of the Convention on the Protection of the Black Sea against Pollution, adopted in
1992 at Bucharest (1992 Bucharest Convention), which together with the 1996 Black Sea
Strategic Action Plan and additional protocols form the legal basis for regional cooperation.
The 1992 Bucharest Convention is a typical "framework" instrument modelled on similar
regional seas agreements adopted in the late 1970s to the early 1990s. Although drafted and
adopted approximately at the same time as some `second generation' regional seas treaties,
such as the 1992 Helsinki (Baltic Sea), the 1992 OSPAR (North Sea) and the 1995
Mediterranean conventions, the Black Sea framework in terms of its substance and
conceptual approach is reminiscent of the much earlier `first generation' regional seas
regimes.
The 1993 Odessa Declaration was exactly the type of an action-orientated document which
was necessary to supplement the general obligations of the `framework' treaty and
established specific and concrete targets and timetables for implementing the objectives of
the 1992 Bucharest Convention. However, none of these targets appear to have been
accomplished on time. In the same vein, the objectives of the Strategic Action Plan for the
Black Sea (BS SAP) adopted in 1996 proved to be too ambitious and had to be amended in
2002. The 2002 Sofia Declaration is imprecise (as compared with the 1993 Odessa
137
Declaration), since concrete objectives were not developed/included. However, it is still not
entirely clear whether the new timeframes have been complied with, as no implementation
and compliance review or control system exist at present.
The Black Sea Countries are also bound by international environmental agreements and
conventions. A large number of conventions and agreements have signed and ratified by all
six countries (Annex 13), providing a good basis for improvement of transboundary
cooperation. International/transboundary cooperation is also supported through bi/tri-lateral
agreements (Annex 14)
In most of the Black Sea Countries the provisions of the above mentioned legal frameworks
are transposed into national strategies/policies/regulations.
6.3.2 National
legislation
National strategies/policies/regulations do not specifically address the four priority Black Sea
transboundary issues. These are not formally looked upon as priority areas and are handled
within broader programme areas, such as:
Ę Habitat changes and alien species introduction within broader biodiversity
programmes.
Ę Changes in commercial marine living resource within broader biodiversity
programmes.
Ę nutrient over-enrichement/eutrophication among other elements of water
management plans/strategies.
As a consequence, there are no dedicated budgetary allocations specifically for the Black Sea
transboundary problems and no statistic is available for the total (public, private, domestic
and and foreign) capital investments channelled to address each of the problems.
Environmental policies in all six Black Sea Countries make use of the "polluters pays"
principle, based on laws, provisions, plans, procedures, standards to be met and prohibited
activities. Also, enforcement powers are assigned to agencies, fines and other penalties are
specified, and monitoring is promoted to ensure compliance.
Georgia, the Russian Federation and Ukraine, having once been part of the Soviet Union,
have similar legislation. Similarities can be found in terms of environmental regulation
which is organized as management of different natural resources such as land, water, forest,
biotic and natural resources. Environmental protection has been treated as a separate issue.
Since natural resources have not been privatized (initial steps have been made only for land
privatization), the management structure has maintained its main features of the state owner
control for the use of the resources. In the Russian Federation the special problem that
occurred is that natural resources, differentiation of state property and nature management,
environmental protection and environmental safety, etc are under the joint jurisdiction of the
Russian Federation and the territorial subjects of the Russian Federation (art. 72 of the
Constitution).
For Romania and Bulgaria the EU accession process represents the driving force for both
adoption and implementation of environmental legislation ensuring/ being in favour to
sustainable development. It can be stated that in terms of policy/legal status there is a need
138
for improvement/harmonisation in four of the countries: Ukraine, Russian Federation,
Georgia and Turkey. While in Turkey the Process of harmonization with EU policies is on-
going and progress is evident under the EU accession process, in Ukraine and Georgia, even
though the programmes have been approved and adopted, the socioŁeconomic situation and
political instability are slowing implementation down.
Despite the above comments on a lack of problem-specific legislation, an attempt has been
made to divide existing national legislation into the four major transboundary problems
(Annex 15), together with a table identifying key pieces of over-arching legislation. In
addition, sectoral legislation relating to the following four sectoral categories is presented in
the same Annex:
Ę Tourism
Ę Urban planning
Ę Agriculture
Ę Industry and transport
Since the legislation is not issue-specific, and the majority of the immediate and underlying
causes of the four major transboundary problems are shared, inevitably many of the
individual pieces of legislation overlap. In Annex 15, however, individual pieces of
legislation have been assigned, where possible, to individual problems or sectors, to help
identify where attention has been focused. Of course, a greater number of individual laws
does not necessarily imply greater coverage or attention to a problem than a single,
comprehensive piece of stand-alone legislation.
Nevertheless, it appears that reasonably robust legislation exists to cover the four major
transboundary problems, albeit that standards/norms for industrial wastewater discharge to
sewer require further clarification. The current lack of a basin-wide approach to pollution
management in at least three of the countries [Georgia, Russia and Ukraine; Turkey's EU
accession talks should shift the emphasis in this country] seriously weakens the ability of
regulators to consider the downstream effect on the Black Sea of direct wastewater
discharges to rivers.
In terms of sectoral legislation, ICZM-specific legislation appears to have been introduced
only in Romania, with IPPC-type legislation only in Romania and Bulgaria. Environmental
management in the remaining four countries, could be strengthened by the introduction of
similar industry-related legislation, as would the introduction of over-arching Best
Agricultural Practice legislation/guidance in Georgia, Russia and Ukraine to help tie-together
existing nating national lrgislation and guidance.
6.4 Conclusions
The BSC achievements to date are limited. While both the 1993 Odessa Declaration and the
1996 Strategic Action Plan for the Black Sea (BS SAP) established specific and concrete
targets and timetables for implementing the objectives of the 1992 Bucharest Convention,
very few of these targets appear to have been accomplished on time. It is also symptomatic
that the 2002 Sofia Declaration is devoid of precision (when compared with the 1993 Odessa
Declaration) which may indicate the Contracting Parties' unwillingness to set up concrete
objectives given their unfortunate previous experience.
139
The current organizational structure of the BSC is multi layered. There is little accountability
within the existing organizational structure. For example, deadlines missed are often further
extended and incomplete activities are rolled over to the next period. The resources, both
human and financial, required maintaining such a complex organization is neither cost
effective nor sustainable.
On the whole, there are two principle conclusions that stem from the legal analysis of the
existing regulatory framework established under the 1992 Bucharest Convention and its
subsidiary instruments. First, from the point of view of its general adequacy and consistency
with current trends in international environmental law-making, the existing legal basis for
regional environmental cooperation in the Black Sea is unsatisfactory; it is outdated. The
second point, however, is that even in its current form this framework still provides the
foundation for more effective regional efforts in combating marine pollution and improving
the environmental status of the Sea. Consequently, some immediate improvements in the
performance of the BSC could be achieved without radical changes in the existing legal
framework.
140
7. STAKEHOLDER
ANALYSIS
7.1 Introduction
A Stakeholder Analysis was conducted in order to determine the priority concerns of
stakeholders in the region, and their perceptions and concerns regarding the management of
the Black Sea ecosystem. It is important to gauge stakeholder concerns and priorities so that
the project can take steps to address these, build on positive trends in opinions and work to
introduce new ecologically oriented concepts where appropriate. By empirically measuring
stakeholder concerns and perceptions, the project also has a tool for understanding where
efforts should be focused to bring about optimal changes in ecosystem management. The
Stakeholder Analysis also assists the project to identify potential areas of tension between
stakeholder groups that may impact future resource management.
The methodology for this study is outlined in section 2.4 of the TDA. The specific
stakeholders and their involvement in the Black Sea ecosystem are outlined in section 3.4.2
of the TDA. The stakeholder analysis is based on quantitative surveys administered
throughout the Black Sea region. The findings here are weighted towards slightly the
responses in Romania as 110 surveys were collected there where as there were 34 from
Bulgaria, 63 from Georgia, 110 from Russia, 35 from Turkey, and 83 from Ukraine. The
discrepancy in survey numbers from various countries will be addressed where it is pertinent
to the findings.
The most notable findings of this study are that there is a large degree of cohesion among
stakeholder groups across the region and across countries as well. The stakeholders appear to
be open to increased information about environmental issues and feel that doing so would
benefit the Black Sea health. Further, while there seems to be a perceived trade-off between
environmental stewardship and economic development, the perceptions did not appear to be
so entrenched that they could not be altered with targeted stakeholder education efforts.
Stakeholder perceptions about cause and effect relationships, and level of concern for
specific issues varied across groups and issues and as expected those issues which are better
understood appear to take higher priority. The perceptions of stakeholders are outlined based
on survey results, the specific transboundary issues are addressed (Sections 7.4-7.7) and
recommendations are presented (Section 7.8).
7.2
Environmental perceptions of stakeholders
Stakeholders were asked about their overall perception of the health of the Black Sea, their
economic and professional dependence upon it and their sense of responsibility for the health
of the Black Sea. The general consensus among all stakeholders surveyed is that the Black
Sea is not healthy. Alternatively, there was not clear agreement on either the dependence
upon or responsibility for the Black Sea among all stakeholder groups. This lack of
consensus is to be expected as a wide array of stakeholders reflected varying degrees of
dependence and responsibility (Figs 7.2 and 7.3).
With regards to the perception about Black Sea health, of all individuals surveyed 33% felt
that it was healthy, 61% felt that is was not healthy, and 6% did not know. On a group by
group basis, the stakeholders tended to feel that the Black Sea was not healthy or there was
division within the groups. Those who felt that it was healthy were Fisheries agencies, social
welfare/public health ministry officials, labour ministry officials, the livestock industry,
141
harbour and port administrators and nature preserve staff. In other cases, there was no clear
agreement between members of the same stakeholder group (Table 7.1.)
Table 7.1
Stakeholder perceptions of the Black Sea
Do you think that
Are you
Do you consider
the Black Sea is
professionally or
the health of the
healthy?
economically
Black Sea to be
No
Divided
Yes
dependent upon the
your responsibility?
health of the Black
Sea?
All surveys combined
1. Water, Hydro-meteorological Department
2. Environmental Ministry62
3. Industry Ministry
4. Energy Ministry
5. Economic Ministry
6. Foreign Affairs Ministry
7. Defence Ministry
8. Internal Affairs Ministry
9. Agriculture Ministry
10. Fisheries Agencies
11. Social Welfare / Public Health Ministry
12. Labour Ministry
13. Public Administrator/ planning agency
14. Regulator agent official/ Enforcement agent
15. Shipping Agencies
16. Parliamentary committees63
17. Inter ministerial Committees/Basin Committees
18. Non Governmental Organization
19. Scientists
20. Manufacturing industry
21. Agro-industry
22. Live stock industry
23. Shipping industry
24. Fishing industry
25. Harbour/port administration
26. Regional government official
27. District water management official
28. Environmental Protection Agencies official
29. Municipal Government
30. Municipal waste manager
31. Nature reserve staff
32. Community based organization
33. Worker on a state owned farm
34. Worker on a privately owned farm
35. Fisherman small scale
36. Educator/teacher
37. Student
38. Public health care provider
39. Member of coastal community
40. Tourism/Recreation industry
41. Press and media
42. International Funding institutions.
62 Natural Resources, Ecology, Water or Environmental Ministry
63 Parliamentary committees for environmental protection
142
Do not
know
6%
Yes
33%
No
61%
Figure 7.1
Stakeholders' responses to the queston: "is the Black Sea healthy?"
Almost equal portions of stakeholders identified themselves as dependent and not dependent
on the health of the Black Sea (Fig. 7.2). Most individuals reported an indirect professional
or economic dependence on the health of the Black Sea. Within groups this division was
more varied within nearly half of the groups showing no clear agreement on this issue, as
delineated in Table 7.1. These findings suggest that it may be advisable to raise the profile of
the economic importance of the Black Sea health with regard to chemical pollution and
possibly biodiversity. Though this link is often difficult to clearly delineate, attention to
economic importance of the Black Sea may generate broader support for Black Sea
Commission activities.
s
30
der
ol
eh
20
ak
f
st
o
10
ge
a
r
cent
0
e
P
Not at all
Not
No
Yes
Yes
directly opinion indirectly directly
Figure 7.2
Stakeholders' assessment of their dependence on the health of the Black
Sea
In comparison to the dependence results, a large portion of respondents reported that they
feel either directly or indirectly responsible for the health of the Black Sea. (Fig. 7.3) This
may be a result of the polling venue itself, or of those stakeholders selection process,
however if verifiable this does bode well for the over all support for the project. In contrast
though there was not clear agreement within 40% of stakeholder groups of their overall
responsibility for the health of the Black Sea. It should be noted that most groups that feel
they are dependent on the health of the Black Sea also feel that they are responsible for it.
One very important exception is the tourism and recreation that strongly agreed that they are
dependent on the Health of the Black Sea, however they were divided in terms of the
responsibility for the health of it. This suggests that there may be a good point for a targeted
intervention for the tourism and recreation industry, at least, to help it take steps to avoid
negatively impacting the Sea.
143
40
e
r
s
l
d
o
30
eh
t
ak
f
s
20
e
o
g
t
a
10
en
r
c
e
0
P
Not at all
Not
No
Yes
Yes
directly
opinion indirectly directly
Figure 7.3
Stakeholders assessment of their responsibility for the health of the Black
Sea
Stakeholders were given a set of statements within the survey and asked to select their level
of agreement from: strongly disagree, disagree, neither agree nor disagree, agree, and agree
strongly. The responses were examined both as stakeholder groups and individual
respondents. They were asked questions pertaining to specific environmental issues, as well
as broader concerns impacting environmental management strategies. Responses regarding
the perceived trade-off between economic development and environmental health were
illuminating, as were responses pertaining to the need for environmental education and
support for regional cooperation.
In response to the question of the importance of economic development and environmental
protection stakeholders individually indicated that environmental health of the Black Sea is
important to them. A significant majority disagreed or disagreed strongly with the statement
that economic development now is more important than the environmental health of the
Black Sea region (Fig. 7.4). This bodes well for the future, but local opinion (at least) is
likely to much more strongly in favour of agreement if economic development substantially
increases employment or personal wealth.
Strongly
agree
1%
Agree Strongly
12% disagree
Neither
27%
16%
Disagree
44%
Figure 7.4
Stakeholders' responses to the statement: "economic development now is
more important than the environmental health of the Black Sea region"
This paradox is refelected in responses to the statement: `most other people believe that
meeting short term economic needs is more important than long term environmental
concerns', with 50% of individual respondents agreeing (Fig. 7.5). This suggests that
stakeholders may be dubious of the ability to meet economic needs while protecting the
ecology/state of health of the Black Sea. This may also suggest that people are more willing
144
to say they believe that other people seem to value economic issues more than environmental
issues, rather than admit to this themselves. It is interesting to note that of all stakeholders
surveys less than a dozen agreed more strongly with the statement: `economic development
now is more important than environmental health of the Black Sea region', than the
statement: `most other people believe that meeting short term economic needs in more
important than long term environmental concerns.' This suggests that people are concerned
about the environment individually, but feel that overall there should be stronger levels of
support for environmental issues across the region.
Strongly
Strongly
agree
disagree
12%
5%
Disagree
20%
Agree
38%
Neither
25%
Figure 7.5
Stakeholders' responses to the statement: "most other people believe that
meeting short term economic needs is more important than long term
environmental concerns"
This supposition is supported by the responses to the statement: `if people know more about
the causes of environmental problems they would want to make changes to improve it'.
Individually, 80% of stakeholders were in agreement, with 34% in strong agreement. In
comparison, only 6% disagreed and 1% disagreed strongly (Fig. 7.6). This suggests that
there is a strong need for environmental education that clearly links cause and effects of
environmental problems, and details actions individuals can take to make improvements in
conditions. The strong level of agreement spanned all countries throughout the region and all
stakeholder groups.
Strongly
Disagree
disagree
6%
1%
Neither
Strongly
13%
agree
34%
Agree
46%
Figure 7.6
Stakeholders' responses to the statement: "if people knew more about the
causes of environmental problems they would want to make changes to
improve it"
There is strong support for regional cooperation in the Black Sea region. There was very
strong agreement from stakeholders in response to the statement: `regional cooperation of
145
countries around the Black Sea can improve conditions in my community' (Fig. 7.7). While
the statement does not refer specifically to environmental issues, the strong support from all
stakeholder groups and all countries suggests that there is awareness among stakeholders of
the importance of increased cooperation throughout the region, and the benefits it can bring
to communities.
Disagree
Strongly
1%
disagree
0%
Neither
12%
Strongly
agree
42%
Agree
45%
Figure 7.7
Stakeholders' responses to the statement: "regional cooperation of
countries around the Black Sea can improve conditions in my
community"
The findings suggest that there is a strong foundation for further investments to
maintain/improve the status of the Black Sea, based the overall concern and willingness of
stakeholders to support such activities. While these portend well for the future, the actual
awareness and understanding of cause and effect relationships should be elucidated so that
stakeholders have a clearer understanding of the role they play in specific issues. The
sections below outline stakeholder priorities and perceptions of the major transboundary
issues dealt with in Section 4.
7.3
Priority issues for stakeholder groups
Stakeholders were asked to list priorities as highest to lowest for the four major issues
addressed in this TDA. The priorities are presented by all surveys combined, and then by
specific groups. Overall the highest priority issue was chemical pollution by a significant
margin. All groups listed this as a high to medium priority, with the exceptions of the
Environment Ministry stakeholder group and the Agro-industry stakeholder group. Further,
only minor difference are found amongst the ranking priorities of different Environmental
Ministries respondents. Agro-industry repondents prioritized nutrient over-enrichment as the
most important issue, again with limited variation between the rankings provided by
individual respondents.
146
Lowest
Low
1%
3%
Medium
14%
Highest
50%
High
32%
Figure 7.8
Stakeholders' prioritisation of `pollution' as a transboundary issue
The second highest priority for all stakeholders was decline in fisheries (Figure 7.9). Though
there was more variation in this among stakeholders than the concern about pollution, the
average stakeholder ranked this as high level concern, though not the top priority. Many
groups also listed this as a higher level priority, though Defence Ministry officials, planners,
regulators, shipping industry, nature preserve staff, students, and public health care providers
all ranked this as a low priority concern. Small scale fishermen rank this as their top priority
by a significant margin.
Lowest
2%
Low
7%
Highest
30%
Medium
24%
High
37%
Figure 7.9
Stakeholders' prioritisation of `decline in fisheries resources' as a
transboundary issue
The third ranked priority of all stakeholder groups is the habitat and biodiversity changes
(Fig. 7.10). This was ranked at the top priority concern by Defence Ministry officials,
planners, regulators, parliamentary committees for environmental protection, and nature
reserve staff. These results are as expected for these groups, and may indicate a positive
trend for habitat conservation, especially as planners and regulators view this as a high-level
concern. In turn, this may indicate a willingness towards tighter regulation of harmful
activities in sensitive areas.
147
Lowest
2%
Low
Highest
12%
22%
Medium
29%
High
35%
Figure 7.10 Stakeholders' prioritisation of `changes in biodiversity' as a
transboundary issue
The lowest priority concern among all combined stakeholders is nutrient over-
enrichment/eutrophication (Fig.7.11). This may be as a result of lower levels of awareness of
information or weaker understanding of the implications of this problem for the Black Sea
ecosystem. Only the agro-industry and fishery industry ranked this as a top priority concern.
The average agro-industry responses were driven by Romanian surveys where this issue may
have greater traction than in other countries less immediately impacted by this issue. Agro-
industry respondents may have been exposed to awareness raising issues arising from
Romanian EU accession.
Lowest
3%
Highest
Low
15%
15%
Medium
High
28%
39%
Figure 7.11 Stakeholders' prioritisation of `eutrophication' as a transboundary issue
The full priority rankings for all surveys combined and by indvidual stakeholder group are
presented in Table 7.2.
7.4 Nutrient
over-enrichment/eutrophication
Though few stakeholders ranked nutrient over-enrichment as a priority concern, there is a
considerable amount of awareness of this as an issue as it impacts the Black Sea, but
probably less awareness of the implications. The perceptions of cause and effects of nutrient
over-enrichment and eutrophication appear to be based in economic interests generally, with
groups who benefit from current status quo advocating a continuation of practices, and those
who are impacted by the problems it creates supporting a change. All stakeholder groups
expressed an explicit concern about sewage and animal waste in the Black Sea.
148
Table 7.2
Stakeholder group priorities
1st priority
2nd priority
3rd priority
4th priority
Nutrients Fisheries Pollution
Biodiversity
All surveys combined
1. Water, Hydro-meteorological Department
2. Environmental Ministry64
3. Industry Ministry
4. Energy Ministry
5. Economic Ministry
6. Foreign Affairs Ministry
7. Defence Ministry
8. Internal Affairs Ministry
9. Agriculture Ministry
10. Fisheries Agencies
11. Social Welfare / Public Health Ministry
12. Labour Ministry
13. Public Administrator/ planning agency
14. Regulator agent official/ Enforcement agent
15. Shipping Agencies
16. Parliamentary committees65
17. Inter ministerial Committees/Basin Committees
18. Non Governmental Organization
19. Scientists
20. Manufacturing industry
21. Agro-industry
22. Live stock industry
23. Shipping industry
24. Fishing industry
25. Harbour/port administration
26. Regional government official
27. District water management official
28. Environmental Protection Agencies official
29. Municipal Government
30. Municipal waste manager
31. Nature reserve staff
32. Community based organization
33. Worker on a state owned farm
34. Worker on a privately owned farm
35. Fisherman small scale
36. Educator/teacher
37. Student
38. Public health care provider
39. Member of coastal community
40. Tourism/recreation industry
41. Press and media
42. International funding institutions
The perceptions of organic wastes from livestock sources impacting the Black Sea and
contributing to eutrophication varied. NGOs and public health care providers strongly agreed
that there is an impact. Economic ministry officials, parliamentary committee for
environmental protection representatives, district water management, nature reserve staff,
64 Natural Resources, Ecology, Water or Environmental Ministry
65Parliamentary committees for environmental protection
149
and tourism and recreation industry officials also agreed. There was, however, a division
between agricultural ministries, with Romanian and Russian officials agreeing and Bulgarian
and Georgian officials disagreeing about the impact of livestock waste on the Black Sea. In
the livestock industry Romanian respondents tended to agree while Russians and Bulgarians
disagreed. There was disagreement from regional government officials and international
funding organizations with regards to pollution from animal farming having a significant
impact on the Black Sea. This variation among groups may be a matter of outreach and
national priorities, as well as economic interests. In comparison to livestock wastes having
impacts, there was overall agreement from all stakeholder groups that municipal waste is a
significant problem for the health of the Black Sea.
The perception of other nutrient sources, specifically from agriculture activities appears to be
more based in economic issues. In response to the statement: `it is difficult to enforce current
regulations on agro-chemicals use,' all groups agreed with medium to low level agreement
that enforcement is difficult.
In contrast, in response to the statement: `fertilizer use on land causes problems the Black
Sea,' there was division within agricultural ministries with Georgian and Bulgarian officials
disagreeing, while others agreed strongly. There was also internal division within the agro
industry, livestock industry and disagreement from farm worker stakeholder groups in
response to this statement. This suggests that the perception of cause and effect relationships
between fertilizers and eutrophication should be more clearly delineated for these groups.
When asked if current agricultural practices are sustainable for the environment (Fig. 7.12),
most stakeholders did not feel that they were, with strongest dissention from economic
ministry officials, environmental protection agents, public health care providers and
international funding organizations. Agricultural ministry officials are extremely divided
across all countries. However, labour ministry officials and farming industry representatives
felt that current practices are not environmentally sustainable, and 30% neither agreed nor
disagreed. Only 23% of all stakeholders surveyed agreed that current agricultural practices
are sustainable. This suggests that while the groups listed above were more cohesive in their
views, there is an overall awareness that agricultural practices are not beneficial to the
environment.
Strongly
Strongly
agree
disagree
3%
8%
Agree
20%
Disagree
39%
Neither
30%
Figure 7.12 Stakeholders' responses to the statement: "current agricultural practices
are sustainable for the environment"
This mirrors responses to the perceived need to use agro-chemicals to product needed food.
The agricultural ministries, fisheries agencies, fishing industry, manufacturing industry,
agro-industry, livestock industry, regional government officials, farm workers, and tourism
150
industry agreed that agrochemicals were necessary, while there was division within the
internal affairs ministries, social welfare/public health ministries and nature preserve staff.
There was disagreement that agrochemicals are required from public administrators, and
parliamentary committees for environmental protection, public health care providers and the
press. This may be because these groups have access to different information about
alternative farming practices.
Again, farm workers felt that environmentally safe farming practices would limit economic
opportunities, while international funding organizations, nature preserve staff, NGOs,
parliamentary committees, and labor ministry officials disagreed. There was wide variation
among agricultural ministry officials in response to this, with no discernable trend from
country to country. There was a trend towards disagreement among all other groups.
This suggests that stakeholders who are most responsible for activities leading to nutrient
over-enrichment are either unaware of the impacts or do not feel that it is appropriate to
admit being at fault for these problems. It may be advisable to develop strategies to reduce
impacts while also increasing awareness and economic viability of alternative practices.
7.5
Decline in commercial fish species/stocks
The decline in commercial fisheries (including specific species and total stocks) is an
important issue for many stakeholders. The survey revealed stakeholder group opinions
about the abundance of fisheries, causes of overfishing and market demands, and perceptions
about legal mechanisms for management. Overall, the divison among stakeholder groups
regarding fisheries is largely due to either economic divisions Ł those who have economic
interests in fisheries and those who do not - or information access issues between those who
have access to information about fisheries and those who do not. Overcoming this divide
may be a worthwhile target for the future.
When asked about the abundance of fish in the Black Sea, and whether there are enough fish
for everyone who wants them, there was agreement from the national shipping companies (or
administrative or executive agencies) and farm workers. In contrast there was disagreement
from agricultural ministry officials, fisheries Ł national company/administration/executive
agencies, social welfare/ public health ministries, labor ministry officials, regulatory
agencies, parliamentary committees, NGOs, scientists, environmental protection agents,
municipal waste managers, nature preserve staff, small scale fishermen, public health care
providers, members of coastal communities, press and media, and international funding
institutions. The shipping industry and fishing industry did not have strong views one way or
the other. This suggests that those who are economically involved in harvesting Black Sea
stocks are either unwilling or unable to suggest that there are not enough fish available, while
those who are exposed to alternative information or the impacts of over-fishing have a view
of declining fisheries. The exception to this is the small-scale fishermen who are likely to be
most directly impacted by declining stocks and therefore they do not agree that there are
enough fish available.
Similarly, stakeholders were asked about why over-fishing occurs, with the statement:
`people take more fish because they need to, not because of greed.' Those who agreed were
from the economic ministry, foreign affairs ministry, agricultural ministry, fisheries -
national company/administration/ executive agencies, shipping companies and the agro-
industry. There was strong agreement particularly from fisheries industries, small-scale
151
fishermen and residents of coastal communities. Alternatively, there was disagreement from
the, internal affairs ministry, public administration planning agency, district water
management officials, municipal waste managers, public health care providers, and
international funding organizations. It is possible that those who disagreed have had more
access to information on overfishing and are sensitive to the increased commercialization of
fishing, as well as the challenges of regulating the fisheries, while those that disagree are
more sensitive to the immediate demands for access to fish, especially small-scale fishermen
and coastal community members.
Nonetheless there was a consensus among all stakeholder groups that steps should be taken
to increase fish stocks in the Black Sea. However, in terms of preserving some species,
national shipping companies and agencies, the shipping industry and fishing industry
representative felt it was more important to meet market demand now, though there was
division within each of these groups. All other groups including small scale-fishermen and
those from national fishery organizations disagreed, and felt that preserving species was
more important. While there was division within groups, overall there was disagreement
from 73% the individual stakeholders surveyed that market demand is more important than
preserving some species, while only 12% agreed (Fig. 7.13).
Strongly
agree
3%
Agree
9%
Strongly
disagree
Neither
15%
31%
Disagree
42%
Figure 7.13 Stakeholders' responses to the statement "meeting market demand for
fish now is more important than preserving some species"
In terms of regulatory mechanisms, there was agreement among all stakeholders with the
statement: `I support stronger enforcement of fisheries regulations than we currently have.' It
should be noted that agreement with this statement by the fisheries industry was notably
weaker than others, though was still supportive.
The statement: `international agreements on fishing in the Black Sea could be unfair to some
users' was supported by NGOs and small-scale fishermen, while foreign affairs ministry
officials disagreed. This is probably because of a perception among NGOs and small-scale
fishermen that their interests would not be addressed by such agreements, which would
favour larger commercial interests instead. Alternatively, foreign affairs ministry officials
who are often responsible for drafting such agreements, probably feel that it is their
responsibility to ensure equitable use whenever possible.
The fisheries concerns were not especially divisive among stakeholder groups. Anticipated
responses among various groups emerged, with the possible exception of more acute concern
about preserving species and the need for insuring fair access among small scale fishermen.
This suggests that it may be important to include small-scale fishmen as a key stakeholder
152
group in the future, as well as to increase opportunities for dialogue among those with
intrinsic interests in preserving species and those with economic interests in continuing
current fishing practices.
7.6
Chemical pollution (including oil)
The threat of chemical pollution, including oil ranked as the highest priority concern for
stakeholders as a whole (Fig. 7.14). The prioritization of this issue suggests that the
awareness level of chemical pollution is quite high and the causes are more clearly
understood than other issues addressed in Section 4.. Further, the image of oil spills spoiling
shores and threatening wildlife has a much more visceral visual impact than declining
biodiversity or nutrient enrichment. As a result, people may be inclined to associate
environmental degradation with such events, and may believe that the over all condition in
the Black Sea is because of pollution, whereas understanding the cause and effect
relationships of other sources of environmental/economic degradation are less accessible to
the general population. The over all perception of most stakeholder groups surveyed suggests
that this perception is common across most stakeholder groups. The individual stakeholders
surveyed shows that 81% ranked oil pollution as a high level concern.
Strongly
Disagree
disagree
5%
1%
Neither
Strongly
13%
agree
37%
Agree
44%
Figure 7.14 Stakeholders' responses to the statement:"oil pollution in the Black Sea is
a high level of concern"
All groups agreed with the statement that `oil pollution in the Black Sea is a high level
concern.' This supports earlier findings of the high prioritization of pollution among
stakeholder groups reflected in Table 7.2. In terms of oil pollution, it appears that this is the
most prevalent perceived cause of pollution of the Black Sea. However, industrial waste is
also a concern. All groups disagreed that industrial wastewater treatment facilities work well
at the current time, and therefore these are perceived to be polluting the Black Sea waters.
There was a discrepancy between groups regarding the impacts of aging ships and poor
maintenance having negative impacts on the Black Sea waters. All groups except those in the
national shipping companies/agencies, shipping industry and the fishing industry felt that the
perceived deteriorating condition of ships caused problems in the Black Sea. This again
would be expected as they would be the two groups most likely to be contributing to these
problems. It is likely that these groups would prefer not to perceive themselves as
responsible for negative impacts on the ecology of the Black Sea.
153
In comparison, all stakeholder groups agreed that if new technologies were used there would
be less pollution in the Black Sea. This suggests that people are aware that declining
conditions and outdated technologies are responsible for the decline in Black Sea conditions
(Section 4.4.4). This also reflects a common belief that there are technological fixes to
environmental problems.
For methods to improve the conditions of the Black Sea, people consider that government
should be the primary means to schieve this. All stakeholder groups agreed that there would
be less pollution if enforcement was stronger and fines were higher for polluters, though the
manufacturing industry was only in very weak agreement. However, it should be taken into
account that individual groups generally are inclined to suggest that other groups are
responsible for pollution, rather than themselves. For example all groups agreed that
monitoring and enforcement of ship activities should be regulated more strongly, though the
harbor and port administrators and national shipping companies/agencies did not support this
as enthusiastically as other groups did. Similarly, all groups supported the statement that
`activities in harbors should be strictly regulated' but, again, shipping industry and port and
harbor administers did not agree with the same level of support as other groups.
This trend is also reflected in the issues pertaining to nutrient loading. It suggests that it will
be important not to assign blame to particular groups, but to target activities towards helping
them to shift their current practices to more environmentally sustainable approaches.
7.7
Habitat and biodiversity changes (including alien
species introduction)
The issue of habitat and biodiversity changes is the third priority concern of all combined
stakeholders, after pollution and decline in fisheries. The issue draws more attention from
groups who have a degree of expertise in ecological issues or are immediately impacted by
the changes which have occurred in recent times. There was a high level agreement over the
need to conserve natural conditions; however, there did not appear to be a high level of
understanding of the mechanisms that may support this.
With regard to a significant threat to biodiversity changes in the Black Sea Ł invasive
species, stakeholders with access to ecological information and impacted by these were
much more familiar with the issue than the broader stakeholder population. In response to
the statement: `new or unfamiliar creatures are in the water of the Black Sea,' those in
agreement were from: Natural Resources, Ecology , Water or Environmental Ministry;
Fisheries National Company/ Administration/Executive Agencies; Shipping National
Company/ Administration/Executive Agencies; Parliamentary committees for environmental
protection; NGOs; Scientists; Shipping industry ; Fishing industry; Environmental Protection
Agencies official; and Nature reserve staff groups; Fisherman small scale; and, Public health
care providers. In contrast those who disagreed with this statement were from International
Funding Institutions and the Tourism/Recreation industry. This disagreement may be
because a lack of access to information, or the perception that their economic livelihood
could be impacted, in the case of tourism/recreation industry representatives.
In contrast, all groups agreed with the statement: `I no longer see some animals in and
around the Black Sea which were there 20 years ago.' Yet again, those with access to more
ecological information agreed more strongly.
154
Is terms of habitat conservation there was a discrepancy between stakeholder groups that
again mirrored the trends noted above. In response to the statement: `oastal development is
good for the Black Sea environment,' there was strong agreement from the economic
ministry, industry ministry stakeholder groups. In contrast, National fisheries
companies/agencies, regulator agent official/ Enforcement agent, NGO, shipping industry,
Environmental Protection Agencies official, Nature reserve staff, Fisherman small-scale,
Public health care provider, Press and media, and International Funding Institution
Stakeholder groups disagreed strongly. Yet, in response to the statement: `the tourism
industry needs a clean environment to be profitable,' all groups agreed strongly.
The protection of habitats and conservation of biodiversity appears to be an issue of
importance to groups that are invested in ecosytemic approaches to environmental
management, or who have access to scientific information, in comparison to those groups
who are less informed and less likely to be directly impacted by these changes. It may be
advantageous to increase information flow to these groups, increasing the relevance of
habitat protection and biodiversity conservation to non-specialists groups. There are initial
signs that groups are moving in this direction but educational efforts should be fostered
where possible, especially to stakeholder groups mediating these changes.
7.8
Summary and preliminary recommendations
In summary, the stakeholder analysis demonstrates two very important issues: first, that
overall stakeholders feel a level of connection to the health of the Black Sea that should be
nurtured through increasing awareness of causes and effects of environmental issues; and
second, that stakeholder groups tend to be divided along economic interests when it comes to
a perceived tradeoff between economic and environmental priorities. These two major
findings suggest that a strategy of stakeholder involvement that focuses on education and
awareness specific to individual stakeholder groups, in combination with increasing the
awareness the economic benefits of environmental stewardship should be considered for
future activities in the Black Sea. Stakeholder appear to be ready and willing to accept the
information, and over all they appear to willing to consider alternative practices, if these are
presented in a clear and logic manner that will not significantly hamper their economic
conditions. Specific actions may include the following recommendations:
Ę Develop focused stakeholder involvement strategies for livestock industry and port
and harbor administrators to help them recognize and remedy actions that adversely
impact the Black Sea ecosystem.
Ę Target activities towards helping groups to adjust their current practices to more
environmentally sustainable approaches, in all areas and issues.
Ę Increase outreach efforts that emphasize the importance of biodiversity and habitat
conservation.
Ę Target efforts to inform stakeholder groupss about nutrient loading and
eutrophication, and provide alternative approaches to current waste water and
nutrient management practices.
Ę Develop an outreach programme that includes stakeholders from all fisheries sectors
to take steps towards addressing the causes of over-fishing.
Ę Develop targeted interventions for the tourism and recreation industry to help it to
take steps to avoid negatively impacting the waters of the Black Sea.
155
Ę Develop an outreach component for the BS Commission that links the economic
well-being of the region with the health of the Black Sea.
156
8.
CONCLUSIONS AND NEXT STEPS
8.1 Conclusions
Ę The four transboundary problems of nutrient-enrichment, changes in marine living
resources, chemical pollution and biodiversity/habitats change are all very closely
linked by the immediate and underlying causes.
Ę The Danube is clearly the single largest source of entry of both freshwater and
pollutants to the Black Sea. Close cooperation between the ICPDR and the BSC is
central to tackling the transboundary problems of the Sea.
Ę River pollution loads far exceed those of direct municipal/industrial sources.
Ę Available data suggest that atmospheric deposition could be an entry pathway for a
similar load of nitrogen to that transported by rivers. However, there is considerable
uncertainty over this assessment.
Ę Considerable progress has been made since the 1996 TDA was produced (e.g. the
reduction of river-borne nutrient loads by some 30%), but environmental
improvements have primarily been brought about by a collapse in agricultural
productivity and a decline in manufacturing industry, rather than direct government
interventions.
Ę However, the Sea is slow to respond to changes in nutrient (and other pollutant)
loads. It will be many years before the reduced river loads are likely to be reflected in
the Sea itself.
Ę Indicators suggest that a regional decline in the agricultural sector appears to have
`bottomed-out'. The sector is in a weak state, but is still a major employer in all
countries. Agricultural polices need to be strengthened (and legislation enforced) to
ensure that as the sector recovers, pollutant emissions can be more effectively
managed.
Ę In terms of nutrient pollution, livestock farming probably represents a higher priority
to tackle than arable farming. Nutrients need to be applied to land when crops are
able to utilise them, so over-winter storage facilities for livestock manure/slurry is
essential if this source of nutrients is to be tackled. In effect, this requires farms to
have storage facilities for atleast 6 months of manure/slurry production.
Ę The harvesting of commercial marine living resources appear to have increased, but
whether the situation has improved or not since 1996 is really not known. Reported
fish landings are now about half of what they were in the 1980s.
Ę Agreed regional stock assessment methodologies, improved collection of statistics on
fish stocks/landings and a regional legally-binding document on fisheries should be
viewed as priorities. At a regional level, values for sustainable catches/landings of
commercial marine living resources remain unknown.
Ę Fisheries management presents serious challenges for all countries, but perhaps the
greatest challenge will be for Turkey, which has (by far) the largest fishing fleet and
greatest number of nationals employed in this industry.
Ę The emphasis of chemical pollution assessment should be on point source loads and
sediment/body burden monitoring within the marine environment. Local
investigations are key to understanding sources of pollution.
Ę It is difficult to assess the scale of chemical pollution within the Sea: extremely high
values of some pollutants have been identified, but these tend to be localised. Levels
of some pesticides in particular give cause for concern, but much greater attention
needs to be paid to quality assurance of POP analyses. The development of
157
harmonised regional environmental quality standards, emission limit values and a
regional priority pollutants list should help provide more focus for what is potentially
a difficult and expensive problem to assess/manage.
Ę There is now an increased risk of pollution from shipping and offshore oil/gas
installations. A single large-scale accident could have devastating consequenses for
the whole region.
Ę Good habitat status is a critical to maintaining high levels of biodiversity within the
Black Sea. All 5 habitats within the coastal margin ecotones category are considered
to be in a critical status in at least one country; both types of benthic pelagic habitat
(neritic and open sea) are considered critical in at least one country; and 13 of 37
types of benthic habitat are considered to be critical in at least one country. Those
most at risk include neritic water column, coastal lagoon, estuaries/delta and coastal
wetlands/saltmarsh habitats. The designation of additional Marine Protected Areas is
required to protect these habitats.
Ę The number of alien species introductions has continued unabated since the original
Black Sea TDA was written. Little has been done to tackle the two most important
vectors of alien species introduction: shipping and aquaculture.
Ę Biodiversity, particularly in the NW shelf has improved greatly as the area affected
by hypoxic conitions has dramatically reduced. Low dissolved oxygen conditions still
remain a potential problem in parts of the NW shelf, but hypoxic events are now less
severe and less frequent than they once were. However, the area in front of the
Dniester River remains a cause for concern.
Ę Biodiversity in the Black Sea is often considered in terms of pre- and post-
Mnemiopsis invasion time-scales.
Ę The impacts of the Beroe ovata insasion during the 1990s are unclear. Some
authorities consider that the Mnemiopsis threat to fish catches is very much reduced
as a consequence of this [it clearly is, but the extent of reduction is not clear], while
others are more cautious. However, the 4-years (or thereabouts) cycle of Mnemiopsis
biomass/abundance, compared with the strong seasonl growth dynamics of Beroe
mean that Mnemiopsis is very unlikely to be eradicated from the Black Sea; only
controlled to some level.
Ę The original Black Sea SAP was over-ambitious in its aims, due to its focus on point
source emissions to the Sea. Of the 50 hot-spots identified for capital investment
from the 1996 TDA, only 12 of these investments have been completed and there are
either no, or only partial plans to tackle over half of the originally identified priority
point sources of pollution.
Ę The emphasis of the next SAP should be broadened to include diffuse sources of
chemical (including nutrient) pollution.
Ę The issue of cost-effectiveness in tackling transboundary issues needs to be tackled
robustly. There are clear governmental costs associated with capital investments
required to tackle point sources, but for diffuse source pollution the costs may be
borne largely by farmers. For example, the costs for introducing/enforcing an
agricultural soil nutrient testing programme could be recouped by farmers from
savings made in reduced inorganic fertilser application rates.
Ę The establishment of the Black Sea Commission and its Permanent Secretariat should
have been identified as a "call to arms" by coastal country governments to tackle the
transboundary issues faced and caused by the Sea, but national support to the
Commission (outside of the fees paid to support the Permanent Secretariat) has been
weak in some cases, weakening its progress.
158
Ę The Commission is over-burdoned, having too many roles/tasks for the resources
(financial and staffing) available to it. Either its priorities need to be re-defined
(narrowed) or the resources available to it enhanced.
Ę One of the Commission's most important tasks should be the collation and analysis
of data from the six coastal countries to support national and international
investments to tackle the transboundary problems of the Sea.
Ę The BSIMAP remains underfunded or poorly coordinated at national level by
Bulgaria, Georgia and Ukraine at least. The recent (2005) expansion of the Turkish
BSIMAP programme represented a substantial step forward, but while the number of
Turkish monitoring sites has increased dramatically, the chemical monitoring
frequency at these sites remains only twice per year, compared to four times per year
in other national BSIMAP programmes. A great deal of coastal water monitoring is
clearly undertaken in Russian coastal waters, but relatively little of this national data
is made available to the Commission.
Ę Biological monitoring of the Black Sea, particularly in terms of zoobenthic
communities has taken a considerable step forwards with the production of regional
methods manuals and pilot monitoring exercises, but a re-assessment of the existing
BSIMAP monitoring sites in terms of the selection of appropriate monitoring and
reference sites is required if this programme is to be considered truly "integrated".
Ę National cooperation between different institutes and ministries responsible for Black
Sea regulation/monitoring requires improving in most countries, with issues of data
ownership restricting access to government-funded data collection exercises.
Ę EU Accession has provided an enormous stimulus to Bulgarian and Romanian
responses to Black Sea environmental issues, and is begining to have a similar effect
on Turkish funding/willingness to more effectively tackle some of the Sea's
transboundary problems.
Ę Examples are given throughout this document where reported data are either
incompatible, missing or highly innaccurate. These issue need to be addressed as a
matter of urgency. National reporting to the Black Sea Commission Permanent
Secretariat has been of highly variable quality.
Ę There is an encouraging willingness amongst stakeholders to help address the
problems faced by the Sea. However, information on the transboundary problems,
causes and consequences is not being sufficiently well passed on to allow action to be
undertaken.
8.2 Next
steps
Issues to be considered in the follow-on SAP include:
Ę Identification/designation of further Black Sea MPAs.
Ę Agricultural pollution/management (focus initially on livestock farming, but
development of a soil nutrient testing programme for arable farming should also be
considered)
Ę Improving regional development of guidance/enforcement of BAT/GAP regulations.
Ę A re-assessment of pollution hot-spots.
Ę Further assessment of atmospheric nitrogen loads to the Sea
Ę A re-assessment of priorities for the BSC Permanent Secretariat.
Ę Development of a code of practice for data handling for use by the Permanent
Secretary and national reporting bodies
Ę Comparison of national standards for industrial discharges to sewer.
159
Ę Harmonisation of national emission standards and marine environmental quality
standards.
Ę Development of a regional list of priority pollutants.
Ę Greater consideration of the Black Sea as a receiving waterbody when setting
emission limit values for point source discharges to river.
Ę Improved actions to tackle the two primary vectors of alien species introduction:
shipping and aquaculture.
Ę Stricter enforcement of existing national environmental legislation.
Ę Greater focus on outputs of the BSC Advisory Groups.
Ę Greater emphasis on the development of a regional legally-binding document on
fisheries.
Ę Development of a regionally agreed system to match fishing effort to stocks
(prohibition periods, minimum admissible fish length, etc).
Ę Harmonisation of methodologies for the collection and collation of fisheries statistics
at a regional level
Ę Establishment of regionally agreed national fishing zones in all Black Sea countries
Ę Prohibition of non-sustainable fishing technologies (notably dragging and bottom
trawling).
Ę Improving steps to prevent illegal fishing practices.
Ę Regional harmonisation of ICZM policies and practices.
Ę Provision of assistance to industrial sectors (including mining enterprises) to develop
Environmental Management Systems and practice cleaner production activities
Ę Regular re-evaluations of major marine systematic (biological) groups in each of the
BS countries, using the latest IUCN criteria and guidelines.
Ę Development of a habitat- and ecosystem- oriented approach to biodiversity
management.
Ę Creation of a Black Sea Red Book of Habitats, Flora and Fauna
160
REFERENCES
Abaza, V. and Sburlea, A. (in press). Actual structure of the fauna associated to some
macroalgae species from the Romanian Southern littoral, Ann. Sci. of DDNI, Tulcea..
Anon (2006) Trends in nutrient loads from the Danube River and trophic status of the Black
Sea. Extended version of a briefing note originally provided to GEF Council on 6 June 2006.
Paper provided for the 5th Regional Conference on Nutrient Pollution Control in the
Danube-Black Sea Basin, October 3 Ł October 6, 2006. Chisinau, Moldova.
Bacescu, M., Muller, G.I. and Gomoiu M.T. (1971) Ecologie Marina, vol. 4 - Cercetari de
ecologie bentala in Marea Neagra. Ed. Acad. R.S.R., Bucuresti, 357 p
Belan, V. (2005) Pollution of Russian Federation Black Sea coastal waters with livestock
biogenic and organic substances. Report to the UNDP-GEF Black Sea Ecosystem Recovery
Project.
Billen G., Lancelot C. and Meybeck M., (1991) N, P, and Si retention along the aquatic
continuum from land to ocean. In: F.F.C. Mantoura, J.M. Martin and R. Wollast (eds) Ocean
Margin Processes in Global Change, pp 19-44. John Wiley and Sons Publishers.
Bologa, A.S. and Sava, D. (in press) Progressive decline and present trend of Romanian
Black Sea macroalgal flora. Cercetari marine Ł Recherches marines, Constanta.
Dumitrache, C. and Abaza, V. (2004) The present state of benthic communities in the
Romanian coastal waters. Cercetari marine, INCDM, 35, 61-75.
Dumitru, M. (2005) Romanian livestock assessment. Report to the UNDP-GEF Black Sea
Ecosystem Recovery Project.
EEA (2006) The changing faces of Europe's coastal areas. EEA report No. 6/2006. European
Environment Agency, Copenhagen.
Friedrich, J. (2007) Benthic process studies: data report on "benthic nutrient fluxes and
sediment geochemistry". Report on the 2006 BSERP research cruise of the Black Sea North
West Shelf.
Galasiu, L., Chiriac, G., Lungu, A., and Constantinescu, M. (2003) Aprecierea starii
ecologice a fluviului Dunarea pe baza fitoplanctonului, componenta a sistemului de
biomonitoring. Un mediu pentru viitor, Ed. Promotal, Bucuresti: 65 Ł 69. (In Romanian.)
Gomoiu, M.T. (1969) Studiul sedimentelor nisipoase de la litoralul romanesc al Marii Negre.
Ecologie Marina, III, Ed. Acad. R.S. Romania: 227-325 (In Romanian, English summary.)
Kamburska L., Doncheva, V. and Stefanova, K. (2003a) On the recent changes of
zooplankton community structure along the Bulgarian Black Sea coast Ł a post invasion
effect of exotic ctenophores interactions. Proceedings of First International Conference on
Environmental Research and Assessment, Bucharest, Romania: 69-85.
161
Kamburska L., Moncheva, S., Konsulov, A., Krastev, A., and Prodanov, K. (2003b) The
invasion of Beroe ovata in the Black Sea - why a warning for ecosystem concern? In:
Oceanology, IO-BAS, 4, 111-124.
Kamburska, L. (2004) Effects of Beroe cf ovata on gelatinous and other zooplankton along
the Bulgarian Black Sea coast, NATO ASI Series "Aquatic invasions in the Black, Caspian,
and Mediterranean Seas", H. Dumont et al. (eds.), Kluwer Academic Publishers: 137-154.
Kideys, A. E. (2002) Fall and rise of the Black Sea ecosystem. Science, 297, 1482-1484.
Konsulova, T., Tasev, V., Todorova, V. and Konsulov A. (2003) The effect of bottom
trawling on mussel beds along the Bulgarian Black Sea coast. Proceedings of the "Second
international conference Oceanography of the Eastern Mediterranean and Black Sea:
Similarities and Differences of Two Interconnected Basins", 14-18 October 2002, Ankara,
Turkey: 888-896.
Konsulova, T., Todorova, V. and Nikolov, V. (2006) Evolution of mussel cultivation along
the Bulgarian Black Sea Coast: case study. Presentation made at the 1st Biannual Scientific
Conference "Black Sea Ecosystem 2005 and Beyond", 8-10 May 2006, Istanbul, Turkey.
Kroiss, H. et al (2005) Nutrient management in the Danube Basin and its impact on the
Black Sea. DaNUbs final report EVK-1CT-2000-00051. Section 6: Detailed Report.
Kucheruk, N.V. (2006) Macrozoobenthos of North Caucasian coast: influence of pelagic and
benthic alien species. Presentation made at the 1st Biannual Scientific Conference "Black
Sea Ecosystem 2005 and Beyond", 8-10 May 2006, Istanbul, Turkey.
Lagidze, T. (2005) Livestock numbers and potential nutrient/organic loads to the Black Sea
(Georgia). Report to the the UNDP-GEF Black Sea Ecosystem Recovery Project.
Mee, L., Friedrich, J. and Gomoiu, M.-T. (2005). Restoring the Black Sea in times of
uncertainty. Oceanography, 18 (2): 100-111.
Mee, L. (2006) Research Cruise BSERP-06. Preliminary Cruise Report. Summary version.
Micu, D. and Micu, S. (2006) Recent records, growth and proposed IUCN status of
Donacilla cornea (Poli, 1795) from the Romanian Black Sea. Cercetari Marine Ł
Recherches Marines, 36, 117-132.
Milchakova, N.A. (2003) The macrophytobenthos. In: Modern condition of a biodiversity of
coastal waters of Crimea (the Black Sea sector), Sevastopol: 152-208.
Minicheva, G. (2004) The floristic composition of Zernov's Phyllophora Field. Data material
of cruse "Academic" September-October 2004, Project "Black Sea ecosystem recovery"
(unpublished data).
Minicheva, G. (2005) Historical trends in benthic communities of the north-western shelf of
the Black Sea. The algae community of genus Phyllophora. Final Report to Control of
eutrophication, hazardous substances and related measures for rehabilitating the Black Sea
ecosystem: Phase 2.
162
Minicheva, G. (2006) State of seaweeds community of the Ukrainian sector of Black Sea.
Presentation made at the 1st Biannual Scientific Conference "Black Sea Ecosystem 2005 and
Beyond", 8-10 May, 2006, Istanbul, Turkey.
Monaghan, E.J. and Ruttenberg, K.C. (1999) Dissolved organic phosphorus in the coastal
ocean:Reassessment of available methods and seasonal profiles from the Eel River Shelf.
Limnology and Oceanography, 44 (7): 1702-1714.
Moncheva, I., Moncheva, S., Slabakova, N., Alexandrova, V. and Doncheva, V. (2006)
Tourism industry impacts on Black Sea ecosystem along the Bulgarian coast Ł "the good, the
bad and the ugly". Presentation made at the 1st Biannual Scientific Conference "Black Sea
Ecosystem 2005 and Beyond", 8-10 May 2006, Istanbul, Turkey.
Moncheva, S., Doncheva, V. and Alexandrova, V. (2006) Regime shifts in the North-
Western Black Sea phytoplankton communities - implication for ecosystem ecological state
assessment. Presentation made at the 1st Biannual Scientific Conference "Black Sea
Ecosystem 2005 and Beyond", 8-10 May 2006, Istanbul, Turkey.
Morse, G.K., Lester, J.N. and Perry, R. (1993) The Economic and Environmental Impact of
Phosphorus Removal from Wastewater in the European Community. Selper Publications.
Moskalov, E. (2005) Assessment of livestock numbers and potential nutrient/organic loads to
water bodies in the Ukrainian part of the Black Sea Basin. Report to the UNDP-GEF Black
Sea Ecosystem Recovery Project.
OECD (1982) Eutrophication of waters: monitoring, assessment and control. Organisation
for Economic Co-operation and Development, Paris.
Oguz, T., Latun, V.S., Latif, M.A., Vladimirov, V.V., Sur, H.I., Makarov, A.A., Ozsoy, E.,
Kotovshchikov, B.B., Eremeev, V.V. and Unluata, U., (1993). Circulation in the surface and
intermediate layers of the Black Sea. Deep Sea Res. I, 40, 1597-1612.
Oguz, T, Cokacar, T., Malanotte-Rizzoli, P. and Ducklow, H. W. (2003) Climatic warming
and accompanying changes in the ecological regime of the Black Sea during the 1990s. G.
Biogeochem. Cycles, 17, 1088, doi:10.1029/2003GB002031.
Oguz, T. and Gilbert, D. (in press) Abrupt transitions of the top-down controlled Black Sea
pelagic ecosystem during 1960-2000: evidence for regime shifts under strong fishery
exploitation and nutrient enrichment modulated by climate-induced variations. Deep Sea
Res. I.
Oguz, T., and Merico, A. (2006) Factors controlling the summer Emiliania huxleyi bloom in
the Black Sea: a modeling study. J. Marine Systems, 59, 173-188.
Parr, W., Wheeler, M.A. and Codling, I. (1998) Nutrient status of the Glaslyn/Dwyryd,
Mawddach and Dyfi estuaries - its context and ecological importance. WRc report to the
Countryside Council for Wales.
163
Parr, W., Volovik, Y., Nixon, N. and Lipan, I. (2005) Improving the understanding of the
Danube River impact on the status of the Black Sea. BSERP report to the Black Sea Ł
Danube Technical Working Group.
Petkova, E. (2005) Livestock Numbers and Potential Nutrient/Organic Loads to the Black
Sea from Riparian Countries. National report Ł Bulgaria. Report to the UNDP-GEF Black
Sea Ecosystem Recovery Project.
Reynolds, C.S. (1984) The Ecology of Freshwater Phytoplankton. Cambridge University
Press.
Sas, H. (1989) Lake Restoration by Reduction of Nutrient Loading. Expectations,
Experiences, Extrapolations. Academia Verlag.
Shiganova T.A., Mirzoyan, Z.A., Studenikina, E.A., Volovik, S.P., Siokou-Frangou, I.,
Zervoudaki, S., Christou, E.D., Skirta, A.Y. and Dumont, H.J. (2001) Population
development of the invader ctenophore Mnemiopsis leidyi, in the Black Sea and other Seas
of the Mediterranean basin. Mar. Biol., 139: 431-445.
Shiganova, T.A. et al (2004) Interactions between the invading ctenophores Mnemiopsis
leidyi (A. Agassiz) and Beroe ovata Mayer 1912, and their influence on pelagic ecosystem of
the Northeastern Black Sea. H. Dumont (eds.), Aquatic Invasions in the Black, Caspian and
Mediterranean Seas. Kluwer Academic Publishers, Netherlands, 33-70.
Shurova, N. and Gomoiu, M.-T. (2006) Present state of mussel population (Mytilus
galloprovincialis) from the North-Western Black Sea. Presentation made at the 1st Biannual
Scientific Conference "Black Sea Ecosystem 2005 and Beyond", 8-10.May 2006, Istanbul,
Turkey.
Sinegub, I.A. (2006) Macrozoobenthos. Bottom communities in 1984Ł2002 / Biology and
ecology of northwestern part of the Black Sea. Kiev: Naukova dumka Publ., 276-286. (In
Russian.)
Sofief, M., Gusev, A., and Strijkina, I. (1994). Results of MSC-East current model
calibration with measurements for SOx, NOx, NHx. EMEP/MSC-E Technical Report 4/94.
Convention on Long-Range Transboundary Air Pollution, Meteorological Synthesizing
CentreŁ East, Moscow, 12 pp.
Sorokin, Y.( 2002). The Black Sea: Ecology and Oceanography. Backhuys, Leiden, The
Netherlands.
Stanev, E.V., Bowman, M.J., Peneva, E.L. and Staneva, J.V. (2003). Control of Black Sea
intermediate water mass formation by dynamics and topography: Comparison of numerical
simulations, surveys and satellite data. Journal ofMarine Research, 61:59-99.
Tarchi, D., Bernardini, A., Ferraro, G., Meyer-Roux, S. and Topouzelis, K. (2006) Satellite
mapping of oil spills in the Black Sea. Presentation made at the 1st Biannual Scientific
Conference "Black Sea Ecosystem 2005 and Beyond", 8-10 May 2006, Istanbul, Turkey.
Todorova, V and Konsulova, T. (2006) Ecological state assessment of zoobenthic
communities on the North-Western Black Sea Shelf Ł the performance of multivariate and
164
univariate approaches. Presentation made at the Black Sea Scientific Conference, 8-10 May
2006, Istanbul.
T÷r÷k, L. (2005) Ecological status of the Danube Delta Biosphere Reserve's lakes. Analele
stiintifice Ł Scientific Annals of the DDNI, Tulcea, 11, 112-115.
Tugrul, S. and A. Besiktepe, S. (2006). The hydrochemical results of the October 2005
survey in the western Black Sea. Report to the UNDP-GEF Black Sea Exosystem Recovery
Project implementation unit, Istanbul.
Ulger, S. (2005) Livestock numbers and nutrient/organic load production in the Turkish
Black Sea Sub-Basin. Report to the UNDP-GEF Black Sea Ecosystem Recovery Project.
Vighi, M. and Chiaudani, G. (1985) A simple method to estimate lake phosphorus
concentrations resulting from natural background loadings. Water Research, 19, 987-991.
Zaitsev, Yu. and ųzt³rk, B. (2001) (eds.). Exotic Species in the Aegean, Marmara, Black,
Azov and Caspian Seas. TUDAV, 8. 265 pp.
Zaitsev, Yu., Alexandrov, B.G., Berlinsky, N.A. and Zenetos, A., (2002) The Black Sea - an
oxygen-poor sea. Europe's biodiversity - biogeographical regions and seas. Seas around
Europe. Report to the European Environment Agency.
(http://reports.eea.europa.eu/report_2002_0524_154909/en/BlackSea.pdf)
165
166
Annex 1: GLOSSARY OF TERMS
Best Available
The most effective and advanced stage in the development of
Technology/Technique activities and their methods of operation which indicate the
practical suitability of particular techniques for providing in
principle the basis for emission limit values designed to prevent
and, where that is not practicable, generally to reduce emissions
and their impact on the environment as a whole.
Biochemical Oxygen
The amount of oxygen used for biochemical oxidation by a unit
Demand (5-day test)
volume of water at a given temperature over a 5-day period.
BOD is an index of the degree of organic pollution in water.
Causal Chain Analysis An analysis of the immediate, underlying and root causes
leading to the generation of an environmental problem.
Commonwealth of
Countries arising from the break-up of the Soviet Union.
Independent States
Chemical Oxygen
The quantity of oxygen used in biological and non-biological
Demand
oxidation of materials in water; a measure of water quality.
Catch Per Unit Effort The catch in numbers or weight taken for a given amount of
fishing effort over time using specific gear.
The Danube and
The DABLAS Task Force comprises a number of
Black Sea Task Force
representatives from the countries in the region, the International
Commission for the Protection of the River Danube (ICPDR),
the Black Sea Commission, International Financing Institutions
(IFIs), the EC, interested EU Member States, other bilateral
donors and other regional/ international organisations with
relevant functions. The European Commission DG Environment
holds the Secretariat of the Task Force.
Ecological Quality
A desired level of ecological quality (EcoQ) relative to
Objective
predetermined reference levels.
Ecotoxicological
The concentration level of a substance above which concern is
Assessment Criterion
indicated, and have been used by OSPAR to identify possible
areas of concern and to indicate which substances might be a
target for priority action.
Eutrophication
Excessive nutrient concentrations in a waterbody, usually caused
by emissions of nutrients (animal waste, fertilizers, sewage)
from land, which causes a dense growth of plant life
(Phytoplankton and benthic macrophytes/macroalgae). The
decomposition of the plants depletes the supply of oxygen,
leading to the death of animal life;
Good Agricultural
The way products should be used according to the statutory
Practice
conditions of approval, which are stated on the label.
Gross Domestic
An estimate of the total money value of all the final goods and
Product
services produced in a given one-year period using the factors of
production located within a particular country's border.
167
Goss Domestic
Value added is defined as gross output minus intermediate
Product, Value Added consumption and equals the sum of employee compensation, net
operating surplus and depreciation of capital assets. The shares
of each sector are calculated by dividing the value added in each
sector by total value added. Total value added is less than GDP
because it excludes value-added tax (VAT) and similar product
taxes.
Gross National
GNI per capita (formerly GNP per capita) is the gross national
Income per capita
income, converted to U.S. dollars using the World Bank Atlas
method, divided by the midyear population. GNI is the sum of
value added by all resident producers plus any product taxes
(less subsidies) not included in the valuation of output plus net
receipts of primary income (compensation of employees and
property income) from abroad. GNI, calculated in national
currency, is usually converted to U.S. dollars at official
exchange rates for comparisons across economies, although an
alternative rate is used when the official exchange rate is judged
to diverge by an exceptionally large margin from the rate
actually applied in international transactions. To smooth
fluctuations in prices and exchange rates, a special Atlas method
of conversion is used by the World Bank.
Integrated Coastal
Integrated coastal zone management (ICZM) is a dynamic,
Zone Management
multidisciplinary and iterative process to promote sustainable
management of coastal zones. It covers the full cycle of
information collection, planning (in its broadest sense), decision
making, management and monitoring of implementation. ICZM
uses the informed participation and cooperation of all
stakeholders to assess the societal goals in a given coastal area,
and to take actions towards meeting these objectives. ICZM
seeks, over the long-term, to balance environmental, economic,
social, cultural and recreational objectives, all within the limits
set by natural dynamics. 'Integrated' in ICZM refers to the
integration of objectives and also to the integration of the many
instruments needed to meet these objectives. It means
integration of all relevant policy areas, sectors, and levels of
administration. It means integration of the terrestrial and marine
components of the target territory, in both time and space.
Marine Protected
An area of sea (or coast) especially dedicated to the protection
Area
and maintenance of biological diversity, and of natural and
associated cultural resources, and managed through legal or
other effective means.
Neritic
Strictly: of or relating to the region of the sea over the
continental shelf which is less than 200 meteres deep. However,
in the Black Sea the depth limit refers only to oxygenated
surface waters (typically 120-150 m deep)
Pelagic
The pelagic zone of the Sea begins at the low tide mark and
includes the entire water column
168
Polycyclic Aromatic
Polycyclic aromatic hydrocarbons are a very large number of
Hydrocarbon
naturally occurring and man-made chemicals. The pure
compounds are white or yellowish crystalline solids. They are
insoluble in water but dissolve readily in fats and oils. Well-
known PAHs include the compounds benzo[a]pyrene,
fluoranthene, naphthaline and anthracene.
Poly-chlorinated
PCBs are mixtures of 209 different chemicals (cogeners) that
biphenyl
come in various forms including oily liquids, solids and hard
resins. PCBs are organochlorines that were manufactured until
the mid-1980s, after which they were banned due to their
toxicity and persistence. PCBs have been widely used as
insulators in electrical equipment. They have also been used in
the production of hydraulic fluids, lubricants, inks, adhesives
and insecticides. They are still found in old electrical equipment
and releases into the environment continue from landfills. PCBs
are very persistent in the environment, taking years to degrade.
They are fat-soluble and bioaccumulate in the tissues of animals.
PCBs have become worldwide pollutants due to long-distance
transport on air currents. Exposure to PCBs can permanently
damage the nervous, reproductive and immune systems of the
human body. PCBs are known carcinogens and have been linked
with the development of various forms of cancer including skin
and liver. In mammals, PCBs are passed via the placenta to
developing young in the womb and via breast milk to newborn
babies. The disposal of wastes containing PCBs is regulated by
the Basel Convention.
Persistent Organic
Persistant Organic Pollutants (POPs) are chemicals that remain
Pollutant
intact in the environment for long periods, become widely
distributed geographically, accumulate in the fatty tissue of
living organisms and are toxic to humans and wildlife. POPs
circulate globally and can cause damage wherever they travel.
Such pollutants include toxic chemicals like DDT, Chlordane,
and Endrin, Dioxins and Furans, among many others. The
Stockholm Convention is a global treaty to protect human health
and the environment from persistent organic pollutants (POPs).
In implementing the Convention, governments agree to take
measures to eliminate or reduce the release of POPs into the
environment.
Strategic Action
A regional strategic programme of measures designed to tackle
Programme
the major environmental problems of a transboundary
waterbody.
169
Sliding BOD
The measurement of BOD5 relies upon biological (bacterial)
uptake of oxygen. However, if toxicants are present at high
levels in a water sample, they suppress the rate of growth of
bacteria, so that over a 5-day period of time, oxygen
consumption by the bacteria is reduced. If the original
(contaminated) water sample is diluted with "pure" water, the
concentrations of toxins is reduced, so the growth of bacteria is
less inhibited. Thus, samples with a lower concentration of
biodegradable organic matter, can demonstrate higher BOD5
levels if toxic substances are present. This phenomenon is
known as sliding BOD.
Transboundary
A Transboundary Diagnostic Analysis (TDA) is a scientific and
Diagnostic Analysis
technical assessment, through which the water-related
environmental issues and problems of a region are identified and
quantified, their causes analysed and their impacts, both
environmental and economic, assessed. The analysis involves an
identification of causes and impacts at national, regional and
(sometimes) global levels, and the socio-economic, political and
institutional context within which they occur. The identification
of causes can specify sources, locations, and sectors.
Total Organic Carbon All of the organic (carbon-containing) substances in natural
waters and sediments may be termed TOC. There are many
natural and man-made substances that all contribute to TOC.
TOC is partly broken down by micro-organisms, in the process
consuming oxygen. At high TOC concentrations, so much
oxygen in the water may be used up that there is not enough to
support fish and other aquatic animals, which then die.
170
Annex 2: ABBREVIATIONS AND ACRONYMS
1,2-DCE
1,2-Dichloroethylene
ICZM
Integrated Coastal Zone Management
AoKK
Assembly of Krasnodar Kray
BAP
Best Agricultural Practice
BAT
Best Available Technology/Technique
BOD5
Biochemical Oxygen Demand (5-day test)
BS
Black Sea
BSC
Black Sea Commission
BSERP
UNDP/GEF Black Sea ecosystem recovery project
BSIMAP
Black Sea ntegrated Monitoring and Assessment Programme
BWM Convention
International Convention for the Control and Management of Ships'
Ballast Water
CCA
Causal Chain Analysis
CIL
Cold Intermediate Layer
CIS
Commonwealth of Independent States
CITES
Convention on nternational Trade in Endangered Species of wild
flora and fauna
CMU
Cabinet of Ministers of Ukraine
COD
Chemical Oxygen Demand
CP
Contracting Party
CPUE
Catch Per Unit Effort
DABLAS
The Danube and Black Sea Task Force
DDT
Dichloro-Diphenyl-Trichloroethane
DIN
Dissolved Inorganic Nitrogen
EAC
Ecotoxicological Assessment Criterion
EAF
Executive Agency on Fisheries
EAPA
Executive Agency "Port Authorities"
EC
European Commission
EcoQO
Ecological Quality Objective
EEA
European Environment Agency
EEZ
Economic Exclusive Zone
EPA
Environmental Protection Agency
EU
European Union
FAWR
Federal Agency for Water Resources
FEIACS
Federal Environmental, Industrial and Atomic Control Service
FSNRM
Federal Service for Natural Resources Management
GAP
Good Agricultural Practice
GDoSHW/GDSHW General Directorate of State Hydraulic Works
GDP
Gross Domestic Product
GEF
Global Environment Facility
GNI per capita
Gross National Income per capita
HCB
Hexachlorobenzene
HCH
Hexachlorocyclohexane
HELCOM
Helsinki Commission (Baltic Sea)
ICIM
Environmental Engineering Research Institute
ICPDR
International Commission for the Protection of the Danube River
IFI
International Financial Institution
IPPC
Integrated Pollution Prevention and Control
171
IRCM
Institutul Roman de Cercetari Marine (National Institute for Marine
Research and Development "Grigore Antipa" - IRCM)
IUCN
International Union for Conservation of nature and Natural Resources
IW
Inland Waters
MEP
Ministry of Environmental Protection
MLR
(Commercial) Marine Living Resources
MoA
Ministry of Agriculture
MoAF
Ministry of Agriculture and Forests
MoAFRD
Ministry of Agriculture, Forests and Rural Development
MoE
Ministry of the Environment
MoEF
Ministry of Environment and Forests
MoEP
Ministry of Environmental Protection
MoEPNR/MEPNR Ministry of Environment Protection and Natural Resources
MoEW
Ministry of Environment and Water
MoEWM
Ministry of Environment and Water Management
MoFA
Ministry of Foreign Affairs
MoH
Ministry of Health
MoNR
Ministry of Natural Resources
MoRD/MRD
Ministry of Rural Development
MoT/MT
Ministry of Transport
MoTC
Ministry of Transport and Comunications
MoTCT
Ministry of Transport, Construction and Tourism
MUN
Municipalities
MPA
Marine Protected Area
NAAR
National Adninistration "Apele Romane"
NGO
Non-Governmental Organisation
NW
North-West
OSPAR
Oslo and Paris Commission (North-East Atlantic)
PAH
Poly-Aromatic Hydrocarbon
PCB
Poly-chlorinated biphenyl
PIU
Project Implementation Unit (of the BSERP)
PLC
Pollution Load Compilation
POP
Persistent Organic Pollutant
PS
Permanent Secretariat
QUASIMEME
Quality Assurance of Information for Marine Environmental
Monitoring in Europe
RBMD
River Basin Management Directorate
RDEP
Regional Department for Environmental Protection
REI
Regional Environment Inspectorate
RID
Riverine Inputs and Direct Discharges
SAP
Strategic Action Programme
SAR images
Synthetic Aperture RADAR (RAdio Detection And Ranging) images
SCLR
State Committee for Land Resources
SCUBA
Self-Contained Underwater Breathing Apparatus
SCWM
State Control Water Management
SEI
State Ecological Inspection
SEIBSAS
State Ecological Inspection for the Black Sea and Azov Sea
SES
Sanitary and Epidemiology Service of Ministry of Health
SHMS
State Hydro-Meteorological Service
SPO
State Planning Organization
172
TDA
Transboundary Diagnostic Analysis
TNMN
Trans-national monitoring network
TOC
Total Organic Carbon
TTT
Technical Task Team
UMA
Undersecretariat of Maritime Affairs
UNDP
United Nations Development Programme
UP
Ukrainian Parliament
USD
United States Dollars
UWWT
Urban Waste Water Treatment
WFD
Water Framework Directive
WSC
Water & Sewerage Companies
WSSA
Water Supply and Sewerage Admisnistrations
WWTP
Waste Water Treatment Plant
173
174
Annex 3: LIST OF CONTRIBUTING SPECIALISTS
Name Country/
E-mail address
Main area(s) of
affliation
contribution
Abaza, Valeria
Romania
abaza@alpha.rmri.ro
Habitat loss/
biodiversity
Akkoyunlu, Atilla
Turkey
Akkoyun@boun.edu.tr
Pollution loads
Aydin, Ali
Turkey
afaydin@ins.itu.edu.tr
Stakeholders,
afaydin@itu.edu.tr
governance and socioŁ
afaydin@ttnet.net.tr
economic analysis
Bloxham, Martin
International
martin.bloxham@btconnect.com
TDA process, tutoring
Consultant
and editing
Buachidze, Nugzar
Georgia
emc.buachidze@yahoo.com
Pollution assessment
Citil, Ercan
BSERP
ecitil@superonline.com
Regional physical and
geographical
characteristics
David, Madalina
Romania
madalinadina@yahoo.com
Pollution loads
Duzgunes, Ertug
Turkey
ertug@ktu.edu.tr
Marine living resources
erduz@excite.com
Galabov, Konstantin
Bulgaria
krgalabov@interbgc.com
Stakeholders,
kgalabov@techno-link.com
governance and socioŁ
economic analysis
Garlitska, Lesya
Ukraine
garlitska@gmail.com
Habitat loss/
garlitska@farlep.net
biodiversity
Gurel, Melike
Turkey
mgurel@ins.itu.edu.tr
Causal chain analysis
Iliev, Kiril
BSC
kiliev@blacksea-commission.org
GIS presentation of
Permanent
results
Secretariat
Islam, Oana
Romania
otortolea@yahoo.com
Stakeholders,
governance and socioŁ
economic analysis
Komakhidze, Akaki
Georgia
wefri@gol.ge
Marine living resources
Komorin, Victor
Ukraine
vkomorin@mail.ru
Pollution assessment
vnkomorin@yahoo.com
Korshenko, Alexander
Russian
korshenko@mail.ru
Pollution assessment
Federation
Kresin, Vladimir
Ukraine
morlab@vk.kh.ua
Pollution loads
morlab@ukr.net
Kudelya, Sergei
Russian
skudelya@yamdex.ru
Web-based applications
Federation
Lagidze, Tengiz
Georgia
laghidzeana@hotmail.com
Causal chain analysis
Lipan, Iozefina
BSERP
jlipan@bserp.org
Contracting,
governance, pollution
and hot-spots analysis
Machavariani, Merab
Georgia
biodiv@caucasus.net
Habitat loss/
biodiversity
Makarova, Mariam
Georgia
waterdept_mm@yahoo.com
Pollution loads
Matthews, Mary
International
mary.matthews@tethysconsultants.com Stakeholders and socio-
Consultant
economic analysis
Micu, Dragos
Romania
ddrraaggoossmm@yahoo.com
Habitat loss/
175
Name Country/
E-mail address
Main area(s) of
affliation
contribution
dragos.micu@gmail.com
biodiversity
Mihail, Otilia
Romania
otilia.mihail@mmediu.ro
Pollution assessment
Mihneva, Vesselina
Bulgaria
vvmihneva@yahoo.com
Causal chain analysis
Mutlu, Erhan
Turkey
mutlu@ims.metu.edu.tr
Pollution assessment
Nenov, Valentin
Bulgaria
vnenov@btu.bg
Pollution loads
Nicolaev, Simion
Romania
nicolaev@alpha.rmri.ro
Marine living resources
Oros, Andra
Romania
andra@alpha.rmri.ro
Pollution loads
Panayotova, Marina
Bulgaria
mpanayotova@io-bas.bg
Habitat loss/
biodiversity
Parr, Bill
BSERP
bill@bserp.org
Eutrophication, marine
living resources,
chemical pollution and
hot-spots analysis
Perelet, Renat
Russian
renat@perelet.msk.ru
Stakeholders,
Federation
governance and socioŁ
economic analysis
Pisotsky, Victor
Ukraine
vpisotskiy@yahoo.com
Stakeholders,
governance and socioŁ
economic analysis
Radu, Gheorghe
Romania
gpr@alpha.rmri.ro
Marine living resources
Raykov, Violin
Bulgaria
vio_raykov@yahoo.com
Marine living resources
Sharabidze, Merab
Georgia
msharabidze@yahoo.com
Stakeholders,
governance and socioŁ
economic analysis
Shlyakhov, Vladislav
Ukraine
fish@kerch.com.ua
Marine living resources
Shtereva, Galina
Bulgaria
chem@io-bas.bg
Pollution assessment
Stanica, Adrian
Romania
adrian_stanica@yahoo.com
Causal chain analysis
Stolberg, Felix
Ukraine
stolberg@kharkov.ua
Causal chain analysis
Todorova, Valentina
Bulgaria
vtodorova@io-bas.bg
Habitat loss/
biodiversity
Uysal, Irfan
Turkey
iruysal@yahoo.com
Habitat loss/
biodiversity
Volovik, Stanislav
Russian
stanislavvolovik@mail.ru
Marine living resources
Federation
Volovik, Yegor
BSERP
yevolovik@bserp.org
Web-based applications
Voronina, Lyudmila
Russian
idpo@kubsu.ru
SocioŁeconomic and
Federation
stakeholders analysis
Yarmak, Leonid
Russia
iczm@mail.ru
Pollution loads and
causal chain analysis
Zhuravleva, Elena
Russian
idpo@kubsu.ru
Governance analysis
Federation
176
Annex 4: MAIN BLACK SEA HABITATS AND CRITICAL
HABITATS AT NATIONAL LEVEL
NATIONAL HABITATS:
BLACK SEA HABITATS
X Ł PRESENT, CR Ł CRITICAL
BU GE RO RU TU UA
Coastal margin ecotones
1. Sedimentary shores
X
CR X X X X
2. Rocky shores
X
CR X X X X
3. Coastal brackish/saline lagoons
CR
CR
CR CR X
4. Estuaries and deltas
X
CR
CR CR
CR
5. Wetlands and saltmarshes
CR
CR X CR
CR
Pelagic habitats (water column)
1. Neritic
CR
CR
CR X X CR
2. Open sea
X
CR X X CR X
Benthic habitats
1. Supralittoral rock
1.1 Association of Littorina neritoides,
Lygia italica and Tylos laeillei on
X
X X
exposed or moderately exposed
supralittoral rock
1.2 Chthamalus stellatus on exposed
X
X X
supralittoral rock
2. Supralittoral sand
2.1 Taliid amphipods in decomposing
X X X X
seaweed on the sand-line
3. Mediolittoral rock
3.1 Mussels and/or barnacles on
very/moderately exposed mediolittoral
X
CR X X X
rock
3.2 Enteromorpha spp. Minor development
of Ceramium, Cladophora, Coralina,
X X X X X
Porphyra
4. Mediolittoral sand and muddy sands
4.1 Coarse sands with Donacilla cornea
CR
CR
CR
CR X X
and facultative Ophelia bicornis
4.2 Fine sands with Pontogammarus
X X X X
maeoticus
5. Sublittoral rock/other hard subsata
177
NATIONAL HABITATS:
BLACK SEA HABITATS
X Ł PRESENT, CR Ł CRITICAL
BU GE RO RU TU UA
Coastal margin ecotones
5.1 Facies with Mytilus galloprovincialis,
on exposed or moderately exposed
X X CR X X X
infralittoral rock Ł vertical or bedrock
5.2 Association with Cystoseira spp. on
exposed or moderately exposed
CR
CR X CR
CR
infralittoral bedrock and boulders
5.3 Association of green and red seaweeds
on moderately exposed or sheltered
X X X X X
infralittoral rock Enteromorpha, Ulva
spp., Porphyra spp.
5.4 Pholas dactylus in infralittoral soft
X X X
rock.
5.5 Peicola litophaga in infralittoral hard
X X
rock
5.6 Spirorbid worms on infralittoral rock,
Vermiliopsis infundibulum biogenic
X X
X
rocks
5.7 Sponge crusts, colonial ascidians and a
bryozoan/hydroid turf on moderately
X X X
exposed to sheltered infralittoral rock
5.8 Polydora sp. tubes on infralittoral soft
X X X X
rock
5.9 Ficopomatus enigmaticus biogenic
X X
reefs
6. Sublittoral sediments
6.1 Donax unculus in infralittoral coarse
X X X CR X X
sands
6.2 Chamelea gallina, Lentidium
mediterraneum and Lucinella
X X X CR X X
divaricata in shallow clean sands
6.3 Lentidium mediterraneum in shallow
CR CR
fine sands
6.4 Solen marginatus in sheltered
X
X X
ifralittoral fine sands
6.5 Branchiostoma lanceolatum,
Protodorvillea kefersteini and Ophelia
X
X X
limacina in circalittoral coarse sand
with shell gravel
178
NATIONAL HABITATS:
BLACK SEA HABITATS
X Ł PRESENT, CR Ł CRITICAL
BU GE RO RU TU UA
Coastal margin ecotones
6.6 Mytilus galloprovincialis beds on
X X X X X
coarse sand with shell gravel
6.7 Phyllophora nervosa on shell gravel
X
X
CR
6.8 Modiolus adriaticus, Aonides
paucibranchiata and Gouldia minima
X X
CR X X
in coarse sands
6.9 Mya arenaria in sands and muddy
X X X X
sands
6.10 Anadara inequivalvis on sands and
X X X X
muddy sands
6.11 Zostera beds in lower shore or
CR
X X X CR
infralittoral clean or muddy sand
6.12 Melinna palmata in infralittoral mud
X
X
X
CR
6.13 Abra alba, Cardiidae and Mytilus in
X X
CR X X
infralittoral mud
6.14 Mya arenaria and Mytilus
X
X
galloprovincialis in infralittoral mud
6.15 Nephthys in infralittoral mud
X
X
6.16 Mytilus galloprovincialis beds in
CR X
X X X
infralitoral and circalittoral mud
6.17 Spisula subuncata and Aricidea
X
CR X X
claudiae in circalittoral mud
6.18 Modiolula phaseolina, Amphiura
stepanovi and Notomastus profundus in
X X X X CR
circalittoral mud
6.19 Pachycerianthus solitarius in
X X X X
circalittoral mud
6.20 Periazoic zone
X
X
X
X
6.21 Anoxic H2S zone with anaerobic
X X X X X
sulphate reducing bacteria
179
Annex 5: INVENTORY OF AQUATIC AND SEMI-AQUATIC
RED LIST SPECIES, ENDANGERED IN AT LEAST
ONE COUNTRY AROUND THE BLACK SEA
IUCN regional status
Species
B
RO UA RU GE TR
G
Cystoseira barbata (Stackhouse) C.Agardh,
EN
1842
Cystoseira crinita Duby
RE
Dictyota dichotoma (Huds.) Lamour
VU
Sphacelaria saxatilis (Kuck.) Sauv.
VU
Coccotylus truncatus (Pallas) Wynne &
VU
Heine (syn. Phyllophora brodiaei)
Phyllophora crispa (Hudson) P.S.Dixon
VU
(syn. P.nervosa)
Phyllophora pseudoceranoides (Gmel.)
CR EN
Newr. & R.Taylor, 1971
Laurencia hybrida (DC.) Lenorm.
VU
Nemalion helminthoides (Vell.) Batt.
VU
Bulbochaete subquadrata Mrozinska -
VU
Webb
Stigeoclonium fasciculare Kutz.
VU
Chara braunii Gmelin
VU
Pteridium aquilinum Gled. ex Scop.
RE
Salvinia natans (L.) All.
LC
VU
Marsilea quadrifolia
L.
EN
Aldrovanda vesiculosa
L.
EN
Alisma lanceolatum
With.
VU
Apium nodiflorum (L.) Lag.
RE
Blackstonia acuminata (Koch et Ziz)
RE
Domin.
Cakile maritima euxina Scop.
EN
Calla palustris L.
RE
Caltha palustris L.
RE
Carex melanostachya Bieb. ex Willd.
VU
Catabrosa aquatica Beauv.
RE
Centaurea pontica Prodan et E.I.Nyarady
CR
Cirsium alatum (S.G.Gmelin) Bobrov
VU
Comarum palustre L.
RE
Epipactis palustris (L.) Crantz
VU
180
IUCN regional status
Species
B
RO UA RU GE TR
G
Equisetum fluviatile
L.
VU
Equisetum hyemale L.
RE
Equisetum palustre
L.
VU
Euphorbia paralias
L.
EN
Limosella aquatica
L.
VU
Peucedanum palustre
(L.)
Moench
EN
Potamogeton compressus
L.
VU
Potamogeton pusillus
L.
VU
Potamogeton trichoides Cham. et Schlecht
VU
Ruppia cirrhosa
(Petagna)
Grande
EN
Ruppia maritima
L.
EN
Sagittaria trifolia
Willd.
EN
Trapa natans L.
LC
VU
Zannichellia palustris
L.
VU
Zostera marina L.
CR
Zostera noltii Hornem.
CR
Halichondria panicea (Pallas, 1766)
VU
Odessia maeotica (Ostroumoff, 1896)
VU
VU
Gibbula divaricata (Linne, 1758)
CR
Tricolia pullus (Linne, 1758)
CR
Epitonium commune (Lamarck, 1822)
CR
Valvata pulchella
Studer,
1820
VU
Micromelania lincta Milaschewitsch, 1908
VU
NT
Calyptraea chinensis
(Linne,
1758)
VU
Chrysallida fenestrata
(Jeffreys,
1848)
EN
Ebala pointeli (de Folin, 1868)
CR
Anisus rotundatus
(Poiret,
1801)
VU
Gyraulus acronicus (Ferrusac, 1807)
VU
Chlajmaguire@e-solventa.commys glabra
RE
(Linne, 1758)
Ostrea edulis Linne, 1758
CR VU
Adacna fragilis
Milaschewitsch,
1908
EN
Hypanis plicata relicta Eichwald, 1829
EN
Monodacna colorata
Eichwald,
1829
EN
Monodacna pontica Eichwald, 1838
EN
Unio crassus
Philipsson,
1788
VU
181
IUCN regional status
Species
B
RO UA RU GE TR
G
Donacilla cornea (Poli, 1795)
CR
Solen marginatus Pulteney, 1799
CR
Tellina donacina Linne, 1758
RE
Tellina fabula Gmelin, 1791
RE
Gastrana fragilis (Linne, 1758)
EN
Donax trunculus
Linne,
1758
VU
Pitar rudis
(Poli,
1795)
VU
Irus irus (Linne, 1758)
CR
Paphia aurea
(Gmelin,
1791)
VU
Petricola lithophaga (Philipsson, 1788)
CR
Pholas dactylus Linne, 1758
CR
Teredo navalis Linne, 1758
CR
Ophelia bicornis Savigny, 1818
RE
Fadejewobdella quinqueannulata Lukin,
VU
1929
Hirudo medicinalis Linne, 1758
LC
VU
Trocheta subviridis Dutrochet, 1817
EN
Tanymastix stagnalis (Linne, 1758)
EN
Branchinecta orientalis G. 0. Sars, 1901
EN
Branchinectella media (Schmankewitsch,
EN
1873)
Branchinella spinosa (Milne-Edwards,
EN
1840)
Branchipus schaefferi Fischer, 1834
EN
Centropages kroyeri pontica (Karawaev,
E
1895)
N
E
Oithona minuta (Kriczagin, 1873)
N
Hippolyte leptocerus (Heller, 1863)
CR
Lysmata seticaudata (Risso, 1816)
RE
Philocheras trispinosus (Hailstone, 1835)
RE
Astacus astacus (Linne, 1758)
CR NT
L
Upogebia pusilla (Petagna, 1792)
LC EN
- -
C
Clibanarius erythropus (Latreille, 1818)
CR
Polybius navigator (Herbst, 1794)
EN
Carcinus aestuarii (Nardo, 1847)
EN EN
182
IUCN regional status
Species
B
RO UA RU GE TR
G
Xantho poressa (Olivi, 1792)
LC EN
Eriphia verrucosa (Forskal, 1785)
NT EN
Pilumnus hirtellus (Leach, 1815)
LC EN
Brachynotus sexdentatus (Risso, 1827)
CR
Pachygrapsus marmoratus (Fabricius,
LC EN
1787)
Hemimysis anomala G. . Sars, 1907
LC
EN
Hemimysis serrata Bacescu, 1938
EN EN
Katamysis warpachowskyi G.O.Sars, 1893
LC
EN
Iphigenella acanthopoda G. 0. Sars, 1896
VU
-
-
-
V
Iphigenella shablensis (Carausu, 1943)
LC NT - - -
U
Chaetogammarus ischnus major (Stebling,
V
LC
1898)
U
V
Dikerogammarus villosus (Sovinskii, 1894)
LC
U
Amphitholina cuniculus (Stebbing, 1874)
EN
Palingenia longicauda (Olivier, 1791)
RE
Coenagrion lindeni (Selys, 1840)
EN
Coenagrion mercuriale (Charpentier, 1840)
EN
Squalus acanthias Linne, 1758
VU
-
VU
Huso huso (Linne, 1758)
EN
VU
EN
Acipenser gueldenstaedtii Brandt &
EN
EN
Ratzenburg, 1833
Acipenser nudiventris Lovetsky,1828
RE EN
EN
Acipenser ruthenus Linne, 175
CR VU
Acipenser stellatus
Pallas,
1771
EN
EN
Acipenser sturio Linne, 1758
RE EN
CR
CR
Salmo labrax Pallas, 1814
EN
EN
Umbra krameri Walbaum, 1792
VU
VU
Petroleuciscus borysthenicus (Kessler,
VU
1859)
Leuciscus idus idus
(Linne,
1758)
VU
Rutilus frisii (Nordmann, 1840)
EN
Tinca tinca
(Linne,
1758)
EN
Chalcalburnus chalcoides (Guldenstadt,
CR
1772)
Vimba vimba (Linne, 1758)
VU
EN
183
IUCN regional status
Species
B
RO UA RU GE TR
G
Barbus barbus barbus (Linne, 1758)
VU
VU
Carassius carassius
(Linne,
1758)
EN
Misgurnus fossilis
(Linne,
1758)
VU
Belone belone (Linne, 1761)
EN
Lota lota (Linne, 1758)
VU
C
Pungitius platygaster (Kessler, 1859)
LC
R
Syngnathus typhle Linne, 1758
VU
E
Nerophis ophidion (Linne, 1758)
EN
N
Hippocampus guttulatus Cuvier, 1829
NT
EN
Liza ramado
(Risso,
1810)
VU
E
Sander marinus (Cuvier, 1828)
EN
N
Gymnocephalus schraetser (Linne, 1758)
LC
VU
Zingel zingel (Linne, 1766)
VU
NT
Diplodus annularis
Linne
1758
RE
Spicara smaris (Linne, 1758)
EN
Mullus barbatus ponticus Essipov, 1927
EN
Pomatomus saltatrix (Linne, 1766)
VU
V
Symphodus ocellatus (Forsskal, 1775)
NT
U
V
Symphodus tinca (Linne, 1758)
NT
U
C
Trachinus draco Linne, 1758
VU
R
C
Uranoscopus scaber Linne, 1758
EN
R
V
Aidablennius sphynx (Valenciennes, 1836)
NT
U
V
Coryphoblennius galerita (Linne, 1758)
EN
U
Parablennius zvonimiri (Kolombatovic,
VU
1892)
V
Salaria pavo (Risso, 1810)
EN
U
Ophidion rochei Muller, 1845
VU
Scomber scombrus
Linne,
1758
EN
Sarda sarda (Bloch, 1793)
CR
184
IUCN regional status
Species
B
RO UA RU GE TR
G
Thunnus thynnus
(Linne,
1758)
EN
Xiphias gladius Linne, 1758
CR
C
Pomatoschistus minutus (Pallas, 1770)
LC
R
Knipowitschia cameliae Nalbant & Otel,
CR
1995
Knipowitschia longecaudata (Kessler,
E
NT
1877)
N
C
Zosterisessor ophiocephalus (Pallas, 1814)
CR
R
C
Neogobius syrman (Nordmann, 1840)
LC
R
Neogobius rjmaguire@e-solventa.comatan
V
VU
(Nordmann, 1840)
U
Chromogobius quadrivittatus
C
(Steindachner, 1863)
R
C
Gobius bucchichi Steindachner, 1870
R
E
Gobius cobitis Pallas, 1814
N
E
Proterorhinus marmoratus (Pallas, 1814)
LC
N
Benthophiloides brauneri Beling &Iljin,
V
CR
1927
U
Scorpaena porcus
Linne,
1758
VU
Chelidonichthys lucernus (Linne, 1758)
VU
DD
Platichthys flesus
(Linne,
1758)
VU
Pegusa lascaris
(Risso,
1810)
VU
Bufo calamita Laurenti, 1768
VU
Emys orbicularis (Linne, 1758)
EN
Gavia stellata (Pontopiddan, 1763)
EN
Gavia arctica (Linne, 1758)
VU
Gavia immer
(Brunnich,
1764)
VU
Tachybaptus ruficollis (Pallas, 1764)
EN
Podiceps nigricollis Brehm, 1831
EN
Podiceps auritus
(Linne,
1758)
EN
Podiceps cristatus
(Linne,
1758)
EN
Puffinus yelkouan (Acaerbi, 1827)
VU
Phalacrocorax pygmaeus (Pallas, 1773)
EN
VU
185
IUCN regional status
Species
B
RO UA RU GE TR
G
Phalacrocorax aristotelis (Linnaeus, 1761)
DD
VU
Pelecanus onocrotalus Linne, 1758
EN
VU
Pelecanus crispus Bruch, 1832
CR VU
Ixobrychus minutus
(Linne,
1758)
EN
Nycticorax nycticorax
(Linne,
1758)
EN
Ardeola ralloides (Scopoli, 1769)
EN
VU
Egretta garzetta (Linne, 1766)
EN
Egretta alba
Linne,
1758
EN
Ardea cinerea Linne, 1758
EN
Ardea purpurea
Linne,
1766
EN
Ciconia nigra Linne, 1758
VU
VU
Plegadis falcinellus (Linne, 1766)
EN
VU
Platalea leucorodia Linne, 1758
EN
VU
Anser erythropus
(Linne,
1758)
VU
Branta ruficollis (Pallas, 1769)
EN
VU
Tadorna ferruginea (Pallas, 1764)
VU
VU
Tadorna tadorna
(Linne,
1758)
EN
Anas penelope Linne, 1758
EN
Anas strepera Linne, 1758
EN
Anas querquedula Linne, 1758
EN
Netta rufina
(Pallas,
1773)
EN
Aythya nyroca (Guldenstadt, 1770)
EN
VU
Mergus albellus
Linne,
1758
EN
Mergus serrator Linne, 1758
EN
VU
Mergus merganser Linne, 1758
EN
Oxyura leucocephala (Scopoli, 1769)
CR DD
Pandion haliaetus
(Linne,
1758)
VU
Rallus aquaticus Savigny, 1809
VU
Grus grus Linne, 1758
EN
VU
Anthropoides virgo Linne, 1758
RE EN
Haematopus ostralegus (Linne, 1758)
EN
NT
Himantopus himantopus (Linne, 1758)
EN
Recurvirostra avosetta (Linne, 1758)
EN
Charadrius dubius
(Scopoli,
1786)
EN
Charadrius alexandrinus (Linne, 1758)
EN
NT
186
IUCN regional status
Species
B
RO UA RU GE TR
G
Charadrius hiaticula
(Linne,
1758)
EN
Pluvialis apricaria
(Linne,
1758)
VU
Pluvialis squatarola
(Linne,
1758)
EN
Arenaria interpres Brisson, 1760
VU
Charadrius morinellus Linne, 1758
CR
Vanellus vanellus
(Linne,
1758)
EN
Calidris alpina
Linne,
1758
EN
Limicola falcinellus
(Pontoppidan,
1763)
EN
Lymnocryptes minimus
(Brunnich,
1764)
EN
Gallinago media Latham, 1787
EN
Limosa limosa (Linne, 1758)
EN
Numenius arquata (Linne, 1758)
EN
VU
Numenius phaeopus (Linne, 1758)
DD
VU
Numenius tenuirostris Vieillot, 1817
DD
EN
Tringa totanus (Linne, 1758)
EN
Tringa glareola
Linne,
1758
EN
Tringa stagnatilis (Bechstein, 1803)
DD
VU
Phalaropus lobatus
(Linne,
1758)
VU
Phalaropus fulicarius
(Linne,
1758)
VU
Stercorarius pomarinus (Temminck, 1815)
VU
Stercorarius parasiticus
(Linne,
1758)
VU
Larus melanocephalus Temminck, 1820
EN
Larus minutus
Pallas,
1776
EN
Larus genei Breme, 1839
EN
Larus canus
Linne,
1758
EN
Larus ichthyaetus Pallas, 1773
DD
VU
Sterna nilotica Gmelin, 1789
EN
Sterna caspia Pallas, 1770
EN
NT
Sterna sandvicensis Latham, 1787
EN
Sterna albifrons
Pallas,
1764
EN
Chlidonias hybridus
Pallas,
1811
EN
Chlidonias niger
(Linne,
1758)
EN
Chlidonias leucopterus (Temminck, 1815)
EN
Alcedo atthis
(Linne,
1758)
EN
Arvicola amphibius
(Linne,
1758)
EN
187
IUCN regional status
Species
B
RO UA RU GE TR
G
Neomys fodiens (Pennant, 1771)
EN
Desmana moschata (Linnaeus, 1758)
DD EN
Lutra lutra (Linne, 1758)
EN
VU
Mustela lutreola (Linne, 1761)
EN
VU
V
Phocoena phocoena (Linne, 1758)
DD EN
VU VU
U
V
Delphinus delphis Linne, 1758
EN DD
LC
U
V
Tursiops truncatus (Montagu, 1821)
EN NT
DD
U
R
Monachus monachus (Hermann, 1779)
RE
RE
CR
E
RE = regionally extinct
CR = critically endagered
EN = endangered
VU = vulnerable
NT = near threatened
LC = least concern
DD = data deficient
188
189
Annex 6: INVENTORY OF AQUATIC AND SEMI-AQUATIC ALIEN SPECIES INTRODUCED TO
THE BLACK SEA AND COASTAL HABITATS
First
occurence,
Establish
when available
Invasiveness
Species
Higher taxon
Status
Vector(s)
ment
Native range
Reference
group
(First
(at present)
success
published
Ecofunctional
record)
Asterionellopsis glacialis
Zaitsev & ųzt³rk
1967 Bacillariophyta
Alien Unknown TE
Unknown
Atlantic, Pacific
(Castracane) Round 1990
(2001)
Chaetoceros diversum var.
Aleksandrov et al.
1999 Bacillariophyta
Alien Unknown TE
Unknown
Pacific
papilionis Senicheva, 2002
(2006)
Chaetoceros tortissimum Gran,
Aleksandrov et al.
2001 Bacillariophyta
Alien Unknown TE
Unknown
N
Europe
1900
(2006)
Detonula pumila (Castracane) Gran
Moderately
Prodanov et.al.
1999 (2001)
Bacillariophyta Alien
Ships
RE
cosmopolitan
1900
invasive
(2001)
Lioloma pacificum (Cupp) Hasle,
1999 Bacillariophyta
Alien Ships TE
Unknown
Indian
Ocean
Zaitsev et al. (2004)
1996
Pseudosolenia calcar-avis
Highly
Atlantic, Indo-
Zaitsev & ųzt³rk
1924 Bacillariophyta
Alien Ships
PE
(Schultze) Sundstr÷m, 1986
invasive
Pacific
(2001)
N Atlantic, Pacific,
Rhizosolenia setigera Brightwell
1987-1997
Velikova et al.
Bacillariophyta Alien
Ships
TE Non-invasive
North Sea, Baltic
Phytoplankton
1858
(1999)
(1999)
Sea, Mediterranean
Scrippsiella trochoidea (Stein)
1999 Bacillariophyta
Alien Ships
RE Non-invasive
Atlantic
Cinar et al. (2005)
(Loeblich III, 1976)
Skeletonema subsalsum (A. Cleve)
European water
Aleksandrov et al.
1993 Bacillariophyta
Alien Unknown PE
Unknown
Bethge, 1928
bodies
(2006)
Thalassiosira nordenskioeldii
Zaitsev & ųzt³rk
1986 Bacillariophyta
Alien Unknown TE
Unknown
N
Europe
Cleve, 1873
(2001)
Alexandrium acatenella (Whed. Et.
Zaitsev & ųzt³rk
2001 Dinophyta Alien Ships
TE
Unknown
Pacific
Ocean
Kof.), 1985
(2001)
190
First
occurence,
Establish
when available
Invasiveness
Species
Higher taxon
Status
Vector(s)
ment
Native range
Reference
group
(First
(at present)
success
published
Ecofunctional
record)
Alexandrium affine (Inue et
Zaitsev & ųzt³rk
2001 Dinophyta Alien Ships
TE
Unknown
Asia
SE
Fukuyo) Balech, 1985
(2001)
Alexandrium monilatum Howel, F.J.
Ships,
Moderately
Atlantic ocean, Gulf Moncheva et.al.
1991 (1995)
Dinophyta
Alien
PE
Taylor 1979
diffusion
invasive
of Mexico
(1995)
Alexandrium pseudogonyaulax
(Biecheler) Horiguchi ex Yuki et
2002
Dinophyta
Alien
Ships
TE
Unknown
Asia SE
Zaitsev et al. (2004)
Fukuyo, 1992
Alexandrium tamarense (Lebour)
2001 Dinophyta Alien Ships TE
Unknown
Cosmopolitan
Zaitsev et al. (2004)
Balech, 1995
Petalodinium porcelio J.and M.
1995-1996
Mediterranean,
Dinophyta Cryptogenic Ships
TE
Non-invasive
Stoyanova (1999)
Cachon 1968
(1999)
Atlantic N.E.
Scaphodinium mirabile Margalef
1995-1996 (1999) Dinophyta
Cryptogenic Ships
TE
Non-invasive Mediterranean
Stoyanova (1999)
Mediterranean,
Spatulodinium pseudonoctiluca
1995-1996 (1999) Dinophyta
Cryptogenic Ships
TE
Non-invasive Atlantic N.E. and
Stoyanova (1999)
(Pouchet) J.and M. Cachon 1968
Japanese Sea
Oxyphysis oxytoxoides (Kofoid,
Moderately
Moncheva et.al.
1991 (1995)
Dinophyta
Alien
Ships
PE
Alaska, California
1926)
invasive
(1995)
Gymnodinium aureolum (Hulburt)
2002
Dinophyta
Alien
Ships
TE
Unknown
N America
Zaitsev et al. (2004)
Hansen, 2000
Atlantic Ocean,
Gymnodinium impudicum (S. Fraga
Aleksandrov et al.
2001 Dinophyta Alien Unknown TE
Unknown
Mediterranean,
& I. Bravo) Hansen & Moestrup
(2006)
Pacific Ocean
Gymnodinium radiatum Kofoid et
Aleksandrov et al.
1998 Dinophyta Alien Unknown TE
Unknown
Pacific
Ocean
Swezy 1921
(2006)
Gymnodinium uberrimum (Allman),
Moderately
Moncheva et.al.
1994 (1995)
Dinophyta
Alien
Ships
PE
Europe inland
Kofoid and Swezy, 1921
invasive
(1995)
191
First
occurence,
Establish
when available
Invasiveness
Species
Higher taxon
Status
Vector(s)
ment
Native range
Reference
group
(First
(at present)
success
published
Ecofunctional
record)
Cochlodinium polykrikoides
N America, Indian
2001 Dinophyta Alien Ships
TE
Unknown
Zaitsev et al. (2004)
Margelef, 1961
Ocean
Pronoctiluca pelagica Fabre-
Aleksandrov et al.
1983 Dinophyta Alien Unknown TE
Unknown Cosmopolitan
Domerque, 1889
(2006)
Prorocentrum minimum (Pavillard)
Aleksandrov et al.
1948 Dinophyta Alien Unknown PE
Unknown Cosmopolitan
Schiller, 1933
(2006)
Mantoniella squamata (Manton et
Diffusion/Sh
Highly
Atlantic
Mihnea & Dragos
198x (1997)
Chlorophyta
Cryptogenic
PE
Parke, 1960)
ips
invasive
Mediterranean
(1997)
Pterosperma cristatum Schiller,
Mediterranean,
Aleksandrov et al.
1948 Chlorophyta Alien Unknown PE
Unknown
1925
Pacific Ocean
(2006)
Pterosperma joergenseni Schiller,
Aleksandrov et al.
1948 Chlorophyta Alien Unknown PE
Unknown
Mediterranean
1925
(2006)
Pyramimonas longicauda Van Meel
2001
Chlorophyta
Alien
Ships
TE
Unknown
Pacific Ocean
Zaitsev et al. (2004)
1984
Poropila dubia Schiller, 1925
Aleksandrov et al.
1948 Chlorophyta Alien Unknown PE
Unknown
Mediterranean
(Vergr., 1911-1914)
(2006)
Mediterranean,
Apedinella spinifera Throndsen,
Aleksandrov et al.
1999 Chrysophyta Alien Unknown RE
Unknown
Atlantic Ocean,
1971
(2006)
Pacific Ocean
Bacteriastrum hyalinum Lauder,
Aleksandrov et al.
1907 Chrysophyta Alien Unknown NE
Unknown
Atlantic
Ocean
1864
(2006)
Distephanus speculum f. octonarius
Aleksandrov et al.
1979 Chrysophyta Alien Unknown TE
Unknown
Atlantic
Ocean
(Ehrenberg) S. Locker & E. Martini
(2006)
Octactis octonaria (Ehrenberg)
Aleksandrov et al.
1948 Chrysophyta Alien Unknown PE
Unknown
Mediterranean
Hovasse, 1946
(2006)
Hillea fusiformis (Schiller) Schiller,
Aleksandrov et al.
1948 Cryptophyta Alien Unknown PE
Unknown
Mediterranean
1925
(2006)
192
First
occurence,
Establish
when available
Invasiveness
Species
Higher taxon
Status
Vector(s)
ment
Native range
Reference
group
(First
(at present)
success
published
Ecofunctional
record)
Phaeocystis pouchetii Hariot
Highly
Atlantic, Pasific,
Petrova-Karadjova
1989 (1990)
Haptophyta
Alien
Ships
PE
(Lagerheim, 1893)
invasive
North Sea, Arctic
(1990)
Aleksandrov et al.
Ectocarpus caspicus Henckel, 1909
1980 Phaeophyta Alien Unknown TE
Unknown
Caspian
Sea (2006)
Aleksandrov et al.
Cocconeis britannica Naegeli, 1849
1902 Bacillariophyta
Cryptogenic Unknown NE
Unknown
N
Europe
(2006)
Navicula finmarchica (Cleve &
N Europe, Pacific
Aleksandrov et al.
1970 Bacillariophyta
Alien Unknown TE
Unknown
Grunow) Cleve 1895
Ocean
(2006)
Nitzschia sigmoidea (Nitzsch) W.
N Europe, Europe
Aleksandrov et al.
1986 Bacillariophyta
Alien Unknown TE
Unknown
Smith, 1853
water bodies
(2006)
Aleksandrov et al.
-
phytobenthos
Toxonidea insignis Donkin, 1858
1902 Bacillariophyta
Cryptogenic Unknown NE
Unknown
N
Europe
(2006)
Undatella quadrata (Brebisson)
Aleksandrov et al.
1985 Bacillariophyta
Alien Unknown TE
Unknown
N
Europe
Micro
Paddock et Sims, 1980
(2006)
Pinnularia trevelyana (Donkin)
Aleksandrov et al.
1902 Bacillariophyta
Cryptogenic Unknown NE
Unknown
N
Europe
Rabenhenhorst, 1861
(2006)
Ships,
Desmarestia viridis (M³ll).
Moderately
Atlantic,
Minicheva &
1992 (1993)
Phaeophyceae Alien
Natural
PE
(Lamouroux, 1813)
invasive
Meditteranean
Eryomenko (1993)
expansion
Ectocarpus siliculosus
1973 Phaeophyceae
Alien Ships
PE
Non-invasive
Atlantic
Cinar et al. (2005)
(Dillwyn)(Lyngbye, 1819)
Halothrix lumbricalis
2004 Phaeophyta Alien Ships
RE
Non-invasive
Atlantic
Cinar et al. (2005)
(K³tzing)(Reinke, 1888)
Macroalgae
Pilayella littoralis (Linnaeus,
(phytobenthos)
1998 Phaeophyta Alien Ships
RE
Non-invasive
Atlantic
Cinar et al. (2005)
(Kjellman, 1872)
Acrochaetium codicolum
1996 Rhodophyta Alien Ships
RE
Non-invasive
Atlantic
Cinar et al. (2005)
(Borgesen, 1927)
193
First
occurence,
Establish
when available
Invasiveness
Species
Higher taxon
Status
Vector(s)
ment
Native range
Reference
group
(First
(at present)
success
published
Ecofunctional
record)
Asparagopsis armata (Harvey,
1973 Rhodophyta Alien Ships
PE
Non-invasive
Atlantic
Cinar et al. (2005)
1855)
Chondrophycus papillosus (C.
1973 Rhodophyta Alien Ships
PE
Non-invasive
Red
Sea
Cinar et al. (2005)
Agardh)( Garbary & Harper, 1998)
Laurencia intermedia (Yamada,
1986 Rhodophyta Alien Ships
PE
Non-invasive
Red
Sea,
Cinar et al. (2005)
1931)
Polysiphonia fucoides (Hudson)
1973 Rhodophyta Alien Ships
PE
Non-invasive
Atlantic
Cinar et al. (2005)
(Greville, 1824)
Polysiphonia paniculata (Montagne,
1986 Rhodophyta Alien Ships
PE
Non-invasive
Atlantic
Cinar et al. (2005)
1842)
Ulva fasciata (Delile, 1813)
1990
Chlorophyta
Alien
Lessepsian
PE
Non-invasive Red Sea
Cinar et al. (2005)
Moderately
Acorus calamus L.
18xx (2000)
Magnoliophyta
Alien
Unknown
PE
Asia SE
Ciocarlan (2000)
invasive
Arundo donax L.
196x (2000)
Magnoliophyta
Alien
Agriculture
PE Non-invasive
Asia
inland
Ciocarlan
(2000)
Zaitsev & ųzt³rk
Azolla caroliniana Wild.
196x-197x Pterydophyta Alien
Ships
PE Unknown MesoAmerica (2001)
Azolla filiculoides Lamarck
1916
Pterydophyta
Alien
Diffusion
PE
Non-invasive N Am. inland
Ciocarlan (2000)
Azolla mexicana C.Presl. (auct non
1916
Pterydophyta
Alien
Diffusion
PE
Non-invasive N Am. inland
Ciocarlan (2000)
Willd.)
Bidens connata Willd.
18xx
Magnoliophyta
Alien
Unknown
PE
Non-invasive N Am. inland
Ciocarlan (2000)
Moderately
Bidens frondosa L.
18xx Magnoliophyta
Alien Unknown PE
N Am. inland
Ciocarlan (2000)
Vascular plant
invasive
Bidens vulgata E.L.Greene
18xx
Magnoliophyta
Alien
Unknown
PE
Non-invasive N Am. inland
Ciocarlan (2000)
Moderately
Brachyactis ciliata Ledeb.
18xx Magnoliophyta
Alien Unknown PE
Asia inland
Ciocarlan (2000)
invasive
Cyperus difformis L.
19xx Magnoliophyta
Alien Agriculture PE
Non-invasive
Azores
Ciocarlan
(2000)
Cyperus odoratus L.
18xx
Magnoliophyta
Alien
Unknown
PE
Non-invasive N Am. inland
Ciocarlan (2000)
194
First
occurence,
Establish
when available
Invasiveness
Species
Higher taxon
Status
Vector(s)
ment
Native range
Reference
group
(First
(at present)
success
published
Ecofunctional
record)
Moderately
Elodea canadensis Michaux, 1791
189x Magnoliophyta
Alien Diffusion PE
N Am. inland
Ciocarlan (2000)
invasive
Highly
Elodea nuttallii (Planchon) St.John
19xx Magnoliophyta
Alien Diffusion PE
N Am. inland
Ciocarlan (2000)
invasive
Heliotropium curassavicum L.
18xx
Magnoliophyta
Alien
Ships
PE
Non-invasive N Am. inland
Ciocarlan (2000)
Hordeum jubatum L.
18xx
Magnoliophyta
Alien
Unknown
PE
Non-invasive Asia Far East
Ciocarlan (2000)
Highly
Juncus tenuis Willd.
18xx Magnoliophyta
Alien Unknown PE
N Am. inland
Ciocarlan (2000)
invasive
Highly
Lemna minuta H.B.K.
18xx Magnoliophyta
Alien Unknown PE
N Am. inland
Ciocarlan (2000)
invasive
Monochoria korsakowii Regel et
19xx Magnoliophyta
Alien Agriculture PE
Non-invasive
Asia
inland Ciocarlan
(2000)
Maack
Oryza sativa L.
19xx Magnoliophyta
Alien Agriculture TE
Non-invasive
Asia
SE
Ciocarlan
(2000)
Populus canadensis Moench.
18xx
Magnoliophyta
Alien
Agriculture
PE
Non-invasive N Am. inland
Ciocarlan (2000)
Moderately
Sagittaria latifolia Willd.
18xx Magnoliophyta
Alien Ornamental PE
N Am. inland
Ciocarlan (2000)
invasive
Sagittaria trifolia L.
18xx Magnoliophyta
Alien Unknown PE
Non-invasive
Asia
inland Ciocarlan
(2000)
Salix babylonica L.
18xx
Magnoliophyta
Alien
Ornamental
PE
Non-invasive Asia Far East
Ciocarlan (2000)
Salix rigida Muhlenb.
18xx
Magnoliophyta
Alien
Agriculture
PE
Non-invasive N Am. inland
Ciocarlan (2000)
Moderately
Vallisneria spiralis L.
19xx Magnoliophyta
Alien Ornamental PE
N Am. inland
Ciocarlan (2000)
invasive
Veronica peregrina L.
18xx Magnoliophyta
Alien Unknown PE
Non-invasive
S
America
Ciocarlan
(2000)
Xanthium orientale L.
18xx
Magnoliophyta
Alien
Unknown
PE
Non-invasive N Am. inland
Ciocarlan (2000)
Atlantic, Pacific,
Aleksandrov et al.
Eutintinnus lusus-undae Entz, 1885
2001 Ciliophora Alien Unknown TE
Non-invasive
Indian Ocean
(2006)
ton
Mediterranea,n
Salpingella aff. rotundata Kofoid &
Aleksandrov et al.
Zooplank
2002 Ciliophora Alien Unknown TE
Unknown
Pacific
Ocean
Campbell, 1929
(2006)
195
First
occurence,
Establish
when available
Invasiveness
Species
Higher taxon
Status
Vector(s)
ment
Native range
Reference
group
(First
(at present)
success
published
Ecofunctional
record)
Eudoxoides spiralis (Bigelow,
Natural
Atlantic
1978 (1980)
Hydrozoa
Cryptogenic
NE Non-invasive
Porumb (1980)
1911)
expansion
Mediterranean
Atlantic
Rathkea octopunctata (Sars, 1835)
1957 (1959)
Hydrozoa
Alien
Diffusion
NE
Non-invasive
Porumb (1959b)
Mediterranean
Highly
N America E coast,
Mnemiopsis leidyi Agassiz 1865
1982 Ctenophora Alien Ships
PE
Zaitsev et al (1988)
invasive
S America E coast
Natural
Gomoiu & Skolka
Highly
Beroe ovata Bruguiere 1789
1996 (1998)
Ctenophora
Alien
expansion or
PE
Atlantic
(1998); Konsulov &
invasive
Ships
Kamburska (1998)
Natural
Verruca spengleri Darwin, 1854
1959 Crustacea Alien
NE Non-invasive
Mediterranean Porumb
(1959a)
expansion
Western Atlantic,
Ships,
Zaitsev & ųzt³rk
Acartia tonsa Dana, 1849
1976 Crustacea Alien
PE Non-invasive
Indian and Pacific
Canals
(2001)
Oceans
Natural
Calocalanus pavo (Dana, 1849)
1978 (1980)
Crustacea Alien
NE Non-invasive
Mediterranean Porumb
(1980)
expansion
Clausocalanus arcuicornis (Dana,
Natural
1978 (1980)
Crustacea Alien
NE Non-invasive
Mediterranean Porumb
(1980)
1849)
expansion
Ctenocalanus vanus Giesbrecht,
Natural
1978 (1980)
Crustacea Alien
NE Non-invasive
Mediterranean Porumb
(1980)
1888
expansion
Cymbasoma rigidum Thompson,
Natural
Porumb (1975)
1975 Crustacea Alien
NE Non-invasive
Mediterranean
1888
expansion
(teza)
Cymbasoma thompsoni (Giesbrecht,
Natural
Porumb (1975)
1975 Crustacea Alien
NE Non-invasive
Mediterranean
1892)
expansion
(teza)
Ischnocalanus plumulosus (Claus,
Natural
1978 (1980)
Crustacea Alien
NE Non-invasive
Mediterranean Porumb
(1980)
1863)
expansion
Labidocera brunescens
Natural
1978 (1980)
Crustacea Cryptogenic
TE Non-invasive
Mediterranean Porumb
(1980)
(Czerniavski, 1868)
expansion
196
First
occurence,
Establish
when available
Invasiveness
Species
Higher taxon
Status
Vector(s)
ment
Native range
Reference
group
(First
(at present)
success
published
Ecofunctional
record)
Mecynocera clausi I.C. Thompson,
Natural
1978 (1980)
Crustacea Alien
NE Non-invasive
Mediterranean Porumb
(1980)
1888
expansion
Mesocalanus tenuicornis (Dana,
Natural
1978 (1980)
Crustacea Alien
NE Non-invasive
Mediterranean Porumb
(1980)
1849)
expansion
Monstrilla grandis Giesbrecht,
Natural
Porumb (1975)
(1975) Crustacea Alien
NE Non-invasive
Mediterranean
1891
expansion
(teza)
Monstrilla helgolandica Claus,
Natural
Porumb (1975)
(1975) Crustacea Alien
NE Non-invasive
Mediterranean
1863
expansion
(teza)
Monstrilla longicornis Thompson,
Natural
Porumb (1975)
(1975) Crustacea Alien
NE Non-invasive
Mediterranean
1890
expansion
(teza)
Natural
Neocalanus gracilis (Dana, 1849)
1978 (1980)
Crustacea Alien
NE Non-invasive
Mediterranean Porumb
(1980)
expansion
Natural
Oncaea mediterranea (Claus, 1863)
1978 (1980)
Crustacea Alien
NE Non-invasive
Mediterranean Porumb
(1980)
expansion
Aleksandrov et al.
Oncaea minuta Giesbrecht, 1892
1997 Crustacea Alien Unknown RE
Non-invasive
Indo-West
Pacific
(2006)
Paracalanus aculeatus Giesbrecht,
Natural
1978 (1980)
Crustacea Alien
NE Non-invasive
Mediterranean Porumb
(1980)
1888
expansion
Natural
Paracalanus nanus Sars, 1907
1978 (1980)
Crustacea Alien
NE Non-invasive
Mediterranean Porumb
(1980)
expansion
Natural
Phaenna spinifera Claus, 1863
1978 (1980)
Crustacea Alien
NE Non-invasive
Mediterranean Porumb
(1980)
expansion
Oithona brevicornis Giesbrecht,
Atlantic Ocean,
Aleksandrov et al.
2001 Crustacea Alien Ships
TE
Unknown
1891
Indo-Pacific
(2006)
Aleksandrov et al.
Oithona plumifera Baird, 1843
2001 Crustacea Alien Unknown TE
Unknown
Cosmopolitan (2006)
197
First
occurence,
Establish
when available
Invasiveness
Species
Higher taxon
Status
Vector(s)
ment
Native range
Reference
group
(First
(at present)
success
published
Ecofunctional
record)
Aleksandrov et al.
Oithona setigera Dana, 1852
2001 Crustacea Alien Unknown TE
Unknown
Unknown
(2006)
Aleksandrov et al.
Rhincalanus sp.
1997 Crustacea Alien Unknown TE
Unknown
Unknown
(2006)
Aleksandrov et al.
Scolecithrix sp.
2001 Crustacea Alien Unknown TE
Unknown
Unknown
(2006)
Callianassa truncata (Giard et
Natural
1948 (1967)
Crustacea Cryptogenic
NE Non-invasive
Mediterranean Bacescu
(1967)
Bonnier, 1890)
expansion
Natural
Stylocheiron sp.
1978 (1980)
Crustacea Alien
NE Non-invasive
Mediterranean Porumb
(1980)
expansion
Blackfordia virginica Mayer 1910
193x (1936)
Hydrozoa
Alien
Ships
PE
Non-invasive N American E coast Valkanov (1936)
Zoobenthos/
Zooplankton
Bougainvillia megas (Kinne, 1956)
19xx (1933)
Hydrozoa
Cryptogenic Ships
PE
Non-invasive Atlantic
Paspalev (1933)
Bougainvillia muscus (Van
Moderately
Zaitsev & ųzt³rk
1960 Hydrozoa Alien Ships
PE
Atlantic Ocean
Beneden, 1844)
invasive
(2001)
Eudendrium capillare Allman, 1856
1990 Hydrozoa Alien Unknown TE
Unknown Cosmopolitan Shadrin
(1999)
Eudendrium vaginatum Allman,
N America, Atlantic
1990 Hydrozoa Alien Unknown TE
Unknown
Shadrin (1999)
1863
Ocean
Zoobenthos
E North Atlantic,
Aleksandrov et al.
Pachycordyle navis (Millard, 1959)
197x Hydrozoa Cryptogenic Unknown NE
Non-invasive
Southern Africa,
(2006)
Black Sea
198
First
occurence,
Establish
when available
Invasiveness
Species
Higher taxon
Status
Vector(s)
ment
Native range
Reference
group
(First
(at present)
success
published
Ecofunctional
record)
Tiaropsis multicirrata (M.Sars,
E North Atlantic,
1990 Hydrozoa Alien Unknown TE
Unknown
Shadrin (1999)
1835)
Arctic Ocean
Moderately
Bacescu et al.
Haliplanella luciae (Verrill 1899)
196x (1971)
Anthozoa
Alien
Ships
PE
NW Pacific
invasive
(1971)
Mediterranean,
Balanus amphitrite Darvin, 1854
1905 Crustacea Alien Ships NE
Unknown
Zaitsev et al. (2004)
Atlantic Ocean
N American E
Zaitsev & ųzt³rk
Balanus eburneus (Gould, 1841)
1892 Crustacea Alien Ships PE
Non-invasive
coast; S America E (2001)
coast
N Atlantic, N
Gomoiu & Skolka
Highly
Balanus improvisus Darwin, 1854
1844 Crustacea Alien Ships
PE
Pacific,
(1996); Zaitsev &
invasive
Mediterranean
ųzturk (2001)
(1933)
Natural
Chthamalus stellatus (Poli 1795)
Crustacea Alien
PE Non-invasive
Mediterranean
Borcea (1933)
expansion
Skolka & Gomoiu
Sphaeroma walkeri Stebbing, 1905
2002 (2004)
Crustacea Alien
Ships
TE
Non-invasive
Indo-Pacific (2004)
Nannastacus euxinicus Bacescu,
Natural
Mediterranean,
1951 Crustacea Cryptogenic
NE Non-invasive
Bacescu (1951)
1951
expansion
Black Sea
Atlantic Ocean,
Aleksandrov et al.
Idyella pallidula Sars, 1905
1964 Crustacea Alien Unknown TE
Non-invasive
Pacific Ocean
(2006)
Paramphiascella vararensis (T
Atlantic Ocean,
Aleksandrov et al.
1964 Crustacea Alien Unknown TE
Non-invasive
Scott, 1903)
Pacific Ocean
(2006)
Atlantic Ocean,
Proameira simplex (Norman & T
Aleksandrov et al.
1964 Crustacea Alien Unknown TE
Non-invasive
Mediterranean,
Scott, 1905)
(2006)
Pacific Ocean
Robertgurneya rostrata (Gurney,
Atlantic Ocean,
Aleksandrov et al.
1964 Crustacea Alien Unknown TE
Non-invasive
1927)
Pacific Ocean
(2006)
199
First
occurence,
Establish
when available
Invasiveness
Species
Higher taxon
Status
Vector(s)
ment
Native range
Reference
group
(First
(at present)
success
published
Ecofunctional
record)
Amphiascus tenuiremis (Brady &
Atlantic Ocean,
Aleksandrov et al.
1996 Crustacea Alien Unknown NE
Unknown
Robertson in Brady, 1880)
Pacific Ocean
(2006)
Macrobrachium rosenbergii (De
Aleksandrov et al.
1990-1992 Crustacea
Alien
Aquaculture TE Non-invasive
Indo-Pacific
Man, 1879)
(2006)
Alpheus dentipes Guerin-Meneville,
Natural
Europe W coast,
1966 (1973)
Crustacea Alien
PE Non-invasive
Bulgurkov (1973)
1832
expansion
Mediterranean
Callinectes sapidus Rathbun, 1896
1967 (1968)
Crustacea
Alien Ships
PE
Non-invasive
N
American E coast Bulgurkov (1968)
Eriocheir sinensis H. Milne-
Canals,
Moderately
(1934) Crustacea Alien
PE
Asia Far East
Vasiliu (1934)
Edwards, 1853
Ships
invasive
Marsupenaeus japonicus (Bate
Zaitsev & ųzt³rk
1977 Crustacea Alien Aquaculture NE Non-invasive Asia
SE
1888)
(2001)
Rhithropanopeus harrisii (Gould,
Moderately
Zaitsev & ųzt³rk
1937 Crustacea Alien Ships
PE
N American E coast
1841)
invasive
(2001)
Pandalus kessleri Czerniavsky,
Zaitsev & ųzt³rk
1959 Crustacea Alien Aquaculture
NE Non-invasive
Asia Far East
1878
(2001)
Hemianax ephippiger (Burmeister,
Natural
(1898) Insecta
Alien
TE Non-invasive
Africa
Inland
McLachlan
(1898)
1839)
expansion
Corambe obscura (Verrill, 1870)
1980 (1994)
Gastropoda
Alien
Ships
PE
Non-invasive W Atlantic
Sinegub (1994)
Moderately
Physella acuta (Draparnaud, 1805)
195x (1987)
Gastropoda
Alien
Unknown
PE
S Europe
Grossu (1987)
invasive
Aleksandrov et al.
Physella heterostropha (Say, 1817)
2004 Gastropoda Alien Unknown TE
Unknown
N
American
inland
(2006)
Potamopyrgus antipodarum (Gray,
Moderately
194x (1951)
Gastropoda
Alien
Ships
PE
New Zealand
Grossu (1951)
1843)
invasive
Kaneva-Abadjieva
Rapana venosa (Valenciennes,
Highly
1954 Gastropoda Alien Ships
PE
Asia SE
(1958); Zaitsev &
1846)
invasive
ųzt³rk (2001)
200
First
occurence,
Establish
when available
Invasiveness
Species
Higher taxon
Status
Vector(s)
ment
Native range
Reference
group
(First
(at present)
success
published
Ecofunctional
record)
Neptunea arthritica (Bernardi,
Aleksandrov et al.
2000 Gastropoda Alien Unknown TE
Unknown
Indo-Pacific
1857)
(2006)
N America, Atlantic
Ercolania viridis (A. Costa, 1866)
2001 Gastropoda Alien Ships
TE
Non-invasive
Zaitsev et al. (2004)
Ocean
Anadara inaequivalvis (Bruguiere,
Moderately
Marinov et al.
1982 (1983)
Bivalvia
Alien
Ships
PE
Asia SE
1789)
invasive
(1983)
Corbicula fluminea (O.F.Muller
Moderately
Micu & Telembici
2000 Bivalvia
Alien Canals
RE
Asia Inland
1774)
invasive
(2004)
Ships,
Zaitsev & ųzt³rk
Crassostrea gigas Thunberg, 1793
190x Bivalvia
Alien
PE
Non-invasive Asia Far East
Aquaculture
(2001)
Crassostrea virginica (Gmelin
NIMRD internal
1973
Bivalvia
Alien
Aquaculture
PE
Non-invasive N Am. E coast
1791)
reports (Csernok E.)
Dreissena bugensis (Andrussov
Moderately
Micu & Telembici
2004 Bivalvia
Alien Ships
RE
Dniepr River basin
1897)
invasive
(2004)
Hypanis vitrea glabra (Ostroumoff,
Aleksandrov et al.
2004 Bivalvia
Alien Unknown TE
Unknown
Caspian
Sea
1905)
(2006)
Musculista senhousia (Benson in
2002 (2004)
Bivalvia
Alien
Ships
TE
Non-invasive NW Pacific
Micu (2004a,b)
Cantor, 1842)
Mytilopsis leucophaeata (Conrad,
Moderately
Aleksandrov et al.
2000 Bivalvia
Alien Ships
TE
N America
1831)
invasive
(2006)
Mytilus edulis Linnaeus, 1758
2001
Bivalvia
Alien
Aquaculture
TE
Unknown
Atlantic
Zaitsev et al. (2004)
Mytilus trossulus Gould, 1850
2001
Bivalvia
Alien
Ships
TE
Unknown
Pacific Ocean
Zaitsev et al. (2004)
Highly
Zaitsev & ųzt³rk
Mya arenaria Linnaeus, 1758
1966 Bivalvia
Alien Ships
PE
N American E coast
invasive
(2001)
D. Micu
Pteria hirundo (Linne, 1758)
(2002) Bivalvia
Alien Ships
TE
Non-invasive
Mediterranean unpublished data
201
First
occurence,
Establish
when available
Invasiveness
Species
Higher taxon
Status
Vector(s)
ment
Native range
Reference
group
(First
(at present)
success
published
Ecofunctional
record)
NIMRD internal
Ruditapes philippinarum (Adams
(1985) Bivalvia
Alien Aquaculture NE
Non-invasive
Asia
SE
reports (Telembici
and Reeve 1850 )
A.)
Moderately
Sarkany-Kiss
Sinanodonta woodiana (Lea 1834)
1962 (1986)
Bivalvia
Alien
Aquaculture
PE
Asia Far East
invasive
(1986)
Diffusion,
Gomoiu & Skolka
Teredo navalis Linne 1758
700-500 B.C.
Bivalvia
Cryptogenic
PE Non-invasive
N
Atlantic
Ships
(1996)
Ficopomatus enigmaticus (Fauvel,
Moderately
1935 (1957)
Polychaeta
Alien
Ships
PE
India Marinov
(1957)
1923)
invasive
N Atlantic, N
Dipolydora quadrilobata Jacobi,
Highly
Todorova &
199x Polychaeta Alien Ships
PE
Pacific, Arctic,
1883
invasive
Panayotova (2006)
Mediterranean
Atlantic Ocean,
Aleksandrov et al.
Glycera capitata Oersted, 1843
197x Polychaeta Alien Ships
TE
Non-invasive
Mediterranean,
(2006)
Pacific Ocean
Hesionides arenaria Friedrich,
Mediterranean-
(1954) Polychaeta Cryptogenic Unknown PE
Non-invasive
Valkanov (1954)
1937
Atlantic
Magelona mirabilis (Johnston,
Aleksandrov et al.
1997 Polychaeta Alien Ships
TE
Non-invasive
N
Europe
1845)
(2006)
Atlantic Ocean, N
Zaitsev & ųzt³rk
Nephtys ciliata (Muller, 1776)
(197x) Polychaeta Alien Ships
TE
Non-invasive
Europe, Pacific
(2001)
Ocean
Highly
Polydora cornuta Bosc, 1802
1962 Polychaeta Alien Ships
PE
Cosmopolitan
Zaitsev et al. (2004)
invasive
Polydora websteri Hartman in
Highly
19xx (2005)
Polychaeta
Cryptogenic Ships
PE
Pacific Surugiu
(2005)
Loosanoff & Engle, 1943
invasive
Sigambra tentaculata (Treadwell,
Zaitsev & ųzt³rk
196x Polychaeta Alien Ships
TE
Non-invasive
Atlantic
Ocean
1941)
(2001)
202
First
occurence,
Establish
when available
Invasiveness
Species
Higher taxon
Status
Vector(s)
ment
Native range
Reference
group
(First
(at present)
success
published
Ecofunctional
record)
N Atlantic,
N Pacific,
Streblospio shrubsolii (Buchanan,
(1957) Polychaeta Cryptogenic Unknown PE
Non-invasive
Mediterranean,
Marinov (1957)
1890)
North Sea,
Baltic Sea
Kaneva-Abadjieva
Streptosyllis varians Webster &
(1966) Polychaeta Cryptogenic Unknown PE
Non-invasive
N
Atlantic
& Marinov (1966);
Benedict, 1887
Marinov (1966)
Tubificoides benedii (Udekem,
1916
Oligochaeta
Alien
Ships
PE
Unknown
N America
Zaitsev et al. (2004)
1855)
Molgula manhattensis (De Kay
Bacescu et al.
(1971) Tunicata
Alien Ships
PE
Non-invasive
N
Atlantic
1843)
(1971)
Urnatella gracilis Leidy, 1851
(1954) Entoprocta Alien Diffusion PE
Non-invasive N Am. inland
Bacescu (1954)
Aristichthys nobilis (Richardson,
1960
Georgiev (1967)
Osteichthyes
Alien
Aquaculture
TE
Non-invasive Asia Far East
1845)
(1967, 1968)
Banarescu (1968a)
Heniochus acuminatus (Linnaeus,
Aleksandrov et al.
2003 Osteichthyes Alien Unknown TE
Non-invasive
Indo-Pacific
1758)
(2006)
Oreochromis aureus (Steingachner,
Moderately
African water
Aleksandrov et al.
197x Osteichthyes Alien Unknown TE
1864)
invasive
bodies
(2006)
Plecoglossus altivelis altivelis
Pacific Ocean, Asia Zaitsev & ųzt³rk
196x-197x Osteichthyes Alien
Aquaculture NE Non-invasive
(Temminck & Schlegel, 1846)
SE
(2001)
Necton
Hypophthalmichthys molitrix
Zaitsev & ųzt³rk
1953
Osteichthyes
Alien
Aquaculture
PE
non-invasive
Asia Far East
(Valenciennes, 1844)
(2001)
Oreochromis niloticus niloticus
Moderately
African water
Aleksandrov et al.
(197x) Osteichthyes Alien Unknown TE
(Linnaeus, 1758)
invasive
bodies
(2006)
Ctenopharyngodon idella
Moderately
1959 (1968)
Osteichthyes
Alien
Aquaculture
PE
Asia Far East
Banarescu (1968)
(Valenciennes, 1844)
invasive
203
First
occurence,
Establish
when available
Invasiveness
Species
Higher taxon
Status
Vector(s)
ment
Native range
Reference
group
(First
(at present)
success
published
Ecofunctional
record)
Europe W coast,
Chelon labrosus (Risso, 1827)
1977 (1980)
Osteichthyes
Alien
Diffusion
PE
non-invasive
Africa W coast,
Minev (1980)
Mediterranea
Gambusia affinis (Baird & Girard,
1921 Osteichthyes Alien Biocontrol PE
Non-invasive
MesoAmerica Manea
(1985)
1853)
Carassius auratus auratus
Moderately
19xx (1938)
Osteichthyes
Alien
Ornamental
PE
Asia Far East
Busnita (1938)
(Linnaeus, 1758)
invasive
Highly
Carassius gibelio (Bloch, 1782)
19xx (1934)
Osteichthyes
Alien
Diffusion
PE
Asia Far East
Antonescu (1934)
invasive
Cyprinus carpio carpio Linnaeus,
12xx Osteichthyes Cryptogenic Aquaculture
PE
Non-invasive
Unknown
Manea
(1985)
1758
Angelescu &
Macoveschi (1980);
Ictiobus bubalus (Rafinesque, 1818)
1978 (1980)
Osteichthyes
Alien
Aquaculture
TE
Non-invasive N Am. inland
Angelescu et al.
(1980)
Angelescu &
Ictiobus cyprinellus (Valenciennes,
Macoveschi (1980);
1978 (1980)
Osteichthyes
Alien
Aquaculture
TE
Non-invasive N Am. inland
1844)
Angelescu et al.
(1981)
Angelescu &
Macoveschi (1980);
Ictiobus niger (Rafinesque, 1819)
1978 (1980)
Osteichthyes
Alien
Aquaculture
TE
Non-invasive N Am. inland
Angelescu et al.
(1982)
Atlantic
Lithognatus mormyrus (Linne,
Natural
Stanciu & Ilie
(1980) Osteichthyes Alien
NE Non-invasive
Mediterranean,
1758)
expansion
(1980)
Black Sea
Minev (1980); FAO
Mugil soiuy Basilewski, 1855
1975 (1980)
Osteichthyes
Alien
Aquaculture
PE
Non-invasive Asia Far East
(1997)
204
First
occurence,
Establish
when available
Invasiveness
Species
Higher taxon
Status
Vector(s)
ment
Native range
Reference
group
(First
(at present)
success
published
Ecofunctional
record)
Mylopharyngodon piceus
Moderately
1960 Osteichthyes Alien Aquaculture
PE
Asia Far East
Banarescu (1968)
(Richardson, 1846)
invasive
Pseudorasbora parva (Temminck &
Highly
1960 (1964)
Osteichthyes
Alien
Aquaculture
PE
Asia Far East
Banarascu (1964)
Schlegel, 1846)
invasive
moderately
Oncorhynchus mykiss (Walbaum,
Aleksandrova &.
1971 (1974)
Osteichthyes
Alien
Aquaculture
PE
invasive in
N American E coast
1792)
Manolov (1974)
rivers
Tribolodon brandtii (Dybowski,
Aleksandrov et al.
195x Osteichthyes Alien Unknown TE
Unknown
Pacific
Ocean
1872)
(2006)
Ameiurus melas (Rafinesque 1820)
1997 (1998)
Osteichthyes
Alien
Diffusion
RE
Non-invasive N Am. inland
Wilhelm (1998)
Ameiurus nebulosus (Lesueur,
1910 (1934)
Osteichthyes
Alien
Diffusion
PE
Non-invasive N Am. inland
Antonescu (1934)
1819)
biocontrol ,
Moderately
Karapetkova &
Gambusia holbrooki (Girard, 1859)
1924 (1973)
Osteichthyes
Alien
PE
N American inland
Ships
invasive
Peshev (1973)
Lateolabrax japonicus
Pacific Ocean, Asia Zaitsev & ųzt³rk
196x-197x Osteichthyes Alien
Aquaculture NE Non-invasive
(Cuvier,1828)
SE
(2001)
Highly
Lepomis gibbosus (Linne, 1758)
1918 (1929)
Osteichthyes
Alien
Diffusion
PE
N Am. inland
Busnita (1929)
invasive
N Europe, Atlantic
Micromesistius poutassou (Risso,
Diffusion,
Zaitsev & ųzt³rk
1999 Osteichthyes Alien
TE Non-invasive
Ocean,
1827)
Ships
(2001)
Mediterranean
Aleksandrov et al.
Morone saxatilis (Walbaum, 1792)
1965
Osteichthyes
Alien
Aquaculture
TE
Non-invasive N American E coast (2006)
Onorhynchus gorbusha
Zaitsev & ųzt³rk
1961 Osteichthyes Alien Aquaculture
NE
Non-invasive
N
American
inland
(Walbaum, 1792)
(2001)
205
First
occurence,
Establish
when available
Invasiveness
Species
Higher taxon
Status
Vector(s)
ment
Native range
Reference
group
(First
(at present)
success
published
Ecofunctional
record)
Percarina demidoffii Nordmann,
Natural
Moderately
Rivers Dniester,
Otel & Banarescu
1985 (1986)
Osteichthyes
Alien
PE
1840
expansion
invasive
Dnieper, Bug, Don (1986)
Moderately
Nalbant et al.
Perccottus glenii Dybowski, 1877
2001 (2004)
Osteichthyes
Alien
Diffusion
RE
Asia Far East
invasive
(2004)
Ustundag et al.
Salmo salar (L. 1758)
1992 (2000)
Osteichthyes
Alien
Aquaculture
PE
Non-invasive Norway
(2000)
Aleksandrov et al.
Sphyraena obtusata uvier, 1829
1999 Osteichthyes Alien Unknown TE
Unknown
Indo-Pacific (2006)
Highly
Pop & Homei
Mus musculus Linne, 1758
2000 B.C.
Mammalia
Cryptogenic Diffusion
PE
India
invasive
(1973)
Rattus norvegicus (Berkenhout,
Highly
Pop & Homei
173x Mammalia Alien Diffusion PE
Asia Inland
1769)
invasive
(1973)
Diffusion,
Escapes
Highly
Pop & Homei
Ondatra zibethica (Linne, 1766)
193x (1973)
Mammalia
Alien
PE
N Am. inland
from fur
invasive
(1973)
farms
Illegal
introduction,
Moderately
Semi-aquatic
Myocastor coypus (Molina, 1782)
1967 (1988)
Mammalia
Alien
Escapes
PE
S America
Markov (1988)
invasive
from fur
farms
Moderately
Murariu &
Mustela vison (Schreber, 1777)
(2005) Mammalia Alien Diffusion RE
N Am. inland
invasive
Munteanu (2005)
Nyctereutes procyonoides (Gray,
Moderately
Pop & Homei
193x (1973)
Mammalia
Alien
Diffusion
PE
Asia Far East
1834)
invasive
(1973)
PE Ł permanently established
RE Ł recently established
TE Ł temporarily established
NE Ł not established
206
References
Aleksandrov B., Boltachev A., Kharchenko T., Liashenko A., Son M., Tsarenko P.,
Zhukinsky V., 2006. Trends of aquatic alien species invasion in Ukraine. Aquatic Invasions.
(in press).
Aleksandrova K., Z. Manolov, 1974. Cultivation of rainbow trout in sea water. Proc. Inst.
Fisheries, vol. XIII, 119 Ł 128.
Angelescu N., Cazacu G., Cazacu C., 1980. Date privind biologia si sitematica pestilor
bufalo (Ictiobus, Catostomidae) introdusi in apele Romaniei. Bul. I.C.P. 33(1):73-85.
Angelescu N., Macoveschi I., 1980. Nota preliminara asupra starilor de boala depistate la la
pesti bufalo recent introdusi in apele Romaniei. Bul. I.C.P. 33(2):101-110.
Antonescu C., 1934. Pestii apelor interioare din Romania. Bucuresti, 80pp.
Bacescu M., 1951. Nannastacus euxinicus n. sp., cumaceu nou gasit in apele Marii Negre.
Com. Acad. R.P.R., 1(7): 585-592.
Bacescu M., 1954. Animale straine patrunse recent in bazinul Marii Negre, cu referinte
speciale asupra prezentei lui Urnatella gracilis in Dunare. Bul. I.C.P. 4:61-66.
Bacescu M., 1967. Fauna Romaniei vol. IV Crustacea, fasc. 9 Decapoda. Ed. Acad. R.S.R.,
Bucuresti, 351 p.
Bacescu M., Muller G.I., Gomoiu M.T., 1971. Ecologie Marina, vol. 4 - Cercetari de
ecologie bentala in Marea Neagra. Ed. Acad. R.S.R., Bucuresti, 357 pp.
Banarescu P., 1964. Fauna Republicii Populare Romane. Volumul XIII. Pisces -
Osteichthyes (pesti ganoizi si ososi). Editura Academiei Republicii Populare Romane,
Bucuresti, 962 pp.
Banarescu P., 1968. Lista revizuita a pestilor din Romania. Bul. I.C.P. 27(3):51-60.
Borcea I., 1933. Liste des animaux marins recoltes jusqu'a present dans la region de la
station d'Agigea (mer Noire). Ann. Sci. Univ. Jassy 19: 402-407.
Bulgurkov K., 1968. Callinected sapidus Rathbun in the Black Sea. Izv. NIRSO, 9, 97-99.
Bulgurkov K., 1973. Record of Alpheus dentipes Guerin along the Bulgarian Black Sea
coast. Proc. Inst. Oceanogr.and Fish. Varna, 12, 103-105.
Busnita T., 1929. Pescaria si Piscicultura, nr. din Sept.
Busnita T., 1938. Genul Carassius in apele Romaniei. In: Vol.jub. Gr. Antipa, Hommage a
son oeuvre, Bucuresti, 119-131.
Cinar et al. (2005). Alien Species on the coasts of Turkey. Mediterranean Marine Science.
Volume 6/2 (In Press).
207
Ciocarlan V., 2000. Flora ilustrata a Romaniei. Pterydophyta et Spermatophyta. Ed. Ceres,
Bucuresti, 1138 pp.
FAO, 1997. FAO Database on Introduced Aquatic Species, FAO, Rome.
Georgiev Z., 1967. Ichthyofauna of the Bulgarian Black Sea lakes. Proc. of the research
Institute of Fisheries and Oceanography, Varna, vol. VIII, 211-227 pp. (in Bulgarian).
Gomoiu M.T., 2002. Post invasion study of the Rapana venosa (Val.) (Mollusca,
Gastropoda) at the Romanian Black Sea shore. Ovidius University Annals of Natural
Sciencec, Biology-Ecology Series, 6: 63-68.
Gomoiu M.T., Skolka M., 1998. Cresterea biodiversitatii prin imigrare - noi specii in fauna
Romaniei. An.St.Nat. Univ. Ovidius, seria Biologie-Ecologie 2: 181-202.
Grossu Al.V., 1951. Potamopyrgus jenkinsi, gasteropod nou pentru apele continentale ale
R.P.R. Com. Acad. R.P.R. 1(7):593-596.
Grossu Al.V., 1987. Gastropoda Romaniae 2: Subclasa Pulmonata: I.Ordo Basommatophora,
II. Ordo Stylommatophora (superfamiliile Succinacea, Cochlicopacea, Pupillacea). Ed.
Litera, Bucuresti, 442 pp.
Kaneva-Abadjieva, V., 1958. A new harmful snail along the Bulgarian Black Sea coast.
Priroda, 3: 89-91. (In Bulgarian.)
Kaneva-Abadjieva V. & Marinov T., 1966. Distribution of sandy macrozoobenthos
community along Bulgarian Black Sea coast. Izv. NIRSO, 7, 69-96.
Karapetkova M., I. Peshev, 1973. Ichthyofaunistical review of Ropotamo River. Proceedings
of the Zoological Institut with Museum, Sofia, XXXVIII, 183-194 pp.
Konsulov A., Kamburska L., 1998. Ecological determination of the new ctenophore Beroe
ovata invasion in the Black Sea, Oceanology, IO BAS, v. 2, 195 198.
Manea G.I., 1985. Aclimatizarea de noi pesti si alte organisme acvatice. Editura Ceres,
Bucuresti, 160 pp.
Markov G., 1988. Mammals. Publ. House "Science and Art", Sofia, 1988, 303 pp.
Marinov T., 1966. Polychaeta fauna of Brackish waters along Bulgarian Black Sea coasts.
Izv. Zool. Inst. BAN, 21,139-152. (In Bulgarian.)
Marinov T., Stoykov St., M'Barek M., 1983. Zoobenthos of sublittoral sandy and mudy
vottom of varna bay. Proc. Inst. Fish Resources, 20: 109-133.
Marinov, T., 1957. Beitrag zur Kenntnis unserer Schwarzmeer Polychaetenfauna. Proc. Mar.
Biol. Station, Varna, 19: 105-119. (In Bulgarian.)
McLachlan R., 1898. On Neuroptera and Odonata collected by McMalcolm Burr in
Wallachia. Entomol. Monthly Magaz., vol. IX: 248.
208
Micu D., 2004a. Annotated checklist of the marine Mollusca from the Romanian Black Sea.
In: Ozturk B., Mokievsky V.O. and Topaloglu B. (eds.), International workshop on Black
Sea Benthos: 89-152. Published by the Turkish Marine Research Foundation, Istanbul.
Micu D., 2004b. First record of Musculista senhousia (Brenson in Cantor, 1842) from the
Black Sea. In: Abstracts of the International Symposium of Malacology, August 19-22nd
2004, Sibiu, Romania.
Micu D. and Telembici A., 2004. First record of Dreissena bugensis (Andrusov, 1897)from
the Romanian stretch of River Danube. In: Abstracts of the International Symposium of
Malacology, August 19-22nd 2004, Sibiu, Romania.
Mihnea P.E., Dragos N., 1997. Mantoniella squamata, a new species for the Black Sea.
Cercetari Marine, 29-30: 95-114.
Minev D., 1980. The silent sport. Publ. house Medicine and physical culture, Sofia, 1980,
154 pp.(in Bulgarian)
Minicheva G.G., Eremenko T.I., 1993. Algological discoveries in the north-western Black
Sea. Algologya, 3, (4): 83-86. (In Russian.)
Moncheva S., Petrova-Karadjova V., Palazov A., 1995. Harmful Algal Blooms along the
Bulgarian Black Sea Coast and possible Paterns of Fish and Zoobenthic Mortalities. In: P.
Lassus et al. (eds.), Harmful marine algal blooms, Lavoisier Publ. inc., 193-298.
Murariu D., Munteanu D., 2005. Fauna Romaniei, vol. XVI Mammalia, fasc.5 Carnivora.
Ed. Acad. Rom., Bucuresti.
Nalbant T.T., Battes K.W., Pricope F., Ureche D., 2004. First record of the Amur sleeper
Perccottus glenii (Pisces:Perciformes:Odontobutidae) in Romania.
Trav.Mus.Nat.Hist.nat."Grigore Antipa", Vol. XLVII:279-284.
Otel V. and Banarescu P., 1986. First record of Percarina demidoffii Nordmann, 1840
(Pisces:Percidae) from Romania and from the Danube river basin. Rev. Roum. Biol.
31(1):11-13.
Paspalev G., 1933. Hydrobiologische Untersuchungen uber den Golf von Varna. Arb
Meeresst. in Varna, 2, 29-32
Petrova-Karadjova, V. 1990. Monitoring of the blooms along the Bulgarian Black Sea coast.
Rapp. Comm. int. Mer Medit., 31(1): 209.
Pop I., Homei V., 1973. Mamifere din Romania, vol III. Ed. Stiintifica, Bucuresti, 190 pp.
Porumb F., 1959. On the presence of Verruca (Cirripedia, Pedunculata) larvae in the in the
Romanian Black Sea waters. Lucr.Ses.St. Stat.Cerc.Mar. "Prof. I.Borcea" Agigea:309-313.
Porumb F., 1959. Rathkea octopuntata (M.Sars), o noua meduza in apele romanesti ale Marii
Negre. Com.Acad.R.P.R. 9(10):1037-1040.
209
Porumb F., 1975. Cercetari asupra dinamicii sezoniere si a variatiilor nictemerale ale
principalelor specii de copepode pelagice din apele romanesti ale Marii Negre - Teza de
doctorat. Inst. St. Biol. Bucuresti.
Porumb F., 1980. Presence de quelques especes mediterraneennes dans le zooplancton de la
mer Noire. Rev. Roum. Biol., 25(2): 167-170.
Prodanov K, S. Moncheva, A. Konsulov, L. Kamburska, Tz. Konsulova, K. Dencheva, 2001.
Recent ecosystem trends along the Bulgarian Black Sea coast. Proceeding of Institute of
Oceanology-BAS, Varna, vol.3, 110-127.
Sarkany-Kiss A., 1986. Anodonta woodiana (Lea, 1834) a new species in Romania
(Bivalvia, Unionacea). Trav.Mus.Hist.Nat. "Grigore Antipa" 28:15-17.
Shadrin N.V., 1999. Ecosystem functioning and economics: interrelations on global and
local scales. In: Sevastopol water area and coast: ecosystem processes and services for
human society, Sevastopol, Aquavita Publ., 10-24. (In Russian.)
Sinegub, I.A., 1994. About expansion of natural habitat of nudibranch mollusc Doridella
obscura Verrill in the Black Sea. Hydrobiol. Zhurn., 30 (3): 107-109.
Skolka M. , Gomoiu M.T., 2004. Specii invazive in Marea Neagra. Impactul ecologic al
patrunderii de noi specii in ecosistemele acvatice. Ovidius University Press, Constanta, 185
pp.
Stanciu M., Ilie G., 1980. Lithognatus mormyrus, a new species of Sparidae at the Romanian
littoral. Pontus Euxinus, Studii si cercetari CSMN-Constanta 1:107-110.
Stoyanova A. P., 1999. New representatives of Noctilucales in the Bulgarian Black Sea
coastal waters. Compt. Ren. de'l Acad. Bul. Des Sci., vol.52, No 9-10: 119-122.
Surugiu V., 2005. Inventory of inshore polychaetes from the Romanian coast (Black Sea).
Mediterranean Marine Science, 6/1: 51-73.
Todorova, Panayotova, 2006. Alien aquatic fauna from the Bulgarian Black Sea and coastal
lakes Ł an inventory of introductions and impacts. NEOBIOTA. From Ecology to
Conservation. 4th European Conference on Biological Invasions, Vienna (Austria), 27-29
September, 2006. Book of Abstracts, 251-252.
Ustundag et al., 2000. Karadeniz B÷lgesinde Su ³r³nleri iletmecilii yapilan iletmelerin
yapisal analizi ve verimliliin belirlenmesi. Ministry of Agricultural and Rural Affair,.
Ankara.Turkey.
Valkanov A., 1936. Notes on our brackish waters, II. Annals Sof. Univ., 32/3, Sofia. 133 pp.
(In Bulgarian.)
Todorova & Panayotova (2006)
Valkanov A., 1954. Two new polychaetes of the Black Sea fauna. Proc. Mar. Biol. Station,
18: 94-53. (In Bulgarian.)
210
Vasiliu G.D., 1934. Zur Frage des Eriocheir sinensis M.Edw. im Schwarzen Meer.
Notationes Biol. 2(3):83-85.
Velikova V., Moncheva S., D. Petrova, 1999. Phytoplankton dynamics and red tides (1987-
1997) in the Bulgarian Black Sea. Water Science and Technology, vol. 39, 8, 27-36.
Wilhelm, A., 1998. Black bullhead Ictalurus melas Rafinesque 1820 (Pisces: Ostariophysi:
Bagroidae), a new species of fish recently found in Romanian waters.
Trav.Mus.Nat.Hist.nat."Grigore Antipa", Vol. XL: 377-381.
Zaitsev Yu., Aleksandrov B., Berlinsky N., Bogatova Yu., Bolshakov V., Bushuev S., Volya
E., Garkavaya G., Gelmboldt M., Zolotarev V., Kopytina N., Kulakova I., Kurilov A.,
Losovskaya G., Minicheva G., Nesterova D., Polyshchuk L., Sinegub I., Terenko L.,
Shurova N., 2004. Basic biological investigations of Odessa maritime port (August-
December, 2001): final report. GloBallast Monograph Series No. 7, Odessa, Ukraine: 171pp.
(In Russian.)
Zaitsev Yu., ųzt³rk B. 2001 (eds.). Exotic Species in the Aegean, Marmara, Black, Azov
and Caspian Seas. Published by TUDAV, 8: 265 pp.
Zaitsev Yu.P., Nesterova D.A., Rusnak E.M., 2001. Quantitative ratio "chlorophyllŁ
phytoplankton" in eutrophic waters of the Black Sea. Sc. Pros. Of Ternopol State University.
Series: Biology, 3, No 3: 73-74. (In Russian.)
Zaitsev Yu.P., Vorobyova L.V., Aleksandrov B.G., 1988. A northern source of
replenishment of the Black Sea fauna. Doklady AN Ukr.SSR, 11: 61-63. (In Russian.)
Todorova & Panayotova (2006)
211
Annex 7: GROUPS USED IN THE STAKEHOLDER
ANALYSIS
1. Water, Hydro-meteorological Department (government level or below): These
stakeholders are those responsible for water quality and quantity management, including
enforcement of water policies and regulations at regional/local level. In most of countries
they are within the Ministry of Environment. and/or Natural Resources66
2. Natural Resources, Ecology, Water or Environmental Ministry: In all six Black Sea
Countries this Stakeholders Group belonging to the central/federal governmental are
responsible for the development and implementation of the national policy in the
environmental sector, including the ones for water resources management. International
Cooperation and cooperation on transboundary water courses is also under their
responsibility. In Bulgaria and Romania it is also under their responsibility to transpose and
implement EU legislation.
For the Stakeholders groups 3,4,5,6 the central/federal government structures differ, so the
industry, economic and energy sectors are combined in:
Ę Bulgaria Ł Ministry of Economy and Energy;
Ę Georgia Ł Ministry of Economy, Industry and Trade;
Ę Romania - Ministry of Economy and Commerce
Ę Russian Federation Ł Ministry of Industry and Energy, Ministry of Economy
Ę Turkey Ł Ministry of Industry and Trade, Ministry of Energy and Natural
Resources
Ę Ukraine Ł Ministry Industry and Trade, Ministry of Fuel and Energy
3. Industry Ministry: This represents the Stakeholder group responsible for policy-
making and regulatory functions in the fields of civil and defence industries and energy
sector, technical standardization and metrology, and mineral exploration under production-
sharing agreements. In all six countries most of the industrial sectors were privatised or this
process is ongoing. The industrial activities often impacted the Black Sea Waters, though
they may not be aware of it.
4. Energy Ministry: This Stakeholders are responsible for policy Ł making and regulatory
functions in the energy sector and to promote its development and competitive capacity.
Their activities often impact the waters of the Black Sea, though they may not be aware of it.
5. Economic Ministry: These Stakeholders are responsible for policy making and
regulatory functions in the economic policy as well as for the implementation of the
integration policy and effecting foreign economic cooperation.
6. Foreign Affairs Ministry: In general, this stakeholders group, is responsible with
carrying out the foreign policy in compliance with the legal frameworks, as well as
66In the Russian Federation, the hydro-meteorological department is responsible for
environmental monitoring only. Other Russian departments responsible for monitoring
compliance with regulatory legislation are also included in this group.
212
approving and negotiating all regional and international treaties and agreement pertaining to
the Black Sea.
7. Defence Ministry: These ministries oversee the protection of the territorial boundaries
and political interests of the countries of the Black Sea region. Their presence as naval and
land forces can have an impact on the Black Sea.
8. Internal Affairs Ministries: This stakeholder group represents the ministries or
agencies who over see national level issues, which can include internal security, natural
resource development over sight and demographic statistical oversight.
9. Agriculture Ministries: This Ministry provides key governmental coordination of the
agricultural sectors, often at the national and district levels. They may also oversee fisheries
in some countries. They are an important sector to the Black Sea, as their work involves
supporting regulations, data collection and other key aspects of oversight.
10. Fisheries national companies/Administration/Executive Agencies: This stakeholder
group is responsible for development of fisheries, either as a state owned company, an
administrative unit within other ministries, or as an independent government agency. They
are a key stakeholder in the region.
11. Social Welfare/Public Health Ministries: This key governmental sector oversees the
conditions of the human population of the Black Sea region. Their responsibilities can
include human development, over sight of human health and epidemiological trends. They
are a key stakeholder in the region, as the health of the environment impacts the health of the
human population.
12. Labour Ministry: This stakeholder group is involved in employment issues and is
strongly involved in monitoring socio-economic trends of environmental issues within the
Black Sea pertaining to employment levels, job rates and associated sectors.
13. Public Administrators/planning agencies: These organizations are those responsible
for planning and implementation of public policies. They often are nested within other
ministries, and are important to the Black Sea as the group responsible for the decisions as to
where specific urban developments occur in various sectors.
14. Regulatory agent officials/Enforcement agents: This stakeholder group represents
those individuals within government institutions tasked with oversight of enforcement and
regulation of activities and policies related to the Black Sea, both directly and indirectly.
15. Shipping National Companies/Administration/Executive Agencies: This group
represents the government organization that oversees the shipping industry, either as a state
owned entity, or as privately owned firms which are then monitored by such a national
administration or executive agency.
16. Parliamentary committees for environmental protection: This group, which is not
active in each Black Sea country, is charged with addressing environmental or natural
resource management at the parliamentary level. In some cases these bodies can influence
the development and implementation of legislation pertaining to coordinated Black Sea
management.
213
17. Inter-ministerial committees/Basin committees: These organizations are either those
which are brought together to address water management issues at the basin level, or either at
the civil and governmental level, or at the intersectoral ministerial level. Their decisions at
the basin level can impact the conditions of waters flowing into the Black Sea.
18. Non-governmental organizations (NGO): These stakeholders self identify themselves
as belonging to organized, and often nationally or internationally registered and affiliated
organizations dealing with development, environmental, social and education aspects of the
Black Sea region.
19. Scientists: The stakeholder group includes trained technical and academic specialists
who address the broad array of physical and social science impacts of issues in and upon the
Black Sea.
20. Manufacturing industries: The manufacturing industry includes both large and small
scale, light and heavy industry, and the supporting sectors. They impact the Black Sea
through their waste disposal activities.
21. Agro-industry: This stakeholder group provides support to the agricultural sector by
providing commercial fertilizers, chemicals, technical equipment and know how, transport
and sales of crops and processing of agricultural goods. They impact the Black Sea through
their waste disposal activities.
22. Livestock industry: The livestock industry is the stakeholder group involved in raising,
managing, transporting and processing livestock in the Black Sea region.
23. Shipping industry: These stakeholders are involved in all aspects of shipping and
marine transport. They deal with movement of goods and people upon the Black Sea. They
also are responsible for transportation of energy resources.
24. Fishing industry: The fishing industry stakeholder group includes those involved with
large scale fishing vessels, fishing byproduct manufacturing, the associated shipping industry
specifically focused on fishing, fishery sales and distributors and other affiliated groups.
25. Harbour/port administrations: Members of this group are responsible for the
management of harbours and ports in the Black Sea. They include harbour masters, and firms
operating within the ports to support the shipping and fisheries industries.
26. Regional government officials: This stakeholder group consist of those individuals
who are responsible for implementing government policies at the regional/district level,
either as part of the national government, or as a member of the regional/district governance
structure. Their input to the Black Sea can be based on their activities at the local level.
27. District water management officials: This group represents those who serve as a water
management official at the district level. Their work may involve monitoring, regulation
and/or enforcement of water related issues, which will impact the Black Sea conditions,
either directly or indirectly.
214
28. Environmental protection agency officials: Members of this group are tasked with the
protection of the environment on behalf of the government. Their work involves enforcement
of policies, and may include monitoring, evaluation and enforcement. They are often
working within other ministries, and their work is key to the protection of the Black Sea
ecosystem.
29. Municipal government officials: The municipal government stakeholder group
oversees municipal functions in urban cities and rural towns. Among other things, they
generally supervise and fund the activities of the municipal waste manager.
30. Municipal waste managers: These stakeholders are those responsible for municipal
waste management including processing and disposal. Their activities often impact the
waters of the Black Sea, though they may not be aware of it.
31. Nature reserve staff: The staff at nature preserves oversees the preserve or park on
behalf of the regional or national government, depending on the country. They often are
responsible for protection of highly sensitive areas and habitats.
32. Community based organizations: This stakeholder group includes organizations
established within communities to deal with common concern around specific community
related issues, including issues pertaining to the Black Sea ecosystem.
33. Workers on state owned farms: These stakeholders are those who work on farms
owned by the government. Their activities often impact the waters of the Black Sea, though
they may not be aware of it.
34. Workers on privately owned farms: These stakeholders are those who work on farms
owned individually or by private firms. Their activities often impact the waters of the Black
Sea, though they may not be aware of it.
35. Fisherman (small scale): Those who fish mainly for local markets or for themselves.
They tend to fish closer to shore and be more directly impacted by shifts in environmental
conditions. They are also often acutely aware of shifts in fish populations.
36. Educators/teachers: Educators and teachers as a stakeholder group assist students to
understand cause and effect relationships, develop critical thinking skills, and
communication, as well as specific subjects pertaining to the health of the Black Sea
ecosystem.
37. Students: This category includes students at all levels from primary through university
level. They are a critical group to assess, because their current perceptions will be those in
the future of the region.
38. Public health care providers: The public health care providers are those professionals
who watch over the health of the population around the Black Sea. They also are able to
monitor trends in epidemiology impacting and due to local environmental conditions in the
Black Sea.
39. Members of coastal communities: This category includes all stakeholders who live in
the coastal zone within both urban and rural communities. These stakeholders are generally
215
most impacted by conditions, but tend to be less active in direct management, though their
behaviours often impacts the conditions of the Black Sea.
40. Tourism/recreation industry: This industry includes those working with tour groups,
restaurants and hotels, cruise ships, entertainment industry, specific sports, and others that
directly or indirectly rely on the environmental conditions within the region.
41. Press and media: The press and media organizations include local, national and
international press that provide information to the project and about the project to their
audiences about the activities of the project.
42. International funding institutions: These institutions include multilateral and bilateral
funding organizations that support efforts related to the Black Sea, and to issues that impact
the Black Sea ecosystem.
216
217
Annex 8: MINIMUM FISH SIZES FOR LANDING IN BLACK SEA COUNTRIES
Latin name
English Name
Minimum admissible length (cm)
BG GE RO RU TR UA
Abramis brama
Bream
30
Acipenser gueldenstadti
Danube
sturgeon
100 140
110
Acipenser stellatus
Starry
sturgeon
90 100
100 100
Alosa kessleri pontica
Pontic
shad
22 22 17 17
Alosa caspia nordmani
Danube
shad
15 11
Alosa caspia tanaica
Azov
shad
11
Alosa maeotica
Black Sea shad
25
Atherina boyeri
Sand
smelt
7
Belone belone euxini
Garfish
35
Callinectes sapidus
Blue
crab
8
Citharus sp.
Flounder
20
Clupeonella cultriventris
Kilka
7
Cyprinus carpio
European
carp
32
Engraulis encrasicolus maeoticus
Anchovy
8 7 7 6.5 9
6.5
Spicara maena / flexuosa / smaris?
Pickarel
10
Glyptocephalus cynoglossus
Gray
sole
45
Gobiidae
Gobies
11
Huso huso
Beluga
140 170
Liza aurata
Golden
mullet
25 20
20
Miracorvina angolensis
Angola
croacker
45
Merlanginus merlanngus euxinus
Whiting
12
13
12
Mugillidae
Other
mullets/
30 30 25 20
20
Mugil cephalus
Flathead
grey
mullet 25 20 20 30
20
Mugil soiuy
Haarder
30
38
Mullus barbatus ponticus
Striped mullet
12
25
8.5
13
8.5
218
Latin name
English Name
Minimum admissible length (cm)
BG GE R0 RU TR UA
Mullus surmuletus
Red
mullet
12 11
Neogobius melanostomus
Round
goby
11
Pomatomus saltatrix
Bluefish
22
Psetta maeotica torosus / maxima
Turbot
45 40 40
35
Platichthys flessus luscus
European
flounder 20 20
Raja clavata
Thornback
ray
60
Rutilus rutilus heckeli
Roach
18
Sarda sarda
Bonito
28 25
Scomber scrombus
Atlantic
mackerel
15
Sprattus sprattus phalericus
Sprat
7 7 - 6
Squalus acanthias
Spiny dogfish
90
35
100
85
Stizostedium lucioperca
Zander
38
Trachurus mediterraneus ponticus
Horse
mackerel
12 13 12 13 10
Vimba vimba
Vimba
22
219
Annex 9: LANDFILL DATA
The tables below show data collated from the six Black Sea countries. Data only for landfills
within 10 km of the coastline were requested, and it was hoped to gain some idea of the scale of
unauthorised (illegal) dumping along the coastline Ł a major problem in all countries. The 10 km
boundary was not based on an scientific argument but was a pragmatic, arbitrary value to limit
the amount of data that couldbe collated given the time and resources available.
It is clear from the tables that information on relatively few anuthorised landfills has been
provided. It is also apparent from Fig. 4.18 that some of the Bulgarian landfills are not located
within 10 km of the coast but are further inland. From landfills named after the towns and cities
close to where they are located, it appears that the grid refences for these sites have been
incorrectly given. Data were provided on only two Turkish landfills.
In is also clear from the second table that incorrect units have been given on the size/capacity of
some landfills. Where no units were provided, the units in which data were request have been
used as the default.
220
Country Reference Name of landfill
Longitude
Latitude
Is the landfill
Does the
Does the
Does the
Does the
Is the
to Fig, <>
authorised?
landfill
landfill
landfill
landfill
amount of
accept
have a
have a
have a
waste
hazardous
liner?
leachate
storm
monitored?
waste?
treatment
water
system?
diversion
system?
Bulgaria 1
Varna, village of
43.120000 27.560000
Yes
No
Yes
Yes
No
Yes
Vaglen
Bulgaria 2
Bourgas Bratovo
42.483000
27.483000
Yes
No
Yes
No
No
Yes
Bulgaria 3
Marinka 42.478000
27.455000
Yes
No
No
No
No
No
Bulgaria 4
Varna Beloslav
43.110000
27.420000
Yes
No
No
No
No
Yes
Bulgaria 5
Varna Solvey Sodi
43.120000
27.420000
Yes
No
No
No
No
No
Bulgaria 6
Varna Polymeri
43.150000
27.450000
Yes
No
No
No
No
Yes
Bulgaria 7
Agrapolychim
43.110000 27.420000
Yes
Yes
No
No
No
Yes
Devnjya
Bulgaria 8
Bourgas Luk Oil
42.483000
27.483000
Yes
Yes
No
No
No
Yes
Bulgaria 9
Bourgas Copper Mine 42.480000
27.491000
Yes
Yes
No
No
No
Yes
Georgia 10
Batumi 41.758333
41.741667
Yes
No
No
No
No
Not
permanently
monitored
Georgia 11
Poti 42.247222
41.811111
Yes
No
No
No
No
Not
permanently
monitored
Georgia 12
Kobuleti 41.944444
41.861111
No
No
No
No
No
No
Romania 13
Mangalia - Albesti
43.470000
28.260000
Yes
Stabilised
Yes Yes Yes Yes
hazardous
wastes
Romania 14
Costinesti 43.570000
28.380000
Yes
No
Yes
Yes
Yes
Yes
Romania 15
Constanta port area
44.150000
28.340000
Yes
Special cell
Yes Yes Yes Yes
designed for
hazardous
wastes
Romania 16
Eforie South
44.100000
28.380000
No
No
No
No
Yes
Romania 17
Medgidia 44.010000
28.380000
No
No
No
No
Yes
Romania 18
Harsova 44.410000
27.570000
No
No
No
No
Yes
Romania 19
Cernavoda 44.200000
28.020000
No
No
No
No
Yes
Romania 20
Techirghiol 44.030000
28.350000 No No
No
No
Yes
Romania 21
Basarabi 44.100000
28.240000
No
No
No
No
Yes
221
Country Reference Name of landfill
Longitude
Latitude
Is the landfill
Does the
Does the
Does the
Does the
Is the
to Fig, <>
authorised?
landfill
landfill
landfill
landfill
amount of
accept
have a
have a
have a
waste
hazardous
liner?
leachate
storm
monitored?
waste?
treatment
water
system?
diversion
system?
Romania 22
Negru Voda
43.490000
28.120000
No
No
No
No
Yes
Romania 23
Luminita 44.530000
28.190000
Yes
Yes
Romania 24
SC Lafarge Romcim
44.140000 28.160000
Yes
Yes
Medgidia
Romania 25
SC Etermed SA
44.140000 28.160000
Yes
Yes
Medgidia
Romania 26
SC Argus SA
44.140000
28.160000
Yes
Yes
Romania 27
SC Rompetrol
44.100000 28.380000
Yes
Yes
Refinery - Petromidia
SA - Navodari
Romania 28
Marway Fertilchim
44.190000 28.360000
Yes
SA - Navodari
Romania 29
Agighiol 45.020000
28.520000
No
No
No
No
No
Yes
Romania 30
Vararie
45.100000
28.480000
No
No
No
No
No
Yes
Romania 31
Macin 45.140000
28.080000
No
No
No
No
No
Yes
Romania 32
Babadag 44.530000
28.420000
No
No
No
No
No
Yes
Romania 33
Isaccea 45.160000
28.270000
No
No
No
No
No
Yes
Romania 34
Sulina 45.090000
29.380000
No
No
No
No
No
Yes
Romania 35
SC Alum SA
45.100000
28.430000
Yes
Yes
Yes
Romania 36
SC Feral SRL
45.100000
28.480000
Romania 37
SC Feral SRL
45.100000
28.430000
No
Yes
Russia 38
Loo village
45.100000
28.480000
No
No
No
No
No
Yes
Russia 39
Adler village
44.133333
39.100000
No
No
No
No
No
No
Russia 40
Landfill in Tuapse city 44.283333
38.833333
No
No
No
No
No
No
Russia 41
Lermontovo village
44.800000
37.950000
No
No
No
No
No
No
Russia 42
Kabardinka village
44.350000
38.533333
No
No
No
No
No
No
Russia 43
Tekos village
44.516667
38.216667
No
No
No
No
No
No
Russia 44
Dzhanhot village
45.066667
37.316667
No
No
No
No
No
No
Russia 45
Krasniy village
43.490000
28.120000
No
No
No
No
No
No
Russia 46
Kumatir village
No
No
No
No
No
No
Russia 47
Utash-4 village
No
No
No
No
No
No
Russia 48
Yurovka village
45.116667
37.416667
No
No
No
No
No
No
222
Country Reference Name of landfill
Longitude
Latitude
Is the landfill
Does the
Does the
Does the
Does the
Is the
to Fig, <>
authorised?
landfill
landfill
landfill
landfill
amount of
accept
have a
have a
have a
waste
hazardous
liner?
leachate
storm
monitored?
waste?
treatment
water
system?
diversion
system?
Russia 49
Supseh village
No
No
No
No
No
No
Russia 50
Gay-Kodzor village
No
No
No
No
No
No
Russia 51
Glebovka village
44.733333
37.583333
No
No
No
No
No
Yes
Turkey 52
stanbul,
41.000000 28.900000
Yes
No
Yes
Yes
Yes
No
Kemerburgaz/Odayeri
Turkey 53
stanbul,
41.016667 29.566667
Yes
No
Yes
Yes
Yes
No
ile/K÷m³rc³oda
Ukraine 54
Pervomaisk gully
44.600000
33.633333
Yes
No
Yes
No
Yes
Yes
Ukraine 55
Gaspra, Yalta
44.450000
34.116667
Yes
No
No
Yes
Yes
Ukraine 56
Alushta 44.733333
34.416667
Yes
No
No
Yes
Yes
Ukraine
Kerch, KATP-122804 45.250000
33.316667
Yes
No
No
No
No
Yes
Ukraine 57
Evpatoria 45.483333
32.716667
Yes
No
Yes
No
Yes
Yes
Ukraine 58
Chernomorskoe 44.883333
34.983333 Yes
No
No No Yes
Ukraine 59
Sudak 45.050000
35.300000
Yes
No
No
No
No
Yes
Ukraine 60
Feodosia 44.966667
35.216667
Yes
No
No
No
No
Yes
Ukraine 61
Koktebel 45.133333
33.616667
Yes
No
No
No
No
Yes
Ukraine 62
Saki 45.366667
33.150000
Yes
No
Yes
No
No
Yes
Ukraine 63
Novoozernoe,
45.983333 33.833333
Yes
No
Yes
No
Yes
Yes
GKPSU Ekologia
Ukraine 64
Krasnoperekopsk,
45.966667 33.783333
Yes
Yes
No
No
No
Yes
Crimea soda plant
site, Krasnoe lake
Ukraine 65
Krasnoperekopsk,
44.733333 37.583333
Yes
Yes
No
No
Yes
Yes
Brom plant, Staroe
lake
Ukraine
Krasnoperekopsk,
Yes
No
No
Yes
Brom plant
Ukraine
Krasnoperekopsk,
Yes
No
No
No
No
Yes
Brom plant
Ukraine
Krasnoperekopsk
Yes
No
No
No
No
Yes
Ukraine 66
Armyansk, Titan plant
46.100000
33.690000
Yes
Yes
No
No
Yes
Yes
Ukraine 67
Armyansk, Titan plant 46.100000
33.690000
Yes
Yes
No
No
Yes
Yes
223
Country Reference Name of landfill
Longitude
Latitude
Is the landfill
Does the
Does the
Does the
Does the
Is the
to Fig, <>
authorised?
landfill
landfill
landfill
landfill
amount of
accept
have a
have a
have a
waste
hazardous
liner?
leachate
storm
monitored?
waste?
treatment
water
system?
diversion
system?
Ukraine
Armyansk, Titan plant
Yes
Yes
No
No
No
Yes
Ukraine
Armyansk, Titan plant
Yes
Yes
Yes
No
Yes
Ukraine
Armyansk, Titan plant
Yes
Yes
No
No
No
Yes
Ukraine
Armyansk, Titan plant
Yes
No
No
No
Yes
Yes
Ukraine
Armyansk
Yes No
No
Yes
Yes
Yes
Ukraine
Kirilovka
Yes
No
Yes
No
No
Yes
Ukraine
Primorsk
Yes
No
Yes
No
No
Yes
Ukraine
Berdyansk
Yes No
Yes
No
No
Yes
Ukraine
Berdyansk, pond-
Yes
No
Yes
No
No
Yes
evaporator, Azot plant
Ukraine
Berdyansk, pond-
Yes
No
Yes
No
No
Yes
evaporator, Berdyansk
state plant of glass
fiber
Ukraine
Yakimovka
Yes No
Yes
No
No
Yes
Ukraine
Radionovka
Yes No Yes
No
No Yes
Ukraine
Priazovsk
Yes
No
Yes
No
No
Yes
Ukraine
Nova Dofinovka
Yes
No
No
No
No
Yes
Ukraine
Karolono-Bugaz
Yes
No
No
No
No
Yes
Ukraine
Sergeevka
Yes No
No
No
No
Yes
Ukraine
Mikolaevka
Yes No No
No
No
Yes
Ukraine
Tuzly
Yes
No
No
No
No
Yes
Ukraine 68
Primorske 45.530000
29.610000
Yes
No
No
No
No
Yes
Ukraine 69
Primorske 45.700000
29.800000
Yes
No
No
No
No
Yes
224
Country Reference Name of landfill
Longitude
Latitude
Type of waste
Surface
Landfill
First year
Last year
Is the
to Fig, <>
handled
area (ha)
capacity
of
of
landfill still
operation
operation
operational
Bulgaria 1
Varna, village of
Municipal 24,000
1,773,875
1976
Yes
Vaglen 43.120000
27.560000
m3
Bulgaria 2
Bourgas Bratovo
42.483000
27.483000
Municipal
13,269.9
923,000 m3 1986
Yes
Bulgaria 3
Marinka
Industrial, non-
1,500 100,000
m3 1969
Yes
42.478000 27.455000 hazardous
Bulgaria 4
Varna Beloslav
Industrial, non-
1978
Yes
43.110000 27.420000 hazardous
Bulgaria 5
Varna Solvey Sodi
Industrial, non-
1972
Yes
43.120000 27.420000 hazardous
Bulgaria 6
Varna Polymeri
Industrial, non-
1972
Yes
43.150000 27.450000 hazardous
Bulgaria 7
Agrapolychim
Hazardous 10
750
m3
Yes
Devnjya 43.110000
27.420000
Bulgaria 8
Bourgas Luk Oil
42.483000 27.483000 Hazardous 25
2200
m3
Yes
Bulgaria 9
Bourgas Copper Mine 42.480000
27.491000 Hazardous
20
1,500
m3
Yes
Georgia 10
Batumi
Municipal 18
7,600,000
1965
Yes
41.758333 41.741667
m3
Georgia 11
Poti
Municipal 8
42,400
1967
Yes
42.247222 41.811111
m3/yr
Georgia 12
Kobuleti
41.944444
41.861111
Municipal
1,6
1964
Yes
Romania 13
Mangalia - Albesti
Municipal and
22.4 3,200,000
1972 2006 Recently
industrial, non-
m3
transformed
hazardous
into an
ecological
landfill:
previous
landfill is
closed and
ecologised.
New
expanded
landfill
consists of
two cells:
43.470000 28.260000
one for
225
Country Reference Name of landfill
Longitude
Latitude
Type of waste
Surface
Landfill
First year
Last year
Is the
to Fig, <>
handled
area (ha)
capacity
of
of
landfill still
operation
operation
operational
municipal
wastes/
capacity
655,000 m3;
and one for
stabilised
dangerous
wastes /
capacity
27300 m3
Romania 14
Costinesti
Municipal and non- 10 1,200,000
2004
Yes
43.570000 28.380000 hazardous industrial
m3
Romania 15
Constanta port area
Harbour generated
2.3 150,300
m3
Previous
wastes
landfill was
closed, new
ecological
landfill is
under
construction.
Started in
44.150000 28.340000
2004
Romania 16
Eforie South
Municipal 7
100,000
m3 1960
2006
Yes,
but
being
44.100000 28.380000
phased out
Romania 17
Medgidia
Municipal and sewage 15 900,000
m3 1984
2006
Yes,
but
sludge
being
phased out.
Plans for a
new
ecological
landfill to
replace it in
the near
44.010000 28.380000
future
Romania 18
Harsova 44.410000
27.570000
Municipal 5
150,000
m3 1989
2010
Yes,
but
226
Country Reference Name of landfill
Longitude
Latitude
Type of waste
Surface
Landfill
First year
Last year
Is the
to Fig, <>
handled
area (ha)
capacity
of
of
landfill still
operation
operation
operational
being
phased out
Romania 19
Cernavoda
Municipal 3
565,000
m3 1977
2012
Yes,
but
being
44.200000 28.020000
phased out
Romania 20
Techirghiol
Municipal 3
150,000
m3 1960
2012
Yes,
but
being
44.030000 28.350000
phased out
Romania 21
Basarabi
Municipal 3
160,000
m3 1976
2015
Yes,
but
being
44.100000 28.240000
phased out
Romania 22
Negru Voda
Municipal 2.5
270,000
m3 1970
2006
Yes,
but
being
43.490000 28.120000
phased out
Romania 23
Luminita
44.530000
28.190000
Sewage sludge
5.8
Romania 24
SC Lafarge Romcim
Industrial, non-
4
Yes
Medgidia 44.140000
28.160000
hazardous
Romania 25
SC Etermed SA
Industrial, non-
1.2
Yes
Medgidia 44.140000
28.160000
hazardous
Romania 26
SC Argus SA
Industrial, non-
0.32
Yes
44.140000 28.160000 hazardous
Romania 27
SC Rompetrol
Sludge from oil
2.47
2006
Yes
Refinery - Petromidia
refining
SA - Navodari
44.100000
28.380000
Romania 28
Marway Fertilchim
Industrial
48
1954
SA - Navodari
44.190000
28.360000
Romania 29
Agighiol
Municipal
2015
Yes, but
being
45.020000 28.520000
phased out
Romania 30
Vararie
Inert wastes
2007
Yes, but
being
45.100000 28.480000
phased out
Romania 31
Macin
Municipal
2016
Yes, but
being
45.140000 28.080000
phased out
227
Country Reference Name of landfill
Longitude
Latitude
Type of waste
Surface
Landfill
First year
Last year
Is the
to Fig, <>
handled
area (ha)
capacity
of
of
landfill still
operation
operation
operational
Romania 32
Babadag
Municipal
2009
Yes, but
being
44.530000 28.420000
phased out
Romania 33
Isaccea
Municipal
2009
Yes, but
being
45.160000 28.270000
phased out
Romania 34
Sulina
Municipal
2017
Yes, but
being
45.090000 29.380000
phased out
Romania 35
SC Alum SA
Industrial, non-
79.4 5,400,000
Yes; must
hazardous
m3
comply with
EU norms
45.100000 28.430000
by 2010
Romania 36
SC Feral SRL
Industrial, non-
4.73
2009
Yes, but will
hazardous
be closed in
45.100000 28.480000
2009
Romania 37
SC Feral SRL
Industrial, non-
4.73
2009
Yes, but will
hazardous
be closed in
45.100000 28.430000
2009
Russia 38
Loo village
45.100000
28.480000
Municipial
4.85
292,000 m3
Yes
Russia 39
Adler village
44.133333
39.100000
7.85
800,000 m3
Yes
Russia 40
Landfill in Tuapse
4.2
140,000 m3
Yes
city 44.283333
38.833333
Russia 41
Lermontovo village
44.800000
37.950000
8
112,000 m3
Yes
Russia 42
Kabardinka village
44.350000
38.533333
22
179,000 m3
Yes
Russia 43
Tekos village
44.516667
38.216667
1
17,000 m3
Yes
Russia 44
Dzhanhot village
45.066667
37.316667
1
18,000 m3
Yes
Russia 45
Krasniy village
45.116667
37.416667
6.7
280,000 m3
Yes
Russia 46
Kumatir village
45.100000
28.480000
5.3
6,200 m3
Yes
Russia 47
Utash-4 village
45.100000
28.430000
4
10,000 m3
Yes
Russia 48
Yurovka village
45.100000
28.480000
1.5
700 m3
Yes
Russia 49
Supseh village
1
100 m3
Yes
Russia 50
Gay-Kodzor village
1.5 100
m3
Yes
Russia 51
Glebovka village
44.733333
37.583333
28
420,000 m3
Yes
Turkey 52
stanbul, 41.000000
28.900000
Municipial
125
1995
2020
Yes
228
Country Reference Name of landfill
Longitude
Latitude
Type of waste
Surface
Landfill
First year
Last year
Is the
to Fig, <>
handled
area (ha)
capacity
of
of
landfill still
operation
operation
operational
Kemerburgaz/Odayeri
Turkey 53
stanbul,
Municipial
70
1995
2020
No
ile/K÷m³rc³oda 41.016667
29.566667
Ukraine 54
Pervomaisk gully
Municipial
4.98
1,950,464
2001
Yes
44.600000 33.633333
m3
Ukraine 55
Gaspra, Yalta
44.450000
34.116667
Municipial
5.76
1971
Yes
Ukraine 56
Alushta
Municipial
6.87
4,500,000
1960
Yes
44.733333 34.416667
m3
Ukraine
Kerch, KATP-122804
Municipial
21.9
7,000,000
Yes
45.250000 33.316667
m3
Ukraine 57
Evpatoria
Municipial
28
4,979,400
1998
Yes
45.483333 32.716667
m3
Ukraine 58
Chernomorskoe 44.883333
34.983333
Municipial
7.5
300,000
m3 1970
Yes
Ukraine 59
Sudak 45.050000
35.300000
Municipial
4.5
300,000
m3 1960
Yes
Ukraine 60
Feodosia
Municipial
7
1,100,000
1974
Yes
44.966667 35.216667
m3
Ukraine 61
Koktebel 45.133333
33.616667
Municipial
3
333,000
m3 1997
Yes
Ukraine 62
Saki 45.366667
33.150000
Municipial
5
300,000
m3
Yes
Ukraine 63
Novoozernoe,
Municipial
4
286,800 m3
Yes
GKPSU Ekologia
45.983333
33.833333
Ukraine 64
Krasnoperekopsk,
Industrial 2207
100,055,000
Yes
Crimea soda plant
tonnes
site, Krasnoe lake
45.966667
33.783333
Ukraine 65
Krasnoperekopsk,
Industrial 5
609,000
Yes
Brom plant, Staroe
tonnes
lake 41.016667
29.566667
Ukraine
Krasnoperekopsk,
Industrial 0.13
2,700
Yes
Brom plant
tonnes
Ukraine
Krasnoperekopsk,
Industrial,
limestone
0.8 1,500,000
Yes
Brom plant
production
tonnes
Ukraine
Krasnoperekopsk
Municipial
10
641,000
m3 2001
Yes
Ukraine
Armyansk, Titan
Industrial
and
4.3
1997
Yes
plant
municipal
Ukraine
Armyansk, Titan
Industrial, 1.5
Yes
plant
phosphogypsum
229
Country Reference Name of landfill
Longitude
Latitude
Type of waste
Surface
Landfill
First year
Last year
Is the
to Fig, <>
handled
area (ha)
capacity
of
of
landfill still
operation
operation
operational
Ukraine
Armyansk, Titan
Industrial,
acid
4132 51,450,000
Yes
plant
collector-evaporator
tonnes
Ukraine
Armyansk, Titan
Industrial, 16
Yes
plant
phosphogypsum
storage site
Ukraine
Armyansk, Titan
Industrial, 56.1
Yes
plant
phosphogypsum
Ukraine
Armyansk, Titan
Industrial
167
Yes
plant
Ukraine
Armyansk Municipial
6.92
132,000
2004
Yes
tonnes
Ukraine 66
Kirilovka
Municipial
3.1
466,377
1972
Yes
46.100000 33.690000
tonnes
Ukraine
Primorsk Municipial
7
53,280
Yes
tonnes
Ukraine
Berdyansk Municipial
19
3,516,150
Yes
tonnes
Ukraine 67
Berdyansk, pond-
Industrial and
21.4 300,000
1961
Yes
evaporator, Azot
municipal
tonnes
plant 46.100000
33.690000
Ukraine
Berdyansk, pond-
Industrial 1.78
45,750
1973
Yes
evaporator,
tonnes
Berdyansk state plant
of glass fiber
Ukraine
Yakimovka Municipal 11.6
256,000
n.a.
Yes
tonnes
Ukraine
Radionovka Municipal 3.9 9,682
Yes
tonnes
Ukraine
Priazovsk Municipal 6.38
85,249
1988
Yes
tonnes
Ukraine
Nova Dofinovka
Municipal
11.3
Yes
Ukraine
Karolono-Bugaz
Municipal
1.5
Yes
Ukraine
Sergeevka
Municipal
4
Yes
Ukraine
Mikolaevka
Municipal
2
Yes
Ukraine
Tuzly
Municipal
2
Yes
230
Country Reference Name of landfill
Longitude
Latitude
Type of waste
Surface
Landfill
First year
Last year
Is the
to Fig, <>
handled
area (ha)
capacity
of
of
landfill still
operation
operation
operational
Ukraine 68
Primorske
45.530000
29.610000
Municipal
2
Yes
Ukraine 69
Primorske
45.700000
29.800000
Municipal
1.5
Yes
231
Annex 10:BOD5 LOADS
Industrial BOD5 loads to the Blkack Sea (tonne/yr)
Country
Industrial Pollution Source
1995
1996 1997 1998 1999 2000 2001 2002 2003 2004 2005
Rosenets - oil terminal
1.3
Port Varna
668.2
114.3
402.9
2925.8
527.8
14.9
12.5
13.4
Bulgaria
Port
Bourgas
367.7
267
184.7 481.5
558.2
412 344
Solvey SODI AD
LUKOIL Neftochim
245.8
180.5
389
3500.9
541.6
193.9
473
312
256
Georgia
Batumi
Oil
Terminal
19,0
18,1
Rompetrol
Refinemnet
786.17 634.67 518.7 421.63 317.6 211.61 176.39 242.07 231.55 196.35 165.623
Romania
OIL
Terminal
22.39
4.45
1.6
1.69
18.023
1.899
Ballast water treatment plant, Tuapse
15.70 11.20 9.40 10.52 10.50 9.20 7.80 7.80 5.80 9.30 9.00
Russian
Federation
Ballast water treatment plant,
Novorossiysk
KBI Murgul, Copper
741
741
Turkey
TUGSAS Samsun, Fertilizer
KBI Samsun Copper
1040
OJSC "BROM", Krasnoperekopsk
Illichivs'k sea trade port
15.8 18.1 21.5 22.2 32.4 25.5 29.9 27.8 36.7 43.8 48.4
Saky's Chemical plant
105.8 90.1 53.1 45.3 37.7 44.2 65.9 34.8 91.6 96.2 84.4
Svastopol's Heat power station
5.1 4.8 3.9 5.1 5.8 9.1 8.1 3.1 4.6 3.7 3.2
Ukraine
OJSC "Iliichevskiy sea fish port"
3.5 2.6 3.4 3.4 2.7 1.9 1.0 0.9 2.0 1.9 1.8
Odesa's port plant
0.6 15.5 18.3 18.5 16.3 15.4 9.9 3.8 8.6 8.2 7.5
OJSC "Odesa's port refrigerator"
4.2 4.2 3.9 3.5 3.7 3.3 3.4 3.0 3.2 3.4 3.0
OJSC "Odesa's Heat power station"
11.7
10.8 9.8 9.7 7.0 8.2 9.9 8.6 6.2 3.5 3.3
OJSC "Kamysh-Burunskiy iron ore
12 10.2 8.3 7.4 7.1 10 7.4 3.033 8.4 6.6 5.6
combine"
232
Municipal BOD5 loads to the Black Sea (tonne/yr)
Country
Municipal Pollution Source
1995
1996
1997
1998
1999
2000
2001
2002
2003
2004
2005
Balchik
WWTP
4.9
6.1
12.2
6.2
Asparuhovo
WWTP
0.1 0.1 118.0
102.2
11.7
11.8
Tsarevo
WWTP
30.2 66.7 36.2 23.8 40.7 37.0 41.0
Sozopol
WWTP
6304.1
206.3 74.4 41.3 66.3 45.6 55.2
Pomorie
WWTP
32.5
36.1
Bulgaria
Ravda
WWTP
43.1
45.6
Obzor-Byala
WWTP
16.3
16.5
Meden
Rudnik
WWTP
88.2
89.4
Bourgas
WWTP
65.2
65.4
Kiten
WWTP
17.3
17.4
Georgia
Kobuleti Sewage System
192.0
200.0
200.0
128.0
128.0
130.0
82.0
79.0
79.0
Constanta
Sud
WWTP
1362.3 1644.1 1536.4 2956.2 2485.5 1792.4 1354.9 2131.1 965.7 802.3 557.6
Romania
Constanta
Nord
WWTP
2163.8 2354.3 2275.3 1708.4 894.7 1254.0 1072.0 670.0 417.0
Eforie
Sud
WWTP
294.7 225.6 342.3 1150.8 618.1 612.1 399.0 237.1 115.3 296.0 160.4
Mangalia
WWTP
522.8 415.2 327.8 553.3 417.7 636.3 166.9 230.5 62.1 120.1 141.3
Adler
149.0 146.0 124.5 111.0 107.0 105.0 106.0 103.0 106.0 137.0 167.0
Kudepsta
127.0 118.5 110.0 108.0 108.0 105.0 102.0 102.0 98.6 96.0 97.9
Bzugu
143.0 134.5 128.0 122.0 120.0 116.0 107.5 108.0 102.0 115.0 117.0
Navaginskiye
634.0 621.0 591.0 566.0 604.0 508.0 419.0 402.0 452.0 541.0 554.0
Dagomis
116.0 106.0 94.0 91.0 87.0 87.0 89.0 86.0 87.7 99.0 101.0
Russian
Lazarevskiye 68.8
68.4
63.0 58.0 51.0 51.0 52.6 50.8 53.0 54.0 55.8
Federation
Tuapse
116.0 83.3 80.0 84.0 100.0 101.4 103.1 114.8 95.3 55.6 41.8
Gelendzhik
55.0 46.0 62.0 51.0 81.0 57.9 63.6 12.8 85.3 101.0 236.5
Kabardinka
19.7
17.6
Novorossiysk
316.6
355.2 329.0 344.8 324.2 333.3 315.4 401.7 342.1 358.8 315.9
Anapa
103.6 96.8 72.4 85.7 58.7 79.0 68.3 79.0 74.6 76.4 71.7
233
Country
Municipal Pollution Source
1995
1996
1997
1998
1999
2000
2001
2002
2003
2004
2005
Trabzon
(Pretreatment)
2975.0
1430.0
1430.0
Samsun
WWTP
8044.0
780.0
3340.0
Zonguldak
WWTP
1194.0
120.0
120.0
Turkey
Giresun
(Marine
Disposal)
806.0
440.0
440.0
Ordu
(Marine
Disposal)
1272.0
803.0
803.0
Bafra
WWTP
332.0
80.0
32.0
Ereli
(Marine
Disposal)
775.0
1310.0
1310.0
PMWSF,
Yalta
307.9 387.2 381.3 347.9 392.7 383.8 304.4 244.8 276.2 297.9 326.7
PMWSF,
Simeiz
126.8 127.6 131.2 127.3 154.3 126.3 109.9 109.5 117.7 132.2 121.5
PMWSF,
Hurzuf
77.3 50.7 47.2 46.9 45.3 40.3 29.9 18.9 21.0 21.1 20.7
SBP
"North",
Odesa
2146.6 2208.9 681.7 576.3 591.4 544.2 594.4 571.3 641.6 637.5 603.3
SBP
"South",
Odesa
2146.6 2208.9 681.7 576.3 591.4 544.2 594.4 571.3 641.6 637.5 603.3
PMWSF,
Yevpatoriia
209.4 208.1 207.3 171.5 140.9 111.5 118.7 121.6 148.0 215.4 245.2
Public enterprise
3130.7 3252.7 2968.5 2675.8 2520.9 2205.8 2439.4 2739.0 3080.5 3271.4 3300.2
"Sevtownwatersewerage"
Ukraine
PMWSF, Fodosiia
124.4 117.4 116.3 120.2 123.7 123.3 163.4 50.8 181.1 192.2 178.2
PMWSF,
Alushta
75.5 63.3 73.7 77.3 82.5 84.2 80.7 121.4 115.3 117.8 125.3
PMWSF,
Sudak
43.9 25.6 25.9 25.9 25.7 25.1 24.2 33.1 27.2 34.4 69.9
TPE
"Clearing
building",
Skadovs'k 5.5 5.1 4.8 4.6 4.2 3.9 3.3 3.3 3.5 3.6 3.7
Ochakovwatersewerage
5.7 4.1 3.5 2.8 1.1 1.2 1.1 1.2 1.2 1.0 1.0
PWP, Partnit
7.9 6.7 7.0 16.1 17.7 10.7 17.7 16.5 18.3 18.5 17.0
SCB,
Balaklawa
703.5 685.5 617.0 576.8 522.9 541.0 391.8 459.4 440.0 423.3 411.5
Public
combine,
Chornomors'k
4.6 5.7 4.9 4.3 3.9 3.7 3.6 3.9 4.7 4.7 4.4
234
River BOD5 loads to the Black Sea (ktonne/yr)
Country
River
1995 1996 1997 1998 1999 2000 2001 2002 2003 2004 2005
Kamchiya
1.63 2.30 2.15 2.94 1.50 1.73 0.61 4.15
Aheloy
0.01
0.01
0.03
Veleka
0.24
0.13
1.04
Ropotamo
0.01
0.01
0.04
Batova
0.01
0.00
0.04
Bulgaria
Diavolska
0.00
0.00
0.01
Dvoinitza
0.03
0.02
0.07
Hadjiska
0.01
0.01
0.04
Karaach
0.02
0.01
0.05
Rezovska
0.10
0.07
0.42
Rioni
0.44 1.88 1.31 1.29 1.48 0.94 0.62 0.51 0.51 0.78 0.81
Supsa
0.00 0.00 0.00 0.00 0.00 0.00 0.00 0.00 0.00 0.00 0.01
Chorakhi
0.40 0.40 0.40 0.30 0.35 0.39 0.48 0.50 0.51 0.78 0.84
Georgia
Natanebi
0.02
0.02
0.02 0.03
0.03
0.03
0.03 0.08
0.07
Khobi
0.01 0.10 0.10 0.30 0.18 0.10 0.10 0.13 0.12 0.12 0.11
Kubastskali
0.04
0.04
Romania
Danube
616.30 621.30 758.90 776.40 710.70 456.60 303.00 343.00 256.83 383.39 341.61
Sochi
1.21 1.24 0.99 0.70 0.92 1.36 2.59 1.24 1.08 1.59 1.80
Russian
Khosta
0.28 0.19 0.12 0.17 0.25 0.23 0.34 0.31 0.31 0.50 0.66
Federation
Mzimta
2.59 1.83 1.97 2.88 2.74 5.35 5.06 3.90 6.49 5.84
Tuapse
0.95 1.79 0.78 1.85 1.72 1.76 1.71 2.37 2.17 2.34 4.32
Sakarya
17.70 10.02 17.98 25.61 13.03 18.53 4.95 18.85 11.97 14.90 14.57
Kizilirmak
0.99
0.03
0.18
0.55
Turkey
Filyos
8.42
13.81
19.49
4.61
2.01
10.71
Yeilirmak
7.31 6.03 5.48 6.33 3.46 8.08 7.82 10.54 20.47 9.89 14.21
Dniepro
95.07 84.10 99.19 162.92 174.20 111.98 132.75 94.54 95.87 133.64 130.24
Ukraine
Southern
Bug
5.44 8.91 7.40 8.63 7.10 6.31 7.09 5.97 9.19 6.16 7.80
Dniester
22.58 34.42 52.14 19.89 41.42 26.42 34.71 38.34 21.51 15.79 33.59
River BOD5 loads to the Sea of Azov (ktonne/yr)
Country
River
1995 1996 1997 1998 1999 2000 2001 2002 2003 2004 2005
Russian
Kuban
18.1 19.6 28.0 19.1 15.2 16.4 14.0 25.2 13.7
Federation
Don
54.7 78.2 77.8 64.3 78.9 58.3 64.4 48.0 82.1
235
Annex 11:IMPLEMENTATION OF HOT-SPOTS CAPITAL INVESTMENTS IDENTIFIED IN THE
1996 TDA
Identified capital investments made
Some progress in implementing capital investments
Further work required
Nature of
Estimated
Estimated costs
Capital
investment
Financial
for 2005-2015
Pollution source
Pollution
Implemented measures
investment
Planned measures for
Country
identified
Requirement
plan
name
source type
1995-2005
costs 1995 -
2005 - 2015
under 1996
(1996 TDA,
implementation
2005 (USD)
TDA
USD)
(USD)
Construction planned
WWTP
Bulgaria Rosenets
Oil Terminal
8,00,000
WWTP Construction
800,000
for completion by end
Construction
2006
WWTP
Bulgaria Varna
Port
700,000
WWTP Extension
700,000
Extension
WWTP
Bulgaria Burgas
Port
2,200,000
WWTP Extension
2,000,000
Extension
WWTP
Bulgaria Asparouhovo
Domestic
7,000,000
WWTP Extension
7,000,000
Plant closed
Extension
WWTP
Construction started in
Bulgaria Balchik
Domestic
8,000,000
WWTP Extension
8,000,000
Extension
2006
WWTP
Bulgaria Sodi
Soda Ash
1,250,000
WWTP Construction
1,250,000
Under construction
Construction
WWTP
Bulgaria Tsarevo
Domestic
8,000,000
WWTP Extension
8,000,000
Under construction
Extension
Construction planned
WWTP
Bulgaria Neftochim
Refinery
2,500,000
WWTP extension
2,500,000
for completion by end
Construction
2006
WWTP
Bulgaria Sozopol
Domestic
6,000,000
WWTP Extension
Construction starts 2006 6,000,000
Extension
WWTP
Georgia
Kutaisi
Domestic
6,000,000
Reconstruction
236
Nature of
Estimated
Estimated costs
Capital
investment
Financial
for 2005-2015
Pollution source
Pollution
Implemented measures
investment
Planned measures for
Country
identified
Requirement
plan
name
source type
1995-2005
costs 1995 -
2005 - 2015
under 1996
(1996 TDA,
implementation
2005 (USD)
TDA
USD)
(USD)
Water supply and
WWTP
Georgia
Batumi
Domestic
13,000,000
sanitation for the town
97,099,000
Reconstruction
of Batumi
WWTP
Georgia
Chiatura
Manganese
10,500,000
Construction
Water supply and
WWTP
Georgia
Poti
Domestic
2,000,000
sanitation for the town
16,359,000
Reconstruction
of Poti
WWTP
Georgia
Zestaponi
Metallurgy
1,500,000
Construction
WWTP
Georgia
Tskhaltubo
Domestic
1,000,000
Reconstruction
WWTP
Georgia
Zugdidi
Domestic
1,500,000
Reconstruction
Fertiliser plant was closed
after 1996. Phosphates
WWTP
Romania Fertilchim
Fertilizer
16,750,000
installation was re-opened
Rehabilitation
in 2003/2004, but only as a
storage facility
Rehabilitation of the
Navodari wastewater
treatment plant, which
WWTP
WWTP improvement
Romania Petromidia
Petrochemical
9,324,000
serves both Petromidia
5,000,000
20,000,000
Rehabilitation
and modernization
Complex, and the
neighboring city (2001-
2002)
WWTP
Extension and
Continuing - extension
Romania Constanta North
Domestic
8,000,000
Extension
modernization :
16,527,209+
and modernization
21,491,692+
2,558,717+
11,805,282+
WWTP
Extension and
Continuing - extension
Romania Eforie South
Domestic
1,800,000
5,687,457
19,395,606
Extension
modernization:
and modernization .
WWTP
Extension and
Romania Mangalia
Domestic
4,000,000
18,663,334
Rehabilitation
modernization
237
Nature of
Estimated
Estimated costs
Capital
investment
Financial
for 2005-2015
Pollution source
Pollution
Implemented measures
investment
Planned measures for
Country
identified
Requirement
plan
name
source type
1995-2005
costs 1995 -
2005 - 2015
under 1996
(1996 TDA,
implementation
2005 (USD)
TDA
USD)
(USD)
Finalisation of pumping
Domestic /
WWTP
Extension and
30,590,000+
Romania Constanta South
42,420,000
stations, sewage system
5,654,188
Industrial
Rehabilitation
modernization:
17,571,657
and reservoires
WWTP
Russia
Rostov-on-Don
Domestic
21,000,000
Extension
WWTP
Russia
Taganrog
Domestic
13,000,000
Extension
Included in
WWTP
172,000,000
Russia
Sheskhoris
Oil
6,500,000
Reconstruction
Rehabilitation
USD
investment
WWTP
Russia
Azov
Domestic
10,500,000
Extension
WWTP
Russia
Tuapse
Port
1,400,000
Under reconstruction
200,000
Finalise reconstruction
1,000,000
Construction
WWTP
Russia
Anapa
Domestic
4,000,000
Under reconstruction
3,400,000
Finalise reconstruction
8,300,000
Extension
WWTP
Russia
Gelendzhik
Domestic
4,000,000
Reconstruction
4,000,000
Extension
WWTP
Russia
Dzhoubga
Domestic
3,100,000
Not needed67
Extension
WWTP
Turkey
KBI Samsun
Copper
7,500,000
Rehabilitation
TUGSAS
WWTP
Turkey
Fertilizer
9,600,000
Samsun
Rehabilitation
WWTP
Turkey
Trabzon
Domestic
14,000,000
Construction
WWTP
Turkey Trabzon
(Center)
Domestic
Marine disposal
10,670,000
Construction
67 Population of Dzoubga is 5,200 people. WWTP exists and complies with Existing standards
238
Nature of
Estimated
Estimated costs
Capital
investment
Financial
for 2005-2015
Pollution source
Pollution
Implemented measures
investment
Planned measures for
Country
identified
Requirement
plan
name
source type
1995-2005
costs 1995 -
2005 - 2015
under 1996
(1996 TDA,
implementation
2005 (USD)
TDA
USD)
(USD)
Trabzon
WWTP
Turkey
Domestic
Marine Disposal
2,666,667
(S³rmene)
Construction
WWTP
Turkey Trabzon
(Of) Domestic
Marine disposal
2,666,667
Construction
Trabzon
WWTP
Turkey
Domestic
Marine disposal
3,000,000
(Vakfikebir)
Construction
WWTP
Turkey Trabzon
(Arsin) Domestic
Marine disposal
2,000,000
Construction
Trabzon
WWTP
Turkey
Domestic
Marine disposal
2,000,000
(Ūaribai)
Construction
WWTP
Turkey
KBI Murgul
Copper
2,500,000
Rehabilitation
WWTP
Turkey
Samsun
Domestic
13,216,000
Construction
WWTP
Turkey Samsun
(Terme) Domestic
Biological treatment
1,730,000
Construction
WWTP
Turkey G÷rele
Domestic
Marine disposal
3,000,000
Construction
WWTP
Turkey Bulancak
Domestic
Marine disposal
3,333,333
Construction
WWTP and
Turkey
Zonguldak
Domestic
27,000,000
sewerage
Zonguldak
WWTP and
Turkey
Domestic
3,920,000
Marine disposal
1,660,000
(Ereli)
sewerage
Zonguldak
WWTP and
Turkey
Domestic
Marine Disposal
(G³l³ńl³)
sewerage
WWTP
Turkey
Giresun
Domestic
7,840,000
Construction
Giresun
WWTP
Turkey
Domestic
Marine disposal
68,666
(Bulancak)
Construction
WWTP
Turkey Giresun
(Centre) Domestic
Marine Disposal
4,000,000
Construction
239
Nature of
Estimated
Estimated costs
Capital
investment
Financial
for 2005-2015
Pollution source
Pollution
Implemented measures
investment
Planned measures for
Country
identified
Requirement
plan
name
source type
1995-2005
costs 1995 -
2005 - 2015
under 1996
(1996 TDA,
implementation
2005 (USD)
TDA
USD)
(USD)
WWTP
Turkey
Ordu
Domestic
7,616,000
Construction
WWTP
Turkey Ordu
(Center) Domestic
Marine disposal
Construction
WWTP
Turkey Ordu
(Fatsa)
Domestic
Marine disposal
2,130,000
Construction
WWTP
Turkey Ordu
(▄nye)
Domestic
Marine disposal
1,730,000
Construction
WWTP
Turkey
Bafra
Domestic
3,808,000
Construction
WWTP
Ukraine Pivdenni
Domestic
1,200,000
General reconstruction
3,900,000
General reconstruction
37,000,000
Construction
WWTP
Ukraine Pivnichni
Domestic
39,600,000
General reconstruction
General reconstruction
61,000,000
Construction
WWTP
Ukraine Balaklava
Domestic
7,800,000
Construction
WWTP
Reconstruction and
Reconstruction of
Ukraine Yevpatoria
Domestic
9,500,000
5,170,000
4,200,000
Construction
updating
sewage pipeworks, etc.
WWTP
Ukraine Sevastopol
Domestic
13,300,000
Construction
WWTP
Ukraine Yalta
Domestic
3,100,000
General reconstruction
460,000
Construction
WWTP
Ukraine Gurzuf
Domestic
4,200,000
General reconstruction
1,100,000
Construction
Kamish
WWTP
Ukraine
Iron ore
1,200,000
Burunski
Construction
WWTP
Ukraine Illichevsk
Port
1,978,000
Construction
WWTP
Ukraine Krasnoperekopsk Brom
600,000
General repair works
4,800
Routine reparis
Construction
240
241
Annex 12:EXISTING PROTOCOLS TO THE BUCHAREST
CONVENTION
The 1992 Protocol on protection of the Black Sea Marine Environment against pollution
from land based sources requires the BSC to:
Ę Define pollution prevention criteria as well as recommend appropriate measures
to reduce, control and eliminate pollution of the marine environment of the Black
Sea from land-based sources (Article 6);
Ę Assist the Contracting Parties in informing one another of measures taken, results
achieved or difficulties encountered in the application of this Protocol; and
Ę Determine procedures for the collection and transmission of such information
(Article 7).
The 1992 Dumping Protocol provides, among other things, that the BSC shall be
entrusted with receiving records of permits on dumping in the Black Sea of wastes or
other matter issued by competent national authorities.
The 1992 Emergency Protocol requires that the BSC shall be informed and provide this
information to other interested states in cases where the marine environment of the Black
Sea is in imminent danger of being damaged or has been significantly damaged by
pollution.
The 2003 Black Sea Biodiversity and Landscape Conservation Protocol added an entirely
new aspect to the mandate of the BSC, having extended it to cover issues of species and
landscape protection and conservation. Under the Biodiversity Protocol the BSC must:
Ę Promote the implementation of the Protocol, inform the Contracting Parties of its
work and make recommendations on measures necessary for achieving the aims
of the Protocol (Article 13).
Ę Report on the state of the biological and landscape diversity and efficacy of
undertaken measures to preserve and manage it to the Meeting of the Contracting
Parties on a five year basis in a jointly agreed reporting format.
Ę Be responsible (through its subsidiary bodies - the Advisory Group on the
Conservation of Biological Diversity and the ad hoc Advisory Group on the
Development of Common Methodology for Integrated Coastal Zone
Management) for scientific activities and monitoring and assessment in the field
of biological and landscape diversity, delegating the co-ordination of this work to
the appropriate activity centres (Batumi, Georgia, and Krasnodar, the Russian
Federation) (Article 10).
242
243
Annex 13:INTERNATIONAL CONVENTIONS AND THEIR RATIFICATION STAGE
Russian
No.
Name
Bulgaria Georgia Romania
Turkey Ukraine
Federation
CONVENTIONS RELATED TO ENVIRONMENTAL PROTECTION
1
United Nations Convention on the Law of the Sea
+
a
d
d - d
Agreement relating to the implementation of Part XI of the
2
a
p
a
a
- +
Convention
Agreement for the implementation of the provisions of the
3
Convention relating to the conservation and management of
d - - d
- +
straddling fish stocks and highly migratory fish stocks
Convention on the Protection of the Black Sea Against Pollution,
4
+
+
+ + + +
(Bucharest, 1992)
5
UN Convention on Combat Desertification (1994)
acc
+
acc
acc
+
acc
CONVENTIONS RELATED TO PROTECTION AGAINST POLLUTION
International Convention for the Prevention of Pollution from
+
+
+
+
+
+
6
Ships (London, 1973) MARPOL
annex I-VI
annex I-V
annex I&V
annex I-V
annex I&V
annex I-V
Convention for Civil Liability for Oil Pollution Damage (London,
7
-
-
- + - +
1972)
8
London Convention Protocol (1996)
-
+
-
-
-
-
UN Convention on Long-range Trans-boundary Air Pollution
9
+
acc
+ + + +
(Geneva, 1979)
1984 Protocol on Long-term Financing of the Cooperative
10
Programme for Monitoring and Evaluation of the Long-range
+ap - a +acc + +acc
Transmission of Air Pollutants in Europe (EMEP)
1985 Protocol on the Reduction of Sulphur Emissions or their
11
+ap - - +acc - +acc
Transboundary Fluxes
1988 Protocol concerning the Control of Nitrogen Oxides or their
12
+ - - +acc - +acc
Transboundary Fluxes
1991 Protocol concerning the Control of Emissions of Volatile
13
+ - - - - +-
Organic Compounds or their Transboundary Fluxes
14
1994 Oslo Protocol on Further Reduction of Sulphur Emissions
+
-
-
+-
-
+-
15
1998 Aarhus Protocol on Heavy Metals
+
-
+
-
-
+-
16
1998 Aarhus Protocol on persistent organic pollutants
+
-
+
-
-
+-
244
Russian
No.
Name
Bulgaria Georgia Romania
Turkey Ukraine
Federation
1999 Gothenburg Protocol on Abate Acidification,
17
+
-
+
- - -
Eutrophication and ground-level Ozone Formation
Vienna Convention for the Protection of the Ozone Layer
18
a a a +acc a +acc
(Vienna, 1985)
Montreal Protocol on Substances that Deplete the Ozone Layer
19
a a a +acc a +acc
(Montreal, 1987)
London Amendment to the Montreal Protocol on Substances that
20
+ a a +acc + +
Deplete the Ozone Layer (London, 1990)
Copenhagen Amendment to the Montreal Protocol on Substances
21
+ a
acc - + +
that Deplete the Ozone Layer (Copenhagen, 1992)
Montreal Amendment to the Montreal Protocol on Substances
22
+
a
+ - + -
that Deplete the Ozone Layer (Montreal, 1997)
23
Beijing Ammendment
+
-
acc
-
+
-
Convention on the Control of Trans-boundary Movements of
24
Hazardous Wastes and their Disposal (Basel, 1989)
a a a + + a
United Nations Convention on the Protection and Use of
25
Transboundary Watercourses and International Lakes (Helsinki,
+
-
+
+ - +
1992)
26
Protocol on Water and Health (London 1999)
+-
+-
+
+
-
+
27
Protocol on Civil Liability (Kiev, 2003)
+- +- +- -
- +-
Convention on the Trans-boundary Effects of Industrial
28
+ _ a +a - -
Accidents (Geneva,2001)
Convention on the Prior Informed Consent Procedure for Certain
29
Hazardous Chemical and Pesticides in International Trade
a _ a - +- a
(Rotterdam, 1998)
30
Convention on Persistent Organic Pollutants (Stockholm) 200168
+
+-
+ +- +- +-
CONVENTIONS RELATED TO NATURE PROTECTION
Ramsar Convention on Wetlands of International Importance
31
+
+
+ + + +
Especially Waterfowl Habitat (Ramsar,1971)
Convention on International Trade in Endangered Species of
32
a
a
a c a a
Wild Fauna and Flora (CITES) Washington, D.C., 1973)
68Signed by all countries, ratified by Bulgaria and Romania only
245
Russian
No.
Name
Bulgaria Georgia Romania
Turkey Ukraine
Federation
a
+ with
European Convention on Wildlife and Environment protection
+ with
33
with
- a -
reservation &
(Berne 1979)
reservation
reservation
objection
Convention on the Conservation of Migratory Species of Wild
34
+ + + -769
- +
Animals (Bonn, 1979)
Agreement on the Conservation of African-Asian Migratory
35
+ + + - - +
Water birds (The Hague, 1995)
Agreement on the Conservation of Cetaceans of the
36
+ + + - - +
Mediterranean and Black Sea (Bonn, 1996)
37
Convention on Biological Diversity (Rio de Janeiro, 1992)
+
a
+
+
+
+
38
Cartagena Protocol on Biosafety
+
a
+
-
+
a
39
Convention on plant protection (Roma , 1951)70
ad _ ad ad ad -
CONVENTIONS RELARED TO ENVIRONMENTAL IMPACT ASSESSMENT
Convention on Environmental Impact Assessment in a Trans-
40
boundary Context (Espoo, 1991)71
+ _ + +- - +
41
Protocol on Strategic Environmental Assessment (Kiev, 2003)
+- +- +- -
- +-
CONVENTIONS RELATED TO CLIMATE CHANGE
UN Framework Convention on Climate Change (New York,
42
+
a
+
+
+
+
1992)
Kyoto Protocol to Amend the UN Framework Convention on
43
+
a
+
+
-
+
Climate Change (Kyoto, 1997)
CONVENTIONS RELATED TO PUBLIC INFORMATION & PARTICIPATION
Convention on Access to Public Information, Public Participation
44
in Decision-making and Access to Justice in Environmental
+ + + - - +
Matters (Aarhus, 1998)
45
Protocol on Pollutant Release and Transfer Registers (Kiev,2003)
+-
+-
+-
-
-
+-
Note: "+" Ł signed and ratified, "+-" Ł signed, but not ratified, "+a" Ł signed and under accession, "a"-accession, "ac"- acceptance, "+acc"-signed and accepted, "+ap"- signed and approved, "ad"-
adherence, "p" Ł consent to be bound 1, "d" Ł declaration, "c"- continuation , "-"- is not signed
`
States bound by the Agreement by having ratified, acceded or succeeded to the Convention under article 4, paragraph 1, of the Agreement.
32 Signed by all countries, ratified by Bulgaria and Romania only
69Russian Federation, is not party - has signed the MoU for Siberian Crane
70In force since 2 october 2005
71Russian Federation signed but not ratified the Convention
246
247
Annex 14:INTERNATIONAL COOPERATION THROUGH
BI/TRI-LATERAL AGREEMENTS
Ę Convention between the Government of the Republic of Bulgaria and the
Government of Romania in the field of Environmental Protection, signed on signed
on 09.12.1991, unlimited.
Ę Agreement between the People's Republic of Bulgaria and the Republic of Turkey
for cooperation in the use of water of transboundary rivers Ł signed on 23.10.1968 in
Istanbul; in force since 26.10.1970; ratified Decree 958/28.11.1968., SG 94/1968;
text Ł UN Treaties, volume 807, p. 117, 11513.
Ę Agreement between the Republic of Bulgaria and the Republic of Turkey for
establishing the border in the area of Resovska/Mutludere river mouth and
delineation of the sea area between the two countries in the Black Sea Ł signed on
04.12.1997 in Sofia; in force since 04.11.1998; ratified with a law passed by the
National Assembly on 24.06.1998, SG 79/1998.
Ę Agreement between the Government of the Republic of Bulgaria and the Government
of the Republic of Turkey on Cooperation in the Field of Environmental Protection,
19.04.2004 (* The Agreement has not entered into force yet).
Ę Agreement between the Ministry of Environment and Water of the Republic of
Bulgaria and the Ministry of Environment and Natural Resources of Ukraine on
Cooperation in the field of Preservation of the Environment and Rational Use of
Natural Resources, signed on 30.01.2003, unlimited.
Ę Agreement between the Ministry of Environment and Water of the Republic of
Bulgaria and the Ministry of Environment and Water Management of Romania on
Cooperation in the Field of Water Management, signed on 12.11.2004, in force since
15.03.2005, unlimited.
This is the first specific agreement signed with the competent authorities for WFD in a
neighboring country specifically aimed at WFD implementation including transitional and
coastal waters.
Ę Agreement between the Romanian Government and the Ukrainian Government
regarding the cooperation in the Field of Border Waters Management, signed on
30.09.1997
Ę Agreement between the Ministry of the Environment and Urbanism of the Republic
of Moldova, the Ministry of Waters, Forests and Environmental Protection of
Romania and Ministry of Environment and Natural Resources of Ukraine regarding
the cooperation in the area formed by the Danube Delta and Inferior Prut river's
protected areas, adopted on 05.06.2000
Ę Agreement between the Government of Romania and Government of the Republic of
Turkey regarding the cooperation in the Field of Environmental Protection, adopted
on 10.09.2001
248
249
Annex 15:RELEVANT NATIONAL LEGISLATION
Cross-sectoral legislation
Bulgaria Georgia Romania
Russian Federation
Turkey
Ukraine
Water Act (State Gazette,
Law on Water (1997)
Water Law no. 107/1996
Water Code (1995)
Water Law no. 831
Water Code (1995)
issue 67/1999, enforced on
amended in 2000
modified and supplemented
28 January 2000, amended
by the Law no 310/
in State Gazette, issue
28.06.2004
87/2000). Draft Water
Management Act Ł
December 31,2005, to enter
into force1
Environmental Protection
Law on Environmental
Law on Environmental
Federal Law "On
Environmental Protection
Environmental Protection
Act (EPA), State Gazette No Protection(1996)
Protection
Environmental Protection"
Law (9/8/1983)
Law (1991)
91/25.09.2002
No. 7-/2002
Regulation no.12/ 2002
Law on Mineral Resources
Law 458/2002 concerning
Coastal Law (1990/92-3621) Law on the State Program
concerning the quality
(1996)
the quality of drinking water
of Protection and
required of surface water
Rehabilitation of the
intended for the abstraction
Environment of the Black
of drinking water
and Azov Seas (2201)
Regulation no. 9/2001 on
Law on Management and
Emergency Ordinance
Water Pollution Control
Law on Drinking Water and
the Quality of Water
Protection of the Sea Coast
202/2002 approved by Law
Regulations (2004)
Drinking Water Supply
Intended for Human
and River Banks/2000
280/2003 on Integrated
(2003)
Consumption
Coastal Zone Management
Regulation
concerning
water
for human
consumption/Official
Gazette No. 25730 - 17
February 2005.
Regulation
on
Environmental Impact
Assessment /Official
Gazette No 25318/16
December 2003
250
Chemical pollution
Bulgaria
Georgia
Romania
Russian Federation
Turkey
Ukraine
Regulation no.12/ 2002
Law on Pesticides and
GD No 100/2002
Resolution No. 561 of the
Water Pollution Control
Law of Ukraine On Wastes
concerning the quality
Agrochemicals (1998)
concerning the quality
Head of Krasnodar Kray
Regulations (2004)
(1998)
required of surface water
required of surface water
Administration of
intended for the abstraction
intended for the abstraction
10.06.2004 "On the
of drinking water
of drinking water
Introduction of Amendments
to the Resolution No. 579 of
the Head of Krasnodar Kray
Administration of
28.05.2002 "On Collecting
Payments for the Discharge
of Wastewater and
Pollutants into Sewerage
Systems of Krasnodar Kray
Settlements"
Regulation no.11/ 2002 on
Law on Hazardous
GD No 202/2002 for the
Resolution No. 162 of the
Regulation on Soil Pollution Law on Environmental
the quality of bathing water
Chemicals (1998)
approval of the Technical
Head of Krasnodar Kray
Control / 31 May 2005
Audit (2004)
Norms on the quality of
Administration of
fresh waters needing
10.03.1999 "On
protection or improvement
Determining Minimal Sizes
in order to support fish life
of Water Protection Zones
of Water Objects of
Krasnodar Kray and Their
Coastal Protective Strips"
Regulation No. 8 /2001 on
Law on State Ecological
OMAPAM No
Administrative
the quality of coastal marine Expertise
44/09.01.2004 (OJ No
Transgressions Code of the
waters
154/23.02.2004) for
Russian Federation No.195-
approving the Regulation for /2001
the water quality monitoring
for priority/dangerous
priority substances
251
Bulgaria
Georgia
Romania
Russian Federation
Turkey
Ukraine
Regulation no.4/ 2002 on
Law on Construction,
GD No 201/2002 on the
Federal Law "On
the quality of fish and
Function, Service,
Quality required of shellfish
Environmental Assessment "
shellfish water
Maintenance and Operation
waters establishes norms
No. 174-
of some Oil Transportation
concerning the quality
Facilities and Legislative
required for shellfish waters
Principles of Import,
Transportation, Storage and
Export of Oil Carried out by
these Facilities on the
Territory of Georgia.
Regulation on Protection of
GD 188/2002 updated
GOST 17.1.3.11-84 Nature
Surface Water of Georgia
through the GD 352/2005on
protection. hydrosphere.
from Pollution/Order
the approval NTPA 011, 001 Common requirements on
No.130/1996 of MoEWP
and 002 regarding the
protection of surface (except
discharging conditions of
for marine waters)and
urban wastewater into the
underground water against
aquatic environment
pollution by mineral
fertilizers
Procedures for Estimation of Order No 125/1996 of the
GOST 17.1.3.04-82 Nature
Feasible Constrains on
Minister of Waters, Forests
protection. hydrosphere.
Collection of Polluted And
and Environmental
Common requirements on
Discharged Water, Flowing
Protection for the approval
protection of surface (except
into Water /Order 105/1996
of the regulation procedure
for marine waters) and
for social and economic
underground water against
activities with
pollution by pesticides.
environmental impact details
the permitting procedures
for new investments and
existing activities, as well as
for the methodology of
elaboration of the impact
assessment studies.
252
Bulgaria
Georgia
Romania
Russian Federation
Turkey
Ukraine
Instruction no.1/2004
Approval of Regulations on
Ministerial Order No
Resolution of the Cabinet of
"Environmental Impact
1141/06.12.2002 (OJ No
Ministers of 20.07.1996 #
Assessment" And
21/16.01.2003) approving
815 on the Regulation of the
Instructions of Trunk
the Procedure and the
State Water Monitoring
Pipelines/Order 59/2002
competencies for issuing the
water management permits
and licences
Regulations no. 6/2000 on
Law on Hazardous
MO No 1241/16.01.2003
Resolution of the Cabinet of
the Limit Values for
Chemicals (1998)
(OJ No 104/19.02.2003)
Ministers of 08.05.1996 .
Admissible Contents of
approving the Procedure for
On approval of procedures
Dangerous and Harmful
modification or withdrawal
of determination of the size
Substances in the Waste
of water management
and borders of water
Water Discharged in the
permits or licences.
protection zones and regime
Water Bodies
of economic activities
within these zones
Ordinance on amending and
Ministerial Order No.
Resolution of the Cabinet of
supplementing Regulation
1144/2002 transposing the
Ministers of 11.09.1996
No. 6/9.11.2000 on the limit
EU requirements related to
N1100 On the procedure of
values for admissible
EPER
development and approval
contents of dangerous and
of norms maximum
harmful substances in the
allowable discharge of
waste water discharged in
polluting substances and
the water bodies (State
list of substances to be
Gazette No. 24/23.03.2004),
regulated during discharge
implementing the
requirements of Directive
91/271/EEC concerning
urban waste water treatment
Regulation no.7/2000 on on
Ministerial Order No.
Resolution of the Cabinet of
the Terms and Procedure for
1140/2002 on The National
Ministers of 25.03.1999 On
Discharge of Industrial
Guidance on the Register of
approval of the Rules of the
Waste Waters into
Emitted Pollutants (EPER
protection of surface waters
Settlement Sewer Systems
Guidance)
against pollution by return
waters
Regulation no. 10/2001 on
MO No 1241/2003
Law on Ecological Expertise
issuing of permits for the
(1995)
discharge of waste waters
253
Nutrient over-enrichment/eutrophication
Bulgaria Georgia Romania
Russian Federation
Turkey
Ukraine
MOEW Order RD Ł
Law on Pesticides and
OMAPAM No
Federal Law "On
Regulation on the protection Law on the State Program of
970/28.07.2003 on
Agrochemicals (1998)
1072/19.12.2003 (OJ No
Environmental Assessment " of waters against pollution
Protection and
identifying the sensitive
71/28.01.2004) for
No. 174-
caused by nitrates from
Rehabilitation of the
areas in the Republic of
approving the organization
agricultural sources" /18. 02. Environment of the Black
Bulgaria according to the
of the National Integrated
2004
and Azov Seas (2201)
requirements of Directive
Monitoring, Supervision and
91/271/ concerning
Decision Support System
urban wastewater treatment.
against nitrate pollution
from agricultural sources in
surface waters and ground
waters and the Surveillance
and Appropriate Control
Programme, as surface
waters and groundwater
Regulation no.1/2000 on the Law on Hazardous
Governmental Decision
Norms SP 2.1.5.1059-01
Regulation on
Resolution of the Cabinet of
research, use and protection
Chemicals (1998)
964/2000 concerning the
Environmental Impact
Ministers of 08.02.1999, No
of groundwater
approval of the Action Plan
Assessment /Official
166.On the approval of the
for the protection of waters
Gazette No 25318/16
Rules for Wetlands of
against pollution with
December 2003
National Significance
nitrates coming from
agricultural sources
Regulation no.2/2000 on the Law on Soil Protection
Law 458/2002 amended by
Federal Law "On
Protection of Waters against (1994)
the Law no 311/2004
Atmospheric Air Protection"
Pollution Caused by Nitrates
No. 96-/1999
from Agricultural Sources
Regulation no. 10/2001 on
GOST R 50611-93 Organic-
issuing of permits for the
mineral fertilizer
discharge of waste waters
254
Bulgaria Georgia Romania
Russian Federation
Turkey
Ukraine
Regulation No. 10 of
06.10.2003 on the Emission
Limit Values
(Concentrations in waste
gasses) of sulphur dioxide,
nitrogen oxides and total
dust, discharged to the
atmosphere from large
combustion plants, SG No
93 of 21.10.2003
Fisheries
Bulgaria Georgia Romania
Russian Federation
Turkey
Ukraine
Fisheries and Aquacultures
Law on Fishing Fund,
Resolution No. 124 of the
Fischeries Law (1971)
Law on Fish, other Alive
Act
Fishery and Aquaculture No. Head of Krasnodar Kray
ammended in 1983
Water Resources and Food
192/2001
Administration of
Products from Them (2003)
05.02.2004 "On
Interdepartmental
Commission of Determining
Catch Quotas of Water
Biological Resources for
Coastal Fisheries between
Krasnodar Kray Applicants"
Ordinance Nerd 09-
Order No. 277/ 4 July 2002
Resolution No. 113 of the
25,Sofia/13.01.2006 of the
regarding approval of the
Head of Krasnodar Kray
Minister of Agriculture and
Regulations for organizing
Administration of
Forestry regarding the total
and functioning of the
16.02.1999 "On Measures
allowable catch
National Company for
for the Protection of Marine
Management of Fishery
Biological Resources in
Resources
Coastal Areas Adjacent to
the Territory of Krasnodar
Kray"
Order No. 262/16 July 2001
regarding the Preparation of
the Directory of Vessels and
Fishing boats
255
Bulgaria Georgia Romania
Russian Federation
Turkey
Ukraine
Order No. 422/30 October
2001 for approval of the
Regulation on the conditions
for development of the
commercial fishing activities
in the Black Sea waters
Annual Order on the Fishing
Prohibition (140/247/2002)
Order No. 179/1 June 2001
regarding the Registering
and transmission of the data
related with the marine
fishing activity
Biodiveristy and habitat changes
Bulgaria Georgia Romania
Russian Federation
Turkey
Ukraine
Biodiversity Conservation
National Biodiversity
Law 462/2001 concerning
Law No. 656- of
Law for Protection of
Forestry Code of Ukraine
Act/2002
Strategy and Action
for the approval of
Krasnodar Kray of
Cultural and Natural
(1994)
Plan/2005
Governmental Emergency
31.12.2003 "On Specially
Amenities(1983-2863)
Ordinance no. 236/2000
Protected Natural Territories
concerning the regime of
of Krasnodar Kray"
natural protected areas and
conservation of natural
habitats
Medicinal Plants Act
Law on Plant Protection
Decree No 187/30.03.1990
Resolution No. 850 of the
National Parks Law (1983)
(1994)
(OJ No 46/31.03.1990) -
Head of Krasnodar Kray
ratifying the Paris
Administration of
Convention on Protection of 29.07.2002 "On the
World Cultural and Natural
Protection of Water
Heritage
Biological Resources in the
Black and Azov Sea Basin
on the Territory of
Krasnodar Kray"
256
Bulgaria Georgia Romania
Russian Federation
Turkey
Ukraine
Protected Territories Acts
Law on Protected Area
Law No 26/24.04.1996 (OJ
Resolution No. 113 of the
Forestry Law
Law on Fauna
System (1996)
No 93/08.05.1996) -Forestry Head of Krasnodar Kray
code
Administration of
16.02.1999 "On Measure for
the Protection of Marine
Biological Resources in
Coastal Areas Adjacent to
the Territory of Krasnodar
Kray"
Protection of Agricultural
Law on State Ecological
Law No 103/23.09.1996 (OJ Federal Law "On Specially
Council of Ministers Decree Law on conservation of the
Lands Act
Expertise (1996)
No 328/17.05.2002) on
Protected Natural
for Agency for Specially
Environment
hunting fund
Territories" No. 33-/1995 Protected Areas
(19.10.1989)
Forests Act
Law on Environmental
GD No 230/04.03.2003 (OJ
Federal Law "On Fauna"
Regulation on CITES
Permits (1996)
No 190/26.03.2003) on the
No. 52-/1995
/Official Gazette No 25545
delimitation of the biosphere
dated 6 August 2004
reserves, national parks and
natural parks and the setting
up of their administrations
Protection of New Animal
Law on Wildlife (1996)
MO No 374/03.09.2004 (OJ
Federal Law "On Natural
and Vegetable Species Act
No 849/16.09.2004) on the
Medicinal Resources,
approval of the Action Plan
Medicinal Spa Localities
regarding Cetaceans
and Resorts" No. 26-
Conservation from Black
Sea, Romania waters
Hunting and Game
Law on Creation and
MO No 850/27.10.2003 (OJ
Protection Act/2000
Management of Kolkheti
No 793/11.11.2003) on
Protected Area (1998)
procedure of entrustment of
administration and custody
of the protected natural areas
Genetically Modified
Forest Code (1999);
MO No 552/26.08.2003 (OJ
Organisms Act/2005
No 648/11.09.2003) on
approval of the internal
zoning of natural and
national park from
biological diversity
conservation point of view
257
Bulgaria Georgia Romania
Russian Federation
Turkey
Ukraine
Regulation on the conditions Presidential Decree No.
MO No 246/22.07.2004 (OJ
and order for issuance of
280/2001 on Coordinated
No 732/13.08.2004) on cave
permits for introduction of
Planning and
classification-natural
non-native or reintroduction
Implementation of Ongoing
protected areas
of native animal and plant
and Prospective
species into the nature/2003
Programmes Related to
Bojomi-Kharagauli National
Park and its Supporting
Zone
Administrative Violation
GD No 2151/30.11.2004
Code (1984)
(OJ No 38/12.01.2005) on
setting up the protected
natural area regime for new
zones
Law on Fauna
Law No 462/18.07.2001
regarding the protected
natural area regime,
conservation of natural
habitats, wild flora and
fauna approval
MO No 647/06.07.2001 (OJ
No 416/26.07.2001) for the
approval of the authorization
procedures for the
harvesting, seizing,
acquisition activities and
trading on the external or
internal market and import
of plants and animals from
wild fauna and flora
258
Sectoral policies
Tourism
Bulgaria Georgia Romania
Russian Federation
Turkey
Ukraine
Law on Sanitary Protection
Governance Ordinance No..
Resolution No. 1665- of
Tourism Incentives Law:
Law on resorts (2000)
of Health Resorts
58/1998 regarding the
Krasnodar Kray Legislative
(12.03.1993)
touristic activities in
Assembly of 18.09.2002
Romania
(edition of 24.04.2003) "On
Temporary Order of
Organization, Equipment
and Exploitation of Beaches
of Krasnodar Kray Water
Bodies"
GD No 459/2002 on the
Federal Law "On Natural
No.2634, 4957 Law on
Resolution of the Cabinet of
quality of bathing water
Medicinal Resources,
Changes for Tourism
Ministers "On the legal
Medicinal Spa Localities
Incentives Law
regime of sanitary protection
and Resorts" No. 26-
zones of water bodies"
/1995
(18.12.1998 N 2004)
General Sanitary Law
Law on the assurance of
no.1593
sanitary-epidemiological
wellbeing of population
Resolution
of
the
Cabinet
of
Ministers of 18.12.1998 #
2004 On the legal regime of
sanitary protection zones of
water bodies
Urban planning
Bulgaria Georgia Romania
Russian Federation
Turkey
Ukraine
Regulation No. 7 of 2003 for Law on Land Registration
Law No 5/06.03.2000 (OJ Land Code of the Russian
Settlements law (3.5.1985)
Land Code (2001
the rules and standards for
No 152/12.04.2000) on the Federation No. 136-
management of different
territorial planning use
/2001
territories and management
zones types
259
Bulgaria Georgia Romania
Russian Federation
Turkey
Ukraine
Regulation for amendments
Regulations of Sea and
Law 247/2005 on land use
Urban Planning Code of the
Land Use and Development
and complements to
River Shores of Georgia and planning system
Russian Federation No. 73-
Law (1985-3194)
Regulation No. 7 of 2003 for Regulations for Engineering
/1998
the rules and standards for
Protection/Order 4/2002
management of different
territories and management
zones types (State Gazette
51/21.06.2005)
Regulation No. 8 of 2001 for
Federal Law "On Land
Bosphorus Law:
the scope and the content of
Planning" No. 78-/2001
(18.11.1983)
territorial plans rules and
standards for management
of different territories and
management zones types
Regulation for amendments
and complements to
Regulation No. 8 of 2001 for
the scope and the content of
territorial plans rules and
standards for management
of different territories and
management zones types
(State Gazette
51/21.06.2005)
Agriculture
Bulgaria Georgia Romania
Russian Federation
Turkey
Ukraine
Ordinance No 22 of 4 July
Law on Pesticides and
Order No. 918/2002 of the
GOST R 50611-93 Organic-
Regulation on the Principles Law on pesticides and
2001on organic production
Agrochemicals (1998)
Minister of Waters and
mineral fertilizer
and Implementation of
agrochemicals (06.05.1995
of plants, plant products and
Environmental Protection
Organic Farming/10 June
N 86)
foodstuffs of plant origin
for the approval of the Code
2005
and indications referring
for Best Agricultural
thereto on them
Practices
260
Bulgaria Georgia Romania
Russian Federation
Turkey
Ukraine
Ordinance No 35 of 30
Law on Soil Protection
Governmental Decision
GOST 17.1.3.11-84 Nature
Regulation on the
Law on resorts (2000)
August 2001on organic
(1994)
964/2000 for the approval of protection. hydrosphere.
Production, Import, Export,
production of livestock,
the National Action Plan for Common requirements on
Marketing and Inspection of
livestock products and
water protection against the
protection of surface (except Organic, Organomineral,
foodstuffs of animal origin
pollution caused by nitrates
for marine waters)and
Soil Conditioner and
and indications referring
from agricultural sources
underground water against
Microbial Fertilizer used in
thereto on them
pollution by mineral
Agriculture, 22 April 2003
fertilizers
Law for the approval of the
1997 Presidential Decree for
GOST 17.1.3.04-82 Nature
The Code on Good
Resolution of the Cabinet of
Code for best Agricultural
the adoption of the Concept
protection. hydrosphere.
Agricultural Practices-
Ministers "On the legal
Practices
of Agrarian Policy of
Common requirements on
08/09/2004 (Official Journal regime of sanitary protection
Georgia
protection of surface(except
no. 25577)
zones of water bodies"
for marine waters) and
(18.12.1998 N 2004)
underground water against
pollution by pesticides.
GOST 12.3.041-86.
The Regulation
Resolution of the Cabinet of
Application of pesticides for no.25377/18.02.2004 on the
Ministers "On approval of
the protection of vegetation.
protection of waters against
the Procedure of usage of
Requirements of safety.
pollution caused by nitrates
the lands of water
from agricultural sources
fund"(13.05.1996 N 502)
SanPiN 1.2.1077-01.
Law on Grazeland:
Resolution of the Cabinet of
Hygienic requirements to
(28.02.1998)
Ministers "On the approval
storage, application and
of the Rules for Compiling
transportation pesticides and
River Passports and Rules
agrochemicals. Sanitary
for the Determination of
regulations and normatives
Bank Areas of the
Waterways and Their Use"
(14.04.1997 No 347)
GOST 26074-84 - Liquid
No.3083 Law of
manure. Veterinary and
Agricultural Reform on
sanitary requirements for
Arrangement of Fields in
treatment, storage,
Irrigated Area
transportation and utilization
261
Bulgaria Georgia Romania
Russian Federation
Turkey
Ukraine
GOST 17.1.2.03-90 Nature
protection. Hydrosphere.
The criteria and quality
characteristics of water for
irrigation
Industry & Transport
Bulgaria
Georgia
Romania
Russian Federation
Turkey
Ukraine
Regulation no.7/2000 on on
Law on Security of
Governmental Decision No
Federal Law "On
Harbors Law: (14.04.1923)
Law on the State Program of
the Terms and Procedure for Hazardous Industrial
625/2001 for the approval of Environmental Assessment "
the Development of Water
Discharge of Industrial
Objects/1997(2000)
the authorisation procedure
No. 174-
Industry (2002)
Waste Waters into
of traders
Settlement Sewer Systems
Regulation on the Terms and Law on Construction,
Ministerial Order No
Federal Law "On Power
No.4737 Law on Industrial
Procedures for Issuing of
Function, Service,
169/02.03.2004 (OJ No
Industry" No. 35-/2003
Zone
Integrated Permits for
Maintenance and Operation
206/09.03.2004) for the
Construction and Operation
of some Oil Transportation
approval of the direct
of New and Operation of
Facilities and Legislative
confirmation method for the
Existing Industrial
Principles of Import,
reference documents
Establishments and
Transportation, Storage and
regarding the Best Available
Installations/Decree No 62
Export of Oil Carried out by Techniques (BREF)
of the Council of Ministers
these Facilities on the
approved by European
of 12.03.2003, SG No 26 of
Territory of Georgia/1996
Union
21.03.2003
Governmental
Emergency
Ordinance (GEO) No
34/2002 on integrated
pollution prevention,
reduction and control,
subsequently modified and
approved by the Parliament
through the Law 645/2002
Order 566/2003 (M.Of. No.
No. 4691 Law on
689/01.01.2003)of the
Development of the
MoEWP on the approval of
Technology
the guide for BAT for
cement industry.
262
Bulgaria
Georgia
Romania
Russian Federation
Turkey
Ukraine
Order 37/2003 of the
MoEWP (M.Of. No.
247/10.04.2003) on the
approval of the guide for
BAT for pulp and paper
industry
263