XIX NON-REGIONAL SEAS LMES
XIX-58 West Greenland Shelf LME
XIX-59 Newfoundland-Labrador Shelf LME
XIX-60 Scotian Shelf LME
XIX-61 Northeast U.S. Continental Shelf LME
XIX-62 Hudson Bay LME
XIX-63 Insular Pacific-Hawaiian LME
XIX-64 Southwest Australian Shelf LME
776
XIX Non-Regional Seas LMEs
XIX Non Regional Seas LMEs
777
XIX-58 West Greenland Shelf LME
M.C. Aquarone and S. Adams
The West Greenland Shelf LME extends along Greenland's west coast in the Atlantic
Ocean, and encompasses a number of banks, including the Fyllas Bank. It has an area
of 375,000 km2, of which 1.37% is protected, and contains one major estuary, the
Tasersuaq (Sea Around Us 2007). It is characterised by its subarctic climate, as well as
by ice cover for parts of the year. For a map of sea currents and geography, see
Pedersen & Rice (2002). Climate is the primary force driving this LME, with intensive
fishing as the secondary driving force. Nutrient enrichment and mixing depend on
changes in sea and air temperature. Book chapters and articles pertaining to this LME
include Hovgĺrd & Buch (1990), Blindheim & Skjoldal (1993), Pedersen & Rice (2002)
and UNEP (2004).
I. Productivity
The West Greenland Shelf LME is a Class III, low productivity (<150 gCm-2yr-1)
ecosystem. The waters of the West Greenland Current come from Greenland's south
coast, the Labrador Sea and from East Greenland's strong Irminger Current. For a map
of surface currents in the northern part of the Atlantic Ocean, see Hovgĺrd & Buch (1990,
p. 39). Hydrographical conditions seem to be changing in the Irminger Sea to the east.
For more information on variations in climate, see Hovgard & Buch (1990). There is a
relatively long time series of plankton and hydrographic samples allowing an exploration
of the links between climate, physical oceanography and abundance of major
zooplankton and ichthyoplankton species (see Pedersen & Rice 2002). Investigations on
selected fish larvae and zooplankton in relation to hydrographic features are currently
undertaken as part of the monitoring programme NuukBasic. The marine component of
the monitoring program was initiated in 2005, and is managed by the Center of Marine
Ecology and Climate Effects at Greenland Institute of Natural Resources. Results from
the monitoring programme are published in annual reports, as well as peer-reviewed
scientific papers when appropriate. Currents carry cod eggs and larvae in a clockwise
direction around the southern part of Greenland, but there is a need to learn more about
the patterns of occurrence of selected fish larvae and zooplankton over time and space
and how those patterns relate to hydrographic features. For more information on the
variable inflow of cod larvae from Iceland, see Hovgard & Buch (1990). Studies showed
a decreasing trend in zooplankton abundance. Information on current velocity is scarce.
For a study of factors affecting the distribution of Atlantic cod, Greenland halibut, redfish,
long rough dab, wolf fish, sandeel and northern shrimp, see Pedersen & Rice (2002).
The decline of cod, redfish and long rough dab stocks can be seen mostly as
consequences of changes in climate, temperature and salinity. NORWESTLAND has
conducted surveys along 3 transects in the West Greenland coast, Store Hellefiske bank,
Sukkertop bank and Fyllas bank, where sea temperatures and salinities have been
measured.
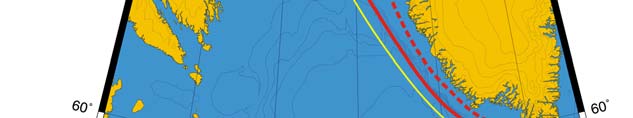
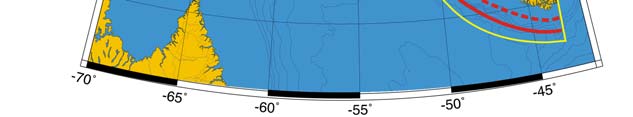
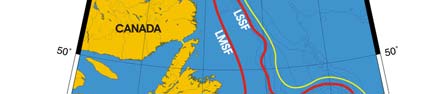
Oceanic fronts (Belkin et al. 2008) (Figure XIX-58.1): The West Greenland Current Front
(WGCF) closely follows the shelf break and the steep upper slope until 52°W, where the
slope becomes notably less steep and therefore no longer stabilises the WGCF. The
front instability results in eddy generation that enhances cross-frontal exchange of heat,
salt and nutrients as well as larvae and juvenile fish. The WGCF waters originate partly
in the cold, fresh East Greenland Current and partly in the warm and salty Irminger
Current. The Mid-Shelf Front (MSF) runs over mid-shelf roughly parallel to the coast and


778
58. West Greenland Shelf LME
carries very cold, low-salinity polar water originated in the East Greenland Current
augmented by melt water from the Greenland Ice Sheet.
Figure XIX-58.1. Fronts of the West Greenland Shelf LME. MSF, Mid-Shelf Front (most probable
location); WGCF, West Greenland Current Front. Yellow line, LME boundary. After Belkin et al. (2008).
West Greenland Shelf SST (Belkin 2008) (Figure XIX-58.2):
Linear SST trend since 1957: 0.42°C.
Linear SST trend since 1982: 0.73°C.
The long-term 50-year warming of the West Greenland Shelf was interrupted by cold events that
peaked in 1970, 1983-84, and 1996. These cold anomalies were associated with low-salinity,
high-sea-ice cover anomalies dubbed "Great Salinity Anomalies" or GSAs since they are best
detected in the salinity time series (Dickson et al., 1988; Belkin et al., 1998; Belkin, 2004). The
GSAs form in the Arctic and are transported by oceanic currents into the northern North Atlantic
either through Fram Strait between Greenland and Svalbard or through the straits of the
Canadian Arctic Archipelago; some GSAs could also form locally in the Labrador Sea. The West
Greenland Shelf is one of a few LMEs where the GSAs are conspicuous in temperature records
as well as in salinity time series. As the GSAs travel along the Subarctic Gyre, they affect
spawning and fishing grounds; generally, their impact is detrimental to fish stocks. The first
anomaly (GSA'70s) led to a collapse of cod stock in this area, ultimately replaced by shrimp. The
ensuing cod-to-shrimp transition of local fisheries has had profound societal ramifications at the
regional level (Hamilton et al., 2003). The cold episodes of the early 1980s and early-to-mid
1990s have been caused by the harshest climatic conditions ever recorded in this area since the
XIX Non Regional Seas LMEs
779
beginning of meteorological observations at Godthab (now Nuuk) in the mid-19th century. During
these events, enhanced export of cold and fresh Arctic waters to the Baffin Bay and Labrador
Sea (through Canadian straits and also through Fram Strait) likely contributed to the formation of
the GSA'80s and GSA'90s. The all-time maximum SST of >1.4°C in 2003-2004 may have been
advected from the upstream-located East Greenland Shelf LME where SST peaked at >2.6°C in
2003.
Figure XIX-58.2. West Greenland Shelf LME annual mean SST (left) and SST anomalies, 1957-2006,
based on Hadley climatology. After Belkin (2008).
West Greenland Shelf LME Chlorophyll and Primary Productivity
This LME is a Class III, low productivity (<150 gCm-2yr-1) ecosystem (Figure XIX-58.3).
Figure XIX-58.3. West Greenland Shelf LME trends in chlorophyll a (left) and primary productivity
(right), 1998-2006, from satellite ocean colour imagery. Values are colour coded to the right hand
ordinate. Figure courtesy of J. O'Reilly and K. Hyde. Sources discussed p. 15 this volume.
II. Fish and Fisheries
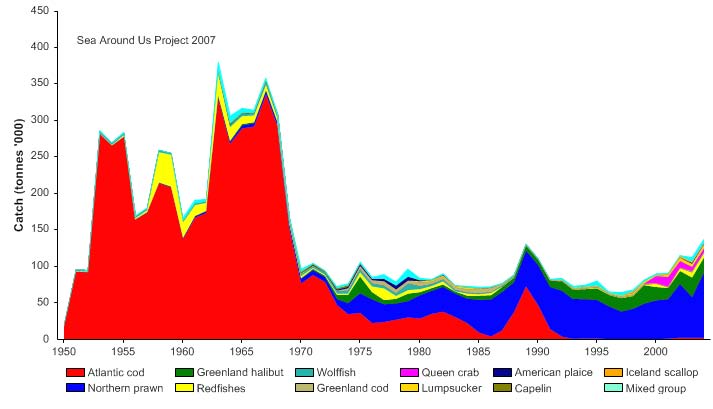
The most important species group in terms of shelf catches for recent years is the
northern prawn (Pandalus borealis), representing more than two-thirds of the total catch.
Another important species group is flatfish. For a study of changes in the West
Greenland fisheries, see Pedersen & Rice (2002). Reported landings of commercial fish
species show major changes over the past century, from a system dominated by Atlantic
cod landings to one defined by prawn landings Reported landings were at a historical
780
58. West Greenland Shelf LME
peak of over 350,000 tonnes in the 1960s (Figure XIX-58.4). They subsequently showed
significant declines to under 100,000 tonnes, with the decline in cod landings, but have
shown an increasing trend over the last few years (Figure XIX-58.4). As northern prawn
now contributes the majority of the reported landings, a potentially large amount of fish
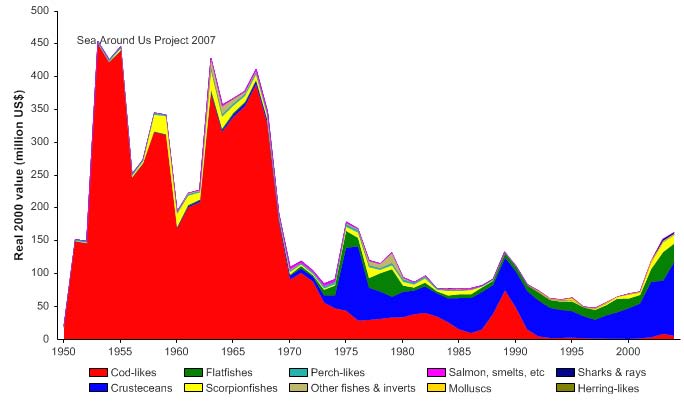
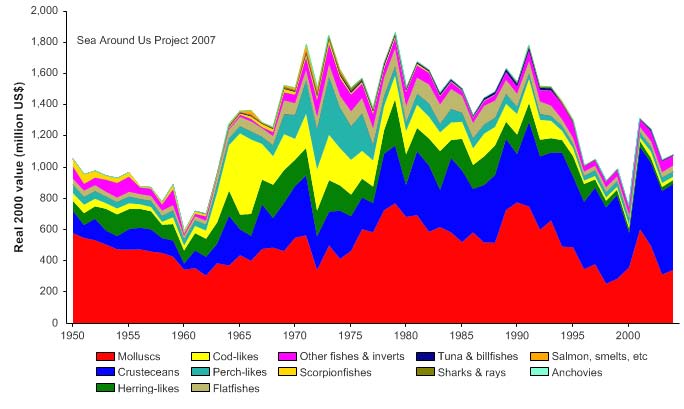
bycatch can be assumed to remain unreported. The value of the reported landings
reached US$400 million (in 2000 US dollars) in the 1950s and 1960s, but has since
reduced to US$163 million in 2004 (Figure XIX-58.5).
Figure XIX-58.4. Total reported landings in the West Greenland Shelf LME by species (Sea Around Us
2007).
Figure XIX-58.5. Value of reported landings in the West Greenland Shelf LME by commercial groups
(Sea Around Us 2007).
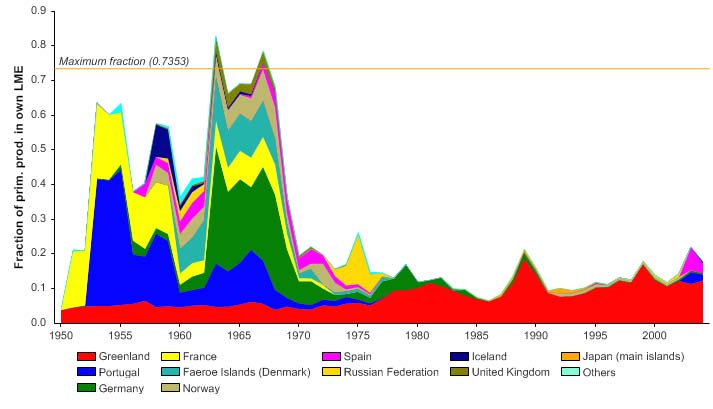
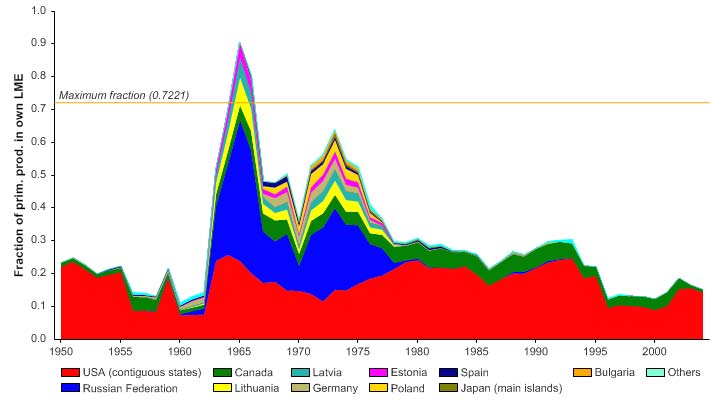
The primary production required (PPR; Pauly & Christensen 1995) to sustain the reported
landings in this LME was over 70% of the observed primary production in the 1960s
before declining to less than 2% over the last three decades. The extremely high PPR
recorded in the 1960s is likely a result of the high level of accumulated biomass of cod
stocks being exploited, not due to the exploitation of annual surplus production.
XIX Non Regional Seas LMEs
781
Greenland accounts for the largest share of the ecological footprint in this LME, although
European countries accounted for the majority of the footprint in the 1950s and 1960s.
Figure XIX-58.6. Primary production required to support reported landings (i.e., ecological footprint) as
fraction of the observed primary production in the West Greenland Shelf LME (Sea Around Us 2007).
The `Maximum fraction' denotes the mean of the 5 highest values.
From 1950 to 1970, cod was dominant in the reported landings in this LME and as a
result, the mean trohic level (i.e., the MTT, Pauly & Watson 2005) remained high. It then
showed a decline with the change from cod to prawn dominance in the ecosystem
(Figure XIX-58.7, top).
Figure XIX-58.7 Mean trophic level (i.e., Marine Trophic Index) (top) and Fishing-in-Balance Index
(bottom) in the West Greenland Shelf LME (Sea Around Us 2007).
782
58. West Greenland Shelf LME
This trend, by its definition, implies a `fishing down' of the food web (Pauly et al. 1998).
The FiB index showed a similar trend (Figure XIX-58.7, bottom), suggesting that the
reported landings did not compensate for the decline in trophic levels during that period.
However, it must be noted that inclusion of bycatch may alter the trends in the indices
observed here. Furthermore, it is known that the system shift from cod to prawn was to a
large extent driven by environmental changes (see, e.g., Pedersen & Zeller 2001).
The Stock-Catch Status Plots indicate that more than 70% of commercially exploited
stocks in this LME have collapsed (Figure XIX-58.8, top), however, with 90% of the
landings still from fully exploited stocks, more specifically from the northern prawn (Figure
XIX-58.8, bottom). Considering the decrease in the reported landings over the past three
decades (Figure XIX-58.4), the observed trends in these plots present a stark reminder
that they must be examined as a pair, not in isolation from each other.
1950
1960
1970
1980
1990
2000
0%
100
10%
90
20%
)
80
%
(
s
30%
u
70
at
st
40%
y
60
b
50%
cks
50
o
f
st
60%
40
er o
b
70%
m
30
Nu
80%
20
90%
10
100%0
1950
1960
1970
1980
1990
2000
(n = 741)
developing
fully exploited
over-exploited
collapsed
1950
1960
1970
1980
1990
2000
0%
100
10%
90
20%
80
)
%
30%
(
70
s
u
at
40%
60
ck st
50%
o
50
st
y
60%
b
h
40
c
70%
Cat
30
80%
20
90%
10
100%0
1950
1960
1970
1980
1990
2000
(n = 741)
developing
fully exploited
over-exploited
collapsed
Figure XIX-58. 8. Stock-Catch Status Plots for the West Greenland Shelf LME, showing the proportion
of developing (green), fully exploited (yellow), overexploited (orange) and collapsed (purple) fisheries
by number of stocks (top) and by catch biomass (bottom) from 1950 to 2004. Note that (n), the number
of `stocks', i.e., individual landings time series, only include taxonomic entities at species, genus or
family level, i.e., higher and pooled groups have been excluded (see Pauly et al, this vol. for definitions).
Landings of cod, redfish and long rough dab have declined. Low recruitment played an
important role in the collapse of the cod fishery. The periodic fluctuations of cod stocks
have been linked to changes in sea and air temperature (see Hovgĺrd & Buch 1990).
These authors also examine the southern displacement of the cod fishery, and provide
information on the development of the cod stock since 1956. For more information on the
biological effects of the temperature and salinity anomaly on the West Greenland cod,
see Blindheim & Skjoldal (1993). In the same period, catches of Greenland halibut and
XIX Non Regional Seas LMEs
783
northern shrimp increased. For nominal catches of Atlantic cod, redfish, Greenland
halibut and northern shrimp, see Pedersen & Rice (2002, p. 153). The present
abundance of shrimp in this LME may partly be the result of a lower abundance of cod
and redfish (see Horsted 2000). Large numbers of redfish, Greenland halibut, polar cod,
cod and others are caught and discarded in the West Greenland shrimp fishery (see
Pedersen & Kanneworff 1995). It is important to also consider the added influence of
changes in fishery technology and effort on cod stocks. The International Cod and
Climate Change Programme (ICCC) studies the response of different cod populations to
climate changes in various regions of the cod's North Atlantic range. Pedersen, Madsen
and Dyhr-Nielsen (2004) report that fishing mortality on cod has been too high due to by-
catch in the shrimp fishery and due to unregulated fishery directed for cod in the fjords
(GIWA 2004).
III. Pollution and Ecosystem Health
The waters of the West Greenland Shelf LME are little polluted. Information about
pollutants and their transport vectors in the Arctic region including Greenland is available
from the Arctic Marine Assessment Program (AMAP) (www.amap.no). Larsen et al.
(2001) et al. reported in Environmental Pollution (2001) that elevated levels of lead and
zinc have been found in sediments and biota in the fjord at Maarmorilik, West
Greenland--a legacy from the mining once done in the area. Bindler et al. (2001)
concluded that the lead in Sřndre Strřfjord (W. Greenland) sediments dated since WW II
bears isotopic signatures suggesting W European sources as well as Russian sources.
Larsen et al. (2001) et al. conclude that this has important implications for future
depositions of eco-toxicologically important pollutants such as Hg and POPs. Pedersen
et al.(2004) cite studies showing that the cold Arctic climate creates a sink for Hg and
POPs, and that the already high levels of mercury in the Arctic are not declining despite
significant emissions reductions in Europe and North America.
IV. Socioeconomic Conditions
Greenland made the transition from a nation of hunters to a nation of fishers, primarily for
cod, over the course of the last century. A rich Atlantic cod fishery started in the 1920s
after a general warming of the Arctic. It developed from a local, small-boat fishery to an
international offshore fishery of primarily trawlers. Today the fishery is dominated by
shrimp, crab and halibut. The industries of West Greenland include fish processing, gold,
uranium, iron and diamond mining, handicrafts, hides and skins, and small shipyards.
Pedersen et al. (2004) suggest that economic diversification is not yet sufficient to offer
alternative income possibilities to professional fishermen and hunters.
V. Governance
Both Canada and Greenland share jurisdiction over this LME. After 1945 Canadian
fisheries were regulated under the International Commission for the Northwest Atlantic
Fisheries (ICNAF), consisting of all the industrialised fishing nations of the world
operating in that area (see www.nafo.ca/about/icnaf.htm). ICNAF's effectiveness,
however, was limited by the voluntary nature of compliance to its rules. With the increase
in foreign fishing fleets after World War II, the cod fishery expanded greatly. The limited
development of Canada's domestic fleet prompted Canada to establish a 200-mile EEZ
in 1977. The Greenland Institute of Natural Resources is responsible for providing
scientifically sound management advice to the Government of Greenland. Pedersen et
al. (2004) point out that chemical contamination of the waters and ecosystems of
Greenland come there from Europe, Asia and North America. Concerted international
effort should be focused on control of these emissions and to enforce existing
agreements.
784
58. West Greenland Shelf LME
References
Belkin, I.M. (2004) Propagation of the "Great Salinity Anomaly" of the 1990s around the northern
North Atlantic, Geophysical Research Letters, 31(8), L08306, doi:10.1029/2003GL019334.
Belkin, I.M. (2008) Rapid warming of Large Marine Ecosystems, Progress in Oceanography, in
press.
Belkin, I.M., Cornillon, P.C., and Sherman, K. (2008). Fronts in Large Marine Ecosystems of the
world's oceans. Progress in Oceanography, in press.
Belkin, I.M., Levitus, S., Antonov, J. and Malmberg, S.-A. (1998) "Great Salinity Anomalies" in the
North Atlantic, Progress in Oceanography, 41(1), 1-68.
Bindler, R., Anderson, N.J., Renberg, I. & Malmquist. C. (2001). Palaeolimnological investigation of
atmospheric pollution in the Sřndre Strřmfjord region, southern West Greenland:
accumulation rates and spatial patterns. Geology of Greenland Survey Bulletin 189:48-53.
Blindheim, J. and Skjoldal, H.R. (1993). Effects of climatic changes on the biomass yield of the
Barents Sea, Norwegian Sea, and West Greenland Large Marine Ecosystems, p 185-198 in:
Sherman, K., Alexander, L.M. and Gold, B.D. (eds), Large Marine Ecosystems: Stress,
Mitigation and Sustainability. AAAS Press, Washington, D.C., U.S.
Buch, E., Pedersen, S.A. and Ribergaard, M.H. (2003). Ecosystem variability and regime shift in
West Greenland waters. Journal of Northwest Atlantic Fishery Science 34:13-28.
Dickson, R.R., Meincke, J., Malmberg, S.-A., and Lee, A.J. (1988) The "Great Salinity Anomaly" in
the North Atlantic, 19681982, Progress in Oceanography 20(1), 103151.
GIWA (2004) Regional Assessment 18, 15, 16--Arctic Greenland, East Greenland Shelf, West
Greenland Shelf available at www.giwa.net/publications/r1b_15_16.phtml.
Hamilton, L.C., Brown, B.C. and Rasmussen, R.O. (2003) West Greenland's cod-to-shrimp
transition: Local dimensions of climate change, Arctic, 56(3), 271-282.
Horsted, S.A. (2000). A review of the cod fisheries at Greenland, 1910-1995. Journal of Northwest
Atlantic Fishery Science 28:1-109.
Hovgĺrd, H. and Buch, E. (1990). Fluctuation in the cod biomass of the West Greenland Sea
ecosystem in relation to climate, p 36-43 in: Sherman, K., Alexander, L.M. and Gold, L.M. (eds),
Large Marine Ecosystems: Patterns, Processes and Yields. AAAS, Washington, D.C. U.S.
Larsen, T.S., Kristensen, J.A., Asmund, G. and Bjerregaard, P. (2001) Lead and zinc in sediments
and biota from maarmorilik, West Greenland: An assessment of the environmental impact of
mining wastes on an Arctic fjord system. Environmental Pollution 114(2): 275-283.
Pauly, D. and Christensen, V. (1995). Primary production required to sustain global fisheries.
Nature 374: 255-257.
Pauly, D. and Watson, R. (2005). Background and interpretation of the `Marine Trophic Index' as a
measure of biodiversity. Philosophical Transactions of the Royal Society: Biological Sciences
360: 415-423.
Pauly, D., Christensen, V., Dalsgaard, J., Froese R. and Torres, F.C. Jr. (1998). Fishing down
marine food webs. Science 279: 860-863.
Pedersen, S.A. and Kanneworff, P. (1995). Fishes on the West Greenland shrimp grounds, 1988-
1992. ICES Journal of Marine Science 53:165-182.
Pedersen, S.A., Madsen, J. And Dyhr-Nielsen, M. (2004) Arctic Greenland, East Greenland Shelf,
West Greenland Shelf--GIWA Regional assessment 1b, 15, 16. Available electronically at
www.giwa.net/publications/r1b_15_16.phtml.
Pedersen, S.A. and Rice, J.C. (2002). Dynamics of fish larvae, zooplankton, and hydrographical
characteristics in the West Greenland Large Marine Ecosystem 1950-1984, p 151-194 in:
Sherman, K. and Skjoldal, H.R. (eds), Large Marine Ecosystems of the North Atlantic:
Changing States and Sustainability. Elsevier, Amsterdam, The Netherlands.
Pedersen, S.A. and Zeller, D. (2001). Multispecies interactions in the West Greenland marine
ecosystem: importance of the shrimp fisheries. p 111-127 in: Guenette, S., Christensen, V. and
Pauly, D. (eds), Fisheries Impacts on North Atlantic Ecosystems: Models and Analyses.
University of British Columbia Fisheries Centre Research Reports 9(4).
Pedersen, S.A., and Smidt, E.L.B. (2000). Zooplankton distribution and abundance in West
Greenland waters, 1950-1984. Journal of Northwest Atlantic Fishery Science 26:45-102.
Pedersen, S.A., Simonsen, C.S and Storm, L. (2002). Northern shrimp (Pandalus borealis)
recruitment in West Greenland waters. Part I. Distribution of Pandalus shrimp larvae in relation
to hydrography and plankton. Journal of Northwest Atlantic Fishery Science 30:19-46.
Petersen, H., Meltofte, H., Rysgaard, S., Rasch, M., Jonasson, S., Christensen, T.R., Friborg, T.,
Sřgaard, H. and Pedersen, S.A. (2001). The Arctic, p 303-330 in: Climate Change Research -
XIX Non Regional Seas LMEs
785
Danish Contributions. Danish Meteorological Instititute, Ministry of Transport. Gads Forlag,
Copenhagen, Denmark.
Sea Around Us (2007). A Global Database on Marine Fisheries and Ecosystems. Fisheries Centre,
University British Columbia, Vancouver, Canada. http://www.seaaroundus.org/lme/
SummaryInfo.aspx?LME=18
UNEP (2004). Pedersen, S.A., Madsen, J. and Dyhr-Nielsen, M. Arctic Greenland, East Greenland
Shelf, West Greenland Shelf, GIWA Regional Assessment 1b, 15, 16. University of Kalmar,
Kalmar, Sweden. http://www.giwa.net/publications/r1b_15_16.phtml
786
58. West Greenland Shelf LME
XIX Non Regional Seas LMEs
787
XIX-59 Newfoundland-Labrador Shelf LME
M.C. Aquarone and S. Adams
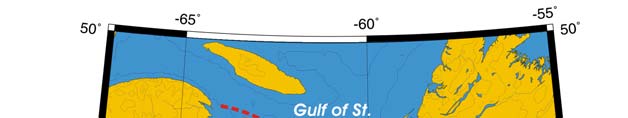
The Newfoundland-Labrador Shelf LME extends some distance off the eastern coast of
Canada, encompassing the areas of the Labrador Current and the Grand Banks. It has
an area of about 896,000 km2, of which 0.44% is protected, and contains 14 major
estuaries (Sea Around Us 2007). The seabed of the shelf is structurally complex. As in
some other LMEs, overexploitation is the principal driver of changes within this LME,
although fluctuations in the ocean climate have also been implicated. The ability to
explain the dynamics of this LME is severely limited by the lack of time series of data on
living components of the system, except for a few species of fishes and seals. A
description of the changing conditions of the fish and fisheries of this LME is given in Rice
(2002).
I. Productivity
The Newfoundland-Labrador Shelf LME is considered a Class II, moderately productive
ecosystem (150-300 gCm-2yr-1). For productivity information, see the GLOBEC Working
Group Summary of the Newfoundland and Labrador Shelves (1993). Harsh
environmental conditions, extensive and persistent sea ice, extreme cold anomalies,
changes in distribution of the area occupied by a Cold Intermediate Layer water mass
(CIL), as well as overfishing, have all contributed to fish population collapses (see Fish
and Fisheries module) in the 1990s. The crab and shrimp that have increased the most
are the favoured prey of cod and other major predators that have collapsed. The new
population densities that have appeared may have redistributed energy flows in ways that
have made it difficult to return to earlier system configurations. There have been several
local studies on plankton dynamics (see Prasad & Haedrich 1993). There was a
continuous plankton recorder transect through this area in the 1950s to the early 1970s.
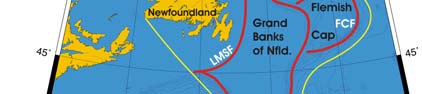
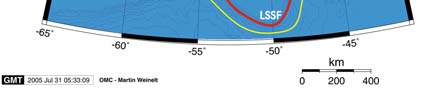
Oceanic fronts (Belkin et al. 2008) (Figure XIX-59.1): The Labrador Shelf-Slope Front
(LSSF) extends along the shelf break and upper slope. The Labrador Mid-Shelf Front
(LMSF) recently identified from satellite data runs inshore of the LSSF, parallel to
Labrador. Farther downstream, the LMSF hugs Newfoundland and merges with the
LSSF south of Newfoundland, near 45°N and 55°W. The Flemish Cap, a shallow bank
that supports important fisheries, is surrounded by the Flemish Cap Front (FCF) that
isolates on-bank waters from direct contact with off-bank oceanic waters. The FCF can
be considered an offshore branch of the LSSF. The main branch of the LSSF continues
south via Flemish Pass between the Grand Banks of Newfoundland and Flemish Cap.
Newfoundland Labrador Shelf SST (Belkin 2008) (Figure XIX-59.2):
Linear SST trend since 1957: 0.77°C.
Linear SST trend since 1982: 1.04°C.


788
59. Newfoundland-Labrador Shelf LME
Figure XIX-59.1. Fronts of the Newfoundland-Labrador Shelf LME. FCF, Flemish Cap Front; LMSF,
Labrador Mid-Shelf Front; LSSF, Labrador Shelf-Slope Front. Yellow line, LME boundary. After Belkin et
al. (2008).
The thermal history of the Newfoundland-Labrador Shelf LME is different from that of the
adjacent Scotian Shelf LME. There was no cold spell in the 1960s. Instead, long-term
steady warming was observed since 1957, punctuated by strong interannual variability
with a magnitude of ~1°C. This warming accelerated since the mid-1990s. Since the
near-all-time minimum of 4.6°C in 1991, the SST has risen to 6.4°C in 2006, a 1.8°C
increase in just 15 years. Despite a single large reversal in 2000-2002, this increase was
one of the fastest regional warming events of the last 25 years. The minima of 1972,
1985 and 1991 may have been associated with large-scale cold, fresh anomalies "Great
Salinity Anomalies" or GSAs (Dickson et al., 1988; Belkin et al., 1998; Belkin, 2004).
These anomalies form in the Arctic Ocean; enter the northern North Atlantic either via
Fram Strait or through the straits of the Canadian Archipelago; and propagate around the
Subarctic Gyre, where they profoundly affect regional ecosystems. The GSAs could also
form in the Labrador Sea (Belkin et al., 1998; Belkin, 2004).
Figure XIX-59.2. Newfoundland-Labrador Shelf LME annual mean SST (left) and SST anomalies (right),
1957-2006, based on Hadley climatology. After Belkin (2008).
XIX Non Regional Seas LMEs
789
Newfoundland-Labrador Shelf LME Chlorophyll and Primary Productivity
This LME is a Class II, moderately productive ecosystem (150-300 gCm-2yr-1) (Figure
XIX-59.3).
Figure XIX-59.3. Newfoundland-Labrador Shelf LME trends in chlorophyll a (left) and primary
productivity (right), 1998-2006, from satellite ocean colour imagery. Values are colour coded to the
right hand ordinate. Figure courtesy of J. O'Reilly and K. Hyde. Sources discussed p. 15 this volume.
II. Fish and Fisheries
Commercially exploited fish species in this LME include cod, haddock, salmon (see
salmon stock assessment for 1997), American plaice, redfish, yellowtail and halibut. Also
harvested are lobster, shrimp and crab. Historic records of catches of Atlantic cod can be
reconstructed back to 1677 (see Forsey & Lear 1987, for a time series of cod catches).
For a stock by stock assessment and recommendation, see Canada's Department of
Fisheries and Oceans website.
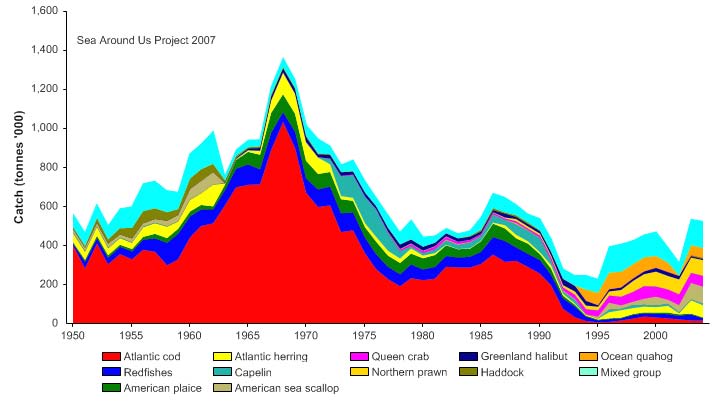
Total reported landings, dominated by cod until the 1990s, exceeded 1 million tonnes
from 1967 to 1970, but declined to 525,000 tonnes in 2004 (Figure XIX-59.4).
Figure XIX-59.4. Total reported landings in the Newfoundland-Labrador Shelf LME by species (Sea
Around Us 2007).
790
59. Newfoundland-Labrador Shelf LME
The cod landings, in particular, declined from a historic high of over 1 million tonnes in
1968 to 16,000 tonnes in 2004 with landings of less than 10,000 tonnes recorded in 1995
and 1996. With the collapse of the cod stock, landings in more recent times are
dominated by invertebrates (crabs, prawns and scallops) and herring (Figure XIX-59.4).
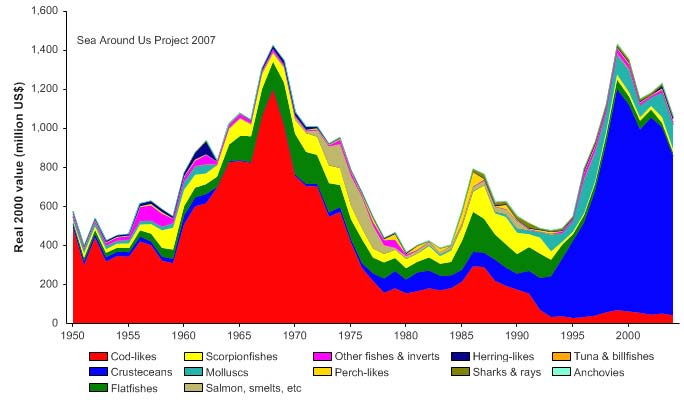
The reported landings of the LME were valued at over US$1.2 billion (in 2000 US dollars)
in the late 1960s, most of which was attributed to cod landings, while in recent years
similarly high values are produced by its invertebrate landings (Figure XIX-59.5).
Figure XIX-59.5. Value of reported landings in the Newfoundland-Labrador Shelf LME by commercial
groups (Sea Around Us 2007).
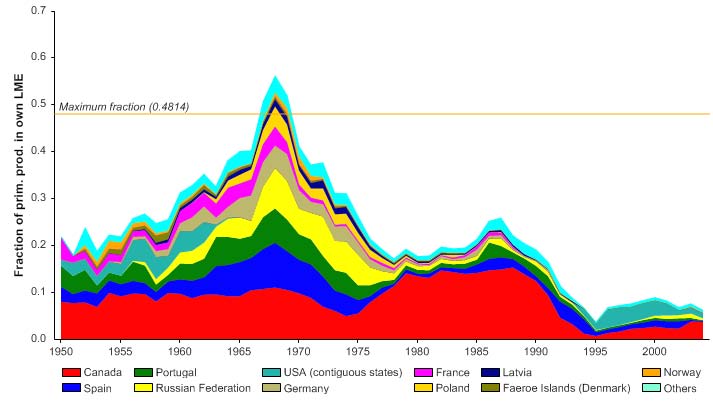
The primary production required (PPR; Pauly & Christensen 1995) to sustain the reported
landings in the LME reached 60% of the observed primary production in the mid 1960s,
but has declined in recent year (Figure XIX-59.6). The peak level achieved in the 1960s
is likely a result of the high level of accumulated biomass of cod stocks being exploited,
not due to the exploitation of annual surplus production.
Figure XIX-59.6. Primary production required to support reported landings (i.e., ecological footprint) as fraction
of the observed primary production in the Newfoundland-Labrador Shelf LME (Sea Around Us 2007). The
`Maximum fraction' denotes the mean of the 5 highest values.
XIX Non Regional Seas LMEs
791
Since the late 1970s Canada accounts for the largest share of the ecological footprint in
this LME, although in the 1960s, a number of European countries also had a large share.
The mean trophic level of the reported landings (i.e., the MTI; Pauly & Watson 2005)
remained high until the 1990s, when the cod stock began to collapse (Figure XIX-59.7,
top), a clear case of `fishing down' the food web in the LME (Pauly et al. 1998, 2001).
The FiB index shows a similar trend (Figure XIX-59.7, bottom), indicating that the
reported landings did not compensate for the decline in the MTI over that period.
However, these landings do not account for the discarded bycatch from the shrimp
fishery, which now accounts for half of the value of the landings (Figure XIX-59.5).
Figure XIX-59.7 Mean trophic level (i.e., Marine Trophic Index) (top) and Fishing-in-Balance Index
(bottom) in the Newfoundland-Labrador Shelf LME (Sea Around Us 2007)
The Stock-Catch Status Plots shows that over 60% of commercially exploited stocks in
the LME have collapsed with another 20% overexploited (Figure XIX-59.8, top). Over
50% of the reported landings biomass is now supplied by fully exploited stocks (Figure
XIX-59.8, bottom).
0%
100
10%
90
20%
)
80
%
(
s
30%
u
70
t
at
s
40%
y
60
b
s
k
50%
c
o
50
f
st
60%
o
40
er
70%
mb
30
u
N
80%
20
90%
10
100%0
1950
1960
1970
1980
1990
2000
(n = 2341)
developing
fully exploited
over-exploited
collapsed
1950
1960
1970
1980
1990
2000
0%
100
10%
90
20%
80
)
%
30%
(
70
s
u
at
40%
60
k st
c
50%
o
50
st
y
60%
b
h
40
t
c
a
70%
C
30
80%
20
90%
10
100%0
1950
1960
1970
1980
1990
2000
(n = 2341)
developing
fully exploited
over-exploited
collapsed
Figure XIX-59.8. Stock-Catch Status Plots for the Newfoundland-Labrador Shelf LME, showing the
proportion of developing (green), fully exploited (yellow), overexploited (orange) and collapsed (purple)
fisheries by number of stocks (top) and by catch biomass (bottom) from 1950 to 2004. Note that (n), the
number of `stocks', i.e., individual landings time series, only include taxonomic entities at species,
genus or family level, i.e., higher and pooled groups have been excluded (see Pauly et al., this volume,
for definitions).
792
59. Newfoundland-Labrador Shelf LME
Instability, variability and overexploitation have characterised the entire history of
fisheries off the coast of Newfoundland and Labrador. Over time, the LME has shown
major changes, which have been greater in recent decades than in any other period in
history. There was a rapid expansion of distant water fleets during the late 1950s, as well
as an intensification of fishing effort. This affected the major fish stocks of the shelf
(Murawski et al. 1997). Overfishing of cod, haddock, redfish and major flatfish in the
1960s and 1970s led to fisheries collapses. There were also declines in the abundance
of broadhead wolffish and thorny skate. These collapses led to a fishing moratorium for
cod in 1992 (Walters & Maguire 1996), and the eventual closure of the fishery a decade
later. At the same time, other fisheries (notably for crab and shrimp, formerly prey of cod)
experienced record high yields.
III. Pollution and Ecosystem Health
Given the low population density of Newfoundland, pollution from land-based sources is
mostly limited to urban coastal areas. However, there is an increasing threat to the
region from the oil and gas industry's exploitation of the Hibernia, Terra Nova, White
Rose, and the Hebron Complex oil reserves, for example. The Canadian Wildlife
Federation (CWF) reported three spills in November of 2004 at the Terra Nova oil field off
the coast of Newfoundland and Labrador, the first spill releasing 170,000 litres into the
ocean. Additionally, CWF asserts that deliberate dumping, the primary source of oil
pollution in Atlantic Canada, is a chronic problem that is both illegal and preventable
(2004). The Economic Research and Analysis Division of the Government of Canada
(2007) reports that oil production in the province is expected to increase by 30%, that
prices will remain high, and more exploratory drilling will likely occur in 2008 and 2009.
There have been Oikopleura blooms in this LME. The International Cod and Climate
Change Programme studies the response of different cod populations to climate changes
in various parts of the cod's North Atlantic range. Canada is a key participant in the
Scientific Committee on Ocean Research (www.jhu.edu/~scor/) and the International
Council for Exploration of the Sea (www.ices.dk).
IV. Socioeconomic Conditions
The Grand Banks of Newfoundland and Labrador have been fished since the 1400s, with
fleets arriving annually from several of Europe's fishing nations. The banks and coastal
areas, being rich and productive, formed the basis for human settlement. The Atlantic
cod fishery was the base of the economy. About 30,000 people have been adversely
affected by the collapse of the cod fishery and its associated economy. However, the
value of the annual fisheries catch is approaching that of the cod fishery, with recent
increases in the crab and shrimp landings (Rice 2002). Hamilton and Butler (2001)
caution that the cod to crustaceans transition, while roughly an even exchange for the
Newfoundland economy, should not be taken for a new stable state. They point out that
shrimp size has been decreasing, depressing catch value and raising uncertainty about
the stock's future. Gear has been changed to prevent the female snow crab from being
caught, but the biomass of snow crab declined in 1999 and 2000. Greenland halibut, are
slow-growing, long-lived deepwater fish that cannot support intensive exploitation and are
thought to be on the verge of collapse (Hamilton and Butler 2001).
Newfoundland's population has been declining and no longer compensates for
outmigration. If this trend continues, it will be difficult for the province to provide services
to those who remain. Department of Finance Canada (2004) points to high economic
growth rates because of the development of offshore oil and gas projects--growth that
helps the Government of Newfoundland and Labrador to provide essential public services
in the face of a high provincial debt burden and the declining population in the region
XIX Non Regional Seas LMEs
793
(www.fin.gc.ca). The Minister of Natural Resources, Gary Lunn, addressed the
Newfoundland Offshore Industry Association on 19 June 2007 and urged increased oil
and gas investment in the Newfoundland and Labrador province. He cites 2,800 people
directly employed by the oil and gas projects and another 14,000 employed in support
industries and businesses--8% if all the people employed in Newfoundland and
Labrador. Tim Appenzeller (2004) in "The End of Cheap Oil," quotes Thomas Ahlbrandt,
the geologist who led the USGS 2000 study asserting 50% more world oil remaining than
feared, as saying "Oil and gas are limited; my personal feeling is, we have a concern in
the next couple of decades."
Hamilton and Butler point out that Rural Newfoundland hosts a strong informal economy
(Felt and Sinclair 1992) including country foods such as moose meat or fish and local
firewood cut for heating. Barter or cash-based exchanges of goods and services such as
home-building and vehicle maintenance are common.
V. Governance
Canada and France (the islands of St. Pierre and Miquelon) share jurisdiction of this
LME. The establishment by Canada of a 200-mile EEZ in 1977 effectively excluded
foreign fleets from most of the Grand Banks. The Government of Canada has
guaranteed that Newfoundland and Labrador will receive 100 percent of royalties from its
offshore oil and gas production, some offset benefits per the Atlantic Accord, and some
protection from reductions in revenues.
Single species quota management continues. The Fisheries Resource Conservation
Council (FRCC) was created in 1993 with a mandate to contribute to a more
comprehensive approach to the management of the Atlantic fisheries on a sustainable
basis, to integrate stock assessments at the ecosystem level and recommend to the
Minister and industry appropriate action to ensure sustainable fisheries. While there is a
stated desire to change to an ecosystem level approach, there are no explicit objectives
within fisheries management plans for the ecosystem. This ambiguity in management
objectives underscores the need for the many single function management agencies to
be integrated. See the West Greenland Shelf LME for further information on the
International Commission for the Northwest Atlantic Fisheries.
References
Appenzeller, T.( 2004). End of Cheap Oil. National Geographic Magazine (June, volume 205(6):80-
100. Online at http://ngm.nationalgeographic.com/ngm/0406/feature5/fulltext.html.
Belkin, I.M. (2008) Rapid warming of Large Marine Ecosystems, Progress in Oceanography, in
press.
Belkin, I.M., Cornillon, P.C., and Sherman, K. (2008). Fronts in Large Marine Ecosystems of the
world's oceans. Progress in Oceanography, in press.
Department of Finance, Canada. (2004) Backgrounder on Status of Offshore Resource Revenue
Discussions with Newfoundland and Labrador. www.fin.gc.ca/FEDPROV05/OffshoreResAcc/
backgroundere.html.
Economic Research and Analysis Division, Government of Canada (2007). Oil and Gas report at
www.economics.gov.nl.ca pages 20-23.
Fisheries and Oceans (1993). Charting a new course: Towards the fishery of the future. Report of
the task force on incomes and adjustment in the Atlantic fishery. Communications Directorate,
Fisheries and Oceans, Ottawa, Canada.
Fisheries Resource Conservation Council (FRCC).(1993) www.frcc.ca/mandate.htm
794
59. Newfoundland-Labrador Shelf LME
Forsey, R and Lear, W.H. (1987). Historical catches and catch rates of Atlantic cod at
Newfoundland during 1677-1833. Canadian Data Report of Fisheries and Aquatic Science 662.
GLOBEC Working Group Summary of the Newfoundland and Labrador Shelves (1993) at
www.globec-canada.mun.ca/globec/documents/science_plan/node14.html
Hamilton, L.C. and M.J. Butler (2001) Outport adaptations: Social indicators through
Newfoundland's cod crisis. Human Ecology Review 8(2): 1-11.
www.seaaroundus.org/lme/SummaryInfo.aspx?LME=9
Murawski, S.A., Maguire, J-J., Mayo, R.K. and Serchuk, F.M. (1997). Groundfish stocks and the
fishing industry, p 27-69 in: Boreman, J., Nakashima, B.S., Wilson, J.A. and Kendall, R.L. (eds),
Northeast Atlantic Groundfish: Perspectives on a Fishery Collapse. American Fisheries Society.
Washington D.C., U.S.
Pauly, D. and Christensen, V. (1995). Primary production required to sustain global fisheries.
Nature 374: 255-257.
Pauly, D. and Watson, R. (2005). Background and interpretation of the `Marine Trophic Index' as a
measure of biodiversity. Philosophical Transactions of the Royal Society: Biological Sciences
360: 415-423.
Pauly, D., Christensen, V., Dalsgaard, J., Froese R. and Torres, F.C. Jr. (1998). Fishing down
marine food webs. Science 279: 860-863.
Pauly, D., Palomares, M.L., Froese, R., Sa-a, P., Vakily, M., Preikshot, D., and Wallace, S. (2001).
Fishing down Canadian aquatic food webs. Canadian Journal of Fisheries and Aquatic Science
58: 51-62.
Prasad, K.S. and Haedrich, R.L. (1993). Satellite observations of phytoplankton variability on the
Grand Banks of Newfoundland during a spring bloom. International Journal of Remote Sensing
14:241-252.
Rice, J. (2002). Changes to the Large Marine Ecosystem of the Newfoundland-Labrador Shelf, p
51-104 in: Sherman, K. and Skjoldal, H.R. (eds), Large Marine Ecosystems of the North Atlantic
Changing States and Sustainability. Elsevier Science, Amsterdam, The Netherlands.
Rivard, D., McKone, W.D. and Elner, R.W. (1988). Resource prospects for Canada's Atlantic
fisheries: 1989-1993. Communications Directorate, Fisheries and Oceans, Ottawa, Canada.
Scarratt, D.J., ed. (1982). Canadian Atlantic Offshore Fishery Atlas. Canadian Special Publication
of Fisheries and Aquatic Sciences 47. (Revised)
Sea Around Us (2007). A Global Database on Marine Fisheries and Ecosystems. Fisheries Centre,
University British Columbia, Vancouver, Canada.
USGS (2000) World Petroleum Assessment at <pubs.usgs.gov/fs/fs-062-03/FS-062-03.pdf>.
Walters, C. and Maguire, J.J. (1996). Lessons for stock assessments from the Northern cod
collapse. Review of Fish Biology and Fisheries 6: 125-137.
XIX Non Regional Seas LMEs
795
XIX-60 Scotian Shelf LME
M.C. Aquarone and S. Adams
The Scotian Shelf LME is bordered by the Canadian province of Nova Scotia and
extends offshore to the shelf break, more than 200 nautical miles from the coast. The
area of this LME is 283,000 km2, of which 0.87% is protected, and contains one major
estuary, the St. Lawrence (Sea Around Us 2007). To the north the LME is separated
from the Newfoundland Labrador Shelf LME by the Laurentian Channel, while to the
south it extends to the Fundian Channel (Northeast Channel). The Scotian Shelf LME
has a complex topography consisting of numerous offshore shallow banks and deep mid-
shelf basins. It can be divided into eastern and western subsystems. The eastern
Scotian Shelf LME includes Emerald Bank. The Nova Scotia Current hugs the coastline
in a southwestward direction and enters the Gulf of Maine through the Northeast channel
(Zwanenburg et al. 2002, Zwanenburg 2003). Book chapters pertaining to this LME are
by Zwanenburg et al. (2002) and Zwanenburg (2003).
I. Productivity
The Scotian Shelf LME is considered a Class II, moderately high productivity ecosystem
(150-300 gCm-2yr-1). Productivity is influenced by changes in environmental conditions
and temperature. A decrease in ambient temperature is noted on the eastern Scotian
Shelf for the period 1980-1992 (Zwanenburg et al. 2002). The recent changes to
research vessel survey protocols broaden the collection of ecosystem monitoring data to
include abundance and distribution of phytoplankton, zooplankton, as well as an
increased suite of physical oceanographic parameters. A monthly Continuous Plankton
Recorder Survey is being conducted in collaboration with the Allister Hardy Foundation,
Plymouth, England. There has been an exponential increase in grey seal abundance
since the 1960s. Harp, hooded and harbour seals are found in the Gulf of St. Lawrence
and so are Beluga whales.
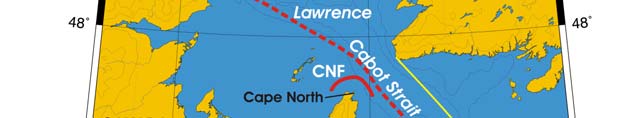
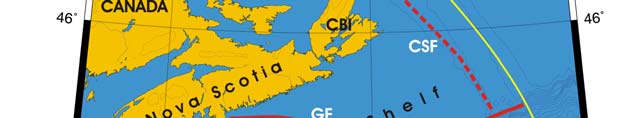
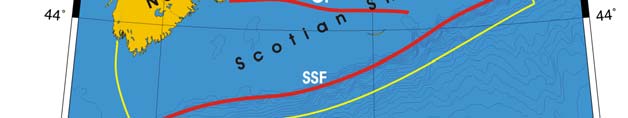
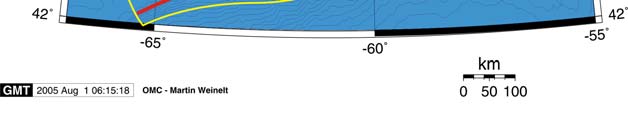
Oceanic fronts (Belkin et al. 2008) (Figure XIX-60.1): The Shelf-Slope Front (SSF)
along the Scotian Shelf/Slope bounds this LME and is associated with the southward
cold, fresh Labrador Current, augmented by fresh discharge from the Gulf of St.
Lawrence. The Gulf component is strongly seasonal and reflects in the SSF
characteristics (Linder & Gawarkiewicz 1998). The newly-identified Gully Front (GF) is
observed at 43.5°N over the Gully, the largest canyon that incises the Scotian Shelf and
Slope. Medium-scale thermohaline fronts in the southern Gulf of St. Lawrence are
generated seasonally by spring freshet, followed by summertime warming. The Cabot
Strait Front (CSF) is also related to the Gulf of St. Lawrence fresh outflow. The Cape
North Front (CNF) develops north of the Cape Breton Island.
The Scotian Shelf LME SST (Belkin 2008) (Figure XIX-60.2):
Linear SST trend since 1957: 1.15°C.
Linear SST trend since 1982: 0.89°C.
796
60. Scotian Shelf LME
Figure XIX-60.1. Fronts of the Scotian Shelf LME. CNF, Cape North Front; CSF, Cabot Strait Front (most
probable location); GF, Gully Front; SSF, Shelf-Slope Front. Yellow line, LME boundary. After Belkin et
al. (2008).
The thermal history of the Scotian Shelf LME is similar to that of the Northeast U.S.
Continental Shelf LME. These LMEs are connected by the Slope Current, which flows
southwestward along the shelf break and upper continental slope. This connection
explains the observed similarities between thermal histories of these LMEs: first of all,
the cold spell of the mid-1960s, with the all-time minimum of 6.7°C in 1965 and the
subsequent steady warming until the present. As in the Northeast Shelf LME, 1965 can
be taken as a true breakpoint between two regimes characterized, respectively, by long-
term cooling before 1965 and long-term warming after 1965. The post-1965 warming
amounted to approximately 2°C over 40 years, making the Scotian Shelf as a geographic
whole, one of the fastest warming LMEs. Note that smaller processes like the rapid
cooling of the eastern Shelf during the 1980s, drive significant changes in the biota.
Generalizations about the entire Scotian Shelf do not examine important differences
between the eastern and western sections of this LME.
Over the late 1990s, the Scotian Shelf interannual variability was in sync with the
Northeast U.S. Continental Shelf LME as evidenced by the simultaneous minimum in
1997, maximum in 1999, minimum in 2004, and the sharp increase in 2004-2006, in both
LMEs. The most recent SST increase in 2004-2006 led to the all-time maximum of
>9.0°C in 2006 over the Scotian Shelf, consistent and concurrent with the near-all-time
maximum of 13.0°C over the Northeast U.S. Shelf Continental LME and the all-time
maximum of 6.4°C over the Newfoundland-Labrador Shelf LME, both in 2006. The
above simultaneity suggests large-scale forcing on the order of 2,000 km as a dominant
factor over these distinct but adjacent ecosystems.
XIX Non Regional Seas LMEs
797
The minima of 1986 and 1997 may have been related to passages of the decadal-scale
Great Salinity Anomalies (GSA) associated with low temperatures (Belkin et al., 1998;
Belkin, 2004).
Figure XIX-60.2. Scotian Shelf LME annual mean SST (left) and SST anomalies (right), 1957-2006, based
on Hadley climatology. After Belkin (2008).
Scotian Shelf LME Chlorophyll and Primary Productivity
This LME is a Class II, moderately-high productivity ecosystem (150-300 gCm-2yr-1)
(Figure XIX-60.3).
Figure XIX-60.3. Scotian Shelf LME annual trends in chlorophyll a (left) and primary productivity (right),
1998-2006, from satellite ocean colour imagery. Values are colour coded to the right hand ordinate.
Figure courtesy of J. O'Reilly and K. Hyde. Sources discussed p. 15 this volume.
II. Fish and Fisheries
Commercially exploited species include cod, haddock, pollock, silver hake, halibut, white
hake, and turbot. Pelagic species include the Atlantic herring and the Atlantic mackerel.
Invertebrates include snow crab, northern shrimp and short fin squid. Both snow crab
and northern shrimp prefer cold water and the increased landings for both those species
coincide with the cooling of the eastern shelf (Zwanenburg 2003). Systematic fishery
surveys of the shelf made between the 1960s and the present are the most consistent
source of information available concerning this LME.
798
60. Scotian Shelf LME
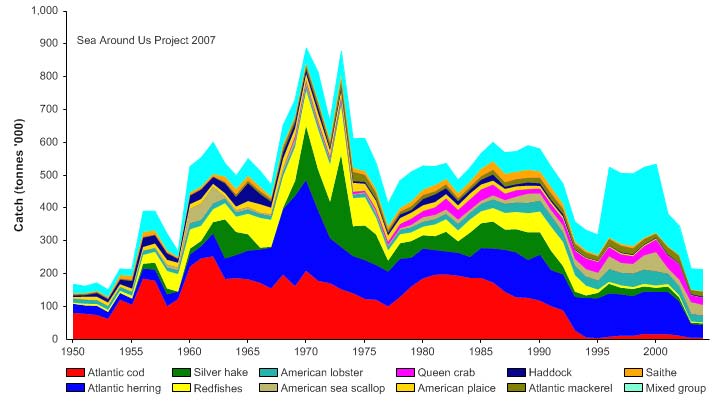
Total reported landings recorded a peak of 889,000 tonnes in 1970 and declined to less
than a quarter of this level or 213,000 tonnes in 2004 (Figure XIX-60.4). Major changes
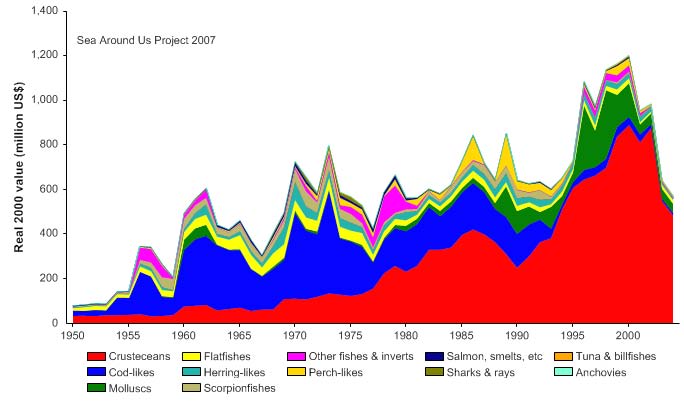
include a dramatic decline in landings of cod, silver hake and redfish. However, the value
of the reported landings reached its peak of US$1.2 billion (in 2000 US dollars) in 2000,
as a result of high value commanded by its landings of crustaceans (Figure XIX-60.5).
Figure XIX-60.4. Total reported landings in the Scotian Shelf LME by species (Sea Around Us 2007).
Figure XIX-60.5. Value of reported landings in the Scotian Shelf LME by commercial groups (Sea
Around Us 2007).
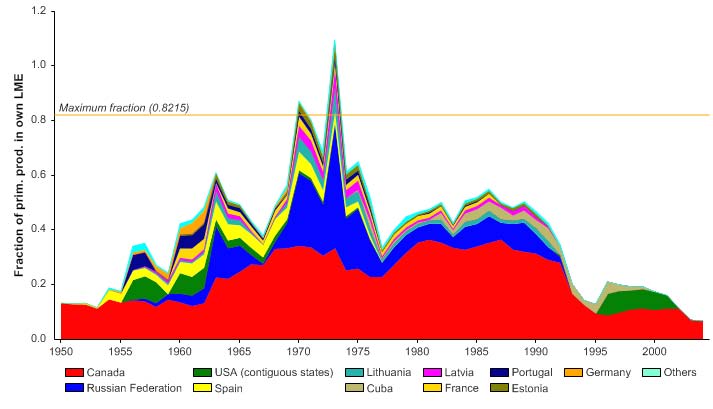
The primary production required (PPR; Pauly & Christensen 1995) to sustain the reported
landings in this LME exceeded the observed primary production in the mid 1970s, but
has declined in recent years (Figure XIX-60.6). The extremely high PPR recorded in the
mid 1970s was likely due to the accumulated biomass of cod stocks being exploited and
not from exploitation of annual surplus production. Canada accounts for almost all of the
ecological footprint in this LME (Figure XIX-60.6), although in the 1960s and 1970s, a
number of European countries also had a large share.
XIX Non Regional Seas LMEs
799
Figure XIX-60.6. Primary production required to support reported landings (i.e., ecological footprint) as
fraction of the observed primary production in the Scotian Shelf LME (Sea Around Us 2007). The
`Maximum fraction' denotes the mean of the 5 highest values.
The mean trophic level of the reported landings (i.e., the MTI; Pauly & Watson 2005)
remained high until the early 1990s, when the cod stock collapsed (Figure XIX-60.7, top),
a clear case of `fishing down' of the food web (Pauly et al. 1998, 2001). The FiB index
showed a similar trend (Figure XIX-60.7, bottom), suggesting that the reported landings
did not compensate for the decline in the MTI over that period.
Figure XIX-60.7. Mean trophic level (i.e., Marine Trophic Index) (top) and Fishing-in-Balance Index
(bottom) in the Scotian Shelf LME (Sea Around Us 2007).
800
60. Scotian Shelf LME
The Stock-Catch Status Plot shows that over 90% of commercially exploited stocks in the
LME are either overexploited or have collapsed (Figure XIX-60.8, top) with less than 30%
of the reported landings biomass supplied by fully exploited stocks (Figure XIX-60.8,
bottom).
1950
1960
1970
1980
1990
2000
0%
100
10%
90
20%
)
80
(
%
s
30%
u
70
at
st
40%
y
60
b
s
k
50%
c
o
50
f
st
60%
o
40
er
70%
mb
30
u
N
80%
20
90%
10
100%0
1950
1960
1970
1980
1990
2000
(n = 2726)
developing
fully exploited
over-exploited
collapsed
1950
1960
1970
1980
1990
2000
0%
100
10%
90
20%
80
)
%
30%
(
70
s
t
u
a
40%
60
ck st
50%
t
o
50
s
y
60%
b
h
40
t
c
a
70%
C
30
80%
20
90%
10
100%0
1950
1960
1970
1980
1990
2000
(n = 2726)
developing
fully exploited
over-exploited
collapsed
Figure XIX-60.6. Stock-Catch Status Plots for the Scotian Shelf LME, showing the proportion of
developing (green), fully exploited (yellow), overexploited (orange) and collapsed (purple) fisheries by
number of stocks (top) and by catch biomass (bottom) from 1950 to 2004. Note that (n), the number of
`stocks', i.e., individual landings time series, only include taxonomic entities at species, genus or family
level, i.e., higher and pooled groups have been excluded (see Pauly et al., this volume, for definitions).
There have been significant declines in abundance and sizes for many commercially
exploited fish species (Zwanenburg 2000), indicating that the limits of exploitation had
been reached (Pauly et al. 2001). The decrease in size, related to fishing effort, occurred
both on the eastern and western shelves. Fishing effort increased rapidly with the
establishment of Canada's 200-mile EEZ in 1977. Recent analyses of changes in the
productivity and biomass yields of the Scotian Shelf LME revealed the consequences of
the removal of top predators on the trophic structure of an ecosystem (Choi et al. 2004,
Frank et al. 2005). The dominant change in the biomass yield was a sharp decline in
groundfish landings and biomass from the mid-1980s through the mid-1990s. The
trawlable demersal biomass declined from 450,000 tonnes in 1973 to less than 15,000
tonnes in 1997. Coincident with this decline was an increase of pelagic fish as well as of
shrimp and snow crab. At the lower trophic levels, increases were observed for a 40-
year period from 1960 to 2000 in phytoplankton concentrations based on colour index
values from CPR, and in the increase in numbers of zooplankters, less than 2 mm in
length. The principal fisheries are now directed toward pelagic fish and
macroinvertebrates, and are dominated by herring, shrimp and snow crab.
XIX Non Regional Seas LMEs
801
A management scheme taking into account species interaction and biomass production
is being initiated to address the overexploitation of the LME's main fisheries (cod,
haddock, flounder, and other demersal fish). When the cod fishery collapsed on the
Eastern shelf, a cod moratorium was imposed in 1993 and remains in effect. Overfishing
led to a number of fishery closures in the early 1990s.
III. Pollution and Ecosystem Health
For information on marine pollution and the protection of this LME's offshore
environment, consult the Fisheries and Oceans Canada site at www.mar.dfo-mpo.gc.ca.
The report section on Ocean Disposal and Marine Environmental Quality, Scotian Shelf:
An Atlas of Human Activities (2005), lists illegal spills and discharges such as the chronic
introduction of oil from vessel traffic, marine debris, chemical contaminants from vessels
and offshore hydrocarbon development activities, and the introduction of invasive species
and pathogens through ballast water as significant ongoing environmental concerns.
Also listed are shipwrecks and post-war chemical and unexploded ordinance dump sites
that need new assessments for risk. There have been several large-scale environmental
emergencies, including the wreck of the Arrow oil tanker and other vessel sinkings. The
DFO reports no concentrations of heavy metals above the PEL (probable effects level) on
the Scotian Shelf.
Hollingworth recognized the need to assess the wider ecological costs of over
exploitation of the fisheries resource (2000). The International GLOBEC Cod and
Climate Change Programme studies the response of different cod populations to climate
changes in various regions of the cod's North Atlantic range, including the Scotian Shelf.
The ESSIM project (Eastern Scotian Shelf Integrated Management Project) described in
its first Ecosystem Status Report for the Eastern Scotian Shelf (DFO 2003) the shift in the
ecosystem from groundfish to pelagic species and invertebrates (see also Zwanenburg et
al. 2006). O'Boyle and Jamieson (2006) point to an ongoing paradigm shift in ocean
management, exemplified by explicit consideration of the impacts of all ocean sectors on
the marine environment, both separately and in aggregate. The authors recommend
adaptive management, and include both conceptual and operational level management
goals to achieve ecosystem-based management. Climate change is a priority issue, and
on 12 December 2007 the Government of Canada announced at the UN Climate Change
Conference in Indonesia new mandatory regulations for industry for emissions reduction.
Industries must submit air emissions data to the Government of Canada within the next
six months as part of the "toughest plan in Canadian history" to clean up air, tackle
climate change and protect our environment" said Environment Minister John Baird. The
air emissions action is part of Canada's "Turning the Corner: An Action Plan to Reduce
Greenhouse Gases and Air pollution launched in April 2007.
IV. Socioeconomic Conditions
The Nova Scotia Department of Finance, Economics and Statistics, reports that the
population of Nova Scotia on 1 October 2007 was 935,106 persons of whom 452,000
were employed and per capita income in 2006 was $29,459. Health Canada posts a
report by Dr. Ronald Colman (2005) on the socioeconomic gradient in health in Atlantic
Canada based on evidence from Newfoundland and Nova Scotia 1985-2001 finding high
socioeconomic inequality in health in Newfoundland and Glace Bay and Kings County,
Nova Scotia compared to Canada as a whole, Europe and Australia. Income was found
to be the most important contributor to socioeconomic inequality in health; education and
economic status also contributed to health status (Colman 2005).
The trophic cascade changed the structure of the Scotian Shelf LME from an economic
perspective, with the recent value of shrimp and crab landings exceeding the previous
802
60. Scotian Shelf LME
value of the demersal fishery. With regard to other marine resources, the Canada-Nova
Scotia offshore petroleum Board is responsible for the regulation of petroleum affairs in
the province. The presence of oil raises issues of multiple uses of the marine
environment.
V. Governance
Federal jurisdiction over Canada's coastal and inland fisheries dates to the Constitution
Act of 1867. In 1979 the federal government established the Department of Fisheries
and Oceans. However, the provinces are responsible for certain areas of fisheries
jurisdiction, including fish processing and the training of fishermen (The Canadian
Encyclopedia at www.thecanadianencyclopedia.com). In November 2007 the DFO
announced a new framework for the management of fisheries resources. Drivers for the
new management framework include the need to certify that Canadian seafood products
are sustainably harvested, domestic legislation including Bill C-45, and International
agreements and protocols signed by Canada. The Framework and the international
agreements emphasise the Precautionary Approach, the Ecosystem Approach, and
Sustainable Development.
References
Belkin, I.M. (2004) Propagation of the "Great Salinity Anomaly" of the 1990s around the northern
North Atlantic, Geophysical Research Letters, 31(8), L08306, doi:10.1029/2003GL019334.
Belkin, I.M. (2008) Rapid warming of Large Marine Ecosystems, Progress in Oceanography, in
press.
Belkin, I.M., Cornillon, P.C., and Sherman, K. (2008). Fronts in Large Marine Ecosystems of the
world's oceans. Progress in Oceanography, in press
Belkin, I.M., S. Levitus, J. Antonov, and S.-A. Malmberg (1998) "Great Salinity Anomalies" in the
North Atlantic, Progress in Oceanography, 41(1), 1-68.
Brown, S.K., Mahon, R., Zwanenburg, K.C.T., Buja, K.R., Claflin, L.W., O'Boyle, R.N., Atkinson, B.,
Sinclair, M., Howell, G., and Monaco, M.E. (1996). East Coast of North America Groundfish:
Initial Explorations of Biogeography and Species Assemblages. NOAA, Silver Springs,
MD/Department of Fisheries and Oceans, Dartmouth, Canada.
Choi, J.S., Frank, K.T., Leggett, W.C., and Drinkwater, K.F. (2004). Transition to an alternate state
in a continental shelf ecosystem. Canadian Journal of Fisheries and Aquatic Sciences 61:505-
510.
Colman, R. (2005) The Socioeconomic Gradient in Health in Atlantic Canada: Evidence from
Newfoundland and Nova Scotia 1985-2001. www.hc-sc.gc.ca/finance/hprp-prpms/results-
resultats/20
DFO (Department of Fisheries and Oceans Canada) (2007) A New Resource Management
Sustainable Development Framework at www.dfo-mpo.gc.ca/communic/fish_
man/consultations/RMSD
DFO (Department of Fisheries and Oceans Canada) (2005) Report on Ocean Disposal and Marine
Environmental Quality, Disposal of Material in the Ocean, Scotian Shelf: An Atlas of Human
Activities. www.mar.dfo-mpo.gc.ca/oceans/e/essim/atlas/odmeq-e.htm
DFO (Department of Fisheries and Oceans Canada) (2003) State of the Eastern Scotian Shelf
Ecosystem. DFO. Can. Sci. Advisory Sec. Ecosystem Status Report 2003/004.
Frank, K.T., Perry, R.I. and Drinkwater, K.F. (1990). Predicted response of northwest Atlantic
invertebrate and fish stocks to CO2-induced climate change. Transaction American Fisheries
Society 119:353-365.
Frank, K.T., Perry, R.I., Drinkwater, K.F. and Lear, W.H. (1988). Changes in the fisheries of Atlantic
Canada associated with global increases in atmospheric carbon dioxide: A preliminary report.
Canadian Technical Report of Fisheries and Aquatic Sciences 652.
XIX Non Regional Seas LMEs
803
Frank, K.T., Petrie, B., Choi, J.S. and Leggett, W.C. (2005). Trophic cascades in a formerly cod-
dominated ecosystem. Science 308:1621-1623.
Hollingworth, C.E. (2000). Ecosystem effects of fishing. Proceedings of an ICES/SCOR
Symposium, Montpellier, France, 16-19 March 1999. ICES Journal of Marine Science 57(3).
Linder, C. A. and Gawarkiewicz, G. (1998). A climatology of the shelfbreak front in the Middle Atlantic
Bight. Journal of Geophysical Research 103(C9):18,405-18,423.
Mills, E.L. and Fournier, R.O. (1979). Fish production and the marine ecosystems of the Scotian
Shelf, eastern Canada. Marine Biology 54:101-108.
Nova Scotia Department of Finance Economics & Statistics (2007) Common Statistics at
www.gov.ns.ca/finance/statistics/agency/index.asp
O'Boyle, R. and Jamieson, G. (2006) Observations on the implementation of ecosystem-based
management: Experiences on Canada's east and west coasts. Fisheries Research 79:1-12.
Pauly, D. and Christensen, V. (1995). Primary production required to sustain global fisheries.
Nature 374: 255-257.
Pauly, D. and Watson, R. (2005). Background and interpretation of the `Marine Trophic Index' as a
measure of biodiversity. Philosophical Transactions of the Royal Society: Biological Sciences
360: 415-423.
Pauly, D., Christensen, V., Dalsgaard, J., Froese R. and Torres, F.C. Jr. (1998). Fishing down
marine food webs. Science 279: 860-863.
Pauly, D., Palomares, M.L., Froese, R., Sa-a, P., Vakily, M., Preikshot, D. and Wallace, S.
(2001). Fishing down Canadian aquatic food webs. Canadian Journal of Fisheries and Aquatic
Science 58:51-62.
Prescott, J.R.V. (1989). The political division of large marine ecosystems in the Atlantic Ocean and
some associated seas, p 395-442 in: Sherman, K. and Alexander, L.M. (eds), Biomass Yields
and Geography of Large Marine Ecosystems. AAAS Selected Symposium 111. Westview
Press, Boulder, U.S.
Sea Around Us (2007). A Global Database on Marine Fisheries and Ecosystems. Fisheries Centre,
University British Columbia, Vancouver, Canada. www.seaaroundus.org/lme/
SummaryInfo.aspx?LME=8
Zwanenburg, K. C. T. (2000). The effects of fishing on demersal fish communities of the Scotian
Shelf, ICES J. Mar. Sci. 57:503-509.
Zwanenburg, K.C.T. (2003). The Scotian Shelf, p 75-91 in: Hempel, G. and Sherman, K. (eds),
Large Marine Ecosystems of the World: Trends in Exploitation, Protection, and Research.
Elsevier, Amsterdam, The Netherlands.
Zwanenburg, K.C.T., Bowen, D., Bundy, A., Drinkwater, K., Frank, K., O'Boyle, R., Sameoto, D.
and Sinclair, M. (2002). Decadal changes in the Scotian Shelf Large Marine Ecosystem, p 105-
150 in: Sherman, K. and Skjoldal, H.R. (eds), Large Marine Ecosystems of the North Atlantic:
Changing States and Sustainability. Elsevier, Amsterdam, The Netherlands.
Zwanenburg, K.C.T., A. Bundy, P. Strain, W.D. Bowen, H. Breeze, S.E. Campana, C. Hannah, E.
Head, and D. Gordon. 2006. Implications of ecosystem dynamics for the integrated
management of the Eastern Scotian Shelf. Can. Tech. Rep. Fish. Aquat. Sci. 2652: xiii + 91 p.
804
60. Scotian Shelf LME
XIX Non Regional Seas LMEs
805
XIX-61 Northeast U.S. Continental Shelf LME
M.C. Aquarone and S. Adams
The Northeast U.S. Continental Shelf LME extends from the Gulf of Maine to Cape
Hatteras in the Atlantic Ocean. It is characterised by its temperate climate. Structurally,
this LME is complex, with marked temperature and climatic changes, winds, river runoff,
estuarine exchanges, tides and multiple circulation regimes. It is historically a very
productive LME of the Northern Hemisphere. The LME has an area of 310,000 km2, of
which 1.96% is protected, and has 28 major estuaries and river systems (Sea Around Us
2007), including Casco Bay (Kennebec), Chesapeake (including the Potomac River),
Delaware, and Long Island Sound (Connecticut River). Four major sub-areas are the
Gulf of Maine, Georges Bank, Southern New England, and the Mid-Atlantic Bight. Book
chapters and articles pertaining to this LME include Falkowski (1991), Sissenwine &
Cohen (1991), Sherman et al. (1996a, 1996b, 2002, 2003) and Murawski (1996, 2000).
A Northeast Shelf Ecosystem volume, edited by Sherman et al., was published in 1996.
I. Productivity
This LME is bounded on the seaward side by the Gulf Stream, with its circulation and
seasonal meanders and rings influencing the LME. The gyre systems of the Gulf of
Maine and Georges Bank, and the nutrient enrichment of estuaries in the southern half of
the LME contribute to the maintenance on the shelf of relatively high levels of
phytoplankton and zooplankton prey fields for planktivores including menhaden, herring,
mackerel, sand lance, butterfish, and marine birds and mammals. For a map of surface
circulation, see Sherman et al. (2003). For an overview of the physical oceanography of
the shelf, see Brooks (1996). The Northeast U.S. Continental Shelf LME is a Class I,
highly productive ecosystem (>300 gCm-2yr-1), and is one of the world's most productive
LMEs. Since 1977, the NOAA Northeast Fisheries Science Centre (NEFSC) has
monitored this LME for primary productivity, chlorophyll-a, zooplankton biomass and
species diversity. Productivity varies in the 4 major sub-areas, and from season to
season. Zooplankton is used as an indicator of major changes in stability of the lower
levels of the food web and of biofeedback responses to oceanographic changes (Durbin
& Durbin 1996). Over the past two decades, zooplankton has been stable with regard to
biomass and the abundance of dominant species. Sufficient biodiversity and abundance
of zooplankton within the ecosystem supported the recovery of herring and mackerel
from their low levels in the mid-1970s and initiated the recovery of demersal fish stocks
beginning in the mid-1990s (Sherman et al. 2003).
Oceanic fronts (Belkin et al. 2008)(Figure XIX-61.1): The Shelf-Slope Front (SSF) is
associated with a southward flow of cold, fresh water from the Labrador Sea. The Mid-
Shelf Front (MSF) follows the 50-m isobath (Ullman and Cornillon, 1999). The Nantucket
Shoals Front (NSF) hugs the namesake bank/shoals along 20-30-m isobaths. The
Wilkinson Basin Front (WBF) and Jordan Basin Front (JBF) separate deep basins from
Georges Bank and Browns Bank and are best defined in winter. Georges Bank is
surrounded by a tidal mixing front, GBF (Mavor and Bisagni, 2001). The Maine Coastal
Front (MCF) and Cape Cod Front (CCF) are seasonal (Ullman and Cornillon, 1999).
Northeast U.S. Continental Shelf LME SST (Belkin 2008)(Figure XIX-61.2):
Linear SST trend since 1957: 1.08°C.
Linear SST trend since 1982: 0.23°C.


806
61. U.S. Northeast Continental Shelf LME
Figure XIX-61.1. Fronts of the Northeast U.S. Continental Shelf LME. CCF, Cape Cod Front; GBF,
Georges Bank Front; MCF, Maine Coastal Front; MSF, Mid-Shelf Front; NSF, Nantucket Shoals Front;
SSF, Shelf-Slope Front. Yellow line, LME boundary. After Belkin et al. (2008).
The Gulf Stream brings warm waters from the Gulf of Mexico into the Southeast U.S.
Shelf, creating oceanographic conditions dramatically different from those of the
Northeast U.S. Continental Shelf LME. The Southeast U.S. Shelf is protected from
northern influences by the convergence of the Gulf Stream with the coast near Cape
Hatteras, which leaves very little opening for the leakage of shelf/slope waters from the
Mid-Atlantic Bight into the South Atlantic Bight. Subarctic influences can reach the Mid-
Atlantic Bight of the NE Shelf LME but not the South Atlantic Bight of the SE Shelf LME
(Greene and Pershing, 2007). Additionally the Gulf Stream, deflected offshore past Cape
Hatteras, indirectly impacts the Northeast U.S. Shelf by warm-core rings, whereas the
Southeast U.S. Continental Shelf is directly affected by the meanders of the Gulf Stream.
A cold spell in the 1960s resulted in a 2°C SST drop down to 10.5°C by 1965; the
recovery took four years. From 1969 on, the Northeast U.S. Continental Shelf
experienced a gradual warming with substantial interannual variability. The linear trend
for 1957-2006 yields a warming of 1.08°C, whereas the linear trend for 1982-2006 yields
a much smaller warming of 0.23°C.
XIX Non Regional Seas LMEs
807
Figure XIX-61.2. Northeast U.S. Continental Shelf annual mean SST (left) and SST anomalies (right),
1957-2006, based on Hadley climatology. After Belkin (2008).
Northeast Shelf LME Chlorophyll and Primary Productivity
The Northeast U.S. Continental Shelf LME is a Class I, highly productive ecosystem
(>300 gCm-2yr-1)(Figure XIX-61.3),
Figure XIX-61.3. Northeast U.S. Continental Shelf LME trends in chlorophyll a (left) and primary
productivity (right), 1998-2006, from satellite ocean colour imagery. Values are colour coded to the
right hand ordinate. Figure courtesy of J. O'Reilly and K. Hyde. Sources discussed p. 15 this volume.
II. Fish and Fisheries
Much has been published on Northeast U.S. Shelf LME fisheries, including population
assessments (Sherman et al. 1996c; Kenney et al. 1996; Mavor & Bisagni 2001) and the
status of living marine resources in Our Living Oceans (NOAA 1999) and in the NEFSC
Status of Stocks reports. The catch composition of this LME is diverse, and is comprised
of demersal fish (groundfish) dominated by Atlantic cod, haddock, hakes, pollock,
flounders, monkfish, dogfish, skates and black sea bass, pelagic fish (mackerel, herring,
bluefish and butterfish), anadromous species (herrings, shad, striped bass and salmon),
and invertebrates (lobster, sea scallops, surfclams, quahogs, northern shrimp, squid and
red crab). In the late 1960s and early 1970s there was intense foreign fishing within the
808
61. U.S. Northeast Continental Shelf LME
LME. The precipitous decline in biomass of fish stocks during this period was the result
of excessive fishing mortality (Murawski et al. 1999). Total reported landings declined
from more than 1.6 million tonnes in 1973 to less than 500,000 tonnes in 1999, before
increasing to just under 800,000 tonnes in 2004 (Figure XIX-61.4). The value of the
reported landings reached US$1.8 billion (in 2000 US dollars) in 1973 and in 1979, and
has maintained a level above US$1 billion except for the three-year period between1998
and 2000 (Figure XIX-61.5). Among the most valuable species are lobster, sea scallops,
monkfish and summer flounder.
Figure XIX-61.4. Total reported landings in the Northeast U.S. Continental Shelf LME by species (Sea
Around Us 2007).
Figure XIX-61.5. Value of reported landings in the Northeast U.S. Continental Shelf LME by commercial
groups (Sea Around Us 2007).
The primary production required (PPR) (Pauly & Christensen 1995) to sustain the
reported landings in the LME reached 90% of the observed primary production in the mid
1960s, but has declined to less than 20% in recent years (Figure XIX-61.6). The
XIX Non Regional Seas LMEs
809
extremely high PPR recorded in the 1960s and 1970s was likely due to the exploitation of
the accumulated biomass of cod stocks rather than from the exploitation of annual
surplus production in the LME. The USA accounts for most of the ecological footprint in
this LME, and Canada for some, although European countries also had a major share in
the 1960s and 1970s.
Figure XIX-61.6. Primary production required to support reported landings (i.e., ecological footprint) as
fraction of the observed primary production in the Northeast U.S. Continental Shelf LME (Sea Around
Us 2007). The `Maximum fraction' denotes the mean of the 5 highest values.
The mean trophic level of the reported landings (Pauly & Watson 2005) has declined
since the early 1960s, when the rate of exploitation of demersal fish in the LME was high
(Figure XIX-61.7, top), the consequence of a clear case of `fishing down' of the food web
(Pauly et al. 1998). The Fishing in Balance index showed a similar decline (Figure XIX-
61.7, bottom), implying that the increase in reported landings in the 1970s did not
compensate for the decline in the Marine Trophic Index over that period.
Figure XIX-61.7. Mean trophic level (i.e., Marine Trophic Index) (top) and Fishing-in-Balance Index
(bottom) in the Northeast U.S. Continental Shelf LME (Sea Around Us 2007).
810
61. U.S. Northeast Continental Shelf LME
The Stock-Catch Status Plots show that over 70% of commercially exploited stocks in the
LME have collapsed, with another 20% being overexploited (Figure XIX-61.8, top).
Slightly over 30% of the reported landings biomass is supplied by fully exploited stocks
(Figure XIX-61.8, bottom). The US National Marine Fisheries Service (NMFS) includes
"overfished" but not "collapsed" in its stock status categories. Currently overfished are
several demersal stocks (NMFS 2009).
1950
1960
1970
1980
1990
2000
0%
100
10%
90
20%
)
80
%
(
s
30%
u
70
t
at
s
40%
y
60
b
50%
cks
50
o
f
st
60%
40
r
o
e
b
70%
m
30
u
N
80%
20
90%
10
100%0
1950
1960
1970
1980
1990
2000
(n = 5359)
developing
fully exploited
over-exploited
collapsed
1950
1960
1970
1980
1990
2000
0%
100
10%
90
20%
80
)
%
30%
(
70
s
t
u
a
40%
60
k st
c
50%
o
50
st
y
60%
b
h
40
t
c
a
70%
C
30
80%
20
90%
10
100%0
1950
1960
1970
1980
1990
2000
(n = 5359)
developing
fully exploited
over-exploited
collapsed
Figure XIX-61.8. Stock-Catch Status Plots for the Northeast U.S. Continental Shelf LME, showing the
proportion of developing (green), fully exploited (yellow), overexploited (orange) and collapsed (purple)
fisheries by number of stocks (top) and by catch biomass (bottom) from 1950 to 2004. Note that (n), the
number of `stocks', i.e., individual landings time series, only include taxonomic entities at species,
genus or family level, i.e., higher and pooled groups have been excluded (see Pauly et al, this vol. for
definitions).
The status of demersal fisheries can be found in Our Living Oceans (NMFS 1999; 2009),
Anderson et al. (1999a and 1999b), EPA 2004 and NMFS 2009. The Northeast Shelf
groundfish complex supports important recreational fisheries as well (summer flounder,
Atlantic cod, winter flounder, and pollock). Many demersal stocks are considered
overfished and are currently rebuilding. Groundfish partially recovered because of
reduced fishing effort and restrictive management in the late 1970s. The recovery trend
of George's Bank yellowtail and haddock observed in the late 1990s is linked to
reductions in the exploitation rate when, in 1994, there was an emergency closure of
portions of Georges Bank, and severe restrictions were placed on the fishing of demersal
species by the New England Fishery Management Council Sherman et al 2003). The
measures to reduce fishing effort included the reductions of days at sea and a
moratorium on new vessel entrants (NMFS 1999). Landings of most groundfish species,
however, were low in the mid 1990s as a result of poor recruitment and continued
XIX Non Regional Seas LMEs
811
restrictions on effort. In a biomass flip, dogfish and skates increased in abundance in the
1970s, as groundfish and flounder declined. However, a decrease of dogfish and skates
has been observed more recently, after a peak in the 1990s (NOAA 1999; Anthony
1996). Some of the Northeast Shelf LME's demersal stocks are among the best
understood and assessed fishery resources in the US (EPA 2004). Abundance of pelagic
mackerel, herring and bluefish has increased since the late 1970s and is presently above
average. The virtual elimination of foreign fishing on Atlantic herring and mackerel stocks
has resulted in the recovery of both species to former abundance levels, as neither
species is a high priority table fish for the U.S. consumer. The herring stock is somewhat
underutilized. Northeast pelagics are an important link in many marine food chains as
they are utilized as preys by a variety of predatory fish, marine mammals and birds.
Some anadromous species (shortnose sturgeon, Atlantic salmon) are listed as
endangered and landings are generally low for Atlantic anadromous fisheries but for the
recently observed increase in landings of striped bass following several years of
management restrictions (NMFS 2009). The alteration of river migration routes blocking
access to historic spawning grounds, pollution and coastal development have played a
major role in the decline of Atlantic salmon, sturgeons, river herrings, and shad. The only
remaining Atlantic salmon populations occur in 8 small rivers in eastern Maine. In the
face of declining natural populations, a small salmon aquaculture industry in Maine has
grown to fill the production void and averages approximately 10,000 t annually.
Invertebrate fisheries (American lobster, sea scallops) are the most valuable in the
Northeast Shelf. The lobster fishery has become increasingly dependent on small and
young lobsters that reach a legal size just prior to capture. There are efforts to reduce
the currently high fishing mortality on lobsters. Both the closure of half of the U.S. portion
of Georges Bank to scallop harvesting to protect groundfish stocks and the increase in
the ring diameter of scallop dredges in 1994 contributed to an increase in sea scallop
stock biomass (Anderson et al. 1999). A system of rotational closures for sea scallop
management is in place to allow small scallops to grow to a larger size. Landings are
presently at high levels.
The long-term potential yield for this LME was set at about 1.6 million tonnes (NMFS
1999). The long-term sustainability of high economic yield species depends on the
rebuilding of fish stocks through the application of adaptive management strategies
(Murawski 1996). Agencies involved in the complex management of Northeast fisheries
include the New England Fishery Management Council, the Mid-Atlantic Fishery
Management Council, the Atlantic States Marine Fisheries Commission, individual states,
and Canada. Information on fishery management plans is available in Our Living Oceans
(NMFS 1999; NMFS 2009). The NEFSC compiles information on the distribution,
abundance and habitat requirements for the 38 commercially valuable species managed
by the New England and Mid-Atlantic Fishery Management Councils (NMFS 1999).
III. Pollution and Ecosystem Health
The Northeast Coast is the most densely population coastal region in the United States.
The ratio of watershed drainage are to estuary water area is relatively small (EPA 2004).
Hypotheses concerned with the growing impacts of pollution, overexploitation and
environmental changes on sustained biomass yields in the Northeast Shelf LME are
under investigation. Efforts to examine changing ecosystem states and the relative
health of this LME are underway in the four sub-areas of the Northeast Shelf ecosystem.
Major rivers systems (Hudson, Delaware, Chesapeake) contribute nitrates to estuaries
and coastal systems from agriculture fertilisation, atmospheric deposition and sewage.
The estuaries and near-coastal waters of the LME are under considerable stress from
increasing coastal eutrophication resulting from high levels of phosphate and nitrate
discharges into drainage basins (Jaworski & Howarth 1996). Whether the increases in
the frequency and extent of nearshore plankton blooms are responsible for the rise in
812
61. U.S. Northeast Continental Shelf LME
incidence of biotoxin-related shellfish closures (White & Robertson 1996) and marine
mammal mortalities remains a question of considerable concern to state and federal
management agencies. For this LME as a whole, water clarity is good, dissolved oxygen
and coastal wetlands are fair, while eutrophic condition, sediment, benthos and fish
tissue are poor (EPA 2001). The water quality index is fair to poor (EPA 2004). About
60% of estuarine areas have a high potential of increasing eutrophication or existing high
concentrations of chlorophyll-a. High levels of sediment contamination are found near
urban centres, reflecting current discharges and the legacy of past industrial practices
(EPA 2004). Over 25% of sediments are enriched or exceed the EPA guidelines. Nearly
40% of wetlands along the coast were eliminated between 1780 and 1980. About 10% of
fish have elevated levels of contaminants in their edible tissues (EPA 2001). Benthic
community degradation, fish tissue contamination and eutrophication are increasing.
Coastal contamination is especially high along the urbanised and densely populated
areas along the northern part of the coast and in poorly flushed waters. Flux levels of
zinc, cadmium, copper, lead and nickel are highest in the southern New England region,
reflecting the level of urbanisation and industrialisation (O'Connor 1996). Heavy metal
concentrations in demersal fish, crustaceans and bivalve molluscs are monitored as
biological indicators (Schwartz et al. 1996). The Virginia Oyster Heritage Program
highlights the critical role oysters play in keeping coastal waters clean and providing
habitat for other marine life (EPA 2004). Of the 826 beaches in the Northeast Coast that
reported information to the EPA, 18% were closed or under advisory for any period of
time in 2002 due to elevated bacteria levels, rainfall events or sewage related problems
(EPA 2004).
IV. Socioeconomic Conditions
The population of the coastal counties of the northeast coast, from northern Maine to the
tidewaters of Virginia, is estimated at 54.3 million people for 2008, representing 78% of
the total population of all the Northeast coastal states (NOAA 2005). Four of the nation's
largest metropolitan areas, New York, Washington DC/Baltimore, Philadelphia and
Boston, are located along the coast of this region. On average, 13 to 23 percent
increases in coastal population were expected in Maryland and Virginia between 2003
and 2006. The economic centres in the region include New York City, the largest
financial market in the world. Northeast economic activities include agriculture, resource
extraction (forestry, fisheries, and mining), major service industries highly dependent on
communication and travel, recreation and tourism, manufacturing and transportation of
industrial goods and materials (USGCRP 2004).
In 2006, the Northeast Shelf ecosystem supported over 1,100 active fishing vessels in
both federal (3-200 miles) and state waters. These vessels produced fish and shellfish
(and other invertebrates) landings worth over US$1.2 billion. In the late 1960s and early
1970s, the intense involvement of foreign fishing fleets and overfishing led to marked
declines in fish abundance (Sherman & Busch 1995). Analyses of catch per unit effort
and fishery independent bottom trawling survey data were critical sources of information
used to implicate overfishing as the cause of the shifts in abundance. Northeast
fishermen were adversely affected by the collapse of the groundfish fishery in the late
1980s. A groundfish vessel buyout program (1995-1998) was designed to provide
economic assistance to fishermen who voluntarily chose to remove their vessels
permanently from the fishery. This resulted in a 20% reduction in fishing effort (NOAA
1999). The fishing culture is traditional in the region and fishermen have struggled to
remain solvent and engaged in the fishing industry in the face of mandated declines in
fishing effort as part of a groundfish stock rebuilding program. Fishing effort reductions
led to curtailed revenues for fishermen (NMFS 1999, Hennessey & Sutinen 2005; Heinz
2000)). The reduction in fishing effort since 1994 has resulted in an initial recovery of
several demersal fisheries, including stocks of sea scallops, haddock and Georges Bank
XIX Non Regional Seas LMEs
813
yellowtail flounder. The Northeast has a low rate of projected future warming compared
to other regions of the U.S. The U.S. Global Change Research Program report on the
potential consequences of climate variability and change in the Northeast (USGCRP
2004) projects increasing trends in precipitation of as much as 25% by 2100 with
increased flooding from storms, rising sea levels, and coastal land loss. At risk are
transportation, communication, energy, water sources and waste disposal systems,
particularly in major Northeast cities presently characterized by insufficient capacity and
deferred maintenance. Sea level rise in the Northeast coastal zone will also exacerbate
stresses to estuaries, bays and wetlands from increasing pollutants, temperature and
salinity and the inundation by sea water of wetlands and marshes.
V. Governance
The Northeast Shelf includes the coastal waters of Maine, New Hampshire,
Massachusetts, Rhode Island, Connecticut, New York, New Jersey, Delaware,
Pennsylvania, Maryland and Virginia. Governance in this LME is shared among several
stewardship agencies and there is a complex layering of management agencies. The
1976 Magnuson Fishing Management Act established the U.S. 200-mile EEZ, which led
to reduction of fishing effort on herring and mackerel stocks and the recovery of their
biomass. But the Act's single species focus neglected predator-prey relationships and
other interactions. This focus has often resulted in conflicting goals and bycatch mortality
(Murawski 1996). A Council system for fisheries management in the region was
introduced in 1976 where co-managing stakeholders are responsible for developing
regulations which are enforced by the National Marine Fisheries Service. Civil societies
participating in this process include fishing groups and environmental organizations. The
New England and mid-Atlantic Fishery Management Councils (Federal Fisheries) and the
Atlantic States Marine Fisheries Commission (State water fisheries) regulate the region's
fisheries through over 35 fishery management plans (FMPs) Regulatory measures since
1994 aimed at a managed recovery of depleted fish stocks through reductions in days at
sea, increased minimum mesh sizes, expanded closed areas, trip limits, and now limited
access privileges including ITQs. Together with decentralized co-management, these
measures have led to good recruitment and recovery of the spawning biomass of sea
scallops and haddock stocks. One issue is the management of transboundary stocks of
Atlantic cod, haddock, yellowtail flounder and pollock in Canadian waters on Georges
Bank and in the Gulf of Maine. Another is the management of transboundary stocks and
jurisdiction over Atlantic anadromous fisheries, along with Canada and West Greenland
(NMFS 2009). Conservation tools are implemented through the North Atlantic Salmon
Conservation Organization (NASCO). In terms of pollution and ecosystem health, the
Chesapeake Bay Programme's partnership with the bordering states has set specific
targets for improving the water quality of the Bay (EPA 2001). Wetlands protection
regulations have reduced the loss of wetlands. Coordinated programmes with
participation from states, academic institutions, the private sector and federal government
are underway to improve monitoring strategies aimed at mitigating habitat loss, coastal
pollution, eutrophication and fisheries overexploitation.
References
Anderson, E.D., Cadrin, S.X., Hendrickson, L.C., Idoine, J.S., Lai, H-L. and Weinberg, J.R. (1999).
Northeast invertebrate fisheries, p 109-115 in: Our Living Oceans: Report on the Status of U.S.
Living Marine Resource. U.S. Department of Commerce, Washington D.C., U.S.
Anderson, E.D., K.D. Friedland, and W.J. Overholtz. (1999a). Northeast pelagic fisheries, p 99-102
in: Our Living Oceans: Report on the Status of U.S. Living Marine Resources. U.S. Department
of Commerce, Washington D.C., U.S.
814
61. U.S. Northeast Continental Shelf LME
Anderson, E.D., Mayo, R.K., Sosebee, K., Terceiro, M., and Wigley, S.E. (1999b). Northeast
demersal fisheries, p 89-97 in: Our Living Oceans: Report on the Status of U.S. Living Marine
Resources. U.S. Department of Commerce, Washington D.C., U.S.
Anthony, V.C. (1996). The state of groundfish resources off the northeastern U.S, pp. 153-167 in:
Sherman, K., Jaworski, N.A. and Smayda, T.J. (eds), The Northeast Shelf Ecosystem:
Assessment, Sustainability and Management. Blackwell Science, Cambridge, U.S.
Belkin, I., Cornillon, P.C., and Sherman, K. (2008). Fronts in Large Marine Ecosystems of the
World's Oceans. Progress in Oceanography, in press.
Brooks, D.A. (1996). Physical oceanography of the shelf and slope seas from Cape Hatteras to
Georges Bank: A brief overview, p 47-74 in: Sherman, K., Jaworski, N.A. and Smayda, T.J.
(eds), The Northeast Shelf Ecosystem: Assessment, Sustainability and Management. Blackwel
Science, Cambridge, U.S.
Durbin, E.G. and Durbin, A.G. (1996). Zooplankton dynamics in the Northeast Shelf Ecosystem, p
129-152 in: Sherman, K., Jaworski, N.A.and Smayda, T.J. (eds), The Northeast Shelf
Ecosystem: Assessment, Sustainability and Management. Blackwell Science, Cambridge, U.S.
EPA (2001). National Coastal Condition Report. www.epa.gov/owow/oceans/nccr/chapters/
EPA (2004). National Coastal Condition Report II. www.epa.gov/owow/oceans/nccr2/
Falkowski, P.G. (1991). A carbon budget for the Northeast Continental Shelf Ecosystem: Results of
the shelf edge exchange process studies, pp 35-48 in: Sherman, K., Alexander, L.M. and Gold,
B.D. (eds), Food Chains, Yields, Models, and Management of Large Marine Ecosystems,
Westview Press, Boulder, CO, U.S.
Greene, CH and Pershing A. (2007). Climate drives sea change. Science 315:1084-1085.
Heinz, H. John III Center for Science, Economics and the Environment (2000). Fishing Grounds:
Defining a New Era for American Fisheries Management. Island Press. Washington D.C., U.S.
Hennessey, T.M. and Sutinen, J.G., eds. (2005). Sustaining Large Marine Ecosystems: The
Human Dimension. Elsevier Science, Amsterdam, The Netherlands.
Jaworski, N.A. and Howarth, R. (1996). Preliminary estimates of the pollutant loads and fluxes into
the Northeast Shelf Ecosystem, p 351-357 in: Sherman, K., Jaworski, N.A.and Smayda, T.J.
(eds), The Northeast Shelf Ecosystem: Assessment, Sustainability and Management. Blackwel
Science, Cambridge, U.S.
Kenney, R.D., Payne, P.M., Heinemann, D.W. and Winn, H.E. (1996). Shifts in Northeast Shelf
cetacean distributions relative to trends in Gulf of Maine/Georges Bank Finfish Abundance, p
169-196 in: Sherman, K., Jaworski, N.A.and Smayda, T.J. (eds), The Northeast Shelf
Ecosystem: Assessment, Sustainability and Management. Blackwell Science, Cambridge, U.S.
Mavor, T.P. and Bisagni, J.J. (2001). Seasonal variability of sea-surface temperature fronts on
Georges Bank. Deep-Sea Research II 48(1-3):215-243.
Murawski, S.A. (1996). Can we manage our multispecies fisheries? p 491-510 in: Sherman, K.,
Jaworski, N.A.and Smayda, T.J. (eds), The Northeast Shelf Ecosystem: Assessment,
Sustainability and Management. Blackwell Science, Cambridge, U.S.
Murawski, S.A. (2000). Definitions of overfishing from an ecosystem perspective. ICES Journal of
Marine Science 57(3):649-658
Murawski, S.A. et al (1999). New England Groundfish. Our Living Oceans: Report on the Status
of U.S. Living Marine Resources, 1999. U.S. Dep. Commer., NOAA Tech. Memo. NMFS-
F/SPO-41. Washington, DC.
NMFS. (2009). Our living oceans. Draft report on the status of U.S. living marine resources, 6th
edition. U.S. Dep. Commer., NOAA Tech. Memo. NMFS-F/SPO-80. 353 p.
NMFS (1999). Our Living Oceans - Report on the Status of U.S. Living Marine Resources. U.S.
Department of Commerce, Washington D.C., U.S.
NOAA (2005) Population Trends Along the Coastal United States: 1980-2008. Report issued
March 1 2005. Appendix C, Northeast. Online at http://oceanservice.noaa.gov/programs/
mb/supp_cstl_population.html.
O'Connor, T.P. (1996). Coastal sediment contamination in the Northeast Shelf Large Marine
Ecosystem, p 239-257 in: Sherman, K., Jaworski, N.A. and Smayda, T.J. (eds), The Northeast
Shelf Ecosystem: Assessment, Sustainability and Management. Blackwell Science, Cambridge,
U.S.
Pauly, D. and Christensen, V. (1995). Primary production required to sustain global fisheries.
Nature 374: 255-257.
Pauly, D. and Watson, R. (2005). Background and interpretation of the `Marine Trophic Index' as a
measure of biodiversity. Philosophical Transactions of the Royal Society: Biological Sciences
360: 415-423.
XIX Non Regional Seas LMEs
815
Pauly, D., Christensen, V., Dalsgaard, J., Froese R. and Torres, F.C. Jr. (1998). Fishing down
marine food webs. Science 279: 860-863.
Schmitz, W.S. and McCartney, M.S. (1993). On the North Atlantic circulation. Reviews of
Geophysics 31:29-49.
Schwartz, J.P., Duston, N.M. and Batdorf, C.A. (1996). Metal concentrations in winter flounder,
American lobster, and bivalve molluscs from Boston Harbour, Salem Harbour and Coastal
Massachusetts: A summary of data on tissues collected from 1986 to 1991, p 285-312 in:
Sherman, K., Jaworski, N.A. and Smayda, T.J. (eds), The Northeast Shelf Ecosystem:
Assessment, Sustainability and Management. Blackwell Science, Cambridge, U.S.
Sea Around Us (2007). A Global Database on Marine Fisheries and Ecosystems. Fisheries Centre,
University British Columbia, Vancouver, Canada. www.seaaroundus.org/lme/SummaryInfo.
aspx?LME=6
Sherman, K., Grosslein, M, Mountain, D., O'Reilly, J. and Theroux, R. (1988). The continental shelf
ecosystem off the northeast coast of the U.S., p 279-337 in: Postma, H. and Zijlstra, J.J. (eds),
Ecosystems of the World 27: Continental Shelves. Elsevier, Amsterdam, The Netherlands.
Sherman, K. and Busch, D.A. (1995). Assessment and monitoring of large marine ecosystems, p
385-440 in: Rapport, D.J, Guadet, C.L. and Calow, P. (eds), Evaluating and Monitoring the
Health of Large-scale Ecosystems. Springer-Verlag, Berlin. (Published in cooperation with
NATO Scientific Affairs Division). NATO Advanced Science Institutes Series. Series 1: Global
Environmental Change, Vol. 28.
Sherman, K., Green, J., Solow, A., Murawski, S.A., Kane, J., Jossi, J. and Smith, W. (1996b).
Zooplankton prey field variability during collapse and recovery of pelagic fish in the Northeast
Shelf Ecosystem, p 217-236 in: Sherman, K., Jaworski, N.A.and Smayda, T.J. (eds), The
Northeast Shelf Ecosystem: Assessment, Sustainability, and Management. Blackwell Science,
Cambridge, U.S.
Sherman, K., Jaworski, N.A., Smayda, T.J., eds. (1996c). The Northeast Shelf Ecosystem:
Assessment, Sustainability and Management. Blackwell Science, Cambridge, U.S. 564 pages.
Sherman, K., Kane, J., Murawski, S., Overholtz, W. and Solow, A. (2002). The U.S. Northeast Shelf
Large Marine Ecosystem: Zooplankton trends in fish biomass recovery, p 195-215 in: Sherman,
K. and Skjoldal, H.R. (eds), Large Marine Ecosystems of the North Atlantic: Changing States
and Sustainability. Elsevier Science, New York, U.S.
Sherman, K., O'Reilly, J. and Kane, J. (2003). Assessment and sustainability of the U.S. Northeast
Shelf Ecosystem, p 93-120 in: Sherman, K. and Hempel, G. (eds), Large Marine Ecosystems of
the World Trends in Exploitation, Protection and Research. Elsevier, Amsterdam, The
Netherlands.
Sherman, K., O'Reilly, J., and Kane, J. ( 2003). Assessment and sustainability of the U.S.
Northeast Shelf Ecosystem. In: Hempel, G. and Sherman K., eds. Large Marine Ecosystems of
the World: Trends in exploitation, protection, and research. Elsevier, Amsterdam, The
Netherlands.
Sissenwine, M. and Cohen, E. (1991). Resource productivity and fisheries management of the
Northeast Shelf Ecosystem, p 105-121 in: Sherman, K., Alexander, L.M. and Gold, B.D. (eds),
Food Chains, Yields, Models and Management of Large Marine Ecosystems. Westview Press,
Boulder, U.S.
Ullman, D.S. and Cornillon, P.C. (1999). Surface temperature fronts off the East Coast of North
America from AVHRR imagery. Journal of Geophysical Research 104(C10):23,459-23,478.
USGCRP (US Global Change Research Program) (2004). Climate change Impacts on the United
States: The Potential Consequences of Climate Variability and change, Overview: Northeast.
US National Assessment of Climate Change. Online at www.usgcrp.gov/usgcrp
/Library/national assessment/overview
White, H.H. and Robertson, A. (1996). Biological responses to toxic contaminants in the Northeast
Shelf . Large Marine Ecosystem, p 259-283 in: Sherman, K., Jaworski, N.A.and Smayda, T.J.
(eds), The Northeast Shelf Ecosystem: Assessment, Sustainability and Management. Blackwel
Science, Cambridge, U.S.
816
61. U.S. Northeast Continental Shelf LME
XIX Non Regional Seas LMEs
817
XIX-62 Hudson Bay LME
M.C. Aquarone and S. Adams
The Hudson Bay LME is a vast, shallow, semi-enclosed LME, bordered by the Canadian
provinces of Quebec, Ontario, Manitoba and Nunavut and with a surface area of about
841,200 km˛, of which 0.42% is protected (Sea Around Us 2007). It is connected to the
Davis Strait, Labrador Sea and Atlantic Ocean through the Hudson Strait, and to the
Arctic Ocean by the Foxe Basin and the Fury and Hecla Straits. Three oceanographically
distinct sub-units could be considered to make up the LME: the Hudson Bay, James Bay
and Foxe Basin (Powles et al. 2004). It should be noted that Foxe Basin was not
included in the LME boundaries used for the calculations presented in this brief. The
LME receives Atlantic and Arctic marine waters, and freshwater from a vast watershed
extending from the Northwest Territories to Saskatchewan and Alberta. The coastal zone
geomorphology (low-lying areas, cliffs and headlands, and bottom topography) is still
rebounding from the great weight of the Laurentide Ice Sheet that once covered the
entire region. A unique oceanographic feature of this LME is its Arctic climate and variety
of ecoclimatic zones, ranging from humid high boreal in the south to low Arctic. The LME
has long, cold winters and short, cool summers. It is the largest body of water in the
world that seasonally freezes over in the winter and becomes ice-free in the summer and
it is significantly colder than other marine regions situated on the same latitude. Strong
winds during the open water season, persistent low temperatures and the influx in the
spring and summer of fresh water from numerous rivers and melting sea ice characterise
the LME. Annual ice cover fluctuates with oscillatory changes in the climate system
produced by the North Atlantic Oscillation and the Arctic Oscillation. There is extreme
variation in the range of average temperatures and average total precipitation, both
seasonally and annually, throughout the LME. Book chapters and articles pertaining to
this LME include Stewart & Lockhart (2004, 2005).
I. Productivity
Three key features characterise productivity of the Hudson Bay LME: (1) the extreme
southerly penetration of Arctic marine water; (2) a very large volume of freshwater runoff;
and (3) the dynamic geomorphology of the coastal zone, with its low-lying marshes and
wide tidal flats. Polynyas (open water areas in the ice, which are known to be biologically
important throughout the Arctic) are found predominantly along the north-west and east
coasts of the LME, in the James Bay and in the vicinity of the Belcher Islands, situated in
the Southeast of the LME. The areas of ice cover and polynyas strongly affect the LME's
physical and biological oceanography, the surrounding land, and human activities. In
summer there is a strong vertical stratification of the water column, particularly offshore.
This slows vertical mixing, precludes the transfer of nutrients to surface waters and limits
biological productivity. In winter, reduced runoff, ice cover and surface cooling weaken
this vertical stratification. The large volume of freshwater influences the timing and
pattern of the ice cover breakup, the surface circulation, water column stability, species
distribution, and biological productivity. Areas to the North of James Bay are
characterised by complete winter ice cover and summer clearing, moderate semidiurnal
tides of Atlantic origin, a strong summer pycnocline, and lower biological productivity
(Stewart & Lockhart 2004).
The Hudson Bay LME is considered a Class II (150-300 gCm-2year-1) productivity
ecosystem. Productivity appears to be lower than that of other LMEs at similar latitudes,
and is enhanced in coastal waters, near embayments and estuaries, and near islands
818
62. Hudson Bay LME
where there is periodic entrainment or upwelling of deeper, nutrient-rich water. A
remarkably diverse microalgal community, consisting of over 495 taxa, exists despite the
northerly latitude, Arctic character, and low productivity of the Hudson-James Bay system
(Stewart and Lockhart 2005). Migratory fish, marine mammals and birds use the varied
range of habitats year-round or seasonally. The ability to exploit the brackish zone is an
important ecological adaptation for both the Arctic freshwater and marine species. Fewer
species are found toward the North where Arctic species predominate. The LME and its
ice habitats are used by five species of seals (bearded, ringed, hooded, harbor and harp),
and by whales, including bowhead, beluga, narwhals, killer whales, minke, sperm whales
and bottom-nose. There are walruses, Arctic foxes and polar bears in the LME coastal
areas and ice habitats. The quality, extent and duration of the sea ice cover determine
the seasonal distribution, movements and reproductive success of all these mammals.
The polar bear population in the Hudson Bay region is at risk as ice cover recedes and
seal prey are less available.
A precautionary approach to setting catch limits for polar bear in a warming Arctic was
adopted at the 14th meeting of the IUCN Polar Bear Specialist Group in 2005.
Knowledge gaps on the structure and function of the food web make it difficult to identify
and understand trends of change and to discern whether they result from natural
environmental variations or from human activities. The seasonal ice cover effectively
prevents year-round, bay-wide research. Taxonomic coverage is uneven or incomplete,
with few studies examining trophic relationships, biological productivity, and seasonal or
inter-annual variation in the LME's physical and biological systems. Stewart and
Lockhart (2005) who listed species that frequent Arctic marine waters: at least 689
invertebrate species, 61 fish species, marine mammals (5 species of whales, 5 species of
seals, walrus, polar bear), and 133 species of seabirds. In addition, it may be pertinent to
highlight the importance and diversity of the ice algal community in Hudson Bay, maybe
by mentioning the following figures: at least 155 taxa, most of them (142) are diatoms.
Oceanic Fronts (Belkin et al. 2008) (Figure XIX-62.1): This LME appears relatively
uniform as it features just a few comparatively weak fronts, mainly around its periphery.
The most robust thermal front is observed in the far south, within James Bay, probably
related to the enhanced freshwater discharge into the apex of James Bay that generates
a collocated salinity front.
Similar estuarine fronts are likely to exist elsewhere off the bay's eastern, southern and
western shores, peaking after spring freshets. A meandering front develops in the
northern part of Hudson Bay between waters that flow into the bay from the northwest
and resident waters. This front develops seasonally; its location and TS-characteristics
ultimately depend on the seasonal ice cover melt since the latter determines the amount
of fresh water released by the melting sea ice and eventually determines the salinity
differential across this front.
Hudson Bay LME Sea Surface Temperature (Belkin 2008) (Figure XIX-62.2):
Linear SST trend since 1957: 0.59°C.
Linear SST trend since 1982: 0.28°C.

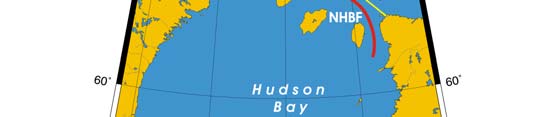
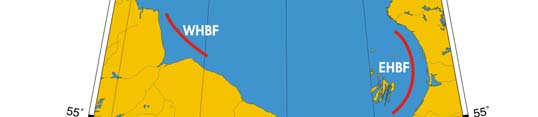
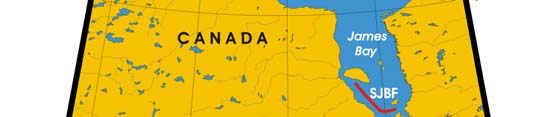
XIX Non Regional Seas LMEs
819
Figure XIX-62.1. Oceanographic fronts of the Hudson Bay LME. EHBF, East Hudson Bay Front; NHBF,
North Hudson Bay Front; SJBF South James Bay Front; WHBF, West Hudson Bay Front. Yellow line,
LME boundary. After Belkin et al. (2008). Note that at the time of this writing, the LME boundaries do
not include Foxe Basin.
The Hudson Bay warming was steady but moderate-to-slow. The all-time minimum of -
0.1°C was achieved in 1972, in the end of a long-term cooling epoch. The post-1972
long-term warming resulted in a SST increase of >1°C over the next 20 years. The all-
time maximum of 1.6°C in 1999 was an isolated event. The long-term decrease of river
freshwater discharge into the Hudson Bay caused salinization of the upper ocean (Déry
et al., 2005), so that there are two modern trends warming and salinization that have
opposite effects on water density, which decreases with rising temperature and increases
with rising salinity. Circulation in Hudson Bay flushes melt water out of the Bay into
Hudson Strait and eventually onto the Newfoundland Shelf. Therefore the continuing
warming of the Hudson Bay is bound to affect the Newfoundland Shelf. Significant
asymmetry was found in temporal trends of landfast ice thickness between western and
eastern sides of the Bay (Gagnon and Gough, 2005). First, "significant thickening of the
ice cover over time was detected on the western side ...., while a slight thinning ... was
observed on the eastern side" (Gagnon and Gough, 2005). Second, "this asymmetry is
related to the variability of air temperature, snow depth, and the dates of ice freeze-up
and break-up" (Gagnon and Gough, 2005). These results contradict numerical models of
general circulation and field results obtained in other areas of the Arctic.
820
62. Hudson Bay LME
Figure XIX-62.2. Hudson Bay LME annual mean SST (left) and SST anomaly (right), 1957-2006, based on
Hadley climatology. After Belkin (2008).
Hudson Bay LME Chlorophyll and Primary Productivity
This LME is a Class II moderate-high (150-300 gCm-2year-1) productivity ecosystem
(Figure XIX-62.3).
It is difficult to measure the contributions of phytoplankton, ice algae, benthic algae and
benthic macrophytes to primary production in the marine ecosystem. Stewart and
Lockhart (2005) point out the difficulty of sampling at breakup when the main
phytoplankton bloom likely occurs.
Figure XIX-61.3. Hudson Bay LME trends in chlorophyll a (left) and primary productivity (right), 1998-
2006, from satellite ocean colour imagery. Values are colour coded to the right hand ordinate. Figure
courtesy of J. O'Reilly and K. Hyde. Sources discussed p. 15 this volume.
A subpycnocline chlorophyll a maximum occurs in the offshore waters of Hudson Bay in
the summer (Stewart and Lockhart 2005).
XIX Non Regional Seas LMEs
821
II. Fish and Fisheries
The Hudson Bay LME supports around 60 species of fish, consisting of a mix of Arctic
marine, estuarine and freshwater species. This shallow LME lacks the deepwater
species that inhabit the Hudson Strait. The typically Arctic mollusk species are more
common and abundant offshore. The more significant marine resources are to be found
in Foxe Basin, near the Fury and Hecla Strait. The Cree and Inuit catch most fish from
estuarine or coastal waters during the open water season. Fishing is mainly for food, and
as a traditional social and cultural activity. Exploited species include anadromous cisco,
whitefish, longnose sucker, brook trout, capelin, cod, sculpin and blue mussels (Mytilus
edulis). Indigenous peoples also catch seals, walrus and whales, and trap muskrat and
beaver. Migratory waterfowl are a significant portion of the Cree and Inuit diet in the
eastern Hudson Bay.
Of importance in this LME are largely unreported subsistence fisheries of the local Inuit
and Indian populations, as described in Booth & Watts (2007). Twenty-four communities
situated around the Hudson and James Bays make use of its resources, and the human
population of these communities has grown from approximately 4,000 in 1950 to over
19,000 in 2001. Catches mainly target Arctic charr (Salvelinus alpinus) and Arctic cod
(Boreagadus saida), although some other species are also taken, notably Atlantic salmon
(Salmo salar) and Fourhorn sculpin (Triglopsis quadricornis). Estimated subsistence
catches in 1950 were approximately 362 tonnes, and peaked in 1962 at 897 tonnes
before declining to approximately 290 tonnes by the early 2000s (Figure XIX-62.4). A
large portion of the decline over the last few decades is attributed to the fact that the
snowmobile has replaced the dog sled as the major form of transportation, thus reducing
the need for marine fish as dog food (Booth & Watts 2007).
1000
900
800
700
)
.
s
600
ne
t
on
(
500
s
400
Landing
300
200
100
0
1950
1960
1970
1980
1990
2000
Year
Charr
Cods
Atlantic salmon
Fourhorn sculpin
Sculpins
Polar cod
Whitefish
Figure XIX-62.4. Total estimated catches (subsistence fisheries) in the Hudson Bay LME by species
(Sea Around Us 2007).
[No Figures 5, 6, 7, or 8]
822
62. Hudson Bay LME
Due to the tentative nature of these catch estimates, no indicators based on these data
will be presented (but see Sea Around Us 2007).
III. Pollution and Ecosystem Health
Pollution: The Hudson Bay LME is relatively pristine. The human activities that can
affect the natural environment of the LME are resource exploitation, marine
transportation, mining, hydrocarbons, sewage disposal and the diversion of freshwater for
industrial and agricultural purposes. The polynyas are thought to be affected by pollution
as a result of the alteration in freshwater input to the southern Hudson Bay. Mercury
levels in the La Grande River system rose considerably when a hydroelectric project
began, but they are now declining. Slightly elevated mercury levels have been found in
marine fish within 10 km to15 km of the La Grande River mouth. Marine mammals high
on the food chain have the highest levels of mercury. Many Hudson Bay communities
lack sewage and wastewater treatment facilities, and as a result, bacterial and chemical
contaminants can be directly discharged into the sea. This is, however, offset by low
temperatures and high salinity, which kill most pathogenic organisms. The impacts of
marine ecotourism, while at present slight, are increasing. Visitors come to the port of
Churchill (Manitoba) during the summer to see the beluga whales, polar bears and
migratory birds. Cruise ships visit the northwestern Hudson Bay in the summer.
Although there is a regular flow of ship traffic through the region, little has been altered
along the coast except for the port of Churchill and for some small docking facilities.
There is a risk of spills (oil, contaminants), and of introducing exotic species when bilges
are cleaned.
Overall, the Hudson Bay LME is a relatively pristine environment. However, there is some
evidence of the impacts of human activities on Hudson Bay with the presence in biota
and sediments of synthetic persistent organic pollutants (POPs) which can reach the
Arctic, and Hudson Bay, via long range transportation with moving air masses. Among
the most toxic products found in Hudson Bay ecosystem, there are PCBs and
radionuclides which result exclusively from human activities (Stewart and Lockhart,
2005). High levels of both DDT and PCBs have been reported from eastern part of
Hudson Bay relative to other parts of the Arctic. High levels of PCBs were measured in
human milk in coastal communities of northern Quebec (Cobb et al., 2001). In addition to
POPs, toxic heavy metals have been found in this region. For example, a significant
proportion of people living in coastal communities of northern Quebec has levels of blood
mercury over the normal range (Cobb et al., 2001), whereas high levels of mercury have
been observed in animals that are the highest in food chains, particularly some birds and
marine mammals such as belugas and polar bears (Stewart and Lockhart, 2005)
Habitat and community modification: Low-lying rocky islands, tidal flats, tundras, salt
marshes, eelgrass beds, coastal cliffs and open water polynyas are important habitats,
used seasonally by migratory fish, marine mammals, migratory waterfowl and shore
birds. The islands and coasts of James Bay provide critical habitats for breeding, feeding
and moulting for a wide variety of species near the limits of their breeding distributions.
Watersheds around the Hudson Bay LME are being altered as a result of population
growth, business activity, agriculture, hydroelectric development and climate change.
The pace of ecological change in the region seems to be accelerating if one draws upon
the observations of indigenous populations who, for generations, have hunted and fished
in this LME.
Hydroelectric installations have altered the timing and the rate of the flow of the La
Grande and Eastmain Rivers, which drain into James Bay from the Province of Quebec,
and of the Churchill and Nelson Rivers, which drain into southwest Hudson Bay from
Manitoba. The long-term impacts of these diversions on the marine environment are
XIX Non Regional Seas LMEs
823
currently unknown. Today the natural spring freshet into James Bay does not occur at the
La Grande or Eastmain Rivers. The Eastmain River plume is significantly reduced, with
saline intrusions occurring upstream over a distance of 10 km. The La Grande River now
discharges 8 times more freshwater into James Bay, with the plume extending 100 km
into the bay. Impacts might include changes in the duration of the ice-cover; changes in
the habitats of marine mammals, fish, and migratory birds; changes in the system of
currents flowing in and out of the Hudson Bay LME; changes in anadromous fish
populations and in the seasonal and annual loads of sediments and nutrients; and
changes in the biological productivity of estuaries and coastal areas.
There are concerns about probable climate change and sea level rise caused by global
warming. Changes in air temperature, precipitation, stream flow, sea ice and biota are
observed in the Hudson Bay LME, with evidence of warming in the western part, cooling
in the eastern part, and an increasing trend of annual precipitation in the spring, summer
and fall. The ice cover record (Stewart & Lockhart 2004) shows evidence of climate
change. The loss of seasonal ice cover has major implications in the Hudson Bay LME:
(1) an initial increase and subsequent reduction or elimination of polynyas and ice edge
habitats that are important areas for the exchange of energy fluxes between ecotones;
(2) an increase of surface salinity; (3) the dilution of surface waters by freshwater inputs
from melting sea ice; (4) wind mixing, making more nutrients available to primary
producers in the upper water column; (5) more surface light available to primary
producers; (6) a decrease of damage to plants and bottom habitats caused by freezing;
and (7) a reduction of ice habitats and their associated biota. Climate change has the
potential to alter the spatial distribution of biota in and around the Hudson Bay LME,
affecting ice-adapted species. However, the direction and degree of change is
impossible to predict given the complexity of the ecosystem.
IV. Socioeconomic Conditions
The Hudson Bay LME is characterised by its remote location and by the non-commercial
nature of its marine resources. European occupation began in the 1600s, with the
exploration of the southeastern Hudson Bay and James Bay in search of a northwest
passage to Asia. Today, the coastal areas of the Hudson Bay LME are populated by
approximately 10,000 people living in 17 communities. Much of the local economy is
based on subsistence hunting, trapping and fishing. Land settlement agreements with
the Canadian government have given the Cree and Inuit title to large stretches of coast.
Nunavut is the new Inuit territory, created in 1999. Many Inuit continue to harvest
bowhead whales for food and as part of their cultural heritage. Ringed seals for the Inuit
and the Cree, and bearded seals for the Inuit, are another very important natural
resource. Waterfowl are also important to the regional economy, for subsistence and for
sport hunting. The common eider is harvested year-round for its meat, feathers, skin,
eggs and down. Some of the down is exported. Quotas exist for the number of bears that
can be harvested. The sharing of the proceeds of hunting and gathering continues to be
of great social, cultural and economic significance to both Inuit and Cree. There is a
small fish smoking plant at Puvirnituq (Quebec). None of the Kivalliq fish processing
operations has received enough fish consistently to meet operating expenses. The
commercial exploitation of coastal marine and estuarine fish is conducted along the
Quebec coast, and the fish is marketed through local cooperatives. Climate change
could effect major changes in the lifestyle and resource use of the native peoples living in
coastal areas, such that their traditional knowledge would no longer be applicable.
Several hydroelectric projects are in operation, or are planned, to divert or impound the
renewable energy of the numerous rivers flowing into the Hudson Bay LME. At present
there is no offshore mineral or hydrocarbon development, although exploration has taken
place in the southwestern part of the bay. The region has a known potential for
824
62. Hudson Bay LME
hydrocarbons, precious metals, diamonds, phosphates, gypsum and limestone.
Construction, some tourism and government services are the other principal activities. A
Hudson Bay shipping route is being envisaged to open up the Canadian prairies.
Churchill Harbor plays an important role in shipping, which is one of the most important
activity that sustains the socio-economy of this region, along with tourism (e.g. polar bear
watching).
V. Governance
The Hudson Bay LME waters are under Canadian federal jurisdiction. There is a federal
responsibility to protect the integrity of the marine and fresh water ecosystems of the
region. Under Canada's Oceans Act, the Department of Fisheries and Oceans (DFO)
has a mandate to lead and facilitate the integrated management of all of Canada's
estuarine, coastal and marine environments. The DFO is taking an ecosystem-based
approach to integrated oceans management. In addition to the Oceans Act, several
pieces of relevant federal legislation that apply to Arctic marine waters contribute to the
conservation and protection of the Hudson Bay LME: the Fisheries Act, Canada Water
Act, Canada Shipping Act, Arctic Water Pollution Prevention Act (up to 60°N), Species at
Risk Act, Canadian Environmental Assessment Act, Canadian Environmental Protection
Act. Main federal responsible authorities are Fisheries and Oceans Canada, Transport
Canada, Environment Canada, Indian and Northern Affairs Canada..
The Nunavut Wildlife Management Board (NWMB) makes decisions relating to fish and
wildlife in Nunavut. This includes setting quotas, fishing and hunting seasons and
regulating harvesting methods, and approving management plans and the designation of
endangered species (www.gov.nu.ca/nunavut/). Under the Northern Quebec Agreement
(1976), Inuit and Cree are guaranteed certain levels of harvest which are to be
maintained unless their continuation is contrary to Canadian principles of conservation.
As opposed to the commercial and sport fisheries, subsistence fisheries by registered
native peoples are not restricted by fishing area, season or harvest. The Cree and the
Inuit may harvest migratory birds, and their eggs and down, year round. The NWMB has
instituted a flexible quota system for polar bear hunts by Kivalliq communities and a
community-based management of the Repulse Bay narwhal hunt, to provide communities
with more responsibility in the management of their renewable resources. The NWMB
relies on government departments for scientific research and advice, with scientists
providing their research and interpretive skills. The local people contribute their on-site
observations over time.
Wapusk National Park, Manitoba's Cape Churchill and Cape Tatnam Wildlife
Management Areas, and Ontario's Polar Bear Provincial Park provide protection for
marine mammals, birds and coastal wetland habitats along the south coast of the LME.
The Committee on the Status of Endangered Wildlife in Canada (COSEWIC) provides
assessment and makes recommendations about the status of species. Actually, species
at risk are designated as such under the Species at Risk Act which is under the
responsibility of Environment Canada (in general) and DFO (for marine species).The
Committee on the Status of Endangered Wildife in Canada has designated the bowhead
whale as endangered in the Hudson Bay LME and the beluga whale as threatened in the
eastern part of the LME. There is `special concern' for the Lac des Loups Marins
subspecies of harbour seal and for the polar bear. The Ivvavik National Park and the
Tuktut Nogait National Park include a marine component. The Canadian Arctic
Resources Committee has proposed a Hudson Bay Programme, in an attempt to
implement sustainable development policies in the region.
XIX Non Regional Seas LMEs
825
References
AMAP (1998) AMAP Assessment Report: Arctic Pollution Issues. Arctic Monitoring and
Assessment Programme (AMAP), Oslo, Norway, xii+859 pp.
Belkin, I.M. (2008) Rapid warming of Large Marine Ecosystems, Progress in Oceanography, in
press.
Belkin, I.M., Cornillon, P.C., and Sherman, K. (2008). Fronts in Large Marine Ecosystems of the
world's oceans. Progress in Oceanography, in press.
Booth, S. and Watts, P. (2007). Canada's arctic marine fish catches. In: Zeller, D. and Pauly, D.
(eds.) Reconstruction of marine fisheries catches for key countries and regions (1950-2004).
Fisheries Centre Research Reports (in press).
Cleator, H.J. (2001). Traditional knowledge study of ringed seals: a transcript of interviews with
hunters
from Chesterfield Inlet, Nunavut. Canada Department of Fisheries and Oceans,
Central and Arctic
Region, Winnipeg, MB.
Cobb, D.G., S. Eddy, and O. Banias. (2001). Examining the health of the Hudson Bay ecosystem.
Proceedings of the Western Hudson Bay Workshop, Winnipeg, MB, October 25-26, 2000.
Department of Fisheries and Oceans (Winnipeg, MB), Canadian Manuscript Report of Fisheries
and Aquatic Sciences, No. 2589, 41 p.
Cohen, S.J., Agnew, T.A., Headley, A., Louie, P.Y.T., Reycraft, J., and Skinner, W. (1994). Climate
variability, climatic change, and implications for the future of the Hudson Bay Bioregion. An
unpublished report prepared for the Hudson Bay Programme. Canadian Arctic Resources
Council
(CARC), Ottawa, ON.
Déry, S.J., M. Stieglitz, E.C. McKenna, and E.F. Wood (2005) Characteristics and trends of river
discharge into Hudson, James, and Ungava Bays, 19642000, J. Climate, 18(14), 25402557.
Fast, H. and Berkes, F. (1998). Climate change, northern subsistence and land based economies,
Chapter 8, p. 205-226 in: Mayer, N. and Avis, W. (eds), The Canada Country Study: Climate
Impacts and Adaptation, Volume VIII: National Cross-Cutting Issues volume. Environment
Canada, Environmental Adaptation Research Group, Toronto, ON.
Gagnon, A.S., and W.A. Gough (2005) Trends and variability in the dates of ice freeze-up and
break-up over Hudson Bay and James Bay, Arctic, 58, 370382.
Gillespie, D.I., Boyd, H. and Logan, P. (1991). Wetlands for the World: Canada's Ramsar sites.
Canadian Wildlife Service, Ottawa, ON. [DSS Cat. #CW66-115/1991E].
Gough, W.A. (1998). Projections of sea-level change in Hudson and James Bays, Canada, due to
global warming. Arct. Alp. Res. 30: 84-88.
Gough, W.A. (2001). Model tuning and its impact on modelled climate change response: Hudson
Bay sea ice, a case study. Canadian Geographer 45:300-305.
Gough, W.A. and Lueng, A. (2002). Nature and fate of Hudson Bay permafrost. Reg. Environ.
Change 2: 177-184.
Gough, W.A. and Wolfe, E. (2001). Climate change scenarios for Hudson Bay, Canada, from
general circulation models. Arctic 54: 142-148.
Handa, I.T., Harmsen, R. and Jefferies, R.L. (2002). Patterns of vegetation change and the
recovery potential of degraded areas in a coastal marsh system of the Hudson Bay lowlands.
Journal of Ecology 90: 86-99.
Harvey, M., Therriault, J.C.A. and Simard, N. (1997). Late-summer distribution of phytoplankton in
relation to water mass characteristics in Hudson Bay and Hudson Strait (Canada). Canadian
Journal Fisheries and Aquatic Science 54: 1937-1952.
Ingram, R.G., Wang, J., Lin, C., Legendre, L. and Fortier, L. (1996). Impact of freshwater on a
subarctic ecosystem under seasonal sea ice cover (southern Hudson Bay, Canada). I:
Interannual variability and predicted global warming influence on river plume dynamics and sea
ice. Journal of Marine Systems 7: 221-231.
Kingsley, M.C.S. (2000). Numbers and distribution of beluga whales, Delphinapterus leucas, in
James Bay, eastern Hudson Bay, and Ungava Bay in Canada during the summer of 1993.
Fisheries Bulletin 98: 736-747.
LeBlond, P.H., Lazier, J.R. and Weaver, A.J. (1996). Can regulation of freshwater runoff in Hudson
Bay affect the climate of the North Atlantic? Arctic 49: 348-355.
Lockhart, W.L., Wagemann, R. and Grondin, J. (1999). Mercury and methylmercury speciation in
Arctic people and marine mammals, p. 149-154 in: Kalhok, S. (ed), Synopsis of Research
Conducted Under the 1998/99 Northern Contaminants Program, Report QS-8599-000-EF-A1,
Indian Affairs and Northern Development, Ottawa, ON.
826
62. Hudson Bay LME
Lockhart, W.L., Wilkinson, P., Billeck, B.N., Danell, R.A., Hunt, R.V., Brunskill, G.J., Delaronde, J.
and St. Louis, V. (1998). Fluxes of mercury to lake sediments in central and northern Canada
inferred from dated sediment cores. Biogeochem. 40: 163-173.
Markham, W.E. (1986). The ice cover, p 101-116 in: Martini, I.P. (ed), Canadian Inland Seas.
Elsevier Oceanography Series 44. Elsevier Science Publishers, Amsterdam.
Maxwell, J. B. (1999). Responding to global climate change in Canada's Arctic, Vol. 2 of the
Canada Country Study: Climate impacts and adaptations. Environment Canada, Downsview,
ON.
Maxwell, J.B. (1986). A climate overview of the Canadian inland seas, p 79-99 in: Martini, I.P.
(ed), Canadian Inland Seas. Elsevier Oceanography Series 44. Elsevier Science Publishers,
Amsterdam.
McDonald, M., Arragutainaq, L., and Novalinga, Z. (1997). Voices from the Bay: Traditional
Ecological Knowledge of Inuit and Cree in the Hudson Bay Bioregion. Canadian Arctic
Resources Committee; Environmental Committee of Municipality of Sanikiluaq, Ottawa,
ON.
Morin, R. and Dodson, J.J. (1986). The ecology of fishes in James Bay, Hudson Bay and Hudson
Strait, p. 293-325 in: Martini, I.P. (ed), Canadian Inland Seas. Elsevier Oceanography Series
44. Elsevier Science Publishers, Amsterdam.
Morrison, R.I.G. and Gaston, A.J. (1986). Marine and coastal birds of James Bay, Hudson Bay and
Foxe Basin, p. 355-386 in: Martini, I.P. (ed), Canadian Inland Seas. Elsevier Oceanography
Series 44. Elsevier Science Publishers, Amsterdam.
Mysak, L.A. (1993). Climate variability and change with respect to hydroelectric development in
northern Quebec. Great Whale Environmental Assessment: Background Paper 1. An
unpublished report prepared for the Great Whale Public Review Support Office, Montréal, QC.
Mysak, L.A., Ingram, R.G., Wang, J. and van der Baaren, A. (1996). Anomalous sea-ice extent in
Hudson Bay, Baffin Bay and the Labrador Sea during three simultaneous ENSO and NAO
episodes of 1972/73, 1982/83 and 1991/92, Atmosphere-Ocean, 34: 313-343.
Parkinson, C.L. (2000). Recent trend reversals in Arctic sea ice extents: possible connections to
the North Atlantic Oscillation. Polar Geography 24(1):1-12.
Powles, H., Vendette, V., Siron, R. and O'Boyle, R. (2004). Proceedings of the Canadian Marine
Ecoregion Workshop. Canadian Science Advisory Secretariat, Proceedings Series no.
2004/016, Department of Fisheries and Oceans, Ottawa, Canada, 47 p.
Prinsenberg, S.J. (1986). The circulation pattern and current structure of Hudson Bay, p 187-204
in:Martini, I.P. (ed), Canadian Inland Seas. Elsevier Oceanography Series 44. Elsevier Science
Publishers, Amsterdam.
Prinsenberg, S.J. and Freeman, N.G. (1986). Tidal heights and currents in Hudson Bay and James
Bay, p 205-216 in: Martini, I.P. (ed), Canadian Inland Seas. Elsevier Oceanography Series 44.
Elsevier Science Publishers, Amsterdam.
Reeves, R.R. and Mitchell, E. (1990). Bowhead whales in Hudson Bay, Hudson Strait, and Foxe
Basin: a review. Nat. Can. (Que.) 117: 25-43.
Roff, J.C. and Legendre, L. (1986). Physio-chemical and biological oceanography of Hudson Bay, p
265-291 in: Martini, I.P. (ed), Canadian Inland Seas. Elsevier Oceanography Series 44. Elsevier
Science Publishers, Amsterdam.
Saucier, F.J. and Dionne, J. (1998). A 3-D coupled ice-ocean model applied to Hudson Bay,
Canada: The seasonal cycle and time-dependent climate response to atmospheric forcing and
runoff. Journal Geophysical Research 103: 27689-27705.
Sea Around Us (2007). A Global Database on Marine Fisheries and Ecosystems. Fisheries Centre,
University British Columbia, Vancouver, Canada. www.seaaroundus.org/lme/Summary
Info.aspx?LME=63
Sly, P.G. (1995). Human impacts on the Hudson Bay Region: Present and future environmental
concerns, p 172-263, in: Munawar, M. and Luotola, M. (eds), The contaminants in the Nordic
Ecosystem: The Dynamics, Processes and Fate. SPB Academic Publishing, Amsterdam, The
Netherlands.
Stewart, D.B. and Lockhart, W.L. (2005) An Overview of the Hudson Bay Marine Ecosystem.
Canadian Technical Report of Fisheries and Aquatic Sciences 2586. Fisheries and Oceans
Canada.
Stewart, D.B. and Lockhart, W.L. (2004). Summary of the Hudson Bay Marine Ecosystem
Overview. Canada Department of Fisheries and Oceans, Central and Arctic Region, Winnipeg,
Manitoba. Draft March 2004.
XIX Non Regional Seas LMEs
827
Stewart, D.B., Dunbar, M.J., and Bernier, L.M.J. (1993). Marine Natural Areas of Canadian
Significance in the James Bay Marine Region. Unpublished report by Arctic Biological
Consultants, Winnipeg, for Canadian Parks Service, Ottawa, ON.
Stirling, I. (1997). The importance of polynyas, ice edges, and leads to marine mammals and birds.
Journal Marine Systems 10: 9-21.
Stirling, I., Lunn, N.J. and Iacozza, J. (1999). Long-term trends in the population ecology of polar
bears in western Hudson Bay in relation to climatic change. Arctic 52: 294-306.
Wang, J, Mysak, L.A. and Ingram, R.G. (1994). Interannual variability of sea-ice cover in Hudson
Bay, Baffin Bay and the Labrador Sea. Atmosphere-Ocean 32(2): 421-447.
Wang, J., Mysak, L.A. and Ingram, R.G. (1994). A 3-D numerical simulation of Hudson Bay
summer ocean circulation. J. Physical Oceanography 24(12): 2496-2514.
Wang, J., Mysak, L.A. and Ingram, R.G. (1994). A numerical simulation of sea-ice cover in Hudson
Bay. J. Physical Oceanography 24(12): 2515-2533.
Wein, E.E., Freeman, M.M.R. and Makus, J.C. (1996). Use of and preference for traditional foods
among the Belcher Island Inuit. Arctic 49: 256-264.
828
62. Hudson Bay LME
XIX Non Regional Seas LMEs
829
XIX-63 Insular Pacific-Hawaiian LME
M.C. Aquarone and S. Adams
The Insular Pacific-Hawaiian LME includes a range of islands, atolls, islets, reefs and
banks extending 1,500 miles from the Main Hawaiian Islands (MHI) of Hawaii, Maui,
Lanai, Molokai, Oahu, Kauai and Nihau to the outer Northwest Hawaiian Islands (NWHI)
from Nihoa to Kure Atoll and their near-shore boundaries. The LME has an area of about
one million km˛, of which 35.59% is protected, and contains 0.38% and 1.00% of the
world's coral reefs and sea mounts, respectively, and four major estuaries (Sea Around
Us 2007). Equatorial currents and predominant northeasterly trade winds influence the
region, which has a tropical climate. Sea surface temperature (SST) ranges from 21 -
29o C, with the LME area-averaged SST ranging between 24.5 and 25.3 o C. The
Hawaiian Islands were formed by successive periods of volcanic activity, and are
surrounded by coral reefs. More information on environmental conditions influencing the
Hawaiian Islands (climate, temperature, salinity, waves, currents and tides) can be found
in the Ocean Atlas of the University of Hawaii. NOAA's Western Pacific Region includes
the Hawaiian Islands and the U.S. affiliated islands of American Samoa, Guam and the
Northern Marianas (NOAA 1999). Book chapters and articles pertaining to this LME
include Morgan (1989).
I. Productivity
NOAA's Climate Studies Group has investigated decadal-scale changes in ecosystem-
wide productivity in the Northwestern Hawaiian Islands (NWHI), the 1,500 km chain of
islands reefs and atolls that stretches northwest of the main Hawaiian Islands (MHI). In
the late 1980s a change in ocean conditions and ocean productivity occurred along the
NWHI. The effects were seen at several trophic levels, from seabirds and monk seals to
reef fishes and spiny lobsters. The Aleutian Low Pressure System was more intense and
located more to the south as compared with 1977 - 1988. As conditions changed in the
mid-1980s the winter storm winds weakened, resulting in lower vertical mixing, fewer
nutrients in the photic zone, and thus reduced productivity in the open ocean (Pacific
Fisheries Environmental Laboratory (PFEL) online at www.pfeg.noaa.gov).
The Insular Pacific-Hawaiian LME is considered a Class III, low productivity ecosystem
(>150 gCm-2yr-1). It has a high diversity of marine species but relatively low sustainable
yields due to limited ocean nutrients (NOAA 1999). The LME has a high percentage of
endemic species: about 18% - 25% of its shore fishes, molluscs, polychaete worms,
seastars and algae exist only in this LME. It is a major habitat for the North Pacific
humpback whale. The algal habitats and coral reef ecosystems are used by a variety of
organisms for food, shelter and nursery grounds. A study of coral disease in this LME, a
collaborative effort among the Hawaii Institute of Marine Biology, USGS, the Hawaii
Department of Land and Natural Resources Division of Aquatic Resources and the
Bishop Museum, is available at the University of Hawaii website. The US National
Assessment of Climate Change Overview of Islands in the Caribbean and the Pacific
(2000) outlines potential effects of climate change on freshwater resources, public health,
ecosystems, biodiversity and sea-level variability.
Oceanic fronts: This is the only mid-ocean LME (Belkin et al., 2008). Meteorological
and oceanographic conditions are relatively uniform and can be characterised as
subtropical. This relative uniformity is interrupted by the Subtropical Front (STF) that cuts
across the LME at 25°-26°N in winter and 28°-29°N in summer (Figure XIX-63.1). This


830
63. Insular Pacific Hawaiian LME
seasonal shift of the STF is caused by a corresponding meridional shift of the wind field
convergence, which is ultimately responsible for the STF formation. The STF sometimes
consists of two nearly parallel fronts a few degrees of latitude apart that form the double
Subtropical Frontal Zone, similar to the double frontal zones found in other subtropical
oceans (Belkin 1988, 1993, 1995, Belkin and Gordon 1996, Belkin et al. 1998). The STF
plays an important role in ocean ecology as it defines a major trans-ocean migration path
and feeding ground of various fish species, including apex predators such as tuna, and
also turtles (e.g., loggerheads).
Figure XIX-63.1. Fronts of the Insular Pacific-Hawaiian LME. STF, Subtropical Front. This front is shown
with a single line: on many occasions the STF appears as a double front zone (STFZ), with two nearly
parallel fronts, North STF and South STF, 300-500 km apart (Belkin 1995; Belkin et al., 1998). Yellow line,
LME boundary. After Belkin et al. 2008.
Insular Pacific-Hawaiian LME SST (Belkin 2008)
Linear SST trend since 1957: 0.03°C.
Linear SST trend since 1982: 0.45°C.
Figure XIX-63.1. Insular Pacific-Hawaiian LME annual mean SST and SST anomaly (right), 1957-2006,
based on Hadley climatology. After Belkin 2008.
Though the LME encompasses a large island chain, the oceanic environment is typical of
the deep open ocean. Moreover, the Hawaiian LME is the most stable oceanic
environment within a large-scale anticyclonic subtropical gyre. This stability might help
explain the most striking feature of the Hawaiian SST time series: the lack of significant
XIX Non Regional Seas LMEs
831
long-term warming over the last 50 years. Indeed, linear trend warming since 1957 was
only 0.03°C. However, after the minimum observed in 1982-83, the SST rose
significantly: the linear trend warming since 1982 was 0.45°C. Interannual variability is
not substantial in absolute terms, usually <0.5°C. The LME area averaged annual SST
varies little from one year to another, usually <0.5°C. However, in some locations,
interannual variability may be of a larger order of magnitude: in the northern Hawaiian
islands, interannual variations up to 8.0°C have been recorded. The relative long-term
thermal stability of the Hawaiian LME is confirmed by the in situ monitoring data from the
Hawaii Ocean Time-Series (HOT) station off Hawaii, which monitors productivity and
biomass variables.
Insular Pacific-Hawaiian Chlorophyll and Primary Productivity: The Insular Pacific-
Hawaiian LME is considered a Class III, low productivity ecosystem (>150 gCm-2yr-1).
Figure XIX-63.3. Insular Pacific-Hawaiian LME trends in chlorophyll a (left) and primary productivity
(right), 1998 to 2006, from satellite ocean colour imagery. Values are colour coded to the right hand
ordinate. Figure courtesy of J. O'Reilly and K. Hyde. Sources discussed p. 15 this volume.
II. Fish and Fisheries
The LME supports a variety of fisheries in both the NWHI and the MHI. The resources
include invertebrates, precious coral, bottomfish, armorhead fisheries, highly migratory
pelagic fisheries, and nearshore fisheries. The fisheries are on a relatively small scale
compared to mainland U.S. fisheries (NOAA 1999). Most fisheries (bottomfish,
nearshore reef fish, and invertebrates) are concentrated in the coastal waters of the
narrow shelf areas surrounding the islands, except for the fishery for highly migratory
pelagic species (NOAA 1999). Tuna (bigeye, yellowfin, skipjack, and albacore) is the
LME's most valuable resource. Transboundary fishery resources are of value to the
Pacific Rim nations and to the U.S. fleets fishing within and beyond the U.S. EEZ.
The lobster fishery harvests both spiny and slipper lobsters in the NWHI and MHI, and is
governed by the Western pacific Regional Fishery Management Council under a
Fisheries Management Plan (FMP). Spiny lobster is the primary target of a commercial
lobster trap fishery in the NWHI and a small scale, primarily recreational fishery in the
MHI (NMFS 2009). Evidence that slipper lobsters have taken over certain areas
previously defined as spiny lobster habitats might indicate an increase in abundance and
spatial distribution of slipper lobsters due to the "fishing down" of spiny lobsters and the
availability of lobster habitat formerly occupied by spiny lobster. Statistics for 1983-1997
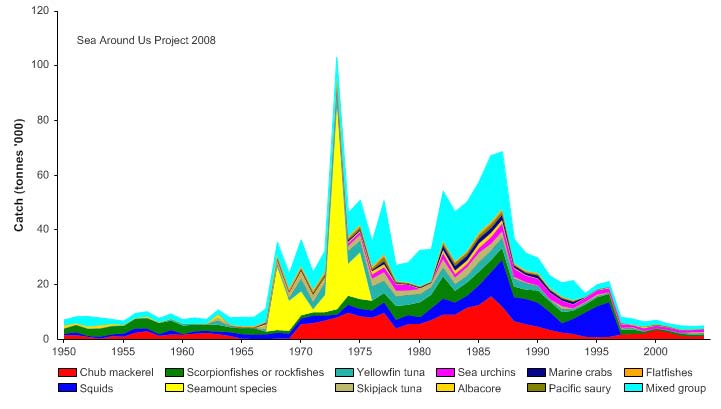
832
63. Insular Pacific Hawaiian LME
showed a decline in lobster landings which is attributed to the combined effect of a shift in
oceanographic conditions affecting recruitment and fishing mortality in the mid-1980s
(NOAA 1999). In response to the continuing decline in CPUE the fishery was closed in
1993 and the fishing seasons were shortened in 1994 and 1995. An FMP was
implemented in 1983, with amendments designed to eliminate lobster trap interactions
with the endangered Hawaiian monk seal (EPA 2004). Other invertebrates harvested are
shrimp, squid, and octopus. Precious deepwater corals including pink, gold and bamboo
are harvested with set quotas. Black coral is a shallow water species. Bottomfish
landings and CPUE have declined since 1948 (NOAA 1999). To determine whether the
causes are environmental, biotic (e.g., habitat and competition), or anthropogenic
requires more catch data, assessments and research. Bottomfish fisheries (snappers,
jacks, and grouper) employ full time fishermen on relatively large vessels in the NWHI.
Bottomfish fisheries are managed jointly by the Western Pacific Fishery Management
Council and state authorities and are presently overfished. Armorhead fisheries are
targeted in the numerous seamounts of the LME, described in Kitchingman et al. 2007,
and were exploited in the late 1960s and 1970s by Japanese trawlers and by trawlers
from the components of the ex-USSR (especially Russia). Partial estimates of pelagic
armorhead (Pseudopentaceros wheeleri) and alfonsin (Beryx spp.) catches are
presented in Zeller et al. (2005). For the present account, they were estimated from the
catch of seamount species reported to FAO by Japan and the components of the ex-
USSR (Zeller and Rizzo 2007), and from the distribution of seamounts in that LME (from
the global seamount map in Kitchingman and Lai 2004).
An issue for the armorhead seamount fishery is how to implement a form of international
management that is conducive to stock recovery. Reports on Hawaiian pelagic fisheries
(tuna, albacore, marlin, swordfish, dolphinfish and sharks) and gear types are available at
NOAA's Pacific Islands Fisheries Science Center website (www.pifsc.noaa.gov). Tropical
tunas and dolphinfish are important to subsistence fisheries. Others, especially marlins,
yellowfin tuna, and albacore, support important recreational fisheries, as in Kona, Hawaii.
Nearshore fisheries are defined as those coastal and estuarine species found in the 0-3
nautical mile zone of coastal state waters. The more highly populated islands receive the
heaviest inshore fishing pressure (NMFS 2009). Total reported landings in this LME
reached 100,000 tonnes in 1973, when the seamount fishery was at its peak, but have
since declined to 5,000 tonnes in 2004 (Figure XIX-63.4).
Figure XIX-63.4. Total reported landings in the Insular Pacific-Hawaiian LME by species (Sea Around Us
2007).
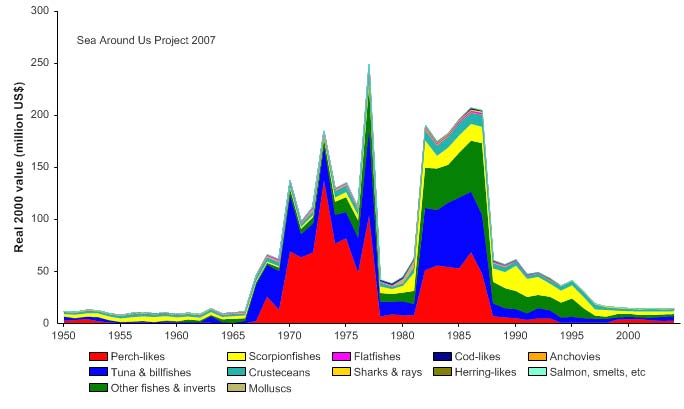
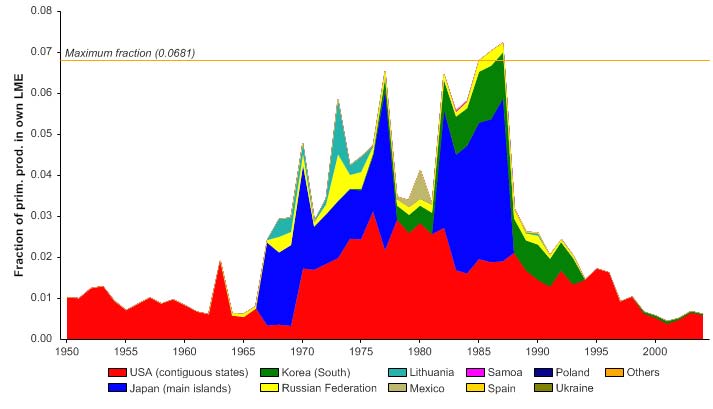
XIX Non Regional Seas LMEs
833
Figure XIX-63.5. Value of reported landings in the Insular Pacific-Hawaiian LME by commercial groups
(Sea Around Us 2007).
Catches of inshore fish by small-scale and recreational fishery are high, however, and
were they to be included in our analysis, the trend in the reported landings would change
considerably (Zeller et al. 2005, 2007). Some key issues in Hawaiian fisheries are: (l) the
management of highly migratory species, (2) shark finning, (3) longline fisheries bycatch
of sea turtles, and (4) longline fisheries bycatch of sea birds. Increasingly, climate change
is an issue for ecosystem dynamics and fisheries management (Polovina and Haight
1999). Reported landings were valued at near US$ 250 million (in 2000 US dollars) in
1977 and over $US 200 million in 1986 and 1987 (Figure XIX-63.5). The primary
production required (Pauly & Christensen 1995) to sustain the reported landings in the
LME reached 7% of the observed primary production in the late 1980s, but has declined
to below 1% in recent years (Figure XIX-63.6). The USA accounts for the largest share
of the ecological footprint in this LME, although a large share by foreign fleets from Japan
and South Korea was reported in the 1970s and 1980s.
Figure XIX-63.6. Primary production required to support reported landings (i.e., ecological footprint) as
fraction of the observed primary production in the Insular Pacific- Hawaiian LME (Sea Around Us 2007).
The `Maximum fraction' denotes the mean of the 5 highest values.
834
63. Insular Pacific Hawaiian LME
The mean trophic level of the reported landings (Pauly & Watson 2005) shows a steady
decline (Figure XIX-63.7 top), an indication of a `fishing down' of the food web in the LME
(Pauly et al. 1998). The Fishing-in-Balance (FiB) index also showed an initial increase,
followed by a decline since the late 1980s (Figure XIX-63.7 bottom). The true patterns of
these indices, however, are likely masked by the underreporting of catches in the LME
(Zeller et al 2005, 2007).
Figure XIX-63.7. Mean trophic level (i.e., Marine Trophic Index) (top) and Fishing-in-Balance Index
(bottom) in the Insular Pacific-Hawaiian LME (Sea Around Us 2007).
The problem of misreporting probably also affects the Stock-Catch Status Plots, which
indicate that over 80% of commercially exploited stocks have collapsed (Figure XIX-63.8,
top), with less than 10% of the reported landings biomass supplied by fully exploited
stocks (Figure XIX-63.8 bottom). The US National Marine Fisheries Service (NMFS)
includes "overfished" but not "collapsed" in its stock status categories (NOAA 1999).
Currently overfished are bottomfish fisheries (snappers, jacks, and grouper).
1950
1960
1970
1980
1990
2000
0%
100
10%
90
20%
)
80
%
(
s
30%
u
70
stat
40%
y
60
b
s
k
50%
c
50
t
o
f
s
60%
o
40
er
b
70%
m
30
u
N
80%
20
90%
10
100%0
1950
1960
1970
1980
1990
2000
(n = 1520)
developing
fully exploited
over-exploited
collapsed
1950
1960
1970
1980
1990
2000
0%
100
10%
90
20%
80
)
30%
(
%
70
s
t
u
a
40%
60
st
ck
50%
o
50
st
y
60%
b
h
40
t
c
a
70%
C
30
80%
20
90%
10
100%0
1950
1960
1970
1980
1990
2000
(n = 1520)
developing
fully exploited
over-exploited
collapsed
Figure XIX-61.8. Stock-Catch Status Plots for the Insular Pacific-Hawaiian LME, showing the proportion
of developing (green), fully exploited (yellow), overexploited (orange) and collapsed (purple) fisheries
by number of stocks (top) and by catch biomass (bottom) from 1950 to 2004. Note that (n), the number
of `stocks', i.e., individual landings time series, only include taxonomic entities at species, genus or
family level, i.e., higher and pooled groups have been excluded (see Pauly et al, this vol. for definitions).
XIX Non Regional Seas LMEs
835
III. Pollution and Ecosystem Health
Some mangroves have been destroyed to make way for aquaculture (Farewell and
Ostrowski 2001. For a chapter on marine mammals of the U.S. Pacific Region and
Hawaii, see NOAA (1999). This provides data for Hawaii of the Hawaiian monk seal, and
various species of dolphins and whales. Mammals are possible indicators of ecosystem
health. For a list of endangered species, see http://hbs.bishopmuseum.org/endangered/.
The LME has a high percentage of endemic species and Hawaii has the highest
extinction rate of biodiversity of any state in the nation according to the U.S. National
Assessment (2000). This LME does not have a comprehensive coastal monitoring
programme. Issues needing to be addressed in specific bays are non point source runoff
and offshore discharges. The State of Hawaii assessed 99% of its estuarine square miles
and 83% of its 1052 miles of shoreline. Forty three percent of estuaries fully support their
designated uses, while 57% of estuaries are impaired. Only 3% of the assessed
shorelines are threatened for one or more uses by some form of pollution or habitat
degradation (EPA 2001 and 2004). Future surveys will provide a better sense of
estuarine conditions. The primary causes of estuarine impairment are increased
concentrations of suspended solids and nutrients. For marine pest invasions, see
Hutchins et al. 2002. For information on the Kaneohe Bay coral reef system, data on
water column and sediments, chlorophyll and nutrients, see www.hawaii.edu/cisnet.
Kaneohe Bay is the focus of a long term project initiated in 1998 to monitor water quality
and sediment processes as part of a nationwide project cooperatively funded by EPA,
NOAA and the National Aeronautics and Space Administration (NASA), termed `CISNet'
(Coastal Intensive Site Network). Recent surveys of the Au'au channel have documented
an infestation by the invasive species Carijoa riisei, which smothers black coral colonies.
The ongoing Hawaii Coral Reef Assessment and Monitoring Programme was created in
1997 by leading coral reef researchers, managers and educators in Hawaii to understand
the ecology of Hawaiian coral reefs (http://cramp.wcc.hawaii.edu/). The initial task was to
develop a state-wide network of over 30 long-term coral reef monitoring sites, and its
associated database. The focus has been expanded to include rapid quantitative
assessments and habitat mapping on a state-wide spatial scale. The EPA has developed
biological criteria for coral reef ecosystem assessment (Jameson et al 1998). Coral reef
ecosystems are biologically critical to this LME and are being impacted by sedimentation,
eutrophication and pollution from intensified human activity in some areas. A question
needing further study is the effect on fish habitat of the harvesting of precious corals.
Some habitat-destructive fishing techniques are coral tangle-netting and dredging.
In addition to unidentified metallic debris buried behind the seawall along most of the
northern shore of Tern Island, revealed in the USCG field survey in 1997, elevated levels
of PCBs have been detected in the biota around the island (Miao et al., 2001). Elevated
levels of copper in crabs, arsenic in eels, and lead in coral were found in the study,
suggesting bioaccumulation of those metals. Former military activity in the area did not
appear to be a factor in the accumulation of metals, with the possible exception of lead.
Teams led by NOAA collected more than 125 tons of debris in the Northwestern
Hawaiian Islands in 2004. An estimated 40 tons of marine debris washes up on
Hawaiian reefs and beaches each year according to the NOAA Coral Reef Ecosystem
Division in Honolulu (www.pifsc.noaa.gov/cred/). Of 87 coastal beaches reporting
information to the EPA, only 8% (7 beaches) were closed or under an advisory for any
period of time in 2002 (EPA 2004). The Hawaiian Islands are stressed by rapid human
population growth, increasing vulnerability to natural disasters, and degradation of natural
resources. Droughts and floods are among the climate extremes of most concern as
they affect the amount and quality of water supplies in island communities and thus can
affect health. Many islands already face chronic water shortages and problems with
waste disposal.
836
63. Insular Pacific Hawaiian LME
IV. Socioeconomic Conditions
The U.S. Census Bureau (http://factfinder.census.gov) estimated the population of Hawaii
at 1,285,498 in 2007. A diverse economy provides employment for 610,394 persons in
mining, utilities, construction, manufacturing, trade, transportation, information, finance
and insurance, real estate, professional scientific and technical services, administration,
waste management, education, health care, arts and recreation, food and other services.
The Bureau of Labor Statistics (www.bls.gov) estimates that 6,243 of the current labour
force works in farming, fishing, and forestry occupations. Tourism is the economic
mainstay of Hawaii. The Hawaii Tourism Report (1999) reported that the travel and
tourism industry produced an estimated $6.3 billion in 1998. The Hawaii State
Department of Business, Economic Development and Tourism (DBEDT) reported that
Hawaii received a total of 6,452,834 visitors in 2002 (www.hawaiitourismauthority.org).
The people of Hawaii have traditionally used the LME for fishing, aquaculture, trade and
transportation. US fishermen have a long history of fishing for Pacific highly migratory
species in Hawaii. For the economic contributions of fisheries in Hawaii, see Sharma et
al. 1999. Tourism, agriculture, fish processing, financial and other service industries all
depend on adequate water supplies. Coral reef ecosystems and fisheries have major
cultural and economic importance. Fisheries are partially artisanal and geared towards
subsistence while a portion is focused towards large pelagic species for profit.
Aquaculture is an important historical activity in the marine environment. The wide range
of temperature in the water allows the culture of a wide diversity of species all year:
tropical fish, trout, salmon, carp, milkfish, mullet, mahi mahi, shrimp, seaweed and
shellfish.
V. Governance
This LME is governed by the U.S. and by the State of Hawaii. The Western Pacific
Fishery Management Council manages fisheries in the State of Hawaii and in the
Territories of American Samoa and Guam, the Commonwealth of the Northern Mariana
Islands and US Pacific Islands possessions--an area of nearly 1.5 million square miles
(http://www.wpcouncil.org/). Coral reefs are managed under a plan implemented in 1983.
The Western Pacific Fisheries Coalition is a partnership between conservationists and
fishers to promote the protection and responsible use of marine resources through
education and advocacy. For information on the North Pacific Marine Science
Organization (PICES), which promotes and coordinates marine research in the northern
North Pacific and adjacent seas, see Chapter X - Northwest Pacific. Recent international
consultations with Japan, Korea, Russia and the US have begun, to establish new
mechanisms for the management of high seas bottom fisheries by vessels operating in
the North Western Pacific Ocean. A management concern is the problem of illegal,
unreported, and unregulated (IUU) fishing by vessels operating outside the control of
regional management regimes (NMFS 2009).
In 2000, President Clinton established the Northwestern Hawaiian Islands Coral Reef
Ecosystem Reserve. In 2006, President Bush designated the Papahnaumokukea
Marine National Monument, an area larger than all US national parks combined and the
second largest area in the world dedicated to the preservation of a unique coral reef area
(NMFS 2009). Pacific whales are protected under the International Whaling Commission
(IWC), which prohibits non-subsistence hunting by member nations
(http://www.iwcoffice.org). With increasing awareness that whales should not be
considered apart from their habitat, and that detrimental environmental changes may
threaten whale stocks, the IWC decided that the Scientific Committee should give priority
to research on the effects of environmental changes on cetaceans. The IWC has
adopted Resolutions encouraging the Scientific Committee to increase collaboration and
cooperation with governmental, regional and international organisations. Related
XIX Non Regional Seas LMEs
837
research will be carried out under the IWC's SOWER programme
(www.iwcoffice.org/other/site_map.htm). Humpback whales are classified as an
endangered species under the U.S. Endangered Species Act. A Hawaiian Islands
Humpback Whale National Marine Sanctuary was designated in 1992
(www.sanctuaries.nos.noaa.gov/oms/omshawaii/omshawaii.html). The Hawaiian Islands
National Marine Sanctuary Act aims to protect humpback whales and their habitat within
the sanctuary, educate the public, and manage human uses within the sanctuary.
References
Belkin, I.M. (1988) Main hydrological features of the Central South Pacific, in: Ecosystems of the
Subantarctic Zone of the Pacific Ocean, edited by M.E. Vinogradov and M.V. Flint, Nauka,
Moscow, 21-28 [Translated as "Pacific Subantarctic Ecosystems", pp.12-17, New Zealand
Translation Centre Ltd., Wellington, 1996].
Belkin, I.M. (1993) Frontal structure of the South Atlantic, in: Pelagic Ecosystems of the Southern
Ocean, edited by N.M. Voronina, Nauka, Moscow, 40-53.
Belkin, I.M. (1995) Remote sensing and in situ observations of subtropical fronts, in: Proceedings of
the COSPAR Colloquium "Space Remote Sensing of Subtropical Oceans", September 12-16,
1995, Taipei, Taiwan, 14B3-1÷14B3-5.
Belkin, I.M. (2008) Rapid warming of Large Marine Ecosystems, Progress in Oceanography, in
press.
Belkin, I.M., and A.L. Gordon (1996) Southern Ocean fronts from the Greenwich meridian to
Tasmania, J. Geophys. Res., 101(C2), 3675-3696.
Belkin, I.M., Z. Shan, and P. Cornil on (1998), Global survey of oceanic fronts from Pathfinder SST
and in-situ data, AGU 1998 Fall Meeting Abstracts, Eos, 79(45, Suppl.), F475.
Belkin, I.M., Cornillon, P.C., and Sherman, K. (2008). Fronts in Large Marine Ecosystems of the
world's oceans. Progress in Oceanography, in press.
Eldredge, L. G. and Carlton, J.T. (2002). Hawaiian marine bioinvasions: A preliminary assessment.
Pacific Science 56(2):211-212.
EPA (2001). National Coastal Condition Report. www.epa.gov/owow/oceans/nccr/chapters/
www.epa.gov/owow/oceans/coral/links.html.
EPA (2004). National Coastal Condition Report II. www.epa.gov/owow/oceans/nccr2/
Farewell, T.E. and Ostrowski, A.C. (2001). The Status and Future of Private Offshore Aquaculture
in Hawaii and the U.S. Islands. Conference: Aquaculture 2001, Lake Buena Vista, FL (U.S.),
21-25 January 2001. Book of Abstracts, World Aquaculture Society 218.
Hawaii Tourism Report (1999) World Travel Tourism Council. Report is available online from
http://www.enterprisehonolulu.com/html/pdf/WTTC HawaiiTourismReport99.pdf.
Hutchins, P.A., Hilliard, R.W. and Coles, S.L. (2002). Species introductions and potential for marine
pest invasions into tropical marine communities, with special reference to the Indo-Pacific.
Pacific Science 56(2):223-233.
Jameson, S.C., Erdmann, M.V., Gibson, G.R. Jr. and Potts, K.W. (1998). Development of biological
criteria for Coral Reef ecosystem assessment for the U.S Environmental Protection Agency.
www.epa.gov/owow/oceans/coral/
Kitchingman, A., S. Lai (2004).Inferences on potential seamount locations from mid-resolution
bathymetric data. . p. 7-12 In: T. Morato and D. Pauly (eds.) Seamounts: Biodiversity and
fisheries. Fisheries Centre Research Reports 12(5).
Kitchingman, A., Lai, S., Morato, T. and D. Pauly (2007). How many seamounts are there and
where are they located? Chapter 2, p. 26-40 In: T.J. Pitcher, T. Morato, P. Hart, M. Clark, N.
Haggan and R. Santo (eds.), Seamounts: Ecology Fisheries and Conservation. Blackwell Fish
and Aquatic Resources Series. 12, Oxford, U.K.
Miao, X-S., Woodward, L.A., Swenson, C. and Qing X.L. (2001) Comparative concentrations of
metals in marine species from French Frigate Shoals, North Pacific Ocean. Marine Pollution
Bulletin 42(11): 1049-1054.
Morgan, J. (1989). Large Marine Ecosystems in the Pacific Ocean, p 377-394 in: Sherman, K.,
Alexander, L.M. Gold, B.D. (eds), Biomass Yields and Geography of Large Marine Ecosystems.
AAAS Selected Symposium 111. Westview Press, Boulder, CO, U.S.
838
63. Insular Pacific Hawaiian LME
NMFS (2009). Our living oceans. Draft report on the status of U.S. living marine resources, 6th
edition. U.S. Dep. Commer., NOAA Tech. Memo. NMFS-F/SPO-80. 353 p.
NOAA (1999). Our Living Oceans - Report on the Status of U.S. Living Marine Resources. U.S.
Department of Commerce, Washington D.C., U.S.
NOAA Coral Reef Ecosystem Division, Pacific Islands Fisheries Science Center (PIFSC) in
Honolulu, Hawaii (www.pifsc.noaa.gov/cred/)
NOAA Pacific Islands Fisheries Science Center. www.pifsc.noaa.gov
Pacific Fisheries Environmental Laboratory (PFEL). www.sfeg.noaa.gov
Pauly, D. and Christensen, V. (1995). Primary production required to sustain global fisheries.
Nature 374: 255-257.
Pauly, D. and Watson, R. (2005). Background and interpretation of the `Marine Trophic Index' as a
measure of biodiversity. Philosophical Transactions of the Royal Society: Biological Sciences
360: 415-423.
Pauly, D., Christensen, V., Dalsgaard, J., Froese R. and Torres, F.C. Jr. (1998). Fishing down
marine food webs. Science 279: 860-863.
Polovina, J.J. and Haight, W.R. (1999). Climate variation, ecosystem dynamics, and fisheries
management in the Northwestern Hawaiian Islands, p 23-32 in: Ecosystem Approaches for
Fisheries Management. Alaska College Sea Grant Publication AK-SG-99-01.
Sea Around Us (2007). A Global Database on Marine Fisheries and Ecosystems. Fisheries Centre,
University British Columbia, Vancouver, Canada. www.seaaroundus.org/lme/SummaryInfo
.aspx?LME=10
Sharma, K.R., Peterson, A., Pooley, S.G., Nakamoto, S.T. and Leung, P.S. (1999). Economic
contributions of Hawaii's fisheries. SOEST 99-08, JIMAR Contribution 99-327.
University of Hawaii. www.hawaii.edu/HIMB/HawaiiCoralDisease/.
Ocean Atlas of Hawaii at http://radlab.soest.hawaii.edu/atlas/left.htm
US Census Bureau. http://factfinder.census.gov
US National Assessment of Climate Change Overview of Islands in the Caribbean and the Pacific
(2000). Climate Change Impacts on the United States: The Potential Consequences of
Climate Variability and Change. Overview: Islands in the Caribbean and the Pacific, online at
www.usgcrp.gov/usgcrp/Library/ national assessment/ overviewis
Zeller, D., Booth, S. and Pauly, D. (2005). Reconstruction of coral reef and bottom fisheries catches
for U.S. Flag Islands in the Western Pacific, 1950-2002. Western Pacific Regional Fishery
Management Council, Honolulu, 113 p.
Zeller, D. M. Darcy, S. Booth, M.K. Lowe and S. Martell. (2007). What about recreational catch?
Potential impact on stock assessment for Hawaii's bottomfish fisheries. Fisheries Research.
91: 88-99.
Zeller, D. and Y. Rizzo. 2007. County disaggregation of the former Soviet Union (URSS) p. 157-
163 In: D. Zeller, D. and D. Pauly (eds.). Reconstruction of Marine Fisheries Catches for Key
Countries and Regions (1950-2005). Fisheries Centre Research Reports, 15(2).
XIX Non Regional Seas LMEs
839
XIX-64 Southwest Australian Shelf LME
T. Irvine, J. Keesing, N. D'Adamo, M.C. Aquarone and S. Adams.
The Southwest Australian Shelf LME extends from the estuary of the Murray-Darling
River to near the city of Perth on Western Australia's coast (~32°S). It borders both the
Indian and Southern Oceans and has a narrow continental shelf until it widens in the
Great Australian Bight. The LME covers an area of about 1.05 million km2, of which
2.23% is protected, with 0.03% and 0.18% of the world's coral reefs and sea mounts,
respectively, as well as 10 major estuaries (Sea Around Us, 2007). This is an area of
generally high energy coast exposed to heavy wave action driven by the West Wind Belt
and heavy swell generated in the Southern Ocean. However, there are a few relatively
well protected areas, such as around Albany, the Recherche Archipelago off Esperance,
and the Cape Leeuwin / Cape Naturaliste region, with the physical protection facilitating
relatively high marine biodiversity. Climatically, the LME is generally characterised by its
temperate climate, with rainfall relatively high in the west and low in the east. However,
rainfall is decreasing and Western Australia is getting warmer, with a 1°C rise in Australia
predicted by 2030 (CSIRO, 2007) and an increase in the number of dry days also
predicted. The overall environmental quality of the waters and sediments of the region is
excellent (Environmental Protection Authority, 2007).
The LME is generally low in nutrients, due to the seasonal winter pressure of the tail of
the tropical Leeuwin Current and limited terrestrial runoff (Fletcher and Head, 2006).
However, the continental slope of this region comprises some of Australia's most
complex networks of submarine canyons and some of the largest areas of abyssal plains
within Australia's Exclusive Economic Zone, and thus contains some of the most
extensive deepwater benthic environments (Commonwealth of Australia, 2007).
Pattiaratchi (2006) identified six such regions that at localised scales, and set against a
regionally oligotrophic background, can produce areas of high productivity. The coastal
environments include spectacular granite reefs, long pristine sandy beaches,
embayments, sponge gardens and communities of filter feeders in deeper waters of the
shelf.
There have been few ecological studies to describe the marine flora and fauna over the
shelf with any great detail. Some notable exceptions include significant research
undertaken to characterise the fish habitats of the Recherche Archipelago (Kendrick et
al., 2005), marine biological workshops resulting in publication of a number of papers on
the taxonomy, ecology and physiology of local marine flora and fauna (eg Wells et al.
1991, 2005), marine protected area (MPA) planning studies for State MPAs (see
www.dec.wa.gov.au and Department of Environment and Conservation, 2006) and
Federal bioregional marine planning studies (see Commonwealth of Australia, 2007).
The LME contains areas of extensive seagrass beds, dominated by genus Posidonia,
with seagrass found as deep as 45m and diverse kelp habitats dominated by the
relatively small Ecklonia radiata rather than larger kelps expected in these latitudes
where waters are typically colder and have higher nutrients (CALM, 1994). In addition,
the area is of global significance as breeding or feeding grounds for a number of
threatened marine animals, including Australian sea lions, southern right whales and
white sharks (Commonwealth of Australia, 2007). Furthermore, islands off the coast are
home to colonies of New Zealand fur seals, penguins and other seabirds, all dependent
on the sea for survival.
840
64. Southwest Australia LME
Some northern species of tropical origin have distributional ranges within this LME due to
the influence of the Leeuwin Current. Five tropical coral species extend their distribution
into this area (specifically at King George Sound and the Recherche Archipelago) and
there are four species endemic to southern coast of Australia (Veron and Marsh, 1988;
CALM, 1994). To date, the range of ecological research undertaken in the region reveals
a significant number of southwest endemic species. For example, in the Great Australian
Bight, one of the world's most diverse soft sediment ecosystems, approximately 85% of
fish species, 95% of molluscs and 90% of echinoderms are thought to be endemic
(Commonwealth of Australia, 2007). The near shore and archipelago regions are
characterised by areas of relatively highly marine biodiversity, many of which have been
selected as worthy of representation in national and State-based marine conservation
reserve networks, as described in Commonwealth of Australia (2006) and CALM (1994),
respectively. Some of these areas are currently undergoing assessment for statutory
MPA reservation, such as the proposed Geographe Bay/Leeuwin-Naturaliste/Hardy Inlet
Marine Park and Walpole/Nornalup Inlet Marine Park (see www.dec.wa.gov.au) and
many others are embedded in Western Australia's aspirational frameworks for a
Statewide system of MPAs, such as the Recherche Archipelago (CALM, 1994).
Reports which provide good general reference material pertaining to the ecology and
environmental status of this LME include CALM (1994), UNEP (2003), Commonwealth of
Australia (2006), Department of Environment and Conservation (2006), Department of
the Environment and Water Resources (2007) and Environmental Protection Authority
(2007).
I. Productivity
The Southwest Australian Shelf LME is considered a Class III, low productivity
ecosystem (<150 gCm-2yr-1). With the Leeuwin Current extending into this southwest
region, it carries nutrient poor water and generally suppresses upwelling (see the West-
Central Australian Shelf LME review for more information). However, there are deep
chlorophyll maxima peaking in late autumn/early winter, in phase with the seasonal
strengthening of the Leeuwin Current, and the formation of eddies which can generate
large productivity pulses (Koslow et al., 2006; Feng et al., 2007). In addition, counter
currents close to coast do allow for upwelling increasing nutrients in a localised sense. In
turn, primary productivity is increased when these counter currents are active in spring
and summer.
Overall, the LME's waters are oligotrophic and characterised by broad-scale inhibition of
upwelling due to the presence of the Leeuwin Current. However, as Pattiaratchi (2007)
describes, at localised scales and set against a regionally oligotrophic background, sub-
regional effects due to the surface and sub-surface current systems, strong coastal
winds, and a combination of topographic features (eg headlands, islands, submarine
canyons) can produce areas of relatively high productivity. Pattiaratchi (2007) highlighted
six such features: the Perth Canyon; the Albany Canyon group (including the Leeuwin
Canyon); the Kangaroo Island canyons and adjacent shelf break; the Kangaroo Island
`Pool'; the predictable large scale eddy field emanating from the main neck of the
Leeuwin Current; and Cape Mentelle upwelling. Pattiaratchi (2007) describes these
regions as being characterised by high productivity which attracts intense feeding
aggregations of large animals such as deep diving mammals, dolphins, seals and sea
lions, large predatory fish and seabirds. Some of these areas are also important as
pupping zones for school sharks. The areas associated with large eddies are thought to
be important for "uplifting" deep ocean water, which is cooler and richer in nutrients,
towards the surface where it can embrace the production of plankton communities, which
in turn attract larger marine life in an extended food chain.
XIX Non Regional Seas LMEs
841
This LME is a haven to a wide diversity of fish and marine species including scallop,
shrimp, trevally, humpback whale, sea lion, penguin and dolphin. Zonation is evidenced
by shallow-water reef fish. Three ecological barriers appear to inhibit dispersal: a sharp
temperature gradient around Albany near the seasonal cessation of the Leeuwin Current,
and two interruptions in the nearshore rocky reef area: in the centre of the Great
Australian Bight, and at the mouth of the Murray River. There are numerous rivers and
estuaries fed by winter flowing rivers, however the number of rivers and estuaries
decreases towards the east of the LME, as the coastline becomes more arid, with limited
runoff from rainfall combining with the effect of the Leeuwin Current to limit the nutrients
available and hence the productivity of the waters. The waters within this LME are
generally clear with low turbidity levels. As a result, light penetrates to greater depths
allowing a number of light-dependent species and associated communities to be found in
waters deeper than those in which they live in other parts of Australia. For instance,
macro-algae and seagrass can be found at depths of up to 120m (Commonwealth of
Australia, 2007). The indication from recent and current research programs within the
LME is that there is much yet to discover in respect to marine biodiversity in the area. For
example, when marine biologists recently surveyed the Recherche Archipelago, some
300-400 species of sponges were collected, of which nearly half were new to science and
six new fish species were recorded. Islands off the coast in the Recherche Archipelago
area are home to colonies of New Zealand fur seals, Australian sea lions, penguins and
other seabirds, all dependent on the sea for survival (http://rmp.naturebase.net/south-
coast).
For a general understanding of oceanographic processes affecting nutrient dynamics and
the productivity of Australian marine ecosystems, see the Western Australian
government's State of the Environment Reports. For more information on productivity, an
associated general marine biodiversity, hydrodynamic characteristics and environmental
health of the region see, http://rmp.naturebase.net/south-coast (general regional marine
planning studies); Department of Environment and Conservation (2006) and
www.dec.wa.gov.au (general MPA studies); Australian Fisheries and Research
Development Corporation Project 2001/060 (led by Dr Gary Kendrick, University of
Western Australia); CALM (1994); Furnas (1995); D'Adamo and Mamaev (1999); UNEP
(2003); Commonwealth of Australia (2006); Goldberg et al. (2006); Pattiaratchi (2006,
2007); Department of the Environment and Water Resources (2007); Environmental
Protection Authority (2007) and Sea Around Us (2007).
Oceanic fronts (Belkin et al. 2008)(Figure XIX-64.1): The warm and saline Leeuwin
Current (originated within the West-Central Australian Shelf LME) rounds Cape Leeuwin
to enter the Great Australian Bight. After rounding Cape Leeuwin, the Leeuwin Current
generally flows along the outer continental shelf in its passage eastwards, at least as far
as Cape Pasley near 124°E, when it tends to move offshore again because of the distinct
northwards kink in the coastline. As on the west coast, large meanders can carry the
warm water over 100 kilometres offshore. The Leeuwin Current and the associated TS-
front (Leeuwin Current Extension Front, LCEF) continue eastward generally along the
shelf edge all the way up to Spencer Gulf. An estuarine front exists across the entrance
to Spencer Gulf (SGF). Two inner shelf/near-coastal fronts are observed in the western
and eastern parts of the Great Australian Bight (WGABF and EGABF) (Belkin et al.
2008).
A series of counter currents exist, moving westward below the Leeuwin Current or
existing at times when the Leeuwin Current flow is weakened (spring/summer). The
Flinders Current, a westward slope current, exists at depths of 400m or more and is the
dominant feature along the southern coast of Australia extending from Tasmania to Cape
Leeuwin. It is the only northern boundary current in the Southern Hemisphere. The
Flinders Current is driven largely by persistent, deep equator-ward transport across the


842
64. Southwest Australia LME
Southern Ocean that is turned west due to vorticity constraints. It can result in favourable
conditions for upwelling as it flows past the mouths of the Murray Canyons (Arthur, 2006).
The Cresswell Current (Pattiratchi, 2006) is a seasonal coastal wind-driven counter-
current in the south of Western Australia, just east of the Capes areas, occurring in the
summertime.
Figure XIX-64.1. Fronts of the Southwest Australian Shelf LME. LCEF, Leeuwin Current Extension
Front; LCF, Leeuwin Current Front; EGABF, East Great Australian Bight Front; SGF, Spencer Gulf
Front; WGABF, West Great Australian Bight Front. Yellow line, LME boundary. After Belkin et al. (2008).
Southwest Australian Shelf LME SST (Belkin 2008)(Figure XIX-64.2):
Linear SST trend since 1957: 0.42°C.
Linear SST trend since 1982: 0.09°C
The moderate, steady warming of the Southwest Australian Shelf was punctuated by
several events. The most conspicuous warm events occurred in 1961-63, 1976, 198385,
and 2000. Three cold events peaked in 1960, 1968, and 1986-87. Most events correlate
with similar episodes south and north of Australia. The 2000 warm event can be
tentatively linked to a similar event of 1999-2001 in the Southeast Australian Shelf LME.
Figure XIX-64.2. Southwest Australian Shelf LME annual mean SST (left) and SST anomaly (right), 1957-
2006, based on Hadley climatology. After Belkin (2008).
XIX Non Regional Seas LMEs
843
These two LMEs are the only two areas where the El Nińo 1997-98 manifested much
later than elsewhere. The two-year delay can be explained by the dampened influence of
the Southern Ocean. The warm event of 1983-85 occurred simultaneously in the West-
Central Australian Shelf LME. The observed synchronism between West-Central,
Southwest, and Southeast Australian Shelf LMEs can be explained by the existence of
the Leeuwin Current that carries warm tropical waters from the Southeast Indian Ocean
around Cape Leeuwin into the Great Australian Bight and eventually toward Tasmania
and into Bass Strait (Ridgway and Condie, 2004).
Southwest Australian Shelf LME Chlorophyll and Primary Productivity
The Southwest Australian Shelf LME is considered a Class III, low productivity
ecosystem (<150 gCm-2yr-1)(Figure XIX-64.3).
Figure XIX-64.3. Southwest Australian Shelf LME trends in chlorophyll a (left) and primary productivity
(right), 1998-2006, from satellite ocean colour imagery. Values are colour coded to the right hand
ordinate. Figure courtesy of J. O'Reilly and K. Hyde. Sources discussed p. 15 this volume.
II. Fish and Fisheries
Australian waters are relatively nutrient-poor and although not productive by world
standards, there are numerous commercial and recreational fisheries based in the waters
of this LME. Production is limited by low levels of nutrient-rich upwellings. Fish stocks are
predominantly temperate, with most species distributions extending the length of the
LME. Many species are endemic to Australia. Under the Australian Constitution,
jurisdiction over Australia's fisheries resources is a complex mix of Australian
Government and State or territory government responsibilities. Relevant legislation has
established the Australian Fisheries Management Authority (AFMA) as the Australian
Government statutory body empowered to manage fisheries. Within this LME there are
Western Australian and South Australian State managed fisheries, and Commonwealth
managed commercial fisheries. For details relating to Western Australia see Fletcher and
Head (2006), for South Australia see Primary Industries and Resources South Australia
(2007) and for Commonwealth fisheries see Larcombe and McLoughlin (2007).
Major Western Australian State commercial fisheries in this region are abalone, purse
seine fishery targeting pilchards and other small pelagics, and demersal gillnet fishery for
sharks. Other smaller fisheries are beach seine fishery for Australian salmon and herring,
a trap fishery targeting southern rock lobster and deep water crabs and the intermittent
scallop fishery in the Recherche Archipelago (Fletcher and Head, 2006). The South
Australian Government has responsibility for four fisheries, these are the Northern Zone
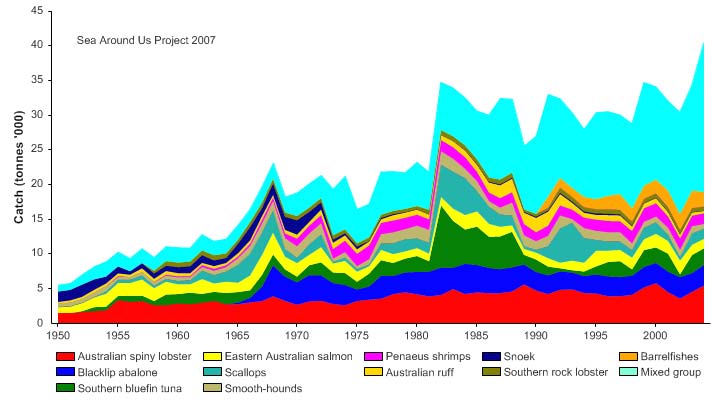
844
64. Southwest Australia LME
Rock Lobster, the Giant Crab, the Sardine and the Marine Scalefish fisheries. In 2004/05,
the four fisheries' combined catch was over 43000 tonnes of fish, worth around US$55
million. The most important of South Australian-managed fisheries by value was the
Sardine Fishery with a catch value of over US$27 million and landings of over 39000
tonnes (Commonwealth of Australia, 2007). South coast commercial fishing vessels
operators often hold a number of licences to create a viable year round operation.
Commonwealth managed fisheries in the area are the Southern Bluefin Tuna Fishery,
Western Tuna and Billfish Fishery, Southern and Eastern Scalefish and Shark Fishery
(SESSF), Western Australian Southern Demersal Gillnet and Longline Fishery and
Western Skipjack Fishery (see Larcombe and McLoughlin, 2007). The total global catch
of Southern Bluefin Tuna in 2005 was 21686 tonnes, of which Australia's share was 5244
tonnes, worth A$140 million (Larcombe and McLoughlin, 2007). The Southern Bluefin
Tuna Fishery is an international fishery and listed as globally overfished. It has been
managed since 1994 through the Commission for the Conservation of the Southern
Bluefin Tuna (CCSBT), which is advised by a scientific committee of member-country
scientists and independent international scientists. The Australian Government is party to
a number of international conventions or agreements for the management of highly
migratory tunas and billfishes that range far beyond the Australian Fishing Zone see
Larcombe and McLoughlin (2007). Responsibility for management of these stocks is
shared by multiple governments through Regional Fisheries Management Organisations.
As much of the coast is remote or difficult to access, recreational boat and beach fishing
is concentrated around main population and holiday centres. The major target species for
such fishing are salmon, herring, whiting, trevally, pink snapper, queen snapper, Bight
redfish, shark, samson fish and King George whiting (Fletcher and Head, 2006) The
predominant aquaculture activity undertaken in the area is the production of mussels and
oysters from Oyster Harbour at Albany. Other forms of aquaculture (e.g. sea cage
farming) are restricted on the south coast by the high-energy environment and the very
limited availability of protected deep waters typically required by this sector (Fletcher and
Head, 2006)
Figure XIX-64.4. Total reported landings in the Southwest Australian Shelf LME by species (Sea Around
Us 2007).
The total of reported landings in the LME is still growing with 40,000 tonnes recorded in
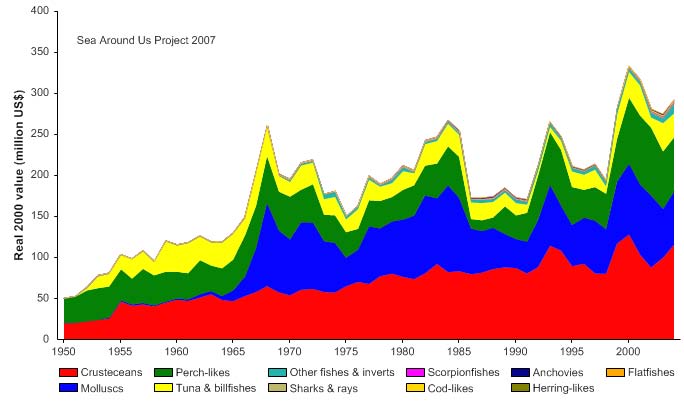
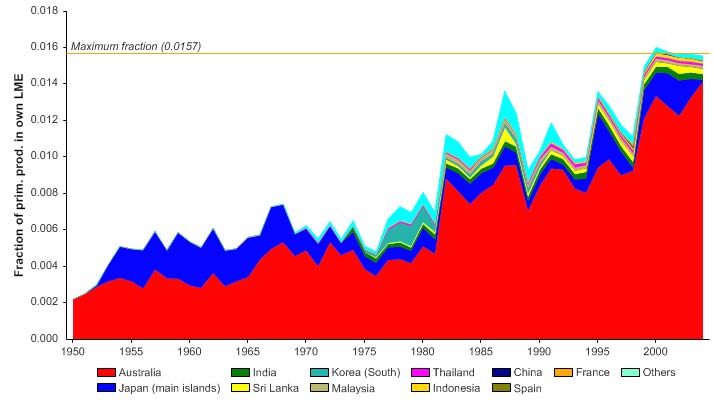
XIX Non Regional Seas LMEs
845
2004 (Figure XIX-64.4). However, there is, presumably, a significant fish bycatch from the
shrimp fishery which is not included in the reported landings. The reported landings were
valued at US$ 333 million in 2000, due to the high value commanded by spiny lobsters
(crustaceans) and abalone (molluscs), and US$ 292 million in 2004 (Figure XIX-64.5).
Figure XIX-64.5. Value of reported landings in the Southwest Australian Shelf LME by commercial
groups (Sea Around Us 2007).
The primary production required (PPR; Pauly and Christensen 1995) to sustain the
reported landings in this LME has been increasing but is still below 2% of the observed
primary production (Figure XIX-64.6). Australia accounts for the majority of the ecological
footprint in this LME.
Figure XIX-64.6. Primary production required to support reported landings (i.e., ecological footprint) as
fraction of the observed primary production in the Southwest Australian Shelf LME (Sea Around Us
2007). The `Maximum fraction' denotes the mean of the 5 highest values.
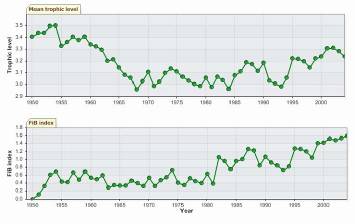
846
64. Southwest Australia LME
During the 1950s and the 1960s, the mean trophic level of the reported landings (MTI,
Pauly and Watson 2005) declined steadily (Figure XIX-64.7 top), indicating a `fishing
down' of the food web in the LME during this period (Pauly et al., 1998). The subsequent
increase of the mean trophic level, as well as the FiB index (Figure XIX-64.7 bottom),
imply a possible geographic expansion of the fisheries (Figure XIX-64.6.)
Figure XIX-64.7. Mean trophic level (i.e., Marine Trophic Index) (top) and Fishing-in-Balance Index
(bottom) in the Southwest Australian Shelf LME (Sea Around Us 2007).
Until recently, fisheries resources were usually managed in separate fishery units. Under
the Environment Protection and Biodiversity Conservation Act 1999 (the EPBC Act), the
Commonwealth Government has a framework that helps it to respond effectively to
current and emerging environmental problems, and to ensure that any harvesting of
marine species is managed for ecological sustainability. All fisheries in the area are
subject to management plans which embrace the principles of Ecosystem Based Fishery
Management (EBFM) as opposed to single target species management approaches
(Smith et al., 2007). State commercial fisheries are managed primarily through input
controls such as limited entry, catch numbers, size limits and seasonal closures, and
stock assessments are undertaken to assess breeding stock levels and exploitation
status undertaken for most fisheries. Management includes assessment of bycatch
species impacts, protected species interactions, food chain effects and habitat effects
(Fletcher and Head, 2006).
The Stock-Catch Status Plots indicate that about 30% of commercially exploited stocks in
the LME have collapsed and another 30% are overexploited (Figure XIX-64.8, top).
About half of the reported landings appear to be supplied by fully exploited stocks (Figure
XIX-64.8 bottom). However, the editors and Australian contributors wish to acknowledge
and advise caution that there are several reasons possible for the apparently reduced
status of some species. Among them, Australian management authorities have in many
cases limited catches and effort to protect the species from overfishing. Landings of
these stocks are therefore lowered, giving the appearance of an overfished condition
status in Figure 8. In addition, productivity of some of these fisheries is tightly coupled to
environmental variability, in particular ENSO, and this also reduces catches in some
years in ways not due to exploitation rate. Catches of all species are subject to annual
active management intervention and often include temporally and spatially explicit
adaptive management measures to prevent overfishing.
XIX Non Regional Seas LMEs
847
1950
1960
1970
1980
1990
2000
0%
100
10%
90
20%
)
80
%
(
s
30%
u
70
at
st
40%
y
60
b
50%
cks
o
50
f
st
60%
o
40
er
70%
mb
30
u
N
80%
20
90%
10
100%0
1950
1960
1970
1980
1990
2000
(n = 1794)
developing
fully exploited
over-exploited
collapsed
0%
100
10%
90
20%
80
)
%
30%
(
70
s
u
at
40%
60
k st
c
50%
o
50
st
y
60%
b
h
40
t
c
a
70%
C
30
80%
20
90%
10
100%0
1950
1960
1970
1980
1990
2000
(n = 1794)
developing
fully exploited
over-exploited
collapsed
Figure XIX-64.8. Stock-Catch Status Plots for the Southwest Australian Shelf LME, showing the
proportion of developing (green), fully exploited (yellow), overexploited (orange) and collapsed (purple)
fisheries by number of stocks (top) and by catch biomass (bottom) from 1950 to 2004. Note that (n), the
number of `stocks', i.e., individual landings time series, only include taxonomic entities at species,
genus or family level, i.e., higher and pooled groups have been excluded (see Pauly et al, this vol. for
definitions).
The FAO provides additional information on Australia's fisheries and the characteristics of
the industry (www.fao.org).
III. Pollution and Ecosystem Health
The SW Australian Shelf LME is sparsely populated except for the areas of the cities of
Perth in Western Australia and Adelaide in South Australia. Thus, the inshore marine
habitats of the coast are largely unaffected by human activities, the exceptions being
some estuaries and marine embayments (e.g. Princess Royal Harbour, Oyster Harbour
and Wilson Inlet) where significant eutrophication associated with nutrient inputs from
landbased activities has occurred (Fletcher and Head, 2006). The most visible result of
such nutrient enrichment is the seagrass loss or degradation in South Australia
(Shepherd et al., 1989). In addition, increased nutrient loads to coastal waters have also
been directly implicated in the increased frequency of algal blooms, particularly 'Red
Tides', and more recently, in the loss of mangroves (Connolly, 1986; Edyvane, 1991). Of
the limited environmental threats that exist for this LME as a whole, of particular concern
is an increase in shipping-related releases of ballast water, which has been shown to
contain harmful bacteria, viruses and algae as well as non-indigenous plankton, and the
larval forms of many invertebrates and fish. Other concerns in this LME are ocean
dumping, marine debris, new exploration for offshore oil and the risk of oil spills from
resulting production. There is also is the potential for environmental impacts caused by
tourism and by the provision of infrastructure to support tourism (airports, power
generation facilities, accommodation, sewage treatment and disposal facilities, moorings,
and marine transport).
848
64. Southwest Australia LME
In respect to the area surrounding Adelaide, including the Spencer Gulf, pollution derives
from mining, manufacturing, petroleum, chemical, agricultural, food processing, gas and
power, and sewerage waste water industries. The main discharges are chemical from the
industrial plants at the northern end of Spencer Gulf, at the various sewerage outfalls and
saline discharges from salt and chemical works at Dry Creek and Osborne (Port
Adelaide) (Zann, 1995). In general, the levels of heavy metals in seawater appear
relatively low and the levels of contamination of aquatic species are considered within
defined limits (Zann, 1995). To name only one of the many local South Australia ongoing
water quality improvements, the EPA is currently negotiating with industry in the Northern
Spencer Gulf area to curb the discharges of heavy metals into the Gulf.
The condition of WA's coastal and shelf waters, including this southwest region, has
historically been poorly monitored, with the exception of certain highly pressured areas,
such as Albany harbours (Environmental Protection Authority, 2007). Relevant reports
are available through the Western Australian Department of Conservation and
Environment (www.dec.wa.gov.au) and the Environmental Protection Agency
(www.epa.wa.gov.au). Western Australia's overall marine and coastal monitoring
framework is undergoing a significant expansion as part of the State's marine protected
area (MPA) implementation and management programs, as discussed in Section V.
The State of the Environment Report for Western Australia 2007 (Environmental
Protection Authority, 2007) lists two fundamental pressures of high concern and "likely to
deteriorate": first, rainfall is decreasing in the south-west with severe implications as
ocean levels are rising and all of Western Australia is getting warmer; and second,
population and consumption are of concern. It is noted that Western Australians have
among the largest ecological footprints in the world.
With respect to benthic disturbance by fishing, methods which can impact on marine
habitats such as trawling are naturally restricted due to the relatively low productivity and
abundance of species capable of trawl capture. A small, limited-entry scallop trawl fishery
focused in the Esperance region is the only state-managed fishing activity which can
have any significant physical interaction with the marine habitat (Fletcher and Head,
2006). Trawling in deep waters off the edge of the continental shelf is managed by the
Commonwealth Government. This area, particularly the western part of the Great
Australian Bight, was subject to significant exploratory trawling by locally based and
international vessels prior to the 1980s, but is only sporadically fished now. There is a
coastal trawling closure of state waters along the western Bight sector, enacted under
Commonwealth Government fisheries legislation, to ensure deep-sea trawlers do not
venture into sensitive coastal areas (Larcombe and McLoughlin, 2007). For more
information on pollution and ecosystem health, see Pogonoski et al. (2002) and for
marine disturbances and coastal pollution see www.ea.gov.au.
IV. Socioeconomic Conditions
Most of South Australia's population of 1.4 million is situated on the coast, with major
towns and cities concentrated on the Fleurieu Peninsula (including Adelaide) and
northern Spencer Gulf (Whyalla, Port Pirie, Port Augusta). The coastal fringe of the Great
Australian Bight from Ceduna to Esperance has a low population density, and few towns
with more than 200 persons listed in the 2001 census. The South Australian portion of
the region is characterised by substantially older median ages and high elderly
dependency, and is more dependent on agriculture, fisheries and forestry industries with
lower employment diversification outside regional centres (http://adl.brs.gov.au). The
Australian Government reports that major marine industries associated in the area
include commercial fishing, marine-based tourism, shipping, oil and gas exploration, boat
and ship-building, defence activities and aquaculture (Department of the Environment
XIX Non Regional Seas LMEs
849
and Water Resources, 2007). Marine based tourism is not well developed in the area,
and focuses on diving and fishing; there is however scope for future development. There
is no current oil and gas production in the region, but exploration has identified two
frontier basins with petroleum potential - the Naturaliste Plateau and Bight Basin.
Commercial fishing employment, including aquaculture, is largely concentrated across
most of the Eyre Peninsula where almost all coastal towns have strong linkages to
commercial fishing activities. For example, Port Lincoln has the largest number and
proportion of people employed within the fishing sector of any coastal town in Australia
(Bureau of Rural Sciences, 2006). In 2003, fishers active within Australian Government-
managed fisheries in the LME caught around US$135 million worth of fish. In the WA and
SA State-managed fisheries, rock lobster, abalone, scallop, shark, King George Whiting
and prawn mostly caught in State waters, have a gross value of production nearing $385
million a year. More than 3,600 people are directly employed by the fishing industry in the
area with a further 800 employed in the aquaculture sector. Of increasing economic
importance is the developing mariculture industry which is primarily based in the coastal
inlets and bays of Eyre Peninsula. Recreational fishing is particularly important in regional
and local economies, especially in the towns on the far-west coast and on Yorke and
Eyre Peninsulas. Recreational fishers are increasingly moving further offshore to target a
range of deep-sea species. Despite the vastness of the South Australian coastline,
human activities tend to be concentrated near centers of population and here most
conflict or competition occurs. The region is becoming of increasing interest for general
coastal and marine tourism and associated water based recreational activities, and this
trend is likely to continue as the region continues to receive greater focus for its
ecological values through marine conservation under State and Commonwealth
instruments.
V. Governance
For a fuller overview of the history, current status and underpinning principles of
respective Commonwealth and Western Australia marine biodiversity conservation
frameworks refer to the West-Central Australian Shelf LME section (this series).
Australia has a federal system of government with the States forming the Australian
Commonwealth federation. The LME is bordered by the States of South Australia and
Western Australia. The States are responsible for the marine environment for the first
three nautical miles from the shore. Australia declared a 200 nautical-mile EEZ in 1978.
Refer to the West-Central LME section for more details of the Commonwealth and State
zones and responsibilities. The Australian State and Commonwealth governments
identified a need to protect representative examples of the full range of marine
ecosystems and habitats in marine protected areas. A spatial framework was
established, the Integrated Marine and Coastal Regionalisation of Australia (IMCRA), for
classifying Australia's marine environment into bioregions that make sense ecologically
and are at a scale useful for regional planning (Commonwealth of Australia, 2006). The
Southwest Australian Shelf LME encompasses 8 IMCRA meso-scale bioregions. The
Commonwealth's IMCRA framework provides a platform for the development of a
National Representative System of Marine Protected Areas (NRSMPA), which is a
comprehensive, adequate and representative system of marine protected areas that will
contribute to the long-term ecological viability of marine and estuarine systems, maintain
ecological processes and systems and protect Australia's biological diversity at all levels.
The establishment of the Commonwealth's MPA network is being progressed as part of
the marine bioregional planning process being conducted by the Department of the
Environment, Water, Heritage and the Arts under the Environment Protection and
Biodiversity Conservation Act 1999. IMCRA bioregions are pooled to form Marine
850
64. Southwest Australia LME
Bioregional Planning Regions (www.environment.gov.au/coasts/mbp). These bioregions
are large areas of ocean, considered to be ecologically similar, compared to other
similarly sized areas. See the West-Central Australian Shelf LME section for more
information on the bioregionalisation schemes developed in Australia and how these
provide a framework for a representative system of marine reserves. The
Commonwealth's South-west Marine Bioregion comprises 7 provincial bioregions, 5 of
which fall into this LME. A Bioregional Profile identifying the important ecological,
conservation and socio-economic values of the region for this region has been released
(Commonwealth of Australia, 2007). Within this LME, the Western Australian and South
Australian State-based marine conservation reserve frameworks are being progressed so
as to be aligned and consistent with the federal framework.
Australian fisheries resources are managed under both Commonwealth and
State/Territory legislation. The jurisdiction and responsibilities among these various
governments has been agreed to under the Offshore Constitutional Settlement (OCS).
Under OCS, the states and territories have jurisdiction over localised, inshore fisheries.
The Commonwealth has jurisdiction over offshore fisheries, transboundary fisheries
(extending to waters adjacent to more than one state or territory) and foreign fisheries.
Each government has separate fisheries legislation and different objectives. An important
goal is to ensure that the exploitation of fisheries resources is conducted in a manner
consistent with the principles of ecologically sustainable development. This includes the
need to assess the impact of fishing activities on non-target species and the long-term
sustainability of the marine environment. For more information on the governance of
Australia's fisheries, see the FAO website.
Coastal development proposals are presently regulated under various State and local
Government planning legislation. In South Australia, coastal development is regulated by
the Planning Commission and overseen by the Coast Protection Board; however coastal
management is often uncoordinated, fragmented and prone to jurisdictional and
administrative overlap. Human activities such as mining, fishing, shipping, or tourism,
which may detrimentally affect marine or coastal habitats, are generally regulated through
conditions on the permits or licenses issued under the respective controlling
legislation.The marine tourism industry has produced a code of conduct that covers
issues such as anchoring, dropping of rubbish, fish feeding and preservation of world
heritage values.
References
Arthur, W.C. (2006) The Flinders Current and Upwelling in Submarine Canyons. Masters Thesis.
University of NSW, Australia. 118 pp.
Belkin, I.M. (2008) Rapid warming of Large Marine Ecosystems, Progress in Oceanography, in
press.
Belkin, I.M., Cornillon, P. and Sherman, K. (2008). Fronts in Large Marine Ecosystems of the
world's oceans. Progress in Oceanography, in press.
Bureau of Rural Sciences (2006) South Western Marine Region Social Profile. National Atlas of
Marine Fisheries and Coastal Communities. Available at http://adl.brs.gov.au/mapserv/fishcoast
/south_western_region.html
CALM (1994) A Representative Marine Reserve System for Western Australia. Report of the
Marine Parks and Reserves Selection Working Group. Department of Conservation and Land
Management (CALM) Perth, Western Australia.
Commonwealth of Australia (2006) A Guide to the Integrated Marine and Coastal Regionalisation
of Australia Version 4.0. Department of the Environment and Heritage, Canberra, Australia.
Connolly, R.M. (1986) Relation of Near-shore Benthic Flora of the Barker Inlet and Northern
Beaches Region to Pollution Sources - with Emphasis on Ulva Distribution. Department of
XIX Non Regional Seas LMEs
851
Environment and Planning, Adelaide.
CSIRO (2007) Climate change in Australia. Released 2 October 2007 by Australia Bureau of
Meteorology and CSIRO Marine and Atmospheric Research at Greenhouse 2007 in Sydney.
D'Adamo, N. and Mamaev, A. (1999) An overview of the oceanography of the proposed
Geographe Bay-Capes-Hardy Inlet marine conservation reserve. Marine Conservation Branch,
Department of Conservation and Land Management, Perth, Western Australia
Department of Environment and Conservation (2006) Indicative Management Plan for the
Proposed Geographe Bay/Leeuwin-Naturaliste/Hardy Inlet Marine Park. Management Plan No.
49. Department of Environment and Conservation, Perth, Western Australia.
Department of the Environment and Water Resources (2007) The South-West Marine Bioregional
Plan: Bioregional Profile. Australian Government. 197pp. Available at www.environment.gov.au/
coasts/mbp.
Edyvane, K.S. (1991) Pollution! The death knell of our mangroves? Safic 16: 4-7.
Environmental Protection Authority (2007) State of the Environment Report: Western Australia
2007. Department of Environment and Conservation, Perth, Western Australia. Available at
www.soe.wa.gov.au,
Feng, M., Majewski, L., Fandry, C. and Waite, A. (2007) Characteristics of two counter-rotating
eddies in the Leeuwin Current system off the Western Australian coast. Deep-Sea Res. II 54:
961980.
Fletcher, W.J. and Head, F. (Eds) (2006) State of the Fisheries Report 2005/06. Department of
Fisheries, Western Australia.
Furnas, M.J. (1995) Land-sea interactions and oceanographic processes affecting the nutrient
dynamics and productivity of Australian marine ecosystems. In: Zann, L.P. Our Sea, Our Future
Major findings of the State of the Marine Environment Report for Australia. Great Barrier Reef
Marine Park Authority, Department of the Environment, Sport and Territories, Canberra.
Available at www.ea.gov.au/coasts/publications/somer/annex1/land-sea.html#HDR7
Goldberg, N.A., Kendrick, G.A. and Walker, D.I. (2006) Do surrogates describe patterns in marine
macroalgal diversity in the Recherche Archipelago, temperate Australia? Aquatic Conservation:
Marine and Freshwater Ecosystems 16(13): 313-327.
Kendrick, G.A., Harvey, E.S. and McDonald, J. (2005) Characterising the fish habitats of the
Recherche Archipelago. FRDC 2001/060 Final Report. University of Western Australia and
Fisheries Research and Development Corporation. 582 p.
Koslow, J.A., Greenwood, J., Lourey, M., Rosebrock, U., Wild-Allen, K. and Margvelashvili, N.
(2006) Coastal and Shelf Biogeochemistry and Modelling. In: Keesing, J.K, Heine, J.N.,
Babcock, R.C., Craig, P.D. and Koslow, J.A. (Eds.) Strategic Research Fund for the Marine
Environment Final Report. Volume 2: the SRFME core projects. Strategic Research Fund for
the Marine Environment, CSIRO, Australia. p. 123-185.
Larcombe, J. and McLoughlin, K. (Eds.) (2007) Fishery Status Reports 2006: Status of Fish Stocks
Managed by the Australian Government. Bureau of Rural Sciences, Canberra.
Pattiaratchi, C.B. (2006) Surface and sub-surface circulation and water masses off Western
Australia. Bulletin of the Australian Meteorological and Oceanographic Society 19(5):95-104.
Pattiaratchi. C. (2007) Understanding areas of high productivity within the south-west marine
region. Report prepared for the National Oceans Office. School of Environmental Systems
Engineering, The University of Western Australia, Australia.
Pauly, D. and Christensen, V. (1995) Primary production required to sustain global fisheries. Nature
374: 255-257.
Pauly, D. and Watson, R. (2005) Background and interpretation of the `Marine Trophic Index' as a
measure of biodiversity. Philosophical Transactions of the Royal Society: Biological Sciences
360: 415-423.
Pauly, D., Christensen, V., Dalsgaard, J., Froese R. and Torres, F.C. Jr. (1998) Fishing down
marine food webs. Science 279: 860-863.
Pogonoski, J.J., Pollard, D.A. and Paxton, J.R. (2002) Conservation overview and action plan for
Australian threatened and potentially threatened marine and estuarine fishes. Environment
Australia. Available at www.environment.gov.au/coasts/publications/marine-fish-ction/index.html
Primary Industries and Resources South Australia (2007) South Australian Fisheries Resources:
Current Status and Recent Trend 2006. South Australian Fisheries Management Series, Paper
No. 49. Government of South Australia. Available at www.pir.sa.gov.au/fisheries
Ridgway, K.R. and Condie, S.A. (2004) The 5500-km-long boundary flow off western and southern
Australia. Journal of Geophysical Research 109(C4): C04017.
852
64. Southwest Australia LME
Sea Around Us (2007) A Global Database on Marine Fisheries and Ecosystems. Fisheries Centre,
University British Columbia, Vancouver, Canada. Available at
www.seaaroundus.org/lme/SummaryInfo.aspx?LME=43
Shepherd, S.A., McComb, A.J., Bulthuis, D.A., Neverauskas, V., Steffensen, D.A. and West, R.
(1989) Decline of seagrasses. In: A.W.D. Larkum, A.J. McComb and S.A. Shepherd (Eds.)
Biology of Seagrasses. Elsevier, Amsterdam, pp. 346-393.
Smith, A.D.M., Fulton, E.J., Hobday, A.J., Smith, D.C. and Shoulder, P. (2007) Scientific tools to
support the practical implementation of ecosystem-based fisheries management. ICES Journal
of Marine Science 64 (4): 633.
UNEP (2003) Wilkinson, C., Reichelt, R., DeVantier, L. and Lawrence, D. Great Australian Bight
and Murray Darling Basin. GIWA Regional Assessment 61. University of Kalmar, Kalmar,
Sweden.
Veron, J.E.N and Marsh, L.M. (1988) Hermatypic corals of Western Australia. Rec WA Museum
Supp Vol 29. 136pp
Wells, F.E., Walker, D., Kirkman, H. and Lethbridge, R. (Eds.) (1991) The Marine Flora and Fauna
of Albany, Western Australia. 2 volumes. Western Australia Musuem.
Wells, F.E., Walker, D. and Kendrick, G.A. (Eds.) (2005) The Marine Flora and Fauna of
Esperence, Western Australia. 2 volumes. Western Australia Musuem.
Zann, L.P. (1995) Our Sea, Our Future Major findings of the State of the Marine Environment
Report for Australia. Great Barrier Reef Marine Park Authority, Department of the Environment,
Sport and Territories, Canberra. Available at www.environment.gov.au/coasts/publications
/somer/