XIV NORTH EAST PACIFIC
XIV-44 California Current LME
XIV-45 East Bering Sea LME
XIV-46 Gulf of Alaska LME
XIV-47 Gulf of California LME
XIV-48 Pacific Central-American
Coastal LME
592
XIV North East Pacific
XIV North East Pacific
593
XIV-44 California Current LME
M.C. Aquarone and S. Adams
The California Current LME is bordered by the USA and Mexico, between subtropical and
subarctic LMEs. It has a surface area of around 2.2 million km˛, of which 1.31% is
protected, and it contains 0.01% of the world's coral reefs and 1.04% of the world's sea
mounts (Sea Around Us 2007). The LME shoreline is more than two thousand miles long.
The LME features more than 400 estuaries and bays, including the Columbia River, San
Francisco Bay and Puget Sound, which constitute 61% of the estuary and bay acreage.
This LME is characterised by its temperate climate and strong coastal upwelling. Book
chapters and articles pertaining to this LME include MacCall (1986), Mullin (1991), Bakun
(1993), Bottom et al. (1993), McGowan et al. (1999), Brodeur et al. (1999) and Lluch-
Belda et al. (2003). Additional information on this well-studied LME is available from the
Pacific Marine Environmental Laboratory at< www.pmel.noaa.gov>.
I. Productivity
The effects of coastal upwelling, ENSO and the Pacific Decadal Oscillation (PDO) result
in strong interannual variability in the productivity of the ecosystem and, consequently, of
the catch levels of different species groups (Bakun 1993). ENSO events are
characterised locally by an increase in temperature, a rise in coastal sea level,
diminished upwelling and increased coastal rainfall (Bakun 1993). Miller (1996) reports a
significant deepening of the thermocline off California, which he attributes to a weakening
of the Aleutian Low (decadal scale), and to waves propagating through the ocean from
the tropics (interannual scale). There is speculation as to what causes changes in the
eastern bifurcation of the Subarctic Current into the California Current, and the possible
effects of these changes on biological production in this LME.
The CCLME is one of the world's five LMEs that undergo seasonal upwellings of cold
nutrient rich water that generate localised areas of high primary productivity that support
fisheries for sardines, anchovy, and other pelagic fish species. (e.g. California Current,
Canary Current, Guinea Current, Benguela Current, and Humboldt Current LMEs). The
California Current LME can be considered a Class III, low productivity ecosystem (<150
gCm-2yr-1) (Figure XIV-44.3). The Pacific Decadal Oscillation (PDO) is a 20-30-year
cooling and warming cycle between a cool and productive ocean regime and a warm and
unproductive ocean regime. The latest warm regimes were in 1977-1998 and 2003-2006.
Apparent biological consequences of these regime shifts are changes in primary and
secondary production and changes in the abundance of eastern Pacific fish stocks. For
example, there was a sharp decline in primary and secondary production following the
1977 regime shift (CalCOFI Atlas 35, 2002). The California Cooperative Oceanic
Fisheries Investigations (CalCOFI) programme has sampled zooplankton biomass almost
continuously from 1951 to present. Observed decline in zooplankton abundance related
to water column stratification has been described by Roemmich & McGowan (1995a and
1995b), Haywood (1995), and McGowan et al. (1999). These biomass changes appear
to be inversely related to those occurring in the Gulf of Alaska LME to the north (Brodeur
& Ware 1995, Brodeur et al. 1999). For a study of interannual variability impacts on the
LME, see Lluch-Belda et al. (2003), Peterson and Schwing (2003), and Hooff and
Peterson (2006). There is a need to better understand the role of climate and seasonal
change in the energy flow and population dynamics of species inhabiting the LME. For
an analysis of chlorophyll and sea surface temperature changes during the El Nińo/La
Nińa period of 1998/1999, see Kahru & Mitchell (2000). For an article on observing and
modelling the California Current system, see Miller and Schneider (2000). Information on

594
44. California Current LME
the U.S. GLOBEC Northeast Pacific Programme is available at:
http://globec.coas.oregonstate .edu/
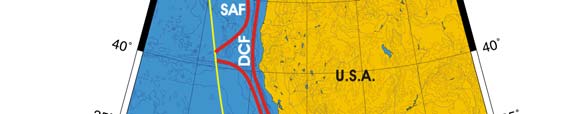
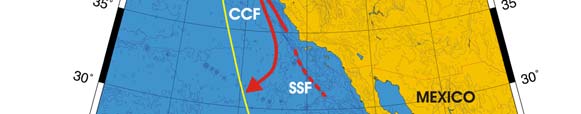
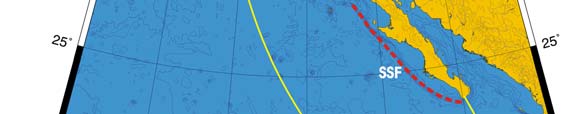
Oceanic fronts (Belkin et al. 2008): The California Current Front (CCF) separates
relatively cold, low-salinity waters of the southward California Current from warmer and
saltier waters inshore (Hickey 1998) (Figure XIV-44.1). The Subarctic Front (SAF)
separates the northward Subarctic Current from inshore waters. On the inshore side of
the California Current, upwelling fronts develop in summer (Belkin & Cornillon 2003,
Belkin et al. 2003). Offshore frontal filaments, sometimes a hundred km long, carry the
upwelled cold, nutrient-rich water across the entire LME (Belkin & Cornillon 2003). In
winter, a second and seasonal poleward current develops over the shelf and slope, giving
rise to the seasonal Davidson Current Front (DCF) between warm saline subtropical
waters inshore and colder, fresher temperate waters offshore. This front can be traced
from off southern California (35°N) to the northern Washington coast (48-49°N).
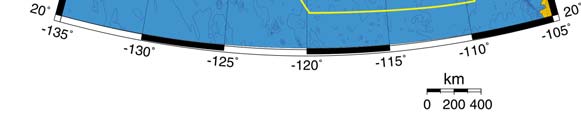
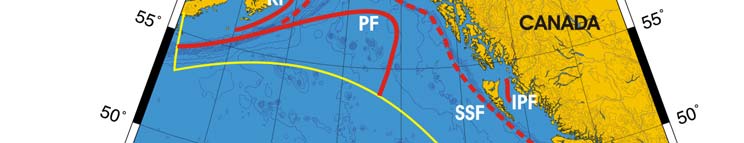
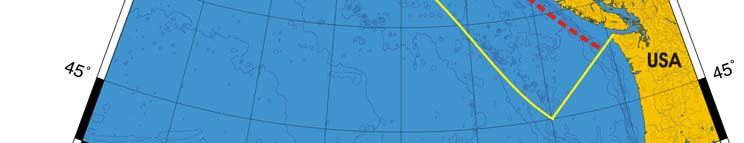
Figure XIV-44.1. Fronts of the California Current LME. CCF, California Current Front; DCF, Davidson
Current Front (winter only); SAF, Subarctic Front; SSF, Shelf Slope Front; Yellow line, LME boundary.
After Belkin et al. (2008).
California Current LME SST (Belkin 2008)(Figure XIV-44.2).
Linear SST trend since 1957: 0.32°C.
Linear SST trend since 1982: -0.07°C.
Like the East Bering Sea and Gulf of Alaska LMEs, the California Current cooled
dramatically, by nearly 2°C, from 1958 to 1975, then warmed in 1977 as a result of the
North Pacific regime shift (Mantua et al., 1997), and remained relatively warm in 1998.
Cooling was again observed from 1999-2002, then warming in 2003-2006. The absolute
minimum of 1975 was synchronous with the absolute minima in two other LMEs of the
East Pacifi, the Gulf of California and Pacific Central American. The absolute maximum
of 18.3°C in 1997 is attributable to El Nińo, whereas the dramatic 1.8°C cooling in 1999
was associated with La Nińa. The California Current LME and the Humboldt Current LME
XIV North East Pacific
595
have experienced a slight cooling over the last 25 years. Both LMEs are situated in
similar oceanographic regimes of East Pacific wind-induced coastal upwelling systems.
These regimes feature strong and persistent alongshore winds directed towards the
Equator, causing Ekman offshore transport of warm surface waters and upward flux of
cold subsurface waters (coastal upwelling). The above-noted long-term cooling in these
areas is suggestive of a long-term increase in the upwelling intensity, which in turn may
have resulted from a long-term increase in the strength and/or persistence of upwelling-
favorable along-coast winds. This hypothesis is supported by observed data and
numerical modeling experiments (Schwing and Mendelsson, 1997; and GLOBEC at
www.usglobec.org). There is no significant time lag between major thermal events in the
California Current, Gulf of Alaska and East Bering Sea LMEs. The observed
synchronicity among these regions suggests ocean-scale if not global forcing in the
Northern and Northeast Pacific. The North Pacific regime shifts of 1976-1977 and 1999-
2002 were broad scale events.
Figure XIV-44.2 California Current LME annual mean SST (left) and SST anomalies (right) based on
Hadley climatology. 1957-2006. After Belkin ( 2008).
California Current LME Chlorophyll and Primary Productivity: The California Current
LME is a Class III, low productivity ecosystem (<150 gCm-2yr-1)(Figure XIV-44.3).
Figure XIV-44.3. California Current LME trends in chlorophyll a (left) and primary productivity (right),
1998-2006, from satellite ocean colour imagery. Values are colour coded to the right hand ordinate.
Figure courtesy of J. O'Reilly and K. Hyde. Sources discussed p. 15 this volume..
596
44. California Current LME
II. Fish and Fisheries
Fisheries resources in the California Current LME include salmon, pelagic fisheries,
groundfish, and invertebrates. Salmon fisheries harvest 5 species of salmon (Chinook,
coho, sockeye, pink, and chum). The abundance of salmon stocks fluctuates
considerably. Chinook and coho are harvested recreationally and commercially in Puget
Sound and in freshwater rivers. Fisheries management for salmon is complex, with
conflicting jurisdictions and salmon originating from several rivers. For all salmon species
there is excess fishing power and overcapitalization of the fishing fleet. For coho and
Chinook there is a sharp decline in abundance that has led to the closure of all salmon
fisheries off the coasts of Oregon and California. Small pelagic resources in the LME are
Pacific sardine, northern anchovy, jack mackerel, chub (Pacific) mackerel, and Pacific
herring. Sardine, anchovy and mackerel are mostly harvested off California and Baja
California. Sardine and anchovy fluctuate widely in abundance (NMFS 2009). Natural
environmental change and intensive fishing are causing long-term shifts in their
abundance in this LME. The CalCOFI programme was initiated to examine the reasons
for the decline of the Pacific sardine and to study its physical and biotic habitat (CalCOFI
1990 results at www.calcofi.org). The collapse of the Pacific sardine has had cascading
effects on other ecosystem components including marine birds. The variability in
abundance levels of sardine and anchovy spawning biomass from 1930 to 1985 is
analysed in MacCall (1986). Sardine catches declined after World War II, and the stock
collapsed in the late 1950s. The sardine crash is one of the earliest well documented
major fishery crashes (Radovich 1982) and is attributed to overfishing that accelerated a
long term pattern of natural decline. Sardines today are taken for human consumption,
bait, and aquaculture feed. Consumer demand for canned anchovy is low. Anchovy are
harvested for reduction into fishmeal, bait, human consumption and oil. In recent years,
low prices and market problems continue to prevent a significant anchovy fishery. The
endangered brown pelican depends on anchovy as an important food source, and the
wellbeing of the ecosystem is an important factor in resource management. Mackerel
supported a major fishery in California but the stock collapsed in the 1970s. It has since
reopened under a quota system. Sardine, anchovy, and mackerel are transboundary
stocks exploited by both US and Mexican fleets. Squid is an important fishery in
California in terms of revenue and tons landed. The vast majority is frozen for human
consumption and exported to China, Japan and Europe. Landings depend on cyclical
oceanographic regimes, with increases when relatively warm water events are displaced
by cool water. Herring landings declined with an El Nińo episode. Groundfish fisheries
include sole, thornyheads, sablefish, rockfish, ligcod and cabezon, flatfish, and Pacific
hake. Harvest rates have been reduced in recent years and gear designs to reduce
bycatch. Nearshore fisheries are for invertebrate species including crabs, shrimps,
abalones, clams, scallops and oysters (NMFS 2009). A recent compilation of species
inhabiting the nearshore California Current LME can be reviewed at the California
Department of Fish and Game site at: www.dfg.ca.gov/mrd/.
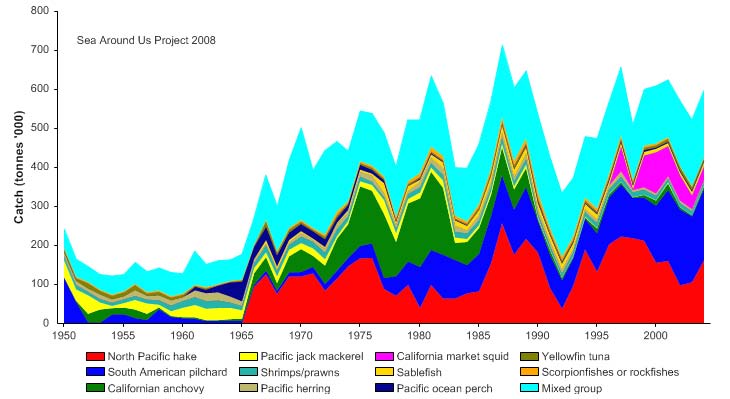
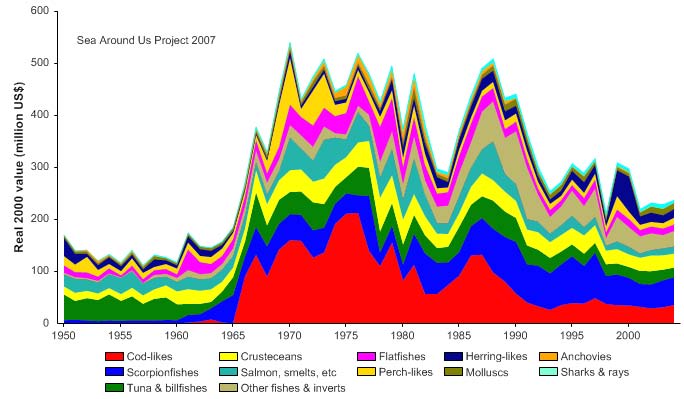
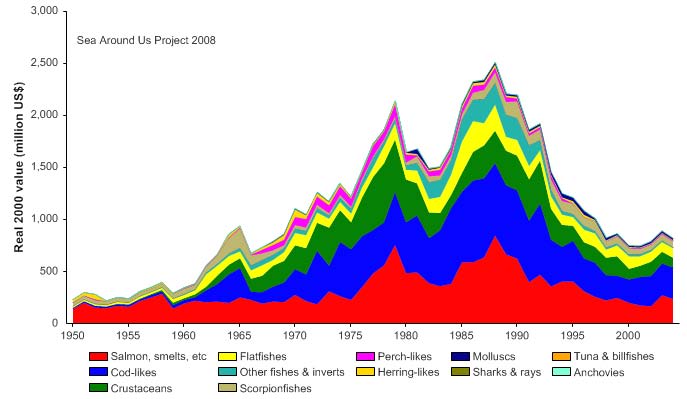
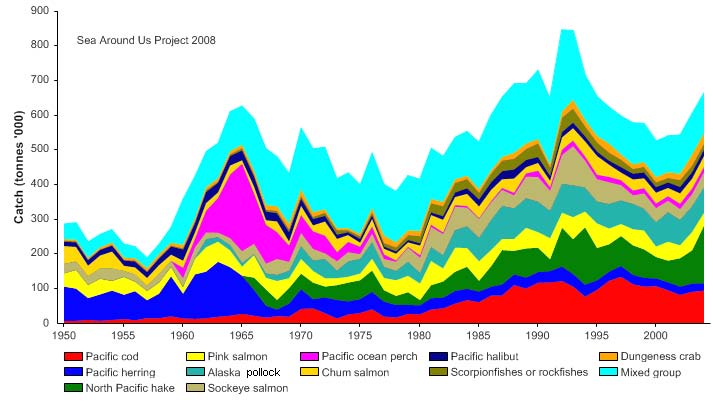
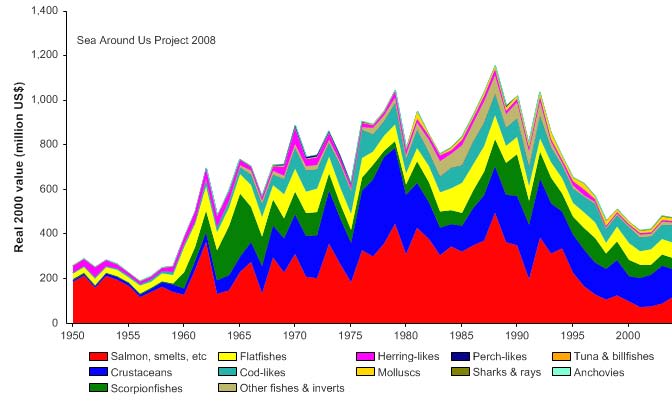
Total reported landings peaked at 710,000 tonnes in 1987 (Figure XIV-44.4). The value
of reported landings peaked in 1970 at US$540 million (in 2000 US dollars) with a similar
level recorded in 1988 (Figure XIV-44.5). The major commercial fish species are Pacific
salmon, hake, albacore tuna, Pacific sardine (also known as South American pilchard),
northern anchovy, jack mackerel, chub (Pacific) mackerel, Pacific herring, and Pacific
halibut. Shrimp, squid, crab, clam and abalone have high commercial value.
XIV North East Pacific
597
Figure XIV-44.4. Total reported landings in the California Current LME by species (Sea Around Us
2007).
Figure XIV-44.5. Value of reported landings in the California Current LME by commercial groups (Sea
Around Us 2007).
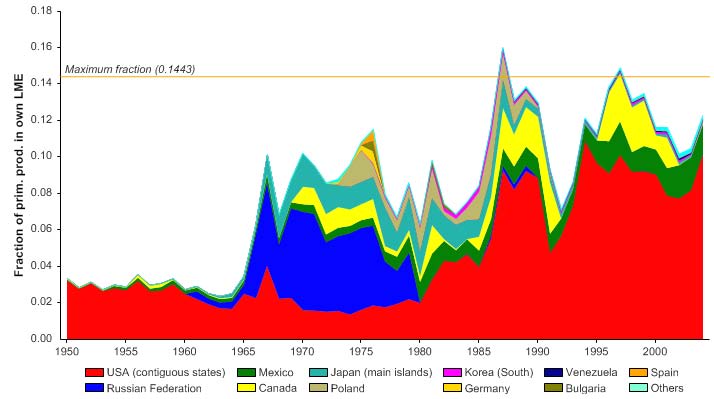
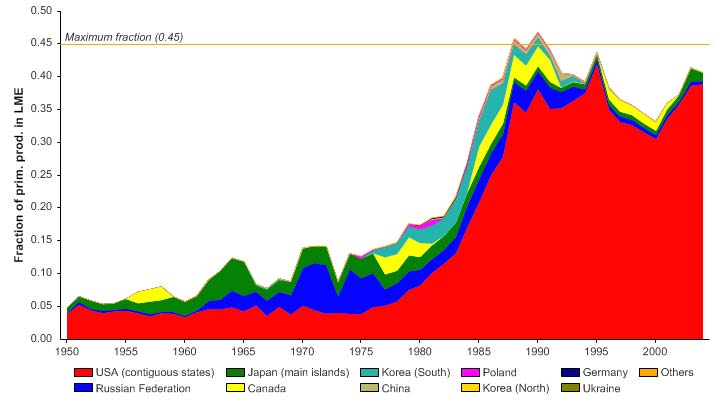
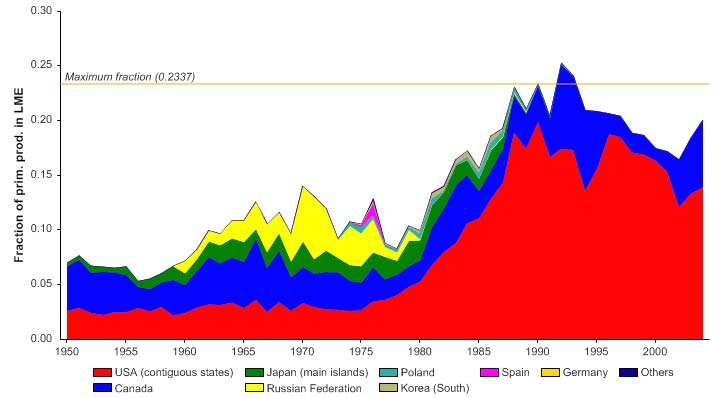
The primary production required (PPR) (Pauly & Christensen 1995) to sustain reported
landings in this LME reached 16% of the observed primary production in the late 1980s,
and has fluctuated between 7 to 15% in recent years (Figure XIV-44-6). The USA has
the largest share of the ecological footprint in the LME.
598
44. California Current LME
Figure XIV-44.6. Primary production required to support reported landings (i.e., ecological footprint) as
fraction of the observed primary production in the California Current LME (Sea Around Us 2007). The
`Maximum fraction' denotes the mean of the 5 highest values.
Both the mean trophic level of the reported landings (Pauly & Watson 2005; figure XIV-
44.7, top) and the Fishing-in-Balance index (Figure XIV-44.7, bottom) show considerable
fluctuation over the reported period with no clear trend, except for the initial increase in
the FiB index corresponding to a growth in fisheries during the 1960s.
Figure XIV-44.7. Mean trophic level (i.e., Marine Trophic Index) (top) and Fishing-in-Balance Index
(bottom) in the California Current LME (Sea Around Us 2007).
The Stock-Catch Status Plots indicate that over 80% of the stocks in the LME have
collapsed or are currently over-exploited (Figure XIV- 44.8, top). Half of the reported
landings biomass is still supplied by fully exploited stocks (Figure XIV-44.8, bottom). The
US National Marine Fisheries Service (NMFS) includes "overfished" but not "collapsed" in
its stock status categories. Currently overfished are Chinook and coho salmon, thought to
be impacted by environmental conditions resulting in poor ocean survival. The other
salmon species are considered fully exploited. Six other overfished species are among
XIV North East Pacific
599
groundfish stocks. Hake and lingcod have been rebuilt to target levels. Jack mackerel
and northern anchovy are underutilized species (NMFS 2009).
1950
1960
1970
1980
1990
2000
0%
100
10%
90
20%
)
80
%
(
s
30%
u
70
t
at
s
40%
y
60
b
s
k
50%
c
o
50
f
st
60%
40
er o
b
70%
m
30
Nu
80%
20
90%
10
100%0
1950
1960
1970
1980
1990
2000
(n = 4148)
developing
fully exploited
over-exploited
collapsed
1950
1960
1970
1980
1990
2000
0%
100
10%
90
20%
80
)
%
30%
(
70
s
t
u
a
40%
60
st
ck
50%
t
o
50
s
y
60%
b
h
40
t
c
70%
Ca
30
80%
20
90%
10
100%0
1950
1960
1970
1980
1990
2000
(n = 4148)
developing
fully exploited
over-exploited
collapsed
Figure IV-44.8. Stock-Catch Status Plots for the California Current LME, showing the proportion of
developing (green), fully exploited (yellow), overexploited (orange) and collapsed (purple) fisheries by
number of stocks (top) and by catch biomass (bottom) from 1950 to 2004. Note that (n), the number of
`stocks', i.e., individual landings time series, only includes taxonomic entities at species, genus or
family level. Higher and pooled groups have been excluded (see Pauly et al, this vol. for definitions).
Comprehensive plans for the management of marine resources in this LME are being
developed. Efforts are underway to implement ecosystem management in this LME.
There is a need to know more about competitive and predatory interactions, and about
climate effects on the fish stocks.
III. Pollution and Ecosystem Health
The major stressors in this LME are the effects of shifting oceanic climate regimes, the
intensive harvesting of commercial fish, releases of captive-bred salmon, and low-level,
chronic pollution from multiple sources (Bottom et al. 1993). Population growth rates
suggest that human pressures on coastal resources will increase substantially in many
coastal areas (EPA 2004). Hypotheses concerned with the growing impacts of pollution,
overexploitation and environmental changes on sustained biomass yields are under
investigation. Pacific salmon in the California Current LME depend on freshwater habitat
for spawning and rearing of juveniles. There are concerns about the interactions of
hatchery and natural wild salmon regarding the genetic integrity of native stocks and
productivity levels. The quality of freshwater habitat is largely a function of land
management practices. Coastal habitat degradation and shoreline alteration have
resulted from dam construction, logging, agriculture, increased urbanisation, grazing and
atmospheric pollution. In 1990-2000, the coastal areas experienced a loss of 1720 acres,
a low figure compared with other regions of the country but high in relation to existing
wetlands in the California Current LME. Ecological conditions in West Coast estuaries, a
600
44. California Current LME
valuable resource in this LME, are considered fair to poor (EPA 2004). Eighty seven
percent of estuaries assessed are impaired by some form of pollution or habitat
degradation. Some estuaries have extensive areas with elevated phosphorus
concentrations and decreased water clarity. Considerable areas have poor light
penetration. DIN concentrations in estuaries are rated good. Summer wind conditions
result in an upwelling of nutrient rich deep water that enters estuaries during flood tides
(EPA 2004). DIP concentrations in estuaries are rated fair. Chlorophyll a concentrations
in estuaries are rated good.
The EPA rated water clarity and dissolved oxygen as good, benthos and fish tissue as
fair, and coastal wetlands, eutrophic condition and sediment as poor in this LME (EPA
2001). In 2004 the EPA assessed the water quality index as fair, the sediment quality
index slightly improved, and the coastal habitat index and fish tissue index as poor (EPA
2004). The primary problem in California Current estuaries continues to be degraded
sediment quality, with 14% of estuaries exceeding thresholds for sediment toxicity or
sediment contaminants. Seventeen different contaminants were responsible for fish
advisories in this LME in 2002. Toxic sediments in Puget Sound were contaminated with
DDT and metals. For a study of water quality and one on sediment contamination in
Puget Sound, see EPA 2004. High concentrations of metals and PAHs were observed in
the Los Angeles harbour. The potential for benthic community degradation and fish
contamination is increasing. A decline in seabirds such as the sooty shearwater has
been observed. The LME contains a large seabird and marine mammal population
(Bakun 1993) that includes sea lions and elephant seals. Since the late 1970s, pinnipeds
have been increasing and are consuming large quantities of fish (DeMaster 1983;
California Department of Fish and Game 2005). For more information on marine
mammals as indicators of LME health, see NOAA (1999, p. 238). Of 274 coastal
beaches, 178 were closed or under an advisory for some period of time in 2002.
IV. Socioeconomic Conditions
Three major estuaries, the San Francisco Bay, the Columbia River and Puget Sound,
contribute to the local economy and enhance the quality of life of the inhabitants. Human
population pressures are increasing in Puget Sound, the Seattle-Tacoma region, San
Francisco Bay and southern California. California's population approached 37.7 million
persons on January 1, 2007 (www.dof.ca.gov), up almost 3.8 million persons from the
2000 census. The coastal population increased by 45% between 1970 and 1980 (U.S.
Census Bureau 1996). Forty seven coastal and estuarine countries bordering the
California Current LME increased their population by 13% between 1990 and 2000 (U.S.
Census Bureau 2001). In 2008 the combined population increase of San Diego, San
Bernardino, Orange and Riverside counties in California was estimated at 12 percent of
the total U.S. coastal population increase (www.oceanservice.noaa.gov). These
pressures require continued environmental monitoring to ensure that environmental
indicators currently demonstrating fair condition do not deteriorate. The California Current
LME supports important commercial and recreational fisheries. All salmon species are
harvested by Native American tribes for subsistence and ceremonial purposes. The value
of recreational catches is not easily measured. Recent prices for salmon have declined
due to market competition from record landings of Alaskan salmon and increasing
aquaculture production. Northern anchovy landings fluctuate more in response to market
conditions than to stock abundance. Commercial fishing is heavily regulated in an effort
to achieve sustainability. In 1998 there were 9,843 commercial fishermen licensed to fish
in California waters, down from 20,363 in 1980-1981. In 2006, there were 6,354
commercial fishing licenses purchased (California Department of Fish and Game
Statistics, online at <www.dfg.ca.gov/licensing/statistics>). Recreational fishing in
California generates US$4.9 billion and supports 43,000 jobs paying US$1.2 million in
salaries and wages (Bacher 2007). An increase in the demand for oil, gas and mineral
XIV North East Pacific
601
resources (e.g., chromite-bearing black sands and titanium sands off the Oregon and
Washington coasts; sand and gravel dredging) has stimulated an exploration of the non-
living resources of the LME.
V. Governance
Some critical issues requiring management include wild salmon stocks and significant
loss of their spawning and nursery habitats (EPA 2001, p.153). The Pacific Fishery
Management Council (PFMC) is responsible for managing fisheries off the coasts of
California, Oregon and Washington, with cooperation form states and tribal fishery
agencies. Within Puget Sound and the Columbia River, fisheries for Chinook and coho
salmon are managed by the states and tribes. The Pacific Salmon Commission, the
State of Washington, and tribal fishery agencies manage fisheries for pink, chum, and
sockeye salmon. All species of pink salmon have been listed as threatened or
endangered under the US Endangered Species Act. There is a legally mandated tribal
allocation of Coho salmon. The Pacific Salmon Treaty with Canada determines the share
of Canada and the US in the transboundary stock (NMFS 2009). There are more than 80
species managed under the Pacific Coast Groundfish Fishery Management Plan (FMP)
of the PFMC, no less than eight of which have been declared overfished. Many
groundfish stocks have geographic ranges that extend beyond the US EEZ into Canada
and Mexico. Groundfish stocks support many commercial, recreational, and Indian tribal
fishing interests in state and Federal waters off the coasts of Washington, Oregon, and
California. Groundfish are also caught incidentally in other fisheries, such as the trawl
fisheries for pink shrimp and ridgeback prawns. Current management measures include
trip limits, bag limits size limits, time/area closures, and gear restrictions. A trawl permit
buy-back program was implemented in 2003 to reduce the capacity of the groundfish
fishery. NOAA Fisheries Service, in cooperation with the PFMC, is assessing the impacts
of groundfish fisheries on the human, biological and physical environment. A preliminary
set of alternatives will be developed to take into account new stock assessments for 23 of
the groundfish species managed under the FMP (NOAA Fish News 2005). For
information concerning the San Francisco Bay Estuary Project, see www.abag.ca.gov/.
In Northern California, commercial, recreational, and Native American fishermen have
recently targeted both State and Federal water management on the Klamath River and in
the California Delta charging that historic fish runs in Northern California have been
destroyed by illegal pumping in the Delta area and by hydroelectric dams (Bacher, 2007).
Since the passage of the Marine Mammal Protection Act in 1972, populations of seals
and sea lions have increased. Killer whales are listed as an endangered species. In the
south, the Mexican portion of the LME has minimal fisheries regulation, with limited fauna
and marine mammal protection. The Mexican part of this LME falls within a non-UNEP
administered Regional Seas Programme, the North-East Pacific Region, which covers 8
central American countries (Colombia, Costa Rica, El Salvador, Guatemala, Honduras,
Mexico, Nicaragua and Panama). The Convention for Cooperation in the Protection and
Sustainable Development of the Marine and Coastal Environment of the North-East
Pacific (Antigua Convention) was signed in 2002. The governments also approved an
Action Plan detailing how the countries concerned will improve the environment of the
North-East Pacific for the benefit of people and wildlife. The Action Plan's secretariat is
COCATRAM (Central America Marine Transport Commission). For information on
PICES, see the East China Sea LME (Chapter X). The States of California, Oregon, and
Washington are developing and implementing a network of marine protected areas.
602
44. California Current LME
References
Bacher, D. California fishermen target water policies. California Progress Report, June 26, 2007.
Accessed July 2007 at <californiaprogressreport.com>
Bakun, A. (1993). The California Current, Benguela Current, and Southwestern Atlantic Shelf
Ecosystems: A comparative approach to identifying factors regulating biomass yields, p 199-
221 in: Sherman, K., Alexander, L.M. and Gold, B.D. (eds), Large Marine Ecosystems: Stress,
Mitigation and Sustainability. AAAS, Washington D.C., U.S.
Belkin, I.M. (2008) Rapid warming of Large Marine Ecosystems, Progress in Oceanography, in
press.
Belkin, I.M., and Cornillon, P.C. (2003). SST fronts of the Pacific coastal and marginal seas. Pacific
Oceanography 1(2):90-113.
Belkin, I.M., Cornillon, P. and Ullman, D. (2003). Ocean fronts around Alaska from satellite SST
data, Paper 12.7 in: Proceedings of the American Meteorological Society, 7th Conference on
the Polar Meteorology and Oceanography. Hyannis, U.S.
Belkin, I.M., Cornillon, P.C., and Sherman, K. (2008). Fronts in Large Marine Ecosystems of the
world's oceans. Progress in Oceanography, in press.
Bottom, D.L., Jones, K.K., Rodgers, J.D. and Brown, R.F. (1989). Management of living marine
resources: a research plan for the Washington and Oregon continental margin. National
Coastal Resources Research and Development Institute. Publication NCRI-T-89-004,
Newport, U.S.
Bottom, D.L., Jones, K.K., Rodgers, J.D., Jeffrey, D. and Brown, R.F. (1993). Research and
management in the northern California Current ecosystem, p 259-271 in: Sherman, K.,
Alexander, L.M. and Gold, B.D. (eds), Large Marine Ecosystems: Stress, Mitigation and
Sustainability. AAAS Washington D.C., U.S.
Brodeur R.D. and Ware, D.M. (1995). Interdecadal variability in distribution and catch rates of
epipelagic nekton in the Northeast Pacific Ocean. Canadian Special Publication of Fisheries
and Aquatic Sciences 121:329-356.
Brodeur, R.D., Frost, B.W., Hare, S.R., Francis, R.C. and Ingraham, W.J., Jr. (1999). Interannual
variations in zooplankton biomass in the Gulf of Alaska, and covariation with California Current
zooplankton biomass, p 106-138 in: Sherman, K. and Tang, Q. (eds), Large Marine
Ecosystems of the Pacific Rim: Assessment, Sustainability, and Management. Blackwel
Science, Malden, U.S.
CalCOFI Committee (1990). Fortieth Anniversary Symposium of the CalCOFI Conference.
CalCOFI Report 31:25-59.
CalCOFI. Atlas 35. (2002) online at www.calcofi.org/newhome/publications/CalCOFI
Reports/calcofi_reports.htm
California Department of Fish and Game (2005). Overview of pinnipeds and their prey. Retrieved
June 2006 from: www.dfg.ca.gov/mrd/mlpa/pdfs/agenda_090705a7.pdf.
California Deptartment of Fish and Game (1990). Review of some California fisheries for 1989.
CalCOFI Report 31:9-21.
DeMaster, D. 1983. Annual consumption of northern elephant seals and California sea lions in the
California Current (abstract). Calif. Coop. Ocean. Fish. Invest. Annual Conference 1983,
Program and Abstracts.
EPA (2001). National coastal condition report. EPA-620/R-01-005. Office of Research and
Development/Office of Water, Washington D.C. U.S.
EPA (2004). National coastal condition report 2. EPA-620/R-03-002. Office of Research and
Development/Office of Water, Washington D.C. U.S.
Hare, S.R., and Mantua, N.J. (2000) Empirical evidence for North Pacific regime shifts in 1977 and
1989, Progress in Oceanography, 47(2-4), 103-145.
Haywood, V.E., ed. (1995). Global Biodiversity Assessment. UNEP, Cambridge University Press,
Cambridge, U.S.
Hickey, B.M. (1998). Coastal oceanography of western North America from the tip of Baja to
Vancouver Island, p 345-393 in: Robinson, A.R. and Brink, K.H. (eds), The Sea, The Global
Coastal Ocean: Regional Studies and Syntheses, Vol. 11. Wiley, New York, U.S.
Hooff, R.C. and W.T. Peterson. 2006. Copepod biodiversity as an indicator of changes in ocean
and climate conditions of the northern California current ecosystem. Limnol. & Oceanogr.
51(6): 2607-2620.
Kahru, M. and Mitchell, B.G. (2000). Influence of the 1997-1998 El Nińo on the surface chlorophyll
in the California Current. Geophysical Research Letters 18:2937-2940.
XIV North East Pacific
603
Lluch Belda, D., Lluch Cota, D.B. and Lluch Cota, S. (2003). Interannual variability impacts on the
California Current Large Marine Ecosystem, p 195-226 in: Hempel, G. and Sherman, K. (eds),
Large Ecosystems of the World: Trends in Exploitation, Protection, and Research. Elsevier,
Amsterdam, The Netherlands.
MacCall, A.D. (1986). Changes in the biomass of the California Current ecosystem, p 33-54 in:
Sherman, K. and Alexander, L.M. (eds), Variability and Management of Large Marine
Ecosystems. AAAS Selected Symposium 99. Westview Press, Boulder, U.S.
Mantua, N.J., S.R. Hare, Y. Zhang, J.M. Wallace, and R.C. Francis (1997) A Pacific decadal
climate oscillation with impacts on salmon, Bulletin of the American Meteorological Society, Vol.
78, pp. 1069-1079.
McGowan, J.A., Chelton, D.B. and Conversi, A. (1999). Plankton patterns, climate, and change in
the California Current, p 63-105 in: Sherman, K. and Tang, Q. (eds), Large Marine Ecosystems
of the Pacific Rim: Assessment, Sustainability, and Management. Blackwell Science, Malden,
U.S.
Miller, A.J. (1996). Recent advances in California Current modeling: decadal and interannual
thermocline variations. California Cooperative Oceanic Fisheries Investigations Report 37.
Miller, A.J. and Schneider, N. (2000). Interdecadal climate regime dynamics in the North Pacific
Ocean: Theories, observations and ecosystem impacts. Progress in Oceanography 47:355-
379.
Morgan, J. (1989). Large Marine Ecosytems in the Pacific Ocean, p 377-394 in: Sherman, K, and
Alexander, L.M. (eds), Biomass Yields and Geography of Large Marine Ecosystems. Westview
Press, Boulder, U.S.
Mullin, M.M. (1991). Spatial-temporal scales and secondary production estimates in the California
Current Ecosystem, p 165-192 in: Sherman, K., Alexander, L.M. and Gold, B.D. (eds), Food
Chains, Yields, Models, and Management of Large Marine Ecosystems. Westview Press,
Boulder, U.S.
NMFS. (2009). Our living oceans. Draft report on the status of U.S. living marine resources, 6th
edition. U.S. Dep. Commer., NOAA Tech. Memo. NMFS-F/SPO-80. 353 p.
NMFS (1999). Our Living Oceans. Report on the status of U.S. Living Marine Resources. U.S.
Department of Commerce, Washington D.C., U.S.
NOAA Fish News (2005). Pacific Coast: Public invited to participate in examining scope of
alternatives for the 2007-2008 groundfish fisheries. October 31:2.
Pauly, D. and Christensen, V. (1995). Primary production required to sustain global fisheries.
Nature 374: 255-257.
Pauly, D. and Watson, R. (2005). Background and interpretation of the `Marine Trophic Index' as a
measure of biodiversity. Philosophical Transactions of the Royal Society: Biological Sciences
360: 415-423.
Peterson, W.T.and Schwing, F.B. (2003). A new climate regime in northeast pacific ecosystems.
Geophysical Research Letters 30(17) 1896, doi:10.1029/2003GL017528,2003
PMEL Pacific Marine Environmental Laboratory at www.pmel.noaa.gov
www.pmel.noaa.gov/np/pages/seas/npmap4.html
Radovich, J. (1982). The collapse of the California sardine industry: What have we learned?
CalCOFI Reports 23: 56-78.
Roemmich, D. and McGowan, J. (1995a). Climatic warming and the decline of zooplankton in the
California Current. Science 267:1324-1326.
Roemmich, D. and McGowan, J. (1995b). Sampling zooplankton: Correction. Science 268:352-353.
San Francisco Bay Estuary Project at www.abag.ca.gov/bayarea/sfep
Schwing, F. B., and R. Mendelssohn (1997), Increased coastal upwelling in the California Current
System, J. Geophys. Res., Vol. 102, No. C2, pp. 34213438.
Sea Around Us (2007). A Global Database on Marine Fisheries and Ecosystems. Fisheries Centre,
University British Columbia, Vancouver, Canada. www.seaaroundus.org/lme/Summary
Info.aspx?LME=3
US Census Bureau online at www.census.gov
US GLOBEC at www.usglobec.org/reports/ebcip/ebcip.histvar.html
604
44. California Current LME
XIV North East Pacific
605
XIV-45 East Bering Sea LME
M.C. Aquarone and S. Adams
The East Bering Sea LME is characterised by an extremely wide, gradually sloping shelf,
and by a seasonal ice cover that in March extends over most of this LME. The LME is
bounded by the Bering Strait to the North, by the Alaskan Peninsula and Aleutian Island
chain to the South, and by a coastline to the east that is thousands of miles in length. The
surface area is about 1.4 million km˛, of which 0.87% is protected. It contains 0.07% of
the world's sea mounts. This LME receives freshwater discharge from major rivers
including the Yukon and Kuskokwim (Sea Around Us 2007). Book chapters and articles
pertaining to this LME include Incze & Schumacher (1986), Carleton Ray & Hayden
(1993), Livingston et al. (1999) and Schumacher et al. (2003).
I. Productivity
Temperature, currents and seasonal oscillations influence the productivity of this LME.
For information on oceanographic and climate forcing in the East Bering Sea ecosystem,
and the recruitment responses of many Bering Sea fish and crabs linked to decadal scale
patterns of climate variability, see EPA (2004) and PICES (2005). The East Bering Sea
LME is a Class II, moderately high productivity ecosystem (150-300 gCm-2yr-1). This LME
is undergoing a climate driven change in species dominance and species abundance in
some ecological groups (PICES 2005). On the temporal variability of the physical
environment over the LME, see Stabeno et al., 2001. There is much to understand about
its carrying capacity during the present period of climate change. For example, there
have been nearly ice-free conditions in the mid shelf from January to May in 2000-2004.
Accompanying this change are shifts in the trophic structure with walrus populations
moving northward with the ice, and Alaska pollock moving east.
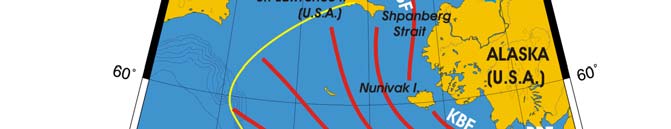
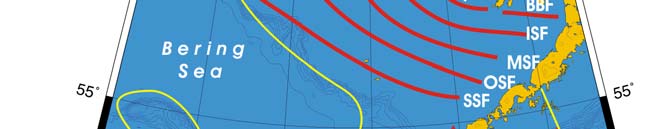
Oceanic fronts: Five major fronts can be found over the East Bering shelf and slope
(Belkin et al., 2003; Belkin & Cornillon 2005; Belkin et al., 2008). The Coastal Front
consists of three segments, the Bristol Bay Front (BBF), the Kuskokwim Bay Front (KBF),
and the Shpanberg Strait Front (SSF), all extending approximately parallel to the Alaskan
Coast at a depth of 10 to 20 meters (Figure XIV-45.1). Farther offshore, the Inner Shelf
Front (ISF) is located at a depth of 20 to 40 meters while the Mid-Shelf Front (MSF) is
found at 40 to 60 meters. These two fronts are also approximately isobathic. The most
distant offshore fronts, the Outer Shelf Front (OSF; 60-100-m depth) and the Shelf-Slope
Front (SSF; 100-200-m depth within this LME) are not isobathic. They extend from
relatively shallow depths in the east, off Bristol Bay, to significantly greater depths in the
west, where the SSF crosses the shelf break and slope to continue over the deep basin
as it leaves the East Bering Sea LME and enters the West Bering Sea LME.
East Bering Sea SST (Belkin 2008)(Figure XIV-45.2)
Linear SST trend since 1957: 0.46°C.
Linear SST trend since 1982: 0.27°C.
The annual mean SST averaged over the East Bering Sea increased by 0.46°C between
1957 and 2006. The 50-year warming was not uniform: instead, the time span included
two periods with opposite SST trends. In 1957 the average Bering Sea SST reached a
maximum that has not been surpassed until recently (Niebauer et al., 1999). From 1957
to 1971, the SST decreased by 1.3°C. The SST drop was especially abrupt in the late
1960s-early 1970s; in 1969-71 SST decreased from 5°C to 4°C. The cold spell lasted

606
45. East Bering Sea LME
through 1976. In the winter of 1976-77, the East Bering Sea underwent an abrupt regime
shift to warm conditions, with the SST rising by 1°C in a single year and remaining
relatively high through 2006. The 1°C SST jump from 4.1°C to 5.1°C between 1976-77
was a regional manifestation of a trans-North Pacific "regime shift" that occurred during
the winter of 1976-77, caused by a major shift of the North Pacific atmospheric pressure
pattern captured in three indexes, ENSO, PDO, and the Aleutian Low index (Mantua et
al., 1997; Hare and Mantua, 2000). This has helped species such as salmon stocks
rebound from previous low years of abundance. The atmosphere-ocean system shift
was followed by an ecosystem shift around and across the entire North Pacific. For
some species, the effects of this ecosystem shift were beneficial, for others they were
detrimental. The most recent cold episode, in 1999, was short-lived. The East Bering
Sea has returned to warm conditions.
Figure XIV-45.1. Fronts of the East Bering Sea LME. BBF, Bristol Bay Front; ISF, Inner Shelf Front; KBF,
Kuskokwim Bay Front; MSF, Mid-Shelf Front; OSF, Outer Shelf Front; PF, Polar Front; SSF, Shelf-Slope
Front; SSNSF, Shpanberg Strait-Norton Sound Front. Yellow line, LME boundary. After Belkin et al.
(2008).
The bathymetry of this LME is critically important while analyzing the area-averaged SST
time series. The most important feature is the presence of two different oceanographic
regimes within this LME, namely an extremely wide, nearly horizontal continental shelf
and a deep-sea basin. This co-existence of shallow shelf and deep sea might explain the
observed discrepancy between the LME-averaged SST time series and the SST
observations over the East Bering Sea Shelf alone. Indeed, the most recent
observations over the southeastern Bering Sea Shelf revealed a dramatic summertime
warming by 3°C in the 2000s, likely caused by a synergy of several mechanisms,
including (a) persistent northward winds since 2000; (b) a later fall transition combined
XIV North East Pacific
607
with an earlier spring transition that resulted in a shorter sea ice season; (c) an increased
flux of warm waters from the Gulf of Alaska LME through Unimak Pass; and (d) the
feedback mechanism between warm summertime oceanic temperatures and the
wintertime southward advection of sea ice (Stabeno et al., 2007).
Figure XIV-45.2. East Bering Sea LME annual mean SST (left) and annual SST anomalies (right), 1957-
2006, based on Hadley climatology. After Belkin (2008).
East Bering Sea LME Chlorophyll and Primary Productivity: The East Bering Sea
LME is a Class II, moderately high productivity ecosystem (150 300 gCm-2yr-1)(Figure
XIV-45.3).
Figure XIV-45.3. East Bering Sea LME trends in chlorophyll-a (left) and primary productivity (right),
1998-2006, from satellite ocean colour imagery. Values are colour coded to the right hand ordinate.
Figure courtesy of J. O'Reilly and K. Hyde. Sources discussed p. 15 this volume.
II. Fish and Fisheries
The LME's thousands of miles of coastline support populations of five species of salmon
(pink, sockeye, chum, Coho and Chinook). The high abundance of salmon is due to a
number of factors including favourable ocean conditions that promote high survival rates
of juveniles, hatchery production, and reduction of bycatch (EPA 2004). Sockeye salmon
(in Bristol Bay, Alaska Peninsula and Aleutian Islands) is the most valuable of the salmon
species but has had recent declines, along with chum salmon. In some years, significant
numbers of chum salmon are caught as bycatch in fisheries that target pollock and other
608
45. East Bering Sea LME
groundfish. Despite relatively stable Chinook stocks there is concern over abundance
trends. A quota under the provisions of the Pacific Salmon Treaty regulates the Chinook
salmon harvest in this LME. Coho salmon is the most popular recreational species.
Salmon bycatch in US groundfish fisheries continues to be a problem in fisheries
management (NMFS 2009). Groundfish (Pacific halibut, Walleye pollock, Pacific cod,
flatfish, sablefish, and Atka mackerel) are the most abundant fisheries resource off the
East Bering Sea LME. The dominant species harvested are pollock and cod. Catch
quotas have been capped at 2 million tons for groundfish in the fishery management plan
for the East Bering Sea and Aleutian Islands. Reported annual landings of Alaska
pollock (Theragra chalcogramma), the largest catch of any species harvested in the US
EEZ, now range between 1.0 and 1.5 million tonnes, a level thought to be sustainable.
Pollock has fluctuated in the past decades as a result of variable year classes. Other
commercially valuable species include herring, rockfish, skate, Greenland turbot, sole,
plaice and crab. The centers of abundance for pelagic herring are in northern Bristol Bay
and Norton Sound (EPA 2004). This fishery occurs within state waters and is managed
by the Alaska Department of Fish and Game. From catch records it is clear that herring
biomass fluctuates widely due to the influence of strong and weak year-classes.
Species such as herring, pollock and Pacific cod show interannual variability in
recruitment that might be related to climate variability (EPA 2004). Herring biomass
fluctuates widely due to strong and weak year classes. Years of strong onshore
transport, typical of warm years in the East Bering Sea, correspond with strong
recruitment of Pollock (NMFS 2009). Annual summaries of pollock catches and other
groundfish, flatfish and invertebrates in the Eastern Bering Sea from 1954 to 1998 are
presented in Schumacher et al. (2003).
Major shellfish fisheries in the LME are king and snow crab. King and Tanner crab
fisheries are managed by the state of Alaska with advice from federal fisheries. Crab
resources are fully utilized. Catches are restricted by quotas, seasons, size and sex
limits. Shrimp are also managed by the state of Alaska. For biomass trends of crab
species from 1979 to 1993, and for finfish fishery exploitation rates compared with crab
recruitment in this LME, see Livingston et al. (1999). Nearshore fishery resources are
those coastal and estuarine species found in the 0-3 nautical mile zone of coastal state
waters. Pollock is targeted in the `Donut Hole' that exists in the high seas area outside of
the U.S. and Russian EEZs.
Historical catches in this area were very high and unsustainable. Since 1999, however,
there has been evidence of increased abundance of Alaska pollock in the Donut Hole,
coincident with the reduction of annual sea-ice cover (Overland et al. 2005). Another
species that appears to be increasing in abundance in response to warming conditions in
this LME is pink salmon (Overland et al. 2002 and 2005, Overland & Stabeno 2004),
whose catches were about 100 thousand tonnes in 2003 and 2004. Patterns of
production for salmon are inversely related to those in the California Current LME.
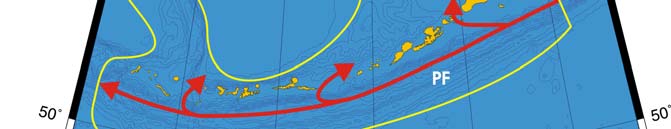
Total reported landings experienced a historic high of over 2.5 million tonnes between
1995 and 1990 (Figure XIV-45.4), with Alaska pollock dominating. In that period, the ex-
vessel value of the catches from the East Bering Sea LME was US$2.5 billion (Figure
XIV-45.5). The value of the salmon catch has declined due to a number of complex
worldwide factors (see IV. Socioeconomic Conditions).
XIV North East Pacific
609
Figure XIV-45.4. Total reported landings in the East Bering Sea LME by species (Sea Around Us 2007).
Figure XIV-45.5 Value of reported landings in the Eastern Bering Sea LME by commercial groups (Sea
Around Us 2007)
The primary production required (PPR) (Pauly & Christensen 1995) to sustain the
reported landings in this LME exceeded 45% of observed primary production in the late
1980s, and has remained around 40% in recent years (Figure XIV-45.6). The USA has
the largest share of the ecological footprint in this LME. The mean trophic level of the
reported landings (i.e., the MTI, Pauly & Watson 2005) declined from the 1950s to the
early 1970s, but has since leveled off at around 3.5 due to the high catch of Alaska
pollock. (Figure XIV-45.7, top). The geographic expansion which led to this dominance of
Alaska pollock is represented by the increase of the FiB index from the mid 1970s to the
mid-1980s (Figure XIV-45.7 bottom). The system appears sustainable according to
these two indices, although it must be stressed that such an interpretation is based on
the overwhelming effect of a single species.
610
45. East Bering Sea LME
Figure XIV-45.6. Primary production required to support reported landings (i.e., ecological footprint) as
fraction of the observed primary production in the East Bering LME (Sea Around Us 2007). The
`Maximum fraction' denotes the mean of the 5 highest values.
Figure XIV-45.7. Mean trophic level (i.e., Marine Trophic Index) (top) and Fishing-in-Balance Index
(bottom) in the East Bering Sea LME (Sea Around Us 2007)
The Stock-Catch Status Plots indicate that over 70% of the commercially exploited stocks
are now generating catches of 10% less than the historic maximum, corresponding to the
`collapsed' status in Figure XIV-45.8 (top). This is in line with the findings of Armstrong et
al. (1998), who reported, for an area immediately adjacent to the one considered here, on
serial depletion of the (frequently small) stocks of commercial invertebrates. However, the
overwhelming bulk of the reported landings for this LME is supplied by fully exploited
stocks of Alaska pollock (Figure XIV-45.8, bottom). The US National Marine Fisheries
Service (NMFS) includes "overfished" but not "collapsed" in its stock status categories. All
five species of Alaska salmon are fully utilized, and stocks in the LME have rebuilt to near
or beyond previous high levels. There is concern for some salmon stocks (especially
Chinook and chum salmon) along the East Bering Sea LME, due to overfishing,
XIV North East Pacific
611
incidental take of salmon as bycatch in other fisheries, and loss of freshwater spawning
and rearing habitats. There is however growing evidence of population increases of pink
salmon in Norton Sound and Kotzebue Sound, due perhaps to climatic changes. The
halibut fishery is not subject to overfishing. A Pacific halibut cap constrains these
fisheries. The Walleye Pollock stock in the LME is considered fully utilized and is well
managed for bycatch and other issues which include minimizing impacts on Steller sea
lion populations. Flatfish species are underutilized. The sablefish stock is fully utilized and
is harvested under an IFQ system. Skates and squids are underutilized. Alaska crab
resources are fully utilized (NMFS 2009). The difference between the two panels of
Figure XIV-45.8 is the greatest of all LMEs included in this volume. It illustrates the
contrast between the effect of prudent management in a few abundant stocks (bottom),
combined with serial depletion of what might be seen as minor stocks (top).
0%
100
10%
90
20%
)
80
%
(
s
30%
u
70
at
st
40%
y
60
b
s
k
50%
c
o
50
f
st
60%
40
er o
70%
mb
30
Nu
80%
20
90%
10
100%0
1950
1960
1970
1980
1990
2000
(n = 3724)
developing
fully exploited
over-exploited
collapsed
1950
1960
1970
1980
1990
2000
0%
100
10%
90
20%
80
)
%
30%
(
70
t
us
40%
t
a
60
s
k
c
50%
t
o
50
s
60%
h by
40
t
c
a
70%
C
30
80%
20
90%
10
100%0
1950
1960
1970
1980
1990
2000
(n = 3724)
developing
fully exploited
over-exploited
collapsed
Figure XIV-45.8. Stock-Catch Status Plots for the East Bering Sea LME, showing the proportion of
developing (green), fully exploited (yellow), overexploited (orange) and collapsed (purple) fisheries by
number of stocks (top) and by catch biomass (bottom) from 1950 to 2004. Note that (n), the number of
`stocks', i.e., individual landings time series, only include taxonomic entities at species, genus or family
level, i.e., higher and pooled groups have been excluded (see Pauly et al, this vol. for definitions).
The management regime annually updates fishing quotas based on biomass estimates,
including those for Alaska pollock. Because of the Steller sea lion interaction with
pollock, research is underway to study the dynamics and distribution of Steller sea lion
prey and predators, and to evaluate the connection with commercial fishing
(www.etl.noaa.gov/). An ecosystem approach is being implemented for the assessment
and management of fisheries biomass yields in the East Bering Sea LME. The basic
ecosystem consideration is a precautionary approach. All groundfish stocks are
considered healthy, providing sustained yields of approximately 2 mmt annually. Actions
are taken by the North Pacific Fisheries Management Council to annually cap a total
groundfish TAC based on NOAA-Fisheries survey operations (Witherell et al. 2000).
612
45. East Bering Sea LME
III. Pollution and Ecosystem Health
The coastal resources in this LME are generally in pristine condition. Coastal habitats
are favourable to, for instance, the high abundance of salmon and with minimal impact
from extensive development. Salmon being anadromous depend on freshwater streams,
rivers and lakes. Their health is directly influenced by land management practices. The
conservation of the region's salmon resource requires the conservation of the thousands
of miles of riparian habitat that support salmon production. Competing uses for this
habitat include logging, mining, oil and gas development, and industrial and urban
development. Contaminant levels are consistently below the EPA's level of concern
(EPA 2001 and 2004). Hypotheses concerned with the growing impacts of pollution,
overexploitation and environmental changes on sustained biomass yields are under
investigation. Concerns for the health of this LME focus on petroleum hydrocarbons
found in the tissue of marine mammals, and the effects of the growing industrialisation of
the region. Population levels of marine mammals in the coastal areas are low compared
to other shallow seas. For statistics concerning the harbour seal, Beluga whale and
harbor porpoise, see NOAA (1999, p. 231). Current regulations restrict the Aleutian
Islands pollock quota due to concerns over food competition with Steller sea lions in this
area, which contains critical habitat for the species. Marine mammal interactions with fish
and fisheries are a major concern in fishery resource management in this LME. Fisheries
compete for prey items that marine mammals and seabirds depend on for food and are a
major factor in the decline of sea lion populations. The Steller sea lion is listed as
threatened under the Endangered Species Act.
The East Bering Sea LME has low levels of toxic contaminants, but these have been
rising over the last 50 years due to increased human activities (mining, fishing and oil
exploration). This increase is linked to the long-range transport of contaminants through
the ocean and atmosphere from other regions. Cold region ecosystems such as the East
Bering Sea LME are more sensitive to the threat of contaminants than warmer regions
because the loss and breakdown of these contaminants are delayed at low temperatures.
Also, animals high in the food web with relatively large amounts of fat tend to accumulate
organic contaminants such as pesticides and PCBs (EEA 2004). This causes concerns
for human health in the region, particularly for Alaska natives, including the Aleut
community, who rely on marine mammals and seabirds as food sources. The EPA and
Indian Health Service contribute $20 million annually for water and sanitation projects
now underway in rural Alaska so that 85% of all Alaska households will have access to
safe water and basic sanitation (www.dced.state.ak.us.AEIS).
IV. Socioeconomic Conditions
The Alaskan coast east of the LME has a low population relative to its size and is distant
from major urban or industrial areas. More than 65,000 Native Americans live on the
shores of the East Bering Sea LME, with a long tradition of relying on salmon and other
marine resources for economic, cultural and subsistence purposes. Pacific salmon plays
an important and pivotal role, along with mining, timber, and furs, keystone natural
resources that led to the settling and development of the US's 49th state by non-native
peoples. Many Alaskans still depend heavily on salmon for recreation, food, and
industry. Recent declines in chum and sockeye salmon runs have added to the
hardships experienced by fishermen in Bristol Bay. The value of the salmon catch has
declined over the past decade, along with a rising trend in total worldwide salmon
production with the rapid growth of farmed salmon especially in Norway, Chile and the
United Kingdom. Nearshore fishery resources provide important subsistence and
recreational fishing opportunities for Alaskans of the East Bering Sea LME. Subsistence
fishing is distributed all along the coastline of the LME. The East Bering Sea herring
fishery began in the late 1920s, with a small salt-cure plant in Dutch Harbor in the
Aleutian Islands. Commercial harvesting and processing, along with rapidly growing
XIV North East Pacific
613
tourism and sport fishing, provide the region with big employment opportunities (NMFS
2009). According to statistics from the State of Alaska Department of Labor and
Workforce Development in 2005, nearly 80% of the private sector population was
engaged in fish harvesting or seafood processing in the Aleutian Islands. In the Bristol
Bay Region, 75%, of which 40% were non-residents, were employed in the regional
seafood industry (harvesting or processing). In the Yukon Delta Region, about 28%.were
engaged in fish harvesting or seafood processing. Recreational fishing continues to grow
due to an increase in guided fishing trips for visitors and tourists.
The East Bering Sea is home to a valuable offshore fishing industry. The interests of US
factory trawlers differ markedly from those of small fisheries. Much of the groundfish
catches are exported, particularly to Asia. This trade is a major source of revenue for US
fishermen. For an article on the political economy of the walleye pollock fishery, see
Criddle & Mackinko (2000). There are increasing demands from extractive industries to
log and drill for oil and gas development. Climate change is having and is expected to
have a profound influence on the socioeconomics of natural resources, goods and
services of the East Bering Sea LME. The U.S. National Science Foundation supports
studies of the physical, chemical and biological processes and human impacts to be
expected by the reduction of sea ice in the East Bering Sea (BEST 2003).
V. Governance
The East Bering Sea LME is bordered by the USA (State of Alaska). The Alaska Board
of Fisheries deals with the allocation of fish resources and quotas among various
fisheries. The North Pacific Fishery Management Council (NPFMC) has primary
responsibility for groundfish management within the US Exclusive Economic Zone (3 to
200 nautical miles) off the coasts of the East Bering Sea and Aleutian Islands, with the
goal of maintaining stable yields by regulating harvest allocations among species. It is
addressing the issue of salmon bycatch through time-area closures and bycatch limits set
for different gear types in groundfish fisheries. The Alaska native populations benefit
from individual fishing quotas or IFQs. There are also community development quotas
(CDQs). Pelagic and salmon fisheries occurring within 3 miles are managed by the
Alaska Department of Fish and Game. Improved management of the salmon fishery by
state and federal agencies has contributed to the high abundance of Pacific salmon.
High seas drift net fisheries by foreign nations for salmon has been eliminated through
UN Resolution 46/215. The management of high seas salmon is under the North Pacific
Anadromous Fish Commission. Initial signatories of the Commission are Canada, Japan,
Russian Federation, Korea, and the United States. The Convention for the Conservation
of Anadromous Stocks in the North Pacific Ocean has eliminated a former high seas
salmon fishery by Japan. An area involving salmon and negotiations with Canada
concerns the stocks and fisheries of the 2,000 mile long Yukon River system. The
agreement sets harvest quotas for Chinook and chum salmon stocks. The Magnuson-
Stevens Fishery Conservation and Management Act extended federal fisheries
management jurisdiction to 200 nautical miles and stimulated the growth of a domestic
Alaskan groundfish fishery that rapidly replaced foreign fisheries. The former
unregulated pollock fishery in the "Donut Hole" now comes under the Convention on the
Conservation and Management of Pollock Resources in the Central Bering Sea. The
Convention has been signed by the Russian Federation, Japan, Poland, China, Korea,
and the United States. A moratorium on pollock fishing was voluntarily imposed in 1993
(NMFS 2009). The Bureau of Indian Affairs has responsibility to protect and improve
trust assets of Alaska natives. Alaska has a Department of Environmental Conservation
(ADEC) responsible for assessing and controlling potential environmental degradation.
.
614
45. East Bering Sea LME
References
Armstrong, J., D. Armstrong and R. Hilborn 1998. Crustacean resources are vulnerable to serial
depletion the multifaceted decline of crab and shrimp fisheries in the Greater Gulf of Alaska.
Reviews in Fish Biology and Fisheries. 8(2): 117-176.
Belkin, I.M. (2008) Rapid warming of Large Marine Ecosystems, Progress in Oceanography, in
press.
Belkin, I.M. and Cornillon, P.C. (2005). Bering Sea thermal fronts from Pathfinder Data: Seasonal
and interannual variability. Pacific Oceanography 3(1):6-20.
Belkin, I.M., Cornillon, P.C., and Sherman, K. (2008). Fronts in Large Marine Ecosystems of the
world's oceans. Progress in Oceanography, in press.
Belkin, I.M., P.C. Cornillon, and D. Ullman (2003). Ocean fronts around Alaska from satellite SST
data, Proceedings of the Amer. Met. Soc. 7th Conf. on the Polar Meteorology and
Oceanography, Hyannis, MA, Paper 12.7, 15 pp.
BEST (2003). Workshop agenda, 2003. Bering Sea Ecosystem Study. www.arcus.org/Bering
/agenda.html
Carleton Ray, G. and Hayden. B.P. (1993). Marine biogeographic provinces of the Bering, Chukchi
and Beaufort seas, p 175-184 in: Sherman, K., Alexander, L.M. and Gold, B.D. (eds), Large
Marine Ecosystems: Stress, Mitigation and Sustainability. AAAS, Washington D.C., U.S.
Criddle, K.R. and Mackinko, S. (2000). Political economy and profit maximization in the Eastern
Bering Sea fishery for walleye pollock. IIFET 2000 Proceedings.
www.orst.edu/dept/IIFET/2000/papers/criddle.pdf
EEA (2004). Arctic environment European perspectives. Environmental Issue Report 38/2003.
http://reports.eea.eu.int/environmental_issue_report_2004_38/en
EPA (2001). National Coastal Condition Report. EPA-620/R-01-005. Office of Research and
Development/Office of Water, Washington D.C., U.S.
EPA (2004). National Coastal Condition Report 2. EPA-620/R-03-002. Office of Research and
Development/Office of Water. Washington D.C., U.S.
ETL (NOAA, Earth System Research Laboratory , Marine Ecological Studies and Physical
Sciences Division) at www.etl.noaa.gov/programs/marine/
Hare, S.R., and N.J. Mantua (2000) Empirical evidence for North Pacific regime shifts in 1977 and
1989, Progress in Oceanography, 47(2-4), 103-145.
Incze, L. and Schumacher, J.D. (1986). Variability of the environment and selected fisheries
resources of the Eastern Bering Sea Ecosystem, in: Sherman, K. and Alexander, L.M. (eds),
Variability and Management of Large Marine Ecosystems. AAAS Selected Symposium 99.
Westview Press, Boulder, U.S.
Livingston, P.A., Low, L.L. and Marasco, R.J. (1999). Eastern Bering Sea Ecosystem trends, p 140-
162 in: Sherman, K. and Tang, Q. (eds), Large Marine Ecosystems of the Pacific Rim:
Assessment, Sustainability and Management. Blackwell Science, Malden, U.S.
Mantua, N.J., S.R. Hare, Y. Zhang, J.M. Wallace, and R.C. Francis (1997) A Pacific decadal
climate oscillation with impacts on salmon, Bulletin of the American Meteorological Society,
78(6), 1069-1079.
Niebauer, H.J., Bond, N.A. Yakunin, L.P. and Plotnikov V.V. (1999) An update on the climatology
and sea ice of the Bering Sea, in Dynamics of the Bering Sea, edited by T.R. Loughlin and K.
Ohtani, pp. 2959, Alaska Sea Grant College Program, AK-SG-99-03, University of Alaska
Fairbanks.
NMFS (2009). Our living oceans. Draft report on the status of U.S. living marine resources, 6th
edition.
U.S. Dep. Commer., NOAA Tech. Memo. NMFS-F/SPO-80. 353 p.
NOAA (1999). Our living oceans. Report on the status of U.S. living marine resources. US
Department of Commerce, Washington D.C., U.S.
Overland, J.E. and Stabeno, P.J. (2004). Is the climate of the Bering Sea warming and affecting the
ecosystem? Transactions of the American Geophysical Union 85:309-310, 312.
Overland, J.E., Boldt, J. and Stabeno, P.J. (2005). Multiple indicators track major ecosystem shifts
in the Bering Sea. ICES CM 2005/M:21.
Overland, J.E., Wang, M. and Bond, N.A. (2002). Recent temperature changes in the western
Arctic during spring. Journal of Climate 15:1702-1716.
Pauly, D. and Christensen, V. (1995). Primary production required to sustain global fisheries.
Nature 374: 255-257.
XIV North East Pacific
615
Pauly, D. and Watson, R. (2005). Background and interpretation of the `Marine Trophic Index' as a
measure of biodiversity. Philosophical Transactions of the Royal Society: Biological Sciences
360: 415-423.
PICES (2005). Fisheries and Ecosystem Response to Recent Regime Shifts. Report of the Study
Group. North Pacific Marine Science Organisation. www.pices.int/publications/
scientific_reports/Report28/Rep_28_default.aspx
Schumacher, J.D., Bond, N.A., Brodeur, R.D., Livington, P.A., Napp, J.M. and Stabeno, P.J.
(2003). Climate change in the Southeastern Bering Sea and some consequences for its biota,
p 17-40 in: Hempel, G. and Sherman, K. (eds), Large Marine Ecosystems of the World: Trends
in Exploitation, Protection and Research. Elsevier Science, Amsterdam, The Netherlands.
Sea Around Us (2007). A Global Database on Marine Fisheries and Ecosystems. Fisheries Centre,
University British Columbia, Vancouver, Canada. www.seaaroundus.org/lme/Summary
Info.aspx?LME=1
Stabeno, P.J., Bond, N.A, Kachel, N.B., Salo, S.A. and Schumacher, J.D. (2001) On the temporal
variability of the physical environment over the south-eastern Bering Sea, Fisheries
Oceanography, 10(1), 8198.
Stabeno, P.J., N.A. Bond, S.A. Salo (2007) On the recent warming of the southeastern Bering Sea
Shelf, Progress in Oceanography, accepted.
State of Alaska Department of Labor and Workforce Development at www.labor.state.ak.us/
research/trends/nov07reg.pdf
Witherell, D., Pautzke, C. and Fluharty, D. (2000) An ecosystem-based approach for Alaska
groundfish fisheries. ICES Journal of Marine Science 57:771-777.
616
45. East Bering Sea LME
XIV North East Pacific
617
XIV-46 Gulf of Alaska LME
M.C. Aquarone and S. Adams
The Gulf of Alaska LME lies off the southern coast of Alaska and the western coast of
Canada. It is separated from the East Bering Sea LME by the Alaska Peninsula. The
cold Subarctic Current, as it bifurcates towards the south, serves as the boundary
between the Gulf of Alaska and the California Current LME. For a description of the Gulf
of Alaska's major currents, see www.pmel.noaa.gov/np/. The LME has a sub-Arctic
climate and is subject to interannual and interdecadal climate variations (Brodeur et al.
1999). The area of this LME is about 1.5 million km˛, of which 1.50% is protected, and
includes 0.52% of the world's sea mounts (as defined in Sea Around Us 2007 and
Kitchingman et al. 2007). There are 14 estuaries and river systems, including the Stikine
River, Copper River, and Chatham Sound (Skeena River). A book chapter pertaining to
this LME is by Brodeur et al. (1999).
I. Productivity
The Gulf of Alaska LME is considered a Class II, moderately productive ecosystem (150-
300 gCm-2yr-1). The LME's cold, nutrient-rich waters support a biologically diverse
ecosystem. Large-scale atmospheric and oceanographic conditions affect the productivity
of this LME. Changes in zooplankton biomass have been observed in both the Gulf of
Alaska LME and the adjacent California Current LME. These biomass changes appear
to be inversely related to each other (Brodeur et al. 1999). A well-documented climatic
regime shift occurring in the late 1970s caused the Alaska gyre to be centred more to the
east (Lagerloef 1995, Anderson & Piatt 1999). Brodeur and his co-authors suggested a
possibility of increases in the future production of salmon as a consequence of long-term
oceanographic shifts resulting in increases in plankton biomass in the last decade. More
information is available on climate variability and its effect on the abundance and
production of marine organisms in this LME (Hollowed et al. 1998). For more information
on the production dynamics of Alaska salmon in relation to oscillating periods of `warm'
and `cool' regimes, see Francis (1993), Francis & Hare (1994), and Hare & Francis
(1995).
Oceanic Fronts (Belkin et al. 2008): The Polar Front (PF) exists year-round in the
western part of the Gulf (Belkin et al. 2002) (Figure XIV-46.1). This front is associated
with the Subarctic Current that crosses the North Pacific from Hokkaido to the Gulf of
Alaska where it retroflects and flows along the Aleutian Island Chain, branching first into
the Eastern Bering Sea, then into the Western Bering Sea. Several fronts develop in
summer over the Alaskan Shelf (Belkin & Cornillon 2003, Belkin et al. 2003). The
conspicuous Kodiak Front (KF) is observed east and south of Kodiak Island, where its
quasi-stable location is controlled by local topography. The Inner Passage Front (IPF) is
located in a strait between the Queen Charlotte Islands and the British Columbia coast.
Gulf of Alaska LME SST (Belkin 2008)(Figure XIV-46.2)
Linear SST trend since 1957: 0.38°C.
Linear SST trend since 1982: 0.37°C.
Temporal SST variability in the Gulf of Alaska (GOA) LME is strong (Figure XIV-46.2). In
1957-2006, three successive regimes were: (1) rapid cooling by nearly 2°C from the
sharp peak of 1958 until 1971; (2) a cold spell in 1971-1976; (3) a warm epoch, from
1977 to the present. These epochs are best defined in the central GOA and off the
Queen Charlotte Islands (Mendelssohn et al., 2003, and Bograd et al., 2005). The

618
46. Gulf of Alaska
transition from the cold spell to the present warm epoch occurred during the North Pacific
regime shift of 1976-77 (see East Bering Sea LME). In general, the SST history of the
GOA is very similar to the East Bering Sea (EBS). In particular, SST swings in 1996-2006
were synchronic, from the absolute maximum in 1997 to a 1.4°C drop in 1999, to a
maximum in 2003-2005, followed by a drop in 2006. The observed synchronicity
between the GOA and EBS is suggestive of large-scale forcing that spans the eastern
North Pacific.
Figure XIV-46.1. Fronts of the Gulf of Alaska LME. IPF, Inner Passage Front; KF, Kodiak Front; PF, Polar
Front; SSF, Shelf-Slope (most probable location). Yellow line, LME boundary. After Belkin et al. (2008).
Figure XIV-46.2. Gulf of Alaska LME annual mean SST (left) and SST anomalies (right), 1957-2006,
based on Hadley climatology. After Belkin (2008).
XIV North East Pacific
619
Gulf of Alaska LME Chlorophyll and Primary Productivity: The Gulf of Alaska LME is
a Class II, moderately productive ecosystem (150-300 gCm-2yr-1)(Figure XIV-46.3).
Figure XIV-46.3. Trends in Gulf of Alaska LME chlorophyll a (left) and primary productivity (right), 1998-
2006, from satellite ocean colour imagery. Values are colour coded to the right hand ordinate. Figure
courtesy of J. O'Reilly and K. Hyde. Sources discussed p. 15 this volume.
II. Fish and Fisheries
This LME supports a number of commercially important fisheries for crab, shrimp,
scallops, walleye pollock, Pacific cod, rockfishes, sockeye salmon, pink salmon and
halibut. For information on salmon, pelagic, groundfish, shellfish and nearshore fisheries
in Alaska, see NMFS (1999). The largest fisheries for sockeye salmon, the salmon
species of highest commercial value in the US portion of the LME, occur in Cook Inlet,
Kodiak Island, and Prince William Sound. Chum salmon hatcheries produce a significant
portion of the catch. A quota, under the provisions of the Pacific Salmon Treaty between
Canada and the US, regulates the Chinook salmon harvest in this LME. Pacific herring is
the major pelagic species harvested in the LME. In Alaska, spawning fish concentrate in
Prince William Sound and around the Kodiak Island-Cook Inlet area (EPA 2004). The
groundfish complex (walleye pollock, Pacific cod, flatfish, sablefish, rockfish, and Atka
mackerel) is an abundant fisheries resource in the Gulf of Alaska LME but less so than in
the neighboring East Bering Sea LME. The extreme variation in pollock abundance is
primarily the result of environmental forcing. For information on abundance of larval
pollock, see Duffy-Anderson et al., 2002. Pollock are carefully managed due to concerns
about the impact of fisheries on endangered Steller sea lions for which pollock is a major
prey. Sea lion protection measures include closed areas and determinations of the
acceptable biological catch. The western part of the Gulf (Kodiak Island and along the
Alaska Peninsula) is a major area of operation for the shrimp fishery. Shrimp landings
rose and are now declining. King crab catches peaked in the mid 1960s. Almost all Gulf
of Alaska king crab fisheries have been closed since 1983. Dungeness crabs are
harvested in the Yakutat and Kodial areas of the Gulf of Alaska. Most nearshore fisheries
take place in the Gulf of Alaska LME near population centers (NMFS 2009). Current
information regarding US fisheries in the GOA is available from the NMFS Alaska Region
(www.fakr.noaa.gov), the Alaska Fisheries Science Center (www.afsc.noaa.gov), and the
Alaska Department of Fish and Game (www.cf.adfg.state.ak.us). Current information
regarding Canadian fisheries is available from Fisheries and Oceans, Canada, Pacific
Region (www.pac.dfo-mpo.gc.ca).
620
46. Gulf of Alaska
Total reported landings in this LME is in the order of 600 to 700 thousand tonnes, with a
peak of 800 thousand tonnes in 1993 (Figure XIV-46.4). The value of the reported
landings peaked in 1988 at nearly US$1.2 billion (calculated in 2000 US dollars) but has
since declined to about US$500 million in 2004 (Figure XIV-46.5).
Figure XIV-46.4. Total reported landings in the Gulf of Alaska Sea LME by species (Sea Around Us
2007)
Figure XIV-46.5. Value of reported landings in the Gulf of Alaska LME by commercial groups (Sea
Around Us 2007)
The primary production required (PPR) (Pauly & Christensen 1995) to sustain the
reported landings in this LME reached over 25% of the observed primary production in
XIV North East Pacific
621
the late 1980s, but leveled off at around 20% in recent years (Figure XIV-46.6). The USA
and Canada now account for all landings (i.e. ecological footprint) in this LME.
Figure XIV-46.6. Primary production required to support reported landings (i.e., ecological footprint) as
fraction of the observed primary production in the Gulf of Alaska LME (Sea Around Us 2007). The
`Maximum fraction' denotes the mean of the 5 highest values.
The mean trophic level of the fisheries landings (MTI) (Pauly & Watson 2005) is rather
high, especially in recent years (Figure XIV-46.7 top), while the increase in the Fishing-in-
Balance index in the early 1980s reflects the increased landings reported during that
period (Figure XIV-46.7 bottom).
Figure XIV-46.7. Mean trophic level (i.e., Marine Trophic Index) (top) and Fishing-in-Balance Index
(bottom) in the Gulf of Alaska LME (Sea Around Us 2007).
The Stock-Catch Status Plots indicate that over 30% of the commercially exploited stocks
are now generating catches of 10% or less than the historic maximum, corresponding to
622
46. Gulf of Alaska
the `collapsed' status (Figure XIV-46.8, top). Another 40% are generating catches from
50 to 10%, corresponding to the `overexploited ' status (see Pauly et al. this vol.). This is
explained by Armstrong et al. (1998), who reported on the serial depletion of (frequently
small) stocks of commercial invertebrates. However, 80%. (in bulk) of the reported
landings in the Gulf of Alaska LME are contributed by fully exploited (i.e., not
overexploited) stocks. (Figure XIV-46.8, bottom), thus confirming the positive assessment
also suggested by Figure XIV-46.7. The US National Marine Fisheries service (NMFS)
includes "overfished" but not "collapsed" in its stock status categories. NMFS 2009 lists
no overfished species. Several groundfish are presently underutilized and cannot be fully
harvested without exceeding the bycatch limits for Pacific halibut. Gulf of Alaska
groundfish stocks in the US are considered to be in a healthy condition as a result of
ecosystem-based management actions by the North Pacific Fishery Management
Council, which include public participation, reliance on scientific assessments,
conservative catch quotas built around annually determined overall fisheries biomass
yield catch, and total allowable catch levels for key species with the objective of long term
sustainability of fisheries stocks (Witherell et al, 2000; North Pacific Management
Council, 2002).
1950
1960
1970
1980
1990
2000
0%
100
10%
90
20%
)
80
%
(
s
30%
t
u
70
a
st
40%
y
60
b
ks
50%
c
o
50
f
st
60%
o
40
er
b
70%
m
30
Nu
80%
20
90%
10
100%0
1950
1960
1970
1980
1990
2000
(n = 2280)
developing
fully exploited
over-exploited
collapsed
1950
1960
1970
1980
1990
2000
0%
100
10%
90
20%
80
)
%
30%
(
70
s
u
40%
t
at
60
k s
c
50%
o
50
st
y
60%
b
h
40
t
c
70%
Ca
30
80%
20
90%
10
100%0
1950
1960
1970
1980
1990
2000
(n = 2280)
developing
fully exploited
over-exploited
collapsed
Figure XIV-46.8. Stock-Catch Status Plots for the Gulf of Alaska LME, showing the proportion of
developing (green), fully exploited (yellow), overexploited (orange) and collapsed (purple) fisheries by
number of stocks (top) and by catch biomass (bottom) from 1950 to 2004. Note that (n), the number of
`stocks', i.e., individual landings time series, only include taxonomic entities at species, genus or family
level, i.e., higher and pooled groups have been excluded (see Pauly et al, this vol. for definitions).
III. Pollution and Ecosystem Health
Because salmon are anadromous and spend a portion of their lives in freshwater
streams, rivers, and lakes, the health of salmon populations in this LME is directly
influenced by land management practices in both countries and the loss of freshwater
spawning and rearing habitats. Competing uses for the salmon habitat include logging,
mining, oil and gas development, and industrial and urban development. Prince William
Sound is an area of concern where large returns of hatchery pink salmon mix with lower
numbers of wild fish. The Gulf of Alaska Ecosystem Monitoring and Research Program is
XIV North East Pacific
623
a long-term effort to gather information about the physical and biological components of
the marine ecosystem, the cooperation of agencies, public involvement and access to
informative data. For pollution issues, see <www.evostc.state.ak.us/>. For information on
coastal condition for all of Alaska, see EPA 2001 and 2004. A sampling survey of the
ecological condition of Alaska's estuarine resources in the south-central region of the
state of Alaska was completed in 2002 (EPA 2004), with data collected from 55 sites.
Prince William Sound and Cook Inlet are major estuaries. The total allowable catch for
pollock in the Alaska is apportioned to accommodate Steller sea lion concerns, as pollock
are the major prey of Steller sea lions in the Gulf of Alaska. For information on clean
water assessments in Alaska, see EPA (2004). For statistics on harbour seals and
harbour porpoises in this LME, see NMFS (1999). Audubon red listed Alaskan seabirds
include Steller's eider, Spectacled eider, Sooty grouse, Laysan albatross, Black-footed
albatross, Short-tailed albatross, Pink-footed shearwater, Eskimo curlew, Rock
sandpiper, Buff-breasted sandpiper, Ivory gull, and murrelet.
Problems affecting the LME include predation by invasive species, discharges of oil
products, and industrial and agricultural contaminants that enter the LME through a
variety of pathways (ocean currents, prevailing winds). Prince William Sound is routinely
crossed by large oil tankers. In 1989, the Exxon Valdez spilled 11 million gallons of North
Slope crude oil off the Port of Valdez, the terminal of the Trans-Alaskan Pipeline. This
was the largest tanker oil spill in U.S. history and it contaminated over 2,000 km of the
Gulf of Alaska's coastline. The livelihood of 70,000 full-time residents living in the area
was directly affected by the Exxon Valdez oil spill. They had to overcome the effects of
the oil-related fish mortalities. Others using the area seasonally for work or recreation
were also seriously affected. There remain concerns about the lingering effects of the oil
spill and the pockets of residual oil in the environment, especially in the Western portion
of Prince William Sound. The effects of the oil spill interact with the effects of other kinds
of changes and perturbations in the marine ecosystem. More common than spills,
however, are smaller discharges of refined oil products, crude oil and hazardous
substances.
IV. Socioeconomic Conditions
The LME coastal population is low relative to the length of the coastline, with the
exception of the city area of Vancouver in the Canadian province of British Columbia.
Native peoples have a long and rich tradition of relying on salmon for economic, cultural,
and subsistence purposes. The coastal native communities rely for their subsistence
largely on hunting and the harvesting of marine resources. The economy of the coastal
communities is based on commercial fishing of pink and red salmon, fish processing,
timber, minerals, agriculture and tourism. Pacific salmon has played a pivotal role in the
history of the region. Although commercial salmon harvests are at high levels, the value
of the catch has declined due to a number of world wide reasons, one of which is a rising
trend in salmon farmed production in Norway, Chile, and the United Kingdom. Alaska's
herring industry began in the late 19th century and expanded rapidly, with markets shifting
from salt-cured herring to reduction products for fishmeal and oil (NMFS 2009). Shellfish
fisheries developed in the 1960s in the Gulf of Alaska (NMFS 1999). US groundfish
catches are exported to Asia, which constitutes a major source of revenue for US
fishermen. The estuarine resources of Prince William Sound and Cook Inlet in Alaska are
of major importance for the local and state economy. Conflicts have emerged between
coastal and offshore interests. In addition to jobs in fishing and fish processing, people in
Gulf of Alaska communities work in government, military (Kodiak U.S. Coast Guard
base), logging, mining and tourism. In 1998, there was an increase of visitors to over 1
million a year in Alaska. Colt et al. (2007) estimate summer 2005 revenue from nature-
based tourism activities in Chichagof Island alone at $15.5 million.
624
46. Gulf of Alaska
V. Governance
The Gulf of Alaska LME is bordered by the U.S. and Canada, each with separate
government actions and management plans. In 2004, Amendment #66 to the Halibut and
Sablefish program became a law that allowed eligible coastal communities in Alaska to
purchase halibut and sablefish quota shares. The North Pacific Fishery Management
Council, in conjunction with NOAA, produces a Gulf of Alaska Groundfish Fishery
Management Plan for Alaska. The Gulf of Alaska Coastal Communities Coalition has
identified 42 communities within Alaska eligible to participate in a program to form a CQE
(Community Quota Entity), a non-profit corporation for the purchasing of quota shares
(www.goac3.org). The program helps compensate for the negative impacts of Individual
Fishing Quotas (IFQs) on subsistence fishers. The transboundary management of Pacific
salmon (sockeye, chum, pink, chinook, coho and steelhead salmon) is conducted under
the Pacific Salmon Treaty (www.oceanlaw.net), signed in 1985 by Canada and the US.
The Treaty is intended to facilitate the management of these salmon stocks by preventing
overfishing and providing for optimum production and equitable sharing of the salmon
catch. Catch quota levels since 1999 are subject to fluctuations of salmon abundance
from year to year. Major transboundary concerns between the two countries are:
Chinook salmon catches in southeastern Alaska where Canadian salmon are caught
along with other non-Alaska US stocks; fisheries in the Dixon Entrance where each
country catches salmon originating in the other nation; transboundary river stocks
associated primarily with the Taku and Stikine Rivers; Canadian fisheries off the west
coast of Vancouver Island; and Strait of Juan de Fuca fisheries for salmon bound for the
Fraser River in Canada (NMFS 2009). The North Pacific Anadromous Fish Commission
(NPAFC) manages the salmon harvest in the high seas. Signatories are Canada, Japan,
Russian Federation, United States and Korea. The Convention prohibits high seas
salmon fishing and trafficking of illegally caught salmon. United Nations Resolution
46/215 bans large scale pelagic driftnet fishing in the world's oceans. The Convention for
the Conservation of Anadromous Stocks in the North Pacific Ocean seeks to control the
interception and incidental take of the LME's salmon resources. Pacific Halibut is also a
target of transboundary management. The resource is managed by a bilateral treaty
between the US and Canada, with recommendations coming from the International
Pacific Halibut Commission. Both Canada and Alaska have moved to regulating halibut
fisheries subareas through catch quotas, time-area restrictions, and by individual fishing
quotas (IFQs). Under the IFQ system there has been a decline in the overall size of the
fishing fleet.
In the aftermath of the Exxon Valdez oil spill, the US Congress crafted the Oil Pollution
Act of 1990 (OPA 90). Under OPA 90, two Regional Citizen Advisory Councils were
created, one for Prince William Sound, and one for Cook Inlet (EPA 2004). In the US, the
Magnuson-Stevens Fishery Conservation and Management Act extended federal
fisheries management jurisdiction to 200 nautical miles and stimulated the growth of a
domestic Alaskan groundfish fishery that rapidly replaced the foreign fisheries. Pacific
ocean perch was intensively exploited by foreign fleets in the 1960s. Inshore groundfish
resources are managed by the Alaska Department of Fish and Game.
References
Anderson, P.J. and Piatt, J.F. (1999). Community reorganization in the Gulf of Alaska following
ocean climate regime shift. Marine Ecology Progress Series 189:117-123.
Armstrong, J., D. Armstrong and R. Hilborn 1998. Crustacean resources are vulnerable to serial
depletion the multifaceted decline of crab and shrimp fisheries in the Greater Gulf of Alaska.
Reviews in Fish Biology and Fisheries. 8(2): 117-176.
XIV North East Pacific
625
Belkin, I.M. (2008) Rapid warming of Large Marine Ecosystems, Progress in Oceanography, in
press.
Belkin, I.M. and Cornillon, P.C. (2003). SST fronts of the Pacific coastal and marginal seas. Pacific
Oceanography 1(2):90-113.
Belkin, I.M., Cornillon, P.C., and Sherman, K. (2008). Fronts in Large Marine Ecosystems of the
world's oceans. Progress in Oceanography, in press.
Belkin, I.M., Cornillon, P. and Ullman, D. (2003). Ocean fronts around Alaska from satellite SST
data, Paper 12.7. in: Proceedings of the American Meteorological Society, 7th Conference on
the Polar Meteorology and Oceanography. Hyannis, U.S.
Belkin, I.M., R. Krishfield and S. Honjo (2002) Decadal variability of the North Pacific Polar Front:
Subsurface warming versus surface cooling, Geophysical Research Letters, 29(9), doi:
10.1029/2001GL013806.
Bograd, S.J., R. Mendelssohn, Schwing, F.B. and Miller, A.J. (2005). Spatial heterogeneity of sea
surface temperature trends in the Gulf of Alaska. Atmosphere-Ocean 43(3):241-247.
Brodeur, R.D., Frost, B.W., Hare, S., Francis, R. and Ingraham, W.J. (1999). Interannual variations
in zooplankton biomass in the Gulf of Alaska, and covariation with California Current
zooplankton biomass, p 106-138 in: Sherman, K. and Tang, Q. (eds), Large Marine
Ecosystems of the Pacific Rim: Assessment, Sustainability and Management. Blackwel
Science, Malden, U.S.
Canada Fisheries and Oceans. www.pac.dfo-mpo.gc.ca).
Colt, S., Dugan, D., Fay, G. (2007) The Regional Economy of Southeast Alaska. Report prepared
for Alaska Conservation Foundation (available at www.iser.uaa.alaska.edu).
Duffy-Anderson, J., Bailey, K.M. and Ciannelli, L. (2002). Consequences of a superabundance of
larval walleye pollock, Theragra chalcogramma, in the Gulf of Alaska in 1981. Marine Ecology
Progress Series 143:179-190.
EPA (2001). National Coastal Condition Report. EPA-620/R-01-005. Office of Research and
Development/Office of Water, Washington D.C., U.S.
EPA (2004). National Coastal Condition Report 2. EPA-620/R-03-002. Office of Research and
Development/Office of Water, Washington D.C., U.S.
Francis, R.C. (1993). Climate change and salmonid production in the North Pacific Ocean, p 33-43
in: Redmond, K.T. and Tharp, V.L. (eds), Proceedings of the Ninth Annual Pacific Climate
(PACLIM) Workshop. California Department of Water Resources, Interagenct Ecological
Studies Program, Technical Report 34.
Francis, R.C. and Hare, S.R. (1994). Decadal-scale regime shifts in the large marine ecosystems of
the North-east Pacific: A case for historical science. Fisheries Oceanography 3:279-291.
Hare, S.R., and Francis, R.C. (1995). Climate change and salmon production in the Northeast
Pacific Ocean. Canadian Special Publication of Fisheries and Aquatic Sciences 121:357-372.
Hollowed, A.B., Hare, S.R. and Wooster, W.S. (1998). Pacific basin climate variability and patterns
of northeast Pacific marine fish production, p 89-104 in: Biotic Impacts of Extratropical Climate
Variability in the Pacific. Proceedings of Hawaiian Winter Workshop, University of Hawaii,
Manoa. www.iphc.washington.edu/Staff/hare/html/papers/control/ben4.pdf.
Kitchingman, A., Lai, S., Morato, T. and D. Pauly. 2007. How many seamounts are there and where
are they located? Chapter 2, p. 26-40 In: T.J. Pitcher, T. Morato, P. Hart, M. Clark, N. Haggan
and R. Santo (eds.), Seamounts: Ecology Fisheries and Conservation. Blackwell Fish and
Aquatic Resources Series. 12, Oxford, U.K.
Lagerloef, G.S.E. (1995). Interdecadal variations in the Alask Gyre. Journal of Physical
Oceanography 25:2242-2258.
Mendelssohn, R., S. Bograd, F. Schwing, and N. Foley-Mendelssohn (2003) Climate trends in the
Gulf of Alaska and the Bering Sea, 1950-1997: Ecosystem implications,
http://globec.coas.oregonstate.edu/reports/si_mtgs/si_jan03/si_03_mendelssohn_01.pdf
NMFS (1999). Our Living Oceans. Report on the Status of U.S. Living Marine Resources, 1999.
U.S Department of Commerce, NOAA Tech. Memo. NMFS-F/SPO-41, Washington D.C., U.S.
NMFS (2009). Our living oceans. Draft report on the status of U.S. living marine resources, 6th
edition.
U.S. Dep. Commer., NOAA Tech. Memo. NMFS-F/SPO-80. 353 p.
North Pacific Fishery Management Council (2002) Responsible Fisheries Management into the 21st
Century.
Pacific Salmon Treaty at www.oceanlaw.net/texts/psc.htm
Pauly, D. and Christensen, V. (1995). Primary production required to sustain global fisheries.
Nature 374: 255-257.
626
46. Gulf of Alaska
Pauly, D. and Watson, R. (2005). Background and interpretation of the `Marine Trophic Index' as a
measure of biodiversity. Philosophical Transactions of the Royal Society: Biological Sciences
360: 415-423.
Sea Around Us (2007). A Global Database on Marine Fisheries and Ecosystems. Fisheries Centre,
University British Columbia, Vancouver, Canada. www.seaaroundus.org/lme/
SummaryInfo.aspx?LME=2
Witherell, D., Pautzke, C. and Fluharty, D. (2000) An ecosystem-based approach for Alaska
groundfish fisheries. ICES Journal of Marine Science 57:771-777.
XIV North East Pacific
627
XIV-47 Gulf of California LME
S. Heileman
The Gulf of California LME (also known as the Sea of Cortez) is a long (1,130 km) and
narrow (80-290 km), semi-enclosed LME bordered by the Baja California Peninsula and
mainland Mexico. It has a surface area of about 221,600 km2, of which 3.64% is
protected, and includes 0.11% and 0.06% of the world's coral reefs and sea mounts,
respectively (Sea Around Us 2007). The Gulf is one of the youngest ocean bodies and
was formed by the separation of the North American Plate and the Pacific Plate by
tectonic movement (Rusnak et al. 1964). Several deep basins (up to 3,600 m deep)
occur in the southern part of the Gulf, including the Guaymas Basin. The northern part of
the Gulf is shallower, due to the large amount of siltation produced over the years by the
Colorado, the major river entering this LME. There are 898 islands of all sizes within the
Gulf, included in the `Area de Protección de Flora y Fauna Islas del Golfo de California'
(Islands of the Gulf of California Flora and Fauna Protection Area) (SEMARNAP 1999).
A report pertaining to this LME is UNEP (2004).
I. Productivity
Surface winds have an average direction that generally follows the axis of the Gulf
(Marinone et al. 2004). Tropical storms and hurricanes can cause heavy rainfall and
intensified water and sediment runoff. SST seasonality is very conspicuous. Highest
annual SST is observed during August and September (30-31ş C south of the islands).
Between October and December, the SST of the northern Gulf falls by almost 20° C and
of the central and southern by about 7ş C. Intense tidal mixing and upwelling maintain
minimum SSTs around the mid-gulf islands throughout the year (Marinone & Lavín 2003).
The largest interannual variability signal in the Gulf SST is due to El Nińo-La Nińa. The
largest SST positive anomaly in the satellite records is that of 1997-1998, 3ş C over the
seasonal climatology, while the largest negative anomaly is associated with the 1988-
1989 La Nińa (4şC below the climatological mean). SST anomalies due to El Nińo tend
to be strongest in the region just south of the mid-gulf islands (Soto-Mardones et al.
1999, Lavín et al. 2003).
The Gulf has unique oceanographic characteristics because of its long axis and the Baja
California Peninsula limit moderating influences from the Pacific Ocean circulation.
Water circulation varies in time from two main influences: diurnal, semidiurnal, and
fortnightly tidal cycles, and annual and semiannual seasonal changes. The tides, which
co-oscillate with those of the Pacific Ocean, are mixed semi-diurnal tides, with one of the
greatest tidal ranges on Earth. For instance, maximum registered spring tidal range at
San Felipe is 6.95 m (Gutierrez & González 1999), with even larger amplitudes at the
entrance to the Colorado Delta. The best-documented features of Gulf of California
circulation are large-scale seasonally reversing gyres in the northern Gulf. A cyclonic
gyre lasts approximately from June to September, and an anticyclonic gyre from
November to April. Estimates from ship drift and the distributions of temperature and
salinity indicate surface outflow during winter and inflow during summer, with mass
conservation requiring a compensating flow at depth (Lavín et al. 1997, Berón-Vera &
Ripa 2002, Castro 2001, Palacios-Hernández et al. 2002, Marinone & Lavín 2003, Lluch-
Cota et al. 2004).
The LME is a Class I, highly productive ecosystem (>300 gCm-2yr-1), and is one of the
five marine ecosystems with high productivity (Enríquez-Andrade et al. 2005). The
northern Gulf has two main natural fertilisation mechanisms: one is the year-round tidal

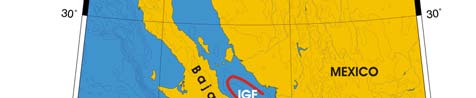
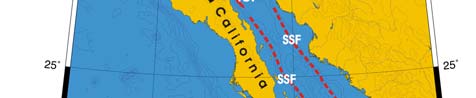
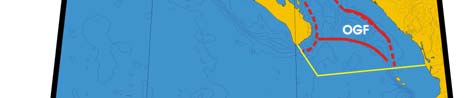
628
47. Gulf of California
mixing around the large islands leading to an area of strong vertical mixing and
continuous flow of cool nutrient-rich water into the euphotic layer, providing a thermal
refuge for temperate species during the warmer periods (Lluch-Belda et al. 2003); the
second is wind-induced upwelling along the eastern central gulf, enriched waters from the
islands and the east coast reaching the peninsular side and remaining trapped,
contributing to higher primary production per unit area. Also, because this enrichment
system operates only during winter, there is a strong annual gradient of pigment
concentration in most of the Gulf (Lluch-Cota et al. 2004, 2007).
The Guaymas Trench has volcanic and hydrothermal vents, with biotic communities
supported by chemosynthesis using hydrogen sulfide, rather than photosynthesis (Teske
et al. 2002). One of the most diverse biological communities in the world is found in this
LME, with 4,852 species of invertebrates, excluding copepods and ostracods, (767
endemic), 891 species of fish (88 endemic) and 222 species of non-fish vertebrates, (four
endemic) (Enríquez-Andrade et al. 2005). An outstanding diversity of marine mammal
species is also found in the LME: 36 species, including 4 pinnipeds, 31 cetaceans and
one bat (Aurioles-Gamboa 1993, Brusca et al. 2004). This LME is also the habitat of one
of the world's most endangered cetaceans, the Vaquita porpoise (Phocoena sinus),
endemic to the upper Gulf and the world's smallest and rarest porpoise. The blue, fin
and grey whales are also found in this LME. The high primary productivity supports
sardine and anchovy, which are the main prey of large quantities of squid, fish, seabirds
and marine mammals.
Oceanic Fronts: This is one of the smallest LMEs, located between Baja California and
Mexico's mainland. The temperature contrast between the northern and southern Gulf is
2şC to 3şC, depending on the season. This gradient is enhanced along a bathymetric
step in the middle of the Gulf, where a thermal front is observed (Inner Gulf Front, IGF)
(Figure XIV-47.1).
Figure XIV-47.1. Fronts of the Gulf of California LME. IGF, Inner Gulf Front; OGF, Outer Gulf fronts; SSF,
Shelf-Slope Front (most probable location). Yellow line, LME boundary. GMT 2005 August 1 06:01:47.
OMC Martin Weinelt. Courtesy of I. Belkin October 2005.
XIV North East Pacific
629
Other fronts form between Mexico's mainland and Baja California where Pacific inflow
waters meet resident waters of the Gulf of California (Outer Gulf fronts (OGF) (Belkin et
al. 2005). The Pacific and resident waters have different salinities and different
temperatures; the salinity differential is the main factor responsible for the maintenance of
this front.
Gulf of California SST
Linear SST trend since 1957: 1.24°C.
Linear SST trend since 1982: 0.31°C.
The semi-landlocked Gulf of California shares some similarities with the California
Current. The global cooling of the 1960s-1970s manifested here as a 2.2°C drop from
1958 to 1975. After a 2.8°C rebound in 1979-1983, the Gulf of California remained warm
until the present. The sharp SST peak of 1983 attributed to a major El Nińo 1982-1983
was synchronous with similar peaks in the California Current LME, the Central American
Pacific LME and the Humboldt Current LME. Since 1983, the Gulf of California thermal
history is strongly correlated with the California Current LME, including major events
(peaks) of 1992 and 1997, associated with major El Nińo events.
The relatively small warming of 0.31°C over the last 25 years is misleading since the
transition from the cold epoch to the warm occurred in the late 1970s. Regardless of the
exact timing of the breakpoint between the cold and warm epochs (1975 or 1979), the
overall warming since then exceeded 1.5°C, which would put the Gulf of California into
the league of fast-warming LMEs. The absolute minimum in 1975 was synchronous with
absolute minima in both adjacent LMEs, the California Current LME and Central-
American Pacific LME.
The Gulf of California is considered to be a primary source of moisture for the North
American or Mexican monsoon, "the most regular and predictable weather pattern in
North America" (Mitchell et al., 2002, p.2261), therefore warmer surface temperatures are
expected to increase evaporation from the Gulf, which in turn would fuel stronger
Mexican monsoons.
Figure XIV-47.2. Gulf of California annual mean SST and annual SST anomalies, 1957-2006. After
Belkin 2008.
630
47. Gulf of California
Gulf of California Chlorophyll and Primary Productivity: The LME is a Class I, highly
productive ecosystem (>300 gCm-2yr-1),
Figure XIV-47.3. Gulf of California trends in chlorophyll a and primary productivity, 1998-2006. Values
are colour coded to the right hand ordinate. Figure courtesy of J. O'Reilly and K. Hyde. Sources
discussed p. 15 this volume.
II. Fish and Fisheries
Historically, the LME has supported numerous fisheries of commercially valuable
species. Fisheries resources in the Gulf are targeted by the commercial, artisanal, and
recreational fishing sectors. In terms of weight caught, the major fisheries are dominated
by small pelagic fish, primarily Californian anchovy (Engraulis mordax) and South
American pilchard (Sardinops sagax [formerly known as Pacific sardine, Sardinops
caeruleus]), as well as penaeid shrimps (blue, white and brown shrimp, Litopenaeus
stylirostris, Litopenaeus vannamei, Farfantepenaeus californiensis, respectively, together
with other less important species). Californian anchovy (Engraulis mordax) undergoes
major scale abundance fluctuations related to environmental variation (Nevárez-Martínez
et al. 2001). Jumbo squid (Dosidicus gigas), also a highly variable resource, is a major
constituent in recent years (Nevárez-Martínez et al. 2000; Lluch-Cota 2007)). At a lower
level of abundance, but much more consistent, are larger pelagic tuna-like fishes (mostly
yellowfin and skipjack tuna) representing important commercial fisheries. The total
annual catch of tuna-like resources increased rapidly from the late 1970s to peak in the
mid 1980s. This increase was followed by a general downward trend until 1995, when
catches began to increase again. The trend in catch of tuna-like species is mirrored by
that of small pelagic fish.
Due to difficulties in separating landing from the Mexican State of Baja California Sur into
components from the Gulf of California and those from the Pacific coast (and belonging
mainly to the California Current LME), the values presented in Figure XIV-47.4 are only
indicative of the magnitude of the catches in this small, yet highly productive LME, In
particular, they differ from catch series (1980-2002) for `sardines', jumbo squids', and
`shrimps' (though they match for tuna) presented in the review by Lluch-Cota et al. (2007,
Fig. 5), which was not available when Figure XIV-47.4 and derived graphs (Figures XIV-
47.5-10) were obtained. However, these graphs can still be expected to give a general
impression of the fisheries and their status in the Gulf of California LME. [See
www.seaaroundus.org for updated version on these graphs]
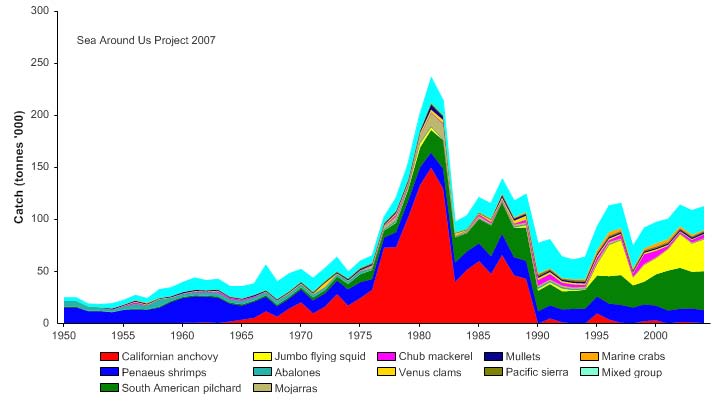
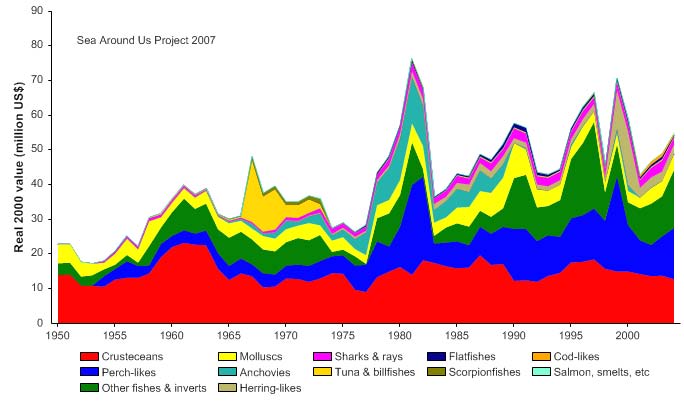
XIV North East Pacific
631
Figure XIV-47.6. Total reported landings in the Gulf of California LME by species (Sea Around Us 2007);
see www.seaaroundus.org for a corrected update.
Figure XIV-47.7. Value of reported landings in the Gulf of California LME by commercial groups (Sea
Around Us 2007); see www.seaaroundus.org for a corrected update.
The primary production required (PPR; Pauly & Christensen 1995) to sustain the reported
landings reached 10% of the observed primary production in 1996 and has fluctuated
between 5 to 9% in recent years (Figure XIV-47.6). Accounting for the catches in Fig. 5
of Lluch-Cota et al. (2007) would increase this figure to 15% at most. Since the mid
1970s, Mexico has been the only country fishing in this LME and hence accounts for all
of the ecological footprint.
632
47. Gulf of California
Figure XIV-47.8. Primary production required to support reported landings (i.e., ecological footprint) as
fraction of the observed primary production in the Gulf of California LME (Sea Around Us 2007). The
`Maximum fraction' denotes the mean of the 5 highest values; see www.seaaroundus.org for a
corrected update.
The mean trophic level of the reported landings (MTI; Pauly & Watson 2005), has
increased from 1950 to the early 1970s, and remained relatively steady thereafter, except
for a more recent increase (Figure XIV-47.7 top). The FiB index suggests a spatial
expansion of the fisheries until the early 1980s, and has remained relatively level since,
suggesting that natural limits may have been reached (Figure XIV-47.7 bottom).
Figure XIV-47.9. Mean trophic level (i.e., Marine Trophic Index) (top) and Fishing-in-Balance Index
(bottom) in the Gulf of California LME (Sea Around Us 2007); see www.seaaroundus.org for a corrected
update.
A decline in trophic levels in the coastal food webs of this LME was reported by Sala et
al. (2004), based on interviews with fishers, fisheries statistics and field surveys.
According to Sala and colleagues, the decline in fish stocks has been accompanied by a
marked shift in the species composition of the coastal fisheries and a decrease in the
maximum individual length of fish catches by approximately 45 cm in 20 years. Large
XIV North East Pacific
633
predatory fishes were among the most important catches in the 1970s, but became rare
by 2000. Moreover, species that were not targeted in the 1970s have now become
common in the catches. These findings contradict the conclusion of Pérez-Espańa
(2004) who, strangely, failed to find evidence of `fishing down the food web' in this LME.
The work of Saenz-Arroyo et al. (2005a, 2005b, 2006), and of Lozano-Montes et al.
2008) should, in any case, lay this controversy to rest as these authors not only
demonstrated massive changes in the catch composition of the Gulf of California
fisheries, but also that the bulk of these changes occurred before the period covered
here, which, put them before the cognitive reach of researchers using based only on
official catch statistics (Pauly 1995).
The Stock-Catch Status Plots indicate that the number of collapsed and overexploited
stocks have been increasing in the LME, to about 70% of the commercially exploited
stocks (Figure XIV-47.10 top). These stocks supply half of the reported landings (Figure
XIV-47.10, bottom).
Several authors have suggested that the LME's fish resources are overexploited and
regard the impacts of overfishing as severe, at least in the upper Gulf (Brusca et al.
2001). Distinct areas of concern include: impacts of fishing on shrimp populations,
impacts of shrimp fishing on non-targeted populations (mostly the bycatch issue) and on
the physical habitat, and catch of fish for bait and in sport fisheries.
0%
100
10%
90
20%
)
80
%
(
s
30%
u
70
at
st
40%
y
60
50%
cks b
o
50
f
st
60%
40
er o
b
70%
m
30
Nu
80%
20
90%
10
100%0
1950
1960
1970
1980
1990
2000
(n = 1823)
developing
fully exploited
over-exploited
collapsed
1950
1960
1970
1980
1990
2000
0%
100
10%
90
20%
80
)
%
30%
(
70
t
us
40%
t
a
60
s
k
50%
t
oc
50
s
60%
h by
40
t
c
a
70%
C
30
80%
20
90%
10
100%0
1950
1960
1970
1980
1990
2000
(n = 1823)
developing
fully exploited
over-exploited
collapsed
Figure XIV-47.10. Stock-Catch Status Plots for the Gulf of California LME, showing the proportion of
developing (green), fully exploited (yellow), overexploited (orange) and collapsed (purple) fisheries by
number of stocks (top) and by catch biomass (bottom) from 1950 to 2004. Note that (n), the number of
`stocks', i.e., individual landings time series, only include taxonomic entities at species, genus or family
level, i.e., higher and pooled groups have been excluded (see Pauly et al, this vol. for definitions).
The abundance and availability of small pelagic fish fluctuate mostly because of natural
environmental variations at various interannual scales, as shown by several studies
including paleosedimentary evidence for the last 250 years (Holmgren-Urba &
Baumgartner 1993, Cisneros-Mata et al. 1995a, Lluch-Cota et al.1999, Nevárez et al.
634
47. Gulf of California
2001). The sudden collapse of the sardine population during the 1991-1993 fishing
seasons was related to overfishing and natural variation (Cisneros-Mata et al. 1995a,
Nevárez et al. 1999), and resulted in the closure of more than 50% of the fish plants.
However, the industry and governmental and research agencies together agreed on time
and area closures, a reduction of the fishing fleet by 50% and a programme of research
cruises to monitor recruitment. The fishery fully recovered after three years. No major
concerns seem to be related to the fisheries for jumbo squid and tuna-like fishes.
The shrimp fishery, which has been assessed since the 1970s, was found to be
overfished as a result of excessive fishing effort and small mesh size in the trawl nets.
Since then, fishing effort has increased further with the increase in the number of large
boats and their fishing power, but most of all, with the number of outboard powered
pangas now fishing for offshore shrimp. According to data in Páez et al. (2003), total
shrimp catch has been declining by an average of 600 tonnes per year in the period
1980-2001, while shrimp aquaculture has increased by 30% per year since 1990 and
now exceeds the catch. Natural variation may further impact shrimp abundance, as
suggested several decades ago (Castro-Aguirre 1976). Galindo-Bect et al. (2000) found
a significant correlation between total shrimp catch in the upper Gulf and the rate of
freshwater discharge by the Colorado River. Although the damming of the Colorado
River may have been the principle cause of the decline in the shrimp fishery, the
escalation in the number of fishing vessels and fishing gear types could have also
contributed to this decline (UNEP 2004). Catches of offshore shrimp could improve
substantially both in volume and individual sizes if fishing effort were to be reduced to
adequate levels and mesh sizes regulated for optimum selectivity. While it would appear
that the trend has been to allow more fishers to participate as a means of further
distributing the benefits, it is becoming increasingly clear that such a process has
involved extra financing through tax exemptions and subsidies and is no longer viable.
Conservation International Mexico (2003) has estimated that each kilogramme of shrimp
caught in the commercial fishery is accompanied by at least 10 kg of bycatch. (Tis
bycatch is not included in catch statistics, but should be). Estimates for the Gulf of
California LME have ranged from 1:2 up to 1:10 (Rosales 1976) and larger at times. This
proportion is similar to those reported for shrimp fisheries in tropical areas around the
world, i.e., 1:10 (Cascorbi 2004). The magnitude of bycatch is highly variable, depending
on area and season. At the beginning of the shrimp season the proportion may be lower;
bycatch tends to increase towards the end of the season, when shrimps have been
fished out. The National Fisheries Institute of Mexico (INP) began developing fish
excluders together with Conservation International in 1992, particularly directed to the
protection of totoaba Cynoscion macdonaldi (Balmori et al. 2003). Such efforts have
continued with the FAO on an international project to develop suitable excluders.
Some species, such as juveniles of totoaba, a large endemic species that was heavily
fished during the 1930s-1940s, and marine turtles, both vulnerable to trawl nets, are of
particular concern. Cisneros-Mata et al. (1995b) estimated that an average of 120,300
juvenile totoaba was killed by shrimp vessels each year from 1979 to 1987. Other icon
species, such as dolphins, are rarely killed by these gears. Vaquitas and sea turtles are
incidentally captured in gill nets. The total estimated incidental mortality caused by the
fleet of El Golfo de Santa Clara was 39 Vaquitas per year, over 17% of the most recent
estimate of population size (D'Agrosa et al. 2000). The vaquita population is estimated to
be less than 600 (Jaramillo-Legorreta et al. 1999). Therefore, considering normal
replacement rates (maximum rate of population growth for cetaceans is of 10% per year),
this incidental loss is unsustainable. Although turtle-excluder devices are mandatory for
industrial fishing vessels, poaching of sea turtles is still a problem throughout western
Mexico.
XIV North East Pacific
635
The impacts of the trawl fishery on the ecosystem are a major concern. Anecdotal
information suggests that sweeping changes in benthic community structure have taken
place over the past 30 years of these disturbances. Commercial shrimp trawling exacts a
harsh toll on the Gulf's marine environment, as more than a thousand shrimp trawlers
annually rake an area of sea floor equivalent to four times the total size of the Gulf. This
constant bottom trawling is considered to damage fragile benthic habitats and non-
commercial, small invertebrate species (Brusca et al. 2001). However, this area of
research is in need of attention since data are not sufficient to evaluate the extent of this
damage in the LME.
UNEP (2004) recalls that the American Fisheries Society's official list of marine fish at
risk of extinction includes six species of large groupers and snappers, four of which are
endemic to the Gulf of California and adjacent areas. Of these, two are regarded as
endangered, while the remaining four are considered as vulnerable, given the fact that
these species are sensitive to overfishing because of late maturity and the formation of
localised spawning aggregations (Musick et al. 2001). The effect of fishing is particularly
evident in large, slow-growing fish, and includes a decrease in abundance and in the
average individual size, where both are unavoidable consequences when aiming at
maximizing yield. What occurs in the Gulf of California LME is similar to what occurs in
Puget Sound, Florida and the southern Gulf of Mexico, the other `hot spots' described by
Musick et al. (2001). Of particular concern has been the totoaba. Although overfishing
has been blamed for the early decline of the fishery, the reduction in the flow of the
Colorado River may have been a major cause of depletion through the alteration of the
estuarine habitat of the river delta, its normal spawning and nursery area (UNEP 2004).
The totoaba fishery declined since 1970 due to declining populations and to restrictions
imposed (in 1975) when catch levels threatened the population. Despite closures, the
totoaba gill net fishery continues on a small-scale.
The tremendous diversity and complexity of the fisheries within the Gulf of California LME
and the large size of the basin make it a difficult area to manage. This is aggravated by
the lack of sufficient resources for implementing and enforcing management decisions
and federal laws, inadequate knowledge about the ecology of exploited species, and
insufficient past efforts to actively involve fishing communities in management decision-
making. However, current efforts are succeeding in conserving the natural resources
upon which a large number of people depend, and an improvement in terms of
overexploitation is expected in the future (UNEP 2004).
III. Pollution and Ecosystem Health
Pollution: A sizeable portion of the eastern coast of the Gulf of California LME is subject
to pollution from industrial and human wastes, agricultural run-off and aquaculture
residues. Other pollution threats include sedimentation from deforestation, bilge water
from ships, the construction of tourist marinas in sensitive coastal areas, and the risk of
oil spills from a steady traffic of oil tankers. While pollution was found to be generally
slight, it is more serious in some localised coastal areas (UNEP 2004). Beman et al.
(2005) have reported eutrophication episodes caused by agricultural irrigation in the
coastal area off the Yaqui Valley. A long time series of data related to eutrophication and
HABs available from Mazatlán showed an increase in the number of toxic species as well
as in the length and frequency of HABs events. Mortalities of marine mammals, birds,
and fish in 1995, 1997 and 1999 were related to HABs (Sierra-Beltrán et al. 1998, 1999).
Except for La Paz Bay and Los Cabos areas, the west coast of the Gulf is nearly pristine.
In the few places where towns or villages do exist, some pollution occurs. Agricultural
pesticides used in the Mexicali Valley and in Sonora and Sinaloa States have led to
concerns since the early 1970s about the possibility of pesticide transport into the Upper
Gulf of California. Pesticides have been found in organisms of the Mexicali Valley
636
47. Gulf of California
irrigation canals as well as the Upper Gulf of California (García-Hernández et al. 2001).
For instance, DDE, DDT and DDD were detected in fish and invertebrate sampled from
the delta wetlands even though such pesticides have been banned (Mora & Anderson
1995). Preliminary findings indicate high concentrations of zinc and lead in Navachiste
Bay, Sinaloa (Orduńa-Rojas et al. 2004).
Habitat and community modification: The delta wetlands and marine areas provide
unique and valuable habitats for a large number of invertebrates, marine mammals, birds
and commercial species of fish (Alvarez-Borrego 1983). These habitats are, however,
being altered by various human activities, the impacts of which are magnified by the
semi-enclosed nature of the Gulf. The most notable human activity to impact the upper
Gulf has been the damming of the Colorado River, which has significantly modified the
environment in this area. The river supplied freshwater, silt and nutrients to the delta,
and helped to create a complex system of wetlands that provided feeding and nesting
grounds for birds, and spawning and nursery habitat for fishes and crustaceans (Glenn et
al. 1996). The reduced freshwater input has drastically changed what used to be an
estuarine system into one of high salinity. It has also reduced the influx of nutrients to the
sea and critical nursery grounds for many commercially important species such as the
totoaba, Gulf curvina, and brown shrimp (Aragón-Noriega & Calderon-Aguilera 2000).
In terms of vegetation cover, the degree of mangrove deterioration in Mexico is not as
evident as in other countries (Páez-Osuna et al. 2003). However, on a regional scale,
there is evidence of mangrove destruction mainly in Sinaloa (Ceuta and Huizache-
Caimanero coastal lagoons) and Nayarit (Marismas Nacionales). The drying out of
lagoons in the Huizache-Caimanero system caused a 20% reduction in water surface
area from 1973 to 1997 and an increase in adjacent seasonal salt pans (Ruiz-Luna &
Berlanga-Robles 1999). The Huizache-Caimanero coastal lagoon supports an important
shrimp fishery. Until the 1980s, this system had yields up to 1,500 tonnes (de la Lanza &
García-Calderón 1991) and provided the highest yields per unit area for shrimp fisheries
in coastal lagoons in Mexico. During the last decade, yields notably decreased (Zetina-
Rejón et al. 2003). Rogerío-Poli & Calderón-Pérez (1987) considered that the changes in
postlarvae density were mainly due to changes in water temperature. On the other hand,
Ruiz-Luna & Berlanga-Robles (1999) suggested that the loss of freshwater, which
changed the salinity in this lagoon, was a consequence of the removal of deciduous
tropical forest for agricultural purposes and a 50% decrease of mangrove forests
between 1973 and 1997. In addition to the elevated rate of mangrove deforestation
(1.9% per year), mangrove coverage for this zone is scarce and with patchy distribution
that aggravates an unstable condition (Páez-Osuna et al. 2003). Carrera & de la Fuente
2001 reported that in Marismas Nacionales about 1,500 hectares of wetlands have been
replaced by shrimp farming. Nonetheless, DeWalt (2000) considered that shrimp
aquaculture in Mexico has thus far developed largely without the major detrimental
environmental effects seen in other countries and has found little evidence of mangrove
destruction.
IV. Socioeconomic Conditions
The Gulf of California LME is a very economically active zone. Overall, the region
accounts for approximately 10% of Mexico's GDP, with a human population of about
8.6 million. Approximately 40% of Mexico's agricultural production comes from the
region, mainly from the States of Sonora, Sinaloa and Nayarit. Because of the richness
of the marine basin and a very particular social-geographic situation (border with the
U.S.), key productive activities have been increasing along the littoral areas, driving an
uncontrolled coastal population growth (WWF Mexico 2005). Port activities and marine
traffic represent a fundamental support for agriculture, industry, mining and fishing. The
region is considered a natural port for international traffic routes and tourism
XIV North East Pacific
637
development. The Mexican government and the Fondo Nacional de Fomento al Turismo
(FONATUR) have announced plans to proceed with a project called Escalera Nautica, or
Nautical Ladder, consisting of at least 22 yachting marina resorts placed strategically
along the coast. The project also contemplates new and improved highways, airports,
airstrips, and the development of hotels, golf courses, etc. (Enríquez-Andrade et al.
2005).
An increase in the demand for oil, gas and mineral resources has stimulated the
exploration of the non-living resources of the EEZ. The LME's fisheries are an important
source of food and income for Mexicans (Enríquez-Andrade et al. 2005). Major
resources are small pelagic fishes, jumbo squid, tuna-like fishes and shrimp. Shrimp
production continues to be of important value, despite the decline in offshore shrimp
catches in the upper Gulf in the late 1980s-early 1990s.
V. Governance
The LME is governed by Mexico. Fisheries regulations are numerous and complex,
responding to the diverse array of natural resources. All fisheries resources in the
country are managed by the Federal Government through the Ministry of Agriculture,
Livestock, Fisheries and Food, by the National Commission of Aquaculture and Fisheries
(CONAPESCA), while the environment is under the responsibility of the Ministry of
Environment and Natural Resources. CONAPESCA has a technical branch, the National
Fisheries Institute (INP), which conducts regular assessments and evaluations of the
status of fisheries resources.
Several natural protected areas have been established in the region, including
five biosphere reserves (among them the Upper Gulf of California and the Colorado River
Delta, the coast of the Reserva de la Biosfera del Vizcaíno and the San Pedro Mártir
Island), five marine parks (including the Bay of Loreto and Cabo Pulmo), three wildlife
reserves (including Cabo San Lucas and all of the Islands of the Gulf of California) and
three areas with other protection status. In addition, two new marine parks are being
considered for decree (Enríquez-Andrade et al. 2005). There are 16 areas designated as
`priority' by the National Commission of Biodiversity. Protected areas are managed by
the National Commission of Protected Areas (CONANP), reporting to Secretaría de
Medio Ambiente y Recursos Naturales (SEMARNAT). After several years of relatively
uncoordinated efforts by several NGOs, a Coalition for the Sustainability of the Gulf of
California was created in December 1997 in an attempt to integrate available information
and generate broad consensus on conservation priorities for the region (Enríquez-
Andrade et al. 2005). At present there is an ongoing process to develop an Ecological
Ordering of the Gulf of California, started June, 2004. This is a coordinated effort of the
Federal Government through SEMARNAT, SAGARPA, the Ministry of Communications
and Transportation (SCT), Ministry of Tourism (SECTUR), Ministry of the Interior
(SEGOB) and the Ministry of the Navy (SEMAR). At the same time, SEMARNAT,
Secretaría de Agricultura, Ganadería, Desarrollo Rural, Pesca y Alimentación
(SAGARPA) and Secretaría de Turismo de México (SECTUR) signed an agreement with
the governments of the states of Baja California, Baja California Sur, Sonora, Sinaloa and
Nayarit to develop the ecological ordering of the terrestrial components of the coastal
areas.
References
Alvarez-Borrego, S. (1983). Gulf of California, p 427-449 in: Ketchum, B.H. (ed), Ecosystems of the
World Estuaries and Enclosed Seas. Elsevier Scientific Publishing House, The Netherlands.
638
47. Gulf of California
Aragón-Noriega, E.A. and Calderón-Aguilera, L.E. (2000). Does damming of the Colorado River
affect the nursery area of blue shrimp Litopenaeus stylirostris (Decapoda: Penaeidea) in the
upper Gulf of California? Tropical Biology 48(4):867-871.
Aurioles-Gamboa, D. (1993). Biodiversidad y situación Actual de los mamíferos marinos en
México. Sociedad Mexicana de Historia Natural: 397-412.
Balmori-Ramírez, A., J.M. García-Caudillo, D. Aguilar-Ramírez, R. Torres-Jiménez and Miranda-
Mier (2003). Evaluación de Dispositivos Excluidores de Peces en Redes de Arrastre
Camaroneras en el Golfo de California, México. SAGARPA/IPN/CRIP-Guaymas/CIMEX,
Dictamen Técnico.
Belkin, I.M., Cornillon, P.C., and Sherman, K. (2008). Fronts in large marine ecosystems of the
world's oceans: An atlas. Progress in Oceanography, submitted.
Beman, J.M., K.R. Arrigo, P.A. Matson (2005). Agricultural run-off fuels large phytoplankton blooms
in vulnerable areas of the ocean. Nature 434:211-214.
Berón-Vera, F.J., and Ripa, P. (2002). Seasonal salinity balance in the Gulf of California. Journal of
Geophysical Research 107(C8):1-15.
Brusca, R.C., Campoy Fabela, J., Castillo Sánchez,, C., Cudney-Bueno, R., Findley, L.T., Garcia-
Hernández, L., Glenn, E., Granillo, I., Hendricks, M.E., Murrieta, J., Nagel, C., Román, M. and
Turk-Boyer, P. (2001). A Case Study of Two Mexican Biosphere Reserves. The Upper Gulf of
California/Colorado River Delta and Pinacate/Gran Desierto de Altar Biosphere Reserves,
International Conference on Biodiversity and Society, Columbia University Earth Institute.
United Nations Educational, Scientific and Cultural Organisation.
Brusca, R.C., Findley, L.T., Hastings, P.A., Hendrickx, M.E., Torre-Cosio, J. and van der Heiden,
A.M. (2004). Macrofaunal biodiversity in the Gulf of California, in: Cartron, J.L.E., Ceballos, G.
and Felger R.S. (eds), Biodiversity, Ecosystems and Conservation in Northern Mexico. Oxford
University Press, New York, U.S.
Carrera, E., and de la Fuente, G. (2001). Inventario y Clasificación de Humedales en México, Parte
I. Ducks Unlimited de México, México.
Cascorbi, A. (2004). Wild-Caught Warmwater Shrimp (Infraorder Penaeus the Penaeid shrimps).
Monterey Bay Aquarium, Monterey, U.S.
Castro, R. (2001). Variabilidad Termohalina e Intercambios de Calor, Sal y Agua en la Entrada al
Golfo de California. Ensenada, México, Universidad Autónoma de Baja California, Mexico.
Castro-Aguirre, J.L. (1976). Efecto de la Temperatura y Precipitacion Pluvial Sobre la Producción
Camaronera. Memorias Simposio sobre Biología y Dinámica Poblacional de Camarones,
Guaymas, Son., INP.
Cisneros Mata, M.A., Nevárez-Martínez, M.O. and Hamman, M.G. (1995a). The rise and fall of the
Pacific sardine, Sardinops sagax caeruleus Girard, in the Gulf of California, Mexico. California
Cooperative Oceanic Fisheries Investigations Report 36:136-143.
Cisneros-Mata, M.A., Montemayor-López, G. and Román-Rodríguez, M.J. (1995b). Life history and
conservation of Totoaba macdonaldi. Conservation Biology 9:806-814.
Conservación Internacional Mexico (2003). Región Golfo de California: Estrategia de
Conservación. Conservación Internacional, Mexico. Cudney-Bueno, R. (2000). Management
and conservation of benthic resources harvested by small-scale hookah divers in the northern
Gulf of California, Mexico: The black Murex snail fishery. Unpublished MS thesis, School of
Renewable Natural Resources, University of Arizona. Tucson.
D'Agrosa, C., Lennert-Cody, C.E. and Vidal, O. (2000). Vaquita by-catch in Mexico's artisanal
gillnet fisheries: Driving a small population to extinction. Conservation Biology 14(4):1110-1119.
De la Lanza, E.G. and García-Calderón, J.L. (1991). Sistema Lagunar Huizache-Caimanero, Sin.
Un estudio Socio Ambiental, Pesquero y Acuícola. Hidrobiología 1(1):1-27.
DeWalt, B.R. (2000). Shrimp Aquaculture, People and the Environment in the Gulf of California. A
Report to the World Wildlife Fund. Pittsburgh, Centre for Latin American Studies, University of
Pittsburgh, U.S.
Enríquez-Andrade, R., Anaya-Reyna, G., Barrera-Guevara, J.C., Carvajal-Moreno, M.A., Martínez-
Delgado, M.E., Vaca-Rodríguez, J. and Valdés-Casillas, C. (2005). An analysis of critical areas
for biodiversity conservation in the Gulf of California region. Ocean and Coastal Management
48:31-50.
Galindo-Bect, M.S., Glenn, E.P., Page, H.M., Fitzsimmons, K., Galindo-Bect, L.A., Hernandez-
Ayon, J.M., Petty, R.L., Garcia-Hernandez, J. and Moore, D. (2000). Penaeid shrimp landings in
the upper Gulf of California in relation to Colorado River freshwater discharge. Fishery Bulletin
98:222-225.
XIV North East Pacific
639
García-Hernández, J., Hinojosa-Huerta, O., Gerhart, V., Carrillo-Guerrero, Y. and Glenn, E.P.
(2001). Southwestern willow flycatcher (Empidonax traillii extimus) surveys in the Colorado
River Delta wetlands: Implications for management. Journal of Arid Environments 49:161-169.
Glenn, E.P., Lee, C., Felger, R. and Zenegal, S. (1996). Effects of water management on the
wetlands of the Colorado River Delta, Mexico. Conservation Biology 10:1175-1186.
Gutiérrez, G. and González, J.I. (1999). Predicciones de Mareas de 1990: Estaciones
Mareográficas del CICESE. Ensenada, B.C., México, Centro de Investigación Científica y de
Educación Superior de Ensenada.
Holmgren-Urba, D. and Baumgartner, T.R. (1993). A 250-year history of pelagic fish abundances
from the anaerobic sediments of the central Gulf of California. California Cooperative Fisheries
Investigations Reports 34:60-68.
http://www.giwa.net/publications/r27.phtml
Jaramillo-Legorreta, A.M., Rojas-Bracho, L., and Gerrodette, T. (1999). A new abundance estimate
for Vaquitas: First step for recovery. Marine Mammal Science 15:957-973.
Lavín, M.F., Durazo, R., Palacios, E., Argote, M.L. and Carrillo, L. (1997). Lagrangian observations
of the circulation in the northern Gulf of California. Journal of Physical Oceanography 27:2298-
2305.
Lavín, M.F., Palacios-Hernández, E. and Cabrera, C. (2003). Sea surface temperature anomalies
in the Gulf of California. Geofísica Internacional 42:363-375.
Lluch-Belda, D., Lluch-Cota, D.B. and Lluch-Cota, S.E. (2003). Baja California's biological transition
zones: Refuges for the California sardine. Journal of Oceanography 59:503-513.
Lluch-Cota, S.E., Aragón-Noriega, E.A., Arreguín-Sánchez, F., Aurioles-Gamboa, D., Bautista-
Romero, J.J., Brusca, R.C., Cervantes-Duarte, R., Cortés-Altamirano, R., Del-Monte-Luna, P.,
Esquivel-Herrera, A., Fernández, G., Hendricks, M., Hernández-Vázquez, S., Karhu, M., Lavín,
M., Lluch-Belda, D., Lluch-Cota, D.B., López-Martínez, J., Marinone, S.G., Nevárez-Martínez,
M.O., Ortega-García, S., Palacios-Hernández, E., Parés-Sierra, A. Ponce-Díaz, G. Ramírez,
M., Salinas-Zavala, C.A., Schwartzlose, R.A. and Sierra-Beltrán, A.P. (2004). Gulf of California.
Marine Ecosystems of the North Pacific, North Pacific Marine Science Organisation, PICES
Special Publication 1.280p. [ ISSN 1813- 8527 ISBN 1-897176-00-7[.
Lluch-Cota, S.E., Lluch-Cota, D.B., Lluch-Belda, D., Nevárez-Martinez, M.O., Parés-Sierra, A. and
Hernández-Vázquez, S. (1999). Variability of sardine catch as related to enrichment,
concentration and retention processes in the central Gulf of California. California Cooperative
Fisheries Investigations Reports 40:184-190.
Lozano-Montes, H.M., T.J. Pitcher and N. Haggan. 2008. Shifting environmental and cognitive
baselines in the upper Gulf of California. Frontiers in Ecology and the Environment, 6: 75-80.
Marinone, S.G. and Lavin, M.F. (2003). Residual flow and mixing in the large islands region of the
central Gulf of California, in: Velasco-Fuentes, O.U., Sheinbaum, J. and Ochoa de la Torre, J.L.
(eds), Nonlinear Processes in Geophysical Fluid Dynamics. Kluwer Academic Publishers, The
Netherlands.
Marinone, S.G., Parés-Sierra, A., Castro, R. and Mascarenhas, A. (2004). Correction to temporal
and spatial variation of the surface winds in the Gulf of California. Geophysical Research
Letters 31(L10305).
Mitchell, D.L., Ivanova, D., Rabin, R., Brown, T.J. and Redmond, K. (2002) Gulf of California sea
surface semperatures and the North American monsoon: Mechanistic implications from
observations, J. Climate, 15(17), 22612281.
Mora, M.A. and Anderson, D.W. (1995). Selenium, boron, and heavy metals in birds from the
Mexicali Valley, Baja California, Mexico. Bulletin of Environmental Contamination and
Toxicology 54:198-206.
Musick, J.A., Harbin, M.M., Berkeley, A., Burgess, G.H, Eklund, A.M., Findley, L.T., Gilmore, R.G.,
Golden, J.T., Ha, D.S., Huntsman, G.R., McGovern, J.C., Parker, S.J., Poss, S.G., Sala, E.,
Schmidt, T.W., Sedberry, G.R., Weeks, H. and Wright, S.G. (2001). Marine, estuarine and
diadromous fish stocks at risk of extinction in North America (exclusive of Pacific Salmonids).
Fisheries 25(11):6-30.
Nevárez-Martínez, M.O., Chávez, E.A., Cisneros-Mata, M.A. and Lluch-Belda, D. (1999). Modelling
of the Pacific sardine Sardinops caeruleus fishery of the Gulf of California, Mexico. Fisheries
Research 41:273-283.
Nevárez-Martínez, M.O., Hernández-Herrera, A., Morales-Bojórquez, E., Balmori-Ramírez, A.,
Cisneros-Mata, M.A. and Morales-Azpeitia, R. (2000). Biomass and distribution of the jumbo
squid (Dosidicus gigas; d'Orbigny, 1835) in the Gulf of California, Mexico. Fisheries Research
49:129-140.
640
47. Gulf of California
Nevárez-Martínez, M.O., Lluch-Belda, D., Cisneros-Mata, M.A., Martínez-Zavala, M.A. and Lluch-
Cota, S.E. (2001). Distribution and abundance of the Pacific sardine (Sardinops sagax) in the
Gulf of California and their relation with the environment. Progress in Oceanography 49:565-
580.
Orduńa-Rojas, J., Longoría-Espinosa, R.M. and Álvarez-Ruiz, P. (2004). Seasonal accumulation of
metals in Green seaweed (Ulva lactuca) and sediments from Navachiste Bay, Sinaloa,
Southern Gulf of California. Gulf of California Conference, 2004, Tucson, U.S.
Páez-Osuna, F., Gracia, A., Flores-Verdugo, F., Lyle-Fritch, L.P., Alonso-Rodríguez, R., Roque, A.
and Ruiz-Fernández, A.C. (2003). Shrimp aquaculture development and the environment in the
Gulf of California ecoregion. Marine Pollution Bulletin 46:806-815.
Palacios-Hernández, E., Beier, E., Lavín, M.F. and Ripa, P. (2002). The effect of the seasonal
variation of stratification on the circulation of the northern Gulf of California. Journal of Physical
Oceanography 32:705-728.
Pauly, D. 1995. Anecdotes and the shifting baseline syndrome of fisheries. Trends in Ecology and
Evolution 10(10): 430.
Pauly, D. and Christensen, V. (1995). Primary production required to sustain global fisheries.
Nature 374: 255-257.
Pauly, D. and Watson, R. (2005). Background and interpretation of the `Marine Trophic Index' as a
measure of biodiversity. Philosophical Transactions of the Royal Society: Biological Sciences
360: 415-423.
Pauly, D., Christensen, V., Dalsgaard, J., Froese R. and Torres, F.C. Jr. (1998). Fishing Down
Marine Food Webs. Science 279: 860-863.
Pérez-Espańa, H. (2004). żPuede la Pesca Artesanal Disminuir el Nivel Trófico de la Pesquería en
México? 4th World Fisheries Congress, American Fisheries Society, Vancouver, U.S.
Rogerío-Poli, C. and Calderón-Pérez, J.A. (1987). Efecto de los Cambios Hidrológicos en la Boca
del Río Baluarte Sobre la Inmigración de Postlarvas de Penaeus vannamei Boone y P.
stylirostris Stimpson al Sistema Lagunar Huizache-Caimanero, Sinaloa, México (Crustacea:
Decápoda: Penaeidae). Anales del Instituto de Ciencias del Mar y Limnilogía 14(1):29-44.
Universidad Nacional Autónoma de México.
Rosales, J.F. (1976). Contribución al Conocimiento de la Fauna de Acompańamiento del Camarón
en Altamar Frente a la Costa de Sinaloa, México. Memorias de la Reunión Sobre Recursos de
Pesca Costera de México. Veracruz, Mexico.
Ruiz-Luna, A. and Berlanga-Robles, C.A. (1999). Modifications in coverage patterns and land use
around the Huizache-Caimanero Lagoon system, Sinaloa, Mexico: A multi-temporal analysis
using LAND-SAT images. Estuarine, Coastal and Shelf Science 49:37-44.
Rusnak, G.A., Fisher, R.L. and Shepard, F.P. (1964). Bathymetry and faults of the Gulf of
California. In: Van Andel, T.H. and G.G. Shor (eds), Marine Geology of the Gulf of California.
American Association of Petroleum Geologists Memoir 3:59-75.
Sáenz-Arroyo, A, C.M. Roberts, J. Torre and M. Carińo-Olvera. 2005a. Using fishers' anecdotes,
naturalists' observations and grey literature to reassess marine species at risk: the case of the
Gulf grouper in the Gulf of California, Mexico. Fish and Fisheries 6 (2): 121-133.
Sáenz-Arroyo, A., C.M. Roberts, J. Torre, M. Carińo and R.R. Enrique-Andrade. . 2005b. Rapidly
shifting environmental baselines among fishers of the Gulf of California. Proceedings of the
Royal Society B: Biological Sciences, 272: 1957-1962.
Sáenz-Arroyo, A., C.M. Roberts, J. Torre, M. Carińo-Olvera and J.P. Hawkins. 2006. The value of
evidence about past abundance: marine fauna of the Gulf of California through the eyes of 16th
to 19th century travellers. Fish and Fisheries, 7 (2): 128146.
Sala, E., Aburto-Oropeza, O.M., Reza, M., Paredes, G. and López-Lemus, L.G. (2004). Fishing
down coastal food webs in the Gulf of California. Fisheries 29(3):19-25.
Sea Around Us (2007). A Global Database on Marine Fisheries and Ecosystems. Fisheries Centre,
University British Columbia, Vancouver, Canada.
http://www.seaaroundus.org/lme/SummaryInfo.aspx?LME=4
SEMARNAP (1999). Programa de Manejo Area de Protección de Flora y Fauna Islas del Golfo de
California. México, D.F., Secretaría del Medio Ambiente, Recursos Naturales y Pesca.
Sierra-Beltran, A.P., Cruz, A., Nuńez, E., Del Villar, L.M., Cerecero, J. and Ochoa, J.L. (1998). An
overview of marine food poisoning in Mexico. Toxicon 36:1493-1502.
Sierra-Beltran, A.P., Ochoa, J.L., Lluch-Cota, S.E., Cruz-Villacorta, A.A., Rosiles, R., Lopez-
Valenzuela, M., Del Villar-Ponce, L.M. and Cerecero, J. (1999). Pseudonitzchia australis
(Frengelli), responsable de la mortandad de aves y mamiferos marinos en el Alto Golfo de
California, Mexico en 1997, in: Tresierra-Aguilar, A.E. and Culquichicon-Malpica, Z.G.
XIV North East Pacific
641
Proceedings del VIII Congreso Latinoamericano sobre Ciencias del Mar. Universidad de
Trujillo, Peru.
Soto-Mardones, L., Marinone, S.G. and Parés-Sierra, A. (1999). Variabilidad espacio temporal de
la temperatura superficial del mar en el Golfo de California. Ciencias Marinas 25:1-30.
Teske, A., Hinrichs, K-U., Edgcomb, V., De Vera Gomez, A., Kysela, D., Sylva, S.P., Sogin, M.L.
and Jannasch, H.W. (2002). Microbial diversity of hydrothermal sediments in the guaymas
basin: Evidence for anaerobic methanotrophic communities. Applied Environmental
Microbiology 68:1994-2007.
UNEP (2004). Arias, E., Albar, M., Becerra, M., Boone, A., Chia, D., Gao, J., Muńoz, C., Parra, I.,
Reza, M., Saínz, J. and Vargas, A. Gulf of California/Colorado River Basin, GIWA Regional
Assessment 27. University of Kalmar, Kalmar, Sweden.
WWF Mexico (2005). Gulf of California. http://www.wwf.org.mx/gulf.php
Zetina-Rejón, M., Arreguín-Sánchez, F. and Chávez, E.A. (2003). Trophic structure and flows of
energy in the Huizache-Caimanero lagoon complex on the Pacific coast of Mexico. Estuarine,
Coastal and Shelf Science 57(5-6):803-815.
642
47. Gulf of California
XIV North East Pacific
643
XIV-48 Pacific Central-American Coastal LME
S. Heileman
The Pacific Central-American Coastal LME extends along the Pacific Coast of Central
America, from 22şN off Mexico down to 4şS. It is shared by Mexico, Guatemala, El
Salvador, Honduras, Nicaragua, Costa Rica, Panama, Colombia and Ecuador. The LME
covers a surface area of nearly 2 million km2, of which 1.42% is protected, and includes
0.22% of the world's coral reefs and 0.78% of the world's sea mounts (Sea Around Us
2007). Re-circulating coastal currents and milder temperatures than those of the
adjacent California Current and Humboldt Current LMEs characterise this LME (Bakun et
al. 1999). Much of the Pacific Central-American Coastal LME is influenced by the
seasonal movements of the Inter-tropical Convergence Zone (Bakun et al. 1999). The
region is vulnerable to the ENSO phenomenon, which affects productive activities,
infrastructure, natural resources and the environment in general. The climate varies from
tropical to temperate, with a dry period during the winter months. During the rainy
season from May to September, rivers discharge significant volumes of freshwater and
suspended solids into the coastal areas of this LME (Windevoxhel et al. 2000). Extreme
ocean depths are reached very close to the coast due to a narrow and steep continental
shelf. Book chapters and reports on this LME are by Bakun (1999), Bakun et al. (1999),
Lluch-Belda (1999) and UNEP (2006).
I. Productivity
The Pacific Central-American Coastal LME could be considered a Class I, high
productivity ecosystem (>300 gCm-2yr-1). Several mechanisms, other than the classic
eastern ocean upwelling produced by Ekman transport, are important sources of nutrient
enrichment in this LME. The mechanisms include equatorial upwelling, open ocean
upwelling driven by wind stress curl, and episodic downwind coastal upwellings forced by
mountain gap winds from the Caribbean, as well as the mechanism underlying the Costa
Rica Dome structure (Bakun et al. 1999). In addition, nutrient inputs also come from river
run-off along the tropical areas of this LME (FAO 1997). Upwelling plumes extending
offshore are located off the three major mountain ranges of the region (Bakun et. al.
1999). An extensive minimum oxygen layer exists off Mexico and Central America
(Wyrtki 1965, Bianchi 1991), with oxygen levels low enough to have major effects on the
composition and migration of the biological communities (Bakun et al. 1999). The large-
scale monthly mean ocean temperatures remain above 26şC throughout the year and, as
a consequence, the marine fauna of this LME is tropical and distinctly different from the
predominantly temperate fauna of the California and Humboldt systems (Bakun et al.
1999). Threatened species such as turtles and sharks are of particular concern in the
region.
Oceanic Fronts (Belkin and Cornillon 2003; Belkin et al. 2008): Most fronts within this
LME (Figure XIV-48.1) are generated by coastal upwelling. Some fronts off the Pacific
coast of Central America originate from quasi-regular bursts of topographically generated
winds blowing from the Caribbean across Central America toward the Pacific Ocean.
Local orography tends to channel these winds and make their direction exceptionally
stable and predictable, especially in the Gulf of Tehuantepec where these winds result in
formation of upwelling zones and fronts that bound them extending far offshore (Belkin &
Cornillon 2003). This is the only place in the World Ocean where such fronts are
observed.
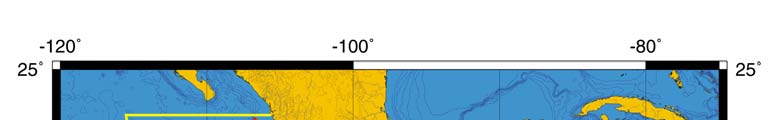
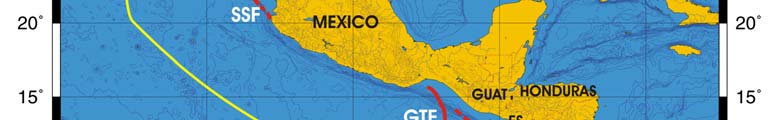
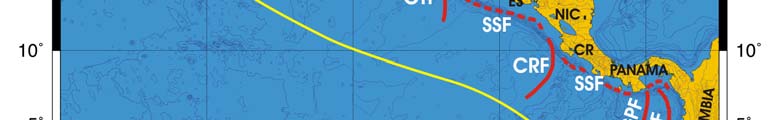
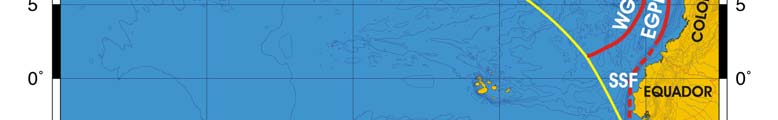
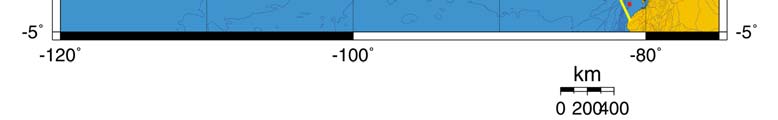
644
48. Pacific Central-American Coastal LME
Figure XIV-48.1. Fronts of the Pacific Central-American Coastal LME. CR, Costa Rica; CRF, Costa Rica
Front; EGPF, East Gulf of Panama Front; ES, El Salvador; GTF, Gulf of Tehuantepec Front; GUAT,
Guatemala; NIC, Nicaragua; SSF, Shelf-Slope Front (most probable location); WGPF, West Gulf of
Panama Front. Yellow line, LME boundary. After Belkin et al. (2008).
Pacific Central-American Coastal LME SST (Belkin 2008)(Figure XIV-48.2)
Linear SST trend since 1957: 0.29°C.
Linear SST trend since 1982: 0.14°C.
The Central-American Pacific LME experienced moderate warming over the last 50
years. However, the thermal history of this LME was non-monotonous. The cooling
phase culminated in the two minimums, in 1971 and 1975, both associated with major La
Nińas ((National Weather Service/Climate Prediction Center, 2007), after which the SST
rose by approximately 1°C over the next 30 years. The absolute minimum of 1975 was
synchronous with absolute minima in two other East Pacific LMEs: California Current
LME and Gulf of California LME. The minimum also was roughly synchronous with the
absolute minimum of 1974-1976 on the other side of the Central American Isthmus, in the
Caribbean LME. The warming phase was accentuated by two sharp peaks, in 1983 and
1997, both associated with major El Nińos (National Weather Service/Climate Prediction
Center, 2007). Similar peaks (warm events) were also observed in other East Pacific
LMEs, namely the Humboldt Current, Gulf of California, and California Current. The
warm event of 1992, concurrent with a strong El Nińo, was less conspicuous in this LME
compared with other East Pacific LMEs. In general, all significant maxima and minima of
SST observed in this LME are associated with El Nińos and La Nińas respectively
(National Weather Service/ Climate Prediction Center, 2007). This strong correlation is
not surprising giving the location of this LME in the Eastern Tropical-Equatorial Pacific,
where El Nińos' and La Nińas' effects are most conspicuous.
XIV North East Pacific
645
Figure XIV-48.2. Pacific Central-American Coastal LME annual mean SST (left) and SST anomalies
(right), 1957-2006, based on Hadley climatology. After Belkin (2008).
Pacific Central-American Coastal LME Chlorophyll and Primary Productivity: The
Pacific Central-American Coastal LME is a Class I, high productivity ecosystem (>300
gCm-2yr-1)(Figure XIV-48.3).
Figure XIV-48.3. Pacific Central-American Coastal LME trends in chlorophyll a (left) and primary
productivity (right), 1998-2006, from satellite ocean colour imagery. Values are colour coded to the
right hand ordinate. Figure courtesy of J. O'Reilly and K. Hude. Sources discussed p. 15 this volume.
II. Fish and Fisheries
The Pacific Central-American Coastal LME is rich in both pelagic and demersal fisheries
resources. The most valuable fisheries in the region are offshore tunas and coastal
penaeid shrimps. More than 50% of the shelf catches consists of small coastal pelagic
species such as anchoveta (Engraulis ringens and Cetengraulis mysticetus), South
American pilchard (Sardinops sagax) and the Pacific thread herring (Opisthonema
libertate), most of which are used for fish meal and fish oil. Artisanal shark fisheries also
operate in El Salvador and Guatemala. In addition to the capture fisheries, aquaculture of
penaeid shrimp is an important economic activity.
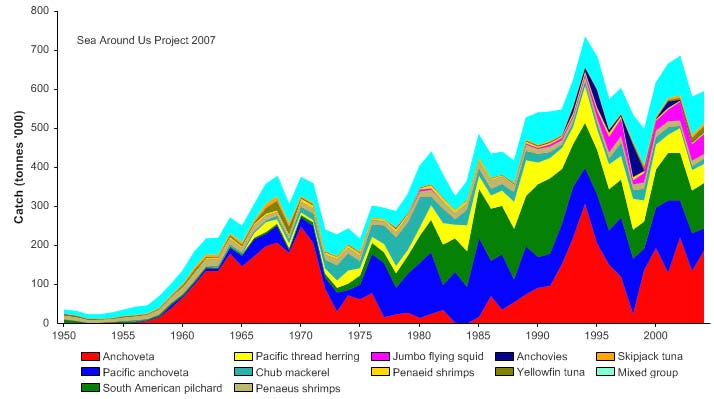
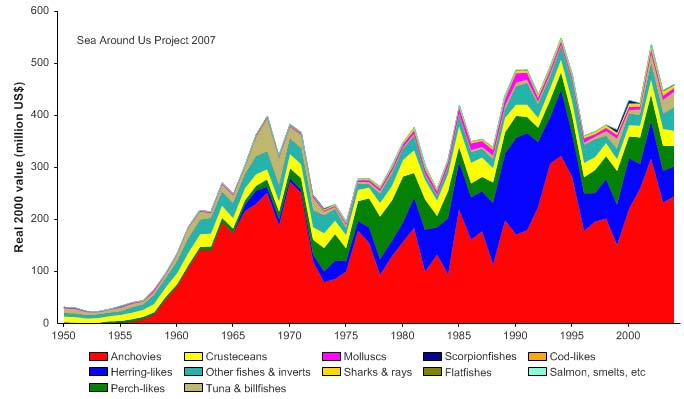
646
48. Pacific Central-American Coastal LME
Total reported landings have risen, with some fluctuations, to peak landings of 730,000
tonnes in 1994 (Figure XIV-48.4). The species composition of the landings has also
fluctuated, particularly between anchovies and South American pilchard. These
fluctuations coincide with the most important El Nińo events and are related to the
dramatic and simultaneous inter-decadal regime shifts in marine fish populations in other
Pacific LMEs associated with El Nińo (Bakun 1999, Lluch-Belda 1999). Fluctuations in
the value of the reported landings correspond with the landings, with a peak of US$548
million (in 2000 US dollars) recorded in 1994 (Figure XIV-48.5).
It should be cautioned, however, that the underlying landing statistics in this LME,
particularly those reported by the countries south of Mexico, strongly underestimate the
true catch (see, e.g., Wielgus et al. 2007 for Columbia) and represent, in several
instances, a bias toward landings of exported species (e.g., lobsters, shrimps), while
those sold on local markets by artisanal fishers are often ignored (see also Bakun et al.
1999).
Figure XIV-48.4. Total reported landings in the Pacific Central-American Coastal LME by species (Sea
Around Us 2007).
Figure XIV-48.5. Value of reported landings in the Pacific Central-American Coastal LME by commercial
groups (Sea Around Us 2007).
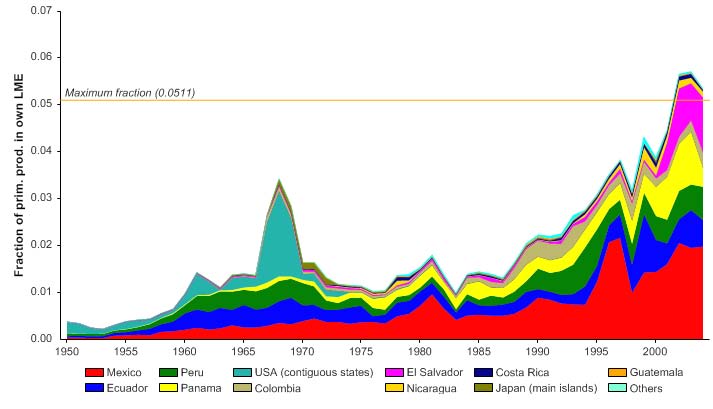
XIV North East Pacific
647
The primary production required (PPR; Pauly & Christensen 1995) to sustain the reported
landings in this LME reached 5% of the observed primary production in 2002 (Figure XIV-
48.6). Mexico, Ecuador, El Salvador, Peru and Panama account for most of the
ecological footprint in this LME.
Figure XIV-48.6. Primary production required to support reported landings (i.e., ecological footprint) as
fraction of the observed primary production in the Pacific Central-American Coastal LME (Sea Around
Us 2007). The `Maximum fraction' denotes the mean of the 5 highest values.
The mean trophic level of the reported landings (i.e., the MTI; Pauly & Watson 2005) is
relatively low, and shows a declining trend until the mid 1980s, after which a slight
increasing trend became apparent (Figure XIV-48.7 top). The FiB index has increased,
indicating that whatever `fishing down' (Pauly et al. 1998) that may be occurring in the
LME would be masked by either the geographic (offshore) expansion of the fisheries
(Figure XIV-7.7 bottom) or the incompleteness of the underlying statistics as indicated
above.
Figure XIV-48.7. Mean trophic level (i.e., Marine Trophic Index) (top) and Fishing-in-Balance Index
(bottom) in the Pacific Central-American Coastal LME (Sea Around Us 2007).
648
48. Pacific Central-American Coastal LME
The Stock-Catch Status Plots indicate that the number of collapsed and that
overexploited stocks are rapidly increasing in the LME (Figure XIV-48.8 top).
Approximately 40% of the reported landings are supplied by fully exploited stocks (Figure
XIV-48.8 bottom).
1950
1960
1970
1980
1990
2000
0%
100
10%
90
20%
)
80
%
(
s
30%
u
70
t
at
s
40%
y
60
b
ks
50%
c
50
t
o
f
s
60%
o
40
er
b
70%
m
30
u
N
80%
20
90%
10
100%0
1950
1960
1970
1980
1990
2000
(n = 3606)
developing
fully exploited
over-exploited
collapsed
1950
1960
1970
1980
1990
2000
0%
100
10%
90
20%
80
)
%
30%
(
70
t
us
40%
t
a
60
s
k
50%
t
oc
50
s
60%
h by
40
t
c
a
70%
C
30
80%
20
90%
10
100%0
1950
1960
1970
1980
1990
2000
(n = 3606)
developing
fully exploited
over-exploited
collapsed
Figure XIV-48.8. Stock-Catch Status Plots for the Pacific Central-American Coastal LME, showing the
proportion of developing (green), fully exploited (yellow), overexploited (orange) and collapsed (purple)
fisheries by number of stocks (top) and by catch biomass (bottom) from 1950 to 2004. Note that (n), the
number of `stocks', i.e., individual landings time series, only include taxonomic entities at species,
genus or family level, i.e., higher and pooled groups have been excluded (see Pauly et al, this vol. for
definitions).
In general, overexploitation was found to be moderate in this LME, although it was severe
in Colombian waters (UNEP 2006), with several traditionally fished stocks showing signs
of overfishing. For example, most of the shrimp stocks are considered to be
overexploited (Bakun et al. 1999, FAO 2005a), although the reported landings of shrimp
trawlers have not substantially declined. In Costa Rica, the landings of the shrimp trawler
fleet increased between 1993 and 2002. However, closer examination reveals that the
increase was due to larger catches of finfish, suggesting that when the shrimp stocks
were reduced, greater fishing effort was focused on high-value fish (FAO 2005a).
Fishery resources in the Gulf of Nicoya have come under heavy pressure from the rapid
growth of the small-scale fleet in the past 20 years. As a result, there has been a
reduction in the catch per unit effort of the most valuable species and the sizes of fish
and shrimp caught.
Numerous species of demersal fish are under heavy fishing pressure from the shrimp
fisheries, in which they are commonly taken as bycatch (Bakun et al. 1999). The shark
stocks in the Gulf of Fonseca are also showing signs of depletion. Other overexploited
stocks include several species of Lutjanidae, Sciaenidae, Centropomidae and Serranidae
(CCAD/IUCN 1999). In the Gulf of Fonseca, some molluscs and crustacean species are
XIV North East Pacific
649
overexploited by the artisanal fishery and several others such as the tropical rocky oyster
(Ostrea iridescens), green lobster (Panulirus gracilis) and crab (Menipe frontalis) are fully
exploited (CCAD/IUCN 1999).
Likewise, the level of bycatch and discards and the use of destructive fishing practices were
assessed as generally moderate, but severe in Colombian waters (UNEP 2006). Several
hundred species of demersal fish, especially early life history stages, are taken as bycatch in
the shrimp trawl fishery, which also has the highest rate of discards. Many of these bycatch
species have potential economic value, but do not sustain major commercial fisheries in the
region (Bakun et al. 1999). Nonetheless, their effective level of exploitation could be high
as a result of pressure from the shrimp fishery, which probably inhibits the development of
fisheries for these species (Bakun et al. 1999). Furthermore, the juveniles of about 30
different groups are discarded during the catching of shrimp larvae for aquaculture in the
Gulf of Fonseca (CCAD/IUCN 1999). This is of particular concern since it is likely
affecting the recruitment of several commercial species and threatening the long-term
sustainability of both aquaculture and artisanal fisheries. No assessment of marine
mammal bycatch has been conducted, although Palacios and Gerrodette (1996)
suggested that the rate could be as high as that in other parts of the Pacific coast of
South America.
The current level of fisheries exploitation is unsustainable, and overexploitation is
expected to worsen (UNEP 2006) as a result of increasing coastal populations and
further increases in fishing effort in the traditional fisheries. However, there is a potential
for the development of fisheries for other species such as mid-sized pelagics and other
oceanic species as well as deepwater shrimps (Bakun et al. 1999). Among the most
pressing needs is the development of systems for improved data collection and
monitoring, since the fisheries catch statistics in the bordering countries are generally
poor and unreliable (Bakun et al. 1999). Future conditions will depend on the effective
implementation of conservation and development projects directed towards the
environmental sustainability of the region.
III. Pollution and Ecosystem Health
Pollution: Population growth, poorly planned urban development, tourism and industrial
and agricultural activities exert significant pressures on the Pacific Central-American
Coastal LME, partly as a result of the associated discharges of waste into the aquatic
environment (IDEAM 2002). Although pollution was found to be generally moderate in
this LME, it was assessed as severe in some localised areas, including in the
transboundary Gulf of Fonseca (UNEP 2006). Land-based pollution is potentially more
damaging in the coastal waters because of the numerous sheltered bays and gulfs in
which pollutants are not easily dispersed. About 95% of the wastewater produced in the
bordering countries is untreated and reaches the Pacific Ocean with high loads of organic
matter, nutrients and other pollutants (PNUMA 2001). The limited available information
indicates accumulation of pesticides, heavy metals and other pol utants in coastal areas,
with unknown impacts on the marine biota. High concentrations of pathogenic micro-
organisms have been recorded in some areas (CPPS 2000). For example, in
Puntarenas, Costa Rica, total coliform bacteria concentrations between 16
-
20 million MPN1/100 ml and between 2 - 9.2 million MPN/100 ml for faecal coliforms have
been reported (Wo-Ching & Cordero 2001).
Wastewater discharges and agriculture run-off are the main source of anthropogenic
nutrient enrichment in the LME. Fertiliser consumption increased from 76 kg ha-1 in 1990
to about 131 kg ha-1 in 2000 in the countries in the central part of the LME. It is
1 MPN: Most Probable Number
650
48. Pacific Central-American Coastal LME
estimated that the coastal waters in the region receive 120,300 tonnes nitrogen yr-1 and
around 14,500 tonnes phosphorus yr-1 (PNUMA 2001). The high rate of deforestation,
poor agricultural practices and associated increase in erosion and runoff also contribute
to elevated nutrient levels to this LME (PNUMA 2001). As a consequence, eutrophication
is evident in coastal areas of e.g. Panama (Panama Bay), Nicaragua (Corinto, El Realejo,
Estero Chocolate, La Esparta, El Real), El Salvador (Jiquilisco Bay) and Costa Rica (Gulf
of Nicoya) (PNUMA 2001). Harmful algal blooms (HABs) associated with eutrophication
have also been observed (Rubio et al. 2001). These factors combined with the input of
wastewater, are producing a significant amount of suspended solids and high
sedimentation in some coastal areas (CCAD/IUCN 1999, Rubio et al. 2001, Sánchez
2001).
Chemical contamination is highly concentrated in some areas of the Pacific coast
(Jameson et al. 2000). Heavy metals such as lead, copper and chromium have been
reported in sediments and surface waters in several countries of the region, especially in
Panama, Nicaragua and Costa Rica (Sánchez 2001, Wo-Ching & Cordero 2001).
Discharges from agricultural areas are a major source of pollution by persistent toxic
substances. The level of pesticides used in the region is one of the highest in Latin
America, and their presence has been reported in discharges of several rivers (Rubio et
al. 2001, Wo-Ching & Cordero 2001). Pesticides have been found in fish, crustacean
and mollusc tissue in some areas (Rubio et al. 2001).
Over 15 million tonnes of solid waste are produced annually in the region, about 44% of
which originates in coastal settlements (PNUMA 2001). However, the collection of solid
waste is generally inadequate, or it is disposed of in inappropriate sites or discharged
directly into water bodies. Litter accumulation has reduced the aesthetic value of coastal
areas and presents a permanent risk for fishing and maritime traffic in the region. Most
oil spills are chronic and occur in ports and storage sites. The heavy traffic on the
shipping lanes to North and South America and Asia, which parallel almost the entire
length of the coastline, increases the threat of oil spills in the LME. Another potential
source of oil pollution is the trans-isthmus oil pipeline (PNUMA 1999). Small spills also
come from the cities when oils and other hydrocarbons are eliminated through the
sewerage system and finally disposed of in coastal areas.
Habitat and community modification: The LME's coast is characterised by its many
peninsulas, gulfs and bays, as well as extensive intertidal areas, barriers and well
developed coastal lagoons. An important geographic feature is the transboundary Gulf of
Fonseca, which is shared by Nicaragua, Honduras and El Salvador. Poorly planned
urbanisation and economic development along the Pacific coast is leading to the
accelerated degradation and destruction of economically and ecologically important
habitats. Habitat modification was found to be moderate in this LME (UNEP 2006). Even
protected areas are being affected, with about 35% of protected areas showing some
type of deterioration in 2001 from various causes such as sedimentation, mangrove
destruction, pollution and overfishing (PNUMA 2001).
Of the coastal habitats in the LME, mangroves are the most affected by human activities
and there are reports of mangrove destruction throughout the region (CCAD/IUCN 1999,
Rubio et al. 2001, Sánchez 2001). Mangrove forests have been cleared for several
purposes including aquaculture, agriculture, urban development, firewood, building
material and tannin production. Conversion to aquaculture ponds is, however, a major
cause of mangrove loss in the region. At least 90% of the shrimp farms have been
constructed on former mangrove or salt pond areas. All mangroves in the transboundary
Gulf of Fonseca have been affected (CCAD/IUCN 1999). The mangrove area in the Gulf
was reduced from 1,049 km2 in 1976 to 691 km2 in 1997. In addition, the Gulf is also
polluted by run-off from extensive banana plantations in the coastal areas. In the central
XIV North East Pacific
651
parts of the LME, only a small proportion of the mangrove area is relatively stable, the
remaining areas being considered vulnerable (wet Pacific coast), in danger (Gulf of
Fonseca and the northern dry coast), or critical (the southern part of the dry coast)
(PNUMA 2001). About 98% of the estuaries are estimated to be affected by
sedimentation, wastewater and agro-industrial residuals. The effects of mangrove
destruction include an increase in coastal erosion, higher penetration of the saline wedge
in some estuaries, soil salinisation and decrease of biological productivity with direct
effects on artisanal fisheries.
The LME's coral reefs have been affected by sedimentation, oil spills, pesticides and
trawling activities (Escobar 1996, PNUMA/IUCN 1998). Also, some reefs were severely
impacted by the 1982-1983 El Nińo event, which caused mass coral bleaching and
mortality in all areas (Spalding et al. 2001). In Costa Rica, recovery has generally been
good and, despite repeated bleaching in 1992 and 1997-1998, coral cover remains high
in most areas. In contrast, recovery on many reefs in Panama has been poor. Pollution
and habitat and community modification are expected to increase in the future, if the
growth of poorly planned coastal urbanisation and development continues (UNEP 2006).
This could be compounded by lack of adequate sanitation service and waste treatment
and disposal facilities, and requires an increase in the provision of sanitation services as
well as the strengthening of measures to prevent and control pollution and habitat
degradation in the region. The crucial nature of transboundary issues within this region
are demonstrated by the situation in the transboundary Gulf of Fonseca (Bakun et al.
1999). Threats to the finely structured habitats of this LME pose important concerns for
biodiversity preservation and resource sustainability.
IV. Socioeconomic conditions
In 2002, the total population of the Pacific Central-American Coastal LME region was
about 180 million, 80% of which is found in Colombia and Mexico (WRI 2004). Within
these countries, some of the most impoverished people have migrated to the coast where
they manage to make a meagre living from subsistence fishing and farming. The main
economic activities in the coastal zone are tourism, fisheries, aquaculture and agriculture,
as well as shipping and industrial activities (Bakun et al. 1999). Fish export value is
substantial for Mexico, Nicaragua, Panama and Ecuador and the export of frozen
crustaceans represents a significant source of foreign exchange. In 2001, the export
value of frozen crustaceans was US$281 million in Ecuador, US$450 million in Mexico,
US$33 million in Nicaragua and US$80 million in Panama (FAO 2005b). This LME is
located on the intercontinental maritime route with intensive commercial exchange and
tourist activity through the region. The most important site of maritime traffic is the
Panama Canal, with an annual average of 14,300 ships (1990-1998) and income of
US$420 million (PNUMA 2001).
Overexploitation, pollution and habitat modification have moderate socioeconomic
impacts in the bordering countries (UNEP 2006). Fishing is of high social and economic
significance for coastal populations, being a major source of protein, employment and
income. However, total catches do not satisfy the local demand because investments
are directed towards international markets. This has a direct impact on coastal
populations by affecting social stability and creating food insecurity. About 28% of
children below five years of age have nutritional problems. A study has shown that the
number of artisanal fishers has increased but fish production has decreased
(CCAD/IUCN 1999). This is producing lower incomes from fishing and an increase of the
population living in extreme poverty. In the Gulf of Fonseca, the increasingly restricted
and scarce marine resources associated with ongoing economic activities have had
negative social impacts by further marginalising traditional human users of mangroves,
wetlands and marine resources (DANIDA 1997).
652
48. Pacific Central-American Coastal LME
Pollution and eutrophication in coastal areas also threaten the food security of the coastal
communities by affecting the harvesting of shellfish and other living resources. Available
information indicates the accumulation of pesticides, heavy metals and other pollutants in
coastal areas. Coastal water pollution also has negative impacts on commercial fisheries
and tourism and endangers the health of swimmers. A growing number of environmental
refugees are encroaching on sensitive areas in need of protection.
V. Governance
The Pacific Central-American LME coastline is shared by Mexico, Guatemala, El
Salvador, Honduras, Nicaragua, Costa Rica, Panama, Colombia and Ecuador. Each of
these countries has laws and institutions related to management of the marine
environment and its resources at the national level. However, there is need for the
strengthening of local administrations for effective monitoring and management as well
as for improved data collection (Bakun et al. 1999). Greater awareness is also required
among local people and governments of the importance of preserving ecosystem
integrity, especially for key coastal habitats like mangrove swamps and coral reefs. The
marine environmental initiatives in the region are partly governed by international
conventions such as UNCLOS, the UN Fish Stocks Agreement and the FAO Code of
Conduct for Responsible Fisheries.
Regional initiatives include the Convention for Cooperation in the Protection and
Sustainable Development of the Marine and Coastal Environment of the Northeast
Pacific (Antigua/Guatemala Convention), which was signed by Costa Rica, El Salvador,
Guatemala, Honduras, Nicaragua and Panama in 2002. Key parts of this convention
address the high levels of sewage and other pollutants being discharged from urban
areas into the Pacific Ocean. Another priority is the assessment of risks from oil pollution
and a strategy to deal with such events including an evaluation of the region's access to
clean-up equipment and personnel. The Northeast Pacific Regional Seas Programme
includes Colombia, Costa Rica, El Salvador, Guatemala, Honduras and Panama and is
based on the Antigua/Guatemala Convention. The Central American Commission for
Maritime Transportation acts as secretariat for the Northeast Pacific Regional Seas
Programme. El Salvador, Honduras, Nicaragua are preparing the project `Integrated
Ecosystem Management of the Gulf of Fonseca' for GEF support. The development
objective of the proposed project is to prevent the degradation and maintain the
ecosystem integrity of the Gulf of Fonseca through an integrated approach to managing
its land and water resources and promoting their sustainable use. The project's global
objective is to implement a regional cooperative framework for the management of the
Gulf that will result in enhanced environmental protection of international waters and
strengthen the conservation of globally significant coastal and marine habitats.
References
Bakun, A. (1999). A dynamic scenario for simultaneous regime-scale marine population shifts in
widely separated large marine ecosystems of the Pacific, p 2-26 in: Sherman, K. and Tang, Q.
(eds), Large Marine Ecosystems of the Pacific Rim: Assessment, Sustainability and
Management. Blackwell Science, Cambridge, U.S.
Bakun, A., Csirke, J.D., Lluch-Belda, D. and Steer-Ruiz, R. (1999). The Pacific Central American
Coastal LME, p 268-280 in: Sherman, K. and Tang, Q. (eds), Large Marine Ecosystems of the
Pacific Rim: Assessment, Sustainability and Management. Blackwell Science, Cambridge, U.S.
Belkin, I.M. (2008) Rapid warming of Large Marine Ecosystems, Progress in Oceanography, in
press.
XIV North East Pacific
653
Belkin, I.M., and Cornillon, P.C. (2003). SST fronts of the Pacific coastal and marginal seas. Pacific
Oceanography 1(2):90-113.
Belkin, I.M., Cornillon, P.C., and Sherman, K. (2008). Fronts in Large Marine Ecosystems of the
world's oceans. Progress in Oceanography, in press.
Bianchi, G. (1991). Demersal assemblages of the continental shelf and slope edge between the
Gulf of Tehuantepec (Mexico) and the Gulf of Papagayo (Costa Rica). Marine Ecology Progress
Series 73:121-140.
CCAD/IUCN (1999). Diagnostico del Estado de los Recursos Naturales, Socioeconómicos e
Institucional de la Zona Costera del Golfo de Fonseca. Informe del Proyecto Regional
Conservación de los Ecosistemas Costeros del Golfo, 1Ş ed San José Costa Rica IUCN/CCAD,
Comisión Centroamericana de Ambiente y Desarrollo. Morovia, Costa Rica.
CPPS (2000). Comision Permanente del Pacifico Sur. Escobar, J.J. (ed), Estado del Medio
Ambiente Marino y Costero del Pacífico Sudeste. Plan de Acción para la Protección del Medio
Marino y Áreas Costeras del Pacífico Sudeste. Quito, Ecuador.
DANIDA (1997). Socio-environmental Study of the Gulf of Fonseca. Danida-Manglares Project,
Nicaragua.
Escobar, J.J. (1996). Políticas, Estrategias y Acciones para la Conservación de la Diversidad
Biológica en los Sistemas Costero Marinos de las Áreas Protegidas, FAO Oficina Regional
para América Latina y el Caribe. Documento Técnico 22, Proyecto FAO/PNUMA FP/0132-94-1
Conservación de la Diversidad Biológica en Áreas Silvestres y Áreas Protegidas de América
Latina y el Caribe, Santiago, Chile.
FAO (1997). Review of the State of World Marine Fisheries. FAO Fisheries Circular 920.
FAO (2005a). Fishery Country Profiles. www.fao.org/countryprofiles/selectiso.asp?lang=en
FAO (2005b). FAOSTAT Database Collections, Fisheries Data.
http://faostat.fao.org/faostat/collections?subset=fisheries
IDEAM (2002). Efectos Naturales y Socioeconómicos del Fenómeno El Nińo en Colombia.
Bogotá,, marzo 2002. http://www.ideam.gov.co/fenomenonino/DOCUMENTOELNINO.pdf
Jameson, S.C., Gallucci, V.F. and Robleto, J.A. (2000). Nicaragua in the Pacific Central American
Coastal Large Marine Ecosystem, p 531-543 in: Sheppard, C. (ed), Seas at the Millennium: An
Environmental Evaluation, Vol. 1, Elsevier Science, Amsterdam, The Netherlands.
Lluch-Belda, D. (1999). The interdecadal climatic change signal in the temperate Large Marine
Ecosystems of the Pacific, p 42-47 in: Sherman, K. and Tang, Q. (eds), Large Marine
Ecosystems of the Pacific Rim: Assessment, Sustainability and Management. Blackwel
Science, Cambridge U.S.
National Weather Service/Climate Prediction Center (2007) Cold and warm episodes by seasons [3
month running mean of SST anomalies in the Nińo 3.4 region (5oN-5oS, 120o-170oW)][based on
the 1971-2000 base period], www.cpc.ncep.noaa.gov/products/analysis_monitoring/ensostuff/
ensoyears.shtml
Palacios, D. and Gerodette, T. (1996). Potential Impact on Artisanal Gill Net Fisheries on Small
Cetacean Populations in the Eastern Tropical Pacific. NOAA Administrative Report LJ-96-11.
Pauly, D. and Christensen, V. (1995). Primary production required to sustain global fisheries.
Nature 374: 255-257.
Pauly, D. and Watson, R. (2005). Background and interpretation of the `Marine Trophic Index' as a
measure of biodiversity. Philosophical Transactions of the Royal Society: Biological Sciences
360: 415-423.
PNUMA (1999). Assessment of land-based sources and activities affecting the marine, coastal and
associated freshwater environment in the southeast Pacific. UNEP Regional Seas Report and
Studies 169. UNEP/CPPS. The Hague, The Netherlands.
PNUMA (2001). Evaluación Sobre las Fuentes Terrestres y Actividades que Afectan al Medio
Marino, Costero y de Aguas Dulces Asociadas en la Región el Pacífico Nordeste.
UNEP/DEC/NEP/EM.
PNUMA/IUCN (1998). Coral Reefs of the World. Vol. 1: Atlantic and Eastern Pacific. UNEP
Regional Seas Directories and Bibliographies. UNEP/IUCN, Gland, Switzerland.
Rubio, E.R, Funes, C. and Gaviria, F.S. (2001). Evaluación de Fuentes de Contaminación y
Actividades Humanas Originadas en Tierra que Afectan Ambientes Marinos, Costeros y
Dulceacuícolas Asociados en El Salvador, Informe al PAM/PNUMA. Abril, El Salvador.
Sánchez, M.J. (2001). Evaluación Nacional Fuentes de Contaminación y Actividades Humanas
Originadas en Tierra que Afectan los Ambientes Marinos, Costeros y Dulceacuícolas
Asociados al litoral Pacífico y Golfo de Fonseca de Nicaragua. Programa de Acción Mundial
para la Protección del Medio Marino Frente a las Actividades Realizadas en Tierra (PAM-
PNUMA). Abril 28 Managua, Nicaragua.
654
48. Pacific Central-American Coastal LME
Sea Around Us (2007). A Global Database on Marine Fisheries and Ecosystems. Fisheries Centre,
University British Columbia, Vancouver, Canada. www.seaaroundus.org/lme/Summary
Info.aspx?LME=11
Spalding, M.D., Ravilious, C. and Green, E.P. (2001). World Atlas of Coral Reefs. UNEP World
Conservation Monitoring Centre. University of California Press, Berkeley, U.S.
UNEP (2006). Permanent Commission for the South Pacific (CPPS). Eastern Equatorial Pacific,
GIWA Regional Assessment 65. University of Kalmar, Kalmar, Sweden.
www.giwa.net/publications/r65.phtml
Wielgus, J. D. Caicedo-Herrera and Dirk Zeller. 2007. A reconstruction of Colombia's marine
catches. p. 69-79 In: D. Zeller, D. and D. Pauly (eds.). Reconstruction of Marine Fisheries
Catches for Key Countries and Regions (1950-2005). Fisheries Centre Research Reports,
15(2).
Windevoxhel, N., Rodríguez, J.J. and Lahmann, E. (2000). Situation of Integrated Coastal Zone
Management in Central America: Experiences of the IUCN Wetlands and Coastal Zone
Conservation Programme, Moravia, San Jose, Costa Rica. IUCN/ORMA.
Wo-Ching, S.E. and Cordero, C. (2001). Evaluación Nacional Sobre Fuentes de Contaminación y
Actividades Humanas Originadas en Tierra que Afectan Ambientes Marinos, Costeros y Dulce
Acuícola Asociados en Costa Rica. Informe Centro de Derecho Ambiental y Recursos
Naturales CEDARENA, San José, Costa Rica. al Programa de las Naciones Unidas para el
Medio Ambiente UNEP-GPA, The Hague, The Netherlands.
WRI (2004). The World Resources Institute. World Development Indicators.
http://www.earthtrends.wri.org/
Wyrtki, K. (1965). Summary of the physical oceanography of the Eastern Pacific Ocean. Institute of
Marine Resources, University of California, San Diego.