XIII NORTH EAST ATLANTIC
XIII-36 Barents Sea LME
XIII-37 Celtic-Biscay Shelf LME
XIII-38 Faroe Plateau LME
XIII-39 East Greenland Shelf LME
XIII-40 Iberian Coastal LME
XIII-41 Iceland Shelf LME
XIII-42 North Sea LME
XIII-43 Norwegian Sea LME
512
XIII North East Atlantic
XIII North East Atlantic
513
XIII-36 Barents Sea LME
S. Heileman
The Barents Sea LME is situated within the European part of the Arctic shelf and to the
north of the Polar Circle (Matishov et al. 2003). It is a relatively shallow sea with a
surface area of about 1.7 million km2, of which 4.32% is protected (Sea Around Us 2007),
a large shelf, and an extensive polar front. Among its river systems and estuaries are the
Dvinskaya Guba and Pechorskaya Guba. This LME is a transition zone where relatively
warm inflowing Atlantic water is cooled and transformed into Arctic as well as Polar water
(Blindheim & Skjoldal 1993). Arctic continental shelves show a complex density
circulation, behaving as `salt-wedge estuaries' in summer and, by the deep export of salt-
rejection brine produced as the sea freezes, `negative estuaries' in winter (Longhurst
1998). The surface water is more dilute and shows greater seasonal variation in salinity
than the central part of the Arctic Ocean (Carmack 1990). The climate of this LME shows
high spatial and temporal variability that depends mainly on the activity and temperature
of the inflowing Atlantic water. A notable feature is the extreme environment with
considerable annual and inter-annual variations in ice cover, which extends over one- to
two-thirds of the sea with maximum extension during winter (Blindheim & Skjoldal 1993).
Book chapters and reports pertaining to this LME include Blindheim & Skjoldal (1993),
Dalpadado et al. (2002), Matishov et al. (2003) and UNEP (2004).
I. Productivity
The Barents Sea LME can be considered a Class II, moderately productive ecosystem
(150-300 gCm-2yr-1). Biological activity in the Arctic seas is determined mainly by
seasonal changes in the temperature and light regimes, advection and ice cover
(Matishov et al. 2003). Many biological processes are strongly influenced by the
formation of the seasonal thermocline and convective mixing (Terziev 1990). In addition,
the drifting and fixed ice masses have a significant influence on the dynamics as well as
seasonality of plankton communities and consequently, the higher trophic levels
(Matishov et al. 2003). The ice-edge zones are distinguished by increased primary
production in spring and early summer in response to the melting of ice (Blindheim &
Skjoldal 1993, Matishov et al. 2003). The total annual primary production from in situ data
is estimated to be 38.4 million tonnes of carbon (Vetrov and Romankevich 2004).
More than 310 species of pelagic microalgae belonging to the Diatomea, Bacilloriophyta,
Dinophyta, Chrysophyta, and Chlorophyta, among others, have been identified in the
phytoplankton of the Barents Sea LME. Approximately 40% of these can be
characterised as Arctic species, more than 20% as boreal species and the rest as
cosmopolitan or with an undesignated geographic distribution (Biological Atlas of Arctic
Seas 2000). Phytoplankton blooms in the surface water masses are dominated by
Chaetoceros spp. and Phaeocystis pouchetii. Ice algae such as Melosira arctica and
loosely attached mats of diatoms are a feature of the ice-covered portions of the Arctic
seas. Algal macrophytes include Ascophyllum nodosum, Fucus distichus and blade-
kelps Laminaria saccharina and L. digitata (Matishov 1998).
Boreal, arctic, and transitional species constitute the zooplankton (Biological Atlas of
Arctic Seas 2000). In the Barents Sea and elsewhere in the Arctic, copepods are the
dominant group of zooplankton followed by amphipods, decapods, ostracods, pteropods
and chaetognaths (Melnikov 1997). The water column below the ice is inhabited by a


514
36. Barents Sea LME
sparse but permanent zooplankton community, its biomass dominated by calanoid
copepods such as Calanus glacialis (C. finmarchicus in the south) and C. hyperboreus
and larger numbers but smaller biomass of species such as Pseudocalanus, Oithona,
and Microcalanus (Longhurst 1998). Dalpadado et al. 2002) have shown the richness of
the zooplankton community in the northern Barents Sea.
The Arctic trophic links vary significantly according to the environmental conditions
(Matishov et al. 2003). For example, in the Atlantic water mass, each level of the food
web contains one dominant, central species or group of species on which the rest of the
biota depends. These dominant groups include pelagic crustaceans (Calanus
finmarchicus and Euphausids), herring (Clupea harengus), capelin (Mallotus villosus),
polar cod (Boreogadus saida) (in the NE) and cod (Gadus morhua). Marine birds and
mammals (e.g., seals, polar bears and whales) are among the top consumers in the
pelagic realm. Biological activity is also closely connected with the ice cover. The Arctic
sea ice biocenoses are described by Melnikov (1997). The biota within the sea ice is
small (<1mm) and dominated by bacteria, unicellular plants and animals and small multi-
cellular animals. Protozoans, turbellarians, nematodes, crustaceans and rotifers can be
abundant in the ice year-round. A partially endemic fauna comprised mainly of
gammaridean amphipods thrive on the underside of ice floes with up to several hundred
individuals m-2. The amphipods are a prey of cod, which in turn are preyed upon by
marine mammals (e.g., seals) and birds. The polar bear (Ursus maritimus) and the Arctic
fox (Alopex lagopus) are the top consumers on the drifting sea ice.
Oceanic fronts: The Atlantic flow enters the Barents Sea LME along the Norwegian
coast and continues along Russia's coast, carrying warm and salty waters that form
distinct TS-fronts at the contact with coastal waters and resident waters of the Barents
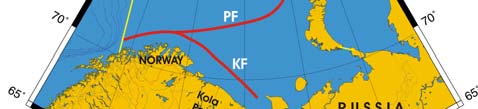
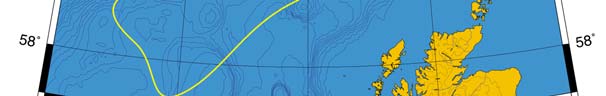
Sea proper (Belkin et al. 2008). North of Tromsř and Nordkapp two fronts are
distinguished: a coastal front just a few miles off the coast and an offshore front farther
out to sea (Figure XIII-36.1). The Polar Front (PF) south of Bear Island follows the
Spitsbergen (Svalbard) continental slope, which provides bathymetric steering to the front
and ensures its stability. In the absence of topographic steering elsewhere within the
Barents Sea LME, the Polar Front's location is variable and depends largely on the
intensity of the Atlantic inflow to the Barents Sea.
Figure XIII-36.1. Fronts of the Barents Sea LME. PF, Polar Front; KF, Kola Front. Yellow line, LME
boundary. After Belkin et al. (2008).
XIII North East Atlantic
515
Barents Sea LME (Belkin 2008)(Figure XIII-36.2):
Linear SST trend since 1957: -0.04°C.
Linear SST trend since 1982: 0.12°C.
In the long-term, the Barents Sea LME appears relatively stable, although its interannual
variability is substantial, having a magnitude of 1°C. The timing of cold events of 1978-
79, 1987, and 1997-99 is consistent with passages of decadal-scale "Great Salinity
Anomalies" (Dickson et al., 1988; Belkin et al., 1998; Belkin, 2004) of the 1970s, 1980s,
and 1990s through the Barents Sea. The double-pronged cold event of 1966-68, which
resulted in the all-time low of 2.6°C in 1966, must have had a different origin. The well-
defined warming events that peaked in 1973 and 2000 also need to be explained. The
last warming event, of 2000, was concurrent with a sharp maximum in the Norwegian
Sea, consistent with large-scale atmospheric forcing and also with oceanic advection.
The previous peak of 1974 in the Norwegian Sea may have been related to the Barents
Sea maximum of 1973.
One has to be cautious while trying to determine long-term trends in the Barents Sea.
Depending on choice of end points, trends could be increasing or decreasing. Most
recent reports of a dramatic three-degree warming of the Barents Sea over the last 26
years are based on satellite data from 1982 on. Note that the year of 1982 was one of
the coldest years on record in this area. Therefore, selection of this year as an end-point
would yield a rapidly increasing SST trend.
Figure XIII-36.2. Barents Sea LME annual mean SST (top) and SST anomalies (bottom), 1957-2006,
based on Hadley climatology. After Belkin (2008).
516
36. Barents Sea LME
Barents Sea LME Chlorophyll and Primary Productivity
The Barents Sea LME is a Class II, moderately productive ecosystem (150-300 gCm-2yr-
1)(Figure XIII-36.3).
Figure XIII-36.3. Barents Sea LME trends in chlorophyll a (left) and primary productivity (right), 1998
2006, from satellite ocean colour imagery; courtesy of K. Hyde.
II. Fish and Fisheries
The major species fished in the Barents Sea LME are capelin, Atlantic cod and herring,
with capelin and herring being the major prey of cod (Blindheim & Skjoldal 1993). The
LME is one of the world's most intensively exploited ecosystems, with severe
overexploitation of the major fish stocks such as cod and haddock (UNEP 2004).Note
that the Norwegian Polar Institute reports a reduction in overfishing in 2008. During the
last decades, the biomass yield of the major species has fluctuated significantly because
of high fishing mortality and variation in the natural environment (Skjoldal 1990,
Blindheim & Skjoldal 1993, Matishov et al. 2003).
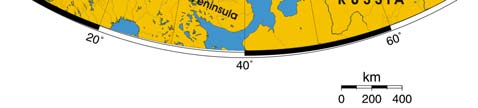
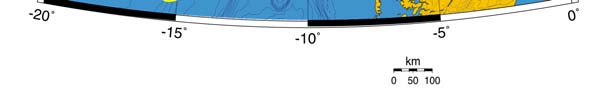
Total reported landings show marked fluctuations and reached a peak of 3.3 million
tonnes in 1977, with capelin accounting for 70% of these landings, followed by a
precipitous decline to 340,000 tonnes in 1990 (Figure XIII-36.4). Cod landings have
decreased considerably from the early 1970s, possibly as a result of the temperature-
salinity anomaly (indicated by cooling and reduced salinity) that occurred in the northern
North Atlantic during the 1960s and the 1970s (Blindheim & Skjoldal 1993). By the
beginning of 2000, the commercial cod stock was estimated at 1.5 million tonnes and its
spawning stock at 300,000 tonnes, significantly lower than the average long-term values
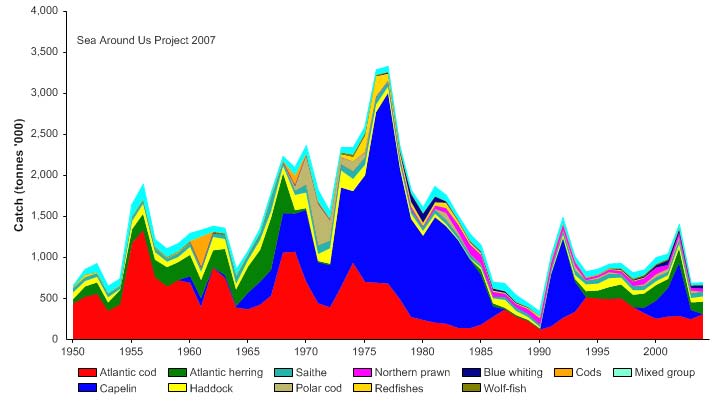
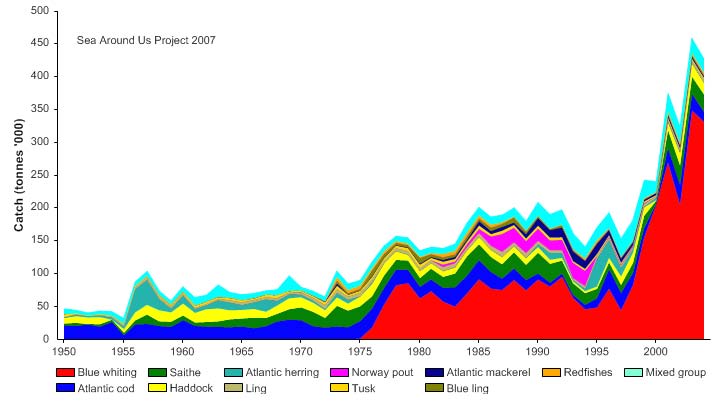
of 2.5 million and 600,000 tonnes, respectively (Borovkov et al. 2001). The total value of
the reported landings also peaked in 1977, estimated at more than US$2.1 billion (in
2000 US dollars; Figure XIII-36.5). In her 2006 address to the North Atlantic Conference
in Tromsř, Minister of Environment Helen Bjřrnřy expressed strong concern for illegal,
unregulated and unreported fisheries (IUU-fisheries) in the Barents Sea, stating that more
than 100.000 tonnes of Arctic cod and 3040,000 tonnes of haddock are estimated to be
illegally fished there each year.
XIII North East Atlantic
517
Figure XIII-36.4. Total reported landings in the Barents Sea LME by species (Sea Around Us 2007).
Figure XIII-36.5. Value of reported landings in the Barents Sea LME by commercial groups (Sea Around
Us 2007).
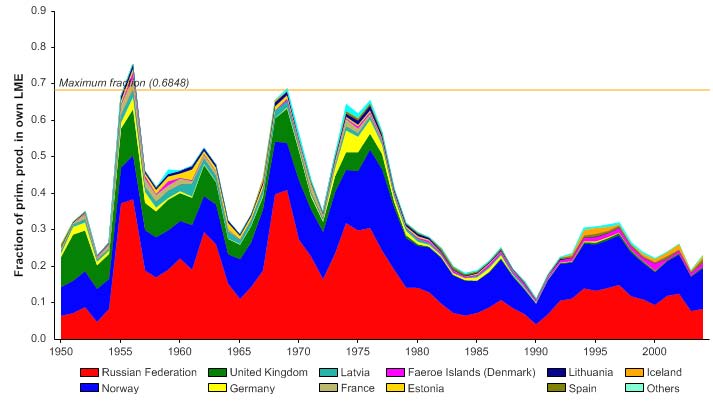
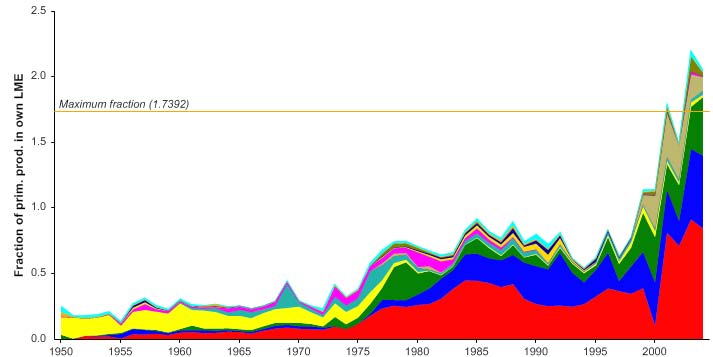
The primary production required (PPR; Pauly & Christensen 1995) to sustain the reported
landings in this LME reached 70% of the observed primary production in 1955 and
recorded similarly high levels in mid 1970s, before declining to less than 30% in recent
years (Figure XIII-36.6). The high PPR level achieved in 1955 is probably a result of the
large landings of accumulated cod biomass, not of annual surplus production, whilst the
levels achieved in the mid 1970s is likely due to the expansion of capelin distribution
beyond the LME boundary which led to possible misreporting of capelin caught outside
the LME as being caught within the LME. Russia and Norway have the largest share of
the ecological footprint in this LME.
518
36. Barents Sea LME
Figure XIII-36.6. Primary production required to support reported landings (i.e., ecological footprint) as
fraction of the observed primary production in the Barents Sea LME (Sea Around Us 2007). The
`Maximum fraction' denotes the mean of the 5 highest values.
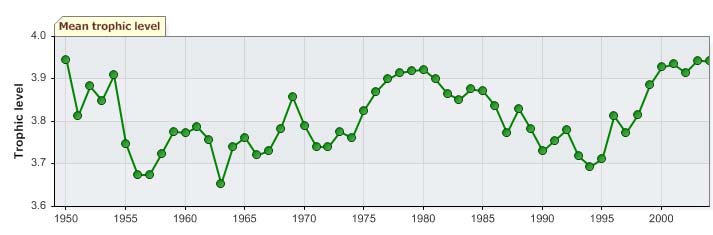
The mean trophic level of the fisheries catch (i.e., the MTI; Pauly & Watson 2005)
underwent a decline from 1950s to the mid-1980s, suggesting a `fishing down' of the food
web (Pauly et al. 1998); it then increased in a fluctuating manner (Figure XIII-36.7, top),
reflecting the relative abundance of cod and capelin in the reported landings during the
1990s and the 2000s (Figure XIII-36.4). During the same period, the FiB index fluctuated
without any observable trend (Figure XIII-36.7, bottom). The Nordic Council of Ministers
is initiating a study on indicators for sustainable fisheries for the Barents and Norwegian
Seas LMEs that is expected to shed new light on the fish abundance in these areas.
Note that he Mare cognitum programme in the Norwegian Sea concluded that the food
chains were short (phytoplankton zooplankton fish) with high trophic efficiency (20 %
rather than 10%).
Figure XIII-36.7. Mean trophic level (i.e., Marine Trophic Index) (top) and Fishing-in-Balance Index
(bottom) in the Barents Sea LME (Sea Around Us 2007).
XIII North East Atlantic
519
The Stock-Catch Status Plots indicate that the number of collapsed stocks has been
rapidly increasing, to about 80% of the commercially exploited stocks, with the remainder
classed as overexploited (Figure XIII-36.8, top). The contribution to the reported landings
biomass by these two stock categories is roughly equal (Figure XIII-36.8, bottom).
1950
1960
1970
1980
1990
2000
0%
100
10%
90
20%
)
80
%
(
s
30%
u
70
t
at
s
40%
y
60
b
ks
50%
c
50
o
f
st
60%
o
40
er
70%
mb
30
u
N
80%
20
90%
10
100%
0
1950
1960
1970
1980
1990
2000
(n = 1994)
developing
fully exploited
over-exploited
collapsed
1950
1960
1970
1980
1990
2000
0%
100
10%
90
20%
80
)
30%
(
%
70
t
us
40%
t
a
60
s
k
50%
t
oc
50
s
y
60%
h b
40
t
c
a
70%
C
30
80%
20
90%
10
100%0
1950
1960
1970
1980
1990
2000
(n = 1994)
developing
fully exploited
over-exploited
collapsed
Figure XIII-36.8. Stock-Catch Status Plots for the Barents Sea LME, showing the proportion of
developing (green), fully exploited (yellow), overexploited (orange) and collapsed (purple) fisheries by
number of stocks (top) and by catch biomass (bottom) from 1950 to 2004. Note that (n), the number of
`stocks', i.e., individual landings time series, only include taxonomic entities at species, genus or family
level, i.e., higher and pooled groups have been excluded (see Pauly et al, this vol. for definitions).
Over the past several decades, capelin biomass has declined significantly, falling from
about 2.5 million tonnes in the late 1970s to almost zero during the late 1980s-1990s
(Dalpadado et al. 2001, ICES 2003, Matishov et al. 2003). Predation on capelin larvae
by young herring as well as on immature capelin by cod can have a marked impact on
the capelin stock (Blindheim & Skjoldal 1993) and the formation of strong year classes of
cod and herring in 1983 is thought to have contributed to the collapse of the capelin stock
in 1986 (Blindheim & Skjoldal 1993). As capelin plays an important intermediate link in
the food web, a decline in its biomass can have serious effects on other components of
the regional ecosystem and may have led to the poor growth of local cod stocks
(Monstad & Gjoesaeter 1987), high seabird mortality and massive seal invasions along
the Norwegian coast (Skjoldal 1990). The capelin biomass has since increased to nearly
three million tonnes in 1999-2000 (Matishov et al. 2003). The editors and Norwegian
reviewer caution that management policies for reduction of catch for some stocks has
caused an appearance of reduced amounts of fish available.
Bycatch and discards are considered to be small in the LME (UNEP 2004), but the
available data are highly uncertain. These issues could, therefore, be serious (Matishov
et al. 2003). Bycatch in the cod fishery consists mainly of under-sized cod and haddock.
520
36. Barents Sea LME
According to studies by the Murmansk Marine Biological Institute and other unofficial
assessments, discards of under-sized fish could be as high as 30% for several species,
despite a number of regulations requiring that all bycatch must be landed. Moreover,
lack of reliable data on the level of discards could be detrimental to fisheries
management as it often leads to uncertainty in assessments of stock sizes (PINRO
2000). Destruction of the bottom habitat by trawling also has a negative impact on cod
and bottom fish, such as catfish, perch, plaice, Greenland halibut and American plaice,
which already suffer from relatively small stock sizes (UNEP 2004).
Mitigation of overfishing can be expected, as a series of management measures continue
to be implemented in the LME. In fact, the total catch has shown some signs of recovery
over the past decade. However, effective management and sustainable use of the LME's
fisheries resources must also take into consideration the impact of environmental
variability on these resources.
III. Pollution and Ecosystem Health
Pollution: The two main sources of pollution are water mass and atmospheric advection
from external sources as well as industrial activities within the basin (Matishov et al.
2003). Water and ice exchange with adjacent areas has a significant role in the pollution
of this LME, which is a sink for the Atlantic Ocean currents. However, information on the
bulk of pollutants discharged into the LME is limited (Matishov et al. 2003). The
authoritative source is the AMAP (2002) report on POPs, heavy metals, radioactivity, and
other aspects affecting ecosystem health.
The overall slight level of pollution (UNEP 2004) is possibly related to the Barents Sea's
high assimilating capacity and being open towards the north and the west (Matishov et al.
2003). Microbiological pollution, eutrophication and suspended solids are not of general
concern (UNEP 2004), although elevated levels of microbiological pollution have been
observed in some localised areas. Pollution by solid waste is due mainly to timber and
municipal waste in localised areas.
The coastal areas are most exposed to chemical pollution. However, in these areas, the
levels of chemical pollutants, such as chlorinated hydrocarbons and heavy metals and
their compounds as well as organic compounds such as DDT are lower than the
Maximum Allowable Concentrations, the standard set by Russian regulations and
Norwegian Pollution Control Authority environmental quality assessment criteria (Molvaer
et al. 1997). These levels are also lower than in other parts of Russia or in the European
Seas (Matishov et al. 2003). An exception to this, however, is Kola Bay, which has high
levels of contamination in the water and sediments. There are eutrophication hotspots in
the estuarine zone of the Kola River (UNEP 2004). The areas adjacent to the port of
Murmansk as well as the port centre of Severomorsk have extremely high levels of
practically all metals. Elevated levels of POPs such as toxaphene and brominated flame
retardant have been found in bottom sediments in some areas of the Kola Bay (Savinov
et al. 2000).
Low accumulation of contaminants in the tissues and organs of the most important
commercial species of fish and invertebrates has been reported (Matishov et al. 2003).
On the other hand, elevated levels were detected in animals at higher trophic levels
(seabirds, marine mammals and polar bear) due to food web bio-accumulation (Muir et
al. 2003, Savinov et al. 2003).
There is concern over possible radioactive contamination. The main sources of artificial
radionuclides in the marine environment include atmospheric fallout, river runoff,
discharges from West-European nuclear reprocessing plants entering the region with the
Gulf Stream Current, discharges of liquid radioactive wastes from sources on the Kola
XIII North East Atlantic
521
Peninsula as well as a result of nuclear tests (mostly, on nearby Novaya Zemlya) and
accidents such as occurred in Chernobyl (Matishov & Matishov 2001).
The oil, gas and shipping industries are potentially dangerous to the health of the LME,
with the chronic pollution of the marine environment and biota from petroleum products
being a serious environmental threat (UNEP 2004). The LME is covered with numerous
navigation routes, including the Northern Sea Route and thousands of vessels, including
oil tankers, pass through the Barents Sea year round. The presence of drifting and
packed ice increases the threat of pollution because of the accumulation of concentrated
oil products and other toxic substances in ice and their release into the marine
environment during ice-melting in summer. Elevated hydrocarbon levels have been
reported in some areas. For instance, levels of oil products higher than MAC are routinely
recorded in the convergence zones and fishing grounds (Matishov et al. 2003). A
spreading oil film covering a relatively large area has been observed in the vicinity of
Kolguev Island where oil is extracted (Ivanov 2002). Pollution from petroleum products
may worsen with the intensification of hydrocarbon extraction on the Arctic shelf and
increased oil transport as well as shipping in the region. The Norwegian government has
petitioned the UN's International Maritime Organization, IMO, to establish mandatory
shipping routes, 30 nautical miles off the coast, between Vardř and Rřst (Norwegian
Ministry of Fisheries and Coastal Affairs 31 March 2006 press release).
Habitat and community modification: There are no records of serious habitat
modification in the LME, but there is evidence of slight degradation and loss of some
habitats (UNEP 2004). An important issue is the introduction of humpback salmon, snow
crab (Kuzmin 2000) and red king crab into the LME (Orlov 1977). These species have
caused serious changes in the faunal composition of benthic communities in localised
areas. For example, sea urchin biomass in Zelenetskaya Bay decreased by a factor of
five following the introduction of the red king crab (UNEP 2004). These might be natural
changes in abundances, but similar changes in a number of areas may provide evidence
for the impact of the crab on benthic communities. Distribution of the red king crab along
the warm Atlantic water masses and its expansion into new warm water habitats has
been observed (UNEP 2004). The introduction and rapid population growth of this
species, which is a large mobile predator and polyphage, has limited the food resources
for itself as well as for other benthic organisms including fish fry. The king crab is also an
intermediate host for a cod fry parasite and an increased infection rate and potential
decrease in cod abundance are expected in the coming years. The majority of the
Barents Sea whales are rare or protected species and are included in the IUCN Red List.
At present the health of the Barents Sea LME is in relatively good condition. This may
change, however, as a result of the rapid development of the oil and gas industry on the
Arctic shelf, increased volume of oil and gas transport as well as the accidental
introduction of alien species with ship ballast water. In addition, the potential threat from
radionuclides may increase in the future (UNEP 2004). Therefore, regional authorities
should be increasingly focused on radiological protection activities and prepared for any
eventualities related to nuclear reactors, storage of radioactive waste and spent nuclear
fuel.
IV. Socioeconomic Conditions
The total human population in the catchment area of the Barents Sea LME is about
five million, composed partly of indigenous peoples (Nenets, Lapps, Karelians and
Vepsians). About 1.5 million people live in the coastal zone (Matishov et al. 2003). The
average population densities in the Russian and Norwegian parts of this LME are
significantly below the national averages. This is a consequence of population decrease,
including migration from these regions, during the last two decades (Demographic Annual
522
36. Barents Sea LME
Book 2002). The countries' economies and populations are partly dependent on the
Barents Sea LME and its resources, directly or indirectly through fisheries, oil and gas
extraction and marine transportation. The economic development of the Russian coast of
the LME is based on the exploitation of natural resources. Tourism is growing in
importance in this region, with the opening of the Russian borders.
Overexploitation has had severe social and economic consequences, in terms of
employment, incomes, investment activity and population growth, particularly in the
coastal settlements that depend on fisheries (UNEP 2004). During the 1990s, fishing
outside the LME was stopped and coastal fish processing reduced, which resulted in a
significant increase in unemployment in the fisheries sector. Unemployment in Finnmark,
Norway is two times higher than the Norwegian average and is principally caused by the
reduction in employment in the fisheries sector. Overexploitation has also resulted in the
loss of human and animal food sources, increase in poaching and conflicts over access
to the resources. Fish consumption in the north of Russia declined by 50% from 1990 to
2001 (UNEP 2004).
The socioeconomic impacts of pollution can be moderate. The large metallurgy, pulp and
paper, mining as well as chemical enterprises are the main source of contaminants
potentially impacting human health in the neighbouring territories. The high cost of
radiological protection is of particular concern.
In general, habitat and community modification have slight socioeconomic impacts, which
include the cost of managing the number of intentionally introduced species, especially
the red king crab, monitoring programmes, research and international agreements on
management and quotas. Potentially the most damaging alien species in Norway are
toxic phytoplankton, which have caused losses in the aquaculture industry of some US$5
- 8 million , and parasites and pathogens which have caused damage of at least
US$630 million to farmed and wild Atlantic salmon in Norway over the last 15 years.
V. Governance
Environmental protection activities are regulated by and carried out through a number of
international programmes and instruments. Among these is the Oslo Convention,
adopted in 1972 to prevent the dumping of hazardous substances at sea, which was
followed by the 1974 Paris Convention dealing with land-based sources of pollution.
These legal instruments have now been merged into the present Convention for the
Protection of the Marine Environment of the North-East Atlantic of 1992 (OSPAR
Convention), which entered into force in 1998. This Convention contains a number of
supporting legislative and policy instruments regarding the Northeast Atlantic. See the
OSPAR website for more information on the protection and conservation of ecosystems
and biological diversity, and for the optimum utilisation of the fisheries of the Northeast
Atlantic (www.ospar.org/). OSPAR is a regional body for international cooperation on the
prevention and elimination of pollution from land-based and off-shore sources, dumping
or incineration, and assessment of the quality of the marine environment. The OSPAR
Commission site has information on the 1992 Convention, ministerial declarations and
statements, and the use of the ecosystem approach to the management of human
activities (www.ospar.org/). Other relevant international conventions include MARPOL
and the United Nations Economic Commission for Europe Protocol of the European
Commission on Strategic Environmental Assessments (the UNECE SEA Protocol).
The Arctic Council is one of the main international organisations dealing with
environmental issues in the Arctic and Barents Sea Region. At least three of its five
programmes deal with the protection of the marine environment: Protection of the Arctic
Marine Environment (PAME) addresses policy and non-emergency response measures
related to protection from land and sea-based activites, the Arctic Monitoring and
XIII North East Atlantic
523
Assessment Programme (AMAP) has responsibilities to monitor the levels of and assess
the effects of pollutants in all components of the Arctic marine environment, as well as in
humans and the Emergency Prevention, Preparedness and Response, which is
responsible for emergency preparedness in the region. The countries have adopted the
Rovaniemi Initiative on the Protection of the Arctic Environment, through which the Arctic
Environmental Protection Strategy was launched in 1991.
The Arctic Council is an intergovernmental forum addressing many of the common
concerns and challenges faced by Canada, Denmark, Finland, Iceland, Norway, Russia,
Sweden and the USA. Arctic Council Ministers, in a 2002 declaration, recognised that
`existing and emerging activities in the Arctic warrant a more coordinated and strategic
approach to address the challenges of the Arctic coastal and marine environment'. The
Council has agreed to develop a strategic plan for protection of the Arctic marine
environment under the leadership of PAME, one of the five working group of the Arctic
Council. PAME is an independent partner of UNEP Regional Seas Programme. Its
international secretariat has been located in Iceland since 1999. More than 20 treaties
and agreements cover the Arctic area. Several countries and groups of countries,
including Norway, are engaged in scientifically-driven management of marine
ecosystems, with an integrated approach similar to the LME approach.
Finland, Sweden and Norway all have bilateral environmental programmes and projects
under-way with Russia in the Barents Sea LME region. Norway and Russia share stocks
of cod, capelin and haddock, and close cooperation is needed in the management of
these transboundary resources. These two countries manage their shared fish stocks
through the Joint Norwegian-Russian Fishery Commission, established in 1975. The
Commission sets total allowable catches (TAC) for shared fish stocks throughout their
transboundary migratory routes. Fish quotas are also allocated to third-parties with
historical rights to the Barents Sea fisheries. The TAC's are based on scientific advice
from ICES and national research institutions. ICES formulates scientific advice to
fisheries authorities in the North Atlantic region, and is one of the main organisations
coordinating and promoting marine research in the North Atlantic, including in adjacent
seas such as the Baltic and North Seas (www.ices.dk/indexnofla.asp). The Barents
Euro-Arctic Council (BEAC) encourages economic intergovernmental cooperation in
trade, investment, energy transport and information technology, on the environment and
nuclear safety, and on human and social development. The Council has a rotating
chairmanship among the 13 member countries.
Cooperation in control, enforcement and marine research is being strengthened. A GEF-
supported project (Support to the National Programme of Action for the Protection of the
Arctic Marine Environment) is being conducted in the region. The main objectives are: to
ensure a coherent basis for the identification of priorities associated with the adverse
effects of land-based activities, to meet Russia's obligations under the GPA as well as
other international agreements and to prepare the ground for environmentally sustainable
development of the Arctic. Project outcomes will include an agreed SAP to address
damage and threats to the Arctic environment from land-based activities in the Russian
Federation, a regulatory framework complemented by adequate infrastructural and
technical capacities and prepared ground for substantial investments in
remediation/prevention of damage to the Arctic environment.
524
36. Barents Sea LME
References
AMAP (2002). Arctic Pollution 2002: Persistent Organic Polluatants, Heavy Metals, Radioactivity,
Human Health, Changing Pathways. Arctic monitoring and Assessment Programme (AMAP),
Oslo, Norway. xii+112 pp.
Belkin, I.M. (2004) Propagation of the `great salinity anomaly' of the 1990s around the northern
North Atlantic. Geophysical Research Letters 31(8): art. No.-LO8306 (DOI:10.
1029/2003GL019334).
Belkin, I.M. (2008) Rapid warming of Large Marine Ecosystems, Progress in Oceanography, in
press.
Belkin, I.M., Cornillon, P.C., and Sherman, K. (2008) Fronts in Large Marine Ecosystems of the
world's oceans. Progress in Oceanography, in press.
Belkin, I.M., Levitus, S. Antonov, J., and Malmberg, S.-A. (1998) "Great Salinity Anomalies" in the
North Atlantic. Progress in Oceanography 41(1): 1-68.
Biological Atlas of Arctic Seas. (2000). Plankton of the Barents and Kara Seas. Silver Spring. World
Oceanographic Data Center. www.nodc.noaa.gov/OC5/ BARPLANK/start.html
Blindheim, J. and Skjoldal, H. R. (1993). Effects of climatic changes on the biomass yield of the
Barents Sea, Norwegian Sea and West Greenland Large Marine Ecosystems, p 185-198 in:
Sherman, K., Alexander, L.M. and Gold, B.D. (eds), Large Marine Ecosystems: Stress,
Mitigation and Sustainability. AAAS, Washington, D.C., U.S.
Borovkov, V.A., Shevelev, M.S. and Shleinik V.N. (2001). Current Status and Dynamics of the
Commercial Ecosystem of the Barents Sea. Biological Resources of the Russian Arctic
Coastal Zone: Materials to Symposium. Belomorsk. April. VNIRO, Moscow, Russia. (In
Russian).
Carmack, E.C. (1990). Large-scale physical oceanography of polar regions, p 171-221 in: Polar
Oceanography. Part A: Physical Science. Academic Press, London, U.K.
Dalpadado, P., Bogstad, B., Gjosoeter, H., Mehl, S. and Skjoldal, H.R. (2002). Zooplankton-fish
interconnections in the Barents Sea, p 269-291 in: Sherman, K. and Skjoldal, H.R. (eds), Large
Marine Ecosystems of the North Atlantic: Changing States and Sustainability. Elsevier, The
Netherlands.
Demographic Annual Book (2002). Statistics Annual Book. Moscow: State Statistics Committee. (In
Russian).
Dickson, R.R., Meincke, J., Malmberg, S.-A. and Lee, A.J. (1988) The `great salinity anomaly' in the
North Atlantic, 1968-1982. Progress in Oceanography 20(1): 103-151.
ICES (2003). International Council for the Exploration of the Sea. ICES Cooperative Research
Report 255.
Ivanov, G.I. (2002). Methodology and Results of the Barents Sea Ecogeochemical Research. St.
Petersburg, Russia. (In Russian).
Kuzmin, S.A. (2000). Spreading of Snow Crab Chionoecetes opilio (Fabricius) in the Barents Sea.
ICES CM /U: 21.
Longhurst, A.R. (1998). Ecological Geography of the Sea. Academic Press, San Diego, California,
U.S.
Matishov, D.G. and Matishov, G.G. (2001). Radiational Ecological Oceanology. Apatity, Publishing
House of the Kola Scientific Center RAS, Russia. (In Russian).
Matishov, G.G. and Denisov, V.V. (2000). Ecosystems and Biological Resources of Russian
European Seas on the Turn of the 21st Century. Murmansk Marine Biological Institute.
Murmansk, Russia.
Matishov, G.G., Denisov, V.V. and Dzhenyuk, S.L. (2003). Contemporary State and Factors of
Stability of the Barents Sea Large Marine Ecosystem, p 41-74 in: Hempel, G. and Sherman, K.
(eds), Large Marine Ecosystems of the World: Trends in Exploitation, Protection, and
Research. Elsevier, the Netherlands.
Matishov, G.G., ed. (1998). Harvesting and Perspective Algae and Invertebrates for Uses of the
Barents and White Seas. Apatity, KSC RAS Publishing House, Russia. (In Russian).
Matishov, G.G., ed. (1999). Adaptation and Evolution in Biota of Polar Seas under the Oceanic
Periglacial Conditions. Apatity, KSC RAS Publishing House, Russia. (In Russian).
Melnikov, I.A. (1997). The Arctic Sea Ice Ecosystem. Gordon and Breach Science Publishers, the
Netherlands.
XIII North East Atlantic
525
Molvćr, J., Knutzen, J., Magnusson, J., Rygg, B., Skei, J and Sřrensen, J. (1997). Classification of
Environmental Quality in Fjords and Coastal Waters. A Guide. SFT Veiledning 97:03. (In
Norwegian).
Monstad T. and Gjoesaeter, H. (1987). Observations on Polar Cod (Boreogadus saida) in the
Barents Sea 1973-1986. ICES C.M. 1987/G:13.
Muir, D., Savinova, T., Savinov, V., Alexeeva, L., Potelov, V. and Svetochev, V. (2003).
Bioaccumulation of POPs and chlorinated pesticides in seals, fishes and invertebrates from the
White Sea, Russia. The Science of the Total Environment 306:111-132.
Norwegian Ministry of Fisheries and Coastal Affairs at www.regjeringen.no
Norwegian Polar Institute (2008) Assessment of the Management Plan for the Barents Sea.
http://npweb.npolar.no/english/ articles/1208773699.31
Orlov, Yu.I. (1977). Introduction of commercial crabs into the Barents Sea. Fishery 9: 20-22. (In
Russian).
OSPAR at www.ospar.org/eng/html/convention/ospar_conv10.htm
Pauly, D. and Christensen, V. (1995). Primary production required to sustain global fisheries.
Nature 374: 255-257.
Pauly, D. and Watson, R. (2005). Background and interpretation of the `Marine Trophic Index' as a
measure of biodiversity. Philosophical Transactions of the Royal Society: Biological Sciences
360: 415-423.
Pauly, D., Christensen, V., Dalsgaard, J., Froese R. and Torres, F.C. Jr. (1998). Fishing down
marine food webs. Science 279: 860-863.
PINRO (2000). Recommendations of the VIII All-Russian Conference on the Problems of the Sea
Forecasts. Murmansk, 23-25 October. (In Russian).
Savinov, V., Savinova, T. and Gabrielsen, G. (2003). Cadmium, zinc, copper, arsenic, selenium
and mercury in seabirds from the Barents Sea: Levels, inter-specific and geographical
differences. The Science of the Total Environment 306:1333-158.
Sea Around Us (2007). A Global Database on Marine Fisheries and Ecosystems. Fisheries Centre,
University British Columbia, Vancouver, Canada.
www.seaaroundus.org/lme/SummaryInfo.aspx?LME=20
Skjoldal, H.R. (1990). Management of marine living resources in a changing ocean climate, p 1-7
in: Papers Presented on the Session `Research on Natural Resources Management' of the
Conference on Sustainable Development, Science and Policy, Bergen 8-12 May 1990. Bergen
Foundation of Science Report BFS A90005. Bergen, Norway.
Terziev, F.S., ed. (1990). Hydrometeorology and Hydrochemistry of the Seas of the USSR. Volume
1. Barents Sea. Issue 1. Hydrometeorological Conditions. Leningrad, Hydrometeoizdat. (In
Russian).
UNEP (2004). Matishov, G., Golubeva, N., Titova, G., Sydnes, A., Voegele, B. and Daler, D.
Barents Sea, GIWA Regional Assessment 11.University of Kalmar, Kalmar, Sweden.
http://www.giwa.net/publications/r11.phtml
Vetrov, A.A., and Romankevich, E.A. (2004) Carbon Cycle in the Russian Arctic Seas. Springer,
Berlin etc., 331 pp.
526
36. Barents Sea LME
XIII North East Atlantic
527
XIII-37 Celtic-Biscay Shelf LME
M.C. Aquarone, S. Adams and L. Valdés
The Celtic-Biscay Shelf LME is situated in the Northeast Atlantic Ocean, and covers an
area of 756,000 km2, of which 0.98% is protected, with 0.01% of the world's sea mounts
(Sea Around Us 2007). At its southern limit the shelf is steep and narrow, but it widens
steadily along the west coast of France, merging with the broad continental shelf
surrounding Ireland and Great Britain. Three countries, Ireland, Great Britain, and France
border this LME. Spain is not part of this LME. However Spain has fishing rights in both
the French Biscay and in the Celtic Shelf (e.g. the Great Sole Bank, a major fishing
ground).The Celtic-Biscay Shelf is characterised by a strong interdependence of human
impact and biological and climate cycles (see Koutsikopoulos & Le Cann 1996). River
systems and estuaries include the Seine, Gironde (Garonne River), Bristol Channel and
Firth of Clyde. Two important book chapters pertaining to this LME are Valdés & Lavin
(2002) and Lavin et al. (2006), both on the Bay of Biscay. The OSPAR reports provide
information on the geography, hydrography and climate of Regions 3 and 4 that together
cover the Celtic-Biscay Shelf LME, (www.ospar.org). See also the ICES working group
WGRED annual report at http://www.ices.dk/iceswork/wgdetailacfm.asp?wg=WGRED
I. Productivity
The Celtic-Biscay Shelf LME is considered a Class II, moderately productive ecosystem
(150-300 gCm-2yr-1). This LME is influenced by the North Atlantic Drift in the north, and by
the Azores Current in the south. For information on circulation and currents, see
Koutsikopoulos & Le Cann (1996). The region undergoes a seasonal climatic cycle that
strongly affects the pelagic ecosystem through forcing factors: sunlight exposure, heat
input, and mechanical forcing on the surface by wind. For more information on seasonal
variability, the vertical structure of coastal and oceanic waters, river plumes, coastal
runoff and tidal fronts, see Valdes & Lavin (2002) who also describe the coastal upwelling
in the Bay of Biscay that affects mainly Iberian coast, being very weak and only
occasional along the French coast; they also describe the warm and salty Navidad
Current. Living marine resources include a wide range of organisms. The LME is a
region of transition that is rich in floral and faunal species. It is difficult to determine the
states of equilibrium of species and communities, since natural variability occurs on a
wide range of space and time scales (seasonal, inter-annual, decadal and centennial
cycles). This LME is positioned in the eastern North Atlantic, in the cyclical North Atlantic
Oscillation.
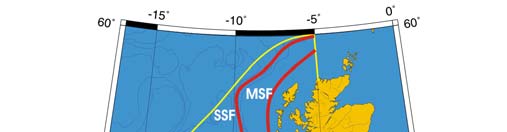
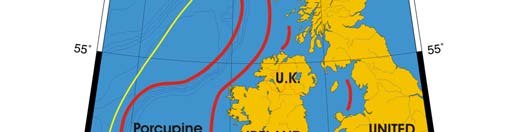
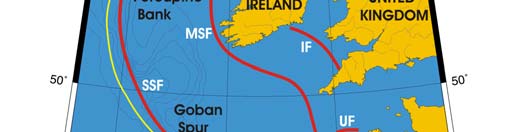
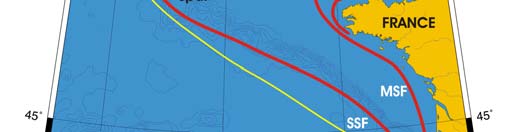
Oceanic fronts (Belkin et al. 2008): The most important front within this LME is the
Shelf-Slope Front (SSF) that extends along the shelf break/upper continental slope from
the Bay of Biscay around the British Isles up to the Faroe-Shetland Channel where it
joins the North Atlantic Current Front (Figure XIII-37.1). This front is distinct year-round
but is best defined in fall when its separation from the Mid-Shelf Front (MSF) becomes
evident. The SSF is associated with the Shelf Edge Current, believed to be continuous
all the way up to the Faroe-Shetland Channel. The SSF, however, does not appear
continuous, suggesting that the Shelf Edge Current is likely not always continuous. The
areas where the SSF is broken most often are near Goban Spur and Porcupine Bank;
these bathymetric features are clearly responsible for the front's instabilities in these
areas. The Mid-Shelf Front (MSF) is located between the SSF and the coasts of France,
United Kingdom and Ireland. Tidal mixing fronts exist off Ushant Island, south of the Irish
Sea, south of Ireland, and over the Malin Shelf.
528
37. Celtic-Biscay Shelf LME
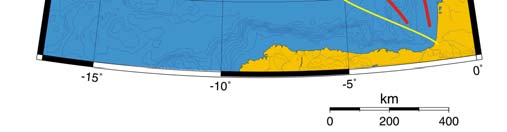
Figure XIII-37.1. Fronts of the Celtic-Biscay Shelf LME. IF, Irish Front; MSF, Mid-Shelf Front; SSF, Shelf-
Slope Front; UF, Ushant Front. Yellow line, LME boundary. After Belkin et al. (2008).
Celtic-Biscay Shelf LME SST (Belkin 2008)(Figure XIII-37.2)
Linear SST trend since 1957: 0.41°C.
Linear SST trend since 1982: 0.72°C.
The thermal history of the Celtic-Biscay Shelf included (1) abrupt cooling in 1959-1963;
(2) cold period until the all-time minimum in 1986; (3) very fast warming at a rate of 1.3°C
over 20 years, accentuated by a major warming peaked in 1989 and interrupted by a cold
spell in 1991-94.
The sequence of alternating, well-defined extremums in 1986 (cold), 1989 (warm), and
1991-94 (cold) is strongly correlated with similar events in the adjacent Iberian Coastal
LME. The latter is oceanographically connected to the Celtic-Biscay Shelf by the Iberian
Poleward Current and its extension off northern Spain dubbed "Navidad" (e.g. Garcia-
Soto et al., 2002) flowing from the Iberian LME onto the Celtic-Biscay Shelf. Given the
short distance between the two LMEs, all three events occurred nearly simultaneously in
both LMEs. The same sequence of three alternating cold-warm-cold events of 1986,
1989, and 1991-94 in the Celtic-Biscay Shelf LME can be tentatively correlated with a
similar cold-warm-cold event sequence of 1986, 1990, and 1995 in the Norwegian Sea
LME located downstream of the Celtic-Biscay Shelf and connected to the latter by the
Slope Current and North Atlantic Current. The less conspicuous minimum of 1972 on the
Celtic-Biscay Shelf was likely related to the all-time minimum of 1972 in the Iberian LME.
The previous minimum of 1963 was also simultaneous in both LMEs. The near-all-time
maximum of 1959 on the Celtic-Biscay Shelf can be tenuously linked to the all-time
maximum of 1961 in the Norwegian Sea. The above correlations suggest a dominant
XIII North East Atlantic
529
role of oceanic advection in transporting thermal signals across the Northeast Atlantic.
The ongoing warming has already significantly affected this LME. For example, in the
southern Bay of Biscay (43°47°N), cold-water species of fish and sea birds declined;
two species (puffin and killer whale) disappeared; populations of warm-water species
increased; all these changes could amount to a regime shift in this LME (Hemery et al.,
2007).
Figure XIII-37.2. Celtic-Biscay Shelf LME annual mean SST (left) and annual SST anomalies (right),
1957-2006, based on Hadley climatology. After Belkin (2008).
Celtic-Biscay Shelf LME Chlorophyll and Primary Productivity: This LME is
considered a Class II, moderately productive ecosystem (150-300 gCm-2yr-1)(Figure XIII-
37.3).
Figure XIII-37.3. Celtic-Biscay shelf LME trends in chlorophyll a (left) and primary productivity (right),
1998-2006. Values are colour coded to the right hand ordinate. Figure courtesy of J. O'Reilly and K.
Hyde. Sources discussed p. 15 this volume.
II. Fish and Fisheries
The natural environmental variability in this LME adds a high degree of uncertainty to the
management of marine resources. Cyclical oscillations, such as the North Atlantic
Oscillation, have been linked to fluctuations in the abundance of albacore and bluefin
tuna (see Ortiz de Zarate et al. 1997 and Santiago 1997). Many stocks in the LME are
intensively exploited or depleted and TAC-based regulations have been implemented for
anchovy, hake and blue whiting. ICES provides general information on fisheries and
530
37. Celtic-Biscay Shelf LME
other topics pertaining to the LME, while OSPAR reports on biodiversity and evolution of
catches of same depleted stocks, but not with an intention of doing any management..
The main marine resources exploited in the LME include molluscs, seaweed, herring,
redfish, sand eel and mackerel. The most important fish caught in its shelf waters include
various pelagic fish species, as well as cod and hake. Sardine is not as important a
resource in this LME as in the Iberian Coastal LME. For more on sardine recruitment,
see Valdés & Lavin (2002).
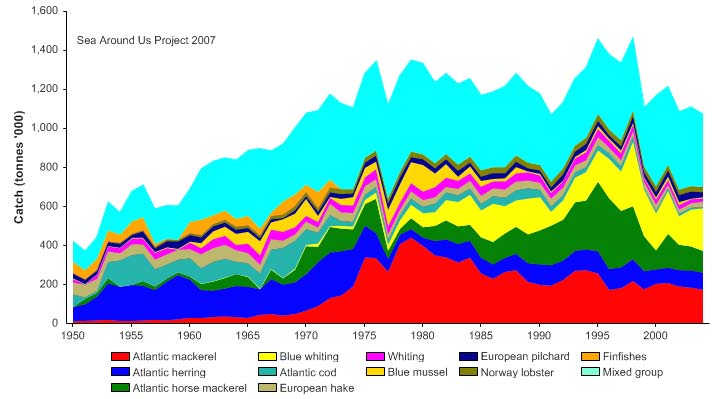
Total reported landings in this LME show changes in biomass and catch composition
(Figure XIII-37.4). The landings recorded a peak of 1.4 million tonnes in 1998, and
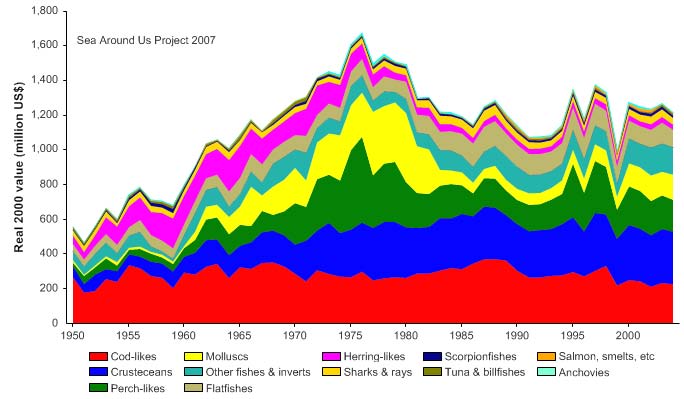
declined to 1 million tonnes in 2004. The value of the reported landings reached US$1.6
billion (in 2000 US dollars) in 1976 (Figure XIII-37.5).
Figure XIII-37.4. Total reported landings in the Celtic-Biscay Shelf LME by species (Sea Around Us
2007).
Figure XIII-37.5. Value of reported landings in the Celtic-Biscay Shelf LME by commercial groups (Sea
Around Us 2007).
XIII North East Atlantic
531
The primary production required (PPR; Pauly & Christensen 1995) to sustain the reported
landings in this LME reached 50% of the observed primary production in the mid-1990s,
but has declined to 40% in recent years (Figure XIII-37.6). France and the UK account
for the largest share of the ecological footprint in this LME.
FigureXIII-37.6. Primary production required to support reported landings (i.e., ecological footprint) as
fraction of the observed primary production in the Celtic-Biscay Shelf LME (Sea Around Us 2007). The
`Maximum fraction' denotes the mean of the 5 highest values.
The mean trophic level of fisheries catches (i.e., to the MTI; Pauly and Watson 2005)
declined over the three decades from 1950 to 1980. In the early 1980s, however, it
underwent a strong increase (Figure XIII-37.7, top) while the FiB index reached a new
plateau (Figure XIII-37.7, bottom). These trends indicate that a `fishing down' of the food
web occurred from 1950 to the 1980s (Pauly et al. 1998), after which the effect was
masked by expansion of the fisheries into new stocks (e.g., blue whiting, Figure XIII-
37.4). This also confirms the results of Pinnegar et al. (2002), who, using fine-resolution
data, concluded "there has been [in the Celtic Sea - ICES divisions VII fj] a significant
decline in the mean trophic level of survey catches from 1982 to 2000 and a decline in the
trophic level of landings from 1946 to 1998."
Figure XIII-37.7. Mean trophic level (i.e., Marine Trophic Index) (top) and Fishing-in-Balance Index
(bottom) in the Celtic-Biscay Shelf LME (Sea Around Us 2007).
532
37. Celtic-Biscay Shelf LME
The Stock-Catch Status Plots indicate that collapsed stocks make up half of all stocks
exploited in the LME (Figure XIII-37.8, top), but that fully exploited stocks contribute
almost 60% of the reported landings biomass (Figure XIII-37.8, bottom).
0%
100
10%
90
20%
)
80
(
%
s
30%
u
70
at
st
40%
y
60
b
50%
cks
50
t
o
f
s
60%
40
r
o
e
70%
mb
30
u
N
80%
20
90%
10
100%0
1950
1960
1970
1980
1990
2000
(n = 6989)
developing
fully exploited
over-exploited
collapsed
0%
100
10%
90
20%
80
)
%
30%
(
70
s
u
at
40%
60
k st
c
50%
o
50
st
y
60%
b
h
40
t
c
70%
Ca
30
80%
20
90%
10
100%0
1950
1960
1970
1980
1990
2000
(n = 6989)
developing
fully exploited
over-exploited
collapsed
Figure XIII-37.8. Stock-Catch Status Plots for the Celtic-Biscay Shelf LME, showing the proportion of
developing (green), fully exploited (yellow), overexploited (orange) and collapsed (purple) fisheries by
number of stocks (top) and by catch biomass (bottom) from 1950 to 2004. Note that (n), the number of
`stocks', i.e., individual landings time series, only include taxonomic entities at species, genus or family
level, i.e., higher and pooled groups have been excluded (see Pauly et al, this vol. for definitions).
III. Pollution and Ecosystem Health
The Celtic-Biscay Shelf LME has experienced ecological disturbances of target fish
species, with alterations in the abundance, distribution and diversity of fish and marine
mammals. Pollution and global change are impacting the coastal habitats (estuaries,
coastal lagoons, rocky cliffs, rocky shores, sandy and muddy shores). Estuaries and
coastal lagoons receive most of the impact of microbiological contamination of urban
origin. Effects of ecosystem variability and human impact on species and habitats of the
Bay of Biscay are described by Valdés & Lavin (2002). The ecosystem is affected by
alterations to the seabed, the introduction of non-indigenous species, agriculture and
sewage (Valdés & Lavin 2002). Introduced species are naturally transported by currents
or are human-induced, caused by an intensification of fisheries and by transport in ballast
water of commercial vessels. The use of DDT in agriculture has now been banned.
There is pressure on the coastal margins from urban sources and from industrial
activities, such as paper mills, petroleum refineries, iron and steel works and chemical
plants.
Industrial discharges, inorganic and organic compounds, mercury (associated with paper
mill industries), and PAHs (linked to human activities such as marine oil extraction,
industry and oil traffic), are described by Valdés & Lavin (2002). Major oil spills have
occurred in the area, listed at the EEA's website <epaedia.eea.europa.eu>, for example
Torrey Canyon off Cornwall in 1967, the Ammoco Cadiz off Brittany, France in 1978, and
the Sea Empress off Wales in 1992. In December 1999, the supertanker Erika spilled
XIII North East Atlantic
533
10,000 tonnes of oil in shallow waters off the coast of France. Due to the strong wind in
the area, the `black tide' moved to the coast of the Bay of Biscay and large expanses of
French beaches were contaminated by oil. The EEA reports that the remains of this
ecological disaster can still be seen.
OSPAR provides information on the chemical aspects of the North-East Atlantic, the
inputs of contaminants and nutrients, and their concentrations in different environments
(www.ospar.org). It identifies pollution trends, the effectiveness of measures, the major
causes of environmental degradation within the area and the managerial and scientific
actions needed to redress this. The OSPAR Integrated Report on Eutrophication (2003)
points out that in all participating countries many coastal areas, fjords and estuaries
showed increased riverine N and P inputs, and some fjords and offshore sedimentation
areas received increased transboundary nutrient inputs. Also reported were elevated
levels of winter DIN and DIP concentrations, elevated levels in winter N/P ratios, elevated
levels of chlorophyll a and elevated "nuisance bloom" or toxic assessment levels.
IV. Socioeconomic Conditions
Traditionally, the LME has been a region of intense fishing activity. Whale hunting began
along the Spanish coast in the Middle Ages. Human activities in the coastal areas also
include aquaculture and farming. Population densities at the coastal edges of the Celtic-
Biscay Shelf LME are increasing. OSPAR estimates that 47.2 million people live in the
catchment areas draining into the Bay of Biscay and Iberian coastal waters. In Brittany in
France, more than 90% of the entire population lives on the coast, according to the EEA
SOE report 2005 Part A, Ireland (together with the Mediterranean coast of Spain) has
one of the two fastest growing coastal area populations in Europe, with increases of up to
50% in the past decade (http://epaedia.eea.europa.eu). Rapid population growth and
socioeconomic development have resulted in environmental imbalances. EEA cites as
principal threats to the Celtic Sea, Bay of Biscay and Iberian coast, eutrophication from
sewage, agriculture, and fish farming; threats to fishing from overfishing, bottom trawling,
discards and catch of non-targeted species; threats from industry in the form of
chemicals and radionuclides; and threats from shipping accidents, pollution and oil spills.
Additional pressure comes from tourism, urbanisation of coastal areas, transportation and
recreational uses of beaches and shores.
V. Governance
A new Marine Strategy Framework Directive was recently enacted which promotes and
integrates environmental considerations into all relevant policies areas and which forms
the basis for a future Maritime Policy for the EU. The countries bordering this LME are all
members of the European Union. The use of natural marine resources is governed by a
number of conventions, declarations and regulations, including the European
Commission directives and regulations within the Common Fisheries Policies. A large
number of instruments from international bodies, such as the UN, the International
Maritime Organisation and the European Union, exist to conserve natural resources,
protect the environment and ensure health and safety standards. The European
Community laws protect the environment in terms of air and noise, chemicals and
industrial risks, nature conservation, waste and water. The EEA online summary for the
Northeast Atlantic Ocean, lists the major political instruments as OSPAR, ICES, EU Birds
and Habitats Directives, North Atlantic Marine Mammal Commission (NAMMCO), the
Bern convention and other conventions covering part of the area including Ramsar for
wetland protection, the Bonn convention for migratory species, MARPOL73/78IMO
convention of marine pollution from ships in additional to national laws, and NGO
organisations such as WWF are working to accelerate the establishment of no-fishing
zones and offshore marine protected areas (www.eea.org).
534
37. Celtic-Biscay Shelf LME
References
Atlas of the living resources of the sea (1972). Department of Fisheries, Food and Agriculture
Organisation of the United Nations, Rome, Italy.
Belkin, I.M. (2008) Rapid warming of Large Marine Ecosystems, Progress in Oceanography, in
press.
Belkin, I.M., Cornillon, P.C., and Sherman, K. (2008). Fronts in Large Marine Ecosystems of the
world's oceans: An atlas. Progress in Oceanography, in press.
European Environment Agency.(EEA) (2002). The North-east Atlantic Ocean. Accessed May 2007
at www.eea.org.reports.eea.europa.eu/report_2002 _0524_154909/en/nea_ocean.pdf
http://epaedia.eea.europa.eu/page.php?pid=504.
Garcia-Soto, C., Pingree, R.D. and Valdés, L. (2002) Navidad development in the southern Bay of
Biscay: Climate change and swoddy structure from remote sensing and in situ measurements,
J. Geophys. Res., 107(C8), 3118, doi:10.1029/2001JC001012.
Hemery G., D'Amico, F. Castege, I., Dupont, B. d'Elbee, J. Lalanne, Y. and Mouches, C. (2007)
Detecting the impact of oceano-climatic changes on marine ecosystems using a multivariate
index: The case of the Bay of Biscay (North Atlantic-European Ocean), Global Change Biology
(OnlineAccepted Articles), doi:10.1111/j.1365-2486.2007.01471.x.
Koutsikopoulos, C. and Le Cann, B. (1996). Physical processes and hydrological structures related
to the Bay of Biscay anchovy. Scientia Marina 60(2):9-19.
Lavín, A., L. Valdés, F. Sánchez, P. Abaunza, A. Forest, J. Boucher, P. Lazure and A.M. Jegou.
2006. The Bay of Biscay: The encountering of the ocean and the shelf. The Sea, Vol 14,
chapter 24: 935-1002
NOAA (1991). Report of the ad hoc Committee on Large Marine Ecosystems. NOAA Technical
Memorandum NMFS-F/NEC-92.
Ortiz de Zarate, V., Lavin, A. and Moreno-Ventas, X. (1997). Is there a relationship between
environmental variables and the surface catch of albacore Thunnus alalunga (Bonnaterre,
1788) in the North Atlantic? Collective Volume of Scientific Papers, International Commission
for the Conservation of the Atlantic Tunas 48(3):250-252.
OSPAR at www.ospar.org/eng /html/qsr2000/QSR2000welcome3.htm
Pauly, D. and Christensen, V. (1995). Primary production required to sustain global fisheries.
Nature 374: 255-257.
Pauly, D. and Watson, R. (2005). Background and interpretation of the `Marine Trophic Index' as a
measure of biodiversity. Philosophical Transactions of the Royal Society: Biological Sciences
360: 415-423.
Pauly, D., Christensen, V., Dalsgaard, J., Froese R. and Torres, F.C. Jr. (1998). Fishing down
marine food webs. Science 279: 860-863.
Pinnegar, J.K , Jennings, S., O'Brien, C.M. and Polunin, N.V.C. (2002). Long-term changes in the
trophic level of the Celtic Sea fish community and fish market price distribution Journal of
Applied Ecology 39 (3): 377390.
Prescott, J.R.V. (1989). The political division of Large Marine Ecosystems in the Atlantic Ocean
and some associated seas, p 395-442 in: Sherman, K. and Alexander, L.M. (eds), Biomass
Yields and Geography of Large Marine Ecosystems. AAAS Selected Symposium 111.
Westview Press, Boulder, U.S.
Report of the Advisory Committee for Fisheries Management (1993). In: ICES Annual Report, 81st
Statutory Meeting. International Council for the Exploration of the Sea, Dublin, Ireland.
Santiago, J. (1997). The North Atlantic Oscillation and recruitment of temperate tunas.
SCRS/97/40.
Sea Around Us (2007). A Global Database on Marine Fisheries and Ecosystems. Fisheries Centre,
University British Columbia, Vancouver, Canada.
http://www.seaaroundus.org/lme/SummaryInfo.aspx?LME=24
Valdés, L. and Lavin, A. (2002). Dynamics and human impact in the Bay of Biscay: An ecological
perspective p 293-320 in: Sherman, K. and Skjoldal, H.R. (eds), Large Marine Ecosystems of
the North Atlantic Changing States and Sustainability. Elsevier Science, Amsterdam, The
Netherlands.
XIII North East Atlantic
535
XIII-38 Faroe Plateau LME
M.C. Aquarone, S. Adams and E. Gaard
The Faroe Plateau LME surrounds the Faroe Islands in the northeast Atlantic Ocean. It
is a high latitude environment characterised by a sub-arctic climate that affects
productivity through changes in temperature, currents, tides and seasonal oscillations.
The Faroe Plateau is a well-defined and geographically uniform LME, with a surface area
of 150,000 km2 (Sea Around Us 2007). The islands have a relatively broad shelf and are
surrounded by a persistent tidal front that separates shelf waters from the open ocean.
The circulation of water masses is anticyclonic, with a branch of the North Atlantic Drift
current flowing north. Gaard et al. (2002) and UNEP (2004) have described this LME.
I. Productivity
For a map of the Faroe Islands and surrounding LME, with a typical position of the tidal
front that separates the shelf water from the ocean water, see Gaard et al. (2002, p. 246).
Climate (e.g., temperature) is the primary force driving the LME, with intensive fishing the
secondary driving force. The dynamic system of ocean currents in the area, in particular
the inflow of warm Atlantic waters to the Nordic seas, is an important feature. Currents,
tides and seasonal oscillations affect productivity. The shallow parts of the shelf are well
mixed by extreme tidal currents, with no stratification occurring during the summer. For a
map of salinity at 50 m depth, see Gaard et al. (2002, p. 248).
The Faroe Plateau LME is considered a Class II, moderately productive ecosystem (150-
300 gCm-2yr-1). Primary productivity and phytoplankton biomass are very low during
winter, but increase during spring and summer. Neritic phytoplankton and zooplankton
communities are found on the shelf, and are somewhat separated from the offshore
areas while receiving variable influence from the offshore environment. The shelf
production of plankton is the basis for production in the higher trophic levels. The LME
also serves as an important feeding ground for pilot whales and other marine mammals.
Monitoring data show simultaneous fluctuations in several trophic levels in the
ecosystem. Plankton production, fish recruitment, seabird recruitment and growth, and
ultimately fish landings, vary inter-annually. For more information on trophic interactions,
and on the large numbers of seabirds, see Gaard et al. (2002).
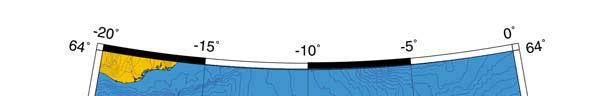
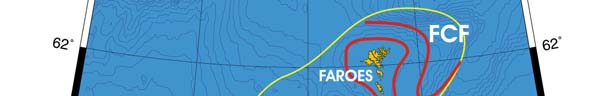
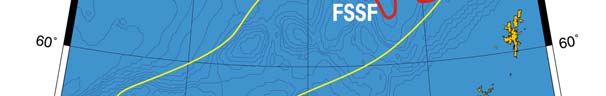
Oceanic Fronts: The Faroe Plateau LME is surrounded by tidal mixing fronts (Belkin et
al. 2008). These fronts (Figure XIII-38.1) define the ecosystem and its important fishery
grounds, especially of herring and cod (Hamilton et al. 2004). Unlike their counterparts
around the British Isles, the Faroese tidal mixing fronts have not been studied in detail. A
large-scale water mass front between the Plateau waters and the North Atlantic waters
exists at the boundary of this LME, running along the Faroe-Shetland Channel (Sherwin
et al. 2001).
Faroe Plateau LME SST (after Belkin (2008)
Linear SST trend since 1957: -0.14°C.
Linear SST trend since 1982: 0.75°C.
Like the Iceland Sea, the Faroe Plateau experienced long-term cooling of 1.2°C from
1960 through 1993, followed by rapid warming (1.3°C in 10 years) by 2003. All major
extremums maxima of 1960 and 2003, and minimum of 1993-1995 were also
observed in the Iceland Shelf LME.
536
38. Faroe Plateau LME
Figure XIII-38.1. Fronts of the Faroe Plateau LME. FCF, Faroe Channel Front; FSSF, Faroes Shelf-Slope
Front. Yellow line, LME boundary. After Belkin et al. (2008).
The observed synchronism between Iceland Shelf and Faroe Plateau can be explained
by the prevalence of northward transport, of various branches of the NAC. Therefore any
SST anomaly transported by them would reach both LMEs at approximately the same
time. Ocean circulation around the Faroes also effectively protects the islands from
being directly affected by cold waters from the Nordic Seas. Subarctic cold waters could
only reach the Faroes with easternmost branches of the North Atlantic Current,
particularly the Irminger Current and Rockall Trough branch, after completing a rather
circuitous journey around the Subarctic Gyre (Orvik and Niiler, 2002; Arhan, M. 1990.).
Figure XIII-38.2. Faroe Plateau LME Annual Mean SST and annual SST anomalies, 1957-2006, after
Belkin (2008).
XIII North East Atlantic
537
Faroe Plateau LME Chlorophyll and Primary Productivity: The Faroe Plateau LME is
considered a Class II, moderately productive ecosystem (150-300 gCm-2yr-1).
Figure XIII-38.3. Faroe Plateau LME trends in chlorophyll a (left) and primary productivity (right), 1998-
2006. Values are colour coded to the right hand ordinate. Figure courtesy of J. O'Reilly and K. Hyde.
Sources discussed p. 15 this volume.
II. Fish and Fisheries
Climatic variability has a major impact on fish landings in the LME. The most important
species group is pelagic fish, representing on average 52% of the total catch, and cod,
saithe and haddock, representing more than 30% of the catch. For landings of cod and
haddock between 1903 and 1998, see Gaard et al. (2002, p. 247). The long-term
average of annual landings of cod fluctuates between 20,000 and 40,000 tonnes.
Landings of haddock fluctuate between 15,000 and 25,000 tonnes per year. In the early
1990s, cod and haddock annual landings reached the lowest values recorded. Cod and
haddock do not always fluctuate simultaneously due to their different reproductive
strategies. Other important species are saithe, halibut and the Norway pout. The latter is
not caught commercially but serves as a food supply for fish (mainly cod and haddock),
seabirds and grey seals. A marked increase in fishing effort has not resulted in an
increase in fish landings.
Total reported landings have been on a rise, recording about 450,000 tonnes in recent
years (Figure XIII-38.4). Blue whiting account for the largest share of the landings since
the late 1970s, with 75% of the total landings in 2004. From 1986 to 1994, landings of
Norway pout were also significant, averaging between 14,000 and 27,000 tonnes per
year. The value of the reported landings recorded 355 million US$ (in 2000 real US$) in
2003 (Figure XII-38.5).
538
38. Faroe Plateau LME
Figure XIII-38.4. Total reported landings in the Faroe Plateau LME by species (Sea Around Us 2007).
Figure XIII-38.5. Value of reported landings in the Faroe Plateau LME by commercial groups (Sea
Around Us 2007).
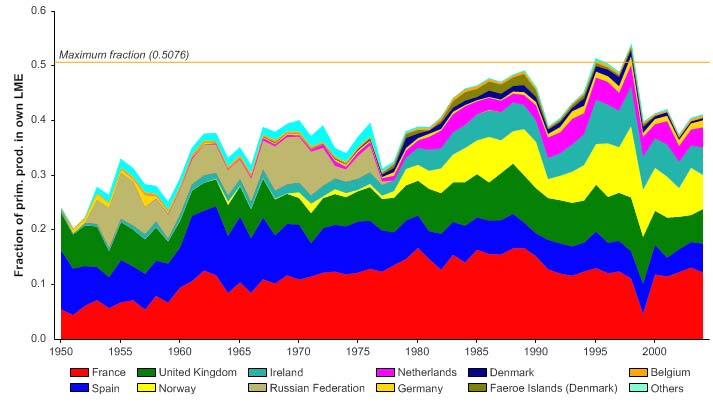
The primary production required (PPR; Pauly & Christensen 1995) to sustain the reported
landings in this LME has reached a level that far exceeds the observed primary
production of the region (Figure XIII-38.6). While there might be other causes (e.g.,
problems with the landings statistics, and/or with the primary production estimate used
here), it is probably due to fish being caught in the LME recruiting from and/or feeding
outside the LME, which thus subsidize the productivity of the Faroe Plateau LME. Faroe
Islands, Russia and Norway account for the largest share of the ecological footprint in
this LME.

XIII North East Atlantic
539
Figure XIII-38.6. Primary production required to support reported landings (i.e., ecological footprint) as
fraction of the observed primary production in the Faroe Plateau LME (Sea Around Us 2007). The
`Maximum fraction' denotes the mean of the 5 highest values.
No clear trend can be observed in the mean trophic level of fisheries landings (i.e., the
MTI; Pauly & Watson 2005) until mid-1990 (Figure XIII-38.7 top). Since then, however,
the level appears to increase, presumably due to the almost exclusive, and increasing
landings of blue whiting (Figure XIII-38.4), which could be masking any possible `fishing
down' effect in the LME (Pauly et al. 1998). The expansion of the blue whiting fisheries is
also evident in the FiB index (Figure XIII-38.7 bottom).
Figure XIII-38.7. Mean trophic level (i.e., Marine Trophic Index) (top) and Fishing-in-Balance Index
(bottom) in the Faroe Plateau LME (Sea Around Us 2007).
540
38. Faroe Plateau LME
The Stock-Catch Status Plots indicate the high proportion of stocks defined as `collapsed'
in the LME (Figure XIII-38.8, top). However, fully exploited stocks contribute almost 90%
of the reported landings biomass (Figure XIII-38.8, bottom), a result of the increase in the
blue whiting landings.
1950
1960
1970
1980
1990
2000
0%
100
10%
90
20%
)
80
%
(
s
30%
t
u
70
t
a
s
40%
y
60
ks b
50%
c
o
50
f
st
60%
40
er o
b
70%
m
30
Nu
80%
20
90%
10
100%0
1950
1960
1970
1980
1990
2000
(n = 1799)
developing
fully exploited
over-exploited
collapsed
1950
1960
1970
1980
1990
2000
0%
100
10%
90
20%
80
)
%
30%
(
70
s
u
at
40%
60
st
k
c
50%
o
50
st
y
60%
b
h
40
c
70%
Cat
30
80%
20
90%
10
100%0
1950
1960
1970
1980
1990
2000
(n = 1799)
developing
fully exploited
over-exploited
collapsed
Figure XIII-38.8. Stock-Catch Status Plots for the Faroe Plateau LME, showing the proportion of
developing (green), fully exploited (yellow), overexploited (orange) and collapsed (purple) fisheries by
number of stocks (top) and by catch biomass (bottom) from 1950 to 2004. Note that (n), the number of
`stocks', i.e., individual landings time series, only include taxonomic entities at species, genus or family
level, i.e., higher and pooled groups have been excluded (see Pauly et al, this vol. for definitions).
The commercial fishing fleet of the Faroe Plateau is comprised mainly of coastal vessels,
long-liners and ocean trawlers. The Faroese fisheries management system with
restrictions on fishing-days was adopted in 1996. The fishing-day system manages
fishing capacity and effort rather than allocating specific quotas for species and stocks
and was put in place for the management of demersal fisheries in the 200-mile fisheries
zone around the Faroe. Vessels are grouped according to size and gear type, and each
group is allocated a set number of fishing days per year, which are allocated among the
vessels. This scheme is combined with gear restrictions designed to protect juvenile fish,
as well as closures of extensive areas to active gear such as trawls in order to protect
nursery and spawning stocks (Zeller & Reinert 2004).
III. Pollution and Ecosystem Health
Fisheries are totally dependent on a sound and healthy marine ecosystem. Safeguarding
the marine environment and ensuring the sustainable use of its valuable resources is a
XIII North East Atlantic
541
necessity, in view of the dependence of the population on these resources. Monitoring of
environmental parameters of the Faroe Shelf LME was initiated in the mid 1990s.
International conventions are the basis for Faroese national legislation to protect the
marine environment, mainly the MARPOL convention for the Prevention of Pollution from
Ships and the OSPAR Convention for the Protection of the Marine Environment in the
North-East Atlantic, which, amongst others, lays down rules for the discharge from
offshore installations. The 2004 GIWA assessment of the marine waters around the
Faroes reports that toxic contamination of the tissue of marine mammals is causing
human health problems and may also affect the economically important fisheries sector
(www.giwa.net/publications/r13.phtml). The report cites long distance transport of
pollutants by ocean currents and air from industrial areas in Europe, North America and
Asia among the sources of the contamination. The traditional consumption of whale
meat has occasioned concern that elevated levels of mercury might be found among
pregnant women (Booth & Zeller 2005).
IV. Socioeconomic Conditions
In 1998, the Faroe Islands had an estimated population of 44,000 persons who are
almost totally dependent on fisheries and on fish farming, which began in the 1980s.
Fishery is the main industry: fishery products, including farmed salmon, represent more
than 95% of total Faroese exports and nearly half of the GDP. Bioaccumulation of
mercury in whales, pelagic fish, and seabirds has already warranted warnings regarding
human consumption of them (online at www.giwa.net/publications/r13.phtml, causal chain
analysis chapter; Booth & Zeller (2005). The phasing out of government subsidies to the
fisheries sector has been a major factor in reducing over-capacity and stimulating more
effective, market-driven approaches to fisheries.
The challenge for the future is to ensure that fisheries management can continue to be
flexible and adaptive to changes in the resource base and the industry, in order to ensure
both biological and economic sustainability. As pollution in the Faroe Islands is largely
caused by long-distance transport of the pollutants by ocean and atmospheric currents
from the highly industrialized countries, solutions will be international in scope.
Petroleum production is being explored in areas close to the Faroe Islands, and between
the Faroe and Shetland Islands.
V. Governance
The Faroe Islands are a self-governing overseas administrative division of Denmark, a
major fishing nation that is attempting to integrate fisheries and environmental policies.
An ecosystem approach was used officially for the first time in 1995 at the international
level with the Convention on Biological Diversity. Denmark participates in ICES. The
Faroe Islands participate in the NEAFC (Northeast Atlantic Fisheries Commission, see
http://www.neafc.org); NAFO (North-west Atlantic Fisheries Organisation, see
http://www.nafo.ca); NASCO (North Atlantic Salmon Conservation Organisation, see
http://www.nasco.org.uk); and NAMMCO (the North Atlantic Marine Mammal
Commission, see http://www.nammco.no). Greenland participates in the Arctic Council as
part of Denmark and the Faroe Islands (see the Barents Sea LME).
The Faroese Parliament adopted UNCLOS in 2003 and the UN Agreement for the
Implementation of the Provisions of the Convention relating to the Conservation and
Management of Straddling Fish Stocks and Highly Migratory Fish Stocks in 1995.
Information on the Faroe Islands is available at: www.faroeislands.org.uk.
542
38. Faroe Plateau LME
References
Arhan, M. (1990). The North-Atlantic Current and Sub-Arctic Intermediate Water. Journal of Marine
Research 48: 109-144.
Belkin, I.M. (2008). Rapid warming of Large Marine Ecosystems. Progress in Oceanography, in
press.
Belkin, I.M., Cornillon, P.C., and Sherman, K. (2008). Fronts in Large Marine Ecosystems of the
world's oceans. Progress in Oceanography, in press.
Booth, S. and Zeller, D. (2005). Mercury, food webs and marine mammals: implications of diet and
climate change on human health. Environmental Health Perspectives 113: 521-526.
Faroe Islands .org. UK at www.faroeislands.org.uk /Default.asp?d=8D6305E5-11A4-4D39-8262-
8A7B41E1F330.
Gaard, E. (2000). Seasonal abundance and development of Calanus finmarchicus in relation to
phytoplankton and hydrography on the Faroe shelf. ICES Journal of Marine Science 57:1605-
1618.
Gaard, E., Hansen, B., Olsen, B. and Reinert, J. (2002). Ecological features and recent trends in
the physical environment, plankton, fish stocks, and seabirds in the Faroe Shelf ecosystem, p
245-265 in: Sherman, K. and Skjoldal, H.R. (eds), Large Marine Ecosystems of the North
Atlantic Changing States and Sustainability. Elsevier Science, Amsterdam, The Netherlands.
GIWA (2004). Regional Assessment 13, at www.giwa.net/publications/r13.phtml
Hamilton, L.C., S. Jónsson, H. Ögmundardóttir and I.M. Belkin. (2004) Sea changes ashore: The
ocean and Iceland's herring capital. Arctic 57 (4): 325-335.
Hansen, B. (1992). Residual and tidal currents on the Faroe Plateau. ICES CM 1992/C:12.
Hansen, B., Kristiansen, A. and Reinert, J. (1990). Cod and haddock in Faroese waters and
possible climate influences on them. ICES CM 1990/G:33.
ICES (1999). Report of the North-western Working Group. ICES CM 1999/ACFM:17.
Jakupsstovu, S.H. and Reinert, J. (1994). Fluctuations in the Faroe Plateau stock, p 194-211 in:
Jakobsson, J. Astthorsson, O.S., Beverton, R.J.H., Bjoernsson, B., Daan, N., Frank, K.T.,
Meincke, J., Rothschild, B., Sundby, S. and Tilseth, S. (eds), Cod and Climate Change.
Proceedings of a symposium held in Reykjavik, 23-27 August, 1993. ICES Marine Science
Symposia 198:194-211.
NOAA (1991). Report of the ad hoc Committee on Large Marine Ecosystems. NOAA Technical
Memorandum NMFS-F/NEC-92.
Orvik, K.A., and P. Niiler (2002). Major pathways of Atlantic water in the northern North Atlantic and
Nordic Seas toward Arctic, Geophysical Research Letters, 29(19), 1896, doi:10.1029/
2002GL015002.
Olsen, B. (1994). Faroe Islands, in: Hunt, G.L. (ed), Report of the Study on Seabird/Fish
Interactions. ICES CM 1994/L:3:1-119.
Pauly, D. and Christensen, V. (1995). Primary production required to sustain global fisheries.
Nature 374: 255-257.
Pauly, D. and Watson, R. (2005). Background and interpretation of the `Marine Trophic Index' as a
measure of biodiversity. Philosophical Transactions of the Royal Society: Biological Sciences
360: 415-423.
Pauly, D., Christensen, V., Dalsgaard, J., Froese R. and Torres, F.C. Jr. (1998). Fishing down
marine food webs. Science 279: 860-863.
Report of the Advisory Committee for Fisheries Management. In ICES Annual Report, 81st
Statutory Meeting. 1993. International Council for the Exploration of the Sea. Dublin, Ireland.
Sea Around Us (2007). A Global Database on Marine Fisheries and Ecosystems. Fisheries Centre,
University British Columbia, Vancouver, Canada.
Sea Around Us (2007). A Global Database on Marine Fisheries and Ecosystems. Fisheries Centre,
University British Columbia, Vancouver, Canada.
www.seaaroundus.org/lme/SummaryInfo.aspx?LME=60
Sherwin, T. J., V. I. Vlasenko, N. Stashchuk, D. R. G. Jeans, and B. Jones (2002), Along-slope
generation as an explanation for some unusually large internal tides, Deep Sea Res. I,
49:1787 1799.
XIII North East Atlantic
543
UNEP (2004). Pedersen, S.A., Madsen, J. and Dyhr-Nielsen, M. Faroe Plateau, GIWA Regional
Assessment 13. University of Kalmar, Kalmar, Sweden. www.giwa net/ publications/r13.phtml
Zeller, D. and Reinert, J. (2004). Modelling spatial closures and fishing effort restrictions in the
Faroe Islands marine ecosystem. Ecological Modeling 172: 403-420.
544
38. Faroe Plateau LME
XIII North East Atlantic
545
XIII-39 East Greenland Shelf LME
M.C. Aquarone and S. Adams, D. Mikkelsen and T.J. Pedersen
The East Greenland Shelf LME extends along Greenland's east coast to the Eirik Ridge,
covering an area of about 319,000 km2, of which 13.34% is protected (Sea Around Us
2007). It is influenced by the cold East Greenland Current, which flows south along the
coast from the polar area. A sub-arctic climate, seasonal ice cover and marked
fluctuations in salinity, temperature and phytoplankton characterise this LME. The
continental shelf varies in width, from 750 km in the north to 75 km in the south, and a
large number of fiords are found. LME book chapters, articles and reports pertaining to
this LME include Prescott (1989), Skjoldal et al. (1993) and UNEP (2004).
I. Productivity
Changes in sea and air temperature are the principal physical driving forces of this LME.
Climatic variability causes large inter-annual variability in ice and hydrographic
conditions. This, in turn, affects plankton production and fish recruitment, and can
contribute to variations in annual catches of cod and small pelagics. Due to the cover of
ice for most of the year, which inhibits the penetration of light, the East Greenland Shelf
is considered a Class III, low productivity ecosystem (<150 gCm-2yr-1). The melting of
sea ice in the summer has significant effects on ecological conditions, causing large
amounts of nutrient salts to be transported into the waters around East Greenland.
Owing to these climatic factors and to the high latitude of the region, the seasonal
phytoplankton production is of short duration and of limited extent. Primary production is
conveyed efficiently to higher trophic levels and supports large populations of fish, marine
mammals and seabirds.
Oceanic fronts (Belkin et al. 2008): The East Greenland Polar Front (EGPF) (Figure
XIII-39.1) hugs the shelf break and the Greenland continental slope, and serves as the
offshore boundary of this LME. The EGPF waters originate in the Arctic Ocean, which
explains their extremely low temperature and salinity. A complicated pattern is formed by
the EGPF over the broad Ammassalik Shelf between 63° N and 65° N, where three
separate branches of the EGPF are observed. This shelf is known as a major spawning
area of cod. Therefore the multiple frontal structure discovered from satellite data is
important to the local cod fishery. South of the Denmark Strait, the EGPF is joined by the
Irminger Current Front that carries warm and salty waters originated in the North Atlantic
Current.
East Greenland Shelf LME SST (Belkin 2008)(Figure XIII-39.2):
Linear SST trend since 1957: 0.51°C.
Linear SST trend since 1982: 0.73°C.
Like many other boreal LMEs, the East Greenland Shelf cooled down in the 1950s-1960s
until it reached the all-time minimum of just 0.5°C in 1971 during the passage of the
Great Salinity Anomaly (GSA) of the 1970s (Dickson et al. 1988; Belkin et al. 1998). The
passage of the GSA'70s is believed to have contributed to the collapse of cod fisheries
downstream, off West Greenland and Newfoundland, in the 1980s (Hamilton et al. 2003).
Later on, the GSAs of the 1980s and of the 1990s were absent over the East Greenland
Shelf, consistent with their local formation in the Labrador Sea (Belkin et al., 1998; Belkin,
2004).


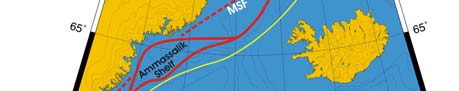
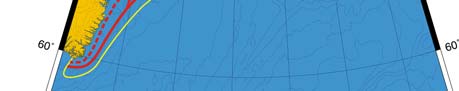
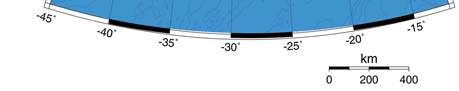
546
39. East Greenland Shelf LME
After a quick recovery in 1972, SST rose steadily until present. The all-time maximum
SST in 2003 exceeded 2.6°C. The record-breaking SST is consistent with the all-time
maximum near-surface air temperature of 1.5°C recorded in Ammassalik on the east
coast of Greenland in 2003. The SST maximum of 2003 correlates with the all-time SST
maximum of 2004-2005 in the downstream-located West Greenland Shelf LME. In the
two nearby LMEs, Iceland Shelf and Faroe Plateau, SST also reached all-time maxima
in 2003. Perhaps, it is not accidental that all these anomalies peaked right after El Nińo
2002-2003.
Figure XIII-39.1. Fronts of the East Greenland Shelf LME. EGPF, East Greenland Polar Front; MSF, Mid-
Shelf Front (most probable location). Yellow line, LME boundary. After Belkin et al. (2008).
Figure XIII-39.2 East Greenland Shelf annual mean SST (left) and SST anomalies (right), 1957-2006,
based on Hadley climatology. After Belkin (2008).
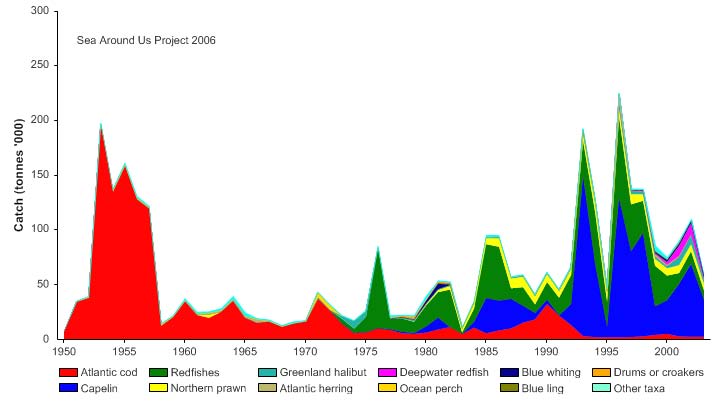
XIII North East Atlantic
547
East Greenland Shelf LME Chlorophyll and Primary Productivity
The East Greenland Shelf LME is a Class III, low productivity ecosystem (<150 gCm-2yr-
1)(Figure XIII-39.3).
Figure XIII-39.3. East Greenland Shelf trends in chlorophyll a (left) and primary productivity (right),
1998-2006, from satellite ocean colour imagery. Values are colour coded to the right hand ordinate.
Figure courtesy of J. O'Reilly and K. Hyde. Sources discussed p. 15 this volume.
II. Fish and Fisheries
Total reported landings1 from 1950 to 2003 show a series of peaks and troughs (Figure
XIII-39.4). Reported landings have fluctuated from a low of 11,000 tonnes in 1983 to a
high of 225,000 tonnes in 1996. While historically cod dominated reported landings, in
more recent years pelagic fish, notably capelin dominate (Figure XIII-39.4)2
Figure XIII-39.4. Total reported landings in the East Greenland Shelf LME by species (Sea Around Us
2007).
1 Due to a recent adjustment to the boundaries of the East Greenland Shelf LME, the landings data presented
here are based on the 1950-2003 data, computed using the boundaries defined in Figure XIII-39.1. Data for
1950-2004, based on the new LME boundaries, will be available online at www.seaaroundus.org.
2 Information on the value of reported landings cannot be provided at this stage, due to the recent adjustments
in LME boundaries (see note 1 above). Data for values using the newly adjusted boundaries will be available at
www.seaaroundus.org.
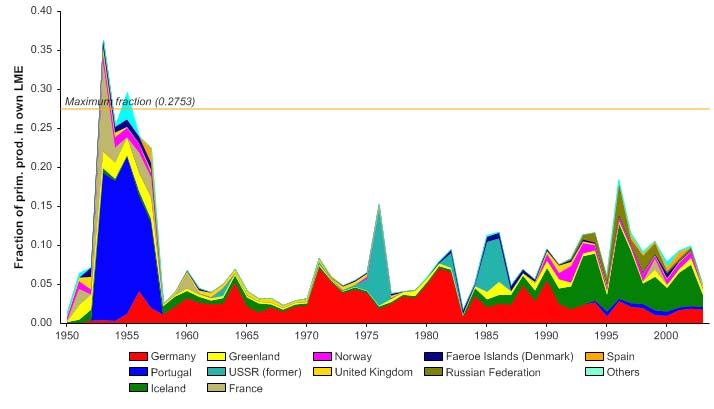
548
39. East Greenland Shelf LME
The primary production required (PPR; Pauly & Christensen 1995) to sustain the reported
landings in this LME reached to 35% of the observed primary production in the mid
1950s, but this relatively high value has not been achieved in recent years, and has
remained mostly under 10% (Figure XIII-39.5). The countries with the largest share of
the ecological footprint in this LME have changed frequently over the years, with Iceland
accounting for the largest footprint in recent years.
Figure XIII-39.5. Primary production required to support reported landings (i.e., ecological footprint) as
fraction of the observed primary production in the East Greenland Shelf LME (Sea Around Us 2007). The
`Maximum fraction' denotes the mean of the 5 highest values.
Until the early 1970s, the reported landings from this LME and the mean trophic level of
the entire fisheries in the region were dominated by cod (i.e., the MTI; Pauly & Watson
2005). With new species coming under exploitation, and the gradual decline of cod
landings, a classical `fishing down' scenario ensued (Pauly et al. 1998), with trophic
levels declining (Figure XIII-39.6, top), and some compensation through higher landings
of species from lower trophic levels (e.g. capelin), the reason for the stability in the FiB
index (Figure XIII-35.6, bottom).
Figure XIII-39.6. Mean trophic level (i.e., Marine Trophic Index) (top) and Fishing-in-Balance Index
(bottom) in the East Greenland Shelf LME (Sea Around Us 2007).
XIII North East Atlantic
549
The Stock-Catch Status Plots indicate a high proportion of collapsed stocks in this LME
(Figure XIII-39.7, top), and a high contribution of these stocks to the reported landings
biomass (Figure XIII-39.8, bottom). The jagged appearance of the latter plot reflects
fluctuations in the reported landings (Figure XIII-39.4).
1950
1960
1970
1980
1990
2000
0%
100
10%
90
20%
)
80
%
(
s
30%
t
u
70
t
a
s
40%
y
60
b
ks
50%
c
o
50
f
st
60%
o
40
er
b
70%
m
30
u
N
80%
20
90%
10
100%0
1950
1960
1970
1980
1990
2000
(n = 831)
developing
fully exploited
over-exploited
collapsed
1950
1960
1970
1980
1990
2000
0%
100
10%
90
20%
80
)
30%
(
%
70
s
u
at
40%
60
st
ck
50%
o
50
st
y
60%
b
h
40
c
70%
Cat
30
80%
20
90%
10
100%0
1950
1960
1970
1980
1990
2000
(n = 831)
developing
fully exploited
over-exploited
collapsed
Figure XII-39.7. Stock-Catch Status Plot for the East Greenland Shelf LME, showing the proportion of
developing (green), fully exploited (yellow), overexploited (orange) and collapsed (purple) fisheries by
number of stocks (top) and by catch biomass (bottom) from 1950 to 2004. Note that (n), the number of
`stocks', i.e., individual landings time series, only include taxonomic entities at species, genus or family
level, i.e., higher and pooled groups have been excluded (see Pauly et al, this vol. for definitions).
A stock of some commercial significance was cod, once central to Greenland's economy.
This stock collapsed in the early 1990s, with landings falling from about 13,000 tonnes in
1992 to below 4,000 tonnes in the following years. The fluctuations of cod stocks have
been linked to changes in sea temperature (see Buch et al.1994). Overfishing and its
effects on stock size and stock interactions appear to coincide with climatically-driven
variability. Atlantic herring was a major species fished in the 1950s and 1960s but it has
also almost entirely disappeared in the catch statistics. Today, species landed are mostly
capelin, shrimp and redfish. Shrimp (Pandalus borealis) is exported. Greenland halibut,
Norway haddock, catfish, Atlantic halibut, salmon and char are important to the local
economy. Greenland's fishing industry tries to balance the possibilities offered by
modern fishing technology with the need to sustain this LME's natural resources. The
near-shore quota system differs from the off-shore system for shrimp, cod and Greenland
halibut. Marine mammals (five species of seal, walruses and whales) are essential for
the survival of the traditional hunting communities, and the meat is traded locally. The
whaling industry led to the decimation of several whale species in the region. While the
recovery of the overexploited right whale has been very slow, the fin and minke whales
have recovered well. Legal measures protect a number of marine species.
550
39. East Greenland Shelf LME
III. Pollution and Ecosystem Health
The International Cod and Climate Change Programme studies the response of different
cod populations to climate change in various regions of the cod's North Atlantic range. A
report by the OSPAR Commission describes the main human pressures in a region of the
Arctic Ocean that includes the east coast of Greenland. Owing to this LME's remoteness
and low population density, environmental conditions within it are generally good.
However, certain activities such as fisheries give cause for concern. In terms of oil
pollution, the difficulties associated with taking remedial actions in a cold environment
such as this are also of concern. Levels of PCB and DDT are quite high in both biotic and
abiotic media around eastern Greenland. For more information about pollutants in the
Arctic region including Greenland, the AMAP website (www.amap.no) makes recent
reports available. The measurement of `new' chemicals, in particular brominated and
fluorinated compounds in the Arctic environment and evidence of the biological effects of
OCs (Organochlorines) in polar bears, glaucous gulls, and northern fur seals are
highlights of recent research carried out on POPs in the Arctic (AMAP 2002 Report on
POPs). These compounds can adversely affect immune, endocrine and reproductive
systems.
The PAME Working Group is involved in assessing changing states of Arctic
environments (see also the Governance module). The PAME work plan (2004-2006) will
identify indicators of ecosystem health and ecosystem objectives for the Arctic LMEs. In
the Arctic, the average extent of sea-ice cover in the summer has declined by 15-20%
over the past 30 years. This decline is expected to accelerate, with the near total loss of
sea ice in the summer projected for late this century (ACIA 2004). The OSPAR website
has information on the protection and conservation of marine biodiversity and
ecosystems, eutrophication, hazardous and radioactive substances (www.ospar.org).
IV. Socioeconomic Conditions
The first Europeans arrived in Ammassalik only about 100 years ago. The human
population in the region is extremely small, with about 3,500 people living in the 2 towns
and 9 settlements of Greenland's east coast. Many are from the traditional Inuit culture,
which continues to play an important role in everyday life. The Inuit dependence on
fishing and on the harvesting of wildlife formed the basis of their society, culture and
economy. Today, the local population continues to be highly dependent on the fish,
crustaceans and mussels obtained from the sea, and on the hunting of seals, whales,
polar bears and other prey. Fishing accounts for 95% of total exports. Certain mineral
deposits may be of future economic interest, including the oil fields near Jameson Island
in East Greenland. Diamond, gold, niobium, tantalite, uranium and iron deposits are
found on the island.
The PAME Working Group has information on the indigenous and non-indigenous
communities living in the Arctic who are heavily dependent on the Arctic living marine
resources. All of these groups are represented in the Arctic Council. OSPAR provides
information on the offshore oil and gas industry, and the use of the ecosystem approach
to the management of human activities (www.ospar.org).
V. Governance
For centuries Greenland belonged to Denmark, but since 1979 has moved towards
independence. The Greenland Institute of Natural Resources is responsible for providing
scientifically sound management advice to the Greenland government. Investigations on
selected fish larvae and zooplankton in relation to hydrographic features is currently
undertaken as part of the monitoring programme NuukBasic. The marine component of
the monitoring program was initiated in 2005, and is managed by the Center of Marine
XIII North East Atlantic
551
Ecology and Climate Effects at Greenland Institute of Natural Resources. Results from
the monitoring programme are published in annual reports, as well as peer-reviewed
scientific papers when appropriate. Issues that have been identified as important for the
management of this LME include the need to improve the scientific basis for linking
climatic variability and climate change to the chemical and biological processes and
fishing pressure. Greenland participates in the Arctic Council and OSPAR as part of
Denmark and the Faroe Islands.
References
ACIA (2004). Arctic Climate Impact Assessment. Impacts of a warming Arctic. Overview report.
http://amap.no/workdocs/index.cfm?dirsub=%2FACIA%2Foverview.
AMAP. Arctic Monitoring and Assessment Program. www.amap.no
Belkin, I.M. (2004) Propagation of the "Great Salinity Anomaly" of the 1990s around the northern
North Atlantic, Geophysical Research Letters, 31(8), L08306, doi:10.1029/2003GL019334.
Belkin, I.M. (2008) Rapid warming of Large Marine Ecosystems, Progress in Oceanography, in
press.
Belkin, I.M., Cornillon, P.C., and Sherman, K. (2008). Fronts in Large Marine Ecosystems of the
world's oceans. Progress in Oceanography, in press.
Belkin, I.M., Levitus, S. Antonov, J. and Malmberg, S.-A. (1998) "Great Salinity Anomalies" in the
North Atlantic, Progress in Oceanography, 41(1), 1-68.
Buch, E., Horsed, S. A. and Hovgard, H. (1994). Fluctuations in the occurrence of cod in Greenland
waters and their possible causes. ICES Marine Science Symposia 198:158-174.
Dickson, R.R., J. Meincke, S.-A. Malmberg, and A.J. Lee (1988) The "Great Salinity Anomaly" in
the North Atlantic, 19681982, Progress in Oceanography, 20(1), 103151.
Hamilton, L.C., Brown, B.C. and Rasmussen, R.O. (2003) West Greenland's cod-to-shrimp
transition: Local dimensions of climate change, Arctic, 56(3), 271-282.
Hansen, P.M. (1949). Studies on the biology of the cod in Greenland waters. Rapports et Proces-
Verbaux des Reunions, Conseil International pour l'Exploration de la Mer 123:1-83.
Hardy, R.J., Bamber, J.L., and Orford, S. The delineation of major drainage basins on the
Greenland ice sheet using a combined numerical modelling and GIS approach. Hydrological
Processes.
Horsted, S.Aa. (1989). Some Features of Oceanographic and Biological Conditions in Greenland
Waters, p 456-476 in: Rey L. and Alexander, V. (eds.) Proceedings of the Sixth Conference of
the Comite Arctique International 13-15 May 1985. E.J. Brill., Leiden.
NOAA (1991). Report of the ad hoc Committee on Large Marine Ecosystems. NOAA Technical
Memorandum NMFS-F/NEC-92.
Pauly, D. and Christensen, V. (1995). Primary production required to sustain global fisheries.
Nature 374: 255-257.
Pauly, D. and Watson, R. (2005). Background and interpretation of the `Marine Trophic Index' as a
measure of biodiversity. Philosophical Transactions of the Royal Society: Biological Sciences
360: 415-423.
Pauly, D., Christensen, V., Dalsgaard, J., Froese R. and Torres, F.C. Jr. (1998). Fishing Down
Marine Food Webs. Science 279: 860-863.
Prescott, J.R.V. (1989). The political division of Large Marine Ecosystems in the Atlantic Ocean
and some associated seas, p 395-442 in: Sherman, K. and Alexander, L.M. (eds), Biomass
Yields and Geography of Large Marine Ecosystems. AAAS Selected Symposium 111.
Westview Press, Boulder, United States.
Sea Around Us (2007). A Global Database on Marine Fisheries and Ecosystems. Fisheries Centre,
University British Columbia, Vancouver, Canada. www.seaaroundus.org/lme/Summary
Info.aspx?LME=19
Skjoldal, H.R., Noji, T.T., Giske, J., Fossaa, J.H., Blindheim, J. and Sundby, S. (1993). Mare
Cognitum. Science Plan for Research on Marine Ecology of the Nordic seas (Greenland,
Norwegian, Iceland Seas) 1993-2000. A regional GLOBEC programme with contributions also
to World Ocean Circulation Experiment and Joint Global Ocean Flux Study. Institute of Marine
Research, Bergen, Norway.
552
39. East Greenland Shelf LME
Stevens, D.P., (1991). A numerical ocean circulation model of the Norwegian and Greenland Seas.
Progress in Oceanography 27:365-402.
UNEP (2004). Pedersen, S.A., Madsen, J. and Dyhr-Nielsen, M. Arctic Greenland, East Greenland
Shelf, West Greenland Shelf, GIWA Regional Assessment 1b, 15, 16. University of Kalmar,
Kalmar, Sweden. www.giwa.net/publications/r1b_15_16.phtml.
XIII North-East Atlantic
553
XIII-40 Iberian Coastal LME
M.C. Aquarone ,S. Adams and L. Valdés
The Iberian Coastal LME is a continental shelf region of the Eastern Atlantic Ocean lying
between approximately 36° N (Gulf of Cadiz) and 44° N (Cantabrian Sea), and bordered
by Spain and Portugal. A temperate climate characterises this western boundary current
ecosystem. The continental shelf in this region varies from 12 to 50 km, being the
narrowest in the Northeast Atlantic margin. The LME has an area of about 300,000 km2,
of which 0.45% is protected, and contains about 0.07% of the world's sea mounts (Sea
Around Us 2007). One of the main geomorphological features of the Iberian Coastal
LME is a series of extremely steep and deep marine canyons. The coast of Asturias has
the canyons of Avilés, Lastres and Llanes; these are so abrupt that in only 7 km from the
coastline the depth reaches 4500 m, making these features the steepest and deepest
near-shore canyons in the world. It seems that these canyons are the refuges of giant
squids (Architeuthis dux and Taningea danae) which are found here quite often (usually
in October) dead on the beaches. Off Portugal there is a remarkable canyon Nazaré.
Other interesting features in this LME are the seamounts or relic shelves offshore, such
as the Bank of Galicia and the Bank of Le Danois (known in Spain as El Cachucho),
which has been recently protected as an AMP in the Northern Spain. The Iberian
seaboard has a highly convoluted coastline indented with drowned river valleys called ria.
Book chapters and articles pertaining to this LME include Wyatt & Perez-Gandaras
(1989) and Wyatt & Porteiro (2002). This LME together with the Bay of Biscay is
included in OSPAR as Region 4. This is the same regionalization that the EU has done in
the recently published Directive on Marine Strategy (25/06/08). ICES is supporting a
Working Group named WGRED which had done quite extensive regional descriptions,
including Iberian shelf. The report of last year can be found at: www.ices.dk/iceswork/wg
detailacfm.asp?wg=WGRED. Additional general information on this region can be found
in Valdes and Lavín (2002) and Lavín et al. (2006).
I. Productivity
Productivity and resource abundance in the Iberian Coastal LME are driven by climate
and upwelling, with intensive fishing being the secondary driving force. The importance
of climate is suggested by the link between sardine catches and Ekman drift, and by the
link between anchovy catches in this LME and biological changes in the Western English
Channel (see Wyatt & Perez-Gandaras 1989). The coastal upwelling is the most
important feature in terms of natural variability in the entire LME. Upwelling takes place in
late spring and summer along the coast of Portugal, Western Galicia up to the Cape
Peńas in the North Spanish coast (mid-Cantabrian Sea). For more on changes in
oceanographic conditions in this LME, see Wyatt & Porteiro (2002).
The Iberian Coastal LME is considered a Class II, moderately productive ecosystem
(150-300 gCm-2yr-1). Margalef (1956) identified marked changes in the phytoplankton
composition of Galician waters during the 1950s sardine crisis. The LME is characterised
by favorable conditions for the production of clupeoids and other small pelagic fishes.
For biomass changes in sardine, see Wyatt & Perez-Gandaras (1989). Changes in the
upwelling regime affected the sardine stock. There were changes in the phytoplankton
composition and in the patterns of water exchange between the rias and the open sea.
Major changes in sardine abundance were accompanied by equally radical changes in
other trophic levels. Good sardine productivity is linked with the presence of the diatom
Melosira (Paralia) sulcata, and poor productivity with Thalassiosira rotula invasions.
There are marked changes in the abundance of certain dinoflagellate species. See the
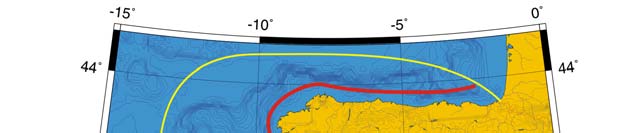
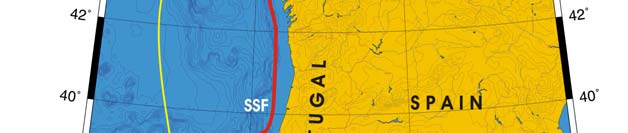
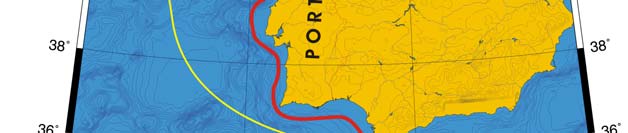
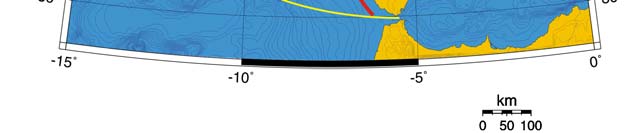
554
40. Iberian Coastal
ocean triads model for an explanation of upwelling, concentration of larval food brought
about by convergences, and mesoscale circulation patterns that help to maintain larval
retention (Wyatt & Porteiro 2002). Galicia is the most important region in the world in
terms of production of mussels cultured in rafts (extensive culture in the rias), with annual
average rates of ~250,000 tons.
Oceanic Fronts (Belkin et al. 2008): The frontal pattern off Iberia (Figure XIII-40.1) is
fairly complicated and variable, especially on the seasonal and interannual scales. Most
fronts are caused by coastal wind-induced upwelling, which is similar to the Northwest
African coastal upwelling (Barton 1998) and also broadly similar to the California Current
upwelling (Haynes et al. 1993). The upwelled water is entrained into large filaments that
extend hundreds of kilometres offshore. SST fronts are most pronounced during the
peak of the upwelling season, from July through September. The wintertime frontal
pattern is quite variable from one year to another and depends, at least partially, on the
poleward coastal warm current that emerges once the trade winds collapse (e.g. Garcia-
Soto et al 2002); this current is, however, confined to a very narrow near-coastal band,
25-40 km wide; its thermal signature is just 1.0-1.5°C.
Figure XIII-40.1. Fronts of the Iberian Coastal LME. SSF, Shelf-Slope Front. Yellow line, LME boundary.
After Belkin et al. (2008)..
Iberian Coastal LME SST (Belkin 2008):
Linear SST trend since 1957: 0.80°C.
Linear SST trend since 1982: 0.68°C.
Since 1957, the Iberian Coastal LME went through a cooling until the all-time minimum of
1972, followed by a rapid warming, 1.7°C over 34 years (Figure XIII-40.2). Several major
events in the Iberian Coastal LME occurred practically simultaneously within a year
with similar events in the adjacent Celtic-Biscay Shelf LME located downstream of the
Iberian Coastal LME and connected to the latter by the Iberian Poleward Current and its
extension off northern Spain dubbed "Navidad" (e.g. Garcia-Soto et al., 2002) flowing
from the Iberian LME onto the Celtic-Biscay Shelf. These events include three minima of
XIII North-East Atlantic
555
1963, 1972, and 1986; a maximum of 1989; and a minimum of 1991-94. The observed
synchronism between both LMEs may be more appearance than reality since annual
mean data does not allow for a study of anomaly propagation over short distances where
propagation time is a few months, not years. The very fast post-1972 warming by 1.7°C
over 34 years has already profoundly affected this LME. Observations in the southern
Gulf of Biscay in 1974-2000 revealed substantial restructuring of local ecosystems
caused by the ongoing warming: cold-water fish and sea bird species dwindled, whilst
two species puffin and killer whale disappeared completely; whereas warm-water
species proliferated; taken together, these changes likely manifest a regime shift
(Hemery et al., 2007).
Figure XIII-40.2. Iberian Coastal LME annual mean SST (left) and SST anomalies (right), 1957-2006,
based on Hadley climatology. After Belkin (2008).
Iberian Coastal LME Chlorophyll and Primary Productivity: This LME is considered
a Class II, moderately productive ecosystem (150- 300 gCm-2yr-1)(Figure XIII-40.3).
Figure XIII-40.3. Iberian Coastal LME trends in chlorophyll a (left) and primary productivity (right), 1998-
2006. Values are colour coded to the right hand ordinate. Figure courtesy of J. O'Reilly and K. Hyde.
Sources discussed p. 15 this volume.
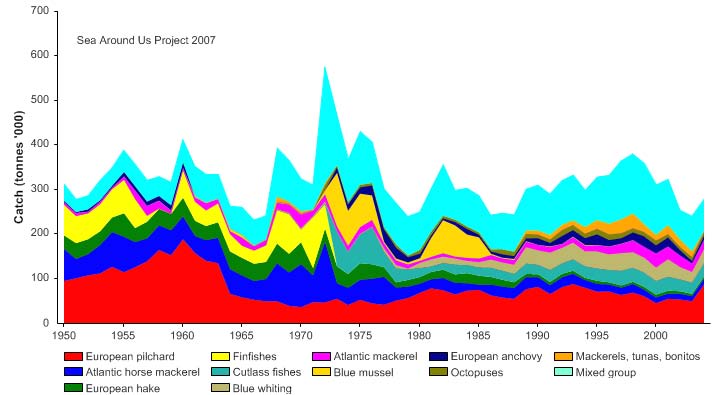
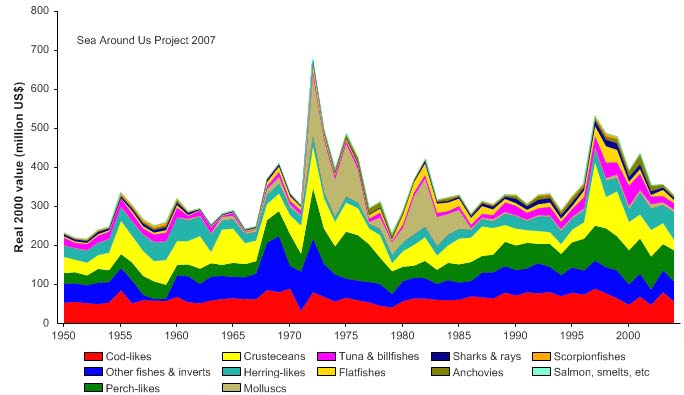
556
40. Iberian Coastal
II. Fish and Fisheries
The catch in the Iberian Coastal LME is essentially composed of three groups: herring,
sardine and anchovy (42%), other pelagic fish (28%), and cod, hake and haddock.
Coastal species harvested are anchovy, sardine, mackerel and horse mackerel. Hake,
blue whiting, bream, bogue, pilchard, sprat and tuna are also caught. For examples of
biomass changes in sardine, sprat, anchovy and other species, as well as for landings of
fish in 1981, and for a description of fisheries geography and Iberian sardine fisheries in
crisis in the 1940s and 1950s, see Wyatt & Porteiro (2002). Total reported landings in
the LME peaked at 575,000 tonnes in 1972, but in general have fluctuated between
250,000 to 350,000 tonnes (Figure XIII-40.4). The value of the reported landings
reached almost US$700 million (in 2000 real US dollars) in 1972, after which it dropped
precipitously and fluctuated between US$200 million and US$500 million ever since
(Figure XIII-40.5).
Figure XIII-40.4. Total reported landings in the Iberian Coastal LME by species (Sea Around Us 2007)
Figure XIII-40.5. Value of reported landings in the Iberian Coastal LME by commercial groups (Sea
Around Us 2007)
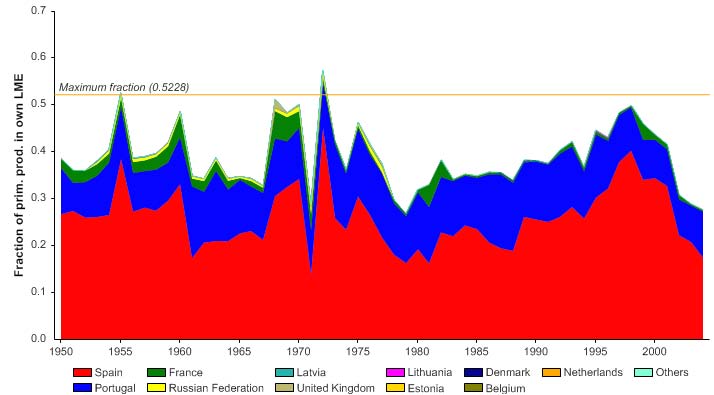
XIII North-East Atlantic
557
The primary production required (PPR; Pauly & Christensen 1995) to sustain the reported
landings in this LME reached extremely high level in the mid 1970s, but has declined to
30% by 2004 (Figure XIII-40.6). Spain and Portugal account for most of the ecological
footprint in this LME.
Figure XIII-40.6. Primary production required to support reported landings (i.e., ecological footprint) as
fraction of the observed primary production in the Iberian Coastal LME (Sea Around Us 2007). The
`Maximum fraction' denotes the mean of the 5 highest values.
The mean trophic level of the reported landings (i.e., the MTI; Pauly & Watson 2005)
remained more or less even, except for two `dips' in 1973 and 1983, likely associated
with the high landings of (possibly farmed) mussels (XIII-40.7, top). The FiB index is also
rather uninformative, except for the very last years, which reflects the decline in the
landings (XIII-40.7, bottom). The sustainable mussel farming here (established in the
1950's) stably produced ~250,000 tonnes/year since 1970's, making it one of the most
important farming cultures in the world..
Figure XIII-40.7. Mean trophic level (i.e., Marine Trophic Index) (top) and Fishing-in-Balance Index
(bottom) in the Iberian Coastal LME (Sea Around Us 2007)
558
40. Iberian Coastal
The Stock-Catch Status Plots indicate that the number of collapsed stocks has been
increasing, accounting for over 60% of the commercially exploited stocks in the LME
(Figure XIII-40.8, top), while the majority of the reported landings biomass is supplied by
overexploited stocks (Figure XIII-40.8, bottom).
0%
100
10%
90
20%
)
80
(
%
30%
t
us
70
t
a
s
40%
60
by
s
k
50%
50
t
oc
s
60%
40
r
of
e
b
70%
m
30
u
N
80%
20
90%
10
100%
0
1950
1960
1970
1980
1990
2000
(n = 5861)
developing
fully exploited
over-exploited
collapsed
0%
100
10%
90
20%
80
)
%
30%
(
70
s
u
40%
t
at
60
ck s
50%
o
50
st
y
60%
b
h
40
c
70%
Cat
30
80%
20
90%
10
100%0
1950
1960
1970
1980
1990
2000
(n = 5861)
developing
fully exploited
over-exploited
collapsed
Figure XIII-40.8. Stock-Catch Status Plot for the Iberian Coast LME, showing the proportion of
developing (green), fully exploited (yellow), overexploited (orange) and collapsed (purple) fisheries by
number of stocks (top) and by catch biomass (bottom) from 1950 to 2004. Note that (n), the number of
`stocks', i.e., individual landings time series, only include taxonomic entities at species, genus or family
level, i.e., higher and pooled groups have been excluded (see Pauly et al, this vol. for definitions).
III. Pollution and Ecosystem Health
Red tides were a more or less annual occurrence in the Rias Bajas from the beginning of
the 20th Century until the 1950s. These were almost always due to the dinoflagellate
Gonyaulax, and sometimes to the ciliate Mesodinium. Since the 1970s, Gonyaulax
blooms have not been reported in the Rias Bajas. Instead, there have been occasional
blooms of the toxic dinoflagellates Alexandrium tamarense, A. minutum and
Gymnodinium catenatum. These phytoplankton changes are seen as part of a worldwide
increase in the frequency and intensity of harmful algal blooms, and are attributed to
various causes including eutrophication and ballast water transport. Perez et al. (2004)
report that under strong insolation and weak synoptic forcing, typically in the summer,
sea breezes and mountain-induced winds develop to create re-circulations of pollutants
along the eastern Iberian coast. According to Wyatt & Porteiro (2002), on the whole,
pollution is not of major importance in the Iberian LME, except in a few localised areas.
OSPAR lists ballast water, mariculture itself; coastal installations intensifying
stratification. Anthropogenic inputs and fluxes of nitrogen into areas susceptible to
eutrophication; unbalanced nutrient ratios in N: P and N:Si for example; hydroelectric
power plant exceptional discharges; and increasing inputs of humic substances from
rivers are threats to mariculture (OSPAR 2000). The EEA in "Eutrophication in Europe's
Coastal Waters" reports in July 2001 that the Bay of Biscay and Iberian coast
eutrophication problems are restricted to estuaries and coastal lagoons, especially Ria
Formosa and Huelva. The concentration in this region of ship transport towards Northern
Europe requires special regulation to prevent and control pollution. The waters around
XIII North-East Atlantic
559
Finisterre are regulated to avoid collisions of tankers and carriers. This region has seen a
high number of oil spills from wrecks such as the recent Aegean Sea (1992) and Prestige
(2002). A map with the location of events can be found in Lavin et al 2006.
IV. Socioeconomic Conditions
In its reports for 2000, OSPAR estimates population in the "Atlantic arc," the coastal
regions of France, Spain and Portugal, at 36.6 million inhabitants or 106 inhabitants per
km2. In Spain, the three northern coastal regions are densely populated: Pais Vasco
(>110 inh/km2), Cantabria (100 inh/km2) and Asturias (104 inh/km2). Population is
concentrated in the coastal areas as are most of the economic activities and industries.
Spain and Portugal are important fishing nations in the European Union, with Spain
having the largest distant water fleet of any European country. The total number of
vessels in the Spanish fishing fleet decreased during the 1990s and is currently around
9000, and only part of it operates in this LME. Spanish artisanal vessels fish for hake
and mackerel in the winter, anchovy in spring, and sardine and albacore in summer and
autumn. Sardine is one of the most important species in both landings and price. The
focus of the Spanish anchovy fishery has moved eastwards, resulting in almost the entire
catch being landed in Basque ports. Technical changes in the Basque fishery accounted
for part of the increase in landings after the 1960s (Igelmo et al. 1984). Spain is
gradually being excluded from several of its traditional extraterritorial fishing grounds, and
will need to focus on the management of its local resources. A blue mussel farming
industry, initiated in the 1950s in the Rias Bajas, produces about 250,000 tonnes
annually. In the main area of raft cultivation, the Ria de Arosa, the standing stock of
mussels is near or above carrying capacity of phytoplankton production.
Coastal erosion is a major concern, with subsequent salt water intrusion into estuaries,
coastal lagoons, wetlands and groundwater as sea level rises likely (OSPAR 2000). The
quality of farmed shellfish, particularly near outfalls discharging domestic wastewater, is
also a major concern. HABS that affect the human consumer, episodes of acute shellfish
toxicity, coastal development including urban expansion, and sea invasion of important
agricultural areas, present a number of environmental issues to this coastal population.
Compared to its Mediterranean coast, Spain's Atlantic coast is not a frequent destination
for tourists; the total number of overnight stays in local hotels on the Atlantic coast
represents 6% of overnight stays in Spain and 87% of the visitors are Spanish (OSPAR
2000) (the French Atlantic Coast represents 24%). Tourism that adds pressure to
existing marine ecosystems is also a force for maintaining clean beaches, potable water
and uncontaminated fish and shellfish. Currently there is no sewage sludge dumped at
sea along the Atlantic coast by France, Spain or Portugal, either from land or ships.
V. Governance
Spain and Portugal are both members of the EU. Being relatively small, the LME can be
surveyed with the resources already available in the two countries. Both countries
collaborate effectively in various fisheries contexts. The exploitation of the natural marine
resources of the Iberian Coastal LME follows a number of conventions, declarations and
regulations, including the European Commission directives and regulations within the
Common Fisheries Policies. All in all, a large number of instruments from international
bodies, such as the UN, ICES, OSPAR, International Maritime Organisation (IMO) and
the EU, exist to conserve natural resources, protect the environment and ensure health
and safety standards. The European Community laws protect the environment in terms
of air and noise, chemicals and industrial risks, nature conservation, waste and water.
See the OSPAR website for more information (www.ospar.org).
560
40. Iberian Coastal
References
Barton, E.D., Aris J., Tett, P., Cantón, M., Garciá J., Hernández-Leon, S., Nykjaer, L., Almeida, C.,
Almunia, J., Ballesteros, S., Basterretxea, G., Escánez, J., Garciá L., Hernández-Guerra, A.,
López-Laatzen, F., Molina, R., Montero, M.F., Navarro-Pérez, E., Rodrig J.M., van Lenning, K.,
Vélez, H. and Wild, K. (1998). The transition zone of the Canary Current upwelling region.
Progress in Oceanography 41:455-504.
Belkin, I.M. (2008) Rapid warming of Large Marine Ecosystems, Progress in Oceanography, in
press.
Belkin, I.M., Cornillon, P.C., and Sherman, K. (2008). Fronts in large marine ecosystems of the
world's oceans. Progress in Oceanography, in press.
European Communities (EC) (1991) Directive 91/271/EEC. Urban waste water treatment.
http://ec.europa.eu/environment/water/water-urbanwaste/directiv.html
Garcia-Soto, C., R.D. Pingree, and L. Valdés (2002) Navidad development in the southern Bay of
Biscay: Climate change and swoddy structure from remote sensing and in situ measurements,
J. Geophys. Res., 107(C8), 3118, doi:10.1029/2001JC001012.
Haynes, R., Barton, E.D. and Pilling, I. (1993). Development, persistence and variability of
upwelling filaments off the Atlantic coast of the Iberian Peninsula. Journal of Geophysical
Research 98(22):681-692.
Hemery G., F. D'Amico, I. Castege, B. Dupont, J. d'Elbee, Y. Lalanne, and C. Mouches (2007)
Detecting the impact of oceano-climatic changes on marine ecosystems using a multivariate
index: The case of the Bay of Biscay (North Atlantic-European Ocean), Global Change Biology
(OnlineAccepted Articles), doi:10.1111/j.1365-2486.2007.01471.x.Igelmo, A.X., Iribar, X., and
Lerga, S. 1984. Inventario de artes de pesca en Euskadi. Publ. Gobierno Vasco. Dep. Com.,
Pesca Y Turismo.
Lavín, A., L. Valdés, F. Sánchez, P. Abaunza, A. Forest, J. Boucher, P. Lazure and A.M. Jegou.
2006. The Bay of Biscay: The encountering of the ocean and the shelf. The Sea, Vol 14,
chapter 24: 935-1002.
Lluch-Belda, D., Crawford, R.J.M., Kawasaki, T., MacCall, A.D., Parrish, R.H., Schwartzlose, R.A.
and Smith, P.E. (1989). World-wide fluctuations of sardine and anchovy stocks: The regime
problem. South African Journal of Marine Science 8:195-205.
Margalef, R. (1956). Paleoecologia postglaciar de la ria de Vigo. Investigaciones Pesqueras 5:89-
112.
OSPARQuality Status Report (2000) at www.sahfos.ac.uk/climate%20encyclopaedia/ OSPAR.htm
Pauly, D. and Christensen, V. (1995). Primary production required to sustain global fisheries.
Nature 374: 255-257.
Pauly, D. and Watson, R. (2005). Background and interpretation of the `Marine Trophic Index' as a
measure of biodiversity. Philosophical Transactions of the Royal Society: Biological Sciences
360: 415-423.
Perez, C., M. Sicard, O. Jorba, A. Comeron, J.M. Baldasano. (2004). Summertime re-circulations of
air pollutants over the north-eastern Iberian coast observed from systematic EARLINET lidar
measurements in Barcelona. Atmos. Environ. 38 (24):3983-4000.
Prescott, J.R.V. (1989). The political division of Large Marine Ecosystems in the Atlantic Ocean
and some associated seas, p 395-442 in: Sherman K. and Alexander, L.M. (eds), Biomass
Yields and Geography of Large Marine Ecosystems. AAAS Selected Symposium 111.
Westview Press, Boulder, U.S.
Sea Around Us (2007). A Global Database on Marine Fisheries and Ecosystems. Fisheries Centre,
University British Columbia, Vancouver, Canada. www.seaaroundus.org/lme/
SummaryInfo.aspx?LME=25
Valdes, L. and Lavin, A. (2002). Dynamics and human impact in the Bay of Biscay: An ecological
perspective p 293-320 in: Sherman, K. and Skjoldal, H.R. (eds), Large Marine Ecosystems of
the North Atlantic Changing States and Sustainability. Elsevier Science, Amsterdam, The
Netherlands.
Wooster, W.S., Bakun, A. and McLain, D.R. (1976). The seasonal upwel ing cycle along the
eastern boundary of the North Atlantic. Journal of Marine Research 34:131-141.
Wyatt, T. and Perez-Gandaras, G. (1989). Biomass changes in the Iberian ecosystem, p 221-239
in: Sherman, K. and Alexander, L.M. (eds), Biomass Yields and Geography of Large Marine
Ecosystems. AAAS Selected Symposium 111, Boulder, U.S.
XIII North-East Atlantic
561
Wyatt, T. and Porteiro, C. (2002). Iberian sardine fisheries: Trends and crises, p 321-338 in:
Sherman, K. and Skjoldal, H.R. (eds), Large Marine Ecosystems of the North Atlantic
Changing States and Sustainability. Elsevier Science, Amsterdam, The Netherlands.
Wyatt, T., Cushing, D.H. and Junquera, S. (1991). Stock distinctions and evolution of the European
sardine, p 229-238 in: Kawasaki, T., Tanaka, S., Toba, Y. and Taniguchi, A. (eds), Long-term
Variability of Pelagic Fish Populations and their Environment. Pergamon.
562
40. Iberian Coastal
XIII North East Atlantic
563
XIII-41 Iceland Shelf LME
M.C. Aquarone and S. Adams
The Iceland Shelf LME surrounds the island-nation of Iceland in the northeast Atlantic
Ocean. It is characterised by a sub-arctic climate and environment, with seasonal ice
cover and marked fluctuations in salinity and temperature off the north coast.
Temperature, currents, tides and seasonal oscillations affect productivity in this LME.
The area of this LME is 315,500 km2, of which 0.06% is protected (Sea Around Us 2007).
In this highly active geological region, the divergence of two tectonic plates causes the
formation of oceanic crust and the crest of the Mid-Atlantic Ridge. LME book chapters
and articles pertaining to this LME include Prescott (1989) and Astthorsson &
Vilhjalmsson (2002).
I. Productivity
Iceland has a wide volcanic margin marked by broad valleys and a sharply defined slope.
For a map of bottom topography around Iceland, see Astthorsson & Vilhjalmsson (2002,
p. 220). Three ocean currents (the North Icelandic Irminger Current, the East Icelandic
Current, and the Coastal Current move in a clockwise gyre around the island. For a map
of ocean currents, see Astthorsson & Vilhjalmsson (2002, p. 221). A complex system of
transverse ridges is oceanographically important because it separates the relatively warm
and saline waters of the Atlantic from the cold, fresh Arctic waters of the Iceland Sea and
Norwegian Sea to the north and northeast.
The Iceland Shelf LME is considered a Class II, moderately high productivity ecosystem
(150-300 gCm-2yr-1). Extensive primary productivity measurements have been carried
out annually in the waters around Iceland for more than four decades (see Thordardottir
1984). For a map of average primary production in Icelandic waters based on data from
the period 1958-1982, see Astthorsson & Vilhjalmsson (2002). Climate is the primary
force driving the LME. There are marked interannual changes in the spring development
of phytoplankton (Gudmundsson, 1998). Studies on zooplankton biomass and species
composition have been carried out on standard transects during late May-June in
Icelandic waters. The highest biomass is found in the front area between the coastal and
the Atlantic water off Iceland's south coast and in the Arctic waters of the East Icelandic
Current off the northeast coast. Changes in hydrography impact the food chain through
influences on primary production, zooplankton, and the capelin and cod stocks. For a
conceptual model of how climatic conditions in Icelandic waters may affect production at
lower trophic levels and eventually the yield from the Icelandic cod stock, see
Astthorsson & Vilhjalmsson (2002, p. 240).
Oceanic fronts (Belkin et al. 2008). The Irminger Current warm and salty waters arrive
on the Iceland Shelf from the south and circulate anticyclonically around Iceland. The
Polar and Arctic waters, both relatively fresh and cold, arrive from the north along the
North Iceland Front to meet the Irminger waters (carried by the North Icelandic Irminger
Current along the Irminger Current-West Iceland Front) over the northwest, north and
northeast Iceland Shelf where two major fronts form (Figure XIII-41.1). The western front
is located where the Irminger waters meet the western branch of cold, fresh waters
headed toward the Denmark Strait. The eastern front is located north and northeast of
Iceland where the East Icelandic Current meets the North Icelandic Irminger Current.
The eastern front appears to be connected to the Iceland-Faroes Front observed farther
east, although this connection is rather tenuous.
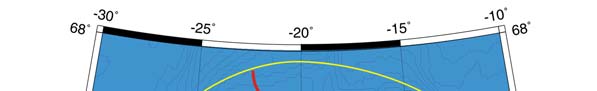


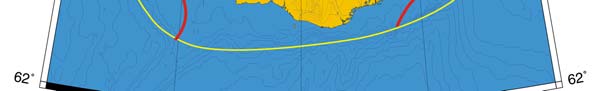
564
41. Iceland Shelf LME
Figure XIII-41.1. Fronts of the Iceland Shelf LME. IFF, Iceland-Faroes Front (located mostly outside this
LME; the link between NIF and IFF is rather tenuous); ICWIF, Irminger Current-West Iceland Front; NIF,
North Iceland Front; SEIF, Southeast Iceland Front. Yellow line, LME boundary. After Belkin et al. 2008.
Iceland Shelf LME (Belkin, 2008)
Linear SST trend since 1957: -0.11°C.
Linear SST trend since 1982: 0.86°C.
The Iceland Shelf experienced a dramatic cooling from the all-time maximum of 7.2°C in
1958 down to the all-time minimum of 5.4°C in 1967 (Figure XIII-41.2). This event
heralded the arrival of the Great Salinity Anomaly (GSA) of the 1960s-1970s (GSA'70s;
Dickson et al., 1988; Belkin et al., 1998), which had a lasting effect on this ecosystem.
This cold anomaly was associated with low salinities and with increased export of sea
ice. Ocean currents transported the GSA'70s from the Greenland Sea southward past
Iceland, then around the Subarctic Gyre, and eventually back to Iceland and past Iceland
into the Norwegian Sea. A map of the circulation in the northern North Atlantic is shown
at www.ospar.org.
Figure XIII-41.2. Iceland Shelf LME annual mean SST (left) and SST anomaly (right), 1957-2006. After
Belkin (2008).
XIII North East Atlantic
565
The SST remained low through 1995, the year when SST was as cold as in 1969 (<5.4°C). Then
SST abruptly rose through 2003, when it peaked at 7.1°C, a 1.7°C rise in 8 years, thereby posting
an average annual warming rate of >0.2°C/year, one of the fastest warming rates observed in the
world's oceans.
Iceland Shelf LME Chlorophyll and Primary Productivity: The Iceland Shelf LME is
considered a Class II, moderately high productivity ecosystem (150-300 gCm-2yr-1).
Figure XIII-41-3. Iceland Shelf LME trends in chlorophyll a (left) and primary productivity (right), 1998-
2006. Values are colour coded to the right hand ordinate. Figure courtesy of J. O'Reilly and K. Hyde.
Sources discussed p. 15 this volume.
II. Fish and Fisheries
Total reported landings1 have increased since 1950, with occasional considerable
variation mainly driven by fluctuations in capelin landings, and total reported landings
peaked in 1997 at 1.6 million tonnes (Figure XIII-41.4). Landings were driven primarily by
Atlantic cod before the 1970s and by herring and especially capelin afterwards (Figure
XIII-41.4). Capelin, which in 1997 accounted for over 60% of the total landings, are
linked to cod through a tight predator-prey relationship (Jakobsson & Stefansson, 1998).
The herring catch peaked at about 615,000 tonnes in 1962, before collapsing in the late
1960s and early 1970s. An important fishery for northern shrimp developed during the
1970s to the 1990s, with landings in the mid-1990s of over 60,000 tonnes2. This declined
has been attributed to higher predatory pressure by cod and reduced recruitment related
to recent warming (Astthorsson et al., 2007)
1 Due to a recent adjustment to the boundaries of the Iceland Shelf LME, the landings data presented here are
based on the 1950-2003 data, computed using the boundaries defined in Figure XIII-41.1. Data for 1950-2004,
based on the new LME boundaries, will be available online at www.seaaroundus.org.
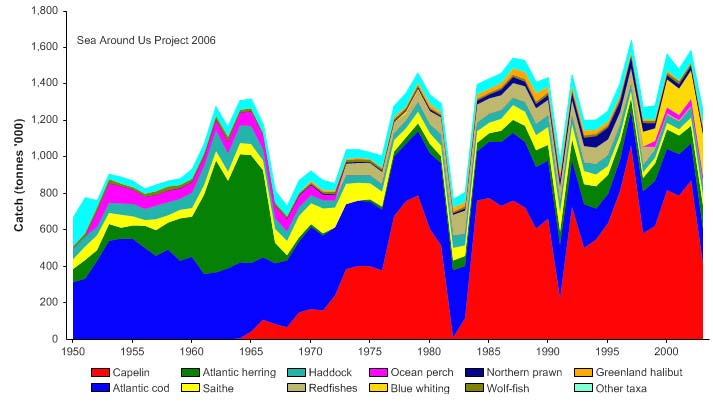
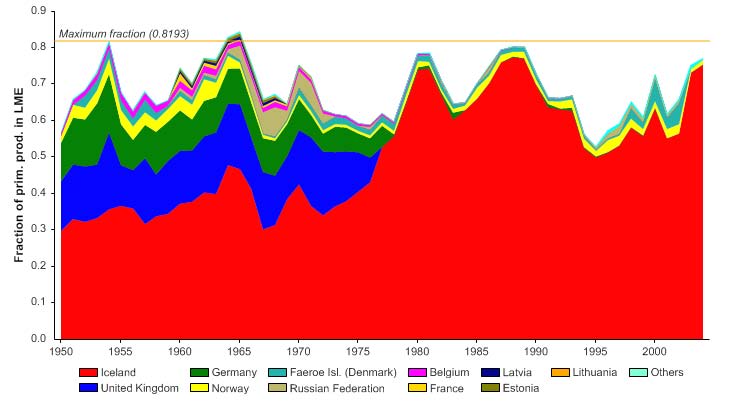
566
41. Iceland Shelf LME
Figure XIII-41.4. Total reported landings in the Iceland Shelf LME by species (Sea Around Us 2007)
No Figure XIII-41.5. Information on the value of reported landings cannot be provided at this stage, due to the
recent adjustments in LME boundaries (see note 1 above). Data for values using the newly adjusted boundaries
will be available at www.seaaroundus.org..
The primary production required (PPR; Pauly & Christensen 1995) to sustain the reported
landings in the LME exceed the observed primary production (Figure XIII-41.6). Such
unrealistically high PPR likely imply that the large portion of the reported landings are
supported by primary production from neighbouring marine ecosystems, i.e., large groups
of exploited stocks are feeding outside of the Iceland Shelf LME and migrating in (see
e.g. FAO 1981). Iceland accounts for almost the entire ecological footprint in the LME
since the late 1970s, following a long, well-documented struggle against the exploitation
of its shelf area by distant-water fleets (Bonfil et al. 1998).
Figure XIII-41.6. Primary production required to support reported landings (i.e., ecological footprint) as
fraction of the observed primary production in the Iceland Shelf LME (Sea Around Us 2007). The
`Maximum fraction' denotes the mean of the 5 highest values.
Both the mean trophic level of the reported landings (i.e., the MTI; Pauly & Watson 2005)
and the FiB index have declined over the reported period (Figure XIII-41.7). In a detailed
analysis on the state of the fisheries in the Iceland shelf LME Valtysson & Pauly (2003)
stated that the declining TL level reflected increasing interest in pelagic species and
invertebrates due to new fishing technology, fish processing technology and marketing,
and was also driven by restrictions in groundfish catches due to declining stocks. Note
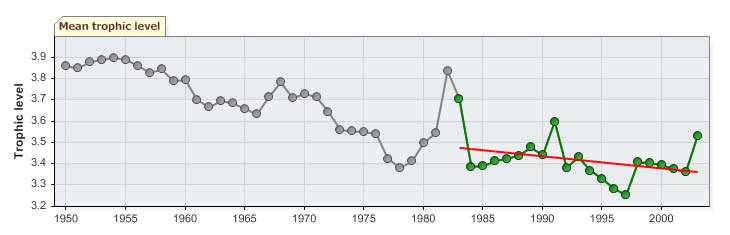
XIII North East Atlantic
567
that capelin and herring were never historically harvested simultaneously until the 1980s.
Furthermore, the lower trophic level blue whiting has migrated into Icelandic waters
because of the warming climate in recent years. These factors help create the
appearance of, but not the fact of, `fishing down the food web'.
Figure XIII-41.7. Mean trophic level (i.e., Marine Trophic Index) (top) and Fishing-in-Balance Index
(bottom) in the Iceland Shelf LME (Sea Around Us 2007)
The Stock-Catch Status Plots indicate that the number of overexploited stocks has been
increasing over the years, accounting for nearly 90% of the commercially exploited stocks
in the region (Figure XIII-41.8, top) with the majority of the reported landings biomass
supplied by overexploited stocks (Figure XIII-41.8, bottom).
0%
100
10%
90
20%
)
80
%
(
s
30%
u
70
at
st
40%
y
60
ks b
50%
c
o
50
f
st
60%
o
40
er
b
70%
m
30
Nu
80%
20
90%
10
100%0
1950
1960
1970
1980
1990
2000
(n = 2073)
developing
fully exploited
over-exploited
collapsed
0%
100
10%
90
20%
80
)
%
30%
(
70
t
us
40%
t
a
60
s
k
c
50%
t
o
50
s
60%
h by
40
t
c
a
70%
C
30
80%
20
90%
10
100%0
1950
1960
1970
1980
1990
2000
(n = 2073)
developing
fully exploited
over-exploited
collapsed
Figure XIII-41.8. The Stock-Catch Status Plots for the Iceland Shelf LME showing the proportion of
developing (green), fully exploited (yellow), overexploited (orange) and collapsed (purple) fisheries by
number of stocks (top) and by catch biomass (bottom) from 1950 to 2004. Note that (n), the number of
`stocks', i.e., individual landings time series, only include taxonomic entities at species, genus or family
level, i.e., higher and pooled groups have been excluded (see Pauly et al, this vol. for definitions).
568
41. Iceland Shelf LME
Fluctuations in salinity, temperature and phytoplankton contribute to variations in annual
catches of cod and small pelagics. Actions are underway in Iceland to reduce
overexploitation in a joint government-industry effort for achieving long term sustainability
in fish stock yields. Intensive fishing is a secondary force, after climate, driving this LME.
Changes in fisheries technology have also impacted the total catch from this LME. At the
turn of the last century, the fishing industry gradually became more mechanised, which
led to a catch increase. See Astthorsson & Vilhjalmsson (2002) for the following:
information on fish yields; a graph of demersal fish catches (cod, haddock, saithe,
redfish) in 1950-1998; the inshore and offshore shrimp catch in 1964-1998; a graph of the
huge fluctuations of herring and capelin from 1950- 1995 (p. 232); the spawning stock
biomass and total catch of the Icelandic cod stock from 1955- 1998 (p. 233); a map of
feeding areas and spawning grounds of the Icelandic capelin (p. 236); and for a
conceptual model of how climatic factors may affect the yield of cod through the food
chain. The simplicity of the main trophic links and oscillations between warm and cold
climatic regimes dramatically influence fish yield in this LME. For further information on
the impact of climate on the Icelandic Shelf LME see Astthorsson et al., (2007) and for
occurrence of new and rare species in recent years see Astthorsson & Palsson (2006).
Fluctuations in temperature and salinity can be related to large-scale changes in the
atmospheric circulation over the North Atlantic Ocean (Malmberg et al., 1999). See
Dickson et al. (1988), Belkin et al. (1998) and Belkin (2004) for information on the `Great
Salinity Anomalies' in the Northern North Atlantic. Near shore, hydrographic conditions
may vary considerably from year to year mainly due to timing and variations of fresh
water runoff.
III. Pollution and Ecosystem Health
Marine pollution appears to be negligible in the fishing grounds of the Iceland Shelf LME.
However, the Iceland's Ministry of the Environment reports that in some seasons of the
year, the quantity of persistent organic pollutants has been measured above the EU's
established critical limits in fish products such as fish oil and fish meal for animal feed.
(Report on the Implementation of the GPA 2001-2006 in Iceland, p.11). Although the
proportion of inhabitants with sewage treatment has risen from 40% in 1992 to almost
70% in 2005, measurements of faecal bacteria have revealed occasional contamination
in the vicinity of Reykjavik. The OSPAR 2005 report reveals that in Iceland the
concentration of arsenic in the vicinity of Álftafijord northwest and cadmium in the
Hvalfjord southwest has increased since the last measurements and efforts are underway
to determine why. Yet, heavy metal contamination in living organisms does not appear to
be a problem in the sea around Iceland, largely because of the lack of heavy industry.
The concentration of mercury is among the lowest measured in the Northeast Atlantic
and has not increased since measurements began. The Ministry recounts that regular
warnings concerning shellfish consumption had to be released in the July 2006 when in
the west in Hvalfjord and Breiőafjord and in Eyjafjord in the north, the levels of Dinophysis
species and the Pseudo-nizschia pseudodelcatissima both measured far above reference
limits. Causes are being investigated. Of particular concern is the effect of the toxins on
humans and on the farmed fish and cultivated shellfish. Nitrogen and phosphorous
released into the ocean from Iceland's rivers are routinely measured. Recent legislation
requires ship owners to remove ships that run aground within six months following the
incident. Iceland's environment laws and their monitoring and assessments, demonstrate
their intent to remain one of the cleanest places on earth.
IV. Socioeconomic Conditions
Iceland has a population of nearly 313,000 as of October 2007 according to Statistics
Iceland (www.statice.is). Icelanders enjoy a per capita income among the highest in
Europe and remain quite dependent on the fishing industry. Foreign fleets, specifically
XIII North East Atlantic
569
British, began fishing these waters at the beginning of the 15th Century (Jonsson, 1994).
Fishing by foreign fleets (particularly German and British) played an important role in the
cod fisheries during the 20th Century (Schopka, 1994) but foreign investment in the
fishing industry is no longer allowed. Iceland is one of the few nations in the world today
that has been able to build a modern society upon the exploitation of the resources of its
surrounding waters. Seafood products constitute about 60% of Iceland's exports. To
address fisheries overexploitation, Iceland has successfully introduced a management
system to allow stocks to recover (country profiles at <www.fco.gov.uk>). Iceland has
diversified its economy away from fishing into other investments: i.e. aluminium smelting,
finance and overseas investment--with some 60% of bank profits now coming from
overseas operations. The country is self-sufficient in meat and dairy products. Tourism
is now a major foreign exchange earner with some 400,000 visitors in 2005-2006.
Whale-watching attracts some 20% of visitors to Iceland. In 2006, 70,000-80,000 visitors
from Britain alone came to Iceland. Major industries today in Iceland are fish processing,
aluminium smelting, ferrosilicon production, geothermal power, tourism, and
pharmaceuticals (country profiles at <www.fco.gov.uk>).
V. Governance
Iceland has played a pioneering role in international Law of the Sea. The competition of
foreign fishing fleets prompted Iceland to protect its fisheries by extending its territorial
limits. The territorial sea was three miles in 1901, and was extended to four miles in
1952. These extensions were early and bold moves for that time. In 1958, the territorial
sea was extended to 12 miles, then in 1972, to 50 miles. British protests against these
extensions took the form of three `cod wars' (in 1961, 1972 and 1975). In an arbitration
opposing Iceland and Great Britain, the International Court of Justice ruled in favour of
Iceland. Finally, in 1975, Iceland extended its limits to 200 miles. The Ministry of Foreign
Affairs has information on Iceland's international relations (http://www.mfa.is/). Iceland
has at least 8 pieces of legislation for marine conservation and is about to establish its
first major marine conservation area. Iceland works closely with ICES to monitor the size
of fish stocks (www.ices.dk/indexnofla.asp). There are various restrictions on fisheries.
The most common methods are TAC, mesh size and gear restrictions, restrictions on
season length and timing and area closures. Often all methods are used in combination
but depending on species some may be more important for one species than another.
The main aim is to secure sustainable fishing.. The management of Icelandic capelin has
been approached in a multi-species context since 1980 (Astthorsson & Vilhjalmsson
2002). The immature stock is specifically protected from fishing and the needs of cod,
the main predator, are taken into account prior to the final decision on total allowable
catch. Steps have been taken to obtain a better understanding of multi-species
interactions in this LME (Anon. 1997). The EEA (European Economic Area) Agreement
is legally binding for Iceland to harmonize their legislation and regulatory framework with
EU environmental legislation. Iceland is party to UNCLOS and the OSPAR Convention.
The LRTAP agreement on Long-range Transboundary Air Pollution of POPs has not
been ratified by Iceland, but Iceland is party to its protocols on POPs and PAHs. Iceland
is party to MARPOL for prevention of pollution from ships, the London Dumping
Agreement, the Copenhagen Convention on international Nordic country cooperation on
dealing with accidents caused by oils and other hazardous substances, and the Basel
convention to control transboundary movement of hazardous wastes and their disposal.
Iceland is working with the Arctic Council and with PAME to protect the Arctic marine
environment (Iceland, Ministry for the Environment, 2006) and chaired the Arctic Council
2002-2004.
570
41. Iceland Shelf LME
References
Anon. (1997). Multi-species investigations 1992-1995. Hafrannsoknastofnunin Fjolrit 57. (In
Icelandic).
Astthorsoon, O.S. and Vilhjalmsson, H. (2002). Iceland Shelf LME: Decadal assessment and
resource sustainability, p 219-243 in: Sherman, K. and Skjoldal, H.R. (eds), Large Marine
Ecosystems of the North Atlantic Changing States and Sustainability. Elsevier Science,
Amsterdam, The Netherlands.
Astthorsson, O.S. and Palsson, J. (2006). New fish records and records of rare southern fish
species in Icelandic waters in the warm period 1996-2005. International Council for the
Exploration of the Sea, CM 2006/C20, 22 pp.
Astthorsson, O.S., Gislason, A. and Jonsson, S. (2007). Climate variability and the Icelandic marine
ecosystem. Deep-Sea Research II, 54, 2456-2477.
Belkin, I.M. (2004) Propagation of the "Great Salinity Anomaly" of the 1990s around the northern
North Atlantic, Geophys. Res. Lett., 31, L08306, doi:10.1029/2003GL019334.
Belkin, I.M. (2008) Rapid warming of Large Marine Ecosystems, Progress in Oceanography, in
press.
Belkin, I.M., Cornillon, P.C. and Sherman, K. (2008). Fronts in Large Marine Ecosystems of the
world's oceans. Progress in Oceanography, in press.
Belkin, I.M., Levitus, S. Antonov, J. and Malmberg, S.-A. (1998) "Great Salinity Anomalies" in the
North Atlantic, Progress in Oceanography, 41(1), 1-68.
Bonfil, R., Munro, G., Sumaila, U.R., Valtysson, H., Wright, M., Pitcher, T., Preikshot, D., Haggan,
N. and Pauly, D. (1998). Impacts of distant water fleets: an ecological, economic and social
assessment. p. 11-111 In: The footprint of distant water fleet on world fisheries. Endangered
Seas Campaign, WWF International, Godalming, Surrey, 111 p.
Dickson, R.R., Meinke, J., Lamb, H.H., Malmberg, S.A. and Lee, A.J. (1988). The `great salinity
anomaly' in the northern north Atlantic 1968-1982. Progress in Oceanography 20:103-151.
FAO. (1981). Atlas of the living resources of the sea (4th edition). FAO Fisheries Department,
Rome.
Gudmundsson, K. (1998). Long-term variation in phytoplankton productivity during spring in
Icelandic waters. ICES Journal of Marine Science 55:635-643.
Iceland, Ministry of the Environment. 2006. Iceland's National Programme of Action for the
protection of marine environment from land-based activities. Report on the Implementation of
the Global Programme of Action 2001-2006 in Iceland. Accessed online May 2007 at
http://www.eng.umhverfisraduneyti.is.
Jakobsson, J. and Stefansson, G. (1998). Rational harvesting of the cod-capelin-shrimp complex in
the Icelandic Marine Ecosystem. Fisheries Research 37:7-21.
Jonsson, J. (1994). Fisheries off Iceland 1600-1900. ICES Marine Science Symposia 198:3-16.
Malmberg, S.A., Mortensen, J. and Valdimarsson, H. (1999). Decadal scale climate and
hydrobiological variations in Icelandic waters in relation to large scale atmospheric conditions
in the North Atlantic. ICES CM 1999/L:13.
OSPAR. 2005. Reports accessed online at <www.ospar.org/documents/dbase/publications>
www.ospar.org/eng/html/qsr2000/qec2.htm for circulation map
Pauly, D. and Christensen, V. (1995). Primary production required to sustain global fisheries.
Nature 374: 255-257.
Pauly, D. and Watson, R. (2005). Background and interpretation of the `Marine Trophic Index' as a
measure of biodiversity. Philosophical Transactions of the Royal Society: Biological Sciences
360: 415-423.
Prescott, J.R.V. (1989). The political division of Large Marine Ecosystems in the Atlantic Ocean
and some associated seas, p 395-442 in: Sherman K. and Alexander, L.M. (eds), Biomass
Yields and Geography of Large Marine Ecosystems. AAAS Selected Symposium 111.
Westview Press, Boulder, U.S.
Schopka, S.A. (1994). Fluctuation in the cod stock off Iceland during the twentieth century in
relation to changes in the fisheries and the environment. ICES Marine Science Symposia
198:175-193.
Sea Around Us (2007). A Global Database on Marine Fisheries and Ecosystems. Fisheries Centre,
University British Columbia, Vancouver, Canada.http://www.seaaroundus.org
/lme/SummaryInfo.aspx?LME=59
XIII North East Atlantic
571
Skjoldal, H.R., Noji,T.T., Giske, J., Fossaa, J.H., Blindheim, J. and Sundby, S. (1993). Mare
Cognitum. Science plan for research on marine ecology of the Nordic seas (Greenland,
Norwegian, Iceland Seas) 1993-2000. A regional GLOBEC programme with contributions also
to Word Ocean Circulation Experiment and Joint Global Ocean Flux Study. Institute of Marine
Research, Bergen, Norway.
Thordardottir, T. (1984). Primary production north of Iceland in relation to water masses in May-
June 1970-1989. ICES CM 1984/L:20.
UK Foreign & Commonwealth Office (2007) Country profile, Iceland at www.fco.gov.uk
Valtysson, H.Ţ. and Pauly, D. (2003). Fishing down the food web: an Icelandic case study. p. 12-24
in: E. Guđmundsson, and H.Ţ. Valtysson, (eds.) Competitiveness within the Global Fisheries.
Proceedings of a Conference held in Akureyri, Iceland, on April 6-7th 2000. University of
Akureyri, Akureyri, Iceland.
572
41. Iceland Shelf LME
XIII North East Atlantic
573
XIII-42 North Sea LME
M.C. Aquarone and S. Adams
The North Sea LME is situated on the continental shelf of northwestern Europe. It covers
an area of 694,000 km˛, of which 1.94% is protected (Sea Around Us 2007). Besides the
North Sea with an area of 575,000 km2 and average depth of 94 m, this LME includes a
part of the deep-water basin between the Faroes and Shetland Islands. The North Sea
LME includes one of the most diverse coastal regions in the world, with a great variety of
habitats (fjords, estuaries, deltas, banks, beaches, sandbanks and mudflats, marshes,
rocks and islands). Among its many river systems and estuaries are the Thames, Rhine,
Elbe, Sheldt and Ems. A temperate climate and four seasons characterise this LME.
Great Britain, Norway, Sweden, Denmark, Germany, the Netherlands, Belgium and
France are the countries bordering the North Sea. LME book chapters and articles
pertaining to this LME include Daan (1986, 1993) and McGlade (2002). There is a wealth
of data on the North Sea. Information on climatology, and physical, chemical and
biological oceanography was published by McGlade in 2002. ICES issued a report on the
fisheries and fish of this region in August 2008.
I. Productivity
The North Sea LME is a Class II, moderately productive ecosystem (150-300 gCm-2yr-1).
Primary production varies considerably across the LME. The highest primary productivity
occurs in the coastal regions, influenced by terrestrial inputs of nutrients, and in areas
such as the Dogger Bank and tidal fronts. For more information on plankton
communities, benthic, fish and shellfish communities, as well as for food web dynamics
and information about bird communities and marine mammals see McGlade (2002). The
Sir Alister Hardy Foundation for Ocean Science has been conducting Continuous
Plankton Recorder surveys, collecting data from the North Atlantic and the North Sea on
biogeography and ecology of plankton since 1931. The Foundation website reports on
plankton abundance in the North Sea (www.sahfos.ac.uk/).
Oceanic fronts: Up to ten fronts have been distinguished in the North Sea LME from
satellite data (Belkin et al. 2008) (Figure XIII-42.1). The North Atlantic Current enters the
North Sea from the north. Its branches are associated with the Fair Isle Front (FIF) and
Shetland Front (ShF). The Norwegian Coastal Current Front (NCCF) extends along the
Norwegian Coast and separates the low-salinity near-shore waters from Atlantic waters.
Tidal mixing fronts form around Dogger Bank (DBF) and off Flamborough Head (FHF).
The Atlantic waters entering the North Sea via the English Channel form two fronts,
western (WECF) and eastern (EECF) fronts at their contact with resident waters; these
fronts flank the Atlantic inflow. The Frisian Front (FF) origin is related to the fresh outflow
from the Rhein River and Scheldt River. The Skagerrak Front (SkF) is located at the
boundary with the Baltic Sea waters.
North Sea LME SST (Belkin, 2008)(Figure XIII-42.2)
Linear SST trend since 1957: 0.88°C.
Linear SST trend since 1982: 1.31°C.

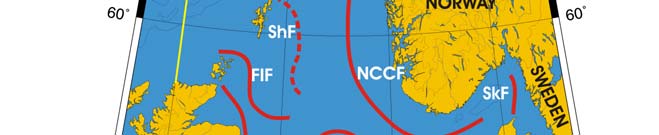
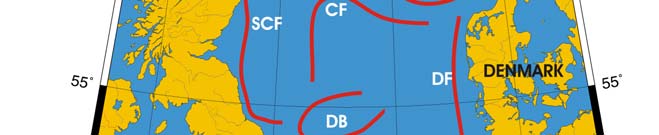
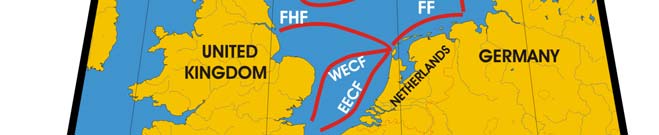
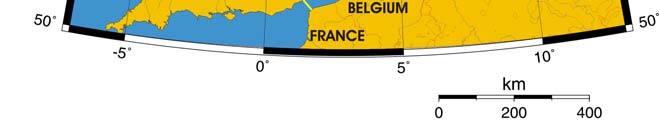
574
42. North Sea LME
Figure XIII-42.1. Fronts of the North Sea LME. CF, Central Front; DBF, Dogger Bank Front; EECF, East
English Channel Front; FF, Frisian Front; FHF, Flamborough Head Front; FIF, Fair Isle Front; NCCF,
Norwegian Coastal Current Front; ShF, Shetland Front; SkF, Skagerrak Front; WECF, West English
Channel Front. Yellow line, LME boundary. After Belkin et al. (2008).
The 50-year long-term warming of this LME was not uniform. In fact, the North Sea
cooled in 1957-1986; this cooling culminated in two cold events of 1979 and 1986 linked
to two consecutive Great Salinity Anomalies, GSAs (Dickson et al., 1988; Belkin et 1998).
The cold event of 1986 was followed by a dramatic rebound by 1.3°C over the next three
years. The third cold event of 1996 was linked to the GSA of the 1990s (Belkin, 2004).
The above decadal-scale events were likely associated with the North Atlantic Oscillation,
NAO. The cold event of 1962-63 may have been associated with a previous GSA, which
is not fully documented because of scarce hydrographic data. The post-1982 warming of
1.31°C makes the North Sea the 2nd fastest warming LME of the last 25 years (after the
Baltic Sea LME).
The ongoing rapid warming of the North Sea will likely have an adverse effect on
recruitment and catches of boreal fish species (Stenevik and Sundby, 2007). In
particular, water temperature in coastal areas of the North Sea is inversely correlated
with cod recruitment and catches (Hannesson, 2007). At the same time, warm-water
species are expected to become more abundant (Stenevik and Sundby, 2007).
XIII North East Atlantic
575
Figure XIII-42.2. North Sea LME annual mean SST (left) and SST anomalies (right), 1957-2006, based on
Hadley climatology. After Belkin (2008).
North Sea LME Chlorophyll and Primary Productivity: The North Sea LME is a Class
II, moderately productive ecosystem (150-300 gCm-2yr-1) (Figure XIII-42.3).
Figure XIII-42.3. North Sea LME trends in chlorophyll a (left) and primary productivity (right), 1998-2006,
from satellite ocean colour imagery; courtesy of K. Hyde.
II. Fish and Fisheries
Fishing is a long-established activity in the North Sea LME and there is a wealth of
fisheries data. The most important species for human consumption represented in the
catch are cod-like fishes (cod, saithe, haddock, etc.), herring, sprat and flatfishes. For
more information on North Sea fishing fleets, see McGlade (2002). Landings from the
industrial fishery consist mainly of sandeels, Norway pout and sprat. There are several
commercially important shellfish species of molluscs and crustaceans, including shrimp,
crab, lobster, oysters, mussels and scallops. The North Sea, on average, supported total
reported landings of over 3 million tonnes per year from the mid 1960s to the early 1990s,
with a peak landing of 4.4 million tonnes in 1968 (Figure XIII-42.4). However, reported
landings have declined consistently since the early 1990s. The value of the reported
landings reached US$3.5 billion (in 2000 US dollars) in 1968, following which it steadily
declined (Figure XIII-42.5).
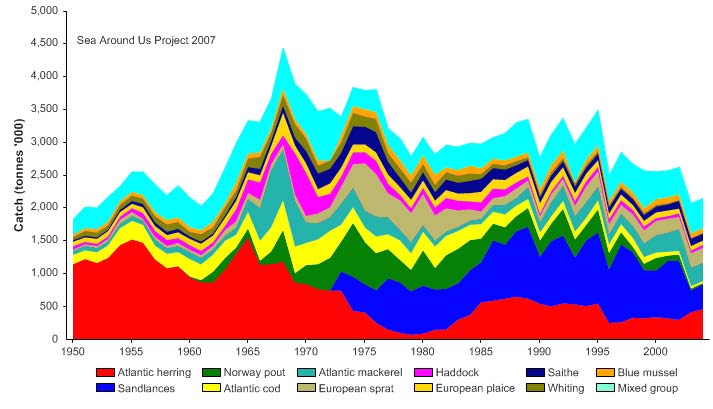
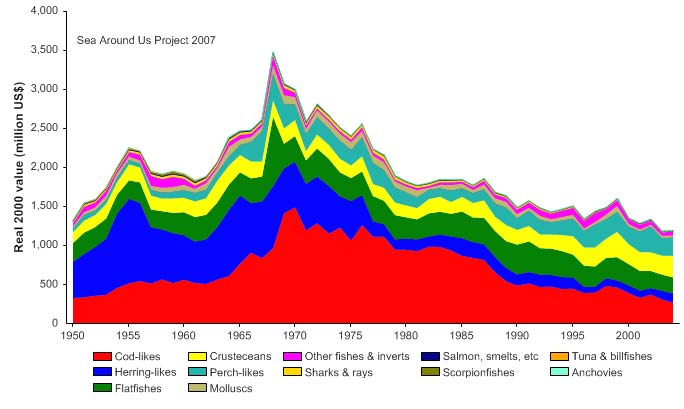
576
42. North Sea LME
Figure XIII-42.4. Total reported landings in the North Sea LME by species (Sea Around Us 2007)
Figure XIII-42.5. Value of reported landings in the North Sea LME by commercial groups (Sea Around
Us 2007)
The primary production required (PPR; Pauly & Christensen 1995) to sustain the reported
landings in this LME reached extremely high level, over 70% of the observed primary
production in the late 1960s, but has declined to less than 40% in recent years (Figure
XIII-42.6). Denmark, Norway and the United Kingdom account for the highest share of
the ecological footprint in this LME. The mean trophic level of the reported landings (i.e.,
the MTI; Pauly & Watson 2005) has shown a steady decline since 1970 (Figure XIII-42.7,
top), an indication of a `fishing down' of the food web in the LME (Pauly et al. 1998). The
FiB index has been on a similar decline over the past three decades (Figure XIII-42.7,
bottom). Both indices thus correspond with the detailed analysis by Froese & Pauly
(2003), which was based on catch data starting in 1903. The Stock-Catch Status Plots,
based on the first analysis of an LME using such plot (Froese and Pauly 2003), indicate
that the numbers of collapsed and overexploited stocks have been increasing, accounting
for close to 80% of all commercially exploited stocks in the LME (Figure XIII-42.8, top). A
majority of the reported landings biomass, particularly in recent years, is supplied by
overexploited stocks (Figure XIII-36.8, bottom).
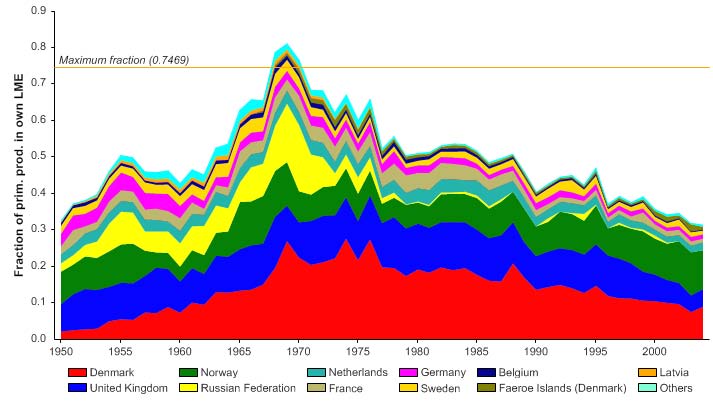
XIII North East Atlantic
577
Figure XIII-42.6. Primary production required to support reported landings (i.e., ecological footprint) as
fraction of the observed primary production in the North Sea LME (Sea Around Us 2007). The `Maximum
fraction' denotes the mean of the 5 highest values.
Figure XIII-42.7. Mean trophic level (i.e., Marine Trophic Index) (top) and Fishing-in-Balance Index
(bottom) in the North Sea LME (Sea Around Us 2007).
The LME is not stable with regard to individual fish species. Changes in the abundance
of commercially important fish stocks have been monitored since the 1950s. All are
heavily exploited and the majority of those exploited for human consumption are
considered to be seriously depleted. In fact, intensive fishing is the primary force driving
the LME. Analytical assessments of all commercially important species are carried out
by ICES (www.ices.dk). Improvements in fishing equipment (more powerful engines,
hydroacoustic equipment, and the purse-seine net in the mid 1960s) have changed the
nature of the fisheries. Various management measures (closures, restrictions on the
number of vessels, fishing gear and time) have been enacted to try to control fishing
mortality, but these are not systematic throughout the LME. The inclusion in the EU of all
riparian countries except Norway led to the development of the Common Fisheries
Policy, the results of which are mixed.
578
42. North Sea LME
0%
100
10%
90
20%
)
80
%
(
s
30%
u
70
at
st
40%
y
60
b
ks
50%
c
50
o
f
st
60%
o
40
er
b
70%
m
30
Nu
80%
20
90%
10
100%0
1950
1960
1970
1980
1990
2000
(n = 4539)
developing
fully exploited
over-exploited
collapsed
0%
100
10%
90
20%
80
)
%
30%
(
70
s
t
u
40%
t
a
60
s
k
50%
t
oc
50
s
60%
by
h
40
t
c
a
70%
C
30
80%
20
90%
10
100%0
1950
1960
1970
1980
1990
2000
(n = 4539)
developing
fully exploited
over-exploited
collapsed
Figure XIII42.8. Stock-Catch Status Plots for the North Sea LME, showing the proportion of developing
(green), fully exploited (yellow), overexploited (orange) and collapsed (purple) fisheries by number of
stocks (top) and by catch biomass (bottom) from 1950 to 2004. Note that (n), the number of `stocks', i.e.,
individual landings time series, only include taxonomic entities at species, genus or family level, i.e.,
higher and pooled groups have been excluded (see Pauly et al, this vol. for definitions).
III. Pollution and Ecosystem Health
Both offshore and land-based activities have a significant effect on the North Sea LME.
Eutrophication is now a major environmental issue arising from the general increase in
nutrient discharges from rivers, land run-off and the atmosphere, largely resulting from
sewage effluents, leaching from agricultural land, contributions from rural populations and
atmospheric nitrogen deposition. Hazardous substances, oily wastes and slicks are a
problem for birds and marine mammals. Alien species have been introduced into the
North Sea ecosystem through ballast water and shipping. For more information on the
impacts of non-indigenous species, coastal habitats, the ecological impacts of pollution
and the effects of marine industries (hazardous and radioactive substances, oil and oily
wastes, litter and dumping), see McGlade (2002). An assessment of the health of the
North Sea LME was initiated in 1987 as part of the international ministerial activities to
address concerns over the impact of human activities and climate change on the
ecosystem. In 2000, ICES reviewed the effects of different types of fisheries on North
Sea benthic ecosystems. Effective on 11 August 2007, the EU Directive 2005/33/EC on
the North Sea SECA (Sulphur Emission Control Area) came into force to regulate sulphur
emissions from all ship fuels not to exceed 1.50% m/m/ (www.imo.org and
www1.veristar.com).
XIII North East Atlantic
579
IV. Socioeconomic Conditions
The North Sea LME plays a key role in one of the world's major economic regions.
Approximately 185 million people live in highly industrialised countries, the United
Kingdom, Norway, Sweden, Denmark, Germany, the Netherlands, Belgium, France, the
Czech and Slovak Republics, Switzerland, and Austria, which have part or the totality of
their territory in the catchment area of the North Sea (Ducrotoy 2003). The fishing sector
is important in terms of employment, with about 260,000 fishers directly involved in
fishing. Currently, the European Union fishing industry comprises 97,000 vessels. The
industry supports additional significant numbers of jobs in processing, packing,
transportation, marketing, ship-building, fishing gear manufacture and servicing. The
LME is also a source of economic resources other than fisheries. The North Sea
supports highly productive extractive industries of hydrocarbons, sand and gravel. It is a
transport highway as well as a sink for waste and pollution. The Straits of Dover and the
North Sea itself are among the most heavily-used sea routes in the world, and are
serviced by large commercial ports. Recreation and tourism are important activities in
the LME. Large wind parks are in advanced planning stages.
In 2000, the EEA reported that approximately 164 million people lived in the North Sea
catchment area, and use the coastline and the marine environment. Due to increased
population growth and industrial activity, many of its resources are close to over-
exploitation. The fisheries sector is under increasing pressure to allow fish stocks to
recover. The northern seaboard will continue to supply at least 50% of the total energy
requirements of the European Union, with increases in natural oil and gas production
from the North Sea and off Scotland.
V. Governance
A new Marine Strategy Framework Directive was recently enacted which promotes and
integrates environmental considerations into all relevant policies areas and which forms
the basis for a future Maritime Policy for the EU. The exploitation of natural marine
resources in the North Sea is governed by a number of conventions, declarations and
regulations. These include the Geneva Convention on the Continental Shelf (1958), the
joint declaration of the EU Commission on the coordinated extension of jurisdiction in the
North Sea through the establishment of EEZs (1992), and European Commission
directives and regulations within the Common Fisheries Policies. All in all, a large
number of instruments from international bodies, such as the UN, IMO and the EU, exist
to conserve natural resources, protect the environment and ensure health and safety
standards. The European Community laws protect the environment in terms of air and
noise, chemicals and industrial risks, nature conservation, waste and water. The
European Union "North Sea Programme Progress Report" (2006) offers insight into social
and environmental activities calculated to build capacity to enable sustainable
management of existing resources in rural and urban areas around the North Sea. The
OSPAR Commission has information on the 1992 Convention and ministerial
declarations on the ecosystem approach (www.ospar.org/eng/html/ welcome.html). The
Oslo and Paris Conventions (OSPARCOM) contain a number of supporting legislative
and policy instruments. The Esbjerg Conference in 1995 enlarged the focus of protection
to wildlife beyond territorial waters, promoted sustainable fishery management, and
pushed for more research on the effects of chemicals on reproductive systems. It is
expected that future conferences will be held at 5-year intervals (see Reid 1999). The
principle of precautionary management has been successfully introduced in the North
Sea fisheries, particularly for herring. For more information on governance of European
fisheries, and on political and legal regimes, see McGlade (2002).
580
42. North Sea LME
References
Anon. (1994). Report of the study group on seabird/fish interactions. ICES CM 1994/L:3.
Becker, G.A. and Pauly, D. (1996). Sea surface temperature changes in the North Sea and their
causes. ICES Journal of Marine Science 53:887-898.
Belkin, I.M. (2004) Propagation of the "Great Salinity Anomaly" of the 1990s around the northern
North Atlantic, Geophysical Research Letters, 31(8); art. no.-L08306 (DOI:10.
1029/2003GL019334)
Belkin, I.M. (2008) Rapid warming of Large Marine Ecosystems, Progress in Oceanography, in
press.
Belkin, I.M., Cornillon, P.C., and Sherman, K. (2008). Fronts in large marine ecosystems of the
world's oceans. Progress in Oceanography, in press.
Belkin, I.M., Levitus, S., Antonov, J. and Malmberg, S.A. (1998). "Great Salinity Anomalies" in the
North Atlantic. Progress in Oceanography 41:1-68.
Daan, N. (1986). Results of recent time-series observations for monitoring trends in Large Marine
Ecosystems with a focus on the North Sea, p 145-174 in: Sherman, K. and Alexander, L.M.
(eds), Variability and Management of Large Marine Ecosystems. Westview Press, Boulder, U.S.
Daan, N. (1993). Simulation study of effects of closed areas to al fishing, with particular reference
to the North Sea ecosystem, p 252-258 in: Sherman, K. Alexander, L.M. and Gold, B.D. (eds),
Large Marine Ecosystems Stress, Mitigation, and Sustainability. AAA Press, Washington
D.C., U.S.
Dickson, R.R., Meincke, J., Malmberg, S.A. and Lee, A.J. (1988). The `great salinity anomaly' in the
northern North Atlantic 1968-1982. Progress in Oceanography 20:103-151.
Ducrotoy, J-P. (2003). Education challenges in the North Sea area. Marine Pollution Bulletin 47, 1-
6, January-June 2003:246-252.
EU North Sea Programme Progress Report (2006) at www.northsearegion.eu/Userfiles/File/
Publications/ Progress%20Report.pdf
Froese, R. and Pauly, D. (2003). Dynamik der Überfischung. p. 288-295. in: Lozán, J.L., Rachor,
E., Reise, K., Sündermann, J. and von Westernhagen, H. (eds) Warnsignale aus Nordsee und
Wattenmeer eine aktuelle Umweltbilanz. GEO, Hamburg.
ICES (2008). Report of the Workshop on historical data on fisheries and fish (WKHIST), 11-15
August 2008, ICES Headquarters, Copenhagen. ICES CM 2008/RMC:04. 54 pp.
IMO (2007). Briefing 44, 21 November 2007, North Sea SECA regulations
(www.imo.org/About/mainframe.asp?topic_id=1472&doc_id+8719)
McGlade, J.M. (2002). The North Sea Large Marine Ecosystem, p 339 - 412 in: Sherman, K. and
Skjoldal, H.R. (eds), Large Marine Ecosystems of the North Atlantic Changing States and
Sustainability. Elsevier Science, Amsterdam, The Netherlands.
Pauly, D. and Christensen, V. (1995). Primary production required to sustain global fisheries.
Nature 374: 255-257.
Pauly, D. and Watson, R. (2005). Background and interpretation of the `Marine Trophic Index' as a
measure of biodiversity. Philosophical Transactions of the Royal Society: Biological Sciences
360: 415-423.
Pauly, D., Christensen, V., Dalsgaard, J., Froese R. and Torres, F.C. Jr. (1998). Fishing Down
Marine Food Webs. Science 279: 860-863.
Reid, P.C. (1999). The North Sea Ecosystem - Status Report, p 476 489 in: Kumpf, H.,
Steidinger, K. and Sherman, K. (eds), The Gulf of Mexico Large Marine Ecosystem:
Assessment, Sustainability, and Management. Blackwell Science, Malden, U.S.
Sea Around Us (2007). A Global Database on Marine Fisheries and Ecosystems. Fisheries Centre,
University British Columbia, Vancouver, Canada. www.seaaroundus.org/lme/
SummaryInfo.aspx?LME=22
XIII North East Atlantic
581
XIII-43 Norwegian Sea LME
M.C. Aquarone and S. Adams
The Norwegian Sea LME is a western boundary ecosystem situated off the West Coast
of Norway. It covers about 1.12 million km2, of which 0.08% is protected, and contains
about 0.13% of the world's sea mounts (Sea Around Us 2007). A sub-arctic climate
characterises this LME. The Iceland-Faroe Ridge separates the relatively warm waters
of the Northeast North Atlantic from the cold Arctic deep water of the Norwegian Sea. A
boundary current flows along the edge of the Norwegian Shelf into the Arctic region. The
cold and low salinity East Icelandic Current flows southeast towards the Norwegian
Basin. LME book chapters and articles pertaining to this LME include Ellertsen et al.
(1990), Blindheim & Skjoldal (1993) and Skjoldal et al. (2004).
I. Productivity
The Norwegian Sea LME is considered a Class II, moderately productive ecosystem
(150-300 gCm-2yr-1). All the major marine phytoplankton groups are represented in the
Norwegian Sea. Significant temporal and spatial variations in phytoplankton distribution
and productivity in the open waters of the Norwegian Sea are described by F. Rey
(2004). Winter is characterised by very low phytoplankton biomass ,0.05 mg m-3.. The
end of the winter period is marked by the appearance of small diatoms (e.g.
Fragiliaropsis pseudonana and Thalassiosira binoculata var. raripora (Dale et al. 1999)
that become important components of the spring bloom. The dominant species during
this pre-bloom period advect to the area with Atlantic water from the south, or overwinter
in the water column above the permanent pycnocline (Rey 2004). The spring bloom
occurs when increased light warms the upper layer, producing a deep seasonal
pycnocline and an upper mixed layer. The spring bloom is dominated by early diatom
production and later by small flagellates, especially Phaeocystis pouchetii, that can
dominate the phytoplankton community after the diatom spring bloom (Rey 2004).
There is a tight coupling of primary with secondary production, especially during the
spring bloom, in the Norwegian Sea. The reproductive activity of the main copepod in the
Norwegian Sea, Calanus finmarchicus, is closely related to, and exerts grazing pressure
on, the spring phytoplankton bloom (Niehoff and Hirche 2000). In the post-bloom period,
coccolithophorids, dinoflagellates and other flagellates dominate the phytoplankton
community while the proportion of diatoms falls. Heterotrophic flagellates such as
Leucocryptos marina appear at this time (Rey 2004). In the Autumn, one or more
secondary but smaller blooms occurs, together with a reduction in zooplankton grazing
pressure. Despite an increase in nutrients by October, diminished light inhibits
production to less than 100 mg C m-2 day-1 in September and decreasing into winter (Rey
2004).
Oceanic fronts (Belkin et al. 2008)(Figure XIII-43.1): The North Atlantic Current Front
(NACF) exists year-round between warm and salty Atlantic waters transported by the
current into the Norwegian Sea, and resident waters of the Norwegian Sea (Belkin et al.
2008, Kostianoy et al. 2005) (Figure XIII-43.1). The Norwegian Coastal Current Front
(NCCF) hugs Norway's coast. This current carries northward low-salinity waters from the
North Sea with an admixture of the Baltic Sea waters. The Arctic Front (AF) follows the
Mid-Atlantic Ridge meridionally up to Jan Mayen, turns NE along Mohns Ridge, then
turns NNW along Knipovich Trough. The Iceland-Faroes Front (IFF) runs near the LME's
southern boundary, spawning warm and cold eddies responsible for the bulk of cross-


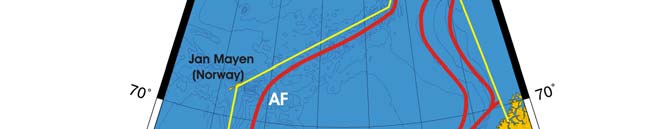
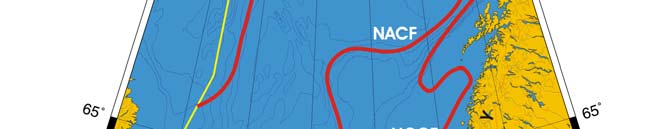
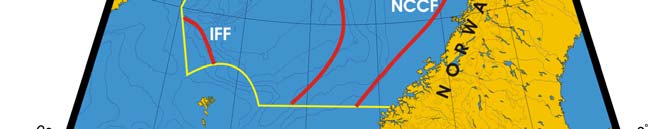
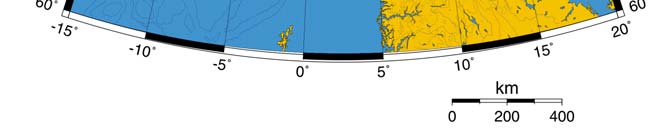
582
43. Norwegian Sea LME
frontal exchange of heat, salt and nutrients. Decadal-scale `Great Salinity Anomalies'
travelled across this LME in the 1970s, 1980s and 1990s (Belkin et al.1998, Belkin 2004).
Figure XIII-43.1. Fronts of the Norwegian Sea LME. AF, Arctic Front; IFF, Iceland-Faroes Front; NACF,
North Atlantic Current Front; NCCF, Norwegian Coastal Current Front. Yellow line, LME boundary (after
Belkin et al. 2008).
Norwegian Sea LME (after Belkin 2008)
Linear SST trend since 1957: 0.22°C.
Linear SST trend since 1982: 0.85°C.
The thermal record of the Norwegian Sea since 1957 was non-monotonous and
consisted of (1) cooling until the breakpoint of the all-time minimum in 1979, followed by
(2) warming until present, during which SST rose by 1.3°C over 27 years. This is a
relatively fast warming rate, consistent with other fast-warming LMEs that surround
Europe. The SST maxima of 1961, 1974 and 1990 seem to correspond to the SST
maxima of 1961, 1973 and 1989-90 in the Barents Sea LME, which is not surprising
given links between circulations in these seas. Thermal manifestations of the Great
Salinity Anomalies, GSA (Dickson et al., 1988; Belkin et al., 1998; Belkin, 2004), are not
evident here, apparently obscured by larger thermal signals, although salinity


XIII North East Atlantic
583
manifestations are distinct. Year-to-year variability in the Norwegian Sea is relatively
small compared to sub-decadal and decadal variability, which strongly modulates long-
term trends. The recent warming of the Norwegian Sea is expected to benefit cod
fisheries owing to a positive correlation between temperature and cod recruitment and
catches, in this area (Hannesson, 2007). Under the present warming conditions, the
optimum temperature for fish is shifting north, from the northern part of West Norway
towards the Helgeland coast (Stenevik and Sundby, 2007).
Figure XIII-43 2. Norwegian Sea LME annual mean SST (left) and annual SST anomalies (right), 1957-
2006 from Hadley climatology. After Belkin (2008).
Norwegian Shelf LME Chlorophyll and Primary Productivity: The Norwegian Sea
LME is considered a Class II, moderately productive ecosystem (150-300 gCm-2yr-1).
Figure XIII-43-3. Norwegian Sea LME trends in chlorophyll a (left) and primary productivity (right), 1998-
2006, from satellite ocean colour imagery. Values are colour coded to the right hand ordinate. Figure
courtesy of J. O'Reilly and K. Hyde. Sources discussed p. 15 this volume..
II. Fish and Fisheries
The Norwegian Sea LME has a complex fishery history with concomitant influences of
ecological anomalies, high fishing mortality and early implementation of management
measures. Reported landings in the LME include Atlantic herring, capelin Atlantic cod,
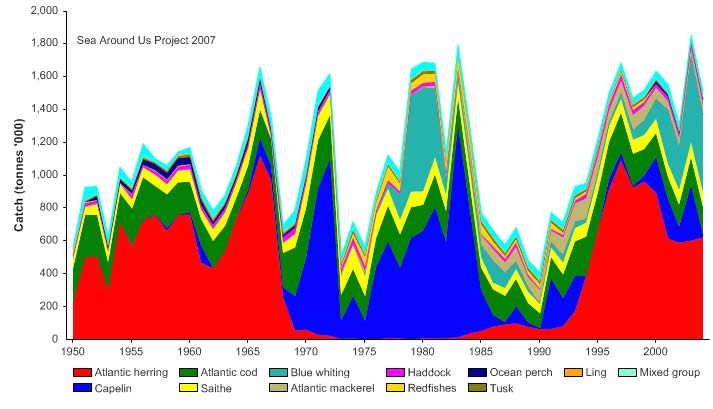
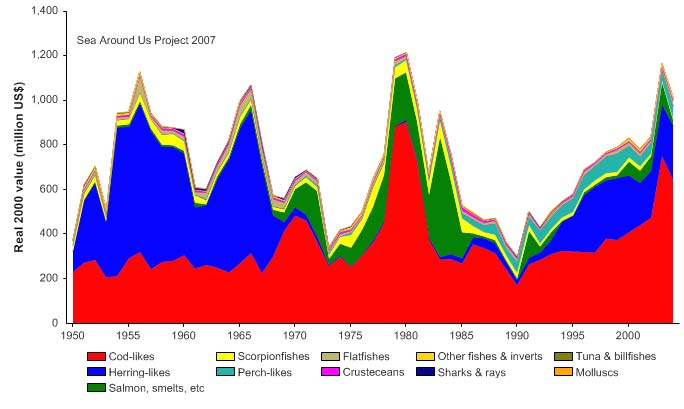
584
43. Norwegian Sea LME
saithe and blue whiting. While Capelin does not occur in the Norwegian Sea, Norway
has agreed that the use of resources in Norway's neighbouring Arctic seas shall not
cause species to become endangered or extinct. Populations of species that are
currently believed to be endangered or adversely affected by land use, harvesting or
pollution shall be conserved and if possible restored. According to the Norwegian Polar
Institute brief of 30 May 2008, capelin quotas are in place in accordance with the
recommendation from the International Council for the Exploration of the Sea (ICES).
Reported landings show significant fluctuations in both total landed biomass and
composition, particularly for herring and capelin (Figure XIII-43.4). In recent years, the
total landings increased from less than half a million tonnes in 1990 to 1.5 million tonnes
in 2004. The value of the reported landings peaked in 1980 at US$ 1.2 billion (in 2000
real US dollars), mainly due to the high blue whiting landings (Figure XIII-43.5).
Figure XIII-43.4. Total reported landings in the Norwegian Sea LME by species (Sea Around Us 2007)
Figure XIII-43. 5. Value of reported landings in Norwegian Sea LME by commercial groups (Sea Around
Us 2007)
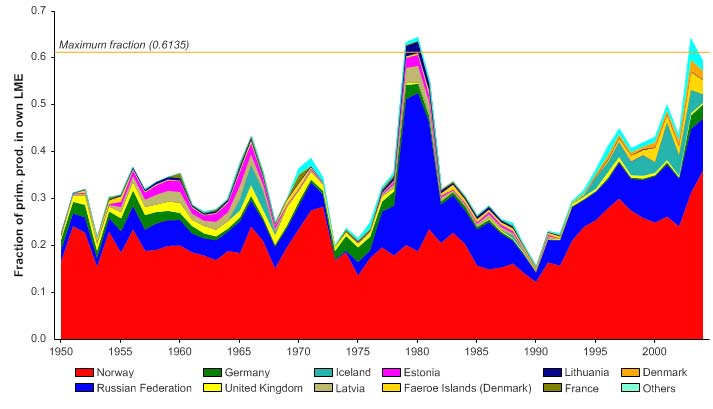
XIII North East Atlantic
585
The primary production required (PPR; Pauly & Christensen 1995) to sustain the reported
landings in this LME reached above 60% of the observed primary production in the late
1970s and again in the 2000s (Figure XIII-43.6). Norway and Russia account for the
largest share of the ecological footprint in this LME.
Figure XIII-43.6. Primary production required to support reported landings (i.e., ecological footprint) as
fraction of the observed primary production in the Norwegian Sea LME (Sea Around Us 2007). The
`Maximum fraction' denotes the mean of the 5 highest values.
The mean trophic level of the reported landings (i.e., the MTI; Pauly & Watson 2005) and
the FiB index remained roughly stable (albeit with considerable year-to-year fluctuation)
over the reported period (Figure XIII-43.7), which may seen as surprising, given the
strong fluctuation of species composition in the landings. One possible explanation may
be that the key species in the ecosystem are fluctuating in such a way that a balance is
maintained in terms of feeding guilds (zooplanktivores, piscivores, etc).
Figure XIII-43.7. Mean trophic level (i.e., Marine Trophic Index) (top) and Fishing-in-Balance Index
(bottom) in the Norwegian Sea LME (Sea Around Us 2007).
586
43. Norwegian Sea LME
The fluctuations in species composition of the reported landings strongly affect the Stock-
Catch Status Plots, which show that the number of collapsed stocks have been
consistently increasing, to about 80% of the commercially exploited stocks, in the LME
(Figure XIII-43.8, top). A majority of the catch is also supplied by collapsed stocks
(Figure XIII-43.8, bottom).
1950
1960
1970
1980
1990
2000
0%
100
10%
90
20%
)
80
%
(
s
30%
u
70
at
st
40%
y
60
ks b
50%
c
o
50
f
st
60%
o
40
er
b
70%
m
30
Nu
80%
20
90%
10
100%0
1950
1960
1970
1980
1990
2000
(n = 2391)
developing
fully exploited
over-exploited
collapsed
1950
1960
1970
1980
1990
2000
0%
100
10%
90
20%
80
)
%
30%
(
70
s
u
at
40%
60
k st
c
50%
o
50
st
y
60%
b
h
40
t
c
a
70%
C
30
80%
20
90%
10
100%0
1950
1960
1970
1980
1990
2000
(n = 2391)
developing
fully exploited
over-exploited
collapsed
Figure XIII-43.8. Stock-Catch Status Plots for the Norwegian Sea LME, showing the proportion of
developing (green), fully exploited (yellow), overexploited (orange) and collapsed (purple) fisheries by
number of stocks (top) and by catch biomass (bottom) from 1950 to 2004. Note that (n), the number of
`stocks', i.e., individual landings time series, only include taxonomic entities at species, genus or family
level, i.e., higher and pooled groups have been excluded (see Pauly et al, this vol. for definitions).
In the 1960s and 1970s, fishing pressure increased as a result of purse seining
technology. Herring was depleted, which eventually led to its collapse. After two decades
of very low abundance, the herring stock has recovered to a total biomass of over 10
millions tonnes. The herring stock overwinters in the Vestfjord and feeds throughout the
Norwegian Sea in summer. The main spawning grounds are off Mřre, with smaller
populations spawning off of Iceland and southern Norway. For a map of the distribution of
the Arcto-Norwegian cod, see Ellertsen et al. (1990, p. 20). The spawning areas of cod
are located in the Norwegian coastal current, in coastal bays and near offshore banks
(see Ellertsen et al. 1989). Temperature is an important factor affecting cod recruitment.
The data strongly suggests that a high temperature is a necessary condition for the
formation of a strong year-class. Capelin migrates out of the Barents Sea into the
Norwegian Sea. For more information on the influence of the marine environment on fish
recruitment and biomass yields, see Ellertsen et al. (1990).
XIII North East Atlantic
587
III. Pollution and Ecosystem Health
Some pollution issues in this LME stem from Norway's offshore oil industry, and the risk
of oil spills in Norwegian waters. Poor weather and substandard ships have caused
groundings and losses. In Norway, the Norwegian Pollution Control Authority is placed
under the Ministry of the Environment. This agency aims to promote sustainable
development. For more information about pollutants in the Arctic region including the
Norwegian Sea, see AMAP (see the Barents Sea LME). The PAME Working Group of
the Arctic Council is involved in assessing changing states of Arctic environments (see
also Governance). The PAME work plan (2004-2006) will identify indicators of
ecosystem health and ecosystem objectives for the Arctic LMEs including the Norwegian
Sea. For information on the protection and conservation of marine biodiversity and
ecosystems, eutrophication, hazardous and radioactive substances see the OSPAR
website at www.ospar.org/.
IV. Socioeconomic Conditions
The fisheries industry is important to coastal Norway's economy. Norway exports fish
and fish products to more than 150 countries world-wide. The fishing industry in Norway
is divided into a marine and an aquaculture sector. The former employs some 15,000
fishermen at sea and 12,000 people in 500 fish plants along the coast. The aquaculture
industry employs some 6,000 people, with fish farms all along the Norwegian north coast.
PAME Working Group has information on the small indigenous and non-indigenous
communities living in the Arctic that are heavily dependent on the Arctic living marine
resources (see the Barents Sea LME). Lidunn Mosaker reports in Fiskeriforskning of 6-
08-2007 that since 2000, almost 4,000 jobs in the fishing industry have disappeared. The
OSPAR Commission has information on the offshore oil and gas industry, and the
ecosystem approach to the management of human activities (www.ospar.org/).
Rigzone.com, oil and gas industry news, reports on 4 December 2007 that StatoilHydro
secured 6 seismic vessels for work offshore Norway. This deal valued at NOK 1.8 billion,
Bjarte Ydstebř, VP for drilling and well acquisitions for StatoilHydro, says will give the
company a better foundation for finding drilling targets on the NCS.
V. Governance
More than 20 treaties and agreements cover the Arctic area. Norway established an EEZ
in 1977 and recently introduced protective measures for the reefs of cold water corals on
the continental slope. It has negotiated a series of agreements with neighbouring
countries, including Russia, to decide on management measures and allocation of quotas
on shared fish stocks. Several national measures for the management of the Norwegian
Sea LME have been implemented in Norway in accord with Norway's activities in the
Arctic Council, ICES and OSPAR. The ICES symposium on the changing states of LMEs
in the North Atlantic was held in Norway in 1999.
References
ACIA (2004). Arctic Climate Impact Assessment. Impacts of a warming Arctic. Overview report.
http://amap.no/workdocs/index.cfm?dirsub=%2FACIA%2Foverview.
Belkin, I.M. (2004) Propagation of the "Great Salinity Anomaly" of the 1990s around the northern
North Atlantic, Geophysical Research Letters,
31(8); art. no.-L08306
(DOI:10.1029/2003GL019334).
Belkin, I.M. (2008). Rapid warming of Large Marine Ecosystems. Progress in Oceanography, in
press.
588
43. Norwegian Sea LME
Belkin, I.M., Cornillon, P.C., and Sherman, K. (2008). Fronts in large marine ecosystems of the
world's oceans: An atlas. Progress in Oceanography, in press.
Belkin, I.M., Levitus, S., Antonov, J. and Malmberg, S.A. (1998). "Great Salinity Anomalies" in the
North Atlantic. Progress in Oceanography 41:1-68.
Blindheim, J. and Skjoldal, H.R. (1993). Effects of climatic changes on the biomass yield of the
Barents Sea, Norwegian Sea, and West Greenland Large Marine Ecosystems, p 85-198 in:
Sherman, K., Alexander, L.M. and Gold, B. (eds), Large Marine Ecosystems: Stress,
Mitigation, and Sustainability. AAAS, Washington D.C., U.S.
Dale, T., Rey, F. and Heimdal, B.R. 1999. Seasonal development of phytoplankton at a high-
latitude oceanic site. Sarsia 84: 419-435.
Dickson, R.R., Meincke, J., Malmberg, S.A. and Lee, A.J. (1988). The `great salinity anomaly' in the
northern North Atlantic 1968-1982. Progress in Oceanography 20:103-151.
Dragesund, O., Hamre, J. and Ulltang, O. (1980). Biology and population dynamics of the
Norwegian spring-spawning herring, in: Saville, A. (ed), The Assessment and Management of
Pelagic Fish Stock. Rapports et Proces-Verbaux des Reunions, Conseil International pour
l'Exploration de la Mer 177:43-71.
Ellertsen, B., Fossum, P., Solemdal, P. and Sundby, S. (1989). Relation between temperature and
survival of eggs and first-feeding larvae of northeast Arctic cod (Gadus Morhua L). Rapports et
Proces-Verbaux des Reunions, Conseil International pour l'Exploration de la Mer 191:209-219.
Ellertsen, B., Fossum, P., Solemdal, P., Sundby, S. and Tilseth, S. (1990). Environmental influence
on recruitment and biomass yields in the Norwegian Sea Ecosystem, p 19-35 in: Sherman, K.,
Alexander, L.M. and Gold, B. (eds), Large Marine Ecosystems: Patterns, Processes, and
Yields. AAAS, Washington D.C., U.S.
Hannesson, R. (2007) Geographical distribution of fish catches and temperature variations in the
northeast Atlantic since 1945, Marine Policy, 31(1), 32-39.
Mosaker, L. (2007) Reduction in loss of workplaces. Fiskeriforskning At http://en.fiskforsk.norut.no
/fiskeriforskning /nyheter/nyhetsarkiv/mindre_tap_av_arbeidsplasser
Furnes, G.K. and Sundby, S. (1980). Upwelling and wind induced circulation in Vestfjorden, in:
Saetre, R. and Mork, M. (eds), Proceedings from Norwegian Coastal Current Symposium.
University of Bergen, Geilo, Norway, 9-12 September 1980.
Hamre, J. (1988). Some aspects of the interrelation between the herring in the Norwegian Sea and
the stocks of capelin and cod in the Barents Sea. ICES CM 1988/H: 42.
Hamre, J. (1994). Biodiversity and exploitation of the main fish stocks in the Norwegian-Barents
Sea ecosystem. Biodiversity and Conservation 3:473-492.
Hamre, J. and Hatlebakk, E. (1998). System Model (Systmod) for the Norwegian Sea and the
Barents Sea, p 93-115 in: Rřdseth, T. (ed), Models for Multispecies Management. Physica-
Verlag.
Kostianoy, A.G., Nihoul, J.C. and Radionov, V.B. (2004). Physical Oceanography of Fronal Zones
in the Subarctic Seas. Elsevier Oceanography Series 71. Amsterdam, The Netherlands.
Misund, O.A., Vilhjálmsson, H., Jákupsstovu, S.H., Röttingen, I., Belikov, S., Astthorsson, O.S.,
Blindheim, J., Jónsson, J., Krysov, A., Malmberg, S.A. and Sveinbjörnsson, S. (1998).
Distribution, migration and abundance of Norwegian spring-spawning herring in relation to
temperature and zooplankton biomass in the Norwegian Sea as recorded by coordinated
surveys on spring and summer 1996. Sarsia 83:117-127.
Niehoff, B. and Hirche, H.-J. 2000. The reproduction of Calanus finmarchicus in the Norwegian Sea
in Spring. Sarsia, 85(1):15-22.
Niehoff, B., Klenke, U., Hirche, H-J., Irigoien, X., Head, R. and Harris, R. (1999). A high frequency
time series at Wethership M, Norwegian Sea, during the 1997 spring bloom: The reproductive
biology of Calanus finmarchicus. Marine Ecology Progress Series 176:81-92.
Norwegian Polar Institute (2008) Capelin: quota and harvest. www.environment.no/Mal-og-
nokkeltall/Mal-og-nokkeltall/Pol
Pauly, D. and Christensen, V. (1995). Primary production required to sustain global fisheries.
Nature 374: 255-257.
Pauly, D. and Watson, R. (2005). Background and interpretation of the `Marine Trophic Index' as a
measure of biodiversity. Philosophical Transactions of the Royal Society: Biological Sciences
360: 415-423.
Rey, F. (2004) Phytoplankton: The grass of the sea. 97-136 in Skjoldal, H.R. The Norwegian Sea
Ecosystem. Institute of Marine Research. Tapir Academic Press, Bergen, Norway.
Rey, F. (2004). Phytoplankton: The grass of the sea. 97-136 in Skjoldal, H-R, ed. The Norwegian
Sea Ecosystem. Tapir Academic Press, Trondheim.
XIII North East Atlantic
589
Sea Around Us (2007). A Global Database on Marine Fisheries and Ecosystems. Fisheries Centre,
University British Columbia, Vancouver, Canada.
http://www.seaaroundus.org/lme/SummaryInfo.aspx?LME=21
Shevelev, M.S., Tereschchenko, V.V. and Yaragina, N.A. (1987). Distribution and behaviour of
demersal fishes in the Barents and Norwegian Seas, and the factors influencing them, p 181-
190 in: Loeng, H. (ed), The Effect of Oceanographic Conditions on Distribution and Population
Dynamics of Commercial Fish Stocks in the Barents Sea. Proceedings of the 3rd Soviet-
Norwegian Symposium, Murmansk, 26-28 May 1986. Institute of Marine Research, Bergen,
Norway.
Skjoldal, H.R., Saetre, R., Faerno, A, Misund O-A and Rottingen, I., editors. (2004). The Norwegian
Sea Ecosystem. Institute of Marine Research. Tapir Academic Press, Bergen, Norway.
Stenevik, E.K., and Sundby, S. (2007) Impacts of climate change on commercial fish stocks in
Norwegian waters, Marine Policy, 31(1), 19-31.
Sundby, S. and Bratland, P. (1987). Spatial distribution and production of eggs from northeast
Arctic cod at the Coast of Northern Norway 1983-1985. Fisken og Havet 1:1-58. (In
Norwegian).
Tjelmeland, S. and Bogstad, B. (1998). System Model (Systmod) for the Norwegian Sea and the
Barents Sea, p 69-91 in Rřdseth, T. (ed), Models for Multispecies Management. Physica-
Verlag.
590
43. Norwegian Sea LME