VIII EAST ASIAN SEAS
VIII-11 Gulf of Thailand LME
VIII-12 Indonesian Sea LME
VIII-13 North Australian Shelf LME
VIII-14 NW Australian Shelf LME
VIII-15 South China Sea LME
VIII-16 Sulu-Celebes Sea LME
VIII-17 West-Central Australian
Shelf LME
254
VIII-11 Gulf of Thailand LME
S. Heileman and R. Chuenpagdee
The Gulf of Thailand LME is located in Southeast Asia and bordered by Cambodia,
Malaysia, Thailand and Vietnam. It covers a surface area of about 400,000 km2, of which
0.80% is protected, and contains about 0.46% of the world's coral reefs and 18 major
estuaries (Sea Around Us 2007). The mean depth is 45 m and maximum depth 80 m
(Piyakarnchana 1989, 1999). The tropical climate is governed by the northeast and
southwest monsoon regimes, which have profound effects on the conditions within the
Gulf (Piyakarnchana 1989, 1999). Geographically, the LME can be divided into the inner
and outer Gulf. The inner Gulf is primarily influenced by river outflow while the outer Gulf
is influenced by seawater intrusion from the South China Sea. Water circulation is
complex and influenced by tides and wind as well as differences in water densities.
These and other aspects of the oceanography and biogeochemical characteristics are
discussed in Wyrtki (1961) and Longhurst (1998). Book chapters and reports pertaining
to this LME are by Piyakarnachana (1989, 1999), Talaue-McManus (2000), Pauly &
Chuenpagdee (2003) and UNEP (2005).
I. Productivity
This LME is considered a Class I, highly productive ecosystem (>300 gCm-2yr-1). Its high
primary production is the result of high nutrient input through rivers and from agricultural
fertilisers, household sewage and shrimp farms (Piyakarnchana 1999). The Chao Phraya
watershed is the largest watershed in Thailand, covering approximately 35% of the
nation's land, and draining an area of 157,924 km˛. Nutrient content and dissolved
oxygen levels vary seasonally in the inner Gulf, with most nutrients except nitrate being
higher and oxygen concentration being lower, in the rainy season. Peaks in
phytoplankton densities are correlated with the rainy season. Higher productivity also
occurs close to estuaries. Increasing input of nutrients is leading to the occurrence of
phytoplankton blooms, including Harmful Algal Blooms (HABs) (Piyakarnchana 1999).
The coastal development in the GoT has been very rapid during the last decade
especially for medium and small industries. Shrimp farming, on the other hand, has been
largely terminated in the inner Gulf area. This is likely to affect the productivity in the
LME.
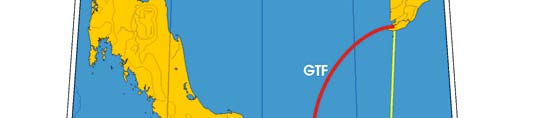
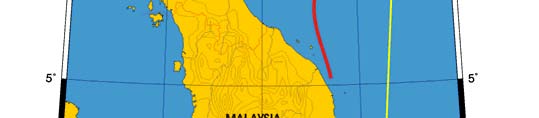
Oceanic fronts: The Gulf of Thailand Front (GTF) is the only major front within this LME
located near its boundary, at the entrance to the Gulf (Figure VIII-11.1). This front is
largely a salinity front between low-salinity waters of the Gulf, diluted by the Mekong
River outflow, and the saline waters of the South China Sea. The salinity contrast
between the Gulf waters and South China Sea waters varies seasonally and
interannually depending on the Mekong River discharge and the South China Sea
circulation that brings Mekong River waters into the Gulf. This contrast can be as high as
3 ppt across the front (Belkin & Cornillon 2003, Belkin et al. 2008). The attendant thermal
front has the cross-frontal range of 2°C to 3°C. The monsoon plays a major role in the
front's seasonal evolution since the Mekong River discharge is largely monsoon-
dependent; the snowmelt component of the Mekong runoff is of secondary importance.
Gulf of Thailand SST
Linear SST trend since 1957: 0.40°C.
Linear SST trend since 1982: 0.16°C.
256
11. Gulf of Thailand
In general, the thermal history of the Gulf of Thailand shows a moderate-to-slow
warming, which is strongly correlated with the one of the South China Sea LME, as could
be expected since the Gulf of Thailand is the largest gulf of the South China Sea. The
relative magnitude of corresponding peaks and troughs is however different among these
LMEs. The Gulf of Thailand's steady, slow warming was modulated by relatively strong
interannual variability with year-to-year variations exceeding 0.5°C. The SST peak of
1998 stands out. This event was likely related to the El Nińo 1997-98. Other pronounced
events are:
(1) near-all-time minimum of 1963, simultaneous with a SST minimum in the South
China Sea LME;
(2) absolute minimum of 1976, which corresponds to a minimum in the South China
Sea.
The major warm event of 1998 caused the first extensive coral bleaching in the Gulf in
April-June 1998, which resulted in severe degradation of coral reefs; the smaller warm
event of 2003 caused mild bleaching (Yeemin, 2004).
Seasonal variability of vertical stratification plays a significant role in the Gulf of
Thailand's thermal regime (Yanagi et al., 2001). Stratification is best developed in spring
owing to strong surface heating and weak winds. The Mekong River runoff also affects
stratification over most of the Gulf. The above parameters incident solar radiation,
winds and runoff eventually depend on monsoon, therefore interannual variability of
monsoon is expected to strongly modulate SST regime of the Gulf.
Figure VIII-11.1. Fronts of the Gulf of Thailand LME. GTF, Gulf of Thailand Front. Yellow line, LME
boundary (from Belkin et al. 2008).
VIII East Asian Seas
257
Figure VIII-11.2. Gulf of Thailand LME, annual mean SST (left) and SST anomalies (right), 1957-2006,
based on Hadley climatology. After Belkin (2008).
Gulf of Thailand LME Trends in Chlorophyll and Primary Productivity: This LME is
considered a Class I, highly productive ecosystem (>300 gCm-2yr-1).
Figure VIII-11.3. Gulf of Thailand LME, trends in chlorophyll a and primary productivity, 1998-2006.
Values are colour coded to the right hand ordinate. Figure courtesy of J. O'Reilly and K. Hyde. Sources
discussed p. 15 this volume.
II. Fish and Fisheries
The catch composition of the Gulf of Thailand LME is a tropical multi-species mix and
includes food fish, trash fish, squid and cuttlefish, shrimp, shellfish and crab. Until the
early 1960s, the fisheries were dominated by small pelagics (mainly Indian mackerels,
Rastrelliger spp. and anchovies, Stolephorus spp.), which were caught by artisanal
fishers for the local market (Pauly & Chuenpagdee 2003). In the 1960s, the introduction
of trawl gear led to the development of demersal trawl fisheries (Piyakarnchana 1989,
Chuenpagdee and Pauly 2004), targeting threadfin bream (Nemipterus spp.), big-eye
(Pempheris adspersa), lizardfish (Saurida elongata), croaker (Johnius sp., Larimichthys
sp., Pennahia sp.), shrimps (Penaeus spp.), flatfish and squid.
258
11. Gulf of Thailand
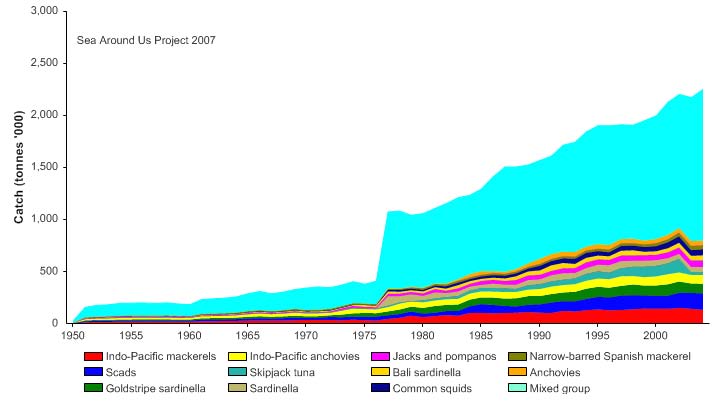
Total reported landings rose to over a million tonnes in 1969, but this is probably due to
misreporting of fish caught outside the Gulf. After 1969, the landings declined to less
than 500,000 tonnes by the late 1970s, but gradually returning to 700,000 tonnes by
2004 (Figure VIII-11.4). Again, a large fraction of the increased landings in recent years
was probably caught outside of the LME, particularly for large pelagic species such as
tuna.. Note the high level of `mixed group' in the reported landings, due to the poor
quality of the underlying statistics which report a majority of the landings simply as
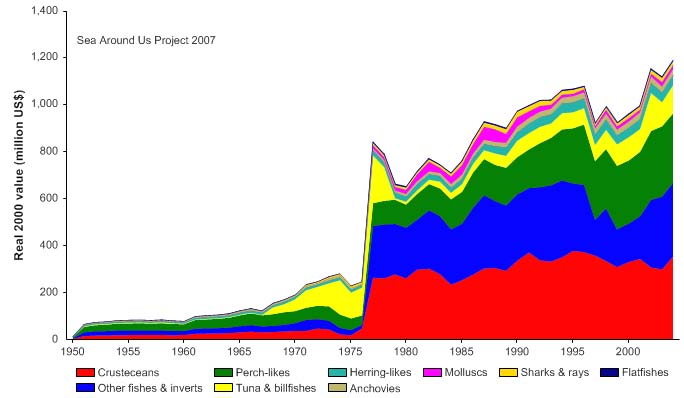
unidentified marine fish. The value of the reported landings peaked at about 1.1 billion
US$ (in 2000 real US$) in 1968 (Figure VIII-11.5).
Figure VIII-11.4. Total reported landings in the Gulf of Thailand LME by species (Sea Around Us 2007).
Figure VIII-11.5. Value of reported landings in the Gulf of Thailand LME by commercial groups (Sea
Around Us 2007).
VIII East Asian Seas
259
The primary production required (PPR; Pauly & Christensen 1995) to sustain the reported
landings in this LME peaked in the early 1970s at 30% of the observed primary
production, and following a period of low PPR, has reached this level in recent years
(Figure VIII-11-6). The countries bordering the LME, namely Thailand, Malaysia and
Vietnam, account for most of the ecological footprint in this LME.
Figure VIII-11.6. Primary production required to support reported landings (i.e., ecological footprint) as
fraction of the observed primary production in the Gulf of Thailand LME (Sea Around Us 2007). The
`Maximum fraction' denotes the mean of the 5 highest values.
The trends in the mean trophic level (i.e., the MTI; Pauly & Watson 2005) and the FiB are
indicative of growing fisheries in the LME (Figure VII-11.7). However, due to the poor
taxonomic details in the underlying landings statistics (Figure VII-11.4), it is highly likely
that such diagnosis is incorrect.
Figure VIII-11.7. Mean trophic level (i.e., Marine Trophic Index) (top) and Fishing-in-Balance Index
(bottom) in the Gulf of Thailand LME (Sea Around Us 2007).
260
11. Gulf of Thailand
The Stock-Catch Status Plots indicate that over 60% of the stocks in the LME are either
collapsed or overexploited (Figure VIII-11.8, top), and that they contribute over 60% of
the catch (Figure VIII-11.8, bottom). Again, the high degree of taxonomic aggregation in
the underlying statistics must be noted in regards to problems in the interpretation of
these plots.
1950
1960
1970
1980
1990
2000
0%
100
10%
90
20%
)
80
(
%
s
30%
u
70
at
st
40%
y
60
b
s
k
50%
c
50
t
o
f
s
60%
40
er o
b
70%
m
30
u
N
80%
20
90%
10
100%
0
1950
1960
1970
1980
1990
2000
(n = 3486)
developing
fully exploited
over-exploited
collapsed
1950
1960
1970
1980
1990
2000
0%
100
10%
90
20%
80
)
%
30%
(
70
s
u
at
40%
60
k st
c
50%
o
50
st
y
60%
b
h
40
t
c
a
70%
C
30
80%
20
90%
10
100%0
1950
1960
1970
1980
1990
2000
(n = 3486)
developing
fully exploited
over-exploited
collapsed
Figure VIII-11.8. Stock-Catch Status Plots for the Gulf of Thailand LME, showing the proportion of
developing (green), fully exploited (yellow), overexploited (orange) and collapsed (purple) fisheries by
number of stocks (top) and by catch biomass (bottom) from 1950 to 2004. Note that (n), the number of
`stocks', i.e., individual landings time series, only include taxonomic entities at species, genus or family
level, i.e., higher and pooled groups have been excluded (see Pauly et al, this vol. for definitions).
There is, in spite of uncertainties in the available statistics, much evidence that fishing
has impacted the LME at the ecosystem level and has become a primary driving force of
biomass change. A `fishing down' of the food web (Pauly et al. 1998) has been
documented for the Gulf of Thailand (Christensen 1998, Pauly & Chuenpagdee 2003)
and is fundamentally altering ecosystem structure and impacting its productive capacity.
Overfishing caused by overcapacity of the local trawl fisheries is well documented (e.g.,
Pope 1979, Pauly 1979. Christensen 1998, Piyakarnchana 1999, Pauly & Chuenpagdee
2003, Silvestre et al. 2003, Chuenpagdee & Pauly 2004) and the South China Sea TDA,
which includes the Gulf of Thailand LME, has identified loss in fisheries productivity as a
major transboundary issue in this region (Talaue-McManus 2000). As a consequence of
high fishing effort by non-selective trawl gear, its demersal catch composition has
changed towards smaller individuals and a mix of predominantly small, short-lived
species or `trash fish' (Pauly & Chuenpagdee 2003). There is also a rapid decrease in
the catch per unit effort, from over 300 kg per hour in the early 1960s to 50 kg per hour in
the 1980s, and a further decline to 20-30 kg per hour in the 1990s (Eiamsa-Ard &
Amornchairojkul 1997).
In addition to overexploitation, destructive fishing was found to be severe in the region
(UNEP 2005) and the use of small meshes in trawl nets has contributed to
overexploitation of the local demersal fish stocks (Christensen 1998). Impacts from
VIII East Asian Seas
261
fishing with explosives and poisons are also severe, particularly on coral reefs (Bryant et
al. 1998, Talaue-McManus 2000, (UNEP SCS 2008) and other types of fishing gear, such
as push nets and mackerel purse seines, have contributed further to the unsustainable
condition of the local fisheries (Pauly & Chuenpagdee 2003). Excessive bycatch is also a
severe problem (UNEP 2005). Small mesh sizes and minimal use of bycatch-exclusion
devices have resulted in massive overexploitation of fisheries resources as bycatch. Yet,
discarding is insignificant, as virtually all of the bycatch is utilised, with smaller 'trash' fish
taken in trawls being used as aquaculture feed. There is widespread capture, either
intentional or accidental, of rare, threatened and endangered species such as turtles and
dugong, by artisanal and commercial fisheries. In 2003 an international training course
on the use of turtle excluder devices (TEDs) and juvenile and trash excluder devices
(JTEDs) was conducted by the Southeast Asian Fisheries Development Center in
cooperation with FAO and GEF to train participants in how to minimize bycatch in the
fisheries of Southeast Asia, particularly in the excluding of turtles from shrimp trawling.
Substantial, though unquantified, levels of bycatch are also produced by distant waters
fleets, through use of blast fishing and poison, and in the shrimp fry fisheries, where
juvenile fishes are often discarded (UNEP SCS 2008).
Fish stocks in the inner Gulf have been affected by rapid environmental deterioration,
including eutrophication, HABs and oxygen depletion (Eiamsa-Ard & Amornchairojkul
1997, Piyakarnchana 1999). The relative effects of environmental deterioration and
overexploitation on the region's fisheries resources need to be further explored but, at the
same time, there is growing recognition that there is an urgent need for Thailand to
reduce and manage fishing capacity (Stobutzki et al. 2006; Pauly & Chuenpagdee 2003,
Ahmed et al. 2007).
As with the neighbouring LMEs, the status and future viability of the fisheries are not well-
understood, and there are significant gaps in data. In fact, the status of many fisheries
may be summarised as Illegal, Unreported and Unregulated (IUU; UNEP 2005). Based
on present consumption and population growth patterns, pressure on the fisheries
resources is likely to increase significantly in the immediate future and overexploitation is
expected to remain severe or get worse if adequate measures are not taken to address
this problem (UNEP 2005). A substantial reduction of fishing effort, especially of bottom
trawlers, may reduce the fishing pressure on the local stocks and slow further ecological
degradation in the region (Pauly & Chuenpagdee 2003; Stobutzki et al. 2006; Ahmed et
al. 2007).
III. Pollution and Ecosystem Health
Pollution: Rapid economic development and population growth in the coastal areas have
caused pollution that is severe in localised coastal hotspots (UNEP 2005). Liquid wastes
from domestic, agricultural and industrial sources, as well as sediments and solid wastes
are the major land-based pollutants affecting the coastal areas (Talaue-McManus 2000,
Fortes 2006). Outflow from the Chao Phraya River, is critical to the productivity of the
system, especially since it contains nutrients and other substances, including pollution.
As a consequence, problems such as eutrophication, sedimentation, and shallowness of
the inner Gulf are common. Pollution has potential transboundary impacts due to the
possibility of long-shore transport of pollutants as a result of the water circulation pattern
on the Sunda Shelf (Talaue-McManus 2000). Water quality is lower than acceptable
standards in the inner Gulf region, especially at river mouths, the popular tourist spots
along the coast and near certain islands. Many cities have no sewage treatment and
discharge raw sewage directly into the coastal areas (UNEP 2005).
Eutrophication is a growing problem, due to the increasing input of nutrients from land-
based sources (Piyakarnchana 1999). The increased nutrient loading has caused
262
11. Gulf of Thailand
phytoplankton blooms in several areas, reducing water clarity as well as dissolved
oxygen in bay areas and this pattern is reportedly spreading. There have been frequent
occurrences of toxic and non-toxic algal blooms, as well as cases of paralytic shellfish
poisoning in parts of the region (Talaue-McManus 2000).
High levels of suspended solids have severe impacts in coastal waters throughout most
of the region (UNEP 2005). Major changes in turbidity and levels of suspended
sediments have resulted from activities such as extensive deforestation, logging, land
reclamation, dredging and urban development. Pollution from solid wastes is also severe
in localised areas, particularly around many towns and villages where waste
management is poor or non-existent.
The use of agricultural pesticides and industrial effluents creates a significant problem in
some areas such as near river mouths and industrial discharges (UNEP 2005). Releases
of chemical and other forms of pollution from shipping in harbours also commonly occurs
since regulations and controls relating to ship-derived pollution are rarely enforced.
Pollution by petroleum hydrocarbons and the occurrence of oil spills have been reported
in the Gulf (Piyakarnchana 1999).
Habitat and community modification: Habitat and community modification was
assessed as severe (UNEP 2005), with land use and land cover changes being the major
contributors (Piyakarnchana 1999). The causes of mangrove destruction along the
coastlines bordering the South China Sea, including the Gulf of Thailand LME, include
conversion to aquaculture ponds, particularly of shrimp, clear felling of timber for
woodchip and pulp production, land clearance for urban and port development and
human settlements and harvest of timber products for domestic use (UNEP 2004a).
However, as noted by Talaue-McManus (2000) and UNEP (2004a), shrimp culture
appears to be the most pervasive economic imperative for mangrove conversion in the
region. In 1961, mangrove forests surrounding the LME covered 367,000 ha, but by
1991 this was reduced to 173,600 ha, with at least three out of 24 provinces having lost
all their mangrove forests (Piyakarnchana 1999). The clearing of these forests has led to
a deterioration of the coastal zone (Piyakarnchana 1999). From a global perspective, the
major transboundary issues surrounding the loss of mangrove habitats include the loss of
unique biological diversity and the loss of mangrove services (UNEP 2004a).
Over the past 15 years, progressive degradation of coral reefs in several locations of the
South China Sea (including the Gulf of Thailand LME) has been noted, with reefs located
near large human population centres having suffered the most serious degradation
(UNEP 2004b). Rapid population growth, coastal development, land-based pollution,
tourism, overfishing and destructive fishing practices all contribute to this decline (Sudara
& Yeemin 1997, Talaue-McManus 2000, UNEP 2004b). Heavy sedimentation resulting
from various anthropogenic disturbances in the coastal areas and poor land use practices
in the watersheds has also impacted the region's reefs (Sudara et al. 1991). In addition,
global warming of the sea surface has caused considerable and widespread damage to
the LME's reefs after the severe 1998 bleaching event (UNEP 2004b). A comprehensive
reef survey programme covering 251 sites in the Gulf of Thailand showed 16.4% of the
reefs to be in excellent condition, 29% good, 30.8% fair and 23.8% poor (Chou et al.
2002).
Seagrass beds are subjected to a number of threats from various sources, the root cause
being associated with coastal human populations (UNEP 2004c). High sediment loads
associated with deforestation (including of mangroves), dredging and land reclamation;
fluctuation in freshwater input due to irrigation and land clearing; increased pollution;
coastal development; and destructive fishing methods are among the causes of
degradation of the region's seagrass habitats (UNEP 2004c). There is evidence of
VIII East Asian Seas
263
widespread modification of seagrass habitats throughout the region. For example,
between 20% to 50% of seagrass beds in Malaysia and Thailand have been damaged
(Talaue-McManus 2000) and Vietnam has lost an estimated 40% to 50% over the past
two decades (UNEP 2004c).
Ecosystem health may deteriorate further as a consequence of expected future increases
in pollution and habitat modification (UNEP 2005). Despite increasing measures for
pollution mitigation and control (e.g., sewage treatment), environmental quality is likely to
worsen, primarily because of the predicted increase in deforestation and agriculture, as
well as a major increase in population overriding the improvements in infrastructure.
Some positive steps are being taken to address habitat modification, including mangrove
rehabilitation programmes, watershed protection and establishment of marine protected
areas. Both the direction of change and the rates of environmental deterioration or
improvement, however, will depend on the success of ongoing and planned interventions.
IV. Socioeconomic Conditions
The population in the Gulf of Thailand LME region is 112 million (Talaue-McManus 2000;
UNEP 2005). For the larger South China Sea region, some 270 million people (5% of the
world's population) inhabit coastal areas and this population is expected to double in the
next three decades. The LME and its resources have provide important benefits to the
region's coastal communities, with fisheries, mariculture and tourism being key economic
activities in the bordering countries. Marine fisheries in particular play a significant
socioeconomic role. Subsistence fishing is the major activity of large numbers of people
outside of the main urban and industrial centres. Fisheries are an important source of
food, employment and foreign exchange. Despite nutritional requirements and current
population growth rates, South China Sea countries in general are net exporters of
fishery products (Talaue-McManus 2000). Fishing contributes about 2% to the GDP of
Thailand, which is a major world exporter of fishery commodities and among the leading
exporters of farmed shrimp (FAO 2005).
The socioeconomic impacts of overexploitation of fisheries and environmental
deterioration are significant (UNEP 2005). There have been reduced economic returns
and loss of employment from the collapse of fisheries in the region. Higher investment is
now required per unit of commercial catch, reducing the profitability of fishing enterprises.
The degradation of mangrove forests, seagrass and coral reefs, critical for fish spawning,
feeding and recruitment, has also contributed to declining fish catch, especially in near-
shore areas. This has had a marked negative impact on the livelihoods of poor artisanal
fishing communities. Competition for fisheries resources among fishers has also been
increasing.
The socioeconomic impacts of pollution include economic losses in mariculture and the
shellfish industry as a result of high levels of toxicity and HABs and risk to human health.
Other socioeconomic impacts of pollution are associated with the costs of clean-up and
coastal restoration. Land-use conflicts have also arisen. The socioeconomic impacts of
habitat and community modification range from slight to severe (UNEP 2005), primarily
because of reduced capacity of local populations to meet basic human needs and loss of
employment. Other impacts include loss or reduction of existing and future income and
foreign exchange from fisheries and tourism and increased risks to capital investment
(e.g., failure of coastal aquaculture projects in many parts of the region, costs of
restoration of modified ecosystems and intergenerational inequity).
264
11. Gulf of Thailand
V. Governance
Governance of the LME is shared by the four bordering countries. A range of measures
and programmes has been established to arrest and reverse overexploitation as well as
environmental degradation in the LME. Following on its adoption of the FAO Code of
Conduct for Responsible Fisheries, the Thai Department of Fisheries issued licensing
regulations to control the number of trawlers and push nets. The number of registered
trawlers has gradually decreased from about 10,500 units in 1980 to 8,000 units in early
2000 (DoF 2002). The Ministry of Agriculture and Cooperatives in Thailand governs the
Department of Fisheries. The Ministry of Natural Resources and Environment governs
coastal resources and the environment. The countries have made a commitment to
devolve authority for natural resources management from state to community and from
central to more local levels of government (Ratner et al. 2004). For instance, in Thailand
the 1999 Decentralization Act has placed a range of decision-making powers with sub-
district government units (Tambon Administrative Organisations).
The Gulf of Thailand LME comes under the UNEP-administered East Asian Regional
Seas Programme. The Action Plan for the Protection and Development of the Marine
and Coastal Areas of the East Asian Region was approved in 1981, and currently
involves 10 countries. There is no regional convention. Instead, the programme
promotes compliance with existing environmental treaties and is based on member
country goodwill. The Action Plan is steered from Bangkok by its coordinating body,
COBSEA. The East Asian Seas Regional Coordinating Unit serves as the secretariat
and is responsible for coordinating the activities of governments, NGOs, UN and donor
agencies and individuals in caring for the region's marine environment. Other regional
action plans include the ASEAN Strategic Plan of Action on the Environment, ASEAN
Cooperation on Transboundary Pollution and Regional Action Programme for
Environmentally Sound and Sustainable Development. Regional research programmes
include the International Cooperative Study of the Gulf of Thailand for the sustainable
management of the Gulf, sponsored by the UNESCO Intergovernmental Oceanographic
Commission-Sub Commission for the Western Pacific (IOC-WESTPAC), the Southeast
Asian Programme in Ocean Law, Policy and Management and the Southeast Asia
START Global Change Regional Centre.
The Council of Directors of the Southeast Asian Fisheries Development Centre approved
a programme for the `regionalisation' of the FAO Code of Conduct in 1998. It has also
produced three volumes of Regional Guidelines for Responsible Fisheries in Southeast
Asia -- Responsible Fishing Operations, Responsible Aquaculture and Responsible
Fisheries Management (SEAFDEC 2003). The Asia-Pacific Fishery Commission is
assisting its member countries to achieve accelerated fisheries development and
management.
To help address the problems in the coastal fisheries of Asia, the WorldFish Centre
joined forces with fisheries agencies from Bangladesh, India, Indonesia, Malaysia, The
Philippines, Sri Lanka, Thailand and Vietnam and the Asian Development Bank, to
implement the project `Sustainable Management of Coastal Fish Stocks in Asia'
(TrawlBase project) between 1998 and 2001 (Silvestre et al. 2003). Among the main
achievements of this partnership was the development of a database called `Fisheries
Resource Information System and Tools' (FiRST), which contains trawl research survey
data and socioeconomic information for selected fisheries, and facilitates its analysis.
The project has also strengthened national capacity in coastal fisheries assessment,
planning and management, and illustrated the benefits of collaborative efforts in
addressing issues of regional concern.
VIII East Asian Seas
265
GEF is currently supporting three projects involving this LME. The project `Reversing
Environmental Degradation Trends in the South China Sea and Gulf of Thailand' aims to
foster and encourage regional collaboration and partnership in addressing transboundary
environmental problems between all stakeholders and at all levels. The project also
seeks to enhance the capacity of the participating governments to integrate
environmental considerations into national development planning. A comprehensive TDA
for the South China Sea, which includes the Gulf of Thailand LME, has been produced
under this project.
The project `Building Partnerships for the Environmental Protection and Management of
the Seas of East Asia' (PEMSEA) aims to enable the East Asian Seas Region to
collectively protect and manage its coastal and marine environment through inter-
governmental and inter-sectoral partnerships (www.pemsea.org). Through partnership
building, the project will help countries to develop scientifically-based environmental
management strategies and action plans in order to deal with land-based pollution,
promote closer regional and sub-regional collaboration in combating environmental
disasters arising from maritime accidents as well as increase regional commitments in
implementing international conventions that they ratify. The project `East Asian Seas
Region: Development and Implementation of Public-Private Partnerships in
Environmental Investments' aims to build confidence and capabilities in public-private
sector partnerships as a viable means of financing and sustaining environmental facilities
and services for the protection and sustainable use of the marine and coastal resources
of the East Asian Seas region.
References
Ahmed, M., Boonchuwongse, P., Dechboon, W. and Squires, D. (2007) Overfishing in the Gulf of
Thailand: Policy challenges and bioeconomic analysis. Environment and Development
Economics 12 (1): 145-172.
Belkin, I.M. (2008). Rapid warming of Large Marine Ecosystems. Progress in Oceanography, in
press.
Belkin, I.M. and Cornillon, P.C. (2003). SST fronts of the Pacific coastal and marginal seas. Pacific
Oceanography 1(2): 90-113.
Belkin, I.M., Cornillon, P.C., and Sherman, K. (2008) Fronts in large marine ecosystems of the
world's oceans: An atlas. Progress in Oceanography, in press.
Bryant, D., Burke, L., McManus, J. and Spalding, M. (1998). Reefs at Risk. A Map-based Indicator
of Threats to the World's Coral Reefs. WRI/ICLARM/WCMC/UNEP, Washington D.C., U.S.
Chou, L.M., Wilkinson, C., Gomez, E. and Suraphol, S. (2002). Status of Coral Reefs in the ASEAN
Region, p 8-17 in: Wilkinson, C.R. (ed), Living Coastal Resources of Southeast Asia: Status
and Management. Report of the Consultative Forum 3rd Association of Southeast Asian
Nations-Australia Symposium on Living Coastal Resources. Chulalongkorn University Bangkok,
Thailand. Australian Institute of Marine Science, Townsville, Australia.
Christensen, V. (1998). Fishery induced changes in a marine ecosystem: insight from models of the
Gulf of Thailand. Journal of Fish Biology 53 (Suppl. A):128-142.
Chuenpagdee, R. and Pauly, D. (2004). The Gulf of Thailand trawl fisheries, p 203-220 in: Swan, J.
and Gréboval, D. (comps), Report and Documentation of the International Workshop on the
Implementation of International Fisheries Instruments and Factors of Unsustainability and
Overexploitation in Fisheries, Mauritius, 3-7 February 2003. FAO Fisheries Report 700. FAO,
Rome.
DoF (2002). Thai Fishing Vessels Statistics 2000. Department of Fisheries, Ministry of Agriculture
and Cooperatives. Bangkok, Thailand. Document 16/2002.
Eiamsa-Ard, M. and Amornchairojkul, S. (1997). The marine fisheries of Thailand, with emphasis
on the Gulf of Thailand trawl fishery, p 85-95 in: Silvestre, G. and Pauly, D. (eds), Status and
Management of Tropical Coastal Fisheries in Asia. International Centre for Living Aquatic
Resources Management Conference Proceedings 53.
266
11. Gulf of Thailand
FAO (2005). Fishery Country Profiles. www.fao.org/fi/fcp/fcp.asp
Fortes, M. (2006). Seas of East Asia, p 177 -192 in: UNEP/GPA (2006), The State of the Marine
Environment: Regional Assessments. UNEP/GPA, The Hague.
Longhurst, A.R. (1998). Ecological Geography of the Sea. Academic Press, California, U.S.
Pauly, D, Christensen, V., Dalsgaard, J., Froese, R. and Torres, F. Jr. (1998). Fishing down marine
food webs. Science 279:860-863.
Pauly, D. (1979). Theory and management of tropical multispecies stocks: a review, with emphasis
on the southeast Asian demersal fisheries. ICLARM Studies and Reviews 1, 35 p.
Pauly, D. and Christensen, V. (1995). Primary production required to sustain global fisheries.
Nature 374: 255-257.
Pauly, D. and Chuenpagdee, R. (2003). Development of Fisheries in the Gulf of Thailand Large
Marine Ecosystem: Analysis of an Unplanned Experiment, p 337-354 in: Hempel, G. and
Sherman, K. (eds), Large Marine Ecosystems of the World: Trends in Exploitation, Protection
and Research. Elsevier, The Netherlands.
Pauly, D. and Watson, R. (2005). Background and interpretation of the `Marine Trophic Index' as a
measure of biodiversity. Philosophical Transactions of the Royal Society: Biological Sciences
360: 415-423.
Piyakarnachana, T. (1989). Yield Dynamics as an Index of Biomass Shifts in the Gulf of Thailand, p
95-142 in: Sherman, K. and Alexander, L.M. (eds), Biomass Yields and Geography of Large
Marine Ecosystems. AAAS Symposium 111, Westview Press, Inc., Boulder, U.S.
Piyakarnchana, T. (1999). Changing State and Health of the Gulf of Thailand Large Marine
Ecosystem, p 240-250 in: Sherman, K. and Tang, Q. (eds), Large Marine Ecosystems of the
Pacific Rim Assessment, Sustainability and Management. Blackwell Science, Malden, U.S.
Pope, J.A. (1979). Stock Assessment in Multispecies Fisheries. South China Sea Fisheries, with
Special Reference to the Trawl Fishery in the Gulf of Thailand. South China Sea Development
and Coordinating Programme. SCS/DEV/79/19. Manila, Philippines.
Ratner, B.D., Thanh-ha, D., Kosal, M., Nissapa, A. and Chanphengxay, S. (2004). Undervalued
and Overlooked: Sustaining Rural Livelihoods through Better Governance of Wetlands.
WorldFish Center Studies and Reviews 28.
Sea Around Us (2007). A Global Database on Marine Fisheries and Ecosystems. Fisheries Centre,
University British Columbia, Vancouver, Canada. www.seaaroundus.org/lme/SummaryInfo.
aspx?LME=35
SEAFDEC (2003). Regional Guidelines for Responsible Fisheries in Southeast Asia: Responsible
Fisheries Management. Southeast Asian Fisheries Development Centre. MFRDMD/SP/3.
Sherman, K. (2003). Physical, Biological and Human Forcing of Biomass Yields in Large Marine
Ecosystems. ICES CM 2003/P: 12.
Silvestre, G.T., Garces, L.R., Stobutzki, I., Ahmed, M., Santos, R.A.V., Luna, C.Z. and Zhou, W.
(2003). South and South-East Asian coastal fisheries: Their status and directions for improved
management. Conference synopsis and recommendations, p 1- 40 in: Silvestre, G., Garces, L.,
Stobutzki, I., Ahmed, M., Santos, R.A.V., Luna, C., Lachica-Alińo, L., Christensen, V., Pauly, D.
and Munro, P. (eds), Assessment, Management and Future Directions for Coastal Fisheries in
Asian Countries. WorldFish Center Conference Proceedings 67.
Stobutzki, I.C., Silvestre, G.T., Talib, A. Abu, Krongprom, A., Supongpan, M., Khemakorn, P.,
Armada, N., Garces, L.R. (2006). Fisheries Research 78:130-142.
Sudara, S. and Yeemin, T. (1997). Status of Coral Reefs in Thailand, p 135-144 in: Grigg, R.W.
and Birkeland, C. (eds), Status of Coral Reefs in the Pacific. Sea Grant College Program,
School of Ocean and Earth Science and Technology, University of Hawaii, U.S.
Sudara, S., Sanitwongs, A., Yeemin, T., Moordee, R., Panutrakune, S., Suthanaluk, P. and
Natekanjanalarp, S. (1991). Study of the Impact of Sediment on Growth of the Coral Porites
lutea in the Gulf of Thailand, p 107-112 in: Alcala, A.C. (ed), Proceedings of the Regional
Symposium on Living Resources in Coastal Areas. Marine Science Institute, University of the
Philippines.
Talaue-McManus, L. (2000). Transboundary Diagnostic Analysis for the South China Sea. East
Asian Seas Regional Coordination Unit Technical Report Series 14, United Nations
Environment Programme, Bangkok, Thailand.
UNEP (2004a). Mangroves in the South China Sea. UNEP/GEF/SCS Technical Publication 1.
UNEP (2004b). Coral Reefs in the South China Sea. UNEP/GEF/SCS Technical Publication 2.
UNEP (2004c). Seagrass in the South China Sea. UNEP/GEF/SCS Technical Publication 3.
UNEP (2005). Wilkinson, C., DeVantier, L., Talaue-McManus, L., Lawrence, D. and Souter D.
South China Sea, GIWA Regional Assessment 54. University of Kalmar, Kalmar, Sweden.
www.giwa.net/publications/r54.phtml
VIII East Asian Seas
267
UNEP SCS (2008) Establishing a regional system of fisheries refugia in the Gulf of Thailand and
South China Sea. Report available online at:http://refugia.unepscs.org/Fisheries_Refugia_
Information/About_Fisheries_Refugia/About_Fisheries_Refugia.html
Wyrtki, K. (1961). Dynamics of the Demersal Fish Resources in the Sunda Shelf Area of the South
China Sea. Ph.D. Dissertation, University of Washington, Seattle, U.S.
Yanagi T., Sachoemar, S.I., Takao, T. and Fujiwara S. (2001) Seasonal variation of stratification in
the Gulf of Thailand, Journal of Oceanography, 57(4), 461-470.
Yeemin, T. (2004) Status of coral reefs in the Gulf of Thailand and the Andaman Sea, poster
presented at the 10th ICRS, Okinawa, Japan, 28 June - 2 July 2004.
268
11. Gulf of Thailand
VIII East Asian Seas
269
VIII-12 Indonesian Sea LME
S. Heileman
The Indonesian Sea LME is situated at the confluence of the Pacific and Indian Oceans,
and is bordered by Indonesia and East Timor. It covers an area of 2.3 million km2, of
which 1.49% is protected, and contains 9.98% and 0.75% of the world's coral reefs and
sea mounts, respectively (Sea Around Us 2007). Indonesia is one the world's largest
archipelagic nations, with a coastline exceeding 84,000 km. The warm ocean acts as a
`heat engine' of global atmospheric circulation, with complex ocean-atmospheric
dynamics, including the ENSO phenomenon. The convergence of three tectonic plates
the Eurasian, the Indo-Australian and the Pacific Plates makes the region geologically
as well as topographically diverse. Many of Indonesia's islands are subject to tectonic
instability including volcanic activity. Seasonal monsoons, during which ocean currents
reverse directions, exert a significant influence on the LME. The seas around Indonesia
have complex and rapid currents owing to energetic tides over rough topography and
also owing to the Indonesian Throughflow, which is the flow and exchange of oceanic
water between the Pacific and Indian Oceans. Books, book chapters, articles and reports
pertaining to this LME are Dalzell & Pauly (1989), Morgan (1989), Pauly & Martosubroto
(1996), Pitcher et al. (2007), Zijlstra & Baars (1990) and UNEP (2005).
I. Productivity
The Indonesian Sea LME is considered a Class I ecosystem with high productivity
(>300 gCm-2yr-1). The Banda Sea and the Aru Basin in particular, are areas of extensive
seasonal upwelling and downwelling related to the monsoonal system. During upwelling
periods, biomasses and productivity at all levels in the food chain are greatly enhanced
(Zijlstra & Baars 1990). Stocks of small pelagic fish were also found to be considerably
higher during the upwelling period. The changing oceanographic conditions in this LME
also influence phytoplankton and zooplankton species composition.
The region is located in the Indo-West Pacific centre of biodiversity, supporting mega-
diversity (Roberts et al. 2002). For example, more than 500 species of reef-building
corals, 2,500 species of marine fish, 47 species of mangroves and 13 species of
seagrasses are found in this region (Chou 1997, Tomascik et al. 1997, Veron 2000,
Spalding et al. 2001). The pelagic realm is an important habitat, which supports high
biodiversity of large and small migratory marine species, including a wide variety of
cetaceans, including the blue, fin and humpback whales and other species that frequently
migrate through the region (Kahn & Pet 2003).
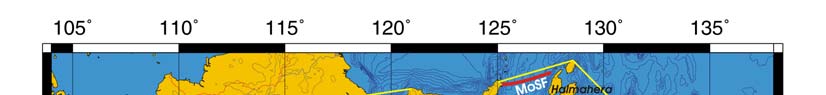
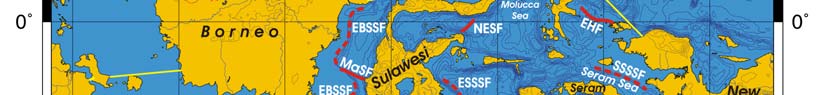
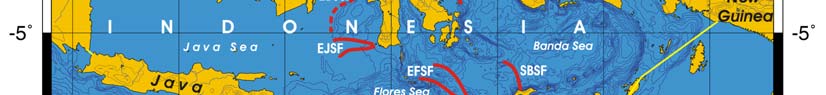
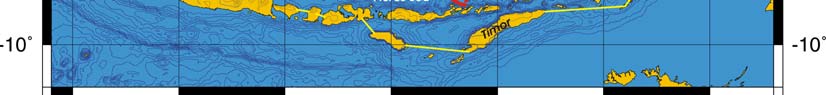
Oceanic fronts Belkin et al. (2008): Straits connecting this LME with the other marginal
seas are sites of front formation due to topographic effects caused by flow constrictions
(Figure VIII-12.1). Internal tide interaction with sills in these straits is one of such front-
genetic processes. Local (basin-scale) fronts are observed east of Borneo (EBSSF),
northeast of Sulawesi (NESF), east of Halmahera (EHF), in the eastern parts of the Java
Sea (EJSF) and Flores Sea (EFSF), across the Makassar Strait (MaSF), in the Molucca
Sea (MoSF) and in the southern Banda Sea (SBSF).
270
12. Indonesian Sea LME
Figure VIII-12.1. Fronts of the Indonesian Sea LME. EBSSF, East Borneo Shelf-Slope Front; EFSF, East
Flores Sea fronts; EHF, East Halmahera Front; EJSF, East Java Sea fronts; ESSSF, East Sulawesi Shelf-
Slope Front; MaSF, Makassar Strait Front; MoSF, Molucca Sea Front; NESF, Northeast Sulawesi Front;
SBSF, South Banda Sea Front; SSSSF, Seram Sea Shelf-Slope Front. Dashed lines show most probable
locations of shelf-slope fronts. Yellow line, LME boundary. After Belkin et al. (2008) and Cornillon
(2003).
Indonesian Sea SST (after Belkin 2008)
Linear SST trend since 1957: 0.53°C.
Linear SST trend since 1982: 0.24°C.
The thermal history of the Indonesian Sea since 1957 included brief cooling through 1967
and steady warming ever since (Figure VIII-12.2). The all-time minimum of 1967
occurred simultaneously with the all-time minimum in the Sulu-Celebes Sea LME and
only a year prior to the all-time minimum of 1968 in the West-Central Australian Shelf
LME and a minimum of 1968 in the North-West Australian Shelf LME.
Figure VIII-12.2. Indonesian Sea LME mean annual SST (left) and SST anomalies (right), 1957-2006,
based on Hadley climatology. After Belkin (2008).
VIII East Asian Seas
271
This sequence of events can be explained by advection of the low-temperature signal of
1967 from the Indonesian Sea toward Western Australia with the Indonesian
Throughflow. The 1982 minimum occurred simultaneously in the North and Northeast
Australian Shelf LMEs, but not off Western Australia; this can be explained by the long-
time variability of circulation pattern. The 1998 all-time maximum was likely caused by El
Nińo 1997-98. Despite the relatively uniform SST field, local anomalies up to 10°C are
generated by the Indonesian Throughflow and tides, e.g. east of Bali in the Lombok
Strait, where SST drops to 16°C vs. 28°C in adjacent waters (Vantier et al., 2005, p. 56).
Indonesian Sea LME trends in Chlorophyll and Primary Production: The Indonesian
Sea LME is considered a Class I ecosystem with high productivity (>300 gCm-2yr-1).
Figure VIII-12.3. Indonesian Sea LME annual trends in chlorophyll a (left) and primary productivity
(right), 1998 2006. Values are color coded to the right hand ordinate. Figure courtesy of J. O'Reilly
and K. Hyde. Sources discussed p. 15 this volume.
II. Fish and Fisheries
The fisheries of the Indonesian Sea LME are very complex and diverse, reflecting the
region's extraordinarily heterogeneous geography and species variance (Pauly &
Martosubroto 1996; FAO 2005). While most of the catch comes from its artisanal sector,
industrial fisheries contribute considerably more in terms of value, since they target high-
value shrimp and tuna stocks. Major species caught in the LME include tuna, sardines,
anchovy, mackerel, as well as a range of reef fishes (Morgan 1989). Reef fisheries are
vital to subsistence fishers and their families in the region but are also important in
supplying high value products for expanding international, national and local markets
(Cesar et al. 2000). Aquaculture of shrimps in coastal ponds has also increased rapidly
during the last two decades in Indonesia.
As noted by Kahn & Fauzi (2001) for the adjacent Sulu-Celebes Sea, but also applicable
in the Indonesian Sea, great uncertainties exist on the status of the local fish stocks due
to serious discrepancies in fisheries data and a potentially significant level of Illegal,
Unreported and Unregulated (IUU) catches. Total reported landings in the LME have
increased steadily from the 1950s, with a sharp increase from less than half a million
tonnes to over one million tonnes in the mid 1970s (Figure VIII-12.4). This distinct
increase in the reported landings may be associated with developments related to the
declaration of the EEZ. In 2004, the total reported landings reached 2.2 million tonnes
272
12. Indonesian Sea LME
and the value of the reported landings, showing a trend similar to landings, reached close
to US$1.2 billion (in 2000 US dollars) in 2004 (Figure VIII-12.5)..
Figure VIII-12.4. Total reported landings in the Indonesian Sea LME by species (Sea Around Us 2007).
Figure VIII-12.5. Value of reported landings in the Indonesian Sea LME by commercial groups (Sea
Around Us 2007).
The primary production required (PPR; Pauly & Christensen 1995) to sustain the reported
landings in this LME is increasing, and is currently at 30% of the observed primary
production (Figure VIII-12.6). Indonesia and Thailand account for the largest shares of
the ecological footprint in the LME.
VIII East Asian Seas
273
Figure VIII-12.6. Primary production required to support reported landings (i.e., ecological footprint) as
fraction of the observed primary production in the Indonesian Sea LME (Sea Around Us 2007). The
`Maximum fraction' denotes the mean of the 5 highest values.
The mean trophic level of fisheries landings (i.e. the MTI; Pauly & Watson 2005) shows
an increase from the early 1980s, an indication of increased reported landings of high
trophic species such as tuna (Figure VIII-12.7 top). Such interpretation is also inferred by
the increase in the FiB index during the same period (Figure VIII-12.7 bottom) denoting a
steady expansion of the fisheries in the region. It must, however, be noted that these
indices may be skewed by the high level of unidentified fishes in the underlying landings
statistics.
Figure VIII-12.7. Mean trohpic level (i.e., Marine Trophic Index) (top) and Fishing-in-Balance Index
(bottom) in the Indonesian Sea LME (Sea Around Us 2007).
274
12. Indonesian Sea LME
The Stock-Catch Status Plots indicate that only a small number of the stocks in the LME
are either overexploited or have collapsed (Figure VIII-12.8, top) with 80% of the catch
from fully exploited stocks. Again, the high level of taxonomic aggregation in the
underlying landings statistics must be noted here.
1950
1960
1970
1980
1990
2000
0%
100
10%
90
20%
)
80
%
(
s
30%
u
70
at
st
40%
y
60
50%
cks b
o
50
f
st
60%
40
er o
b
70%
m
30
Nu
80%
20
90%
10
100%0
1950
1960
1970
1980
1990
2000
(n = 4260)
developing
fully exploited
over-exploited
collapsed
1950
1960
1970
1980
1990
2000
0%
100
10%
90
20%
80
)
%
30%
(
70
t
us
40%
t
a
60
s
k
50%
t
oc
50
s
60%
h by
40
t
c
a
70%
C
30
80%
20
90%
10
100%0
1950
1960
1970
1980
1990
2000
(n = 4260)
developing
fully exploited
over-exploited
collapsed
Figure VIII-12.8. Stock-Catch Status Plots for the Indonesian Sea LME, showing the proportion of
developing (green), fully exploited (yellow), overexploited (orange) and collapsed (purple) fisheries by
number of stocks (top) and by catch biomass (bottom) from 1950 to 2004. Note that (n), the number of
`stocks', i.e., individual landings time series, only include taxonomic entities at species, genus or family
level, i.e., higher and pooled groups have been excluded (see Pauly et al, this vol. for definitions).
Overexploitation is widespread in this LME, with many fish stocks exploited well beyond
the biological limits (Dwippongo et al. 1987), especially in the coastal zone, which is
exploited by 85% of Indonesian fishers (Hopley & Suharsono 2000). In addition, foreign
fleets continue to threaten Indonesia's fisheries, but again, accurate data on the extent,
the number of vessels and their mode of operations are inadequate (Kahn & Fauzi 2001,
Perrin et al. 2002). Coral reefs have been exploited for a long time, even in the more
remote areas of Eastern Indonesia (Palomares & Heymans 2006), and are now
considered to be under severe fishing pressure. Of particular concern is the live reef fish
trade in the Southeast Asian region, including in the Indonesian Sea LME. The use of
fish poisons to catch aquarium and food fishes is a serious problem in many Pacific
countries, but more so in Indonesia and the Philippines (Johannes & Riepen 1995). Use
of explosives is also of a grave concern throughout the region (see Pollution and
Ecosystem Health).
About 85% of aquarium fish traded internationally has been caught using cyanide,
targeting about 380 species from a few families such as Labridae, Pomacentridae,
Chaetodontidae, Pomacanthidae and Scaridae (Pratt et al. 2000). The live food fish
trade primarily targets groupers (especially Epinephelus spp. and Plectropomus
leopardus), Napolean wrasse (Cheilinus undulates) and barramundi cod (Cromileptes
altivelis) (Pet & Pet-Soede 1999). Because of their particular life-history attributes,
VIII East Asian Seas
275
groupers are highly susceptible to overexploitation and the targeting of their spawning
aggregations is a serious concern (Licuanan & Gomez 2000). In addition to taking adult
groupers for direct food consumption, the live reef fish food trade also involves capture of
wild fry and fingerlings supplying the grouper mariculture industry in Southeast Asia,
predominantly in Taiwan and Thailand (Sadovy & Pet 1998).
Over the past several centuries many of Indonesia's coral reefs have been heavily and
chronically overfished, with a major loss of productivity and cascading effects to other
components of the ecosystem. Overexploited stocks include many species of reef fish
such as groupers and threatened and endangered species such as sea turtle and
dugong. Benthic invertebrate species such as sea cucumbers, trochus and clams are
also overexploited, particularly around major coastal population centres. Overexploitation
of pelagic species such as shark, tuna and billfish is also evident. Catch per unit effort for
these fisheries has declined sharply, as has the size of fishes caught. There have also
been local extinctions and reductions in market availability (UNEP 2005). Of major
importance in this context has to be the realization that much of the true catch may not be
accounted for by official landings statistics, e.g., as shown for northern Sabah, Malaysia
(Teh et al. 2007). While these examples pertain to other LME areas, the same problem
applies to the Indonesian Sea LME.
The problem of excessive bycatch was assessed as severe (UNEP 2005). However,
there are little or no discards because virtually all of the bycatches, except those
produced by distant waters fleets and through the use of blast fishing and poisons, are
consumed. Sharks are also caught as bycatch in trawl as well as tuna long-line fisheries.
Perrin et al. (2002) noted that bycatch is a major threat to all marine mammals in
Indonesian waters, especially to cetaceans and dugong, and can lead to major losses in
biodiversity. Impacts of destructive fishing on fisheries resources and marine habitats are
increasingly becoming a problem, even within national parks (Pet-Soede & Erdmann
1999, UNEP 2005). There is a widespread habitat destruction of coral reefs from blast
and poison fishing including extensive damages to soft-bottom communities from trawling
(see Pollution and Ecosystem Health). The impacts of destructive fishing have major
transboundary implications, both in terms of target species population dynamics and in
terms of international market demand. Although these practices are illegal, regulations
are difficult to enforce, especially in remote areas.
III. Pollution and Ecosystem Health
Pollution: Urban expansion and industrialisation have resulted in coastal pollution from
domestic, agricultural and industrial wastes in the Indonesian Sea LME. Industrial forms
of water pollution are concentrated in the major urban centres, primarily the large cities of
northern Java. Oil spills, slowly degrading toxic wastes from chemical as well as non-
chemical industries, agricultural runoff and heavy metals threaten coastal waters. This
has resulted in severe pollution in some areas, such as Sunda (UNEP 2005). Because of
inadequate sewage disposal and treatment throughout the region, microbiological
pollution is severe, especially around urban centres. Eutrophication is also severe
around urban centres, particularly in areas with limited water circulation and where
sewage, agricultural and/or industrial discharges are present.
Siltation rates in this LME are among the highest in the world (Hodgson & Dixon 1992).
Pollution by suspended solids is severe in coastal waters, particularly in north Java and
Sumatra, with high turbidity over wide areas. Close to the major urban centres, the
affected zone extends up to 50 km offshore (Hopley & Suharsono 2000). This has mostly
resulted from extensive deforestation in many watersheds, compounded by high rates of
erosion as well as industrial mining. Solid waste is a severe problem locally, particularly
276
12. Indonesian Sea LME
in the Java Sea and around the cities, towns and villages where waste management is
inadequate.
Chemical pollution from agricultural pesticides and industries is severe in localised areas.
Mercury contamination from gold mining is widespread and is generating serious health
as well as environmental risks in Indonesia (Limbong et al. 2003). Studies conducted by
Kambey et al. (2001) showed that mercury levels in the tissue of fish near gold mines
were higher than that recommended by the WHO for total restriction on fish consumption.
The disposal of toxic materials from mines via submarine tailings placement is of special
relevance to Indonesian marine life (Perrin et al. 2002). In the next decade, the world's
biggest copper and gold mine situated in Indonesia will discharge more than one
billion tonnes of tailings over a wide area. This LME forms part of both the main and
Ultra Large Crude Carrier oil tanker routes between the Indian and Pacific Oceans.
Furthermore, there is regular discharge of ship ballast waters in this LME. In addition to
spills, chronic pollution from oil production facilities and refineries is evident in some
areas such as Sunda (Hopley & Suharsono 2000).
Habitat and community modification: The Indonesian Sea LME has a large diversity
of coastal habitats, including extensive mangroves, coral reefs and seagrass beds. The
area of Indonesia's mangroves has been estimated to range from 24,000 km2 (Tomascik
et al. 1997) to 42,500 km2 (Wilkinson et al. 1994), representing over two thirds of the area
of mangroves in Southeast Asia. Seagrass beds are even more extensive (30,000 km2
according to Tomascik et al. 1997). Estimated coral reef areas range from 50,000 to
90,000 km2 (Spalding et al. 2001) to 85,707 km2 (Tomascik et al. 1997). Overall, habitat
and community modification was assessed as severe in the Sunda and Wallacea sub-
regions, and moderate in the Sahul (UNEP 2005). Extensive cutting for timber,
conversion for aquaculture and other forms of coastal development, heavy siltation,
pollution and destructive fishing have caused major fragmentation and reduction in
mangrove area. For example, more than 30% of the mangroves in north Java
disappeared during the last 150 years. About 80% of the reefs are at extremely high risk
of further damage from human activities (Bryant et al. 1998, Burke et al. 2002). In the
last 50 years, the proportion of degraded reefs has increased from 10% to 50% (Hopley
& Suharsono 2000). In central Indonesia, 40% of coral reefs are currently classified as
being in poor condition and only 6% in excellent condition (Hopley & Suharsono 2000).
Damage to coral reefs from the use of explosives and poisons is catastrophic. Johannes
& Riepen (1995) forecast the collapse of the live fish industry in Indonesia and this does
appear to be happening in many areas (Bentley 1999). On regularly bombed reefs, coral
mortality can range from 50% to 80%, even in National Parks (Pet-Soede & Erdmann
1999). The effects of cyanide fishing are multiple. In addition to being broken to retrieve
stunned fish, corals are also bleached by the cyanide (Johannes & Riepen 1995) and
recovery may take up to half a century (Cesar 1996). As reefs become damaged and
unproductive, they are abandoned by fishers who move to new reefs to continue this
pattern of destruction. Indonesian coral reefs are also impacted by pollution. Reefs
subject to land-based pollution (sewage, sedimentation and/or industrial pollution) show
30% to 50% reduced diversity at 3 m and 40% to 60% reduced diversity at 10 m depth
relative to unpolluted reefs (Edinger et al. 1998). This implies a dramatic, rapid decrease
in Indonesian reef-based fisheries resources. Mining and quarrying of coral is another
significant threat to the LME's coral reefs and is widespread at both subsistence and
commercial levels, despite being banned by various provincial governments (Hopley &
Suharsono 2000). Indonesia's reefs have also been impacted by the 1997-1998 El Nińo
event that triggered widespread bleaching, with western and west-central Indonesia most
affected.
VIII East Asian Seas
277
Modification of coastal habitats has resulted in major changes in population structure as
well as functional group composition, notably on coral reefs, and massive changes in
ecosystem services of coral reefs and mangroves (DeVantier et al. 1999). For instance,
the important nursery and feeding ground role of mangroves as well as seagrass beds for
fish and marine mammals have been lost over extensive areas. Habitat modification and
loss have also contributed to the decline in populations of marine mammals such as
dugong (Marsh et al. 2001). Habitat degradation has significant transboundary
implications in terms of reduced fish recruitment and impacts on migratory species as
well as on biodiversity throughout the region.
Unless there are improvements in regulation and expansion and improved management
of protected areas, the health of the LME is likely to deteriorate further primarily because
of the predicted increases in fisheries, deforestation, agriculture, aquaculture, mining and
industrialisation as well as a major increase in population without the required
improvements in infrastructure.
IV. Socioeconomic Conditions
The population of Indonesia as a whole is about 222 million in 2006 (Indonesian Central
Statistics Bureau, 2006), with some 200 million people living in the LME region. The total
population is expected to double to 400 million by 2035. Subsistence farming and fishing
are the major activities of large numbers of people outside the main urban centres. Most
of the approximately 6,000 coastal communities are directly dependent on the sea as
their primary source of food and income (Dahuri & Dutton 2000). Coastal and marine
industries, including oil and gas production, transportation, fisheries and tourism, account
for 25% of the nation's GDP, in addition to employing a significant percentage of
Indonesia's workforce (Dahuri & Dutton 2000).
The socioeconomic impacts of overexploitation of fisheries include reduced economic
returns as well as loss of employment of fisher families, conflicts between user groups,
loss of food sources for human and animals and injury or loss of human life from diving
accidents (Johannes & Djohani 1997). Losses in revenue to the Indonesian economy as
a result of poaching by foreign boats may top four billion US dollars (Perrin et al. 2002).
The reefs of Indonesia provided annual economic benefits of US$1.6 billion per year in
2002, based on their value in food security, employment, tourism, pharmaceutical
research and shoreline protection. However, over the next 20 years, human impacts,
notably overfishing, destructive fishing and sedimentation, could cost Indonesia some
US$2.6 billion (Burke et al. 2002). The cost from fish bombing alone over the next
20 years will be at least US$570 million (Cesar 1996, Pet-Soede et al.2000), while the
economic loss from cyanide fishing is estimated to be US$46 million annually (Hopley &
Suharsono 2000).
Pollution has severe socioeconomic impacts, especially around major urban centres and
coastal villages (UNEP 2005). Water pollution is found in virtually all populated and/or
highly industrialised areas of Indonesia and is known to cause massive fish kills, harvest
failure from aquaculture and threats to human health (Dahuri 1999, Hopley & Suharsono
2000). Habitat and community modification impact local fisheries, cause increased
beach erosion and have adverse consequences for tourism, due to loss of aesthetic
value and the cost of mitigation measures.
V. Governance
The Indonesian Sea LME is governed by Indonesia and the recently independent state of
East Timor. Indonesia uses the `Archipelagic Doctrine' to define its territorial waters;
most of this LME is within archipelagic waters. Marine governance in Indonesia is very
complex as there are three levels of government district, provincial and national with
278
12. Indonesian Sea LME
marine jurisdiction. The government has sponsored the Coral Reef Rehabilitation and
Management Programme, a 15-year initiative aimed at strengthening the management of
the country's coastal resources while considering the needs of coastal communities.
Since the 1980s, there have been major advances in the regional capacity for
development of policy and legislation based on sound science. For example, a `critical
mass' of regional expertise now resides in government, inter-governmental agencies,
academic institutions and NGOs. There is also an extensive literature on the marine
environment in Indonesia that is published locally in the Indonesian language.
An urgent priority regarding the management of the country's coastal and marine living
resources is the development of a functional, integrated network of MPAs (UNEP 2005).
This must be accompanied by the establishment of substantial no-take zones as well as
the development of appropriate policy and legal frameworks. The National Parks Service
manages six National Marine Parks and several other Terrestrial National Parks with
marine areas. These parks cover a total sea space of 41,129 km2, equivalent to 1.3% of
the country's territorial and archipelagic seas (Putra & Mulyana 2003). Indonesia is
developing co-management strategies for improving the management of these parks.
The LME falls within the UNEP-administered East Asian Regional Seas Programme (see
Gulf of Thailand LME). Indonesia participated in the GEF-supported project `Regional
Programme for Marine Pollution Prevention and Management in the East Asian Seas
region' from 1994 to 1999. This country is also participating in the GEF-supported
PEMSEA (see Gulf of Thailand LME) and Bay of Bengal LME projects (see Bay of
Bengal LME and www.fao.org/).
References
Belkin, I.M. (2008) Rapid warming of Large Marine Ecosystems, Progress in Oceanography, in
press.
Belkin, I. M. and Cornillon, P.C. (2003) SST fronts of the Pacific coastal and marginal seas. Pacific
Oceanography 1(2): 90-113.
Belkin, I.M., Cornillon, P.C. and Sherman, K. (2008). Fronts in Large Marine Ecosystems of the
world's oceans. Progress in Oceanography, in press.
Bentley, N. (1999). Fishing for Solutions: Can the Live Trade in Wild Groupers and Wrasses From
Southeast Asia be Managed? A report for TRAFFIC Southeast Asia.
Bryant, D., Burke, L., McManus, J. and Spalding, M. (1998). Reefs at Risk. A Map Based Indicator
of Threats to the World's Coral Reefs. WRI, ICLARM, WCMC and UNEP, Washington D.C.,
U.S.
Burke, L, Selig, E. and Spalding, M. (2002). Reefs at Risk in Southeast Asia. World Resources
Institute.
Cesar, H. (1996). Economic Analysis of Indonesia Coral Reefs. World Bank, Washington D.C., U.S.
Cesar, H.S.J., Warren, K.A., Sadovy, Y., Lau, P., Meijer, S. and van Ierland, E. (2000). Marine
market transformation of the live reef fish food trade in Southeast Asia, in: Cesar, H.S.J. (ed),
Collected Essays on the Economics of Coral Reefs. CORDIO, Department of Biology and
Environmental Sciences, Kalmar University, Sweden.
Chou, L.M. (1997). Southeast Asia as the global center of marine biodiversity. Tropical Coasts 4: 4-
8.
Dahuri, R. (1999). Coastal zone management in Indonesia: Issues and approaches, p 60-72 in:
Rais, J., Dutton, I.M., Pantimena, L., Plouffe, J. and Dahuri, R. (eds), Integrated Coastal and
Marine Resource Management Proceedings International Symposium, Malang, 1998.
Dahuri, R. and Dutton, I. (2000). Integrated Coastal and Marine Management Enters a New Era in
Indonesia. Integrated Coastal Zone Management 1:11-16.
Dalzell, P. and Pauly, D. (1989). Assessment of the fish resources of Southeast Asia, with
emphasis on the Banda and Arafura Seas. Netherlands Journal of Sea Research 24(4): 641-
650.
VIII East Asian Seas
279
DeVantier, L.M., Suharsono, Budiyanto, A., Tuti, J., Imanto, P. and Ledesma, R. (1999). Status of
the Coral Communities of Pulau Seribu, Java Sea, Indonesia, p 1-24 in: Soemodihardjo, S.
(ed), Contending with Global Change Study 10. Proceedings Coral Reef Evaluation Workshop
Pulau Seribu, Jakarta, Indonesia. UNESCO/Indonesian Institute of Sciences.
Dwiponggo, A., Hariati, T., Banon, S., Palomares, M.L. and Pauly, D. (1987). Growth, mortality and
recruitment of commercially important fishes and penaeid shrimps in Indonesian waters.
ICLARM Technical Reports. 17, 91 p.
Edinger, E.N., Jompa, J., Limmon, G.V., Widjatmoko, W. and Risk, M.J. (1998). Reef degradation
and coral biodiversity in Indonesia: Land-based pollution, destructive fishing practices and
changes over time. Marine Pollution Bulletin 36 (8):617-630.
FAO (2005). Fishery Country Profiles Indonesia. www.fao.org/countryprofiles/index
Feng, M., Meyers, G., Pearce, A. and Wijffels, S. (2003) Annual and interannual variations of the
Leeuwin Current at 32°S, Journal of Geophysical Research, 108(11), 3355,
doi:10.1029/2002JC001763.
Hodgson, G. and Dixon J.A. (1992). Sedimentation damage to marine resources: Environmental
and economic analysis, in: Marsh J.B. (ed), Resources and Environment in Asia's Marine
Sector. Taylor and Francis, Washington, U.S.
Hopley, D. and Suharsono (2000). The Status of Coral Reefs in Eastern Indonesia. Australian
Institute of Marine Science, Townsville, Australia.
Indonesian Central Statistics Bureau (1 September 2006). "Tingkat Kemiskinan di Indonesia
Tahun 20052006" (in Indonesian). Press release.
Johannes, R.E. and Djohani, R. (1997). Reducing the incidence of the bends in Indonesian fishing
villages: Education may not be enough. SPC Live Reef Fish Bulletin 3.
Johannes, R.E. and Riepen, M. (1995). Environmental, Economic and Social Implications of the
Live Reef Fish Trade in Asia and the Western Pacific. Report for the Nature Conservancy and
South Pacific Forum Fisheries Agency.
Kahn, B. and Fauzi, A. (2001). Fisheries in the Sulu Sulawesi Seas Indonesian Country Report.
Assessment of the State of Biophysical, Socio-economic and Institutional Aspects of Coastal
and Pelagic Fisheries in the Indonesian Part of the Sulu-Sulawesi Seas. WWF Sulu-Sulawesi
Marine Eco-region Fisheries Project.
Kahn, B. and Pet, J. (2003). Long-term Visual and Acoustic Cetacean Surveys in Komodo National
Park, Indonesia 1999-2001: Management Implications for Large Migratory Marine Life, in:
Proceedings and Publications of the World Congress on Aquatic Protected Areas 2002.
Australian Society for Fish Biology.
Kambey, J.L., Farrell, A.P. and Bendell-Young, L.I. (2001). Influence of illegal gold mining on
mercury levels in fish of north Sulawesi's Minahasa Peninsula, (Indonesia). Environmental
Pollution (114)3: 299-302.
Licuanan, W.Y. and Gomez, E.D. (2000). Philippine Coral Reefs and Associated Fisheries Status
and Recommendations to Improve their Management. Global Coral Reef Monitoring Network.
Institute of Marine Science, Townsville, Australia.
Limbong, D., Kumampung, J., Rimper, J., Arai, T. and Miyazaki, N. (2003). Emissions and
environmental implications of mercury from artisanal gold mining in North Sulawesi, Indonesia.
The Science of the Total Environment (302)1-3:227-236.
Marsh, H., Penrose, H., Eros, C. and Hugues, J. (2001). Dugong Status Report and Action Plans
for Countries and Territories. Early Warning and Assessment Report Series.
UNEP/DEWA/RS.02-1.
Morgan, J. (1989). Large Marine Ecosystems in the Pacific Ocean. p 377-394 in: Sherman, K.,
Alexander, L.M. and Gold, B.D. (eds). Biomass Yields and Geography of Large Marine
Ecosystems. AAAS Selected Symposium 111. Westview Press. Boulder, U.S.
Palomares, M.L.D. and Heymans, J.J. (2006). Historical Ecology of the Raja Ampat Archipelago,
Papua Province, Indonesia, Fisheries Centre Research Report 14(7), 64 pp
Pauly, D. and Christensen, V. (1995). Primary production required to sustain global fisheries.
Nature 374: 255-257.
Pauly, D. and Martosubroto, P. (eds). (1996). Baseline studies in biodiversity: the fish resources of
western Indonesia. ICLARM Studies and Reviews 23. 390 p.
Pauly, D. and Watson, R. (2005). Background and interpretation of the `Marine Trophic Index' as a
measure of biodiversity. Philosophical Transactions of the Royal Society: Biological Sciences
360: 415-423.
Perrin, W.F., Reeves, R.R., Dolar, M.L.L., Jefferson, T.A., Marsh, H., Wang J.Y. and Estacion, J.,
eds. (2002). Report of the Second Workshop on the Biology and Conservation of small
280
12. Indonesian Sea LME
Cetaceans and Dugongs of SE Asia. Silliman University, Dumaguete City, Philippines 24-26
July, 2002.
Pet, J. and Pet-Soede, L. (1999). A note on cyanide fishing in Indonesia. SPC Live Reef Fish
Bulletin 5:21-22.
Pet-Soede, L. and Erdmann, M. (1999). An overview and comparison of destructive fishing
practices in Indonesia. SPC Live Reef Fish Bulletin 4:28-36.
Pet-Soede, L., Cesar, H. and Pet, J. (2000) Blasting away: The economics of blast fishing on
Indonesian coral reefs, p 77-84 in: Cesar, H. (ed), Collected Essays on the Economics of Coral
Reefs. CORDIO, Kalmar University, Kalmar, Sweden.
Pitcher, T.J., Ainsworth, C.H. and Bailey, M. (eds). (2007). Ecological and economic analyses of
marine ecosystems In the Bird's Head Seascape, Papua, Indonesia. Fisheries Centre
Research Report 15(5) 184 pp.
Pratt, V. R., Mamauag, S., Alban, J., Parfan, E. and Donaldson, T. (2000). Status Report on the
Philippine Live Reef Fish Trade and Strategies to Combat its Destructive Fishing Practices.
Workshop on the Status of Philippine Reefs, 24 January 2000, Marine Science Institute,
University of the Philippines.
Putra, S. and Mulyana, Y. (2003). Linking Coral Reef Conservation into Integrated Coastal
Management as Part of Indonesia Sea Large Marine Ecosystem. An Experience of Coral Reef
Rehabilitation and Management Program, COREMAP Phase II.
Roberts, C.M., Colin, J.M., Veron, J.E.N., Hawkins, J.P., Allen, G.R., McAllister, D.E., Mittermeier,
C.G., Schueller, F.W., Spalding, M., Wells, F., Vynne, C. and Werner, T.B. (2002). Marine
biodiversity hotspots and conservation priorities for tropical reefs. Science 295:1280-1284.
Sadovy, Y. and Pet, J. (1998). Wild collection of juveniles for grouper mariculture: Just another
capture fishery? SPC Live Reef Fish Information Bulletin 4:36-39.
Sea Around Us (2007). A Global Database on Marine Fisheries and Ecosystems. Fisheries Centre,
University British Columbia, Vancouver, Canada. www.seaaroundus.org/lme/
SummaryInfo.aspx?LME=38
Spalding, M., Ravilious, C. and Green, E.P. (2001). World Atlas of Coral Reefs. United Nations
Environment Programme World Conservation Monitoring Centre, Cambridge, U.K.
Teh, L., Zeller, D., Cabanban, A., Teh, L. and Sumaila, U.R. (2007). Seasonality and historic trends
in the reef fisheries of Pulau Banggi, Sabah, Malaysia. Coral Reefs 26: 251-263.
Tomascik, T., Mah, A.J., Nontji, A. and Moosa, M.K. (1997). The Ecology of the Indonesian Seas.
Periplus 2 Volumes.
UN (2002). Johannesburg Summit (2002) Indonesia Country Profile. United Nations Department of
Economic and Social Affairs. Division for Sustainable Development. www.un.org/esa/
agenda21/ natlinfo/wssd/indonesia.pdf
UNEP (2005). DeVantier, L., Wilkinson, C., Lawrence, D. and Souter, D., eds. Indonesian Seas,
GIWA Regional Assessment 57. University of Kalmar, Kalmar, Sweden. www.giwa.net/
publications/r57.phtml
Vantier, L.,. Wilkinson, C., Lawrence, D. and Souter, D., editors (2005) Indonesian Seas, GIWA
Regional assessment 57, University of Kalmar on behalf of United Nations Environment
Programme, Kalmar, Sweden, 140 pp., xv.
Veron, J.E.N. (2000). Corals of the World. Australian Institute of Marine Science, Townsville,
Australia.
Wilkinson, C., Gomez, E. and Sudara, S. (1994). Status of coral reefs in the ASEAN region, p 8-12
in: Wilkinson, C.R. (ed), Living Coastal Resources of Southeast Asia: Status and Management.
Report of the Consultative Forum Third ASEAN-Australia Symposium on Living Coastal
Resources, May 1994, Thailand. Australian Agency for International Development.
Zijlstra, J.J. and Baars, M.A. (1990). Productivity and Fisheries Potential of the Banda Sea
Ecosystem, p 54-65 in: Sherman, K., Alexander, L.M. and Gold, B.D. (eds), Large Marine
Ecosystems: Patterns, Processes and Yields. AAAS Press, Washington, D.C., U.S.
VIII East Asian Seas
281
VIII-13 North Australian Shelf LME
M.C. Aquarone and M. Furnas
The North Australian Shelf LME is a tropical sea lying between the Pacific and the Indian
Oceans. It extends from the Timor Sea to the Torres Strait and includes the Arafura Sea
and Gulf of Carpentaria. The LME covers an area of nearly 800,000 km2, of which 2.17%
is protected, and contains 0.70% of the world's coral reefs (Sea Around Us 2007). A
broad continental shelf links Australia with eastern Indonesia and Papua New Guinea.
Despite high local currents, there is very little net exchange of water between the Pacific
and Indian Oceans through the shallow Torres Strait. It is bordered by the Timor Trough
to the north. The Indonesian Throughflow, a warm-water current flowing from the Pacific
into the Indian Ocean, crosses the north-western part of this LME and plays a vital role in
driving the world's climate system, carrying up to 10,000,000 cubic meters per second
from the Pacific Ocean into the Indian Ocean. The Throughflow is of particular
importance to Australia since it helps warm the sea surface of the Indian Ocean and is a
major driver of climate in northern Australia. The region has a monsoonal climate and
tropical cyclones are common seasonal events. A report pertaining to this LME is given
by UNEP (2003).
I. Productivity
The North Australian Shelf LME is a Class I, high productivity ecosystem (>300 gCm-2yr-1),
although offshore areas are more oligotrophic (Rothlisberg et al., 1994). Northern
Australian waters are dominated by picoplankton-sized cyanobacteria, although the large
colony-forming N-fixing cyanobacterium Trichodesmium is often abundant in these
waters. Nutrient discharge from rivers is restricted to the summer wet season and is
highly variable within and between years. Tidal mixing is a major contributor to the
nutrient dynamics of this generally shallow LME. Bottom friction acts in a manner
analogous to wind stress on the surface to mix the water column. Monsoonal winds and
tropical cyclones also contribute to nutrient enrichment of shelf waters in this LME. Well-
developed mangrove creeks occur along much of the coastline which is characterized by
fine sediment and low relief. Tropical cyclones have a pronounced effect on the
continental shelf and on the coastal ecosystems. The episodic rainfall that accompanies
cyclonic weather systems can be a major source of freshwater to the region, causing
widespread flooding. Supra-tidal mud flats are found along coastal areas throughout the
region, particularly the arid and dry-tropical coastline in areas of low relief of the southern
Gulf of Carpentaria. These flats concentrate salt and nutrients for extended periods
following tidal inundations and rainfall, then release salty, nutrient-laden water into the
coastal zone (Wolanski and Ridd, 1990). The quantitative contribution of these
processes to the coastal zone is not well known.
Temperature and salinity measurements of the Indonesian Throughflow and the South
Equatorial Current which flow into the LME region were made as part of the World Ocean
Circulation Experiment. Volumetric estimates of the Indonesian Throughflow are still not
well constrained, but are known to vary with large-scale climate variability processes
such as ENSO. Surface waters in the Timor and Arafura Seas are generally lower in
salinity than adjacent oceanic waters due to higher precipitation. High salinities can
occur in many coastal areas due to enhanced evaporation, particularly at the end of the
dry season. For information on the marine environment around Australia, see CSIRO
(2007). A general description of oceanographic processes affecting the nutrient


282
13. North Australian LME
dynamics and productivity of Australian marine ecosystems is given in the State of the
Environment Report (www.ea.gov.au/index.html). For more information on productivity,
see Furnas (2002) and Rothlisberg et al. (1994).
Oceanic fronts (Belkin, 2005; Belkin and Cornillon, 2003): The Gulf of Carpentaria is the
largest physiographic province within this LME and is surrounded by a major seasonal
coastal front (Gulf of Carpentaria Front, GCF) (Figure VIII-13.1). The offshore Cape
Arnhem Front (CAF) and Cape York Peninsula Front (CYPF) emerge seasonally near the
northwest and northeast entrances to the Gulf, respectively. Farther west, the coastal
Arafura Sea Front (ASF) is observed north of Arnhem Land, while the coastal Joseph
Bonaparte Gulf Front (JBGF) develops in the southern part of the Timor Sea. In the past,
a significant amount of pelagic fishing activity has been concentrated in the region of the
Arafura Sea Front. These fronts are likely to play an important role in the ecology of
commercially important prawns (Belkin and Cornillon 2003).
Figure VIII-13.1. Fronts of the North Australian Shelf LME. ASF; Arafura Sea Front; CAF, Cape Arnhem
Front; CYPF, Cape York Peninsula Front; GCF, Gulf of Carpentaria Front; JBGF, Joseph Bonaparte Gulf
Front. Yellow line, LME boundary. After Belkin et al. (2008) and Belkin and Cornillon (2003).
North Australian Shelf SST (after Belkin 2008)
Linear SST trend since 1957: 0.42°C.
Linear SST trend since 1982: 0.17°C.
Like the adjacent Indonesian Sea LME, the North Australian Shelf LME underwent a
cooling that lasted through 1977, after which SST rose steadily (Figure VIII-13.2). The
observed similarity of thermal histories of these LMEs is expected since the North
Australian Shelf is oceanographically connected to the Indonesian Sea by the Indonesian
Throughflow. The all-time minimum of 1976-77 is similar to the 1976 all-time minimum
observed in the Northwest Australian Shelf LME. The all-time maximum of 1998
coincided with the El Nińo 1997-98 which had significant oceanographic impacts
throughout the Indonesian Archipelago and along the western Australian coast. The
warm event of 1988 occurred simultaneously with the Sulu-Celebes LME, Northeast
Australian Shelf LME, East-Central Australian Shelf LME, and only a year later in the
VIII East Asian Seas
283
Southeast Australian Shelf LME. The twin peaks of 1970-1973 occurred simultaneously
in the adjacent Northeast Australian Shelf LME and the East-Central Australian Shelf
LME, especially the warm event of 1973. Interannual variability of SST in this LME is
substantial, partly explained by the very shallow upper mixed layer in the tropics.
Figure VIII-13.2. North Australian Shelf LME annual mean SST (left) and SST anomalies (right), 1957-
2006, based on Hadley climatology. After Belkin (2008).
North Australian Shelf LME Chlorophyll and Primary Productivity: The North
Australian Shelf LME is a Class I, high productivity ecosystem (>300 gCm-2yr-1), although
offshore areas are more oligotrophic (Rothlisberg et al., 1994). These estimates are
largely based upon ocean color satellite imagery and the optical properties of northern
Australian waters are poorly characterized at present.
Figure VIII-13.3. Estimated North Australian Shelf trends in chlorophyll a (left) and primary productivity
(right) from ocean color imagery, 1998 2006. Values are colour coded to the right hand ordinate.
Figure courtesy of J. O Reilly and K. Hyde.
II. Fish and Fisheries
Fish stocks in the North Australian Shelf LME are small but diverse. The level of
endemism in the northern Australian LMEs is low, with most species distributed widely in
the Indo-West Pacific region. Commercially fished species in the LME include northern
prawns (Gulf of Carpentaria and Joseph Bonaparte Gulf), threadfin bream, skipjack tuna,
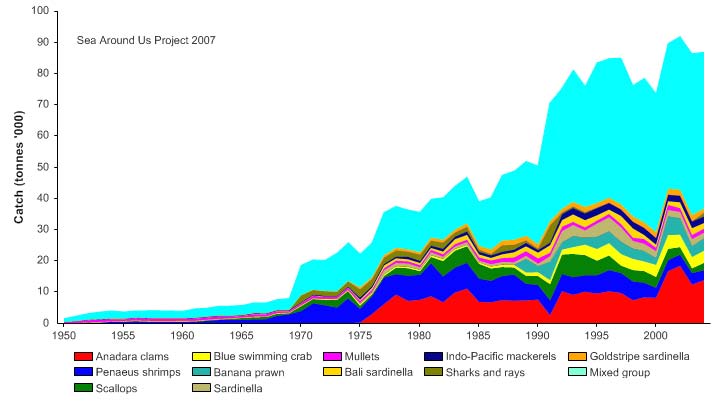
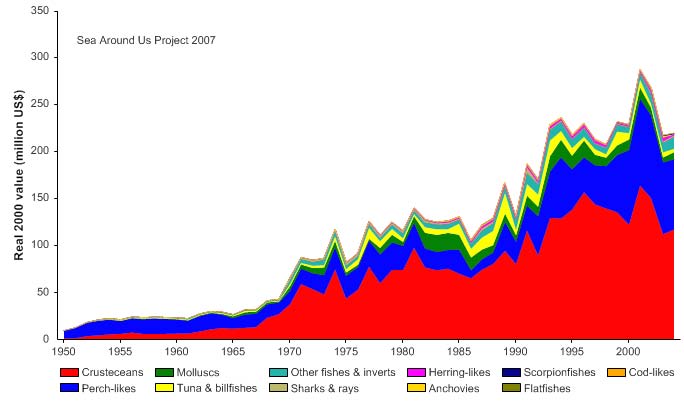
284
13. North Australian LME
Indo-Pacific anchovies, mud crab, barramundi, salmon, shark, Spanish mackerel, as well
as snappers and reef fish. About half of the reported landings consist of mixed taxa
(Figure VIII-13.4). In the Arafura Sea and Gulf of Carpentaria, the prawn fishery is almost
fully exploited. Crustaceans and molluscs dominate the catch, particularly in the Gulf of
Carpentaria where prawns are targeted. Shark populations have been significantly
depleted as a result of the shark fin fishery. Information on Australia's fisheries is
provided by FAO (www.fao.org/fi/FCP/FICP_AUS_E.ASP). Total reported landings grew
steadily to ~87,000 tonnes in 2004 (Figure VIII-13.4). The value of the reported landings
showed a general increase, with a maximum value of just under US$300 million (in 2000
US dollars) in 2001 (Figure VIII-13.5). Penaeid shrimps and tuna are the two most
important groups in terms of value.
Figure VIII-13.4. Total reported landings in the North Australian Shelf LME by species (Sea Around Us
2007).
Figure VIII-13.5. Value of reported landings in the North Australian Shelf LME by commercial groups
(Sea Around Us 2007).
The primary production required (PPR; Pauly & Christensen 1995) to sustain the reported
landings in this LME is still below 2%--much lower than other LMEs of comparable
characteristics (Figure VIII-13.6) although this is not surprising given the high rates of in
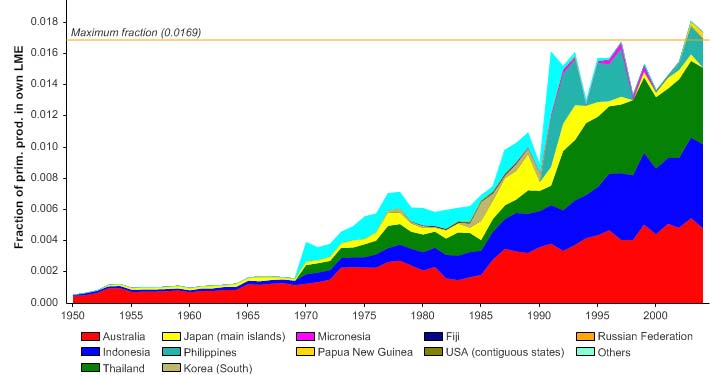
VIII East Asian Seas
285
situ recycling. Australia, Indonesia and Thailand account for the largest share of the
ecological footprint in the LME.
Figure VIII-13.6. Primary production required to support reported landings (i.e., ecological footprint) as
fraction of the observed primary production in the North Australian Shelf LME (Sea Around Us 2007).
The `Maximum fraction' denotes the mean of the 5 highest values.
The long term trend of the mean trophic level (i.e., the MTI; Pauly & Watson 2005) for this
LME is one of a decline from 1950 to the mid 1980s (Figure VIII-13.7, top), indicating a
`fishing down' of the food web (Pauly et al. 1998); followed by an increase, which
coincides with the increased landings of tuna and other large pelagic species. The
pattern is confirmed by the FiB index (Figure VIII-13.7, bottom), which also suggests a
steady expansion (Pauly & Watson 2005).
Figure VIII-13.7. Mean trophic level (i.e., Marine Trophic Index) (top) and Fishing-in-Balance Index
(bottom) in the North Australian Shelf LME (Sea Around Us 2007).
286
13. North Australian LME
The Stock-Catch Status Plots indicate that only a few of the exploited stocks can be
considered collapsed or overexploited (Figure VIII-13.8, top). The majority of the
reported landings come from fully exploited stocks (Figure VIII-13.8, bottom).
1950
1960
1970
1980
1990
2000
0%
100
10%
90
20%
)
80
%
(
s
30%
t
u
70
a
st
40%
y
60
b
s
k
50%
c
o
50
f
st
60%
o
40
er
b
70%
m
30
u
N
80%
20
90%
10
100%0
1950
1960
1970
1980
1990
2000
(n = 3736)
developing
fully exploited
over-exploited
collapsed
1950
1960
1970
1980
1990
2000
0%
100
10%
90
20%
80
)
%
30%
(
70
s
u
40%
t
at
60
k s
c
50%
o
50
st
y
60%
b
h
40
t
c
a
70%
C
30
80%
20
90%
10
100%0
1950
1960
1970
1980
1990
2000
(n = 3736)
developing
fully exploited
over-exploited
collapsed
Figure VIII-13.8. Stock-Catch Status Plots for the North Australian Shelf LME, showing the proportion of
developing (green), fully exploited (yellow), overexploited (orange) and collapsed (purple) fisheries by
number of stocks (top) and by catch biomass (bottom) from 1950 to 2004. Note that (n), the number of
`stocks', i.e., individual landings time series, only include taxonomic entities at species, genus or family
level, i.e., higher and pooled groups have been excluded (see Pauly et al, this vol. for definitions).
III. Pollution and Ecosystem Health
The LME is threatened by an increase in shipping, mining activity in adjacent watersheds
and by the production and transportation of oil and other hydrocarbons. Ships empty of
cargo that enter the ports of northwest Australia are ballasted with water collected in the
last port of call. This ballast water has been shown to contain organisms including
bacteria, viruses, algal cells, plankton and the larval forms of many invertebrate and fish
species. One significant introduction of an exotic mollusc (Zebra mussel) was found and
contained at an early stage in one coastal port. The source was either a small fishing
vessel or yacht. There are accidental discharges of contaminants through spills and
shipping accidents. The dominant human impacts are related to fisheries and terrestrial
runoff from deforestation, overgrazing by livestock, and certain agricultural practices.
Compared with most countries, however, these impacts are quite modest. For more
information on marine pollution in this LME, see Environment Australia (www.ea.gov.au)
and a technical paper from EA on marine disturbances.
IV. Socioeconomic Conditions
Many residents are involved in the marine-related sectors of the economy. There are
economically significant aquaculture activities, at a number of coastal sites, based on
oyster pearls, and to a much lesser extent, prawns. Industry (mining, oil and gas
VIII East Asian Seas
287
extraction), shipping and tourism are major economic activities. Marine and coastal-
based forms of tourism are important both in terms of domestic and international tourism.
A significant proportion of the local Australian population is involved in recreational fishing
and boating. Tourists prize the coral reefs and the natural and largely unspoilt marine
environment. There are, however, social, cultural, economic and environmental impacts
caused by tourism. Tourism may affect the lifestyle of residents in ways they perceive as
intrusive. Australia's Aborigines, and the Torres Strait Islanders who occupy parts of the
far northeast of the land area, have traditionally made considerable use of reef and
coastal resources. The FAO (see website above) provides information on the
characteristics and socioeconomic benefits of Australia's fishing industry.
V. Governance
The North Australian Shelf LME lies off the coast of the states of Western Australia,
Northern Territory and Queensland. Some governance issues in this LME pertain to the
Aboriginal coastal populations, who have considerable rights regarding their traditional
use of coastal habitats. However, coastal population densities throughout much of this
region low. Australian fisheries resources are managed under both Commonwealth and
State/Territory legislation. The demarcation of jurisdiction and responsibilities among
these various governments has been agreed to under the Offshore Constitutional
Settlement, under which the states and territories have jurisdiction over localised, inshore
fisheries. The Commonwealth has jurisdiction over transboundary, foreign and offshore
fisheries or those extending to waters adjacent to more than one state or territory. Each
government has separate fisheries legislation and differing objectives. Under the
Environment Protection and Biodiversity Conservation Act 1999, the Commonwealth
Government now has a framework that helps it to respond to current and emerging
environmental problems. An important goal is to ensure that the exploitation of fisheries
resources is conducted in a manner consistent with the principles of ecologically
sustainable development. This includes the need to assess the impact of fishing
activities on non-target species and the long-term sustainability of the marine
environment. Illegal and unlicensed fishing activity is a significant and ongoing problem in
the region. By agreement with Indonesia, groups of Indonesian fishers retain rights to
fish at a number of offshore island and reef sites using traditional craft and methods. For
more information on the governance of Australia's fisheries, see the FAO website given
above.
Reserves have been declared to help protect rocky shore habitats and marine life,
provide opportunities for research and education conserve Australia's cultural heritage
and help boost ecotourism. In 2001, a Government-held consultation process indicated
strong community support to further protect these aquatic reserves. The marine tourism
industry has produced a code of conduct that covers issues such as anchoring, removal
of rubbish, fish feeding and the preservation of World Heritage values. Australia declared
a 200-nautical-mile EEZ in 1978. The LME falls within the UNEP-administered East
Asian Regional Seas Programme.
References
Belkin, I.M. (2008) Rapid warming of Large Marine Ecosystems, Progress in Oceanography, in
press.
Belkin, I.M., Cornillon, P.C. and Sherman, K. (2008) Fronts in Large Marine Ecosystems of the
world's oceans. Progress in Oceanography, in press.
Belkin, I. M. and Cornillon, P. C. (2003). SST Fronts of the Pacific Coastal and Marginal Seas,
Pacific Oceanography, 1(2): 90-113.
288
13. North Australian LME
Environment Australia technical paper at www.ea.gov.au/soe/techpapers/marine-disturbance/
appendix1.html.
Environment Australia www.ea.gov.au/coasts/pollution/index.html
FAO (2003). Trends in Oceanic Captures and Clustering of Large Marine Ecosystems -2 Studies
Based on the FAO Capture Database. FAO Fisheries Technical Paper 435.
Feng, M., Meyers, G. Pearce, A. and Wijffels, S. (2003) Annual and interannual variations of the
Leeuwin Current at 32°S, Journal of Geophysical Research, 108(11), 3355,
doi:10.1029/2002JC001763.
Hayes, D., Lyne, V. Condie, S., Griffiths, B.. Pigot, S and Hallegraeff, G. (2005) Collation and
analysis of oceanographic datasets for National Marine Bioregionalisation, A report to the
Australian Government, National Oceans Office. CSIRO Marine and Atmospheric Research,
229 pp.
Pauly, D, Christensen, V., Dalsgaard, J., Froese, R. and Torres, F. Jr. (1998). Fishing down marine
food webs. Science 279:860-863.
Pauly, D. and Christensen, V. (1995). Primary production required to sustain global fisheries.
Nature 374: 255-257.
Pauly, D. and Watson, R. (2005). Background and interpretation of the `Marine Trophic Index' as a
measure of biodiversity. Philosophical Transactions of the Royal Society: Biological Sciences
360: 415-423.
Pogonoski, J.J., Pollard, D.A. and Paxton, J.R. (2002). Conservation Overview and Action Plan for
Australian Threatened and Potentially Threatened Marine and Estuarine Fishes. Environment
Australia, February 2002. www.ea.gov.au/coasts/species/marine-fish/pubs/marine-fish.pdf
Rothlisberg, P.C., P.C. Pollard, P.D. Nichols, D.J.W. Moriarity, A.M.G. Forbes, C.J.
Jackson and D. Vaudrey 1994 Phytoplankton community structure and productivity
in relation to the hydrological regime of the Gulf of Carpentaria, Australia, in summer.
Australian Journal of Marine and Freshwater Research 45: 265-282
Sainsbury, K.J. (1988). The Ecological Basis of Multispecies Fisheries, and Management of a
Demersal Fishery in Tropical Australia, p 349-382 in Gulland, J.A. (ed), Fish Population
Dynamics: The Implications for Management. John Wiley and Sons, New York.
Sea Around Us (2007). A Global Database on Marine Fisheries and Ecosystems. Fisheries Centre,
University British Columbia, Vancouver, Canada. www.seaaroundus.org/lme/SummaryInfo.
aspx?LME=39
UNEP (2003). Barnett, B., Lawrence, D., DeVantier, L., Skelton, P. and Wilkinson, C. North
Australia Shelf, GIWA Regional Assessment 58. University of Kalmar, Kalmar, Sweden.
Wolanski, E. and P. Ridd 1990 Mixing and trapping in Australian tropical coastal waters. p 165-
180 in Cheng, R.T. (ed), Coastal and Esturarine Studies: Residual and Long-term Transport.
Springer-Verlag, New York.
VIII East Asian Seas
289
VIII-14 Northwest Australian Shelf LME
M.C. Aquarone and M. Furnas
The Northwest Australian Shelf LME extends from Northwest Cape to the Timor Sea. It
encompasses a wide area of about 900,000 km2, of which 0.68% is currently protected in
reserves, and contains 1.17% of the world's coral reefs and 0.02% of the sea mounts
(Sea Around Us 2007). Topographical features such as the Exmouth Plateau, the
Rowley Shelf and the Sahul Shelf are found in this LME, which is positioned on the path
of the Indonesian Throughflow, a low-salinity warm-water current flowing from the Pacific
into the Indian Ocean. The Timor Sea is characterized by warm surface temperatures
year-round and generally lower salinities than in the adjacent Indian Ocean. The
Indonesian Throughflow warms the LME's sea surface and increases rainfall over
Western Australia. Rainfall is strongly seasonal, with a predictable summer wet season
and recurrent seasonal cyclonic disturbances. Tropical cyclones are common summer
(Nov-Apr) events that exert pronounced effects on the continental shelf and on the
coastal marine ecosystems. The rainfall that accompanies cyclonic weather systems is a
major source of freshwater to the region, causing widespread though episodic flooding.
Menon (1998) and UNEP (2003) have published a book chapter, and a report,
respectively, on this LME.
I. Productivity
The Northwest Australian Shelf LME is considered a Class II, moderate productivity
ecosystem (150-300 gCm-2yr-1). This estimate is largely based upon satellite imagery of
the region where relatively few direct productivity measurements have been made (Jitts,
1969; Furnas, 2007). In some areas most of the phytoplankton biomass and productivity
has little or no surface expression (Furnas, 2007). Brief episodes of very high primary
productivity (1-8 g C m-2 d-1) have been recorded in the vicinity of North West Cape
which are linked to localized upwelling against the narrow continental shelf and enhanced
vertical mixing (Hansen et al., 2005; Furnas, 2007). Productivity at North West Cape is
higher during ENSO periods when transport in the Leeuwin Current is reduced. The LME
supports diverse phytoplankton including the normally dominant picoplankton, but
regionally or episodically, populations of diatoms or Trichodesmium can dominate.
Temperature and salinity measurements of the Indonesian Throughflow and the South
Equatorial Current were made as part of the World Ocean Circulation Experiment. More
information is provided at www.marine.csiro.au.
The LME is characterised by high-energy and internal wave tidal regimes. Surface spring
tides can reach 8 m at coastal sites in the Kimberly region of NW Australia (e.g. Broome).
The sub-surface regime along the continental slope is also characterized by well-
developed and persistent internal tides and internal waves generated by interactions
between tidal currents and local bathymetry. These waves typically break on the mid-
shelf, leading to enhanced vertical mixing. Tidal mixing is a major contributor to nutrient
dynamics. Bottom friction acts in a manner analogous to wind stress on the surface to
mix the water column and resuspend sediment and organic material from the bottom.
Shelf upwelling and cyclonic disruptions also contribute to nutrient inputs in this LME.
Because of the high levels of mixing and resuspension, the continental shelf supports a
diverse demersal fish community. For a general understanding of oceanographic
processes affecting nutrient dynamics and the productivity of Australian marine
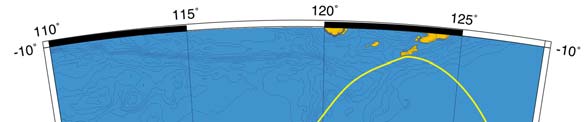
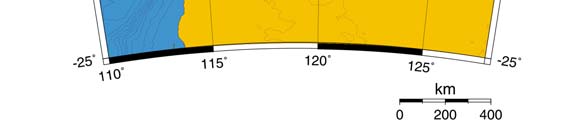
290
14. Northwest Australian LME
ecosystems, see the State of the Environment Report (www.ea.gov.au/index.html) and
Furnas (2002).
Oceanic fronts: (Belkin et al. 2008) This vast shelf is the source area of the Leeuwin
Current that flows poleward along the west coast of Australia carrying warm and low-
density tropical waters far south. Seasonal evolution of the frontal pattern over this shelf
is somewhat similar to that west of Northwest Africa and west of the U.S. West Coast.
Variations in the strength of the Leeuwin Current are linked to changes in sea level in the
western Pacific Ocean and the strength of the Indonesian Throughflow. Year-to-year
variations in flow have a strong influence on the productivity and fisheries yield along the
western Australian coast. In summer, a multitude of small-scale fronts develops that form
a chaos-like spatial pattern. As the season progresses, these small-scale fronts
apparently coalesce into large-scale (hundreds km long) coherent filaments that persist
for weeks and months. Tidal mixing over this shelf is deemed important, although no
stable tidal mixing fronts have been detected within this LME.
Northwest Australian Shelf SST (Belkin, 2008)
Linear SST trend since 1957: 0.42°C.
Linear SST trend since 1982: 0.24°C.
This LME is interesting in that its interannual and decadal variability are small compared
with other LMEs (Figure VIII-14.2). Indeed, the magnitude of interannual and decadal
variability in temperature is less than 0.5°C. The only significant warm event, the all-time
maximum of 1998, was associated with the El Nińo 1997-98. The cold event of 1976,
when SST anomaly was about -1°C relative to the long-term trend, can be associated
with the cold event of 1976-77 in the North Australian Shelf LME. This is a rare example
of a large signal confined to just two contiguous LMEs that comprise a relatively small
area. Another cold signal, of 1968, was likely advected from the Indonesian Sea LME,
where a cold event occurred in 1967. The proposed advection route is consistent with
the circulation pattern (Feng et al. 2003).
Figure VIII-14.1. Fronts of the Northwest Australian Shelf LME. KMSF, Kimberley Mid-Shelf Front;
NWCF, Northwest Coastal Front. Yellow line, LME boundary. After Belkin et al. (2008).
VIII East Asian Seas
291
Figure VIII-14.2. Northwest Australian Shelf LME annual mean SST (left) and SST anomaly (right), 1957-
2006, based on Hadley climatology. After Belkin (2008).
Northwest Australian Shelf LME Chlorophyll and Primary Productivity: The
Northwest Australian Shelf LME is considered a Class II, moderate productivity
ecosystem (150-300 gCm-2yr-1).
Figure VIII-14.3. Estimated Northwest Australian Shelf trends in chlorophyll a (left) and primary
productivity (right), 1998 2006. Values are colour coded to the right hand ordinate. Figure courtesy of
J. O'Reilly and K. Hyde.
II. Fish and Fisheries
Northwest Australian shelf waters are relatively nutrient-poor and unable to sustain large
fish populations. The level of endemism in northern Australian LMEs is low, with most
species distributed widely in the Indo-West Pacific region. Seasonal aggregations of
plankton feeding whale sharks and manta rays occur off Ningaloo Reef, which begins at
North West Cape. This LME once supported an extensive pearl shell fishery along the
coast. Following depletion of stocks, this fishery has been replaced by a harvesting and
grow-out aquaculture industry at a number of sites along the coast. This LME and the
adjacent Northern Australian Shelf LME are major suppliers of large pearls to the
international market. A small prawn fishery is located in the southern part of the LME,
principally in Exmouth Gulf, near North West Cape. Reef fisheries occur in the Rowley
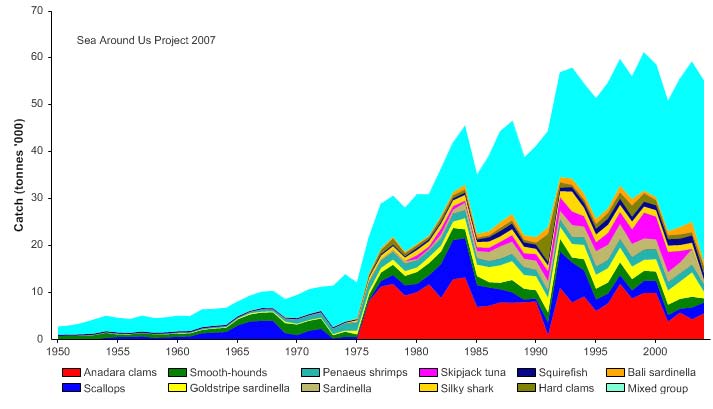
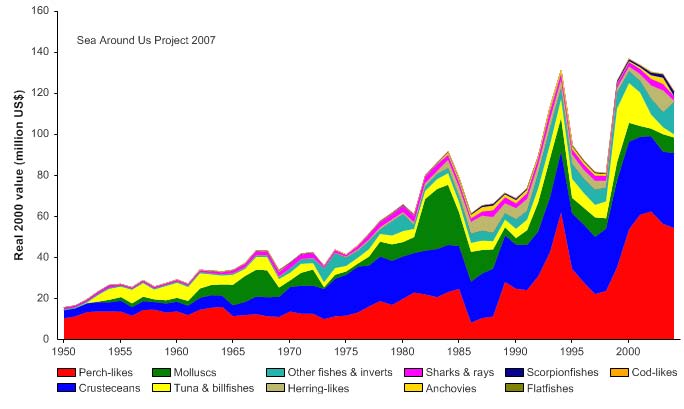
292
14. Northwest Australian LME
Shoals, Scott Reef and Ashmore Reef, a chain of coral atolls at the edge of the LME's
wide continental shelf. The former site is a marine reserve. The latter two sites are
primarily fished by traditional Indonesian fishermen using traditional boats, methods and
gear. Demersal species fished in this LME include Lethrinus, Nemipterus, Saurida and
Lutjanus, which have historically been fished by foreign fleets. Small domestic trap
fisheries for Lethrinus, Lutjanus and Epinephelus exist in areas subjected to little trawling.
Other exploited groups include Anadara clams, scallops and goldstripe sardinella, as well
as a significant number of unidentified taxa (Figure VIII-14.4). Fishing for shark fins in the
northern part of the LME has greatly depleted shark populations. FAO provides
information on Australia's fisheries industry (www.fao.org). Total reported landings show
a series of peaks in the 1990s over 50,000 tonnes with a record landings of 61,000
tonnes in 1999 (Figure VIII-14.4). From the early 1990s to 2004, the value of the catch
increased sharply, then fluctuated between US$80 million and US$140 million (in 2000
US dollars; Figure VIII-14.5).
Figure VIII-14.4. Total reported landings in the Northwest Australian Shelf LME by species (Sea Around
Us 2007).
Figure VIII-14.5. Value of reported landings in the Northwest Australian Shelf LME by commercial
groups (Sea Around Us 2007).
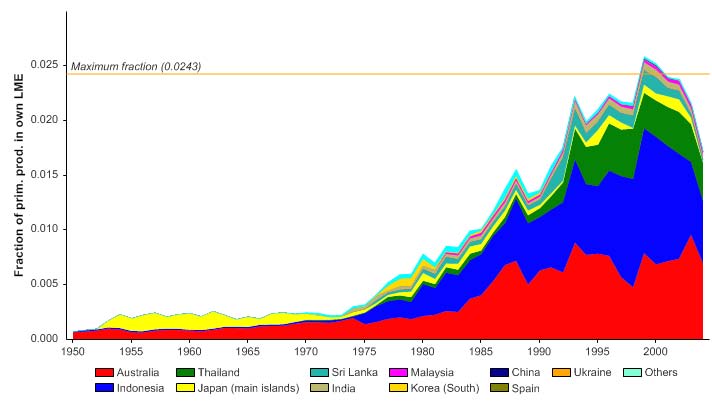
VIII East Asian Seas
293
The primary production required (PPR; Pauly & Christensen 1995) to sustain the reported
landings in this LME has reached 2.5% in the 1990s with Australia and Indonesia
accounting for the largest share of the ecological footprint (Figure VIII-14.6).
Figure VIII-14.6. Primary production required to support reported landings (i.e., ecological footprint) as
fraction of the observed primary production in the Northwest Australian Shelf LME (Sea Around Us
2007). The `Maximum fraction' denotes the mean of the 5 highest values.
Since the mid 1980s, both the mean trophic level (i.e. the MTI; Pauly & Watson 2005;
Figure VIII-14.7, top) and the FiB index (Figure VIII-14.7, bottom) showed an increase,
likely a result of geographic expansion of the fisheries and targeting of large and medium
pelagic species.
Figure VIII-14.7. Mean trophic level (i.e., Marine Trophic Index) (top) and Fishing-in-Balance Index
(bottom) in the Northwest Australian Shelf LME (Sea Around Us 2007).
294
14. Northwest Australian LME
The Stock-Catch Status Plots indicate that approximately 50% of the stocks have
collapsed or are overexploited in the LME (Figure VIII-14.8, top). The reported landings
are largely supplied by fully exploited stocks (Figure VIII-14.8, bottom).
0%
100
10%
90
20%
)
80
%
(
s
30%
u
70
at
st
40%
y
60
b
s
k
50%
c
50
t
o
f
s
60%
o
40
er
b
70%
m
30
u
N
80%
20
90%
10
100%0
1950
1960
1970
1980
1990
2000
(n = 3773)
developing
fully exploited
over-exploited
collapsed
1950
1960
1970
1980
1990
2000
0%
100
10%
90
20%
80
)
%
30%
(
70
s
t
u
a
40%
60
ck st
50%
o
50
st
y
60%
b
h
40
c
70%
Cat
30
80%
20
90%
10
100%
0
1950
1960
1970
1980
1990
2000
(n = 3773)
developing
fully exploited
over-exploited
collapsed
Figure VIII-14.8. Stock-Catch Status Plots for the Northwest Australian Shelf LME, showing the
proportion of developing (green), fully exploited (yellow), overexploited (orange) and collapsed (purple)
fisheries by number of stocks (top) and by catch biomass (bottom) from 1950 to 2004. Note that (n), the
number of `stocks', i.e., individual landings time series, only include taxonomic entities at species,
genus or family level, i.e., higher and pooled groups have been excluded (see Pauly et al, this vol. for
definitions).
III. Pollution and Ecosystem Health
The LME is threatened by an increase in shipping and the development of extensive
offshore oil and gas deposits. The shelf and adjacent continental region are a major
international source of iron ore, other minerals, ammonium, liquefied natural gas and
other petroleum products. These exports are likely to increase for the foreseeable future.
Ships empty of cargo (chiefly iron ore and LNG) that enter the ports of Northwest
Australia are ballasted with water collected in the last port of call. This ballast water has
been shown to contain organisms including bacteria, viruses, algal cells, plankton, and
the larval forms of many invertebrates and fish. There are accidental discharges of
contaminants through spills and shipping accidents. This LME's coastal marine parks,
home to a variety of plants, corals, fishes and marine mammals, are impacted to varying
degrees by tourism. In general, numbers of tourists are still relatively low due to the
remote nature of much of this LME and its bordering land mass and effects are largely
localized. There is pressure, however, for increased development of tourism
infrastructure. Activities associated with recreational fishing, SCUBA diving and boating
have the potential to affect the coastal environment around regional towns through
pollution of the water by boats and the disturbance of species and habitats. Recreational
VIII East Asian Seas
295
fishermen tend to target reef ecosystems and remove larger predatory species. The
effects of this selective removal of fish are largely unknown. A significant source of
environmental impacts is the provision of infrastructure to support the oil and gas, and
mining industries and to a lesser extent, tourism (airports, power generation facilities,
accommodation, sewage treatment and disposal facilities, moorings and marine
transport). This infrastructure is expanding rapidly and being located in fragile or pristine
environments that are susceptible to disturbance and fragmentation. For more
information, see Environment Australia for marine (www.ea.gov.au/soe/) and coastal
pollution (www.ea.gov.au/coasts) issues, and the State of the Environment Report
(www.ea.gov.au/SOE).
IV. Socioeconomic Conditions
FAO provides information on the characteristics and socioeconomic benefits of
Australia's fishing industry (www.fao.org/fi/FCP/FICP_AUS_E.ASP). There has been
exploration for oil and natural gas. A number of significant gas, and to a lesser extent, oil
fields have been discovered and large-scale development of these fields is being
undertaken at a range of sites (Scott Reef, Barrow Island, Dampier), principally to support
exports of LNG. Hydrocarbon production and export is expected to be a significant
economic activity within the region, requiring extensive infrastructure development and
growing regional populations. Industry, shipping and tourism are major economic
activities. Marine and coastal-based tourism is a relatively small-scale activity but
important both in terms of domestic and international tourism. Some tourism activities
(e.g. whale shark watching at Ningaloo Reef) are directly dependent upon marine
resources and conservation activities in other LMEs.
V. Governance
The Northwest Australian Shelf LME lies off the coast of the state of Western Australia,
close to Indonesia. Some governance issues in this LME pertain to fisheries
management and to the establishment of marine reserves (including Ningaloo Marine
Park). Indonesian fishermen using traditional craft and methods are allowed to fish at
designated sites at the northern end of this LME. After examining several possible
management regimes for this LME, the government of Australia divided the area into
three zones and closed two of them to trawling. It is thought that there will be an
expansion of trap fishing in the two closed areas after the species composition changes
induced by trawling are reversed. See the North Australian Shelf LME for information on
fisheries and tourism governance. The LME falls within the UNEP-administered East
Asian Regional Seas Programme.
References
Belkin, I.M. (2008) Rapid warming of Large Marine Ecosystems, Progress in Oceanography, in
press.
Belkin, I.M., Cornillon, P.C. and Sherman, K. (2008). Fronts in Large Marine Ecosystems of the
world's oceans. Progress in Oceanography, in press.
CSIRO (2007). www.marine.csiro.au/PressReleasesfolder/95releases/6nov95.html).
Environment Australia. (2006) www.ea.gov.au/SOE/.
www.ea.gov.au/soe/techpapers/marine-disturbance/appendix1.html
www.ea.gov.au/coasts/pollution/index.html
FAO at www.fao.org/fi/fcp/en/AUS/profile.htm
296
14. Northwest Australian LME
Feng, M., G. Meyers, A. Pearce, and S. Wijffels (2003) Annual and interannual variations of the
Leeuwin Current at 32°S, Journal of Geophysical Research, 108(11), 3355,
doi:10.1029/2002JC001763
Furnas, M.J. (2002). www.environment.gov.au/coasts/publications/somer/annex1/land-ea.html
#HDR7
Menon, H.B. (1998). Role of oceanic fronts in promoting productivity in the Southern Indian Ocean,
p 175-191 in: Sherman, K. Okemwa, E. and Ntiba, M. (eds), Large Marine Ecosystems of the
Indian Ocean: Assessment, Sustainability and Management. Blackwell Science, Cambridge,
MA, U.S.
Pauly, D. and Christensen, V. (1995). Primary production required to sustain global fisheries.
Nature 374: 255-257.
Pauly, D. and Watson, R. (2005). Background and interpretation of the `Marine Trophic Index' as a
measure of biodiversity. Philosophical Transactions of the Royal Society: Biological Sciences
360: 415-423.
Sainsbury, K.J., Campbell, R.A. and Whitelaw, A.W. (1993). Effects of trawling on the marine
habitat on the northwest shelf of Australia and implications for sustainable fisheries
management, In: Hancock, D.A. (ed), Sustainable Fisheries through Sustaining Fish Habitat.
Australian Society for Fish Biology Workshop Proceedings. Victor Harbour SA, August 1992.
Australian Government Publishing Service, Canberra.
Sea Around Us (2007). A Global Database on Marine Fisheries and Ecosystems. Fisheries Centre,
University British Columbia, Vancouver, Canada. www.seaaroundus.org/lme/SummaryInfo.
aspx?LME=45
UNEP (2003). Barnett, B., Lawrence, D., DeVantier, L., Skelton, P. and Wilkinson, C. North
Australian Shelf, GIWA Regional Assessment 58. University of Kalmar, Kalmar, Sweden.
VIII East Asian Seas
297
VIII-15 South China Sea LME
S. Heileman
The South China Sea LME is bordered by China, Indonesia, Malaysia, Philippines,
Taiwan and Vietnam. It covers an area of 3.2 million km2, of which 0.31% is protected,
and contains 7.04% and 0.93% of the world's coral reefs and sea mounts, respectively
(Sea Around Us 2007). Coastal waters are relatively shallow (less than 200 m) and
influenced by marine as well as by river and terrestrial inputs. The South China Sea
Basin and Palawan Trough are deeper than 1,000 m. Numerous rivers (120) drain a
total catchment area of 2.5 million km2 into the LME. Most of the region lies within the
sub-tropical and equatorial zones and the climate is governed by the northeast and
southwest monsoon regimes. The northern and central parts of the region are affected
by typhoons during the southwest monsoon months, bringing intense rains and
destructive winds to coastal areas. This LME is particularly sensitive to ENSO, which
has caused significant changes in rainfall patterns, for example, in Indonesia and
Malaysia. Major oceanographic currents include those generated by the seasonal
monsoons. Waters from the LME may flow seasonally into the Sulu Sea and Java Sea,
contributing to the Indonesian Throughflow. The component subsystems of this LME
have been documented in Pauly & Christensen (1993). Other reports pertaining to this
LME are listed in the references (see also Talaue-McManus 2000, UNEP 2005).
I. Productivity
The South China Sea LME is a biologically diverse marine ecosystem with a tropical
climate. It is considered a Class II, moderate production ecosystem (150-300 gCm-2yr-1).
The Indo-West Pacific marine biogeographic province, which includes the South China
Sea LME, is well-recognised as a global centre of marine shallow-water, tropical
biodiversity (Spalding et al. 1997, Tomascik et al. 1997). Over 450 coral species have
been recorded from the Philippines. Recent estimates suggest that approximately
2 million ha of mangrove forest or 12% of the world total are located in the countries
bordering the South China Sea LME (Talaue-McManus 2000). Six species of marine
turtles, all considered as either Endangered or Vulnerable by the IUCN, the dugong and
several other species of marine mammal included on IUCN's Red List of Threatened
Animals occur in this LME. Many of these exhibit transboundary migratory behaviour,
which presents major challenges for their conservation.
Oceanic fronts: Fronts observed within this LME (Figure VIII-15.1) are quite diverse
(Belkin & Cornillon 2003, Belkin, 2005). The South China Inner Shelf Front (SCISF) and
South China Outer Shelf Front (SCOSF) extend along southern China coast from Hainan
Island into Taiwan Strait. The Gulf of Tonkin Front (GTF) is of the estuarine origin; the
salinity differential across this front is controlled by a massive river discharge into the
Gulf, mostly by the Red River. The Vietnam Coastal Front (VCF) is largely caused by
wind-induced coastal upwelling and is thus strongly monsoon-dependent. The West
Luzon Front (WLF) appears as a relatively broad frontal zone southwest of the Luzon
Strait; it is likely caused by the inflow of the Pacific waters; the wind-induced upwelling
also contributes to frontal maintenance.
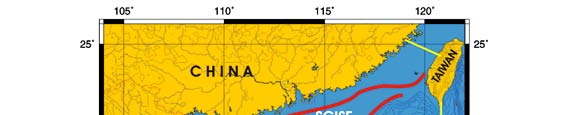
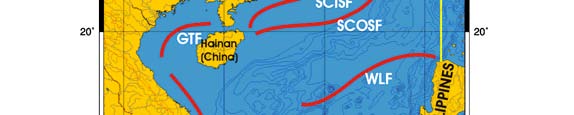
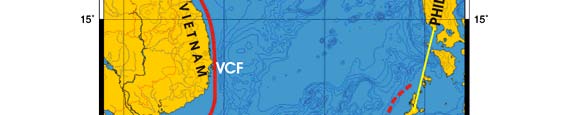
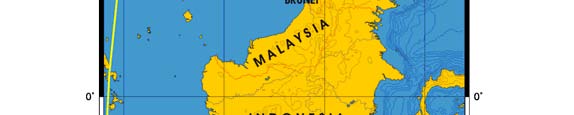
298
15. South China Sea
Figure VIII-15.1. Fronts of the South China Sea LME. GTF, Gulf of Tonkin Front; SCISF, South China
Inner Shelf Front; SCOSF, South China Outer Shelf Front; SSF, Shelf-Slope Front (the most probable
location); VCF, Vietnam Coastal Front; WLF, West Luzon Front. Yellow line, LME boundary. After
Belkin et al. (2008) and Belkin and Cornillon (2003).
South China Sea SST (Belkin, 2008)
Linear SST trend since 1957: 0.80°C.
Linear SST trend since 1982: 0.44°C.
The thermal history of the South China Sea (Figure VIII-15.2) is strongly correlated with
the Gulf of Thailand LME and largely decorrelated from other neighboring LMEs. The all-
time maximum of 1998 is an exception since this event was linked to the global El Nińo
1997-98. Interannual and decadal variability in the South China Sea are relatively small.
The observed stability of the South China Sea can be partly explained by the existence of
the so-called South China Warm Pool (Li et al., 2007); such warm pools are known to be
relatively stable owing to anticyclonic circulations that enclose them; a good example of a
large-scale warm pool is a gyre in the western part of the Sargasso Sea. The South
China Warm Pool changes seasonally and interannually (He et al., 2000): it grows in
summer and shrinks and retreats to the southwest in winter, and it is modulated by the
ENSO (El Nińo-Southern Oscillation).
VIII East Asian Seas
299
A recent study of the ERA-40 reanalysis and other data sets, including HadISST and
SODA (Simple Ocean Data Assimilation), has shown that "due to the impact of global
climate warming, the winter and summer monsoon flows became weak over the offshore
area of China and its adjacent ocean after 1976, which caused the weakening of winter
and summer sea surface wind stresses, especially the meridional sea surface wind
stresses, and obvious increase of SST in the area." (Cai et al., 2006, p. 239).
Figure VIII-15.2. South China Sea LME annual mean SST (left) and SST anomalies (right), 1957-2006,
based on Hadley climatology. After Belkin (2008).
South China Sea LME Chlorophyll and Primary Productivity: South China Sea LME
is considered a Class II, moderate production ecosystem (150-300 gCm-2yr-1).
Figure VIII-15.3. South China Sea trends in chlorophyll a (left) and primary productivity (right), 1998-
2006. Values are colour coded to the right hand ordinate. Figure courtesy of J. O'Reilly and K. Hyde. Sources
discussed p. 15 this volume.
I. Fish and Fisheries
Reported landings from the South China Sea LME are in the order of 6 million tonnes
(Figure VIII-15.4), although substantial uncertainty is associated with these figures. The
marine fisheries are important to the food security and economy of the bordering
countries and targeted groups include flying fishes, tunas, billfishes, mackerels and
sharks for the pelagic species, and a large array of demersal fish and invertebrates,
especially penaeid shrimps. There is also a high percentage of reef fish and other small
coastal pelagic fishes such as herring, sardine and anchovy in the landings. Like
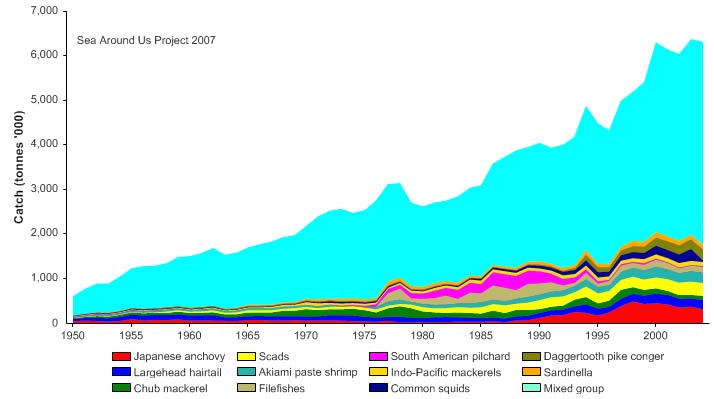
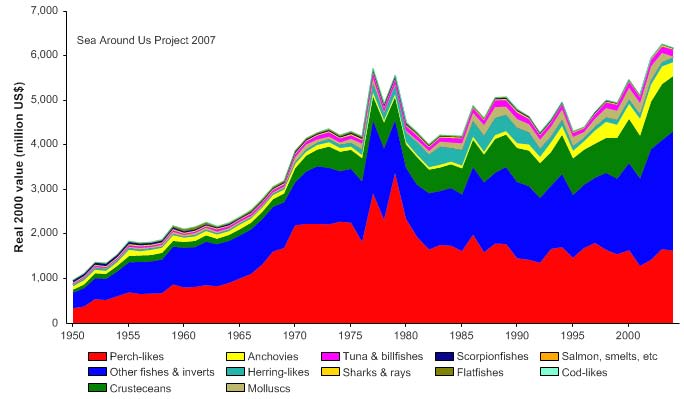
300
15. South China Sea
adjacent LMEs, the status and future viability of fish stocks of this LME are not well
understood, and there are significant gaps in the available data with many fisheries that
may be classified as Illegal, Unreported and Unregulated (IUU; UNEP 2005). The steady
increase of the reported landings, from 600,000 tonnes in 1950 to over 6 million tonnes in
2004 (Figure VIII-15.4) is primarily due to a significant increase in the landings of
unidentified fishes (included in `mixed group'), which account for two-third of the landings
in recent years. In general, a high proportion of unidentified catches in landings statistics
is a symptom of deficiencies in a reporting system, and therefore, we should be wary of
the large, continuous increases reported in this LME. Due to the large increase in the
reported landings, the value of the landings also rose steadily, reaching US$6 billion (in
2000 US dollars) in the early 2000s (Figure VIII-15.5).
Figure VIII-15.4. Total reported landings in the South China Sea LME by species (Sea Around Us 2007).
Figure VIII-15.5. Value of reported landings in South China Sea LME by commercial groups (Sea Around
Us 2007).
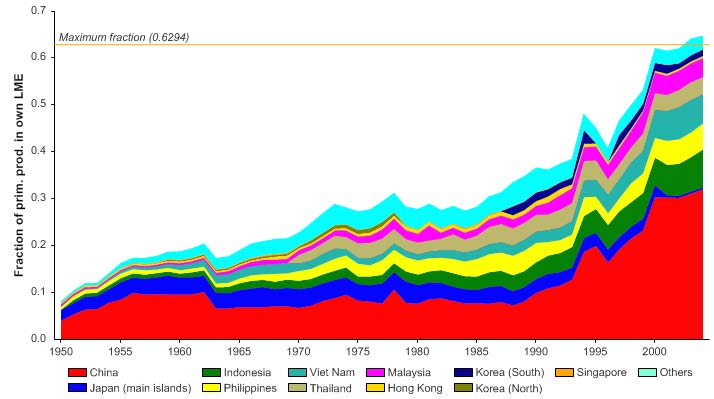
VIII East Asian Seas
301
The primary production required (PPR; Pauly & Christensen 1995) to sustain the reported
landings in this LME is increasing with the reported landings, and is presently over 60%
of the observed primary production (Figure VIII-15.6)--yet another indication that the
reported landings from this LME may be unrealistically high. China accounts for the
largest share of the ecological footprint in this LME.
Figure VIII-15.6. Primary production required to support reported landings (i.e., ecological footprint) as
fraction of the observed primary production in the South China Sea LME (Sea Around Us 2007). The
`Maximum fraction' denotes the mean of the 5 highest values.
The trends of both the mean trophic level (i.e., the MTI; Pauly & Watson 2005; Figure
VIII-15.7 top) and the FiB index (Figure VIII-15.7 bottom) until the mid-1980s are both
suggestive of a `fishing down' in the food web (Pauly et al. 1998) with a limited
geographic expansion of fisheries with the MTI declining and and the FiB index showing
a limited increase.
Figure VIII-15.7. Mean trophic level (i.e., Marine Trophic Index) (top) and Fishing-in-Balance Index
(bottom) in the South China Sea LME (Sea Around Us 2007).
302
15. South China Sea
The trends of these indices from the mid-1980s on, however, is hard to interpret, as the
increase in the MTI does not seem to be caused by development of high trophic fisheries
such as tuna fisheries (time series of the MTI without tuna catches can be examined at
www.seaaroundus.org). Another, more likely explanation for such trends is that the
landings statistics for the LME include either catches made outside the LME or
exaggerated values. This would also explain why the PPR for the fisheries in the LME is
improbably high (Figure VIII-15.6). The Stock-Catch Status Plots indicate that about 40%
of the stocks in the LME are collapsed or overexploited (Figure VIII-15.8, top), however,
with the majority of the catches supplied by fully exploited stocks (Figure VIII-15.8,
bottom). Such diagnosis is probably optimistic, and is again likely a result of the high
degree of taxonomic aggregation in the underlying statistics.
While masked in recent years, `fishing down' of the food web is widespread in most, if not
all, countries of the South China Sea LME (UNEP 2005). Moreover, catch per unit effort
in most fisheries has declined steadily, an indication of severe overexploitation. The
increase was accompanied by a change in the major species in the catch, an indication
of massive selective fishing pressure (Yanagawa 1997). Intensive fishing is the primary
driving force of biomass change in this LME (Sherman 2003). The South China Sea TDA
has identified loss of fisheries productivity as a major transboundary issue (Talaue-
McManus 2000) and most of the conventional species have been fully exploited at the
basin level (Yanagawa 1997).
1950
1960
1970
1980
1990
2000
0%
100
10%
90
20%
)
80
%
(
30%
t
us
70
t
a
s
40%
60
by
s
k
50%
50
t
oc
s
60%
40
r
of
e
b
70%
m
30
u
N
80%
20
90%
10
100%0
1950
1960
1970
1980
1990
2000
(n = 9088)
developing
fully exploited
over-exploited
collapsed
1950
1960
1970
1980
1990
2000
0%
100
10%
90
20%
80
)
%
30%
(
70
s
t
u
a
40%
60
ck st
50%
o
50
st
y
60%
b
h
40
t
c
a
70%
C
30
80%
20
90%
10
100%0
1950
1960
1970
1980
1990
2000
(n = 9088)
developing
fully exploited
over-exploited
collapsed
Figure VIII-15.8. Stock-Catch Status Plots for the South China Sea LME, showing the proportion of
developing (green), fully exploited (yellow), overexploited (orange) and collapsed (purple) fisheries by
number of stocks (top) and by catch biomass (bottom) from 1950 to 2004. Note that (n), the number of
`stocks', i.e., individual landings time series, only include taxonomic entities at species, genus or family
level, i.e., higher and pooled groups have been excluded (see Pauly et al, this vol. for definitions).
VIII East Asian Seas
303
Because of their proximity to shore, fringing reefs are heavily exploited by subsistence
fishers and about 70% of the coral reefs in the broader region (including Sulu-Sulawesi
Sea and Indonesian Seas) are heavily depleted, producing less than 5 tonnes per km2
per year in comparison with the remaining 30% of reefs that produce about 15 - 20
tonnes per km2 per year. Moreover, adult fish are scarce in some reefs in the region
(McManus 1994). Reduction and loss of reef fish populations may have transboundary
consequences if reef interdependence between oceanic shoals and highly exploited
fringing reefs of the South China Sea LME is considered (Talaue-McManus 2000).
Oceanic migratory species such as tuna, billfish, sharks and other pelagic species are
also overexploited, with potential transboundary impacts (UNEP 2005). Some shark
species that migrate throughout the South China Sea LME, are also targeted and often
caught as bycatch in the tuna and swordfish fisheries. Currently, high demand for shark
products for exotic food, medicinal and ornamental markets (Chen 1996) is causing
concern about overexploitation of sharks in the region (Talaue-McManus 2000).
Invertebrate species such as holothurians, molluscs and crustaceans are considered to
be heavily exploited, partly through overinvestment and encroachment of large-scale
commercial operations, including illegal and unreported incursions of vessels from
countries outside the South China Sea LME.
Excessive bycatch is a severe problem in this LME (UNEP 2005). The lack of bycatch
exclusion devices has resulted in massive overexploitation of species regarded as
bycatch in other regions. However, the quantity of discards in the region's fisheries is
insignificant, as virtually all of the bycatch, including turtles, sharks and whales, are
utilised. There is also a widespread capture, either intentional or accidental, of rare,
threatened and endangered species such as turtles and dugong, by traditional and
commercial fisheries. Substantial, though unquantified, levels of bycatch are produced
by distant waters fleets, through use of blast fishing and poisons, as well as in the
shrimp fry fisheries, where juveniles of all other species are discarded. Destruction by
reef bombing and use of poisons is severe, particularly on coral reefs (Bryant et al.
1998, Talaue-McManus 2000, UNEP 2005). Massive habitat destruction and
fragmentation and changes in population and community structure are occurring from
destructive fishing methods in the region. Based on present consumption patterns and
population growth rates, the region will have to produce significantly more fish in the
future just to meet domestic demand. Pressure on the coastal resources is therefore
likely to increase significantly in the near future.
III. Pollution and Ecosystem Health
Pollution: Pollution in the South China Sea LME can be attributed to rapid economic
development and population growth in the coastal zone. Overall, pollution was assessed
as moderate, but severe in some localised areas (UNEP 2005). Wastes from domestic
and industrial sources, agricultural and aquaculture, as well as sediments and solid
wastes are the major land-based pollutants affecting coastal areas (Koe & Aziz 1995,
Talaue-McManus 2000, Fortes 2006). Inadequate sewage treatment and disposal has
led to high faecal coliform bacteria levels in some areas (e.g., Manila Bay). Industries
release an estimated minimum of about 430,000 tonnes of Biological Oxygen Demand
(BOD) into aquatic systems interacting with the LME (Talaue-McManus 2000). If this is
not significantly reduced, the coastal waters of the Sunda Shelf from the Indo-China
Peninsula to Malaysia and Indonesia, across to the western Philippine shelf, could
become eutrophic. In enclosed bays, harbours, lagoons and in the immediate vicinity of
river mouths there has been frequent occurrence of non-toxic algal blooms and HABS, as
well as cases of paralytic shellfish poisoning in parts of the region (Talaue-McManus
2000).
304
15. South China Sea
High levels of suspended solids are found in coastal waters throughout most of the
region. This has resulted from activities such as extensive deforestation in many
watersheds, logging, mining, land reclamation, dredging and urban development,
compounded by high rates of erosion (Naess 1999). There have been major changes in
turbidity and levels of suspended sediments in Malaysia, Vietnam, Philippines, Indonesia
(Sumatra and Kalimantan) and Thailand. Suspended solids have caused major changes
in biodiversity of benthic communities (UNEP 2005). Pollution from solid waste is severe
in localised areas, particularly around many towns and villages where waste
management is poor or non-existent.
Data provided on heavy metals, though incomplete, show high levels in localised areas.
Vietnam, whose major rivers are all transboundary, reports an annual load of heavy
metals of about 100,000 tonnes. In the Northern Economic Zone of Vietnam, the
concentration of lead, zinc and copper are 7-10 times the allowable limits. The LME
contains some of the world's busiest international sea-lanes and two of the busiest ports
in the world, Singapore and Hong Kong (Coulter 1996). This has led to moderate
pollution from spills, with episodic discharges from shipping and occasional spills from oil
exploration and production. International trade is expected to triple by 2020, much of
which will be through the sea, increasing the potential for spills.
Habitat and community modification: Ecological goods and services provided by
mangrove systems are estimated to be worth about US$16 billion per year (Naess 1999,
UNEP 1999). Southeast Asian reefs are estimated to be worth more than US$2.4 billion
per year, based on their contribution to food security, employment, tourism,
pharmaceutical research and shoreline protection (Burke et al. 2002), while the estimated
value of seagrass and coastal swamp areas in the South China Sea region is about
US$190 billion per year (UNEP 1999).
Growing coastal populations and development, destructive fishing practices, pollution and
siltation have resulted in severe habitat and community modification in this LME (UNEP
2005). Significant expanses of coral reefs have already been degraded or are under
severe threat (Chou et al. 1994, Bryant et al. 1998, Burke et al. 2002). Coral reefs are
most extensive and also the most threatened in Indonesia and the Philippines, with
50% of Indonesian reefs and 85% of Philippines reefs at high risk (Bryant et al. 1998).
Recent studies suggest that degraded reefs have incurred reductions in biodiversity and
at worse, species extinctions (Talaue-McManus 2000).
The reversing monsoonal pattern of wind and surface circulation facilitates connections
between oceanic shoal reefs and those fringing the coastal states. McManus (1994)
suggests that planktonic larvae of many coral reef biota from the oceanic shoals of the
South China Sea can recruit in the fringing reefs of Sabah, the Philippines, Taiwan,
coastal China, the Paracell Islands, Vietnam or in the Natuna Islands (Indonesia),
depending on the direction of water circulation. Degradation of the coral reefs in the
South China Sea LME will have a major impact on the global heritage of reef biodiversity
(Bryant et al. 1998).
The original area of mangroves has decreased by about 70% during the last 70 years,
with millions of hectares of land, mostly mangroves, having already been converted for
shrimp mariculture, industrial development and tourist resorts. A continuation of the
current trend would result in all mangroves being lost by the year 2030 (UNEP 1999).
The disappearance of mangrove systems on such a large scale has led to sediment
erosion, water pollution, loss of biodiversity and a critical loss of nursery habitat for young
fish and shellfish. Despite the continuing destruction, significant areas supporting good
quality coastal and marine habitats still remain (e.g., Spratly and Paracel Islands; western
Palawan, Philippines; Con Dao Islands, Vietnam), both within and outside MPAs.
VIII East Asian Seas
305
There is evidence of widespread modification of seagrass habitats throughout the region,
with 20% to 50% of seagrass beds having been damaged (Talaue-McManus 2000).
Sediments from coastal development, destructive fishing methods and land-based
pollution are among the major threats to the region's seagrass habitats. Like coral reefs
and mangroves, seagrass beds possess high biodiversity and a number of endangered
species like sea cows and marine turtles are known to feed in these areas. Numerous
species spend various stages of their life cycles among adjacent mangrove, seagrass
and coral reef habitats. Degradation and loss of these critical habitats have led to
reduction in the essential ecosystem services they provide in maintaining the high
biodiversity and fisheries production of this region.
The health of the South China Sea LME may deteriorate further as a consequence of the
expected future increase in pollution and habitat modification (UNEP 2005). Despite
increasing measures for pollution mitigation and control, environmental quality is likely to
worsen, primarily because of the predicted increase in deforestation and agriculture, as
well as a major increase in population overriding the improvements in infrastructure
(UNEP 2005). Some positive steps are being taken to address habitat modification,
including mangrove rehabilitation programmes, watershed protection and establishment
of MPAs.
IV. Socioeconomic Conditions
About 270 million people live in the coastal areas of the South China Sea LME. This
population is expected to double in the next three decades. The South China Sea LME
contributes to the livelihood of millions of people engaged in trade, tourism, industry,
fisheries and oil exploitation. Fisheries remain a significant source of revenue and food.
Economic activities include fisheries, mariculture, tourism and mining. The region is a
globally important source of minerals, with considerable reserves of oil and gas.
The socioeconomic impacts of unsustainable exploitation of fisheries and environmental
deterioration are significant for the newly developed economies of this region (Talaue-
McManus 2000, UNEP 2005). There have been reduced economic returns and loss of
employment as well as of livelihood from the fisheries collapse. In many areas, fisher
families' children are malnourished, as fish consumption has declined from approximately
36 kg person-1yr-1 to 24 kg person-1yr-1, with consequent high levels of malnutrition
(UNEP 2005). The socioeconomic impacts of pollution are mainly related to poverty in
the major urban centres (UNEP 2005). Impacts include economic losses to mariculture
and the shellfish industry through regular advisories of high levels of toxicity (e.g.,
Philippines, Vietnam, Indonesia, Thailand), as well as HABs and cases of mercury
poisoning. Other impacts are associated with the costs of clean-up and coastal
restoration. There have also been losses in recreational value in parts of the Philippines
and land use conflicts in Philippines, Thailand and Malaysia.
Habitat modification has resulted in reduced capacity of local populations to meet basic
human needs and loss of employment throughout the LME (UNEP 2005). Other impacts
include loss or reduction of existing and future income and foreign exchange from
fisheries and tourism, loss of charcoal production, economic conflicts between investors
and local users, national and international conflicts and increased risks to capital
investment (e.g., failure of coastal aquaculture projects in many parts of the region), costs
of restoration of modified ecosystems and intergenerational inequity (UNEP 2005).
V. Governance
Most South China Sea nations recognise that their fisheries resources are threatened,
but they also need the fishery products to feed their human populations and to sustain
306
15. South China Sea
industries based on fisheries (Naess 1999). Thus, there is constant competition between
socioeconomic and environmental concerns, where the former often win (Naess 1999).
Fishing fleets of individual countries are depleting the common resources of the LME,
reaping short-term benefits at the cost of others. There are multilateral attempts at
improving the current situation of regulation of fisheries, to an ecosystem-wide approach
to which all littoral states commit themselves. Management of the goods and services of
the South China Sea LME is presently the focus of a Global Environment Facility and
World Bank financed effort to support a country driven project for protecting the
environment and living marine resources of the South China Sea LME (www.gef.org).
The losses related to overexploitation and habitat degradation, both in biodiversity and in
fisheries yield, are important transboundary issues, not only from a biological point of
view (i.e. nursery areas, recruitment of larvae, etc.) but also from an economic
perspective where the drivers are international demand for aquarium fish, live food fish
and prawns, as well as coastal tourism (Talaue-McManus 2000). The present situation
and future prognosis indicate that more extensive and intensive intervention is required,
including direct on-the-ground community-based conservation programmes. One of the
Policy recommendations is the development of a functional, integrated regional network
of MPAs (UNEP 2005). Bordering countries already have many legally designated MPAs
and some multilateral conservation agreements have been established. Approximately
125 MPAs have already been gazetted (Spalding et al. 2001, Cheung et al. 2002) and
there are also two World Heritage sites: Halong Bay, Vietnam and Puerto Princesa
Subterranean River National Park, Philippines. However, insufficient resources for
management and enforcement of fisheries and other regulations in many MPAs limit their
effectiveness. Just 10-20% of MPAs are considered as effectively managed (Cheung et
al. 2002).
The South China Sea LME is included as part of the UNEP-administered East Asian
Regional Seas Programme. The GEF-World Bank supported projects underway are
moving toward an integrated country based ecosystem approach to recover depleted fish
stocks, restore degraded habitats, reduce coastal pollution and nutrient over-enrichment,
conserve biodiversity and adapt to the effects of climate change.
References
Belkin, I.M. (2008) Rapid warming of Large Marine Ecosystems, Progress in Oceanography, in
press.
Belkin, I. M. and Cornillon, P. C. (2003). SST Fronts of the Pacific Coastal and Marginal Seas,
Pacific Oceanography 1(2): 90-113.
Belkin, I.M., Cornillon, P.C. and Sherman, K. (2008). Fronts in Large Marine Ecosystems of the
world. Progress in Oceanography, in press.
Bryant, D., Burke, L., McManus, J. and Spalding, M. (1998). Reefs at Risk. A Map-based Indicator
of Threats to the World's Coral Reefs. WRI/ICLARM/WCMC/UNEP, Washington D.C., U.S.
Burke, L, Selig, E. and Spalding, M. (2002). Reefs at Risk in Southeast Asia. World Resources
Institute, Washington, D.C., U.S.
Cai, R.-S., Chen, J.-L and Huang, R-H. (2006) The response of marine environment in the offshore
area of China and its adjacent ocean to recent global climate change, presented at the PICES
15th Annual Meeting, Yokohama, Japan, 13-22 October 2006;
www.pices.int/publications/book_of_abstracts/PICES_15_Book_of_Abstracts.pdf,p.239,
abstract W5-3249.
Chen, H.K., ed, (1996). Shark Fisheries and the Trade in Sharks and Shark Products of Southeast
Asia. TRAFFIC Southeast Asia, Malaysia.
Cheung, C.P.S., Alino, P.M., Uychiaoco, A.J. and Arceo, H.O. (2002). Marine Protected Areas in
South-east Asia. Association of South East Asian Nations, Regional Centre for Biodiversity
Conservation, Department of Environment and Natural Resources.
VIII East Asian Seas
307
Chou, L.M., Wilkinson, C.R., Licuanan, W.R.Y., Alino, P.M., Cheshire, A.C., Loo, M.G.K.,
Tangjaitrong, S., Sudara, S., Ridzwan, A.R. and Soekarno (1994). Status of coral reefs in the
ASEAN Region, p 1-10 in: Wilkinson, C., Sudara, S. and Chou, L.M. Proceedings Third ASEAN
Australia Symposium on Living Coastal Resources, 16-20 May 1994, Thailand. Volume 1:
Status Reviews. Australian Agency for International Development, Australia.
Coulter, D.Y. (1996). South China Sea Fisheries: Countdown to Calamity. Contemporary Southeast
Asia 17(4).
Fortes, M. (2006). Seas of East Asia, p 177 -192 in: UNEP/GPA (2006), The State of the Marine
Environment: Regional Assessments. UNEP/GPA, The Hague.
He, Y.-H., Guan, C.-H. and Yamagata, T. (2000) The climate features of the South China Sea
Warm Pool, Journal of Tropical Meteorology, 6(1), 86-93; http://www.wanfangdata.com.cn/
qikan/periodical.Articles/rdqxxb-e/rdqx2000/0001/000109.htm
Koe, L.C.C. and Aziz, M.A. (1995). Regional Programme of Action on Land-based Activities
Affecting Coastal and Marine Areas in the East Asian Seas. RCU/EAS Technical Report Series
5.
Li, N., Shang, S.P., Shang, S.L. and Zhang, C.Y. (2007) On the consistency in variations of the
South China Sea Warm Pool as revealed by three sea surface temperature datasets, Remote
Sensing of Environment, 109(1), 118-125; doi:10.1016/j.rse.2006.12.012.
McManus, J. (1994). The Spratly Islands: A marine park. Ambio 23:181-186.
Naess, T. (1999). Environment and Security in the South China Sea Region: The Role of Experts,
Non-government Actors and Governments in Regime Building Processes. Ph.D. Thesis,
University of Oslo, Oslo, Norway.
Pauly, D. and Christensen, V. (1995). Primary production required to sustain global fisheries.
Nature 374: 255-257.
Pauly, D. and Watson, R. (2005). Background and interpretation of the `Marine Trophic Index' as a
measure of biodiversity. Philosophical Transactions of the Royal Society: Biological Sciences
360: 415-423.
Pauly, D., Christensen, V., Dalsgaard, J., Froese R. and Torres, F.C. Jr. (1998). Fishing down
marine food webs. Science 279: 860-863.
Pauly. D. and Christensen, V. (1993). Stratified Models of Large Marine Ecosystems: A General
Approach and an Application to the South China Sea, p 148 - 174 in: Sherman, K. Alexander,
L.M. and Gold, B.D. (eds), Large Marine Ecosystems: Stress, Mitigation, and Sustainability.
American Association for the Advancement of Science, Washington, D.C.
Sea Around Us (2007). A Global Database on Marine Fisheries and Ecosystems. Fisheries Centre,
University British Columbia, Vancouver, Canada. www.seaaroundus.org/lme/
SummaryInfo.aspx?LME=36
Sherman, K. (2003). Physical, Biological and Human Forcing of Biomass Yields in Large Marine
Ecosystems. ICES CM 2003/P: 12.
Spalding, M., Ravilious, C. and Green, E.P. (2001). World Atlas of Coral Reefs. United Nations
Environment Programme World Conservation Monitoring Centre.
Talaue-McManus, L. (2000). Transboundary Diagnostic Analysis for the South China Sea.
EAS/RCU Technical Report Series 14. United Nations Environment Programme, Bangkok,
Thailand.
Tomascik, T., Mah, A.J., Nontji, A. and Moosa, M.K. (1997). The Ecology of the Indonesian Seas.
Part 1. Dalhousie University, Periplus Editions, Singapore.
UNEP (1999). Strategic Action Programme for the South China Sea. Draft Version 3, February
1999. United Nations Environment Programme, Nairobi, Kenya.
UNEP (2005). Wilkinson, C., DeVantier, L., Talaue-McManus, L., Lawrence, D. and Souter, D.
South China Sea, GIWA Regional Assessment 54. University of Kalmar, Kalmar, Sweden.
www.giwa.net/publications/r54.phtml
Yanagawa, H. (1997). Small pelagic resources in the South China Sea, p 365-380 in: Devaraj, M.
and Martusubroto, P. (eds), Small Pelagic Resources and their Fisheries in the Asia Pacific
Region. Proceedings APFIC Working Party on Marine Fisheries, First Session, 13-16 May
1997, Bangkok, Thailand. RAP Publication 1997/31.
308
15. South China Sea
VIII East Asian Seas
309
VIII-16 Sulu-Celebes Sea LME
S. Heileman
The Sulu-Celebes Sea LME is comprised of the Sulu and Celebes Seas, which are
separated from each other by a deeper trough and a chain of islands known as the Sulu
Archipelago. The LME is bounded by northern Borneo (Malaysia), the southwest coast of
the Philippines and Sulawesi Island (northern coast of Indonesia), but most of the LME
falls within the archipelagic waters of either the Philippines or Indonesia. The LME
covers an area of about one million km2, of which 1.03% is protected, and contains
6.17% and 0.22% of the world's coral reefs and sea mounts, respectively (Sea Around
Us 2007). A complex oceanography results from the Celebes' strong currents, deep sea
trenches, seamounts and active volcanic islands. The LME's tropical climate is governed
by the monsoon regime. During the southwest monsoon months, the northern and
central parts of the region are affected by typhoons, which bring intense rains and
destructive winds to coastal areas. There are more than 300 major watersheds and 14
major estuaries in the region. A report pertaining to this LME is UNEP (2005).
I. Productivity
The Sulu-Celebes Sea LME is considered a Class II, moderate productivity ecosystem
(150-300 gCm-2yr-1). The tropical climate, warm waters, ocean currents and upwellings
make this LME one of the world's most biologically diverse marine environments.
Located near the confluence of three major biogeographic zones and within the Indo-
West Pacific centre of biodiversity, the region supports mega-diversity (Roberts et al.
2002, Cheung et al. 2002). A significant proportion of the total coral reef area of the
Philippines (about 20,000 km2) is located in this LME. This forms a part of the `coral
triangle', which has the highest coral diversity together with Indonesia and New Guinea
(more than 500 reef-building species). In addition, 2,500 species of marine fishes,
400 species of algae, five species of sea turtles and 22 species of marine mammals are
found in the LME (Chou 1997, Jacinto et al. 2000, Veron 2000).
Oceanic fronts (Belkin et al. 2008; Belkin and Cornillon, 2003): This semi-enclosed sea
is connected to other seas of the Indonesian Archipelago via several straits. Flow
constrictions within these straits are conducive to front formation (Figure VIII-16.1). The
uniformly high surface temperature tends to mask salinity fronts caused by coastal
upwelling, whose intensity sharply increases locally owing to orographic and bathymetric
effects. Evaporative cooling also contributes to front formation since this process creates
a colder and saltier water mass, which is substantially denser than ambient waters. Tidal
currents and tidal mixing also play a significant role in front formation, especially off
numerous coastal headlands and near straits. The most robust fronts are located in the
eastern Celebes Sea.
Sulu-Celebes Sea SST (Belkin, 2008):
Linear SST trend since 1957: 0.62°C.
Linear SST trend since 1982: 0.23°C.
The steady warming of the Sulu-Celebes Sea was accentuated by two warm events, in
1988 and 1998, the latter being of the global scale (El Nińo 1997-98). In many locales
across this sea, the SST anomaly in 1998 exceeded 2°C; the extreme thermal stress has
resulted in widespread restructuring of coral reef communities and numerous coral
bleaching events (Vantier et al., 2005, p. 48, Figure 16; Goreau et al., 1997). The warm


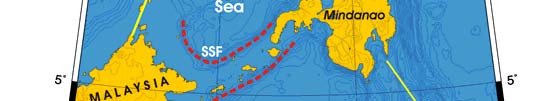

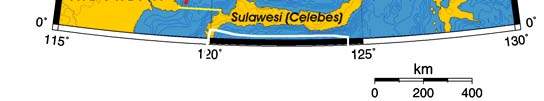
310
16. Sulu Celebes Sea LME
Figure VIII-16.1. Fronts of the Sulu-Celebes Seas LME. ECF, East Celebes fronts; SSF, Shelf-Slope Front
(most probable location); Yellow line, LME boundary. After Belkin et al. (2008) and Belkin and Cornillon
(2003).
event of 1988 occurred simultaneously in the Indonesian Sea LME, North Australian
Shelf LME, West-Central Australian Shelf LME, and Northwest Australian Shelf LME; and
only one year prior to the warm event of 1989 in the Southeast Australian Shelf LME.
Apparently, the warm event of 1988 was caused by large-scale forcing. The all-time
minimum of 1967 occurred simultaneously in the Indonesian Sea LME and, one year
prior to the all-time minimum of 1968, in the West-Central Australian Shelf LME. The
strong correlation between the Sulu-Celebes Sea's thermal history and adjacent seas
could alternatively be explained by oceanic circulation, particularly, the Indonesian
Throughflow that flows through this LME (NOAA Ocean Explorer, 2007).
Figure VIII-16.2. Sulu-Celebes LME mean annual SST (left) and SST anomalies (right), 1957-2006, based
on Hadley climatology. After Belkin (2008) .
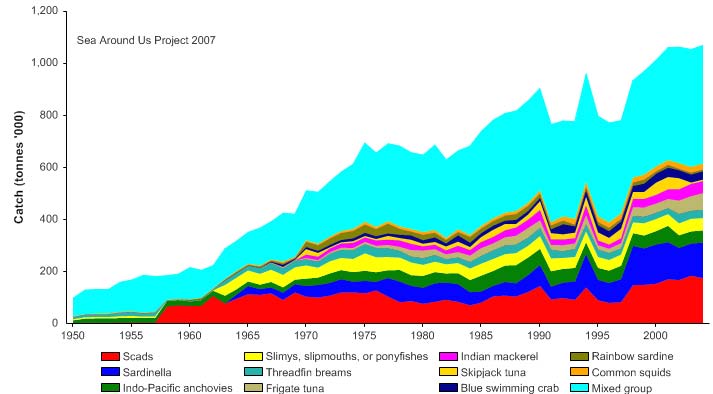
VIII East Asian Seas
311
Sulu-Celebes Chlorophyll and Primary Productivity: The Sulu-Celebes Sea LME is
considered a Class II, moderate productivity ecosystem (150-300 gCm-2yr-1).
Figure VIII-16.3. Sulu-Celebes Sea: Trends in chlorophyll-a(left) and primary productivity (right), 1998-
2006. Values are colour coded to the right hand ordinate. Figure courtesy of J. O'Reilly and K. Hyde.
Sources discussed p. 15 this volume.
II Fish and Fisheries
The fisheries of the Sulu-Celebes Sea LME are multi-gear and multi-species. Reef
fisheries provide essential sustenance to artisanal fishers and their families throughout
the region while high value fish products are exported to expanding international, national
and local markets. Live food and aquarium reef fish exports to Hong Kong and the
Chinese mainland have burgeoned since the 1990s (Cesar et al. 2000). Aquaculture of
prawns, oysters, mussels, fish, seaweeds and other species is an important industry in
the three bordering countries (FAO 2000, BFAR 2004). The fisheries of the southwest
coast of the Philippines are well-documented, relative to the fisheries from the other parts
of this LME (see e.g., Ingles & Pauly 1984, Aprieto et al. 1986, Trinidad et al. 1993, DA-
BFAR 2004). Total reported landings in the LME have increased steadily to one million
tonnes in 2004 (Figure VIII-16.4), though a significant proportion of the landings is
reported simply as unidentified fishes in the available statistics (included in `mixed group'
in Figure VIII-16.4).
Figure VIII-16.4. Total reported landings in the Sulu-Celebes Sea LME by species (Sea Around Us 2007).
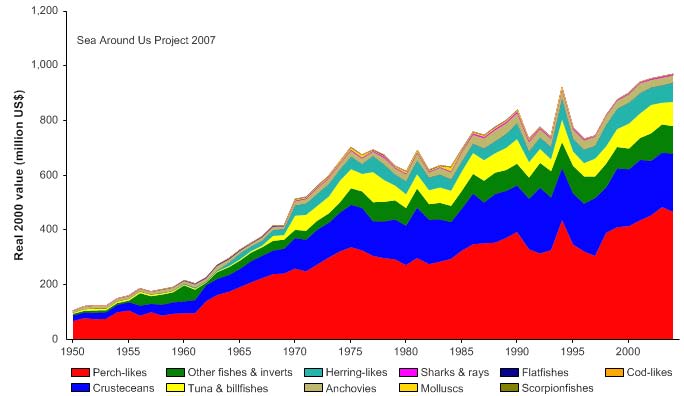
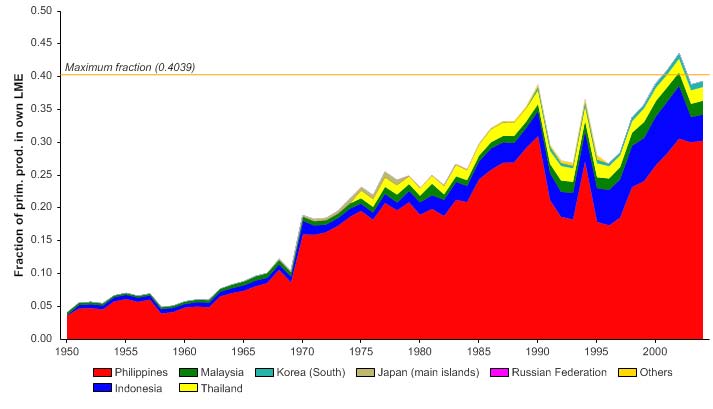
312
16. Sulu Celebes Sea LME
Figure VIII-16.5. Value of reported landings in the Sulu-Celebes Sea LME by commercial groups (Sea
Around Us 2007).
The value of the reported landings has also increased, exceeding US$900 million (in
2000 real US dollars) in recent years (Figure VIII-16.5).
The primary production required (PPR; Pauly & Christensen 1995) to sustain the reported
landings in this LME is increasing, and has reached 40% of the observed primary
productivity in recent years (Figure VIII-16.6), a very high level that is possibly skewed by
the large proportion of unidentified fishes in the reported landings. The Philippines
account for the largest share of the ecological footprint in the LME.
Figure VIII-16.6. Primary production required to support reported landings (i.e., ecological footprint) as
fraction of the observed primary production in the Sulu-Celebes Sea LME (Sea Around Us 2007). The
`Maximum fraction' denotes the mean of the 5 highest values.
The trend in the mean trophic level (i.e., the MTI; Pauly & Watson 2005) and the FiB is
not conclusive, likely due to the poor quality of the underlying landings statistics (Figure
VIII-16.7). However, a decline in the MTI can be seen from 1950 to 1974, a period in
which the proportion of unidentified fish in the landings statistics was relatively small, an
VIII East Asian Seas
313
indication that a `fishing down' of the food web (Pauly et al. 1998) is perhaps occurring in
the LME, only to be drowned out by the high level of taxonomically aggregated catches in
recent years.
Figure VIII-16.7. Marine Trophic Index (top) and Fishing in Balance Index (bottom) in the Sulu-Celebes
Sea LME (Sea Around Us 2007).
The Stock-Catch Status Plots indicate that about half of the stocks in the LME have
collapsed or are currently overexploited (Figure VIII-16.8, top), and that the reported
landings are largely supplied by fully exploited stocks (Figure VIII-16.8, bottom). Such
diagnosis is probably a result of the high degree of taxonomical aggregation in the
underlying statistics.
1950
1960
1970
1980
1990
2000
0%
100
10%
90
20%
)
80
%
(
s
30%
u
70
at
st
40%
y
60
50%
cks b
o
50
f
st
60%
o
40
er
70%
mb
30
u
N
80%
20
90%
10
100%0
1950
1960
1970
1980
1990
2000
(n = 5745)
developing
fully exploited
over-exploited
collapsed
0%
100
10%
90
20%
80
)
%
30%
(
70
s
u
at
40%
60
k st
c
50%
o
50
st
y
60%
b
h
40
t
c
a
70%
C
30
80%
20
90%
10
100%0
1950
1960
1970
1980
1990
2000
(n = 5745)
developing
fully exploited
over-exploited
collapsed
Figure VIII-16.8. Stock-Catch Status Plots for the Sulu-Celebes Sea LME, showing the proportion of
developing (green), fully exploited (yellow), overexploited (orange) and collapsed (purple) fisheries by
number of stocks (top) and by catch biomass (bottom) from 1950 to 2004. Note that (n), the number of
`stocks', i.e., individual landings time series, only include taxonomic entities at species, genus or family
level, i.e., higher and pooled groups have been excluded (see Pauly et al, this vol. for definitions).
314
16. Sulu Celebes Sea LME
Beyond the archipelagic waters of the Philippines, neither the status nor the future
viability of the fisheries in the Sulu-Celebes Sea LME is understood. Great uncertainty
exists because of serious discrepancies in fisheries data, which may also be missing a
significant quantity of Illegal, Unreported and Unregulated (IUU) catches, possibly as high
as 50% of the total catch (Kahn & Fauzi 2001). Unreported catches are high, as has
been shown for Northern Sabah (Teh et al. 2007). The LME is an attractive fishing
ground for illegal fishers, including commercial fishers from throughout Southeast Asia
and beyond. Consequently, accurate data on the extent, number of vessels and their
mode of operations are rare, despite the likelihood that such illegal activities may have
significant environmental and socioeconomic impacts.
Excessive fishing effort and destructive fishing have led to severe overexploitation of
fisheries and considerable threat to coral reefs in this LME, with declining catches,
particularly in coastal areas (FAO 2000). Statistics from the Philippines (BFAR 1997, DA-
BFAR 2004) and Indonesia suggest that, despite increasing catch of some species,
CPUE has declined steadily. Over the past few decades, many of the fringing coral reefs
have been depleted, with a major loss of productivity and adverse effects to other
components of the ecosystem (Licuanan & Gomez 2000). About 70% of the coral reefs
in the Philippines are heavily exploited, producing less than five tonnes per km2 per year,
while the remaining 30% produces between 15-20 tonnes per km2 per year (Licuanan &
Gomez 2000). Overfishing has also led to severe depletion of market-sized fishes as
well as reduction in population sizes and in some cases, local extinction. This also
includes large piscivorous species such as groupers, barracudas, jacks and sharks
(Werner & Allen 2000). Bycatch is produced by distant-waters fleets as well as through
the use of blast fishing and poisons. Rare and endangered species of turtles as well as
marine mammals are also caught incidentally. There are little or no discards in the
region's inshore fisheries, however, since virtually all of the bycatch is utilised by local
fishers.
Destructive fishing practices (e.g., dynamite and cyanide fishing on reefs) have severe
impacts in coastal areas (Pilcher & Cabanban 2000). Live coral reef fish trade is of
particular concern. Use of fish poisons to catch aquarium and food fishes is a rapidly
growing problem in many Pacific nations, but is most serious in the Philippines and
Indonesia (Johannes & Riepen 1995) with about 85% of the aquarium fish traded caught
using cyanide, targeting 379 species from a few families (e.g., Labridae, Pomacentridae,
Chaetodontidae, Pomacanthidae and Scaridae) (Pratt et al. 2000). The live food fish
trade primarily targets groupers (especially Epinephelus spp. and Plectropomus
leopardus) and Napolean wrasse (Cheilinus undulates). Because of their particular life-
history attributes, groupers are easily overexploited and targeting of their spawning
aggregations is of a serious concern (Licuanan & Gomez 2000). In addition to taking
adult groupers for direct food consumption, the live reef fish food trade also involves the
capture of wild fry and fingerlings supplying the grouper mariculture industry in Southeast
Asia, predominantly in Taiwan and Thailand (Sadovy & Pet 1998).
Because of Indonesia's increasing coastal population, greater commercialisation,
continued use of destructive fishing practices and lack of effective regulation and
enforcement, depletion of fisheries resources is expected to continue in the LME.
However, such grim outlook on the future of fisheries in the LME may be ameliorated to
some degree by improved enforcement of national regulations (e.g., Philippines Fisheries
Code) and through successful interventions by government and NGOs.
II. Pollution and Ecosystem Health
Pollution: Rapid industrialisation and economic growth have taken a heavy toll on the
environment of the seas of East Asia. Most of the pollutants entering the marine
environment come from land-based sources, and have changed virtually every dimension
VIII East Asian Seas
315
of the coastal and marine environments (Fortes 2006). Pollution in the Sulu-Celebes Sea
LME is of particular concern around the major urban centres (UNEP 2005). Major
sources of pollution include sewage, industries, agriculture, aquaculture and shipping.
Throughout the region, sewage treatment is rudimentary, with raw or primary treated
sewage discharged directly into water courses. Microbial pollution is of local significance
near to the major urban centres. Eutrophication is most significant in enclosed bays,
harbours and lagoons with limited water circulation, particularly where sewage or
industrial discharges are present. Pollution is a locally significant problem in areas such
as Batangas Bay (heavy metals), urban areas of Mindanao, the Visayan Islands and
other industrial and urban areas, with contaminant loads concentrated near discharge
points. While pollution from agricultural run-off is not a major problem at the scale of the
LME, localised agricultural pollution is widespread. Releases of chemical and, to a lesser
extent, microbiological pol ution from shipping in harbours, are also common. The
Makassar Strait and Celebes Sea LME is a major oil tanker route between Japan and the
greater Pacific Ocean, the Indian Ocean, West Asia and Europe, with associated risks of
collisions and spills (MPP-EAS 1998).
Suspended solids pose a severe problem in the coastal waters of the Philippines, as a
result of extensive deforestation in the region's watersheds (e.g., Hodgson & Dickson
1992, Chia & Kirkman 2000, Burke et al. 2002). This is compounded by erosion and
siltation rates that are among the highest on Earth. For example, in the Philippines, it is
estimated that approximately one billion m3 of sediment are lost to coastal waters
annually (Burke et al. 2002), carrying high loads of particle-bound nutrients. The
transboundary impacts of this phenomenon are compounded by sediment-laden waters
flowing seasonally into the region around the northern coast of Sabah and to the south of
Palawan from the South China Sea LME (Bate 1999). Pollution by solid waste is severe
around the larger cities, towns and villages where waste management is generally poor
or non-existent.
Habitat and community modification: The Sulu-Celebes Sea LME includes diverse
habitats such as estuaries, sandy foreshores, mangroves, seagrass meadows, coral
reefs and deep sea. Major causes of modification of these habitats are conversion for
aquaculture, destructive fishing practices, agriculture (pollution) and industrial
development (dredging, siltation and oil and gas exploration). Overfishing has caused
changes in population structures and/or functional group composition (e.g., coral reef
fishes). The important fish nursery ground function of large sections of mangroves and
seagrass beds has been seriously impaired.
Overall, habitat degradation in the Sulu-Celebes Sea LME was assessed as severe, with
extensive degradation particularly of mangroves and coral reefs (UNEP 2005). An
estimated 60% - 80% or more of the mangrove resources in the Philippines have been
lost (Atmadja & Mann 1994). In 1967, the Philippines Bureau of Fisheries and Aquatic
Resources (BFAR) reports showed the existence of 4,200 km2 of mangrove areas, of
which about 1,400 km2 remains (FAO 2000). The loss of mangroves can be attributed
primarily to the illegal conversion into fishponds, indiscriminate cutting for firewood and
construction purposes, and reclamation. In Indonesia, up to 10,000 km2 of land, mostly
mangrove forests, were allocated by the government to shrimp farms. By 2001, about
70% of these farms had become unsustainable and were subsequently abandoned
(UNEP 2005).
316
16. Sulu Celebes Sea LME
Development of most ports has resulted in foreshore reclamation and channel dredging,
while muro-ami1 (Hopley & Suharsono 2000, Pilcher & Cabanban 2000), blasting
(Cabanban 1998) and poison fishing (Pratt 1996) have damaged or destroyed more than
70% of coral reefs throughout the region. According to Burke et al. (2002), up to 50% of
Indonesia's 51,000 km2 of reef has already been degraded and 85% is threatened by
human activities. Destructive fishing practices are the single largest threat to the region's
reefs (Burke et al. 2002). BFAR reports have indicated that up to 70% of reefs in the
Philippines have been destroyed by rampant dynamite fishing as well as by accumulation
of silt from the watershed areas (FAO 2000). Coral cover and fish density on the reefs
are decreasing at an alarming rate, even within some protected areas.
Changes in sea surface temperature have also affected the structure of coral reef
communities during various coral bleaching events since 1983. For example, in the
Philippines Tubbataha National Park, mean live coral cover decreased by about 19%
after bleaching in 1998, then remained stable from 1999 to 2001 (Chou et al. 2002).
There was good recovery of most other bleached areas and, on average, the bleaching
events appear to have been less severe than in some other countries (Chou et al. 2002,
Wilkinson 2002).
Environmental impacts are likely to deteriorate further, primarily because of the predicted
increases in forestry, mining and agriculture as well as a major increase in population,
without accompanying improvements in infrastructure. The impacts of habitat
degradation are likely to deteriorate further or remain stable. In the Sahul area an
improvement is expected due to strengthened regulations as well as management of
protected areas.
III. Socioeconomic Conditions
National statistics suggest that the total population of the Sulu-Celebes Sea LME region
is approximately 33 million (WWF 2001). The region has diverse economic activities,
with the major export earners including fisheries, mariculture, agriculture and mining.
Service industries, including coastal tourism, also make a substantial contribution to
GDP. There is significant offshore oil and mineral exploration, with a potential for
substantial expansion in the coming decades. Subsistence farming and fishing are major
activities of large numbers of people outside of the main urban centres. The Sulu-
Celebes Sea LME's fisheries are an important source of foreign exchange earnings for
the three countries (FAO 2000, BFAR 2004). In addition, the countries obtain a
significant percentage (up to 70%) of their animal protein from marine fishes (FAO 2000,
BFAR 2004). Marine fisheries including fish farming are also an important source of
employment in the region (FAO 2000, BFAR 2004).
The socioeconomic impacts of overfishing are severe, with reduced subsistence
livelihood and food supply as well as reduced economic returns to small-scale fishers
throughout the Philippines and Indonesia. These impacts include loss of employment,
conflict between user groups for shared resources, reduced earnings in one area by
destruction of juveniles and reproductive stock in other areas (migratory as well as
shared stocks) and loss of protected species (e.g., local extinction of dugong in the
Philippines).
The socioeconomic impacts of pollution were assessed as moderate, and include
increased risks to human health, increased costs of human health protection, preventive
1 Muro-ami involves setting a net over a coral reef into which a group of 10-30 swimmers drive the fish. The
swimmers are equipped with weighted lines that are bounced up and down on the reef in an effort to drive out
the fish.
VIII East Asian Seas
317
medicine, medical treatment and of clean-up, as well as economic loss in fisheries and
reduced fish marketability. Most of these impacts are concentrated around the major
urban centres, where there have been significant health issues including cases of
mercury poisoning.
The socioeconomic impacts of habitat and community modification were considered to
range from moderate to severe (UNEP 2005). Increasing habitat fragmentation on the
region's coasts has depleted the wide variety of resources that used to be the main
source of sustenance and survival of coastal inhabitants (Fortes 2006). Major economic
costs are also accruing from destruction of coral reef habitats. In 2001, the reefs of
Indonesia and the Philippines provided annual economic benefits of US$1.6 billion and
US$1.1 billion per year, respectively (Burke et al. 2002). Over the next 20 years, human
impacts on the reefs could cost Indonesia and the Philippines some US$2.5 billion each
(Burke et al. 2002). Habitat destruction has resulted in loss of income from tourism, loss
of opportunity for investment, increased risks to capital investment, and costs of
controlling invasive species and of restoration of modified ecosystems (UNEP 2005).
Other socioeconomic costs of habitat modification are related to its impacts on fisheries.
V. Governance
Marine resource management and exploitation are, in theory, already controlled by
extensive policy and regulatory frameworks. Both the Philippines and Indonesia have
moved to decentralised management of marine resources (FAO 2000). The
establishment of MPAs is one of the measures taken to address habitat degradation and
unsustainable fisheries exploitation in the region. Several hundred protected areas have
already been designated (Spalding et al. 2001, Cheung et al. 2002) and over one
hundred more are currently being gazetted. Most protected areas are situated in the
Philippines, especially in the Tubbutaha Marine Park. Several small community-based
management initiatives have proven to be very successful at protecting coral reefs as
well as facilitating replenishment of reef-based fisheries (Russ & Alcala 1996, Sherwood
2002). These successes are not common, however, as only 7% of the total number of
MPAs in the Southeast Asian region are effectively managed, while 68% have poor or
unknown management (Kelleher et al. 1995, Burke et al. 2002).
One of the greatest challenges in this LME is non-compliance with existing laws and
regulations, which is exacerbated by weak institutional capability for enforcement. In
addition, the information base is limited in these countries. However, steps are being
taken to address the information gap, with several research initiatives in various agencies
(including universities) in the respective countries. An extensive literature exists in the
region, much of which is published in the national language, for example, in Indonesia.
The Sulu-Celebes Sea LME is included in the UNEP-administered East Asian Regional
Seas Programme (See the Gulf of Thailand LME). International agencies such as the
UNEP, WWF, Conservation International and GEF have initiated some projects in the
region. GEF is supporting several projects in the region (see the Gulf of Thailand LME).
GEF has also provided support for the development of a TDA as well as the preliminary
framework of a SAP for this LME.
References
Aprieto, V.L., Saeger, J. and Pauly, D. (eds). (1986). Selected papers on Philippine marine
fisheries resources (1947-1986). University of the Philippines in the Visayas, College of
Fisheries, Technical Reports of the Department of Marine Fisheries. (9), 436 p.
318
16. Sulu Celebes Sea LME
Atmadja, W. and Mann, A. (1994). Threats and pressures on mangroves and current management
practices, p 62-70 in: Wilkinson C.R. (ed), Living Coastal Resources of Southeast Asia: Status
and Management. Report of the Consultative forum third ASEAN-Australia Symposium on
Living Coastal Resources. Chulalongkorn University Bangkok, Thailand. May 1994. Australian
Institute of Marine Science, Townsville, Australia.
Bate, E. (1999). Biophysical Assessment of the Sulu-Sulawesi Large Marine Ecosystem: Geology
Module. A Report Prepared for the Sulu-Sulawesi Marine Ecoregion Conservation Programme
Development, WWF-Philippines.
Belkin, I.M. (2008) Rapid warming of Large Marine Ecosystems, Progress in Oceanography, in
press.
Belkin, I. M. and Cornillon, P. C. (2003). SST Fronts of the Pacific Coastal and Marginal Seas,
Pacific Oceanography 1(2), 90-113.
Belkin, I.M., Cornillon, P.C. and Sherman, K. (2008). Fronts in Large Marine Ecosystems of the
world's oceans. Progress in Oceanography, in press.
BFAR (1997). Bureau of Fisheries and Aquatic Resources. Philippines Fisheries Profile 1996.
Department of Agriculture, Manila, Philippines.
BFAR (2004). Bureau of Fisheries and Aquatic Resources, Philippines. www.bfar.da.gov.ph/
Burke, L, Selig, E. and Spalding, M. (2002). Reefs at Risk in Southeast Asia. World Resources
Institute.UNEP-WCMC, Cambridge, U.K.
Cabanban, A.S. (1998). Impacts of fish-bombing on the coral reef fish community of the Semporna
Reef Complex, Sabah, Malaysia: Preliminary results, p 89-93 in: Proceeding of APEC
Workshop on the Impacts of Destructive Fishing Practices on the Marine Environment, 16-18
December 1997, Hong Kong.
Cesar, H.S.J., Warren, K.A., Sadovy, Y., Lau, P., Meijer, S. and van Ierland, E. (2000). Marine
market transformation of the live reef fish food trade in Southeast Asia, in: Cesar, H.S.J. (ed),
Collected Essays on the Economics of Coral Reefs. CORDIO, Department of Biology and
Environmental Sciences, Kalmar University, Sweden.
Cheung, C.P.S., Alino, P.M., Uychiaoco, A.J. and Arceo, H.O. (2002). Marine Protected Areas in
Southeast Asia. ASEAN Regional Centre for Biodiversity Conservation Department of
Environment and Natural Resources.
Chia, L.S. and Kirkman, H. (2000). Overview of Land-based Sources and Activities Affecting the
Marine Environment in the East Asian Seas. UNEP/GPA Coordination Office and EAS/RCU.
Regional Seas Report and Studies Series 173.
Chou, L.M. (1997). Southeast Asia as the global centre of marine biodiversity. Tropical Coasts 4:4-
8.
Chou, L.M., Wilkinson, C., Gomez, E. and Suraphol, S. (2002). Status of coral reefs in the ASEAN
Region, p 8-17 in: Wilkinson, C.R. (ed), Living Coastal Resources of Southeast Asia: Status
and Management. Report of the Consultative forum third ASEAN-Australia Symposium on
Living Coastal Resources. Chulalongkorn University Bangkok, Thailand. May 1994. Australian
Institute of Marine Science, Townsville, Australia.
DA-BFAR (2004). In turbulent Sea: the status of Philippine marine fisheries. Department of
Agriculture Bureau of Fisheries and Aquatic Resources. Coatal Rsources Management
Project, Cebu City, 378 p.
FAO (2000). Fishery Country Profiles. www.fao.org/fi/fcp/fcp.asp
Fortes, M. (2006). Seas of East Asia, p 177 -192 in: UNEP/GPA (2006), The State of the Marine
Environment: Regional Assessments. UNEP/GPA, The Hague.
Goreau, T.J., Hayes, R.L. and Strong, A.E. (1997) Tracking South Pacific coral reef bleaching by
satellite and field observations, Proc. 8th International Coral Reef Symposium, 2, 1491-1494.
Hodgson, G. and Dixon, J.A. (1992). Sedimentation damage to marine resources: Environmental
and economic analysis, in: Marsh, J.B. (ed), Resources and Environment in Asia's Marine
Sector. Taylor and Francis, Washington, U.S.
Hopley, D. and Suharsono. (2000). The Status of Coral Reefs in Eastern Indonesia. Australian
Institute of Marine Science, Townsville, Australia.
Ingles, J. and Pauly, D. (1984). An atlas of the growth, mortality and recruitment of Philippine
fishes. ICLARM Technical Report 13, 127 p.
Jacinto, G.S., Alino, P.M., Villanoy, C.L., Talaue-McManus, L. and Gomez, E.D. (2000). The
Philippines, in: Sheppard, C.R.C. (ed), Seas at the Millenium: An Environmental Evaluation.
Vol. II Regional Chapters: The Indian Ocean to the Pacific. Pergamon Press, Elsevier, The
Netherlands.
VIII East Asian Seas
319
Johannes, R.E. and Riepen, M. (1995). Environment, Economic and Social Implications of the Live
Fish Trade in Asia and the Western Pacific. Report to the Nature Conservancy and Forum
Fisheries Agency.
Kahn, B. and Fauzi, A. (2001). Fisheries in the Sulu Sulawesi Seas Indonesian Country Report.
Assessment of the State of Biophysical, Socio-economic, and Institutional Aspects of Coastal
and Pelagic Fisheries in the Indonesian part of the Sulu-Sulawesi Seas. WWF Sulu-Sulawesi
Marine Ecoregion Fisheries Project.
Kelleher, G., Bleakley, C. and Wells, S., eds. (1995). A Global Representative System of Marine
Protected Areas, Vol. III. Central Indian Ocean, Arabian Seas, East Africa and East Asian
Seas. Great Barrier Reef Marine Park Authority/ World Bank/World Conservation Union.
Licuanan, W.Y. and Gomez, E.D. (2000). Philippine Coral Reefs, and Associated Fisheries Status
and Recommendations to Improve their Management. Global Coral Reef Monitoring Network.
Australia Institute of Marine Science, Townsville, Australia.
NOAA Ocean Explorer. Online in 2007 at http://oceanexlorer.noaa.gov/explorations/07philippines/
background/speciation/media/lombok_600.html. Map of Indonesian Throughflow.
MPP-EAS (1998). Marine Pollution Management in the Malacca/Singapore Straits: Lessons
learned. MPP-EAS/Info99/195. GEF/UNDP/IMO Regional Programme for the Prevention and
Management of Marine Pollution in the East Asian Seas. Quezon City, Philippines
Pauly, D. and Christensen, V. (1995). Primary production required to sustain global fisheries.
Nature 374: 255-257.
Pauly, D. and Watson, R. (2005). Background and interpretation of the `Marine Trophic Index' as a
measure of biodiversity. Philosophical Transactions of the Royal Society: Biological Sciences
360: 415-423.
Pauly, D., Christensen, V., Dalsgaard, J., Froese R. and Torres, F.C. Jr. (1998).Fishing down
marine food webs. Science 279: 860-863.
Pilcher, N. and Cabanban, A. (2000). The Status of Coral Reefs in Eastern Malaysia. Australian
Institute of Marine Science, Australia.
Pratt, V. R., Mamauag, S., Alban, J., Parfan, E. and Donaldson, T. (2000). Status Report on the
Philippine Live Reef Fish Trade and Strategies to Combat its Destructive Fishing Practices.
Workshop on the Status of Philippine Reefs, 24 January 2000, Marine Science Institute,
University of the Philippines, Philippines.
Pratt, V.R. (1996). The growing threat of cyanide fishing in the Asia Pacific Region, and the
emerging strategies to combat it. Coastal Management in Tropical Asia 5: 9-11.
Reefbase (2005). Reefbase GIS Reefs at Risk, Southeast Asia. reefgis.reefbase.org/ mapper.asp
Roberts, C.M., McClean, C.J., Veron, J.E.N., Hawkins, J.P., Allen, G.R., McAllister, D.E.,
Mittermeier, C.G., Schueler, F.W., Spalding, M., Wells, F., Vynne, C. and Werner, T.B. (2002).
Marine biodiversity hotspots and conservation priorities for tropical reefs. Science 295:1280-
1284.
Russ, G. and Alcala, A. (1996). Do Marine reserves export adult fish biomass? Evidence from Apo
Island, Central Philippines. Marine Ecology Progress Series 132:1-9.
Sadovy, Y. and Pet, J. (1998). Wild collection of juveniles for grouper mariculture: Just another
capture fishery? SPC Live Reef Fish Information Bulletin 4:36-39.
Sea Around Us (2007). A Global Database on Marine Fisheries and Ecosystems. Fisheries Centre,
University British Columbia, Vancouver, Canada. www.seaaroundus.org/lme/
SummaryInfo.aspx?LME=37
Sherwood, K. (2002). Local commitment to conservation: A Philippine success story, in: Wilkinson,
C. (ed), Status of Coral Reefs of the World: 2002. Australian Institute of Marine Science,
Townsville, Australia.
Spalding, M., Ravilious, C. and Green, E.P. (2001). World Atlas of Coral Reefs. United Nations
Environment Programme World Conservation Monitoring Centre, Cambridge, U.K.
Teh, L., Zeller, D., Cabanban, A., Teh, L. and Sumaila, U.R. (2007). Seasonality and historic trends
in the reef fisheries of Pulau Banggi, Sabah, Malaysia. Coral Reefs 26: 251-263.
Trinidad, A.C., Pomeroy, R.S., Cruz, P.V. and Aguero, M. (1993). Bioeconomics of the Philippine
small pelagics fishery. ICLARM Technical Report 38, 75p.
UNEP (2005). DeVantier, L., Wilkinson, C., Souter, D., South, R., Skelton, P. and Lawrence, D.
Sulu-Celebes (Sulawesi) Sea, GIWA Regional assessment 56. University of Kalmar, Kalmar,
Sweden. www.giwa.net/publications/r56.phtml
Vantier, L., C. Wilkinson, D. Souter, R. South, P. Skelton, and D. Lawrence, editors (2005) Sulu-
Celebes (Sulawesi) Sea, GIWA Regional assessment 56, University of Kalmar on behalf of
United Nations Environment Programme, Kalmar, Sweden, 116 pp.
320
16. Sulu Celebes Sea LME
Veron, J.E.N. (2000). Corals of the World. Australian Institute of Marine Science,
Townsville, Australia.
Werner, T.B. and Allen, G.R. (2000). A Rapid Marine Biodiversity Assessment of the Calamianes
Islands, Palawan Province, Philippines. RAP Bulletin of Biological Assessment 17.
Conservation International.Washington D.C., U.S.
Wilkinson, C., ed. (2002). Status of Coral Reefs of the World: 2002. Australian Institute of Marine
Science, Townsville, Australia.
WWF (2001). Sulu-Sulawesi Seas Ecoregion: Users, Uses and Threats. A Report Integrated by
Raoul Cola for the Sulu-Sulawesi Marine Ecoregion Programme, WWF.
VIII East Asian Seas
321
VIII-17 West-Central Australian Shelf LME
T. Irvine, J. Keesing, N. D'Adamo, M.C. Aquarone and S. Adams
The West-Central Australian Shelf LME extends off Western Australia (WA) from Cape
Leeuwin (~34.5°S) to Northwest Cape (~22°S). This LME owes much of its biogeographic
unity to the respective connecting influences of the West Australian Current, a northward
flow coming from the circulation pattern of the counterclockwise Indian Ocean gyre, and
the Leeuwin Current (LC), the only west coast poleward-flowing eastern boundary current
in the southern hemisphere. The LC is a major southward flow of warm, low nutrient,
buoyant tropical water along this LME's relatively narrow continental shelf, and is
responsible for tropical reefs and associated marine flora and fauna flourishing further
south than anywhere else in the world (CALM, 1994). In addition to these regional scale
currents, there are wind-driven coastal counter currents dominating the circulation close
to shore mainly during the austral spring/summer period (Pattiaratchi, 2006). Relatively
high energy from sea and swell is a major feature of this LME, but there are embayments
and lagoons where waves are restricted or effectively blocked, with sheltered highly
biodiverse protected habitats occurring behind offshore limestone reefs in many localities
(CALM, 1994). The LME has an extremely narrow shelf, in some areas being merely 40
km wide, and covers an area of nearly 550,000 km2, about 2% of which is gazetted as a
marine protected area (MPA) that contains 0.37% of the world's coral reefs (CALM,
2005a; Sea Around Us, 2007; www.dec.wa.gov.au).
The region has a Mediterranean climate with sea temperatures varying from about 15°C
in the south in winter to about 29°C in the north in summer, as described in
biogeographic overviews contained within management plans for proposed and existing
Western Australian MPAs (see for example CALM, 1996, 2002, 2005a, 2005b and DEC
2006, 2007a, 2007b, 2007c). The marine biodiversity of this LME is characterised by a
rather special tropical-temperate mix, varying from predominantly tropical in the north to
predominantly temperate in the south. Tropical species from the north are carried
southwards by the LC, while temperate and sub-temperate species are carried
northwards by coastal counter currents, such as the Capes and Ningaloo currents
respectively (Pattiaratchi, 2006). The gradation in the biodiversity is exemplified by the
latitudinal variation in the relative proportion of tropical versus temperate fish species
along WA's coast, which acts as a good surrogate of overall biodiversity variation (Fox
and Beckley, 2005). Superimposed on the tropical-temperate distributions is a proportion
of the biota endemic to Western Australia, including, for example, 5% endemic fish
species and 25% endemic shallow water echinoderms. Overall, about 10% of the shallow
water fauna in this LME are endemic to WA (CALM, 1994).
Some of this LME's ecological highlights include the 270 km long fringing Ningaloo Reef
(~22°S), which resides within an MPA that has 30% gazetted as sanctuary zone; the
World Heritage listed hypersaline inverse-estuary of Shark Bay (~26°S), which is also an
MPA and contains 20,000 km2 of seagrass meadows and extensive areas of
stromatolites; the high-latitude coral reefs of the Abrolhos Islands (~29°S); extensive
areas of mangal communities; open coast sandy beaches; long shore-parallel intertidal
and sub-tidal macro-algal-dominated limestone reefs; and an overall high biodiversity of
mixed tropical/temperate marine species. This LME ranks 7th amongst the world's 18
most biologically diverse marine areas and 2nd as a centre of endemism (Roberts et al.,
2002). Recent large multidisciplinary studies have made significant advances in the
understanding of the region's biophysical, biogeochemical and ecological dynamics (e.g.
322
17 West Central Australian Shelf LME
Keesing et al., 2006). UNEP (2003) provides further biogeographical information on this
LME.
I. Productivity
The West-Central Australian Shelf LME is a Class III, low productivity (<150 gCm-2yr-1)
ecosystem. Its coastal waters are oligotrophic by world standards, with recent studies by
Koslow et al. (2006) recording annual phytoplankton production at 46gCm-2 inshore and
115gCm-2 on the shelf and offshore. Due to its latitudinal range and confluence of tropical
and temperate flows, this LME encompasses diverse pelagic and coastal ecosystems. In
the southeast Indian Ocean, the West Wind Drift branches northward as the West
Australian Current. However, the presence of the southward flowing Leeuwin Current
(LC) closer to the coast of this LME effectively suppresses any broad-scale upwelling of
deeper, highly productive water, in contrast to other eastern boundary currents where
strong upwelling is typical. However, recent studies are showing that localised
productivity from upwelling can be associated with sporadic events and near-shore
counter currents (see, for example, the research framework of the Western Australian
Marine Science Institution: www.wamsi.org.au). Perth Canyon, an incisive, 100 km long
and deep (ranging from 200 to 4000 m) canyon, is a highly productive slope feature off
Perth (Rennie et al., 2006) characterised by bouts of eddy-induced upwelling, high
primary production, and associated aggregations of marine fauna, from large (e.g.
whales) to small (e.g. krill).
The LC flows most strongly in winter, extending all the way down the west coast and then
eastward along the southern coast of the Australian continent. Comparatively warmer,
lower salinity water flows through the Indonesian Archipelago from the Pacific Ocean to
the Indian Ocean, and results in lower density water between Indonesia and northwest
Australia as compared with the cooler and more saline ocean waters off southwest
Australia (Pattiaratchi, 2006). This density difference results in a sea level change of up
to about 0.5 m along the Western Australian coast and is the driving force for the
Leeuwin Current. Due to the effect of the earth's rotation, water is entrained from the
Indian Ocean into the Leeuwin Current, and the Current cools as it propagates
southwards; thus, the Leeuwin Current strengthens as it flows southward. The Leeuwin
Current weakens in spring/summer, mainly as a result of the relatively strong opposing
wind stresses associated with seasonal wind fields. Ridgway and Condie (2004) provide
further information on the seasonal evolution of the LC flow and its influence on sea
surface temperature throughout the year.
The dynamics of the LC are influenced to a significant extent by inter-annual variability in
the El Nińo Southern Oscillation and an important feature is the strong eddy activity
associated with the instability in the fast southward flow (Waite et al., 2007). These
eddies are typically up to about 300 km in diameter and can generate large productivity
pulses, drawing significant amounts of water, heat and biomass from the productive shelf
and coastal waters into the open ocean. During winter in La Nińa years the LC may have
a volume transport of 6 million m3sec-1, while in winter in El Nińo years this is about 4
million m3sec-1 (Feng et al., 2003). It has been calculated that the eddies may flush the
entire volume of the southwestern Australian continental shelf twice annually carrying
phytoplankton biomass equivalent to 40,000 tonnes of carbon offshore each year (Feng
et al., 2007). The dynamics of the LC, particularly the large-scale eddy circulation, is
known to also have a profound influence on the LME's coastal and offshore fisheries
ecology, for example the predictable influence on the inter-annual variability in
recruitment of the commercially important Western Rock Lobster.
Within the LC, a deep chlorophyll maximum is a significant contributor to total water
column production. Chlorophyll a, as an indicator of phytoplankton, peaks in the late
VIII East Asian Seas
323
autumn / early winter period on the shelf and shelf break, in phase with the seasonal
strengthening of the LC and its eddy field. This is consistent with the recent discovery of
a deep water chlorophyll maxima representing high phytoplankton levels around 50 m
depth in winter (Koslow et al., 2006). Ongoing studies are examining how enhanced flow
of the LC in late autumn might lead to nutrient enrichment and heightened primary
productivity. These studies are also examining the role of the extensive and highly
productive benthic ecosystems of the region (Babcock et al., 2006) and benthic-pelagic
coupling on the biogeochemistry of the region. Nutrient budgeting for the region by Feng
and Wild-Allen (in press) indicates that about 80% of nitrogen utilised by annual primary
production is retained and recycled on the shelf. For more information on the LC and its
influence on this LME see Deep Sea Research II special issue, volume 54.
When the LC is flowing strongly during the winter months, it tends to move onto the
continental shelf as it approaches Cape Naturaliste. It generally flows close inshore down
to Cape Leeuwin and then eastwards towards the Great Australian Bight. In late spring,
however, it moves a little offshore to be replaced by a cool northwards counter-current,
recently named the Capes Current. The Capes Current commences near Cape Leeuwin
and flows northwards past Cape Naturaliste and on beyond Rottnest Island (Pearce and
Pattiaratchi, 1999); there is often an associated upwelling region in the lee of Rottnest
Island. This in turn dies away about March/April as the strengthening LC moves inshore
again. Similarly, a summer counter current (the Ningaloo Current) has recently been
identified along the Ningaloo Reef (Taylor and Pearce, 1999), and similar counter
currents are known to exist inshore of the Abrolhos Islands. Pattiaratchi (2006) provides a
more detailed overview of these and other general circulation patterns off Western
Australia.
For an analysis of the association between oceanic fronts and enhanced marine
productivity, see Menon (1998). Shark Bay along the coastline is an inverse estuary:
along this arid coastline region, the high evaporation rate from shallow embayments
without significant freshwater inflows and with restricted tidal exchange creates an
environment with a salinity that exceeds that of the seawater, to a maximum of about 65
ppt in its uppermost reaches, where extensive areas of stromatolites occur (CALM,
1996). For a general understanding of oceanographic processes affecting the nutrient
dynamics and productivity of Australian marine ecosystems, read the State of the
Environment Report (EPA, 2007). For more information on productivity, see
www.ea.gov.au.
Oceanic fronts (Belkin et al., 2008): The Leeuwin Current Front (LCF) (Figure VIII-17.1),
described in 1980 by Cresswell and Golding (1980), occurs within this LME, although
some source waters of this current/front are found farther north, in the Northwest
Australian Shelf LME. The Leeuwin Current, flowing poleward along the outer continental
shelf, is a relatively shallow and narrow boundary current by global standards, being less
than 300 m deep and 100 km wide. Typical current speeds within the Leeuwin Current
and its eddies are about 1 knot (50 cm/s), although speeds of 2 knots are common, and
the highest speed ever recorded by a drifting satellite-tracked buoy was 3.5 knots.
Tropical warm waters spread along this front toward Cape Leeuwin. There is a northward
counter current beneath the Leeuwin Current called the Leeuwin Undercurrent. The
Leeuwin Undercurrent flows equatorward in a narrow depth zone (typically 250-450 m)
and carries relatively high-salinity, oxygen-rich, nutrient- depleted water northward within
this LME.
The North Tropical Front (NTrF) merges with the LCF near 25°S. Farther south, the
South Tropical Front (STrF) merges with the LCF near 30°S. The LCF and the associated
current extend over the shelf break and shelf. They play an important role in the ecology
of many tropical species, particularly lobster, since the Leeuwin Current and its extension
324
17 West Central Australian Shelf LME
carry lobster eggs and larvae into the Great Australian Bight. In addition, the high latitude
(29°S) coral reef at Houtman Abrolhos (Abrolhos Islands), with its relatively high coral
diversity, is established and sustained by the Leeuwin Current, which is also responsible
for the presence of corals as far south as Rottnest Island (32°S). A meso-scale Kalbarri
Inner Shelf Front (KISF) extends NNW from the Murchison River mouth at 27.5°S.
Figure VIII-17.1. Fronts of the West-Central Australian Shelf LME. KISF, Kalbarri Inner Shelf Front; LCF,
Leeuwin Current Front; NTrF, North Tropical Front; STrF, South Tropical Front. Yellow line, LME
boundary. After Belkin et al. (2008).
West-Central Australian Shelf SST (Belkin, 2008)(Figure VIII-17.2)
Linear SST trend since 1957: 0.82°C.
Linear SST trend since 1982: 0.09°C.
The 25 years since 1957 were rather quiet and relatively cold. The single pronounced
cold event of 1968 was also observed in the Sulu-Celebes Sea LME, Indonesian Sea
LME, Northwest Australian Shelf LME, and Southwest Australian LME. The cold event of
1968 was preceded by the all-time minimum in the Indonesian Sea in 1967 (and a
minimum of 1967 in the North Australian Shelf LME); therefore this low-temperature
signal was likely transported by the Indonesian Throughflow from the Indonesian Sea
onto Western Australia's shelves, and farther south and east, with the Leeuwin Current,
onto the Southwest Australian Shelf LME.
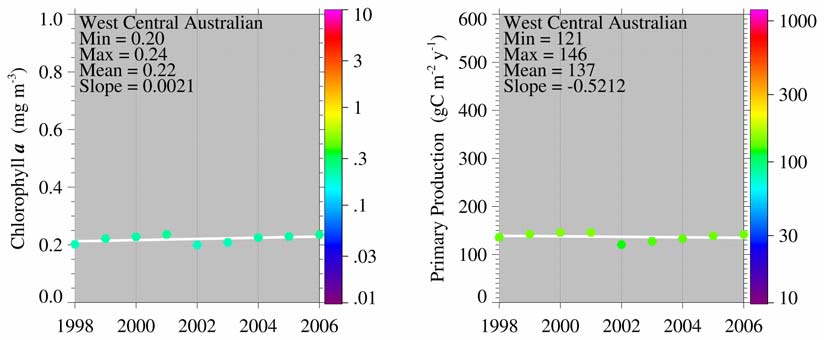
VIII East Asian Seas
325
The 25 years from 1982 to 2006, featured strong events with a peak-to-trough amplitude
of 1°C. The two warm events of 1983-1984 and 1988-1989 were possibly correlated with
moderate El Nińos. The all-time maximum of 1998 was likely linked to the extremely
strong El Nińo 1997-98 (Feng et al., 2003).
Figure VIII-17.2. West Central Australia Shelf LME annual mean SST (left) and SST anomalies (right),
1957-2006, based on Hadley climatology. After Belkin (2008)
West-Central Australian Shelf LME Chlorophyll and Primary Productivity: The
-2
-1
West-Central Australian Shelf LME is a Class III, low productivity (<150 gCm yr )
ecosystem.
Figure VIII-17.3. West-Central Australian Shelf LME trends in chlorophyll a (left) and primary
productivity (right), 1998-2006, from satellite ocean colour imagery; courtesy of K. Hyde.
II. Fish and Fisheries
Production in Australian waters is limited by low levels of nutrients and as a result, fish
populations are relatively small. Many species are endemic to Australia. Although not
productive by world standards, there are numerous commercial and recreational fisheries
based in the waters of this LME. The commercial fisheries operating in this area tend to
be low-volume, high-value fisheries producing fish and shellfish for local consumption
326
17 West Central Australian Shelf LME
and export. Currently there are 16 State-managed commercial fisheries and 5
Commonwealth commercial fisheries within this LME. For details of WA State fisheries
see Fletcher and Head (2006) and for Commonwealth fisheries see Larcombe and
McLoughlin (2007).
There are commercial fisheries for lobster, abalone, pink snapper, shark, crab, pilchard,
prawn and scallop. Constantly changing ocean conditions affect the abundance and
distribution of all species in the marine food chain. The commercial fishery for the
western rock lobster, Panulirus cygnus, within this LME is the largest single-species
fishery in Australia. The important finfish fisheries are the Shark Bay Snapper Fishery
and the West Coast Purse Seine Fishery; the most significant prawn and scallop trawl
fisheries are concentrated in Shark Bay, with some other trawl fisheries further south.
Approximately 45% of the waters of this LME out to the 200 m contour are permanently
closed to trawling.
Using global data, total reported landings in this LME peaked at around 16,000 tonnes in
1993, followed by a period of a slight dip in the late 1990s, but have returned to 16,000
tonnes in 2004 (Figure VIII-17.4). However, alternate calculations from this LME's portion
of State fisheries (Fletcher and Head, 2006) and Commonwealth fisheries (Australian
Fisheries Management Authority, pers. comm.) estimate the annual production of
commercial fisheries in 2005 to be 30,055 tonnes, valued at US$340 million.
Invertebrates such as lobster, scallops, prawns and shrimps account for the largest share
of the landings in the LME. The reported landings were estimated to be valued at about
US$120 million in 2000 (Figure VIII-17.5).
All fisheries in the area are subject to management plans which embrace the principles of
Ecosystem Based Fishery Management (EBFM) as opposed to single target species
management approaches (Smith et al., 2007). For the 21 managed fisheries in this
region, 15 have published Stock Assessments and 16 have published Ecological Risk
Assessments (Fletcher and Head, 2006). Of those with published Ecological Risk
Assessments, one fishery had inadequate spawning stock levels, one had moderate
bycatch species impacts, one had moderate protected species (marine mammal)
interactions, two had moderate food chain impacts and one had moderate habitat
impacts.
There are some areas that are of particular concern due to over-fishing; for example, the
Shark Bay snapper fishery has experienced very high fishing pressure in the past, and
following adjustments to management strategies (including prolonged closures), the
population of pink snapper has not recovered as expected (Fletcher and Head, 2006). It
is thought that wider environmental factors are playing a significant role (e.g. ocean
currents affecting young fish, and perhaps water temperature). The most significant
Commonwealth managed fishery in this LME is the Western Tuna and Billfish industry.
Southern bluefin tuna, yellowfin tuna and broadbill swordfish are subject to overfishing in
the broader Indian Ocean (Larcombe and McLoughlin, 2007). The Australian
Government is party to a number of international conventions or agreements for the
management of highly migratory tunas and billfishes that range far beyond the Australian
Fishing Zone see Larcombe and McLoughlin, 2007.
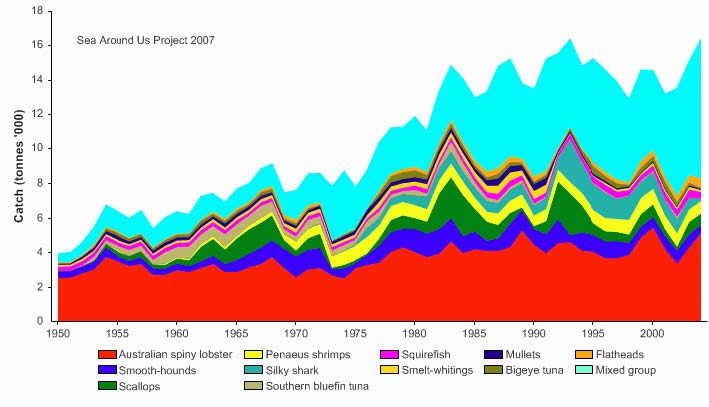
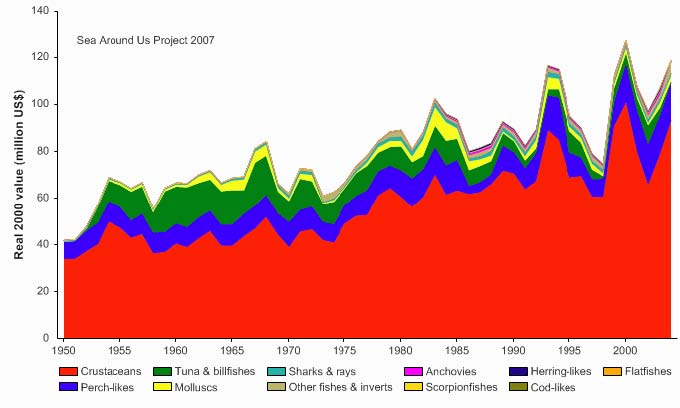
VIII East Asian Seas
327
Figure VIII-17.4. Total reported landings in West-Central Australian Shelf LME by species (Sea Around
Us, 2007).
Figure VIII-17.5. Value of reported landings in West-Central Australian Shelf LME by commercial groups
(Sea Around Us, 2007).
The primary production required (PPR; Pauly and Christensen, 1995) to sustain the
reported landings is very small (less than 1.5%), in line with the low exploitation of the
LME (Figure VIII-17.6). Australia has the largest share of the ecological footprint in this
LME.
328
17 West Central Australian Shelf LME
Figure VIII-17.6. Primary production required to support reported landings (i.e., ecological footprint) as
fraction of the observed primary production in the West-Central Australian Shelf LME (Sea Around Us,
2007). The `Maximum fraction' denotes the mean of the 5 highest values.
The mean trophic level (i.e., expressed through the Mean Trophic Index (MTI); Pauly and
Watson, 2005) in the LME was generally low, due to the low trophic level of Australian
spiny lobster which accounts for the largest share of the reported landings (Figure VIII-
17.7 top). In recent years, however, the MTI is on a rise with the growing share of
various fish species in the landings. This transition is also reflected in the Fishing-in-
Balance (FiB) index (Figure VIII-17.7 bottom). This LME, thus, shows no sign of a
`fishing down,' in line with the low level of PPR recorded in Figure VIII-17.6.
Figure VIII-17.7. Mean trophic level (i.e., Marine Trophic Index) (top) and Fishing-in-Balance Index
(bottom) in the West-Central Australian Shelf LME (Sea Around Us, 2007).
There are high levels of recreational fishing but negligible levels of artisanal or indigenous
traditional fishing in this LME. The key target species of recreational fishing are western
king and school prawns, blue manna crabs, abalone, rock lobster and a variety of finfish
VIII East Asian Seas
329
including herring, salmon, tailor, whiting, snapper, dhufish and a variety of other highly
sought after reef fish species.
The Stock-Catch Status Plots indicate that about 70% of the stocks are deemed as
collapsed or overexploited (Figure VIII-17.8, top). It appears that the majority (over 70%)
of the reported landings is supplied by fully exploited stocks (Figure VIII-17.8, bottom).
However, the editors and Australian contributors wish to acknowledge and advise caution
that there are several reasons possible for the apparently reduced status of some
species. Among them, Australian management authorities have in many cases limited
catches and effort to protect the species from overfishing. Landings of these stocks are
therefore lowered, giving the appearance of an overfished condition status in Figure 8. In
addition, productivity of some of these fisheries is tightly coupled to environmental
variability, in particular ENSO, and this also reduces catches in some years in ways not
due to exploitation rate. Catches of all species are subject to annual active management
intervention and often include temporally and spatially explicit adaptive management
measures to prevent overfishing.
1950
1960
1970
1980
1990
2000
0%
100
10%
90
20%
)
80
%
(
s
30%
u
70
at
st
40%
y
60
b
50%
cks
50
o
f
st
60%
o
40
er
70%
mb
30
u
N
80%
20
90%
10
100%0
1950
1960
1970
1980
1990
2000
(n = 1865)
developing
fully exploited
over-exploited
collapsed
0%
100
10%
90
20%
80
)
%
30%
(
70
s
u
at
40%
60
ck st
50%
o
50
st
y
60%
b
h
40
t
c
a
70%
C
30
80%
20
90%
10
100%0
1950
1960
1970
1980
1990
2000
(n = 1865)
developing
fully exploited
over-exploited
collapsed
Figure VIII-17.8. Stock-Catch Status Plot for the Western Central Australian Shelf LME, showing the
proportion of developing (green), fully exploited (yellow), overexploited (orange) and collapsed (purple)
fisheries by number of stocks (top) and by catch biomass (bottom) from 1950 to 2004. Note that (n), the
number of `stocks', i.e., individual landings time series, only include taxonomic entities at species,
genus or family level, i.e., higher and pooled groups have been excluded (see Pauly et al, this vol. for
definitions).
III. Pollution and Ecosystem Health
The shallow water marine environments of this LME are recognised as having some of
the highest marine biodiversity and endemism in the world. Roberts et al. (2002) ranked
this area 2nd in the world among 18 centers of endemism. Of those 18, this area ranked
330
17 West Central Australian Shelf LME
among the least threatened, ranking 15th in terms of threats from coastal development,
overexploitation and pollution. This is in part due to the region's sparse population and
relatively low associated level of threatening activities, but also due to the strong
legislative framework (see Governance section) and a mature planning framework for
marine natural resource management that embraces and includes multiple-use MPAs
and Ecosystem Based Management of Fisheries. The State of the Environment Report
(EPA, 2007) assessed the condition of the marine environment against a selection of
broad indicators in the categories of Degradation of the Marine Environment, Marine
Contamination and Introduced Marine Pests. Marine contamination issues affect only a
small proportion of the waters of this LME, mainly near ports. Heavy metal contamination
is low in the areas it is monitored. Overall, the report expresses concern that too few
places are routinely monitored for degradation and contamination against environmental
quality management frameworks. The condition of WA's coastal and shelf waters has
historically been poorly monitored, with the exception of certain highly pressured areas,
such as Albany harbours, North West Shelf (particularly Dampier Archipelago) and areas
which lie on the southern boundary of the LME such as Cockburn Sound and Perth
metropolitan coastal waters (EPA, 2007). Relevant reports are available through the
Western Australian Department of Conservation and Environment (www.dec.wa.gov.au)
and the Environmental Protection Agency (www.epa.wa.gov.au). Western Australia's
overall marine and coastal monitoring framework is undergoing a significant expansion as
part of the State's MPA implementation and management programs, as discussed in
Section V.
Although relatively infrequent, accidental discharges of contaminants, such as from spills
and shipping accidents, also place pressure on the region's marine environment. Port
and industrial development, pipelines, mining and dredging cause direct physical damage
to the marine habitats. Tributyltin (TBT) contamination (a highly toxic ingredient of anti-
fouling paint applied to ships and coastal vessels) was widespread throughout the Perth
metropolitan region in areas near marinas and ports; however following complete bans in
1991 on the use of TBT on boats less than 25 m long, the effects of contamination have
been decreasing (Wells et al., 2008). Another major pressure in the Perth area marine
environment is excessive nutrient loads from sewage wastewater outfalls, as well as from
industrial and agricultural sources. To a lesser degree, there are also contaminated
groundwater and river and estuary discharges.
In respect to the threat from introduced marine species, significant numbers have been
recorded along the coast, such as in the port of Geraldton, as well as in certain localities
within the Carnarvon and adjacent Shark Bay areas. The most likely vectors are thought
to be international and domestic shipping, fishing and recreational vessels (EPA, 2007).
The West-Central Australian Shelf LME is therefore threatened by an increase in
shipping, especially from ballast water. Ballast water discharges are of concern because
of their potential to transport species from their native habitat to new habitats where they
may become invasive. Ballast water from shipping has been responsible for introducing
more than 250 species, and possibly as many as 500 species, into Australian waters. In
response, Australia has introduced mandatory ballast water management requirements
to reduce the risk of introducing more unwanted marine species. More than 99% of the
approximately 12,500 annual voyages that arrive in Australia comply with these
requirements (Beeton et al., 2006).
Tourism, urban development and associated commercial and recreational use along the
coastal strip are also placing stress in populated areas of this LME, through coastal
development and recreational fishing in particular. Natural embayments along WA's
extensive coastline make ideal locations for human settlements, ports and marinas, but
this places pressure on shallow water marine habitats from the associated ecological
forcings that accompany human usage. Large numbers of people are engaged in
VIII East Asian Seas
331
recreational activities that have the potential to affect the environment through pol ution of
the water by boats and the disturbance of species and habitats. For more information on
marine and coastal pollution issues see Pogonoski et al. (2002), annual State of the
Environment reports (EPA, 2007) and Zann (1995).
Recent advances in the understanding and prediction of climate change impacts, places
this amongst the most concerning of all fundamental pressures on the marine
ecosystems in this LME. The WA region has been subjected to a significantly greater
warming trend over the last 50 years than many other parts of the Indian Ocean (Feng et
al., 2005; EPA, 2007). Climate modeling under the IPCC A2 greenhouse gas scenario
predicts that continued warming will occur and that the warming is a result of local air-sea
fluxes, not hydrodynamic structure (Feng et al., 2007). The advancing establishment of
GOOS (Global Ocean Observing System) in the region, facilitated by the
Intergovernmental Oceanographic Commission, will continue to improve the
characterization of broadscale hydrodynamic and climatic impacts within WA's LMEs.
This is being achieved through, for example, the Indian Ocean Observing System
(IndOOS) of the Indian Ocean Panel of CLIVAR/GOOS (www.clivar.org/organization
/indian/indian_reference.php), Australia's recently implemented Integrated Marine
Observing System (www.imos.org.au) and a number of long-term monitoring networks
established and maintained under the auspices of State and Federal natural resource
management and maritime transport agencies. Furthermore, Australia's operational
ocean forecasting facility, Bluelink, that currently provides ocean forecasts at 10 km grid
resolution out to 7 days, is underpinned by data assimilation progressed under the
international GODAE program (www.bom.gov.au/bluelink).
IV. Socioeconomic Conditions
The most populous sections of the WA coast are in the city of Perth and two smaller
cities, Geraldton and Bunbury. As an island nation, Australia depends heavily on its
marine environment for transport and shipping. Fishing is an important marine industry
and its highly distributed nature along the coast makes it important socioeconomically for
many rural communities. FAO provides information on the characteristics and
socioeconomic benefits of Australia's fishing industry (www.fao.org). Aquaculture is a
relatively minor activity, except for important pearling operations. The dry, hot climate of
this area makes it ideal for solar salt production. Extensive evaporation ponds have been
established adjacent to Shark Bay, and there are a number of other large-scale
evaporative salt plants. Marine and coastal-based tourism are important in this LME, both
in terms of domestic and international tourism, with recreational fishing a very significant
component, in addition to scuba diving, surfing, wind surfing, sailing and boating.
Tourists prize the LME's coral reefs and the general natural and unspoiled marine
environment. The coral-dominated Ningaloo Reef is an important tourism location with
over 200,000 tourists visiting each year. Shark Bay is one of only six World Heritage
Areas in Australia that have a marine component. This LME is a breeding ground for the
Antarctic-feeding humpback whale. Other cetaceans (including many whale species and
large numbers of dolphins), dugong, sharks (including whale sharks), sea lions, sea
turtles (six species), sea snakes, manta rays, seabirds, shorebirds, migratory waders and
little penguins are amongst the key marine values of this LME. The region is also notable
for extensive stands of seagrass meadows, involving many species of seagrasses. In
addition to commercial and recreational fishing, this LME supports other important
cultural and economic marine values which include aquaculture (e.g. pearling),
indigenous and maritime (European) heritage, seascapes, wilderness, marine tourism
(e.g. diving, swimming, sailing, water sports), and petroleum development.
332
17 West Central Australian Shelf LME
V. Governance
Australia has a federal system of government with the states forming the Australian
Commonwealth federation. This LME lies adjacent to the State of Western Australia
(WA). Australia's exclusive economic zone (EEZ) extends out 200 nautical miles. Within
the EEZ, WA State waters generally extend 3 nm offshore, or greater in some areas to
encompass islands and archipelagos. The Commonwealth Government's Environment
Protection and Biodiversity Conservation Act 1999 is the principal national instrument for
managing human usage and impacts, and for conserving biodiversity in Australia's
territory. It is employed in conjunction with the WA State Government's Environmental
Protection Act 1986, Wildlife Conservation Act 1950 and Conservation and Land
Management Act 1984, the latter of which was amended by the Acts Amendment (Marine
Reserves) Act 1997, establishing the Marine Parks and Reserves Authority (MPRA) as
the vesting body for Western Australia's marine conservation reserves.
Australia is committed to the protection of marine biodiversity and ecological processes
and the sustainable use of marine resources through the goals and principles of
Ecological Sustainable Development (ESD). This commitment has been ratified through
Australia's international responsibilities and obligations under the Convention on
Biological Diversity and implemented at a national level by the States and Territories
under the Intergovernmental Agreement on the Environment (IGAE), through the
development of national strategies. Biodiversity conservation is managed by a strong
legislative and planning framework and an extensive system of marine conservation
reserves, which, when fully implemented, will cover approximately 35% of this LME's
coast length.
In the early 1990s, at a national level, Australia identified a need to protect representative
examples of the full range of Australia's marine ecosystems and habitats in marine
protected areas. The respective State Governments agreed to establish a
comprehensive, adequate and representative system of protected areas covering
Australia's Exclusive Economic Zone. As a first step over the past 10 years, a spatial
framework was developed and established, named the Integrated Marine and Coastal
Regionalisation of Australia (IMCRA), for classifying Australia's marine environment into
bioregions that make sense ecologically and that are at a scale useful for regional
planning (Commonwealth of Australia, 2006). This captures all Australian waters from the
coast to the edge of the Exclusive Economic Zone, excluding Antarctica and Heard and
Macdonald Islands. These IMCRA bioregions are consolidated into regional groupings to
form a smaller set of Marine Bioregional Planning Regions under Australia's Oceans
Policy (www.environment.gov.au/coasts/mbp). This LME encompasses parts or all of 4
of the 7 provincial bioregional units making up the South-West region and 3 of the 8
provincial bioregional units making up the North-West marine bioregional planning region.
Development of a Bioregional Profile identifying the important ecological, conservation
and socioeconomic values of the region for the South West has been released
(Department of the Environment and Water Resources, 2007); that of the North West
was expected to be released in mid-2008 (see www.environment.gov.au/coasts/
mbp/north-west).
Such marine bioregionalisations and descriptive profiles help managers to understand
complex ecosystems and their specific management needs. These bioregions are
consistent with the development of a National Representative System of Marine
Protected Areas (NRSMPA) which aims to establish and manage a system of marine
protected areas to contribute to the long-term ecological viability of marine and estuarine
systems, in order to maintain ecological processes and systems, and to protect
Australia's biological diversity at all levels. The Western Australian Government's
existing and proposed system of Marine Protected Areas contributes to the Australian
VIII East Asian Seas
333
National Representative System of Marine Protected Areas (www.dec.wa.gov.au) and,
when fully implemented, will also result in MPAs situated within all of the LMEs covering
Western Australian coastal zone.
Western Australia's MPA framework focuses on the maintenance of marine biodiversity,
but also considers socioeconomic marine uses allowing for managed fishing and general
tourism as important social uses (CALM, 1994). The framework includes explicit provision
for marine sanctuary (no-take) zones and other special purpose zones (e.g. for scientific
reference and education) to ensure biodiversity conservation requirements can be met.
Often, State and Commonwealth instruments are used to provide contiguous zones of
protection. For example, the Ningaloo Marine Park is a state-managed marine park
extending 3 nm from the coast, and a Commonwealth Act has been used to extend the
effective area of the MPA seaward through the establishment of an adjoining
Commonwealth MPA.
Natural resource management (NRM) for the area comes under the jurisdiction of an
integrated (State and Federal) national framework, facilitating scientific and institutional
consistencies in NRM science and governance. The socioeconomic uses incorporated in
NRM regimes centre around fishing, coastal use, nature-based tourism, water sports,
scientific research, education and petroleum activities. A best-practice, outcome-based
NRM model for adaptive management is employed (ANZECC, 1997). This is supported
by a statewide marine science program that services a statutory adaptive management
framework based around zoning, compliance (patrol and enforcement), public
participation (education/communication/interpretation), management intervention, visitor
infrastructure, research, and monitoring (www.calm.wa.gov.au). Key planks of the NRM
model are the designation of performance measures (indicators of management
effectiveness), management targets (the end points of management) and key
performance indicators (quantitative measures of overall management effectiveness),
which are regularly and formally assessed under Government legislation, in respect to
the effectiveness of management (www.dec.wa.gov.au) by the State's Marine Parks and
Reserves Authority.
Fisheries management is also implemented at State (www.fish.wa.gov.au) and
Commonwealth (www.afma.gov.au) levels, underpinned by ecosystem-based
frameworks rather than more traditional single-species stock management methods. The
Offshore Constitutional Settlement (OCS) agreement defines the jurisdiction of
Commonwealth and State governments, with management of most fish stocks out to the
200 nm limit of the Australian Fishing Zone being managed under state legislation (Fish
Resources Management Act 1994). Offshore fisheries and those extending across state
borders are managed by the Commonwealth Government (Fisheries Management Act
1991). Integrated State/Commonwealth institutional instruments are also in use for the
management of marine values focusing on maritime and indigenous heritage, tourism,
science, education, shipping and extractive industries such as mining, oil/gas exploration
and production.
References
ANZECC (1997) Best practice in performance reporting in natural resource management.
Australian and New Zealand Environment and Conservation Council. Department of Natural
Resources and Environment, Melbourne, Australia.
Babcock R., Clapin, G., England, P., Murphy, N., Phillips, J., Sampey, A., Vanderklift, M. and
Westera, M. (2006) Benthic Ecosystem Structure: Spatial and Temporal Variability in Animal
334
17 West Central Australian Shelf LME
and Plant Diversity. In: Keesing J.K, Heine, J.N., Babcock, R.C., Craig, P.D. and Koslow, J.A.
Strategic Research Fund for the Marine Environment Final Report. Volume 2: the SRFME core
projects. Strategic Research Fund for the Marine Environment, CSIRO, Australia. p. 187-238.
Beeton R.J.S., Buckley K.I., Jones G.J., Morgan D., Reichelt R.E. and Trewin D. (2006) Australia
State of the Environment 2006, Independent report to the Australian Government Minister for
the Environment and Heritage. Department of the Environment and Heritage, Canberra.
Belkin, I.M. (2008) Rapid warming of Large Marine Ecosystems, Progress in Oceanography, in
press.
Belkin, I.M., Cornillon, P.C., and Sherman, K. (2008) Fronts in Large Marine Ecosystems of the
world's oceans. Progress in Oceanography, in press.
CALM (Department of Conservation and Land Management) (1994) A Representative Marine
Reserve System for Western Australia. Report of the Marine Parks and Reserves Selection
Working Group. Department of Conservation and Land Management (CALM), Perth, Western
Australia.
CALM (Department of Conservation and Land Management) (1996) Shark Bay Marine Reserves
Management Plan 1996-2006. Management Plan No. 34. Department of Conservation and
Land Management, Perth, Western Australia.
CALM (Department of Conservation and Land Management) (2002) Marmion Marine Park
Management Plan 1992-2002. Management Plan No. 23. Department of Conservation and
Land Management, Perth, Western Australia.
CALM (Department of Conservation and Land Management) (2005a) Management Plan for the
Ningaloo Marine Park and Muiron Islands Marine Management Area 2005-2015. Management
Plan No. 52. Department of Conservation and Land Management and Marine Parks and
Reserves Authority, Perth, Western Australia.
CALM (Department of Conservation and Land Management) (2005b) Jurien Bay Marine Park
Management Plan 2005-2015. Management Plan No. 49. Department of Conservation and
Land Management and Marine Parks and Reserves Authority, Perth, Western Australia.
Commonwealth of Australia (2006) A Guide to the Integrated Marine and Coastal Regionalisation
of Australia Version 4.0. Department of the Environment and Heritage, Canberra, Australia.
Cresswell, G.R. and Golding, T.J. (1980) Observations of a south-flowing current in the
southeastern Indian Ocean. Deep-Sea Research 27A: 449-66.
DEC (Department of Environment and Conservation) (2006) Indicative Management Plan for the
Proposed Geographe Bay/Leeuwin-Naturaliste/Hardy Inlet Marine Park. Management Plan No.
49. Department of Environment and Conservation, Perth, Western Australia.
DEC (Department of Environment and Conservation) (2007a) Shoalwater Islands Marine Park
Management Plan 2007-2017. Management Plan No. 58. Department of Environment and
Conservation and Marine Parks and Reserves Authority, Perth, Western Australia.
DEC (Department of Environment and Conservation) (2007b) Management Plan for the
Montebello/Barrow Islands Marine Conservation Reserves 2007-2017. Management Plan No.
55. Department of Environment and Conservation and Marine Parks and Reserves Authority,
Perth, Western Australia.
DEC (Department of Environment and Conservation) (2007c) Rowley Shoals Marine Park
Management Plan 2007-2017. Management Plan No. 56. Department of Environment and
Conservation and Marine Parks and Reserves Authority, Perth, Western Australia.
Department of the Environment and Water Resources (2007) The South-West Marine Bioregional
Plan: Bioregional Profile. Australian Government. 197pp. Available at
www.environment.gov.au/coasts/mbp
EPA (Environmental Protection Authority) (2007) State of the Environment Report: Western
Australia 2007. Department of Environment and Conservation, Perth, Western Australia.
Available at www.soe.wa.gov.au
Feng, M., Majewski, L., Fandry, C., and Waite, A. (2007) Characteristics of two counter-rotating
eddies in the Leeuwin Current system off the Western Australian coast. Deep-Sea Res. II 54:
961980.
Feng, M., Meyers, G. Pearce, A. and Wijffels, S. (2003) Annual and interannual variations of the
Leeuwin Current at 32°S, Journal of Geophysical Research, 108(11): 3355.
Feng, M., Wijffels, S., Godfrey, S. and Meyers, G. (2005) Do eddies play a role in the momentum
balance of the Leeuwin Current? J. Phys. Oceanogr. 35: 964-975.
Feng, M. and Wild-Allen, K. (In Press) The Leeuwin Current. In: Liu, K.-K., Atkinson, L., Quinones,
R. and Talaue-McManus, L. (Eds.) Carbon and Nutrient Fluxes in Continental Margins: A
Global Synthesis.
VIII East Asian Seas
335
Fletcher, W.J. and Head, F. (Eds) (2006) State of the Fisheries Report 2005/06. Department of
Fisheries, Western Australia.
Fox, N.J. and Beckley, L.E. (2005) Priority areas for conservation of Western Australian coastal
fishes: A comparison of hotspot, biogeographical and complementarity approaches. Biological
Conservation 125: 399-410.
Keesing J.K., Heine, J.N., Babcock, R.C., Craig, P.D. and Koslow, J.A. (2006) Strategic Research
Fund for the Marine Environment Final Report. Volume 2: the SRFME core projects Strategic
Research Fund for the Marine Environment, CSIRO, Australia. 266pp.
Koslow, J.A., Greenwood, J., Lourey, M., Rosebrock, U., Wild-Allen, K., and Margvelashvili, N.
(2006) Coastal and Shelf Biogeochemistry and Modelling. In: Keesing J.K, Heine, J.N.,
Babcock, R.C., Craig, P.D. and Koslow, J.A. Strategic Research Fund for the Marine
Environment Final Report. Volume 2: the SRFME core projects. Strategic Research Fund for
the Marine Environment. CSIRO, Australia. p. 123-185.
Larcombe, J. and McLoughlin, K. (Eds.) (2007) Fishery Status Reports 2006: Status of Fish Stocks
Managed by the Australian Government. Bureau of Rural Sciences, Canberra.
Menon, H.B. (1998) Role of Oceanic fronts in promoting productivity in the Southern Indian Ocean.
In: Sherman, K. Okemwa, E. and Ntiba, M. (eds), Large Marine Ecosystems of the Indian
Ocean: Assessment, Sustainability, and Management. Blackwell Science, Cambridge, MA. p
175-191
Pattiaratchi, C.B. (2006) Surface and sub-surface circulation and water masses off Western
Australia. Bulletin of the Australian Meteorological and Oceanographic Society 19(5):95-104.
Pauly, D. and Christensen, V. (1995) Primary production required to sustain global fisheries. Nature
374: 255-257.
Pauly, D. and Watson, R. (2005) Background and interpretation of the `Marine Trophic Index' as a
measure of biodiversity. Philosophical Transactions of the Royal Society: Biological Sciences
360: 415-423.
Pearce, A.F. and Pattiaratchi, C.B. (1999) The Capes Current: a summer counter-current flowing
past Cape Leeuwin and Cape Naturaliste, Western Australia. Continental Shelf Research. 19:
401-420.
Pogonoski, J.J., Pollard, D.A. and Paxton, J.R. (2002) Conservation Overview and Action Plan for
Australian Threatened and Potentially Threatened Marine and Estuarine Fishes. Environment
Australia. Available at www.ea.gov.au/coasts/species/marine-fish/pubs/marine-fish.pdf.
Rennie, S., Pattiaratchi, C.B. and McCauley, R. (2006). Physical processes within the Perth
Canyon and their influence on productivity. AGU 87(36), Ocean Sci. Meet. Suppl., Abstract
OS45A-08.
Ridgway, K., and Condie. S. (2004) The 5500-km-long boundary flow off western and southern
Australia. J. Geophys. Res. 109(C4), C04017.
Roberts, C.M., McClean, C.J., Veron, J.E.N., Hawkins, J.P., Allen, G.R., McAllister, D.E.,
Mittermeier, C.G., Schueler, F.W., Spalding, M., Wells, F., Vynne, C. and Werner, T.B. (2002)
Marine Biodiversity Hotspots and Conservation Priorities for Tropical Reefs. Science
295:12801284.
Sea Around Us (2007) A Global Database on Marine Fisheries and Ecosystems. Fisheries Centre,
University British Columbia, Vancouver, Canada. Available at
www.seaaroundus.org/lme/SummaryInfo. aspx?LME=44.
Smith, A.D.M., Fulton, E.J., Hobday, A.J., Smith, D.C. and Shoulder, P. (2007) Scientific tools to
support the practical implementation of ecosystem-based fisheries management. ICES Journal
of Marine Science 64(4): 633.
Taylor, J.G and Pearce, A.F. (1999) Ningaloo Reef Current observations and implications for
biological systems: Coral spawn dispersal, zooplankton and whale shark abundance. Journal of
the Royal Society of Western Australia 82: 57-65.
UNEP (2003) Barnett, B., Lawrence, D., DeVantier, L., Skelton, P. and Wilkinson, C. North
Australian Shelf, GIWA Regional Assessment 58. University of Kalmar, Kalmar, Sweden.
Waite, A.M., P.A. Thompson, S. Pesant, M. Feng, L.E. Beckley, C. Domingues, D. Gaughan, C.
Hanson, C. Holl, J.A. Koslow, M. Meuleners, J. Montoya, T. Moore, B.A. Muhling, H. Paterson,
S. Rennie, J. Strzelecki and L. Twomey (2007) The Leeuwin Current and its Eddies: An
Introductory Overview. Deep Sea Research II 54(8-10): 789-796.
Wells, F.E., Keesing, J.K. and Irvine, T.R. (2008) A Re-examination of Imposex in Conus at
Rottnest Island Seventeen Years after the First Report. Report to Swan Catchment Council 16
pp.
336
17 West Central Australian Shelf LME
Zann, L.P. (1995) Our Sea, Our Future Major findings of the State of the Marine Environment
Report for Australia. Great Barrier Reef Marine Park Authority, Department of the Environment,
Sport and Territories, Canberra. Available at www.environment.gov.au/coasts
publications/somer/