IX SOUTH PACIFIC
IX-18 East-Central Australian Shelf LME
IX-19 New Zealand Shelf LME
IX-20 Northeast Australian Shelf LME
IX-21 Southeast Australian Shelf LME
338
IX South Pacific
IX South Pacific
339
IX-18 East-Central Australian Shelf LME
M.C. Aquarone, S. Adams, I.M. Suthers and M.E. Baird
The East-Central Australian Shelf LME extends from the southern edge of the Great
Barrier Reef off Fraser Island, Queensland (24.5şS) to Cape Howe (37.5 şS), at the
southern end of the state of New South Wales. It covers a surface area of 650,000 km2,
of which 2.66% is protected, and contains 0.18% of the world's coral reefs and 0.20% of
the world's sea mounts, as well as 15 major estuaries (Sea Around Us 2007). A narrow
continental shelf (only 20-60 km wide) that is bordered by the Tasman abyssal plain and
a temperate climate characterise the LME. The South Equatorial Current from the Pacific
Ocean gyre flows westward towards the Australian coast, bifurcates with the southern
branch bending south (left) under the influence of wind stress and topography to become
the East Australian Current (EAC, Ridgeway and Dunn 2003). The EAC is Australia's
largest current and is typically 30 km wide, 200 m deep and traveling up to 4 knots (2 ms-
1), with a variable annual transport variously estimated as 20-30 Sv (Ridgeway & Dunn
2003 and references therein). For comparison, the EAC has ~5 fold greater volume
transport than the seasonally flowing Leeuwin Current on the west coast. The EAC
intensifies in the northern part of this LME, before separating from the coast 31-33 şS,
leaving behind a southward trending eddy field. The EAC's mesoscale variability is so
large that a single continuous current can often not be identified, and distinguishes it from
other western boundary currents. After separation the EAC retroflects northward and can
feed back into the EAC, as an anticyclonic eddy. Further separations and retroflections
are evident along the NSW coast around 34 and 37şS (Ridgeway & Dunn 2003). The
eddies are formed at 90 to 180 d intervals driven in part by intrinsic instabilities
(Marchesiello and Middleton 2000; Bowen et al. 2005). The anticyclonic eddies may
transport considerable amounts of heat into the Tasman Sea, or may turn northeast and
coalesce back into the main current. The strengthening of the EAC is predicted to warm
Australian waters by 1-2şC by 2030 and 2-3 şC by 2070s, particularly off Tasmania
(Poloczanska et al. 2007). This has already affected growth rates of commercial fish
(Thresher et al. 2007). Ridgeway (2007) and others have noted the remarkable impact of
the EAC's southward penetration off Tasmania. Using the Maria Island long term quasi-
monthly monitoring station (since 1944), they report the warming rate of 2.3 şC per
century and increasing salinity of 0.34 per century. A book chapter and report pertaining
to this LME are Morgan (1989) and UNEP (2003).
I. Productivity
The East-Central Australian Shelf LME is considered a Class III, low productivity
ecosystem 86 177 gCm-2yr-1) (Sea Around Us 2007; www.science.oregonstate.
edu/ocean.productivity/). At this latitude, water temperature, levels of wind mixing and
light intensity go through seasonal cycles. During the winter, strong winds and cool
surface water temperatures enhance vertical mixing processes, breaking down vertical
density gradients and allowing nutrient-rich waters to mix into the surface layer.
However, the overall productivity of this temperate Australian LME is restricted by the
poleward transport of low-nutrient tropical waters along the continent's eastern margin by
the EAC. There are no widespread seasonal blooms producing large surpluses of
organic matter. Localised coastal blooms occur as a result of wind-driven and current-
driven upwelling and occur throughout the year (Ajani, 2001; Baird et al., 2006).
Localised blooms can produce ecosystem responses such as red-tides (Dela-Cruz et al.,
2003), but are not sufficiently large to support a large demersal fishery such as those
which characterise northern hemisphere continental shelf systems.
340
18. East Central Australia LME
For a general understanding of oceanographic processes affecting the nutrient dynamics
and productivity of Australian marine ecosystems, see the Australian State of the
Environment Reports at www.deh.gov.au/soe where the reports are listed by date. For
more information on productivity, see Furnas (1995). For information on ocean surface
environmental data (currents, temperatures, winds), see the website
www.marine.csiro.au for the Commonwealth Scientific and Industrial Research
Organisation, CSIRO, and David Griffin's CSIRO site at www.marine.csiro.au/%7Egriffin/.
Regularly updated information on climate impact, fisheries and marine sciences,
including an online Atlas of Australian Marine Fishing and Coastal Communities is
available from the Australian Department of Agriculture, Fisheries and Forestry, Bureau
of Rural Sciences at http://adl.brs.gov.au together with lists of publications on species,
bycatch, the role of marine reserves and other important topics broken out by regions.
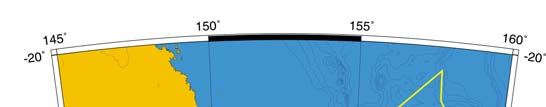
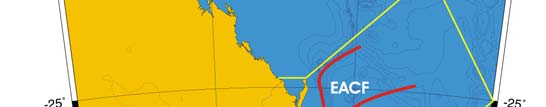
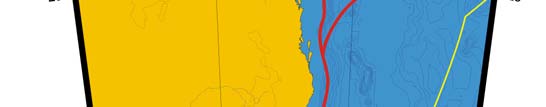
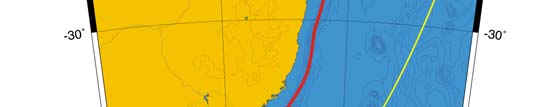
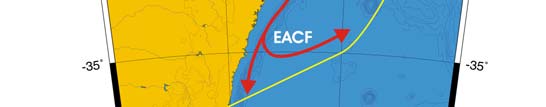
Oceanic fronts: The westward South Equatorial Current impinges on the east coast of
Australia and bifurcates, with the two branches flowing north or south, along the coast
(Belkin & Cornillon 2003, Belkin et al. 2008) (Figure IX-18.1). The southward branch is
the East Australian Current (EAC), a strong poleward flowing western boundary current
that carries tropical waters into the LME. A distinct front exists between tropical Coral Sea
waters and the Tasman Sea waters at between 31-37şS, the Tasman Front. The EAC is
a highly energetic current that shifts between a dominating poleward extension that flows
past Tasmania, and a Tasman Front extension, which flows eastward towards Lord Howe
Island, eventually forming the East Auckland Current. With currents more than 1 ms-1,
water flowing in from the north, surface waters can move though the LME in as little as a
month. The poleward extension of the EAC has strengthened due to recent climatic
changes, resulting in a significant warming of waters of southern NSW and Tasmania
(Cai, 2006).
Figure IX-18.1. Fronts of the East-Central Australian Shelf LME. EAC, East Australian Curent; TF,
Tasman Front. Yellow line, LME boundary (after Belkin et al. 2008).
IX South Pacific
341
East-Central Australian Shelf SST
Linear SST trend since 1957: 0.56°C.
Linear SST trend since 1982: 0.35°C.
The steady warming of the East-Central Australian Shelf was punctuated by two warm
events, in 1973 and 1998. The 1973 peak was a large-scale event that occurred
simultaneously in the Indonesian Sea LME, North Australian Shelf LME, and Northwest
Australian Shelf LME. The above-noted synchronism can only be explained by large-
scale atmospheric forcing (teleconnections). Indeed, oceanic advection by currents must
be ruled out because the entire Northeast and East Australian coastal and offshore
region (basically, most of the Coral Sea and northern part of the Tasman Sea) is
dominated by the South Equatorial Current and its extension, East Australian Current,
whereas the Indian Ocean inflow via Torres Strait is negligible.
The 1998 all-time maximum was a manifestation of the 1997-98 El Nińo. The summer of
1997-1998 was the hottest recorded on the Great Barrier Reef, causing bleaching of two
thirds of inshore reefs (Berkelmans and Oliver 1999).. Otherwise, the interannual
variability of this ecosystem was rather small, with year-to-year variations less than 0.5°C
(CSIRO 2007). Causes of the annual variation in the EAC eddies are still a puzzle,
driven by intrinsic instabilities (Bowen et al. 2005).
Figure IX-18.2. East Central Australian Shelf LME Mean Annual SST, 1957-2006 (top) and SST
anomalies, 1957-2006 (bottom) based on Hadley climatology, after Belkin et al. 2008.
342
18. East Central Australia LME
East Central Australian Shelf LME, Chlorophyll and Primary Productivity: The East-
Central Australian Shelf LME is considered a Class III, low productivity ecosystem at 86
177 gCm-2yr-1 (Sea Around Us 2007; www.science.oregonstate. edu/ocean.productivity/).
Figure IX-18.3. East Central Australian Shelf trends in chlorophyll a and primary productivity, 1998-
2006. Values are colour coded to the right hand ordinate. Figure courtesy of J. O'Reilly and K. Hyde.
Sources discussed p. 15 this volume.
II. Fish and Fisheries
Australian waters are relatively nutrient-poor and unable to sustain large fish populations.
Approximately 1 in 4 of the 4,482 species found in Australian waters are endemic (Hoese
et al. 2006). Off the coast of New South Wales, 1,748 fish species are recorded of which
22% are Australian endemics. For information on South-East Fisheries, see the AFMA
websites or DEWR reports. Federal, commercial fishing is not large in the Australian
East Marine Planning region (approximates the East Central Australian LME) valued in
2002-2006 at around $320 m and 1% of the national value of commercial fisheries.
These AFMA managed fisheries http://www.afma.gov.au/fisheries/default.htm include the
East Coast Deepwater trawl fisheries, (10 concessions, using demersal and midwater
trawling); the Commonwealth Trawl Sector (formerly South East Trawl Fishery), with
nearly 60 concessions, 54 vessels using otter trawl and danish seine methods, some
midwater trawling; the Eastern Tuna and Billfish Fishery (ETBF) with over 100 permits,
72 vessels using pelagic longline, minor line (handline, troll, rod and reel). The vast bulk
of the landings are restricted to the very narrow continental shelf (Moore et al. 2007).
Three of the more significant commercial fisheries are the various estuarine and ocean
prawn trawl fisheries to 3 nautical miles, and the federally managed South East Trawl
and the East Coast tuna fishery. FAO provides information on Australia's fisheries and
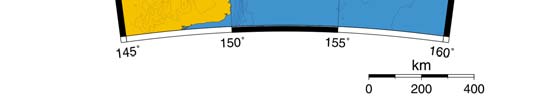
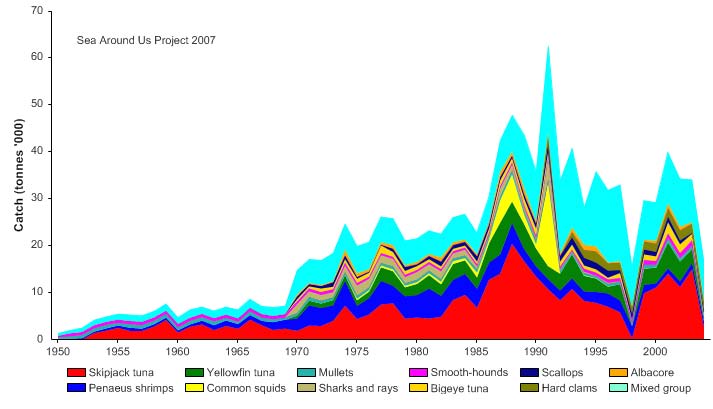
the characteristics of the industry (www.fao.org). Reported landings in the LME include
mullet, shrimps and prawns, butterfishes and tunas (skipjack, yellowfin and bluefin) and
have fluctuated over the last 50 years with peaks in the mid 1970s, late 1980s and early
2000s with over 30,000 tonnes recorded in mid 1970s, late 1980s and again in 2002-
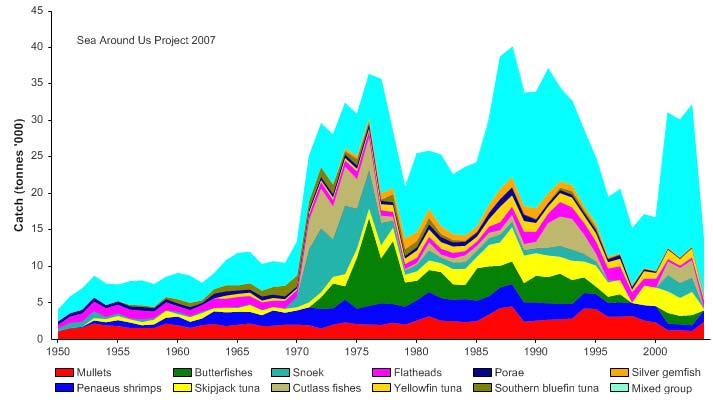
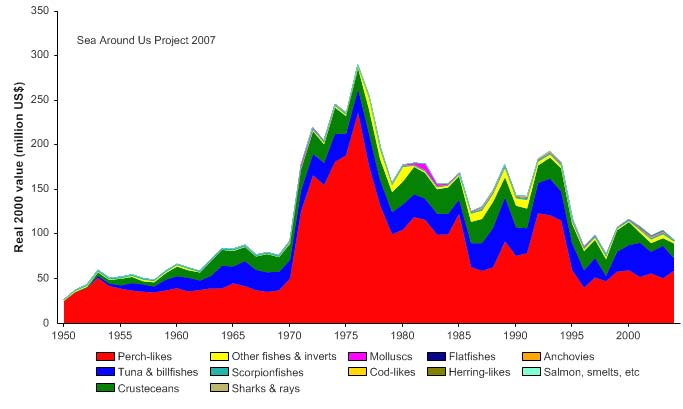
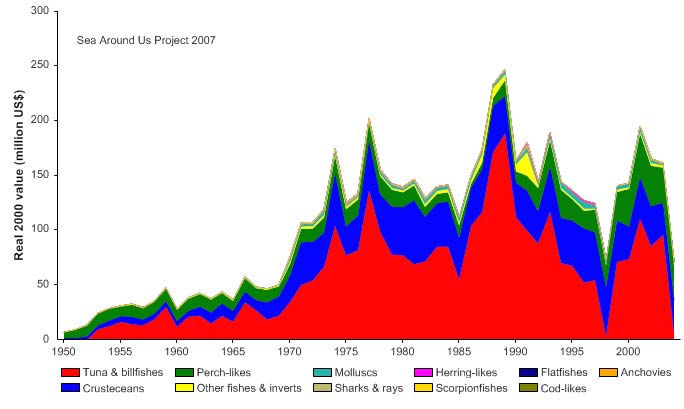
2005 (Figure IX-18.4). The value of the reported landings reached nearly 300 million
US$ (in 2000 real US$) in the mid 1970s and 100 million US$ in recent years (Figure IX-
18.5). For 2000/01, FAO reports landed catch in Queensland fisheries alone at 31,250
tonnes (excluding aquaculture), valued at 741 millions $AUD. The ADL Bureau of Rural
Science estimates that the Eastern Central Region's commercial fisheries caught 31,500
tonnes with Gross Value of Products (GVP) at 315 million $AUD in 2002.
IX South Pacific
343
Figure IX-18.4. Total reported landings in the East-Central Australian Shelf LME by species (Sea
Around Us 2007). Note that Porae =Blue Morwong.
Figure IX-18.5. Value of reported landings in the East-Central Australian Shelf LME by commercial
groups (Sea Around Us 2007).
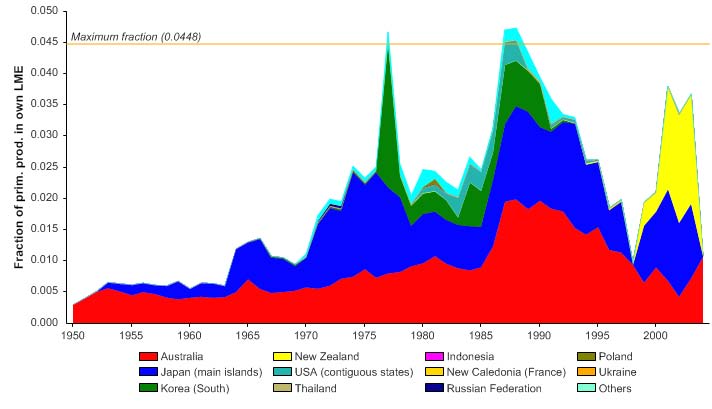
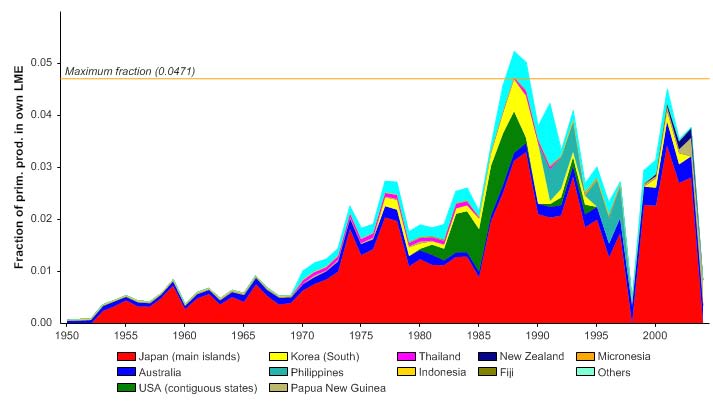
The primary production required (PPR; Pauly & Christensen 1995) to sustain the reported
landings in this LME is currently below 4% with Australia and New Zealand, as well as
few distant water fishing countries, namely Japan and South Korea, historically
accounting for the large share of the ecological footprint (Figure IX-18.6).
344
18. East Central Australia LME
Figure IX-18.6. Primary production required to support reported landings (i.e., ecological footprint) as
fraction of the observed primary production in the East-Central Australian Shelf LME (Sea Around Us
2007). The `Maximum fraction' denotes the mean of the 5 highest values.
Both the mean trophic level (i.e., the MTI; Pauly & Watson 2005) and the FiB index vary
widely and no clear interpretation on the state of the LME or its fisheries can be made
based on these indices (Figure 18.7). It is likely that such variation in the two indices is
due to the low level of exploitation in the region.
Figure IX-18.7. Mean trophic level (i.e., Marine Trophic Index) (top) and Fishing-in-Balance Index
(bottom) in the East-Central Australian Shelf LME (Sea Around Us 2007)
The fluctuations in the reported landings are also making interpretation of the Stock-
Catch Status Plots difficult (Figure IX-18.8). Whilst these plots imply approximately 20%
and 40% of stocks being collapsed and overexploited, respectively (Figure IX-18.8 top),
the causes are complex including changes to gear and management, price and
IX South Pacific
345
especially multispecies effects (over 200 species are processed by the Sydney Fish
Markets, Moore et al. 2007).
1950
1960
1970
1980
1990
2000
0%
100
10%
90
20%
)
80
%
(
s
30%
u
70
at
st
40%
y
60
b
ks
50%
c
50
o
f
st
60%
o
40
er
b
70%
m
30
u
N
80%
20
90%
10
100%0
1950
1960
1970
1980
1990
2000
(n = 2640)
developing
fully exploited
over-exploited
collapsed
1950
1960
1970
1980
1990
2000
0%
100
10%
90
20%
80
)
%
30%
(
70
s
u
at
40%
60
ck st
50%
o
50
st
y
60%
b
h
40
c
70%
Cat
30
80%
20
90%
10
100%0
1950
1960
1970
1980
1990
2000
(n = 2640)
developing
fully exploited
over-exploited
collapsed
Figure IX-18.8. Stock-Catch Status Plots for the East-Central Australian Shelf LME, showing the
proportion of developing (green), fully exploited (yellow), overexploited (orange) and collapsed (purple)
fisheries by number of stocks (top) and by catch biomass (bottom) from 1950 to 2004. Note that (n), the
number of `stocks', i.e., individual landings time series, only include taxonomic entities at species,
genus or family level, i.e., higher and pooled groups have been excluded (see Pauly et al, this vol. for
definitions). See also Moore et al. (2007) for a fisheries status overview.
III. Pollution and Ecosystem Health
The major problems for this coastline are real estate value, urbanization, water quality,
freshwater, and beach erosion. The coastline of NSW alone has over 450 coastal
discharge sites along the NSW coast, the largest three being off Sydney amounting to
nearly 1000 ML.d-1 or primary treated sewage Desalination plants are planned or being
constructed for the Gold Coast, Sydney (Kurnell) and Melbourne (at Wonthaggi on the
South Gippsland coast). There are no mining activities in the LME but there is potential
for sand mining, manganese nodule harvesting, or base/precious metals on the Lord
Howe Rise. Sand mining has the greatest potential for NSW in light of beach erosion and
construction needs. There is a pilot wave-energy generator at the breakwater of Port
Kembla www.oceanlinx.com/ .
For 2005-2006, ports of the East Marine Planning region (mostly Newcastle, Sydney,
Brisbane and Port Kembla) accounted for 42% of the nation's exports and 51% of
national imports by tonnage (Anon. 2007). These ports accounted for 18% of freight
loaded and 67% unloaded by all Australian ports. The busiest sea lanes are through the
Coral Sea. The LME may be threatened by an increase in shipping. Ship ballast water
has been shown to contain organisms including bacteria, viruses, algal cells, plankton
346
18. East Central Australia LME
and the larval forms of many invertebrates and fish. Two of Australia's largest three cities
and four of the largest 10 ports are located in this LME, and it is the most urbanized
coastline in Australia. Pressure is increasing on natural environments, productive
agricultural land, water resources, sewage treatment and waste disposal systems. There
are environmental impacts caused by tourism and related infrastructure (airports, power
generation facilities, accommodation, sewage treatment and disposal facilities, moorings
and marine transport). For more information on coastal and marine pollution issues in
this LME, see the Australia State of the Environment Reports indexed by date at
www.deh.gov.au/soe/index.html.
.
IV. Socioeconomic Conditions
Australia's Bureau of Rural Sciences estimates that, on average, 5% of the population of
the Eastern Central and Norfolk Regions is employed in the fishing industry
(http://adl.brs.gov.au/). FAO provides information on the characteristics and
socioeconomic benefits of Australia's fishing industry (www.fao.org/). The Eastern
Central region contains 165 towns, and large cities and ports, including Sydney (Port
Jackson and Botany Bay), Brisbane, Newcastle, and Port Kembla. Shipping and marine
tourism are major economic activities and the cities absorb much of the country's
population growth. The Australian Bureau of Statistics http://www.abs.gov.au/ estimates
the current coastal population in this LME at 8 million, mostly living in Sydney and
Brisbane, with a quarter in the large coastal non-metropolitan centres like Newcastle,
Wollongong, Gold and Sunshine Coasts, Coffs and Bundaberg (http://adl.brs.gov.au/).
The largest marine industry is marine tourism, contributing 22% of the national marine
industry ($27 billion in value added during 2002-03, The Allen Report 2004). The value
of the marine industry (i.e. all recreational and light commercial vessels) in NSW is
valued at over $2 billion pa and employs over 11,000 both figures are almost equivalent
to all other states combined (mostly Victoria and Queensland,
http://www.bia.org.au/data.html ). Over a third of the national marine industry employment
(36%) is in NSW and mostly in marine tourism. These figures are more remarkable
considering that our estuaries, while numerous (>130) are small and we have the nation's
narrowest continental shelf. The Australian Bureau of Statistics estimates at
www.abs.gov.au/ausstats/ that, in the entire country, over 5 million Australians take part
in recreational fishing in Australia as a leisure activity (i.e. 20% fish at least once a year),
with some 120,000 people identified as members of fishing clubs in 1996-97, and that
recreational fishing supports about 90,000 Australian jobs especially in industries
supplying tackle and bait and recreational boating. The Bureau of Statistics estimates
that international tourists spend over $200m on fishing in Australia each year. A survey
undertaken by the ABS in the early 1990s showed that recreational fishing accounted for
23,000 tonnes of fish, 2,800 tonnes of crabs and approximately 1,400 tonnes of
freshwater crayfish. In NSW the recreational catch is about 30% of the commercial
catch, but for 6 major species the recreational catch is actually greater than the
commercial. In NSW the recreational fishing fee bought out commercial fishing licenses
in 25 estuaries in 2001, now described as recreational fishing havens. Most of Australia's
recreational fishing is undertaken along the coast and estuaries of New South Wales,
Queensland and Victoria, reflecting both the excellent fishing areas and the geographic
spread of Australia's population.
V. Governance
The East-Central Australian Shelf LME is bordered only by Australia and falls within the
non-UNEP administered Pacific Regional Seas Programme. In 2003, Australia's Natural
Resource Council endorsed a framework for a national cooperative approach to
Integrated Coastal Zone Management. State jurisdiction is generally limited to the 3
IX South Pacific
347
nautical mile limit, but many state managed fisheries extend into federal waters to 200
nautical miles. Governance issues in this LME pertain to fisheries management and to
the establishment of marine reserves. Lord Howe Island (33.5S, 159E) and the Solitary
Islands (30.2S off northern NSW) were declared state marine parks in 1998/1999. Four
other NSW marine parks have been declared over the past 6 years, which extend out to
the 3 nm mile limit of state waters: Cape Byron (22,000 ha), Batemans Bay (85,000 ha),
Jervis Bay (21,000 ha) and the largest, Port Stephens-Great Lakes (98,000 ha). The
Batemans Bay and Port Stephens parks have been the most controversial with the
recreational fishing community, and have challenged in state parliament the science on
which they are based. The NSW Marine Parks Authority (MPA) through NSW
Department of Environment and Climate Change aims to establish and manage a system
of multiple-use marine parks designed to conserve marine biodiversity, maintain
ecological processes and, provide for ecologically-sustainable use, public appreciation,
education, understanding and enjoyment of the marine environment. Key issues
remaining are larval connectivity amongst areas, and the degree of "spill-over".. See the
North Australian Shelf LME (Chapter VIII, this volume) for more information. NSW
Department of Primary Industries is the principal agency responsible for conserving the
aquatic environment and managing the fisheries resources of this LME. It is responsible
for protecting and restoring fish habitats, promoting responsible and viable commercial
fishing and supporting aquaculture industries.
The South Pacific Regional Environment Programme (SPREP), a regional
intergovernmental organisation now based in Apia, Samoa, was initially established in
1982 as a programme of the South Pacific Commission. SPREP is the primary regional
organisation concerned with environmental management in the Pacific, and serves as the
Secretariat for three Conventions. The 1986 Convention for the Protection of the Natural
Resources and Environment of the South Pacific region entered into force in 1990. The
1976 Convention on the Conservation of Nature in the South Pacific (Apia Convention),
came into force in 1990. The Pacific Islands Forum is the key regional political
organization in the Pacific representing the 14 Island countries as well as Australia and
New Zealand. Australia ratified the United Nations Law of the Sea Convention (UNCLOS)
in 1996. The 1995 Convention to Ban the Importation into Forum Island Countries of
Hazardous and Radioactive Wastes and to Control the Transboundary Movement and
Management of Hazardous Wastes within the South Pacific Region (Waigani
Convention) entered into force in 2001. Australia's indigenous peoples are re-emerging
in the environmental management process as a result of native title rights. The Pacific
Islands Forum is the key regional political organization in the Pacific, representing the 14
island countries as well as Australia and New Zealand. The Action Plan has identified
four broad priorities for the region: natural resources management, pollution prevention,
climate change and variability, and sustainable economic development. The Australian
Government's Department of the Environment and Heritage regularly updates a coasts
and oceans website at: www.deh.gov.au/coasts/.
References
Ajani, P., Hallegraeff, G.M., Pritchard, T., 2001. Historic overview of algal blooms in marine and
estuarine waters of New South Wales, Australia. Proc. Linn. Soc. N. S. W. 123, 1 22.
Australia State of the Environment (2006) at www.deh.gov.au
Australian Bureau of Agriculture and Resource Economics (ABARE) www.abare.gov.au/
Australian Bureau of Statistics (ABS) www.abs.gov.au/
Australian Bureau of Statistics at www.abs.gov.au/ausstats/abs
Australian Government, Department of Agriculture, Fisheries and Forestry, Bureau of Rural
Sciences at www.daff.gov.au/fisheries_marine
348
18. East Central Australia LME
Australian Marine Fishing and Coastal Communities,"Pilot" Atlas, Eastern Central and Norfolk
regions at http://adl.brs.gov.au/mapserv/fishcoast/eastern_central_norfolk_region
Anonymous 2007. East Marine Planning Region. Non-fisheries resource use activities in the east
marine planning region. Sinclair Knight Mertz report to DEWR. www.environment.gov.au
/coasts /mbp/publications/general/marine-economic.html
ABARE 2007, Australian Fisheries Statistics 2006, Canberra June. ISSN 1037-6879
Baird, M. E., Timko, P. G., Suthers, I. M., and Middleton, J. H. (2006). Coupled physicalbiological
modelling study of the East Australian Current with idealised wind forcing. Part I: Biological
model intercomparison. Journal of Marine Systems 59, 249270
Belkin, I. M. and Cornillon, P. C. (2003). SST fronts of the Pacific coastal and marginal seas.
Pacific Oceanography 1(2):90-113.
Belkin, I.m., Cornillon, P.C., and Sherman, K. (2008). Fronts in large marine ecosystems of the
world's oceans: An atlas. Progress in Oceanography, submitted.
Berkelmans R and Oliver JK. 1999. Large-scale bleaching of corals on the Great Barrier Reef.
Coral Reefs 18(1):55 - 60
Bureau of Rural Sciences (BRS) www.brs.gov.au/, fisheries and the marine environment, and
Marine Matters reports.
Cai, W. 2006. Antarctic ozone depletion causes an intensification of the Southern Ocean super-
gyre circulation, Geophys. Res. Lett. 33: L03712.
CSIRO. (2007) Commonwealth Scientific and Industry Research Organization at www.csiro.gov.au/
59th Annual Report.
Dela-Cruz, J., Middleton, J.H., Suthers, I.M., 2003. Population growth and transport of the red tide
dinoflagellate, Noctiluca scintillans, in the coastal waters off Sydney Australia, using cell
diameter as a tracer. Limnol. Oceanogr. 48, 656 674
Fisheries Research Development Corporation (FRDC) www.frdc.com.au/
Furnas, M. J. 1995. Land-sea interactions and oceanographic processes affecting the nutrient
dynamics and productivity of Australian marine ecosystems, p. 61-74. In L. P. Zann
(ed.),SOMER Technical Annex 1. Great Barrier Reef Marine Park Authority, Townsville,
Australia.
Henry GW, Lyle JM (2003) 'The national recreational and indigenous fishing survey.' Australian
Government Department of Agriculture, Fisheries and Forestry, Canberra.
Hoese, D.F., Bray, D.J., Paxton, J.R. & G.R. Allen. 2006. Fishes. In Beesley, P.L. & A. Wells.
(eds) Zoological Catalogue of Australia. Volume 35. ABRS & CSIRO Publishing: Australia. parts
1-3, Pp. 1-2178.
Moore et al. 2006. Regional Profile East Marine Region. Description of commercial, recreational
and charter fishing activities. Report for Bureau of Rural Science.
www.environment.gov.au/coasts/mbp/publications/general/marine-economic.html
Morgan, J. (1989). Large Marine Ecosystems in the Pacific Ocean, p 377-394 in: Sherman, K. and
Alexander, L.M. (eds), Biomass Yields and Geography of Large Marine Ecosystems. AAAS
Selected Symposium 111. Westview Press, Boulder, U.S.
Pauly, D. and Christensen, V. (1995). Primary production required to sustain global fisheries.
Nature 374: 255-257.
Pauly, D. and Watson, R. (2005). Background and interpretation of the `Marine Trophic Index' as a
measure of biodiversity. Philosophical Transactions of the Royal Society: Biological Sciences
360: 415-423.
Pogonoski, J.J., Pollard, D.A. and Paxton, J.R. (2002). Conservation overview and action plan for
Australian threatened and potentially threatened marine and estuarine fishes. Environment
Australia, February 2002. www.deh.gov.au/coasts/publications/marine-fish-action /index.html
Ridgway, K. R., and J. R. Dunn. 2003. `Mesoscale structure of the mean East Australian Current
System and its relationship with topography'. Progress in Oceanography 56:189-222.
Sainsbury, K.J. (1988). The ecological basis of multispecies fisheries, and management of a
demersal fishery in tropical Australia, p 349-382 in: Gulland, J.A. (ed), Fishery Population
Dynamics: The Implications for Management. John Wiley and Sons, New York, U.S.
Sea Around Us (2007). A Global Database on Marine Fisheries and Ecosystems. Fisheries Centre,
University British Columbia, Vancouver, Canada. www.seaaroundus.org/lme/
SummaryInfo.aspx?LME=41
The Allen Report. 2004. The economic contribution of Australia's marine industries.
1995-96 to 2002-03. Report to the National Oceans Office.
UNEP (2003). Wilkinson, C., Reichelt, R., DeVantier, L. and Lawrence, D. Great Australian Bight
and Murray Darling Basin. GIWA Regional Assessment 61. University of Kalmar, Kalmar,
Sweden.
IX South Pacific
349
IX-19 New Zealand Shelf LME
M.C. Aquarone and S. Adams
The New Zealand Shelf LME stretches across from the subtropics to the sub-Antarctic. It
covers a surface area of nearly one million km2, of which 0.03% is protected, and
contains 0.08% of the world's sea mounts (Sea Around Us 2007). The shelf surrounding
New Zealand's North Island and South Island vary in width from a few tens to several
hundred kilometres. This LME is characterised by its temperate climate, influenced by
the warm Tasman and North Cape currents in the north and by the cooler Southland
Current in the South. The marine environment is diverse and includes estuaries,
mudflats, mangroves, seagrass and kelp beds, reefs, sea mount communities and deep
sea trenches. Morgan (1989) and UNEP (2003) pertain to this LME.
I. Productivity
The New Zealand Shelf LME is a Class III, low productivity (<150gCm-2yr-1) ecosystem.
See also Bradford-Grieve et al. (2003, 2006). While the southern Plateau region
subantarctic water, limited by iron availability, is low a productionsystem, the productivity
of the Chatham Rise, eastern Cook Strait, and the NE shelf are considerably more
productive. For a study of ocean fronts and their contribution to marine productivity in this
LME, see the National Institute of Water and Atmospheric Research website,
www.niwa.co.nz. View a SeaWiFS image of ocean chlorophyll in New Zealand coastal
waters at www.niwa.cri.nz. In the southern part of this LME, there is higher productivity in
the fiord ecosystems. The current definitive data on marine species in the New Zealand
flora and fauna from the National Institute of Water and Atmospheric Research of New
Zealand (NIWA) are a maximum of 16,214 species in total, including known, undescribed
species.
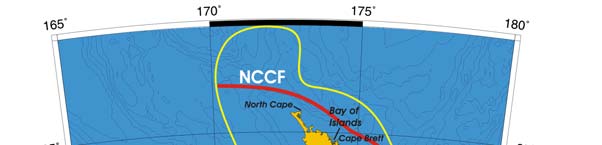
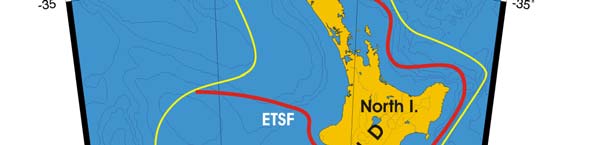
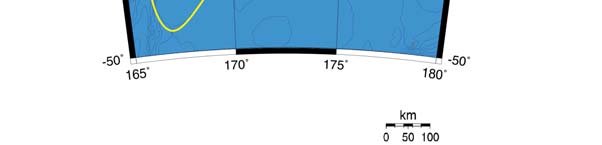
Oceanic fronts: This LME features several well-defined fronts (Figure IX-19.1) that
together determine the ecological regime of the New Zealand shelf (Belkin and Gordon
1996; Belkin and Cornillon 2003; Belkin et al. 2008). In the north, the Tasman Front and
its extension associated with the North Cape Current bring warm and salty tropical waters
to the east coast of North Island. This influx, together with vigorous tidal mixing thanks to
rough bathymetry, is largely responsible for the exceptionally high productivity off the Bay
of Islands, where big game fish like marlins and kingfish come unusually close to the
mainland coast, forming fishing grounds just a few miles offshore, for example, off Cape
Brett. West of North Island, the southern branch of the Tasman Front heads toward
Cook Strait. In the south, the Southland Current Front runs northward along the east
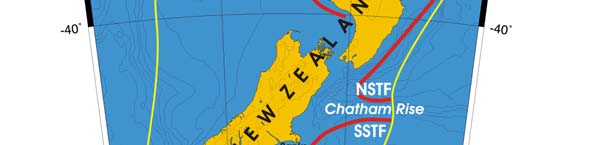
coast of South Island toward Banks Peninsula. East of New Zealand, the double
Subtropical Frontal Zone that consists of the North and South STF extends eastward
along the north and south flanks of the Chatham Rise up to Chatham Island and beyond.
This double Subtropical Frontal Zone is similar to the double frontal zones found in other
subtropical oceans (Belkin, 1988, 1993, 1995, 2005; Belkin and Gordon, 1996). See also
Bradford-Grieve et al. (2006).
New Zealand Shelf SST (Belkin 2008)
Linear SST trend since 1957: 0.11°C.
Linear SST trend since 1982: 0.32°C.
The New Zealand Shelf features strong interannual variability, with a magnitude
exceeding 1°C, superimposed over a slow-warming trend (Figure IX-19.2). Any
correlation between this LME and the upstream LMEs off Australia can only be rather

350
19 New Zealand Shelf LME
tenuous since different parts of the New Zealand Shelf are advectively affected by
different Australian LMEs. For example, the North Island is oceanographically linked to
the Northeast Australian Shelf LME, whereas the South Island is linked to the Southeast
Australian Shelf LME. The all-time maximum of 1971 in New Zealand occurred two years
prior to the near-all-time maximum of 1973 in the East Central Australian Shelf LME,
therefore these events could not have been advectively connected.
Figure IX-19.1. Fronts of the New Zealand Shelf LME. ETSF, East Tasman Front; NCCF, North Cape
Current Front; NSTF, North Subtropical Front; SCF, Southland Current Front; SSTF, South Subtropical
Front. Yellow line, LME boundary. After Belkin et al. (2008), Belkin and Cornillon (2003), and Belkin and
Gordon (1996).
Another warm peak, of 1974, occurred off New Zealand a year after the 1973 warm peak
in the East-Central Australia LME; these events may have been advectively connected.
The warm events of 1971-1974 were confined to these two LMEs connected by the East
Australian Current and its eastward extensions, namely Tasman Front (TF), North Cape
Current Front (NCCF), and East Tasman Sea Front (ETSF) (Figure IX-19.1).
IX South Pacific
351
Figure IX-19.2. New Zealand Shelf LME annual mean SST (left) and SST anomalies (right), 1957-2006,
based on Hadley climatology. After Belkin (2008).
New Zealand Shelf LME Chlorophyll and Primary Productivity
Figure IX 19.3. New Zealand Shelf LME annual trends in chlorophyll a (left) and primary productivity
(right), 1998-2006. Values are colour coded to the right hand ordinate. Figure courtesy of J. O'Reilly and
K. Hyde. Sources discussed p. 15 this volume.
I. Fish and Fisheries
The New Zealand Ministry of Fisheries estimates about 750,000 tonnes of seafood is
harvested annually from New Zealand's fisheries--70% from deepwater and midwater
fisheries, 11% pelagic, 10% farmed species, and 9% from their inshore fisheries. Note
that the Chatham Rise and the Southern Plateau, 2 major fishing regions, are not entirely
included in the LME. The Ministry also estimates that 20% of the population engages in
marine recreational fishing annually and that the expenditure made by recreational
fishers to catch five key recreational species is nearly NZ$1 billion per year
(www.govt.nz/en-nz). Among the important fisheries in this LME are those for migratory
apex predators such as tuna, billfish, and shark, squid, hoki, orange roughy, rock lobster,
mussels (cultured) and snapper are key export species. According to the Ministry, the
value of fish exports in 2004 grew more than the volume and generated NZ$1.2 billion,
NZ$1.0 billion from capture fisheries and NZ$200 million from aquaculture.
352
19 New Zealand Shelf LME
Fisheries policies in New Zealand hope to secure a long-term future for the industry by
setting sustainable catch limits and providing harvesting rights to benefit all New
Zealanders, including the indigenous Maori. Fiords in the southern part of this LME
support commercial and recreational fisheries as well as traditional Maori fisheries.
Information on the fisheries in this LME is available on the FAO website (www.fao.org/).
For information on areas closed to fishing, see the New Zealand Department of
Conservation (www.doc.govt.nz/).
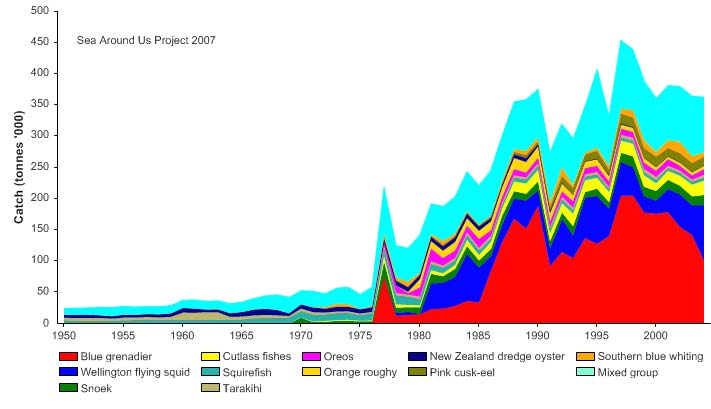
Total reported landings show a sharp spike in 1977 of 220,000 tonnes, likely associated
with the declaration of the 200 nautical mile Exclusive Economic Zone around this LME
by New Zealand, followed by a continuous increase through the 1980s and 1990s and a
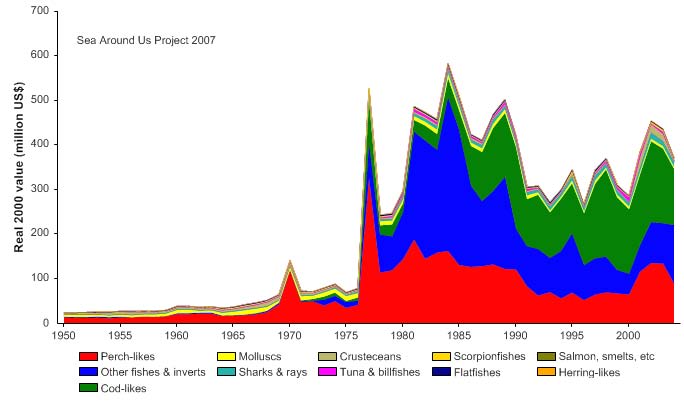
decline in the 2000s (Figure IX-19.4). The value of the reported landings reached
US$583 million (in 2000 US dollars) in 1984, followed by a decline to between US$260
million and US$450 million in recent years (Figure IX-19.5).
Figure IX-19.4. Total reported landings in the New Zealand Shelf LME by species (Sea Around Us 2007).
Figure IX-19.5. Value of reported landings in the New Zealand Shelf LME by commercial groups (Sea
Around Us 2007).
IX South Pacific
353
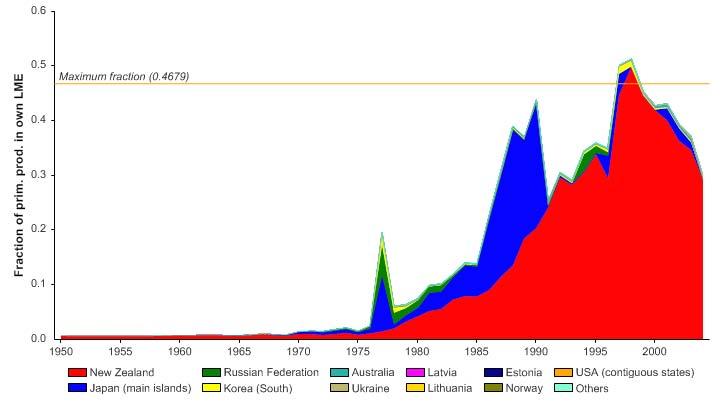
The primary production required (PPR; Pauly & Christensen 1995) to sustain the reported
landings is currently below 4% with New Zealand accounting for the great majority of the
ecological footprint in the LME (Figure IX-19.6).
Figure IX-19.6. Primary production required to support reported landings (i.e., ecological footprint) as
fraction of the observed primary production in the New Zealand Shelf LME (Sea Around Us 2007). The
`Maximum fraction' denotes the mean of the 5 highest values.
The mean trophic level of the reported landings (i.e., the MTI; Pauly & Watson 2005) has
been on a rise since the mid-1970 (Figure IX-19.7, top) as has the FiB index (Figure IX-
19.7, bottom). Together with the data presented in Figure IX-19.6, such trends suggest
the development of previously under-utilized, high trophic fisheries resources by local as
well as foreign fleets.
Figure IX-19.7. Mean trophic level (i.e., Marine Trophic Index) (top) and Fishing-in-Balance Index
(bottom) in the New Zealand Shelf LME (Sea Around Us 2007).
354
19 New Zealand Shelf LME
1950
1960
1970
1980
1990
2000
0%
100
10%
90
20%
)
80
%
(
s
30%
u
70
at
st
40%
y
60
b
ks
50%
c
o
50
f
st
60%
40
r
o
e
b
70%
m
30
u
N
80%
20
90%
10
100%0
1950
1960
1970
1980
1990
2000
(n = 2695)
developing
fully exploited
over-exploited
collapsed
1950
1960
1970
1980
1990
2000
0%
100
10%
90
20%
80
)
%
30%
(
70
t
us
40%
t
a
60
s
k
50%
t
oc
50
s
y
60%
h b
40
t
c
a
70%
C
30
80%
20
90%
10
100%0
1950
1960
1970
1980
1990
2000
(n = 2695)
developing
fully exploited
over-exploited
collapsed
Figure IX-19.8. Stock-Catch Status Plots for the New Zealand Shelf LME, showing the proportion of
developing (green), fully exploited (yellow), overexploited (orange) and collapsed (purple) fisheries by
number of stocks (top) and by catch biomass (bottom) from 1950 to 2004. Note that (n), the number of
`stocks', i.e., individual landings time series, only include taxonomic entities at species, genus or family
level, i.e., higher and pooled groups have been excluded (see Pauly et al, this vol. for definitions).
The Stock-Catch Status Plots for the LME illustrate that more than half of the stocks in
the region are currently either overexploited or have collapsed (Figure IX-19.8, top).
However, the majority of the reported landings are supplied by stocks classified as `fully
exploited' (Figure IX-19.8, bottom).
III. Pollution and Ecosystem Health
Fisheries impacts on the environment are not completely understood and the data is
incomplete. Gill nets pose a risk to marine birds, particularly if set near feeding or
breeding areas. Yellow-eyed penguins appear most at risk from nets set by commercial
fishermen for bottom dwelling species such as rig and dogfish. The nets are set well
within the feeding range of these penguins. Fiord ecosystems in the southern part of this
LME are in need of protection. In that region, the crested penguin, Eudyptes
pachyrhynchus, is at risk. Native flora and fauna are affected by invasions of the Asian
kelp, Undaria, and toxic micro-algae. Additional information on marine invasions, ballast
water, marine toxins, harmful algal blooms and diarrheic shellfish poisoning, is given
www.cawthron.org.nz. Studies are underway to assess trawling damage to benthic
species and to deepwater seamount habitat.
It has been suggested that changes in sea surface conditions have contributed to the
spread of toxic algae and invasive seaweeds in New Zealand waters. Toxic algal blooms
occurring in the 1990s have killed marine life and caused illness in humans. Other issues
IX South Pacific
355
affecting the marine environment are waste and hazardous substances. New Zealand
produces a higher rate of municipal waste (two thirds of a tonne per person each year)
than most other developed countries. Industrial waste is estimated at 300,000 tonnes a
year. Another ecosystem health issue is climate change. Gases released into the
atmosphere are enhancing the natural greenhouse effect at a rate that could extensively
damage the LME's biophysical systems. Atmospheric levels of carbon dioxide and
methane - two of New Zealand's major greenhouse gases are rising. Studies are
underway to assess the impact of terrestrial runoff on coastal ecologies and marine
communities.
IV. Socioeconomic Conditions
The population of New Zealand is exceeds 4 million and impacts the marine environment
through commerce, recreation (including whale watching), indigenous fishing (Maori and
Pacific Islanders), commercial fisheries, marine aquaculture, trade, defence and security.
The ocean floor is explored and mined for minerals, natural gas and oil. Ports and
harbours in this LME are Auckland, Christchurch, Dunedin, Tauranga and Wellington.
Statistics New Zealand has developed socioeconomic indicators for the environment that
complement the Ministry for the Environment's Environmental Performance Indicators
programme (www.stats.govt.nz/). The Ministry of Fisheries estimates direct full-time
employment in commercial fisheries and aquaculture at 10,500, and direct and indirect
full-time employment in those jobs at 26,000 (www.fish.govt.nz/). Commercially
important species are managed under the quota management system (the QMS). The
Ministry lists 2,200 persons as holding a quota and a total quota value of $3.5 billion.
The Mori now own 40% of quota and have additional involvement in 20% of quota
(www.fish.govt.nz/). Recommended TACs for various species for 2006/2007are listed at
www.fish.govt.nz/ and in 2006 it was thought that some TAC levels were still too high to
be sustainable. Of the 93 stocks on which New Zealand has information for current stock
size, 76 (82%) are at or near target levels.
V. Governance
This LME is governed by New Zealand, and is included within the UNEP Pacific Regional
Seas Programme. Managing the marine environment is a complex process involving
overlapping and conflicting interests, agencies and legislation. Issues arising between
commercial fisheries and conservation interests are addressed under different
regulations administered by the Department of Conservation and the Ministry of
Fisheries. The latter, since the 1930s, has been responsible for the sustainable use of
fisheries for the social, economic and cultural well-being of the people. All stakeholders
of the marine environment are included in the advancement of sustainable management.
There are currently 97 species groupings in the QMS, divided into 629 fishstocks or
geographic Quota Management Areas (QMAs). Of the 629 fishstocks, 280 have TACCs
of 10 tonnes or less, leaving approximately 349 significant fishstocks that need to be
closely monitored (www.fish.govt.nz).
New Zealand is in the process of developing a comprehensive National Oceans Policy
which aims to address a range of marine issues including fisheries, maritime transport
and protection of the marine environment. New Zealand's Department of Conservation is
responsible for marine reserves and for marine mammals such as dolphins, whales, sea
lions and fur seals. New Zealand has a number of coastal national parks (Bay of Islands
Maritime and Historic Park, Hauraki Gulf Maritime Park).. The New Zealand Biodiversity
Strategy (2000) goal includes having 10% of the marine environment in a network of
Marine Protected Areas by 2010. For more information on marine reserves see the
Department of Conservation website at (www.doc.govt.nz/). The Ministry of Foreign
Affairs and Trade is responsible for New Zealand's international effort to address
356
19 New Zealand Shelf LME
environmental pressures arising from climate change, conservation of species, protection
of ocean biodiversity, hazardous substances, and international agreements on
environmental goods and services. The Environment Division leads this work and all
multilateral environmental agreements, such as the United Nations Framework
Convention on Climate Change (ministry web site at www.mfat.govt.nz/).
References
Belkin, I.M. (1988) Main hydrological features of the Central South Pacific, in: Ecosystems of the
Subantarctic Zone of the Pacific Ocean, edited by M.E. Vinogradov and M.V. Flint, Nauka,
Moscow, 21-28 [Translated as "Pacific Subantarctic Ecosystems", pp.12-17, New Zealand
Translation Centre Ltd., Wellington, 1996].
Belkin, I.M. (1993) Frontal structure of the South Atlantic, in: Pelagic Ecosystems of the Southern
Ocean, edited by N.M. Voronina, Nauka, Moscow, 40-53.
Belkin, I.M. (1995) Remote sensing and in situ observations of subtropical fronts, in: Proceedings of
the COSPAR Colloquium "Space Remote Sensing of Subtropical Oceans", September 12-16,
1995, Taipei, Taiwan, 14B3-1÷14B3-5.
Belkin, I.M. (2008) Rapid warming of Large Marine Ecosystems, Progress in Oceanography, in
press.
Belkin, I.M., and Gordon, A.L. (1996) Southern Ocean fronts from the Greenwich meridian to
Tasmania, J. Geophys. Res., 101(C2), 3675-3696.
Belkin, I.M., Cornillon, P.C., and Sherman, K. (2008). Fronts in Large Marine Ecosystems of the
world's oceans. Progress in Oceanography, in press.
Belkin, I.M., and Cornillon, P.C. (2003). SST fronts of the Pacific coastal and marginal seas. Pacific
Oceanography 1(2), 90-113.
Boyd, P.W., LaRoche, J., Gall, M., Frew, R. and McKay, R. (1999). Role of iron, light, and silicate in
controlling algal biomass in subantarctic waters SE of New Zealand. Journal of Geophysical
Research 104(13):391-404.
Bradford-Grieve, J.M., Boyd, P., Chang, F.H., Chiswell, S., Hadfield, M., Hall, J.A., James, M.R.,
Nodder, S.D. and Shushkina, E.A. (1999). Ecosystem functioning in the subtropical front
region east of New Zealand in austral winter and spring 1993. Journal of Plankton Research
21(3):405-428.
Bradford-Grieve, J.M., Probert, P.K.; Baker, A.N., Best, H.A., Boyd, P., Broekhuizen, N.,
Childerhouse, S., Clark, M.; Hadfield, M., Hall, J.A.; Hanchet, S.; Nodder, S.D.; Safi, K.;
Thompson, D.; Wilkinson, I.; Zeldis J. (2003) Pilot trophic model for subantarctic water over the
Southern Plateau, New Zealand: a low biomass, high efficiency system. Journal of
Experimental Marine Biology and Ecology 289(2): 223 262.
Bradford-Grieve, J., Probert, K., Lewis, K., Sutton, P., Zeldis, J., Orpin, A. (2006). Chapter 36. New
Zealand shelf region. In: The Sea, Volume 14: "The Global Coastal Ocean: Interdisciplinary
Regional Studies and Syntheses" Part B. (eds) A. Robinson and H. Brink, Wiley, New York. Pp
1451-1492.
Cawthron (2007) www.cawthron.org.nz//what_biosecurity_main.htm. (for information on
invasive species ). Cawthron's funding comes from the Foundation for Research, Science &
Technology and a range of commercial clients to which it provides consulting and analytical
services. Cawthron scientific and technical staff are based in Nelson and Marlborough.
FAO. Fisheries at www.fao.org/docrep/003 /w4248e/AREA81
Forrest, B., Taylor, M. and Hay, C. (1997). Foreign marine species in New Zealand: Towards a risk
assessment and management model. Cawthron Report 424.
Gall, M., Hawes, I. and Boyd, P. (1999). Predicting rates of primary production in the vicinity of the
subtropical convergence east of New Zealand. New Zealand Journal of Marine and Freshwater
Research 33(3):443-455.
Hall, J.A., James, M.R. and Bradford-Grieve, J.M. (1999). Structure and dynamics of the pelagic
microbial food web of the subtropical convergence region east of New Zealand. Aquatic
Microbial Ecology 20(1):95-105.
Hay, C. (1998). Marine and freshwater invaders. Water and Wastes in New Zealand
November/December issue:27-29.
IX South Pacific
357
Hay, C. and Taylor, M. (1999). Biosecurity in ports: Pros and cons of an "Insurance Assessment"
approach, in: Hillman, S.P. (ed), The Ballast Water Problem - Where to from here?
Proceedings of a workshop, 5-6 May 1999, Brisbane, Australia. EcoPorts Monograph Series
19.
Hunter K.A. and Boyd, P.W. (1999). Biogeochemistry of trace metals in the ocean. Marine and
Freshwater Research 50(8):739-754.
Morgan, J. (1989). Large Marine Ecosystems in the Pacific Ocean, p 377-394 in: Sherman, K. and
Alexander, L.M. (eds), Biomass Yields and Geography of Large Marine Ecosystems. AAAS
Selected Symposium 111. Westview Press. Boulder, U.S.
New Zealand National Institute of Water and Atmospheric Research at www.niwa.cri.nz/
pgsf/Ocean Fronts/images/nz2/gif for Sea WiFS image.
New Zealand Department of Conservation at www.doc.govt.nz/ Conservation/Marine-and-
coastal/index.asp
New Zealand Government Environment Publications at www.govt.nz/en-nz/Publications/);
www.stats.govt.nz/domino/external/web/prod_serv.nsf/htmldocs/Socioeconomic+indicators+in
dicators+for+the+environment)
New Zealand Ministry of Fisheries at www.fish.govt.nz
www.fish.govt.nz/en-nzFisheries+at+a+glance/default.htm (for labor statistics)
www.fish.govt.nz/en-nz/Press/September+2006/Sustainability (for 2006-2007 TAC statistics)
www.fish.govt.nz/en-nz/Publications/Ministerial+Briefing+04/F (for Maori catch quotas)
NOAA (1991). Report of the ad hoc Committee on Large Marine Ecosystems. NOAA Technical
Memorandum NMFS-F/NEC-92.
Paulin, C., Stewart, A., Roberts, C. and McMillan, P. (1989). New Zealand Fish A complete guide.
National Museum of New Zealand Miscellaneous Series No 19.
Pauly, D. and Christensen, V. (1995). Primary production required to sustain global fisheries.
Nature 374: 255-257.
Pauly, D. and Watson, R. (2005). Background and interpretation of the `Marine Trophic Index' as a
measure of biodiversity. Philosophical Transactions of the Royal Society: Biological Sciences
360: 415-423.
Roberts, R., Hay, C. and Rhodes, L. (1997). Marine invaders. The Royal Society of New Zealand,
Alpha Series 92.
Safi, K.A. and Hall, J.A. (1999). Mixotrophic and heterotrophic nanoflagellate grazing in the
convergence zone east of New Zealand. Aquatic Microbial Ecology 20(1):83-93.
Sea Around Us (2007). A Global Database on Marine Fisheries and Ecosystems. Fisheries Centre,
University British Columbia, Vancouver, Canada. www.seaaroundus.org/lme/
SummaryInfo.aspx?LME=46
UNEP (2003). Deese, H., de Ronde, C., DeVantier, L., Hall, J., Howard-Williams, C., Johnson, D.,
Mosbauer, A., Murdoch, R., Nodder, S., Pearson, C., Reichelt, R. and Wilkinson, C. Tasman
Sea, GIWA Regional Assessment 63. University of Kalmar, Kalmar, Sweden.
358
19 New Zealand Shelf LME
IX South Pacific
359
IX-20 Northeast Australian Shelf LME
M.C. Aquarone, S. Adams, and J. Brodie
The Northeast Australian Shelf/Great Barrier Reef LME lies in the Pacific Ocean off the
coast of the State of Queensland, Australia. It is bounded by the Coral Sea to the east
and by the Torres Strait, which separates Australia from Papua New Guinea, to the north,
covering an area of 1.3 million km2 of which 28.06% is protected (Sea Around Us 2007).
The LME is characterised by a tropical climate, with tropical cyclones being common
seasonal events. The South Equatorial Current, a part of the Pacific Ocean
counterclockwise gyre, and the Great Barrier Reef (GBR), a system of coral reefs that
stretches 2,000 km along Australia's northeast coast, are notable features of the LME
(Brinkman et al., 2002). It has the largest system of corals and related life forms in the
world, with 13.51% of the world's coral reefs, in addition to 0.26% of the world's sea
mounts (Sea Around Us 2007). Nutrient enrichment is due to land-based sources as well
as small upwelling areas and advection while mixing in this LME is due to tidal effects
and the wind regime in inshore areas. Intensive fishing is an important force driving the
LME but the combined stresses of climate change, terrestrial pollution and over-
harvesting are degrading the system in similar ways to other global coral reef systems
(Pandolfi et al., 2003; Bruno and Selig, 2007). Book chapters and articles pertaining to
this LME include Bradbury & Mundy (1989), Morgan (1989), Kelleher (1993), Brodie
(1999, 2003), Furnas (2003), Hopley et al. (2007), Johnson and Marshall (2007), and
UNEP (2003).
I. Productivity
The Northeast Australian Shelf LME is considered a Category III, low productivity
(<150 gCm-2yr-1) ecosystem. Ocean currents and wind systems along this coast inhibit
the development of highly productive upwelling systems. On this continental shelf,
sources of nutrients are Coral Sea surface water, Coral Sea local upwellings of deep sea
water, terrestrial runoff and atmospheric inputs. Tidally-induced mixing in the GBR is a
major contributor to the nutrient dynamics of this ecosystem. For more information on
oceanographic processes in this LME, see Wolanski, 1994, Wolanski et al., 2001 and
Brinkman et al., 2002. For large-scale shifts in biomass of the GBR, see Bradbury &
Mundy (1989).
There has been a steady accumulation of knowledge and understanding of the structure
and dynamics of this system. There is high biological diversity in this LME, with high
numbers of rare species. On the GBR are found 350 species of hard corals, along with
1,500 species of fish, 240 species of seabirds, and at least 4,000 species of molluscs
(see Brodie 1999). The physical and biological structure of the GBR is complex. For a
map of the GBR region, see Kelleher (1993). The abundance of hard corals has been
reduced by at least 50% in areas where there is intense crown-of-thorns starfish activity.
For more information about the large-scale effects of crown-of-thorns starfish outbreaks
on the benthic community, and for the propagation of effects into the fish and plankton
communities, see Bradbury & Mundy (1989) and Brodie et al. (2005).
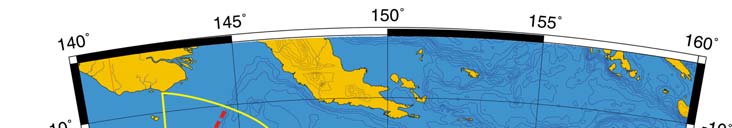
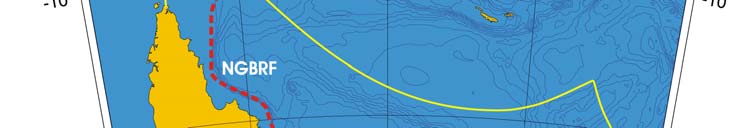
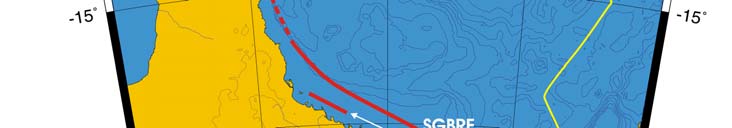
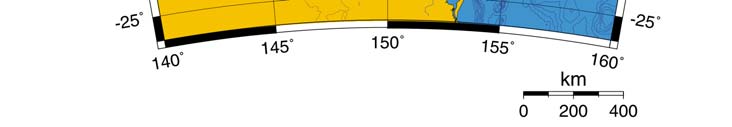
Oceanic fronts: From satellite data (Belkin & Cornillon 2003, Belkin et al. 2008), the
GBR is marked by a seasonal thermal front (GBRF) that peaks during the austral winter
(Figure IX-20.1). This front is better defined off southern Queensland, whereas the
fronts' extension off northern Queensland is less robust. Satellite data analysis revealed
another, inner shelf front that runs off the Queensland coast (QISF). This front appears
to consist of three segments, northern, central and southern, whose possible connectivity
is not yet established. In addition, a coastal region affected by terrestrial material is

360
20. Northeast Australia LME
evident (Brodie et al., 2007) separated from the oceanic regions off the shelf in deeper
waters.
Figure IX-20.1. Fronts of Northeast Australian Shelf/Great Barrier Reef LME. NGBRF, North Great
Barrier Reef Front (most probable location); QISF, Queensland Inner Shelf Front; SGBRF, South Great
Barrier Reef Front. Yellow line, LME boundary. After Belkin et al. (2008).
Northeast Australian Shelf SST (after Belkin 2008)
Linear SST trend since 1957: 0.46°C.
Linear SST trend since 1982: 0.37°C.
Interannual and long-term variability of SST in this LME (Figure IX-20.2) are correlated
with a few neighboring LMEs. For example, the twin peaks of 1970-1973 occurred
simultaneously in the North Australian Shelf LME. The local minimum of 1982 occurred
at the same time in the Indonesian Sea LME and in the Australian Shelf LME. The all-
time maximum of 1998 was a local manifestation of the global warming effect of the El
Nińo 1997-98. The absolute minimum of 1964-65 occurred concurrently with the
Southeast Australian Shelf LME. This cold anomaly probably originated upstream, in the
South Equatorial Current.
High SST exceeding the coral colony' tolerance threshold is the primary cause of coral
bleaching (Hoegh-Guldberg, 1999; Liu et al., 2003). In 2002, the Great Barrier Reef
suffered from the worst coral bleaching event ever, which affected up to 60% and
severely damaged 5%, of reefs surveyed (Berkelmans et al., 2004). Further severe
bleaching and damage is predicted under the current climate change predictions and in
association with ocean acidification (Lough, 2008, Hoegh-Guldberg et al., 2007).
IX South Pacific
361
Figure IX-20.2. NE Australian Shelf mean annual SST (left) and SST anomalies (right), 1957-2006, based
on Hadley climatology. After Belkin (2008).
Northeast Australian Shelf Chlorophyll and Primary Productivity
Figure IX-20.3. Northeast Australian Shelf Trends in chlorophyll-a and primary productivity, 1998-2006.
Values are colour coded to the right hand ordinate. Figure courtesy of J. O'Reilly and K. Hyde. Sources
discussed p. 15 this volume.
II. Fish and Fisheries
The relatively nutrient-poor waters of the Northeast Australian Shelf are unable to sustain
large fish populations. The trawl fishery (Brodie 1999) targets tiger prawns, banana
prawns and king prawns. Commercial and recreational fishing remain a huge industry in
the Northeast Australian Shelf/Great Barrier Reef LME. The commercial sector in the
state of Queensland annually harvests about 24,000 tonnes of seafood while the 800,000
recreational fishers in Queensland annually catch between 3,500 and 4,300 tonnes
(www.oceanatlas.org). The Bureau of Rural Sciences estimates a total commercial
fisheries production in national waters in 2002 at 15,600 tonnes with a value of AU$165
million (http://adl.brs.gov.au/). The annual catch of scallops and prawns is about 8,000
tonnes. Scallops are caught in the southern section of the GBR Marine Park. The Torres
Strait prawn fishery is fully-exploited while the Torres Strait lobster is still underexploited.
Information on Australia's fisheries is also available on the FAO website (www.fao.org/).
Total reported landings of the LME comprised mainly of tunas (mostly of skipjacks but
also yellowfin, bigeye and albacore), shrimps and prawns, and squids (from the late
362
20. Northeast Australia LME
1980s to early 1990s) and recorded 62,000 tonnes in 1990 (Figure IX-20.4). The
landings have since declined to about half of the peak landings. The trend in the value
reflected that of the landings, rising to about US$250 million (in 2000 US dollars) in 1989
(Figure IX-20.5).
Figure IX-20.4. Total reported landings in the Northeast Australian Shelf LME by species (Sea Around
Us 2007)
Figure IX-20.5. Value of reported landings in Northeast Australian Shelf LME by commercial groups (Sea
Around Us 2007).
The primary production required (PPR; Pauly & Christensen 1995) to sustain the reported
landings in this LME reached to 5% of the observed primary production in the late1980s,
but still is relatively low, considering the high proportion of high trophic pelagic species in
the landings (Figure IX-20.6). Japan, with its distant water tuna fleets, account for the
largest footprint in the region.
IX South Pacific
363
Figure IX-20.6. Primary production required to support reported landings (i.e., ecological footprint) as
fraction of the observed primary production in the Northeast Australian Shelf LME (Sea Around Us
2007). The `Maximum fraction' denotes the mean of the 5 highest values.
The mean trophic level of the reported landings (i.e., the MTI; Pauly & Watson 2005;
Figure) in the LME is still high, except for 1998 and 2004 when the landings of tuna were
unusually low (Figure IX-20.7, top), while the FiB index has been stable following an
increase from 1950 to the mid-1970s (Figure IX-20.7, bottom). These trends imply a
growth of fisheries in the region with no clear signs of a `fishing down' (Pauly et al. 1998)..
Figure IX-20.7. Mean trophic level (i.e., Marine Trophic Index) (top) and Fishing-in-Balance Index
(bottom) in the Northeast Australian Shelf LME (Sea Around Us 2007).
364
20. Northeast Australia LME
The Stock-Catch Status Plots indicate that more than half of the stocks in the region are
currently either overexploited or have collapsed (Figure IX-20.8, top) and that half of the
reported landings is supplied by such stocks (Figure IX-20.8, bottom).
1950
1960
1970
1980
1990
2000
0%
100
10%
90
20%
)
80
%
(
s
30%
u
70
at
st
40%
y
60
50%
cks b
50
o
f
st
60%
o
40
er
70%
mb
30
Nu
80%
20
90%
10
100%0
1950
1960
1970
1980
1990
2000
(n = 2266)
developing
fully exploited
over-exploited
collapsed
1950
1960
1970
1980
1990
2000
0%
100
10%
90
20%
80
)
%
30%
(
70
s
u
at
40%
60
k st
c
50%
o
50
st
y
60%
b
h
40
t
c
a
70%
C
30
80%
20
90%
10
100%0
1950
1960
1970
1980
1990
2000
(n = 2266)
developing
fully exploited
over-exploited
collapsed
Figure IX-20.8. Stock-Catch Status Plot for the Northeast Australian Shelf LME, showing the proportion
of developing (green), fully exploited (yellow), overexploited (orange) and collapsed (purple) fisheries
by number of stocks (top) and by catch biomass (bottom) from 1950 to 2004. Note that (n), the number
of `stocks', i.e., individual landings time series, only include taxonomic entities at species, genus or
family level, i.e., higher and pooled groups have been excluded (see Pauly et al, this vol. for definitions).
III. Pollution and Ecosystem Health
The Northeast Australia LME has been perturbed by the crown-of-thorns starfish
(Acanthaster planci) that has devastated reefs (Kelleher 1993). There is uncertainty as to
whether the outbreaks are human-induced or a natural part of the ecological variability of
the GBR (Brodie 1999). Possible anthropogenic causes are the overfishing of crown-of-
thorns predators such as fish or the triton shell, and enhanced nutrient runoff from coastal
development (Brodie et al., 2005). The large-scale effects of crown-of-thorns starfish
outbreaks on the benthic community have been discussed in Bradbury & Mundy (1989)
and in the State of the Environment Report (www.deh.gov.au/soe/index ).
The GBR is also threatened by increased shipping. A number of ports line the GBR
coastline (Brodie 1999), and navigation in the Torres Strait is intense. Ballast water
introductions of toxic dinoflagellates have caused serious ecological problems in other
parts of Australia but so far no undesirable introduction has been detected in the GBR
region. One significant anthropogenic impact on the GBR region is the change in the
IX South Pacific
365
water quality of terrestrial runoff (Brodie 1999). Excess nutrients affect coral and coral
reef systems (Kinsey 1991). There is considerable evidence that reefs, particularly
inshore fringing reefs, are now muddier and have less coral cover and more algal cover
(Fabricius et al., 2005). Reef ecosystem damage is evident in a large area of the north-
central GBR (Devantier et al., 2006) coinciding with the area known to be exposed to
polluted terrestrial runoff (Devlin and Brodie, 2005). Recreational fishermen tend to
target reef ecosystems and remove larger predatory species. The effects of this selective
removal of fish are largely unknown. Shore-based recreational fishing can affect shore
populations of invertebrates that are collected for bait in intensively visited areas.
Environmental impacts on the Great Barrier Reef also stem from tourism. Large numbers
of people are engaged in recreational fishing, SCUBA diving and boating. The expanding
marine tourism industry is a major contributor to the Australian economy and now
supports more than 820 operators, generates $4.2 billion annually, and accommodates
1.8 million visitors each year (www.oceansatlas.org). Activities associated with this level
of recreational use can affect the environment through the pollution of water by boats and
the disturbance of species and habitats (including mangroves). A major source of
environmental impacts is the provision of infrastructure to support tourism (airports,
power generation facilities, accommodation, sewage treatment and disposal facilities,
moorings, and marine transport, including high-speed ferries). Often, this infrastructure is
located in fragile or pristine environments that are susceptible to disturbance and
fragmentation. For more information on pollution control in the GBR, see Kelleher
(1993).
IV. Socioeconomic Conditions
According to the Bureau of Rural Statistics, the North Eastern Region of Australia has a
population of 441,300 of whom 90% reside in 66 medium-to-large coastal towns.
(http://adl.brs.gov.au). Employment within the fishing sector is heavily concentrated in
the commercial sector, and involves from 1% to 5% of total employment. Total
commercial fisheries production for the region in 2002 was estimated at 15,600 t with a
GVP of AU$165 million (http://adl.brs.gov.au/). FAO provides information on Australia's
fisheries and the socioeconomic benefits of the industry (www.fao.org/fi). Marine and
coastal-based tourism is the main industry of the GBR, an internationally recognised
tourist site and one of Australia's six World Heritage Sites (see Brodie 1999). In the
1980s, tourism in the GBR was evaluated at 150,000 visitor-days. In the late 1990s,
tourism was worth US$1 billion, with 1.5 million visitor-days. Whale-watching takes place
off the coast of Queensland. Tourism clearly depends on sustaining environmental and
heritage values. Tourism can affect the lifestyle of community residents in ways they
perceive as intrusive. In terms of fisheries, for instance, there can be tensions between
recreation, commercial and indigenous interests. Traditional fishing by Aborigines and
Torres Strait islanders is confined to areas close to Aboriginal communities (Brodie
1999). Shipping is a major activity. Mining including extraction of petroleum is not
permitted within the Marine Park boundary. For more information about human uses of
the GBR, see Kelleher (1993) and Brodie (2003).
V. Governance
This LME falls within the Pacific Regional Seas Programme (see the East-Central
Australian Shelf LME). The main governance issues in this LME pertain to fisheries
management and to the Great Barrier Reef Marine Park and Great Barrier Reef World
Heritage Area. See the North Australian Shelf LME (Chapter VIII) for more information.
For sustainable fishing issues in the GBR, see Kelleher (1993). Under the offshore
constitutional settlement between the Australian states and the federal government, the
management of most fisheries within the GBR is the responsibility of the Queensland
366
20. Northeast Australia LME
government (Brodie 1999). Fishery Management methods covering recreational and
commercial fishing are: input controls (gear restrictions, limited entry licenses, area and
seasonal closures); output controls (TAC, ITQs, bag limits and size limits), measures for
species and habitat protection. There is often a `user pays' approach in which users
(usually fishers) pay the full cost of supporting management and compliance for their
fisheries, including substantial license or access fees (www.fao.org/). In 2003 the
Australian Government Representative Areas Program for the GBR was introduced
where the area of highly protected status (no take) was increased from 6 to 30 % of the
total (Fernandes et al. 2004). More information on the governance of Australia's fisheries
is available at the FAO website.
The GBR Marine Park Act was one of the first pieces of legislation in the world to apply
the concept of sustainable development to the management of a large natural area. The
GBR Marine Park Authority was established in 1975 to manage the multi-use park. The
Authority aims to protect the natural ecosystems of the GBR, and ensures that fishing
does not have unacceptable ecological impacts on the fished areas and the reefs. For
more information on the history and zoning system of the GBR Marine Park, see Brodie
(1999) and Kelleher (1993). Compulsory pilotage in the area reduces the risk of collision
with reefs.
On the national level, the Commonwealth Government developed a National Action Plan
for Tourism in 1998. The Plan, which identifies conservation and careful management of
the environment as essential to the long-term viability of the tourism industry, makes a
commitment to ecologically sustainable tourism development and recognises that
environmental considerations should be an integral part of economic decisions.
References
Belkin, I.M. (2008) Rapid warming of Large Marine Ecosystems, Progress in Oceanography, in
press.
Belkin, I.M. and Cornillon, P.C. (2003). SST fronts of the Pacific coastal and marginal seas. Pacific
Oceanography 1(2):90-113.
Belkin, I.M., Cornillon, P.C., and Sherman, K. (2008) Fronts in large marine ecosystems of the
world's oceans: An atlas. Progress in Oceanography, in press.
Bell, P.R.F. (1991). Status of eutrophication in the Great Barrier Reef lagoon. Marine Pollution
Bulletin 23:89-93.
Berkelmans, R., De'ath, G., Kininmonth, S. and Skirving, W. (2004) A comparison of the 1998 and
2002 coral bleaching events on the Great Barrier Reef: spatial correlation, patterns and
predictions, Coral Reefs, 23(1), 74-83.
Bradbury, R.H. and Mundy, C.N. (1989). Large-scale Shifts in biomass of the Great Barrier Reef
ecosystem, p 143-168 in: Sherman, K. and Alexander, L.M. (eds), Biomass Yields and
Geography of Large Marine Ecosystems. AAAS Selected Symposium 111. Westview Press,.
Boulder, U.S.
Brinkman, R., Wolanski, E., Deleersnijder, E., McAllister, F. and Skirving, W.: 2002, Oceanic inflow
from the Coral Sea into the Great Barrier Reef. Estuarine, Coastal and Shelf Science 54, 655-
668.
Brodie, J. (1999). Management of the Great Barrier Reef as a Large Marine Ecosystem, p 428-437
in: Sherman, K. and Tang, Q. (eds), Large Marine Ecosystems of the Pacific Rim
Assessment, Sustainability and Management. Blackwell Science, Malden, U.S.
Brodie, J. (2003). The Great Barrier Reef: 25 years of management as a Large Marine Ecosystem,
p 313 - 336 in: Hempel, G. and Sherman, K. (eds), Large Marine Ecosystems of the World:
Trends in Exploitation, Protection and Research. Elsevier, The Netherlands.
Brodie, J. and Furnas, M. (1994). Long term monitoring programmes for eutrophication and the
design of a monitoring programme for the Great Barrier Reef. Proceedings of the Seventh
International Coral Reef Symposium, Guam 1:77-84.
IX South Pacific
367
Brodie, J.E. (1995). Management of sewage discharges in the Great Barrier Reef Marine Park, p
457-465 in: Bellwood, O., Choat, H. and Saxena, N. (eds), Recent advances in Marine
Science and Technology '94. James Cook University, Townsville, Australia.
Brodie J., Fabricius K., De'ath G. and Okaji K. 2005. Are increased nutrient inputs responsible for
more outbreaks of crown-of-thorns starfish? An appraisal of the evidence. Marine Pollution
Bulletin, 51 (1-4): 266-278.
Brodie, J., De'ath, G., Devlin, M., Furnas, M., and Wright, M. 2007. Spatial and temporal pattern of
near-surface chlorophyll-a in the Great Barrier Reef lagoon. Marine and Freshwater
Research, 58: 342-353.
Bruno, J. and Selig, E. 2007. Regional decline of coral cover in the Indo-Pacific: timing, extent and
sub-regional comparisons. PLoSONE, 8.
DeVantier, L., De'ath, G., Turak, E., Done, T. Fabricius, K. 2006. Species richness and community
structure of reef-building corals on the nearshore Great Barrier Reef. Coral Reefs, 25: 329-
340.
Devlin, M.J. Brodie, J. 2005. Terrestrial discharge into the Great Barrier Reef Lagoon: nutrient
behaviour in coastal waters. Marine Pollution Bulletin, 51: 9-22.
Fabricius, K.E., De'ath, G., McCook, L.J., Turak, E., Williams, D. (2005). Coral, algae and fish
communities on inshore reefs of the Great Barrier Reef: Ecological gradients along water
quality gradients. Marine Pollution Bulletin 51: 384-398.
FAO. (2003). Information on Fisheries Management in Australia. www.fao.org/
fi/fcp/en/AUS/body.htm (for access fees); www.fao.org/ fi/FCP/FICP_AUS_E.ASP)
Fernandes, L., Day, J., Lewis, A., Slegers, S., Kerrigan, B., Breen, D., Cameron, D, Jago, B., Hall,
J., Lowe, D., Innes, J., Tanzer, J., Chadwick, V., Thompson, L., Gorman, K., Simmons, M.,
Barnett, B., Sampson, K., De'ath, G., Mapstone, B., Marsh, H., Possingham, H., Ball, I., Ward,
T., Dobbs, K., Aumend, J., Slater, D. and K. Stapleton (2005) Establishing representative no-
take areas in the Great Barrier Reef: large-scale implementation of theory on marine
protected areas. Conservation Biology: 1733-1744.
Furnas, M.J. (1995). Land-sea interactions and oceanographic processes affecting the nutrient
dynamics and productivity of Australian marine ecosystems. www.ea.gov.au/coasts/
publications/somer/annex1/land-sea.html#HDR7
Furnas, M.J. (2003). Catchments and Corals: Terrestrial Runoff to the Great Barrier Reef.
Australian Institute of Marine Science and Reef CRC, Townsville.
Hoegh-Guldberg, O. (1999) Coral bleaching, climate change and the future of the world's coral
reefs, Marine and Freshwater Research, 50(8), 839-866.
Hoegh-Guldberg, O., Mumby, P.J., Hooten, A.J. et al (2007). Coral reefs under rapid climate
change and ocean acidification. Science 318, 1737-1742.
Hopley D, Smithers SG, Parnell KE 2007 The Geomorphology of the Great Barrier Reef:
development, diversity, and change, Cambridge University Press, ISBN: 978-0-521-85302-6.
Johnson JE and Marshall PA (editors) (2007) Climate Change and the Great Barrier Reef. Great
Barrier Reef Marine Park Authority and Australian Greenhouse Office, Australia
Kelleher, G. (1993). Sustainable development of the Great Barrier Reef as a Large Marine
Ecosystem, p 272-279 in: Sherman, K., Alexander, L.M. and Gold, B.D. (eds), Large Marine
Ecosystems Stress, Mitigation and Sustainability. AAAS Press, Washington D.C., U.S.
Kinsey, D. (1991). Water Quality and its Effect on Reef Ecology, Land Use Patterns and Nutrient
Loading of the Great Barrier Reef Region. James Cook University, Townsville, Australia.
Lassig, B. and Englehardt, U. (1994). Crown-of-thorns starfish Another outbreak looms. Search
25(3):66-68.
Liu, G., Strong, A.E., and Skirving, W. (2003) Remote sensing of sea surface temperatures during
2002 Barrier Reef coral bleaching, Eos, 18(15), 137-144.
Lough, J.M. 2008. 10th Anniversary Review: a changing climate for coral reefs. Journal of
Environmental Monitoring 10, 21-29.
Morgan, J. (1989). Large Marine Ecosystems in the Pacific Ocean, p 377-394 in: Sherman, K and
Alexander, L.M. (eds), Biomass Yields and Geography of Large Marine Ecosystems. AAAS
Selected Symposium 111. Westview Press, Boulder, U.S.
Pandolfi, J.M. Bradbury, R.H. Sala, E. Hughes, T.P. et al. 2003. Global trajectories of the long-
term decline of coral reef ecosystems. Science, 301: 955-958.
Pauly, D. and Christensen, V. (1995). Primary production required to sustain global fisheries.
Nature 374: 255-257.
Pauly, D. and Watson, R. (2005). Background and interpretation of the `Marine Trophic Index' as a
measure of biodiversity. Philosophical Transactions of the Royal Society: Biological Sciences
360: 415-423.
368
20. Northeast Australia LME
Pauly, D., Christensen, V., Dalsgaard, J., Froese R. and Torres, F.C. Jr. (1998). Fishing down
marine food webs. Science 279: 860-863.
Pogonoski, J.J., Pollard, D.A. and Paxton, J.R. (2002). Conservation overview and action plan for
Australian threatened and potentially threatened marine and estuarine fishes. Environment
Australia, February 2002. www.deh.gov.au/coasts/publications/marine-fish-action/ index.html
Sea Around Us (2007). A Global Database on Marine Fisheries and Ecosystems. Fisheries Centre,
University British Columbia, Vancouver, Canada. www.seaaroundus.org/lme/
SummaryInfo.aspx?LME=40
Steinberg, C. (2007) Chapter 3 Impacts of climate change on the physical oceanography of the
Great Barrier Reef, in: Climate Change and the Great Barrier Reef, Johnson, J.E., and P.A.
Marshall (eds.), Great Barrier Reef Marine Park Authority and Australian Greenhouse Office,
Australia.Australian Department of Agriculture, Fisheries and Forrestry, Bureau of Rural
Sciences http://adl.brs.gov.au/mapserv/fishcoast/north_eastern_region.html
UNEP (2003). DeVantier, L., Wilkinson, C., Lawrence, D. and Barnett, B. Great Barrier Reef, GIWA
Regional Assessment 60. University of Kalmar, Kalmar, Sweden.
Wolanski, E. (1994). Physical Oceanographic Processes of the Great Barrier Reef. CRC Press,
Boca Raton, U.S.
E. Wolanski (ed). (2001). Oceanographic Processes of Coral Reefs: Physical and Biological Links
in the Great Barrier Reef. CRC Press, Boca Raton, Florida, 356 pp.
IX South Pacific
369
IX-21 Southeast Australian Shelf LME
M.C. Aquarone, S. Adams, S. Frusher, and I.M. Suthers
The Southeast Australian Shelf LME extends from Cape Howe, at the southern end of
the State of New South Wales, to the estuary of the Murray-Darling river system in the
State of South Australia. It borders the Southern Ocean and the western boundary
currents flowing into the West Wind Drift, which circulates around the continent of
Antarctica. The LME has a surface area of about 1.2 million km2, of which 0.17% is
protected (Sea Around Us 2007), and contains the island of Tasmania and the Bass
Strait, which separates the island from the mainland state of Victoria. There are over 50
islands in Bass Strait, the largest and inhabited ones being Kings Island and Flinders
Island. The Murray-Darling river system has a large catchment area, and it used to
transport nutrients and sediments from the land into the coastal waters, but the river is
heavily exploited and river flow is minimal. A book chapter on this LME has been
published by Morgan (1989).
The region is characterised by sub-tropical species with southern Tasmania being
Australia's main temperate region. The area has a large and variable marine flora and
fauna including a large number of endemic species and is of high conservation value
(Hoese et al. 2006).
The southeast region is the meeting place of two of Australia's main currents. The East
Australian current (see Eastern Australian LME) brings low nutrient waters into south
eastern Australia before heading offshore off eastern Tasmania. The Leeuwin Current
(see Western Australian LME) brings low nutrient waters into southern Australia and
down the western region of Tasmania. Off western Tasmania this current is often referred
to as the Zeehan Current (Baines et al. 1983). Higher nutrient waters are brought to
southern Tasmania from the sub-Antarctic waters. The Flinders Current is a westward
flow along the 600 m isobath, from western Bass Strait to Kangaroo Island (Middleton
and Bye 2007). An upwelling system off the Bonney Coast between southeastern South
Australia and Victoria also brings nutrients to the surface.
I. Productivity
The Southeast Australian Shelf LME has a diversity of habitats such as seagrass beds,
mud flats, intertidal and sub-tidal rocky reefs, kelp forests and pelagic systems. It is
considered a Class III, low productive ecosystem (<150 gCm-2yr-1). Estimates of the
mean annual primary productivity from 1998-2006 of the southeast Australian continental
shelf vary between 68 and 251 gCm-2d-1 (www.science.oregonstate.edu/ocean.
productivity/) depending whether the estimate is based on chlorophyll or particulate
carbon concentration, and if a temperature correction is applied. The Sea Around Us
project estimates mean primary productivity at 187 g C m-2 d-1. The large range of values
may result from the atypically low nutrient concentrations for a shelf system at this
latitude - a result of low continental discharge and poleward flowing boundary currents.
It is a temperate marine environment inhabited by communities rich in species, many of
which are endemic to Australia. Investigations in Bass Strait and the south-eastern slope
have revealed soft-bottom benthic communities more diverse than anywhere else in the
world. For example of the 638 species of fish recorded for Tasmania, 38 (6%) are
endemic to Tasmania and 273 (43%) are endemic to Australia (Hoese et al. 2006).
370
21. Southeast Australian Shelf LME
Near the island of Tasmania, seasonal storm events accelerate the mixing of nutrients
onto the shelf. Runoff from the Murray-Darling river system was a regional contributor to
shelf nutrient processes and fluxes. For a general understanding of oceanographic
processes affecting the nutrient dynamics and productivity of Australian marine
ecosystems, see Australia's State of the Environment (SOE) Report 2006
(www.deh.gov.au/soe/index.html). Reports by States and Territories and National
environment audits are available from this index. For more information on productivity,
nutrient dynamics and land-sea interactions, see Furnas (1995) and UNEP (2003).
In the southwest of this LME strong westerly winds drive colder nutrient rich sub-antarctic
waters up the east coast of Tasmania. These waters are characterised by high nitrate
and dissolved organic nitrogen concentrations in surface waters. These cooler windy
periods result in less oligotrophic conditions with the phytoplankton dominated by large
diatoms and the zooplankton by larger species such as krill. In years of strong westerlies
the phytoplankton biomass and productivity increases and the spring bloom lasts longer.
In such years, the zooplankton biomass increased 10 fold in late spring. In contrast, the
surface waters in the summer and autumn period (January to July) reflect the intrusion of
sub-tropical water which can be detected by increased salinities and very low dissolved
inorganic phosphorus. This period coincides with a reduction in the westerly wind stress.
These calmer warmer periods result in more oligotrophic conditions when the
phytoplankton is dominated by small dinoflagellates and the zooplankton by small
copepods (Harris et al, 1988; Harris et al, 1991; Clementson et al, 1989).
Productivity in the northwest of the LME is dominated by summer upwelling events. The
largest of these is the Bonney upwelling in southeastern South Australia adjacent to the
Victorian border. During winter the Leeuwin Current moves eastwards along the south
Australian coast to the southern tip of Tasmania (Cirano and Middleton 2004; Cresswell
and Peterson 1993; Godfrey et al. 1986). In the summer, the coastal wind reverses and
changes to induce upwelling producing a westward flow at the coastal boundary
(Middleton and Platov 2005). Sub-surface upwelling extends in an almost continuous
band from the Bonney Coast to western Tasmania. Extensive areas of krill have been
observed along this shelf margin, Hunter group of islands and King Island and the region
has high conservation values, including the pygmy blue whale (Butler et al. 2002).
La Nina years are associated with a weaker influence of the East Australian Current in
Eastern Bass Strait and the Leeuwin Current in western Bass Strait. During this time
cooler waters enter Bass Strait from the Bonney upwelling and the Flinders Current.
Oceanic fronts: The East Australian Current (EAC) carries tropical waters from the East-
Central Australian Shelf LME into the Southeast Australian Shelf LME to feed a
southward EAC and mesoscale eddies off eastern Tasmania (Figure IX-21.1). The
Zeehan Current is the final extension of the Leeuwen Current along western Tasmania.
East of Kangaroo Island the Flinders Current is probably responsible for intermittent
upwelling in the deep canyon systems off the western Victorian Shelf. The Kangaroo
Island Front (KIF) develops seasonally southeast of Kangaroo Island caused by wind-
driven coastal upwelling (Belkin & Cornillon 2003, Belkin et al. 2008.
Southeast Australian Shelf LME
Linear SST trend since 1957: 0.53°C.
Linear SST trend since 1982: 0.20°C.
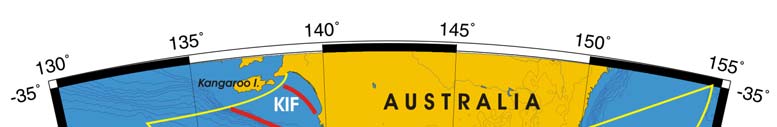
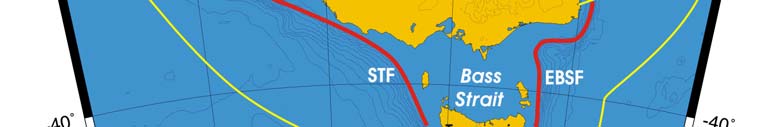
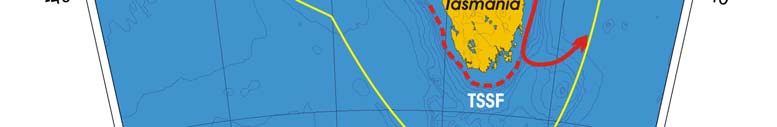
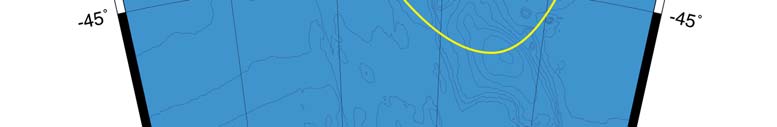

IX South Pacific
371
Figure IX-21.1. Fronts of the Southeast Australian Shelf LME. EBSF, East Bass Strait Front; STF,
Subtropical Front; TSSF, Tasmania Shelf-Slope Front (most probable location). Yellow line, LME
boundary. (after Belkin et al. 2008)
The thermal history of this LME features a long-term ascending trend, although this
warming was quite erratic, including major reversals. Some peculiarities of this LME's
thermal history are likely caused by its location as the southernmost Australian LME.
Therefore this LME is affected by the Subantarctic and Antarctic (via atmospheric
teleconnections) more strongly than are other Australian LMEs. The East Australian
Current is a dominant warm current and its role increased over the last half-century as
this current penetrated farther south by ~350 km over the 19442002 period, thus
effectively warming up the East Tasmanian waters at a rate of 2.28°C/century (Ridgway,
2007).
The most striking difference between this LME and other Australian LMEs is the absence
of a major peak in 1998 that could have been a manifestation of the 1997-98 El Nińo, as
observed elsewhere. Instead, SST peaked in 2001, possibly a delayed response to the
El Nińo 1997-98. A similar warm event peaked in 2000 in the adjacent Southwest
Australian Shelf LME. The all-time maximum of 1989 can be tentatively correlated with
the peak of 1988 in the Sulu-Celebes Sea LME, North Australian Shelf LME, West-
Central Australian Shelf LME, and lesser peaks of 1989 in the Southwest Australian Shelf
LME and of 1988 in the Northwest Australian Shelf LME. The peak of 1961 occurred
simultaneously in the adjacent Southwest Australian Shelf LME. The cold events of 1964
and 1996 cannot be readily linked to similar events elsewhere. This asymmetry between
372
21. Southeast Australian Shelf LME
warm and cold events suggests a weaker correlation between cold events versus a
stronger correlation between warm events.
Figure IX-21.2. SE Australian Shelf LME annual mean SST (left) and SST anomalies (right), 1957-2006,
based on Hadley climatology (after Belkin 2008).
Southeast Australian Shelf LME, Chlorophyll and Primary Productivity: The
Southeast Australian Shelf is considered a Class III, low productive ecosystem
(<150 gCm-2yr-1).
Figure IX-21.3. Southeast Australian Shelf LME trends in chlorophyll a and primary productivity, 1998-
2006. Values are colour coded to the right hand ordinate. Figure courtesy of J. O'Reilly and K. Hyde.
Sources discussed p. 15 this volume.
II. Fish and Fisheries
Fig. IX-21.4 and IX-21.5 present the estimates of the Sea Around Us Project for the
capture fisheries landings in this LME, and their ex-vessel value. Australian sources
suggest that the combined capture fisheries and aquaculture production in the
southeastern Australian LME is 121.5 thousand tonnes, valued at $1.05 billion Australian
dollars, with the wild fish sector accounts for 60% of the weight and 50% of the value of
production in this region, suggesting that the Sea Around Us figures are underestimates.
The main groups fished include lobster, abalone, scallops, crabs, prawns, snapper,
sardines, blue grenadier and flathead. The aquaculture sector includes atlantic salmon,
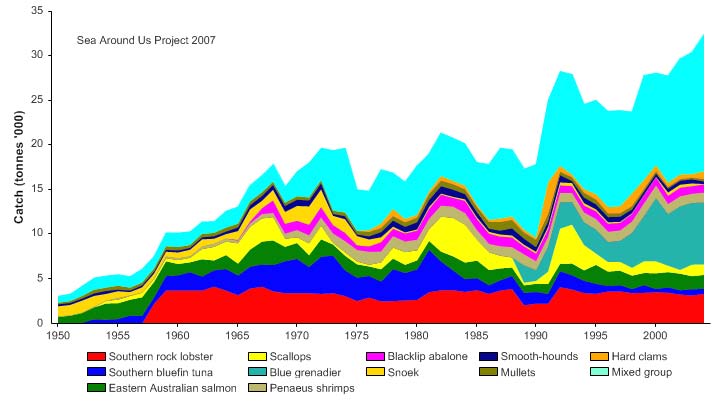
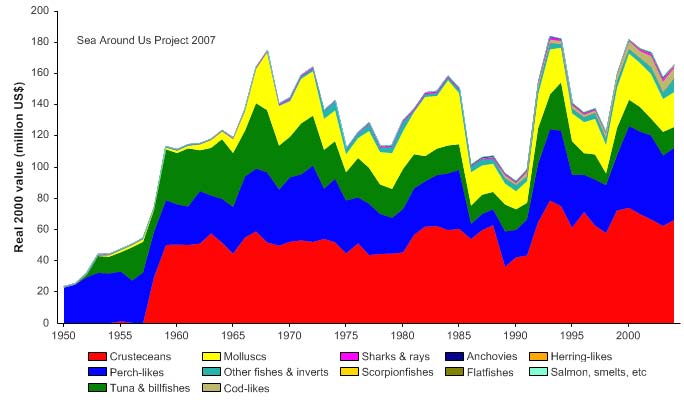
IX South Pacific
373
southern bluefin tuna, oysters and mussels. ABARE provides additional information on
the characteristics of Australia's fishing industry (www.abare.gov.au).
The region is a mix of high valued export fisheries, which includes nearly 50% of the
global wild caught abalone production, and the bulk of the domestic fish market in
Sydney and Melbourne. The small pelagics fishery has undergone substantial
fluctuations over the decades with large catches of jack mackerel (Trachurus declivis)
dramatically declining in eastern and southern Tasmania. Recently there has been an
increase in redbait (Emmelichthys nitidus) (Anon. 2008a) In addition to the small
pelagics fishery, dramatic fluctuations in recruitment of scallops and striped trumpeter
(Latris lineata) reflect the dynamics of the physical environment (Anon. 2008b).
Figure IX-21.4. Total reported landings in the Southeast Australian Shelf LME by species (Sea Around
Us 2007).
Figure IX-21.5. Value of reported landings in the Southeast Australian Shelf LME by commercial groups
(Sea Around Us 2007).
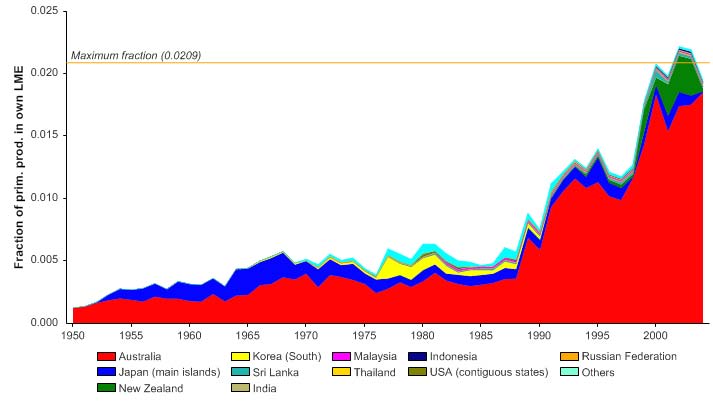
374
21. Southeast Australian Shelf LME
ABARE estimates for 2006/2007 (including aquaculture) for fisheries production in
Victoria was 8,243 t valued at $93.934 millions $AUD; South Australia production was
60,548 tonnes at a value in millions of $AUD of $426,499; Tasmania fisheries production
in totalled 36,413 tonnes at a value in millions of $AUD $475,429 and Commonwealth
managed fisheries harvested 16,328 tonnes at a value in millions of $AUD $54.539.
(www.abare.gov.au). Quota management has been introduced into many of the more
valuable fisheries over the last 20 years. This has resulted in substantial rebuilding of the
biomass in several fisheries such as rock lobster (Haddon and Gardner 2008). The
primary production required (PPR; Pauly & Christensen 1995) to sustain the reported
landings in this LME is currently below 2.5% with Australia accounting for the largest
share of the ecological footprint (Figure IX-21.6).
Figure IX-21.6. Primary production required to support reported landings (i.e., ecological footprint) as
fraction of the observed primary production in the Southeast Australian Shelf LME (Sea Around Us
2007). The `Maximum fraction' denotes the mean of the 5 highest values.
Over the past twenty years, both the mean trophic level of the reported landings (i.e., the
MTI; Pauly & Watson 2005) and the FiB index have increased in the LME, indicating a
development of new offshore fisheries from the late 1980s to the 1990s.
Figure IX-21.7. Mean trophic level (i.e., Marine Trophic Index) (top) and Fishing-in-Balance Index
(bottom) in the Southeast Australian Shelf LME (Sea Around Us 2007).
IX South Pacific
375
The Stock-Catch Status Plots suggest that while a sizeable fraction of the stocks in this
LME may have been overexploited (Figure IX-21.8, top), about half of the catch biomass
originates from stocks that are fully exploited (Figure IX-21.8, bottom). Moreover,
changes to gear, management, fleet dynamics/fisher behaviour, market forces, as well as
discarding, unstandardised catch data and climate (e.g. the jack mackerel fishery)
prevent further interpretation. There is limited or no fishery independent data for many
species, and recruitment records are unknown. Recent changes to management have
improved the stock status of many fisheries.
0%
100
10%
90
20%
)
80
(
%
s
30%
u
70
at
st
40%
y
60
b
ks
50%
c
o
50
f
st
60%
40
r
o
e
b
70%
m
30
u
N
80%
20
90%
10
100%0
1950
1960
1970
1980
1990
2000
(n = 1812)
developing
fully exploited
over-exploited
collapsed
1950
1960
1970
1980
1990
2000
0%
100
10%
90
20%
80
)
30%
(
%
70
t
us
40%
t
a
60
s
k
50%
t
oc
50
s
y
60%
h b
40
t
c
a
70%
C
30
80%
20
90%
10
100%0
1950
1960
1970
1980
1990
2000
(n = 1812)
developing
fully exploited
over-exploited
collapsed
Figure IX-21.8. Stock-Catch Status Plots for the Southeast Australian Shelf LME, showing the
proportion of developing (green), fully exploited (yellow), overexploited (orange) and collapsed (purple)
fisheries by number of stocks (top) and by catch biomass (bottom) from 1950 to 2004. Note that (n), the
number of `stocks', i.e., individual landings time series, only include taxonomic entities at species,
genus or family level, i.e., higher and pooled groups have been excluded (see Pauly et al, this vol. for
definitions).
III. Pollution and Ecosystem Health
Land use impacts within the Murray Darling Basin, nutrient loading from diffuse and point
sources, soil erosion, soil salinisation, and dry climate with intermittent flows and natural
salt stores in the landscape have resulted in significant or major nitrogen exceedances in
the Lower Murray, Myponga, Fleurieu Peninsula and Willochra Creek River basis. In
several of these river basins, guidelines for salinity, phosphorus and for turbidity have
also been exceeded (http://audit.ea.gov.au/ ANRA/water/quality/). A major problem in
this LME is the introduction of exotic marine organisms from the hulls of ships or as a
consequence of discharging ballast water. A recent inventory of introduced marine pests
found 57 species in Victoria, 45 in Tasmania and 43 in South Australia
(www.marine.csiro.au/crimp/nimpis). These introduced marine species threaten native
marine flora and fauna and local marine diversity as well as fishing and aquaculture.
Introduced species in this LME include the North Pacific sea star (Asterias amurensis),
Japanese kelp (Undaria pinnatifida), the New Zealand screw shell (Maoricolpus roseus),
European fan worm (Sabella spallanzanii) and the toxic dinoflagellate (Gymnodinium
catenatum). The North Pacific sea star native to northern China, Korea, Russia and
Japan, was first found in Tasmania in 1986, but was misidentified as a native species
376
21. Southeast Australian Shelf LME
until 1992. The sea star has since spread to Victoria. At present, its distribution in
Australia appears to be limited to these two States. However, suitable conditions exist for
its survival and reproduction in the West-Central Australian Shelf LME. The sea star is a
voracious predator of shellfish, thus posing a serious threat to mariculture and wild
shellfish fisheries. While significant research is being undertaken on the potential
impacts of the sea star in Australia, the available data are still not adequate to
conclusively determine if it is having an impact on Australian fisheries. Japanese kelp
has appeared in near-shore habitats along the east coast of Tasmania and is spreading
fast with the potential to invade the entire southern coastline. For more information on
pollution issues see www.deh.gov.au/coasts/pollution/index.html, the State of the
Environment Reports at www.deh.gov.au/soe and CSIRO's Center for Introduced Marine
Pests at www.marine.csiro.au/crimp/. Climate change is also impacting on the
distribution of species in southeastern Australia. The magnitude and poleward distribution
of the East Australian Current (EAC) has increased over the last 60 years (Ridgway,
2007) and is expected to increase due to climate change with predictions that
southeastern Australian marine waters will be the fastest warming in the southern
hemisphere. With the increased penetration of the East Australian Current there has
been an increase in the number and southerly distribution of sub-tropical species into
Tasmania. The most notable of these is the long-spined sea urchin, which forms
extensive barrens habitat (Johnson et al., 2005). These barrens habitats lead to
substantial changes in productivity and biodiversity (Ling, 2008) with flow on impacts on
fisheries. Initially, range expansion was by way of larval transport from NSW via the EAC.
With increasing warmer waters, the conditions for C. rodgersii to complete it larval cycle
in-situ in eastern and southern Tasmanian become more favourable (Ling et al., 2008).
The dinoflagellate Noctiluca scintillans has also dramatically increased with summer
blooms impacting on coastal salmon farms (www.tafi.org.au/zooplankton).
In the northwestern region of the LME climate change is expected to increase the
strength and duration of upwelling winds (Bakun 1990). This is expected to result in a
stronger Bonney upwelling and for increased sub-surface upwelling events that extend
from western Victoria to western Tasmania. An increase in these upwelling events at the
beginning of summer accelerates primary and secondary productivity.
Climate change simulations are currently being improved for the Australian region at
CSIRO, particularly in modeling the Southern Ocean, developing a more realistic
Antarctic Circumpolar Current, and modeling the transport of surface water into the deep
ocean. The latter process is particularly important in the sequestering of heat and carbon
into the deep ocean, which influences the rate and pattern of warming globally.
IV. Socioeconomic Conditions
In the Southeast Australian Shelf LME, the population is 1,465,200 persons and between
5% and 10% of the total employment is in the fish industry--fisheries, aquaculture and
processing sectors. The region is socially diverse, with some small, isolated communities
and some major metropolitan centres, with the population growth highest in coastal
metropolitan areas and large coastal regional centres (especially Melbourne). The two
main industries for the LME are marine tourism and oil and gas. Bass Strait accounts for
about 20% of the nation's oil and gas (Love 2004). In the Atlas of Australian Marine
Fishing and Coastal Communities, (http://adl.brs.gov.au/), the region is characterised by
a lower proportion of Indigenous persons, by younger median ages in coastal
metropolitan areas and large coastal regional centres, by higher child dependency in
many regional areas, and by higher socio-economic disadvantage in many non-
metropolitan areas of coastal Tasmania with strong links to the fish industry. The
southern rock lobster fishery is the most valuable in this region and was estimated in
2003 to provide 3,381 employment opportunities either directly or indirectly with a total
IX South Pacific
377
economic impact of almost 0.5 billion dollars into regional economies. A record low catch
rate in the South East coast is being reported for rock lobster in October, 2008 according
to John Ashby, president of the Port MacDonnell Fishermen's Association
(http://fis.com/fis/worldnews 16 October 2008). The South East Fishery, which includes
both the trawl and gillnet, trap and line fisheries, is a major fish industry with landings in
2006/7 being 20,578 tonnes worth an estimated $AUD 78 million. Salmon aquaculture is
carried out in Tasmania and its production was valued at $271 million in 2006/7
(www.abare.gov.au). Recreational fishing is an important pastime in this region with
approximately 1 million people participating in the 12 months prior to May 2000.
Participation rates were estimated at 29.3%, 24.1% and 12.7% in Tasmania, South
Australia and Victoria respectively (Henry and Lyle 2003). The Southeast Australian Shelf
LME contains a number of cities and ports, including Melbourne. Industry, shipping and
tourism are major economic activities. There is offshore oil and gas off the Victoria coast.
Marine and coastal-based tourism is important in this LME, both in terms of domestic and
international tourism.
V. Governance
The Southeast Australian Shelf LME lies off the coast of four Australian States: New
South Wales, Victoria, Tasmania and South Australia. The main governance issues of
this LME pertain to industrial and agricultural degradation of the water quality, fisheries
management and to the establishment of marine reserves. Fisheries are managed by
either State or Commonwealth agencies. Most of the states manage the fisheries out to
5.5 km offshore and the Commonwealth manages fisheries beyond this zone. Several
fisheries that are within the 5.5 km zone are managed by the Commonwealth (e.g. small
pelagics) and other outside this limit by the State (eg. giant crab). Some fisheries have
both Commonwealth and State zones (e.g. scallops). Most of the valuable fisheries in
the region are managed under output controls and many have seen substantial rebuilding
of legal sized biomass since the introduction of quota management systems. The less
valuable fisheries tend to be managed through input controls that restrict effort. These
include gear limits and seasonal and regional closures. Both State and Commonwealth
fishiers have established management advisory committees that usually involve industry,
managers and research providers in the co-management of the resource. See the
North Australian Shelf LME (Chapter VIII) for more information on fisheries management.
Coastal marine reserves are managed by Conservation agencies in most States whereas
offshore marine reserves are managed by the Australian Department of Environment,
Water and Heritage.
References
Anon. 2008A. Fishery Status review: Small Pelagics Fishery, affashop.gov.au/
PdfFiles/17_fsr06_spf.pdf)
Anon. 2008b.http://www.environment.gov.au/coasts/mbp/publications/south-east/se-fisheries.html
ANRDL. Australian Natural Resources Data Library [and the Bureau of Rural Sciences] at
http://asdd.ga.gov.au/tech/node/brs-4.html
Atlas of Australian Marine Fishing and Coastal Communities at http://adl.brs.gov.au/mapserv/
fishcoast/south_ eastern_region html
Australia Land and Natural Resources Audit results for water quality in South Australia at
www.epa.sa.gov.au/water_threatened.html
Australian Government; Department of Agriculture, Fisheries and Forestry; Bureau of Rural
Sciences; Marine Matters: Australian Marine Fishing and Coastal Communities at
http://adl.brs.gov.au/mapserv/fishcoast /south_eastern_region.html.
378
21. Southeast Australian Shelf LME
PG Baines, RJ Edwards and CB Fandry 1983. Observations of a new baroclinic current along the
western continental slope of Bass Strait. Australian Journal of Marine and Freshwater
Research 34(1) 155 - 157
Belkin, I. M., and P. C. Cornillon (2003) SST fronts of the Pacific coastal and marginal seas. Pacific
Oceanography 1(2):90-113.
Belkin, I.M., Cornillon, P.C., and Sherman, K. (2008) Fronts in large marine ecosystems of the
world's oceans: An atlas. Progress in Oceanography, submitted.
Butler E, Althaus, Furlani DM, Ridgeway (2002) Assessment of the conservation values of the
Bonney upwelling area.
Cirano M, Middleton JF (2004) The mean wintertime circulation along Australia's southern shelves:
a numerical study. J. Phys. Oceanogr. 34, 668-684.
Clementson, Harris, Griffiths and Rimmer (1989). Seasonal and inter-annual variability in chemical
and biological parameters in Storm Bay, Tasmania. 1. Physics, chemistry and the biomass of
components of the food chain. AJMRF. 40:25-38.
Cresswell GR, Peterson JL (1993) The Leeuwin Current of Western Australia. Aust. J. Mar.
Freshw. 44, 285-303.
CSIRO Center for Introduced Marine Pests at www.marine.csiro.au/crimp/.
CSIRO Marine and Atmospheric Research (2004) SE Australian waters report and circulation map
available online at www.srfme.org.au/news/mar04.htm.
Furnas, M.J. (1995). Land-sea interactions and oceanographic processes affecting the nutrient
dynamics and productivity of Australian marine ecosystems. www.ea.gov.au/coasts/
publications/somer/annex1/land-sea.html#HDR7
Godfrey JS, Vaudrey DJ, Hahn SD (1986) Observations of the shelf-edge current south of
Australia. J. Phys. Oceanogr. 16, 668-679.
Haddon, M and Gardner, C (2008). Rock lobster fishery assessment. 21(3):29-30.
Harris, Davies, Nunez and Meyers (1988) Interannual variability in climate and fisheries in
Tasmania. Nature 333: 754-757.
Harris, Griffiths, Clementson, Lyne and Van der Doe (1991). Seasonal and interannual variability in
physical processes, nutrient cycling and the structure of the food chain in Tasmanian shelf
waters. Journal of Plankton Research 13: 109-131.
Henry, G.W., and Lyle, J.M. (2003). The national Recreational and Indigenous Fishing Surveys.
NSW Fisheries Final report Series No. 48. 188pp.
Jenkins, G.P., 2005. Influence of climate on the fishery recruitment of a temperate, seagrass-
associated fish, the King George whiting Sillaginodes punctata. Marine Ecology-Progress
Series, 288: 263-271.
Love G. 2004. Key economic issues facing marine based industries in the south east marine
region, ABARE report for NOO, Canberra July 2004 www.environment.gov.au/
coasts/mbp/publications/south-east/se-economic.html
Ling, S.D., Johnson, C.R., Frusher, S.D. and King, C.K. (2008). Reproductive potential of a marine
ecosystem engineer at the edge of a newly expanded range. Global Change Biology. 14: 907-
915.
Ling, S.D. (2008) Range expansion of a habitat-modifying species leads to loss of taxonomic
diversity: a new and impoverished reef state. Oecologia 156:883894
Middleton, J. F., and M. Cirano (2002), A northern boundary current along Australia's southern
shelves: The Flinders Current, J. Geophys. Res., 107(C9), 3129, doi:10.1029/2000JC000701.
Middleton JF, Platov G (2005) Hydrodynamic model of the Great Australian Bight. In 'Tropho-
dynamics of the GAB: Assessing the need for an ecological al ocation in the SA Pilchard
fishery'. (Eds T Ward, SD Goldsworthy, BC Page) pp. 51-99. (SARDI FRDC Report 2003/072:
Adelaide).
Middleton JF and JAT Bye. 2007 A review of the shelf-slope circulation along Australia's southern
shelves: Cape Leeuwin to Portland. Progress in Oceanography 75: 1-41
Morgan, J. (1989). Large Marine Ecosystems in the Pacific Ocean, p 377-394 in: Sherman, K. and
Alexander, L.M. (eds), Biomass Yields and Geography of Large Marine Ecosystems. AAAS
Selected Symposium 111. Westview Press, Boulder, U.S.
Pauly, D. and Christensen, V. (1995). Primary production required to sustain global fisheries.
Nature 374: 255-257.
Pauly, D. and Watson, R. (2005). Background and interpretation of the `Marine Trophic Index' as a
measure of biodiversity. Philosophical Transactions of the Royal Society: Biological Sciences
360: 415-423.
Pauly, D., Christensen, V., Dalsgaard, J., Froese R. and Torres, F.C. Jr. (1998). Fishing down
marine food webs. Science 279: 860-863.
IX South Pacific
379
Pogonoski, J.J., Pollard, D.A. and Paxton, J.R. (2002). Conservation overview and action plan for
Australian threatened and potentially threatened marine and estuarine fishes. Environment
Australia at www.deh.gov.au/coasts/publications/marine-fishaction/index.html
Ridgway, K. R. (2007) Long-term trend and decadal variability of the southward penetration of the
East Australian Current, Geophysical Research Letters,
34, L13613,
doi:10.1029/2007GL030393.
Sea Around Us (2007). A Global Database on Marine Fisheries and Ecosystems. Fisheries Centre,
University British Columbia, Vancouver, Canada. www.seaaroundus.org/lme/Summary
Info.aspx?LME=42
UNEP (2003). Wilkinson, C., Reichelt, R., DeVantier, L. and Lawrence, D. Great Australian Bight
and Murray Darling Basin. GIWA Regional Assessment 61. University of Kalmar, Kalmar,
Sweden.
380
21. Southeast Australian Shelf LME