
THE UNEP
LARGE MARINE ECOSYSTEMS
REPORT
A PERSPECTIVE ON CHANGING CONDITIONS IN
LMES OF THE WORLD'S REGIONAL SEAS
ii
This report may be cited as:
Sherman, K. and Hempel, G. (Editors) 2008. The UNEP Large Marine Ecosystem Report: A
perspective on changing conditions in LMEs of the world's Regional Seas. UNEP Regional Seas
Report and Studies No. 182. United Nations Environment Programme. Nairobi, Kenya.
Bound and printed in the United States
DEP/089I/HA
ISBN 978-92080702773-9

iii
A Message from the Executive Director of UNEP
The world's 64 Large Marine Ecosystems
are as much economic as they are
environmental assets contributing around
12 trillion dollars annually to the global
economy.
Increasingly the management of these
assets is beginning to reflect that
importance. Combined efforts among
coastal countries in Africa, Asia, Latin
America, and eastern Europe are now contributing to assessment and
management actions aimed at tackling coastal pollution, restoration of degraded
habitats, and recovery of depleted fish stocks.
They have been joined by United Nations agencies, the Global Environment
Facility, and a growing number of northern hemisphere countries and principle
stakeholders in fish and fisheries, coastal transportation, tourism, gas and oil
production, and diamond and mineral extraction operations.
The effort to reverse the degraded status of LMEs will take time, well-focused
and creative policies and funding. However it is clear that with the financial
assistance of the GEF and in partnership with the UN the effort has begun,
especially among the economically developing nations.
The work reflects the targets put forward at the World Summit on Sustainable
Development in Johannesburg in 2002 to achieve substantial reductions in land-
based sources of pollution; introduce an ecosystems approach to marine
resource assessment and management by 2010; designate a network of marine
protected areas by 2012 and restore and maintain fish stocks to maximum
sustainable yield levels by 2015. UNEP is among several agencies and donors
assisting developing countries to achieve these targets.
Climate change adds new urgency to this effort. Indeed the original findings in
this report have been up-dated to reflect new findings showing that in many of
the LMEs warming is proceeding at two to three times the global rate. Some of
this most rapid warming is being witnessed in northeastern North Atlantic and
around Europe and in the East Asian seas.
Pollution, such as high levels of nutrients coming from the land and the air, may
be aggravating the effect. So we must not only secure a deep and decisive
climate regime post 2012 but also tackle the wider sustainability issues to ensure
the abundant productivity of not only LMEs but the Regional Seas and oceans in
general for this and future generations.
Achim Steiner,UN Under-Secretary General and UNEP Executive Director
iv

v
A Message from the Chief Executive Officer, GEF
We live on the land yet we often forget the sea.
We forget that 70% of our planet is made up of
coastal and marine ecosystems and that our
coastal economies depend on these ecosystems
to generate sustainable communities.
Many do not know that more than half of the
carbon sequestered on the planet is attributed to
marine ecosystems; our planet's temperature is
regulated by the oceans. We take them for granted as we do the fact that
international trade in coastal and marine fisheries is a $70 billion a year business
that drives coastal economies.
While we tend to focus on a plethora of terrestrial environmental problems over
the last 35 years, we have neglected coastal and marine water pollution. The
Large Marine Ecosystems (LMEs) of our planet that span the continental shelves
and enclosed marine waters are warming, over-fished, and becoming ever more
degraded with nitrogen.
This book represents the first attempt at establishing the baseline environmental
conditions of the world's LMEs and comes from a partnership among the United
Nations Environment Programme, the U.S. National Oceanic and Atmospheric
Administration, the Intergovernmental Oceanographic Commission of UNESCO,
and the Global Environment Facility. Eighty percent of marine capture fisheries
are taken in these LMEs where billions of people reside in coastal areas.
The satellite-based time series of warming of LMEs presented in this baseline
assessment presents a stark picture. The trend of over-fishing of valuable and
less desirable species of fish based on many decades of data from the Food and
Agriculture Organization and the University of British Columbia's Sea Around Us
Project shows vast depletion of species in many LMEs to the point of
overexploitation and collapse. The authors also found there is an increased
trend expected for nitrogen pollution from land-based sources--this promises to
create more dead zones of oxygen depletion and hazardous algal blooms that
threaten human, ecosystem, and economic health.
We at the Global Environment Facility hope that the release of this global
assessment will call attention to the degraded state of many coasts and marine
waters as well as the high risk that human behavior is placing on loss of perhaps
trillions of dollars of annual goods and services. We need to stop taking these
precious resources for granted.
Monique Barbut, CEO Global Environment Facility
vi


vii
The UNEP
Large Marine Ecosystems
Report
A Perspective on Changing Conditions in LMEs of
the World's Regional Seas
Edited by
Kenneth Sherman
Director, Narragansett Laboratory and Office of Marine Ecosystem Studies,
NOAA-NMFS, Northeast Fisheries Science Center
Narragansett, Rhode Island, USA
Adjunct Professor of Oceanography, Graduate School of Oceanography
University of Rhode Island, Narragansett, RI, USA
Adjunct Professor, School of Marine Science and Technology, University of
Massachusetts, Dartmouth.
Gotthilf Hempel
Science Advisor, Senate of Bremen, Germany
Professor emeritus, Bremen and Kiel Universities
Director, Alfred-Wegener Institute for Polar and Marine Research, Bremerhaven
until 1992
Director, Center for Tropical Marine Ecology, Bremen until 2000
Director, Institute for Baltic Research, Rostock until 1997
viii
ix
Preface
The world's coastal ocean waters continue to be degraded by unsustainable fishing
practices, habitat degradation, eutrophication, toxic pollution, aerosol contamination, and
emerging diseases. Against this background is a growing recognition among world
leaders that positive actions are required on the part of governments and civil society to
redress global environmental and resource degradation with actions to recover depleted
fish populations, restore degraded habitats and reduce coastal pollution. No single
international organization has been empowered to monitor and assess the changing
states of coastal ecosystems on a global scale, and to reconcile the needs of individual
nations to those of the community of nations for taking appropriate mitigation and
management actions. However, the World Summit on Sustainable Development
convened in Johannesburg in 2002 recognized the importance for coastal nations to
move more expeditiously toward sustainable development and use of ocean resources.
Participating world leaders agreed to pursue 4 marine targets: (i) to achieve substantial
reductions in land-based sources of pollution by 2006; (ii) to introduce an ecosystems
approach to marine resource assessment and management by 2010; (iii) to designate a
network of marine protected areas by 2012; and (iv) to maintain and restore fish stocks to
maximum sustainable yield levels by 2015. At present, 110 developing countries are
moving toward these targets in joint international projects supported, in part, by financial
grants by the Global Environment Facility (GEF) in partnership with scientific and
technical assistance from UN partner agencies, donor countries and institutions, and non-
governmental organizations including the World Conservation Union (IUCN). Many of
these projects are linked to ecosystem-based initiatives underway in Europe and North
America.
This report is a result of a collaborative effort to promote a global view of conditions within
LMEs across the North-South divide. It was generously coordinated by UNEP Regional
Seas Programme, and the Global Programme of Action for the Protection of the Marine
Environment from Land-based Activities (GPA Coordination Office) in The Hague,
Netherlands. In summer 2005 it was agreed that UNEP, in partnership with the GEF-
supported Global International Waters Assessment (GIWA) project, and NOAA's Large
Marine Ecosystem Program, would provide synopses of ecological conditions for each of
the worlds' Large Marine Ecosystems (LMEs). In accordance with the outcome of a
series of consultations among the three parties, it was concluded that the five-module
LME assessment framework of productivity, fish and fisheries, pollution and ecosystem
health, socioeconomics, and governance, would provide a useful basis for describing
ecological conditions within the world's LMEs.
The synopses are relatively brief for the LMEs adjacent to the more economically
developed countries where ecological conditions are fairly well documented by
periodically released reports, published in print or electronically, on various sectoral
interests including: fisheries, pollution, habitats, tourism, shipping, oil and gas production
and mineral extraction. Sources for this summary information are provided for the
reader. Whereas, for the LMEs bordering countries less economically developed in
Africa, Asia, and Latin America, the synopses are longer. They are based on information
collected through GIWA and the GEF-LME project planning and implementation process
using information that would otherwise not be readily available in the published marine
assessment and management literature. The synopses were prepared by two principal
authors, Dr. Sherry Heileman and Dr. Marie Christine Aquarone. For several LME
synopses, where one or more of the peer reviewers added substantially to the description
of ecological conditions, they are listed as co-authors of the synthesis. Each of the 64
x
synopses of ecological conditions includes standardized information on productivity
(gCm-2y-1), ocean fronts, multi-decadal time series of trends in annual fishery yields, and
changes in mean annual trophic levels of fish catch, as well as data on the physical
extent (km2) of LMEs, the presence of sea mounts, coral reefs and linked rivers,
watersheds and estuaries.
Chapters I, through XVIII describe conditions of LMEs within the Regional Seas areas,
followed by chapter XIX on the LMEs bordering Regional Seas areas. Three generic
issues recur in the synopses: (1) the issue of encroachment of industrial fisheries into
near coastal community based fisheries in Africa, Asia, and Latin America, and the need
for application of the precautionary principle to protect the food security and livelihood of
coastal communities; (2) the need for improved forecasting of climate driven events
affecting LME resources, especially during present extensive global climate change, and
(3) the global scale increasing frequency and extent of eutrophication stress on
ecosystem integrity and health. Examples of these issues are included in the
introductory chapter.
The substantial contribution in start-up funding by the GEF to 110 developing countries is
enabling a global effort to go forward in initiating movement in Asia, Africa, and Latin
America towards the WSSD marine targets. Although the way ahead is costly, a
concerted and focused effort has been initiated. Within the context of the baseline
initiated in this report, UNEP in partnership with other actors in the conservation and
management of the marine and coastal environment will aim at measuring progress
regularly through further editions of this report or through contributing to other reports
such as the Global Marine Assessment (GMA).
The Editors
xi
Acknowledgments
Preparation of this initial report on the ecological conditions of the LMEs in the Regional
Seas has been a collaborative effort. We are greatly indebted to the GEF-LME
Programme Managers for their pioneering contributions to the LME assessment and
management process and their willingness to take the time from busy schedules to
provide reviews of the LME descriptions in this report. Special appreciation is extended
to: Andrew Cooke (Canary Current LME), Gerardo Gold-Bouchot (Gulf of Mexico LME),
Chidi Ibe (Guinea Current LME), Yihang Jiang, Qisheng Tang and Hyung Tack Huh
(Yellow Sea LME), Robin Mahon (Caribbean Sea LME), Jan Thulin (Baltic Sea LME),
and Michael O'Toole (Benguela Current LME).
The GEF had tasked the Global International Waters Assessment (GIWA) to identify the
ecological conditions of the GEF-eligible LMEs, thereby allowing, on the basis of these
assessments, the GEF to prioritize the activities or areas needing more financial,
scientific and technical support. The reports on the ecological condition for 34 LMEs, for
which bordering countries are eligible for GEF financial support, were prepared by Dr.
Sherry Heileman, marine and fisheries biologist, Paris, France. We are indebted to Dr.
Heileman for her carefully prepared reports. We are indebted to Dr. Marie Christine
Aquarone for her expert synthesis of ecological conditions in the 30 LMEs bordering the
more economically advanced countries. We are indebted as well to Dr. Sara Adams,
Technical Editor, for recent updates to LME descriptions and for extraordinary care and
expertise in producing this volume for publication.
The following experts gave much of their time, effort, and considerable expertise to
review the LME reports in Africa, Asia, Latin America and eastern Europe: Dr. Johann
Augustyn (South Africa), Dr. Andrew Bakun (USA), Dr. Ratana Chuenpagdee (Nova
Scotia), Dr. Andrew Cooke (Senegal), Brian Crawford (South Africa), Dr. Werner Ekau
(Germany), Dr. Li Haiqing (China), Dr. Kwame Koranteng (Kenya), Dr. Daniel Lluch
Belda (Mexico), Johann Lutjeharms (South Africa), Dr. Robin Mahon (Barbados), Dr.
Gennady G. Matishov (Russia), Dr. Laurence Mee (United Kingdom), Dr. Sunilkumar
Kolliyil Mohamed (India), Dr. Dirar Nasr (Saudi Arabia), Dr. Michael O'Toole (Namibia),
Dr. Nancy Rabalais (USA), Dr. Claude Roy (France), Rodolfo Serra (Chile), Jerker
Tamelander (Sri Lanka), Dr. Jan Thulin (Sweden), Professor Dr. Matthias Wolff
(Germany), Jiang Yihang (Korea) and Dr. Sinjae Yoo (Korea).
The LME descriptions for North America, Europe and East Asia were originally made
possible by LME experts who prepared syntheses of ecosystem productivity, fish and
fisheries, pollution and ecosystem health, socioeconomics, and governance that have
been published in the 14 LME volumes. These experts include P. Cury, S. J. Heymans,
P. Hoagland, S. Levin, P.A. Livingston, J.M. McGlade, J.E. Overland, J. Rice, V.
Shannon, H. R. Skjoldal, Q. Tang, and K.C.T. Zwanenburg.
We thank Dr. Daniel Pauly and other members of the Sea Around Us Project (Fisheries
Centre, University of British Columbia, Vancouver, Canada, for contributing graphs of
fisheries catch time series and related statistics for each of the LMEs covered here, and
embedding these graphs and their explanatory text into the LME descriptions.
Finally, we acknowledge with gratitude the support and encouragement of Dr. Veerle
Vandeweerd, former coordinator of UNEP/GPA and Head of the Regional Seas Program
in the Hague, and Anjan Datta, Officer in Charge of the UNEP/GPA Coordination Office,
Nairobi, Kenya, and Annie Muchai of UNEP, Nairobi, Kenya
The Editors
xii
xiii
Expert Reviewers
I West and Central Africa
Michael J. O'Toole (Namibia and Ireland); Johann Augustyn (SouthAfrica);
Johann R.E. Lutjeharms (South Africa); Kim Prochazka (South Africa);
Chidi Ibe (Nigeria); Julius Wellens-Mensah (Ghana); Jean Folack (Cameroon); Bradford
Brown (USA); Andrew Cooke (Senegal); Claude Roy (France); Merete Tandstad (Italy);
Tayaa Mhammed (Morocco)
II Eastern Africa
Lucy E.P. Scott (South Africa); Johann R.E. Lutjeharms (South Africa); Chris Magadza
(Zimbabwe); Renison K. Ruwa (Kenya)
III Red Sea and Gulf of Aden
Khulood Tubaishat (Saudi Arabia); Dirar Nasr (Saudi Arabia); David Aubrey (USA)
IV Mediterranean
Paul Mifsud (Athens)
V Black Sea
Yegor Volovik (Turkey); William Parr (Turkey); Felix Stolberg (Ukraine)
VI ROPME Sea Area
Peyman Eghtesadi-Araghi (Iran); Najah T. Mistafa (Sweden)
VII South Asian Seas
Simon Funge-Smith (Rome); Gabriella Bianchi (Rome)
VIII East Asian Seas
Ratana Chuenpagdee (Canada); Clive Wilkinson (Australia)); Miles Furnas, (Australia);
David Souter (Australia); John Keesing (Australia); Tennille Irvine (Australia);
Nick D'Adamo, (Australia)
IX South Pacific
Iain Suthers (Australia); M.E. Baird (Australia); Janet Bradford-Grieve (New Zealand);
Jon Brodie (Australia); Stewart Frusher (Australia)
X North West Pacific
Qisheng Tang (P.R. China); Jing Zhang (P.R. China); Igor Belkin (U.S.A);
Arkady V. Alekseev (Russia); Yihang Jiang (Republic of Korea);
Teng Seng-Keh (P.R. China)
XI Arctic
Gennady Matashov (Russia); Igor Belkin (USA); NMFS, Alaska Fisheries Science
Center (AFSC), U.S.A.; Alla Tsyban (Russia); Natalia Golubeva (Russia);
Mogens Dyhr-Nielsen (Russia)
XII Baltic Sea
Jan Thulin (Denmark); Ain L��ne (Estonia)
xiv
XIII North East Atlantic
Hein Rune Skjoldal (Norway); Natalia Golubeva (Russia); Luis Vald�s (Spain);
Michael J. O'Toole (Ireland); Eilif Gaard (Faroe Islands); Ditte Mickelsson (Greenland);
Thomas Juul Pedersen (Greenland); �lafur S. �st��rsson (Iceland)
XIV North East Pacific
NMFS, Northwest Fisheries Science Center (USA); Igor Belkin (USA);
NMFS, Alaska Fisheries Science Center (AFSC; Daniel Lluch Belda (Mexico);
Edgar Arias Patron (Mexico)
XV Wider Caribbean
Robin Mahon (Barbados); NMFS, Southeast Fisheries Science Center (SEFC) (USA);
Nancy Rabelais (USA)
XVI South West Atlantic
Igor Belkin (USA); Marcia Marques (Brazil); Maria Gasalla (Brazil);
Ana Mugetti (Argentina)
XVII South East Pacific LME
Renato Guevara (Per�); Francisco Chavez (USA); Arnau Bertrand (France);
Adm. Hector Soldi (Per�); Ulises Munaylla Alarc�n (Ecuador)
XVIII Antarctic
NMFS Southwest Fisheries Center (USA)
XIX LMEs Outside Regional Sea Areas
Ditte Mickelsson (Greenland); Thomas Juul Pedersen (Greenland); Igor Belkin (USA);
Kees C.T. Zwanenburg (Canada); Robert Siron (Canada);
NMFS Pacific Island Fishery Center (USA); John Keesing (Australia);
Tennille Irvine (Australia); Nick D'Adamo (Australia)
xv
Contents
Message from the Executive Director of UNEP
iii
Message from the Executive Director of GEF
v
Preface
ix
Acknowledgments xi
Expert Peer Reviewers
xiii
Contents
xv
BACKGROUND REPORTS
1
Perspectives on Regional Seas and the Large Marine Ecosystem Approach
3
K. Sherman and G. Hempel
Fisheries in Large Marine Ecosystems: Descriptions
and Diagnoses
23
D. Pauly, J. Alder, S. Booth, W.W.L. Cheung, C. Close, U.R. Sumaila, W. Swartz,
A. Tavakolie, R. Watson, L. Wood and D. Zeller
Accelerated Warming and Emergent trends in Fisheries Biomass Yields of the
World's Large marine Ecosystems
41
K. Sherman, I. Belkin, K. Friedland, J. O'Reilly, K. Hyde
Land-Based Sources of Nutrients to Large marine Ecosystems
81
S. Seitzinger and R. Lee
LMEs and REGIONAL SEAS
99
I West and Central Africa
101
1. Benguela Current LME
103
2. Guinea Current LME
117
3. Canary Current LME
131
II Eastern Africa
143
4. Agulhas Current LME
145
5. Somali Current LME
159
III Red Sea and Gulf of Aden
173
6. Red Sea LME
175
IV Mediterranean
187
7. Mediterranean Sea LME
189
V Black Sea
201
8. Black Sea LME
203
VI ROPME Sea Area
219
9. Arabian Sea LME
221
xvi
VII South Asian Seas
235
10. Bay of Bengal LME
237
VIII East Asian Seas
253
11. Gulf of Thailand LME
255
12. Indonesian Sea LME
269
13. North Australia LME
281
14. Northwest Australia LME
289
15. South China Sea LME
297
16. Sulu Celebes Sea LME
309
17. West-Central Australia LME
321
IX Pacific (SPREP)
337
18. East-Central Australia LME
339
19. New Zealand Shelf LME
349
20. Northeast Australia LME
359
21. Southeast Australia LME
369
X North-West Pacific
381
22. East China Sea LME
383
23. Kuroshio Current LME
393
24. Oyashio Current LME
403
25. Sea of Japan/ East Sea LME
413
26. Sea of Okhotsk LME
423
27. West Bering Sea LME
433
28. Yellow Sea LME
441
XI Arctic
453
29. Arctic Ocean LME
455
30. Beaufort Sea LME
463
31. Chukchi Sea LME
469
32. East Siberian Sea LME
477
33. Kara Sea LME
483
34. Laptev Sea LME
491
XII Baltic Sea
497
35. Baltic Sea LME
499
XIII North-East Atlantic
511
36. Barents Sea LME
513
37. Celtic-Biscay Shelf LME
527
38. Faroe Plateau LME
535
39. Greenland Sea LME
545
40. Iberian Coastal LME
553
41. Iceland-Shelf LME
563
42. North Sea LME
573
43. Norwegian Sea LME
581
XIV The North-East Pacific
591
44. California Current LME
593
45. East Bering Sea LME
605
46. Gulf of Alaska LME
617
47. Gulf of California LME
627
48. Pacific Central-American LME
643
xvii
XV Wider Caribbean
655
49. Caribbean Sea LME
657
50. Gulf of Mexico LME
673
51. Southeast U.S. Continental Shelf LME
689
XVI South-West Atlantic
699
52. North Brazil Shelf LME
701
53. East Brazil Shelf LME
711
54. Patagonian Shelf LME
723
55. South Brazil Shelf LME
735
XVII South-East Pacific
747
56. Humboldt Current LME
749
XVIII Antarctic
763
57. Antarctic LME
765
XIX LMEs Outside Regional Sea Areas
775
58. West Greenland Shelf LME
777
59. Hudson Bay LME
787
60. Insular Pacific-Hawaiian LME
795
61. Newfoundland-Labrador Shelf LME
805
62. Northeast U.S. Continental Shelf LME
817
63. Scotian Shelf LME
829
64. Southwest Australia LME
839
xviii
BACKGROUND REPORTS
2 Background
Reports
Perspectives on Regional Seas and the Large
Marine Ecosystem Approach
K. Sherman and G. Hempel
UNEP REGIONAL SEAS PROGRAMME LINKS WITH LARGE MARINE
ECOSYSTEMS ASSESSMENT AND MANAGEMENT
A new partnership has been developed that links the coastal and marine activities of the
global Regional Seas Programme (RSP), coordinated by the United Nations Environment
Programme (UNEP), with the Large Marine Ecosystem (LME) approach to the
assessment and management of living marine resources and environments. The joint
initiative assists developing countries in using LMEs as operational units for translating
the Regional Seas Programme into concrete actions. With substantial support in over
one billion dollars in financial grants from the Global Environment Facility (GEF) and
investment funds from the World Bank in partnership with other UN agencies and
government and industrial donors, countries in Africa, Asia, the Pacific, Latin America
and the Caribbean, and Eastern Europe are presently engaged in LME assessment and
management projects that implement actions to restore and sustain living marine
resources in coastal waters.
THE LARGE MARINE ECOSYSTEM APPROACH
The LME approach to the assessment and management of marine resources and their
environments was first introduced at an international symposium convened at the annual
meeting of the American Association for the Advancement of Science, in 1984. At the
outset, it was understood that the LME approach would provide a framework for utilizing
ecologically defined Large Marine Ecosystems as place-based areas around the globe, to
focus the methods of marine science, policy, law, economics and governance on a
common strategy for assessing, managing, recovering, and sustaining marine resources
and their environments (Sherman and Alexander 1986).
There are two important features in the LME approach. First and foremost, the
physical extent of the LME and its boundaries are based on 4 linked ecological
rather than political or economic criteria. These are: (i) bathymetry, (ii)
hydrography, (iii) productivity, and (iv) trophic relationships. It is the bathymetry or
bottom topography that greatly influences water column structure and flow. Within the
water column, the nutrient flux, vertical circulation and advective processes determine to
a large extent the levels of primary productivity of the phytoplankton of the LME--
productivity that is a determinant of zooplankton biomass and species composition
(biodiversity), and subsequent energy-flow (trophodynamics), from plankton to fish and
shellfish to marine birds and marine mammals, through the food web of the LME. Based
on the 4 ecological criteria, 64 distinct LMEs have been delineated around the coastal
margins of the Atlantic, Pacific, and Indian Oceans (Figures 1a and 1b).
Frontal maps and quantitative assessments of the sea surface temperature (SST) and
temperature anomalies for each of these LMEs are provided by Dr. Igor Belkin. SST was
selected as the only thermal parameter routinely measured worldwide that can be used to
characterize thermal conditions in each and every LME. Subsurface hydrographic data,
albeit important, lack spatial and temporal density required for reliable assessment of
thermal conditions at the LME scale worldwide.


4
K. Sherman and G. Hempel
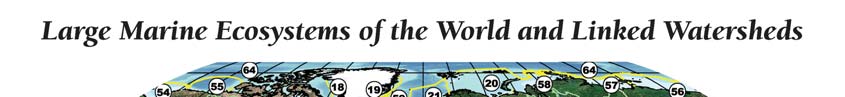
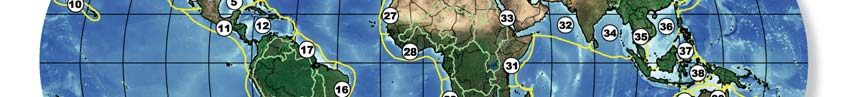
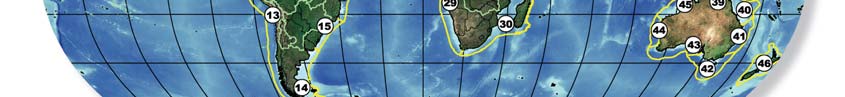
Figure 1a. Map showing 64 Large Marine Ecosystems of the world. LMEs in this map are numbered as
they are on the LME website, www.lme.noaa.gov.
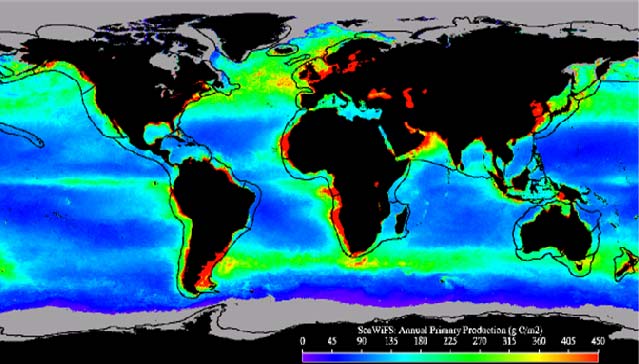
Figure 1b. Global map of average primary productivity and the boundaries of the 64 Large Marine
Ecosystems (LMEs) of the world, available at www.lme.noaa.gov. The annual productivity estimates are
based on Sea WiFS satellite data collected between September 1998 and August 1999, and the model
developed by M. Behrenfeld and P.G. Falkowski (Limnol. Oceangr. 42(1): 1997, 1-20). The color-
enhanced image provided by Rutgers University depicts a shaded gradient of primary productivity from
a high of 450 gCm-2yr-1 to a low of 10gCm-2y-1.
Regional Seas and Large Marine Ecosystems
5
All LMEs are relatively large areas of ocean space, of approximately 200,000 km2 or
greater, adjacent to the continents in coastal waters where primary productivity is
generally higher than in open ocean areas. It is within the boundaries of the LMEs that
80% of the world's annual marine fish catch is produced, degraded habitats are most
prevalent and the frequency and effects of pollution and eutrophication of ocean waters
are most severe. The LMEs are also centers of marine gas and oil production; mining for
sand, gravel, diamonds and other extractive minerals; coastal shipping; and tourism.
A second important feature of the LME approach is the use of a 5-module strategy
for measuring the changing states of the ecosystem and for taking remedial
actions toward recovery and sustainability of degraded resources and
environments. From a management perspective it is essential to establish a baseline
condition against which to measure the success or failure of management actions
directed toward recovery of degraded conditions within the LMEs. The 5 modules are
focused on the application of suites of indicators measuring LME (1) productivity, (2) fish
and fisheries, (3) pollution and ecosystem health, (4) socio-economics, and (5)
governance.
LMES AND THE UNEP REGIONAL SEAS PROGRAMME
Since 1984, the LME approach has matured into the planning and implementation
activities of 16 projects in 110 countries bordering on LMEs in Africa, Asia, Latin America
and countries in economic transition in eastern Europe (Sherman et al. 2007). The
projects are country driven, wherein the direction and priorities of assessment and
management actions are "driven" by nations sharing the transboundary goods and
services of the LMEs.
There is a growing body of peer-reviewed published reports on the application of the LME
approach to the assessment and management of marine resources. As of 2006, the
American Association for the Advancement of Science, Westview Press, Blackwell
Science, and Elsevier Science have published a total of fourteen peer-reviewed volumes
with contributions by 445 authors (www.noaa.lme.gov).
The LME approach is a way forward for advancing ecosystem-based management of
coastal and marine resources within a framework of sustainable development. Country-
driven GEF-LME assessment and management projects are linked to the WSSD Plan of
Implementation and to the global Regional Seas Programme, coordinated by UNEP. The
descriptions in this report of the general ecological conditions of the LMEs, with regard to
their productivity, fish and fisheries, pollution and ecosystem health, socioeconomics and
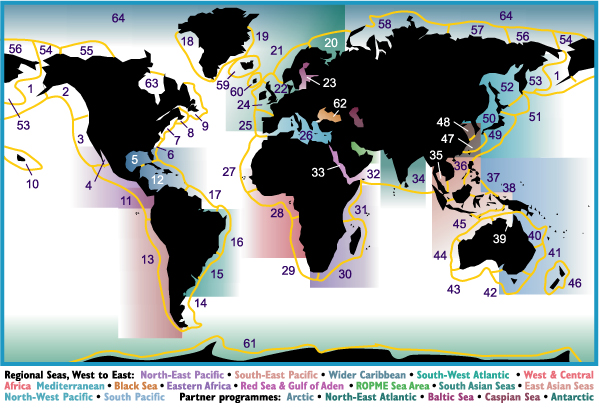
governance, are arranged in accordance with the Regional Seas designations (Figure 2).
Regional Seas, LMEs and the 2002 World Summit on Sustainable Development
In December 2004, at the 6th Global Meeting of the Regional Seas Conventions and
Action Plans, new strategic directions were adopted, in order to strengthen the Regional
Seas Programme at the global level and address evolving challenges and priorities, while
continuing to implement the individual work programmes of the Conventions and Action
Plan secretariats. One of the directions calls to "Develop and promote a common
vision and integrated management, based on ecosystem approaches, of priorities
and concerns related to the coastal and marine environment and its resources in
Regional Seas Conventions and Action Plans, introducing amongst others
proactive, creative and innovative partnerships and networks and effective
communication strategies." In 1982, UNEP began to address issues related to
impacts on the marine environment from land-based activities. Some 80% of the
6
K. Sherman and G. Hempel
pollution load in the oceans originates from land-based activities (municipal, industrial
and agricultural wastes, run-off, and atmospheric deposition). These contaminants affect
the most productive areas of the marine environment, including estuaries and near-shore
coastal waters.
Figure 2. Regional Seas map with boundaries (in yellow) of the 64 Large Marine Ecosystems. Numbers
correspond to the LME map numbers for the 64 LMEs.
The health and, in some cases, the very survival of coastal populations depend upon the
health and well being of coastal systems such as estuaries and wetlands. In response to
intense pressures put on coastal systems, 108 governments and the European
Commission adopted the 1995 Washington Declaration, to establish a Global Programme
of Action for the Protection of the Marine Environment from Land-based Activities (GPA).
To support the GPA activity, a UNEP/GPA office was established in The Hague,
Netherlands.
During the World Summit on Sustainable Development (WSSD), held in Johannesburg in
2002, participating world leaders agreed to pursue 4 marine targets: (i) to achieve
substantial reductions in land-based sources of pollution by 2006; (ii) to introduce an
ecosystems approach to marine resource assessment and management by 2010; (iii) to
designate a network of marine protected areas by 2012; and (iv) to maintain and restore
fish stocks to maximum sustainable yield levels by 2015. In an effort to encourage the
global movement toward the 4 WSSD targets, UNEP along with other partnering UN and
non-governmental organizations (NGOs), and the GEF and its partners, is assisting
developing countries in operationalizing LME projects to serve as operational and
management units for translating the legal frameworks and objectives of the Regional
Seas Programmes into concrete actions to restore, sustain, protect and manage coastal
environments and linked watersheds. Assessments of the state of most LMEs in GEF
eligible regions were carried out by the Global International Waters Assessment (GIWA)
between 2000 and 2005. The GIWA Regional Reports can be downloaded from their
website www.giwa.net/publications/.
Regional Seas and Large Marine Ecosystems
7
TRANSBOUNDARY DIAGNOSTIC ANALYSIS AND STRATEGIC ACTION PROGRAM
The GEF Operational Strategy recommends that nations sharing an LME begin to
address coastal and marine issues by jointly undertaking strategic processes for
analyzing science-based information on transboundary concerns, their root causes, and
by setting priorities for action on transboundary concerns. This process is referred to as
a Transboundary Diagnostic Analysis (TDA) and it provides a useful mechanism to foster
participation of policy makers, scientists, management experts, stakeholders, and civil
society at local, regional, national and international levels of interest. Countries then
determine the national and regional policy, legal, and institutional reforms and
investments needed to address the priorities, and based on the strategies prepare and
initiate an LME wide Strategic Action Program (SAP). This allows sound science to
assist policy making within a specific geographic location for an ecosystem-based
approach to management that can be used to engage stakeholders (Figure 3).
Figure 3. Summary of Transboundary Diagnostic Analyses (TDA) and Strategic Action Plans (SAP) for
GEF sponsored LME projects planned and underway. An additional 2 projects outside the Regional
Seas areas have completed TDAs.
In the GEF-LME projects either approved or in the preparation stage, 110 countries are
moving to meet WSSD ecosystem-related targets and to address overfishing, fishing
down food webs, destruction of habitat and accelerated nitrogen export. Countries
engaged in the TDA process have already begun to scientifically characterize the LME, to
identify the root causes of trends in LME biomass yields and the most pressing
transboundary characteristics of coastal pollution, damaged habitats and depleted fish
stocks, in order to prioritize these issues. Seven country-driven GEF-LME Projects are
advancing to the drafting of the SAP, in which the countries commit to making institutional
arrangements and taking policy actions, based on sound science, to address the issues
identified in the TDA. The SAP addresses actions to correct institutional fragmentation,
ecosystem assessment gaps, lack of cooperation and weak coastal policies and is signed
by high-level government authorities of each participating country. The strategic
framework for developing TDAs and SAPs is guided by the geographic area of LMEs and
the application of the 5-module approach to LME assessment and management.
Examples of TDA and SAP documents for the Benguela Current LME Project are
available at www.bclme.org.
These processes are critical for integrating science into management in a practical way
and for establishing appropriate governance regimes. The five modules consist of 3 that
are science-based indicators focused on: productivity, fish/fisheries, pollution/ecosystem
health; the other two, socio-economics and governance, are focused on economic
benefits to be derived from a more sustainable resource base and implementing
8
K. Sherman and G. Hempel
governance mechanisms for providing stakeholders and stewardship interests with legal
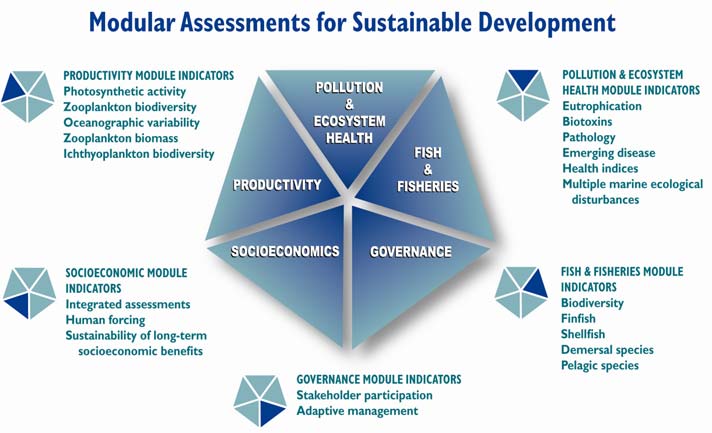
and administrative support for ecosystem-based management practices (Figure 4). The
first four modules support the TDA process while the governance module is associated
with periodic updating of the Strategic Action Program or SAP (Duda and Sherman,
2002; Wang 2004). Adaptive management regimes are encouraged through periodic
assessment processes (TDA updates) and updating of SAPs as gaps are filled.
CHANGING STATES OF THE LMES: INDICATOR MODULES
Figure 4. The Large Marine Ecosystem (LME) approach to sustainable development includes 5 modules
with indicators.
The five-module indicator approach to the assessment and management of LMEs has
proven useful in ecosystem-based projects. The modules are customized to fit the
situation within the context of the TDA process and SAP development process for the
groups of nations or states sharing an LME.
Productivity module indicators
Primary productivity can be related to the carrying capacity of an ecosystem for
supporting fish resources (Pauly & Christensen 1995). Measurements of ecosystem
productivity can be useful indicators of the growing problem of coastal eutrophication. In
several LMEs, excessive nutrient loadings to coastal waters have been related to algal
blooms implicated in mass mortalities of living resources, emergence of pathogens (e.g.,
cholera, vibrios, red tides, and paralytic shellfish toxins), and explosive growth of non-
indigenous species (Epstein 1993, Sherman 2000). The ecosystem parameters
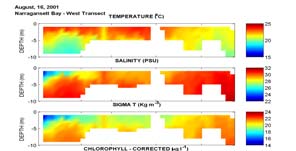
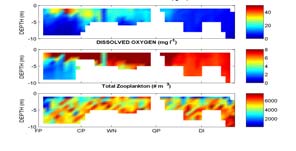
measured and used as indicators of changing conditions in the productivity module are
zooplankton biodiversity and species composition, zooplankton biomass, water-column
structure, photosynthetically active radiation, transparency, chlorophyll-a, nitrite, nitrate,
and primary production, (Aiken 1999, Berman & Sherman 2001, Melrose et al. 2006),
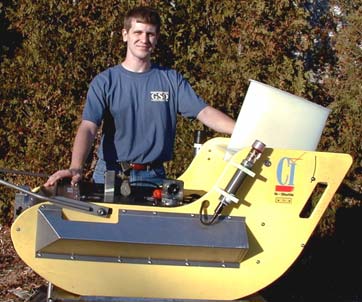
(Figure 5).
Regional Seas and Large Marine Ecosystems
9
Figure 5. A Mariner Shuttle, towed behind a ship is used to collect measurements for assessing
changing conditions of temperature, salinity, density, chlorophyll and primary productivity, oxygen and
zooplankton within LMEs.
Fish and Fisheries module indicators
Changes in biodiversity and species dominance within fish communities of LMEs have
resulted from excessive and selective exploitation, environmental shifts due to climate
change and coastal pollution. Changes in biodiversity and species dominance in a fish
community can cascade up the food web to apex predators and down the food web to
plankton and benthos components of the ecosystem.
The Fish and Fisheries Module includes both fisheries-independent bottom-trawl surveys
and pelagic-species acoustic surveys to obtain time-series information on changes in fish
biodiversity and abundance levels (Figure 6). Standardized sampling procedures, when
employed from small, calibrated trawlers, can provide important information on changes
in fish species (Sherman 1993). The fish catches on the surveys provide biological
samples for stock identification, stomach content analyses, age-growth relationships,
fecundity, and for coastal pollution monitoring, based on pathological examinations.
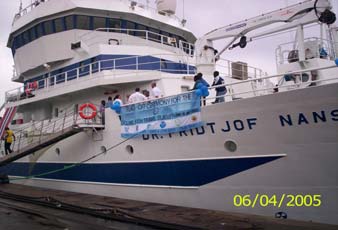
Figure 6. The Norwegian Research Vessel Dr. Fridtjof
Nansen readies to depart from Accra, Ghana on the Third
Guinea current LME Survey (June 4 � July 15, 2005) of the
fish and fisheries of the Guinea Current LME Project
(GCLME). Scientists and technicians from all of the
GCLME countries participated in this survey. The
countries represented were Angola, Benin, Cameroon,
Congo, Democratic Republic of Congo, C�te d'Ivoire,
Ghana, Equatorial Guinea, Guinea, Liberia, Nigeria, Sierra
Leone and Togo.
Fish stock demographic data are used for preparing stock assessments (NAFO 2005)
and for clarifying and quantifying multispecies trophic relationships (NAFO 2005). NOAA
Fisheries information is available at http://nft.nefsc.noaa.gov (username: nft; password:
nifty) for development of a standard suite of methods for standardizing assessment tasks.
The survey vessels can also be used as platforms for obtaining water, sediment, and
benthic samples for monitoring harmful algal blooms, diseases, anoxia, and structure of
benthic communities.
10
K. Sherman and G. Hempel
Pollution and Ecosystem Health module indicators
In semi-enclosed LMEs, pollution and eutrophication can be important driving forces of
change in biomass yields. Assessing the changing status of pollution and health of an
entire LME is scientifically challenging. Ecosystem health is a concept of wide interest for
which a single precise scientific definition is difficult. The health paradigm is based on
multiple-state comparisons of ecosystem resilience and stability, and is an evolving
concept that has been the subject of a number of meetings (Sherman 1993). To be
healthy and sustainable, an ecosystem must maintain its metabolic activity level and its
internal structure and organization, and must resist external stress over time and space
scales relevant to the ecosystem (Costanza 1992). The modules are all used to a
greater or lesser extent in the US, in ICES, and are now being introduced in the GEF-
LME Projects.
The Pollution and Ecosystem Health Module measures pollution effects on the
ecosystem through the pathobiological examination of fish, and through the estuarine and
nearshore monitoring of contaminant effects in the water column, the substrate, and
selected groups of organisms. Where possible, bioaccumulation and trophic transfer of
contaminants are assessed, and critical life history stages and selected food web
organisms are examined for indicators of exposure to, and effects from, contaminants.
Effects of impaired reproductive capacity, organ disease, and impaired growth from
contaminants are measured. Assessments are made of contaminant impacts at both
species and population levels. Implementation of protocols to assess the frequency and
effect of harmful algal blooms, emergent diseases, and multiple marine ecological
disturbances (Sherman 2000) are included in the pollution and ecosystem health module.
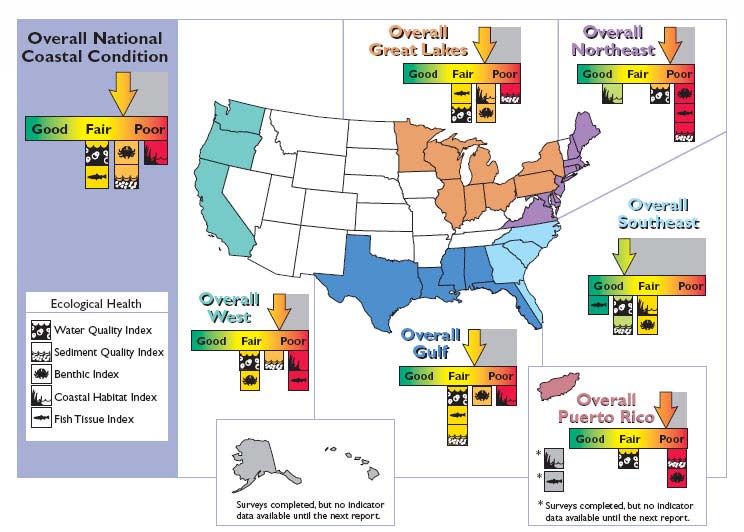
In the United States, the Environmental Protection Agency (EPA) has developed a suite
of 5 coastal condition indicators: water quality index, sediment quality index, benthic
index, coastal habitat index, and fish tissue contaminants index (Figure 7) as part of an
ongoing collaborative effort with the National Oceanic and Atmospheric Administration
(NOAA), the U.S. Fish and Wildlife Service (FWS), the U.S. Geological Survey (USGS),
and other agencies representing states and tribes.
Figure 7. The U.S. Environmental Protection Agency (EPA) 2004 indicators of coastal condition A
stoplight approach is used to indicate relative conditions: poor (red), moderate (orange) or good
(green). (National Coastal Condition Report II. 2004).
Regional Seas and Large Marine Ecosystems
11
The 2004 report, "National Coastal Condition Report II," includes results from EPA's
analyses of coastal condition indicators and NOAA's fish stock assessments by LMEs
aligned with EPA's National Coastal Assessment (NCA) regions (USEPA 2004). Several
GEF supported LME projects are adapting EPA's 5 coastal condition indicators for
assessing the health of near coastal areas of LMEs (Figure 7).
Socioeconomic module indicators
This module emphasizes the practical application of scientific findings to the
management of LMEs and the explicit integration of social and economic indicators and
analyses with all other scientific assessments to assure that prospective management
measures are cost-effective. Economists and policy analysts work closely with ecologists
and other scientists to identify and evaluate management options that are both
scientifically credible and economically practical with regard to the use of ecosystem
goods and services.
In order to respond adaptively to enhanced scientific information, socioeconomic
considerations must be closely integrated with science findings. Both the socioeconomic
and governance indicators are used in the planning and implementation actions as
summarized in Figure 8.
PLANNING ACTIONS
1. Transboundary Diagnostic Analysis (TDA) � provides
consensus priorities from analysis and ranking of water-related
resources issues, their environmental and socioeconomic impacts,
immediate and root causes and possible remedies
Integrated Ecosystem
2. Strategic Action Program (SAP) � provides national and
regional commitments to policy, legal and institutional reforms, and
Assessment and
investments to remedy root causes of priority transboundary issues
Adaptive Management
identified in TDA
IMPLEMENTATION ACTIONS
3. Ecosystem-based assessment and management strategy for
TDA and SAP
3.1 Productivity indicators and assessments
3.2 Fish and fisheries indicators and assessments
3.3 Pollution and ecosystem health indicators and assessments
3.4 Socioeconomic indicators and assessments
3.5 Governance indicators and assessments
Year 1
Year 2
Year 3
Year 4
Years 5-10
Assessments &
Assessments &
Assessments &
Toward Self-
Management
Management
Management
financing
Actions
Actions
Actions
Assessments
and adaptive
management
Figure 8. Integrated Ecosystem-based assessment and adaptive management planning actions over 10
years.
The new ecosystem accounting paradigm requires that resource managers of the
different sectors of stakeholder interests incorporate the cumulative assessments of
changing ecosystem productivity, fish and fisheries, pollution and ecosystem health and
their effects on socioeconomic conditions and governance jurisdictions, as both additive
12
K. Sherman and G. Hempel
and integrative effects on ecosystem conditions. These latter components of the LME
approach to marine resources management have recently been described as the human
dimensions of LMEs (Hennessey & Sutinen 2005). A framework has been developed by
the Department of Natural Resource Economics at the University of Rhode Island for
monitoring and assessment of the human dimensions of LMEs and for incorporating
socioeconomic considerations into an adaptive management approach for LMEs (Sutinen
et al. 2000; Juda et al. 2006, Olsen et al. 2006). One of the more critical considerations,
a method for economic valuations of LME goods and services, has been developed using
framework matrices for indexing economic activity (Sherman et al. 2005, Hoagland & Jin
2006).
Governance module indicators
The Governance Module is evolving, based on demonstration projects now underway in
several ecosystems, that are being managed from an ecosystem perspective. In LME
assessment and management projects supported by the Global Environment Facility for
the Yellow Sea, the Guinea Current, and the Benguela Current LMEs, agreements have
been reached among the several ministries in each country bordering the LMEs
(ministries responsible for ocean resources for the environment, fisheries, energy,
tourism, finance and foreign affairs, for example), to enter into joint resource assessment
and management activities as the framework for ecosystem-based management
practices. Elsewhere, the Great Barrier Reef LME and the Antarctic LME are also being
managed from an ecosystem perspective, the latter under the Commission for the
Conservation of Antarctic Marine Living Resources. Governance profiles of LMEs are
being explored to determine their utility in promoting long-term sustainability of
ecosystem resources (Juda and Hennessey 2001). In each of the LMEs, governance
jurisdiction can be scaled to ensure conformance with existing legislated mandates and
authorities. An example of multiple governance-related jurisdictions that includes areas
designated for fisheries management, pollution control and marine protected areas, is
described in Sherman et al. (2004).
Within the context of ecosystem-based management the integration of data and
information for decision making is additive and vertically integrated for the five modules,
and adaptive contingent on annual assessment findings horizontally across years. From
Year 1, the GEF supported projects move toward the goal of self-financing of the
ecosystem assessment and management process by year 10 (Figure 8).
GEF-SUPPORTED LME PROJECTS
An increasing number of countries and organizations are engaged in LME projects aimed
at moving toward the WSSD marine targets. The LME approach to the assessment and
management of marine resources and their environments is being applied with financial
assistance from GEF to developing countries who are planning and implementing LME
projects focused on introducing an ecosystem-based approach to the (1) recovery of
depleted fish stocks; (2) restoration of degraded habitats; and (3) reduction of coastal
pollution and eutrophication. GEF-LME projects are presently located in 16 LMEs that
provide goods and services in bordering countries containing over half the world's
population. These LMEs produce 46% of the world's annual marine fish catch while also
being subjected to significant eutrophication in near coastal waters. These stressors
have been identified during the TDA and SAP process. Taken together, the 16 projects
represent a significant movement toward the WSSD targets, and will be the subject of
future UNEP and partners' ecological condition reports.
Regional Seas and Large Marine Ecosystems
13
The new generation
The LME projects themselves as well as their academic, administrative and political
environment have to be scientifically and technically strong. The complexity of the
modern ecosystem oriented approach of fisheries and other marine activities calls for a
new generation of professionals addressing the sustainability issue in a much broader
sense than before. Not only do the preservation of the fish stocks and the other goods
and services of the ecosystem including the protection of marine biodiversity have to be
taken care of, but also the socio-economic development of the region. Management
goals have to be defined and defended under the pressure of conflicting ecological
interests and societal and political constraints.
On the one hand, in order to address all five modules of the LME concept, specialists are
needed like ichthyologists and oceanographers and plankton experts, fish stock
assessment biologists, sociologists, economists and experts in international law. There
is an increasing demand for reliable data sets of adequate length and resolution in space
and time to feed modern data-driven models on the medium- and long-term
consequences of various management strategies. On the other hand experienced
generalists and modelers are required to put the facts and findings together and to create
such management scenarios. Those generalists are rather rare and not easy to recruit.
Therefore, capacity development has to be continued in all parts of the world, not only in
developing countries. Much of it can now be done in the regions themselves through
mutual assistance.
To a certain extent a fair division of research work between the rich and the poorer
countries might be envisaged. Rich countries have the capacity and hence the
responsibility of advancing science in the broadest possible way in natural and social
sciences per se but also in theory and analysis of the interactions in the sustainability
triangle of environment, economy and society. Those interactions differ in structure from
region to region. Working in collaboration with colleagues and institutions in poorer parts
of the world, including developing countries with their rich and diverse perspectives, is a
win-win situation.
In a nutshell
The LME approach is the pathway towards sustainable use of marine ecosystems
provided the interaction between the various players becomes much stronger amongst
the various science sectors and between scientists and stakeholders, the general public
and the national and international administration. Partnership and communication are
required on all levels and on all geographical scales. What is lacking is not so much the
money but rather the political will and the vision of enthusiastic and competent experts on
the way to apply the LME concept for the sustainable development of the use and
conservation of the marine environment in many parts of the World Ocean.
TECHNICAL DESCRIPTION OF THE DATA SETS CONTAINED IN THIS REPORT
ECOLOGICAL INDICATORS OF LME CONDITION AND METHODOLOGY
Ocean front maps
Igor Belkin of the University of Rhode Island provided descriptions and maps of LME
oceanographic fronts for each of the 64 LMEs (Belkin et al. 2008, Belkin & Cornillon
2003). An oceanographic front is a relatively narrow zone of enhanced horizontal
gradients of physical, chemical and biological properties (e.g. temperature, salinity,
nutrients). Fronts occur on a variety of scales, from several hundred meters up to many
thousand kilometers. Some of them are short-lived, but most are quasi stationary and
14
K. Sherman and G. Hempel
seasonally persistent: they emerge and disappear at the same locations during the same
season, year after year. The temperature and salinity ranges across the strongest fronts
can be as high as 10-15 degrees C and 2 to 3 parts per thousand (ppt) salinity, although
somewhat smaller numbers, such as 5 degrees C and 1 ppt, are far more common. The
width of fronts varies widely: from less than 100 m to 200 km. Vertically, many fronts
extend several hundred meters in depth. Major fronts can extend as deep as 2,000 m.
Fronts are crucial in various processes that evolve in the ocean and at the ocean
interfaces with the atmosphere, sea ice and sea bottom. Fronts are important for climate
change monitoring and prediction, the fishing industry, pollution control, waste disposal
and hazards mitigation, marine transportation, marine mining, including the oil and gas
industry, submarine navigation and integrated coastal management.
� Fronts are associated with current jets, so that any frontal pattern represents a
circulation pattern;
� The along-frontal current jets are accountable for the bulk of water/heat/salt
transport;
� Fronts separate different water masses and spawn rings responsible for the bulk
of cross-frontal and meridional transport of water, heat and salt;
� Fronts usually coincide with major biogeographical boundaries associated with
zones of enhanced bio-productivity, including fisheries grounds;
� The surface heat fluxes, wind stress and other meteorological parameters may
differ drastically between the warm and cold sides of a front. Fronts strongly
interact with the marine atmospheric boundary layer and separate regions with
different response to atmospheric forcing, so they are crucial for weather
forecasting and climate monitoring;
� Some high-latitude fronts are directly related to sea ice conditions, so the front
locations are determined by the maximum extent of the sea ice cover;
� Fronts profoundly influence acoustic environment so that solving any sound
propagation problem requires knowledge of the fronts' locations and
characteristics;
� Ocean sedimentation regimes are largely determined by the circulation (hence
frontal) pattern, therefore the interpretation of paleo-oceanographic and
paleoclimatic information recorded in marine sediments requires a priori
knowledge of the modern frontal situation;
� Because fronts are associated with convergent currents, oceanic and riverine
pollutants can be concentrated thousands of times on fronts, thus endangering
the fish, sea birds and marine mammals that inhabit the frontal zones.
The descriptions and maps provide both textual and visual summaries of dominant frontal
patterns and principal individual fronts. The frontal schematics are annual long-term
means, based largely on a 12-year data set of frontal maps assembled at the University
of Rhode Island. They are the result of a comprehensive global analysis, based on
Pathfinder Sea Surface Temperatures. The maps show the most robust and well-defined
fronts, regardless of the seasons during which they develop and peak.
Sea Surface Temperature
The U.K. Meteorological Office Hadley Center SST climatology data was selected for its
superior resolution (1 degree latitude by 1 degree longitude globally); for the historic
reach of the data; and for its high quality. A highly detailed, research-level description of
this data set has been published by Rayner et al. (2003). The Hadley data set consists of
monthly SSTs calculated for each 1� x 1� rectangular cell (spherical trapezoid, to be
exact) between 90�N-90�S, 180�W-180�E. To calculate and visualize annual SSTs for
each LME, the annual SST for each 1� x 1� cell was calculated and the area-averaged
annual 1� x 1� SSTs within each LME. Since the square area of each trapezoidal cell is
Regional Seas and Large Marine Ecosystems
15
proportional to the cosine of the middle latitude of the given cell, all SSTs were weighted
by the cosine of the cell's middle latitude. After integration over the LME area, the
resulting sum of weighted SSTs was normalized by the sum of the weights, that is, by the
sum of the cosines. Annual anomalies of annual LME-averaged SSTs were calculated
by computing the long-term LME-averaged SST for each LME by a simple long-term
averaging of the annual area-weighted LME-averaged SSTs. Then, annual SST
anomalies were calculated by subtracting the long-term mean SST from the annual SST.
Both SST and SST anomalies were visualized using adjustable temperature scales for
each LME in order to bring out details of temporal variability that otherwise would be
hardly noticeable if a unified temperature scale were used. The resulting plots of SST
and SST anomalies are for 63 LMEs. Ice cover precludes a meaningful assessment of
the LME-averaged SST for the Arctic Ocean. John O'Reilly (NOAA) kindly provided a
data set of the LME coordinates for these processes.
Primary productivity data
The LME descriptions include primary productivity estimates derived from satellite borne
data of NOAA's Northeast Fisheries Science Center, Narragansett Laboratory. These
estimates originate from SeaWiFS (satellite-derived chlorophyll estimates from the Sea-
viewing Wide Field-of-view Sensor), Coastal Zone Color Scanner (CZCS), a large archive
of in situ near-surface chlorophyll data, and satellite sea surface temperature (SST)
measurements to quantify spatial and seasonal variability of near-surface chlorophyll and
SST in the LMEs of the world. Daily binned global SeaWiFS chlorophyll a (CHL, mg m-3),
normalized water leaving radiances, and photosynthetically available radiation (PAR,
Einsteins m-2 d-1) scenes at 9 km resolution for the period January 1998 through
December 2006) are obtained from NASA's Ocean Biology Processing Group. Daily
global SST (oC) measurements at 4 km resolution are derived from nighttime scenes
composited from the AVHRR sensor on NOAA's polar-orbiting satellites and from NASA's
MODIS TERRA and MODIS AQUA sensors. Daily estimates of global primary
productivity (PP, gC m-2 d-1) are calculated using the Ocean Productivity from Absorption
and Light (OPAL) model (Marra, personal communication), a derivative of the model first
formulated in Marra et al. (2003). The OPAL model generates profiles of chlorophyll
estimated from the SeaWiFS chlorophyll using the algorithm from Wozniak et al. (2003)
and uses the absorption properties in the water column to vertically resolve estimates of
light attenuation in approximately 100 strata within the euphotic zone. Absorption by pure
water is assumed to be a constant value over PAR wavelengths; chlorophyll-specific
phytoplankton absorption is parameterized empirically (Bricaud et al., 1998); absorption
by photosynthetic pigments is distinguished from total absorption; and absorption by
colored dissolved organic matter (CDOM) is calculated according to Kahru and Mitchell
(2001). The chlorophyll-specific phytoplankton absorption is used to calculate
productivity, while absorption by photosynthetic pigments, water, and CDOM are used to
vertically resolve light attenuation. SST, which is used as a proxy for seasonal changes
in the phytoplankton community, is related to the chlorophyll-specific absorption
coefficient. The quantum efficiency is obtained from a hyperbolic tangent and a constant
max. Productivity is calculated for the 100 layers in the euphotic zone and summed to
compute the integral daily productivity (gC m-2 d-1).
Monthly and annual means of PP were extracted for each LME and a simple linear
regression of the annual PP was used to determine the rate of change over time. The
significance (alpha = 0.01 and 0.05) of the regression coefficient was calculated using a
t-test according to Sokal and Rohfl (1995)(Table 1). The data allowed for classifying the
LMEs into 3 categories: Class I, high productivity (>300 gCm-2 year-1), Class II, moderate
productivity (150-300 gCm-2year-1), and Class III, low (<150 gCm-2 year-1) productivity.
16
K. Sherman and G. Hempel
LME Chl
PP
Barents Sea
+ **
Bay of Bengal
- *
California Current
+ *
East Greenland Shelf
+ *
East Siberian Sea
- *
Hudson Bay
+ **
+ *
Humboldt current
+ *
Indonesian Sea
+ *
New Zealand Shelf
+ *
North Australian Shelf
+ *
Red Sea
+ **
+ *
Sea of Okhosk
+ *
Table 1. Significance of T test on chlorophyll (Chl) and primary productivity (PPD) regression
coefficients for SeaWiFS time series data on chlorophyll and primary productivity (1998-2006). Only
cases where p<.05 are listed. All other comparisons were nonsignificant. Plus and minus signs are
used to designate the direction of the slope of the trend line. * Indicates P<.05 ** Indicates P<.01
Fisheries catch and values trends, and ecosystem state indicators
Trends in fisheries biomass yields and catch value, provided by the Sea Around Us
Project, Fisheries Centre, University of British Columbia (see www.seaaroundus.org), are
also included in the LME descriptions. The datasets and methods used for deriving the
catch trends and the concepts behind the indicators are described in Pauly et al. (this
volume).
THE GLOBAL INTERNATIONAL WATERS ASSESSMENT
The assessments presented in this volume on state and trends in LMEs in GEF eligible
regions are based mainly on the data collections and regional reports compiled by the
Global International Waters Assessment (GIWA), supplemented by information from
other sources (see Appendix 2). GIWA was designed as a globally comparable
assessment of the present state and future trends of transboundary aquatic resources in
the world`s shared waters. On a regional basis, a bottom-up and multidisciplinary
approach was adopted that involved nearly 1,500 natural and social scientists from
around the world, particularly in developing regions (Hempel & Daler 2004, UNEP 2006).
The GIWA project divided the world into transboundary water regions, each comprising
one or more major drainage basin(s) with adjacent LMEs. Regional teams conducted the
assessment based on existing regional data and information, and adapted the
methodology to the local conditions. In many GIWA regions, the assessment process
has strengthened communication between social and natural scientists, as well as
managers. It has also fostered new partnerships within the regions and between
neighbouring regions. The GIWA project was initiated and largely funded by GEF and
led by UNEP. The key products of GIWA are 35 regional reports, most of them published
in print and/or electronically. The GIWA Final Report (UNEP 2006) summarises the
findings of the regional reports in a global perspective and provides information on
GIWA's methodology and theoretical background.
Regional Seas and Large Marine Ecosystems
17
Globally comparable results were achieved by a common and consistent methodology
applied by all of the regional teams. The GIWA methodology provides criteria for
assessing water-related environmental concerns, and for identifying their immediate and
root causes and potential policy options. Regional experts assessed and compared the
severity of impacts from a regional perspective (Belausteguigoitia 2004).
The numerous and complex transboundary water-related environmental problems were
grouped into five major concerns:
1) Freshwater
shortage
2) Pollution
3) Overfishing and other threats to aquatic living resources
4) Habitat and community modification
5) Global
change
The GIWA methodology is comprised of four major steps:
1) Scaling defines the geographic boundaries of the GIWA region, boundaries
generally demarcated by a large drainage basin and its adjacent marine
areas. The boundaries of the marine parts of the GIWA regions often
correspond with those of LMEs.
2) Scoping assesses and scores the severity of present and predicted
environmental and socioeconomic impacts caused by each of the GIWA
concerns.
3) Causal chain analysis traces the cause and effect pathways from the socio-
economic and environmental impacts back to their root causes.
4) Wherever possible, the causal chain analysis was followed by policy option
analysis which outlined potential courses of action that aim to mitigate or
resolve environmental and socioeconomic problems in the region.
The GIWA provided baseline information at the regional level for the preparation of TDAs
and SAPs initiated by GEF. At the same time, many GIWA regional assessments have
benefited from completed TDAs. GIWA has been the largest global assessment of
ecosystem-wide water issues from a transboundary perspective, linking international river
basins to their adjacent LMEs. It was designed to provide policy makers and managers
with the information they need to improve transboundary resources management.
RECENT TRENDS IN LMES WITHIN REGIONAL SEAS,
IDENTIFIED THROUGH THE 5-MODULE ASSESSMENTS
During the review of the LME condition descriptions, three major challenges emerged: (1) the
need to apply the precautionary approach, especially in LMEs with limited access to science-
based stock assessments, to control the industrial fishing effort that threatens the community-
based artisanal fisheries, (2) The need to improve forecasts of climate effects on abundances
of key species, and (3) the need to reduce nutrient inputs into estuaries to levels that protect
coastal waters from eutrophication.
Need for Precautionary Approach:
One example illustrating the need for a precautionary approach is the encroachment of
industrial globalized fisheries on artisanal fisheries in the Guinea Current LME. Findings
from a time series analysis of Catch-Per-Unit-Effort for both small-sized inshore artisanal-
type vessels and industrialized fishing fleets from the European Union showed that the
large industrialized trawlers are fishing species in near-shore areas previously not fished
by the industrial fishmeal extraction enterprises that provide product to industrialized
farms in the developed world as animal feed or fertilizer (Figure 9). The analysis found a
consistent rise in industrial trawling coinciding with a downward trend during the late
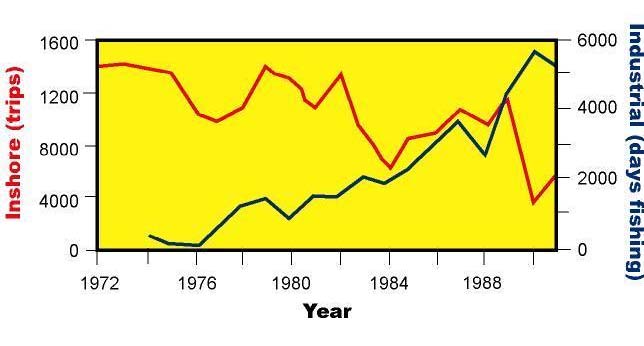
18
K. Sherman and G. Hempel
1980s in inshore seasonal artisanal fishing, which raises concerns for the community-
based fish harvest, available to meet the growing nutritional needs of the 300 million
people living along the Guinea Current coast (Korentang 2002, Figure 9).
Figure 9. Negative influence of industrial fisheries (days fished) on catch based in shore fishing fishing trips
along the coast of Ghana in the Guinea Current LME (from Koranteng, 2002)
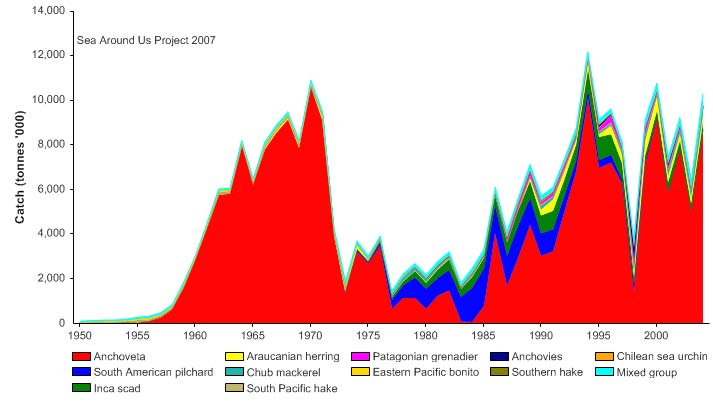
Need for improved forecasts of fishery fluctuations during climate change:
The variability in mean-annual fisheries catch of Humboldt Current LME provides one
illustration of the need for improved forecasts of fishery fluctuations in order to move toward
long-term sustainability of pelagic and demersal fish stocks. The Humboldt Current LME
contains the world's largest upwelling system and is the world's most productive marine
ecosystem, providing between 15% and 20% of the world's annual marine catch. Anchovy,
sardine and horse mackerel are used for fish meal and for human consumption. Fishing
sustains thousands of fishermen and their families. The sharp decline in landings in the early
1970s and increases in the late 1980s and 1990s are related to El Ni�o climate effects (see
Humboldt Current description, this volume).
Figure 10.--Humboldt Current LME multi-decadal fish catch (1950-2004). Source: Sea Around Us Project
2007.
Regional Seas and Large Marine Ecosystems
19
While the high productivity of the Humboldt Current LME is the result of upwelling processes
governed by strong trade winds, the upwelling is subjected to considerable annual climatic
variability, which causes variations in marine populations and catch (Figure 10). The normal
seasonal upwelling can be interrupted by the El Ni�o-Southern Oscillation (ENSO), which
results in intrusions of warm water. For the long-term sustainability of the pelagic and
demersal fish stocks of this LME, improved forecasts of climate-driven fishery fluctuations are
required. Polar region LMEs are now also changing from extensive global climate warming
and ice melt (see East Bering Sea and Gulf of Alaska descriptions, this volume).
Need to curb excessive nitrogen loading:
Models of nitrogen affecting LMEs predict significant increases. Excessive levels of nitrogen
contribution to coastal eutrophication constitute a growing global environmental problem that
is cross-sectoral in nature. Excessive nitrogen loadings have been identified as problems
inter alia in the Baltic Sea, Black Sea, Adriatic portion of the Mediterranean, Yellow Sea,
South China Sea, Bay of Bengal, Gulf of Mexico, and Patagonian Shelf LMEs.
16
14
12
2050
10
-1 r
1990
8
Tg N y
6
4
2
0
N o rth
S o u th Afric a E u ro p e N o rth
E a s t
S o u th
A m e ric a A m e ric a
e a s t
A s ia
A s ia
A s ia
Figure 11. Model-predicted nitrogen (dissolved inorganic N) export by rivers to coastal systems in 1990
and in 2050--based on a business-as-usual (BAU) scenario. Figure modified from Kroeze and
Seitzinger (1998).
Model-predicted global estimates of dissolved inorganic nitrogen (DIN) export from
freshwater basins to coastal waters in 1990 and 2050 have been developed by Kroeze
and Seitzinger (1998). These estimates, based on a business-as-usual (BAU) scenario,
are cause for concern for the future condition of LME coastal waters with expected
nitrogen exports doubling between 1990 and 2050 (Figure 11). Given the expected
future increases in human population size and in fertilizer use, without significant nitrogen
mitigation efforts, LMEs will be subjected to a future of increasing harmful algal bloom
events, reduced fisheries, and hypoxia that will further degrade marine biomass and
biological diversity.
REFERENCES
Aiken, J., Pollard, R., Williams, R., Griffiths, G., Bellan, I. (1999). Measurements of the upper ocean
structure using towed profiling systems. In: Sherman, K. and Q. Tang, eds. Large Marine
Ecosystems of the Pacific Rim: Assessment, Sustainability, and Management. Malden:
Blackwell Science, Inc. 346-362.
20
K. Sherman and G. Hempel
Behrenfeld, M. and Falkowski, P.G. (1997). Limnol. Oceangr. 42(1):1-20.
Belausteguigoitia, J.C. (2004). Causal chain analysis and root causes: the GIWA approach. Ambio
33:7-12.
Belkin, I.M. (2008) Rapid warming in Large Marine Ecosystems. Progress in Oceanography, in
press.
Belkin, I.M., and Cornillon, P.C. (2005). Bering Sea thermal fronts from Pathfinder data: Seasonal
and interannual variability, Pacific Oceanography 3(1): 6-20.
Berman, M.S. and Sherman, K.. 2001. A towed body sampler for monitoring marine ecosystems.
Sea Technology 42(9):48-52.
Bouvet M., Hoepffner, N. and Dowell, M.D. (2002). Parameterization of a spectral solar irradiance model
for the global ocean using multiple satellite sensors. Journal of Geophysical Research, 107(C12),
3215, doi:10.1029/2001JC001126.
Bricaud, A., A. Morel, M. Babin, K. Allali, and H. Claustre. 1998. Variations of light absorption by
suspended particles with chlorophyll a concentration in oceanic (case 1) waters: Analysis and
implications for bio-optical models. Journal of Geophysical Research 103(C13):31033-31044.
CBD (2004). Annex I, Decision VII/30, p 351 in: The 2020 Biodiversity Target: a Framework for
Implementation. Decisions from the Seventh Meeting of the Conference of the Parties of the
Convention on Biological Diversity, Kuala Lumpur, 9-10 and 27 February 2004. Secretariat of
the CBD, Montreal.
Costanza, R. (1992). Toward an operational definition of ecosystem health. In: Costanza R, B.G.
Norton, B.D. Haskell, eds. Ecosystem Health: New Goals for Environmental Management.
Island Press, Washington DC. 239-256.
Duda, A. and Sherman, K. (2002). A new imperative for improving management of large marine
ecosystems. Ocean & Coastal Management 45:797-833.
Epstein, P.R. (1993). Algal blooms and public health. World Resource Review 5(2):190-206.
FAO'S Fisheries Agreement Register (FARISIS). 1998. Committee on Fisheries. Twenty-third
Session Rome, Italy, 15-19 February 1999 www.fao.org/docrep/meeting/w9885e.htm
GEF. 2007. Operational Programs , available online at http://gefweb.org/Operational_Policies/
Operational_Programs/OP_8_English.pdf.
Hempel, G. and Daler, D.. (2004). Why a Global International Waters Assessment (GIWA)? Ambio
33:2-6.
Hennessey, T. and Sutinen, J., eds. (2005). Sustaining Large Marine Ecosystems: The Human
Dimension. Elsevier. Amsterdam. 368p.
Hoagland, P. and Jin, D. (2006). Accounting for Marine Economic Activities in Large Marine
Ecosystems and the Regional Seas. Final Report to the United Nations Environment
Programme, Regional Seas Programme (UNEP/RSP) Project No. CP/6000-04-71-2108.
Hoepffner N., Finenko, Z., Sturm, B. and Larkin, D. (1999). Depth-integrated primary production in the
eastern tropical and sub-tropical North Atlantic basin from ocean colour imagery. International
Journal of Remote Sensing, 20: 1435-1456.
Juda, L. and Hennessey, T. (2001). Governance profiles and the management of the uses of large
marine ecosystems. Ocean Development and International Law 32:41-67
Kahru, M., and B.G. Mitchell. 2001. Seasonal and nonseasonal variability of satellite-derived
chlorophyll and colored dissolved organic matter concentration in the California Current. Journal
of Geophysical Research 106(C2):2517-2529.
Koranteng, K.A. (2002). Status of demersal fishery resources on the inner continental shelf off
Ghana. 261-274 in: McGlade, J., Cury, P. and Koranteng, K.. The Gulf of Guinea Large
Marine Ecosystem: Environmental Forcing and Sustainable Development of Marine
Resources. Elsevier Science. Netherlands. 392p.
Kroeze, C. and Seitzinger, S. (1998). Nitrogen inputs to rivers, estuaries and continental shelves
and related nitrous oxide emissions in 1990 and 2050: A global model. Nutrient Cycling in
Agroecosystems 52:195-212.
Marra, J., C. Ho, and Trees. C. 2003. An alternative algorithm for the calculation of primary
productivity from remote sensing data. LDEO. Technical Report # LDEO-2003-1
Melrose, D.C., Oviatt, C.A. O'Reilly, J.E., Berman, M.S. (2006). Comparisons of fast repetition rate
fluorescence estimated primary production and 14 C uptake by phytoplankton. Mar Ecol Prog
Ser 311:37-46.
Northwest Atlantic Fisheries Organization (NAFO). (2005). NAFO SCS Doc. 06/10, Serial No.
N5235. U. S. Research Report for 2005. by K.A. Sosebee.
Olsen, S.B., Sutinen, J.G., Juda, L., Hennessey, T.M., Grigalunas, T.A.. (2006). A Handbook on
Governance and Socioeconomics of Large Marine Ecosystems. University of Rhode Island. 94p
Regional Seas and Large Marine Ecosystems
21
Pauly D. and V. Christensen. 1995. Primary production required to sustain global fisheries. Nature
374:255-257.
Pauly, D., Alder, J., Booth, S., Cheung, W.W.L., Close, C., Sumaila, U.R., Swartz, W., Tavakolie, A.,
Watson, R., Wood, L., and Zeller, D. (2008). Fisheries in Large Marine Ecosystems: Descriptions
and Diagnoses. 21-38, this volume.
Platt T. ,and Sathyendranath, S. (1988). Oceanic primary Production: estimation by remote sensing at
local and regional scales. Science, 241: 1613-1620.
Rayner, N.A., D.E. Parker, E.B. Horton, C.K. Folland, L.V. Alexander, D.P. Rowell, E.C. Kent and
A. Kaplan, (2003) Global analyses of SST, sea ice and night marine air temperature since the
late nineteenth century, J. Geophys. Res, 108, doi:10.1029/2002JD002670, 2003
Sea Around US (2007). A Global Database on Marine Fisheries and Ecosystems. Fisheries Centre,
University British Columbia, Vancouver, Canada. www.seaaroundus.org/ --click on Large
Marine Ecosystems.
Seitzinger, S.P. and Kroeze. C. (1998). Global distribution of nitrous oxide production and N inputs
in freshwater and coastal marine ecosystems. Global Biogeochemical Cycles 12(1): 93-113.
Sherman, B. (2000). Marine ecosystem health as an expression of morbidity, mortality, and disease
events. Marine Pollution Bulletin 41(1-6): 232-254.
Sherman, K. ed. (1993). Emerging theoretical basis for monitoring the changing states (Health) of
large marine ecosystems. Summary report of two workshops: 23 April 1992, National Marine
Fisheries Service, Narragansett, Rhode Island, and 11-12 July 1992, Cornell University, Ithaca,
New York. NOAA Technical Memorandum NMFS-F/NEC-100.
Sherman, K. (2003). Physical, biological and human forcing of biomass yields in large marine
ecosystems. ICES CM 2003/P12
Sherman, K. and Alexander, L.M. (1986). Variability and Management of Large Marine
Ecosystems. AAAS Selected Symposium 99. Westview Press. Boulder, Colorado. 319p.
Sherman, K. P. Celone and S. Adams. 2004. NOAA Fisheries Service's Large Marine Ecosystems
Program: Status Report. NOAA Technical Memorandum NMFS-NE-183. U.S. DOC, NOAA,
NMFS, Northeast Fisheries Science Center. Woods Hole, MA.
Sherman, Hoagland and Jin, D. (2005). Driving forces affecting resource sustainability in large
marine ecosystems . ICES 2005/M:07. Presented at the ICES Annual Science meeting in
Aberdeen Scotland, 2005.
Sokal, R.R., and F.J. Rohlf. 1995. Biometry: The Principals and Practical Statistics in Biological
Research. W.H. Freeman and Company, New York.
Sutinen, J., editor. (2000). A framework for monitoring and assessing socioeconomics and
governance of large marine ecosystems. NOAA Techical Memorandum. NMFS-NE-158. 32p
Wozniak, B., J. Dera, D. Ficek, and R. Majchrowski. 2003. Modeling light and photosynthesis in the
marine environment. Oceanologia 45(2):171-245.
USEPA. (2004). National Coastal Condition Report II. EPA-620/R-03/002. Washington, DC. 285p.
22
K. Sherman and G. Hempel