Accelerated Warming and Emergent Trends in
Fisheries Biomass Yields of the World's Large
Marine Ecosystems
K. Sherman, I. Belkin, K. Friedland, J. O'Reilly and K. Hyde
Introduction
The heavily exploited state of the world's marine fisheries has been well documented
(FAO 2004; Garcia and Newton 1997; González-Laxe 2007). Little, however, is known of
the effects of climate change on the trends in global fisheries biomass yields. The Fourth
Assessment Report of the Intergovernmental Panel on Climate Change stated with "high
confidence" that changes in marine biological systems are associated with rising water
temperatures affecting shifts in pelagic algae and other plankton, and fish abundance in
high latitudes (IPCC 2007). The Report also indicated that adaptation to impacts of
increasing temperatures in coastal systems will be more challenging in developing
countries than in developed countries due to constraints in adaptive capacity. From a
marine resources management perspective, the 8 regions of the globe examined by the
IPCC (i.e. North America, Latin America, Europe, Africa, Asia, the Australia and New
Zealand region and the two Polar regions), are important fisheries areas but at a scale
too large for determination of temperature trends relative to the assessment and
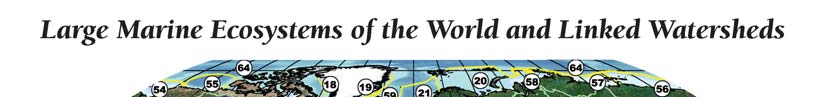
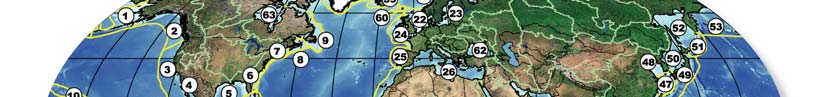
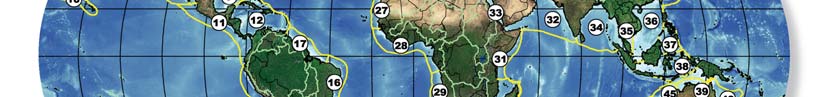
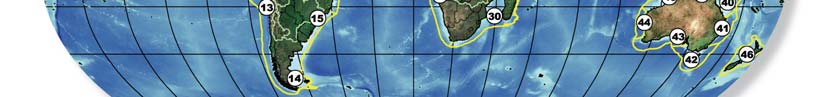
management of the world's marine fisheries biomass yields produced principally in 64
large marine ecosystems (LMEs) (Figure 1). These LMEs, in coastal waters around the
globe, annually produce 80% of the world's marine fisheries biomass (Figure 2).
Large Marine Ecosystems are areas of an ecologically based nested hierarchy of global
ocean biomes and ecosystems (Watson et al. 2003). Since 1995, LMEs have been
designated by a growing number of coastal countries in Africa, Asia, Latin America, and
eastern Europe as place-based assessment and management areas for introducing an
ecosystems approach to recover, develop, and sustain marine resources. The LME
approach to the assessment and management of marine resources is based on the
operationalization of five modules, with suites of indicators for monitoring and assessing
changing conditions in ecosystem: (i) productivity, (ii) fish and fisheries (iii) pollution and
ecosystem health, (iv) socioeconomics, and (v) governance (Duda and Sherman 2002).
The approach is part of an emerging effort by the scientific community to relate the scale
of place-based ecosystem assessment and management of marine resources to policy
making and to tighten the linkage between applied science and improved management of
ocean resources within the natural boundaries of LMEs (COMPASS 2005; Wang 2004).
Since 1995, international financial organizations have extended explicit support to
developing coastal countries for assessing and managing goods and services using the
modular approach at the LME scale. At present, 110 countries are engaged in LME
projects along with 5 UN agencies and $1.8 billion in financial support from the Global
Environment Facility (GEF) and the World Bank. Sixteen LME projects are presently
focused on introducing an ecosystems approach to the recovery of depleted fish stocks,
restoration of degraded habitats, reduction and control of pollution, conservation of
biodiversity, and adaptation to climate change. In recognition of the observational
evidence of global warming from the 4th Assessment Report of the (IPCC 2007) and the
lack of information on trends in global warming at the LME scale where most of the
world's marine fisheries biomass yields are produced, we undertook a study of the
physical extent and rates of sea surface temperature trends in relation to fisheries
biomass yields and SeaWiFS derived primary productivity of the world's LMEs.
42
Sherman et al.
Figure 1. Large Marine Ecosystems of the World
Figure 2. Annual global marine fisheries biomass yields in metric tons in world LMEs (Sea Around Us Project)
Accelerated warming and emergent trends in fisheries biomass yields
43
METHODS
Fisheries biomass yields are not presented here as representative of individual fish stock
abundances. They are representative of fisheries catches and are used here to compare
the effects of global warming on the fishery biomass yields of the World's LMEs. The
comparative analysis of global temperature trends, fisheries biomass yields, and primary
productivity is based on available time-series data at the LME scale on sea surface
temperatures, marine fisheries biomass yields, and Sea WiFS derived primary
productivity values.
LME Sea Surface Temperatures (SST)
Sea surface temperature (SST) data is a thermal parameter routinely measured
worldwide. Subsurface temperature data, albeit important, are limited in the spatial and
temporal density required for reliable assessment of thermal conditions at the Large
Marine Ecosystem (LME) scale worldwide. The U.K. Meteorological Office Hadley
Center SST climatology was used in this analysis (Belkin 2008), as the Hadley data set
has resolution of 1 degree latitude by 1 degree longitude globally. A detailed description
of this data set has been published by Rayner et al. (2003). Mean annual SST values
were calculated for each 1° x 1° cell and then were area-averaged by annual 1° x 1°
SSTs within each LME. Since the square area of each trapezoidal cell is proportional to
the cosine of the middle latitude of the given cell, all SSTs were weighted by the cosine of
the cell's middle latitude. After integration over the LME area, the resulting sum of
weighted SSTs was normalized by the sum of the weights, that is, by the sum of the
cosines. Annual anomalies of annual LME-averaged SST were calculated. The long-
term LME-averaged SST was computed for each LME by a simple long-term averaging
of the annual area-weighted LME-averaged SSTs. Annual SST anomalies were
calculated by subtracting the long-term mean SST from the annual SST. Both SST and
SST anomalies were plotted using adjustable temperature scales for each LME to depict
temporal trends. Comparisons of fisheries biomass yields were examined in relation to
intervals of 0.3°C of increasing temperature.
LME Primary Productivity
The LME primary productivity estimates are derived from satellite borne data of NOAA's
Northeast Fisheries Science Center, Narragansett Laboratory. These estimates originate
from SeaWiFS (satellite-derived chlorophyll estimates from the Sea-viewing Wide Field-
of-view Sensor), Coastal Zone Color Scanner (CZCS), a large archive of in situ near-
surface chlorophyll data, and satellite sea surface temperature (SST) measurements to
quantify spatial and seasonal variability of near-surface chlorophyll and SST in the LMEs
of the world. Daily binned global SeaWiFS chlorophyll a (CHL, mg m-3), normalized water
leaving radiances, and photosynthetically available radiation (PAR, Einsteins m-2 d-1)
scenes at 9 km resolution for the period January 1998 through December 2006 were
obtained from NASA's Ocean Biology Processing Group. Daily global SST (oC)
measurements at 4 km resolution were derived from nighttime scenes composited from
the AVHRR sensor on NOAA's polar-orbiting satellites and from NASA's MODIS TERRA
and MODIS AQUA sensors. Daily estimates of global primary productivity (PP, gC m-2 d-1)
were calculated using the Ocean Productivity from Absorption and Light (OPAL) model, a
derivative of the model first formulated in Marra et al. (2003). The OPAL model
generates profiles of chlorophyll estimated from the SeaWiFS chlorophyll using the
algorithm from Wozniak et al. (2003) that uses the absorption properties in the water
column to vertically resolve estimates of light attenuation in approximately 100 strata
within the euphotic zone. Productivity is calculated for the 100 layers in the euphotic
zone and summed to compute the integral daily productivity (gC m-2 d-1). Monthly and
annual means of primary productivity (PP) were extracted and averaged for each LME.
Significance levels (alpha=0.01 and 0.05) of the regression coefficients of the nine years
of Sea WiFS mean annual primary productivity data were determined using a t-test
44
Sherman et al.
according to Sokal and Rohfl (1995). Time series trends plotted for each LME are
available online (www.lme.noaa.gov).
Fisheries Biomass Yield Methods
Prior to the Sea Around Us Program, projections of marine fisheries yields at the LME
scale, were largely defined by the range of vessels exploiting a given resource (Pauly
and Pitcher 2000). The need for countries to manage fisheries within EEZ's under
UNCLOS initiated efforts to derive fisheries yields at the national level(Prescott-Allen
2001) and consistent with the emergence of ecosystem-based management at the LME
scale(Sherman et al. 2003) (Pauly et al. 2008). The time series of fisheries biomass
yields (1950-2004) used in this study are based on the time-series data provided at the
LME scale by the Sea Around Us Project at the University of British Columbia (Pauly et
al. 2008) The method used by the Sea Around Us Project to map reported fishery
catches onto 180,000 global spatial cells of ˝ degrees latitude and longitude was applied
to produce profiles of 54-yr. mean annual time-series of catches (biomass yields) by 12
species or species groups for the world's LMEs (Pauly et al. 2008; Watson et al. 2003).
In addition, plots on the status of the stocks within each of the LMEs according to their
condition (e.g. undeveloped, fully exploited and overexploited) in accordance with the
method of Froese and Kesner-Reyes (2002), and illustrated by Pauly et al. (2008), were
used to examine trends in yield condition among the LMEs. Fisheries biomass yields
were examined in relation to warming trends for 63 LMEs for the period 1982 to 2004.
Fisheries biomass yield trends were plotted for each LME using the LOESS smoothing
method (tension=0.5) and the emergent increasing and decreasing patterns examined in
relation to LME warming data (Cleveland and Devlin 1988). Observed trends were
compared to earlier studies for emergent spatial and temporal global trends in LME
fishery biomass yields.
RESULTS
Comparative SST Clusters
The LME plots of SST and SST anomalies are presented in 2 sets of 4 plates, with each
set containing a total of 63 figures: four plates for SST and four plates for SST anomalies
1957-2006. These can be viewed at www.lme.noaa.gov. The Arctic Ocean LME was not
included in this analysis because of the perennial sea ice cover. Other Arctic LMEs also
feature sea ice cover that essentially vanishes in summer, thus making summer SST
assessment possible. The 1957-2006 time series revealed a global pattern of long-term
warming however, the long-term SST variability since 1957 was not linear over the
period. Specifically. most LMEs underwent a cooling between the 1950s and the 1970s,
replaced by a rapid warming from the 1980s until the present. Therefore we re-
calculated SST trends using only the last 25 years of data (SST data available at
www.lme.noaa.gov, where SST anomalies are calculated for each LME. Net SST
change in each LME between 1982 and 2006 based on SST trends is summarized in
Table 1 (after Belkin, 1998).
The most striking result is the consistent warming of LMEs, with the notable exceptions of
two, the California Current and Humboldt Current. These LMEs experienced cooling over
the last 25 years. Both are in large and persistent upwelling areas of nutrient rich cool
water in the Eastern Pacific. The SST values were partitioned into 0.3°C intervals to
allow for comparison among LME warming rates. The warming trend observed in 61
LMEs ranged from a low of 0.08°C for the Patagonian Shelf LME to a high of 1.35°C in
the Baltic Sea LME (Table 1). The relatively rapid warming exceeding 0.6°C over 25
years is observed almost exclusively in moderate- and high-latitude LMEs. This pattern
is generally consistent with the model-predicted polar-and-subpolar amplification of global
warming (IPCC 2007). The warming in low-latitude LMEs is several times slower than
the warming in high-latitude LMEs (Table 1). In addition to the Baltic Sea, the most rapid
Accelerated warming and emergent trends in fisheries biomass yields
45
Table 1. SST change in each LME, 1982-2006 (sorted in descending order)
LME# SST
Change
Slope of Linear
Standard Error of
(°C)
Regression
Slope (°C/year)
1982-2006
(°C/year)
LME23='BALTIC SEA';
1.35
0.0563 0.0151
LME22='NORTH SEA';
1.31
0.0544 0.0099
LME47='EAST CHINA SEA';
1.22
0.0509 0.0077
LME50='SEA OF JAPAN'/'EAST SEA';
1.09
0.0453 0.0098
LME9='NEWFOUNDLAND-LABRADOR SHELF';
1.04
0.0435 0.0108
LME62='BLACK SEA';
0.96
0.0401 0.0124
LME8='SCOTIAN SHELF';
0.89
0.0370 0.0105
LME59='ICELAND SEA';
0.86
0.0360 0.0091
LME21='NORWEGIAN SEA';
0.85
0.0356 0.0072
LME49'KUROSHIO CURRENT';
0.75
0.0312 0.0062
LME60='FAROE PLATEAU';
0.75
0.0311 0.0078
LME33='RED SEA';
0.74
0.0309 0.0048
LME18='WEST GREENLAND SHELF';
0.73
0.0304 0.0064
LME24='CELTIC-BISCAY SHELF';
0.72
0.0301 0.0076
LME26='MEDITERRANEAN SEA';
0.71
0.0294 0.0055
LME54='CHUKCHI SEA';
0.70
0.0290 0.0087
LME25='IBERIAN COASTAL';
0.68
0.0283 0.0072
LME48='YELLOW SEA';
0.67
0.0279 0.0097
LME17='NORTH BRAZIL SHELF';
0.60
0.0252 0.0049
LME51='OYASHIO CURRENT';
0.60
0.0250 0.0086
LME15='SOUTH BRAZIL SHELF';
0.53
0.0221 0.0068
LME27='CANARY CURRENT';
0.52
0.0217 0.0082
LME12='CARIBBEAN SEA';
0.50
0.0208 0.0050
LME19='EAST GREENLAND SHELF';
0.47
0.0197 0.0074
LME28='GUINEA CURRENT';
0.46
0.0194 0.0063
LME10='INSULAR PACIFIC HAWAIIAN';
0.45
0.0187 0.0056
LME36='SOUTH CHINA SEA';
0.44
0.0182 0.0063
LME53='WEST BERING SEA';
0.39
0.0162 0.0064
LME2='GULF OF ALASKA';
0.37
0.0154 0.0081
LME40='NE AUSTRALIAN SHELF-GREAT BARRIER REEF';
0.37
0.0153 0.0101
LME56='EAST SIBERIAN SHELF';
0.36
0.0149 0.0092
LME41='EAST-CENTRAL AUSTRALIAN SHELF';
0.35
0.0145 0.0056
LME55='BEAUFORT SEA';
0.34
0.0140 0.0066
LME46='NEW ZEALAND SHELF';
0.32
0.0135 0.0105
LME4='GULF OF CALIFORNIA';
0.31
0.0130 0.0069
LME5='GULF OF MEXICO';
0.31
0.0130 0.0161
LME52='SEA OF OKHOTSK';
0.31
0.0129 0.0053
LME16='EAST BRAZIL SHELF';
0.30
0.0126 0.0062
LME63='HUDSON BAY';
0.28
0.0117 0.0076
LME1='EAST BERING SEA';
0.27
0.0113 0.0070
LME32='ARABIAN SEA';
0.26
0.0110 0.0048
LME29='BENGUELA CURRENT';
0.24
0.0100 0.0072
LME34='BAY OF BENGAL';
0.24
0.0098 0.0061
LME38='INDONESIAN SEA';
0.24
0.0098 0.0067
LME45='NORTHWEST AUSTRALIAN SHELF';
0.24
0.0098 0.0049
LME7='NORTHEAST U.S. CONTINENTAL SHELF';
0.23
0.0096 0.0043
LME37='SULU-CELEBES SEA';
0.23
0.0096 0.0125
LME30='AGULHAS CURRENT';
0.20
0.0085 0.0079
LME42='SOUTHEAST AUSTRALIAN SHELF';
0.20
0.0084 0.0042
LME31='SOMALI COASTAL CURRENT';
0.18
0.0074 0.0059
LME39='NORTH AUSTRALIAN SHELF';
0.17
0.0070 0.0068
LME6='SOUTHEAST U.S. CONTINENTAL SHELF';
0.16
0.0067 0.0061
LME35='GULF OF THAILAND';
0.16
0.0067 0.0064
LME58='KARA SEA';
0.16
0.0066 0.0065
LME11='PACIFIC CENTRAL-AMERICAN COASTAL';
0.14
0.0059 0.0101
LME20='BARENTS SEA';
0.12
0.0051 0.0092
LME57='LAPTEV SEA';
0.12
0.0048 0.0088
LME43='SOUTHWEST AUSTRALIAN SHELF';
0.09
0.0039 0.0057
LME44='WEST-CENTRAL AUSTRALIAN SHELF';
0.09
0.0038 0.0093
LME14='PATAGONIAN SHELF';
0.08
0.0034 0.0059
LME61='ANTARCTIC';
0.00
0.0001 0.0011
LME3='CALIFORNIA CURRENT';
-0.07
-0.0030 0.0119
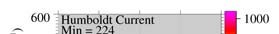
LME13='HUMBOLDT CURRENT';
-0.10
-0.0042 0.0112
LME64='ARCTIC OCEAN';
46
Sherman et al.
warming exceeding 0.96°C over 25 years is observed in the North Sea, East China Sea,
Sea of Japan/East Sea, and Newfoundland-Labrador Shelf and Black Sea LMEs.
Comparisons of warming were made among three temperature clusters of LMEs. 1)
Super fast warming LMEs with D(SST) between >0.96°C -1.35°C are combined with fast
warming LMEs .67°C 0.84°C. Moderate warming LMEs have D(SST) between >0.3-
0.6°C; slow warming LMEs, have D(SST) between 0.0°C-0.28°C. Of the fast warming
LMEs (0.67°C to 1.35°C), 18 are warming at rates 2x to 4x times higher than the global
air surface temperature increase of 0.74°C for the past 100 years as reported by the
IPCC (2007) (Figure 3, after Belkin, 2008, Figure 5).
SST Net Warming in Large Marine Ecosystems, 1982-2006
1.2
1.1
1
0.9
°C 0.8
i
ng, 0.7
m
0.6
e
t
War 0.5
T N 0.4
SS 0.3
0.2
0.1
0
Slow LME
Moderate LME
Fast LME
Super-Fast LME
Global SST
(IPCC-2007;
1979-2005)
Figure 3. SST Net Warming in Large Marine Ecosystems, 1982-2006
Primary Productivity
No large scale consistent pattern of either increase or decrease in primary productivity
was observed. Of the 64 LMEs examined, only four 9-year trends were significant
(P<.05) (Figure 4). Primary productivity declined in the Bay of Bengal, and increased in
the Hudson Bay, Humboldt Current and Red Sea LMEs). The general declining trend in
primary productivity with ocean warming reported by Behrenfeld (2006) was limited to
the Bay of Bengal LMEs. No consistent trend among the LMEs was observed (Table 1).
However, as previously reported (Chassot et al. 2007; Nixon et al. 1986; Ware and
Thomson 2005) fisheries biomass yields did increase with increasing levels of primary
productivity (P<.001) in all 63 LMEs, and for LMEs in each of the warming clusters
(Figure 5A and 5B).
Fisheries biomass yield trends
The effects of warming on global fisheries biomass yields were non-uniform in relation to
any persistent global pattern of increasing or decreasing yields. The relationship
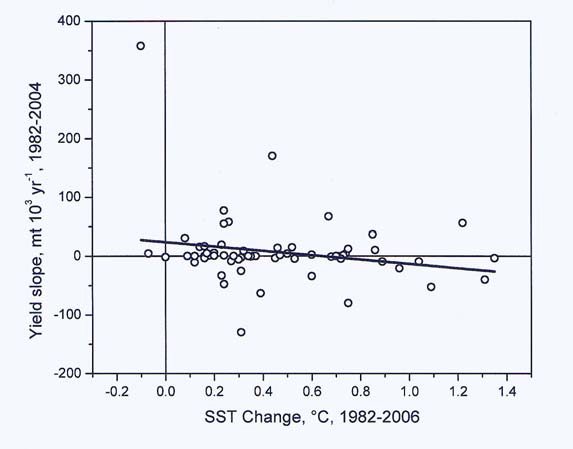
between change in LME yield and SST change was not significant; the slight suggestion
of a trend in the regression, was influenced by the data for the Humbolt LME (Figure 6).
Partitioning of the results into LMEs with increasing trends in fisheries biomass yields,
and those with declining trends divided the trends into two groups. Increasing yields
were observed in 31 (49.2%) and decreasing trends in 32 (50.8%) of LMEs. Differences


Accelerated warming and emergent trends in fisheries biomass yields
47
Figure 4. Primary productivity trends (1998-2006): Bay of Bengal, Hudson Bay, Humboldt Current and
Red Sea.
Figure 5A. Comparison of 5-yr mean annual fisheries biomass yield with 9-yr mean annual primary
production in fast warming (red), moderately warming (yellow) and slower warming (green) LMEs. The
two blue circles represent cooling LMEs.
48
Sherman et al.
Figure 5B. Comparison of 5-yr mean annual fisheries biomass yield with 9-yr mean annual primary
production in fast warming (red), moderately warming (yellow) and slower warming (green) LMEs.
Figure 6. The relationship between change in LME yield and SST change was not significant; the slight
suggestion of a trend in the regression, was influenced by the data for the Humbolt LME
Accelerated warming and emergent trends in fisheries biomass yields
49
;
land
e
n
ing LMEs
Fast
m
C5
st Gre
st Bering Sea
te War
odera
of the NW Atlantic;
South China Sea, Ea
C4
n-Clustered, M
No
n Seas;
ral
heast Shelf, the Barents Sea, Ea
e
ve
Es.
ropea
M
S
s
.
Gulf of California;
i
c.
sed Eu
a
cif
P
s
tal LME
n/East Sea L
SW
Coa
u
lf
of Alaska,
st Shelf, the U.S. Sout
Semi-Enclo
C10
i
c;
C3
a
cif
Sea of Japa
P
S. Northea
e
a
n
;
W
ntral American
N
rop
n
t and
cific Hawaiian, G
C9
Es in Relation to SSTs, 1987-2006:
de the U.
Es;
a
r Pa
hern Eu
Pacific Ce
o
Curre
M
i
n
clu
rs.
Sout
n
t and
C2
Kuroshi
nt Wate
C6
:
ing LMEs
s
ter;
a
ce
m
a Curre
Eastern Atlantic L
:
ean Clu
ng: NE Australia, Insul
;
C8
n and Adj
Slow War
E WARMING
d,
st Asian LMEs;
warmi
c
ea
rn Europ
LMEs
n
Shelf, Benguel
an O
tere
derate
-
clus
Northe
rming Ea
Atlantic
Indi
Figure 7. Warming Clusters of LM
FAST WARMING C1 Wa
MODERAT C7 are mo Shelf;
SLOW WARMING: C11 Non Patagonia
50
Sherman et al.
were similar in Fast Warming (8 increasing, 10 decreasing) and Moderate Warming
LMEs (10 increasing, 8 decreasing). In the Slower Warming LMEs, most (14) were
undergoing increasing biomass yields and 6 were in a decreasing condition (Table 2).
Linear warming trends from 1982 to 2006 for each LME were distributed in distinct global
clusters, (i) the Fast Warming LME clusters were in the Northeast Atlantic, African and
Southeast Asian waters; (ii) the Moderate Warming LMEs were clustered in the Atlantic
and North Pacific waters; and (iii) the Slow Warming LME clusters were located
principally in the Indian Ocean, and also in locations around the margins of the Atlantic
and Pacific Oceans (Figure 7). Comparisons of fisheries biomass yield trends for eleven
LME warming clusters were examined.
Table 2. Fisheries biomass trends in countries adjacent to developing and developed countries.
Fisheries biomass
Status of adjacent
Fisheries biomass in
Percentage of total
trend
countries
million metric tons
Increasing fisheries (20
Developing countries
32.0
49%
LMEs)
Decreasing fisheries (9
Developing countries
6.2
9%
LMEs)
Increasing fisheries (11
Developed countries
4.4
6%
LMEs)
Decreasing fisheries 15
Developed countries
11.0
17%
LMEs)
California Current,
11.4
19%
Humboldt Current, and 7
Arctic LMEs (9 LMEs)
Total fisheries biomass
All categories
65.0
100%
Comparative fisheries biomass yields in relation to warming: Fast
warming European LMEs
In the Norwegian Sea, Faroe Plateau, and Iceland Shelf, the fisheries biomass yield is
increasing. These three LMEs account for 3.4 million tons, or 5% of the world biomass
catch, (Figure 8A). This cluster of LMEs is influenced from bottom-up forcing of
increasing zooplankton abundance and warming hydrographic conditions in the northern
areas of the North Atlantic, where stocks of herring, blue whiting and capelin are
benefiting from an expanding prey field of zooplankton (Beaugrand and Ibanez 2004;
Beaugrand et al. 2002) supporting growth and recruitment of these three species. The
warming trend in the Norwegian Sea driving the increase in biomass of herring, capelin
and blue whiting yields has been reported by (Skjoldal and Saetre 2004). On the Faroe
Plateau LME, Gaard et al. (2002) indicate that the increasing shelf production of plankton
is linked to the increased production of fish and fisheries in the ecosystem. Astthorsson
and Vilhjálmsson (2002) have shown that variations of zooplankton in Icelandic waters
are greatly influenced by large scale climatic factors and that warm Atlantic water inflows
favor zooplankton that supports larger populations of capelin that serve as important prey
of cod. The productivity and fisheries of all three LMEs are benefiting from the increasing
strength of the sub-Polar gyre bringing warmed waters to the LMEs of the region
generally in the northern northeast Atlantic and contributing to decreasing production and
fisheries yields in the relatively warmer southern waters of the northeast Atlantic
(Richardson and Schoeman 2004).
In southern Europe three LMEs, the North Sea, Celtic Biscay, and Iberian Coastal
LMEs in fast warming clusters are experiencing declines in biomass trends representing
4.1 mmt (6.4%) of the mean annual global biomass yield (Figure 8B). It has been
Accelerated warming and emergent trends in fisheries biomass yields
51
(A)
2,000,
2,
000
00
600,000
600,
1,
1 600,
,
00
600, 0
00
1,
1 500,
,
00
500, 0
00
500,000
500,
1,
1 400,
,
00
400, 0
00
1,500,
1,
000
00
1,
1 300,
,
00
300, 0
00
400,000
400,
_21
_60
1,
1 200,
,
00
200, 0
_59
00
_59
1,000,
1,
000
E
00
E
E
E 1,1100,
,
00
100, 0
00
LM
LM 300,000
300,
LM
1,
1 000,
,
00
000, 0
00
500,000
00
200,000
200,
900,00
900, 0
00
800,00
800, 0
00
0
100,000
100,
700,00
700, 0
00
1981
1989
1997
200
2 5
00
1981
1989
1997
1
200
2 5
00
1981
19
1989
1
1997
200
20 5
0
YEA
YE R
A
YEA
YE R
A
YEA
YE R
A
Norwegian Sea LME
Faroe Plateau LME
Iceland Shelf LME
(B)
4,000,
4,
0
000, 00
0
1,700,
70 000
00
500,000
0
1,600,
60 000
00
3,500,
3,
0
500, 00
0
400,000
0
1,500,
50 000
00
_22
_24
_25
3,000,
3,
0
000, 00
E
0
E
E
E
LM
LM 1,400,
40 000
00
LM
300,000
0
2,500,
2,
0
500, 00
0
1,300,
30 000
00
2,000,
2,
0
000, 00
0
1,200,
20 000
00
200,000
0
1981
19
1 89
9
1997
200
20 5
0
19
1 8
9 1
8
19
1 8
9 9
8
19
1 9
9 7
9
20
2 0
0 5
0
19
1 81
9
19
1 89
9
1997
2005
200
YEA
YE R
A
YEA
YE R
A
YEA
YE R
A
North Sea LME
Celtic Biscay LME
Iberian Coastal LME
(C )
1,100,
10 000
00
900,0
900, 00
0
1,250,
25 000
00
800,0
800, 00
0
1,000,
00 000
00
1,200,
20 000
00
700,0
700, 00
0
900,
90 000
00
1,150,
15 000
00
600,0
600, 00
0
_23
_62
_26
E
E
E
LM
500,0
500, 00
0
800,
80 000
00
LM
LM 1,100,
10 000
00
400,0
400, 00
0
700,
70 000
00
1,050,
05 000
00
300,0
300, 00
0
600,
60 000
00
200,0
200, 00
0
1,000,
00 000
00
1981
198
1989
19
19
1 97
9
20
2 0
0 5
0
1981
1989
198
1997
200
2 5
00
19
1 81
9
19
1 8
9 9
8
199
19 7
9
200
20 5
0
YEA
YE R
A
YEA
YE R
A
YEA
YE R
A
Baltic Sea LME
Black Sea
Mediterranean Sea
150,
1
0
50, 0
0 0
0
100,
1
0
00, 0
0 0
0
_33
E
LM
50,
50 0
, 0
0 0
0
0
1981
19
19
1 8
9 9
8
1997
19
20
2 0
0 5
0
YEA
YE R
A
Red Sea LME
Figure 8. Fisheries biomass yield trends (metric tons) in fast warming clusters A. Norwegian, Faroe
Plateau and Iceland Shelf LMEs (C1) B. North Sea, Celtic Biscay and Iberian Coastal LMEs (C2) and C.
Baltic Sea, Black Sea, Mediterranean Sea and Red Sea (C3) LMEs
reported that zooplankton abundance levels in the three LMEs are in decline, reducing
the prey field for zooplanktivores (Beaugrand et al. 2002; Valdes and Lavin 2002; Valdés
et al. 2007). Although we did not detect any significant decline in primary productivity in
52
Sherman et al.
the three LMEs, the declining phytoplankton level in the region (Richardson and
Schoeman 2004) is consistent with the declines in primary productivity in warming ocean
waters reported by Behrenfeld (2006). The fisheries biomass yields of 80% of the
targeted species are in an overexploited or fully exploited condition (Table 3), suggesting
that the observed decline in biomass yield of pelagic species is related to both heavy
exploitation and warming.
The three semi-enclosed European LMEs, the Mediterranean, the Black Sea, and the
Baltic Sea, and the adjacent area of the Red Sea (Figure 8C), are surrounded by
terrestrial areas and are fast warming, with heavy fishing as a dominant feature. The four
LMEs contribute 2.4 mmt (3.7%) of the mean annual global biomass yield. In three
European LMEs, the fisheries biomass trend is decreasing, while in the Red Sea it is
increasing. In the case of the Black Sea, the fisheries biomass is severely depleted, with
85% of fisheries stocks overexploited due to heavy fishing and a trophic cascade
(Daskalov 2003). In the Baltic Sea, Red Sea and Mediterranean Sea LMEs, 78% of the
stocks are in a fully exploited condition. Mixed species dominate in the Red Sea, where
88% of the species fished are fully exploited and 10% are overexploited (Table 3). It
appears that heavy exploitation is the dominant driver of the biomass trends observed in
all four LMEs.
Comparative fisheries biomass yields (in metric tons) in the fast
warming clusters of the Northwest Atlantic (C4) LMEs and the Asian
(C5, C6) LMEs
The three LMEs in this region contribute 1.1 mmt (1.7%) to the global biomass yield. In
two LMEs of the Northwest Atlantic, the downward trends in fisheries yield have been
attributed to the cod collapse in the Newfoundland-Labrador Shelf (Rice 2002), and to
the cod collapse and collapse of other demersal fisheries in the Scotian Shelf LME from
excessive fishing mortality (Choi et al. 2004; Frank et al. 2005). In the West Greenland
Shelf LME, where the cod stock has collapsed from excessive fishing mortality, there is a
recent increase in the landings of shrimp and other species (Aquarone and Adams
2008b) (Figure 9A).
Biomass yields of the fast warming LMEs of East Asian Seas
The 7.5 million metric tons (mmt) biomass yields of the Yellow Sea and East China Sea
LMEs constitute 11% of the global yield. In both LMEs, yields are increasing (Figure 9B).
The principal driver of the increase is food security to accommodate the needs of the
People's Republic of China and Korea (Tang 2003; Tang 2006; Tang and Jin 1999;
Zhang and Kim 1999). Biomass yields are dominated by heavily fished "mixed" species.
Seventy percent or more of the species constituting the yields are fully exploited or
overexploited (Table 3), suggesting that the principal driver of increased biomass yields is
full exploitation rather than global warming.
The fast warming Kuroshio Current and Sea of Japan/East Sea LMEs show declining
fisheries trends (Figure 9B). They contribute 1.9 mmt (2.9%) to the global marine
fisheries yield. For these two LMEs, exploitation levels are high with 90% of the species
in a fully exploited to overexploited condition (Table 3). The fisheries are also subjected
to periodic oceanographic regime shifts affecting the abundance of biomass yields
(Chavez et al. 2003). Among the fast warming East Asian Seas LMEs, no analysis has
been conducted for the ice-covered Chukchi Sea LME, as the data is limited and of
questionable value.
Accelerated warming and emergent trends in fisheries biomass yields
53
(A)
1,000,
1,
000
000,
600,0
600, 00
0
200,
2
0
00, 0
0 0
0
900,000
900,
500,0
500, 00
0
800,000
800,
150,
1
0
50, 0
0 0
0
9
400,0
400, 00
0
700,000
8
_ 700,000
_
_
E
E
_18
E
LM 600,000
600,
LM 300,0
300, 00
0
LM
100,
1
0
00, 0
0 0
0
500,000
500,
200,0
200, 00
0
400,000
400,
300,000
300,
100,0
100, 00
0
50,
50 0
, 0
0 0
0
1981
1989
1
1997
200
20 5
0
1981
1989
1997
1
200
2 5
00
1981
19
19
1 8
9 9
8
1997
19
20
2 0
0 5
0
YEA
YE R
A
YEA
YE R
A
YEA
YE R
A
Newfoundland/Labrador Shelf LME Scotian Shelf LME West Greenland Shelf LME
(B)
4,000,
4,
000
000,
5,000
00 ,
0 00
, 0
00
3,000,
00 000
00
3,000,
3,
000
000,
4,000
00 ,
0 00
, 0
00
2,000,
00 000
00
_48
_47
_49
E
E
E
LM
LM
LM
2,000,
2,
000
000,
3,000
00 ,
0 00
, 0
00
1,000,
00 000
00
1,000,
1,
000
000,
2,000
00 ,
0 00
, 0
00
0
1981
1989
1
1997
1
200
20 5
0
1981
198
198
1 9
98
1997
199
200
2 5
00
1981
198
19
1 8
9 9
8
1997
1
200
2 5
00
YEA
YE R
A
YEA
YE R
A
YEA
YE R
A
Yellow Sea LME
East China Sea LME
Kuroshio Current LME
2,500
50 ,
0 00
, 0
00
2,000
00 ,
0 00
, 0
00
_50
E
LM
1,500
50 ,
0 00
, 0
00
1,000
00 ,
0 00
, 0
001981
198
1989
198
199
1 7
99
2005
200
YEA
YE R
A
Sea of Japan/East Sea
Figure 9. Comparative fisheries biomass yields (in metric tons) in the fast warming clusters of the (A)
Northwest Atlantic (C4) LMEs and the(B) Asian (C5, C6) LMEs
Comparative Fisheries Biomass Yields (in metric tons) in Moderate
Warming Western Atlantic LMEs (C7), Eastern Atlantic (C8) LMEs, and
LMEs of the Asian Northwest Pacific region
A large cluster of moderately warming LMEs can be found in the Trade Winds region of
the Atlantic Ocean. This is an important cluster of LMEs contributing 5.1 mmt (7.9%) to
the mean annual global biomass yield. Five LMEs are clustered in the Western Atlantic,
and two in the Eastern Atlantic. In the West Atlantic Ocean, the Gulf of Mexico LME
fisheries biomass yields are decreasing, while in the Caribbean, North Brazil, East
Brazil, and South Brazil Shelf LMEs fisheries biomass yields are increasing (Figure
10A).
54
Sherman et al.
The fisheries biomass yield trends in the Atlantic Ocean region appear to be driven
principally by heavy exploitation rather than climate warming. The Caribbean, North
Brazil, and East Brazil Shelf LMEs are in a fully exploited and over-exploited fisheries
condition equal to or greater than 88% of the stocks. In the South Brazil Shelf, 60% of
fisheries are fully exploited or overexploited (Table 3). The East Brazil Shelf and South
Brazil Shelf LMEs are dominated by small pelagics and/or "mixed species"
(A)
2,000,
2,
000
000,
500,
5
00
00, 0
00
35
3 0,
5 00
0, 0
00
1,500,
1,
000
500,
400,
4
00
00, 0
00
30
3 0,
0 00
0, 0
00
5
_
E
_12
_17
E
E
LM
LM
LM
1,000,
1,
000
000,
300,
3
00
00, 0
00
25
2 0,
5 00
0, 0
00
500,000
500,
200,
2
00
00, 0
00
20
2 0,
0 00
0, 0
00
1981
1989
1
1997
200
20 5
0
19
1 81
9
1989
19
1997
19
2005
200
1981
1
1989
19
1997
19
2005
200
YEA
YE R
A
YEA
YE R
A
YEA
YE R
A
Gulf of Mexico LME
Caribbean LME
North Brazil LME
300
30 ,
0 0
, 0
0 0
0
250
25 ,
0 0
, 0
0 0
0
250
25 ,
0 0
, 0
0 0
0
200
20 ,
0 0
, 0
0 0
0
_16
_15
200
20 ,
0 0
, 0
0 0
E
0
E
E
LM
LM
150
15 ,
0 0
, 0
0 0
0
150
15 ,
0 0
, 0
0 0
0
100
10 ,
0 0
, 0
0 0
0
100
10 ,
0 0
, 0
0 0
0
1981
1
1989
19
1997
19
2005
200
1981
1
1989
19
1997
19
2005
200
YEA
YE R
A
YEA
YE R
A
East Brazil LME
South Brazil LME
(B)
3,000,
3,
000
00
1,100,
1,
000
00
1,000,
1,
000
00
2,500,
2,
000
00
900,000
00
_27
_28
E
E
LM
LM 800,000
00
2,000,
2,
000
00
700,000
00
1,500,
1,
000
00
600,000
00
1981
1989
1997
200
2 5
00
1981
1989
1
1997
2005
200
YEA
YE R
A
YEA
YE R
A
Canary Current LME
Guinea Current LME
(C)
1,100,
1,
000
100,
5,0
5, 00,
0
000
2,0
2, 00,
0
000
1,000,
1,
000
000,
900,000
900,
4,0
4, 00,
0
000
1,5
1, 00,
5
000
800,000
800,
700,000
_51 700,
_51
_52
_53
E
3,0
3, 00,
0
000
E
1,0
1, 00,
0
000
E
600,000
600,
LM
LM
LM
500,000
500,
2,0
2, 00,
0
000
500,
5
000
400,000
400,
300,000
300,
200,000
200,
1,0
1, 00,
0
000
0
1981
1989
1
1997
200
20 5
0
1981
19
1989
198
1997
199
2005
200
1981
19
1989
198
1997
199
2005
200
YEA
YE R
A
YEA
YE R
A
YEA
YE R
A
Oyashio Current LME
Sea of Okhotsk LME West Bering Sea LME
Figure 10. Comparative Fisheries Biomass Yields (in metric tons) in Moderate Warming (A) Western
Atlantic LMEs (C7), (B) Eastern Atlantic (C8) and (C) Pacific LMEs
Accelerated warming and emergent trends in fisheries biomass yields
55
The two LMEs of the Eastern Atlantic are important sources of food security to the over
300 million people of West African countries adjacent to the LMEs. The Canary Current
and the Guinea Current are showing increasing trends in biomass yield with "mixed
species" dominant (Heileman 2008) (Figure 10 B&C. The fisheries stocks in both LMEs
are at risk. Oceanographic perturbations are also a source of significant variability in
biomass yields in the Guinea Current (Hardman-Mountford and McGlade 2002;
Koranteng and McGlade 2002) and in the waters of the Canary Current LME (Roy and
Cury 2003)(www.thegef.org, IW Project 1909).
Three LMEs, the Sea of Okhotsk, the Oyashio Current, and the West Bering Sea,
contribute 2.3 mmt (3.5%) to the mean annual global biomass yield. They are in a
condition where 78% of the fisheries stocks are overexploited (Table 3). The Oyashio
Current and the West Bering Sea LMEs show decreasing trends in fisheries yields
(Figure 10C. In the Sea of Okhotsk, the biomass yields are dominated by targeted table
fish including pollock and cod. The increasing yield trend in the Sea of Okhotsk LME is
related principally to a high level of overexploitation (Shuntov et al. 1999).
Comparative Fisheries biomass yields in Moderately Warming Southwest
Pacific LMEs (C10) and other Non-clustered, Moderately Warming LMEs
The three moderately warming LMEs, two on the east coast of Australia (Northeast and
East Central Australia LMEs) and the New Zealand Shelf LME, contribute 0.4 mmt
(0.7%) to the mean annual global biomass yield. Biomass yields are decreasing in the
Australian LMEs, whereas they are increasing in the New Zealand Shelf LME (Figure 11)
under the present condition of full exploitation (Table 3). Whether their conditions are the
result of top down or bottom up forcing is not clear. However, Individual Transferable
Quota (ITQ) management to promote the recovery and sustainability of high priority
fisheries stocks is in place. Stewardship agencies in Australia and New Zealand have
implemented management actions for the recovery and sustainability of the overexploited
species.
Six moderately warming LMEs occur in separate locations. Taken together they
contribute 7.7 mmt (11.8%) to the mean annual global biomass yields. In the Pacific,
landings are too low in the moderately warming Insular Pacific Hawaiian LME to draw
any conclusion on biomass yield. In the moderate warming Gulf of Alaska LME, the
overall 25-yr. fisheries biomass trend is decreasing. However, this LME shows evidence
of a relatively recent upturn in yield, attributed to increases in biomass of Alaska Pollock
and Pacific salmon populations in response to climate warming (Overland et al. 2005).
The biomass of the moderately warming Gulf of California LME is in a declining trend
(Figure 11). The dominant biomass yield in this LME is from small pelagics and "mixed
species," suggestive of top down fishing as the principal driver of the decline. The South
China Sea fisheries biomass yields are increasing. The dominant biomass yield of the
LME is of "mixed species" and the level of exploitation is high with 83% fully exploited
and 13% overexploited (Table 3). In this case, high population demand for protein by the
adjacent countries contributes to drive the biomass yield upward.
The Arctic region's Beaufort Sea LME, landings data are unavailable. The moderate
warming East Greenland Shelf fisheries biomass yields are increasing with capelin,
redfish and shrimp dominant; following the earlier collapse of cod and other demersal
species. The role of global warming in relation to cause and effect of increasing yields is
not known.
56
Sherman et al.
Table 3. LMEs, rates of warming, 5-yr. mean fisheries biomass yields, adjacent to developing or
developed countries, status of stocks exploitation.
Accelerated warming and emergent trends in fisheries biomass yields
57
58
Sherman et al.
80,
80 0
, 0
0 0
0
50,000
50,
60
6 0,
0 00
0, 0
00
70,
70 0
, 0
0 0
0
40,000
40,
50
5 0,
0 00
0, 0
00
60,
60 0
, 0
0 0
0
50,
50 0
, 0
0 0
0
_40
_41
_46
E
30,000
E 30,
E
40
4 0,
0 00
0, 0
E
00
E
40,
40 0
, 0
0 0
LM
0
LM
LM
LM
30,
30 0
, 0
0 0
0
20,000
20,
30
3 0,
0 00
0, 0
00
20,
20 0
, 0
0 0
0
10,
10 0
, 0
0 0
0
10,000
10,
20
2 0,
0 00
0, 0
00
1981
19
1989
19
1997
19
20
2 0
0 5
0
1981
1989
19
1997
200
20 5
0
19
1 81
9
1989
19
1997
19
2005
200
YEA
YE R
A
YEA
YE R
A
YEA
YE R
A
NE Australia LME
East Central Australia LME
New Zealand Shelf
80,000
80,
1,500
50 ,
0 00
, 0
00
300,
3
0
00, 0
0 0
0
70,000
70,
1,400
40 ,
0 00
, 0
00
60,000
60,
1,300
30 ,
0 00
, 0
00
200,
2
0
00, 0
0 0
0
50,000
0 50,
0
1,200
20 ,
0 00
, 0
00
2
4
_
1
_
_
40,000
E 40,
E
E 1,100
10 ,
0 00
, 0
00
E
LM
LM
LM
30,000
30,
1,000
00 ,
0 00
, 0
00
100,
1
0
00, 0
0 0
0
20,000
20,
900
90 ,
0 00
, 0
00
10,000
10,
800
80 ,
0 00
, 0
00
0
700
70 ,
0 00
, 0
00
0
1981
1989
19
1997
200
20 5
0
1981
198
1989
198
1997
199
200
2 5
00
1981
19
19
1 8
9 9
8
1997
19
20
2 0
0 5
0
YEA
YE R
A
YEA
YE R
A
YEA
YE R
A
Insular Pacific Hawaiian LME
Gulf of Alaska LME
Gulf of California
7,0
7, 00,
0
000
200,
2
000
00
6,0
6, 00,
0
000
150,
1
000
00
5,0
5, 00,
0
000
_36
E
_19 100,
1
000
E
00
E
LM 4,0
4, 00,
0
000
LM
50,000
00
3,0
3, 00,
0
000
2,0
2, 00,
0
000
0
1981
19
1989
198
1997
199
2005
200
1981
19
1989
1997
1
200
20 5
0
YEA
YE R
A
YEA
YE R
A
South China Sea LME East Greenland Shelf LME
Figure 11. Comparative Fisheries Biomass Yields (in metric tons) in Moderately Warming Southwest
Pacific LMEs (C10) and other Moderately Warming LMEs
Comparative Fisheries Biomass Yields in Slow Warming Indian Ocean and
Adjacent LMEs (C11)
The 10 LMEs of the Indian Ocean, Arabian Sea, Bay of Bengal, Agulhas Current,
Somali Current, Indonesian Sea, North Australia, Northwest Australia, West Central
Australia, Southwest Australia and Southeast Australia LMEs are in the slow range
of climate warming and their biomass trends are all increasing. This group of LMEs
contributes 8.6 million metric tons, or 13.2% of the global biomass yield. The slow
warming is consistent with the IPCC forecast of slow but steady warming of the Indian
Ocean in response to climate change (IPCC 2007). While biomass yields are
increasing, the landings adjacent to developing countries are composed primarily of
mixed species and small pelagics (Heileman 2008) and the stocks are predominantly fully
exploited and/or overexploited (Table 3), suggesting that top down fishing is the
predominant influence on the condition of biomass yield. In the adjacent Southwest
Pacific waters, the slow warming Sulu-Celebes and Gulf of Thailand LMEs contribute 1.8
mmt (2.8%) to the mean annual global biomass yield. The consistent pattern of
Accelerated warming and emergent trends in fisheries biomass yields
59
increasing yields of the Indian Ocean LMEs adjacent to developing countries is driven
principally by the demand for fish protein and food security (Ahmad et al. 1998; Dwivedi
and Choubey 1998). In the case of the 5 LMEs adjacent to Australia, the national and
provincial stewardship agencies are promoting stock recovery and sustainable
management through ITQs. The fisheries stocks in the LMEs adjacent to developing
countries are under national pressure to further continue to expand the fisheries to
provide food security for the quarter of the world's population inhabiting the region. Given
the demands on fisheries for food security for the developing countries bordering the
Indian Ocean, there is a need to control biomass yields and sustain the fisheries of the
bordering African and Asian LMEs.
3,000,
000 0
, 00
0
4,000,
000 0
, 00
0
400,00
0 0
0
2,500,
500 0
, 00
0
3,000,
000 0
, 00
0
300,00
0 0
0
3
2
_
_34
_30
2,000,
000 0
, 00
E
0
E
E
E
LM
LM
LM
2,000,
000 0
, 00
0
200,00
0 0
0
1,500,
500 0
, 00
0
1,000,
000 0
, 00
0
1,000,
000 0
, 00
0
100,00
0 0
0
1981
198
19
1 8
9 9
8
1997
1
2005
200
1981
19
19
1 8
9 9
8
1997
19
2005
200
1981
1989
1997
2005
200
YEA
YE R
A
YEA
YE R
A
YEA
YE R
A
Arabian Sea LME
Bay of Bengal
Agulhas Current LME
3,000,
000 0
, 00
0
70,000
00
200,00
0 0
0
60,000
00
2,500,
500 0
, 00
0
150,00
0 0
0
50,000
00
3
9
_31
_38
_
E
2,000,
000 0
, 00
E
0
E
E
LM 40,000
00
LM
LM
100,00
0 0
0
1,500,
500 0
, 00
0
30,000
00
20,000
00
1,000,
000 0
, 00
0
50,000
00
1981
1989
1997
199
20
2 0
0 5
0
1981
198
19
1 8
9 9
8
1997
1
2005
200
1981
1989
1997
2005
200
YEA
YE R
A
YEA
YE R
A
YEA
YE R
A
Somali Current LME
Indonesian Sea LME
North Australia LME
22
2 ,
2 000
50,
50 000
70,00
70, 0
00
21
2 ,
1 000
45,
45 000
60,00
60, 0
00
4 20
2 ,
0 000
3
_45 50,00
50, 0
E
00
E
E_4
40,
40 000
E_4
LM
LM 19
1 ,
9 000
LM
40,00
40, 0
00
35,
35 000
18
1 ,
8 000
30,00
30, 0
00
17
1 ,
7 000
30,
30 000
1981
1989
1997
199
20
2 0
0 5
0
1981
1989
1997
2005
200
1981
19
1989
19
1997
199
2005
200
YEA
YE R
A
YEA
YE R
A
YEA
YE R
A
Northwest Australia LME
West-Central Australia Southwest Australia LME
40,
40 000
0
35,
35 000
0
2
_
4
30,
30 000
E
0
E
LM
25,
25 000
0
20,
20 000
0 19
1 8
9 1
8
1989
19
1997
19
20
2 0
0 5
0
YEA
YE R
A
Southeast Australia LME
Figure 12. Comparative Fisheries Biomass Yields (in metric tons) in Slow Warming Indian Ocean and
Adjacent LMEs (C11)
60
Sherman et al.
The biomass yields of other slow warming LMEs of the Northwest Atlantic
and the United States East Coast, Barents Sea, East Bering Sea,
Patagonian Shelf, Benguela Current, and Pacific Central American Coastal
LMEs
There is slow warming taking place in the Northeast US Shelf and in the Southeast US
Shelf. The LMEs contribute 1.0 mmt (1.6%) to the mean annual global marine biomass
yield. For both LMEs, the declines are attributed principally to overfishing (NMFS 2006)
For these two LMEs and the Gulf of Mexico, the Gulf of Alaska, the East Bering Sea,
Chukchi Sea, Beaufort Sea, Insular Pacific Hawaiian Islands, and the Caribbean, the
United States has underway a fisheries stock rebuilding program for increasing the
spawning stock biomass of overfished species(NMFS 2007).
Biomass yields of the slow warming LMEs of the Arctic region
For several of the slow warming LMEs bordering the Arctic including the Laptev Sea,
Kara Sea, East Siberian Sea and Hudson Bay, biomass yield data is at present
incomplete and is not included in the trend analyses. In the case of the Barents Sea
LME, there is a decreasing biomass trend attributed to the over-exploited condition of
many fish stocks inhabiting the LME (Table 3)(Figure 13). During the present warming
condition, variability in ice cover has an important influence on biomass yields (Matishov
et al. 2003)
Biomass yields of other LMEs
Four widely separated LMEs, the East Bering Sea, the Patagonian Shelf, Benguela
Current, and Pacific Central American LMEs are located in slow warming waters
(Figure 13). Together they contribute 3.3 mmt (5.1%) to the mean annual global biomass
yield. In the North Pacific Ocean, the slow warming East Bering Sea has an overall
decline in fisheries biomass yield. However, in recent years there has been an upturn in
yield, attributed to climate warming and increases in biomass of Alaska Pollock and
Pacific Salmon populations (Overland et al. 2005). In the Southwest Atlantic Ocean
Patagonian Shelf LME, increasing biomass yields are reflective of a very high level of
fisheries exploitation, overshadowing any climate change effects, where 30% of fisheries
are fully exploited, and 69% are overexploited (Table 3). The increasing biomass trends
of the Pacific Central American Coastal LME are the result of high levels of exploitation
(Table 3) driven principally by the need for fish protein and food security of the adjacent
developing countries and secondarily by oceanographic regime shifts (Bakun et al. 1999).
The biomass yields of the Benguela Current (BCLME), southwest African coast are in a
declining trend (Figure 13). The living resources of the BCLME have been stressed by
both heavy exploitation and environmental perturbations during the past 25 years (van
der Lingen et al. 2006) The southwestward movement of sardines (Sardinella)
populations from the coastal areas off Namibia to southeastern South Africa has been
attributed to recent warming. The southerly migration has disrupted the Namibian
fisheries. A further southerly movement of sardines and anchovies from the vicinity of
island colonies of African penguins off South Africa led to a decrease in availability of
small pelagic fish prey of penguins resulting in a 40% penguin population decline (Koenig
2007).
Accelerated warming and emergent trends in fisheries biomass yields
61
1,500,
500 0
, 00
0
200,000
2,000,
000 0
, 00
0
1,400,
400 0
, 00
0
1,300,
300 0
, 00
0
1,500,
500 0
, 00
0
1,200,
200 0
, 00
0
150,000
1,100,
100 0
, 00
0
E_7
E_6
_
20
1,000,
000 0
, 00
E
0
E
1,000,
000 0
, 00
LM
0
LM
LM
LM
900,
900 0
, 00
0
100,000
500,
500 0
, 00
0
800,
800 0
, 00
0
700,
700 0
, 00
0
600,
600 0
, 00
0
50,000
0
1981
198
19
1 8
9 9
8
1997
1
2005
200
1981
1989
1997
2005
200
1981
198
19
1 8
9 9
8
1997
1
2005
200
YEA
YE R
A
YEA
YE R
A
YEA
YE R
A
U.S. Northeast shelf LME
U.S. Southeast Shelf LME
Barents Sea LME
2,500,
500 0
, 00
0
2,
2 00
0 0,
0 00
0, 0
00
3,000,
000 0
, 0
0 0
0
2,000,
000 0
, 00
0
1,
1 50
5 0,
0 00
0, 0
00
2,000,
000 0
, 0
0 0
0
9
_
1
14
E
_
2
1,500,
500 0
, 00
0
E_
E
LM
LM
LM
1,
1 00
0 0,
0 00
0, 0
00
1,000,
000 0
, 0
0 0
0
1,000,
000 0
, 00
0
500,
500 0
, 00
0
50
5 0,
0 00
0, 0
00
0
1981
198
19
1 8
9 9
8
1997
1
2005
200
1981
198
1989
19
19
1 97
9
2005
200
1981
198
1989
19
19
1 97
9
2005
200
YEA
YE R
A
YEA
YE R
A
YEA
YE R
A
East Bering Sea LME
Patagonian Shelf LME Benguela Current LME
1,
1 00
0 0,
0 00
0, 0
00
90
9 0,
0 00
0, 0
00
80
8 0,
0 00
0, 0
00
11
70
7 0,
0 00
0, 0
E_
00
E_
LM
60
6 0,
0 00
0, 0
00
50
5 0,
0 00
0, 0
00
40
4 0,
0 00
0, 0
001981
198
1989
19
19
1 97
9
2005
200
YEA
YE R
A
Pacific Central American LME
Figure 13. Comparative Fisheries Biomass Yields (in metric tons) in Slow Warming LMEs of the United
States East Coast, Barents Sea, East Bering Sea, Patagonian Shelf, Benguela Current and Pacific
Central American Coastal LMEs
Discussion
Emergent trends
From the analysis, we conclude that in four LME cases the warming clusters of LMEs are
influencing 7.5 mmt or 11.3% of the world's fisheries biomass yields. The first and
clearest case for an emergent effect of global warming on LME fishery yields is in the
increasing biomass yields of the fast warming temperature clusters affecting 3.4 mmt
(5.0%) of global yields for the Iceland Shelf, Norwegian Sea, and Faroe Plateau LMEs in
the northern Northeast Atlantic. Warming in this region has exceeded levels expected
from entering the warm phase of the Atlantic Multi-decadal Oscillation (Trenberth and
Shea 2006). The increase in zooplankton is related to warming waters in the northern
areas of the Northeast Atlantic (Beaugrand et al. 2002) leading to improved feeding
conditions of three zooplanktiverous species that are increasing in biomass yields.
Herring, blue whiting, and capelin yields are increasing in the Iceland Shelf and
Norwegian Sea LMEs, and blue whiting yields are increasing in the Faroe Plateau LME.
The second case is in the contrasting declines in biomass yields of the fast warming
cluster of more southern Northeast Atlantic waters including the North Sea, the Celtic-
62
Sherman et al.
Biscay Shelf, and Iberian Coastal LME where declines in warm water plankton (Valdés et
al. 2007) and northward movement of fish (Perry et al. 2005) are a negative influence on
4.1 mmt (6.3%) of the mean annual global biomass yields. Recent investigations have
found that SST warming in the northeast Atlantic is accompanied by increasing
zooplankton abundance in cooler more northerly areas, and decreasing phytoplankton
and zooplankton abundance in the more southerly warmer regions of the northeast
Atlantic in the vicinity of the North Sea, Celtic-Biscay Shelf and Iberian Coastal LMEs
(Richardson and Schoeman 2004). Due to tight trophic coupling fisheries are adversely
affected by shifts in distribution, reduction in prey and reductions in primary productivity
generated by strong thermocline stratification inhibiting nutrient mixing (Behrenfeld et al.
2006).
In the third case, recent moderate warming of the Gulf of Alaska, and slow warming of
the East Bering Sea are supporting increasing levels of zooplankton production and
recent increasing biomass yields of Alaska Pollock and Pacific Salmon (Grebmeier et al.
2006; Hunt et al. 2002; Overland et al. 2005).
The biomass yields of the fourth case are more problematic. Biomass yields of all 10
LMEs (8.6 mmt) (13.2%) around the western and central margin of the Indian Ocean are
increasing (Figure 12). The increasing yields of the five LMEs adjacent to developing
countries, the Agulhas Current, Somali Current, Arabian Sea, Bay of Bengal and
Indonesian Sea are dominated by mixed species and small pelagic species, driven by the
fish protein and food security needs of nearly one quarter of the world's population
inhabiting the bordering countries of Africa and Asia (Heileman and Mistafa 2008). The
overexploited condition of most species is at present masking any gains in biomass yield
that may be attributed to the slow and steady warming of waters predicted for the Indian
Ocean by the IPCC (2007) and observed during the present study. In contrast, the slow
warming five Australian LMEs on the eastern margin of the Indian Ocean are driven
principally by economic considerations and are closely monitored by governmental
stewardship agencies that practice an adaptive management system of Individual
Transferable Quotas (Aquarone and Adams 2008a). Taken together, the 8.6 mmt mean
annual biomass yield of the Indian Ocean LMEs are critical for food security of the heavily
populated adjacent countries. In this region there is a need to exercise a precautionary
approach (FAO 1995) to recover and sustain the fisheries in the LMEs of east Africa and
Asia, in the slow warming clusters.
Precautionary Cap and Sustain Action
From a global perspective 38.2 mmt or 58% of the mean annual 2001-2006 biomass
yields are being produced in 29 LMEs adjacent to developing countries (Table 2). This
vital global resource is at risk from serious overexploitation (Table 3). Given the
importance for sustaining 58% of the world's marine fisheries biomass yield, it would be
prudent for the GEF supported LME assessment and management projects to
immediately cap the total biomass yield at the annual 5-year mean (2000-2004) as a
precautionary measure and move toward adoption of more sustainable fisheries
management practices.
The management strategies for protecting the 26.8 mmt or 42% of global marine biomass
yields in LMEs adjacent to the more developed countries (Table 2) have had variable
results ranging from highly successful fisheries biomass yield recovery and sustainability
actions for stocks in LMEs adjacent to Australia, New Zealand, the United States,
Norway, and Iceland to the less successful efforts of the European Union and LMEs
under EU jurisdiction in the Northeast Atlantic (Gray and Hatchard 2003). An ecosystem-
based cap and sustain adaptive management strategy for groundfish based on an annual
overall total allowable catch level and agreed upon TACs for key species is proving
Accelerated warming and emergent trends in fisheries biomass yields
63
successful in the management of the moderately warming waters of the Gulf of Alaska
LME and slow warming East Bering Sea LME Alaska Pollock and Pacific Salmon stocks,
providing evidence that cap and sustain strategies can serve to protect fisheries biomass
yields (NPFMC 2002; Witherell et al. 2000).
In LMEs where primary productivity, zooplankton production and other ecosystem
services are not seriously impaired, exploited, overexploited and collapsed stocks as
defined by Pauly and Pitcher (2000) can be recovered where the principal driver is
excessive fishing mortality and the global warming rates are moderate or slow. The
principal pelagic and groundfish stocks in the slow warming US Northeast Shelf
ecosystem have been targeted for rebuilding from the depleted state of the 1960s and
1970s by the New England Fisheries Management Council and the Mid Atlantic Fisheries
Management Council. In collaboration with NOAA-Fisheries and the results of
productivity and fisheries multi-decadal assessment surveys it was concluded that the
principal driver of the declining trend in biomass yield was overfishing. Reductions in
foreign fishing effort in the 1980s resulted in the recovery of herring and mackerel stocks.
Further reductions in US fishing effort since 1994 initiated recovery of spawning stock
biomass of haddock, yellowtail flounder and sea scallops. Similar fish stock rebuilding
efforts are underway in all 10 of the LMEs in the US coastal waters (NMFS 2007).
From our analysis, it appears that the emerging increasing trends in biomass yields can
be expected to continue in fast warming LMEs of the northern North Atlantic (Iceland
Shelf, Faroe Plateau, Norwegian Sea) and the moderate and slow warming LMEs of the
northeast Pacific (Gulf of Alaska, East Bering Sea and the U.S. Northeast Shelf). The
countries bordering these LMEs (U.S., Norway, Faroes Islands) have in place sufficiently
advanced ecosystem-based capacity to support adaptive assessment and management
regimes for maintaining sustainable levels of fishery biomass yields.
In the absence of the capacity for conducting annual assessments for a large number of
marine fish species in many developing countries, and in recognition of the uncertainties
of effects of climate warming, in the observed slow warming and increasing fisheries
biomass yields of LMEs adjacent to east Africa and south Asia along the margins of the
Indian Ocean, it would be prudent for the bordering countries to implement precautionary
actions to protect present and future fishery yields with a cap and sustain strategy aimed
at supporting long term food security and economic development needs.
REFERENCES
Ahmad HbA, Ahmed L, Atapattu A, Chullasorn S, Lui YP, Maniku MH, Nickerson DJ,
Pimoljinda J, Purwaka TH, Saeed S and others. 1998. Regional stewardship for
sustainable marine resources: Management in the Bay of Bengal. In: Sherman K,
Okemwa EN, Ntiba MJ, editors. Large Marine Ecosystems of the Indian Ocean:
Assessment, sustainability, and management. Malden, MA: Blackwell Science. p 369-
378.
Aquarone MC, Adams S. 2008a. VIII East Asian Seas: 13 North Australia LME; 17 West-Central
Australia LME; IX Pacific (SPREP): 21 Southeast Australia LME. In: Sherman K,
Hempel G, editors. The UNEP Large Marine Ecosystems Report: A perspective on
changing conditions in LMEs of the world's Regional Seas. Nairobi, Kenya: UNEP
Aquarone MC, Adams S. 2008b. XI Arctic: 30 Beaufort Sea LME; XIII North-East Atlantic: 39
East Greenland Shelf LME. In: Sherman K, Hempel G, editors. The UNEP Large Marine
64
Sherman et al.
Ecosystems Report: A perspective on changing conditions in LMEs of the world's
Regional Seas. Nairobi, Kenya: UNEP.
Astthorsson OS, Vilhjalmsson H. 2002. Iceland Shelf large marine ecosystem. In: Sherman K,
Skjoldal HR, eds, editors. Large marine ecosystems of the North Atlantic: Changing
states and sustainability. Amsterdam: Elsevier Science. p 219-244. 449p.
Bakun A, Csirke J, Lluch-Belda D, Steer-Ruiz R. 1999. The Pacific Central American Coastal
LME. In: Sherman K, Tang Q, editors. Large Marine Ecosystems of the Pacific Rim:
Assessment, sustainability, and management. Malden, MA: Blackwell Science. p 268-
279.
Beaugrand G, Ibanez F. 2004. Monitoring marine plankton ecosystems. II: Long-term changes in
North Sea calanoid copepods in relation to hydro-climatic variability. Mar Ecol Prog Ser
284(December 21):35-47.
Beaugrand G, Reid PC, Ibanez F, Lindley JA, Edwards M. 2002. Reorganization of North Atlantic
Marine Copepod Biodiversity and Climate. Science 296:1692-1694.
Behrenfeld MJ, O'Malley R, Siegel D, McClain C, Sarmiento J, Feldman G, Milligan A,
Falkowski P, Letelier R, Boss E. 2006. Climate-driven trends in contemporary ocean
productivity. Nature 444:752-755.
Belkin IM. 2008. Rapid warming of Large Marine Ecosystems. Progress in Oceanography
submitted.
Chassot E, Mélin F, Le-Pape O, Gascuel D. 2007. Bottom-up control regulates fisheries
production at the scale of eco-regions in European seas. Marine Ecology Progress Series
343(7 August 2007):45-55.
Chavez FP, Ryan J, Lluch-Cota SE, Ńiquen C. M. 2003. From anchovies to sardines and back:
Multidecadal change in the Pacific Ocean. Science 299(10 January 2003):217-221.
Choi JS, Frank KT, Leggett WC, Drinkwater K. 2004. Transition to an alternate state in a
continental shelf ecosystem. Can. J. Fish. Aquat. Sci. 61:505-510.
Cleveland WS, Devlin SJ. 1988. Locally weighted regression: An approach to regression analysis
by local fitting. Journal of the American Statistical Association 83:596-610.
COMPASS. Communication Partnership for Science and the Sea: Scientific Consensus Statement
on Marine Ecosystem-Based Management Released 21 March 2005.
www.compassonline.org/pdf_files/ EBM_Consensus_Statement_v12.pdf.; 2005 August
2007.
Daskalov GM. 2003. Overfishing drives a trophic cascade in the Black Sea. In: Hempel G,
Sherman K, editors. Large Marine Ecosystems of the World: Trends in Exploitation,
Protection, and Research. the Netherlands: Elsevier Science. p 171-191.
Duda AM, Sherman K. 2002. A new imperative for improving management of large marine
ecosystems. Ocean and Coastal Management 45(2002):797-833.
Dwivedi SN, Choubey AK. 1998. Indian Ocean Large Marine Ecosystems: Need for national and
regional framework for conservation and sustainable development. In: Sherman K,
Okemwa EN, Ntiba MJ, editors. Large Marine Ecosystems of the Indian Ocean:
Assessment, sustainability, and management. Malden, MA: Blackwell Science. p 361-
368.
FAO. 1995. Code of Conduct for Responsible Fisheries; Precautionary Principle. In: FAO, editor:
FAO Document Repository.
FAO. 2004. The State of World Fisheries and Aquaculture 2004. Rome: FAO Corporate
Document Repository.
Frank KT, Petrie B, Choi JS, Leggett WC. 2005. Trophic cascades in a formerly cod-dominated
ecosystem. Science 308:1621-1623.
Froese R, Kesner-Reyes K. 2002. Impact of fishing on the abundance of marine species. ICES CM
2002/L:12, 15p.
Gaard G, Hansen B, Bergur Olsen JR. 2002. Ecological Features and Recent Trends in the
Physical Environment, Plankton, Fish Stocks, and Seabirds in the Faroe Shelf Ecosystem.
In: Sherman K, Skjoldal HR, editors. Large Marine Ecosystems of the North Atlantic:
Changing States and Sustainability. Amsterdam: Elsevier.
Accelerated warming and emergent trends in fisheries biomass yields
65
Garcia SM, Newton C. 1997. Current situation, trends,and prospects in world capture fisheries. In:
Pikitch EL, Huppert DD, Sissenwine MP, editors. Global trends: fisheries management.
Bethesda, Maryland: American Fisheries Society Symposium 20. p 3-27.
González-Laxe F. 2007. Territorialisation processes in fisheries management. Ocean and Coastal
Management 51:259-271.
Gray T, Hatchard J. 2003. The 2002 reform of the Common Fisheries Policy'ssystem of
governance--rhetoric or reality? Marine Policy 27(6):545-554.
Grebmeier JM, Overland JE, Moore SE, Farley EV, Carmack EC, Cooper LW, Frey KE, Helle JH,
McLaughlin FA, McNutt SL. 2006. A major ecosystem shift in the northern Bering Sea.
Science 311(10 March 2006):1461-1464.
Hardman-Mountford NJ, McGlade JM. 2002. Variability of physical environmental processes in
the Gulf of Guinea and implications for fisheries recruitment. An Investigation using
remotely sensed sea surface temperature. In: McGlade JM, Cury P, Koranteng KA,
Hardman-Mountford NJ, editors. The Gulf of Guinea Large Marine Ecosystem:
Environmental forcing and sustainable development of marine resources. Amsterdam:
Elsevier. p 49-66.
Heileman S. 2008. I. West and Central Africa. In: Sherman K, Hempel G, editors. The UNEP
Large Marine Ecosystems Report: A perspective on changing conditions in LMEs of the
world's Regional Seas. . Nairobi, Kenya: UNEP.
Heileman S, Mistafa N. 2008. II Eastern Africa; VI ROPME Sea Area; VII South Asian Seas;VIII
East Asian Seas, IX Pacific (SPREP). In: Sherman K, Hempel G, editors. The UNEP
Large Marine Ecosystems Report: A perspective on changing conditions in LMEs of the
world's Regional Seas. Nairobi, Kenya: UNEP.
Hunt GL, Jr., Stabeno P, Walters G, Sinclair E, Brodeur RD, Napp JM, Bond NA. 2002. Climate
change and control of the southeastern Bering Sea pelagic ecosystem. Deep-Sea Research
II 49:5821-5853.
IPCC. 2007. Climate Change 2007: The Physical Science Basis. Contribution of Working Group
I to the Fourth Assessment Report of the Intergovernmental Panel on Climate Change.
Geneva, Switzerland: WMO, UNEP. 18 p.
Koenig R. 2007. African Penguin Populations Reported in a Puzzling Decline. Science 315(2
March):1205.
Koranteng KA, McGlade JM. 2002. Physico-chemical changes in continental shelf waters of the
Gulf of Guinea and possible impacts on resource variability. In: McGlade JM, cury P,
Koranteng KA, Hardman-Mountford NJ, editors. The Gulf of Guinea Large Marine
Ecosystem: Environmental forcing and sustainable development of marine resources.
Amsterdam: Elsevier. p 93-102.
Marra J, Ho C, Trees C. 2003. An alternative algorithm for the calculation of primary productivity
from remote sensing data. . LDEO.
Matishov G, Denisov VV, Dzhenyuk SL. 2003. Contemporary state and factors of stability of the
Barents Sea Large Marine Ecosystem. In: Hempel G, Sherman K, editors. Large Marine
Ecosystems of the World: Trends in exploitation, protection, and research. Amsterdam:
Elsevier. p 41-74.
Nixon SW, Oviatt CA, Frithsen J, Sullivan B. 1986. Nutrients and the productivity of estuarine
and coastal marine ecosystems. Journal of the Limnology Society of South Africa 12:43-
71.
NMFS. 2006. NOAA's National Marine Fisheries Service Report on the Status of the U.S.
Fisheries for 2006.
NMFS. 2007. Magnuson-Stevens Fishery Conservation and Management Act, As Amended
Through January 12, 2007 (Public Law 109-479).
www.nmfs.noaa.gov/msa2005/docs/MSA_amended_msa%20_20070112_FINAL.pdf.
NPFMC. 2002. Responsible Fisheries Management into the 21st Century. North Pacific Fishery
Management Council.
Overland JE, Boldt J, Stabeno PJ. 2005. Multiple indicators track major ecosystem shifts in the
Bering Sea. J.E. Overland, J. Boldt, P.J. Stabeno. Multiple indicators track major
ecosystem shifts in the Bering Sea. ICES CM 2005/M:21. ICES CM 2005/M:21.
66
Sherman et al.
Pauly D, Alder J, Booth S, Cheung WWL, Close C, Sumaila UR, Swartz W, Tavakolie A, Watson
R, Wood L and others. 2008. Fisheries in large marine ecosystems: Descriptions and
diagnoses. In: Sherman K, Hempel G, editors. The UNEP Large Marine Ecosystems
Report: A Perspective on Changing Conditions in LMEs of the World's Regional Seas.
The Hague: UNEP.
Pauly D, Pitcher TJ. 2000. Assessment and mitigation of fisheries impacts on marine ecosystems:
A multidisciplinary approach for basin-scale inferences, applied to the North Atlantic. p.
1-12 in D. Pauly and T.J. Pitcher (eds) Methods for Evaluating the Impacts of Fisheries
on North Atlantic Ecosystems. Fisheries Centre Research Reports 8(2).
Perry AL, Low PJ, Ellis JR, Reynolds JD. 2005. Climate change and distribution shifts in marine
fishes. Science 308(5730):1912-1915.
Prescott-Allen R. 2001. The Well-being of Nations: A country-by-country index of quality of life
and the environment. Washington, D.C.: Island Press. 342 p.
Rayner NA, Parker DE, Horton EB, Folland CK, Alexander LV, Rowell DP, Kent EC, Kaplan A.
2003. Global analyses of SST, sea ice and night marine air temperature since the late
nineteenth century. J. Geophys. Res. 108(doi:10.1029/2002JD002670,2003).
Rice J. 2002. Changes to the Large Marine Ecosystem of the Newfoundland-Labrador Shelf. In:
Sherman K, Skjoldal HR, editors. Large Marine Ecosystems of the North Atlantic. The
Netherlands: Elsevier Science B.V.
Richardson AJ, Schoeman DS. 2004. Climate impact on plankton ecosystems in the Northeast
Atlantic. Science 305(10 September 2004):1609-1612.
Roy C, Cury P. 2003. Decadal environmental and ecological changes in the Canary Current Large
Marine Ecosystem and adjacent waters: Patterns of connections and teleconnection. In:
Hempel G, Sherman K, editors. Large Marine Ecosystems of the World: Trends in
exploitation, protection, and research. Amsterdam: Elsevier. p 255-278.
Sherman K, O'Reilly J, Kane J. 2003. Assessment and sustainability of the Northeast Shelf
ecosystem. In: Hempel G, Sherman K, ed, editors. Large Marine Ecosystems of the
World: Trends in exploitation, protection, and research. Amsterdam: Elsevier BV. p 93-
120. 423p.
Shuntov VP, Dulepova EP, Lapko VV. 1999. Long-term variations in pelagic communities in the
Large Marine Ecosystems of the northwest Pacific Ocean. In: Sherman K, Tang Q,
editors. Large Marine Ecosystems of the Pacific Rim. Malden, MA: Blackwell Science. p
48-54.
Skjoldal Hr, Saetre R. 2004. Climate and ecosystem variability. In: Skjoldal HR, editor. The
Norwegian Sea Ecosystem. Trondheim: Tapir Academic Press.
Tang Q. 2003. The Yellow Sea and mitigation action. In: Hempel G, Sherman K, eds, editors.
Large marine ecosystems of the world: Trends in exploitation, protection and research.
Amsterdam, Netherlands: Elsevier Science. p 423p.
Tang Q. 2006. Changes in biomass yield in the central to southern part of Yellow Sea. In: 2006 T,
editor. IOC 8th LME Consultative Meeting. UNESCO, Paris.
Tang Q, Jin X. 1999. Ecology and variability of economically important pelagic fishes in the
Yellow Sea and Bohai Sea. In: Sherman K, Tang Q, editors. Large Marine Ecosystems of
the Pacific Rim: Assessment, sustainability, and management. Malden, MA: Blackwell
Science. p 179-197.
Trenberth KE, Shea DJ. 2006. Atlantic hurricanes and natural variability in 2005. Geophys. Res.
Lett. 33(L12704):doi:10.1029/2006GL026894.
Valdes L, Lavin A. 2002. Dynamics and human impact in the Bay of Biscay: An ecological
perspective. In: sherman K, Skjoldal HR, editors. Large Marine Ecosystems of the North
Atlantic: Changing States and Sustainability. The Netherlands: Elsevier Science B.V. p
293-320.
Valdés L, López-Urrutia A, Cabal J, Alvarez-Ossorio M, Bode A, Miranda A, Cabanas M, Huskin
I, Anadón R, Alvarez-Marqués F and others. 2007. A decade of sampling in the Bay of
Biscay: What are the zooplankton time series telling us? Progress in Oceanography 74(2-
3):98-114.
Accelerated warming and emergent trends in fisheries biomass yields
67
van der Lingen C, Freon P, Hutchings L, Roy C, Bailey G, Bartholomae C, Cockcroft A, Field J,
Peard K, Plas Avd. 2006. Resource and ecosystem variability, including regime shifts, in
the Benguela Current system. In: Shannon V, Hempel G, Malanotte-Rizzoli P, Moloney
C, Woods J, editors. Benguela: Predicting a Large Marine Ecosystem: Elsevier. p 147-
184.
Wang H. 2004. An evaluation of the modular approach to the assessment and management of
large marine ecosystems. Ocean Development and International Law 35:267-286.
Ware DM, Thomson RE. 2005. Bottom-up ecosystem trophic dynamics determine fish production
in the Northeast Pacific. Science 308:1280-1284.
Watson R, Pauly D, Christensen V, Froese R, Longhurst A, Platt T, Sathyendranath S, Sherman K,
O'Reilly J, Celone P. 2003. Mapping fisheries onto marine ecosystems for regional,
oceanic and global integrations. In: Hempel G, Sherman K, eds, editors. Large marine
ecosystems of the world: Trends in exploitation, protection, and research: Elsevier
Science. p 423p.
Witherell D, Pautzke C, Fluharty D. 2000. An ecosystem-based approach for Alaska groundfish
fisheries. ICES Journal of Marine Science 57:771-777.
Wozniak B, Dera J, Ficek D, Majchrowski R. 2003. Modeling light and photosynthesis in the
marine environment. Oceanologia 45(2):171-245.
Zhang CI, Kim S. 1999. Living marine resources of the Yellow Sea ecosystem in Korean Waters:
Status and perspectives. In: Sherman K, Tang Q, editors. Large Marine Ecosystems of the
Pacific Rim: Assessment, sustainability, and management. Malden, MA: Blackwell
Science. p 163-178.
68
Sherman et al.
Accelerated warming and emergent trends in fisheries biomass yields
69
APPENDIX 1. Mean annual SST for all LMEs and SST anomalies, 1982-2006.
70
Sherman et al.
Accelerated warming and emergent trends in fisheries biomass yields
71
72
Sherman et al.
Accelerated warming and emergent trends in fisheries biomass yields
73
74
Sherman et al.
Accelerated warming and emergent trends in fisheries biomass yields
75
76
Sherman et al.
Accelerated warming and emergent trends in fisheries biomass yields
77
APPENDIX 2. Fishery biomass yields by year for Large Marine Ecosystems, linear
regression lines cover the period 1982-2004, smoothing curves are LOWESS smoothers
at tension=0.5. LME numbers correspond to the LME numbers in Figure 1, p.42 (this
volume).
2,5,00,000
1,
1 50
, 0,
50 0
0, 0
0 0
800,
80 00
0, 0
00
300,
30 0
0, 0
0 0
1,
1 40
, 0,
40 0
0, 0
0 0
700,
70 00
0, 0
00
2,0
, 00,000
1,
1 30
, 0,
30 0
0, 0
0 0
200,
20 0
0, 0
0 0
1,
1 20
, 0,
20 0
0, 0
0 0
1
2
600,
60 00
0, 0
2
3
00
3
4
_
_
_
_
E 1,5
, 00,000
E 1,
1 10
, 0,
10 0
0, 0
0 0
E
E
LM
LM
LM 500,
50 00
0, 0
LM
000
1,
1 00
, 0,
00 0
0, 0
0 0
100,
10 0
0, 0
0 0
1,0
, 00,000
900,
90 0
0, 0
0 0
400,
40 00
0, 0
00
800,
80 0
0, 0
0 0
500,0
00, 00
0
700,
70 0
0, 0
0 0
300,
30 00
0, 0
00
0
198
9 1
1989
199
9 7
2005
1981
1989
199
9 7
2005
1981
1989
199
9 7
2005
198
19 1
8
1989
19
1997
19
20
2 0
0 5
YEAR
YE
YEAR
YEA
YEAR
YE
YEAR
YE
2,0
, 00,000
200,
20 0
0, 0
0 0
1,50
1, 0,
50 0
0, 0
0 0
0
600,
60 0
0, 0
0 0
1,40
1, 0,
40 0
0, 0
0 0
0
1,30
1, 0,
30 0
0, 0
0 0
500,
50 0
0, 0
0 0
00
1,5
, 00,000
150,
15 0
0, 0
0 0
1,20
1, 0,
20 0
0, 0
0 0
0
5
6
7
400,
40 0
0, 0
0 0
7
8
_
_
1,10
1, 0,
10 0
0, 0
0 0
_
_
0
_
_
E
E
E
E
LM
LM
1,00
1, 0,
00 0
0, 0
0 0
LM
LM
0
LM
LM 300,
30 0
0, 0
0 0
1,0
, 00,000
100,
10 0
0, 0
0 0
900,
90 00
0, 0
00
800,
80 00
0, 0
00
200,
20 0
0, 0
0 0
700,
70 00
0, 0
00
500,0
00, 00
0
50,00
0 0
600,
60 00
0, 0
00
100,
10 0
0, 0
0 0
198
9 1
1989
199
9 7
2005
1981
1989
199
9 7
2005
1981
1989
199
9 7
2005
198
19 1
8
1989
19
1997
19
20
2 0
0 5
YEAR
YE
YEAR
YEA
YEAR
YE
YEAR
YE
1,0
, 00,000
80,00
0 0
1,00
1, 0,
00 0
0, 0
0 0
0
500,
50 0
0, 0
0 0
900,0
00, 00
70,00
0 0
00
900,
90 00
0, 0
00
60,00
0 0
800,0
00, 00
0
800,
80 00
0, 0
00
400,
40 0
0, 0
0 0
50,00
0 0
9
700,0
00, 00
_
0
10
11
12
_
E
_
_
_
E
40,00
0 0
E
700,
70 00
0, 0
E
E
00
E
E
600,0
00, 00
LM
0
LM
LM
LM
LM
30,00
0 0
600,
60 00
0, 0
00
300,
30 0
0, 0
0 0
500,0
00, 00
0
20,00
0 0
400,0
00, 00
500,
50 00
0, 0
00
00
10,00
0 0
300,0
00, 00
0
0
400,
40 00
0, 0
00
200,
20 0
0, 0
0 0
198
9 1
1989
199
9 7
2005
1981
1989
199
9 7
2005
1981
1989
199
9 7
2005
198
19 1
8
1989
19
1997
19
20
2 0
0 5
YEAR
YE
YEAR
YEA
YEAR
YE
YEAR
YE
15,
15 0
, 00
0 ,
00 0
, 00
0
2,
2 00
, 0,
00 0
0, 0
0 0
250,
25 00
0, 0
00
300,
30 0
0, 0
0 0
250,
25 0
0, 0
0 0
10,
10 0
, 00
0 ,
00 0
, 00
0
1,
1 50
, 0,
50 0
0, 0
0 0
200,
20 00
0, 0
00
_13
_14
_15
_16
E
E
E
200,
20 0
0, 0
0 0
E
E
LM
LM
LM
LM
5,0
, 00,000
1,
1 00
, 0,
00 0
0, 0
0 0
150,
15 00
0, 0
00
150,
15 0
0, 0
0 0
0
500,
50 0
0, 0
0 0
100,
10 00
0, 0
00
100,
10 0
0, 0
0 0
198
9 1
1989
199
9 7
2005
1981
1989
199
9 7
2005
1981
1989
199
9 7
2005
198
19 1
8
1989
19
1997
19
20
2 0
0 5
YEAR
YE
YEAR
YEA
YEAR
YE
YEAR
YE
78
Sherman et al.
350
35 ,
0 00
, 0
00
200,000
200,
200,000
20
2,000,0
2,
0
000,0 0
0
150,000
15
1,500,0
1,
0
500,0 0
0
300
30 ,
0 00
, 0
00
150,000
150,
7
8
9
0
1
1
1
2
_
_
_
_
E
E
100,000
E
E 10
1,000,0
1,
0
000,0 0
E
E
0
E
LM
LM
LM
LM
250
25 ,
0 00
, 0
00
100,000
100,
50,
50 000
0
500,000
500,
200
20 ,
0 00
, 0
00
50,
50 0
, 00
0
0
0
198
19 1
1989
9
1997
19
2005
1981
19
198
19 9
1997
2005
20
1981
1989
9
1997
19
2005
1981
19
198
19 9
1997
200
20 5
YEAR
YE
YEAR
YEAR
YE
YEAR
2,0
2, 00,000
0
4,000,0
4,
0
000,0 0
0
1,100,000
1,10
1,700,0
1,
0
700,0 0
0
1,000,000
1,00
1,600,0
1,
0
600,0 0
0
1,5
1, 00,000
0
3,500,0
3,
0
500,0 0
0
900,000
90
1,500,0
1,
0
500,0 0
0
21
22
23
24
_
_
_
_
1,0
1, 00,000
E
0
3,000,0
3,
0
000,0 0
E
E
0
E
E
E
LM
LM
LM
800,000
80
LM 1,400,0
1,
0
400,0 0
0
500
50 ,
0 00
, 0
00
2,500,0
2,
0
500,0 0
0
700,000
70
1,300,0
1,
0
300,0 0
0
0
2,000,0
2,
0
000,0 0
0
600,000
60
1,200,0
1,
0
200,0 0
0
198
19 1
1989
9
1997
19
2005
1981
19
198
19 9
1997
2005
20
1981
1989
9
1997
19
2005
1981
19
198
19 9
1997
200
20 5
YEAR
YE
YEAR
YEAR
YE
YEAR
500
50 ,
0 00
, 0
00
1,250,0
1,
0
250,0 0
0
3,000,000
3,00
1,100,0
1,
0
100,0 0
0
1,200,0
1,
0
200,0 0
0
1,000,0
1,
0
000,0 0
0
400
40 ,
0 00
, 0
00
2,500,000
2,50
1,150,0
1,
0
150,0 0
0
900,000
900,
_25
_26
_27
_28
E
E
E
E
M
M
M
M
L
L 1,100,0
1,
0
100,0 0
0
L
L
800,000
800,
300
30 ,
0 00
, 0
00
2,000,000
2,00
1,050,0
1,
0
050,0 0
0
700,000
700,
200
20 ,
0 00
, 0
00
1,000,0
1,
0
000,0 0
0
1,500,000
1,50
600,000
600,
198
19 1
1989
9
1997
19
2005
1981
19
198
19 9
1997
2005
20
1981
1989
9
1997
19
2005
1981
19
198
19 9
1997
200
20 5
YEAR
YE
YEAR
YEAR
YE
YEAR
3,0
3, 00,000
0
400,000
400,
70,
70 000
0
3,000,0
3,
0
000,0 0
0
60,
60 000
0
2,500,0
2,
0
500,0 0
0
2,0
2, 00,000
0
300,000
300,
9
0
1 50,
50 000
0
2
2
3
3
3
_
_
_
_
E
E
E
2,000,0
2,
0
000,0 0
E
E
0
E
LM
LM
LM 40,
40 000
0
LM
1,0
1, 00,000
0
200,000
200,
1,500,0
1,
0
500,0 0
0
30,
30 000
0
0
100,000
100,
20,
20 000
0
1,000,0
1,
0
000,0 0
0
198
19 1
1989
9
1997
19
2005
1981
19
198
19 9
1997
2005
20
1981
1989
9
1997
19
2005
1981
19
198
19 9
1997
200
20 5
YEAR
YE
YEAR
YEAR
YE
YEAR
Accelerated warming and emergent trends in fisheries biomass yields
79
150,0
, 00
4,
4 00
, 0,
00 0
0, 0
0 0
800,
80 000
0,
7,000
,
,000
0
700,
70 000
0,
6,000
,
,000
0
100,0
, 00
3,
3 00
, 0,
00 0
0, 0
0 0
600,
60 000
0,
5,000
,
,000
0
33
34
35
36
_
_
_
_
E
E
E
E
LM
LM
LM 500,
50 000
0,
LM 4,000
,
,000
0
50,000
2,
2 00
, 0,
00 0
0, 0
0 0
400,
40 000
0,
3,000
,
,000
0
0
1,
1 00
, 0,
00 0
0, 0
0 0
300,
30 000
0,
2,000
,
,000
0
198
9 1
1989
1997
2005
1981
1989
1997
2005
1981
19
1989
19
1997
19
2005
20
1981
19
1989
19
1997
19
200
20 5
YEAR
YEA
YEAR
Y
YEAR
YE
YEAR
YEA
1,300
,
,000
3,
3 00
, 0,
00 0
0, 0
0 0
200,
20 000
0,
80,000
1,200
,
,000
70,000
000
2,
2 50
, 0,
50 0
0, 0
0 0
60,000
1,100
,
,000
150,
15 000
0,
37
38
39
50,000
39
40
_
_
_
_
1,000
,
,000
E
2,
2 00
, 0,
00 0
0, 0
0 0
E
E
E
E
LM
LM
LM
40,000
LM
LM
900,0
, 00
100,
10 000
0,
30,000
1,
1 50
, 0,
50 0
0, 0
0 0
800,0
, 00
20,000
700,0
, 00
1,
1 00
, 0,
00 0
0, 0
0 0
50,
50 0
, 00
0
10,000
198
9 1
1989
1997
2005
1981
1989
1997
2005
1981
19
1989
19
1997
19
2005
20
1981
19
1989
19
1997
19
200
20 5
YEAR
YEA
YEAR
Y
YEAR
YE
YEAR
YEA
50,000
40,
40 0
, 00
0
50,
50 0
, 00
0
22,000
21,000
40,000
35,
35 0
, 00
0
45,
45 0
, 00
0
20,000
_41
_42
_43
_44
30,000
E
30,
30 0
, 00
E
E
0
40,
40 0
, 00
E
E
0
E
E
M
M
M
M
L
L
L
L 19,000
20,000
25,
25 0
, 00
0
35,
35 0
, 00
0
18,000
10,000
20,
20 0
, 00
0
30,
30 0
, 00
0
17,000
198
9 1
1989
1997
2005
1981
1989
1997
2005
1981
19
1989
19
1997
19
2005
20
1981
19
1989
19
1997
19
200
20 5
YEAR
YEA
YEAR
Y
YEAR
YE
YEAR
YEA
70,000
600,
60 000
0,
5,00
5, 0,
00 0
0, 0
0 0
4,000
,
,000
0
60,000
500,
50 000
0,
4,00
4, 0,
00 0
0, 0
0 0
3,000
,
,000
0
45
46
47
48
_
_
_
_
50,000
E
400,
40 000
E
E
0,
E
E
E
LM
LM
LM
LM
3,00
3, 0,
00 0
0, 0
0 0
2,000
,
,000
0
40,000
300,
30 000
0,
30,000
200,
20 000
0,
2,00
2, 0,
00 0
0, 0
0 0
1,000
,
,000
0
198
9 1
1989
1997
2005
1981
1989
1997
2005
1981
19
1989
19
1997
19
2005
20
1981
19
1989
19
1997
19
200
20 5
YEAR
YEA
YEAR
Y
YEAR
YE
YEAR
YEA
80
Sherman et al.
3,000,00
0 0
2,50
2, 0
50 ,
0 00
0 0
1,1
, 00,000
5,00
5, 0,
00 0
0, 0
0 0
0
1,0
, 00,000
900,000
4,00
4, 0,
00 0
0, 0
0 0
0
2,000,00
0 0
2,00
2, 0
00 ,
0 00
0 0
800,000
_49
_50
700,000
_50
_51
_52
E
E
E
3,00
3, 0,
00 0
0, 0
0 0
E
E
0
E
600,000
LM
LM
LM
LM
1,000,00
0 0
1,50
1, 0
50 ,
0 00
0 0
500,000
2,00
2, 0,
00 0
0, 0
0 0
0
400,000
300,000
0
1,00
1, 0
00 ,
0 00
0 0
200,000
1,00
1, 0,
00 0
0, 0
0 0
0
198
9 1
1989
199
9 7
2005
198
9 1
1989
199
9 7
2005
1981
1989
1997
2005
19
1 8
9 1
8
198
9 9
19
1 9
9 7
9
200
0 5
YEAR
YE
YEAR
YE
YEAR
YE
YEAR
YE
2,000,00
0 0
0.00000015
10
0.0
. 00000
0 15
0.00000010
0.0
. 00000
0 10
9
1,500,00
0 0
0.00000005
0.0
. 00000
0 05
8
_53
_54
_55
_56
1,000,00
0 0
E
0.00000000
E
E
E
0.0
. 00000
0 00
E
E
LM
LM
LM 7
LM
-0
- .
0 0000000
0 5
-0
- .0
0 0000005
500,000
6
-0
- .
0 0000001
0 0
-0
- .0
0 0000010
0
-0
- .
0 0000001
0 5
5
-0
- .0
0 0000015
198
9 1
1989
199
9 7
2005
198
9 1
1989
199
9 7
2005
1981
1989
1997
2005
19
1 8
9 1
8
198
9 9
19
1 9
9 7
9
200
0 5
YEAR
YE
YEAR
YE
YEAR
YE
YEAR
YE
0.00000015
600
1,6
, 00,000
600,
60 00
0, 0
00
1,5
, 00,000
0.00000010
500
1,4
, 00,000
500,
50 00
0, 0
0
00
0.00000005
400
1,3
, 00,000
400,
40 00
0, 0
00
_57
_58
1,2
, 00,000
_58
_59
_60
0.00000000
E
300
E
E
E
E
1,1
, 00,000
LM
LM
LM
LM 300,
30 00
0, 0
00
-0
- .
0 00000
0 005
200
1,0
, 00,000
900,000
200,
20 00
0, 0
00
-0
- .
0 00000
0 010
100
800,000
-0
- .
0 00000
0 015
0
700,000
100,
10 00
0, 0
00
198
9 1
1989
199
9 7
2005
198
9 1
1989
199
9 7
2005
1981
1989
1997
2005
19
1 8
9 1
8
198
9 9
19
1 9
9 7
9
200
0 5
YEAR
YE
YEAR
YE
YEAR
YE
YEAR
YE
80,0
80 00
,0
900,000
600,000
70,0
70 00
,0
800,000
500,000
60,0
60 00
,0
700,000
400,000
50,0
50 00
,0
600,000
_61
_62
_64
40,0
40 00
E
,0
E
E
300,000
E
E
LM
500,000
LM
LM
LM
30,0
30 00
,0
200,000
400,000
20,0
20 00
,0
100,000
10,0
10 00
300,000
,000
0
200,000
0
198
9 1
1989
199
9 7
2005
198
9 1
1989
199
9 7
2005
1981
1989
1997
2005
YEAR
YE
YEAR
YE
YEAR
YE