Water Resources and Environment
W
The World Bank
Technical Note C.2
T
Environment Department
The World Bank
The W
1818 H Street, N.W.
1818 H Street, N.W
Washington, D.C. 20433, U.S.A.
W
www.worldbank.org
www
For information on these publications contact the
ESSD Advisory Service at eadvisor@worldbank.org
or call 202.522.3773
Environmental Flows:
Case Studies
Series Editors
Richard Davis
Rafik Hirji
WATER RESOURCES
AND ENVIRONMENT
TECHNICAL NOTE C.2
Environmental Flows:
Case Studies
SERIES EDITORS
RICHARD DAVIS, RAFIK HIRJI
The World Bank
Washington, D.C.

Water Resources and Environment Technical Notes
A. Environmental Issues and Lessons
Note A.1
Environmental Aspects of Water Resources Management
Note A.2
Water Resources Management Policy Implementation: Early Lessons
B. Institutional and Regulatory Issues
Note B.1
Strategic Environmental Assessment: A Watershed Approach
Note B.2
Water Resources Management: Regulatory Dimensions
Note B.3
Regulations for Private Sector Utilities
C. Environmental Flow Assessment
Note C.1 Environmental Flows: Concepts and Methods
Note C.2 Environmental Flows: Case Studies
Note C.3 Environmental Flows: Flood Flows
Note C.4 Environmental Flows: Social Issues
D. Water Quality Management
Note D.1 Water Quality: Assessment and Protection
Note D.2 Water Quality: Wastewater Treatment
Note D.3 Water Quality: Nonpoint-Source Pollution
E.
Irrigation and Drainage
Note E.1
Irrigation and Drainage: Development
Note E.2
Irrigation and Drainage: Rehabilitation
F.
Water Conservation and Demand Management
Note F.1
Water Conservation: Urban Utilities
Note F.2
Water Conservation: Irrigation
Note F.3
Wastewater Reuse
G. Waterbody Management
Note G.1 Groundwater Management
Note G.2 Lake Management
Note G.3 Wetlands Management
Note G.4 Management of Aquatic Plants
H. Selected topics
Note H.1
Interbasin Transfers
Note H.2
Desalination
Note H.3
Climate Variability and Climate Change
Copyright © 2003
The International Bank for Reconstruction and Development/THE WORLD BANK
1818 H Street, N.W., Washington, D.C. 20433, U.S.A.
All rights reserved.
Manufactured in the United States of America
First printing March 2003
2


CONTENTS
Foreword
5
Acknowledgments
7
Introduction
9
River Ecosystems and Environmental Flows
10
Rivers respond to both natural disturbances and man-
made disturbances. In general, the more the flows are
changed for a specific river, the more the river`s ecol-
ogy will change.
The Lesotho Highlands Water Project
12
One of the world's largest water resource develop-
ments, the Lesotho Highlands Water Project will even-
Authors
tually comprise seven major dams on the headwaters
Jacqueline King, Catherine Brown
of the Senqu River system. Social and ecological con-
cerns about the first dam built led to an environmen-
Technical Adviser
tal flow assessment for existing and planned parts of
Stephen Lintner
the development.
Editor
The Skagit River Hydroelectric Project
17
Robert Livernash
An application to renew the operating license for hy-
dropower dams on the Skagit River in the northwest-
Production Staff
ern United States created an opportunity to incorporate
Cover Design: Cathe Fadel
environmental flows into the license.
Design and Production:
The Word Express, Inc.
The Murray-Darling Cap on Abstractions
20
Rivers of the Murray-Darling Basin in southeastern Aus-
Notes
tralia are seriously degraded as a result of over-ab-
Unless otherwise stated,
straction and increasing nutrient and salinity levels. A
all dollars = U.S. dollars.
"cap" on abstractions will limit further degradation until
All tons are metric tons.
flow assessments can be completed and environmen-
tal flows implemented.
The boundaries, colors,
denominations, and any
other information shown on any
Widening Application of the Concept of
maps do not imply,
Environmental Flows
24
on the part of the World Bank Group,
Environmental flow assessments also can be applied
any judgment on the legal
to wetlands, lakes, deltas, and inland seas.
status of any territory, or any
endorsement or acceptance of
Conclusion
27
such boundaries.
Water resources developments that alter the pattern
Cover photo by
of water movement in aquatic ecosystems need to
J. Turpie
be assessed for possible ecosystem effects.
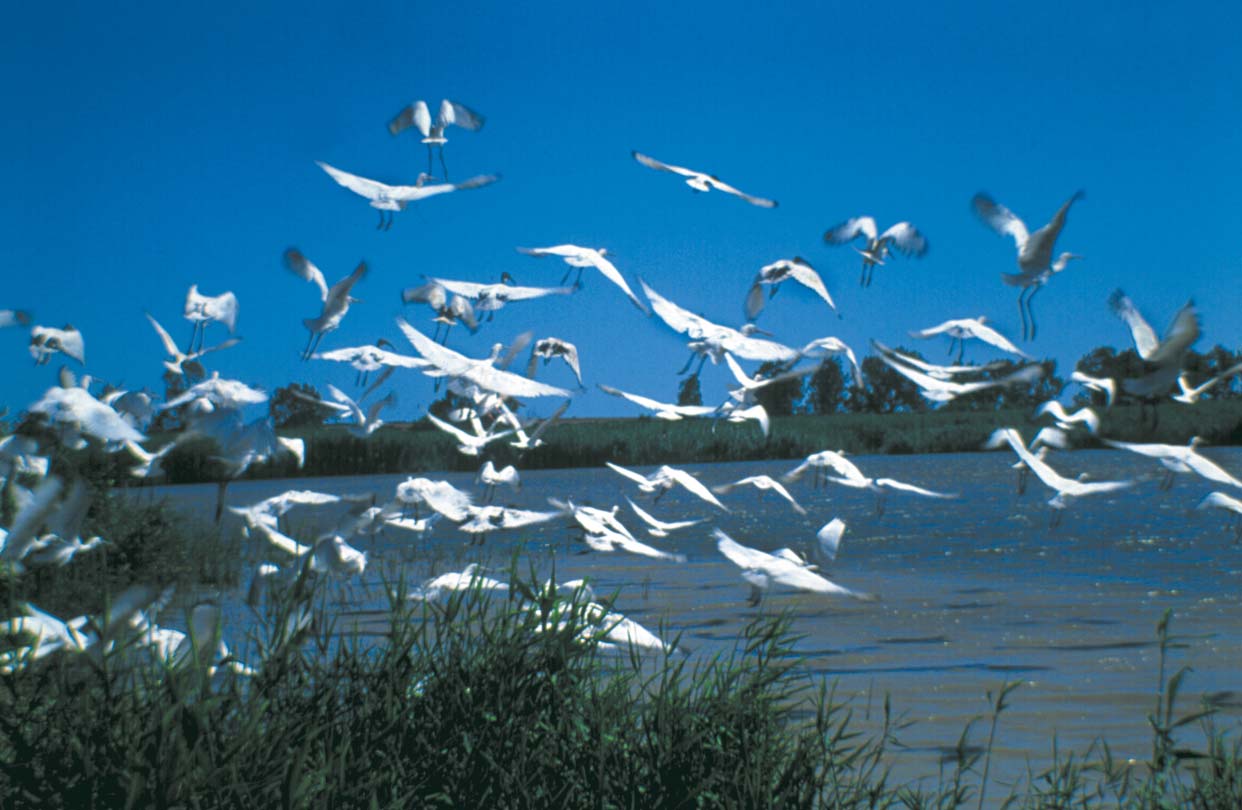
Waterbirds, Berg River
floodplain, South Africa
Further Information
28
3

WATER RESOURCES AND ENVIRONMENT · TECHNICAL NOTE C.2
Boxes
1. The main components of a river ecosystem
10
2. Phases of the Lesotho Highlands Water Project
12
3. Benefits and direct monetary costs of Phase 1 of the LHWP
13
4. Specialists involved in the Lesotho Flow Assessment
15
5. Predicted implications of four possible flow scenarios from Phase 1 and
2 dams in Lesotho
16
6. Costs of enhancement measures in the Settlement Agreement.
19
7. Examples of flow regulation protective measures for chinook salmon
in the new license for operating the SRP
19
8. The Terror Lake Hydropower Project
20
9. The Central Valley Project, California, U.S.A.Box The Central Valley Project,
California, U.S.A.
24
Figures
1. Environmental flow assessments in the decisionmaking process
11
2. The Lesotho Highlands Water Project
12
3. DRIFT Modules
15
4. The Murray-Darling Basin in Southeast Australia
21
5. Growth in water use in Murray-Darling Basin
22
4

ENVIRONMENTAL FLOWS: CASE STUDIES
FOREWORD
The environmentally sustainable development and
priority in Bank lending. Many lessons have been
management of water resources is a critical and
learned, and these have contributed to changing
complex issue for both rich and poor countries. It
attitudes and practices in World Bank operations.
is technically challenging and often entails difficult
trade-offs among social, economic, and political con-
Water resources management is also a critical de-
siderations. Typically, the environment is treated
velopment issue because of its many links to pov-
as a marginal issue when it is actually key to sus-
erty reduction, including health, agricultural
tainable water management.
productivity, industrial and energy development,
and sustainable growth in downstream communi-
According to the World Bank's recently approved
ties. But strategies to reduce poverty should not lead
Water Resources Sector Strategy, "the environment
to further degradation of water resources or eco-
is a special `water-using sector' in that most envi-
logical services. Finding a balance between these
ronmental concerns are a central part of overall
objectives is an important aspect of the Bank's in-
water resources management, and not just a part
terest in sustainable development. The 2001 Envi-
of a distinct water-using sector" (World Bank 2003:
ronment Strategy underscores the linkages among
28). Being integral to overall water resources man-
water resources management, environmental
agement, the environment is "voiceless" when other
sustainability, and poverty, and shows how the 2003
water using sectors have distinct voices. As a con-
Water Resources Sector Strategy's call for using
sequence, representatives of these other water us-
water as a vehicle for increasing growth and re-
ing sectors need to be fully aware of the importance
ducing poverty can be carried out in a socially and
of environmental aspects of water resources man-
environmentally responsible manner.
agement for the development of their sectoral in-
terests.
Over the past few decades, many nations have been
subjected to the ravages of either droughts or floods.
For us in the World Bank, water resources man-
Unsustainable land and water use practices have
agement--including the development of surface and
contributed to the degradation of the water resources
groundwater resources for urban, rural, agriculture,
base and are undermining the primary investments
energy, mining, and industrial uses, as well as the
in water supply, energy and irrigation infrastruc-
protection of surface and groundwater sources, pol-
ture, often also contributing to loss of biodiversity.
lution control, watershed management, control of
In response, new policy and institutional reforms
water weeds, and restoration of degraded ecosys-
are being developed to ensure responsible and sus-
tems such as lakes and wetlands--is an important
tainable practices are put in place, and new predic-
element of our lending, supporting one of the es-
tive and forecasting techniques are being developed
sential building blocks for sustaining livelihoods and
that can help to reduce the impacts and manage
for social and economic development in general.
the consequences of such events. The Environment
Prior to 1993, environmental considerations of such
and Water Resources Sector Strategies make it clear
investments were addressed reactively and prima-
that water must be treated as a resource that spans
rily through the Bank's safeguard policies. The 1993
multiple uses in a river basin, particularly to main-
Water Resources Management Policy Paper broad-
tain sufficient flows of sufficient quality at the ap-
ened the development focus to include the protec-
propriate times to offset upstream abstraction and
tion and management of water resources in an
pollution and sustain the downstream social, eco-
environmentally sustainable, socially acceptable,
logical, and hydrological functions of watersheds
and economically efficient manner as an emerging
and wetlands.
5

WATER RESOURCES AND ENVIRONMENT · TECHNICAL NOTE C.2
With the support of the Government of the Nether-
The Notes are in eight categories: environmental
lands, the Environment Department has prepared
issues and lessons; institutional and regulatory is-
an initial series of Water Resources and Environ-
sues; environmental flow assessment; water qual-
ment Technical Notes to improve the knowledge
ity management; irrigation and drainage; water
base about applying environmental management
conservation (demand management); waterbody
principles to water resources management. The
management; and selected topics. The series may
Technical Note series supports the implementation
be expanded in the future to include other relevant
of the World Bank 1993 Water Resources Manage-
categories or topics. Not all topics will be of inter-
ment Policy, 2001 Environment Strategy, and 2003
est to all specialists. Some will find the review of
Water Resources Sector Strategy, as well as the
past environmental practices in the water sector
implementation of the Bank's safeguard policies.
useful for learning and improving their perfor-
The Notes are also consistent with the Millennium
mance; others may find their suggestions for fur-
Development Goal objectives related to environmen-
ther, more detailed information to be valuable; while
tal sustainability of water resources.
still others will find them useful as a reference on
emerging topics such as environmental flow assess-
The Notes are intended for use by those without
ment, environmental regulations for private water
specific training in water resources management
utilities, inter-basin water transfers, and climate
such as technical specialists, policymakers and
variability and climate change. The latter topics are
managers working on water sector related invest-
likely to be of increasing importance as the World
ments within the Bank; practitioners from bilateral,
Bank implements its environment and water re-
multilateral, and nongovernmental organizations;
sources sector strategies and supports the next gen-
and public and private sector specialists interested
eration of water resources and environmental policy
in environmentally sustainable water resources
and institutional reforms.
management. These people may have been trained
as environmental, municipal, water resources, ir-
rigation, power, or mining engineers; or as econo-
mists, lawyers, sociologists, natural resources
Kristalina Georgieva
specialists, urban planners, environmental planners,
Director
or ecologists.
Environment Department
6

ENVIRONMENTAL FLOWS: CASE STUDIES
ACKNOWLEDGMENTS
The Bank is deeply grateful to the Government of
Lesotho; Hossein Sabet, S M EC International,
the Netherlands for financing the production of this
Lesotho; Mike Sale, Oak Ridge National Laboratory,
Technical Note.
USA; Dave Pflug and colleagues, Seattle City Light,
USA; Bob Milhous and Lee Lamb, US Geological
Technical Note C.2 was drafted by Jacqueline King
Survey, USA; and Ben Dyer, Murray-Darling Basin
and Catherine Brown of the Southern Waters Eco-
Commission, Australia.
logical Research and Consulting Pty (Ltd) in Cape
Town, South Africa.
At the World Bank, this Technical Note was reviewed
by Hans-Olav Ibrekk, Alessandro Palmieri, Tor
The authors thank the following specialists for their
Ziegler, Jean-Roger Mercier, and Robert Robelus.
assistance and advice: Makase Nyaphisi and Peter
The editors appreciate their suggestions.
Nuttall, Lesotho Highlands Development Authority,
7


ENVIRONMENTAL FLOWS: CASE STUDIES
INTRODUCTION
The flows of the world's rivers are increasingly being
decreasing turbiditythe focus in these notes is pri-
modified through impoundments such as dams and
marily on the direct effects of flow on the ecological
weirs, extractions for agriculture and urban supply,
functioning of rivers and the management of water
maintenance of flows for navigation, inflows of drain-
quantity. Note C.1 introduces concepts and methods
age waters, and structures for flood control. These in-
for determining environmental flow requirements
terventions have had significant impacts, reducing the
for rivers. Note C.2 reviews some important case his-
total flow of many rivers and affecting both the sea-
tories, which provide examples of the increasing
sonality of flows and the size and frequency of floods.
range of situations in which environmental flow as-
In many cases, these modifications have adversely af-
sessments are becoming a water-management tool,
fected the ecological and hydrological services pro-
and some of the legal, economic, social, and ecologi-
vided by water ecosystems, which in turn has
cal implications of pro-active flow management for
increased the vulnerability of peopleespecially the
river health. Note C.3 describes the reinstatement of
poorwho depend on such services. It is increasingly
flood releases from reservoirs for floodplain inunda-
recognized that modifications to river flows need to be
tion. Note C.4 addresses the downstream social is-
balanced with maintenance of essential water-depen-
sues arising from changes in flows.
dent ecological services. The flows needed to main-
tain these services are termed "environmental flows"
Environmental flow assessments have evolved from
and the process for determining such flows is termed
the narrow purpose of describing flows for maintain-
"environmental flow assessment" (EFA).
ing specific fish species to their present use as a tool
in holistic catchment management. The case studies
The recognition that modifications to river flows are
reflect this evolution. The first case study describes
an important source of riverine, floodplain and, in
how a flow assessment was completed in the plan-
some cases, estuarine degradation is relatively re-
ning stage of a water development to aid decisions on
cent. The World Bank acknowledged the issue in its
which dams should be built and how much water
1993 Water Resources Management Policy, which in-
should be allocated to protecting the rivers and sub-
cluded as an objective that "the water supply needs of
sistence users dependent on those rivers. The second
rivers, wetlands, and fisheries will be considered in
case study illustrates how flows were set to mitigate
decisions concerning the operation of reservoirs and
impacts of an existing dam by modifying the down-
the allocation of water." An environmental assess-
stream releases of water. Both describe advanced
ment (Operational Policy 4.01) is triggered if modifi-
forms of traditional environmental flow assessments.
cations to river flows lead to adverse environmental
The third case study describes another way that reha-
risks and impacts. If changes in flow have the poten-
bilitation of a seriously degraded river was initiated,
tial to cause significant loss
through placing a limit on
or degradation of natural
current levels of water ab-
habitats, borrowers must
straction. This does not con-
comply with the Bank's natu-
stitute an environmental
ral habitats policy (Opera-
flow assessment itself, but
tional Policy 4.04) in order for
provides breathing space for
a loan to be approved.
flow assessments to be pre-
pared. Finally, the report
Technical Notes C.1 to C.4
mentions three examples of
deal with environmental
a Development Authority
how the concept of environ-
flows. Although changes in
mental flows is used in in-
flow will affect water quality
creasingly broader ways in
Photo by Chilik
for example, by increasing or
Fishtrap, Chilika Lake, India
water management.
9

WATER RESOURCES AND ENVIRONMENT · TECHNICAL NOTE C.2
RIVER ECOSYSTEMS AND ENVIRONMENTAL FLOWS
In this document, the term "river" is used to de-
attributes appear. Often, the new attributes are less
scribe the complete river ecosystem of many inter-
welcome than the old; they could include, for
dependent nonliving and living components. Rivers
instance, pest flies, unreliable water supply, and
are dynamic systems, sculptured by their flows, with
algal blooms. The trend is one of increasing deg-
dependence on different-sized flows at different
radation.
times of the year for the inundation of various chan-
nel features and the completion of plant and ani-
Many developed countries now regularly report on
mal life cycles. Rivers respond to both natural
river health, using classifications for river reach
disturbances (such as drought) and man-made dis-
conditions that are defined under national water
turbances (such as dams) to flow; changes in the
or enviromental policies and legislation. Each class
components are shown in Box 1. In general, the
summarizes a different level of degradation (such
more the flows are changed for a specific river, the
as A=near natural or pristine; B=slightly modified;
more the river will change.
C=moderately modified; D=largely modified;
E=seriously modified; F=critically modified). A
Man-made flow changes can be caused by direct
number of developing countries are also adopting
manipulationsuch as damming or abstraction of
their own classifications for river health. National
wateror by activities in the surrounding catchment
objectives may be to maintain a specified percent-
that affect river flow, such as deforestation and land
age of rivers in each category.
use changes. The resulting changes to the river do
not have to be left to chance, but can be predicted
Technical Note C.1 provides more details on the re-
and managed so that they stay within acceptable
sponses of rivers to different flow events and op-
limits. This is possible because rivers can be man-
tions for managing flows. Information linking river
aged to exist at different levels of condition.
flow with environmental assessment is provided
through an environmental flow assessment. In the
Undisturbed rivers are generally seen as healthy
context of a proposed water-related activity, the flow
because their channels and species have evolved
assessment is a means of describing the potential
over long periods of time in harmony with their
trade-offs between development gains--such as in-
different environments, so that they process re-
creased access to water for agriculture or indus-
sources most efficiently. Their valued attributes
trial use--and environmental losses--such as reduced
include reliable, good-quality water supplies, flood-
habitat for waterbirds or reductions in the quality
plain fisheries, and stable banks. With increasing
of life of subsistence users of the river. Environmen-
disturbance, rivers lose valued attributes and new
tal flows link water- or land-development objectives
BOX 1.
THE MAIN COMPONENTS OF A RIVER ECOSYSTEM
Nonliving
Living
Channel, source to sea
Riparian, fringing and aquatic plants
Banks
Fish, including marine fish that use estuaries
Floodplains
Aquatic invertebrates
Linked lakes and wetlands
Aquatic mammals
Estuary
Water birds
Linked groundwater
Amphibians and aquatic reptiles
Linked near-coast marine environment
Microorganisms
Sediments
Water chemistry and temperature
10

ENVIRONMENTAL FLOWS: CASE STUDIES
with active management of river health. They are
FIGURE 1.
not just "flows for nature."
ENVIRONMENTAL FLOW ASSESSMENTS
IN THE DECISIONMAKING PROCESS
Scenarios showing these trade-offs should be as-
sessed in terms of their wider macroeconomic im-
Client selects scenarios
that reflect a range of management options
plications--for example, for industry--and their
acceptability to all interested parties (Figure 1).
Ultimately, society chooses which scenario is most
acceptable, and in this way identifies a river's de-
For each scenario, the following are predicted:
sired future condition. The flows described in the
chosen scenario will maintain that desired condi-
tion, and will become the environmental flow for
· the impacts on river flow
that river. They are unique to each river.
· how this will change river condition
· how the changing river condition will impact all users,
including subsistence users
· what the mitigation and compensation costs could be.
Scenarios c
Sc
ompar
enarios c
ed and assessed in t
ompar
e
ed and assessed in t rms of
e
:
· Macroeconomics
· Stakeholder Acceptability
(Public Participation Process)
All Outputs to Decisionmakers
11

WATER RESOURCES AND ENVIRONMENT · TECHNICAL NOTE C.2
THE LESOTHO HIGHLANDS WATER PROJECT
The Lesotho Highlands Water Project (LHWP)one
by rural communities, and the rivers flow through
of the world's largest water-resource developments
deep gorges that provide little opportunity for ur-
will eventually comprise six major dams and a weir
ban or agricultural development.
on the headwaters of the Senqu River system. The
project has been planned to be developed in 5 phases
The river water was considered an important po-
(Box 2). Phase 1A (Katse Dam) created social and
tential source of revenue for this small developing
ecological concerns that led (during phase 1B) to
country, with South Africa's Vaal Region as a po-
an environmental flow assessment for all phase 1
tential recipient of the water. The Vaal Region is
structures. The assessment produced scenarios of
the industrial heart of South Africa, and vital to that
how the downstream rivers would be affected by
various dam release options, as well as the mitiga-
F
tion and compensation costs for affected subsistence
IGURE 2.
THE LESOTHO HIGHLANDS To Vaal Dam
groups that use the river.
WATER PROJECT
Bethlehem
BACKGROUND
Delivery
Tunnels
0
10
20 kilometers
O R A N G E
Clarens
F R E E S TAT E
Masjaing
N ATA L
Lesotho is a landlocked country surrounded by
R.
Ngoe
Muela
Butha-
South Africa. The Senqu River system rises in the
Buthe
Ficksburg
Caledon Hlotse
Hlotse
(Leribe)
PHASE II
D R
Transfer
A K
eastern Highlands, becoming the Orange River as
Tunnel
E N S
PHASE I
B U
Transfer
R
Tunnel
it flows into South Africa (Figure 2). The Lesotho
G
Teyateyaneng
Matsoku
Highlands are mountainous and characterized by
Malibamatso R.
PHASE I
Matsoku
Mokhotlong
rainfall ranging from 700 to 1,500 mm annually.
MASERU
Interconnecting
Tunnel
Katse
Dam
Roma
Mohale
Senqu R.
Dam
Thaba Tseka
Linakeng
The powerful rivers that drain the region had vir-
Senqunyane R.
Mashai
PHASE II
Dam
tually natural flow until the 1990s, largely because
Sehonghong
the Highlands are remote and sparsely inhabited
T R A N S K E I
Semonkong
PHASE IV
Ntoahae
PHASE III
Dam
Tsoelike
Dam
Senqu R.
BOX 2.
C A P E P R O V I N C E
PHASES OF THE LESOTHO HIGHLANDS WATER PROJECT
Phase
Yield
Facilities
1A
I 18 m3 s-1 flow
I 185 m Katse Dam on the Malibamatso River
Completed 1998
I 72-MW hydropower
I 55 m Muela Dam on the Nqoe River
I Hydropower plant at Muela
I Transmission lines to Maseru
I Water delivery tunnels
I Access roads and other infrastructure
1B
I 9 m3 s-1 flow
I 145 m Mohale Dam on the Senqunyane River
Completed 2002
I 2 m3 s-1 flow
I 20 m Matsoku Weir on the Matsoku River
I Delivery tunnels to Katse Reservoir
I Access roads and other infrastructure
2
Total estimated yield
I Mashai Dam on the Senqu River and infrastructure
3
for all phases
I Tsoelike Dam on the Senqu River and infrastructure
4
(1-5): 70 m3 s-1 flow
I Ntoahae Dam on the Senqu River and infrastructure
5
I Malatsi Dam on the Senqunyane River and infrastructure
12

ENVIRONMENTAL FLOWS: CASE STUDIES
country's national economy. In the 1950s, with few
rent government income for the next 50 years (Box
natural water resources and increasing industrial
3). Development costs are borne mainly by South
and urban demand, the Vaal Region was projected
Africa. The LHWP creates jobs and, indirectly, many
to be facing a water deficit--that is, a shortfall of
other employment and development opportunities.
supply compared to demand--of 106.7 m3 s-1 by 2023.
Water stored in the scheme within Lesotho could
Of the technically viable schemes to meet this short-
lead to growth in agro-industry, forestry, fisheries,
fall, the least expensive was the gravity-fed trans-
and tourism endeavors. Another important benefit
fer of water from the Lesotho Highlands.
for Lesotho is the generation of electricity using the
transfer water at Muela.
Feasibility studies began in the 1950s, and in 1986
the LHWP got under way. The treaty between South
Management of the LHWP. The Lesotho Highlands
Africa and Lesotho signed in 1986 embraced five
Water Commission (LHWC), which oversees the
Phases (Box 2) in concept, but committed the coun-
project, is a bi-national body answerable to both
tries only to Phase 1. Although the scheme was con-
governments, with monitoring, advisory, and
ceived and begun during the apartheid era, the
approval powers. Its main responsibility relates to
current democratically elected governments of both
project implementation in areas such as technical
countries fully support the project, and the new
acceptability, design of works, tender procedures
Government of Namibia (through which the Orange
and documents, cash flow forecasts, allocation of
River flows to the ocean) has no objection.
costs, and financing arrangements. A parastatal body
in each country runs the LHWP: the Lesotho High-
Benefits and costs. Both countries stand to benefit
lands Development Authority (LHDA) in Lesotho
from the scheme, essentially through South Africa
and the Trans-Caledon Tunnel Authority (TCTA)
securing a reliable annual supply of good-quality
in South Africa. Identified stakeholders in the LHWP
water, and Lesotho acquiring revenue that, from
were represented on the steering committee guid-
Phase 1 alone, amounts to about 14 percent of cur-
ing the environmental flow assessment.
BOX 3.
BENEFITS AND DIRECT MONETARY COSTS OF PHASE 1 OF THE LHWP
Lesotho
South Africa
Benefits:
Benefits:
I Annual revenue of $55 million from South Africa for 50
I Secures the cheapest substantial source of high-
years
quality water
I No financial risk for water-transfer component
I Lower water prices to consumers
I Hydropower from Muela
I Augmentation of water supply to newly enfranchised
I Infrastucture such as roads and telecommunications
poor
to increase health, education, and trade services
I Industrial growth in a water-scarce area of high
I 39,000 person-years of direct employment for local
economic importance.
people
I Additional enhancement of GDP through higher
indirect employment, import duties, and tax receipts.
Direct costs:
Direct costs:
I Hydropower component.
I Full costs of construction, operation, and mainte-
nance of the project except for the hydropower
component
I Associated debt
I Annual royalties payment to Lesotho of $55 million
I Compensation and mitigation costs
I Social and development programs.
13

WATER RESOURCES AND ENVIRONMENT · TECHNICAL NOTE C.2
Existing and potential water conflicts. There were
pacts of the dams, with a balance being sought be-
two potential water conflict issues: (1) the popula-
tween development of the river's water resources
tion at risk included about 39,000 subsistence us-
and protection of river health.
ers living along the targeted rivers and downstream
of the dam sites; and (2) the scenic beauty of the
ENVIRONMENTAL FLOW
mountain regions and their rivers suggested a po-
METHODOLOGY
tential for ecotourism.
Increasing the amount of river flow harnessed in
The flow assessment study covering Phases 1 and
dams increases direct revenue earned and the po-
2, commissioned by LHDA, began in 1997 and was
tential for a range of development opportunities, but
completed in 2000. It was designed to maximize
also causes greater deterioration in the condition
understanding of the rivers and human dependence
of the rivers, which impacts both the population at
upon them. Within a one-year data-collection pe-
risk and ecotourism. A declining river condition
riod, an international team of 27 scientists (Box 4)
also would pose an increased threat to the rare
collaborated to predict the changes in river con-
and endangered Maloti minnow, Pseudobarbus
dition that would occur if various dams were built
quathlambae.
and operated in specific ways, and the implications
of these river changes for subsistence users. In 2001,
The 1986 treaty stipulated that minimum compen-
with changes in water use and demand in South
sation flows of 0.5 m3 s-1 or higher should be re-
Africa, it became clear that Phase 2 would not be
leased from Katse Dam and 0.3 m3 s-1 or higher from
imminent, and a new report was prepared to cover
Mohale Dam, representing approximately 3 to 5 per-
the environmental flow impacts of Phase 1 only.
cent of the total annual flow of the rivers at those
The Phase 1 EFA report was issued in July 2002.
points. These lower limits, which were the target
level LHDA was initially planning to use to operate
Approach chosen. A holistic interactive approach--
the system, would not support maintenance of the
Downstream Response to Imposed Flow Transfor-
downstream rivers in their historical condition.
mations, or DRIFT--with four modules was developed
for use in the study (Figure 3). In Module 1, the
FUTURE OPTIONS
changes to the rivers were described in response
to flow changes. In Module 2, the population at
risk was identified and their links to the rivers de-
The 1986 treaty had a provision for renegotiating
scribed (Box 5). In Module 3, four scenarios of interest
the terms after 12 years, i.e. after 1998. The terms
to the client were developed. Each predicted a pos-
of the renegotiated treaty were delayed pending
sible future flow regime; the resulting condition
completion of a flow assessment and the resulting
of the river; and the impacts on the Population at
environmental flow requirement (EFR) policy,
Risk (PAR). Module 4 dealt with mitigation and
which will be used to optimize flow-release pat-
compensation issues.
terns from Katse Dam, Mohale Dam, and Matsoku
Weir. The new treaty will also be used to help de-
A pilot study of the population at risk measured
cide which other dams should be built, what the
the widths of inhabited corridors on either bank
water-release patterns from these dams should be,
and identified the river resources used. A follow-
what design features should be incorporated to fa-
up study quantified resource use, estimated the costs
cilitate environmental releases, and what mitiga-
of resources, and considered cultural links with
tion and compensation measures need to be
the rivers. Medical and veterinary teams described
instituted to offset ecosystem and social impacts and
the health profiles of the population at risk and
costs.
their domestic stock, and estimated the cost of
Terms of the new treaty will be based partly on pre-
measures to mitigate potential additional health
dictions of the potential ecological and social im-
risks. The information was used to describe the
14

ENVIRONMENTAL FLOWS: CASE STUDIES
BOX 4.
SPECIALISTS INVOLVED IN THE LESOTHO FLOW ASSESSMENT
Biophysical
Channel form
Hydrologist, hydraulic modeler, sedimentologist, fluvial geomorphologist, physical-habitat specialist
Water quality
Aquatic chemist, microbiologist
Biology
Botanists for riparian, fringing and aquatic plants; zoologists for fish, invertebrates, frogs, reptiles,
water birds, terrestrial wildlife
Subsistence use
Social
Sociologist, anthropologist, public health doctor, animal health veterinarian, water-supply specialist
Economic
Economist, resource economist
Process
Flow-assessment facilitators
Scenario builders
FIGURE 3.
links between the riparian people and the rivers,
DRIFT MODULES
and how flow changes might affect them.
MODULE 1
MODULE 2
The biophysical and socioeconomic specialists
Biophysical
Sociological
maintained strong links with each other during data
Describe the nature
Identify PAR
collection. As an example, the botanists helped the
and functioning of
social team identify river plants used by the popu-
the river
Describe river use
lation at risk, and then allocated each plant species
and health profiles
to one of six vegetation zones occurring up the
Develop predictive
banks. All the zones were then studied to define their
capacity of flow
links with flow. The hydrologist and hydraulic mod-
Develop predictive
related changes
eler linked each vegetation zone with flow by deter-
capacity of social
impacts of river
mining how often it is flooded under current flows.
changes
Knowing the links between flow and vegetation
zones, the botanist could then describe for each pos-
MODULE 3
sible future flow regime, how the vegetation zones
Scenario development
might expand or contract, and thus whether each
Identify possible future
plant species would increase or decrease in abun-
scenarios and describe
dance. The social team then used this prediction to
biophysical consequences
assess, for each scenario, the impact of vegetation
of each
changes on the population at risk.
Describe social
Because of the complexity of rivers, any study of this
consequences of each
nature--either in developing or developed countries
MODULE 4
scenario
is necessarily undertaken with only limited knowl-
Economic
edge. In the Lesotho study, this uncertainty was
Calculate compensation
managed through the use of severity ratings, which
and migration costs
allowed scientists to indicate within a coarse range
for PAR
how great each described change would be (Sever-
ity Rating 1 = negligible; Severity Rating 2 = Low;
DRIFT output to Decisionmaker
Severity Rating 3 = moderate; Severity Rating 4 =
15


WATER RESOURCES AND ENVIRONMENT · TECHNICAL NOTE C.2
Severe; Severity Rating 5 = Critically Severe). A spe-
ers for subsistence. The process for deciding be-
cialist might predict, for instance, that under a cer-
tween these scenarios is expected to include three
tain future scenario, fish species A would show a
major stages:
moderate reduction in abundance (Severity Rating
I identifying the range of an acceptable volume
3). If there was uncertainty about which severity rat-
of water for environmental maintenance
ing to allocate to a predicted change, then a range
I finding an optimum balance among flow re-
of severity ratings was usedfor example, fish spe-
gime, economic and social costs, and envi-
cies A would show moderate to critically severe re-
ronmental impacts
duction in abundance (Severity Rating 3-5). The final
I making a formal commitment to environmental
scenarios were thus illustrated as risk envelopes of
flows in the form of an EFR policy.
predicted changes, with wider envelopes indicating
greater uncertainty.
The EFA process and outcome has informed and
improved project decisionmaking even though the
MANAGEMENT IMPLICATIONS
EFA was carried out during project implementation.
The design of the Mohale Dam outlet structure was
The scenarios in Box 5 illustrate that the more
changed in 1998, ahead of the result of the flow as-
water harnessed in the dams, the greater the impact
sessment, in anticipation of the likely requirement
on river health and on the people using the riv-
for "greater-than-treaty" flows. The dam outlet works
now incorporate a large release pipe as well as a
multi-level release facility for smaller flows and a
larger low-level facility for flood release. The EF
releases from Matsoko Wier, which is not governed
by the 1986 treaty, were increased from 0.05 m3 s-1
to 0.6 m3 s-1. The draft final EFR policy has recom-
mended the following initial bulk EFRs from (a)
Katse Dam of 2.12 m3/s, which was increased from
0.5 m3/s and from (b) Mohale Dam of 1.01 m3/s,
which was increased from 0.3 m3/s. These flows will
be distributed as seasonal releases and as small
Photo by Christian Boehm
floods. The EFR policy will also describe a specific
Boy drinking from river, Lesotho
BOX 5.
PREDICTED IMPLICATIONS OF FOUR POSSIBLE FLOW SCENARIOS FROM PHASE 1 AND 2 DAMS IN LESOTHO
Scenario
Change in river condition
Social impact of
Costs of compensation
Yield
from present
river change
and mitigation
of water
Minimum change
Low
Negligible
Low
Very low
Design limitation
Moderate
Moderate
Moderate
Low
Treaty
Critically Severe
Severe
Very High
Medium
Fourth
Severe
Moderately severe
High
Very High
Minimum change = The maximum amount of water that could be removed by the dams before measurable
change in river condition occurs.
Design Limitation = Highest attainable river condition with current dam structures and moderate water-supply
commitments.
Treaty
= Very low downstream releases from the dams as per the original treaty.
Fourth
= A fourth position in the range of possible scenarios, between Design Limitation and Treaty.
16

ENVIRONMENTAL FLOWS: CASE STUDIES
mitigation and compensation program to offset the
the first comprehensive assessment by the World
impacts on communities and their resources.
Bank in which downstream environmental analy-
sis is explicitly linked to social analysis, and has
The LHWP Environmental Flow Assessment rep-
had significant influence on project decision-
resents a major contribution to knowledge. It is
making.
THE SKAGIT RIVER HYDROELECTRIC PROJECT
Hydropower dams on the Skagit River in the United
After 15 years of studies, and 10 years of negotia-
States provide electricity to the city of Seattle. An ap-
tions, a comprehensive Settlement Agreement was
plication to renew the operating license for the dams
signed in 1991. The Federal Energy Regulatory Com-
created an opportunity to incorporate environmen-
mission (FERC) then issued a new 30-year operat-
tal flows into the license to partially reverse past de-
ing license to SCL in 1995.
terioration to the river, and negotiate a settlement
that maximized benefits for a range of stakeholders.
BASIS OF THE ENVIRONMENTAL
NEGOTIATIONS
BACKGROUND
FERC has exclusive authority in the United States
The Skagit River rises in Canada and flows 162 miles
to license nonfederal hydropower projects on navi-
to its mouth in Puget Sound in the State of Washing-
gable waterways and federal lands. FERC gave equal
ton in the United States. About 70 percent of its drain-
consideration to the need for power generation and
age basin falls under U.S. federal administration,
to issues related to energy conservation, fish and
including 550 square miles of U.S. Forest Service
wildlife resources, recreational opportunities, and
wilderness, 750 square miles of national park, 170
other aspects of environmental quality. FERC
square miles of national recreation area, and 60
identified four major resources that could be
square miles in the National Wild and Scenic Rivers
directly affected:
System.
I anadromous fish (species that migrate between
sea and freshwaters)
The Skagit River Project (SRP), which began opera-
I sensitive terrestrial ecological resources
tion in 1927, consists of three sequential hydropower
I recreational and visual resources
dams along the main stem of the river in the United
I cultural resources.
States: the Ross, Diablo, and Gorge Dams. It is the
largest of six hydropower projects in the basin, with
Additional indirect impacts to these resources could
an installed capacity of 689 MW of power.
occur through unstable slopes in reservoir draw-
down areas, and continued transport of sediments
The utility company for Seattle, Seattle City Light
to downstream rivers, which would change the
(SCL), holds the only water rights in the SRP, and
nature of their channels. Only the combined water
uses them only to generate hydropower. The origi-
and fishery issues are addressed in this case study.
nal operating license expired in 1977, and agencies
and tribes concerned about fisheries and other en-
The Skagit system is one of the few Puget Sound
vironmental issues opposed re-licensing. As a re-
basins in which salmon are managed on a natural-
sult, operation of the SRP continued with annually
stock basis. The fish are a major component of the
renewed licenses, while intensive investigations and
river ecosystem, an important fisheries resource,
negotiations about re-licensing ensued among SCL;
and attract one of the largest over-wintering popu-
local, state, federal, and tribal governments; and en-
lations of bald eagles in the United States.
vironmental organizations.
17

WATER RESOURCES AND ENVIRONMENT · TECHNICAL NOTE C.2
The Skagit downstream of the lowest dam--Gorge
provement of fish habitat and fish production. For
Dam--receives migratory runs of all five species
example, a 1968 license amendment required a
of Pacific salmon and three other anad-
minimum flow release from Gorge Dam, but within
romous game species. Historically, the upper Skagit
this constraint, releases still fluctuated with electric-
River had abundant rainbow trout and other resi-
ity demand. In 1978, through interim agreements,
dent fish species, for which the dam reservoirs
flow releases were modified to benefit downstream
markedly increased habitat while reducing habi-
fish, including reduced flow fluctuations and limi-
tat for the flowing-water species. The rapid and large
tations on the degree to which floods were con-
fluctuations in releases from Gorge Dam also had
trolled during the normal flood season.
a major negative affect on the anadromous fish
lower down the river. Low points in the fluctua-
Other interim agreements addressed:
tions severely reduced aquatic habitat, dried out
I the impacts from fluctuating reservoir levels
spawning grounds, left young fish stranded at wa-
on fish spawning along shorelines and in tribu-
ter edges and in potholes, and created shallow ar-
taries
eas through which adult fish could not migrate.
I the loss of fish habitat through water being di-
verted from the river through turbines
FLOW AND FISHERIES RESEARCH
I the maintenance of favorable water tempera-
tures for fish.
Research studies were undertaken on the impacts
of the dam on the river. For example, a series of field
These flow-management measures, carried out
studies between 1979 and 1982 were designed to
mostly during the 1980s, correlated with an in-
determine the effects of flow fluctuations on the
creased production of pink and chinook salmon.
spawning behavior, egg deposition, incubation,
hatching success, and tolerance to stranding of young
THE SETTLEMENT AGREEMENT
steelhead trout and chinook and chum salmon. Sup-
porting laboratory studies focused mainly on deter-
mining whether and under what conditions young
The SA listed environmental enhancement mea-
fish migrate into the riverbed to avoid being stranded.
sures totaling about $100 million (Box 6). This in-
Results indicated that more young fish survived if
cluded a Fish Flow Plan that formalized the
down-ramping (reduction) of dam releases occurred
flow-management activities already in force and
during daytime, and if the riverbed had coarse par-
added other flow-related measures to enhance fish
ticles with large interstitial spaces for them to move
habitat (Box 7). It also included several measures
into. These and many other findings led to interim
not related to flow management--costing more than
agreements on flow management, which were ne-
$6 million--that would further reduce impacts of the
gotiated without application of a specific flow-
SRP on fishery resources. This component focused
assessment method. A recommendation was made,
on research and production programs and creation
however, that the Instream Flow Incremental
or improvement of critical fish habitat.
Method (IFIM) (see Note C.1) be used to further
guide flow management.
REISSUE OF LICENSE
THE INTERIM AGREEMENTS
FERC concluded that the proposed SA struck a rea-
sonable balance between the development values
The interim agreements between the SCL and re-
of the SRP and the values of the natural resources.
source agencies, reached before and during the pe-
Of the range of options considered, continued op-
riod of annual licensing, later formed part of the
eration under the terms of the SA was FERC's pre-
Settlement Agreement (SA). These mainly ad-
ferred option. Cumulative effects would be no
dressed flow requirements for protection and im-
greater than under the present interim agreements,
18

ENVIRONMENTAL FLOWS: CASE STUDIES
BOX 6.
COSTS OF ENHANCEMENT MEASURES IN THE SETTLEMENT AGREEMENT.
(ALL COSTS IN MILLIONS OF US DOLLARS AT 1990 VALUE AND MOSTLY SPREAD OVER THE 30-YEAR LICENSE PERIOD.)
Category
Examples of measures
Cost (millions)
Geology and Soils
Erosion control at more than 50 sites
3
Fisheries
I Interagency coordinating committees
I Revised management of water levels in Ross reservoir
I Flow management to protect spawning and juvenile habitat (Box 7):
I flow plans for drought years
I advance scheduling of hourly hydropower generation
during each calendar day
I Monitoring
I Nonflow measures such as research and enhancement of fish habitat.
49
Vegetation and
Acquisition and preservation of wildlife habitat
20
Wildlife
Visual Resources
I Revegetation
I Redesign, relocation, or removal of several buildings
2.5
Cultural Resources
Archaeological, historical, and architectural issues
6
Land-use and
Enhanced recreational facilities
17
Recreation
BOX 7.
EXAMPLES OF FLOW REGULATION PROTECTIVE MEASURES FOR CHINOOK SALMON IN THE NEW LICENSE FOR OPERATING THE SRP.
(CFS = CUBIC FEET OF WATER PER SECOND, FLOWING PAST A MEASURED POINT. DOWN-RAMPING = RATE OF CHANGE OF
DECREASING POWER-PLANT WATER RELEASES)
Protected feature
Regulation
Spawning period
August 20 to October 15
Incubation period
August 20 to April 30
Spawning flow
During the spawning period, daily flows shall not exceed 4,500 cfs
Incubation flows
Minimum incubation flows each day of the incubation period as per a pre-agreed schedule.
Protection of Fry
The Salmon Fry Protection Period is February 1 to May 31. During this period, the City shall restrict
down-ramping and adhere to minimum flows to protect fry.
and in some cases would have new beneficial ef-
tion. SCL received the 1998 Public Service Award
fects on resources. With the new environmental
from the Nature Conservancy of Washington for its
protection measures in place, the SRP would con-
environmental stewardship of the Skagit River ba-
tinue to be economically viable and provide a
sin, and is seen by many as a model for any public
dependable and economic source of energy for
agency seeking to combine energy production with
its customers.
protection of the natural environment. The Terror
Lake Hydropower Project (Box 8) provides another
The new license was a notable example of what
example of how pre-licensing negotiations can pro-
can be achieved through parties with different in-
duce an atmosphere of cooperation and mutual
terests being willing to negotiate a win-win solu-
compromise, reducing conflict and costly delays.
19

WATER RESOURCES AND ENVIRONMENT · TECHNICAL NOTE C.2
BOX 8.
THE TERROR LAKE HYDROPOWER PROJECT
The Terror River, on Kodiak Island in Alaska, lies within the Kodiak National Wildlife Refuge. It supports commercially
important runs of several species of Pacific Salmon. These fish are a vital food source for the Kodiak brown bear; the
bear's protection is the main purpose of the Refuge.
The river is also a prime resource for generating hydropower. Between 1964 and 1981, negotiations took place be-
tween the Kodiak Electric Association (KEA), which wished to establish a hydropower plant on the river to meet the entire
electrical demand of the city of Kodiak, and a range of government institutions and other interested parties. The project
became the first hydropower project for which a license was held up due to concern over environmental flows. KEA
initially used a rule-of-thumb approach (The Tennant Method--see Technical Note C.1) to assess flows for fish mainte-
nance. The licensing agency, FERC, felt this method was inappropriate outside its area of development, and also was
too coarse to assess the impacts of a range of potential changes in flow.
This led to a pioneering application of the Instream Flow Incremental Methodology (IFIM), which allowed the impacts of
hydropower releases to be predicted and trade-offs to be considered. IFIM has two major features. First, it describes the
changes in hydraulic conditions within the river with changing flows. Second, it evaluates these changing conditions in
terms of suitable fish habitat. The IFIM assessment described how proposed flow changes could impact fish migration,
salmon spawning, egg incubation, and rearing of juveniles. Because these activities took place at different times and
required different kinds of flows, a key issue in the negotiations was the scheduling (timing) and volume of flow in the
river at any time of the year.
Major factors leading to a successful agreement were the early agreement to use IFIM, and the receptiveness of all
interested parties to its outputs once they knew what the methodology could do and were regularly updated on
emerging results. Using IFIM, minimum stream flows to be released from the project were specified, and the parties
agreed to an Instream Flow Mitigation Plan. In June 1981, a compromise agreement incorporating these and other
concerns was signed by KEA, the U.S. Department of the Interior, the State of Alaska, the Sierra Club, the National
Audobon Society, and the National Wildlife Federation. FERC issued the license to proceed with the project in October
1981, which included specifications for monitoring the fisheries for 9 years.
COMMENT
inadequate refuge areas, all of which will affect fish
numbers. There is a widespread belief, probably
Fish are but one component of an interdependent
underlying the Skagit River example, that if the flow
ecosystem (Box 1). Although productive fisheries
is appropriate for fish, it will probably serve most
might be the objective, managing without consid-
other ecosystem needs. In different projects this may
eration for the other ecosystem components could
or may not be so. Flow management is best ad-
result in, for example, poor food supplies for the
dressed for the whole ecosystem and not left
fish, inappropriate water quality or temperature, or
to chance.
THE MURRAY-DARLING CAP ON ABSTRACTIONS
The rivers of the Murray-Darling Basin in Austra-
consideration of ecosystem functioning, but it
lia are seriously degraded as a result of over-ab-
represents an important policy decision to limit
straction of water and increasing nutrient and
further degradation of the river until flow assess-
salinity levels. As a first move to halt river degra-
ments can be completed and environmental
dation, a limit ("cap") has been placed on abstrac-
flows implemented.
tions. If this, along with other initiatives, does not
achieve the desired level of river health, water al-
BACKGROUND
locations to offstream users may be reduced and
re-allocated for river maintenance. The cap is not
Located in southeastern Australia, the Murray-
an environmental flow, because it is not based on
Darling Basin covers one-seventh (1.06 x 10⁶ km2)
20

ENVIRONMENTAL FLOWS: CASE STUDIES
FIGURE 4.
from the 1950s onwards, and at present the median
THE MURRAY-DARLING BASIN IN SOUTHEAST AUSTRALIA
annual flows from the basin to the sea are only 21
percent of those that occurred naturally. The lower
Queensland
Northern
Territory
Murray now experiences drought-like flows in more
than 3-in-5 years, compared to 1-in-20 years under
Charleville
natural conditions.
BRISBANE
Toowoomba
Projected growth in demand. Until 1995, the water
South Australia
Bourke
allocation system encouraged further development
New South Wales
r
ive
of the water resources of the basin, rationing water
g R
arlin
D
Dubbo
during droughts but not during normal or wet years.
Orange
A significant level of under-use of allocations still
SYDNEY
ADELAIDE
Mildura
Murray River
CANBERRA
existed. For example, in the period 1991-95, only
Murray Bridge
63 percent of the permitted abstractions actually
Albury
occurred. If all existing water entitlements were fully
MELBOURNE
used, the potential existed for long-term average ab-
Victoria
stractions from the whole basin to increase by a
further 15 percent (Figure 5). This projected increase
of the country's total area (Figure 4). It encom-
would have reduced the security of supply for ex-
passes parts of four states--New South Wales,
isting irrigators and exacerbated an already grave
Victoria, South Australia, and Queensland--and the
decline in river health.
Australian Capital Territory (ACT). Some 2 mil-
lion people live in the basin; another 1 million
Existing and potential water conflicts. River-flow
outside it are dependent on its water. It contains
patterns have changed markedly, particularly in the
some of the country's best farmland, and use of
lower reaches. The causes include flow regulation
its waters has allowed expansion of irrigated ag-
by dams and weir pools, and abstractions, primarily
riculture into the drier inland areas. The value
for irrigation areas. In certain seasons, far less flow
of the basin's agricultural produce exceeds Aus$8.5
than natural is available in these reaches to dilute
billion per annum, of which Aus$3 billion is de-
and carry away increasing volumes of nutrient-rich
rived from irrigated land. Jobs created and for-
agricultural runoff and urban wastewater. The con-
eign income derived from the food-processing
struction of weirs for irrigation off-takes has created
industry further enhance the importance of this
still, stratified conditions that promote the growth of
area. The water is also used for domestic pur-
blue-green algae, which sometimes increase to
poses in Canberra, Adelaide, and many small
problematic proportions as algal blooms. The algae
country towns; for plantations, which account for
can produce toxins that cause liver damage, stom-
15 percent of Australia's income from forest prod-
ach discomfort, skin and eye irritations, and disor-
ucts; and for mining, which produces 6 percent
ders of the nervous system. They can also cause
of the country's income from minerals. Hydro-
livestock deaths, odorous and distasteful water, clog
power produced at the Snowy Mountains Hydro-
water-supply equipment and, when they decay,
electric Scheme meets 5 percent of the region's
cause mass fish kills. The toxins can only be re-
energy needs and diverts water across the catch-
moved by advanced water purification systems. In
ment divide into basin rivers.
1991, the world's largest riverine bloom of blue-
green algae developed along a 1,000-kilometer
Development of the basin over the last 100 years
stretch of the Darling River, causing the New South
has resulted in increasing abstraction of water from
Wales Government to declare a state of emergency.
its rivers. Dams and weirs regulate about 80 per-
cent of the approximately 17,500 kilometers of river
Algal blooms are one very visible symptom of de-
length. The rate of abstraction sharply increased
clining river health. They occur because the natu-
21

WATER RESOURCES AND ENVIRONMENT · TECHNICAL NOTE C.2
ral checks and balances of a healthy river system
FIGURE 5.
have been lost. In the Murray-Darling, some of the
GROWTH IN WATER USE IN MURRAY-DARLING BASIN
imbalance has been caused by the loss of natural
communities of aquatic plants and animals and their
14,000
Full development of existing
replacement by introduced species, but arguably the
Total
entitlements
ear) 12,000
NSW
major cause has been over-abstraction of water. Pre-
Victoria
S.A.
dictions that these activities would continue to in-
10,000
Queensland
ACT
crease indicate that costly problems related to river
Average Natural
8,000
Flow to Sea
'88
'94
health could also be expected to increase in fre-
ersion (GL/Y
quency and severity.
6,000
4,000
nnual Div
BALANCING CATCHMENT DEVELOPMENT
A
2,000
AND PROTECTION OF RIVER HEALTH
0
The cap. The Murray-Darling Basin Ministerial
1920
1930
1940
1950
1960
1970
1980
1990
2000
2010
2020
Council is the highest-level forum for interstate
Year
cooperation on management of the basin's natural
resources. The council consists of relevant minis-
ters from the five states and the national govern-
ment. Being a political forum, the council has the
sustainable use of the basin's waters, the purpose
power to recommend decisions for the basin as a
of the cap was to restrain abstraction but not nec-
whole. However, enactment remains the responsi-
essarily development. New development would be
bility of each state. In 1993, in response to growing
allowed, provided the water was obtained by im-
concern over water-use patterns, the Ministerial
proving the efficiency of water use or by purchas-
Council requested an audit of water use in the ba-
ing water from existing developments (water trading
sin. The audit indicated that the patterns of exist-
for highest-value use).
ing and projected water use were unsustainable.
The council introduced the cap by unanimous vote,
In 1995, in response to the audit, the Ministerial
representing a consensus of government opinion
Council introduced an interim cap on abstraction
and policy across the basin. Impetus was provided
of water from the basin for all consumptive uses.
by the Council of Australian Governments, which
Seen as an essential first step in achieving sus-
in 1994 produced a Water Reform Agenda that
tainable use of the rivers' waters, this was con-
inter alia redefined water rights and costs, and
firmed as a permanent cap in 1997. The cap is
stressed the need for water allocations for environ-
presently defined as "The volume of water that
mental maintenance.
would have been diverted under 1993/94 levels of
development. In unregulated rivers this Cap may
Monitoring achievement. An Independent Audit
be expressed as an end-of-valley flow regime." The
Group (IAG) advises on setting, implementing, and
limit has no specific ecological significance, be-
monitoring the cap. Abstractions are monitored in
ing simply the level of abstractions two years be-
each of the 23 major sub-catchments of the basin
fore the cap was introduced.
to determine if the cap is being achieved. The IAG
annually reviews cap implementation, and reports
The objective was to strike a balance between the
to the chairman of the Ministerial Council.
significant social and economic benefits of devel-
oping the basin's water resources, and the need for
The methods used to determine whether usage in
maintaining a healthy river system by safeguard-
a sub-catchment has exceeded the cap have been
ing adequate river flow. As an initial move toward
modified with experience. The current rule is
22


ENVIRONMENTAL FLOWS: CASE STUDIES
that if any sub-catchment in any year uses 20 per-
contribute to deterioration of water quality and
cent more water than its 1993-94 usage, corrected
environmental protection
for that year's climate, then that area has breached
I water allocations to be made with extreme sen-
the cap. As an example, in the 1997-98 review of
sitivity to the effects on the environment (Pre-
cap implementation, the IAG found that the Barwon-
cautionary Principle)
Darling sub-catchment within New South Wales had
I water to be allocated to the highest-value use
breached the cap. Following discussion at the March
I statutory and agreed property rights to be rec-
2000 Ministerial Council meeting, New South Wales
ognized
was requested to report to the August 2000 Minis-
I water management processes to be transpar-
terial Council meeting on the actions it is under-
ent and auditable
taking to bring abstractions in the Barwon-Darling
I an administrative system that is easily under-
within cap limits.
stood and that minimizes time and costs.
Equity issues that may jeopardize management of
The current monitoring system addresses only volu-
the cap fall into two categories: 1) pre-existing;
metric abstractions with no attention to river health,
and 2) newly identified. Pre-existing equity issues
a limitation recognized by the Ministerial Council.
included finalization of the cap limits for
The current cap may not allow sufficient water to
Queensland and ACT. If some jurisdictions were
remain in the system to halt river degradation; as
exempt, the cap could be undermined. Newly iden-
information about flow needs improves, the level
tified equity issues include conflicts between ex-
may have to be re-set. At the March 2000 Council
isting users and new developers, and the inclusion
meeting, the Council requested that a sustainable
of farm dams and tree plantations in the relevant
rivers audit be prepared, with preliminary results
caps. Overall, effective management of these is-
on river health to be presented at the August 2000
sues requires a total catchment management ap-
meeting.
proach to water management that embraces the
whole water cycle.
In October 2001, a pilot sustainable river audit was
approved to test the feasibility and effectiveness of
audit options and procedures in four basins. The
DEFINING THE ENVIRONMENTAL
pilot audit is expected to report to the Council by
FLOW REQUIREMENT
mid-2003.
With the cap in place, the focus now is on ensur-
STAKEHOLDER AND EQUITY ISSUES
ing the health of the rivers. The starting point is
the assessment of river health that will be provided
Implementation of the cap was a policy decision
by the year 2000 Sustainable Rivers Audit. But
taken by all relevant governments. As such, the key
beyond this, there is no basin-wide move to take
policy stakeholders were
the next step of defining
involved, and they in turn
and reserving environ-
worked with their constitu-
mental flows for all the riv-
encies.
ers. Such flow assessments
are being done for many
From the outset, equity was
sub-catchments (includ-
an important implementa-
, ©CSIRO
en
ing by expert panels of
tion issue. The IAG devel-
river specialists--see Note
oped six principles to assess
C.1), but these are not
equity:
being integrated to deliver
I no further change to
environmental flows to
flow regimes that would
Photo by Willem van Ak
maintain all the basin's
River Red Gums,Murray River, Australia
23

WATER RESOURCES AND ENVIRONMENT · TECHNICAL NOTE C.2
rivers--including the Murray and Darling Rivers--
A further difficulty is likely to arise. The cap allows
in a healthy condition.
for irrigation development through improvements
in water use efficiency as long as the water extracted
There is growing recognition that this next step
from the river remains within the cap. These effi-
should be taken. However, any change in river man-
ciency improvements will come partly from reduced
agement that requires more river flow for the envi-
leakage in distribution systems and on-farm. The
ronment would imply a reduction somewhere else,
consequence is that surface and subsurface return
and this would be difficult politically. Nevertheless,
flows to the rivers of the Basin will decrease. Thus,
the process is gradually gaining momentum, follow-
the cap could have the perverse effect of decreas-
ing precedents in other countries where historical
ing river flows and placing greater pressure on the
water allocations have led to severe environmental
aquatic environment.
problems (Box 9).
WIDENING APPLICATION OF THE CONCEPT
OF ENVIRONMENTAL FLOWS
The impact of flow manipulations is not reflected
THE CARONI SWAMP OF TRINIDAD
only in river channels. Wetlands, lakes, deltas,
AND TOBAGO
groundwater reserves and inland seas are all becom-
ing degraded due to disturbance of their natural pat-
The Caroni Swamp is the country's largest man-
terns of water movement. This section provides three
grove swamp, supporting 157 bird species, includ-
examples--the Caroni Swamp in Trinidad and Tobago,
ing migratory waterfowl and the national bird, the
the Lower Mekong River, and the Aral Sea--of prob-
scarlet ibis. Over the last few decades, various ab-
lems that have emerged, and the moves to limit or
stractions and other catchment activities have
reverse degradation of both the water bodies and the
sharply reduced the freshwater inflows from
quality of life of the riparian peoples.
groundwater, overland flow, and its four rivers. In
BOX 9.
THE CENTRAL VALLEY PROJECT, CALIFORNIA, U.S.A.
In 1937, the Central Valley Project (CVP) was launched to divert water from the Sacramento-San Joaquin River delta to
southern California. This was supplemented in 1960 by the State Water Project, with the two schemes providing 10
million acre-feet of water to southern California and enhancing the welfare of rural areas and industrial growth. How-
ever, there were massive ecological impacts, including a serious decline of sport and commercial fisheries, loss of 95
percent of the state's wetlands, decline of migratory bird and waterfowl populations from 60 million to 3 million, and
enhanced salinity levels in the donor systems.
Policies and laws to mitigate this include the CVP Improvement Act of 1992, which placed environmental restoration
and protection on an equal footing with offstream water demands. Operation of CVP facilities is changing to allow re-
allocation of an additional 800,000 acre-feet of water yield from offstream users to the environment. An $80 million
temperature control device was added to Shasta Dam to aid Sacramento River salmon, and more than $100 million
has been spent on environmental rehabilitation.
By 1997, debate over major sections of the act continued, including management of the environmental water alloca-
tion and the Anadromous Fish Restoration Program. There was dispute over the definition of yield and where it should be
measured; whether downstream flows could be re-captured and exported; and how and where the water could best
be used for the environment. The amount of water needed at the delta to double fish populations was questioned, as
was the adequacy of the underlying science. Renewed contracts for water allocations now cost more and require
water conservation plans and payment into a restoration fund.
24

ENVIRONMENTAL FLOWS: CASE STUDIES
addition, pollution from various industries and rum
The Great Lake, or Tonle Sap, is of exceptional eco-
processing plants have increased waste discharges
logical, economic, and cultural importance. Situ-
into the Caroni River. Flood protection works, em-
ated in Cambodia, it is linked to the Mekong River
bankments, and canals have prevented floodplains
by the Tonle Sap River. In the dry season, the Great
from being inundated and allowed increased inflow
Lake drains into the Mekong. In the wet season,
of marine waters. Increasing salinization and loss
the Mekong reverses the flow of the Tonle Sap River,
of a range of habitats has resulted in an overall de-
which expands the lake from about 3,000 km2 to
cline in biodiversity and a falling abundance of
16,000 km2. Gradual drainage of the lake in the dry
plants and animals, including the scarlet ibis.
season significantly contributes to dry-season
low flows in the delta. The annual fish catch of the
The World Bank-supported Trinidad and Tobago
lower Mekong, some 1.5-2.0 million tons, is largely
Water Resources Management Strategy recom-
dependent on the annual flooding and draining of
mended measures for the rehabilitation of the
the Tonle Sap.
swamp, including increasing freshwater and sedi-
ment inflows, retarding drainage of water from the
In 2000, the Mekong River Commission (MRC),
swamp, excluding seawater intrusion, and control-
which is charged with implementing the Mekong
ling point and nonpoint sources of pollution. Two
Agreement, received $10.8 million from the Global
critical considerations will be 1) restoring flushing
Environment Facility to develop "Rules for Water
floods and not just increasing base flows; and 2)
Utilization," including rules for cooperation in the
ensuring the extra water is of high quality, brought
maintenance of flows in the main stream. Article 6
from high in the catchment. A further consideration
of the agreement requires that the following flows
is that all remedial work should be simple and not
be adhered to, except in years of historically severe
require highly skilled professionals to maintain it.
droughts or floods:
The ultimate aim is to reverse the decline in
I not less than the acceptable minimum monthly
biodiversity and ensure sustainable use of the
natural flow during each month of the dry sea-
swamp's valued ecological attributes.
son
I the natural reversal of flows into the Tonle Sap in
THE LOWER MEKONG RIVER
the wet season
I average daily peak flows that are not greater than
would naturally occur on average during the
In 1995, the four riparian countries of the lower
flood season.
Mekong--Cambodia, Laos, Thailand, and Vietnam--
signed an "Agreement on Co-operation for the Sus-
Agreed flows will be based on a process of
tainable Development of the Mekong River Basin."
transboundary analysis, which began in 2000. Mini-
Although all parts of the system will be addressed,
mum flows for the dry season are due to be set by
two critical areas will receive special attention.
2004. The World Bank is providing technical assis-
These are the delta in Vietnam and the Tonle Sap
tance for the determination of environmental flow
Lake in Cambodia. The delta covers about 12 per-
requirements for the Mekong River Basin.
cent of Vietnam's land area, supports about 17 mil-
lion people, and produces half of the country's rice.
THE ARAL SEA
With catchment and other changes, the river's flow
is becoming increasingly subject to floods, with "ex-
cessive" floods occurring about every 30 years in-
Until the 1960s, the Aral Sea was the fourth largest
stead of every 200 years, and consequent lower flow
inland body of freshwater in the world, and was
in the dry season. As a result, there is increasing
vital to life in the Central Asian states of Tajikistan,
saltwater intrusion into the delta, which adversely
Kyrgyz Republic, Uzbekistan, Kazakhstan, and
affects delta residents, domestic water supplies, and
Turkmenistan. Irrigated agriculture has been prac-
up to 2 million hectares of agricultural land.
ticed for thousands of years in the Aral Basin and
25

WATER RESOURCES AND ENVIRONMENT · TECHNICAL NOTE C.2
currently supports 40 million people. Irrigation,
It is probably economically, socially, and ecologi-
mostly of rice and cotton, has been both the means
cally impossible to restore the Aral Sea to its origi-
of survival for the people, and the main cause of
nal condition. A new balance needs to be struck
the decline of the Basin's water resources. The
to maintain the water bodies at agreed levels of
irrigated area has more than tripled in the last
health that will also address the needs of millions
hundred years, to the present 8 million hectares.
of poor people. This is being addressed through ef-
To support this, more than 90 percent of the river
forts of the Global Environment Facility, the World
flow into the Aral Sea has been diverted, and its
Bank, and many other multilateral, bilateral, and
present volume is 70 percent less than histori-
national organizations. Efforts will focus on two
cal levels. The remaining lake has split into a
main objectives. First, the irrigation infrastructure
smaller northern section, with some inflow re-
will be rehabilitated to increase its efficiency. Sec-
maining, and a larger southern portion that is
ond, the northern Aral Sea will be isolated and,
hypersaline and mostly biologically dead. Increas-
through managed environmental flows, an attempt
ing salinization is also a major problem in the
will be made to restore some of its original ecosys-
surrounding irrigated land.
tem attributes.
26

ENVIRONMENTAL FLOWS: CASE STUDIES
CONCLUSION
There is growing awareness that catchment and
I Use of best available knowledge from these pro-
water resource developments that alter the pattern
grams, together with directed short-term re-
of water movement in aquatic ecosystems will cause
search, to answer management questions
the systems to change. These changes do not have
(moving ahead with limited knowledge)
to be left to chance, but can be anticipated and lim-
I Use of structured, transparent processes for
ited to a level that society finds acceptable. Many
options assessment and decisionmaking that
techniques have evolved for environmental flow
equally address economic, ecological, social,
assessments (see Note C.1). As the examples de-
and engineering concerns (assessing the full im-
scribed here reveal, these techniques can be used
plications of all options and negotiating
in different ways to provide advice on development
tradeoffs)
options . World Bank experience in EFA is evolving
I Monitoring the outcome of the chosen option
slowly.
(learning by doing)
I Adjustment of management plans where indi-
The availability of these flow assessment techniques
cated by monitoring results (employing strate-
is a step forward, but in isolation can achieve little.
gic adaptive management).
All too commonly, and irrespective of the chosen
method, there are few relevant data, limited funds,
To achieve this strategy, five factors for success
few specialists with relevant skills and experience,
are apparent in the case studies. First, down-
poor understanding of the targeted aquatic system,
stream communities have an important role to play
and development needs that are so urgent that de-
in the decisionmaking process, which is likely to
cisions cannot wait until all of the preceding are
impact and alter there livelihoods. Second, the wa-
fully resolved.
ter authorities need to move from being provid-
ers of water to becoming holistic managers of
If responsible environmental management, and the
water resources. Third, scientists and manag-
concept of sustainable use, are to succeed, scien-
ers need to agree to work together in an envi-
tific advisors, water managers, and decisionmakers
ronment of limited knowledge. Fourth, emerging
could benefit from a working relationship based on
legislation on sustainable resource use, either
a six-point strategy:
from within the country or from outside, needs
I Development of appropriate policy and legisla-
to be implemented to provide impetus for and
tion on resource protection (legitimizing sus-
legitimacy to the environmental flow assess-
tainable use)
ments. Fifth, the move toward sustainable river
I Directed national programs of research on the
use, though difficult, is typified by negotiation,
links between ecosystems and flow (increasing
transparent decision making, and attention to
the knowledge base)
equity and conservation issues.
27

WATER RESOURCES AND ENVIRONMENT · TECHNICAL NOTE C.2
FURTHER READING
Lesotho Highlands
ommendations from the Terror Lake project."
Washington, D.C.: U.S. Fish and Wildlife Service.
Boadu, F.O. 1998. "Relational characteristics of
FWS/OBS-84/08.
transboundary water treaties: Lesotho's water
Bovee, K.D. 1982. "A guide to stream habitat analysis us-
transfer Treaty with the Republic of South Af-
ing the Instream Flow Incremental Methodology."
rica." Natural Resources Journal 38:381-409.
Instream Flow Information Paper 12. Washing-
Lesotho Highlands Development Authority (LHDA). Un-
ton, D.C.: U.S. Fish and Wildlife Service. FWS/
dated. "Environmental and social aspects of the
OBS-82/26.
Lesotho Highlands Water Project." Maseru,
Lesotho: LHDA.
Web site: www.lhwp.org.ls
Murray-Darling Basin
Blackmore, D.J. 1999. "The Murray-Darling Basin Cap
Skagit River
on diversions policy and practice for the new
millennium." Address at National Water Sympo-
Stober, Q.J., S.C. Crumley, D.E. Fast, E.S. Killebrew, R.M.
sium, Sydney, Australia.
Woodin, G. Engman, and G. Tutmark. 1982. "Ef-
Murray-Darling Basin Commission. 1999. "Review of Cap
fects of hydroelectric discharge fluctuations on
implementation 1998/99: Report of the Indepen-
salmon and steelhead in the Skagit River, Wash-
dent Audit Group." Canberra, Australia: Murray-
ington: Final Report from the Washington De-
Darling Basin Commission.
partments of Fisheries and Game to the City of
Chenoweth, J.L., and H.M. Malano. 2001. "Decision mak-
Seattle."
ing in multi-jurisdictional river basins: A case
Federal Energy Regulatory Commission. 1996. "Environ-
study of the Murray-Darling Basin." Water Inter-
mental assessment for new hydropower license:
national 26(3): 301-313.
Skagit River Hydroelectric project." Washington,
Web site: www.mdbc.gov.au
D.C.: Federal Energy Regulatory Commission.
FERC Project No. 553.
Web site: http://www.ci.seattle.wa.us
The Central Valley Project
McCarthy E. 1997. "CVP Improvement Act update." West-
Terror River
ern Water: 4-13.
Olive, S.W. and B.L. Lamb. 1984. "Conducting a FERC
environmental assessment: a case study and rec-
28