UNEP SCS/SAP Ver. 3 (24/2/99)
Page 1
UNEP SCS/SAP Ver. 3
Strategic Action Programme
for the South China Sea
(Draft Version 3, 24 February 1999)
TABLE OF CONTENTS
1
BACKGROUND & RATIONALE: ........................................................................................... 6
1.1 GLOBAL AND REGIONAL SIGNIFICANCE OF THE SOUTH CHINA SEA (SCS) AND ITS ASSOCIATED
FRESHWATER CATCHMENTS ................................................................................................. 6
1.2
BASIS FOR PREPARATION OF THE STRATEGIC ACTION PROGRAMME......................................... 7
2 CAUSES OF DEGRADATION AND THREATS TO THE AQUATIC ENVIRONMENT AND
RESOURCES OF THE SOUTH CHINA SEA.............................................................................. 9
2.1
CAUSES OF ENVIRONMENTAL DEGRADATION ........................................................................ 9
2.2
FUTURE THREATS TO THE SOUTH CHINA SEA ..................................................................... 11
3 ESTABLISHMENT OF TARGETS FOR ENVIRONMENTAL QUALITY IN THE SOUTH CHINA
SEA ....................................................................................................................................... 12
3.1
GENERAL...................................................................................................................... 12
3.2
OBJECTIVES, RATIONALE AND PRIORITIES FOR THE SAP...................................................... 12
3.3
TARGETS AND PRIORITY ACTIONS..................................................................................... 13
3.3.1
Mangroves...........................................................................................................13
3.3.2
Coral reefs ...........................................................................................................16
3.3.3
Seagrass .............................................................................................................17
3.3.4 Estuaries and Wetlands .........................................................................................21
3.4
OVER EXPLOITATION OF FISHERIES.................................................................................... 22
3.5
LAND-BASED POLLUTION................................................................................................. 24
3.5.1
Urban/Municipal Waste.........................................................................................24
3.5.2
Industrial Waste ...................................................................................................26
3.5.3
Agricultural Waste ................................................................................................26
3.5.4
Hydrocarbons.......................................................................................................27
3.5.5
Suspended Solid/Sedimentation............................................................................28
3.5.6
Regional Cooperation ...........................................................................................30
4
COST BENEFIT ANALYSIS OF PROGRAMME ACTIONS.................................................... 31
4.1
VALUATION CONSIDERATIONS.......................................................................................... 31
4.2
VALUATION OF RESOURCES............................................................................................. 32
4.2.1
Mangrove.............................................................................................................33
4.2.2
Coral Reefs ..........................................................................................................42
4.2.3
Seagrass .............................................................................................................42
4.2.4
Wetlands .............................................................................................................43
4.2.5
Total habitat values ..............................................................................................43
4.2.6
Overexploitation of fishery resources .....................................................................44
4.2.7
Pollution...............................................................................................................46
UNEP SCS/SAP Ver. 3 (24/2/99)
Page 2
4.2.8 Regional Cooperation ...............................................................................................47
4.4
ASSESSING THE BENEFITS FROM THE PROGRAMME ............................................................. 47
4.5
ESTIMATED COST OF THE STRATEGIC ACTION PROGRAMME.................................................. 48
5
INCREMENTAL PARTNERSHIPS ....................................................................................... 64
5.1
JUSTIFICATION FOR FORMING PARTNERSHIPS ..................................................................... 64
5.2
PARTNERSHIPS AVAILABLE FOR ACHIEVING MAXIMUM ENVIRONMENTAL BENEFITS.................... 64
5.3
EXAMPLES OF POTENTIAL FOR EXISTING AND PLANNED INVESTMENTS.................................... 65
5.3.1
Regional..............................................................................................................65
5.3.2
National...............................................................................................................65
5.3.3
Donor Countries ...................................................................................................65
5.3.4
Non Government Organisations ............................................................................66
5.3.5
United Nations Organisations................................................................................66
6
PRIORITY REGIONAL AND NATIONAL ACTIONS TO ADDRESS THE CAUSES OF
ENVIRONMENTAL DEGRADATION AND THREATS TO THE ENVIRONMENT OF THE SOUTH
CHINA SEA................................................................................................................................ 67
6.1
PRIORITIES.................................................................................................................... 67
6.2
EXAMPLES OF ACTIONS THAT WILL FULFIL SOME OF THE OBJECTIVES OF THE STRATEGIC ACTION
PROGRAMME............................................................................................................................ 67
6.2.1
Support a regional programme in cleaner production technologies and best
environmental practices.......................................................................................................67
6.2.2
Monitoring of demonstration conservation sites ......................................................68
6.2.3
Review national EIA regulations to promote greater public participation ...................68
6.2.4
Demonstration site for local community conservation activity...................................69
6.2.5
Develop guidelines on preparation of national plans for protection of marine and
coastal environments...........................................................................................................69
6.2.6
A regional GIS database and a mathematical model on pollution and its impact on
ecosystems.........................................................................................................................69
6.2.7
Collect information on trade in "minor" and endangered marine products..................70
UNEP SCS/SAP Ver. 3 (24/2/99)
Page 3
LIST OF TABLES
Table 1.1
Ranking Of Importance Of Various Issues By Country
Table 2.1
Loss And Causes Of Mangrove Destruction.
Table 2.2
Ranked Sources Of Pollution Among Participating Countries In The South
China Sea1.
Table 4.1
Valuation Of Ecosystems
Table 4.2
Rates And Amounts Of Habitat Loss Under High And Low Pressure On The
Habitats
Table 4.3
Calculation Of Areas Saved By Action Programme: Low Pressure Scenario
Table 4.4
Calculation Of Values Saved By Action Programme: Low Pressure Scenario
Table 4.5
Net Present Value (NPV) Year 1999-2010
Table 4.6
Calculation Of The Rate Of Loss
Table 4.7
Calculation Of Areas Saved By Action Programme: High Pressure Scenario
Table 4.8
Calculation Of Values Saved By Action Programme: High Pressure Scenario
Table 4. 9
Net Present Value (NPV) Year 1999-2010
Table 4.10
Key Indicators Using The Gordon-Schaefer Model Results In The Philippines
Marine Fisheries 1994
Table 4.11
South China Sea Fishery Yield
Table 4.12 Summary Of Programme Cost
Table 4.13 Cost Of Action: Mangrove
Table 4.14 Cost Of Action: Coral Reefs
Table 4.15 Cost Of Action: Seagrass
Table 4.16 Cost Of Action: Seagrass
Table 4.17 Cost Of Action Exploitation Of Fisheries
Table 4.18
Cost Of Action: Land-Based Pollution
Table 4.19 Cost Of Action: Regional Co-operation
Table 5.1
Organisations Willing To Collaborate In Programme
LIST OF FIGURES
Figure 3.1
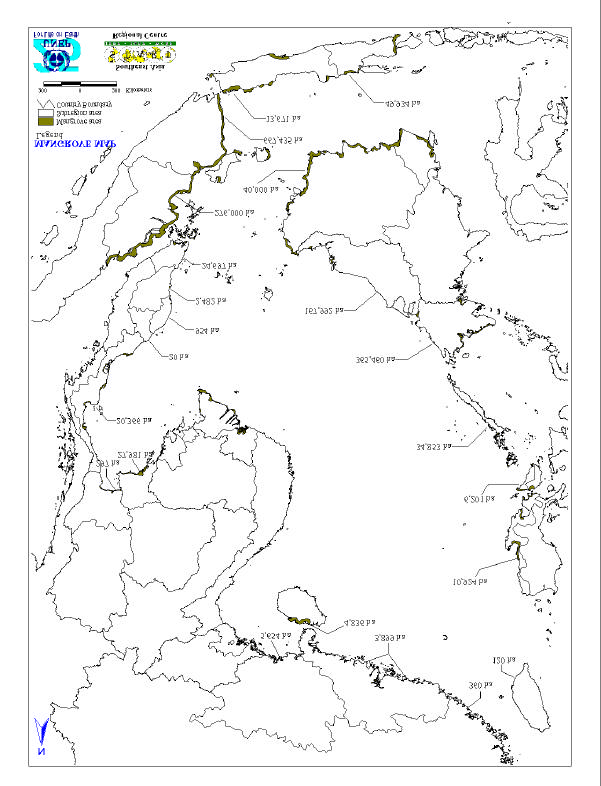
Distribution Of Mangroves In The South China Sea
Figure 3.2
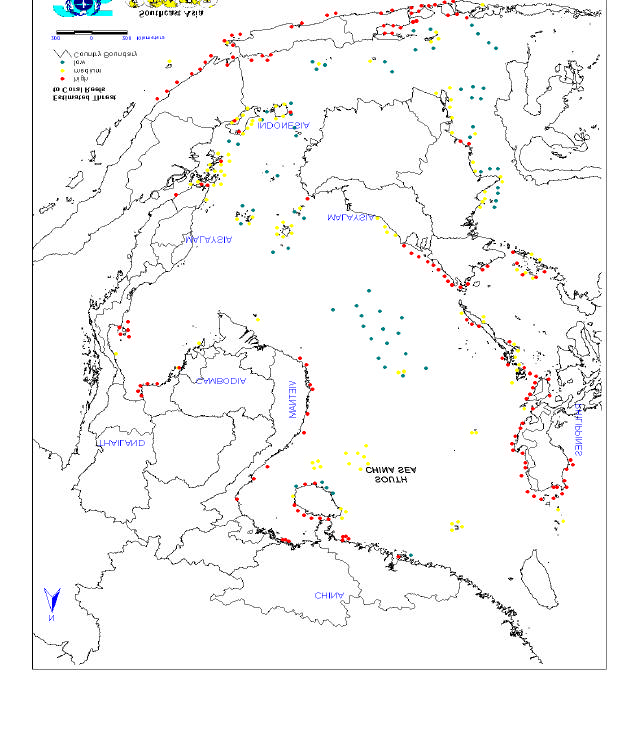
Distribution Of Coral Reefs In The South China Sea
Figure 3.3
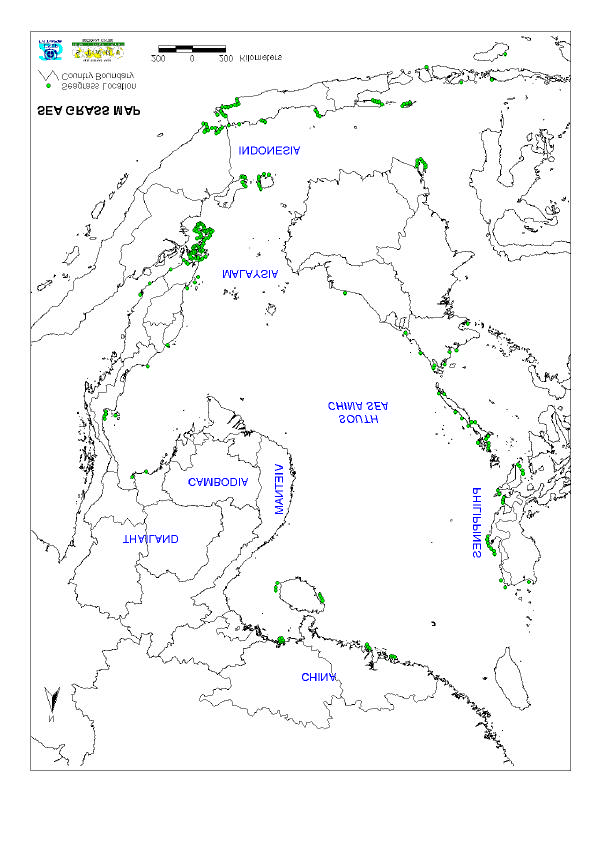
Distribution Of Seagrass In The South China Sea
Figure 3.4
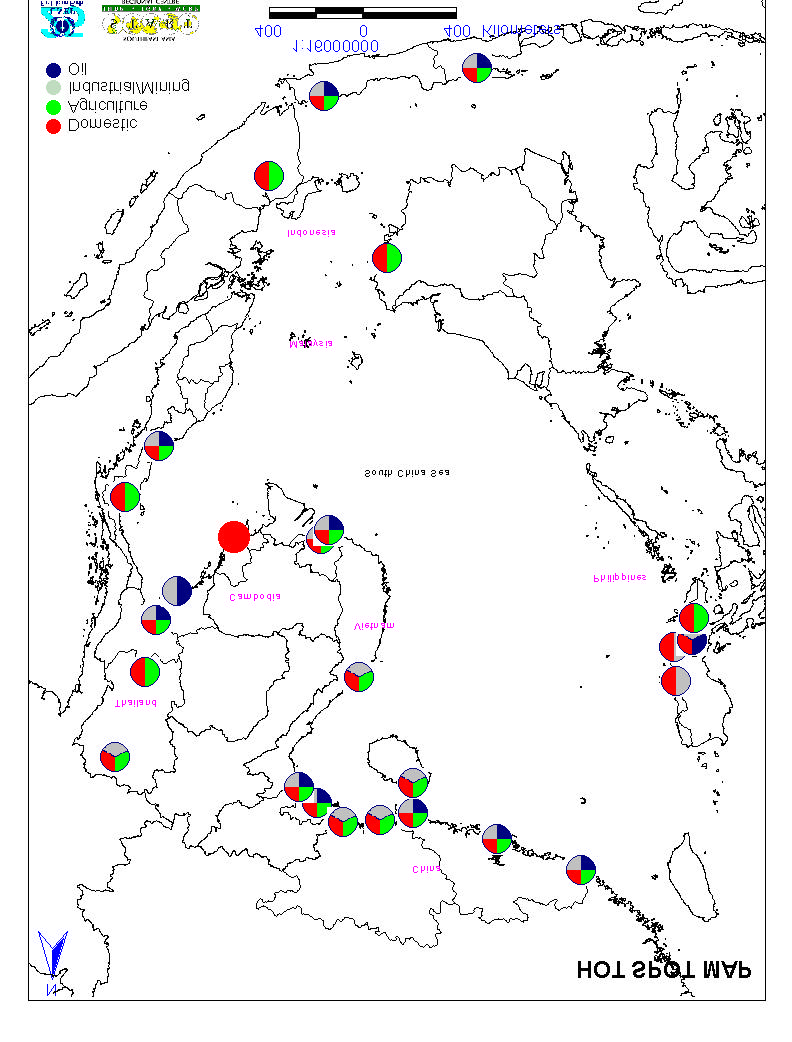
Distribution Of Pollution "Hot Spots" In The South China Sea
Figure 3.5
Biological Oxygen Demand From Domestic Sources In The South China Sea
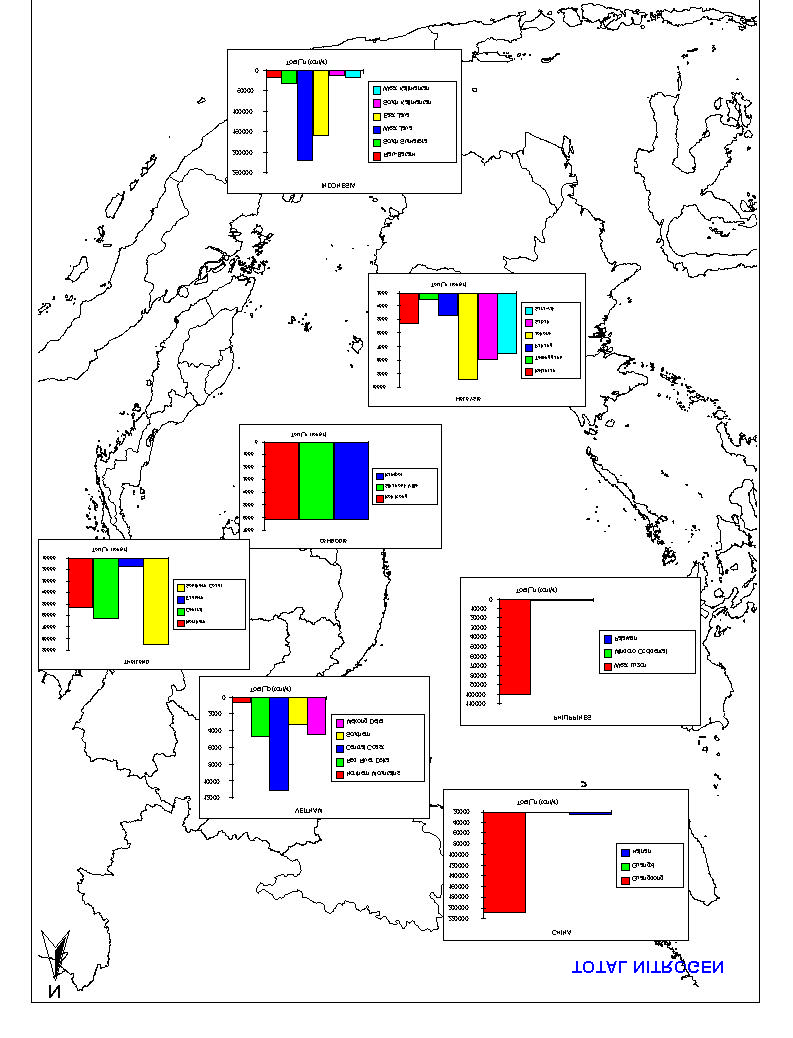
Figure 3.6
Total Nitrogen In The South China Sea
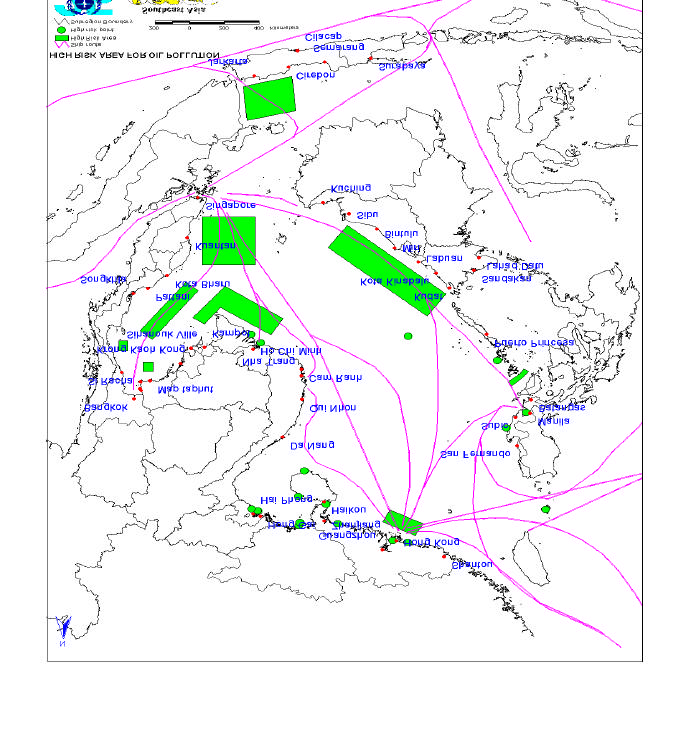
Figure 3.7
High Risk Areas For Oil Pollution In The South China Sea.
UNEP SCS/SAP Ver. 3 (24/2/99)
Page 4
PREFACE
Development of the Strategic Action Programme
The South China Sea is a unique environment with rapid economic development and
rapid population increase in the coastal areas during the part two decades and with rapid
degradation of marine and coastal environments. The South China Sea is shared by many
countries, and the environmental problems they have are common and of a transboundary
nature with similar root causes.
Recognising that actions are urgently needed to halt degradation of the environment
of the South China Sea, the countries of the region sought the assistance of UNEP and the
Global Environment Facility (GEF) in preparing a Transboundary Diagnostic Analysis of the
issues and problems and their societal root causes as the basis for development of this
Strategic Action Programme. The Twelfth intergovernmental meeting of the Coordinating
Body for the Seas of East Asia (COBSEA) in December 1996 endorsed the proposal and the
GEF made available a project preparation and development facility grant (PDF-B) to enable
countries to prepare the necessary analyses and reviews.
In accordance with the GEF Operational Strategy these analyses and reviews
included the preparation of a Transboundary Diagnostic Analysis (TDA) (UNEP SCS/TDA
ver. 3) and Strategic Action Programme (SAP, this document). In preparing the
Transboundary Diagnostic Analysis, national committees were formed in each participating
country. Headed by a coordinator, each committee prepared a comprehensive, country-
based analysis of water-related environmental problems and concerns. An outline for the
content of these reports was agreed at a first meeting of coordinators held in March 1997.
The first drafts of the national reports were submitted and evaluated prior to a second
meeting of national coordinators in June, 1998. During this meeting, and on the basis of the
causal chain analysis done by each country for each identified water-related problem, a
weighting of all identified major issues was prepared by the national coordinators and invited
experts from the region. The identified regional concerns and principal issues became the
focus for the regional TDA, which was discussed and agreed by the national coordinators
and regional resource persons.
This draft Strategic Action Programme is based on the findings of the regional
Transboundary Diagnostic Analysis (TDA) that represents a regional synthesis of issues
identified from the national reports. The TDA identifies the priorities among water-related
problems and concerns, their socio-economic root causes, the sectoral implications of
actions needed to mitigate them and the extent to which the problems are transboundary in
either origin or effect.
The National reports, the draft Transboundary Diagnostic Analysis, and the draft
Strategic Action Programme were all submitted to The Third Meeting of National Co-
ordinators and regional experts for review and endorsement prior to their submission to the
Thirteenth Intergovernmental Meeting of COBSEA (document UNEP/(WATER)/EAS IG9/3).
This meeting endorsed the draft SAP and requested UNEP to formulate a project brief for
submission to the GEF that addresses the priority actions identified in the SAP. A key
element of this project must be actions that will lead to the further elaboration and
development of the present draft Strategic Action Programme. It is the intention of
UNEP SCS/SAP Ver. 3 (24/2/99)
Page 5
participating governments that this process of elaboration be undertaken over the next two
years with a view to governments endorsing a final draft during the next intergovernmental
meeting of COBSEA to be held in December 1999.
The actions proposed in the framework of the draft Strategic Action Programme are
wide ranging in both context and proposed areas for action. Successful implementation of
the Programme will depend upon co-ordination of actions by diverse organisations,
agencies, non-governmental organisations, private sectors, and stakeholder groups at both
the national and regional levels. Recognising the mandate of the United Nations
Environment Programme to co-ordinate environmental actions across the United Nations
System, the widest possible range of appropriate partners at national and regional levels will
be encouraged and assisted to participate in the execution of the Programme. It is the
intention of the participating countries that all actions be undertaken in a spirit of
collaboration and partnership, to enhance synergy between on-going initiatives at national
and regional levels, and eliminate duplicative and conflicting actions.
UNEP SCS/SAP Ver. 3 (24/2/99)
Page 6
1
BACKGROUND & RATIONALE:
1.1
Global and Regional Significance of the South China Sea (SCS) and its
Associated Freshwater Catchments
The South China Sea is a strategic body of water, surrounded by nations that are
currently at the helm of industrialisation and rapid economic growth in the Asia-Pacific
region. Bordered by the People's Republic of China to the north, the Republic of Philippines
to the east; Malaysia, the Republic of Singapore, The Republic of Indonesia and Brunei to
the south; and the Kingdom of Thailand, the Kingdom of Cambodia and the Socialist
Republic of Viet Nam to the west; the South China Sea has always been central to issues of
economic and political stability in Southeast Asia and adjacent regions (Fig. 1.1). Today, it is
central to environmental sustainability and food security for rapidly expanding populations of
these coastal and archipelagic nations.
The coastal subregions of these nations are home to 270 million people or 5% of the
world's population. About 125 major rivers drain 2.5 X 10⁶ km2 of catchment area and
deliver, water, sediments, nutrients and pollutants to the South China Sea.
The South China Sea lies at the centre of the Indo-West Pacific biogeographic
Province the world's most diverse shallow-water marine area. Such richness in flora and
fauna contributes to the area's high natural rates of primary and secondary production.
Capture fisheries from the South China Sea contribute 10% of the world's landed catch at
around. 5 X 10⁶ tons year-1. From the standpoint of aquaculture, five of the eight top shrimp
producers in the world, are countries bordering the South China Sea, namely: Indonesia,
first, Viet Nam, second, China, third, Thailand, sixth, and the Philippines, eighth.
Forty-five mangrove species out of a global total of 51 (Spalding et al. 1997); 50 of 70
coral genera (Tomascik et al. 1997); 20 of 50 seagrasses species (Sudara et al. 1994); and
7 of 9 giant clam species (Tomascik et al. 1997), are found in the nearshore areas of the
South China Sea. Compared to the Atlantic, the tropical Indo-West Pacific is highly diverse.
Only 5 mangrove species and some 35 coral species are found in the Atlantic compared with
51 mangrove and over 450 coral species are recorded from the Philippines compared with
200 species from the Red Sea, 117 from South East India and 57 from the Persian Gulf.
The richness and productivity of the natural environment of the South China Sea are,
however, seriously threatened by high rate of population growth, pollution, excessive
harvesting and habitat modification, resulting in rapid loss of habitat and impairment of the
regenerative capacities of living systems. The socio-economic impacts of environmental
deterioration are significant for the newly developed economies of this region. While the
economy of these countries is becoming increasingly dominated by developments in the
industrial and service sectors, food consumption patterns rely heavily on cheap protein
derived from fishery resources. The agriculture sector (including fisheries) remains not only a
significant source of revenue but also an important basis for food security in the countries of
the region.
An economic crisis in mid 1997 caused development to slow and a reduction in
funding to non-essential services. Under conditions of fiscal restraint environmental
protection tends to receive priority.
UNEP SCS/SAP Ver. 3 (24/2/99)
Page 7
1.2
Basis for Preparation of the Strategic Action Programme
The Transboundary Diagnostic Analysis [UNEP SCS/TDA ver.3] is based on national
reports prepared by Cambodia, China, Indonesia, Malaysia, the Philippines, Thailand and
Viet Nam. The national reports present the key national priorities amongst the many issues
and concerns relating to the aquatic environment of the South China Sea basin. The TDA
provides an assessment of the regional and wider significance of these issues; an analysis
of the socio-economic causes of environmental degradation; an evaluation of the sectoral
implications of actions needed to mitigate them; and an analysis of priorities from the
national and regional perspectives.
The Strategic Action Programme (this document) is based on the preliminary findings
of the regional Transboundary Diagnostic Analysis and in particular upon the priorities
identified by the second meeting of National Co-ordinators and regional experts. This
preliminary ranking is presented in Table 1. 1
This Strategic Action Programme was prepared in collaboration and cooperation with
other regional institutions, organisations and bodies having interests in many issues in the
region, including:
� Food and Agricultural Organisation of the UN;
� South East Asia (START) Regional Centre;
� The South China Sea Informal Working Group at the University of British Columbia;
� IOC Sub-Commission for the Western Pacific (WESTPAC);
� GEF/UNDP/IMO Regional Programme for the Prevention and Management of
Marine Pollution in the East Asian Seas.
UNEP SCS/SAP Ver. 3 (24/2/99)
Page 8
Table 1.1 Ranking Of Importance Of Various Issues By Country
ISSUE
Cambodi
China
Indonesia
Malaysia
Philippines
Thailand
Viet Nam
TOTAL
RANK
a
Litter/Solid waste
3
1
3
1
3
1
12
7
Nitrate - domestic
1
3
2
3
3
3
1
16
3
Nitrate Rural
n.a.
3
1
1
2
2
1
10
9
Phosphate domestic
1
3
1
3
3
3
1
15
4
Phosphate rural
n.a.
3
-
1
2
2
1
9
10
Sediments mining
2
1
2
1
1
3
10
9
Sediments Rural
3
1
3
3
2
1
13
6
Hydrocarbons
n.a.
3
3
21
2
2
2
14
5
Organics domestic
3
2
3
3
3
3
1
18
2
Organics Rural
2
2
1
2
2
2
11
8
POPs
n.a.
1
1
1
1
1
5
12
E. Coli
n.a.
1
3
3
3
3
1
14
5
Heavy metals domestic
n.a.
1
1
1
1
4
13
Heavy Metals Industrial
2
1
3
1
3
1
1
12
7
Harmful Algal Blooms
n.a.
3
1
12
3
8
11
Industrial Chemical
2
1
2
2
3
2
1
13
6
Natural Catastrophes
1
2
2
3
2
10
9
Overfishing
3
1
3
3
3
3
3
19
1
Habitat loss
2
2
3
3
3
3
16
3
A
Overfishing
B
Sewage municipal
C
Habitat loss
D
Hydrocarbons
1 Potential problems in future
E
Industrial chemicals & HM
2 Sabah & Swak only
F
Rural (N, P, sed.org.)
n.a � not available
G
Solid waste/litter
H
Natural catastrophes
H
Mining Sediments
I
Harmful algal blooms
J
POP's
UNEP SCS/SAP Ver. 3 (24/2/99)
Page 9
2
CAUSES OF DEGRADATION AND THREATS TO THE AQUATIC ENVIRONMENT
AND RESOURCES OF THE SOUTH CHINA SEA
2.1
Causes of Environmental Degradation
The root causes of the degradation of marine habitats and environment in the South
China Sea are the increased populations and the demands made upon the marine
environment as the population strives to achieve higher levels and standards of living. These
socio-economic causes are manifested in overexploitation of resources, human and
industrial waste dumping and destruction of habitat during development. These causes have
resulted in large losses of mangrove and seagrass area and destruction of coral reefs.
For instance, as indicated in the TDA, Table 2.1 shows that mangroves in the seven
participating countries constitute 10% of the current global area of slightly over 18 million ha.
The total amount of area lost over different time spans (70 years for the Philippines) is
estimated to be 4.3 million ha or 24% of the current global mangrove area. The causes for
mangrove destruction include conversion to pond culture, tree felling for woodchip and pulp
production, urban development and human settlements, and harvest of products for
domestic use. The impact of each economic activity is difficult to quantify for each country.
Nonetheless, shrimp culture would seem to be the most pervasive economic imperative for
mangrove conversion. However, the rate of destruction wrought by each cause must be
taken into account when known, for a more thorough analysis.
Table 2.1 Loss And Causes Of Mangrove Destruction.
Country
Area
Area now
%
Causes of mangrove destruction
before (ha)
(ha)
Are
a
Shrimp
Wood-
Urban
Domestic
lost
culture
chip and
developme
use
pulp
nt/Human
settlement
s
Cambodia
170,000
85,100
50
�
�
China
42,001
14,749
65
�
�
Indonesia
4,254,312
733,000
83
�
�
�
Malaysia
505,000
446,000
12
�
�
�
Philippines
400,000
160,000
80
�
�
�
Thailand
550,000
247,000
70
�
Vietnam
400,000
252,500
37
�
�
TOTAL
6,321,313
1,938,349
GLOBAL
18,107,700
TOTAL
Sources: Spalding et al., 1997; ISME 1993.
UNEP SCS/SAP Ver. 3 (24/2/99)
Page 10
The immediate causes for degradation in coral reefs in the participating countries and
in Southeast Asia in general are varied, but the major ones are commonly identified in the
national reports. Regional assessments like those of Wilkinson et al (1994) state that
pollution and sediments are major causes in countries of the Sunda shelf, and in the shallow
areas of the Philippines and Indonesia. However, overfishing causes greatest degradation in
the deeper areas of the archipelagoes including those in the oceanic shoals. Bryant et al.
(1998) enumerates overfishing, destructive fishing practices, sedimentation and pollution
associated with coastal development as the major culprits. These causes were weighted in
determining the three risk levels used in their evaluation.
Catchment areas are not managed with an eye to marine environments and the
forest fires, deforestation and inappropriate agricultural practices which occur in the region
considerably degrade the marine environment, particularly by allowing excess runoff of soil
and sediments into the rivers and hence, the sea. Rivers are dammed and their courses
changed which alters the stream flow and the erosion or accretion of sedimentary loads.
It is not clear, for underwater habitats, how much damage has been done as there is
no complete map of underwater habitats. Fisheries catch records and stock assessment are
not available for the South China Sea It is obvious that monitoring of marine resources and
habitats is not adequate. Monitoring should be to determine what the situation is, detect the
damage done and to test whether remedial efforts are successful.
Land based pollution is another priority area identified by the countries involved in
this project. Table 2.2 summarizes the sources of pollution among the participating countries
in the South China Sea, the quality of the database, and the perceived contribution of these
sources to the state of aquatic environments in each country. Wastes from domestic,
agricultural, and industrial sources, along with sediments and solid wastes are the major
sources of pollutants that impinge on both freshwater and coastal systems in the seven
countries. Land-based sources play a major role in both inland and coastal pollution. Ship-
based sources contribute relatively small amounts, but may have severe impacts when large
volumes are released such as during major oil spills. Atmospheric inputs may seem
innocuous at the present time because of a very poor database and because their impacts
are harder to establish given the nature of atmospheric chemistry and the larger scales
needed to carry out appropriate studies of air sheds. It must be pointed out however, that
atmospheric pollutants are most potent in being transported across national boundaries. This
was made evident during the extensive forest fires that occurred in Indonesia that caused
haze to shroud Malaysia and western Philippines. On a global scale, the ashfall debris
injected into the stratosphere by Mt. Pinatubo's eruption caused major weather anomalies
worldwide.
The Transboundary Diagnostic Analysis provides more detailed information on the
root causes and sources of the problems identified.
UNEP SCS/SAP Ver. 3 (24/2/99)
Page 11
Table 2.2 Ranked Sources Of Pollution Among Participating Countries In The South
China Sea1.
Source
Rank &
Contribution to pollution of national aquatic
Data
environments
base
(L=Low, M= Moderate, H= High)
Ca
Ch
Indo
Mal
Phil
Tha
Viet
� Domestic waste
1-Fair
M
H
H
M
H
H
H
� Agricultural waste
2-Poor
M
H
H
M
H
H
H
� Industrial waste
2-Poor
M
H
H
H
H
H
H
� Sediments
3-Poor
M
H
H
M
H
H
H
� Solid waste
4-Fair
H
H
H
M
H
H
H
� Hydrocarbons
5-Poor
L
M
H
M
M
M
M
� Ship-based sources
6-Poor
L
M
M
M
M
M
M
� Atmospheric
7-Poor
L
M
H
M
H
M
M
1Ranking of pollution sources was done during the Second Meeting of National Coordinators
(June 1998).
2.2
Future Threats to the South China Sea
Unless countries realise that there is unsustainable exploitation and irreversible
damage being done to marine ecosystems the current situation of losing habitat will
continue. Inventories of what is there, records of the state of the marine environment
determined by monitoring and a realistic outlook on exploitation of resources will give
countries a guide as to what should be done to relieve the current situation. To this end the
TDA and the SAP are leading documents. The population of most countries of the South
China Sea is growing and in 50-100 years time, however well managed the marine
environment is, it will not be able to support the predicted number of people.
As analysed in the TDA, the future treats for mangrove as an example mainly
include:
(i) Loss of biodiversity. The incomplete inventory of associated flora and fauna in the seven
participating countries nonetheless indicates the high biodiversity associated with mangrove
areas in the South China Sea region. The rich species diversity is reflected in the high
number of mangrove trees, finfish and penaeid shrimps, among others, that are associated
with mangrove swamps. Because of the severe pressure exerted on mangroves, a number
of associated species are among those classified as endangered. These include the
proboscis monkey, Nasalia larvatus, which eat young shoots and growing tips of Sonneratia
and Avicennia trees, the crocodile Crocodilus porosus, swamp birds like Ardea and Egretta,
among others (Low et al., 1994).
(ii) Loss of fisheries productivity. Mangroves act as nursery and feeding grounds for finfish
and shellfish at some stage or throughout their life cycles. Singh et al. (1994) obtained
studies that show high correlation between catch in coastal fisheries and the area of
adjacent mangroves in study sites such as Indonesia, Malaysia, Philippines, Australia and
the US. Although correlation does not imply causation, ecological studies have established
the connectivities among mangroves, coral reefs and seagrass as far as supporting the life
cycles of coastal organisms (Robertson and Duke, 1987; Twiley 1988). Based on the
precautionary principle, it is not necessary to unequivocally prove that mangrove destruction
UNEP SCS/SAP Ver. 3 (24/2/99)
Page 12
will cause a decline in the productivity of dependent biota, and consequently a decrease in
their yields. There is sufficient evidence to believe that it will and does.
3
ESTABLISHMENT OF TARGETS FOR ENVIRONMENTAL QUALITY IN THE
SOUTH CHINA SEA
3.1
General
The national reports and the transboundary diagnostic analysis identified the priority
problems of the South China Sea as being, environmental pollution, over exploitation of
biotic resources, and ecosystem loss. Associated with these issues are the growing
problems of freshwater quality and quantity for human use. For a number of these issues
and problems quantitative indicators of loss or degradation are not available, or the data and
information are not uniform throughout the region, thus, further studies are required in order
to establish definitive targets for protection and management of the environment and its
resources. Nevertheless, recognising the urgency of the issues and problems, the
Governments agreed to establish preliminary targets for the key issues identified for priority
action in the immediate future.
Underlying the process of degradation of the various resources described in the TDA
is the lack of an effective institutional framework at national and regional levels, for collective
management of the environment and resources. This problem is addressed among the
priority actions outlined in this draft Strategic Action Programme.
3.2
Objectives, Rationale and Priorities for the SAP
The ultimate goal of the Strategic Action Programme is to halt or slow the current rate
of environmental degradation and as such it contains priority actions that need to be
undertaken at both national and regional levels. It is designed to assist participating states
in taking actions individually or jointly within their respective policies, priorities and
resources, which will lead to the prevention, reduction, control and/or elimination of the
causes of degradation of the marine and freshwater environment. Achievement of the aims
of the SAP will contribute to the protection of human health; promote the conservation and
sustainable use of marine living resources; and contribute to the maintenance of globally
significant biological diversity.
The general objectives of the SAP are:
� Formulation of principles, approaches, measures, timetables and priorities for
action;
� Preparation of a priority list for intervention and investments;
� Detailed analysis of expected baseline and additional actions needed to resolve
each transboundary priority problem;
� Identification of the elements and preparation of guidelines for the formulation of
national action plans for the protection of the marine environment and rational use of
marine and coastal resources consistent with the regional SAP;
� Foster the involvement of regional and, where appropriate, national Non-
Governmental Organizations and the private sector in the implementation of the
SAP;
UNEP SCS/SAP Ver. 3 (24/2/99)
Page 13
� Foster collaboration and co-operation between all regional entities having interests
in the environment of the South China Sea in an attempt to reduce or eliminate
duplication of effort and waste of scarce human and financial resources.
The countries of the South China Sea region are at different levels of socio-
economic, scientific and technological development. However, the basic infrastructure for the
protection of the environment and for the sustainable use of marine resources exists in all
countries of the region, including competent institutions having authority for protection of the
environment, and adopted legislation and regulations. However, the governments of the
region have recognised that past actions at national and regional levels have not been
adequate to halt the rate of degradation and that a more strategic approach is required.
Consequently, targets have been defined and endorsed by the governments, for each of the
priority areas of concern identified in the TDA, namely:
� Habitat conversion and loss
� Unsustainable exploitation of living aquatic resources
� Land-based pollution
� Freshwater shortage and low water quality
3.3
Targets and Priority Actions
Habitat Conversion and Loss
The loss of important habitats is a priority in the region. This is a concern in the case
of mangroves, coral reefs, seagrass and coastal wetlands. In most countries, laws and
regulations concerning land use planning and coastal development exist and important
areas of habitat have been declared as protected areas. The enforcement of these legal
measures is not effective in the face of continued economic pressures for the conversion of
these areas to alternative uses. The main reasons for continuing habitat loss are the failure
to deal with the socio-economic pressures for development and a failure to integrate
environmental concerns into the development process. The national reports identified the
need to prepare master plans of institutional and legal reform and action to deal with these
problems in an integrated way.
3.3.1 Mangroves
Over the last 70 years the area of mangrove bordering the South China Sea has
decreased from 6,321 km2 to 1,938 km2 a loss of nearly 70% of the original area.
Continuation of losses at the present rate will result in all mangrove being lost by the year
2030. The present distribution of mangrove forests is illustrated in Figure 3.1. Ecologically,
mangroves provide valuable habitat for juvenile fish and crustacea of commercial and
recreational value, protect the shore from erosion, and provide timber and other products for
human use. The value of the products and ecological services provided by the mangrove
systems of the South China Sea is estimated at about US$ 15,984 million per year ( based
on total area of 1.6 million ha as indicated in TDA, and a value of US$ 9990 ha-1 year-1).
The main causes of mangrove loss result from conversion of the land to other uses,
such as shrimp farms, urban development and logging for timber and woodchips.
As the global centre of mangrove biodiversity such losses in this region have both
global and wider regional significance. Loss of biodiversity and fisheries productivity are
major transboundary issues at a regional scale but trading in mangrove wood products i.e.
UNEP SCS/SAP Ver. 3 (24/2/99)
Page 14
pulp, charcoal, woodchips and building materials, are also transboundary being driven by
international trade in such products. The countries of the region dominate the mariculture
production of shrimp which results from high prices
on the world market that encourage low capital, extensive farming systems dependent on
tidal regimes for water and natural food inputs, in cleared mangrove areas.
UNEP SCS/SAP Ver. 3 (24/2/99)
Page 15
Figure 3.1 Distribution of Mangroves in the South China Sea
UNEP SCS/SAP Ver. 3 (24/2/99)
Page 16
Proposed Targets
By 2010, to maintain the area of mangroves in the region at no less than 90% of the present
(1998) area.
Proposed Activities at the Regional level
� Develop criteria for selection of mangrove areas for protection/sustainable management,
particularly those of transboundary importance;
� Identify and prioritise specific areas for future management and protection and develop
regional and national action plans to maintain regionally important mangroves areas;
� Develop and establish management regimes for the identified areas;
� Establish a regional mangroves database;
� Build the capacity of the governments of the region to understand the issues concerning
mangroves and to raise public awareness concerning the national and regional
importance of such ecosystems.
Proposed Activities at the national level
� Carry out and/or update inventories of mangrove areas and classify them according to
potential ecological functions, using a GIS database;
� Prepare national legislation and action plans for mangrove management;
� Implement and coordinate mangrove restoration projects wherever relevant;
� Study and assess the techniques and methods of mangrove restoration currently in use
in the Region with a view to improve restoration projects;
� Build the national capacity to understand the issues concerning mangroves and raise
public awareness.
3.3.2 Coral reefs
Coral reefs are habitats for marine life, for sequestration of carbon, and provide
economic return for fisheries and tourism. Coral reefs are one of the most diverse habitats
on earth. They also act as a barrier to swell waves and storm surges thus preventing erosion
of other inshore ecosystems and the coast.
Twenty seven percent of the world's mapped coral reefs are in South East Asia (Fig.
3.2) and 84% of these fringe Indonesia and the Philippines. All countries in the South China
Sea have degraded reefs, from 95% in Hainan to an unknown amount in Viet Nam. They all
identified overexploitation as an immediate cause of degradation, five cited destructive
fishing and sedimentation, and coastal development was also a cause of damage.
A more insidious cause of destruction is high nutrient and/or suspended solids in the
water either favoring seaweed to overgrow the coral or smothering the zooxanthellae (the
synergistic plants that grow in coral polyps). There is also coral bleaching occurring in the
region which may be caused by slightly higher water temperatures. The status of coral
bleaching is currently being examined.
Loss of coral reefs has long-term implications because of the time that they take to
recover. Protection of coral reefs is best carried out by means of declaring protected areas,
such as marine parks. A lack of data on the location and status of existing reefs hampers
efforts in controlling and preventing further damage.
UNEP SCS/SAP Ver. 3 (24/2/99)
Page 17
The value of the products and ecological services provided by the coral reef systems
of the South China Sea is estimated at US$ 13,792 million per year (considering one third of
coral areas of the South East Asia are located in the South China Sea, and have value of
US$ 6076 ha-1 year-1)
The transboundary issues associated with coral reef degradation are: loss of
biodiversity, reduction in reef fisheries, coastal tourism, threatened or endangered species,
and trade in coral, shells and associated biota. There is biodiversity connectivity when
ocean currents move planktonic larvae to recruit fringing reefs and oceanic shoals,
suggesting the strategic establishment of marine protected areas between interconnected
reef systems.
Proposed Targets
� By 2010, to maintain the area of coral reef with more than 50% live cover at the present
(1998) level.
Proposed Activities at the Regional level
� Develop criteria for selection of coral reef areas for protection/sustainable management,
particularly those of transboundary importance;
� Identify and prioritise specific areas for future management and protection and develop
regional and national action plans to maintain regionally important coral reef areas;
� Establish demonstration sites for implementing management models, based on the
agreed model of management for the rest of the Region to study;
� Develop and agree on scientific and technical guidelines on the economic evaluation of
coral reefs as resources;
� Develop, agree on and implement guidelines on the preparation of national legislation
and action plans for preservation of coral reefs;
� Coordinate with other organizations standardising and regionalising coral monitoring,
mapping and status and ensuring these are updated on a regional database;
� Build the capacity of the governments of the region to understand the issues concerning
coral reefs and to raise public awareness concerning the national and regional
importance of such ecosystems.
Proposed Activities at the national level
� Map and describe the status of coral reefs using, where appropriate the organizations
currently performing these tasks;
� Establish coral reef protection areas and to implement proper management of coral reef
resources;
� Prepare and implement national legislation and action plans for preservation of coral
reefs, such as legislating marine parks in the region;
� Actively participate in activities organized by the relevant coral reef monitoring networks
and provide information for the use of interested parties;
� Build the capacity of each nation in understanding coral reef based issues.
3.3.3 Seagrass
Seagrasses form the basis of many complex marine ecosystems and provide a
valuable nursery for commercially important fish and crustaceans such as crabs and
shrimps. When the seagrasses decline the links in the productivity chain are broken and the
UNEP SCS/SAP Ver. 3 (24/2/99)
Page 18
whole ecosystem collapses. Seagrasses also play an important role in the cycling of marine
nutrients. Dugong and green sea turtles graze on seagrass leaves and rhizomes but other
fish do not generally eat seagrasses.
Seagrasses have rhizomes that hold the sediments and form a mat over the bottom
preventing erosion along the coastal fringes where they grow. The leaves slow the water
movement over them thus causing particulate matter in the water to fall out into the seagrass
meadow. Some of this particulate matter is organic and provides food for animals dwelling in
the meadows.
Under natural conditions seaweeds (epiphytes) grow on seagrass leaves and stems,
but when excessive amounts of nutrients are introduced to the coastal waters this seaweed
can bloom (grow unnaturally rapidly). Under bloom conditions the seaweed can smother the
seagrass host by blocking out the light the plants need to survive. Without photosynthesis
the plant quickly uses up its stored food and dies. Light is also reduced by excessive
suspended solids in the water coming from runoff from the land due to deforestation, forest
fires, poor agricultural practices and inappropriate engineering works. Seagrass meadows
are also damaged in the region by inappropriate fishing methods such as push nets and
trawling which mechanically uproots the seagrass.
Seagrass meadows growing in shallow waters close to the shore renders them very
susceptible to unplanned and unmanaged urban and industrial development and tourism.
These problems are compounded by a lack of environmental assessment procedures for
developments, awareness about the importance of seagrasses, and information on their
distribution.
Seagrasses are the least studied marine habitats compared to coral reefs and
mangroves. An assessment of the extent of habitat modification in the South China Sea is
based on a few studied areas in some countries. Anywhere between 20 and 50% of
seagrass areas in Indonesia, Malaysia, Philippines and Thailand are damaged. Main
seagrass meadows in the region are shown in Fig. 3.3.
As with the other marine ecosystems the main transboundary issues are losses of
biodiversity and fisheries productivity. The seagrass nursery areas provide commercial fish
for fishing grounds a long way from the habitat of the juveniles. There is also a trade in
seahorses and green turtles that live in seagrass meadows.
The best ways to preserve seagrass is by leaving it undisturbed, mainly by
preventing trawling, maintaining water quality by reducing nutrient and suspended solids
loads and by using appropriate fishing gear.
The value of the products and ecological services provided by the seagrass systems
of the South China Sea is estimated at US$ 22,400 ha-1 year-1. (The area of seagrass is not
known. To determine this area is one of the aims of the project).
Proposed Targets
� By the year 2010, to maintain at least 80% of the present area of seagrass in good
condition.
Proposed Activities at the Regional level
UNEP SCS/SAP Ver. 3 (24/2/99)
Page 19
� Develop criteria for selection of seagrass areas for protection/sustainable management,
particularly those of transboundary importance;
� Identify and prioritise specific areas for future management and protection and develop
regional and national action plans to maintain regionally important seagrass areas;
� Develop and establish management regimes for the identified areas;
� Establish an accessible database containing maps and status of environmental health of
sea grass beds in the South China Sea;
� Conduct training workshops on seagrass management;
� Build the capacity of the governments of the region to understand the issues concerning
seagrass and to raise public awareness concerning the national and regional importance
of such ecosystems.
Proposed Activities at the national level
� Provide and implement national legislation and action plans for the preservation of
seagrass areas;
� Establish seagrass protection areas and implement proper management;
� Encourage monitoring, mapping and research on seagrass for a better understanding of
the economic and ecological implications of conserving seagrass beds;
� Conduct economic valuation of seagrass areas as a resource;
� Conduct training on seagrass management.
UNEP SCS/SAP Ver. 3 (24/2/99)
Page 20
Figure 3.3
Distribution of Seagrass in the South China Sea
UNEP SCS/SAP Ver. 3 (24/2/99)
Page 21
3.3.4 Estuaries and Wetlands
Wetlands are defined by IUCN in the "Ramsar Convention on Wetlands of
International Importance" as "areas of marsh, fen, peat, land or water whether natural or
artificial, permanent or temporary, in which water is static or flowing, fresh, brackish or salt
including areas of marine water the depth of which at low tide does not exceed six metres."
There is no simple definition of the wetlands that do not include mangrove forests, seagrass
meadows and coral reefs to six m deep. In this report we will refer to wetlands as peat
swamps, swamps, fens and saltmarshes.
Wetlands are the seasonal home to many migratory birds, they have their own suite
of animals and plants of great diversity and are the nursery area of some commercial fish
and crabs. They function as nutrient traps and some wetlands are used for aquaculture
Wetlands are under threat from urban expansion (land reclamation), pollution from
urban sources, and changes to coastal morphology from up stream development (dam
building causing downstream erosion through lack of replacement sediment). Their small
size makes them especially vulnerable to pollution. Those that are easily accessible or have
a high concentration of birds and mammals, tend to attract large numbers of visitors, whose
wastes are deleterious to the wetlands. Straightening the meanders of wetland streams and
rivers changes the hydrology and/or salinity regime that is deleterious to wetlands.
Introduced plants may dominate some wetlands and the classic example of this in many
parts of the world is water hyacinth.
The value of the products and ecological services provided by the wetlands systems
of the South China Sea is estimated at US$ 190,726 million per year (from Table W1 of the
TDA, the total area of wetlands is about 12.9 million ha, and US$ 14,785 ha-1 year-1 is its
estimated ecological and economic value)
Proposed Targets
� By the year 2005, to have management plans for all wetlands, excluding mangroves, in
the Region, with emphasis on those in the coastal zone.
Proposed Activities at the Regional level
� Develop criteria for selection of wetland areas for protection/sustainable management,
particularly those of transboundary importance;
� Identify and prioritise specific areas for future management and protection and develop
and implement regional and national action plans to maintain regionally important
wetland areas;
� Develop, establish and implement management regimes for the identified areas;
� Develop and agree on scientific and technical guidelines on the economic valuation of
wetlands as resources;
� Establish a GIS-type database providing the necessary information on wetlands in the
Region;
� Build the capacity of the governments of the region to understand the issues concerning
mangroves and to raise public awareness concerning the national and regional
importance of such ecosystems.
Proposed Activities at the national level
UNEP SCS/SAP Ver. 3 (24/2/99)
Page 22
� Develop and implement guidelines, standards and measures to control development
impinging on wetland areas;
� Establish and implement management plans for wetland "hot spots" to conserve their
ecological and economic functions, including encouraging nations to ratify the
International Convention on Wetlands (Ramsar);
� Enhance public awareness of wetlands and assist with capacity building.
3.4
Over exploitation of fisheries
The problem of unsustainable exploitation of living aquatic resources is found in all
the national reports. Almost all countries bordering the South China Sea suffer from an
ineffective fisheries management system, allowing the non-sustainable use of living marine
resources.
The deteriorating resource base, as described in 1.1 and 2.1, is compounded by
socio-economic problems. Typically, many small-scale fishermen compete for resources with
a few large-scale more capitalised entrepreneurs. Current management policies may
exacerbate the problems by providing incentives for over-exploitation, e.g. subsidies for
capital investment or fuel, and provision of infrastructure and industrial incentives.
Different levels of development in the countries of the South China Sea lead to
uneven resource capabilities. Some countries have large fleets of large vessels that have
depleted local resources and are now encroaching on others which have not had the means
to fully exploit their resources. This transboundary movement of fishing fleets results in
conflicts among countries where territorial water limits are violated.
Where the level of exploitation is now excessive, guidelines to reduce that level to a
more sustainable one should be prepared. This sustainable level of fishing can be at many
optimal levels, from open access, where a limit on the amount of fish caught is laid down but
not on the effort required to catch them, to maximum economic yield, where the catch is
limited by the economic return. The maximum ecological yield lies somewhere between.
The prevailing situation is one of open access, where the level of exploitation is in
access of the ecological and the economical optimal levels. The choice is thus between
whether to continue with open access or to reduce the level of exploitation to either
ecological or economic optimum. Economic theory does not provide a clear-cut answer;
rather, the choice is between social preference, and the likely response of the ecosystem
productivity.
From the perspective of welfare, the main concern is with the maximisation of valued-
added product, and the aim of the intervention should be to achieve the level of long-term
exploitation that is maximising welfare with maximum economic yield. The target should take
into account costs of effort and the productive potential of the ecosystem.
The target for the issue of excessive exploitation should be to reduce the level of
effort to the level that is economically welfare-maximizing and still preserve the resource
base. The decisions on the form and amount of intervention should establish the actual
target levels of exploitation for these resources, and the economic cost to capture them. It
should concentrate on the targeted living aquatic resources of each country, and consider
the social implications. The question of large versus small-scale fishermen has to be
thoroughly recognised and dealt with in these studies realising that the removal of fishing
UNEP SCS/SAP Ver. 3 (24/2/99)
Page 23
boats and employment will cause hardship and short-term problems. These issues must be
included in the action programme.
Proposed targets
� By 2005 to determine regional catch levels of key economic/commercially important
species according to levels that are economically welfare maximising, while still
preserving the resource base;
� By the year 2005, to have established a regional system of marine protected areas
for fishery stock conservation and care for endangered species;
� By the year 2005 to have prepared and implemented at chosen sites, a management
system that will sustain the exploited resources.
�
Proposed activities at the Regional level
� Develop criteria for selection of marine habitats and areas critical to the maintenance
of regionally important fish stocks, particularly those of transboundary importance;
� Identify and prioritise specific areas for future management and protection and
develop regional and national action plans to develop a regional system of refugia for
maintenance of regionally important fish stock;
� Develop and establish management regimes for the identified areas;
� Review destructive fishing activities with the aim of removing and replacing them;
� Review fisheries management systems;
� Review compliance to international fisheries conventions.
Proposed activities at the national level
� Establish marine protected areas in areas identified as critical habitats for fish stock
conservation and protection of endangered species;
� Implement programmes to provide information on fish stock conservation and
sustainable fishery practices among small and artisanal fishing communities;
� Conduct resource assessment of fishery resources to determine the level of optimal
catch and effort for different fishing grounds in the Region;
� Develop educational and public awareness materials on sustainable fishery practices
for dissemination in countries;
� Establish in selected pilot sites a good management system which can be tested to
determine if it is leading to sustainable exploitation of resources;
� Promote the Code of Conduct for Responsible Fisheries through workshops,
awareness building, translate into local languages and educate people about the
Code.
UNEP SCS/SAP Ver. 3 (24/2/99)
Page 24
There should be close co-ordination and co-operation with the Regional Office of
Food and Agriculture Organization (FAO) for the implementation of the actions identified.
3.5
Land-based Pollution
Most of the polluting elements that occur in the sea come from the land, waste from
large cities includes sewage, industrial waste and hydrocarbons, while agricultural runoff has
nutrients, pesticides and sediment that may pollute the marine environment. The "hotspots"
or areas of most concern are shown in Fig 3.4.
3.5.1 Urban/Municipal Waste
Urban waste consists of solid waste, such as plastic, glass, cans etc.; and sewage
consisting of organics which increase BOD, nutrients and bacterial coliforms that can
damage human health. Solid waste is unpleasant to the eye, can choke marine life and may
calm water to such an extent that alga blooms are allowed to concentrate in the mass of
floating debris. High BOD loading reduces dissolved oxygen available to fish and other
marine life. Usually the pelagic fish swim away from these areas but demersal fish, worms,
crustaceans and sessile animals are killed. Lowered oxygen in the water also kills plants
such as seaweed and seagrasses. The populations of the seven countries of the South
China Sea generate about six million tons per year of organic matter. Only 11% of this is
removed from four countries with treatment plants. The main producers of BOD are shown in
Fig 3.5.
Nutrients from treated or untreated sewage enhance the growth of phytoplankton that
may concentrate to such an extent that they form algal blooms. Sometimes these algal
blooms are toxic and fish kills and worse, human poisoning, may occur. Excess nutrients in
the water column may also be harmful to seagrass meadows. Epiphytes on the seagrass
leaves adsorb the nutrients, grow quickly and shade the seagrass so that it can no longer
photosynthesise enough food to sustain it. Storage material is used up and the seagrass
dies. With the death of the seagrass the organic matter, made up of epiphytes, seagrass
detritus and associated flora and fauna, fall to the bottom, use up oxygen as they decay and
the BOD rises, eventually leading to anaerobic conditions and virtual desertification of the
seafloor. This excess of nutrients is called eutrophication.
Usually, in the sea, nitrogen is the limiting nutrient to plant growth so it is usually
monitored in preference to phosphorus if monitoring facilities are limited. Total nitrogen
includes organic nitrogen as well as the inorganic form taken up readily by plants. Total
nitrogen from different sub-regions or districts of the South China Sea is shown in Fig. 3.6.
Untreated sewage contains much organic matter that has a deleterious effect on demersal
communities. The organics from sewage are most easily removed in the treatment plant and
can be used for mulch and organic fertilizer. High coliform counts in rivers, estuaries and
coastal waters cause health problems to users of the water bodies. E. coli is killed by
sunlight and settling ponds usually reduce coliform counts. Another sources of bacteria in
coastal waters is urban runoff from roads, gardens and footpaths where domestic animals'
faeces are washed into the drains, rivers and out to sea.
UNEP SCS/SAP Ver. 3 (24/2/99)
Page 25
Figure 3.5
Biological Oxygen Demand from Domestic Sources in the South China Sea
UNEP SCS/SAP Ver. 3 (24/2/99)
Page 26
Cities in the coastal areas of the South China Sea are large and growing, e.g. Guang
Zhou, Hong Kong, in China, Ho Chi Minh City in Viet Nam, Bangkok in Thailand, Manila in
Philippines, Jakarta in Indonesia and Singapore. Few have sewage treatment facilities, so
that waste is released directly into the rivers and seas. This inappropriate management
results in severe pollution through high BOD loadings, eutrophication, fish kills, red tides,
damage or loss of seagrass habitat and public health hazards.
Some of these problems can be addressed by installing waste treatment facilities.
However, this approach has been hampered by lack of finance and cost recovery of
facilities. Information on the damage caused by sewage pollutants and the economic loss
due to pollution should be provided to the governments and public. There are alternatives to
coastal dumping, such as using the two scarce commodities, freshwater and fertilizer, in
forestry, crop growing or playing field management.
3.5.2 Industrial Waste
Urban centres are also the location for major industrial agglomerations, e.g.
Bangkok, Maptaphut, Guang Zhou, Haiphong, with significant discharge of industrial wastes
to the marine and coastal environments, which can be highly toxic and damaging to marine
life. Causes of industrial pollution are lack of or poor enforcement of industrial pollution laws
and regulations, poor facilities and the desire of factories to promote competitiveness in the
international market by ignoring environmental and social costs. These problems can be
reduced by incentives and regulations to recycle wastes.
One of the environmental services provided by the oceans is its capacity to
assimilate or absorb wastes. However this capacity is being exceeded in many coastal
areas in the South China Sea region. The pollutants from industrial waste range from
nutrients to specific persistent organic pollutants that will, in most cases, be toxic.
3.5.3 Agricultural Waste
The reliance of countries of the South China Sea on agriculture for food and exports
means that much of the land surface is used for growing crops or rearing animals.
Successful farming relies on adequate applications of fertiliser to enhance plant growth and
the use of herbicides and insecticides to reduce pests that lower crop or animal yields.
Far too often fertiliser is over applied and applied at the wrong time thus making it
available to be washed away. Apart from the economic waste of losing fertiliser to runoff
after rain, there is a major problem of high nutrient levels in the marine environment once the
runoff enters rivers and hence the sea. Animal waste from piggeries and poultry farming and
the effluent from aquaculture also contain nutrients which can damage marine ecosystems.
Very often these wastes are allowed to run into waterways in times of flood or rainfall.
Shrimp and fish farms are major sources of nutrients to the marine environment as they are
usually close to the sea and excess feed and faeces are not treated in settling ponds. These
non-point sources of nutrients enter the sea and may cause transboundary problems if they
are not immediately absorbed by plants (phytoplankton, seagrasses, seaweed or
mangroves).
Economic loss due to poor water quality, loss of nursery habitat for commercial
species and disease in fish and shrimp ponds, means that attempts should be made to
reduce loss of nutrients to the marine environment.
UNEP SCS/SAP Ver. 3 (24/2/99)
Page 27
As insects and weeds become more immune to chemicals, larger applications are
made. Cost benefit analysis often suggests that applying the extra pesticide to kill the last 5-
10% of a pest is not economic and the extra pesticide is often wasted by also entering
waterways. These pesticides have varying effects on the marine environment. Some may be
persistent and accumulate in animal or plant tissue, others may accumulate in the sediment
and be released during storms. The damage they do is also variable and ranges from
causing impotence in gastropods to moving up the food-chain to human food.
3.5.4 Hydrocarbons
Oil-spills from wrecked ships are not the major cause of oil pollution in the sea. The
UNEP The State of the World Environment 1987 states that half a million tonnes of the 1.6
million tonnes annually discharged into the sea by shipping is released accidentally: The
remainder results from regular discharge by ships of contaminated ballast water and water
used for flushing out tanks. Later figures estimated total marine pollution at 3.5 million
tonnes, with 48% coming from land (World Resources, 1987). Municipal and industrial
wastes represent the single largest source.
Marine sources of hydrocarbon pollution in coastal and marine waters are ships and
oil and gas exploration and production platforms. The high risk areas for oil pollution from
marine sources are shown in Fig. 3.7. The amount of ship traffic - commercial, fishing,
leisure and bulk oil carriers, is likely to increase in the region and with it the risk of pollution
from ship-based oil. Hydrocarbon pollution may be limited in extent but have severe
consequences for the marine environment because some of the substances are not easily
biodegradable and highly toxic. Methods exist to contain the effects of major oil spills and
there are standards established for oil and gas exploration and production activities to
reduce pollution. These need to be followed and monitored. Yet, in spite of precautions,
accidents will occur, and countries need to be prepared to deal with these emergencies in
order to contain the damage.
The main difficulty of preventing marine-based sources from polluting the sea,
however, is in dealing with dispersed sources of pollution from small boats because they are
small scale and widespread, but the effect can be cumulative. The best way to deal with this
is to encourage people to adopt good practices in dealing with oil based substances through
education and provision of adequate facilities to dispose of waste oils etc. at landing sites.
Land-based activities like oil refining, oil-well blow-outs and leakages, and fallout
from the atmosphere are sources of hydrocarbons in the sea, but most comes via run-off
from rivers and city drains. More oil enters the coastal areas from car exhausts and oil-
changes in city garages that are then dumped down the drain, than from any other source
(Elsworth, S. A Dictionary of the Environment, 1990.).
Because of its persistence, oil in the marine environment is a transboundary issue.
Oil is driven by both currents and wind action across the sea surface. For large oil-spills from
wrecked tankers or blowouts from sea-based oil exploration platforms the responsible
companies usually have oil-spill contingency plans. Often the companies have not co-
ordinated these operations among themselves. For a large spill there is not
UNEP SCS/SAP Ver. 3 (24/2/99)
Page 28
enough equipment to contain the oil and not enough is known of the whereabouts of
vulnerable areas to make decisions on where to place limited clean-up equipment. A
mapping program to map vulnerable underwater habitats would be useful if seagrass
meadows and coral reefs are to be saved. Co-ordination between companies and countries
within the Region may help save some of the more valuable ecosystems if a large spill
occurred.
3.5.5 Suspended Solid/Sedimentation
Inappropriate agricultural practices and deforestation may leave bare soil available to
erosion by wind and rain. Land clearing of forests for agricultural crops is a major supply of
suspended solids and silt in rivers and coastal areas. The recent floods in China, although
the largest on record did not result from the largest rainfall on record, rather, the amount of
deforestation caused vast areas of loose sediment to be removed which silted up rivers and
hence river water broke over the rivers' banks and flooded the land.
Inappropriate engineering practices also lead to large volumes of sediment being
washed into rivers and the sea. The slope of unprotected earth walls in shrimp farms,
causeways, bridge approaches and roadsides are potential sites for erosion. With long-term
planning it should be obvious to engineers that repairs will be needed after a few years of
erosion. Artificial coverings such as Geotextile can be used, or slopes and banks can be
revegetated using seed of a fast growing annual which will stabilise the bare soil long
enough for more robust perennials to take over.
Eroded soil is washed into waterways and this suspended solid material reduces
water quality. Reduced water quality in this case means less light to benthic plants and may
result in a loss of benthic vegetation. Many of the rivers of the South China Sea are heavily
laden with suspended solids and some of these rivers have picked up these solids in
countries other than that in which the river enters the sea, thus a transboundary problem
occurs. Rivers that discharge large volumes of water often have plumes of suspended solids
which cross ocean boundaries and are therefore transboundary on their effect on the marine
environment.
There is an amount of suspended solids which has always washed out to sea caused
by floods and natural erosion, in recent years this natural loss of soil and sediment has
increased due to human activities. It is necessary to determine what is an acceptable flow of
suspended solids and what is caused by inappropriate human activities. Some of these
activities may be irreversible and this should be identified before attempts are made to
change the situation.
River-borne sediments are a major contribution to the water bodies in the South
China Sea region. Sediments perform useful functions by replenishing the coastline,
maintaining the land area for human habitation and supplying nutrients to the water bodies.
However, human actions in the upstream regions significantly affect the process of river
sedimentation. Dam construction can trap the flow of sediments and reduce the supply to
replace the beach material eroded by tidal action, resulting in eroding shorelines and threat
to coastal structures.
Proposed Targets
UNEP SCS/SAP Ver. 3 (24/2/99)
Page 29
� By 2003 develop and agree on regional water quality objectives; make recommendations
for water quality standards for use in coastal waters; make recommendations for effluent
standards/or mitigation measures for municipal, industrial and agricultural (including
aquaculture) activities;
� By 2003 develop guidelines for monitoring coastal waters, taking into account already
published guidelines;
� By 2003 determine principal pollutants in the region, estimate the carrying/assimilative
capacity of relevant ecosystems for relevant pollutants - BOD, nutrients, metals,
sediments etc.
� Establish a regional contingency plan for South China Sea to handle incidents of oil and
chemical or hazardous waste spillage;
� By 2004 develop a regional South China Sea Plan of Action for land-based activities to
meet regional water quality objectives;
� By 2005 identify 10 Priority Discharge Sites for action and develop appropriate mitigation
activities;
� By 2005 develop regional funding mechanisms for mitigation activities;
� By 2006 initiate mitigation activities on the Priority Discharge Sites;
� By 2008 review recommended water quality standards in national legislation.
Proposed Activities:
Determine regional water quality objectives and water quality and effluent standards:
� First meeting to review and assess existing knowledge of regional water quality,
determine information gaps, set a programme for carrying/assimilation capacity
evaluation, discuss GPA-land-based activities guidelines/action programmes (2002);
� Second meeting to agree on water quality objectives, determine a regional South China
Sea Plan of Action (based on GPA-land-based activities);
� Third meeting to agree on regional water quality and effluent standards;
� National meetings for endorsement of South China Sea Plan of Action (2005);
� International organisations, such as UNEP EAS/RCU, will initiate the production of
package programmes to help member countries facing problems associated with land-
based activities that pollute the South China Sea.
Determination of Regional Priority Hot Spots (2005)
� Discuss and agree on criteria for evaluating the regional importance of nationally
identified pollution "hot spots" (severity of pollution, feasibility/ease of mitigation,
transboundary effects);
� Assess and evaluate data relating to national "hot spots" and prepare and agree on
regional priorities;
� Conduct a preliminary evaluation of the costs and benefits of alternative mitigation
measures for selected "hot spots";
� Develop and agree on a South China Sea strategic approach to mitigating regional "hot
spots", including priority investment portfolio, cofinancing arrangements, national and
regional actions.
� Carry out capacity building activities that lead to improvement in water quality testing and
hence cleaner water. Determine the carrying capacity of ecosystems for specific
pollutants, realising that the carrying capacity of a human-made toxic chemical is zero.
UNEP SCS/SAP Ver. 3 (24/2/99)
Page 30
Analyse secondary data and, where appropriate, carry out some primary studies to
improve water quality testing and hence water quality. (2003)
3.5.6 Regional Cooperation
To achieve collaboration and co-operation among countries it is usual to have legal
frameworks that cover the areas of interest between the interested parties. However, there is
no legal framework that directly relates to forming a marine environment protection co-
ordinating body and few that relate to the marine pollution problems prioritised by the
member countries of the South China Sea. The development of a legal framework between
member countries requires negotiation and compromise at the highest level. The objectives
of a legal framework (or protocol) are to protect and manage the marine environment and
coastal areas of the South China Sea region, including actions on:
(a)
Taking all necessary measures to prevent, reduce and control pollution of the South
China Sea area, particularly dumping, land-based sources, activities causing habitat
loss and airborne pollution;
(b)
Protecting and preserving rare or fragile ecosystems as well as the habitat of
depleted, threatened or endangered species and other marine life in specially
protected areas;
(c)
Co-operating in dealing with pollution emergencies in the South China Sea area;
(d)
Co-operating in assessing environmental impacts in the South China Sea area and in
exchanging data and other scientific and technical information;
(e)
Establishing rules and procedures for the determination of liability and compensation
for damage resulting from pollution in the South China Sea area.
There are some global and regional conventions/protocols that cover these issues
but none that directly apply to pollution from land-based sources in the South China Sea or
the East Asian Seas. Table 3.1 Global and Regional Conventions/protocols on the
Protection of Marine Environment
Proposed Targets
� Further develop the SAP by holding national expert and intergovernmental consultation
by the year 2001;
� By 2002, convince a high level meeting of government officials and experts to formulate
a legal framework for regional co-operation for the protection and sustainable
management of the marine and coastal environment of the South China Sea;
� By 2005, complete a draft agreement on the legal framework for regional co-operation for
the protection and sustainable management of the marine and coastal environment of the
South China Sea.
Proposed Activities at Regional Level
� Initiate negotiations on the establishment of a legal framework for regional co-operation
for the protection and sustainable management of the marine and coastal environment of
the South China Sea;
UNEP SCS/SAP Ver. 3 (24/2/99)
Page 31
� Prepare a draft legal framework for regional co-operation for the protection and
sustainable management of the marine and coastal environment of the South China Sea,
taking into account existing expertise within UNEP, and national institutions;
� Discuss a draft legal framework for regional co-operation for the protection and
sustainable management of the marine and coastal environment of the South China Sea;
and
� Submit a draft legal framework to the national focal points for their consideration on its
adoption.
Proposed Activities at National Level
� Provide necessary information and expertise on the negotiation and establishment of a
legal framework for regional co-operation for the protection and sustainable management
of the marine and coastal environment of the South China Sea;
� Assist in preparation of a legal framework by active participation in the whole process of
negotiation;
� Co-ordinate with relevant national institutions concerned in preparation, negotiation and
adoption of a legal framework.
4
COST BENEFIT ANALYSIS OF PROGRAMME AC TIONS
In this section the evaluation is focussed on:
� The economic and ecological valuations of the resources;
� The costs of the actions to meet the targets as identified in Section 3;
� The value saved by meeting the targets identified by specific actions of the project;
� The benefits obtained after the GEF project is complete.
4.1
Valuation Considerations
The valuation of the resources of the South China Sea estimates the value of
ecosystems in terms of ecological functions and economic values which follows that used in
Costanza et al. 1997 (The value of the world's ecosystem services and natural capital.
Nature, 387, 253-260).
Ecological functions include: regulation of atmospheric gas concentrations, climate,
protection of other ecosystems from disturbance, water supply, erosion control, soil
formation, nutrient cycling, waste treatment, pollination, biological control and provision of
habitat/refugia.
Economic values include food and fibre production, raw materials, genetic resources,
recreation and cultural values. Constanza et al. (1997) estimates the value in terms of flow of
services per unit area per year, hence the area estimations for the different ecosystems
reported in the TDA are used. The reason we used the Constanza approach is that this is
the first global attempt to give values to ecosystems and, to be consistent, we used the
same methods for each of the ecosystems.
The base line for the cost benefit evaluation is that if nothing is done, then habitat
loss will continue. The rate of habitat loss is based on the findings reported in the TDA, and
takes into consideration the future threats, also reported in the TDA. Rates of loss have
varied in the past for the different periods given by each country. These rates also change
with economic conditions so that each scenario we have used reflects differing future socio-
UNEP SCS/SAP Ver. 3 (24/2/99)
Page 32
economic conditions. The "with project" scenario is based on the targets for each ecosystem
laid out in Section 3, and the details are provided in the relevant sections.
4.2
Valuation of Resources
The relevant economic and ecological values for the four marine ecosystems of
particular interest in the South China Sea are shown in Table 4.1. The seagrass values
include a figure for commercial fish caught over seagrass from Virnstein and Morris (1996).
Most of the value in seagrass and mangrove is from waste and nutrient cycling and this is a
third of the value of wetlands. Tourism is a large component of the value of coral reefs. One
of the activities identified in the SAP is to improve these estimates of values for ecosystems
in the South China Sea.
Table 4.1 Valuation Of Ecosystems (In US Dollars, Adapted From Constanza et al.)
Mangroves Coral Reefs
Seagrass
Wetlands
Gas regulation
133
Disturbance
1,839
2,750
4,539
regulation
water regulation
15
water supply
3,800
nutrient cycling
19,000
waste treatment
6,696
58
4,177
biological control
5
habitat/refugia
169
7
304
Sum ecological
8,704
2,820
19,000
12,968
food production
466
220
256
raw materials
162
27
3,400
106
recreation
658
3,008
574
cultural
1
881
sum economic
1,286
3,256
3,400
1,817
sum total
9,990
6,076
22,400
14,785
For the analysis of actions programmes we define two scenarios. The first is for low
destructive pressure on the particular ecosystem and the second is for high pressure. When
there is a demand for high export earnings and population pressure is great the higher
scenario is the most likely. Under better economic conditions and with population increases
slowing, the lower scenario can be used (Table 4.2).
Table 4.2 Rates and amounts of Habitat Loss Under High and Low Pressure on the
Habitats
HABITAT
TARGET
ANNUAL RATES OF HABITAT
(in thousand ha)
LOSS %
1998
2010 Low
2010 High
Target
Low
High
Pressur
Pressure
e
Mangrove
1754
1556
1022
0.88
1.0
4.5
Coral Reef
2219
2090
1664
0.00
0.5
2.4
UNEP SCS/SAP Ver. 3 (24/2/99)
Page 33
Seagrass
1652
1153
498
1.86
3.0
10.0
There is a number of assumptions made about the rate of loss for a particular
scenario. Under low human pressure, loss is at a lower rate therefore if the target is
achieved the benefit will be relatively small compared with that at a high human pressure.
The benefit under low pressure will, however, be significant because, at a high discount rate,
the benefits from saving habitats at low pressure are $2.7 billion at a 50% discount rate
(Table 4.5). The low pressure scenario in each ecosystem type is the most likely because of
attempts underway now by governments and other institutions to conserve marine
ecosystems. The regional approach suggested by this GEF proposal will improve these
attempts. If governments do not continue efforts at conservation and remediation and the
ecosystems deteriorate further the value of this programme will rise.
4.2.1 Mangrove
The target of the programme to preserve mangroves is to maintain the area of
mangrove at no less than 90% of the existing (1998) level by the year 2010.
The threats to mangrove come from conversion to other uses, such as shrimp
farming and urban development. There is almost unlimited access to mangrove for
conversion in most areas. Where zoning is implemented, there may be enforcement
problems. The key way to maintaining the area of mangrove in the face of the economic
pressure for conversion is to adopt a land use zoning approach taking into account the
relative value of the mangrove in each area from a national, Regional and global
perspective. Areas of national, regional or global significance should receive a high priority in
national policies aimed at sustainable management of mangrove systems. Examples of
transboundary significance are the areas between Malaysia and Thailand, and between
Thailand and Cambodia. Important areas should be chosen for developing management
plans and then these plans implemented. Actions to value mangroves in this region should
be implemented. Monitoring is needed at national and Regional levels. National and regional
data, experiences and inventories should be collected in a regional data network.
Where necessary, mangroves can be restored by replanting, though the time
required to reach a mature stand may be considerable (10-20 years). The investment in
replanting mangrove areas provides benefit in services provided from the mangrove, and
ecosystem functions such as protection of coastal habitat and beaches.
National actions should take advantage of experiences gained from similar
programmes elsewhere. Information exchange among mangrove area managers, such as
replanting successes, management by local populations, and the technical aspects of
silvicultural, should be supported. Various management models can serve as pilot sites to
demonstrate techniques that can be tried in other areas and can provide a training ground
from which others can learn.
Without intervention, it is likely that mangrove area will continue to be lost. In this
section we present two scenarios. A low pressure scenario assumes a 1% annual loss of
mangrove, derived from the current rate of loss from 1.9 million ha in 1990 to around 1.6
million ha now (TDA Report) (Table 4.3). There was a concomitant decline in fishery
productivity (economic) and an increased incidence of beach erosion (functions). By far the
main loss was in terms of ecological function, accounting for almost 90% of the total value of
the annual flow of value of mangroves. The total present value of mangrove saved by
UNEP SCS/SAP Ver. 3 (24/2/99)
Page 34
intervention and assuming the target was met, is $0.9 billion in 2010 if 1% were saved. This
is a saving of $118 million at a discount rate of 50% (Table 4.5).
UNEP SCS/SAP Ver. 3 (24/2/99)
Page 35
Table 4.3 Calculation of Areas Saved by Action Programme: Low Pressure Scenario
(in thousand ha)
Area without action
1
2
3
4
5
6
7
8
9
10
11
12
programme
mangrove
1,754
1,736
1,719 1,702 1,685 1,668 1,652 1,635 1,619 1,603 1,587 1,571 1,556
coral reef
2,219
2,208
2,197 2,186 2,175 2,165 2,154 2,143 2,132 2,122 2,111 2,101 2,090
seagrass
1,652
1,603
1,556 1,510 1,465 1,422 1,380 1,339 1,299 1,261 1,224 1,188 1,153
Area with action
programme
mangrove
1,754
1,739
1,723 1,708 1,693 1,679 1,664 1,649 1,635 1,621 1,606 1,592 1,579
coral reef
2,219
2,219
2,219 2,219 2,219 2,219 2,219 2,219 2,219 2,219 2,219 2,219 2,219
seagrass
1,652
1,621
1,592 1,562 1,534 1,505 1,478 1,450 1,424 1,397 1,372 1,346 1,322
Area saved by action programme
mangrove
2
4
6
8
10
12
14
16
18
19
21
23
coral reef
11
22
33
44
55
66
76
87
98
108
119
129
seagrass
18
36
53
68
83
98
111
124
136
148
159
169
UNEP SCS/SAP Ver. 3 (24/2/99)
Page 36
Table 4.4 Calculation Of Values Saved By Action Programme: Low Pressure Scenario
Action
year
0
1
2
3
4
5
6
7
8
9
10
11
12
Habitat
conservation
mangrove area
2
4
6
8
10
12
14
16
18
19
21
23
saved
coral reef area
11
22
33
44
55
66
76
87
98
108
119
129
saved
seagrass area
18
36
53
68
83
98
111
124
136
148
159
169
saved
Value of habitat saved (*million USD)
Ecological
mangrove
18
37
54
72
89
106
122
138
154
170
185
200
coral reef
31
62
93
124
155
185
215
245
275
305
335
364
seagrass
349
682
998 1,299 1,585 1,857 2,114 2,359 2,590 2,809 3,016
3,212
Economic
mangrove
3
5
8
11
13
16
18
20
23
25
27
30
coral reef
36
72
108
143
178
214
249
283
318
352
387
421
seagrass
63
122
179
233
284
332
378
422
463
503
540
575
Total Value
mangrove
21
42
62
82
102
121
140
159
177
195
212
229
coral reef
67
134
201
267
333
399
464
529
593
658
722
785
seagrass
412
804 1,177 1,532 1,869 2,189 2,493 2,781 3,053 3,312 3,556
3,786
Total Value
500
980 1,440 1,881 2,304 2,709 3,097 3,468 3,824 4,164 4,489
4,801
UNEP SCS/SAP Ver. 3 (24/2/99)
Page 37
Table 4.5 Net Present Value (NPV) Year 1999-2010
Low Pressure Scenario
Discount rate
10.00%
25.00%
50.00%
mangrove
732
309
118
coral reef
2,430
1,018
385
seagrass
12,966
5,581
2,183
Total Value
16,128
6,908
2,686
Action
year
0
1
2
3
4
5
6
7
8
9
10
11
12
Fishery
1,904 1,904
1,904 1,904 1,904 1,904 1,904 1,904 1,904 1,904 1,904
1,904
Management
NPV
12,973 7,093 3,779
Pollution -
2,304 2,304
2,304 2,304 2,304 2,304 2,304 2,304 2,304 2,304 2,304
2,304
aquaculture
NPV
15,699 8,583 4,572
Discount rate
Total Action Programme
10.00%
25.00%
50.00%
Habitat Conservation
16128
6908
2686
Fishery management
12973
7093
3779
Pollution Prevention
15699
8583
4572
Total Action Programme
44800
22583
11037
UNEP SCS/SAP Ver. 3 (24/2/99)
Page 38
Table 4.6 Calculation of The Rate of Loss (sources: national reports)
Country
Original
Present
%
Year
Lost rate
Lost rate
estimated
area
Area
s of
Per yr
Weigh
with
cover (ha)
(ha)
lost
data
%
weight
Per year
%
Cambodia
170,000
85,100
50
20
2.5
0.04
1.00
China
42,001
14,749
65
40
1.6
0.01
0.16
Indonesia
4,254,312
733,000
83
14
5.9
0.38
22.40
Malaysia
505,000
446,000
14
15
0.9
0.23
2.10
Philippines
400,000
160,000
80
70
1.2
0.08
0.96
Thailand
550,000
247,000
55
21
2.6
0.13
3.40
Viet Nam
400,000
252,500
37
39
0.9
0.13
1.20
Average
2.2
1 (total)
4.5
The second scenario weights the average loss per year by the area of mangrove
remaining in that country. The calculation is shown in the Table 4.6. The average loss per
year is calculated on the loss per year for the time that records were kept in each country,
e.g. the Philippines had an area of mangrove 70 years ago of 400,000 ha it is now 160,000
ha so the rate of loss is 0.86% per yr, but it has 9.6% of the total remaining mangrove area.
These percentages are used to give a weighted percentage of loss for the Region of 4.5%
(Table 4.6). For the high pressure scenario the annual values saved by the actions
suggested are tabulated in Table 4.7. After 12 years, in 2010, the saving would be the net
present value, $3.25 billion at 50% discount rate (Table 4.9). This is a conservative estimate
of the benefit from mangrove habitat conservation.
UNEP SCS/SAP Ver. 3 (24/2/99)
Page 39
Table 4.7 Calculation of Areas Saved by Action Programme: High Pressure Scenario
(in thousand ha)
Area without action
1
2
3
4
5
6
7
8
9
10
11
12
programme
mangrove
1,754 1,677 1,603 1,532 1,465 1,401 1,339 1,280 1,224 1,170 1,118 1,069 1,022
coral reef
2,219 2,167 2,115 2,065 2,016 1,968 1,922 1,876 1,832 1,788 1,746 1,704 1,664
seagrass
1,652 1,495 1,352 1,224 1,107 1,002
907
820
742
672
608
550
498
Area with action programme
mangrove
1,754 1,739 1,723 1,708 1,693 1,679 1,664 1,649 1,635 1,621 1,606 1,592 1,579
coral reef
2,219 2,219 2,219 2,219 2,219 2,219 2,219 2,219 2,219 2,219 2,219 2,219 2,219
seagrass
1,652 1,621 1,592 1,562 1,534 1,505 1,478 1,450 1,424 1,397 1,372 1,346 1,322
Area saved by action
programme
mangrove
62
120
176
228
278
325
369
411
451
488
523
556
coral reef
53
104
154
203
251
298
343
388
431
474
515
555
seagrass
127
239
339
426
503
571
630
681
726
764
796
824
UNEP SCS/SAP Ver. 3 (24/2/99)
Page 40
Table 4.8 Calculation of Values Saved by Action Programme: High Pressure Scenario
Action
year
0
1
2
3
4
5
6
7
8
9
10
11
12
Habitat conservation
mangrove area saved
62
120
176
228
278
325
369
411
451
488
523
556
coral reef area saved
53
104
154
203
251
298
343
388
431
474
515
555
seagrass area saved
127
239
339
426
503
571
630
681
726
764
796
824
Value of habitat saved (*million
USD)
Ecological
mangrove
538 1,048
1,531
1,988
2,420
2,829
3,215
3,580
3,924
4,249
4,555
4,843
coral reef
148
293
435
573
708
839
968
1,093
1,216
1,335
1,452
1,566
seagrass
2,409 4,544
6,432
8,098
9,563 10,848 11,970
12,945 13,789 14,514 15,133
15,656
Economic
mangrove
80
155
226
294
358
418
475
529
580
628
673
716
coral reef
171
339
502
661
817
969
1,118
1,262
1,404
1,542
1,677
1,808
seagrass
431
813
1,151
1,449
1,711
1,941
2,142
2,317
2,467
2,597
2,708
2,802
Total Value
mangrove
618 1,203
1,757
2,282
2,778
3,247
3,690
4,109
4,504
4,877
5,228
5,559
coral reef
320
632
937
1,234
1,525
1,809
2,085
2,356
2,620
2,877
3,129
3,375
seagrass
2,840 5,357
7,583
9,547 11,274 12,789 14,112
15,262 16,256 17,111 17,841
18,457
Total Value
3,777
7,192 10,277 13,063 15,577 17,844 19,887
21,726 23,380 24,865 26,198
27,391
UNEP SCS/SAP Ver. 3 (24/2/99)
Page 41
Table 4. 9 Net Present Value (NPV) Year 1999-2010
High Pressure Scenario
Discount rate
10.00%
25.00%
50.00%
mangrove
19,196
8,282
3,250
coral reef
10,889
4,613
1,769
seagrass
73,432
32,879
13,503
Total Value
103,517
45,775
18,523
Action
year
0
1
2
3
4
5
6
7
8
9
10
11
12
Fishery Management
1,904 1,904 1,904 1,904 1,904 1,904 1,904 1,904 1,904 1,904 1,904 1,904
NPV
12,973
7,093 3,779
Pollution � aquaculture
2,304 2,304 2,304 2,304 2,304 2,304 2,304 2,304 2,304 2,304 2,304 2,304
NPV
15,699
8,583 4,572
Discount rate
Total Action Programme
10.00%
25.00%
50.00%
103,517
45,775
18,523
Habitat Conservation
16,210
7,528
3,807
Fishery management
19,615
9,110
4,607
Pollution Prevention
Total Action Programme
139,342
62,413
26,936
UNEP SCS/SAP Ver. 3 (24/2/99)
Page 42
4.2.2 Coral Reefs
The target set for coral reefs is to maintain the existing reefs in good condition (those
having more than 50% live coverage) by the year 2010. Based on the data reported in the
TDA, the existing area is estimated to be 2.3 million ha in 1990.
The actions required to maintain coral reefs are to protect them from human
interference. Management zones, mapping and inventory taking with the data on a Regional
database will assist the conservation of coral reefs. Management methods include restricting
access to the area by administrative means, designating the area as a protected area, and
then enforcing restriction through patrolling and licensing systems. Controlling the use of the
area to minimize impact, such as providing buoys for mooring of tourist boats and limiting the
number of tourists through a system of licensed tour boats, can be set and enforced.
The control of fishing activities on coral reefs may be to license fishermen and place
various restrictions on fishing gear and methods. A suitable system of sanction and charges
may implement the control. The design of such a system has to fit in with local conditions.
Nevertheless, such interventions are necessary to maintain coral reefs for the future.
The low pressure case scenario (Table 4.2) assumes that the loss of good coral reefs
(area with 50% or more live cover) will be at the rate of 0.5% per annum. Achieving the
target will mean that an area of 226,000 ha of coral reef will be kept intact. This area has
value as a fishery and for tourism in the future. The value of the area saved on an
incremental basis is shown for twelve years in Table 4.4. Based on the Costanza values,
the amount of avoided loss discounted at 50% will be $385 million US (at 1994 prices)
(Table 4.5).
Another possible scenario is that, based on the 0.5% loss in the past 30 years and
assuming that that rate increases to such an extent that 48% will be lost in the next 20 years
(Chou, L.M. 1998. Status of Southeast Asian coral reefs. In: Status of Coral Reefs of the
World: 1998. Ed. Wilkinson, C. 79-87), there will be a 2.4% annual loss (Table 4.7). The
value of the area saved, at intense pressure of degradation on an incremental basis, is
shown for twelve years in Table 4.7. This loss is worth $1.7 billion at a 50% discounted rate
(Table 4.8).
4.2.3 Seagrass
The target for seagrass is to maintain at least 80% of the existing area by the year
2010. The estimated area of seagrass in the TDA should be taken with caution.
Nevertheless, it is presented here to indicate the order of magnitude, and to derive an
estimate of the costs involved. The base case scenario assumes that the area of seagrass
will decline at the rate of 3% annually, this is higher than the first scenarios for mangrove
and coral reefs, due to the greater sensitivity of seagrass to environmental damage and
threats from human activities such as trawling and sedimentation from land-based
development. With the assistance of the programme, the area of loss avoided is estimated at
over 169,000 ha (Table 4.3) at low pressure of human impact and 824,000 ha at high
pressure (Table 4.7).
These targets require that seagrass beds are protected from threats which are mainly
human activities--namely trawling fishing boats close to the shoreline, and deterioration in
water quality with solid wastes and land-based pollutants which affect the health of the
seagrass beds. The actions can take the form of community management to patrol the area
UNEP SCS/SAP Ver. 3 (24/2/99)
Page 43
to keep out fishing boats and management of land-based sources of pollution so that they
are not discharged to the sea. In turn, this requires planning for waste disposal on land.
Assessment of the Regional importance of the seagrass resource and hence its
Regional value is a first step for its management. Next steps are preparing and implementing
management plans for the identified areas, resulting in achieving the target. The main value
in preventing loss of seagrass habitat will be in the maintenance of fishery yields, prevention
of erosion and, to a small extent, tourism revenue.
Estimating the value of the benefit is subject to the uncertainty concerning the area of
seagrass. Based on the Costanza values, all of the value from seagrass beds is related to
ecosystem functions, in particular that of nutrient cycling, the services value of seagrass is
negligible. Obviously, in the South China Sea the services value is of some significance
considering the fisheries based in seagrass, therefore the ecosystem value needs to be
determined on a Regional basis and not on a global average. We have added to Constanza
et al. (1997) figures an estimate of value of food gained from seagrass beds using estimates
of Virnstein and Morris (1996).
The incremented values of the areas saved under the two different scenarios are
given in Tables 4.4 and 4.8. Using the discounted values of results from action, the total
annual value of seagrass saved is estimated at more than $2.1 billion and $13.5 billion US at
50% discount for low and high pressure scenarios, respectively (Tables 4.5 and 4. 9).
4.2.4 Wetlands
Wetlands will be treated differently in this SAP from the previously described
ecosystems. National Wetlands Committees will be approached and if necessary
established to handle the issues in the South China Sea. The following values and cost
benefit analyses will be suggested to the National Wetlands Committees.
The target for wetlands is to have management plans for all the important wetland areas,
thus maintaining their value. The area of wetlands and estuaries were estimated at 2.1
million ha and the base case scenario assumes that the area will decline by 2% annually.
The proposed action will result in the preparation of management plans for wetlands areas
which will control the use of the wetlands so as to maintain their ecosystem functions, during
development.
Benefits are the avoided loss in value of wetlands services. The main values are the
preservation of biodiversity, with reference to migratory birds, but the use values of fishery
and aquaculture are also significant. Using the Costanza value estimates, the total value of
wetland area loss avoided is $822 million US.
4.2.5 Total habitat values
For the ecosystem loss component as a whole, the benefit of the programme is
estimated at $2.686 billion US at 1994 prices at 50% discount rates, assuming that there is a
low human pressure on them (Table 4.5). At high human pressure there would be a
discounted saving of $18.5 billion (Table 4.9). Around 20% of this being services, while the
remaining amount is ecosystem functions. This is the value of the loss avoided,
corresponding to the population's Willingness to Accept (WTA) in compensation for the
UNEP SCS/SAP Ver. 3 (24/2/99)
Page 44
degradation that would result from the "do nothing" scenario. The annual savings for both
high and low scenarios are for 12 years, of which the GEF Programme will be for five. It is
expected that the impetus of the programme will continue after GEF, and the results are
shown in Tables 4.4 and 4.8 as the last seven years of the tables.
4.2.6 Overexploitation of fishery resources
The proposed targets are closely related to the sustainable economic and
environmental resource use. The management of fishing fleets will require complex
measures involving many agencies and be outside the scope of the programme. However,
to support the goal of responsible fisheries, a key element is to know the environmentally
sustainable yield that can be obtained from the fishing ground and to protect areas that are
important breeding grounds for fish. The proposed actions are focused on assessing
resources at the regional level to provide the basis for further action in the formation of a
concerted regional fishery action plan.
The problem that the dependence of the majority of the coastal population is on near-
shore fishery resources is addressed by the action to provide information on the need for
sustainable fishing and the methods to practice it. Action is aimed at the small scale artisanal
fishing community. It should help to maintain the productivity of fishing grounds and the loss
of fishery income or food can be offset against the benefit of the action.
Based on a study of overfishing in the Philippines, (Israel and Banzon, 1998), by the
early 1990s, the production of marine capture fisheries had exceeded the maximum
sustainable yield. While the production value reached then was $2.8 million US at the Open
Access point, the maximum economic yield was estimated to be only $1.4 million US. The
value of the economic rent (revenue from production minus cost) under the maximum
economic yield case is as high as $760,000 US in contrast to zero under the Open Access
regime (Table 4. 10).
UNEP SCS/SAP Ver. 3 (24/2/99)
Page 45
Table 4.10 Key Indicators Using The Gordon-Schaefer Model Results in the Philippines Marine Fisheries 1994
Indicator
Volume of Catch
Total
Amount of
Total Costs
Maximum
(metric tons)
Revenue
Effort
(million
economic rent
(million
(horse power)
dollars)
(million dollars)
dollars)
Maximum Sustainable
1,803,727
3,349
5,505,882
3,155
191
point
Maximum Economic
1,403,728
2,606
2,913,072
1,669
937
Point
Open Access Point
1,797,624
3,338
5,826,143
3,338
0
Source: Table 12, in Danilo C. Israel and Cesar P. Banzon, 1998
Overfishing in the Philippine Marine Fisheries Sector,
Economy and Environment Program for Southeast Asia(EEPSEA)
UNEP SCS/SAP Ver. 3 (24/2/99)
Page 46
Table 4.11 South China Sea Fishery Yield (in thousand tons)
Countries
1972
1980
1991
1992
Brunei
2
4
4
4
Cambodia
21
7
36
34
Hong Kong
132
187
220
220
Indonesia
836
1,395
2,380
2,692
Malaysia
325
734
904
1,024
Philippines
928
1,251
1,673
1,660
Singapore
15
16
11
9
Chinese Taipei
611
759
308
326
Thailand
1,538
1,648
2,479
2,736
Vietnam
811
398
610
810
Total (excluding china)
5,219
6,399
8,625
9,515
Source: Sudara,S. 1997.
Another study of the marine fishing industry in Indonesia came to a similar conclusion
(R. Dahuri. 1997. In: Asia-Pacific Fishery Commission, Table 13, p. 113). It estimated that,
based on maximum sustained yield and a fixed income for the fishing household, the optimal
number of fishing households that could be supported by the fishery was 428,000 but there
are now 677,000 households, 36% higher than can be indefinitely supported by the fishery. If
the criteria of maximum economic yield were used instead of the maximum sustainable yield,
the number of fishing households would be even lower.
Assuming that the Philippines case is representative of the other fisheries in the SCS
countries, the fish catch should fall by about 50% from the present level, while the benefit
from the reduction in fishing effort would be around 28% of the total value of the present
catch.
It is reported (Sudara, S, Marine Fisheries and Environment in the Asian Region,
Environmental Aspects of Responsible Fisheries, 1997. In Asia-Pacific Fishery Commission,
p. 184) that the value of the catch in the South China Sea Region (excluding China) in the
early 1990s was US$ 6,800 million, while the quantity of the catch was 9.5 million tonnes
(Table 4. 11). If this is the catch weight under Open Access, it would need to be reduced to
around 4.75 million tonnes, while the economic rent would increase from zero, to around
$1,904 million US annually. The saving is not incremental like the ecosystem conservation
but the same each year. The net present value at 50% discount is $3.8 billion.
4.2.7 Pollution
The target for the pollution problem is to set and maintain region-wide water quality
standards and water quality objectives to help to maintain the health of the coastal
ecosystems.
The actions are designed to develop a system of standards and objectives that will
help to maintain the productivity of the seas in the region. Achieving such a Region-wide
system will support the continuation of fisheries and tourism in coastal areas. Maintaining
water quality standards will also help to conserve marine habitats.
UNEP SCS/SAP Ver. 3 (24/2/99)
Page 47
While the effect of pollutants may be slight for the SCS as a whole, and the effect on
the marine biota may be sporadic � fish kills and red tides, for example, the "hot spots" of
high pollution risks � particularly areas with large urban settlements and heavy concentration
of industry--can suffer directly from the effects of pollution.
Treated sewage dumping into the sea raises nutrients which enhance algal blooms
and the growth of opportunistic algae on seagrass leaves and coral reefs. The effect of the
current coral bleaching in the SCS may be worsened by an increase in nutrients. Instead of
the bleached coral being able to recover quickly, algal growth quickened by increased
nutrients may prevent recovery. The costs of losing coral reefs and seagrass beds were
covered in the previous sections on these habitats. Additional problems can occur when
seafood grown in waters containing toxic algae are consumed but these are irregular and
are usually dealt with effectively by the public health authorities when they occur.
Untreated sewage has the added risk of high organic matter and coliform bacteria
counts. The organic matter lowers the oxygen content in the water and results in the death of
fish other animals and plants. High coliform counts may cause illness to swimmers and
consumers of shellfish.
A clear case of damage from pollution is estuarine and marine aquaculture. This
activity is highly sensitive to water quality changes. Water quality deterioration can wipe out
the whole industry. Tourism is another activity that is adversely affected by pollution caused
decline in water quality.
For the purpose of analysis, it is assumed that only aquaculture is affected by
pollution in the base case scenario. Tourism sites can be developed in other areas in the
same country, or they can move to another country in the region. The TDA estimates the
quantity of cultured fish at 2.9 million tons. Assuming a price of $4,000 US ton-1 (for cultured
shrimp), the value of aquaculture production may be put at $11,600 million US. Then,
assuming that pollution would lower the yield by 20%, there will be a loss of $2,304 million
US. The programme target of setting water quality standards and maintaining them in the
region would help to maintain the level and values of aquaculture activity. The net present
value of the intervention action, assuming there is low pressure on aquaculture is $4.6 billion
at 50% discount (Table 4.5).
4.2.8 Regional Cooperation
There is no formal legal agreement between governments in the region to reduce
pollution, use fisheries in a sustainable way or protect marine habitats. The costs of
enhancing Regional cooperation in the form of a legal framework consist mainly of the costs
of meetings, consultancies and travels. The benefits are evident in the success of the
previous described actions to improve habitats, obtain sustainable fisheries and reduce
pollution.
4.4
Assessing the Benefits from the Programme
Taking the SAP as a whole, the focus is to maintain the existing level of resources for
the future, through proper planning and management and to address key problems in "hot
spot" areas by curative measures. The benefits of the SAP for each ecosystem are
summarized in Table 4.5 and 4.9 for the scenarios of low and high pressure on them. The
UNEP SCS/SAP Ver. 3 (24/2/99)
Page 48
ecological and economic values are estimated separately for the twelve years (Tables 4.4
and 4.8). For each habitat the value is calculated on a year by year basis. The saving is
accumulative. The values commence from the latest period for which data are available -
1998, and run to 2010.
For the fisheries management and the effect of pollution control on aquaculture, the
benefit each year is not cumulative and remains the same for as long as the remediative
actions are carried out. For pollution, the only figure given is a saving of 20% of the value of
shellfish aquaculture accomplished by preventing red tides and pollution from damaging the
shellfish industry. This is an arbitrarily chosen figure to represent what may be saved by
improving water quality. Such an estimate can only be made for an individual site and
depends on the extent of pollution, flushing rates, density of aquaculture and other factors.
Net Present Value of these savings is given in Tables 4.5 and 4.9 at a discount rate
of 10%, 25% and 50% to compare different incentives to achieve the targets.
4.5
Estimated Cost of the Strategic Action Programme
The costs of meeting the identified targets by implementation of the project activities
consist of three parts: the GEF funding, the national contribution to the project activities and
the contribution obtained from co-financing. As the project will enhance the institutional and
legal frameworks in the South China Sea Region, the benefits will continue after the GEF
project in terms of protection of marine habitats, sustainable fisheries and reduction of land
based sources of pollution into the sea. An analysis will be provided to show the benefits.
To achieve the targets the actions must be taken sequentially to address the root
causes of the various problems identified in the TDA. Since these problems have various
causes ranging from institutional, social, and economic to technological issues, the approach
must be to develop an integrated management plan to deal with each of the problems. In this
section, the issue of how the proposed actions will lead to the achievement of the agreed
targets will be elaborated for each of the problem areas.
In broad terms, the actions may be classified as preventive, curative, outreach,
monitoring and evaluation, and integrated management planning. The terms are self-
explanatory, but how they respond to the problems and the targets set for each problem
area will be discussed.
The actions proposed for the SAP consist of four main types of activities:
(1)
Development of criteria for assessing the importance of a habitat or standards of
environmental quality to identify sites for concrete actions.
(2)
Development of regional and national action plans to establish an institutional
framework for planning and coordinating activities.
(3)
Development of a database for inventory and monitoring of environmental status to
support planning.
(4)
Establishment of pilot projects where improved management practices are
demonstrated.
(5)
Development of justifiable ecological and services cost for each ecosystem.
The activities (1)-(3) may be implemented by holding meetings of senior officials and
experts, convened at the regional level by a regional coordinating body such as the
UNEP SCS/SAP Ver. 3 (24/2/99)
Page 49
EAS/RCU. The estimated basic cost of each meeting is $30,000 US (assuming an
international meeting in Bangkok).
The cost of demonstration projects was estimated based on the costs of a World
Bank funded study on the improvement of the management of marine parks in Thailand
(1995). The dollar values were used, to avoid the recalculation of costs in local currencies.
The estimated total cost of the programme is shown in Table 4.12 The costs for each
component of the programme are given in Tables 4.13 - Table 4. 19
The cost of the Strategic Action Programme can only be prepared when it is fully
developed and finalized. As decided by the Thirteenth Meeting of COBSEA, the Strategic
Action Programme will be further improved as an initial action of the project.
The main actions will include preventive and curative measures, outreach activities
and the cost of inaction. The detailed analysis on the cost of the Strategic Action
Programme will be provided when the project takes off.
The costs detailed in this SAP are those readily identified to progress the actions.
However, cost boron by other agencies, government departments and collaborators are not
well detailed yet. They will be added as the SAP progresses.
Table 4.12 Summary of Programme Cost (Unit = 1,000 US$)
Item/Issue
Total Cost
National
Regional
Mangrove
3,183.5
653
2,530.5
Coral Reef
3,275.5
696
2,579.5
Seagrass
3,299.5
700
2,599.5
Wetlands
3,275.5
696
2,579.5
Habitat total
13,034
2,745
10,289
Fishery
1,123.5
385
738.5
Pollution
2,981.5
525
2,456.5
Regional Cooperation
1,380.9
350
1,030.9
Sub-total
18,519.9
4,005
14,514.9
Programme steering Committee
150
Technical Advisory Group
80
Programme Operation
150
Duty Travel
300
Reporting/publication
70
Evaluation mission
60
Other cost
90
Sub-total
900
Total
19,419.9
4,005
15,414.9
UNEP SCS/SAP Ver. 3 (24/2/99)
Page 50
Table 4.13 Cost of Action: Mangroves
(in thousand US dollars)
Component
Governments
GEF
Co-Financing
Total
Sub-component
Activities
1. Habitat Conversion & Loss
1.1 Mangroves
1.1.1 Establishment or re-vitalisation of National
Mangrove Committees (N) - Cash, 2,000/country/year for 5 yrs
70
140
5
Annual meetings for leaders of national committees
150
1.1.2 National Data base
Review national data; development of compatible, inter-linked national
70
28
systems for data management (N)
Convene meeting on data policy
30
Conduct training on data exchange
35
Operation of database
70
1.1.3 Restoration
Review of current restoration activities and techniques (N)
35
200
Prepare and publish guidelines
14
35
1.1.4 Develop national action plans (including legislation) to maintain nationally important mangrove areas (N)
Prepare guideline to develop national action plans/legislation
21
35
Prepare and publicsh national action plans/legislation
35
28
Conduct a regional workshop
30
1.1.5 Public Awareness
UNEP SCS/SAP Ver. 3 (24/2/99)
Page 51
Convene national public meetings for presentation and review of the
21
10
national reports and findings of the national and regional task
teams (N)
1.1.6 National management Plan
Convene a Regional workshop on preparation of national
30
management plans
Prepare and Adopt the national management plans
14
-
Implement the national management plan
70
21
Conduct Regional training on survey/mapping of mangrove area
30
Coordinate the preparation of national maps of mangrove areas
28
14
1.1.7 Regional Criteria
Identify experts to form a regional task team
-
-
5
Convene two regional expert meetings;
40
60
Draft and finalise the management criteria (R)
21
50
Apply the criteria to identify and prioritise areas for future
21
-
management, protection restoration and selection of 3 pilot sites
for demonstration activities (R)
1.1.8 Regional Action Plan
Develop regional action plans to maintain regionally important
42
50
mangrove areas (N & R)
Convene one high-level regional meeting for presentation and review
21
-
100 -COBSEA
of the national and regional reports and recommendations of the
national and regional task teams (R)
1.1.9 Demonstration activities
Identy 3 demonstration sites
Implement activities in the 3 demonstration sites
60
1,500
1.1.10 Personnel cost (based in Bangkok,1999)
1/6 P5
23.6
UNEP SCS/SAP Ver. 3 (24/2/99)
Page 52
1/6 P3
16.6
2/6 GS 5
14.3
TOTAL
653
2,530.5
Table 4.14 Cost Of Action: Coral Reefs
(in thousand US dollars)
Component
Governments
GEF
Co-Financing
Total
Sub-component
Activities
1. Habitat Conversion & Loss
1. 2 Coral Reefs
1.2.1 Establish national coral reef working groups & convene regular meetings(N)
Establish national working groups
70
140
5
Convene regular meetings
150
1.2.2 National management plan 1.2.2
Draft & publish the criteria; guidelines for the national management
35
70
plans and for economic evaluation (R)
Coordinate the preparation of a GIS/map based national inventory of
70
701
coral reefs & review national data (N).
Prepare national legislation and management plans for the
70
140
protection and sustainable management of nationally important
coral reefs (N).
Adopt the national management plans (N).
35
Convene national public meetings for presentation and review of the
30
national reports and management plans and reports of the national
and regional task teams (N).
1.2.3 Regional Network
Identify experts to form a regional task team (R).
70
Convene regional expert meetings (R).
120
UNEP SCS/SAP Ver. 3 (24/2/99)
Page 53
Develop the regional framework for inter-linking national data
351
management systems
Coordinate Regional mapping of coral reefs
70
10
Apply the criteria to identify and prioritise areas for future
14
35
management, protection and selection of 3 sites for demonstration
management projects (R).
Develop regional priority actions for inclusion in the Strategic Action
10
35
Programme to maintain regionally significant coral reef areas (N &
R).
1.2.4 Capacity building and public awareness
Convene and assist with training on coral reef conservation
35
70
Prepare and facilitate public education
70
35
1.2.5 Demonstration Projects
Convene intergovernmental meetings to: adopt the criteria for
42
50
prioritisation of areas for management intervention; for
presentation, review, and adoption of the regional priority actions
for final adoption of the SAP (R).
Implement 3 demonstration projects for integrated management in
140
1,500
regionally significant coral reef areas (N & R).
1.2.6 Personnel Cost
1/6 P5
23.6
1/6 P3
16.6
2/6 GS 5
14.3
TOTAL
696
2,579.5
Table 4.15 Cost of Action: Seagrass
(in thousand US dollars)
Component
Governments
GEF
Co-Financing
Total
UNEP SCS/SAP Ver. 3 (24/2/99)
Page 54
Sub-component
Activities
1. Habitat Conversion & Loss
1. 3 Seagrass
1.3.1 Establish national seagrass working groups & convene regular meetings(N)
Establish national seagrass working groups
70
140
5
Convene regular meetings
150
1.3.2 National management plan
Draft & publish criteria; guidelines for the national management
35
70
plans and for economic evaluation (R)
Coordinate a GIS/map based national inventories of seagrass &
70
701
review national data (N).
Prepare national legislation and management plans for the
70
140
protection and sustainable management of nationally important
seagrass (N).
Adoption of national management plans (N).
35
Convene national public meetings for presentation and review of the
30
national reports and management plans of the national and
regional task teams (N).
1.2.3 Regional Network
Identify experts to form a regional task team (R).
70
Convene regional expert meetings (R).
120
Develop a regional framework for inter-linking national data
351
management systems
Coordinate Regional mapping of seagrass
30
30
Apply criteria to identify and prioritise areas for future management
60
35
and protection. Select 3 sites for demonstration management
projects (R).
Develop regional priority actions for inclusion in the Strategic Action
10
35
Programme to maintain regionally significant seagrass areas (N &
UNEP SCS/SAP Ver. 3 (24/2/99)
Page 55
R).
1.2.4 Capacity building and public awareness
Training on seagrass conservation
35
70
Public education
70
35
1.2.5 Demostration Projects
Convene intergovernmental meetings to: adopt the criteria for
42
50
priroitisation of areas for management intervention; present,
review, and adopt the regional priority actions; finally adopt the
SAP (R).
Implementation of 3 demonstration projects for integrated
140
1,500
management in regionally significant seagrass areas (N & R).
1.2.6 Personnel Cost
1/6 P5
23.6
1/6 P3
16.6
2/6 GS 5
14.3
TOTAL
700
2,599.5
UNEP SCS/SAP Ver. 3 (24/2/99)
Page 56
Table 4.16 Cost Of Action: Seagrass
(in thousand US dollars)
Component
Governments
GEF
Co-Financing
Total
Sub-component
Activities
1. Habitat Conversion & Loss
1. 3 Wetland
1.3.1 Establish national wetlands working groups & convene regular meetings(N)
Establish national wetlands working groups
70
140
5
Convene regular meetings
150
1.3.2 National management plan
Draft & publish criteria; guidelines for the national management
35
70
plans and for economic evaluation (R)
Coordinate the preparation of a GIS/map based national inventory
70
701
wetlands & review of national data (N).
Prepare national legislation and management plans for the
70
140
protection and sustainable management of nationally important
seaagrass (N).
Adopt the national management plans (N).
35
Convene national public meetings for presentation and review of the
30
national reports and management plans of the national and
regional task teams (N).
1.2.3 Regional Network
Identify experts to form a regional task team (R).
70
Convene regional expert meetings (R).
120
Develop the regional framework for inter-linking national data
351
management systems
Coordinate the Regional mapping of wetlands
70
10
Apply the criteria to identify and prioritise areas for future
14
35
UNEP SCS/SAP Ver. 3 (24/2/99)
Page 57
management, protection and selection of 3 sites for demonstration
management projects (R).
Develop regional priority actions for inclusion in the Strategic Action
10
35
Programme to maintain regionally significant wetlands areas (N &
R).
1.2.4 Capacity building and public awareness
Conduct and implement training on wetlands conservation
35
70
Prepare educational publications
70
35
1.2.5 Demostration Projects
Convene intergovernmental meetings to: adopt the criteria for
42
50
priroitisation of areas for management intervention; for
presentation, review, and adoption of the regional priority actions;
for finally adopting the SAP (R).
Implement 3 demonstration projects for integrated management in
140
1,500
regionally significant wetlands areas (N & R).
1.2.6 Personnel Cost
1/6 P5
23.6
1/6 P3
16.6
2/6 GS 5
14.3
TOTAL
696
2,579.5
UNEP SCS/SAP Ver. 3 (24/2/99)
Page 58
Table 4.16 Cost of Action Exploitation of Fisheries
(in thousand US dollars)
Component
Governments
GEF
Co-Financing
Total
Sub-component
Activities
2 Over Exploitation of fisheries
2.1 Regional coordination & determination of priorities for action
Identify National Focal Points & experts, and establish a regional
70
140
Task Force (R)
Prepare a regional over-view of the state of fisheries including stocks,
35
58
identification of significant spawning and nursery areas, optimal catch and
effort, impacts of destructive fishing activities, fisheries management
systems, and national compliance with international fisheries conventions
Develop criteria for determining the national, regional and transboundary
35
70
significance of individual stocks, spawning and nursery areas
Adopt the recommended criteria and priorities for action by an
30
appropriate regional intergovernmental forum for subsequent
inclusion in the SAP
2.2 Develop regional and national management plans
Develop regional and national management plans for priority areas
70
140
of regional and transboundary significance to establish a regional
system of refugia to maintain regionally important fish stocks
2.3 Trial a blast fishing detection system
Trial a blast fishing detection system
170
University
Malaysia Sabah
2.4 Information and public awareness
Develop and implement programmes to provide information on fish
51
stock conservation and sustainable fishery practices among small
and artisanal fishing communities in the priority areas;
Develop educational and public awareness materials on sustainable
35
UNEP SCS/SAP Ver. 3 (24/2/99)
Page 59
fishery practices;
Translate into local languages and disseminate public awareness
35
materials
Conduct national and regional workshops to promote the Code of
140
30
Conduct for Responsible Fisheries
Personnel Cost
1/6 P5
23.6
1/6 P3
16.6
2/6 GS 5
14.3
TOTAL
385
738.5
UNEP SCS/SAP Ver. 3 (24/2/99)
Page 60
Table 4.17 Cost of Action: Land-Based Pollution
(in thousand US dollars)
Component
Sub-component
Governments
GEF
Co-Financing
Total
Activities
3. Land-based Pollution
3.1 Regional Water Quality standards (2005)
Identify National and Regional experts and form regional and national
70
14
expert working groups : guidelines/action programmes for
implementation of the GPA;
and prepare draft regional water quality objectives and water quality and
35
140
GPA, HOTO
effluent standards
review and assess existing knowledge of regional water quality,
determine information gaps,
evaluate carrying/assimilation capacity of sub-regions within the South
140
210
China Sea, transboundary movements of contaminants
adopt water quality objectives, prepare guidelines for the development of
70
140
GIPME
national management plans, including capacity building legislation,
and other appropriate components to achieve the agreed water
quality objectives; review national capacity to test, monitor, control
and enforce water quality and effluent standards
develop and finalise national and regional management plans to reach
28
these objectives within specified time frames; to be incorporated
into the Strategic Action programme for the South China Sea
Initiate capacity building activities that lead to improvement in water
35
60
quality testing and monitoring and conduct an evaluation of the
sensitivity of key ecosystems to specific pollutants or regional and
transboundary significance
3.2 Determination of Regional Priority "hot spots" (2005
UNEP SCS/SAP Ver. 3 (24/2/99)
Page 61
Discuss and agree on criteria for evaluating the regional importance of
70
210
nationally identified pollution ""hot spots"" in the Transboundary Diagnostic
Analysis (severity of pollution, feasibility/ease of mitigation, transboundary
effect
Assess and evaluate data relating to national "hot spots" and prepare and
70
35
agree on a regional priority listing for investment
Conduct a preliminary evaluation of the costs and benefits of
1500
alternative mitigation measures for selected priority "hot spots";
pre-feasibility studies for three selected priority pollution "hot
spots"
Develop and agree on a South China Sea strategic approach to
35
65
mitigating priority regional "hot spots" (including priority investment
portfolio, cofinancing arrangements, national and regional actions)
3.3 Personnel Cost
1/6 P5
23.6
1/6 P3
16.6
2/6 GS 5
14.3
TOTAL
525
2,456.5
UNEP SCS/SAP Ver. 3 (24/2/99)
Page 62
Table 4.18 Cost of Action: Regional Co-Operation
(in thousand US dollars)
Component
Sub-component
Governments
GEF
Co-Financing
Total
Activities
4. Regional Co-operation
4.1 Regional Co-ordination of the finalisation of the Strategic Action Programme
Appoint regional co-ordinatiing staff and consultants for management
and execution of the project
Convene of a meeting of COBSEA national Focal Points and partner
70
64
organisations and institutions to prepare the framework master plan for
project management and execution and determine and agree on the
membership of the Regional Co-ordinating Committee for the project
Appoint National Focal Points to Chair the National Inter-ministry
70
70
Steering Committees and initial country visits by the regional co-
ordinating staff to meet with the national Steering Committees and
prepare national workplans and budgets
Convene, in close association with the meetings of the Co-ordinating
35
210
Body for the Seas of East Asia, regional conferences of experts to
present the results & recommendations of the national and regional
working groups & establish & re-inforce the linkages between the
sectoral working groups
4.2 Regional Collaboration on the development of a legal framework for action
Identify national legal experts, create national inter-ministry working
70
140
groups to review: existing national legislation relating to the
environment of the South China Sea, current obligations of
countries under Global Conventions including inter alia the
UNFCC, the CBD, the UNCLOS, and MARPOL and to participate
actively in the work of the regional task force
Establish a regional task force to review the similarities and differences
35
140
between national legislation and consider ways in which such legislation
UNEP SCS/SAP Ver. 3 (24/2/99)
Page 63
might be harmonised to achieve the common objectives of the countries
as expressed in the Strategic Action Programme. Prepare
recommendations concerning the optimum mode of countries meeting
their obligations under the global conventions and to protecting the
environment of the South China Sea
Prepare, for consideration by a high level intergovernmental meeting,
70
140
recommendations and a draft legal framework for regional co-operation
in the protection and sustainable management of the marine and coastal
environment of the South China Sea.
Personnel Cost
1/6 P5
23.6
1/6 P3
16.6
2/6 GS5
14.3
TOTAL
350
1,030.9
UNEP SCS/SAP Ver. 3 (24/2/99)
Page 64
5
INCREMENTAL PARTNERSHIPS
5.1
Justification for Forming Partnerships
This section considers existing and planned investments by the countries, donors
and non government organisations of the South China Sea as a baseline for assessing the
incremental cost of the Strategic Action Programme. Before the regional economic crisis,
there were several projects underway in the South China Sea region that would have been
enhanced by this programme. It is this synergistic increment to these projects that this SAP
is aimed. Projects underway at that time were: ASEAN-Australian Living Resources
programme, UNESCO-UNDP mangrove project, ASEAN-USAID coastal management
programme, and ADB/ESCAP/UNEP coastal area management programme, etc.
With the regional economic crisis, national budgets are under severe constraints and
existing spending plans may not be fulfilled. Some of the existing national level actions will
complement the proposed actions in the SAP drawn largely from the national TDA reports.
Where existing or planned actions by the nations of the SCS coincide with the planned
actions of the SAP, the "in kind" and financial backing of the country concerned is assumed.
5.2
Partnerships Available for Achieving Maximum Environmental Benefits
Assuming that there will be funds from national budgets allocated for the actions
proposed in the SAP, the costing of the SAP includes both GEF and national contributions.
National actions are specified in Section 3 and 4 and were agreed upon at meetings held to
discuss regional issues. Many NGO's, aid organisations and donor countries are expected to
contribute to the costs of the proposed actions. A list of organisations that agreed in principle
to contribute to taking part in the suggested actions appears as Table 5.1.
Table 5.1 Organisations Willing to Collaborate in Programme
ORGANISATION
ACTION
TYPE OF
ORGANISATION
FAO
Over fishing
UN
MAB/UNESCO
Habitats
UN
IOC/GOT
All
UN
GPA (Red River) World Bank
Pollution
UN
UNEP Clean Factories
Pollution
UN
UNEP (NETTLAP)
All
UN
UNEP EA
All habitats
UN
AIMS Pollution Indicators
Pollution
RESEARCH
Legal
SEAPOL (LAW)
Framework
NGO
World Wildlife Fund
Coral
NGO
ICRI
Coral
NGO
LOICZ
Pollution
NGO
SIDA
All
DONOR
DANIDA/IOC/HAB/Viet Nam
Mangrove
DONOR
SEAFDEC
Fisheries
INTERGOVT
National Mangrove Commission
Mangrove
INTERGOVT
UNEP SCS/SAP Ver. 3 (24/2/99)
Page 65
USAID or State Dept.
Coral
GOVT.
5.3
Examples of Potential for Existing and Planned Investments
The costs of actions to address the causes of environmental degradation and threats
to the marine environment of the South China Sea were shown in Section 4 above. The
organisations in Table 5.1 are willing to collaborate in projects that have common aims or
that achieve mutually agreeable objectives. Costs that will be borne by these organisations
and "in kind" assistance have yet to be determined. This section will deal with examples
based on discussions that were carried out to determine possible partners in this programme
of action.
5.3.1 Regional
The International Coral Reef Initiative and Global Coral Reef Monitoring Network are
examples of organisations that have projects and a network throughout the Region. In this
case coral reefs are monitored by community groups, commercial diving agencies and
interested scientists. The results go on to a database held in Hongkong for dissemination to
countries that wish to know about the status of their reefs. Coral bleaching is recorded and
the level of health of monitored reefs. These data will be used in the programme to assist
with management and legislation decisions. The database held by IOC/GOT is also of use to
this programme.
5.3.2 National
The National Mangrove Committee of the National Research Council of Thailand in
cooperation with UNDP and UNESCO have a research station at Ranong in Thailand.
Although this is not in the South China Sea the mangroves and research are similar. This
research station together with a number of mangrove restoration sites in theGulf of
Thailand, will be used in the programme as part of the mangrove management work.
5.3.3 Donor Countries
Denmark, through the IOC-Danida, is supporting a Viet Nam project on toxic algal
blooms and their effect on shellfish. This project has funding of $2.4 million. Our programme
has a component based around preventing algal blooms caused by high nutrients and their
effect on the shellfish aquaculture trade.
There is an IOC-Westpac Cooperative Oceanographic Study in the Gulf of Thailand
supported by numerous organisations and donor countries. The project funding is $1.9
million over five years and this is the second year of the study. The governments of
Cambodia, Malaysia, Thailand and Viet Nam are taking part. The objectives of this project
are to strengthen the scientific capabilities of scientific institutes and government agencies
related to the management of the Gulf of Thailand.
A further project which could well be linked to this programme is one undertaken by
the Hong Kong University of Science and Technology in collaboration with research
institutes and government agencies on the Chinese Mainland and with academic institutions
in France and Hong Kong. The project will develop a real-time database of the status of
UNEP SCS/SAP Ver. 3 (24/2/99)
Page 66
specific pollutants, sediments, pesticides, heavy metals, harmful algal blooms and nutrient
levels in the Pearl River Estuary. The funding is an $18 million grant.
5.3.4 Non Government Organisations
The South China Sea Informal Working Group at the University of British Columbia
was instrumental in developing the proposal for a legal framework for this programme. Its
work is currently in the Gulf of Thailand on legal matters in association with SEAPOL and
START whose work is directly related to this programme. Their objectives include
developing large-scale cooperative research and ocean science policy, solving the problems
of overfishing in the Gulf, and resolving flooding problems and sealevel concerns.
5.3.5 United Nations Organisations
It is the objective of this Programme to support, facilitate and promote the capacity to
apply, develop and manage access to cleaner production technologies as well as best
available techniques and best environmental practice. The UNEP Regional Office of Asia
and the Pacific will collaborate to support this objective and its detailed projects will be used
to achieve requirements in this Programme. The environmental impact of industrial waste
discharged into marine environments must be understood to justify the expense and effort of
reducing these loads.
The actions required to build capacity to understand and act upon the issues
developed in this SAP are wide-ranging. Education of the community from politicians to
school children, illiterate fishers and research scientists takes many forms. The means by
which the actions, from electronic websites to hand held pictures demonstrating correct
practices, are conveyed depends on the level of sophistication of the target audience. At
most levels these educational aids and capacity builders, e.g. workshops, training groups,
should be in local languages.
A demonstration village site should be targeted. The villagers, through appropriate
educational means, should be taught about caring for their environment. After using the
relevant educational tools, the result should be monitored to determine if the exploited
ecosystem improved. This type of capacity building can be incorporated into a UNEP
NETTLAP project.
A UNDP/IMO GEF funded project on the East Asian Seas has two demonstration
sites in the South China Sea which can be used to develop the criteria for management
plans.
UNEP SCS/SAP Ver. 3 (24/2/99)
Page 67
6
PRIORITY REGIONAL AND NATIONAL ACTIONS TO ADDRESS THE CAUSES
OF ENVIRONMENTAL DEGRADATION AND THREATS TO THE ENVIRONMENT
OF THE SOUTH CHINA SEA.
In this section the priorities of the Strategic Action Plan are presented with
justification for their importance. The Programme cannot progress if these priorities are not
given the full support of governments, non-government organisations and the GEF.
6.1
Priorities
The following activities are listed, not necessarily in priority order, to demonstrate the
workbase and actions required to progress the Programme:
� Endorse a legal framework upon which to facilitate and commit governments to the
Strategic Action Programme, and relevant regional co-operation.
� Prepare maps and inventories of the marine resources in the South China Sea and
strategically coordinate monitoring of ecosystems and water pertinent to deciding on
action plans to achieve Programme goals.
� Develop a network of databases throughout the Region so that transboundary data can
be used to facilitate the Programme goals.
� Develop criteria for management plans for ecosystems and fisheries in the Region.
These management plans will be the framework around which the actions to achieve
Programme goals are based.
� Enhance capacity building in the form of education for all levels of the population, by
helping provide technology to the various activities, by assisting in changing philosophies
about environmental issues and assisting local people to achieve the aims of this
Programme past its completion date.
6.2
Examples of Actions that will fulfil some of the Objectives of the Strategic
Action Programme
6.2.1 Support a regional programme in cleaner production technologies and best
environmental practices.
Industrial and urban waste should be managed in a way that it has the least possible
effect on the marine environment. The industrial sectors of the SCS countries are still largely
at a low level of development and therefore need further support to enable them to be
environmentally sound while being able to develop in the competitive environment of the
global market economy. Industrial technologies need to adapt to suit local conditions. The
scope for technology transfer in relation to cleaner production technologies and best
environmental practices is important for the pollution reduction component of the SAP.
It is the objective of this Programme to support, facilitate and promote the capacity to
apply, develop and manage access to cleaner production technologies as well as best
available techniques and best environmental practice. The UNEP Regional Office of Asia
and the Pacific will collaborate to support this objective and its detailed projects will be used
to achieve requirements in this Programme. The environmental impact of industrial and
urban waste discharged into marine environments must be understood to justify the expense
and effort of reducing these loads.
UNEP SCS/SAP Ver. 3 (24/2/99)
Page 68
Urban waste, especially sewage, is a problem throughout the region. The extent of
the problem and its impact on marine ecosystems is not well known. This section should
coordinate and where, necessary initiate efforts to show the effect of sewage on the marine
environment. There are many projects underway which have identified the need to treat or
use sewage. The most efficient and environmentally sound treatment comes by reusing the
water and nutrients contained in sewage. The reuse requires in some case large areas of
land and comes with a human health consideration which must be addressed. Recharging
groundwater, growing crops or forests with treated sewage and single household treatment
plants are all ways of dealing with sewage and should be considered. It would be useful to
set up demonstration sites to determine the economic, ecological and cultural feasibility of
such proposals.
6.2.2 Monitoring of demonstration conservation sites
Capacity building, increasing public awareness, legislating for marine parks, and
managing the marine environment in a more organised and consistent way must show some
direct results. To determine if these management tools are, in fact, improving the marine
environment some form of monitoring or quality control must exist. Monitoring a
conservation site should be carried out to compare it with a non-conservation site and a
marine protected area. Conservation sites are those where local people have become
involved with conserving marine ecosystems. This comparison will show whether the
capacity building of local people has achieved one of its purposes.
6.2.3 Review national EIA regulations to promote greater public participation
Experience has shown that resource conservation actions can be successful only
when the local communities are actively involved. Participation of the local communities
needs to be a part of the planning and management processes at all stages. It is necessary,
therefore, to identify the stakeholders for each coastal zone resource, including the local
communities, non-governmental organizations working at the local level, private sector
concerns and local and national governments. All the stakeholders should be a part of the
implementation of Integrated Coastal Zone Management programmes to be established
under the SAP.
The objective of this section is to increase public awareness and participation. First,
the problem should be identified to the participants. By public debate and careful deliberation
among all parties, the alternative solutions to the problem should be reviewed. At this time
there should be open access to information on environmental impact assessment of
activities affecting the local environment, and open hearings in environmental impact
studies. This project should be carried out at a demonstration site, and the results of the
decisions made monitored to determine if these measures had an effect on the marine
environment, similar to 6.2.2 above. Public awareness is about disseminating the results of
established sites to other selected sites.
UNEP SCS/SAP Ver. 3 (24/2/99)
Page 69
It is recommended that countries review their Environmental Impact Assessment
(EIA) requirements and processes to incorporate, as far as possible, rules and procedures to
promote participation by the public and especially the stakeholders involved. EIA's should
also be taken seriously and reviewed and appraised by all stakeholders, especially scientists
who would review the rigor of the EIA.
6.2.4 Demonstration site for local community conservation activity
The actions required to build capacity to understand and act upon the issues
developed in this SAP are wide-ranging. Education of the community from politicians to
school children, illiterate fishers and research scientists takes many forms. The means by
which the actions, from electronic websites to hand held pictures demonstrating correct
practices, are conveyed depends on the level of sophistication of the target audience. At
most levels these educational aids and capacity builders, e.g. workshops, training groups,
should be in local languages.
A demonstration village site should be targeted. The villagers, through appropriate
educational means, should be taught about caring for their environment. After using the
relevant educational tools, the result should be monitored to determine if the exploited
ecosystem improved. This type of capacity building can be incorporated into a UNEP
NETTLAP project.
Also at the village level, over fishing and the use of inappropriate fishing gear is also
a problem. A demonstration site, where the use of push nets is prohibited and the prohibition
enforced, to show local fishermen that, even over two or three years this method is
unproductive, should be set up. Education in the way of local language flip charts and TV
programs could be used to help make the enforcement more palatable.
6.2.5 Develop guidelines on preparation of national plans for protection of marine and
coastal environments
The SAP provides a framework for planning actions to promote the sustainable use
of the SCS resources. However, the necessary actions will be taken at a national level so
countries need to integrate the proposals of the SAP in their planning and policies. At the
regional level, a set of guidelines for the preparation of national plans should be developed
and provided to the national planning agencies to implement. It is expected that successful
projects will be continued by the collaborators after GEF funding is finished whether they be
national agencies or other organizations interested in an improved marine environment
6.2.6 A regional GIS database and a mathematical model on pollution and its impact on
ecosystems
The need for a database and analytical models of the relevant ecosystems and their
pollutants should be ascertained by a scoping exercise in the region. Once the need is
verified a network of existing databases should be prepared with the aim of finding a set that
would implement and use modelling techniques to solve pollution problems.
From the TDA, it was obvious that there was a lack of data required for adequate
management of resources in the SCS. It is therefore of high priority that improved and more
relevant data be obtained and stored on a network of existing GIS-type databases for
resource inventory, monitoring and modelling. Such a network should conform to a regional
UNEP SCS/SAP Ver. 3 (24/2/99)
Page 70
standard, be accessible to all qualified users, and be linked to a process of decision-making
in each country so that it has a clear role in supporting the decision-making process.
It is difficult to manage and monitor ecosystems without knowing their extent and
floral and faunal community composition. Current mapping of underwater marine
ecosystems is not, generally, adequate in the Region. Mapping of underwater ecosystems
can be demonstrated at a site in one of the countries and the necessary processing for the
mapping and GIS-type products carried out at one of the existing GIS centres.
An overall framework for monitoring and analysis of pollution loads and their impacts
on water quality in the SCS, and their effects on the ecology of marine living organisms is a
priority to control pollution. It is recommended that an immediate effort be initiated to develop
an analytical tool, such as a mathematical model based on a GIS database, which will help
to establish the scientific framework for obtaining a resource inventory, monitoring and
analysis of pollution and its impact for the SCS as a whole. Databases throughout the region
should be linked such that the metadata and data are easily available and there is some
quality statement about the data. The National University of Singapore and the UNEP
Environmental Assessment Programme are willing to begin to form a network of databases
in the Region.
6.2.7 Collect information on trade in "minor" and endangered marine products
For those animals known to be under pressure such as turtles and dugongs and for
other less well known ones, like seahorses and stingrays there should be some
management plans. The main constraint on preparing actions to manage these resources is
the lack of information on the volume of trade and the ecological impact of the trade on
population size and habitat changes. More information is urgently required on these species,
in order to provide a basis of analysis and to prepare appropriate actions during the period of
the implementation of the SAP.
The trade of endangered species, the amount of uncontrolled industries based on
little known animals and generally data on smaller fisheries should be collected to determine
the impact that these collections have. The effect of loss of habitat on these organisms
should be determined as part of this section.