3 DESCRIPTION OF THE BASIN
3.1 Physical and Geographical Characteristics
The Dnipro Basin is a multi-sectoral region of natural and socio-economic importance. Not only does it contain natural resources of social value (e.g. water, land and forest resources) but it is also a valuable asset for a number of stakeholders including commercial, industrial and governmental organisations (e.g. industries, land users, water users, governmental bodies, regulatory and control authorities etc). It sustains major urban centres and a large number of small and medium-size towns.
The Dnipro River extends into the territories of three Eastern European countries, the Russian Federation, the Republic of Belarus and Ukraine. It is the third largest European transboundary watercourse after the Danube and the Volga, draining a basin of 511,000 km2, and the fourth longest river in Europe (2,200 km), next to the Ural, the Volga and the Danube. 19.8% of the Dnipro Basin is within the territory of the Russian Federation (about 100,500 km2), 22.9% in Belarus (116,400 km2), and the largest portion, or 57.3% is in Ukraine (about 291,400 km2). A map of the Dnipro Basin is shown in Figure 3.1 and a full description of the basin is provided below in the Dnipro Basin Passport.
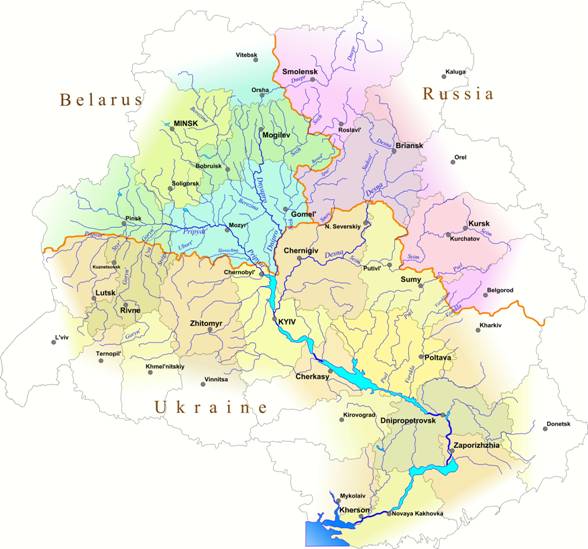 |
Figure 3.1 Map of the Dnipro Basin
DNIPRO RIVER BASIN PASSPORT
|
Geography and Nature Resources | |||
|
Total area of the Basin: |
511,000 km2 (catchment area is about 509,000 km2) | ||
|
Within the Republic of Belarus |
116,400 km2 (22.9%) | ||
|
Within the Russian Federation |
100,500 km2 (19.8%) | ||
|
Within Ukraine |
291,400 km2 (57.3%) | ||
|
Administrative and Territorial Division | |||
|
Oblasts |
30 | ||
|
By country: |
| ||
|
Districts |
385 | ||
|
By country: |
| ||
|
Cities/towns |
220 | ||
|
By country: |
| ||
|
Townships |
447 | ||
|
By country: |
| ||
|
Rural settlements |
28,020 | ||
|
By country: |
| ||
|
Land uses in the Dnipro Basin: | |||
|
Area of arable land |
55.4% (283,000 km2 ) | ||
|
Republic of Belarus |
29.2% (34,000 km2 ) | ||
|
Russian Federation |
42.8% (43,000 km2 ) | ||
|
Ukraine |
70.3% (206,000 km2 ) | ||
|
Forests |
33.8% (172,400 km2 ) | ||
|
Republic of Belarus |
48.6% (56,600 km2 ) | ||
|
Russian Federation |
31.6% (31,700 km2 ) | ||
|
Ukraine |
17.1% (87,100 km2 ) | ||
|
Wetlands |
% (km2 ) | ||
|
Republic of Belarus |
36% (41,900 km2, including area of drained land) | ||
|
Russian Federation |
1.8% | ||
|
Ukraine |
|||
|
Urbanised (built-up) area | |||
|
Republic of Belarus |
4.0% (4,700 km2 ) | ||
|
Russian Federation |
2.0% (2,000 km2 ) | ||
|
Ukraine |
3.9% (11,400 km2 ) | ||
|
Area of drained and irrigated land | |||
|
Republic of Belarus |
Drained area: 2 million ha | ||
|
Russian Federation |
Drained area: 0.38 million ha, irrigated area: 0.04 million ha | ||
|
Ukraine |
irrigated area: 2.6 (2.2) million ha Drained area: 2.5 million ha Total: 5.1 million ha | ||
|
Area of land contaminated by radionuclides: | |||
|
Republic of Belarus |
41,640 km2 (as of 2001, level of contamination by Cs-137 >1 Curie/km2) | ||
|
Russian Federation |
17,061 km2 | ||
|
Ukraine |
54,600 km2 | ||
|
Water bodies | |||
|
Republic of Belarus |
0.3% (400 km2 ) | ||
|
Russian Federation |
0.6% (600 km2 ) | ||
|
Ukraine |
3.9% (11,400 km2 ) | ||
|
Area of protected territories |
1.6% (8,100 km2 ) | ||
|
Republic of Belarus |
3.0% (3,100 km2 ) | ||
|
Russian Federation |
1.3% (1,300 km2 ) | ||
|
Ukraine |
1.1% (3,200 km2 ) | ||
|
Mineral Resources | |||
|
Republic of Belarus |
Oil: 60 deposits, 38 under exploitation, 13 under exploration, 9 suspended. Natural gas: annual extraction 252 million m3. Peat: 3 billion tonnes. Potassium salts: the Starobinsky deposit (capacity 5,698.0 million tonnes) is under exploitation. Rock salt: the Mosyr and Starobinsky deposits. Building stone: three deposits. Ferruginous quartzite: the Okolovsk deposit in Minsk Oblast (capacity about 500 million tons; average iron content 26%). Rare-metal deposit in the Gomel Oblast, containing ores used as a raw material for production of beryllium and rare-earth metals of cerium group. | ||
Russian Federation
|
The Upper Dnipro Basin within the Russian Federation has scarce fuel/energy resources, limited to small deposits of low-grade coal and peat. Bryansk Oblast: only peat is extracted in considerable quantity. Belgorod Oblast: major part of the iron-ore deposit (the Kursk Magnetic Abnormality) lies in this Oblast and extends into the Dnipro Basin, although mining sites/activities are located beyond the Basin. Kursk Oblast has a number of iron-ore deposits associated with the Kursk Magnetic Abnormality, the largest of them is the Mikhailovsky deposit containing up to 400 million tonnes of ore (iron content 58%) and 1 billion tonnes of ferruginous quartzite (iron content 30-40%). The Oblast has deposits of building materials (chalk, marl, sand, sandstone, clay, and tripoli. Smolensk Oblast has deposits of low-grade brown coal (410 million tonnes), peat, and building stone (estimated capacity 90 million m3). | ||
|
Ukraine
|
4,464 (or 57% of the country total) mineral resource deposits are located in the Dnipro Basin, 1,759 of them are exploited. Key mineral resources: oil, gas, brown coal and coal, peat, iron ore, manganese ore, titanium/zirconium ore, kaolin, bentonitic clay, building materials. The Dnipro Basin contains 29.5% of the country’s coal reserve, 53% of oil reserve, 67% of natural gas reserve, 84% of iron ore reserve, 85% of brown coal reserve, and 100% of titanium/zirconium ore reserve. Major mineral deposits located in the Dnipro Basin: the Kriviy Rih – Kremenchug iron ore deposit; the Nikopol manganese ore deposit; the Dnipro-Donetsk oil/gas deposit; the Dnipro lignite deposit; the Western Donbass coal deposit. In the Kriviy Rih area (the Right-bank of the Dnipro River), iron ore was extracted in 10 opencast mines and 23 mines (at present the majority of them are closed). The total area of all quarries is 40.5 km2, total void space is 6.5 km3, and their depth is up to 300 m. The depth of ore mines is up to 1,100 m. In the Kremenchug region (the left bank of the Dnipro River), 2 quarries are in operation, with volume 0.8 km3 each, and depth up to 150 m. Samara River Basin (left tributary of the Dnipro River), 10 coalmines in operation. The Dnipro-Donetsk oil/gas deposit (the Middle Dnipro Basin) has about 300 deposits; production output: 2.0 million tons of oil per year, 12 billion m3 of natural gas per year, and 1.0 million of gas condensate per year. The Dnipro brown coal deposit (the Middle Dnipro Basin): annual output is 1 million tonnes per year. Manganese ore deposit is located in the area of Nikopol, where 10 quarries and 7 mines are in operation. Titanium and zirconium ore deposits are concentrated in the Right-bank Dnipro tributary catchments in the Zhitomyr and Dnipropetrovsk Oblasts. | ||
Population | |||
|
Total (2001) |
32.4 million | ||
|
Republic of Belarus |
6.3 million (19.4%) | ||
|
Russian Federation |
3.6 million (11.1%) | ||
|
Ukraine |
22.2 million (68.5%) | ||
|
Urban population, million people (%): |
| ||
|
Rural population, million people (%): |
| ||
|
Average population density |
64 persons/km2 | ||
|
Republic of Belarus |
52 persons/km2 | ||
|
Russian Federation |
35.6 persons/km2 | ||
|
Ukraine |
75.7 persons/km2 | ||
|
Population growth in the Dnipro Basin | |||
|
Republic of Belarus |
- 25,000 persons/year (2000) | ||
|
Russian Federation |
- 35,900 persons/year (2000) | ||
|
Ukraine |
- 222,500 persons/year (average for 1995-2000) | ||
|
Life expectancy |
HDI Report, 2000 | ||
|
Republic of Belarus |
68.1 years | ||
|
Russian Federation |
66.7 years | ||
|
Ukraine |
69.1 years | ||
|
Economy | |||
|
Gross domestic product (GDP) | |||
|
Republic of Belarus |
Country total, in actual prices: 9,134 million BR | ||
|
Russian Federation |
95.9 billion RR (2000, the Dnipro Basin) | ||
|
Ukraine |
Country total, in actual prices: 172,952 million UAH (2000) | ||
|
GNP growth |
|||
|
Republic of Belarus |
105.8% | ||
|
Russian Federation |
105% (1999); 118% (2000) (the Dnipro Basin) | ||
|
Ukraine |
105.8% (2000) | ||
|
Real GDP per capita | |||
|
Republic of Belarus |
2,198 USD (1998) | ||
|
Russian Federation |
832 USD (2000, the Dnipro Basin) | ||
|
Ukraine |
873 USD (1998) | ||
|
GNP by sector | |||
|
Industry |
| ||
|
Agriculture |
| ||
|
Services |
| ||
|
Unemployment | |||
|
Republic of Belarus |
2.1% (2000) of the able-bodied population | ||
|
Russian Federation |
221,000 people | ||
|
Ukraine |
The ILO estimate: 2,707,600 people (2000, ); Officially registered: 1,155,200 people (2000) | ||
|
Industry | |||
|
Industrial output growth |
|||
|
Republic of Belarus |
107.8% Average annual growth in 1996-2000 was 10.5% (the country average; growth rate is similar in the Dnipro Basin) | ||
|
Russian Federation |
In 2000: –38% of 1990 level; or +19% of 1997 level | ||
|
Ukraine |
In 2001: 114.2%, when compared to the previous year | ||
|
Energy |
|||
|
Republic of Belarus |
109.3% | ||
|
Russian Federation |
In the Dnipro Basin: 46 billion kWh (2000) | ||
|
Ukraine |
Country total: 173 billion kWh (2001) | ||
|
Agriculture | |||
|
Republic of Belarus |
Average annual decrease in 1996-2000 was 6% | ||
|
Russian Federation |
In 2000: 68% of the 1990 level | ||
|
Ukraine |
Country total, % to the previous year: 114.2 % (2001) | ||
|
Water resources and uses (the Dnipro Basin) | |||
|
Surface waters | |||
|
| |||
| Internal flow |
|||
|
Mean annual flow |
16.9 km3/year | ||
|
Low-flow year (95%) |
10.7 km3/year | ||
|
External inflow |
|||
|
Mean annual inflow |
19.1 km3/year | ||
|
Low-water year inflow (95%) |
9.1 km3/year | ||
| Flow discharge |
|||
|
Mean annual discharge |
36.0 km3/year | ||
|
Low-flow year discharge (95%) |
19.8 km3/year | ||
|
Hydrographic network |
|||
|
Total length |
45,400 km | ||
|
| |||
| Internal flow |
|||
|
Mean annual flow |
15.5 km3 | ||
|
Low-flow year (95%) |
10.7 km3 | ||
| Flow discharge |
|||
|
Mean annual discharge |
15.5 km3 | ||
|
Low-flow year discharge (95%) |
10.7 km3 | ||
|
Hydrographic network (rivers) |
|||
|
Total length |
39,500 km | ||
|
| |||
| Internal flow |
|||
|
Mean annual flow |
22.1 km3 | ||
|
Low-flow year (95%) |
9.0 km3 | ||
|
External inflow |
|||
|
Mean annual inflow |
31.9 km3 | ||
|
Low-water year inflow (95%) |
22.1 km3 | ||
| Flow discharge |
|||
|
Mean annual discharge |
52.01 km3 | ||
|
Low-flow year discharge (95%) |
31.14 km3 | ||
|
Hydrographic network (rivers) |
15,423 rivers | ||
|
Total length |
78,500 km | ||
|
Groundwater (usable reserve) | |||
|
Projected reserve | |||
|
Republic of Belarus |
9.27 km3/year | ||
|
Russian Federation |
2.31 km3/year | ||
|
Ukraine |
12.80 km3/year | ||
|
Explored reserve | |||
|
Republic of Belarus |
1.117 km3/year | ||
|
Russian Federation |
0.681 km3/year | ||
|
Ukraine |
N/A | ||
|
Groundwater abstraction | |||
|
Republic of Belarus |
0.687 km3/year (2000) | ||
|
Russian Federation |
0.379 km3/year (2000) | ||
|
Ukraine |
1.027 km3/year (2000) | ||
|
Water resources per capita | |||
|
Republic of Belarus |
7,580 m3/person | ||
|
Russian Federation |
2,640 m3/person | ||
|
Ukraine |
3,520 m3/person | ||
|
Water reservoirs | |||
|
Quantity |
564 | ||
|
Water surface area |
775.6 km2 | ||
|
Capacity |
46.2 km3 | ||
|
|
102 reservoirs, water surface area 345 km2, capacity 1.044 km3 730 ponds, water surface area 93 km2, capacity 0.164 km3 | ||
|
|
Ponds: water surface area 180 km2 | ||
|
|
564 reservoirs, including 6 major ones, water surface area 688 km2, capacity 43.8 km3 13,283 ponds; water surface area 12 km2, capacity 1.8 km3 | ||
|
Total annual freshwater consumption (2000) |
10.68 km3/year | ||
|
|
1.040 km3/year | ||
| Industry (%) |
29.0%, or 0.302 km3/year | ||
|
Agriculture (%) |
8.7%, or 0.090 km3/year | ||
|
Of that, irrigation |
0.4%, or 0.004 km3/year | ||
|
Municipal sector (%) |
43.8%, or 0.455 km3/year | ||
|
Other sectors (%) |
18.1% | ||
|
|
Total volume used: 0.715 km3/year | ||
| Industry (%) |
Extracted 55.4% (0.396 km3/year) | ||
|
Of that, energy |
36.5% (0.261 km3/year) | ||
|
Agriculture (%) |
15% (0.107 km3/year) | ||
|
Of that, irrigation |
0.4% (0.003 km3/year) | ||
|
Municipal sector (%) |
28.2% (0.202 km3/year) | ||
|
|
8.87 km3/year | ||
| Industry (%) |
58% | ||
|
Agriculture (%) |
14.9% | ||
|
Of that, irrigation |
9.7% | ||
|
Municipal sector (%) |
22.1% | ||
|
Other sectors (%) |
5% | ||
|
Average annual water consumption per capita (2000) | |||
|
Republic of Belarus |
204 l/day per capita | ||
|
Russian Federation |
0.249 km3/year (domestic/potable consumption) 0.283 km3/year (industrial consumption) | ||
|
Ukraine |
N/A | ||
|
Wastewater discharge (point sources) (2000) | |||
|
Republic of Belarus |
0.818 km3/year | ||
|
Russian Federation |
0.425 km3/year (0.243 km3/year of polluted wastewater) | ||
|
Ukraine |
5.6 km3 | ||
|
Level of flow regulation |
| ||
|
Flow diversion to other basins | |||
|
Republic of Belarus |
2 schemes (0.29 km3/year) | ||
|
Russian Federation |
None | ||
|
Ukraine |
6 channels, 5 water ducts, 3.14 km3/year (2000) | ||
|
Water losses at transportation (2000) | |||
|
Republic of Belarus |
380 million m3/year | ||
|
Russian Federation |
22 million m3/year | ||
|
Ukraine |
1,660 million m3/year | ||
| Biodiversity | |||
|
Rare and endangered species | |||
|
Republic of Belarus |
214 plant species, 97 vertebrate species, 85 invertebrate species | ||
|
Russian Federation |
Species included into the Red Data Book: 22 plant species, 7 invertebrate species, 26 vertebrate species | ||
|
Ukraine |
|||
Water Protection | |||
|
Water protection expenditures | |||
|
Republic of Belarus |
49,240 million BR (61. 5 million USD) | ||
|
Russian Federation |
75 million RR (2.4 million USD) | ||
|
Ukraine |
136.6 million UAH (25.5 million USD) (2000) | ||
|
International Agreements in the Field of Environment Protection | |||
|
Republic of Belarus
|
United Nations Framework Convention on Climate Change (UNFCCC), Convention on Biological Diversity, Convention on Wetlands, Convention on Wetlands of International Importance Especially as Waterfowl Habitat, Convention on Long-Range Transboundary Air Pollution, Vienna Convention for the Protection of the Ozone Layer, Convention on Environmental Impact Assessment in a Transboundary Context, Stockholm Convention on Persistent Organic Pollutants, UN Convention on Climate Change, Convention on the International Trade in Endangered Species of Wild Flora and Fauna (CITES), Convention on Access to Information, Public Participation in Decision-Making and Access to Justice in Environmental Matters, Declaration of the United Nations Conference on Environment and Development, NIS Agreement on Cupertino in the Field of Ecology and Environment Protection | ||
|
Russian Federation |
United Nations Framework Convention on Climate Change (UNFCCC), Convention of the World Meteorological Organisation, Convention Concerning the Protection of the World Cultural and Natural Heritage, Convention on Wetlands of International Importance Especially as Waterfowl Habitat, Convention on Long-Range Transboundary Air Pollution, Vienna Convention for the Protection of the Ozone Layer, Convention on the Control of Transboundary Movements of Hazardous Wastes and Their Disposal, Convention on Environmental Impact Assessment in a Transboundary Context, Stockholm Convention on Persistent Organic Pollutants, Convention on Biological Diversity, Convention of the Protection and Use of Transboundary Watercourses and International Lakes, Convention on the Prevention of Marine Pollution by Dumping Wastes and Other Matter, Convention on the Protection of the Black Sea Against Pollution, Convention on the International Trade in Endangered Species of Wild Flora and Fauna (CITES), Convention on the Transboundary Effects of Industrial Accidents, Convention on Access to Information, Public Participation in Decision-Making and Access to Justice in Environmental Matters (observer status), Convention on Conservation of European Wild Fauna, Flora and Natural Habitats (observer status), Convention on the Conservation of Migratory Species of Wild Animals (observer status), Declaration of the United Nations Conference on Environment and Development, NIS Agreement on Cupertino in the Field of Ecology and Environment Protection | ||
|
Ukraine |
United Nations Framework Convention on Climate Change (UNFCCC), Convention of the World Meteorological Organisation, Convention for the Protection of the Ozone Layer, Convention Concerning the Protection of the World Cultural and Natural Heritage, Convention on Wetlands of International Importance Especially as Waterfowl Habitat, Convention on Long-Range Transboundary Air Pollution, Vienna Convention for the Protection of the Ozone Layer, Basel Convention on the Control of Transboundary Movements of Hazardous Wastes and Their Disposal, Convention on Environmental Impact Assessment in a Transboundary Context, Stockholm Convention on Persistent Organic Pollutants, Convention on Biological Diversity, The Convention of the Protection and Use of Transboundary Watercourses and International Lakes, Convention on the Prevention of Marine Pollution by Dumping Wastes and Other Matter, Convention on the Protection of the Black Sea Against Pollution, Convention on the International Trade in Endangered Species of Wild Flora and Fauna (CITES), Convention on Conservation of European Wild Fauna, Flora and Natural Habitats, Convention on the Conservation of Migratory Species of Wild Animals, Convention on Access to Information, Public Participation in Decision-Making and Access to Justice in Environmental Matters, Declaration of the United Nations Conference on Environment and Development, NIS Agreement on Co-operation in the Field of Ecology and Environment Protection | ||
3.1.1 Water resources and major water bodies in the Basin
Surface waters
The water resource of the Dnipro Basin is formed of river flow and groundwater sources, as well as other water inputs from outside the Basin. It is a typical lowland river rising at the Belsky Upland on the outskirts of the Smolensk Oblast, near the village of Kletsovoe located close to the administrative border with the Tver Oblast.
The Dnipro River is generally divided into three reaches:
· The Upper Dnipro, from the river source to Kyiv (1,320 km)
· The Middle Dnipro, from Kyiv to Zaporizhzhia (555 km)
· The Lower Dnipro, from Zaporizhzhia to the estuary (325 km)
The major Dnipro tributaries are shown in Table 3.1, together with the countries and reach with which they are associated.
Rainfall is stable and heavy in the upper reach (the Forest zone), becoming unstable in the middle reach (the Forest/Steppe and Steppe zones) and scarce in the lower reach (the Steppe zone), to the extent that there is a deficit of available water resources.
The Upper Dnipro Basin occupies the major part of the Central Russian Region, where the environmental situation is relatively favourable. All rivers have twisting channels, slow flow velocities and a high-water period in spring and low-water period in summer. In the south, the Upper Dnipro Basin extends into the Belorussian Polessie, located in the Central Berezina Plain and in the southern part of the Orsha-Mogilev Plateau.
The Middle and Lower Dnipro Basin consists of extensive lowland areas of alluvial and granular unfixed sands. A chain of reservoirs (the Kyiv, Kremenchug, Dniprodzerzhinsk, Dniprovsky and Kakhovka reservoirs dominates the Middle and Lower Dnipro (from the Pripyat River inflow to Kakhovka)). Very little of the natural channel remains downstream of Dniprodzerzhinsk. In its middle and lower reaches, the Dnipro crosses the Trans-Dnipro Upland, which extends along the Middle Dnipro itself, and the Ukrainian Crystalline Shield between Dnipropetrovsk and Zaporizhzhia. In the south of Ukraine, the Dnipro Basin extends into the Black Sea Lowland.
Table 3.1 The major Dnipro tributaries
|
Major Dnipro tributaries |
Countries |
Reach |
| Berezina River |
Belarus |
Upper |
| Pripyat River |
Ukraine, Belarus, Ukraine |
Upper |
| Desna River |
Russia, Ukraine |
Upper |
| Psyol River |
Russia, Ukraine |
Middle |
| Vorskla River |
Russia, Ukraine |
Middle |
| Inhulets River |
Ukraine |
Lower |
The Dnipro River is fed from several sources, mainly collecting its flow in the upper section in the form of snowmelt water (50%), groundwater (27%) and rainstorm water (23%). The proportion of the snowmelt water contribution progressively grows downstream, whereas inputs of rainstorm water diminish.
The mean flow discharge rate near Kyiv is 7,000 m3/s (with a maximum of 25,000 m3/s, and minimum of 200 m3/s). The mean annual flow discharged into the Black Sea is 53 km3 at the average rate of 1,670 m3/s (with a maximum of 73 km3 in a wet year and a minimum of 24 km3 in a dry year). In the upper section of the Dnipro River, total annual flows vary within a narrow margin from year to year, exceeding the annual normal flow by 1.5-2-fold in a wet year or falling below the annual normal flow by a factor of 0.5-0.7 in a dry year. The spring flow contributes about a half of the total annual flow. The spring flood period has always been well pronounced with 60-70% (and up to 80%) of the total annual flow being discharged in spring, followed by an extremely low-water period in summer. Further potential flood periods can occur in the autumn (during heavy rainfall) or winter (during thawing). Overall, the summer and autumn flow contributes 25-35% of the total annual flow, with winter flow ranking next (10-20%). Tables 3.2 and 3.3 provide information on regional river-flow distribution patterns.
The surface water resource is distributed extremely unevenly over the territory of the Basin, with the upper part of the Basin (Russia and Belarus) enjoying the highest level of water availability (over 200,000 m3/year per 1 km2 in the average year). In the Pripyat and Desna River Basins, water resource availability per unit area ranges from 110,000 to 120,000 m3 per year, whereas it progressively decreases in the Lower Dnipro Basin to 35,000–40,000 m3.
The Dnipro River freezes over in December, and ice cover generally remains from January to March. It starts breaking up in early April in the upper reaches, in mid-March in the middle reaches and in early March in the lower reaches.
The river system of the Dnipro Basin has been regulated with a large number of reservoirs, channels, conduits, ponds, dams and locks/gates. Overall, 564 reservoirs have been constructed in the Basin with a total area of 775.6 km2 and a capacity of 46.2 km3. Within the Russian part of the Basin, there are 25,000 artificial reservoirs with a total area of 180 km2. In Belarus, 102 reservoirs have been constructed on the watercourses draining the Dnipro Basin, with a total water surface area of 345 km2 and capacity of 1,044 million m3. Of that, 55 reservoirs (with a water surface area of 206 km2 and a capacity of 585 million m3) and 730 ponds (with a water surface area of 93 km2 and capacity of 164 million m3) are located in the Pripyat River Basin.
Within Ukraine the flow of the Middle and Lower Dnipro is regulated by a chain of six major reservoirs constructed between 1965 to 1976 (the Kyiv, Kanev, Kremenchug, Dniprodzerzhinsk, Dniprovsky and Kakhovka reservoirs). These six reservoirs have a total area of 688 km2 and a maximum capacity of 43.8 km3. In addition, 13,283 ponds have been constructed along the Dnipro Basin watercourse with a total area of 12.0 km2 and a capacity of 1.8 km3. Six major channels and 5 conduits have also been constructed to supply water from the Dnipro River to dry regions within the country.
Groundwater
The total projected groundwater resource available in the Basin is approximately 24 km3, with over 13 km3 being hydraulically isolated from the surface water flow.
The projected groundwater resource available in the Russian part of the Dnipro Basin is 2.31 km3/year with an actual daily consumption rate of 1,832,000 m3. Over 50% of the regional demand for drinking water is covered from such sources. The level of groundwater reserve drawdown in this part of the Basin is below 2.0% and the groundwater resource distribution pattern is extremely uneven with the deficit becoming more and more obvious in some areas. The groundwater resource available in the Belorussian part of the Dnipro Basin is 9.27 km3/year. In Ukraine, the projected groundwater resource is 12.8 km3. Of that, 4.7 km3 is hydraulically isolated from the surface flow, and accounted for respectively in the water budget.
3.1.2 Land resource
Historically, the land resource of the Dnipro Basin has been intensively used for a number of different purposes (Figure 3.2). Three fifths of the Basin area have lost their original natural landscape features as a result of highly intensive land use. About 50% of the territory is occupied by agriculture, the majority of which is arable farmland occupying an area of 38,500,000 hectares. Of that, 20.8% is in Russia, 18.5% in Belarus, and 60.7% in Ukraine, the major agricultural land user in the Basin.
Table 3.2 River flow distribution pattern in the Dnipro Basin
|
Basin Section |
River flow distribution between the countries, % of the total annual river flow in the Basin |
|||||||
|
Belarus |
Russia |
Ukraine |
||||||
|
Average year |
Water-scarce year |
Average year |
Water-scarce year |
Average year |
Water-scarce year |
|||
|
Source/Russian border |
- |
- |
6.9 |
7.3 |
- |
- |
||
|
Russian border/Ukrainian border * |
20.5 |
24.1 |
6.9 |
7.0 |
0.2 |
0.2 |
||
|
Pripyat River Basin |
11.7 |
12.2 |
- |
- |
14.0 |
11.6 |
||
|
Kyiv reservoir tributaries ** |
0.3 |
0.2 |
- |
- |
2.5 |
1.7 |
||
|
Desna River Basin |
- |
- |
13.8 |
16.9 |
5.8 |
3.2 |
||
|
Kanev and Kremenchug reservoir tributaries *** |
- |
- |
- |
- |
5.9 |
3.6 |
||
|
Tributaries in the section between the Kremenchug HPS and Kakhovka HPS |
- |
- |
2.2 |
3.3 |
7.8 |
8.5 |
||
|
Tributaries downstream of Kakhovka HPS |
- |
- |
- |
- |
1.5 |
0.2 |
||
|
Total in the mouth section, million m3 |
16921 |
11367 |
15503 |
10724 |
19586 |
9023 |
||
|
Total in the mouth section, % |
32.5 |
36.5 |
29.8 |
34.5 |
37.7 |
29.0 |
||
|
* ** *** |
Pripyat, Desna, Psyol and Vorskla are not included Teteriv, Irpin etc. Sula, Ros etc. | |||||||
Table 3.3 River water resource distribution pattern in the Dnipro Basin
|
Basin Section |
Flow input into the section, million m3 |
Flow generated within the section, million m3 | |||
|
Average year |
Water-scarce year |
Average year |
Water-scarce year | ||
|
Source/Russian border |
- |
- |
3566 |
2269 | |
|
Russian border/Ukrainian border * |
3566 |
2269 |
14391 |
9744 | |
|
Pripyat River Basin |
- |
- |
13298 |
7378 | |
|
Kyiv reservoir tributaries ** |
31255 |
19391 |
1501 |
593 | |
|
Desna River Basin |
- |
- |
10229 |
6242 | |
|
Kanev and Kremenchug reservoir tributaries *** |
42985 |
26226 |
3061 |
1137 | |
|
Tributaries in the section between the Kremenchug HPS and Kakhovka HPS |
46046 |
27363 |
5167 |
3681 | |
|
Tributaries downstream of Kakhovka HPS |
51213 |
31044 |
797 |
70 | |
|
Total in the mouth section, million m3 |
- |
- |
52010 |
31114 | |
|
* ** *** |
Pripyat, Desna, Psyol and Vorskla are not included Teteriv, Irpin etc. Sula, Ros etc. | ||||
Approximately 10% of the Basin area has been designated for land reclamation purposes, 4% is occupied by urban centres and about 1-4% has been lost due to construction of reservoirs and impoundments.
 |
The Russian part of the Upper Dnipro Basin occupies the central, western and southwestern parts of the Central Russian Upland, mainly consisting of extensive areas of hills and plains intersected by lowland rivers, gorges and valleys. Soil cover in this part of the Basin is represented by fertile loamy soils lying in the north, dark-grey and grey forest soils in the western part of the Central Russian Upland, and very fertile black-earth soils in the south-west.
Of the total area of the Russian part of the Dnipro Basin, 52% (or 5.3 million hectares) is used for agricultural purposes (of that, 4.3 million hectares is used for arable agriculture). In Russia, the area of agricultural land has reduced over recent years. This is due to a number of factors including land conversion to non-agricultural uses, loss of cultivatable land due to an increase in shrubs, and mineral resource and peat extraction operations. As much as 600,000 hectares of farmland have been affected by water erosion and over 400,000 hectares have been classified as areas susceptible to erosion.
The Belorussian section of the Dnipro Basin (116,400 km2) is occupied by 44.7%, or 5.2 million hectares of agricultural land. Of this, 3.4 million hectares is used for arable agriculture, 0.8 million hectares is designated as grassland, and 0.9 million hectares is used as pastures.
The Belorussian Polessie, extending into the southern part of Belarus mainly consists of lowland wetlands and marshes and represents one of the major wetland resources in Europe. Between the mid-1960s to 1980s, a major land drainage scheme was implemented in this part of the Basin to provide over 2 million hectares of land for agriculture, which has led to a loss of over 50% of the natural wetland area. Currently, former peat bog soils in this area have become depleted, leading to a continuous reduction of crop productivity. Land drainage activities have had a profound impact on the environment, manifested in large-scale soil erosion, land degradation and a higher susceptibility to flooding effects resulting in the contamination of water resources.
Radioactive contamination is considered to be the major environmental problem in the Belorussian part of the Dnipro Basin. Extensive areas of agricultural land were contaminated by 137Cs as a result of the Chornobyl accident and 265,400 hectares were withdrawn from agricultural use for this reason. Approximately 1.2 million hectares of Belorussian agricultural land contaminated by 137Cs (>1 Ci/km2) is located in the Dnipro Basin (Figure 3.3).
 |
The land resource of the Ukrainian part of the Dnipro Basin is 29.14 million hectares, or 48.6% of the country territory. Of that, 32.8% lies in the Ukrainian Polessie zone, 39.9% in the Forest Steppe zone and 26.6% in the Steppe zone. Generally, the land resource within the Forest Steppe and Steppe zones has been intensively used for arable agriculture, urban and industrial development purposes.
Intensive agricultural and industrial activities, transport network development, urbanisation and industrialisation have all led to a degradation of the land resource. This has resulted in the progressive deterioration of the environment due to increasing anthropogenic pressures and has had a profound effect not only on this resource, but also on the state of the Dnipro River itself.
3.1.3 Forests
Forests are distributed unevenly in the Dnipro Basin. They are mainly concentrated in the upper part of the basin and less dominant in the lower where forest cover is limited to relatively small artificial plantations and wind break strips surrounding agricultural fields.
The upper part of the Dnipro Basin within the Russian Federation mainly consists of unevenly distributed mixed forests occupying an area of 3.2 million hectares. The main tree species consist of pine (the most valuable species in the Basin) birch and aspen. Other widely occurring species are oak, black alder, ash and maple. The maintenance and conservation of many non-commercial forest plantations in this region needs to be urgently addressed. For example, wooded belts that offer protection along motorways, railroads, power lines, gullies, agricultural lands and parkland in urban areas are being removed at an alarming rate.
Forests lying within the Belorussian part of the Dnipro Basin occupy 5.7 million hectares or 48.6% of the total area. Of this, 4.6 million hectares is woodland with an estimated timber stock of 799.4 million m3 (or 59.6% of the total from the Republic) and a further 82.5 million m3 of mature and over-mature wood stock.
Over 25.6% (or 1.7 million hectares) of Belorussian forest was contaminated by radioactive substances as a result of the Chornobyl accident and the major proportion of this lies within the Dnipro Basin. Of the total contaminated area of forests, 89.3% is within radioactive danger zone 1 (i.e. the pollution level is between 1 and 5 Ci/km2 of 137Cs), 8.4% is within zone 2 (5 to 15 Ci/km2), and 2.3% is within zone 3 (above 15 Ci/km2).
In all, 166,800 hectares of forest have been withdrawn from commercial use with a further 320,200 hectares being operated in a limited capacity.
Forests occupy about 5 million hectares in the Ukrainian part of the Dnipro Basin, sustaining an estimated standing timber stock of 890 million m3. Average forest coverage is relatively low (17 %), varying from 25% in the Upper Dnipro Basin, to 15% and 7% in the Middle and Lower Dnipro Basin, respectively. Protective forest plantations play a significant environmental role in the Lower Dnipro Basin, although their proportion is extremely low, i.e. 1%, or approximately 40,000 hectares.
The natural forest resource of the Ukrainian part of the Basin is in a poor state as it is mainly located within areas directly impacted by industrial activities. As a result of the Chornobyl accident, radionuclide contamination has affected 2.5 million hectares of forests in Ukraine and about 200,000 hectares have been withdrawn from use. The major part of the withdrawn forests (over 165,000 hectares) is located within the exclusion zone.
3.1.4 Mineral resources
The resource base of the upper part of the Basin (within the Russian Federation) is rather scarce and limited to relatively small deposits of low-grade coal and peat. However, the rich and diverse mineral resource base in the Belorussian and Ukrainian parts of the Dnipro Basin have driven the large-scale development of mining and processing industries.
The major mineral resource base of Belarus is concentrated in the Dnipro Basin, particularly in the Pripyat Saddle, supplying raw materials and mining products (e.g. potassium salt and rock salt) to internal and external markets. There are also considerable oil and gas reserves in this part of the basin. Overall, there are 60 oil fields, of which 38 are being developed, 13 explored and 9 temporarily closed. Annual production of natural gas was reported to be about 252 million m3. Moreover, the mineral resource potential of the Belorussian part of the Dnipro Basin is yet to be fully realised. In addition, there are also substantial reserves of peat in this part of the Basin with an estimated capacity of about 3 billion tonnes, although actual production is significantly lower.
A significant proportion of the national mineral resource of Ukraine is also concentrated in the Dnipro Basin, and together with the related mining industries is one of the major contributors to waste generation and environment pollution. Of 7,829 mineral resource deposits registered with and accounted for in the State Mineral Resource Budget of Ukraine, 57% are located in the Dnipro Basin and 53% of the total number are being exploited. The most important mineral resources are oil and gas; coal; peat; iron, manganese and titanium/zirconium ores; kaolin; bentonite clay; and a broad spectrum of building materials (e.g. cement, rough and crushed stone, ceramic materials). Figure 3.4 shows the contribution of mineral reserves in the Dnipro Basin to the Ukrainian national mineral resource.
In the Kriviy Rih area (on the Right bank of the Basin), iron ore was historically extracted at 10 quarries and 23 mines, most of which have recently closed. The total area of all quarries is 40.5 km2, with a void space of 6.5 km3, and depths as great as 300 metres. There are also 44 mining waste disposal sites, occupying an area of 69 km2 with a total waste volume of 1.64 km3. A further 1.4 km3 of ore enrichment process waste is stored at waste disposal sites for mine tailings.
Near Kremenuchug (on the left bank of the Basin), there are 2 operational quarries which have a void space of 0.8 km3 and depth of up to 150 m, together with 11 waste disposal sites for mine tailings covering an area of 5.4 km2. There is also a sludge storage site of approximately 14 km2 located directly within the Vorskla River floodplain. This site has caused progressive salinisation and contamination of the alluvial aquifer associated with the Dnipro River. Sludge fields and tailing waste disposal sites are inherent to the ore enrichment and agglomeration industries concentrated in the Kriviy Rih and Kremenchug areas. The length of each site varies from 4 to 10 km, with widths ranging from 2 to 5.5 km.
The storage of waste and the continued pumping of saline wastewater from mines and quarries (up to 50 million m3 per year) has led to concern over increasing levels of pollution in the Lower Dnipro and Dniprovsky Liman (the Dnipro Estuary). Average mineralisation in these waters is 12 g/l, although levels of up to 46 g/l have been reported.
 |
In the Samara river basin (a tributary of the Dnipro) 10 mines are operated which have generated over 20 million m3 of mining waste. This is accumulated in 13 waste storage sites with a total area of over 100 hectares. In the Nikopol manganese ore field, 10 quarries and 7 mines are in operation. The waste material generated over the operational life of these is stored at 15 sludge disposal sites.
The Dnipro/Donetsk oil and gas field, extending along the left bank of the Middle Dnipro in the form of wide strip (50-100 km), is the largest petroleum-producing region in Ukraine. It contains about 300 deposits (including mixed oil/gas fields) and production has recently stabilised at 2.0 million tonnes of oil, 12 billion m3 of gas, and 1.0 million tonnes of gas condensate per year.
3.1.5 Biological resources
The Dnipro Basin is a unique Eastern European ecosystem sustaining a rich biological diversity and featuring an ecological network with a stable pattern of natural processes. The catchments of the Dnipro River and its tributaries contain various interacting micro-ecosystems that play a major role in maintaining and conserving biodiversity at the national and European level. The Pripyat River Basin in the Belorussian Polessie region and the Dnipro Basin floodplain are typical examples of this ecosystem. The great value of the Pripyat River floodplain is illustrated by the fact that it sustains a virtually undisturbed river floodplain system. It has the only remaining floodplain forest within the whole Dnipro Basin and is unique in terms of its geographic location, the forest wood/under wood pattern and its flora diversity.
The Dnipro Basin has been recognised as one of the major wetland areas in Europe. It provides a habitat for various birds and animals and is a powerful barrier against flooding events and water percolation. It also operates as a major carbon sink. Sections of the Basin also enjoy international recognition and special protection under the Ramsar Convention. These include the Mid Pripyat State Landscape Zakaznik, the Pripyat River floodplain and the Dnipro River Delta.
Biodiversity in the Basin consists of over 90 fish species (60 of them inhabiting the Dnipro River itself); approximately 182 bird species; and over 2,500 plant species.
3.1.6 Nature reserves and protected areas
The Dnipro Basin sustains a rich and diverse biological resource much of which is within nature reserves and protected areas. There are more than 35 nature reserves and protected areas in the Dnipro Basin occupying about 1.6% (8,100 km2) of the catchment area, with one quarter of these being of man-made origin. Due to severe budgetary constraints, an adequate protection regime has not been properly maintained in the majority of these areas.
Within the Russian Federation, nature reserves and protected areas occupy 1.3% of the Basin territory. The existing nature reserve capacity is not adequate to ensure full protection and conservation of rare plant and animal species, and their communities.
Since 17th century, 238 species were lost in Belarus as a result of human activities and changes in abiotic factors. Large-scale land drainage schemes implemented in the Belorussian part of the Dnipro Basin over the past decades have resulted in the loss and/or shrinkage of a number of valuable and unique woodland communities of oak, ash, lime, black alder, and elm, as well as specific flora and fauna systems. Over the past 100 years, 25 higher vascular plants were reported to have become extinct and 40 animal species have lost their habitats.
Within Ukraine, the Dnipro River floodplain from the Pripyat River mouth to Kakhovka has lost most of its natural features as a result of the transformation of the main stem of the river into a series of reservoirs. Large areas of natural vegetation have been inundated following the filling of these reservoirs, which has resulted in significant changes in the Dnipro Basin ecosystem. Very little of the natural river channel remains. That which does is restricted to the Dnipro Delta, downstream of Kherson, and to short lengths of the Dnipro floodplain connecting the reservoirs (e.g. the Bila Tserkva reed marshes near Kremenchug; the Kanev nature reserve area; and the lower reach of the Dnipro downstream of the Kakhovka reservoir dam). Nature reserves and protected areas occupy 318,700 hectares within the Ukrainian part of the Dnipro Basin, accounting for 31% of the total area of nature reserves and protected territories within Ukraine. These include 2 biosphere reserves, 5 nature reserves, 3 national parks and 27 sites of outstanding historical/cultural/architectural value.
Generally, the state of biological resources sustained by forests, wetlands and steppes in the Dnipro Basin is rather poor and is subject to a number of anthropogenic impacts, particularly within the territory of Ukraine. The biological resources of the Dnipro Basin have been and continue to be depleted at an alarming rate, and urgent actions are needed to protect them in order to improve the environmental situation in the Basin.
3.2 Socio-economic situation
In relation to Eastern Europe as a whole, the Dnipro River Basin has a medium population density. The estimated population of the Basin at the beginning of 2001 was about 32.4 million people (Table 3.4), or about 16% of the total population of the Russian Federation, Belarus and Ukraine.
Table 3.4 Population of the Dnipro River Basin (as of 1/1/2001)
|
Population |
Unit |
Belarus |
Russia |
Ukraine |
Dnipro Basin |
|
Total population |
Million people |
6.3 |
3.6 |
22.2 |
32.4 |
|
Rural population |
% |
27 |
33.3 |
32.8 |
30.7 |
|
Urban population |
% |
73 |
66.7 |
67.2 |
69.3 |
Broken down by country, the population of the Dnipro Basin varies from 3.6 million people living in the Russian Federation to 22.2 million people living in Ukraine. About 69% of the Dnipro Basin population live in urban areas, with the main conurbations located along the Dnipro River itself.
The population density in the Dnipro Basin (63 people/ km2) is higher than the country averages of Russia and Belarus (35.6 and 53 people/ km2, respectively), and lower than that of Ukraine (76 people/km2) with population density increasing downstream (Figure 3.5).
Figure 3.5 Population density in the Dnipro Basin, people/km2
3.2.1 Demographic processes
The transition to a market economy appears to have had significant demographic consequences in terms of increased mortality rate, reduced birth rate, and a negative balance of migration. All these have contributed to the obvious population decline in the region.
The following major demographic trends have emerged over the last decade, being characteristic for the Dnipro Basin and each country as a whole:
· A decline in the total number of population;
· An increase in the urban population;
· A reduction in the rural population.
The demographic situation in the upper part of the Dnipro Basin is characterised by a negative population growth and a decline in birth rates. In 2001, the net population reduction expressed as the difference between the number of births and deaths in the Russian part of the Dnipro Basin was 37,362. In comparison, the net reduction was 5,600 in 1990, and 5,508 in 1995.
There has also been a downward trend in the demographic situation in the Ukrainian part of the Dnipro Basin. Since 1995 to 2000, the Basin population has declined by 1,122,500 people, with an average annual net decline of 222,500 persons. Population reduction is reported to be due to natural causes in all Oblasts located in the Dnipro Basin with the highest rate of decline in the northeastern part (11.6 per 1,000 persons). Radioactive contamination is a significant contributor to increased mortality due to malignant tumours. This is particularly the case for the population living in the Zhitomyr, Kyiv, Rivne, Sumy and Chernihiv Oblasts.
3.2.2 Migration processes
Historically, there has been significant migration exchange among the three riparian countries. For example, about 90% of migrants to Belarus are citizens of Russia and Ukraine. The migration pattern has changed over recent years and now includes refugees and emigrants from other republics of the former USSR. Migration processes have always been inherent to the Belorussian part of the Dnipro Basin providing a buffer zone between the Russian Federation and Ukraine.
Since the Chornobyl accident, migration processes in the Russian part of the Dnipro Basin have become more pronounced. The increased outflow of people has resulted in an uneven age pattern and a progressive population decline. Although this is in part due to migration, the migration rate stabilised in the mid-90s, and natural causes have now become a major factor of population reduction.
In Ukraine, migration intensity generally increases from the southwest via the north to the southeast. In 2000, the migration intensity in the Dnipro Basin was reported to be slightly higher than the country average (34%, as compared to 32.9%). Like the country as a whole, the Dnipro Basin has a negative balance of migration, although the value of the migration reduction coefficient is 1.5-fold lower than the average in Ukraine (0.6, as compared to 0.9). This is mainly due to two areas of the Dnipro Basin, which have a positive balance of migration (Kyiv and the Poltava Oblast).
3.2.3 State of economy in the Dnipro Basin
The Dnipro Basin is a complex river system of high economic value, sustaining a large multi-sectoral economy that relies heavily on, and impacts the environment and water resources of the Basin.
Several factors have shaped the economic development of the Dnipro Basin with the Basin geography playing a major role. Urban areas have historically developed along the main stem of the Dnipro River where the regional industrial centres have been concentrated. In the main these have been represented by heavy chemical, metallurgical and agro-industries which have posed a continuous threat of environmental pollution.
Land resource in the Basin has been extensively used for large-scale agricultural development schemes. This has included extensive conversion of land to agriculture regardless of its fertility, ploughing-up areas with unsuitable soils, large-scale land drainage and irrigation schemes, and construction of major livestock breeding industries. Again, all have contributed to environmental degradation of the Dnipro Basin.
 |
The economy of the Belorussian part of the Dnipro Basin is a fairly typical reflection of the national economic pattern of Belarus, dominated by a centralised command-and-control management approach. In 1995-2000, government interventions into the national economy continued through price control, exchange rate regulation, trade limitations, trade quotas and subsidies. In 2000 (Figure 3.6), pre-crisis 1990 levels were restored in some sectors (industry and consumer growth) but remain stagnant in others (Agricultural production, equity investment). The private sector has grown significantly. Between 1996-2000, 404 state-owned and 1773 municipality-owned companies were privatised.
The GRP (gross regional product) structure in Belarus is dominated by the manufacturing sector (up to 67%). The contribution of agriculture to the regional GRP varies between 15 and 21%. There has been continuous growth of the service sector in terms of regional GRP between 1995 and 2000.
The Ukrainian part of the Dnipro Basin has a very specific economic pattern that is not typical for the country as a whole. The region is by far and away the largest manufacturer of goods and products. For example, in 1995 the proportion of the manufacturing sector in the regional economy was 59%, when compared to the country average of 54%. This is largely attributed to higher levels of industrial and agricultural sector development in the region as compared to the country average. In 1995, industry represented 32% of the country's economy (36% in the region's economy), the agricultural sector 14% (16%), and the construction industry sector 6.9% (7.3% in the region's economy).
Large power engineering and electricity generating facilities are concentrated in the region, contributing significantly to the anthropogenic load on the environment and posing a continuous threat of accidental pollution. 69% of the national power generating capacity is concentrated in five Oblasts located within the Dnipro Basin.
Although production output has shown an increase in recent years (2000-2001), overall decline during the preceding period of 1995-2000 was dramatic. Gross production output dropped by 15.9%, interlocutory consumption by 14.3% and gross value-added output by 17.3%.
Certain signs of growth have started to manifest themselves since 2000 which can be attributed to a revival of industrial production. This has largely been caused by increases in demand for the products of the building material industry, food processing industries, light industries, and ferrous metallurgical and petrochemical industries.
3.2.4 Industry
 |
Historically, the large industrial centres of European Russia have been concentrated in the upper part of the Dnipro Basin. Most industrial activity is concentrated in the Smolensk, Bryansk and Kursk Oblasts, accounting for 90% of the overall industrial capacity of the Russian part of the Dnipro Basin. This area contains over 4,000 industrial enterprises, a skilled workforce and high-technology production capacities. Industry in this region represents 3.5% of Russia’s industrial capacity, and accounts for 5.6% of the country’s power generation. The industrial sector is dominated by processing industries (Figure 3.7). After a decade of continuous decline, industrial production output has shown an increase since 2000.
In Belarus, industrial production output grew continuously between 1996–2000 at an average annual growth rate of 10.5%. In that period, production output in the chemical/petrochemical industry increased by 51.6%. The machine-building industry has also shown an increase in output. In 2000, there was a 1.5-fold increase in cement production output compared to 1995 levels and significant growth was achieved in the industrial production and construction sectors (by 45% and 15%, respectively).
Historically, there has been intensive industrial development in the Ukrainian part of the Dnipro Basin. The region currently accounts for over 60% of the total industrial production capacity of the country, including 60.7% of its heavy industry and 60.6% of light and food-processing industries.
Industrial facilities are distributed very unevenly over the territory of the Basin. More than two thirds of the regional industrial capacity is concentrated within less than one third of the region’s area, namely the Kyiv Oblast, Kyiv itself, and the Oblasts of Poltava, Dnipropetrovsk, Donetsk and Zaporizhzhia. Industrial production density is highest in the Dnipropetrovsk and Zaporizhzhia Oblasts, accounting for 43.6% of the industrial output of the Dnipro Basin. The Kyiv Oblast and Kyiv itself account for over 15% of the regional industrial output. Relatively little industry is contained in the southern and Polessie areas of the Basin, which together accounts for only 9.3% of output. The industrial production output of the Ukrainian part of the Dnipro Basin is shown in Table 3.5.
Table 3.5 Industrial production output of the Ukrainian part of the Dnipro Basin
|
Industry |
Output (%) |
|
Energy (electric power) |
12.4 |
|
Ferrous and non-ferrous metallurgy |
32.0 |
|
Machine-building and metal fabrication |
13.2 |
|
Food processing |
17.2 |
3.2.5 Agriculture
The area of arable land in the Dnipro Basin is 283,000 km2, or 55.4% of the total Basin area. Serious structural changes have taken place in the agricultural sector of the three riparian countries of the Basin over the last decade, leading to a continuous reduction in the proportion of arable agriculture compared with total agricultural output. However, mineral fertiliser application has significantly increased over recent years and livestock production has stabilised following a period of steep decline. Private sector involvement schemes have been set up, resulting in a 6% increase in the area of farmland allocated for individual farming activities.
Agricultural production plays a significant role in the economy of the Russian part of the Dnipro Basin. In 1996, the area of agricultural land used for arable purposes was 8.7 million hectares, accounting for 6.6% of the total grain cultivation area in the Russian Federation. Between 1996–2000 this area was reduced by 30%. This dramatic reduction in arable area graphically illustrates the current level of agricultural sector degradation in the Russian part of the Dnipro Basin, as compared to the overall situation in the country. A significant decline in livestock farming has also occurred. In 2000, meat and milk output accounted for 48% and 52% of the 1990 levels, respectively.
Deterioration of soil quality is considered to be one of the major causes of this continuing crisis, with 50% of agricultural land being swamped or acidified due to insufficient levels of lime. Large areas of agricultural land have also been inundated with shrubs. Erosion is also a continuing problem and inherent to agricultural fields located on slopes with gradients of greater than 1.5–2°. This has been aggravated because simple anti-erosion practices such as lateral slope tillage have been applied on only a third of this erosion-susceptible land.
The agricultural sector in Belarus was severely hit by the Chornobyl accident. Over 3600 villages whose inhabitants relied on farming as their major source of income were contaminated with radionuclides above 1 Ci km2 of caesium-137 as well as more than 18,000 sq. km of agricultural land and about 800 collective farms.
Intensive farming contributes significantly to the anthropogenic pressure on the Dnipro Basin within Ukraine. There has been a continuous expansion of grain-crop farming areas. Technical crops, particularly sunflower, are also increasingly dominating crop-planting patterns and are contributing to the progressive depletion of soil quality. A breakdown of agricultural enterprise by type is shown in Table 3.6.
Table 3.6 Breakdown of agricultural enterprise by type
|
Enterprise |
Area (Million Ha) |
Number of enterprises |
|
Large agricultural enterprises |
13.29 |
6,684 |
| Private farms |
0.25 |
21,000 |
|
‘Gardening communities’ |
0.19 |
2,000,000 |
|
Land plots held by individual households |
1.85 |
6,400,000 |
Large-scale land irrigation/drainage schemes in Ukraine were launched in 1966, and the existing area of irrigated and drained farmland is 2.6 million hectares and 2.5 million hectares, respectively. The Dnipro River is a major source of water for irrigation. For example, the area of irrigated farmland near the Kakhovka reservoir is 260,000 hectares. Another 80,000 hectares lie in the Inhulets River catchment, and the North-Crimean channel serves an irrigated farmland area of 400,000 hectares. irrigation systems are largely in poor technical condition and require upgrade and capital repair.
3.2.6 Social development and living conditions in the Dnipro Basin
As a result of the economic reforms of the 1990’s, hyperinflation, the collapse of productive activity, unemployment and uncontrolled growth of prices on basic consumer goods have had an immediate and severe impact on the population. Real earning capacity has been undermined and individuals cash assets have virtually disappeared. Rates of decline were particularly severe between 1991-2000. Key comparative statistics on the living standards in the riparian countries of the Dnipro Basin is presented in Table 3.7.
Table 3.7 Human development indicators for the Dnipro Basin countries (UNDP Human Development Report 2000)
|
Country |
Rank |
Human development index |
Factors contributing to the total value of the human development index | ||||
|
Real GDP per capita, PPP** |
Life expectancy |
Level of literacy among adult population | |||||
|
USD |
USD |
years |
% | ||||
|
1998 |
1990 |
1998 |
1990 |
1998 |
1998 |
1998- | |
| Belarus |
(57) |
0.804 |
0.781 |
2761 |
2198 |
68.1 |
99.5* |
| Russia |
(62) |
0.812 |
0.771 |
3668 |
2133 |
66.7 |
99.5* |
| Ukraine |
(78) |
0.793 |
0.744 |
1979 |
873 |
69.1 |
99.6* |
|
Eastern Europe and NIS |
… |
0.776 |
7500 |
5620 |
68.9 |
98.6 | |
|
* This value was rounded up to 99% for the purpose of the human development index calculation; ** PPP – Purchasing power parity of a national currency expressed via USD | |||||||
In 2000, Belarus was ranked 57 in the Human Development Index, ahead of Russia (62) and Ukraine (78). The Basin countries have high ranks in terms of the education level of their population, although real per capita GDP values are 2-3-fold lower than in other Eastern European and NIS countries.
There has been a dramatic 20-60% reduction of real per capita GDP values in the Dnipro Basin countries over the last decade. The Ukrainian population has been particularly hard hit with a per capita GDP reduction of 60.1% (from 1,979 USD in 1990 to 873 USD in 1998). In Russia and Belarus, per capita GDP reduction has been 58% and 44% respectively.
Average life expectancy is low in all countries of the Basin (67 to 69 years) and Ukraine has the largest proportion of population whose incomes are below the poverty line. The economic reforms have had a serious impact on the human resource potential of the Basin, which is going to require a long time to redevelop. The living conditions and life expectancy of the Basin population are also greatly affected by the unfavourable environmental situation that has developed as a result of the Chornobyl accident and a deficit of good quality drinking water.
The progressive deterioration in living conditions in the riparian countries of the Dnipro Basin is a crucial issue, as an underdeveloped market often limits the choice of the population with regard to housing. The situation is exacerbated by an inadequately developed/funded transportation network, and the poorly developed and funded social service sector (including the municipal utility service sector and communications). It is recognised that there is a close relationship between the level of social development, the living conditions of the Dnipro Basin population and the existing state of the municipal utility sector.
3.2.7 Municipal utility sector
Centralised water supply systems are available in virtually all urban areas located in the Dnipro Basin (e.g. in Belarus, 95% of all municipalities are covered by such systems). However, they are poorly developed in the majority of the rural areas, particularly within the Ukrainian part of the Basin.
In Ukraine, a centralised water supply service is available in 100% of cities/towns, 89% of townships, and about 20% of rural settlements. Centralised sewerage services are available in 94% of cities/towns, 50% of townships, and about 3% of rural settlements. About 62% of the population are connected to a centralised sewerage service, mainly in the urban areas. The highest level of coverage is provided in the Zaporizhzhia (81.4%), Dnipropetrovsk (74.5%), Sumy (62%) and Kherson Oblasts, as opposed to the Volyn and Rivne Oblasts where coverage is low (less than 27%). According to expert estimates, this coverage is extremely low when compared to Western Europe.
In general, major water supply/sewerage systems are in poor repair and have reached a high level of depreciation. The total length of sewage mains within Ukraine is 33,840.9 km, with about 10% of the pipework reaching the highest level of depreciation. In addition, about 2,160 km is in extremely poor repair and requires urgent replacement. The poor state of municipal utilities in the Dnipro Basin is illustrated by the fact that wastewater discharges from municipal wastewater treatment plants have been recognised as a major (immediate) source of pollution.
The municipal utility sector accounts for a significant proportion of the total volume of effluents received by the Dnipro Basin water bodies. Therefore the state of wastewater treatment plants and related operation/maintenance costs are considered to have a significant effect on the actual treatment level and quality of municipal effluents entering the water bodies of the Dnipro Basin. For example, in Ukraine, the actual capital expenditure in the water utility sector is currently only 15–20% of the required amount. As a result, municipal wastewater discharges accounted for 40%, or over 0.5 billion m3, of the total amount of insufficiently treated or untreated wastewater received by the Basin water bodies in 2001 (over 1.3 billion m3).
Brief information on the municipal water supply/wastewater treatment sector of the Russian Federation is presented below:
· Centralised water supply/sewerage services are available in all urban areas of the Russian part of the Dnipro Basin.
· Water consumption for drinking/domestic purpose is reported to represent 20% in the total water consumption pattern in the Kursk Oblast, 29% in the Belgorod Oblast, and 63% in the Bryansk Oblast.
· Daily per capita water consumption is between 197 l/day (226 l/day including industrial consumption).
In the Republic of Belarus, mixed municipal/industrial effluents are treated at centralised wastewater treatment plants. The total available wastewater treatment capacity of 1,168.4 ´ 106 m3 per year is higher than the actual volume of treated wastewater (835.4 ´ 106 m3 in 2000). In many cases collected effluents contain contaminants at concentrations that exceed mandatory limits. Of the total wastewater volume, 90% is treated by municipal wastewater treatment plants in 37 large cities. Local wastewater treatment facilities are currently available in only 140 of 205 smaller townships.
Over 90% of the urban population of the Ukrainian part of the Dnipro Basin is connected to centralised water supply/sewerage services, whereas these services are available to only 24% of the rural population. The major water supply/sewerage systems have generally reached a high level of depreciation and the coverage of the centralised sewerage service is extremely low when compared to Western European countries.
3.2.8 Sanitary situation
Pollution from untreated or inadequately treated sewage generated by large urban areas located in the catchments of the Dnipro River and its tributaries appears to be a major factor affecting the sanitary situation in the Basin. Urban runoff and storm water discharges are also considered to contribute significantly to the problems of surface water pollution. The overwhelming majority of human settlements have separate storm water drainage systems that are not connected to centralised wastewater treatment plants, resulting in urban/rainstorm runoff entering the river basin without any treatment.
The surface waters of the Dnipro Basin receive and accumulate a substantial organic pollution load as a result of human activities and a full assessment of the magnitude of this load has yet to be made. Organic pollution has a profound effect on water quality in terms of its physical, chemical, biological and sanitary-hygienic characteristics.
Water mains and related inspection wells are reported to be a source of water pollution in the Russian Federation, due to their generally poor technical state, frequent breakage’s and absence of disinfection practices. For example, 40% of water samples collected in recreational areas were found to have been non-compliant due to the presence of Helminth eggs. The provision of good quality drinking water to the population has become a serious issue. Over 50% of municipal and corporate water supplies do not meet sanitary standards, with one quarter of water samples from centralised water supply systems and one third of samples from municipal water mains being non-compliant with existing requirements.
The key areas suffering from poor water quality and sanitation in Belarus are the Svisloch River throughout its whole length from Minsk to Osipovichi; the Berezina River near Bobruisk and Svetlogorsk (downstream of its confluence with the Svisloch River); and the Pripyat River near Mosyr and Narovl. In the Dnipro River section near Rechitsa, pollution levels were reported to be significantly higher than acceptable limits for a range of parameters with between 52 and 71% of water quality samples found to be non-compliant. Pollution levels were found to be lower in the downstream section, and the proportion of non-compliant water quality samples taken near Loev ranged between 2 and 30% for various years. Figure 3.8 shows the mean annual proportions of non-compliant water quality samples and total annual percentages of water quality samples not meeting sanitary standards in the Belorussian part of the Dnipro River Basin between 1999-2001.
It is commonly recognised that a gross excess (by a factor of 1,116 for bacteriophages, and 5,000 for Escherichia coli) of mandatory microbiological and sanitary requirements, is the clearest evidence of a continuous threat of waterborne contagious diseases in the region. This is exacerbated by the reported presence of Salmonella and Helminth species in treated wastewater discharged into the Svisloch River. Moreover, treated wastewater is reported to have relatively high mutagenicity levels (scores of 2 in 30% of samples, and 3 in 50% of samples).
 |
Monitoring data for 2000, provided by the Ukrainian Sanitary/ Epidemiological Service suggests that a considerable proportion of surface water bodies and drinking water supplies contain water of an unacceptable quality. In 2000, 26.6% of surface water samples were found to be non-compliant with existing sanitary standards, and 15.5% of them did not meet microbiological requirements. Pollution levels detected in drinking water appear to be very high. For example, 20.4% of drinking water intakes did not meet either sanitary or chemical composition requirements, and 9.3% did not meet microbiological requirements.
The rural population appears to be at greatest risk of consuming drinking water of unacceptable quality, although even in the large industrial centres 11.1% of tap water samples were found to be non-compliant with sanitary and chemical composition requirements and 5.5% did not meet microbiological requirements.
Interestingly, the results of regular sanitary/bacteriological monitoring suggest that river water quality with respect to microbiological pollution has remained relatively stable over recent years.
3.2.9 Water-borne diseases
According to the official definition of the European Regional Bureau of the World Health Organisation, water-borne diseases mean any significant and widely spread negative effect on human health (death, disability, disease or disorder) that is directly or indirectly caused by the state or changes in quantity or quality of any water resource.
There is a continuous threat of outbreaks of waterborne diseases in the Dnipro River Basin. Available data shows numerous limited outbreaks of diseases caused by exposure to or consumption of poor quality water containing pathogenic bacteria that are responsible for transmitting various contagious diseases.
In 2000-2001, 10 outbreaks of contagious viral and bacterial diseases were officially recorded within the Russian part of the Dnipro Basin, attributed to microbial contamination of drinking water. The total number of people affected was 307, about 38% of them children under 14 years of age. Enteric fever, A, B, and C-paratyphoid and bacterial dysentery are the most frequent water-borne diseases. In the Kaluga, Orel and Bryansk Oblasts, the incidence of dysentery, hepatitis A and other acute contagious diseases is higher than the country average level.
Over the period of 1994-2001, 12 outbreaks of contagious waterborne viral and bacterial diseases were recorded in the Belorussian part of the Dnipro Basin. The total number of people affected was 1,135 with over 50% of them children under 14 years of age. In addition to contagious viral and bacterial diseases, human health in the Dnipro Basin is threatened by parasitic invasions. In the Pripyat River Basin, parasitic invasion levels are relatively low. This is because fish have never dominated the local food pattern, with only between 2% and 9% of the local population engaged in non-commercial fishing. The incidence of opisthorchiasis is different in the Dnipro River Basin where as many as 20% of the local population is engaged in such activities. In this area, fish is consumed in large quantities, particularly dried and pickled. Inadequate existing water treatment and disinfection technologies are considered to be the major causes of water-borne disease outbreaks.
In Ukraine, contaminated water is considered as one of the major causes of enteric infections. There is a direct relationship between the increasing contamination of water and the incidence of water-borne diseases (enterocolitis, dysentery, salmonellosis, viral hepatitis А, etc). Results of studies carried out in the Dnipro Basin suggest that microbiological contamination of drinking water is the major contributor to the growing frequency of contagious disease incidence (Table 3.8).
Table 3.8 Percentage of cases of contagious diseases attributed to microbiological pollution
|
Contagious disease |
% cases attributed to microbiological contamination |
| Dysentery |
41 |
| Salmonellosis |
62-77 |
| Hepatitis A |
72 |
| Enetrocolitis |
45 |
Between 1990 to 2000 the incidence of human disease has been growing at an average rate of 0.7%. Notably, the incidence of diseases relating to or associated with environmental pollution has been growing at a significantly higher rate.
This picture varies across the Basin. For example, the highest disease incidence rate has traditionally been recorded in the Central Ukrainian Oblasts with disease patterns being dominated by circulatory system diseases and respiratory diseases. This, in some part, can be attributed to the ageing population of this region. Malignant tumours are frequent in the industrialised areas of the Basin (Dnipropetrovsk, Zaporizhzhia and Kirovhrad Oblasts) which can be attributed to higher levels of environmental pollution.
The incidence of endocrine and digestive system diseases remains high in the central and northwestern areas of the Basin, where thyroid adenoma has been a serious issue. Since 1999, the situation has become even more complicated due to higher incidence of hyperplasia of the thyroid gland, indicative of the impact of the Chornobyl accident.
3.2.10 Water uses in the Basin
In terms of the territorial distribution of water resources, the Dnipro Basin features two major zones. The first is the flow formation zone located within the Republic of Belarus and the Russian Federation, characterised by very low water consumption. The second is the flow transit zone starting downstream of Kyiv and extending throughout the Ukrainian part of the Basin which has minor side flow inputs and a high water demand.
The Dnipro is a vital water artery for the economies and populations of the three nations. Table 3.9 gives statistical data on water consumption in the Dnipro Basin in 1999. The total volume of water abstraction in the Dnipro Basin was 13.4 km3. This can be broken down by country as follows: 6% in the Russian Federation, 8% in the Republic of Belarus, and 86% in Ukraine.
 |
The Russian part of the Dnipro Basin has the best-developed water reuse/recycling schemes in the Federation (96%, as opposed to the country average of 77%). The total annual volume of water reuse/recycling in 1995 was 7.8 km3 and 7.5 km3 in 2000.
In the Belorussian part of the Dnipro Basin, groundwater sources accounted for more than 50% of the total volume of abstracted water in 2000. Groundwater is used to provide domestic and drinking water to both the urban and rural population, and to meet the demand of food and light industries. In total, there are over 30,000 artesian boreholes and 40,000 wells in Belarus.
Table 3.9 Water consumption in the Dnipro Basin (million m3), 1999
|
Country |
Water abstraction |
Water consumption |
|
|
Republic of Belarus |
1121 |
1038 |
|
|
Russian Federation |
774 |
736 |
|
| Ukraine |
11544 |
9139 |
|
|
Total |
13439 |
10913 |
Ukraine is by far the largest water user in the Basin with the Dnipro covering about 60% of the national demand for freshwater (a breakdown by sector is shown in Figure 3.9). In 2000, there were 7,900 officially registered water users within the Ukrainian part of the Basin and total water use was reported to be 36 billion m3. Water is drawn from surface water bodies (26%), groundwater sources (3%), and water reuse/recycling (71%). Non-returnable (consumptive) water uses account for 45% of the total water abstraction. Of that, 3.7 billion m3 was abstracted from the main stem of the Dnipro itself.
About 30% of the total abstracted volume is supplied to arid areas of the Basin via water diversion channels (Table 3.10). In Belarus, 0.04-0.06 km3/year is diverted annually via the Dnipro-Buh Channel.
Agriculture appears to be the most intensive water user, being responsible for 69% of the total non-returnable water consumption in the Basin. A large proportion of this abstracted water is supplied to irrigation systems (Figure 3.9). Seasonally, about 56% of the total annual water abstraction occurs between May and August, attributed to intensive irrigation of arable farmland downstream of the Dniprovsky hydropower dam.
In 2000, the industry sector accounted for 54.8% of the total water consumption in the Ukrainian part of the Basin, followed by domestic/drinking water supply (about 21%). Overall water consumption is reported to have decreased by 52% when compared to the 1990 level, although polluted effluent discharges remain high.
Table 3.10 Major diversion channels in the Ukrainian part of the Dnipro Basin
|
Diversion Channel |
million m3 |
|
The Dnipro-Donbass Channel |
228 |
|
The North-Rohachitska irrigation scheme |
58 |
|
The Kakhovka Channel |
513 |
|
The North-Crimean Channel |
2,004 |
|
The Inhulets irrigation scheme |
191 |
|
The Dnipro–Kirovhrad water conduit |
59 |
|
The Dnipro–Mykolaiv water conduit |
87 |
The Lower Dnipro (from the Dniprodzerzhinsky hydropower dam to the estuary) has been severely affected by extremely high anthropogenic pressures. This is illustrated by the fact that this part of the Basin accounts for 76%, of the total non-returnable water consumption in the Basin. The major contributors to non-returnable water losses are the Dnipropetrovsk Oblast (12%), the Kherson Oblast (23%), and the flow diversion channels described above (Table 3.9). Industrial facilities concentrated in the Dnipropetrovsk and Zaporizhzhia Oblasts are the major sources of water pollution, accounting for 75% of the total polluted effluent discharge. The major pollution sources in the Ukrainian part of the Basin are ferrous metallurgy industries (35%) and municipal water utilities (47%).
3.3 Ecological Status of the Basin
3.3.1 Global trends in the environmental situation in the Dnipro Basin
Changes in air temperature
The reliable assessment of changes in air temperature can be made for those meteorological station locations where long-term time series of observation data are available. It is also desirable to make sure that the sites of these stations have remained unchanged during the whole period of their operation, and are located in relatively small towns where local impacts (from heating mains, etc.) are relatively low.
There are several meteorological stations meeting these requirements in the Dnipro Basin such as the Poltava meteorological station where observations have been carried out since 1886. Comparable time series of observation data are also available for the Gorki meteorological station located in the north of Belarus. Long-term variations of mean annual air temperatures at these stations are shown in Figure 3.10.
The data suggests that the net increase of mean annual air temperature over the period 1880 to 2000 was about 1.0°C, generally higher than the global increase of air temperature. Rates of increase have been especially high during the past 25-30 years. It should be noted that an increase of mean annual air temperature might affect the river flow in many ways. Moreover, seasonal variations can have an even stronger effect on the water resource. In particular, higher temperatures at cold periods of the year and frequent thaws are expected to result in lower discharges and decreased peak flows during the spring high flow period. This likely effect can be confirmed by actual observation data.
 |
Changes in atmospheric precipitation
Available data indicates that there is a strong relationship between changes in air temperature and changes in atmospheric precipitation, with the latter featuring a downward tendency in some areas of the Basin, and an upward tendency in other areas (Table 3.11). A similar picture emerges from an analysis of observation data obtained from a larger number of meteorological stations over the period 1946 to 2000. A significant body of research evidence is also available in various national and international reports.
The Dnipro River features a specific flow pattern with a markedly high flow in spring, when the river discharges more than half its annual flow. Therefore it is important to monitor variations in thickness of snow cover and water content.
Table 3.11 Changes in mean annual precipitation in Ukraine and Belarus over 1891-2000*
|
Station |
Equation |
Mean value, mm |
|
Gorki |
Y = -0.20 T + 648 |
637 |
|
Mogilev |
Y = -1.51 T + 734 |
648 |
|
Kyiv |
Y = -0.33 T + 670 |
652 |
|
Zhitomyr |
Y = 0.13 T + 604 |
611 |
|
Uman |
Y = 1.13 T + 526 |
589 |
|
Poltava |
Y = 0.57 T + 505 |
537 |
* Т- period (years)
These aspects have been studied at several meteorological stations located in the Polessie zone (where snow cover plays a major role in river flow formation). Despite significant variability of available data, there appears to be a downward tendency in snow cover thickness (Figure 3.11).
 |
Variations in mean annual flow of the Dnipro River
Given that the Dnipro River flow is greatly affected by various human activities, mainly concentrated in the Lower Dnipro Basin, assessment of global climatic changes and their impact on water resource needs to be based on data collected in the relatively undisturbed upper river stretches. The most suitable for this purpose are hydrometric stations located in Rechitsa (catchment area 58,200 km2) and Kyiv (328,000 km2). Although flow measurements are not currently conducted at the Kyiv hydrometric station, flow estimates may be derived by summing up the actually measured flow values available for the Kyiv hydropower dam (239,000 km2) and the Letki hydrometric station (88,500 km2) located near the Desna River mouth.
The above mentioned climatic changes (increased air temperature during cold periods of the year, and reduced thickness of snow cover) have resulted in reduced discharges and peak flows during the spring high flow period, with a corresponding increase of discharges during winter and summer low flow periods (Figure 3.12).
 |
Apart from the Dnipro River flow, global processes also affect river water quality. This is caused by changes in the composition of precipitation falling within the catchment area as a result of anthropogenic impacts. For instance, the mineralisation level in water associated with various forms of precipitation is now higher than several decades ago.
Global transboundary transport of pollutants
Ukraine has common borders with many European countries, therefore transboundary transport of pollution is considered to have an effect on the state of catchment areas and surface waters within the Dnipro Basin. Westerly air-mass transport prevails in Ukraine, therefore pollution emitted to the atmosphere in Western and Central European countries is transported to the western and northern Oblasts of Ukraine, including the upper part of the Dnipro Basin. The major contributors of nitrogen dioxide (NO2) load transported to Ukraine are Poland (450 tonnes), Germany (305 tonnes), and Slovakia (196 tonnes). Sulphur compounds are mainly brought with air masses from Poland (153 tonnes) and Romania (115 tonnes).
3.3.2 Review of the 2000-2001 field survey results. Assessment of impact of transboundary pollution transport on the environmental situation in the Basin (local and global effects)
As a result of international field surveys carried out in the transboundary sections of the Dnipro River Basin during 2000-2001, new original data were collected. In particular, landscape diversity assessment surveys and a review of the current state of nature reserves and protected areas located in the transboundary sections of the Dnipro River Basin were undertaken. This has provided a basis for the identification of issues and problems relating to the conservation of the landscape and biological diversity in the Basin. Figure 3.13 shows the locations of sampling sites for the 2000-2001 field surveys.
The surveys revealed that the floodplains of the Pripyat, Ubort and Stvyga Rivers have been severely damaged and urgent actions are needed to protect what is left of their landscape diversity. Landscape and biological diversity conservation capacity in nature reserves and protected areas in the Basin is also inadequate. It was also shown that although such areas could be used as a reference basis for the purposes of ambient water quality monitoring, they are currently not.
Water Quality
In terms of ecological/sanitary criteria, the examined water bodies can principally be described as moderately polluted or dirty, corresponding to Water Quality Categories 5-7. The prescribed Maximum Allowable Concentration (MAC) limits for fishery water use were found to be exceeded in the majority of water bodies for a range of parameters (COD, BOD5, sulphates, ammonium and nitrites).
Metal contamination
The field survey results confirmed that metal concentrations were relatively high in the transboundary river sections of the Dnipro Basin, where fishery MAC limits for metals were exceeded in all water samples. All bottom sediment samples were found to contain iron and manganese at significant concentrations. MAC limits for zinc, copper, lead and arsenic were exceeded in fish samples, as well as the interim sanitary guideline levels for iron, chromium and nickel. Excessive concentrations of metals and arsenic in water, bottom sediment and aquatic biota samples from the transboundary sections of the Dnipro Basin indicate that these media have accumulated considerable quantities of these substances (Figure 3.14).
Concentrations of zinc, copper, nickel and mercury in all water bodies were found to be excessive only in terms of the MAC limits for fishery water use.
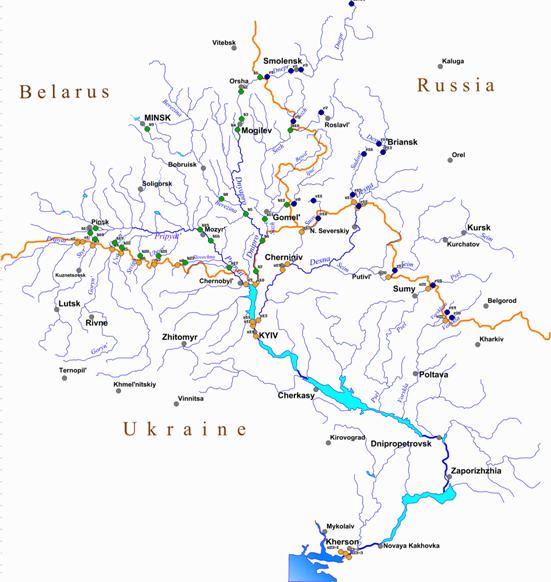 |
Figure 3.13 Locations of sampling sites for the 2000-2001 field surveys
Figure 3.14 Excessive concentrations of metals and arsenic in fish sampled
during the 2001 field survey
Persistent organic contamination
During the spring field survey, all but two water samples (from Lake Nobel and the Seim River) were found to contain oil products at concentrations exceeding the MAC limit set for fishery water use. Many exceeded the MAC limit for potable and recreational water use, with levels up to 3.7 times higher than that set.
High levels of pesticides were found in water samples from the rivers Sozh, Ipout, Styr, Slovechna, Pripyat, Seim and the Dnipro itself. Analytical results indicated that HCCH, n,n'-DDT and its metabolites were the predominant organochlorines found in transboundary river water samples (Figure 3.15). a-HCCH was detected in 72% of all water samples at levels ranging from 0.003 to 0.111 mg/dm3. γ-HCCH concentrations in water samples ranged from 0.012 to 0.018 mg/kg. Levels of n,n'-DDT were found to be below the detection limit in most water samples, whereas n,n'-DDE was detected in 47% of water samples at concentrations ranging from 0.007 to 0.026 mg/dm3. The highest levels of organo-chlorine pesticides were found in water samples taken from Lake Nobel, the Kyiv reservoir, the Seim River and the Desna River section between the villages of Kamen and Chernihiv.
Treflane, Harness and synthetic pyrethroid herbicides were not detected in any of the water samples taken during the field surveys. However 2,4-D was detected at concentrations ranging from 2.1 to 2.4 mg/dm3 in water samples taken from the Desna and Sudost Rivers, and the mouth section of the Dnipro River itself. Organo-chlorine pesticides were present in bottom sediment samples at levels reflecting their global dispersion pattern. Moreover, 38% of the bottom sediment samples were found to contain treflane.
Figure 3.15 Chlorinated organic pesticides in water of the Dnipro River Basin
Organo-chlorine pesticides were detected in all fish samples at levels considerably higher than their ambient concentrations in water. A clear pattern of organo-chlorine pesticide contamination emerged from the analysis of freshwater fish species (pike, perch, pike perch, catfish, ide, bream, and rudd). The highest contamination levels were detected in liver samples, with lower concentrations being generally present in fish muscle. There was a general trend of higher contamination levels in predator fish samples (pike, perch, and pike perch) compared to the benthophage fish species.
The major organo-chlorine pesticides detected in all fish samples were a- and g-HCCH, n,n'-DDT, n,n'-DDE, n,n'-DDD, and heptachlor. Accumulated pesticide metabolites, in particular n,n'-DDE, were detected in fish muscle and organs, indicating major metabolic changes since initial exposure to contamination. a- and b-HCCH, n,n'-DDT and its metabolites n,n'-DDE and n,n'-DDD were detected in shellfish samples. In addition, there appear to be differences among water bodies in terms of the level of pesticide accumulation in shellfish.
Microbiological contamination
High levels of bacterial contamination were recorded in the transboundary sections of the Pripyat River tributaries during the autumn field survey (Table 3.12. The number of lactopositive Escherichia coli in samples from the Snov and Sudost Rivers exceeded the MAC limits for recreational/domestic water uses by 1.2 times.
Table 3.12 Bacterial contamination in the transboundary sections of the Pripyat River tributaries
|
Pripyat River tributary |
Escherichia coli (million cells/l) |
Salmonella (cells/ml) |
| Horyn |
10.98 |
102 |
| Styr |
3.20 |
70 |
| Stvyga |
0.60 |
34 |
The lowest quantities of bacterial plankton and heterotrophic microorganisms were in samples collected from the transboundary section of the Desna River. During the autumn 2000 field survey, recorded quantities of bacterial plankton and heterotrophic bacteria at the Belorussian/Russian border section were 1.87 million cells/ml and 1,600 cells/l, respectively. Bacteria species active on oil products and surfactants were detected in minor quantities (Escherichia coli, 60,000 cells/l). During the spring field survey, a 3.6-fold increase in the quantity of heterotrophic organisms was recorded for this section. This was attributed to pollution carried from the adjacent territory during the spring high-flow period. Also, samples taken from this river section during the spring field survey had higher quantities of bacterial plankton (by 1.4 times), heteroptrophic bacteria (by 2.8 times) and Escherichia coli (by 2.2 times).
The highest bacterial contamination levels were recorded in the transboundary section of the Vorskla River (downstream from the village of Lugovoe). Wastewater discharges from the local dairy and municipal wastewater treatment plant have affected the hydrobiological regime of the river. Recorded quantities of bacterial plankton and heterotrophic organisms for this section of the Vorskla River were 4.73 million cells/ml and 184,000 cells/ml, respectively. The quantities of bacteria active on oil products and surfactants were also relatively high at 1,800 cells/ml and 4,430 cells/ml, respectively.
Ecological status
Overall, 473 phytoplankton species representing 8 groups were recorded in the Dnipro Basin, with 321 species found in the transboundary sections of the Basin. Phytoplankton community structure data indicates that the water can be characterised as ‘moderately polluted’ by organic substances in the transboundary sections. The field survey results on zooplankton community structure indicate that pollution levels were relatively low. Water quality in the Pripyat River Basin was mainly affected by factors of natural origin, whilst anthropogenic factors played a major role in the Dnipro River and its left-bank tributaries.
Zoobenthos is an important indicator of aquatic ecosystem state and there appear to be significant differences among the transboundary sections of the Dnipro Basin. In the Pripyat River Basin, benthic fauna development is mainly affected by natural factors (soil properties and hydrological regime), while the effect of anthropogenic factors is minor. As a result, biotic and diversity indices vary widely among the rivers. Only in the Horyn River, did the state of benthic communities suggest significant inputs of organic pollution from local sources. Interpretation of zoobenthos diversity and abundance indices suggests that anthropogenic factors have not caused persistent effects on the state of the ecosystem.
Field survey results and a review of the specialist literature showed that there was considerable diversity of parasites (up to 200 species) living in or on fish, shellfish and crayfish species inhabiting the transboundary sections of the Dnipro Basin. The parasitic fauna includes species capable of causing disease and death in fish (Trypanosome, Microsporidia, Diplostomuma, and Ligula). Moreover, the following pathogenic species were also found: Opisthorchis felineus, Metagonimus yokogawai, Pseudamphistomum truncatum, Metorchis albisus, Mesorchis denticulatus, Apophallus muehlingi, and Diphyllobothrium latum (Figure 3.16).
|
|
|
Figure 3.16 Parasitic invasions in B.leachi mollusc sample (the Vorskla River)
Water and sediment samples from the Dnipro River Basin were analysed for toxicity with a set of animal and plant bioassays. River water samples analysed for toxicity in the field were found to contain no toxic substances at detectable levels, whereas chronic toxic effects were found in the laboratory. No toxic substances were detected in bottom sediment samples.
Radionuclide contamination
Maximum concentrations of 137Cs in the water were recorded in the Pripyat River tributaries (up to 435.0 Bq/m3), the Upper Dnipro tributaries (146.0 Bq/ m3), the Kyiv reservoir, a major trap for Chornobyl-related radionuclide contamination (up to 263.0 Bq/ m3) and the Snov River (102.0 Bq/ m3).
Concentrations of 137Cs in the bottom sediments of the Middle and Lower Dnipro tributaries varied within a range of 5-46 Bq/kg. The range was wider in the Upper Dnipro Basin (2.3-100 Bq/kg) due to the immediate proximity of the Chornobyl Nuclear Plant and the ‘spotty’ distribution of radioactive contamination.
Levels of 90Sr in bottom sediments correlated well with 137Cs concentrations, suggesting exposure to localised sources of radioactive contamination as a result of the Chornobyl accident. The highest level of 90Sr was found in bottom sediment samples from the Pripyat River within the 30-km Chornobyl zone (4.8 Bq/kg of dry sample mass), whereas samples from the Ubort River had the lowest levels (0.27 Bq/kg). The distribution of radionuclides in bottom sediment samples was similar to that of water samples, although more pronounced reflecting the overall picture of radionuclide contamination as a result of the Chornobyl accident.
Bivalve molluscs act as natural filters, contributing significantly to river self-purification processes. Data on radionuclides in bivalve molluscs sampled in the Pripyat River Basin indicate that such species as Dreissena and Unito pictorum are the most powerful biological filters in the freshwater macrozoobenthic community with accumulation factors of over 1,100 for 90Sr in Dreissena, and near 500 for 137Cs in Unito pictorum.
Radionuclide contamination in the Dnipro River Basin is very uneven in distribution, suggesting strong local sources of an anthropogenic nature. Tritium is a major radioactive component of effluent generated by nuclear power facilities and is regarded as a long-lived radionuclide capable of spreading far beyond its immediate source. Tritium concentrations in water were generally below or slightly above the detection limits of the measurement techniques involved in this study (up to 3.4 Bq/l). The only exceptions were water samples from the Styr River where the tritium concentration was 7.5 Bq/l, possibly as a result of the Rivne Nuclear Power Plant.
Assessment of the ecological status of the Dnipro Basin on the basis of national techniques
adopted in the riparian countries
The Water Pollution Index (WPI) technique is used in the Russian Federation, the Republic of Belarus and Ukraine as a tool to assess surface water quality. The calculation procedure for WPI involves determining the mean annual concentrations of six substances. Two of them (dissolved oxygen and BOD5) are compulsory and the other four can be chosen from a priority list of substances ranked in terms of the rate of the maximum admissible concentration (MAC) exceedence at a given site. Based on data provided by the National Monitoring System, the four additional parameters involved in the WPI calculation procedure are ammonium nitrogen, nitrite nitrogen, zinc, and oil products. The WPI-based water quality classification system includes seven water quality categories or classes (Figure 3.17).
Figure 3.17 Water quality classification on the basis of WPI values
The rivers of the upper part of the Dnipro Basin within the Russian Federation can be described as ‘moderately polluted’ in terms of WPI values.
In the Republic of Belarus, WPI values indicate that ambient water quality in the Dnipro River between Orsha and Bykhov is generally undisturbed, whereas water in the river section between Rechitsa and Loyev is ‘moderately polluted’, suggesting a progressive downward trend in water quality. The WPI values for the Berezina River indicate relatively stable water quality upstream of Svetlogorsk, although the downstream section of the river has deteriorated over recent years. Consistently high pollution levels have been reported for the Svisloch River section downstream of the municipal wastewater treatment plant serving the City of Minsk. The Pripyat River tributaries (Slutch, Tsna, Ptich, Bobrik, Moroch, Ubort, and Oressa) have a relatively stable water quality regime and can be described as ‘moderately polluted’ in terms of water quality classification. There appears to be no sign of water quality improvement in the transboundary sections of the Dnipro River and its tributaries where they enter Ukraine. Moreover, the WPI values increase within the transboundary section of the Dnipro River itself.
Within Ukraine, the rivers of the Dnipro Basin are characterised as ‘clean’ and ‘moderately polluted’. The pattern of WPI values for the Dnipro Basin is shown in Figure 3.18.
Figure 3.18 Variation of WPI values along the Dnipro River within the Republic of Belarus
Transboundary transport of pollution in the Dnipro Basin
The existing water quality monitoring system has not been designed to quantify transboundary pollution loads carried by river flow from or to the riparian countries of the Dnipro Basin. The closest cross-border water quality monitoring stations are often located 60-100 km from the border and the transboundary hydrological monitoring network is inadequate with monitoring carried out on an infrequent basis. Therefore it is virtually impossible to calculate mass load values at a required level of accuracy and precision (e.g. 10% error at 90% confidence).
The mass load estimates calculated in this section are considered to be very approximate. In order to minimise potential error, only averaged values over the period of 1995-2000 were included in calculation procedure. Calculation results are presented in Tables 3.13–3.16.
As can be seen from the these tables, there appear to be significant differences in mass flow estimates made on the basis of data collected at adjacent monitoring stations located on either side of the border. Nonetheless, the exercise itself is very useful, as it helps to appreciate the order of magnitude involved and clearly illustrates the need for establishing a special monitoring regime in the transboundary sections of the Basin.
Taking into account the flawed character of the input data involved in the calculations, the derived mass flow values must be considered as a very rough estimate. These values should not be used as a basis for evaluating and claiming damage incurred to the 3 riparian countries as a result of transboundary pollution.
Table 3.13(A) Estimated mean annual mass load at the Ukrainian/Belorussian border over the period of 1995-2000 (tonnes/year)
|
Parameter |
Pripyat – Pinsk |
Horyn – Rechitsa |
Ubort – Krasnoberezhie |
|
Suspended substances |
26600 |
73700 |
4800 |
|
BOD5 |
5280 |
11100 |
1300 |
| Phosphates |
70 |
480 |
30 |
| Copper |
15 |
24 |
4 |
| Zinc |
50 |
97 |
5 |
| Phenols |
25 |
9 |
- |
| Iron total |
1070 |
1350 |
1340 |
| Manganese |
29 |
58 |
13 |
| Oil products |
235 |
289 |
81 |
| Surfactants |
55 |
215 |
21 |
Note: Calculations on the basis of the RB monitoring data were made by the Belorussian experts.
Table 3.13(B) Estimated mean annual mass load at Ukrainian/Belorussian border over the period of 1995-2000 (tonnes/year)
|
Parameter |
Pripyat – Narovlya |
Pripyat – Chornobyl |
|
Suspended substances |
148000 |
189000 |
|
BOD5 |
38300 |
48400 |
| Phosphates |
890 |
930 |
| Copper |
93 |
111 |
| Zinc |
344 |
790 |
| Phenols |
170 |
175 |
| Iron total |
7860 |
8930 |
| Manganese |
307 |
1417 |
| Oil products |
1360 |
1380 |
| Surfactants |
- |
332 |
Note: Calculations made by the Belorussian experts (Pripyat-Narovlya) and Ukrainian experts (Pripyat-Chornobyl).
Table 3.13 (C) Estimated mean annual mass load at the Ukrainian/Belorussian border over the period of 1995-2000 (tonnes/year)
|
Parameter |
Republic of Belarus |
Ukraine |
|
Dnipro – Loyev |
Dnipro – Nedanchichi | |
|
Suspended substances |
95810 |
172800 |
|
BOD5 |
42370 |
26130 |
| Phosphates |
652.5 |
1608 |
| Copper |
47.94 |
98.27 |
| Zinc |
228.2 |
962.4 |
| Phenols |
51.04 |
52.65 |
| Iron total |
5308 |
7029 |
| Manganese |
- |
1368 |
| Oil products |
940.7 |
2469 |
| Surfactants |
194.9 |
450.2 |
Note: Calculations made by the Belorussian experts (Dnipro-Loyev) and Ukrainian experts (Dnipro-Nedanchichi).
Table 3.14 Estimated mean annual mass load at the Russian/Belorussian border over the period of 1995-2000 (tonnes/year)
|
Parameters |
RF |
RB |
RF |
RB |
RF |
RB |
RF |
RB |
|
Dnipro – Smolensk |
Dnipro – Orsha |
Sozh |
Sozh - Krichev |
Ipout –Dobrodeevka |
Ipout - Dobrush |
Total, tonnes |
Total, tonnes | |
|
Suspended solids |
31120 |
42644.4 |
Not estimated |
26300 |
34138 |
2132 |
Not estimated |
71070 |
| BOD5 |
9479 |
8778 |
4740 |
3943 |
1112 |
14630 |
||
| Mineral nitrogen |
5914 |
1748 |
646.2 |
391.6 |
993.8 |
3367 |
||
| PO4-P |
- |
320.1 |
119.8 |
- |
28.08 |
468 |
||
| Total phosphorus |
458.9 |
- |
- |
179.5 |
- |
- |
||
| Copper |
- |
19.99 |
14 |
- |
1.015 |
35 | ||
| Zinc |
- |
19.97 |
36.99 |
- |
7.04 |
64 |
||
| Nickel |
- |
30.01 |
12.01 |
- |
1.98 |
44 |
||
| Phenols |
5.96 |
9.996 |
2.996 |
- |
1.008 |
14 |
||
| Total iron |
- |
3167 |
1059 |
310.8 |
203.8 |
4430 |
||
| Oil products |
- |
360 |
195.6 |
- |
44.4 |
600 |
||
| Surfactants |
397.3 |
109.9 |
81.95 |
- |
5.122 |
197 |
Table 3.15 Estimated annual mass load carried by the main Dnipro tributaries across the Russian/Ukrainian border (tonnes/year)
|
Parameter |
Desna |
Seim |
Psyol |
Vorskla |
Vorsklitsa |
|
Suspended substances |
58482 |
24185 |
8168 |
2556 |
1326 |
| Sulphates |
66631 |
79775 |
47142 |
16004 |
2312 |
| Chlorides |
48132 |
45554 |
20962 |
15192 |
951.7 |
| COD |
66822 |
40082 |
12446 |
2820 |
1168 |
|
BOD5 |
7543 |
4340 |
1459 |
445.5 |
163.2 |
| Oil products |
- |
156.7 |
30.87 |
14.50 |
6.04 |
| Phenols |
- |
1.43 |
0.774 |
0.510 |
- |
| Surfactants |
- |
77.93 |
49.62 |
4.535 |
0.575 |
|
Mineral nitrogen |
1829 |
1890 |
604.1 |
188.8 |
51.38 |
|
Total phosphorus |
360 |
783 |
267.7 |
62.74 |
29.18 |
| Total iron |
1022 |
261.2 |
95.89 |
54.82 |
20.30 |
| Copper |
39.42 |
3.932 |
2.506 |
0.486 |
- |
| Zinc |
18.64 |
3.435 |
11.73 |
1.376 |
- |
| Chromium 6+ |
- |
6.587 |
1.122 |
0.200 |
- |
Note: Calculations made by the Russian experts.
Table 3.16 Averaged mass flow estimates for the Dnipro-Kherson section (estuary) based on the 1998-2000 data
|
Parameter |
Unit |
Sample average technique |
Linear interpolation |
Probabilistic interpolation | ||||||
|
Quantile 0.10 |
Mean |
Quantile 0.9 | ||||||||
| Flow discharge |
km3/year |
52.225 | ||||||||
|
Suspended substances |
t/year ´1,000 |
64.17 |
53.93 |
51.26 |
55.07 |
59.14 | ||||
| Sulphates (SO4) | t/year ´1,000 |
2485 |
2458 |
2446 |
2497 |
2550 |
||||
| Chlorides (Cl) | t/year ´1,000 |
1971 |
1988 |
1958 |
1982 |
2004 |
||||
| COD | t/year ´1,000 |
1295 |
1288 |
1254 |
1281 |
1308 |
||||
| BOD5 | t/year ´1,000 |
155.0 |
154.8 |
152.7 |
154.8 |
159.1 |
||||
| Oil products | t/year |
549 |
479 |
492 |
534 |
581 |
||||
| Phenols | t/year |
78 |
79 |
74 |
81 |
88 |
||||
| Total mineral nitrogen | t/year ´1,000 |
17.12 |
17.23 |
16.78 |
17.17 |
17.51 |
||||
| Phosphate phosphorus | t/year |
6095 |
6048 |
6027 |
6072 |
6123 |
||||
| Total phosphorus | t/year ´1,000 |
12.54 |
12.45 |
12.40 |
12.48 |
12.55 |
||||
| Total iron | t/year |
4516 |
4987 |
4473 |
5042 |
5604 |
||||
| Copper | t/year |
146 |
169 |
156 |
175 |
194 |
||||
| Manganese | t/year |
1518 |
2199 |
1637 |
2482 |
3436 |
||||
| Zinc | t/year |
3583 |
3369 |
2981 |
3420 |
3903 |
||||
| Hexavalent chromium | t/year |
250 |
266 |
249 |
260 |
268 |
||||
3.3.3 Identification of hot spots and evaluation of their potential transboundary impact
Surface water quality in the Dnipro Basin is affected by a large number of point sources, including industries, urban centres, mining and agricultural developments. In autumn 2001, the United Nations Industrial Development Organisation (UNIDO) launched the Project on Identification and Evaluation of Pollution Sources (Hot Spots) in the Dnipro Basin. Within the framework of this Project, national experts from the riparian countries of the Dnipro Basin have identified major hot spots affecting the ecological state of water bodies within the Dnipro Basin.
Figure 3.19 shows the locations of the most significant pollution sources (hot spots) identified by the national experts in the Belorussian, Russian and Ukrainian parts of the Dnipro Basin. A list of major hot spots for the three countries is shown in Table 3.17.
Radioactive pollution hot spots
In order to fully reflect local specific conditions existing in the Basin, it is necessary to identify radioactive pollution hot spots. The list of actual and potential hot spots of radioactive pollution is presented below.
Current hot spots:
1. The Pripyat River floodplain section within the Chornobyl exclusion zone. This is considered to be a transboundary hot spot with an impact that increases during high flow periods.
2. Radioactive waste dumps at the former Pridniprovsky Chemical Plant (PCP) site in Dniprodzerzhinsk, and uranium processing sites in Zhovti Vody. These national hot spots have the potential to create a persistent long-term impact if the integrity of tailing waste storage facilities is affected by erosion or a major accident.
3. Inhabited areas in the three countries with high levels of Chornobyl-related radioactive contamination, including enclosed lakes, where 137Cs concentrations in food products or drinking water exceed admissible limits. These local hot spots occur in all three countries of the Basin.
4. Chornobyl exclusion zone, where temporary radioactive waste storage sites and local sources are concentrated, resulting in higher radionuclide concentrations in local small water bodies.
Potential hot spots:
1. The Chornobyl Shelter Facility could result in a potential transboundary hot spot and the Cooling Reservoir in a national hot spot if they were to collapse.
2. Nuclear Power Plants located within the Dnipro Basin have a transboundary hot spot potential if a major accident were to occur. The probability of this is considered to be very low in view of the continuous large-scale operational safety improvements implemented at the nuclear power facilities in Russia and Ukraine. However, a massive release would have considerable transboundary impact, particularly on the Black Sea, if it were to occur in the south of Ukraine.
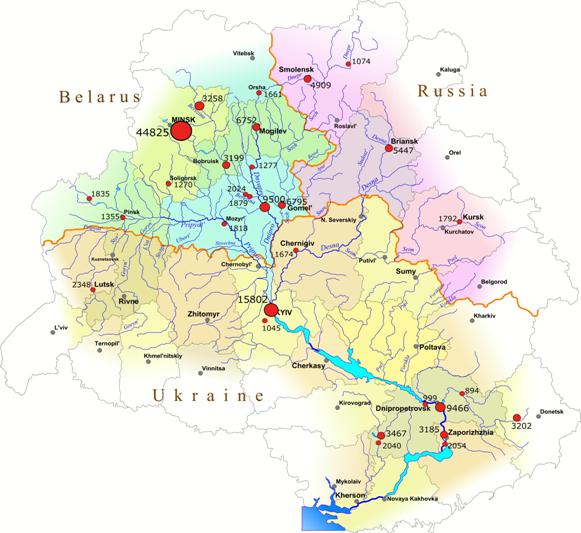 |
Figure 3.19 Major hot spots identified in the three riparian countries of the Dnipro Basin
3.3.4 Radioactive pollution sources within the Dnipro Basin
Uranium mines and ore-processing sites
Uranium mines and ore-processing sites are concentrated in the Ukrainian part of the Dnipro Basin. Uranium exploration activities commenced in 1944, and 21 deposits were discovered, most of them located within the Dnipro Basin itself although there are some uranium deposits in the Southern Buh and Siversky Donets River Basins.
Mining and ore-processing operations in Zhovti Vody have had a profound impact on the environment and sanitary situation in the region. Runoff and leachate from tailings, mines and other contaminated sites has lead to elevated concentrations of radionuclides in the local rivers, although these concentrations remain below the maximum admissible levels set for drinking water sources.
Table 3.17 Major hot spots in the Russian, Belorussian and Ukrainian parts of the Dnipro Basin
| Country |
Industry |
Location |
|
Republic of Belarus |
Minsk Water Utility “Minsk Vodokanal” |
Minsk |
|
Rechitsa Hydrolysis Plant |
Rechitsa | |
|
Chemical Fiber Plant “KhimVolokno” |
Mogilev | |
|
Borisov Water Utility |
Borisov | |
|
Gomel Water Utility “Gomel Vodokanal” |
Gomel | |
|
Russian Federation |
Smolensk Water Utility “Smolensk Vodokanal” |
Smolensk |
|
Agricultural centre in the Vorskla River Basin |
Belgorod Oblast | |
|
District Sewer Networks in the City of Bryansk |
Bryansk | |
|
Kursk Water Utility “Kursk Vodokanal” |
Kursk | |
|
District Sewer Networks in Novozybkov |
Novozybkov, Bryansk Oblast | |
| Ukraine |
Kyiv Water Utility “Kyiv Vodokanal” |
Kyiv |
|
Dnipropetrovsk Water Utility “Dnipropetrovsk Vodokanal” |
Dnipropetrovsk | |
|
“KrivorozhStal” Steel Mill |
Kryvy Rih | |
|
Lutsk Water Utility “Lutsk Vodokanal” |
Lutsk | |
|
Chernihiv Water Utility “Chernihiv Vodokanal” |
Chernihiv | |
|
Zaporizhzhia Water Utility “Zaporizhzhia Vodokanal” |
Zaporizhzhia | |
|
“ZaporizhStal” Steel Mill |
Zaporizhzhia | |
|
The Dzerzhinsky Plant |
Dniprodzerzhinsk | |
|
Zhitomyr Water Utility “Zhitomyr Vodokanal” |
Zhitomyr | |
|
Kherson Water Utility “Kherson Vodokanal” |
Kherson |
Operations at the Pridniprovsky Chemical Plant (PCP) and related facilities have resulted in elevated levels of uranium and its daughter elements in the Konoplyanka River and the Dnipro itself. In order to determine the effects of uranium mining and ore-processing activities in the region, pollution pathways need to be analysed, examining the presence of radioactive contamination in air, vegetation and food products. This information is currently scarce and needs to be made available prior to planning and implementing remedial actions.
Radioactive waste storage and disposal sites
The following radioactive waste disposal sites are located in the Dnipro Basin:
1. The “Ecores” State Enterprise near Minsk comprises of two sealed trenches and two storage sites that are currently being filled. This facility accepts radioactive waste material from the “Sosny” Nuclear Research Centre and another 100 industrial, research and healthcare organisations and institutions. The site is located 2 km from the Slutch River and 1.6 km from a local lake. The site does not meet existing international standards for the engineered disposal of low/medium radioactive waste material. However, the site is located some distance away from the Dnipro River and therefore any environmental impact associated with its operation in the future is likely to be limited.
2. The “Radon” State Enterprise in Kyiv and Dnipropetrovsk operates two disposal sites. These sites accept radioactive waste and spent materials from non-energy sources, including industrial organisations, healthcare institutions and agricultural companies.
3. Numerous waste disposal or ‘temporary’ storage sites for Chornobyl-related waste materials are located in Belarus and Ukraine, the largest of them being the “Buryakovka” disposal site which comprises of 30 cells with a sealed bottom (1m natural clay layer).
These facilities are considered to have moderate local impact potential. There are no significant radioactive waste disposal/storage sites in the Russian part of the Dnipro Basin. Engineered containment arrangements at the existing radioactive waste disposal sites are considered to be adequate and capable of preventing a potential impact on the environment. However, the majority of radioactive waste storage sites at the nuclear power plants are reaching capacity.