TRANSBOUNDARY DIAGNOSTIC ANALYSIS
FOR THE CASPIAN SEA
Volume Three
THE CASPIAN ENVIRONMENT PROGRAMME
BAKU, AZ
MARCH 2002
![]()


![]()
Table of Contents
Volume Three
Annex 3.1 Supplementary Materials for Volume II, Section 1.2 Physical and Biochemical
Characteristics
Annex 3.2 Supplementary Materials for Volume II, Section 1.3 Socio-Economic &Development Setting
Annex 3.3 Supplementary Materials for Volume II, Section 1.4 Legal & Regulatory Setting
Annex 3.4 Supplementary Materials for Volume II, Section 2.1 Causal Chain Analysis
Annex 3.5 Supplementary Materials for Volume II, Section 2.2 Stakeholder Analysis &
Questionnaire
Annex 3.6 Supplementary Materials for Volume II, Section 2.3 Decline in Certain Commercial
Fish Stocks
Annex 3.7 Supplementary Materials for Volume II, Section 2.6 Water Quality Data for the
Caspian Sea
Annex 3.8 Supplementary Materials for Volume II, Section 2.6 Sediment Quality Data for the
Caspian Sea
Annex 3.9 Supplementary Materials for Volume II, Section 2.6 Contamination in Tissue in Seal
Blubber
Annex 3.10 Supplementary Materials for Volume II, Section 2.6 Selected Graphics from ASTP
Final Report
Annex 3.11 Supplementary Materials for Volume II, Section 2.7 Decline in Human Health
Bibliography
Annex 3.1
Supplemental Material for
Section 3.1 Physical and Biogeochemical Characteristics Caspian Sea
Table 3.1-1 Major sensitive habitats in the Caspian Sea Region
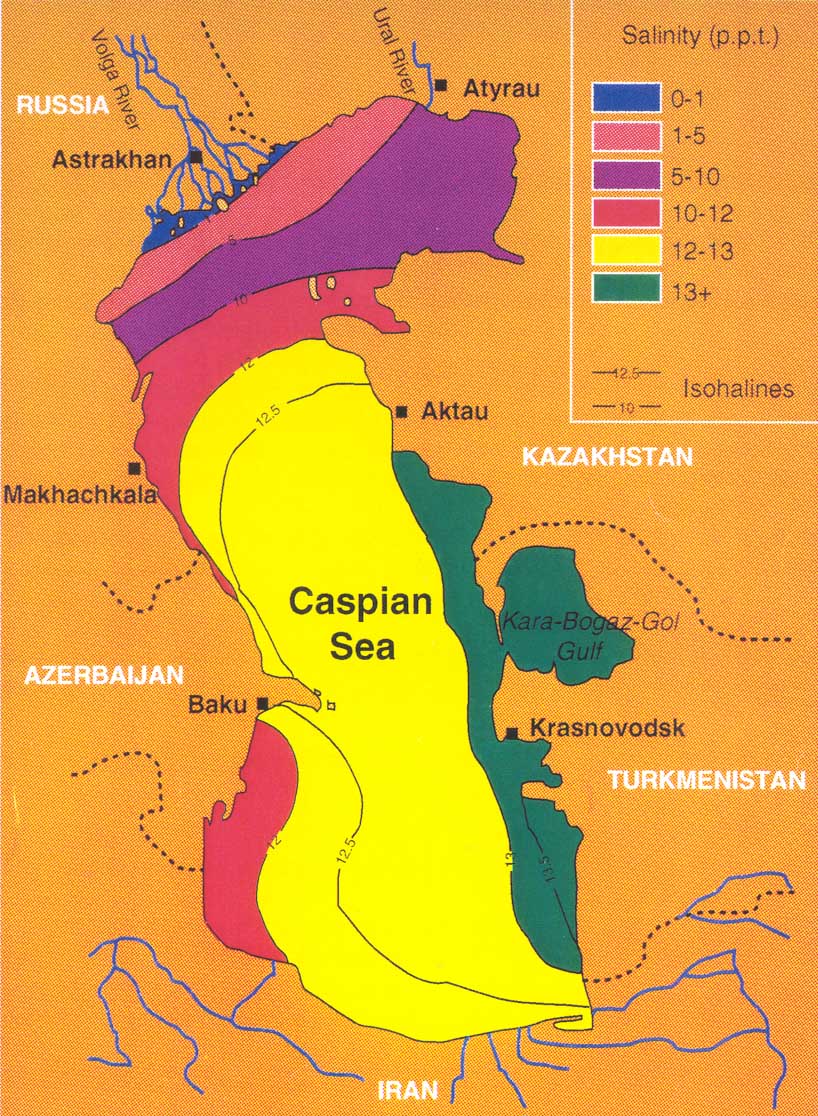
Table 3.1-1 Surface Water Salinity during summer in the Caspian Sea (Aubrey, 1994)
Table A2.2-1 Major Sensitive Habitats in the Caspian Sea Region
|
Country |
Sensitive Habitat Name |
Status |
Area ha x 1000 |
Importance |
Major Species |
Significance |
|
Azerbaijan |
Kyzylagach |
State Reserve |
88.4 |
Protection and reproduction of winter and migratory birds (.5-1 million species/year) and waterfowls |
About 250 bird species in the reserve. Among those: Francolinus francolinus, Phoenicopterus ruber, Branta rufolis and others |
Global |
|
Azerbaijan |
Maly Kizil-Agach |
Conservation Area |
10.7 |
Protect and restore wintering, migrating, and wintering waterfowl-wader and coastal birds |
|
|
|
Azerbaijan |
Shirvan |
State Reserve |
25.8 |
Protect and reproduce Gazella subgutturosa, water fowls and specific vegetation of the Shirvan lowland |
Gazella subgutturosa, Francolinus francolinus, Otis tarda, Otis tetrax |
|
|
Azerbaijan |
Byandovan |
Conservation Area |
30.0 |
Preserve Gazella subgutturosa and birds-migrants. |
Gazella subgutturosa |
|
|
Azerbaijan |
Apsheron |
Conservation Area |
0.8 |
Protect and restore migratory and wintering waterfowl – wader birds, and Caspian seal rookeries in the Azizbekov district of Baku |
|
|
|
Azerbaijan |
Glinani Island |
Conservation Area |
2.0 |
Protect migratory and wintering waterfowl birds, seagull colonies and Caspian seal rookeries |
Migratory and wintering waterfowl birds, seagull colonies and Caspian seal rookeries |
|
|
Azerbaijan |
Gobustan |
Historical Conservation Area |
|
|
|
|
Iran |
Anzali Wetland |
Not officially protected |
15.0 |
Feeding and resting station for breeding, migrating and wintering birds |
Submerged vegetation includes species of duckweed (Lemna), pondweeds (Potamogeton), (Elodea), milfoil (Myriophyllum), hornwort (Ceratophyllum) and arrowhead (Sagitaria) reed-beds of Phragmites communis and Typhas spp., with rushes (Scirpus spp. and Cyperus spp.), willow and alder (Salix spp., Alnus spp.) grebe (Podiceps cristatus), black-necked grebe (P. nigricollis), purple gallinule (Porphryio porphyrio), herons (Ardeidae), rail (Rallidae), pygmy cormorant (Phalacrocorax pygmaeus), whiskered tern (Chlidonias hybrida), coot (Fulica atra), few duck (Anatidae), swans (Cygnus spp.) |
Ramsar site |
Iran |
Bandar-e-Kiashahr lagoon and the Mouth of Sefid-rood River |
Unprotected |
0.5 |
Wintering area for waterfowl |
Grebe (Podiceps spp.), dalmatian pelican (Pelecanus crispus), greater flamingo (Phoenicopterus ruber), herons (Ardeidae), greylag goose (Anser anser), shelduck (Tadorna tadorna), gulls (Laridae) and some wades (Limicolae). It is a breeding site for cormorant (Phalacrocorax carbo) and several species of heron (Ardeidae) |
Ramsar site |
Iran |
Gorgan Bay, Lapoo-Zaghmarz Reservoirs
|
Nature Reserve |
40 |
Wintering station |
Dalmatian pelican (Pelecanus crispus), greater flamingo (Phoenicopterus ruber), greylag goose (Anser anser), lesser white fronted goose (A. erythropus), swans (Cygnus spp.), red-breasted merganser (Mergus serrator) and the rare white- headed duck (Oxyura leucocephala). heron (Ardeidae), pratincole (Glareola pratincola ) in large colonies, Kentish plover (Charadrius alexandrinus), little tern (Sterna albifrons) and a large colony of whiskered tern (Chlidonias hybrida) |
Ramsar site |
Iran |
Lavandevil |
Wildlife Refuge |
0.949 |
|
Grebe, cormorant, faisan, pintail black alder, Caspian honey-locus, Caucasian walnut |
|
Iran |
Selkeh |
Wildlife Refuge |
0.360 |
|
Dalmation pelican |
|
Iran |
Siahkeshim |
Protected Area |
4.5 |
|
Cormorant, grebe, white-fronted goose, pintail, whooper swan |
|
Iran |
Khoshkedaran |
National Natural Monument |
0.227 |
|
Herons black alder, Caucasian walnut |
|
Iran |
Miankaleh |
Wildlife Refuge |
68.8 |
|
Pelican white-fronted goose, gray lag goose, faisan, greater flamingo, white-headed duck |
|
|
Kazakhstan |
North Caspian Coast, Volga-Ural area |
|
|
|
Reed (Phragmites australis), reedmace (Typha angustifolia, T. laxa, T. minima) in water, and Arundineae – scirpus phytocoenosis (Phragmites australis, Bolboschoenus maritimus) on land, white water lily (Nymphae alba), lotus (Nelumbo nuciferum), waterbug trap (Aldrovanda vesiculosa), water chestnut (Trapa natans). Glossy Ibis (Plegadis falcinellus) – north Caspian Coastal Plain; Pink flamingo (Phoenicopterus roseus) – northeastern coast of Caspian; Whooper Swan (Cygnus cygnus) – Caspian coastal plain; Bewick’s Swan (Cygnus bewickii) – stops in North Caspian area during migration; Feruginous pochard (Aythya nyroca) – nests in northern Caspian region; white-headed duck (Oxyura leucocephala) – nests in northern Caspian; steppe eagle (Aquila rapax) ; imperial eagle (Aquila heliaca) – northern and eastern Caspian; Pallas’s sea-eagle (Haliaeetus leucoryphus) ; white-tailed sea-eagle (Haliaeetus albicilla) – nests along Ural and northern Caspian coast; purple swamphen (Porphyrio porphyrio); great bustard (Otis tarda); great black-headed gull –(Larus ichthyaetus) – Caspian Sea islands; Pallas’s sandgrouse (Syrrhaptes paradoxus) – Northern and Eastern Caspian coast |
|
|
Kazakhstan |
East Caspian Coast |
|
|
|
Short-toed snake-eagle (Circaetus gallicus); imperial eagle (Aquila heliaca); golden eagle (Aquila chrysaetus); Egyptian vulture (Neophron percnopterus); saker falcon (Falco cherrug p. 152); black-bellied sandgrouse (Pterocles orientalis p. 188) |
|
|
Kazakhstan |
Karagiye-Karakolsky |
State Reserve |
137.5 |
|
|
|
|
Kazakhstan |
Novinsky |
Nature Reserve |
45.0 |
To maintain rivers and marshes ecosystems |
Water chestnut, Caspian lotus, Astrakhan catchfly, white water lily, must rat, European beaver, Brandt hedgehog, Dalmatian pelican, flamingo, whooper-swan, little egret, squacco heron, spoonbill, scaup |
|
|
Kazakhstan |
Aktau-Buzachinsky |
Nature Reserve |
170.0 |
Conserve the fauna hunting species and endemic species |
Mouflon, some bird species, milk vetch, Ustyurt wormwood, saltwort, Persian bindweed |
|
|
Kazakhstan |
Emba Delta |
|
|
|
Otididae family, sand-grouse, order Gruiformes, birds of prey, Dalmatian pelicans, Anatidae family, swans, herons, appearance of the new species (buff-backed heron, Indian gallinule |
|
Russia |
Terek River Delta |
|
|
Spawning and fattening grounds of valuable fishes, transit routes of migratory and fluvial anadromous fishes, and bird wintering places |
|
|
Russia |
Sulak River delta |
|
|
Spawning and fattening grounds of valuable fishes, transit routes of migratory and fluvial anadromous fishes, and bird wintering places |
|
|
Russia |
Volga River Delta |
1,100 |
Protection of wetlands |
In the northern part of the wetlands there are hayfield hygrophil motley-grass-herbaceous meadows with reeds on alluvial islands. They provide grazing for farm animals, permit stockpiling of hay and are breeding grounds during floods. Waterfowl visit the flooded areas during spring migration. In the south there are reed belts and willow forests, which are habitat for cormorants and various species of herons. River-bed channels are habitat for breeding grounds for wild ducks, common pochard, coot, grey goose and red-nosed swan. |
Internation-ally important wetlands |
|
Russia |
Astrakhan Biospheric State Reserve |
State Reserve |
66.8 |
Conserving and studying the natural course of natural processes and phenomena and deltaic plant and animal gene pool, and developing scientific principles of nature protection |
Flora survey revealed 278 species: white and French willows, dewberry, commonn reed (Phragmites australis), Digraphis arundinacea (L.) Trin., sedges (Carex and C. acutiformis Ehrh.), Persian nightshade (Solanum persicum), lesser reedmace, simple bur-reed (Sparganium simplex Huds.), flowering rush, East Indian lotus (Nelumbo nucifera Gaertn.), water chestnut, floating heart (Nymphoides peltata (Gmel.) Ktze.), white water lily, yellow water lily, Salvinia natans (L.) All., lesser duckweed, spiral wild celery, water thyme, holly-leaved naiad, Chara spp., Nitellopsis obtusa enteromorpha, East Indian lotus and water chestnut (chilim), white water lily and yellow water lily. Mammals include about 30 species: insectivorous (3), Chiroptera (6), double-toothed rodents (Duplicidentata) (1), rodents (8), predatory (8), pinnipedes (Pinnipedia) (1) and even-toed ungulates (Arctiodactyla) (3). About 230 bird species are observed in the reserve, including 84 nesting species, 105 migratory and wintering species and about 40 irregular transient species. The group of wetland birds is dominated by Anseriformes (14 species). The nesting birds are: mute swan, grey-leg goose, mallard, red-crested pochard, common squacco, buff-backed, great white herons and little egret, night heron, spoonbill, glossy ibis and European cormorant. The Volga delta is a major area of massive accumulation of birds during seasonal migrations in the European continent. Dalmatian pelican, roseate pelican, spoonbill, glossy ibis, buff-backed heron, osprey, white-tailed eagle, little bustard, black-winged stilt, peregrine, golden eagle, Siberian crane, stone curlew, great bustard, black stork, flamingo, etc.) 61 fish species belonging to 2 classes and 14 families. Cyprinidae: common carp, carp-bream, roach, tench, rudd, white bream, Aspius, bleak, pike, wels, perch, pike-perch, and crucian carp. Migratory fishes, the sturgeons (Russian sturgeon, giant sturgeon, Caspain sturgeon, sturgeon) and herrings (Clupeidae spp.) |
Part of the international system of biospheric reserves performing global environmental monitoring, Ramsar site |
Russia |
Daghestankyi State Natural Reserve |
State Natural Reserve |
19.06 |
Preserve the natural state of natural complexes in the Bay of Kizlyar of the Caspian Sea and of Sarykum barkhans with the totality of their components, including animals and plants listed in the Red Books of Russia and Daghestan and valuable game species, as well as to study and protect a major migration route of migratory birds, their nesting and wintering places along the western coast of the Caspian Sea. |
Ducks (mallard, pintail, gadwall, teals, etc.), geese (bean goose, grey-lag goose), gulls, etc.; also observable are flamingo, Dalmatian and roseate pelicans, Indian gallinule, red-breasted goose, golden eagle, peregrine, little bustard and great bustard, bald coot, mute swan, mallard, teals, herons, and Charadriiformes. Abundant populations of glossy ibis, lapwing, curlew, etc. feed on swampy meadows. Little bustard and demoiselle crane, wild boar, jungle cat, racoon-dog and semidesert areas (corsac fox, steppe polecat, jerboas, fox, occasional flocks of saiga). Shallow reaches of the bay are habitat for sturgeons, Caspian sturgeon, giant sturgeon habitats and spawning grounds of common carp, carp-bream, wels, tench, perch, roach and other fish species. |
|
Russia |
The Caspian Sea coast in Daghestan and relict deltaic ecosystems |
|
|
The unique feature is the species composition, highly diverse in terms of species number and origin, of aquatic and psammophilous flora that contains Euro-Siberian and Iran-Turanian, Pontian and Ghirkanian, Caucasian and Daghestan, West Transcaucasian, Kolkhidan and Lower Volga relict and endemic species. |
Sturgeons, seals, aquatic and psammophilous flora that contains Euro-Siberian and Iran-Turanian, Pontian and Ghirkanian, Caucasian and Daghestan, West Transcaucasian, Kolkhidan and Lower Volga relict and endemic species |
|
|
Turkmenistan |
Khazar Reservation (Krasnovodsk, N. Cheleken bays) |
Natural Reserve |
262 |
To maintain the genetic fund of the bird species in danger of extinction |
280 species of Aves, 40 species of mammalia, 31 species of lizards and snakes, 2 species of amphibian, 20 species of Pisces, more than 400 species of higher plants |
Ramsar sites |
|
Turkmenistan |
Ogurchinski Island |
Natural Reserve |
7 |
|
|
|
Figure A2.2-1 Surface Water Salinity During Summer in the Caspian Sea (from Aubrey et al., 1994a)
Annex 3.2
Supplemental Material for
Section 1.3 Socio-Economic and Development Setting
Contents
Annex 3.1 1
Supplemental Material for 1
Section 3.1 Physical and Biogeochemical Characteristics Caspian Sea 1
Table 3.1-1 Major sensitive habitats in the Caspian Sea Region 1
Table 3.1-1 Surface Water Salinity during summer in the Caspian Sea (Aubrey, 1994) 1
Table A2.2-1 Major Sensitive Habitats in the Caspian Sea Region 2
Figure A2.2-1 Surface Water Salinity During Summer in the Caspian Sea (from Aubrey et al., 1994a) 9
Table A3.2-1. UNDP Human Development Index (HDI) – 1999 Data 3
Table A3.2-2. UNDP Human Development Index Trends 3
Table A3.2-3. Population Data (World Bank, 1999) 3
Table A3.2-4. Projected Population Trends (UNDP Human Development Report 2001) 3
Table A3.2-5. Expenditures for Public Health, Education, and Social Protection in Azerbaijan 4
Table A3.2-6. Population in the Coastal Zone 4
Table A3.2-7. Cities and Towns in the Coastal Zone 5
Table A3.2-8. Azerbaijan: Dynamics of Population Number in 1999 (Coastal Profile) 5
Table A3.2-9. Education System in Caspian Coastal Zone 5
Table A3.2-10. Azerbaijan: Characteristics of Education System for 1999 (Coastal Profile) 6
Table A3.2-11. Principal Indices of Education in Azerbaijan 7
Table A3.2-12. Employment Characteristics in Caspian Hinterland 7
Table A3.2-13. Azerbaijan: Labor Resources and Population Employment in 1999 8
Table A3.2-14. Dynamics of Living Standards in CEZ in Russian Federation 8
Table A3.2-15. Employment in Turkmenistan CEZ (Balkan Province) 9
Table A3.2-16. Economic Indicators in Caspian Hinterland 9
Table A3.2-17. Main Social-Economic Indexes of the Development of Kazakhstan Republic 9
Table A3.2-18. Kazakhstan Income Data 10
Table A3.2-19. The industrial mix for CEZ (1999) in Russian Federation 11
Table A3.2-20. Turkmenistan (in the province of Balkan) Industry (5200 manat = $1) 11
Table A3.2-21. Areas Under Cultivation in Caspian Region 12
Table A3.2-22. Agricultural Production in the Caspian Region 12
Table A3.2-23. Agricultural Output in Iran CEZ 12
Table A3.2-24. Chemical Fertilizer Used in the Northern Provinces of Iran (1990) 13
Table A3.2-25. The Number of Employees in the Agricultural Sector in Iran 13
Table A3.2-26 Agricultural Indices in CEZ of Russian Federation 13
Table A3.2-27 Structure of Livestock Population in All Management Categories in the Balkan Province of Turkmenistan 14
Table A3.2- 28 Fishing Industry Statistics in the Caspian Region 14
Table A3.2-29 Industrial Production in the Caspian Region 14
Table A3.2-30 Distribution of Industrial Facilities in Iran 14
Table A3.2-31 Industrial Mix for CEZ of the Russian Federation (1999) 15
Table A3.2-32 Oil and Gas Activities in the Caspian Region 16
Table A3.2-33 Production of Oil in Azerbaijan (million tons) 16
Table A3.2-34 Outputs of Oil and Power Complex in the Balkan Province of Turkmenistan 17
Table A3.2-35 Water Use in the Caspian Coastal Zone 17
Table A3.2-36. Azerbaijan: Generalized Indices on the Centralized Water Supply and Drainage for 1999 (m.m3) 17
Table A3.2-37 Azerbaijan: Irrigated Lands Distribution (thousand ha) 18
Table A3.2-38 Azerbaijan: Indices of Irrigated Lands Use 18
Table A3.2-39 Urbanization Trends (UNDP Human Development 2001 and Country Socio -Economic Reports) 18
Table A3.2-40 Possibilities for Tourism in the Caspian Coastal Zone 19
Annex 3.3 1
Supplemental Material for 1
Section 3.3 Legal and Regulatory Setting 1
Table A3.3-2 International Environmental Conventions Ratified by the Republic of Azerbaijan 3
Table A3.3-4 International Environmental Conventions and Agreements Ratified by the Republic of Kazakhstan (as of June 1, 2001) 4
Table 3.5-1 Decline in Fisheries 4
Table 3.5-2 Decline in Environmental Quality 6
Table 3.5-3 Decline in Biodiversity 8
Table 3.5-4 Decline in Human Health 10
Table 3.5-5 Decline in Infrastructure 12
Table 3.5-6 Degradation of Coastal Landscape 14
Table 3.5-7 Emerging Issue: Increase in Pollution from Oil and Gas Activities 15
Table 3.5-8 Introduction of Exotic Species 17
Table 3.11-1 Commitment to Health: Access, Services and Resources (UNDP Human Development Report 2001) 3
Table 3.11-2 Leading Global Health Crises and Challenges (UNDP Human Development Report 2001) 3
Table 3.11-3 Access to Healthcare in Caspian Coastal Zones 4
Table 3.11-4 Survival Rates (UNDP Human Development Report 2001) 4
Table 3.11-5 Principal indices of the public health in Azerbaijan 4
Table 3.11-6 Azerbaijan: Deaths attributed to illnesses in 1999. (Number of diseases per 100,000) (Coastal Profile) 5
Table 3.11-7 Disease Rates in Kazakhstan (per 100,000 people) 6
Table A3.2-1. UNDP Human Development Index (HDI) – 1999 Data
|
|
Life expectancy at birth (years) |
Adult literacy rate (% age 15 and above) |
GDP per capita (PPP US$) |
Human Development Index Value |
HDI Rank |
|
Azerbaijan |
71.3 |
97.0 |
2,850 |
0.738 |
79 |
|
I.R. Iran |
68.5 |
75.7 |
5,531 |
0.714 |
90 |
|
Kazakhstan |
64.4 |
99.0 |
4,951 |
0.742 |
75 |
|
Russian Fed. |
66.1 |
99.5 |
7,473 |
0.775 |
55 |
|
Turkmenistan |
65.9 |
98.0 |
3,347 |
0.730 |
83 |
GDP: gross national product
PPP: per person parity
Table A3.2-2. UNDP Human Development Index Trends
|
|
1975 |
1980 |
1985 |
1990 |
1995 |
1999 |
|
Azerbaijan |
-- |
-- |
-- |
-- |
-- |
0.738 |
|
I.R. Iran |
0.556 |
0.563 |
0.607 |
0.645 |
0.688 |
0.714 |
|
Kazakhstan |
-- |
-- |
-- |
-- |
-- |
0.742 |
|
Russian Fed. |
-- |
0.809 |
0.826 |
0.823 |
0.778 |
0.775 |
|
Turkmenistan |
-- |
-- |
-- |
-- |
-- |
0.730 |
Table A3.2-3. Population Data (World Bank, 1999)
|
|
Population total (millions) |
Population density (people per square km) |
Population growth (annual %) |
Fertility rate (births per woman) |
Infant mortality rate (per 1000) |
|
Azerbaijan |
8.0 |
92.2 |
0.9 |
2.0 |
16.2 |
|
I.R. Iran |
63.0 |
38.8 |
1.7 |
2.7 |
25.5 |
|
Kazakhstan |
14.9 |
5.6 |
-1.0 |
2.0 |
21.7 |
|
Russian Fed. |
146.2 |
8.7 |
-0.4 |
1.3 |
16.0 |
|
Turkmenistan |
4.8 |
10.2 |
1.3 |
2.8 |
32.7 |
Table A3.2-4. Projected Population Trends (UNDP Human Development Report 2001)
|
|
Pop. total (mill-ions) 1999 |
Pop. total (mill-ons) 2015 |
Annual pop. growth rate (%) 1999-2015 |
Pop. under age 15 (% of total) 1999 |
Pop. under age 15 (% of total) 2015 |
Pop. aged 65 and above (% of total) 1999 |
Pop. aged 65 and above (% of total) 2015 |
|
Azerbaijan |
8.0 |
8.7 |
0.6 |
30.0 |
17.5 |
6.5 |
8.1 |
|
I.R. Iran |
69.2 |
87.1 |
1.4 |
38.7 |
27.2 |
3.3 |
5.0 |
|
Kazakhstan |
16.3 |
16.0 |
-1.0 |
27.6 |
22.2 |
6.8 |
8.1 |
|
Russian Fed. |
146.2 |
133.3 |
-0.6 |
18.7 |
13.6 |
12.3 |
13.8 |
|
Turkmenistan |
4.6 |
6.1 |
1.7 |
38.2 |
28.4 |
4.2 |
4.5 |
Table A3.2-5. Expenditures for Public Health, Education, and Social Protection in Azerbaijan
|
Expenditures |
1992 |
1993 |
1994 |
1995 |
1996 |
1997 |
1998 |
1999 |
|
Total expenditures in ratio to GDP, including project loans |
48.4 |
55.9 |
46.0 |
29.0 |
21.3 |
21.3 |
20.0 |
24.9 |
|
Expenditures for public education |
|
|
|
|
|
|
|
|
|
Share of GDP |
6.4 |
7.1 |
4.9 |
3.5 |
3.7 |
3.6 |
3.5 |
4.8 |
|
Share of total public expenditures |
13.2 |
12.7 |
10.7 |
12.2 |
17.5 |
16.8 |
17.7 |
19.3 |
|
Valid indexes (1992=100)а |
100.0 |
85.3 |
47.3 |
30.0 |
32.1 |
32.6 |
35.4 |
51.8 |
|
Public expenditures for public health |
|
|
|
|
|
|
|
|
|
Share of GDP |
2.7 |
3.3 |
2.4 |
1.4 |
1.5 |
1.2 |
1.0 |
1.1 |
|
Share of total public expenditures |
|
|
|
4.8 |
6.9 |
5.8 |
4.8 |
4.5 |
|
Valid indexes (1992=100)а |
100.0 |
94.0 |
54.9 |
28.0 |
30.0 |
26.5 |
22.9 |
28.9 |
|
Social Protection Fund |
|
|
|
|
|
|
|
|
|
Share of GDP |
10.4 |
16.5 |
8.6 |
5.0 |
5.8 |
5.3 |
5.9 |
6.9 |
|
Share of total public expenses |
21.4 |
29.6 |
18.7 |
17.3 |
27.1 |
25.0 |
29.3 |
27.6 |
|
Valid indexes (1992=100)а |
100.0 |
122.7 |
51.2 |
26.3 |
30.6 |
30.0 |
36.3 |
45.7 |
|
Share of GDP |
1.7 |
3.4 |
2.6 |
1.6 |
2.5 |
1.8 |
2.1 |
0.7 |
|
Share of total public expenses |
3.4 |
6.2 |
5.6 |
5.6 |
11.7 |
8.3 |
10.5 |
2.8 |
|
Valid indexes (1992=100)а |
100.0 |
159.3 |
95.3 |
53.5 |
82.7 |
62.1 |
81.5 |
29.3 |
а Using GDP deflator Source: World Bank, International Monetary Fund, Ministry of Finance
Table A3.2-6. Population in the Coastal Zone
|
|
Provinces |
Population (thousands) |
Population density |
Population growth rate |
Urban population |
Rural population |
Azerbaijan |
Guba-Khachmaz |
441.5 |
|
|
137.1 |
304.4 |
|
Apsheron |
2201.1 |
|
|
2141.3 |
59.8 |
|
|
Central-Aran |
605.4 |
|
|
228.3 |
377.1 |
|
|
Lenkoran |
730.5 |
|
|
730.5 |
563.0 |
|
I.R. Iran |
Gilan |
2204.0 (1991) |
157/km2 |
0.75% |
883.8 |
1320.2 |
|
Mazandaran |
3793.1 (1991) |
|
1.65% |
|
|
|
Kazakhstan |
Atyrau |
439.3 (1999) |
|
|
255.9 |
183.4 |
|
Mangistau |
316.3 (1999) |
|
|
248.5 |
67.8 |
|
|
Russian Fed. |
Astrakhan |
1026 (1999) |
23.0/km2 |
|
|
|
|
Dagestan |
2144 (1999) |
42.6/km2 |
|
900.5 |
1243.5 |
|
|
Kalmykia |
316 (1999) |
4.1/km2 |
|
|
|
|
|
Turkmenistan |
Balkan |
411.3 |
|
|
324.9 |
86.4 |
Table A3.2-7. Cities and Towns in the Coastal Zone
|
Countries and areas |
Population in coastal zone (50km strip) |
Population in coastal zone (50 to 150km strip) |
||||||
|
Number of towns |
Population (thousands) |
Density (per km2) |
Number of towns |
Population (thousands) |
Density (per km2) |
|||
|
Total |
Cities |
Total |
Cities |
|||||
|
Russia, including |
23 |
1 |
1430 |
382.8 |
7 |
- |
125 |
16.7 |
|
Astrakhan |
7 |
1 |
795 |
706.6 |
1 |
- |
5 |
2.2 |
|
Kalmykia |
1 |
- |
25 |
46.2 |
1 |
- |
5 |
5.0 |
|
Daghestan |
15 |
- |
610 |
1314.6 |
5 |
- |
115 |
320.1 |
|
Azerbaijan |
21 |
1 |
3275 |
1266.9 |
6 |
- |
130 |
25.1 |
|
Iran |
22 |
- |
2005 |
543.3 |
9 |
1 |
3455 |
468.1 |
|
Turkmenistan |
15 |
- |
165 |
31.8 |
9 |
- |
135 |
13.1 |
|
Kazakhstan |
10 |
- |
230 |
32.3 |
10 |
- |
90 |
6.3 |
The World Atlas - London: Dorling Kindersley Limited Publishing House, 1997. – p 338.
Table A3.2-8. Azerbaijan: Dynamics of Population Number in 1999 (Coastal Profile)
|
Population Indices |
Economic-geographical regions |
Total by coastal zone |
||||
|
Guba-Khachmaz |
Apsheron |
Central Aran |
Lenkoran |
|||
|
Baku and Sumgayit |
Rural area |
|||||
|
Birth rate |
16.5 |
12.2 |
14.6 |
15.8 |
15.9 |
15.0 |
|
Death rate |
6.6 |
4.9 |
4.9 |
6.2 |
5.9 |
5.7 |
|
Natural population increase |
9.9 |
7.3 |
9.7 |
9.6 |
10.0 |
9.3 |
|
Infant death rate under 1 year (per thousand newborns) |
17.6 |
15.1 |
14.4 |
13.1 |
14.5 |
14.9 |
Table A3.2-9. Education System in Caspian Coastal Zone
|
Country |
Province |
% of pre-school children provided with education |
% of school children provided with education |
Number of universities |
Literacy rate % |
Literacy rate for women % |
Govt. funding for education - % of nat’l expenditure |
Azerbaijan |
Guba-Khachmaz |
|
|
1 |
|
|
17.5 |
|
Apsheron |
|
|
30 |
|
|
|
|
|
Central-Aran |
|
|
1 |
|
|
|
|
|
Lenkoran |
|
|
1 |
|
|
|
|
I.R. Iran |
Gilan |
|
73.3 |
|
74.5 |
67 |
20 |
|
Mazandaran |
|
|
|
|
|
|
|
Kazakhstan |
Atyrau |
|
|
|
|
|
|
|
Mangistau |
|
|
|
|
|
|
|
|
Russian Fed. |
Astrakhan |
60 |
69 |
|
|
|
|
|
|
Dagestan |
30 |
70 |
|
|
|
|
|
|
Kalmykia |
50 |
85 |
|
|
|
|
Turkmenistan |
Balkan |
|
|
|
|
|
|
Table A3.2-10. Azerbaijan: Characteristics of Education System for 1999 (Coastal Profile)
|
Geographic regions |
Elementary institutions |
Secondary, special institutions |
Higher education institutions |
|||
|
schools, gymnas-iums |
number of teachers, per thousand persons |
technical secondary school, specialized schools, colleges |
number of teachers, per thousand persons |
univer-sities, institu-tions |
number of teachers, per thousand persons |
|
|
Guba-Khachmaz, including regions: |
426 |
94.6 |
4 |
1.1 |
1 |
0.1 |
|
Guba |
144 |
29.6 |
1 |
0.3 |
1 |
0.1 |
|
Gusar |
90 |
20.0 |
1 |
0.5 |
- |
- |
|
Khachmaz |
118 |
28.8 |
- |
- |
- |
- |
|
Devechi |
48 |
9.2 |
1 |
0.2 |
- |
- |
|
Siazan |
26 |
7.0 |
1 |
0.1 |
- |
- |
|
Apsheron, including cities: |
465 |
462.8 |
26 |
16.1 |
30 |
91.5 |
|
Baku |
343 |
372.3 |
15 |
12.1 |
29 |
88.9 |
|
Sumgayit |
54 |
62.6 |
9 |
3.6 |
1 |
2.6 |
|
regions: Khyzy |
14 |
2.8 |
- |
- |
- |
- |
|
Apsheron |
24 |
18.1 |
1 |
0.3 |
- |
- |
|
Gobustan |
30 |
7.0 |
1 |
0.1 |
- |
- |
|
Central Aran |
310 |
130.2 |
8 |
1.3 |
- |
- |
|
Including Ali-Bairamly |
15 |
12.9 |
2 |
0.5 |
- |
- |
|
regions: Ajigabul |
25 |
10.1 |
- |
- |
- |
- |
|
Sabirabad |
84 |
32.1 |
3 |
0.4 |
- |
- |
|
Saatly |
46 |
18.5 |
- |
- |
- |
- |
|
Saliyany |
50 |
23.5 |
- |
- |
- |
- |
|
Neftchala |
55 |
14.9 |
3 |
0.4 |
- |
- |
|
Belysuvar |
35 |
18.2 |
- |
- |
- |
- |
|
Lenkoran |
564 |
167.9 |
10 |
2.7 |
1 |
1.7 |
|
including regions: Jalilabad |
128 |
38.1 |
2 |
0.3 |
- |
- |
|
Massaly |
99 |
40.4 |
1 |
0.2 |
- |
- |
|
Lenkoran |
88 |
41.0 |
4 |
0.8 |
1 |
1.7 |
|
Lerik |
111 |
15.2 |
1 |
0.2 |
- |
- |
|
Yardimly |
78 |
12.6 |
1 |
0.3 |
- |
- |
|
Astara |
60 |
20.6 |
1 |
0.9 |
- |
- |
|
Total by coastal zone: |
2129 |
855.5 |
48 |
21.2 |
32 |
93.3 |
Table A3.2-11. Principal Indices of Education in Azerbaijan
|
Education indices |
1990-1991 |
1998 - 1999 |
Change (in %) |
|
Total number of enrolled (in thousands) |
|
|
|
|
Pre-school facilities |
180.9 |
116.1 |
- 35.8 |
|
Primary and secondary schools |
1.344200 |
1.606400 |
-19.5 |
|
Specialized secondary |
58.0 |
35.7 |
-38.5 |
|
Vocational schools |
73.0 |
25.4 |
-65.2 |
|
Universities |
105.1 |
85.7 |
-18.4 |
|
Public expenditures for education: |
|
|
|
|
in share to GDP |
6.7 (1992) |
3.5 (1998) |
- 47.8 |
|
in share to total public expenditures |
13.9 (1992) |
17.5 (1998) |
25.9 |
Table A3.2-12. Employment Characteristics in Caspian Hinterland
|
|
Provinces |
Population |
Workforce |
Number of Unemployed |
Employed in Industrial Sector |
Employed in Agricultural Sector (%) |
Employed by Services Sector |
Azerbaijan |
Guba-Khachmaz |
|
|
|
|
|
|
|
Apsheron |
|
|
|
|
|
|
|
|
Central-Aran |
|
|
|
|
|
|
|
|
Lenkoran |
|
|
|
|
|
|
|
I.R. Iran |
Gilan |
|
631,520 (1996) |
70,730 |
20.48 |
(39.36) |
38.51 |
|
Mazandaran |
|
994,425 (1996) |
111,376 |
22.51 |
(36.52) |
39.46 |
|
Kazakhstan |
Atyrau |
439,300 (1999) |
195,928 |
|
25.1 |
(8.8) |
66.1 |
|
Mangistau |
316,300 (1999) |
148,345 |
|
28.9 |
(8.2) |
62.9 |
|
|
Russian Fed. |
Astrakhan |
1,026,000 (1998) |
461,000 |
73,000 (15.8%) |
No data |
61,000 (15.7%) |
|
|
Dagestan |
2,144,000 (1998) |
703,000 |
211,000 (30.0%) |
107,000 (21.7%) |
88,000 (17.9%) |
|
|
|
Kalmykia |
316,000 (1998) |
147,000 |
45,000 (30.6%) |
12,000 (11.8%) |
52,000 (51.0%) |
|
|
Turkmenistan |
Balkan |
|
|
>150,000 |
|
|
|
Table A3.2-13. Azerbaijan: Labor Resources and Population Employment in 1999
(per thousand) (Coastal Profile)
|
Region |
Labor resources |
Employed population |
Officially registered unemployed (persons) |
||
|
Total |
Industrial sector |
Non-industrial sector |
|||
|
Guba-Khachmaz EGR, including: |
221.4 |
138.5 |
112.0 |
26.5 |
1620 |
|
-Guba |
66.1 |
49.7 |
43.5 |
6.2 |
176 |
|
-Gusar |
40.7 |
28.9 |
22.9 |
6.0 |
529 |
|
-Khachmaz |
72.8 |
37.6 |
29.3 |
8.3 |
437 |
|
-Devechi |
22.0 |
12.5 |
9.0 |
3.5 |
355 |
|
-Siazan |
19.8 |
9.8 |
7.3 |
2.5 |
123 |
|
Apsheron EGR, including: |
1192.7 |
696.6 |
373.0 |
323.6 |
4200 |
|
cities: |
|
||||
|
-Baku |
959.5 |
560.6 |
311.1 |
249.5 |
3865 |
|
-Sumgayit |
161.7 |
93.1 |
29.3 |
63.8 |
251 |
|
regions: |
|
||||
|
-Khyzy |
5.0 |
3.4 |
2.3 |
1.1 |
24 |
|
-Apsheron |
500.0 |
37.0 |
28.8 |
8.2 |
35 |
|
-Gobustan |
16.5 |
2.5 |
1.5 |
1.0 |
25 |
|
Central-Aran EGR, including: |
297.8 |
178.6 |
135.6 |
43.0 |
2068 |
|
-Ali-Bairamly city |
58.2 |
16.1 |
6.1 |
10.0 |
586 |
|
regions: |
|
||||
|
-Ajigabul |
27.6 |
14.0 |
7.4 |
6.6 |
508 |
|
-Sabirabad |
73.5 |
35.2 |
27.4 |
7.8 |
337 |
|
-Saatly |
47.3 |
29.0 |
26.1 |
2.9 |
121 |
|
-Salyan |
42.0 |
39.7 |
33.5 |
6.2 |
214 |
|
-Neftchala |
32.5 |
23.1 |
17.2 |
5.9 |
120 |
|
-Bilasuvar |
36.7 |
21.5 |
17.9 |
3.6 |
396 |
|
Lenkoran EGR, including regions: |
356.3 |
208.0 |
165.4 |
42.6 |
1700 |
|
-Jalilabad |
81.6 |
52.4 |
46.4 |
6.0 |
251 |
|
-Masally |
83.0 |
32.0 |
26.5 |
5.5 |
292 |
|
-Lenkoran |
95.6 |
54.6 |
34.8 |
19.8 |
617 |
|
-Lerik |
30.5 |
19.5 |
15.8 |
3.7 |
66 |
|
-Yardymly |
24.6 |
8.6 |
6.3 |
2.3 |
408 |
|
-Astara |
41.0 |
40.0 |
35.6 |
5.3 |
146 |
|
Total on coastal zone |
2068.2 |
1221.7 |
786.0 |
435.7 |
9588 |
Table A3.2-14. Dynamics of Living Standards in CEZ in Russian Federation
|
|
Population with income under poverty line |
Living standard decline |
||||
|
1994 |
1995 |
1996 |
1997 |
1998 |
||
|
Daghestan |
No data |
No data |
No data |
53,9%: |
58,1% |
4,2% for 97-98 |
|
Kalmykia |
37% |
60,3% |
59,2% |
46% |
60,1% |
23,1% for 94-98 , & 14,1% for 97-98 |
|
Astrakhan Province |
No data |
No data |
No data |
27,8% |
34,4% |
6,6% for 97-98 |
Table A3.2-15. Employment in Turkmenistan CEZ (Balkan Province)
|
State enterprises and Institutions |
Agricultural Associations |
Private and Joint Companies, Cooperatives |
Households |
|
94,600 |
19,600 |
12,600 |
45,000 |
Table A3.2-16. Economic Indicators in Caspian Hinterland
|
|
Provinces |
GDP in USD |
GDP per capita |
%GDP from Industrial Sector |
%GDP from Agricul-tural Sector |
%GDP from Services Sector |
Azerbaijan |
Guba-Khachmaz |
|
|
|
|
|
|
Apsheron |
|
|
|
|
|
|
|
Central-Aran |
|
|
|
|
|
|
|
Lenkoran |
|
|
|
|
|
|
I.R. Iran |
Gilan |
|
|
|
|
|
|
Mazandaran |
|
|
|
|
|
|
Kazakhstan |
Atyrau (1999) |
1,219,960,000 |
2,760 |
67% (entire CEZ) |
1% (entire CEZ) |
17% (entire CEZ) |
|
Mangistau (1999) |
606,410,000 |
1,910 |
|
|
|
|
|
Russian Fed. |
Astrakhan |
|
|
|
|
|
|
Dagestan |
|
|
|
|
|
|
|
Kalmykia |
|
|
|
|
|
|
Turkmen-istan |
Balkan |
|
|
|
|
|
Table A3.2-17. Main Social-Economic Indexes of the Development of Kazakhstan Republic
(in % of the previous year)
|
|
1994 |
1995 |
1996 |
1997 |
1998 |
1999 |
|
Gross Domestic Product (GDP) |
87.4 |
91.8 |
100.5 |
101.7 |
98.1 |
101.7 |
|
Volume of industrial production (works and services) |
71.9 |
91.8 |
100.3 |
104.0 |
97.6 |
102.2 |
|
Overall agricultural production |
79.0 |
45.6 |
95.0 |
99.2 |
81.1 |
128.9 |
|
Investments in the main capital |
85.0 |
57.5 |
60.1 |
111.6 |
141.9 |
103.8 |
|
Retail commodity circulation |
47.0 |
85.6 |
133.3 |
129.3 |
119.1 |
106.8 |
|
Turnover of the foreign trade, |
… |
145.0 |
108.1 |
108.4 |
91.9 |
82.0 |
|
including: |
|
|
|
|
|
|
|
Export |
… |
166.9 |
113.7 |
107.0 |
84.1 |
95.2 |
|
Import |
… |
130.4 |
103.4 |
109.7 |
99.0 |
71.7 |
|
Average money income per person |
1431.4 |
272.7 |
137.8 |
120.2 |
106.0 |
112.8 |
|
Average money expenses per person |
1431.4 |
272.7 |
137.8 |
120.2 |
106.0 |
112.8 |
|
Real disposable money income |
… |
99.4 |
100.6 |
103.0 |
99.8 |
104.4 |
|
Index of consumer prices (for the end of period in % to December of the previous year) |
1258.3 |
160.3 |
128.7 |
111.2 |
101.9 |
117.8 |
|
Official unemployment level in % to the economically active part of the population (for the end of period) |
1.1 |
2.1 |
4.2 |
3.8 |
3.7 |
3.9 |
Table A3.2-18. Kazakhstan Income Data
|
Income of population |
1995 |
1996 |
1997 |
1998 |
1999 |
Atyrau Region |
|
|
|
|
|
|
Average monthly per capita income of population, in US$ (tenge) |
26.21 (1597) |
32.38 (2179) |
36.88 (2782) |
40.28 (3154) |
31.61 (3782) |
|
Monetary expenditures of population (monthly average per capita), US$ (tenge) |
25.29 (1541) |
33.08 (2226) |
37.53 (2831) |
40.45 (3167) |
31.82 (3808) |
|
Average monthly calculated wage of employees in economy, US$ (tenge) |
99.66 (6072.7) |
130.15 (8758.4) |
166.08 (12525.9) |
182.83 (14314) |
174.15 (20836) |
Mangistau Region |
|
|
|
|
|
|
Average monthly per capita income of population, in US$ (tenge) |
60.93 (2444) |
43.27 (2912) |
52.06 (3927) |
55.23 (4324) |
34.48 (4126) |
|
Monetary expenditures of population (monthly average per capita), US$ (tenge) |
4101 (2499) |
43.46 (2925) |
50.94 (3842) |
54.22 (4245) |
34.36 (4112) |
|
Average monthly calculated wage of employees in economy, US$ (tenge) |
163.81 (9981) |
215.32 (14489) |
241.35 (18203) |
220.41 (17256) |
160.36 (19186) |
|
Kazakhstan |
|
|
|
|
|
|
Average monthly per capita income of population, in US$ (tenge) |
28.23 (1720.5) |
35.23 (2370.8) |
37.77 (2848.9) |
38.57 (3020.1) |
28.48 (3408.0) |
|
Monetary expenditures of population (monthly average per capita), US$ (tenge) |
27.76 (1691.9) |
34.44 (2317.7) |
36.72 (2769.8) |
38.21 (2991.8) |
27.81 (3327.3) |
|
Average monthly calculated wage of employees in economy, US$ (tenge) |
78.54 (4786) |
101.66 (6841) |
113.24 (8541) |
123.68 (9683) |
94.08 (11256) |
Table A3.2-19. The industrial mix for CEZ (1999) in Russian Federation
|
|
Daghestan |
Kalmykia |
Astrakhan Province |
|
Commodity output (bln rubles) |
3.8 |
0.91 |
10.6 |
|
Power industry |
25.3% |
36.7% |
No data |
|
Fuel industry |
15.7% |
23.1% |
32.7% |
|
Construction materials |
9.3% |
9.1% |
No data |
|
Engineering |
14.1% |
6.0% |
12.4% |
|
Light industry |
4.3% |
1.2% |
No data |
|
Food industry |
22.3% |
20% |
23.6% |
|
Percentage of unprofitable firms |
64.8% |
71.5% |
47% |
Table A3.2-20. Turkmenistan (in the province of Balkan) Industry (5200 manat = $1)
|
Industry/company |
Effective prices for 1999 (billion manat) |
Growth rate in 1999 in % to 1998 |
|
Electric power TEPP Turkmenbashi PA “Balkanenergo” |
350.0 22.7 |
123 34 |
|
Oil TMPP Oil and gas producing |
340.4 1051.9 |
88 108 |
|
Chemical and petrochemical JV “Turkmensintez” Boyadag Iodine producing plant Balkan Iodine producing plant Khazar Chemical Plant PA “Gorabogazgolsulfat” |
0.8 1.2 6.3 7.1 9.1 |
124
126 71 79 |
EngineeringCable producing plant (Balkanabad) JV “B/Energoremont” Railway-car repair works |
5.3 1.3 6.9 |
100 132 106 |
|
Building material industry |
22.5 |
104 |
|
Food |
138.9 |
143 |
|
Light |
19.5 |
113 |
|
Printing |
1.3 |
100 |
Table A3.2-21. Areas Under Cultivation in Caspian Region
|
|
Provinces |
Agriculture (thousand hectares) |
Grain Production (thousand tons) |
Cotton Production (thousand tons) |
Cattle (thousands) |
Sheep and Goats (thousands) |
|
Azerbaijan |
Guba-Khachmaz |
|
|
|
|
|
|
Apsheron |
|
|
|
|
|
|
|
Central-Aran |
|
|
|
|
|
|
|
Lenkoran |
|
|
|
|
|
|
|
I.R. Iran |
Gilan |
300.5 |
|
|
1,004* |
3,445* |
|
Mazandaran |
1201.9 |
|
|
|
|
|
|
Kazakhstan |
Atyrau |
|
10.4 |
|
91.7 |
396 |
|
Mangistau |
|
0 |
|
5.1 |
300 |
|
|
Russian Fed. |
Astrakhan |
481 (295 of which are pastrue) |
|
|
253 |
862.5 |
|
Dagestan |
640.4 (185.7 of which are tilled) |
|
|
|
|
|
|
Kalmykia |
|
|
|
|
1723 |
|
|
Turkmenistan |
Balkan |
60 (1999) |
111 |
15 |
57 |
993 |
*For the entire Iranian Caspian region
Table A3.2-22. Agricultural Production in the Caspian Region
|
Azerbaijan |
I.R. Iran |
Kazakhstan |
Russian Fed. |
Turkmenistan |
|
|
Wheat |
Cattle |
Cattle |
Grain |
|
|
Barley |
Horses |
Sheep |
Cotton |
|
|
Beans and peas |
Sheep |
Horses |
Potato |
|
|
Rice |
Fodder |
Vegetables |
Melon |
|
|
Vegetables |
Wheat |
Wheat |
Pumpkin |
|
|
Melons |
|
Corn |
Cattle |
|
|
Herbs |
|
Wine |
Sheep |
|
|
Citrus plants |
|
Rice |
Goats |
|
|
|
|
Potato |
|
Table A3.2-23. Agricultural Output in Iran CEZ
|
Crops |
Cultivated Land (1000 Hectares) |
Product (1000 Tons) |
|
Wheat |
349.8 |
647 |
|
Barley |
159.5 |
203 |
|
Rice |
496.5 |
2571 |
|
Cotton |
146 |
257.8 |
|
Oily Seeds |
98.5 |
94.7 |
|
Tea |
35 |
278 |
|
Total |
1285.3 |
4051.5 |
Table A3.2-24. Chemical Fertilizer Used in the Northern Provinces of Iran (1990)
|
|
Mazandaran |
Gilan |
Total |
|||
|
Fertilizer |
Amount |
% |
Amount |
% |
Amount |
% |
|
Ura |
85675 |
45.04 |
31249 |
60.61 |
116924 |
48.36 |
|
Amonium Nitrate |
1335 |
0.70 |
1723 |
3.34 |
3058 |
1.26 |
|
Amonium Sulphate |
952 |
0.50 |
2460 |
4.77 |
3412 |
1.41 |
|
Amonium Phosphate |
97254 |
51.12 |
15576 |
30.22 |
112830 |
46.66 |
|
Super Phosphate Tripol |
2400 |
1.26 |
1 |
0.001 |
2401 |
0.99 |
|
Potassium Sulphate |
2590 |
1.36 |
544 |
1.05 |
3134 |
1.29 |
|
Others |
11 |
0.005 |
- |
- |
11 |
0.03 |
|
Total (kg) |
190217 |
100 |
51553 |
100 |
241770 |
100 |
Table A3.2-25. The Number of Employees in the Agricultural Sector in Iran
|
|
Total persons employed more than 10 years |
Total |
Total agriculture persons employed more than 10 years |
Total |
Persons employed in agriculture sector |
% of Total Employed persons |
|||
|
|
Female |
Male |
|
Female |
Male |
|
Female |
Male |
|
|
Mazandaran |
76097 |
501745 |
577843 |
44015 |
320427 |
364442 |
57.8% |
63.8% |
63% |
|
Gilan |
-- |
-- |
612644 |
-- |
-- |
253311 |
-- |
-- |
41.3% |
|
Total |
-- |
-- |
1190486 |
-- |
-- |
617753 |
-- |
-- |
51.9% |
Table A3.2-26 Agricultural Indices in CEZ of Russian Federation
|
|
Number of farms by years (thousands) |
Size of farms, ha |
Increase in number of farms in 3 years, % |
||
|
|
1994 |
1995 |
1996 |
||
|
Russia |
270.0 |
279.2 |
280.1 |
42-43 |
3.7 |
|
Povolzhsky economic region, incl.: |
|
|
35.8 |
|
|
|
Republic of Kalmykia |
1.5 |
1.6 |
1.8 |
440-413 |
14.0 |
|
Astrakhan oblast |
1.8 |
1.95 |
1.95 |
122-128 |
6.1 |
|
North-Caucasian economic region, incl.: |
|
73.5 |
79.2 |
19-20 |
|
|
Repubic of Dagestan |
11.4 |
13.6 |
16.6 |
3-2 |
46.0 |
Share (%) of production of main kinds of agricultural products by farms, 1995 (farms of all categories)
Table A3.2-27 Structure of Livestock Population in All Management Categories in the Balkan Province of Turkmenistan
|
Livestock |
Through 01 January 1999 |
Through 01 January 2000 |
||||
|
Total |
State owned |
Private |
Total |
State owned |
Private |
|
|
Cattle |
55347 |
4647 |
50700 |
57309 |
5509 |
51800 |
|
Sheep and goats |
989348 |
251148 |
738200 |
993382 |
288082 |
710300 |
|
Camels |
29509 |
4809 |
24700 |
33451 |
5751 |
27700 |
|
Poultry |
29038 |
1938 |
27100 |
85746 |
3146 |
82600 |
|
Horse |
3503 |
1203 |
2300 |
3544 |
1344 |
2200 |
Table A3.2- 28 Fishing Industry Statistics in the Caspian Region
|
|
Number of fishermen employed |
Number of boats in fleet |
Capacity of sturgeon hatcheries |
|
Azerbaijan |
|
|
|
|
I.R. Iran |
7000 |
996 |
|
|
Kazakhstan |
1500 |
|
6.06 million fry |
|
Russian Fed. |
|
|
|
|
Turkmenistan |
|
|
|
Table A3.2-29 Industrial Production in the Caspian Region
|
Azerbaijan |
I.R. Iran |
Kazakhstan |
Russian Fed. |
Turkmenistan |
|
|
Food, tobacco |
Oil production |
|
Electroenergetics |
|
|
Wood products |
Gas production |
|
Construction |
|
|
Chemical |
Uranium mining |
|
Oil production |
|
|
Oil production |
|
|
Food production |
|
|
Coal production |
|
|
Engineering |
|
|
Paper and printing |
|
|
Myrabolyte |
|
|
Machinery production |
|
|
Bromine |
|
|
Textile |
|
|
Iodine |
|
|
Mineral products |
|
|
Technical carbon |
Table A3.2-30 Distribution of Industrial Facilities in Iran
|
Industry |
Mazandaran |
Gilan |
Total |
||
|
Coastal |
non-coastal |
Coastal |
Non-coastal |
||
|
Food, tobacco and drinking Textile, clothing and leather Wood and products paper, cardboard and printing Chemical, oil and coal Non-metallic mineral product Metallic product Equipment and machinery Handicraft Others industry Total number of industries |
597 796 741 34 16 107 13 929 80 118 3431 |
1198 1527 1413 75 15 208 51 2245 207 231 7170 |
295 261 216 11 12 61 1 265 1937 10 3069 |
953 1301 676 39 14 137 11 990 3120 88 7329 |
3043 3885 3046 159 57 513 76 4429 5344 447 20996 |
Table A3.2-31 Industrial Mix for CEZ of the Russian Federation (1999)
|
Federation Unit |
Daghestan |
Kalmykia |
Astrakhan Province |
Volgograd Province |
|
Commodity output (bln rubles) |
3.8 |
0.91 |
10.6 |
41.2 |
|
Power industry |
25.3% |
36.7% |
No data |
18.9% |
|
Fuel industry |
15.7% |
23.1% |
32.7% |
No data |
|
Construction materials |
9.3% |
9.1% |
No data |
5% |
|
Engineering |
14.1% |
6.0% |
12.4% |
14% |
|
Light industry |
4.3% |
1.2% |
No data |
No data |
|
Food industry |
22.3% |
20% |
23.6% |
12% |
|
Percentage of unprofitable firms |
64.8% |
71.5% |
47% |
59.1% |
Table A3.2-32 Oil and Gas Activities in the Caspian Region
|
|
Provinces |
Extractable Oil reserves |
Gas reserves |
Fields under development |
Azerbaijan |
Guba-Khachmaz |
|
|
|
|
Apsheron |
|
|
|
|
|
Central-Aran |
|
|
|
|
|
Lenkoran |
|
|
|
|
I.R. Iran |
Gilan |
|
|
|
|
Mazandaran |
|
|
|
|
Kazakhstan |
Atyrau |
1529081 thousand tons |
198733 mln. m3 |
38 |
|
Mangistau |
702542 thousand tons |
157730 mln. m3 |
|
|
|
Russian Federation |
Astrakhan |
|
|
|
|
Dagestan |
|
|
|
|
|
Kalmykia |
|
|
|
|
Turkmenistan |
Balkan |
|
|
|
Table A3.2-33 Production of Oil in Azerbaijan (million tons)
|
Years |
Offshore |
Onshore |
Total |
|
1981 |
9,371 |
4,703 |
14,074 |
|
1982 |
8,247 |
4,666 |
12,913 |
|
1983 |
8,409 |
4,286 |
12,695 |
|
1984 |
8,447 |
4,057 |
12,504 |
|
1985 |
9,233 |
3,909 |
13,142 |
|
1986 |
9,419 |
3,902 |
13,321 |
|
1987 |
10,069 |
3,734 |
13,803 |
|
1988 |
10,324 |
3,417 |
13,741 |
|
1989 |
10,136 |
3,023 |
13,159 |
|
1990 |
9,931 |
2,582 |
12,513 |
|
1991 |
9,492 |
2,249 |
11,741 |
|
1992 |
9,225 |
1,970 |
11,195 |
|
1993 |
8,321 |
1,974 |
10,295 |
|
1994 |
7,778 |
1,785 |
9,563 |
|
1995 |
7,440 |
1,760 |
9,200 |
|
1996 |
7,680 |
1,420 |
9,100 |
|
1997 |
7,500 |
1,600 |
9,100 |
|
1998 |
9,700 |
1,700 |
11,400 |
|
1999 |
Not found |
Not found |
14,400 |
Source: State Committee of Azerbaijan on Statistics (SOCAR)
Table A3.2-34 Outputs of Oil and Power Complex in the Balkan Province of Turkmenistan
|
Product |
1999 |
1998 |
% |
|
Electric energy, m. KW/hour |
1593.0 |
1486.0 |
107 |
|
Oil, including gas condensate, thousand tons |
6803.0 |
6141.0 |
109 |
|
Oil |
6683.0 |
6141.9 |
109 |
|
Gas condensate |
119.8 |
99.1 |
121 |
|
Natural gas, million m3 |
4086.3 |
4008.7 |
102 |
|
Including: natural, million m3 |
3461.9 |
3355.4 |
103 |
|
Oil gas, million m3 |
624.4 |
653.3 |
96 |
|
Initial refining of oil, thousand tons |
4120.7 |
4985.5 |
83 |
|
Gasoline, thousand tons |
743 |
682.3 |
109 |
|
Diesel fuel, thousand tons |
1185.0 |
1432.8 |
83 |
|
Furnace fuel oil, thousand tons |
1348.1 |
2063.3 |
65 |
|
Petroleum coke, thousand tons |
123.3 |
96.8 |
127 |
|
Furnace fuel, thousand tons |
186.8 |
114.7 |
162 |
|
Liquefied gas, thousand tons |
12.7 |
17.2 |
74 |
|
Kerosene (burning and technical), thousand tons |
104.5 |
81.1 |
128 |
|
Oil asphalt, thousand tons |
54.9 |
56.3 |
98 |
Table A3.2-35 Water Use in the Caspian Coastal Zone
|
|
Total Consumption |
Domestic Consumption |
Agricultural Consumption |
Industrial Consumption |
Raw Sewage Emitted into Caspian Sea |
Treated Sewage Emitted into Caspian Sea |
|
Azerbaijan |
|
|
|
|
169.11 m.m3 |
240.49 m.m3 |
|
I.R. Iran |
|
|
|
|
|
|
|
Kazakhstan |
|
|
|
|
|
|
|
Russian Fed. |
|
|
|
|
|
|
|
Turkmenistan |
1.1billion m3 |
|
935 million m3 (85%) |
|
|
|
Table A3.2-36. Azerbaijan: Generalized Indices on the Centralized Water Supply and Drainage for 1999 (m.m3)
|
EGR |
Water Consumption |
Drainage |
Circulating water-supply |
||||||
|
total |
including |
total |
including |
||||||
|
drinking |
industrial |
other |
non-refined sewage |
normative clean sewage |
normative refined sewage |
||||
|
Guba-Khachmaz |
9.67 |
8.79 |
0.86 |
0.02 |
3.36 |
1.0 |
0.14 |
2.22 |
0.46 |
|
Apsheron, |
767.37 |
359.01 |
373.96 |
34.40 |
544.48 |
159.73 |
147.64 |
237.11 |
266.05 |
|
including: Baku |
522.42 |
288.00 |
228.72 |
5.70 |
440.64 |
155.00 |
76.13 |
209.51 |
163.55 |
|
Sumgayit |
208.45 |
50.38 |
129.42 |
28.65 |
100.19 |
1.08 |
71.51 |
27.60 |
102.50 |
|
Central-Aran, |
37.87 |
25.85 |
4.84 |
7.18 |
7.49 |
7.24 |
- |
0.25 |
5.41 |
|
incl. Ali-Baitamly |
24.02 |
18.05 |
0.74 |
5.23 |
3.42 |
3.18 |
- |
0.24 |
2.65 |
|
Lenkoran |
2.78 |
2.44 |
0.10 |
0.24 |
2.05 |
1.14 |
- |
0.91 |
- |
|
Total: |
817.69 |
396.09 |
379.76 |
41.84 |
557.38 |
169.11 |
147.78 |
240.49 |
271.92 |
Table A3.2-37 Azerbaijan: Irrigated Lands Distribution (thousand ha)
|
Economical-geographical regions |
Total area |
Irrigated soils area |
Irrigated lands |
orchard and country plots |
forests |
||||||
|
total |
% of total area |
total |
including |
||||||||
|
long-standing plantations |
plough-land |
hayfield |
pastures |
long-fallow land |
|||||||
|
Guba-Khachmaz |
696.5 |
131.2 |
18.8 |
124.5 |
28.3 |
84.2 |
4.6 |
6.8 |
0.6 |
6.7 |
- |
|
Apsheron |
664.0 |
22.9 |
3.4 |
19.4 |
4.0 |
12.8 |
- |
2.6 |
- |
2.1 |
1.4 |
|
Central Aran |
873.7 |
274.1 |
31.4 |
253.5 |
0.2 |
234.5 |
- |
14.1 |
4.7 |
19.9 |
0.7 |
|
Lenkoran |
606.9 |
39.1 |
6.4 |
38.9 |
8.6 |
29.6 |
0.2 |
0.5 |
- |
0.2 |
- |
|
Total: |
2841.1 |
467.3 |
16.4 |
436.3 |
41.1 |
361.1 |
4.8 |
24.0 |
5.3 |
28.9 |
2.1 |
Table A3.2-38 Azerbaijan: Indices of Irrigated Lands Use
|
Economical-geographical regions |
Area of irrigated lands, total thousand ha |
Area of irrigated lands in 1999, thousand ha |
Water volume used for irrigation, thousand m3 |
Water volume for land unit, m3/ha |
|
Guba-Khachmaz |
131.2 |
76.1 |
187,122 |
2458.9 |
|
Apsheron |
22.9 |
11.4 |
46,267 |
4085.5 |
|
Central Aran |
274.1 |
204.5 |
1,075,720 |
5260.2 |
|
Lenkoran |
39.1 |
18.3 |
46,936 |
2564.8 |
|
Total: |
467.3 |
310.3 |
1,356,045 |
4370.1 |
Table A3.2-39 Urbanization Trends (UNDP Human Development 2001 and Country Socio -Economic Reports)
|
|
Total Urban Population 1975 |
Total Urban Population 1999 |
Total Urban Population 2015 |
Urban Population in Coastal Zone 1999 |
|
Azerbaijan |
51.5 |
56.9 |
64.0 |
|
|
I.R. Iran |
45.8 |
61.1 |
68.8 |
6.0 (1991) |
|
Kazakhstan |
52.2 |
56.4 |
60.6 |
|
|
Russian Fed. |
66.4 |
77.3 |
82.0 |
|
|
Turkmenistan |
47.5 |
44.7 |
49.9 |
|
Table A3.2-40 Possibilities for Tourism in the Caspian Coastal Zone
|
|
Current number of resorts |
Current number of beds |
Current number of tourists annually |
Potential number of tourists annually |
|
Azerbaijan |
|
|
|
|
|
I.R. Iran |
62 |
2482 |
325477 |
|
|
Kazakhstan |
4 |
4000 |
|
|
|
Russian Fed. |
|
|
|
|
|
Turkmenistan |
17 |
2615 |
|
|
Annex 3.3
Supplemental Material for
Section 3.3 Legal and Regulatory Setting
Table 3.3-1 Government organizations responsible for carrying and legislation or the protection and management of Caspian Sea Resources
Table 3.3-2 International Environmental Connections ratified by the Republic of Azerbaijan
Table 3.3-3 International Environmental Connections ratified by the Islamic Republic of Iran
Table 3.3-4 International Environmental Connections ratified by the Republic of Kazakhstan
Table 3.3-5 International Environmental Connections ratified by the Russian Federation
Table 3.3-6 International Environmental Connections ratified by Turkmenistan
Conclusions and ?????
Table A3.3-1 Government organizations responsible for carrying out legislation on protection and management of the Caspian Sea’s natural resources
Azerbaijan
Ministry of Ecology and Natural Resources
State Committee for Supervision of Safety of Industry Mining
Committee for Land Improvement and Water Economy (Cabinet Ministers)
Iran
Department of the Environment
Environmental High Council
Ministry of Jihad Agriculture, including:
Forest and Research Organization (Department of Natural Resources)
Fisheries Organization
Ministry of Energy
Ministry of Oil
Ministry of Mines and Industry
Ministry of Environment and Natural Resources
Ministry of Ecology and Mineral Resources
Land Energy Resource Agency
Russia
Ministry of Natural Resources
State Committee for Fishing
Federal Frontier Service
Federal Service for Hydrometeorology and Monitoring of the Environment
State Marine Rescue and Coordination Service under the Transport Ministry
Ministry of Nature Protection
State Enterprise on Issues of the Caspian Sea under the President of Turkmenistan
The State Fish Industry
Turkmengeology
National Hydrometereology Committee attached to the Cabinet of Ministries of Turkmenistan
Turkmenistan Information Standards center
Ministry of Water Industry
Civil Defense and Emergency Situations Department
Sanitary and Epidemiological Inspection
Table A3.3-2 International Environmental Conventions Ratified by the Republic of Azerbaijan
|
Name of Convention
|
Date of Ratification |
|
Convention for the protection of the world cultural and natural heritage |
December 6, 1993 |
|
UN Framework Convention on Climate Change. Rio-de-Janeiro, 09.05.92 |
January 10, 1995 |
|
Montreal Protocol on substances that deplete the Ozone Layer. Montreal, 16.09.87. Amendments to Protocol: London, 29.06.90; Copenhagen, 25.11.92 |
May 31, 1996 |
|
International Convention on the Prevention of Pollution from Ships. London, 1973/1978 |
April 22, 1997 |
|
Protocol to the Agreement of CIS countries on mutual activities in the area of hydrometeorology and on the authority, work procedure and funding of the Intergovernmental Council and Executive Committee of the Council for Hydrometeorology involving state-signatories of said Agreement. |
February 17, 1998 |
|
UN Convention to combat desertification in those countries experiencing serious drought and/or desertification, especially in Africa. Paris, June 17, 1994 |
April 24, 1998 |
|
Convention on international trade in endangered species of wild flora and fauna (CITES). Washington, March 3, 1973 |
June 23, 1998 |
|
Resolution of countries-signatories to the Convention on international trade in endangered species of wild flora and fauna "On protection of sturgeon". Harare (Zimbabwe), June 9-20, 1997 |
June 23, 1998 |
|
Convention on environmental impact assessment in a transboundary context. Espo (Finland), February 25, 1991 |
February 1, 1999 |
|
Convention on conservation of European wildlife and natural habitats. Bern, September 19, 1979 |
October 28, 1999 |
|
UN Convention on access to information, public involvement in decision-making and access to justice in environmental matters. Aarhus (Denmark), June 25, 1998 |
9 ноября 1999 |
|
Convention on biological diversity. Rio-de-Janeiro, 05.06.92 |
March 14, 2000 |
|
Convention on the protection and uses of transboundary watercourses and international lakes. Helsinki, 17.03.92 |
March 14, 2000 |
|
Plant Protection Convention. Rome, 06.12.1951 |
March 14, 2000 |
|
Amendment to the Montreal Protocol on substances that deplete the ozone layer. Montreal, 15-17.09.97 |
July 18, 2000 |
|
Kyoto Protocol to the UN Framework Convention on climate change. Kyoto, 11.12.97 |
July 18, 2000 |
|
UNESCO Convention on wetlands of international importance, especially as waterfowl habitats. Ramsar, 02.02.71 |
18 июль 2000 |
|
Amendments to UNESCO Convention on wetlands of international importance, especially as waterfowl habitats. 28.05.87 |
July 18, 2000 |
|
Convention on control of transboundary movements of dangerous wastes and their disposal. Basel, 1989 |
16 февраля 2001 |
Table A3.3-3 International Environmental Convention Ratified by the Islamic Republic of Iran
Convention on biological diversity
Convention for protection of the world cultural and natural heritage
CITES
Convention to combat desertification
Convention on wetlands of international importance, especially as waterfowl habitats
International Convention on oil pollution preparedness, response and cooperation
Table A3.3-4 International Environmental Conventions and Agreements Ratified by the Republic of Kazakhstan (as of June 1, 2001)
|
Name of Convention, Agreement |
Document, Substantiating Ratification of Convention/Agreement By Republic of Kazakhstan (RK) |
|
Convention on the world meteorological organization |
Resolution of RK Supreme Council “On joining the WMO Convention,” dated 18.12.1992. Decision of the Cabinet of Ministers, issued on 13.04.1993, “On joining the WMO Convention.” Ratified on 13.04.1993. |
|
International convention on civil liability for oil pollution damage |
Decision of the RK Cabinet of Ministers, issued on 04.03.1994, “On joining international conventions adopted under the aegis of the International Maritime Organization (IMO) and to the convention on IMO.” Ratified on 05.06.1994. |
|
Convention on safety of marine living organisms |
Decision of RK Council of Ministers, issued on 04.03.1994, “On joining international conventions adopted under the aegis of the International Maritime Organization (IMO) and to the convention on IMO.” Ratified on 07.06.1994. |
|
Convention on biological diversity |
Decision of RK Council of Ministers No. 918, issued on 19.08.94, “On ratification by RK of the Convention on biological diversity and organization of compliance with its provisions.” Ratified on 06.09.1994. |
|
Convention for the protection of the world cultural and natural heritage |
Adopted and ratified on 29.07.1994.
|
|
UN Framework Convention on climate change |
Decree of RK President “On ratification of UN Framework Convention on climate change,” dated 4.05.1995. Ratified on 17.05.95. |
|
UN Convention to combat desertification |
Senate Resolution, dated 28.06.97. RK law “On ratification of UN Convention to combat desertification,” enacted on July 7, 1997, No 149-13 РК. Ratified on 09.07.97. |
|
Vienna Convention to protect the ozone layer |
RK law “On RK joining the Vienna convention to protect the ozone layer,” October 30, 1997. |
|
Montreal Protocol on substances that deplete the ozone layer |
RK law “On RK joining the Montreal Protocol on substances that deplete the ozone layer,” October 30, 1997. |
|
London amendment to the Montreal Protocol on substances that deplete the ozone layer |
RK law “On ratification of amendment to the Montreal Protocol on substances that deplete the ozone layer, London, June 27-29, 1990,” May 7, 2001, No. 191 – II.
|
|
Agreement and Protocol to the Energy Charter on energy efficiency issues and corresponding environmental aspects |
Presidential Decree “On ratification of the agreement and protocol to the Energy Charter on energy efficiency issues and corresponding environmental aspects,” dated 18.10.1995.
|
|
Convention on international trade in endangered species of wild flora and fauna |
Presidential law “On ratification by the Republic of Kazakhstan of the Convention on international trade in endangered species of wild flora and fauna, dated April 6, 1999. Ratified on April 19, 2000. |
|
Convention on prohibiting the military or any other hostile use of environment modification techniques |
Resolution of RK Supreme Council, dated 20.02.1995, “On ratification by RK of the Convention on prohibiting the military or any other hostile use of environment modification techniques,” dated 13.04.1993. |
|
Convention on access to information, public involvement in decision-making and access to justice on environmental matters |
RK law No. 92-II on ratifying the convention, enacted on 23.10.2000 |
|
Convention on environmental impact assessment in a transboundary context |
RK law No 86-II on ratifying the convention, enacted on 21.10.2000 |
|
Convention on transboundary effects of industrial accidents |
RK law No. 91-II on ratifying the convention, enacted on 23.10.2000 |
|
Convention on the protection and uses of transboundary watercourses and international lakes |
RK law No. 94-II on ratifying the convention, enacted on 23.10.2000
|
|
Convention on long-range transboundary air pollution |
RK law No. 89-II on ratifying the convention, enacted on 23.10.2000 |
Table A3.3-5 International Environmental Conventions Ratified by the Russian Federation
Convention on biological diversity
Convention for protection of the world cultural and natural heritage
CITES
Convention on environmental impact assessment in a transboundary context
Convention on transboundary impact of industrial accidents
Convention to fight desertification
UN ECE Convention on the protection and uses of transboundary watercourses and international lakes
Convention on wetlands of international significance, especially as waterfowl habitats
International Convention on the establishment of an international fund for compensation for oil pollution damages
International Convention on oil pollution preparedness, response and cooperation
Convention on maritime law
International Convention on civil liability.
Table A3.3-6 International Environmental Conventions Ratified by Turkmenistan
Basel Convention on the control of transboundary movements of hazardous wastes and their disposal (June 18, 1996)
Convention on biological diversity (June 18, 1996)
Framework Convention on climate change (June 5, 1995)
Convention to combat desertification (June 18, 1996)
Vienna Convention to protect the ozone layer and the Montreal Protocol on substances that deplete the ozone layer (November 14, 1993), Amendments to the Montreal Protocol (March 15, 1994)
Convention on access to information, public involvement in decision-making and access to justice on environmental matters (Aarhus, Denmark) (April 30, 1999)
Convention for protection of the world cultural and natural heritage (1992).
Annex 3.4
Supplemental Material for
Section 2.1
Casual Chain Analysis
CCA for Decline of Environmental Quality
CCA for Decline in Biodiversity
CCA for Water Level Fluctuations
CCA for Damage to Coastal Infrastructure
CCA for Landscape Degradation
This Causal Chain Analysis were prepared by participants of the second TDA workshop held in Baku in December 2000.
Decline in Environmental Quality

Decline in Environmental Quality

Decline in Environmental Quality

Decline in Environmental Quality

Decline in Environmental Quality

Decline in Environmental Quality

Biodiversity Casual Chain Environmental
Impacts
Introduction of Exotic Species and
Water Level
Fluctuation / Climate Change

Biodiversity Casual Chain Environmental Impacts
Loss
of Species / Loss of Genetic Biodiversity

Biodiversity Casual Chain Environmental
Impacts
Degredation of Habitats

Casual Chain Environmental Impacts
Reduced Human
Conditions
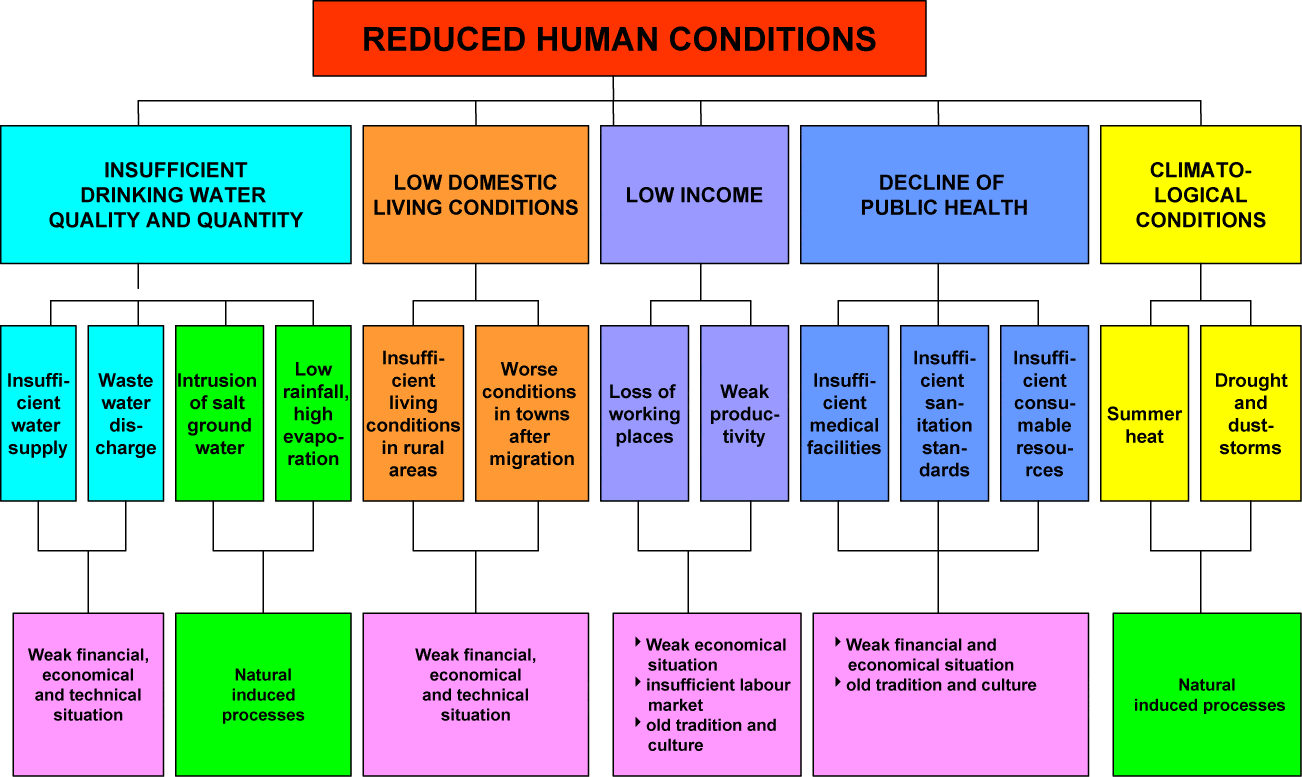
Casual Chain Environmental Impacts
Damage to Shore
Zone Infrastructure
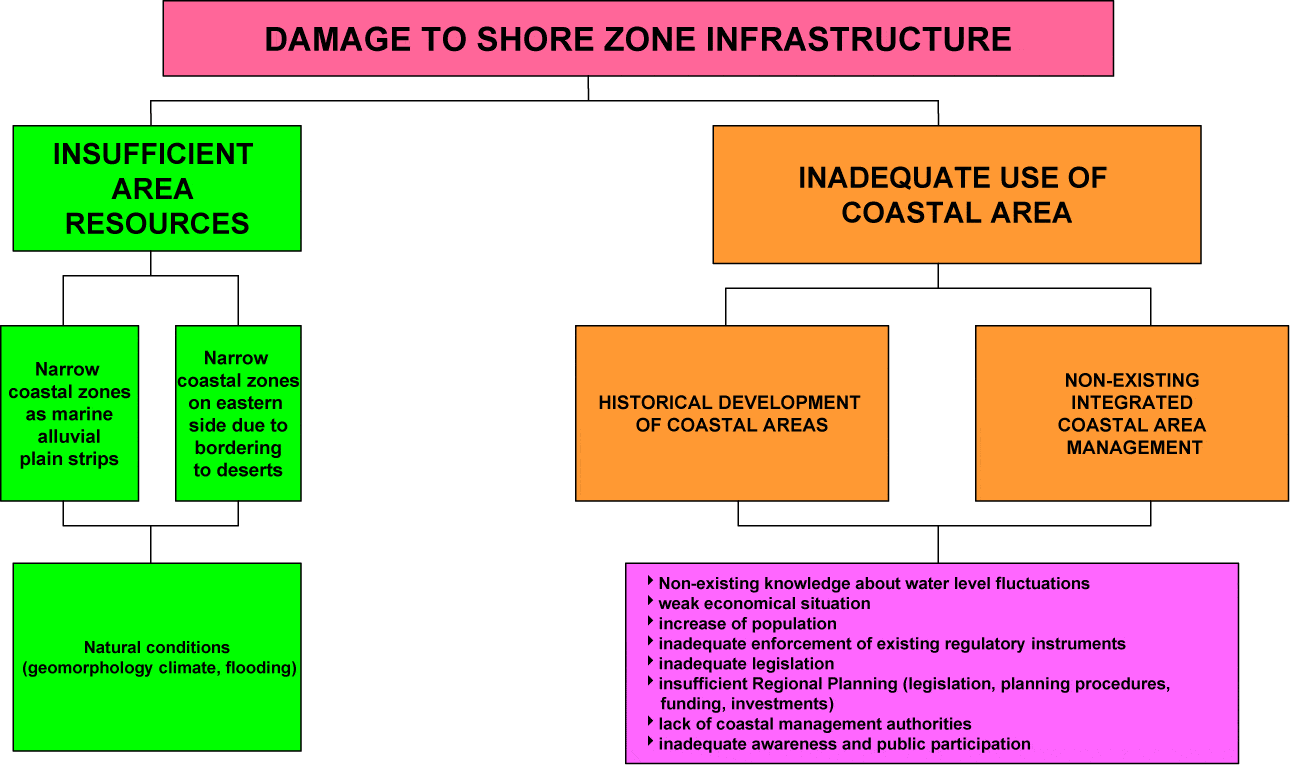
Casual Chain Environmental Impacts
Landscape
Degredation
Annex 3.5
Supplemental Material for
Contents
Annex 3.1 1
Supplemental Material for 1
Section 3.1 Physical and Biogeochemical Characteristics Caspian Sea 1
Table 3.1-1 Major sensitive habitats in the Caspian Sea Region 1
Table 3.1-1 Surface Water Salinity during summer in the Caspian Sea (Aubrey, 1994) 1
Table A2.2-1 Major Sensitive Habitats in the Caspian Sea Region 2
Figure A2.2-1 Surface Water Salinity During Summer in the Caspian Sea (from Aubrey et al., 1994a) 9
Table A3.2-1. UNDP Human Development Index (HDI) – 1999 Data 3
Table A3.2-2. UNDP Human Development Index Trends 3
Table A3.2-3. Population Data (World Bank, 1999) 3
Table A3.2-4. Projected Population Trends (UNDP Human Development Report 2001) 3
Table A3.2-5. Expenditures for Public Health, Education, and Social Protection in Azerbaijan 4
Table A3.2-6. Population in the Coastal Zone 4
Table A3.2-7. Cities and Towns in the Coastal Zone 5
Table A3.2-8. Azerbaijan: Dynamics of Population Number in 1999 (Coastal Profile) 5
Table A3.2-9. Education System in Caspian Coastal Zone 5
Table A3.2-10. Azerbaijan: Characteristics of Education System for 1999 (Coastal Profile) 6
Table A3.2-11. Principal Indices of Education in Azerbaijan 7
Table A3.2-12. Employment Characteristics in Caspian Hinterland 7
Table A3.2-13. Azerbaijan: Labor Resources and Population Employment in 1999 8
Table A3.2-14. Dynamics of Living Standards in CEZ in Russian Federation 8
Table A3.2-15. Employment in Turkmenistan CEZ (Balkan Province) 9
Table A3.2-16. Economic Indicators in Caspian Hinterland 9
Table A3.2-17. Main Social-Economic Indexes of the Development of Kazakhstan Republic 9
Table A3.2-18. Kazakhstan Income Data 10
Table A3.2-19. The industrial mix for CEZ (1999) in Russian Federation 11
Table A3.2-20. Turkmenistan (in the province of Balkan) Industry (5200 manat = $1) 11
Table A3.2-21. Areas Under Cultivation in Caspian Region 12
Table A3.2-22. Agricultural Production in the Caspian Region 12
Table A3.2-23. Agricultural Output in Iran CEZ 12
Table A3.2-24. Chemical Fertilizer Used in the Northern Provinces of Iran (1990) 13
Table A3.2-25. The Number of Employees in the Agricultural Sector in Iran 13
Table A3.2-26 Agricultural Indices in CEZ of Russian Federation 13
Table A3.2-27 Structure of Livestock Population in All Management Categories in the Balkan Province of Turkmenistan 14
Table A3.2- 28 Fishing Industry Statistics in the Caspian Region 14
Table A3.2-29 Industrial Production in the Caspian Region 14
Table A3.2-30 Distribution of Industrial Facilities in Iran 14
Table A3.2-31 Industrial Mix for CEZ of the Russian Federation (1999) 15
Table A3.2-32 Oil and Gas Activities in the Caspian Region 16
Table A3.2-33 Production of Oil in Azerbaijan (million tons) 16
Table A3.2-34 Outputs of Oil and Power Complex in the Balkan Province of Turkmenistan 17
Table A3.2-35 Water Use in the Caspian Coastal Zone 17
Table A3.2-36. Azerbaijan: Generalized Indices on the Centralized Water Supply and Drainage for 1999 (m.m3) 17
Table A3.2-37 Azerbaijan: Irrigated Lands Distribution (thousand ha) 18
Table A3.2-38 Azerbaijan: Indices of Irrigated Lands Use 18
Table A3.2-39 Urbanization Trends (UNDP Human Development 2001 and Country Socio -Economic Reports) 18
Table A3.2-40 Possibilities for Tourism in the Caspian Coastal Zone 19
Annex 3.3 1
Supplemental Material for 1
Section 3.3 Legal and Regulatory Setting 1
Table A3.3-2 International Environmental Conventions Ratified by the Republic of Azerbaijan 3
Table A3.3-4 International Environmental Conventions and Agreements Ratified by the Republic of Kazakhstan (as of June 1, 2001) 4
Table 3.5-1 Decline in Fisheries 4
Table 3.5-2 Decline in Environmental Quality 6
Table 3.5-3 Decline in Biodiversity 8
Table 3.5-4 Decline in Human Health 10
Table 3.5-5 Decline in Infrastructure 12
Table 3.5-6 Degradation of Coastal Landscape 14
Table 3.5-7 Emerging Issue: Increase in Pollution from Oil and Gas Activities 15
Table 3.5-8 Introduction of Exotic Species 17
Table 3.11-1 Commitment to Health: Access, Services and Resources (UNDP Human Development Report 2001) 3
Table 3.11-2 Leading Global Health Crises and Challenges (UNDP Human Development Report 2001) 3
Table 3.11-3 Access to Healthcare in Caspian Coastal Zones 4
Table 3.11-4 Survival Rates (UNDP Human Development Report 2001) 4
Table 3.11-5 Principal indices of the public health in Azerbaijan 4
Table 3.11-6 Azerbaijan: Deaths attributed to illnesses in 1999. (Number of diseases per 100,000) (Coastal Profile) 5
Table 3.11-7 Disease Rates in Kazakhstan (per 100,000 people) 6
The following tables present results of the Regional Stakeholder Analysis Survey (See Annex 2.6b)
Survey participants were asked to rank their level of agreement with statements in the stakeholder analysis questionnaire (SHAQ). The scale was from 9 to 1, with 9 being “agree strongly”, 1 being “disagree strongly” and 5 being “no opinion”.
*Stakeholder groups are given (1) a measure of low, medium or HIGH, which represents the overall prioritization of an issue by level of agreement within the specific stakeholder group, (2) the average/mean ranking of participants within a specific stakeholder group and (3) the standard deviation, which is in parenthesis.
HIGH was measured for strong agreement 9-7.5, or strong disagreement, 1-2.5. Medium represents averages from 7.4-6.0 for agreement and 4.0-2.6 for disagreement. Low is 5.9-4.1 for the lowest level of prioritization
The average for each stakeholder group was calculated from surveys that answered the particular section of questions, and non-answers were discarded.
The standard deviation is a calculation of how widely spread the variation is away from the average among respondents. Thus, the lower the standard deviation, the closer the consensus on an issue.
SHAQ followed by a numeral (e.g., SHAQ 30) indicates the question number in the survey.
*Stakeholder groups that did not respond in significant numbers were not given these ratings.
Table 3.5-1 Decline in Fisheries
I think it is safe and healthy to eat fish from the Caspian.
(Agree somewhat) fishermen stakeholder group, multinational corporation stakeholder group
(Disagree somewhat) Energy Ministry stakeholder group, NGOs
Radiation is the primary reason there are fewer fish in the Caspian.
(Agree somewhat) public healthcare provider stakeholder group
(Disagree) multinational corporation stakeholder group, scientific community
The fishermen benefit most from the fish they catch.
(Agree strongly) Energy Ministry stakeholder group
(Disagree) regional and municipal governments
An enforced system of mutually agreed upon fishing limits would be effective for reducing over-fishing in the Caspian.
(Agree strongly) Energy Ministry stakeholder group, regional and municipal governments, environmental ministries
(Disagree somewhat) multinational corporation stakeholder group
|
Agree
Disagree |
Environmental Ministries |
Agriculture and Fishing Ministries |
Energy Ministries |
Regional and Municipal Governments |
Scientific Community |
Industries |
Multinational Corporations |
NGO |
Public Healthcare Providers |
Fishermen |
Coastal Zone Residents |
|
Environmental Ministries |
|
|
Fishing limits |
|
|
|
|
|
|
|
|
|
Agriculture and Fishing Ministries |
|
|
|
|
|
|
|
|
|
|
|
|
Energy Ministries |
|
|
|
|
|
|
Safe to eat Caspian fish |
|
|
Safe to eat Caspian fish |
|
|
Regional and Municipal Governments |
|
|
Fishermen benefit |
|
|
|
|
|
|
|
|
|
Scientific Community |
|
|
|
|
|
|
|
|
Radiation |
|
|
|
Industries |
|
|
|
|
|
|
|
|
|
|
|
|
Multinational Corporations |
Fishing limits |
|
Fishing limits |
Fishing limits |
|
|
|
|
Radiation |
|
|
|
NGO |
|
|
|
|
|
|
Safe to eat Caspian fish |
|
|
Safe to eat Caspian fish |
|
|
Public Healthcare Providers |
|
|
|
|
|
|
|
|
|
|
|
|
Fishermen |
|
|
|
|
|
|
|
|
|
|
|
|
Coastal Zone Residents |
|
|
|
|
|
|
|
|
|
|
|
Table 3.5-2 Decline in Environmental Quality
Unless there is a severe environmental crisis, care for the environment will not be a priority for the people.
(Agree strongly to agree somewhat) fishermen stakeholder group, Agriculture and Fishing Ministries stakeholder group, regional and municipal governments, NGOs, public health care providers, multinational corporations, coastal zone residents.
(Disagree) industry and Energy Ministry stakeholder group
There is adequate scientific knowledge about the causes of environmental decline in the Caspian.
(Agree somewhat) environmental ministries
(Disagree) fishermen stakeholder group
Private industry should take all responsibility for reversing environmental degradation of the Caspian.
(Agree) agriculture & fishing ministries, industry, regional and municipal governments, environmental ministries, health care providers
(Disagree) multinational corporation stakeholder group
|
Agree
Disagree |
Environmental Ministries |
Agriculture and Fishing Ministries |
Energy Ministries |
Regional and Municipal Governments |
Scientific Community |
Industries |
Multinational Corporations |
NGO |
Public Healthcare Providers |
Fishermen |
Coastal Zone Residents |
|
Environmental Ministries |
|
|
|
|
|
|
|
|
|
|
|
|
Agriculture and Fishing Ministries |
|
|
|
|
|
|
|
|
|
|
|
|
Energy Ministries |
|
Environmental crisis |
|
Environmental crisis |
|
|
Environmental crisis |
Environmental crisis |
Environmental crisis |
Environmental crisis |
Environmental crisis |
|
Regional and Municipal Governments |
|
|
|
|
|
|
|
|
|
|
|
|
Scientific Community |
|
|
|
|
|
|
|
|
|
|
|
|
Industries |
|
Environmental crisis |
|
Environmental crisis |
|
|
Environmental crisis |
Environmental crisis |
Environmental crisis |
Environmental crisis |
Environmental crisis |
|
Multinational Corporations |
Private industry responsibility |
Private industry responsibility |
|
Private industry responsibility |
|
Private industry responsibility |
|
|
Private industry responsibility |
|
|
|
NGO |
|
|
|
|
|
|
|
|
|
|
|
|
Public Healthcare Providers |
|
|
|
|
|
|
|
|
|
|
|
|
Fishermen |
Scientific knowledge |
|
|
|
|
|
|
|
|
|
|
|
Coastal Zone Residents |
|
|
|
|
|
|
|
|
|
|
|
Table 3.5-3 Decline in Biodiversity
It is more important for people to use the Caspian resources that they need than it is to leave them untouched because of environmental concerns.
(Agree) Conflict between coastal zone resident stakeholder group, environmental ministries, Agriculture and Fishing Ministries stakeholder group, regional and municipal governments, scientific community, public healthcare provider stakeholder group, and fishermen stakeholder group
(Disagree) Energy Ministry stakeholder group, NGOs, industry and multinational corporation stakeholder group
|
Agree
Disagree |
Environmental Ministries |
Agriculture and Fishing Ministries |
Energy Ministries |
Regional and Municipal Governments |
Scientific Community |
Industries |
Multinational Corporations |
NGO |
Public Healthcare Providers |
Fishermen |
Coastal Zone Residents |
|
Environmental Ministries |
|
|
|
|
|
|
|
|
|
|
|
|
Agriculture and Fishing Ministries |
|
|
|
|
|
|
|
|
|
|
|
|
Energy Ministries |
Use needed resources |
Use needed resources |
|
Use needed resources |
Use needed resources |
|
|
|
Use needed resources |
Use needed resources |
Use needed resources |
|
Regional and Municipal Governments |
|
|
|
|
|
|
|
|
|
|
|
|
Scientific Community |
|
|
|
|
|
|
|
|
|
|
|
|
Industries |
Use needed resources |
Use needed resources |
|
Use needed resources |
Use needed resources |
|
|
|
Use needed resources |
Use needed resources |
Use needed resources |
|
Multinational Corporations |
Use needed resources |
Use needed resources |
|
Use needed resources |
Use needed resources |
|
|
|
Use needed resources |
Use needed resources |
Use needed resources |
|
NGO |
Use needed resources |
Use needed resources |
|
Use needed resources |
Use needed resources |
|
|
|
Use needed resources |
Use needed resources |
Use needed resources |
|
Public Healthcare Providers |
|
|
|
|
|
|
|
|
|
|
|
|
Fishermen |
|
|
|
|
|
|
|
|
|
|
|
|
Coastal Zone Residents |
|
|
|
|
|
|
|
|
|
|
|
Table 3.5-4 Decline in Human Health
Air quality is a significant problem in the Caspian region.
(Agree strongly to agree) public healthcare provider stakeholder group, scientific community, energy ministries, regional and municipal governments, fishermen
(Disagree) NGOs
The government should spend money on the basic needs of people, like housing, health care and good jobs, before it spends money on protecting the environment.
(Agree) Energy Ministry stakeholder group, regional and municipal governments, fishermen stakeholder group
(Disagree) Environmental Ministries stakeholder groups, NGOs, industry, multinational corporation stakeholder group, scientific community, public healthcare provider stakeholder group
|
Agree
Disagree |
Environmental Ministries |
Agriculture and Fishing Ministries |
Energy Ministries |
Regional and Municipal Governments |
Scientific Community |
Industries |
Multinational Corporations |
NGO |
Public Healthcare Providers |
Fishermen |
Coastal Zone Residents |
|
|
Environmental Ministries |
|
|
Basic needs |
Basic needs |
|
|
|
|
|
Basic needs |
|
|
|
Agriculture and Fishing Ministries |
|
|
|
|
|
|
|
|
|
|
|
|
|
Energy Ministries |
|
|
|
|
|
|
|
|
|
|
|
|
|
Regional and Municipal Governments |
|
|
|
|
|
|
|
|
|
|
|
|
|
Scientific Community |
|
|
Basic needs |
Basic needs |
|
|
|
|
|
Basic needs |
|
|
|
Industries |
|
|
Basic needs |
Basic needs |
|
|
|
|
|
Basic needs |
|
|
|
Multinational Corporations |
|
|
Basic needs |
Basic needs |
|
|
|
|
|
Basic needs |
|
|
|
NGO |
|
|
Basic needs |
Basic needs |
Air quality |
|
|
|
Air quality |
Basic needs |
|
|
Air quality |
Air quality |
Air quality |
||||||||||
|
Public Healthcare Providers |
|
|
Basic needs |
Basic needs |
|
|
|
|
|
Basic needs |
|
|
|
Fishermen |
|
|
|
|
|
|
|
|
|
|
|
|
|
Coastal Zone Residents |
|
|
|
|
|
|
|
|
|
|
|
|
Table 3.5-5 Decline in Infrastructure
Mining activities reduce the water quality of the Caspian.
(Agree strongly) Agriculture and Fishing Ministries stakeholder group, multinational corporation stakeholder group, environmental ministries, scientific community, public healthcare provider stakeholder group, fishermen stakeholder group
(Disagree) Energy Ministry stakeholder group
Sea level fluctuation has been responsible for most damage to the coastal infrastructure.
(Agree) regional and municipal governments, Energy Ministry stakeholder group, environmental ministries
(Disagree somewhat) multinational corporation stakeholder group
|
Agree
Disagree |
Environmental Ministries |
Agriculture and Fishing Ministries |
Energy Ministries |
Regional and Municipal Governments |
Scientific Community |
Industries |
Multinational Corporations |
NGO |
Public Healthcare Providers |
Fishermen |
Coastal Zone Residents |
|
Environmental Ministries |
|
|
|
|
|
|
|
|
|
|
|
|
Agriculture and Fishing Ministries |
|
|
|
|
|
|
|
|
|
|
|
|
Energy Ministries |
Mining activity |
Mining activity |
|
Mining activity |
Mining activity |
Mining activity |
Mining activity |
Mining activity |
Mining activity |
Mining activity |
Mining activity |
|
Regional and Municipal Governments |
|
|
|
|
|
|
|
|
|
|
|
|
Scientific Community |
|
|
|
|
|
|
|
|
|
|
|
|
Industries |
|
|
|
|
|
|
|
|
|
|
|
|
Multinational Corporations |
Sea level fluctuation |
|
Sea level fluctuation |
Sea level fluctuation |
|
|
|
|
|
|
|
|
NGO |
|
|
|
|
|
|
|
|
|
|
|
|
Public Healthcare Providers |
|
|
|
|
|
|
|
|
|
|
|
|
Fishermen |
|
|
|
|
|
|
|
|
|
|
|
|
Coastal Zone Residents |
|
|
|
|
|
|
|
|
|
|
|
Table 3.5-6 Degradation of Coastal Landscape
There should be fees for water used in the irrigation of crops.
(Agree somewhat) Energy Ministry stakeholder group
(Disagree somewhat) industry, scientific community
|
Agree
Disagree |
Environmental Ministries |
Agriculture and Fishing Ministries |
Energy Ministries |
Regional and Municipal Governments |
Scientific Community |
Industries |
Multinational Corporations |
NGO |
Public Healthcare Providers |
Fishermen |
Coastal Zone Residents |
|
Environmental Ministries |
|
|
|
|
|
|
|
|
|
|
|
|
Agriculture and Fishing Ministries |
|
|
|
|
|
|
|
|
|
|
|
|
Energy Ministries |
|
|
|
|
|
|
|
|
|
|
|
|
Regional and Municipal Governments |
|
|
|
|
|
|
|
|
|
|
|
|
Scientific Community |
|
|
Fees for irrigation |
|
|
|
|
|
|
|
|
|
Industries |
|
|
Fees for irrigation |
|
|
|
|
|
|
|
|
|
Multinational Corporations |
|
|
|
|
|
|
|
|
|
|
|
|
NGO |
|
|
|
|
|
|
|
|
|
|
|
|
Public Healthcare Providers |
|
|
|
|
|
|
|
|
|
|
|
|
Fishermen |
|
|
|
|
|
|
|
|
|
|
|
|
Coastal Zone Residents |
|
|
|
|
|
|
|
|
|
|
|
Table 3.5-7 Emerging Issue: Increase in Pollution from Oil and Gas Activities
The preservation of the Caspian eco-system cannot take place at the same time as oil drilling activities.
(Agree strongly) fishermen stakeholder group, environmental ministries, agriculture & fishing ministries, public health care providers
(towards disagree) industry
Multinational Corporations and the energy industry do not care about the environment.
(Agree to agree strongly) Agriculture and Fishing Ministries stakeholder group, fishermen stakeholder group
(Disagree) regional and municipal governments, industry, and multinational corporation stakeholder group
|
Agree
Disagree |
Environmental Ministries |
Agriculture and Fishing Ministries |
Energy Ministries |
Regional and Municipal Governments |
Scientific Community |
Industries |
Multinational Corporations |
NGO |
Public Healthcare Providers |
Fishermen |
Coastal Zone Residents |
|
Environmental Ministries |
|
|
|
|
|
|
|
|
|
|
|
|
Agriculture and Fishing Ministries |
|
|
|
|
|
|
|
|
|
|
|
|
Energy Ministries |
|
|
|
|
|
|
|
|
|
|
|
|
Regional and Municipal Governments |
|
Care about environment |
|
|
|
|
|
|
|
Care about environment |
|
|
Scientific Community |
|
|
|
|
|
|
|
|
|
|
|
|
Industries |
Preservation vs oil activity |
Preservation v oil activity |
Care about environment |
|
|
|
|
|
Preservation vs. oil activities |
Preservation vs. oil activities |
|
|
Care about environment |
Care about environment |
||||||||||
|
Multinational Corporations |
|
Care about environment |
|
|
|
|
|
|
|
Care about environment |
|
|
NGO |
|
|
|
|
|
|
|
|
|
|
|
|
Public Healthcare Providers |
|
|
|
|
|
|
|
|
|
|
|
|
Fishermen |
|
|
|
|
|
|
|
|
|
|
|
|
Coastal Zone Residents |
|
|
|
|
|
|
|
|
|
|
|
Table 3.5-8 Introduction of Exotic Species
I have seen unusual creatures in the Caspian that were not there ten years ago.
(Agree strongly) fishermen stakeholder group, agriculture & fishing ministries, public health care providers
(Disagree) multinational corporation stakeholder group, Energy Ministry stakeholder group
|
Agree
Disagree |
Environmental Ministries |
Agriculture and Fishing Ministries |
Energy Ministries |
Regional and Municipal Governments |
Scientific Community |
Industries |
Multinational Corporations |
NGO |
Public Healthcare Providers |
Fishermen |
Coastal Zone Residents |
|
Environmental Ministries |
|
|
|
|
|
|
|
|
|
|
|
|
Agriculture and Fishing Ministries |
|
|
|
|
|
|
|
|
|
|
|
|
Energy Ministries |
|
Unusual creatures |
|
|
Unusual creatures |
|
|
|
Unusual creatures |
Unusual creatures |
|
|
Regional and Municipal Governments |
|
|
|
|
|
|
|
|
|
|
|
|
Scientific Community |
|
|
|
|
|
|
|
|
|
|
|
|
Industries |
|
|
|
|
|
|
|
|
|
|
|
|
Multinational Corporations |
|
Unusual creatures |
|
|
Unusual creatures |
|
|
|
Unusual creatures |
Unusual creatures |
|
|
NGO |
|
|
|
|
|
|
|
|
|
|
|
|
Public Healthcare Providers |
|
|
|
|
|
|
|
|
|
|
|
|
Fishermen |
|
|
|
|
|
|
|
|
|
|
|
|
Coastal Zone Residents |
|
|
|
|
|
|
|
|
|
|
|
Annex 2.6b
This survey is an important contribution to the Caspian Environment Programme’s Transboundary Diagnostic Analysis. The Caspian Environment Programme (CEP) is a regional programme established by the Caspian littoral states and international agencies including The World Bank, United Nations Environment Programme (UNEP), and United Nations Development Programme (UNDP). A goal of the Caspian Environment Programme is to improve the lives of the people in the Caspian region by improving the environment of the Caspian Sea.
The Caspian Environment Programme is eager to develop a set of realistic, achievable objectives that enhance the condition of the Caspian Sea. In order to best serve the Caspian community, it is important to identify its stakeholders.
In order to determine what groups have active interests in the environment of the Caspian Sea, what these interests are, and how these interests relate to other interests in the region, your assistance with this survey is needed. Your answers will be tabulated with others from the region and analyzed to determine those environmental interests that are most pervasive in the region. No individual survey or participant will be identified in any report. Please answer the questions below to the best of your ability, by writing the number of your response in the space provided.
What state are you from? (Please circle one)
Azerbaijan IR Iran Kazakhstan Russian Federation Turkmenistan Other:__________________
What type of organization do you represent? (If you represent more than one category, please list these as well.)
Environmental Ministry
Foreign Affairs Ministry
Economic Ministry
Agriculture/Fisheries Ministry
Energy Ministry
Regional Government
Municipal Government
Non-Governmental Organization (NGO)
State owned industry
Private industry
Multinational corporation
Scientific community
Educator
Public health providers
International organization
Student
Farming/fishing large industry
Farming/fishing artesanal industry
Other ____________________
How large is your organization (number of people in the Caspian Region)?
1-10 people
10-50 people
50-100 people
100-500 people
500 + people
How long has your organization existed?
Less than 1 year
Between 1 and 5 years
Between 5 and 10 years
Between 10 and 30 years
More than 30 years
National experts from Caspian Countries have identified 6 major perceived problems and issues and two emerging problems and issues. Below are a series of statements. We are interested in your opinions regarding these perceived problem and issues. These perceived problems and issues are: decline in certain fish stocks, degradation of the coastal landscape, threats to biodiversity, decline in overall environmental quality, decline in human health, damage to coastal infrastructure and amenities. The emerging perceived problems and issues are: potential damage from oil and gas activities and threats from invasive, exotic species of living organisms.
Please rank order how you would prioritize the perceived problems and issues listed below from a rank of 8 the most important perceived problem and issue to a rank of 1 for the least important perceived problem and issue
Decline in certain fish stocks
Degradation of the coastal landscape
Threats to biodiversity
Decline in overall environmental quality
Decline in human health
Damage to coastal infrastructure and amenities
Potential damage from oil and gas activities
Threats from invasive, exotic species of living organisms
Is there a perceived problem or issue that should be added to this list? If so, what is it? (You may list more than one, please answer below)
A “root cause” is the reason that something happens, distilled to the most basic level. National experts from the Caspian Countries have identified root causes for the perceived problems and issues listed above. Often several of these perceived problems and issues share the same root cause. Please help us by telling us how important you feel these root causes are to environmental problems in the Caspian.
Please prioritize the root causes, listed in numbers 14 to 25 for level of importance, with 1 = least critical, 2=critical, 3= most critical:
Non-sustainable use of resources
Lack of advanced technologies
Regional poverty
Regional over population
Abuse of power
Lack of sufficient enforcement of current environmental laws
Undefined legal status
Lack of property rights
Sea level change
Lack of public awareness of environmental problems
Weakness in civil society
Weakness in rule of law
What root causes have not been identified in this list? (Please answer below)
Below are a series of statements designed to gauge how people think about the environment. We would like to know how strongly you agree or disagree with these statements. Please assign a number to each statement based on this scale of agreement:
Strongly agree No opinion Strongly disagree
9 8 7 6 5 4 3 2 1
It is more important for people to use the Caspian resources that they need than it is to leave them untouched because of environmental concerns.
The environment of the Caspian must be protected at all costs.
It is possible to develop programs that balance human needs with care for the environment.
People will not care about protecting and preserving the environment if they are hungry and need shelter.
If the economy were stronger, the environment would be cleaner.
The preservation of the Caspian eco-system cannot take place at the same time as oil drilling activities.
There are fewer fish in the Caspian than there used to be because of recent oil drilling.
The environment can be protected without a strong economy.
Government, industry and the public can all agree about how to care for the Caspian Sea.
Multinational Corporations and the energy industry do not care about the environment.
Unless there is a severe environmental crisis in the Caspian region, care for the environment will not be a priority for governments.
Unless there is a severe environmental crisis, care for the environment will not be a priority for the people.
People will not change their lifestyles to protect endangered species.
The government should spend money on the basic needs of people, like housing, health care and good jobs, before it spends money on protecting the environment.
It is more important to protect natural habitats than it is to enhance economic development.
It is possible to have economic growth and environmental protection at the same time.
Regional stakeholders
Which one of perceived problems and issues most strongly affects your organization?
Decline in certain fish stocks
Degradation of the coastal landscape
Threats to biodiversity
Decline in overall environmental quality
Decline in human health
Damage to coastal infrastructure and amenities
Potential damage from oil and gas activities
Threats from invasive, exotic species of living organisms
Which of the other issues in question 43 also affect your organization?
My organization/group might be a contributing factor to which of the issues in question 43?
In your opinion, which single group listed below is most responsible for improving the condition of the Caspian environment?
Local industries
International industries
Municipal governments
Regional governments
Federal governments
International organizations
Citizen groups/ NGOs
Coastal Communities
Fishermen
Educators
Other: ___________________________
In your opinion, which group in question 46 is the most likely to bring about positive environmental change in the Caspian environment?
In your opinion, which group in question 46 will benefit the most from positive change in the Caspian environment?
With which groups in question 46 does your organization work on a regular basis?
With which groups in question 46 does your organization desire to work?
Of the groups listed in question 46, please list all of the groups you believe would be eager to collaborate with your organization with regards to improving the environment?
Does your group work with groups in other Caspian countries? If so, which countries? (Please answer below)
Thank you for your time and effort!
There are a set of optional questions below, targeting certain perceived problems and issues. You may choose which sets of questions (if any) you would like to answer, or you may answer all of these. We are very interested in your opinions.
These questions are in statement form. We would like to know how strongly you agree or disagree with these statements. Please assign a number to each statement based on this scale of agreement:
Strongly agree No opinion Strongly disagree
9 8 7 6 5 4 3 2 1
My grandparents ate more food from the Caspian waters than I do.
I eat fish from the Caspian at least three times per week.
I think it is safe and healthy to eat fish from the Caspian.
Pollution is the primary reason that there are fewer fish in the Caspian.
Radiation is the primary reason there are fewer fish in the Caspian.
Even if it is illegal, some fish will still be caught for profit.
The fishermen benefit most from the fish they catch.
People, other than fisherman, make money from the illegal fishing of some species.
An enforced system of mutually agreed upon fishing limits would be effective for reducing over-fishing in the Caspian. Careful… there is one, right?
There are enough hatcheries to support all commercial fishing stocks.
All barriers to fish migration should be removed.
Farmers using herbicides and pesticides should be taught natural ways to reduce use of these chemicals. (For instance: organic farming methods, crop rotation, more appropriate crop selection based on climate and soil, genetically engineered crops, training, education, other chemicals or synthetics)
It would be helpful to have coordinated coastal management plans in the Caspian region to help preserve the environment.
There should be fees for water used in the irrigation of crops.
There should be limits on some activities in certain zones of the coastal region.
Landscape degradation is mostly due to human activities, such as oil drilling and pesticide use.
Communities in the Caspian region use forest resources wisely.
Current laws are not strong enough to protect natural resources around the Caspian.
There should be a network of marine and wetland nature preserves all around the Caspian.
My organization supports strengthening laws protecting sensitive areas even if it limits access to those areas.
There is no problem with how agriculture or industrial chemicals are stored near the Caspian waters.
Agricultural and industrial wastes flowing into the Caspian threaten marine and coastal species.
It is necessary to protect fish spawning sites in the Caspian
There is sufficient sharing of information about environmental quality between groups concerned about the Caspian environment.
The environment of the Caspian is not suffering.
There is adequate scientific knowledge about the causes of environmental decline in the Caspian.
There should be more environmental monitoring projects that involve NGOs, scientists and private sector collaboration.
Private industry should take all responsibility for reversing environmental degradation of the Caspian.
Air quality is a significant problem in the Caspian region.
Better technology for environmental preservation would enhance the Caspian region.
In the Caspian region, the biggest threat to the human population is the lack of safe drinking water.
If there were a stronger economy, people would be healthier in the Caspian region.
People are healthier today than they were 20 years ago in the Caspian region.
Industrial runoff has caused people to be sick.
There is nothing that can be done about human health in the region.
Public health must be the concern of the government.
Radioactive materials have led to a decline in human health.
People would be healthier if the environment were cleaner.
Soil erosion contributes to the decline in environmental quality of the Caspian.
Coastal cities and towns dump most municipal wastes into the water on the Caspian
Mining activities reduce the water quality of the Caspian.
Sea level fluctuation has been responsible for most damage to the coastal infrastructure.
The Caspian environment would be improved if all oil and gas activities used best available technologies.
A petroleum industry based legal agreement for marine pollution from oil would reduce oil pollution in the Caspian.
There are adequate oil reception facilities in the Caspian region.
I have seen unusual creatures in the Caspian that were not there ten years ago.
All steps should be taken to limit invasive species that threaten the ecosystem.
Invasive species are creating significant environmental degradation in the Caspian.
Thank you for your participation in this survey!
If you have questions or comments, please contact Mary M. Matthews at:
E-mail: caspianenvironment@hotmail.com
Or contact the individual who distributed this questionnaire to you.
The completed Regional Stakeholder Analysis will be available on the CEP web page later this year. Please visit: http://www.caspianenvironment.org
Annex 3.6
Supplemental Material for
Section 2.3
Decline in Certain Commercial Fish Stocks
Contents
Figure 3.6-1 Arsenic in Fish Tissue 3
Figure 3.6-2 Cadmium in Fish Tissue 4
Figure 3.6-3 Copper in Fish Tissue 5
Figure 3.6-4 Mercury in Fish Tissue 6
Figure 3.6-5 Zinc in Fish Tissue 7
MPC: Maximum permitted concentration (CIS standard) 2
Figure 3.7-1 Arsenic in Water 3
Figure 3.7-2 Barium in Water 4
Figure 3.7-3 Cadmium in Water 5
Figure 3.7-4 Chromium in Water 6
Figure 3.7-5 Copper in Water 7
Figure 3.7-6 Iron in Water 8
Figure 3.7-7 Lead in Water 9
Figure 3.7-8 Mercury in Water 10
Figure 3.7-9 Nickel in Water 11
Figure 3.7-10 Vanadium in Water 12
Figure 3.7-11 Zinc in Water 13
Figure 3.7-12 Phenols in Water 14
Figure 3.7-13 Total Hydrocarbons in Water 15
Figure 3.8-1 a HCH in Sediments 3
Figure 3.8-2 Aldrin in Sediments 4
Figure 3.8-3 Alpha Endosulfan in Sediments 5
Figure 3.8-4 Aluminum in Sediments 6
Figure 3.8-5 Aroclor 1254 in Sediments 7
Figure 3.8-6 Arsenic in Sediment 8
Figure 3.8-7 b HCH in Sediment 9
Figure 3.8-8 Barium in Sediment 10
Figure 3.8-9 Beta Endosulfan in Sediment 11
Figure 3.8-10 Cadmium in Sediment 12
Figure 3.8-11 Carbonate in Sediment 13
Figure 3.8-12 Chromium in Sediment 14
Figure 3.8-13 CIS Chlordane in Sediment 15
Figure 3.8-14 Copper in Sediment 16
Figure 3.8-15 d HCH in Sediment 17
Figure 3.8-16 Dieldrin in Sediment 18
Figure 3.8-17 Endosulfan Sulfate in Sediment 19
Figure 3.8-18 Endrin in Sediment 20
Figure 3.8-19 Fines 62-10 in Sediment 21
Figure 3.8-20 HCB in Sediment 22
Figure 3.8-21 Heptachlor Epoxide in Sediment 23
Figure 3.8-22 Heptachlor in Sediment 24
Figure 3.8-23 Lindane in Sediment 25
Figure 3.8-24 Mercury in Sediment 26
Figure 3.8-25 Methoxychlor in Sediment 27
Figure 3.8-26 Nickel in Sediment 28
Figure 3.8-27 Silver in Sediment 29
Figure 3.8-28 Total DDT in Sediment 30
Figure 3.8-29 Total HCH in Sediment 31
Figure 3.8-30 Total Hydrocarbons in Sediment 32
Figure 3.8-31 Total Organic Carbon in Sediment 33
Figure 3.8-32 Total PAHs in Sediment 34
Figure 3.8-33 Total PCBs in Sediment 35
Figure 3.8-34 Trans Chlordane in Sediment 36
Figure 3.8-35 Unresolved Aliphatics in Sediment 37
Figure 3.8-36 Unresolved Aromatics in Sediment 38
Figure 3.8-37 Vanadium in Sediment 39
Figure 3.8-38 Zinc in Sediment 40
Figure 3.9-1 Chlordane –related compounds in Seal Blubber 3
Figure 3.9-2 DDT –related compounds in Seal Blubber 4
Figure 3.9-3 Dieldrin in Seal Blubber 5
Figure 3.9-4 HCB in Seal Blubber 6
Figure 3.9-5 HCHs in Seal Blubber 7
Figure 3.10-1.5 Al (g g-1), Ca (g g-1) and carbonate (%) as a function of the percentage of fine material in Caspian Sea sediments. 3
Figure 3.10-2.4 Plots of sedimentary concentrations of Unresolved Complex Mixture (UCM, g g-1) and ratios to resolved aliphatics (UCM/R) and n-alkanes (UCM/n-alkanes) for stations in Azerbaijan (A) and Iran (B). 4
Figure 3.10-2.6 Ternary diagram showing the relative amounts of PAHs from different sources (fossil oil, combustion products and natural biological activity) and distinguished on a country basis. 5
Figure 3.10-2.8 Ternary diagram showing the relative amounts of DDT (i.e. fresh input) and its breakdown products DDD and DDE for sediments samples from throughout the Caspian Sea. 6
Figure 3.10-2.26 A plot of the Goldberg Index for coastal sediments from throughout the Caspian Sea, together with the concentrations of PCBs to DDTs from which it is calculated. 7
Figure 3.10-3.3 Ba plotted against Al concentrations (g g-1) for all sites in the Caspian Sea. 8
8
Figure 3.10-3.6 Cr as a function of Al concentrations (g g-1) in Azerbaijan, Iran, Kazakhstan and Russia.. 9
9
Figure 3.10-3.9 Co and Pb as a function of Al concentrations (g g-1) for all sites in the Caspian Sea. 10
Figure 3.6-1 Arsenic in Fish Tissue
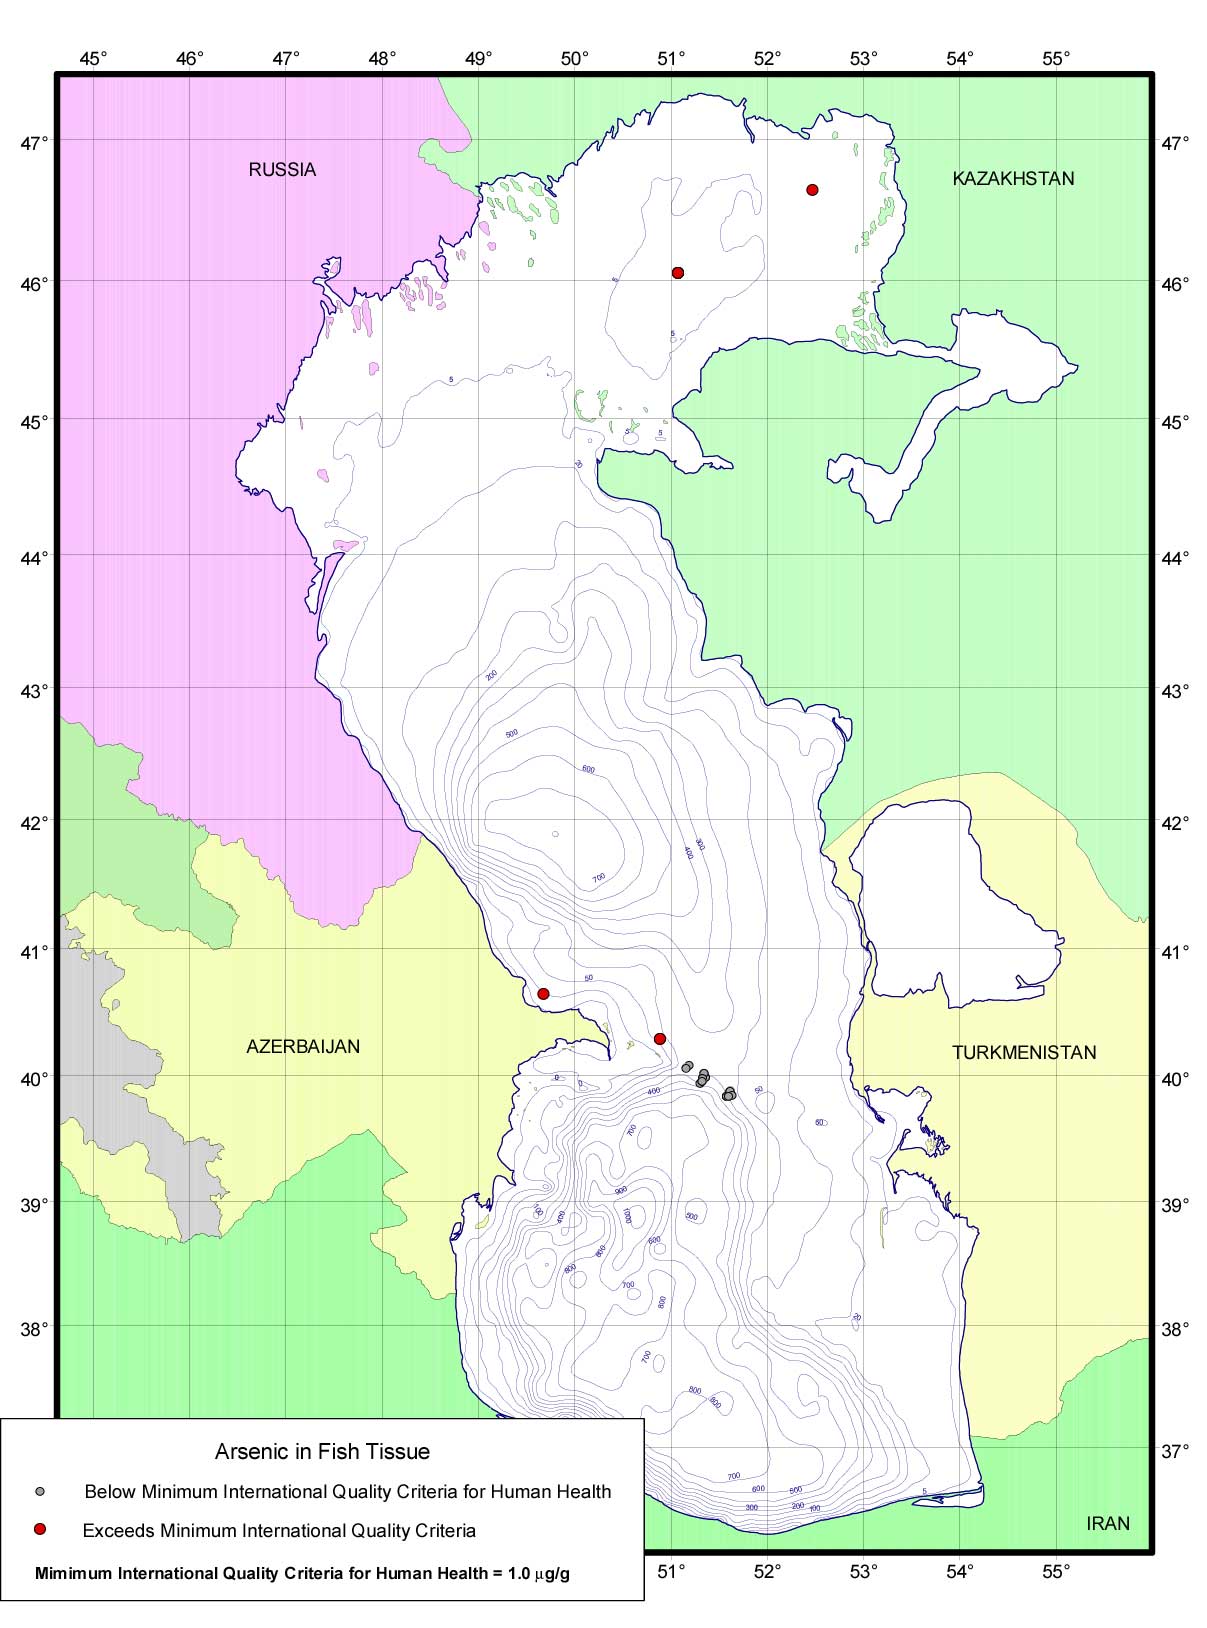
Figure 3.6-2 Cadmium in Fish Tissue
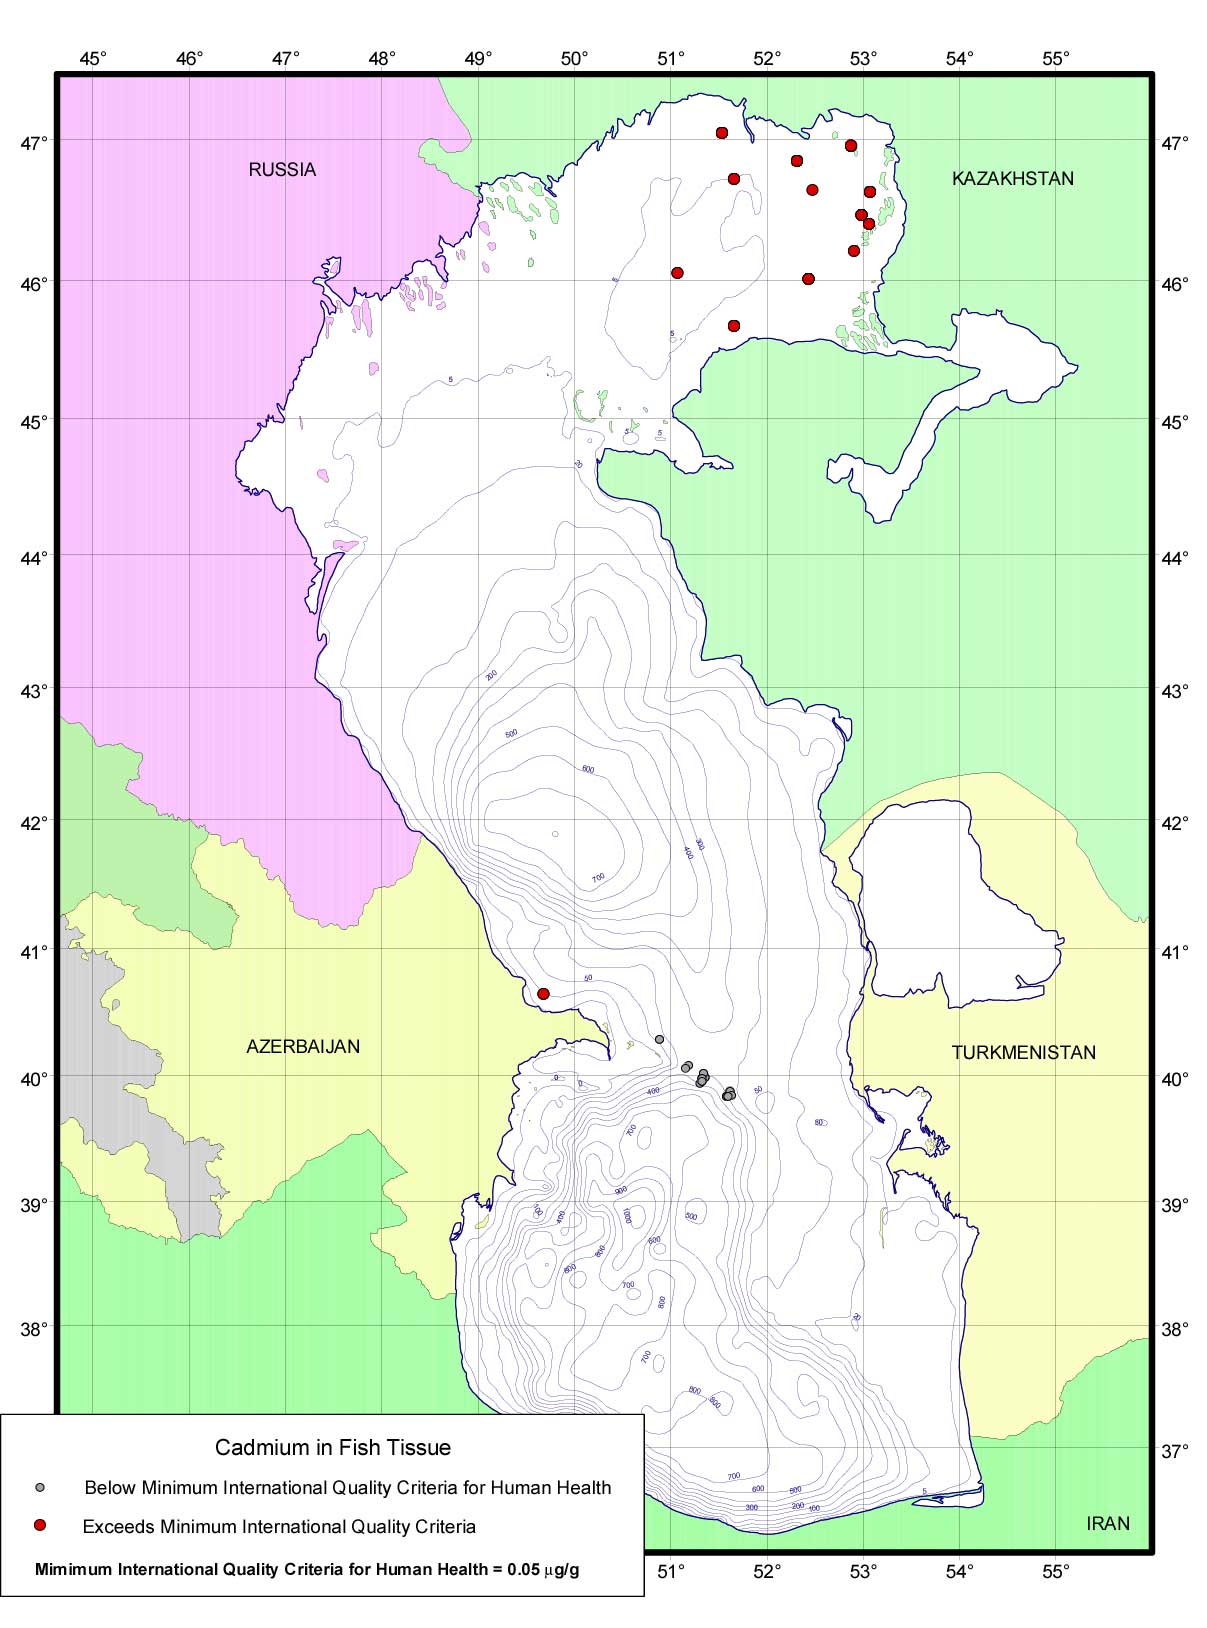
Figure 3.6-3 Copper in Fish Tissue

Figure 3.6-4 Mercury in Fish Tissue

Figure 3.6-5 Zinc in Fish Tissue
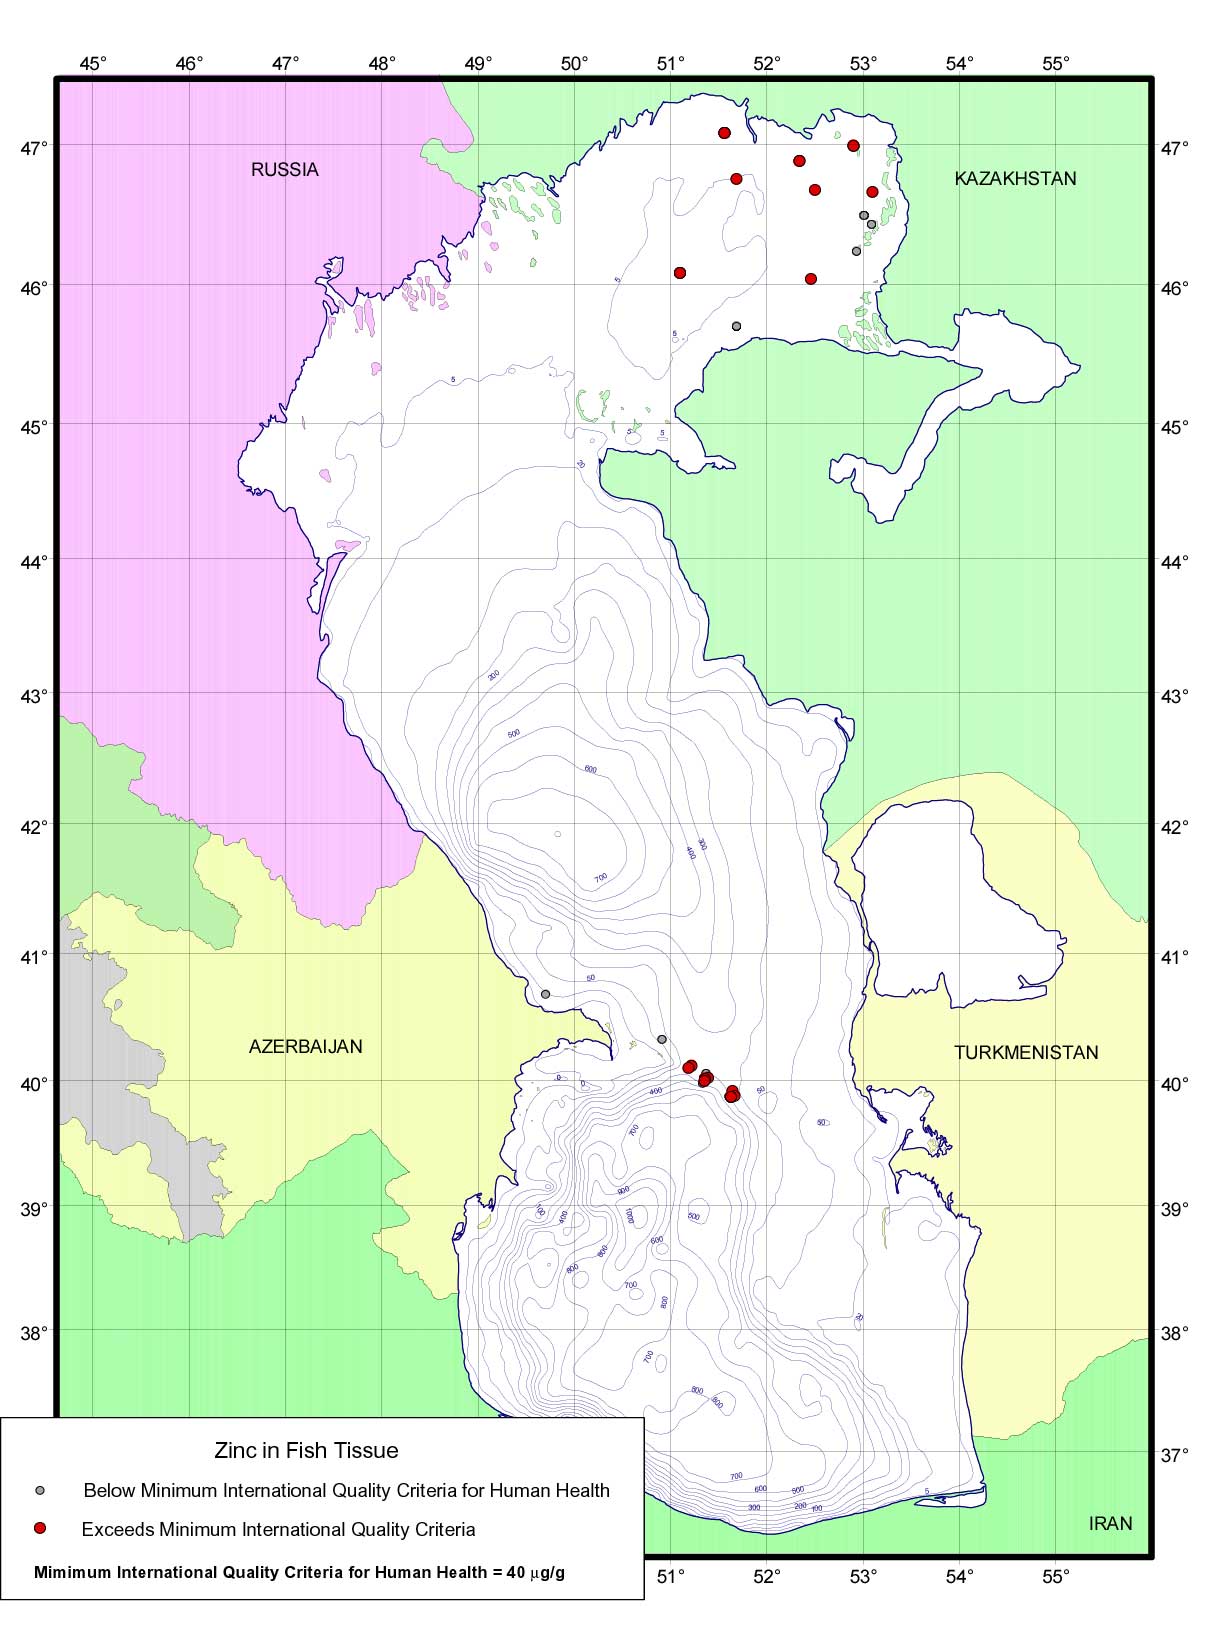
Annex 3.7
Supplemental Material for
Section 2.6
Water Quality Data for the Caspian Sea
(from EIAs and Baseline Studies submitted by the Oil and Gas industries)
Contents
Figure 3.6-1 Arsenic in Fish Tissue 3
Figure 3.6-2 Cadmium in Fish Tissue 4
Figure 3.6-3 Copper in Fish Tissue 5
Figure 3.6-4 Mercury in Fish Tissue 6
Figure 3.6-5 Zinc in Fish Tissue 7
MPC: Maximum permitted concentration (CIS standard) 2
Figure 3.7-1 Arsenic in Water 3
Figure 3.7-2 Barium in Water 4
Figure 3.7-3 Cadmium in Water 5
Figure 3.7-4 Chromium in Water 6
Figure 3.7-5 Copper in Water 7
Figure 3.7-6 Iron in Water 8
Figure 3.7-7 Lead in Water 9
Figure 3.7-8 Mercury in Water 10
Figure 3.7-9 Nickel in Water 11
Figure 3.7-10 Vanadium in Water 12
Figure 3.7-11 Zinc in Water 13
Figure 3.7-12 Phenols in Water 14
Figure 3.7-13 Total Hydrocarbons in Water 15
Figure 3.8-1 a HCH in Sediments 3
Figure 3.8-2 Aldrin in Sediments 4
Figure 3.8-3 Alpha Endosulfan in Sediments 5
Figure 3.8-4 Aluminum in Sediments 6
Figure 3.8-5 Aroclor 1254 in Sediments 7
Figure 3.8-6 Arsenic in Sediment 8
Figure 3.8-7 b HCH in Sediment 9
Figure 3.8-8 Barium in Sediment 10
Figure 3.8-9 Beta Endosulfan in Sediment 11
Figure 3.8-10 Cadmium in Sediment 12
Figure 3.8-11 Carbonate in Sediment 13
Figure 3.8-12 Chromium in Sediment 14
Figure 3.8-13 CIS Chlordane in Sediment 15
Figure 3.8-14 Copper in Sediment 16
Figure 3.8-15 d HCH in Sediment 17
Figure 3.8-16 Dieldrin in Sediment 18
Figure 3.8-17 Endosulfan Sulfate in Sediment 19
Figure 3.8-18 Endrin in Sediment 20
Figure 3.8-19 Fines 62-10 in Sediment 21
Figure 3.8-20 HCB in Sediment 22
Figure 3.8-21 Heptachlor Epoxide in Sediment 23
Figure 3.8-22 Heptachlor in Sediment 24
Figure 3.8-23 Lindane in Sediment 25
Figure 3.8-24 Mercury in Sediment 26
Figure 3.8-25 Methoxychlor in Sediment 27
Figure 3.8-26 Nickel in Sediment 28
Figure 3.8-27 Silver in Sediment 29
Figure 3.8-28 Total DDT in Sediment 30
Figure 3.8-29 Total HCH in Sediment 31
Figure 3.8-30 Total Hydrocarbons in Sediment 32
Figure 3.8-31 Total Organic Carbon in Sediment 33
Figure 3.8-32 Total PAHs in Sediment 34
Figure 3.8-33 Total PCBs in Sediment 35
Figure 3.8-34 Trans Chlordane in Sediment 36
Figure 3.8-35 Unresolved Aliphatics in Sediment 37
Figure 3.8-36 Unresolved Aromatics in Sediment 38
Figure 3.8-37 Vanadium in Sediment 39
Figure 3.8-38 Zinc in Sediment 40
Figure 3.9-1 Chlordane –related compounds in Seal Blubber 3
Figure 3.9-2 DDT –related compounds in Seal Blubber 4
Figure 3.9-3 Dieldrin in Seal Blubber 5
Figure 3.9-4 HCB in Seal Blubber 6
Figure 3.9-5 HCHs in Seal Blubber 7
Figure 3.10-1.5 Al (g g-1), Ca (g g-1) and carbonate (%) as a function of the percentage of fine material in Caspian Sea sediments. 3
Figure 3.10-2.4 Plots of sedimentary concentrations of Unresolved Complex Mixture (UCM, g g-1) and ratios to resolved aliphatics (UCM/R) and n-alkanes (UCM/n-alkanes) for stations in Azerbaijan (A) and Iran (B). 4
Figure 3.10-2.6 Ternary diagram showing the relative amounts of PAHs from different sources (fossil oil, combustion products and natural biological activity) and distinguished on a country basis. 5
Figure 3.10-2.8 Ternary diagram showing the relative amounts of DDT (i.e. fresh input) and its breakdown products DDD and DDE for sediments samples from throughout the Caspian Sea. 6
Figure 3.10-2.26 A plot of the Goldberg Index for coastal sediments from throughout the Caspian Sea, together with the concentrations of PCBs to DDTs from which it is calculated. 7
Figure 3.10-3.3 Ba plotted against Al concentrations (g g-1) for all sites in the Caspian Sea. 8
8
Figure 3.10-3.6 Cr as a function of Al concentrations (g g-1) in Azerbaijan, Iran, Kazakhstan and Russia.. 9
9
Figure 3.10-3.9 Co and Pb as a function of Al concentrations (g g-1) for all sites in the Caspian Sea. 10
MPC: Maximum permitted concentration (CIS standard)
Figure 3.7-1 Arsenic in Water
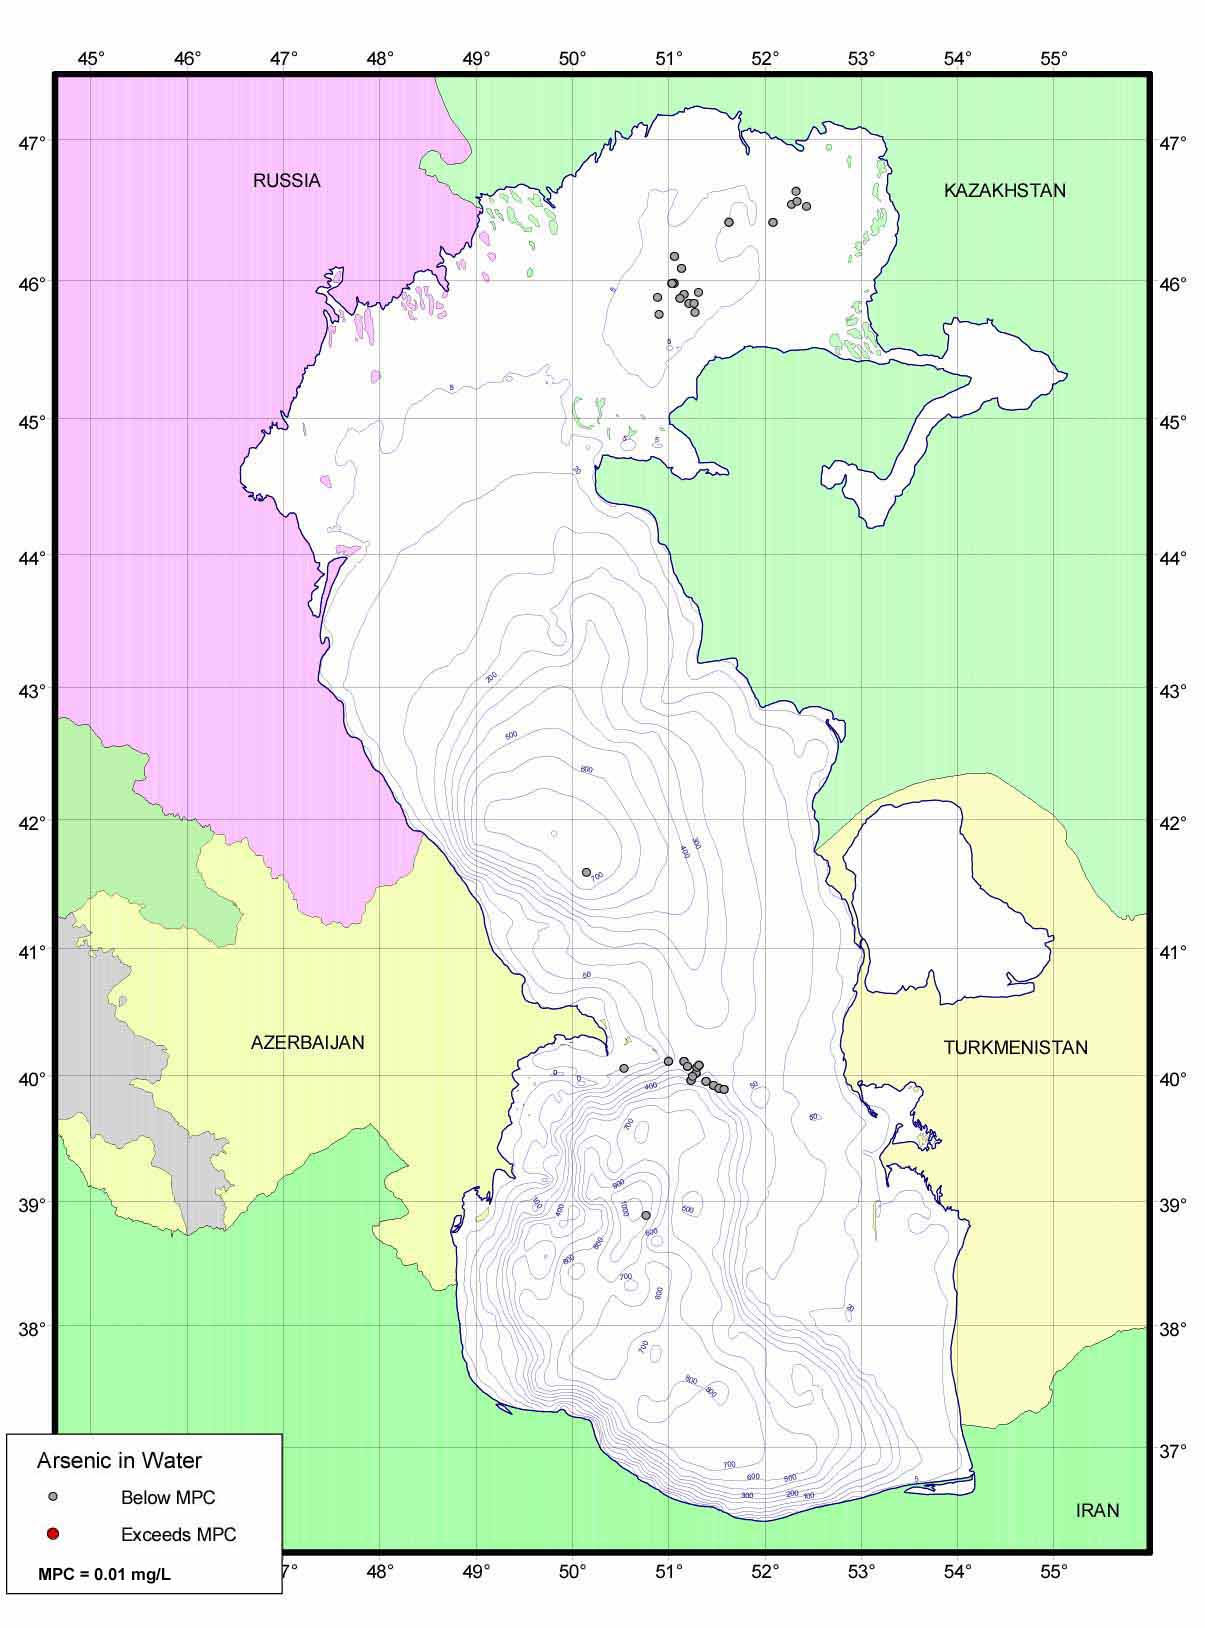
Figure 3.7-2 Barium in Water
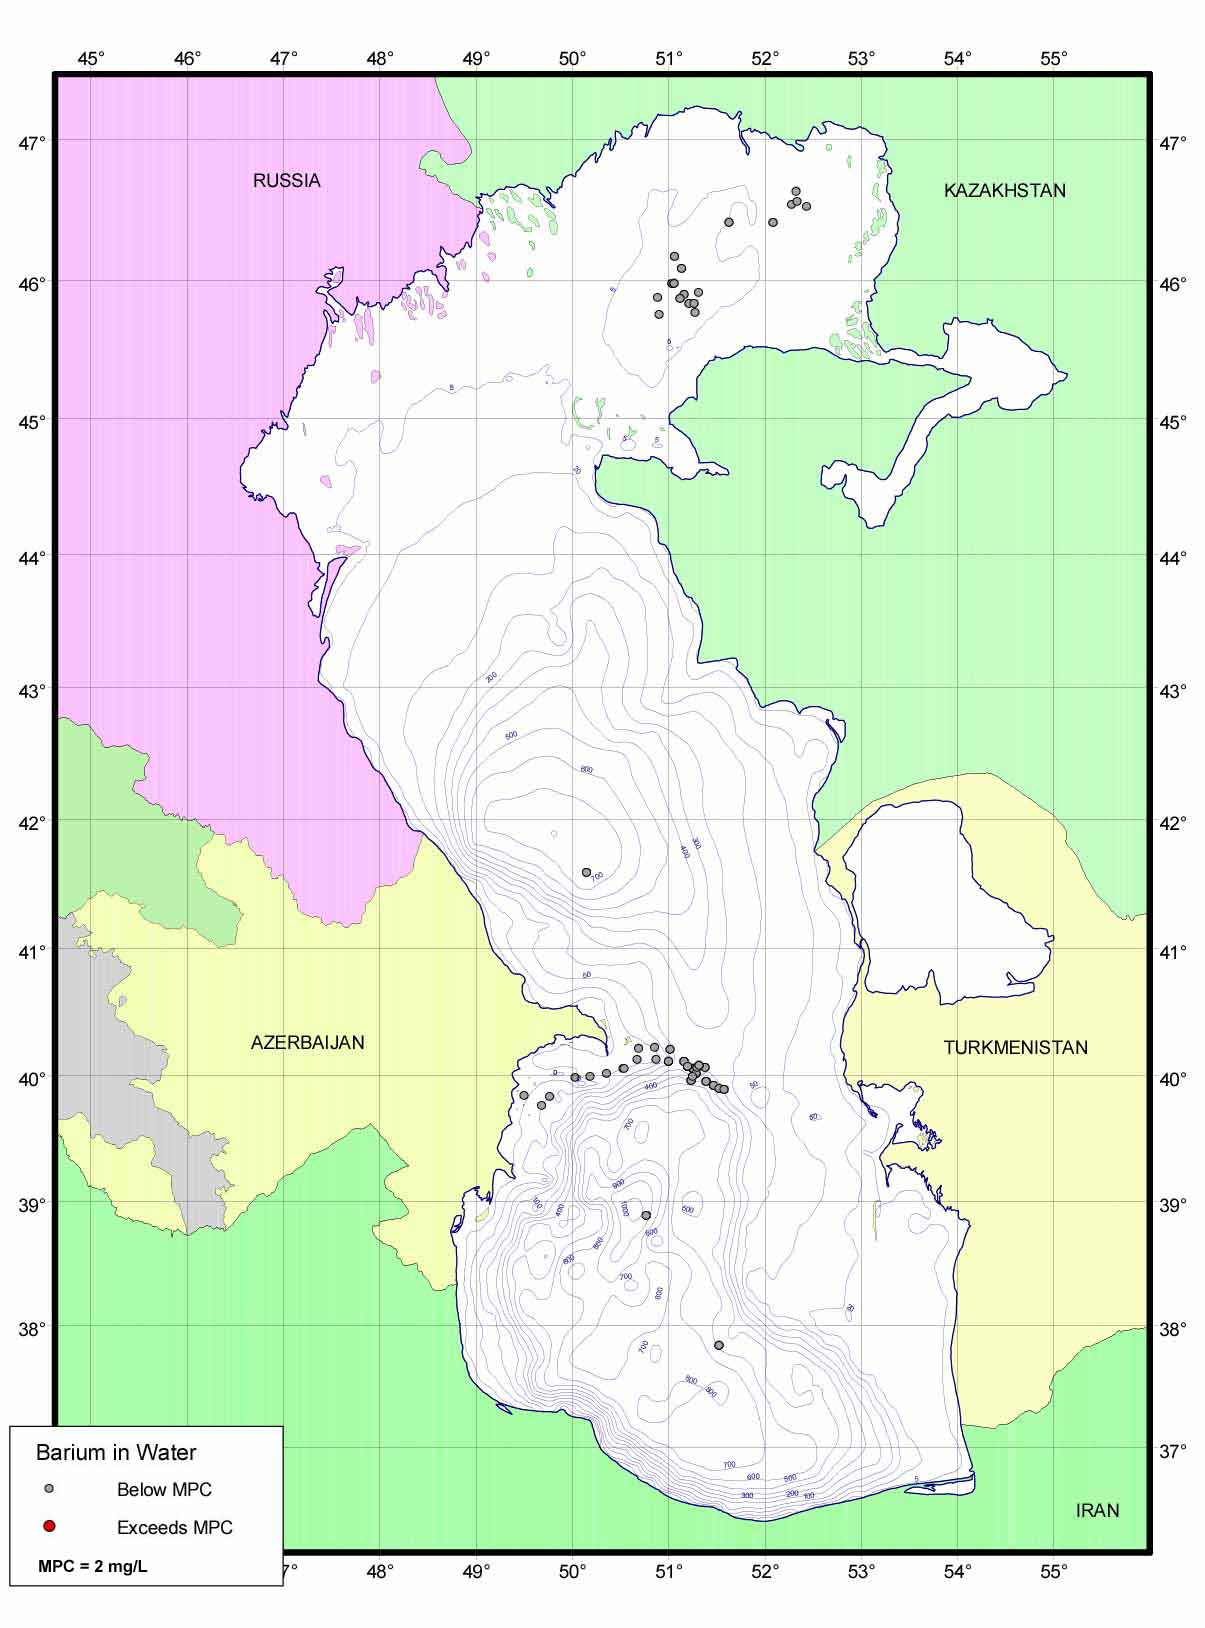
Figure 3.7-3 Cadmium in Water

Figure 3.7-4 Chromium in Water

Figure 3.7-5 Copper in Water
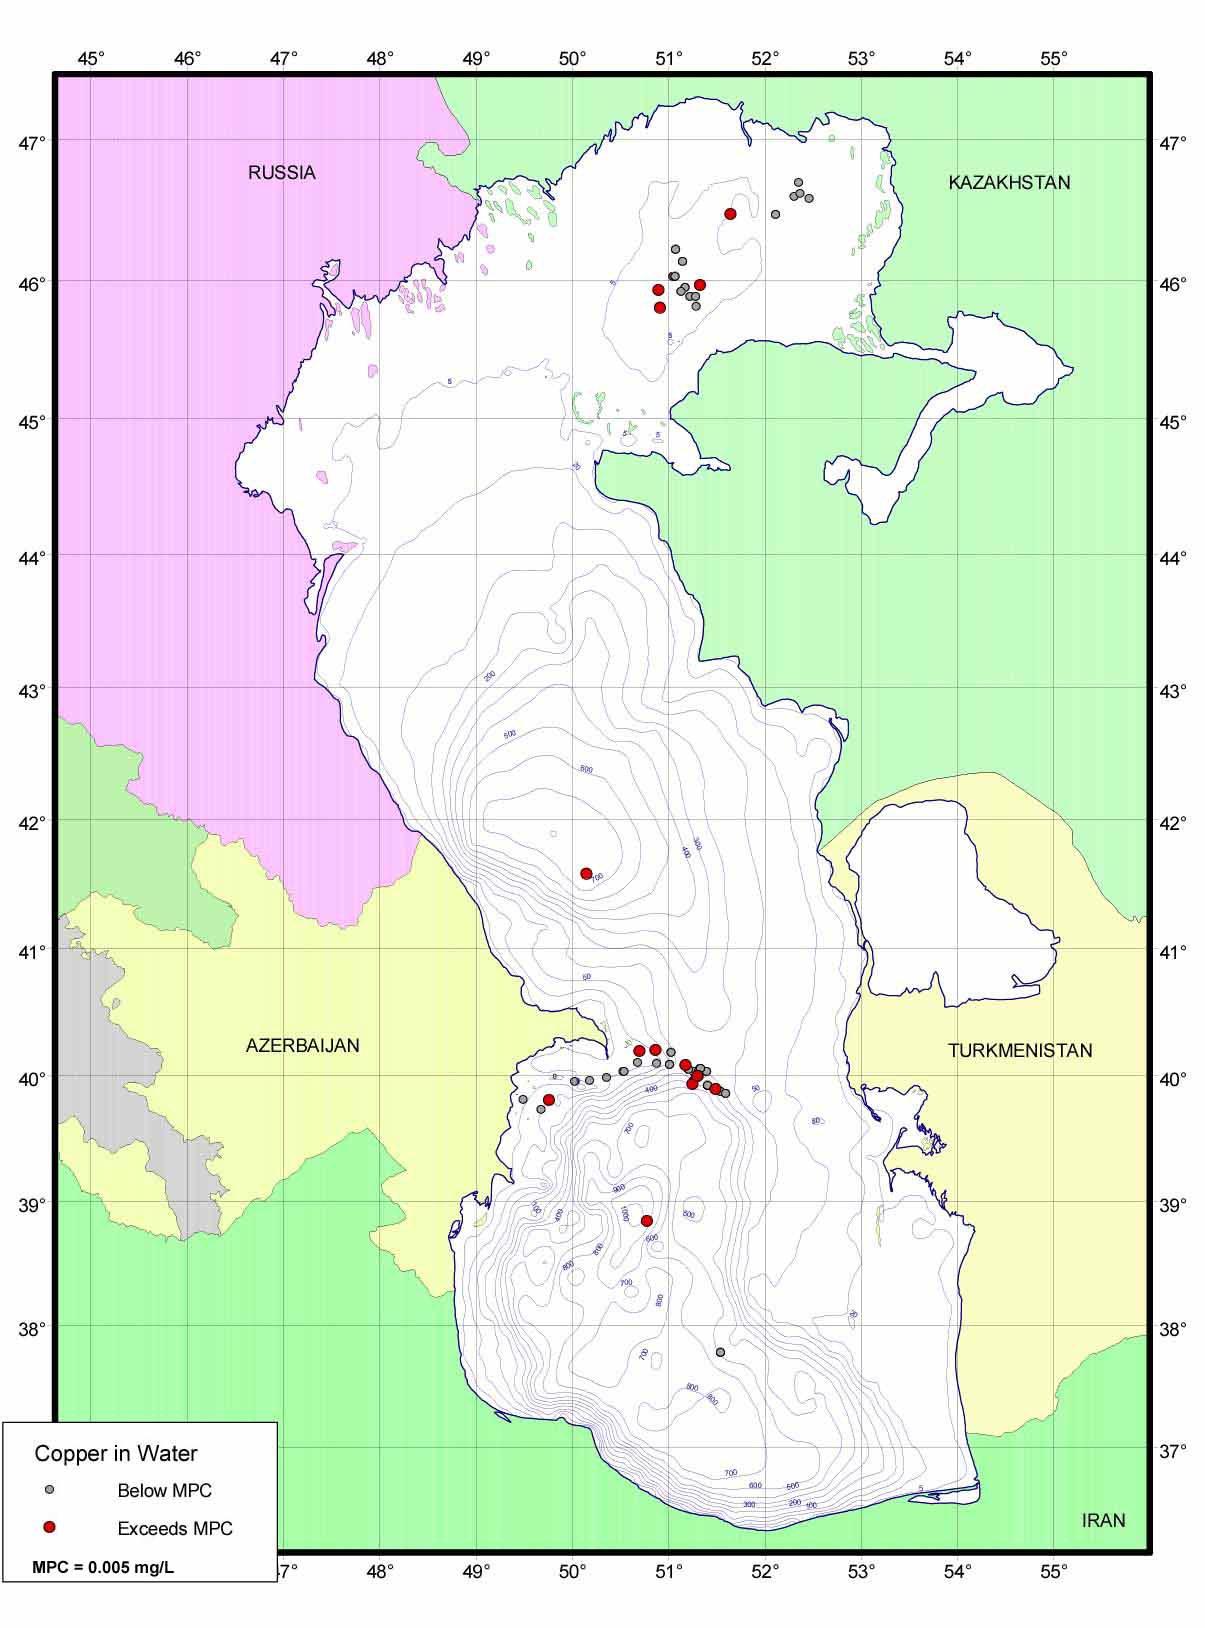
Figure 3.7-6 Iron in Water
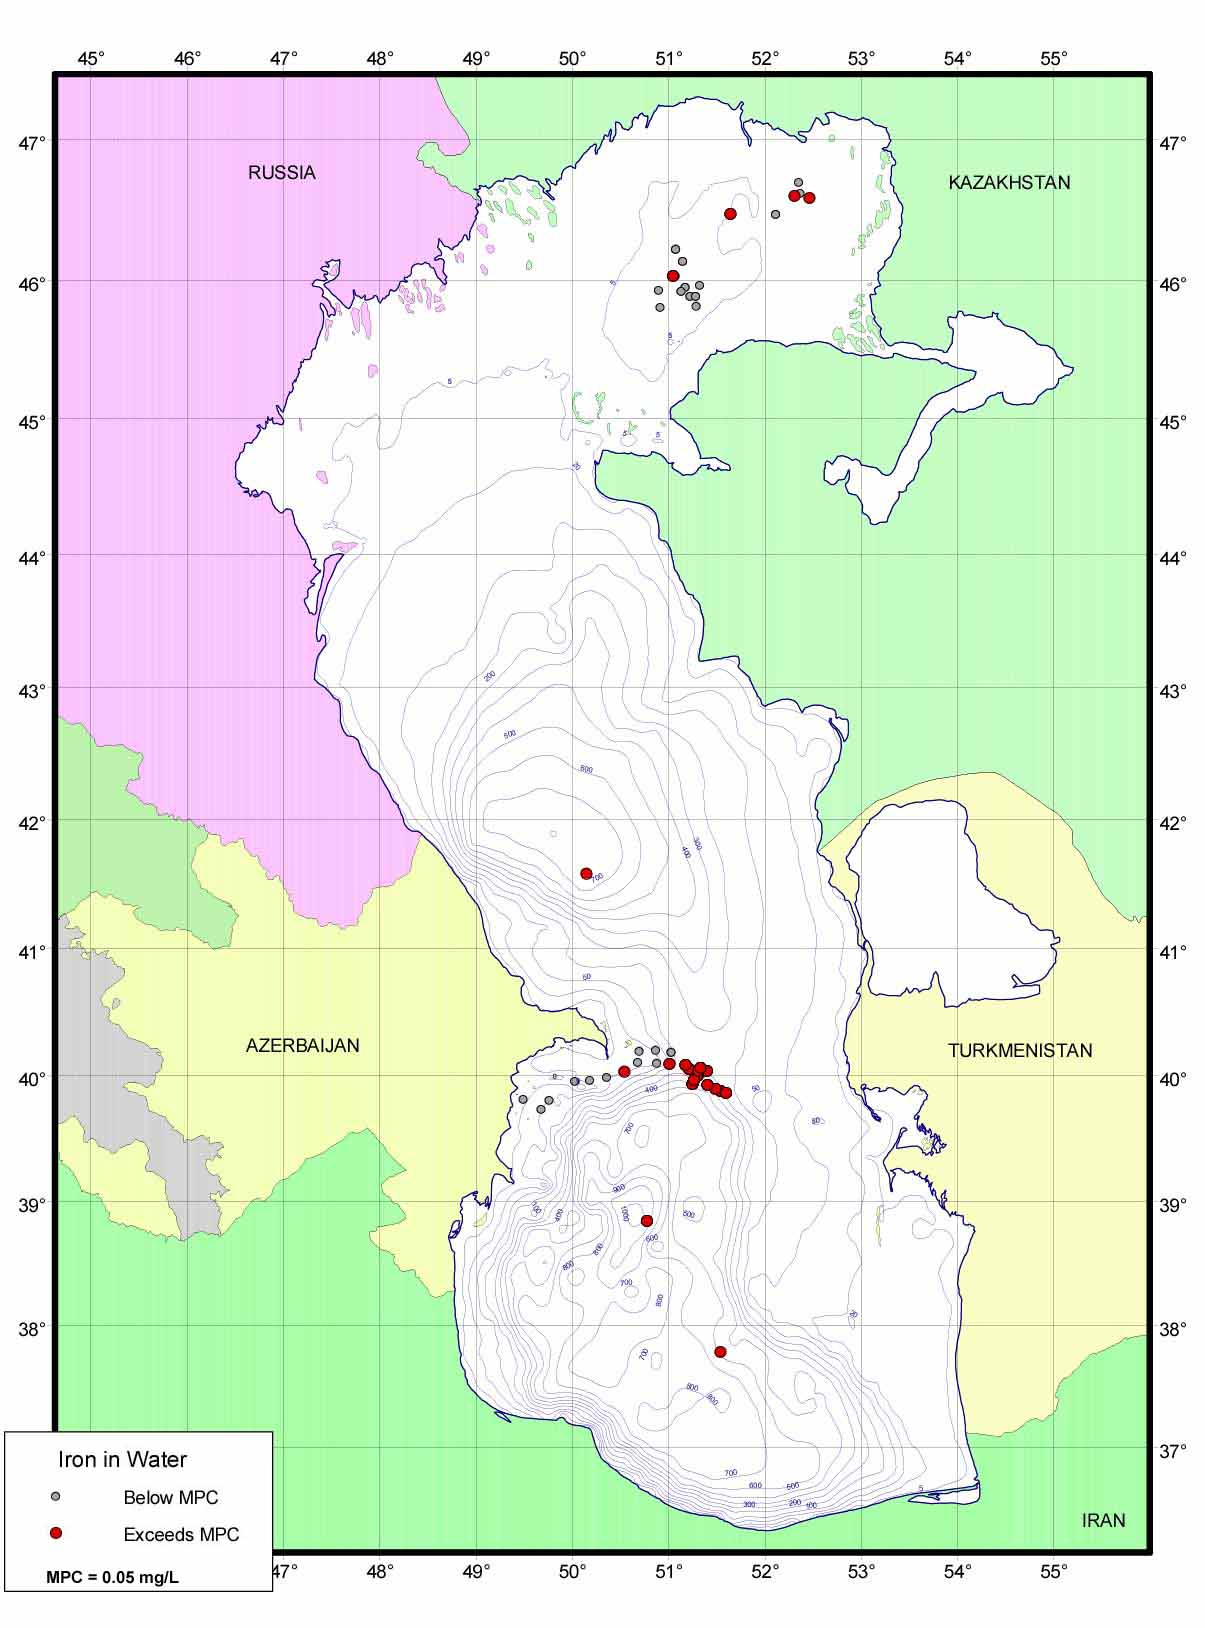
Figure 3.7-7 Lead in Water
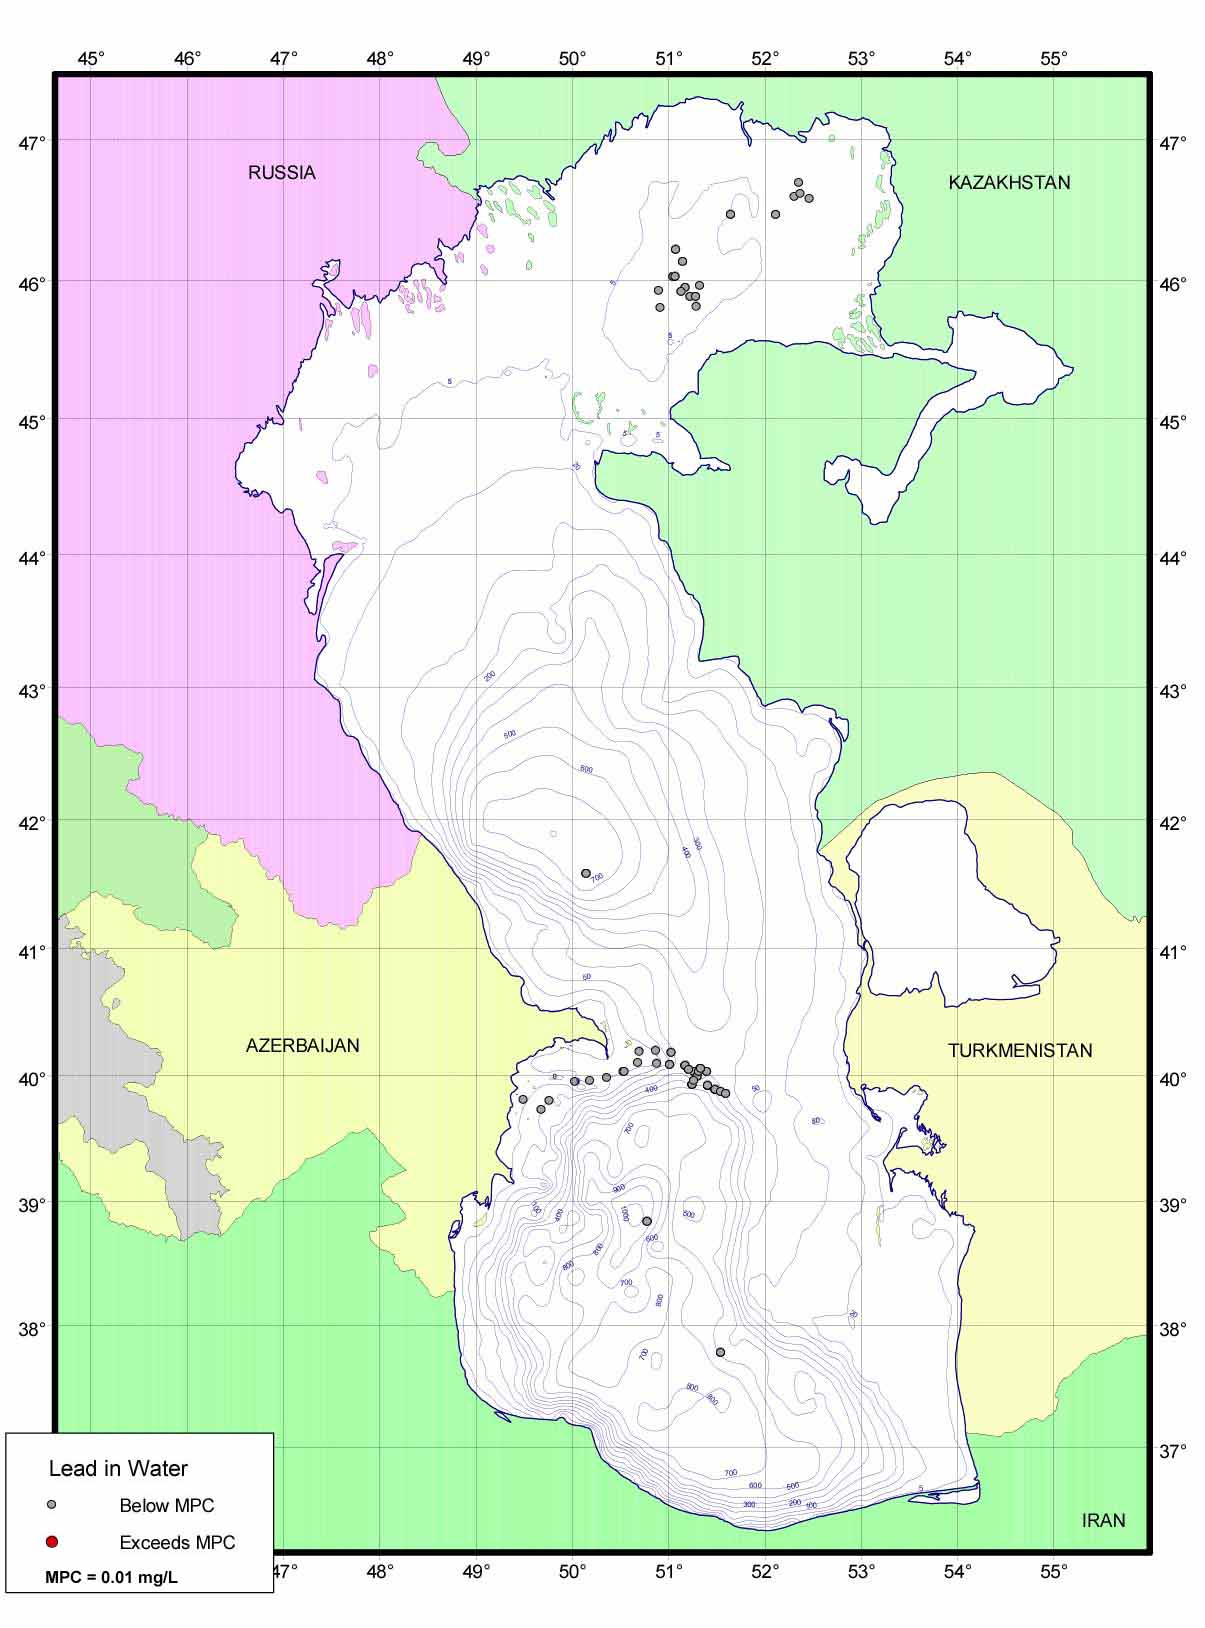
Figure 3.7-8 Mercury in Water
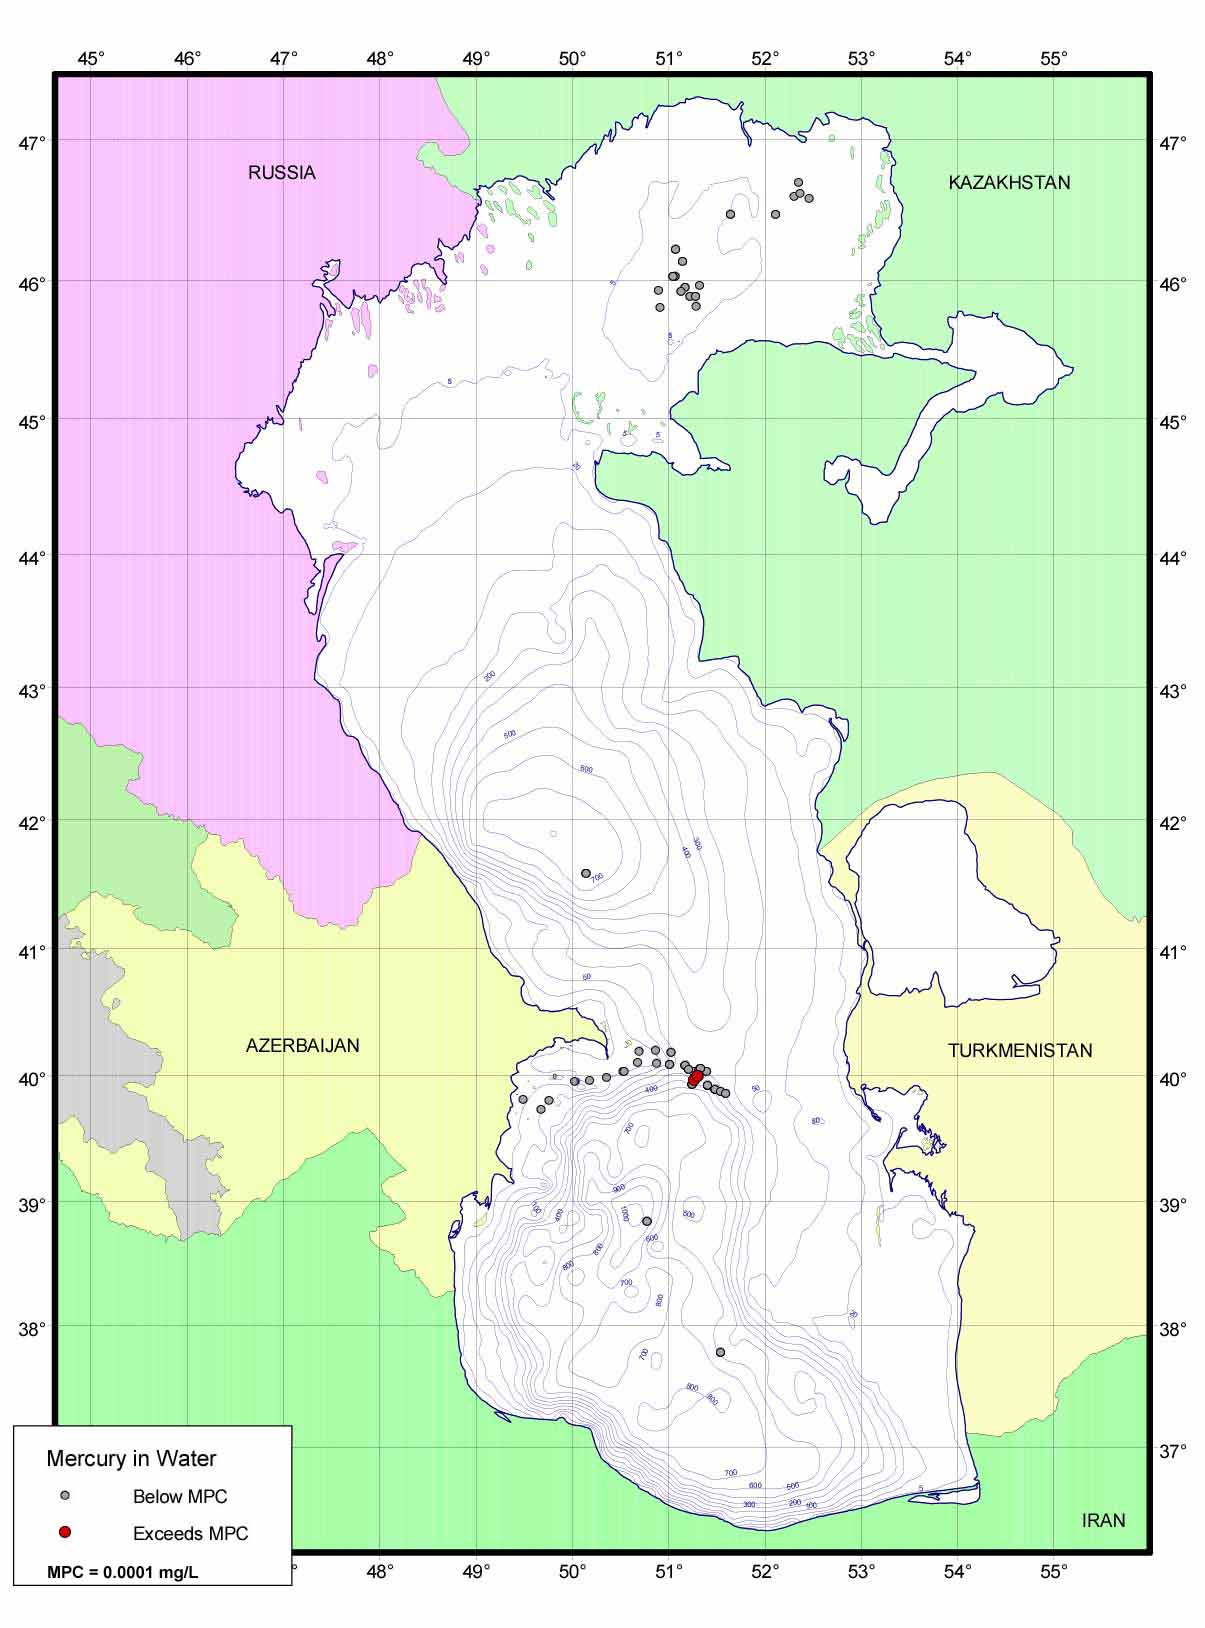
Figure 3.7-9 Nickel in Water
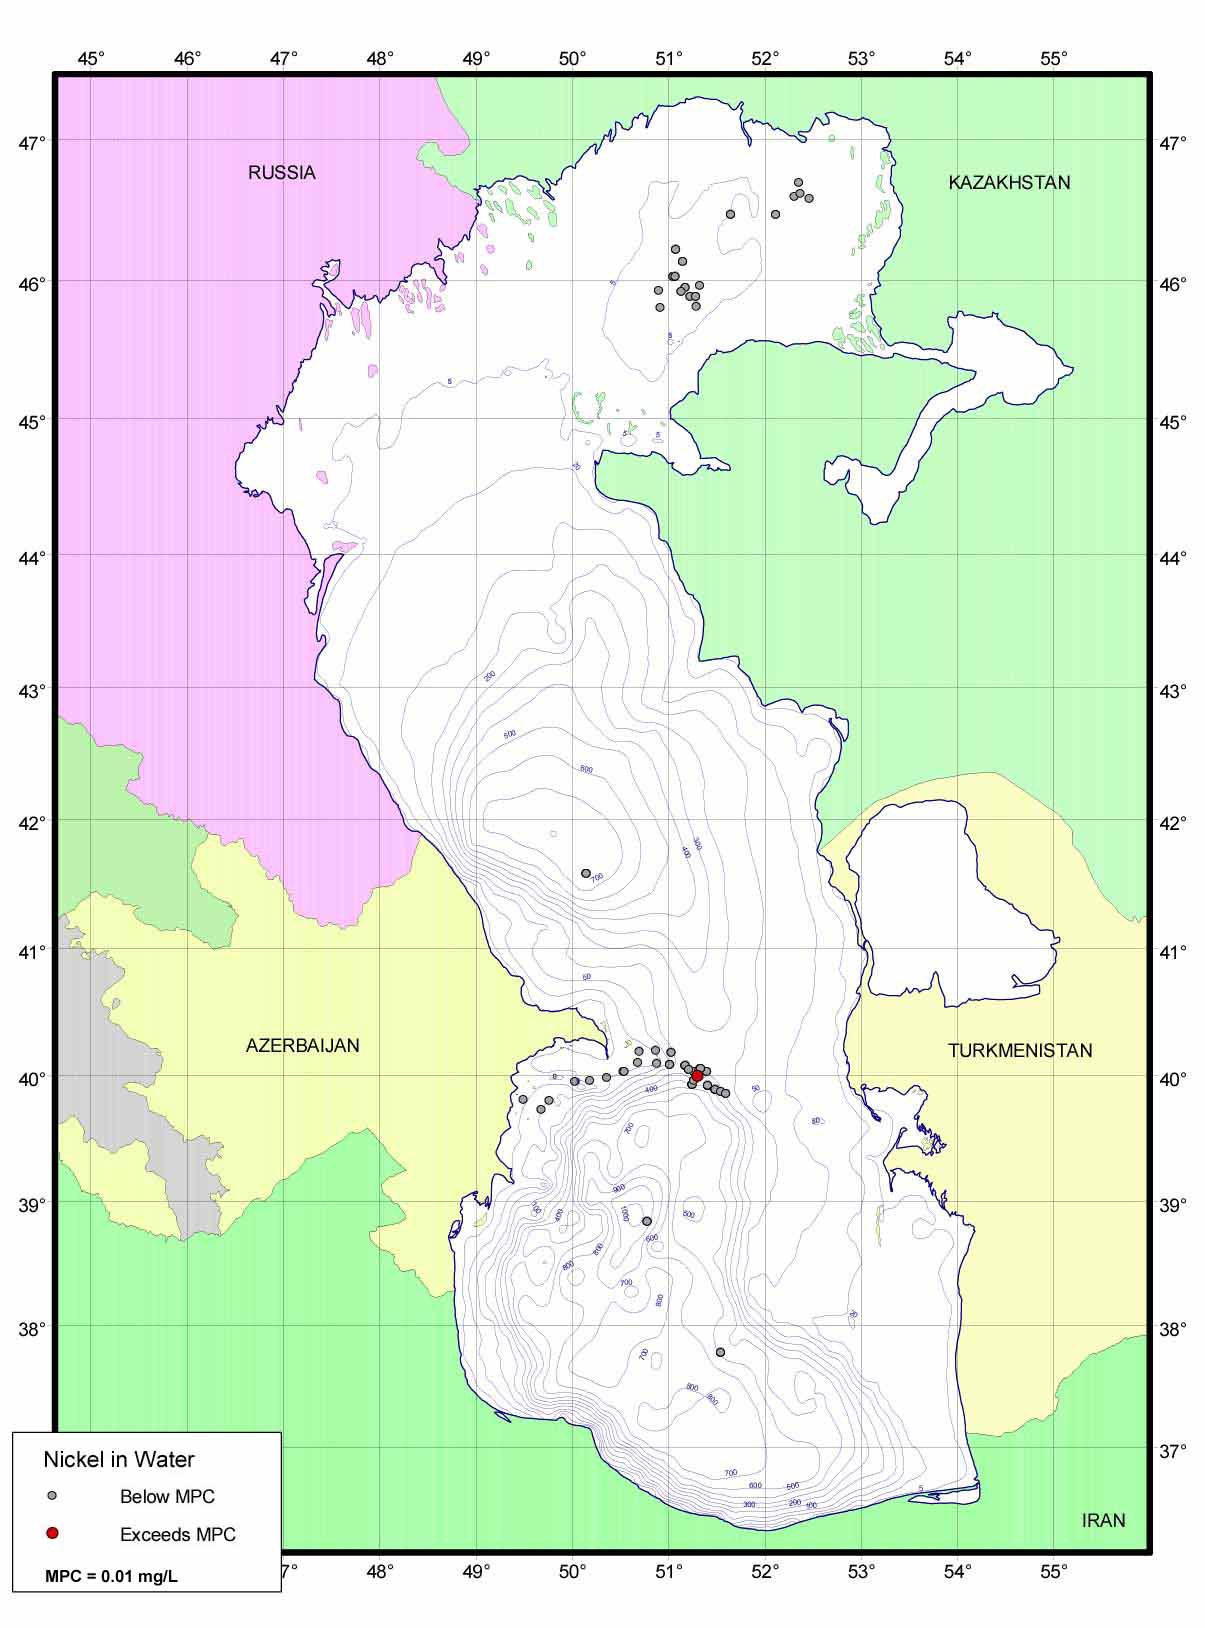
Figure 3.7-10 Vanadium in Water

Figure 3.7-11 Zinc in Water

Figure 3.7-12 Phenols in Water

Figure 3.7-13 Total Hydrocarbons in Water
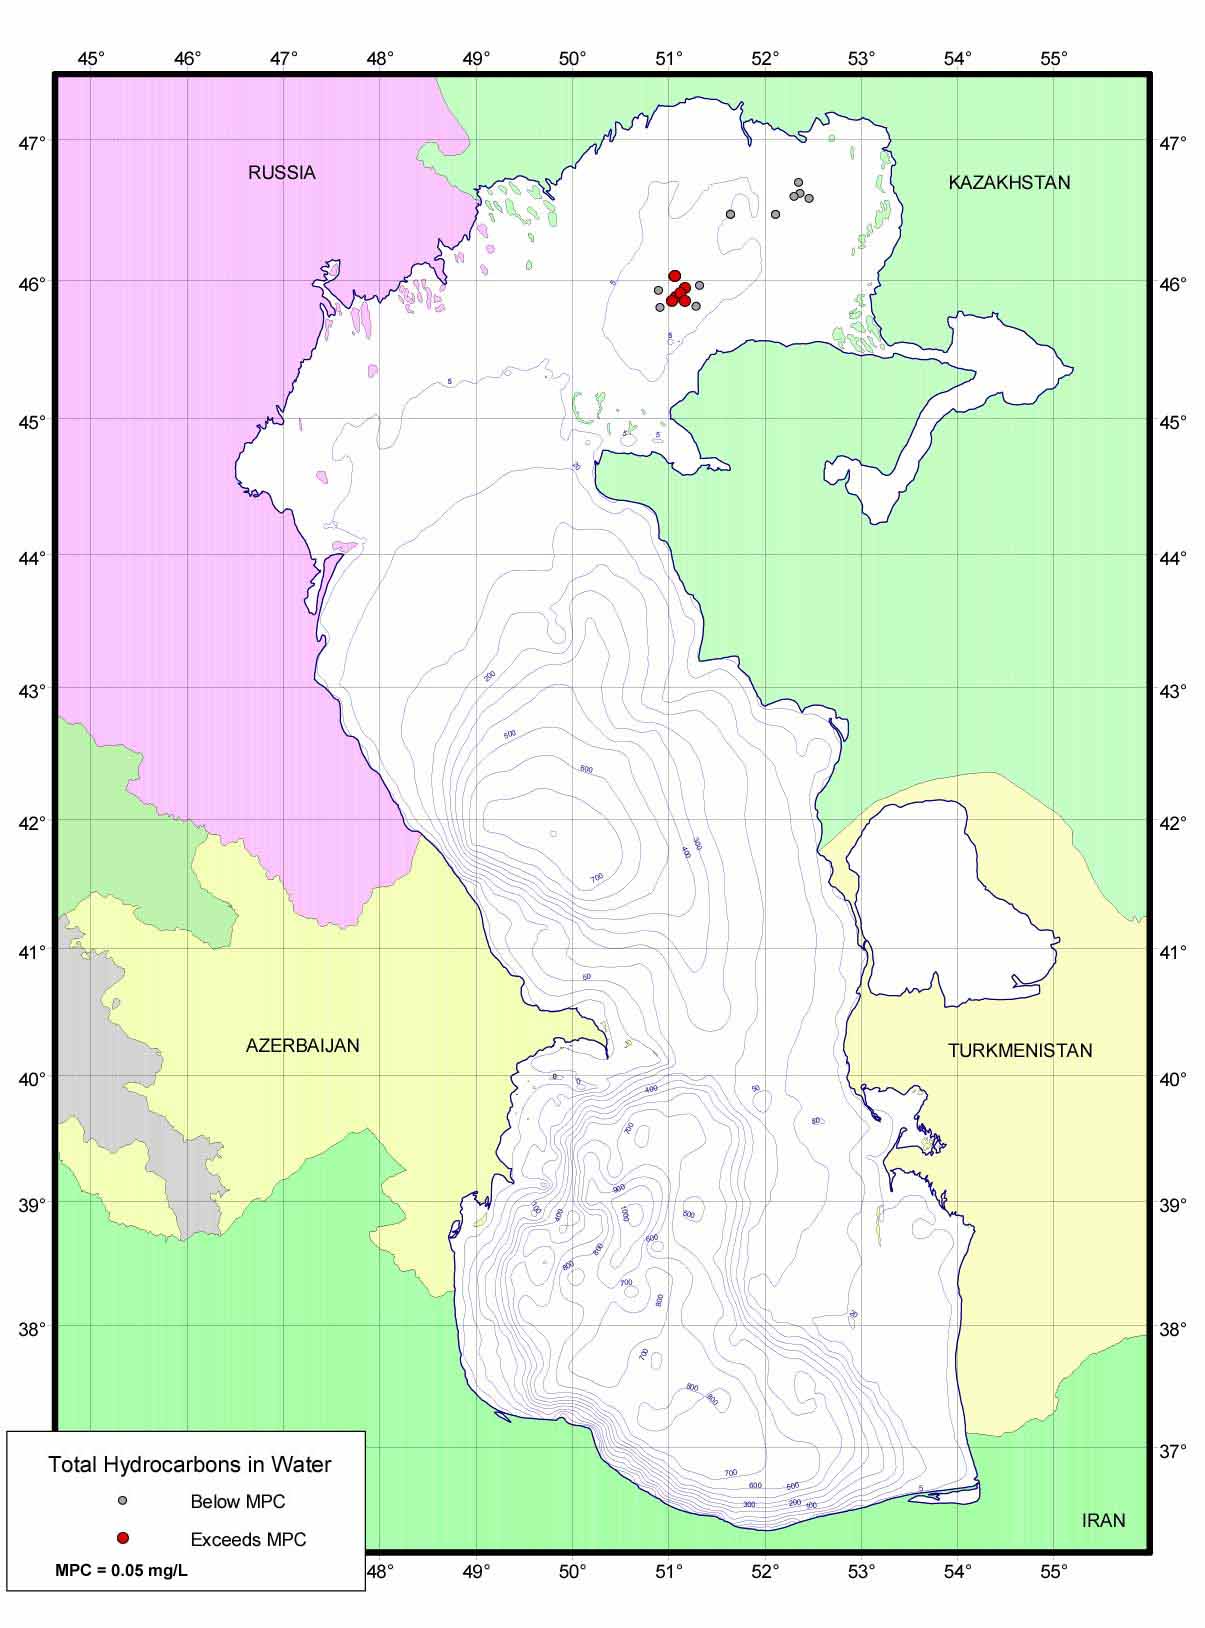
Annex 3.8
Supplemental Material for
Section 2.6
Sediment Quality Data for the Caspian Sea
Contents
Figure 3.6-1 Arsenic in Fish Tissue 3
Figure 3.6-2 Cadmium in Fish Tissue 4
Figure 3.6-3 Copper in Fish Tissue 5
Figure 3.6-4 Mercury in Fish Tissue 6
Figure 3.6-5 Zinc in Fish Tissue 7
MPC: Maximum permitted concentration (CIS standard) 2
Figure 3.7-1 Arsenic in Water 3
Figure 3.7-2 Barium in Water 4
Figure 3.7-3 Cadmium in Water 5
Figure 3.7-4 Chromium in Water 6
Figure 3.7-5 Copper in Water 7
Figure 3.7-6 Iron in Water 8
Figure 3.7-7 Lead in Water 9
Figure 3.7-8 Mercury in Water 10
Figure 3.7-9 Nickel in Water 11
Figure 3.7-10 Vanadium in Water 12
Figure 3.7-11 Zinc in Water 13
Figure 3.7-12 Phenols in Water 14
Figure 3.7-13 Total Hydrocarbons in Water 15
Figure 3.8-1 a HCH in Sediments 3
Figure 3.8-2 Aldrin in Sediments 4
Figure 3.8-3 Alpha Endosulfan in Sediments 5
Figure 3.8-4 Aluminum in Sediments 6
Figure 3.8-5 Aroclor 1254 in Sediments 7
Figure 3.8-6 Arsenic in Sediment 8
Figure 3.8-7 b HCH in Sediment 9
Figure 3.8-8 Barium in Sediment 10
Figure 3.8-9 Beta Endosulfan in Sediment 11
Figure 3.8-10 Cadmium in Sediment 12
Figure 3.8-11 Carbonate in Sediment 13
Figure 3.8-12 Chromium in Sediment 14
Figure 3.8-13 CIS Chlordane in Sediment 15
Figure 3.8-14 Copper in Sediment 16
Figure 3.8-15 d HCH in Sediment 17
Figure 3.8-16 Dieldrin in Sediment 18
Figure 3.8-17 Endosulfan Sulfate in Sediment 19
Figure 3.8-18 Endrin in Sediment 20
Figure 3.8-19 Fines 62-10 in Sediment 21
Figure 3.8-20 HCB in Sediment 22
Figure 3.8-21 Heptachlor Epoxide in Sediment 23
Figure 3.8-22 Heptachlor in Sediment 24
Figure 3.8-23 Lindane in Sediment 25
Figure 3.8-24 Mercury in Sediment 26
Figure 3.8-25 Methoxychlor in Sediment 27
Figure 3.8-26 Nickel in Sediment 28
Figure 3.8-27 Silver in Sediment 29
Figure 3.8-28 Total DDT in Sediment 30
Figure 3.8-29 Total HCH in Sediment 31
Figure 3.8-30 Total Hydrocarbons in Sediment 32
Figure 3.8-31 Total Organic Carbon in Sediment 33
Figure 3.8-32 Total PAHs in Sediment 34
Figure 3.8-33 Total PCBs in Sediment 35
Figure 3.8-34 Trans Chlordane in Sediment 36
Figure 3.8-35 Unresolved Aliphatics in Sediment 37
Figure 3.8-36 Unresolved Aromatics in Sediment 38
Figure 3.8-37 Vanadium in Sediment 39
Figure 3.8-38 Zinc in Sediment 40
Figure 3.9-1 Chlordane –related compounds in Seal Blubber 3
Figure 3.9-2 DDT –related compounds in Seal Blubber 4
Figure 3.9-3 Dieldrin in Seal Blubber 5
Figure 3.9-4 HCB in Seal Blubber 6
Figure 3.9-5 HCHs in Seal Blubber 7
Figure 3.10-1.5 Al (g g-1), Ca (g g-1) and carbonate (%) as a function of the percentage of fine material in Caspian Sea sediments. 3
Figure 3.10-2.4 Plots of sedimentary concentrations of Unresolved Complex Mixture (UCM, g g-1) and ratios to resolved aliphatics (UCM/R) and n-alkanes (UCM/n-alkanes) for stations in Azerbaijan (A) and Iran (B). 4
Figure 3.10-2.6 Ternary diagram showing the relative amounts of PAHs from different sources (fossil oil, combustion products and natural biological activity) and distinguished on a country basis. 5
Figure 3.10-2.8 Ternary diagram showing the relative amounts of DDT (i.e. fresh input) and its breakdown products DDD and DDE for sediments samples from throughout the Caspian Sea. 6
Figure 3.10-2.26 A plot of the Goldberg Index for coastal sediments from throughout the Caspian Sea, together with the concentrations of PCBs to DDTs from which it is calculated. 7
Figure 3.10-3.3 Ba plotted against Al concentrations (g g-1) for all sites in the Caspian Sea. 8
8
Figure 3.10-3.6 Cr as a function of Al concentrations (g g-1) in Azerbaijan, Iran, Kazakhstan and Russia.. 9
9
Figure 3.10-3.9 Co and Pb as a function of Al concentrations (g g-1) for all sites in the Caspian Sea. 10
Figure 3.8-1 a HCH in Sediments

Figure 3.8-2 Aldrin in Sediments
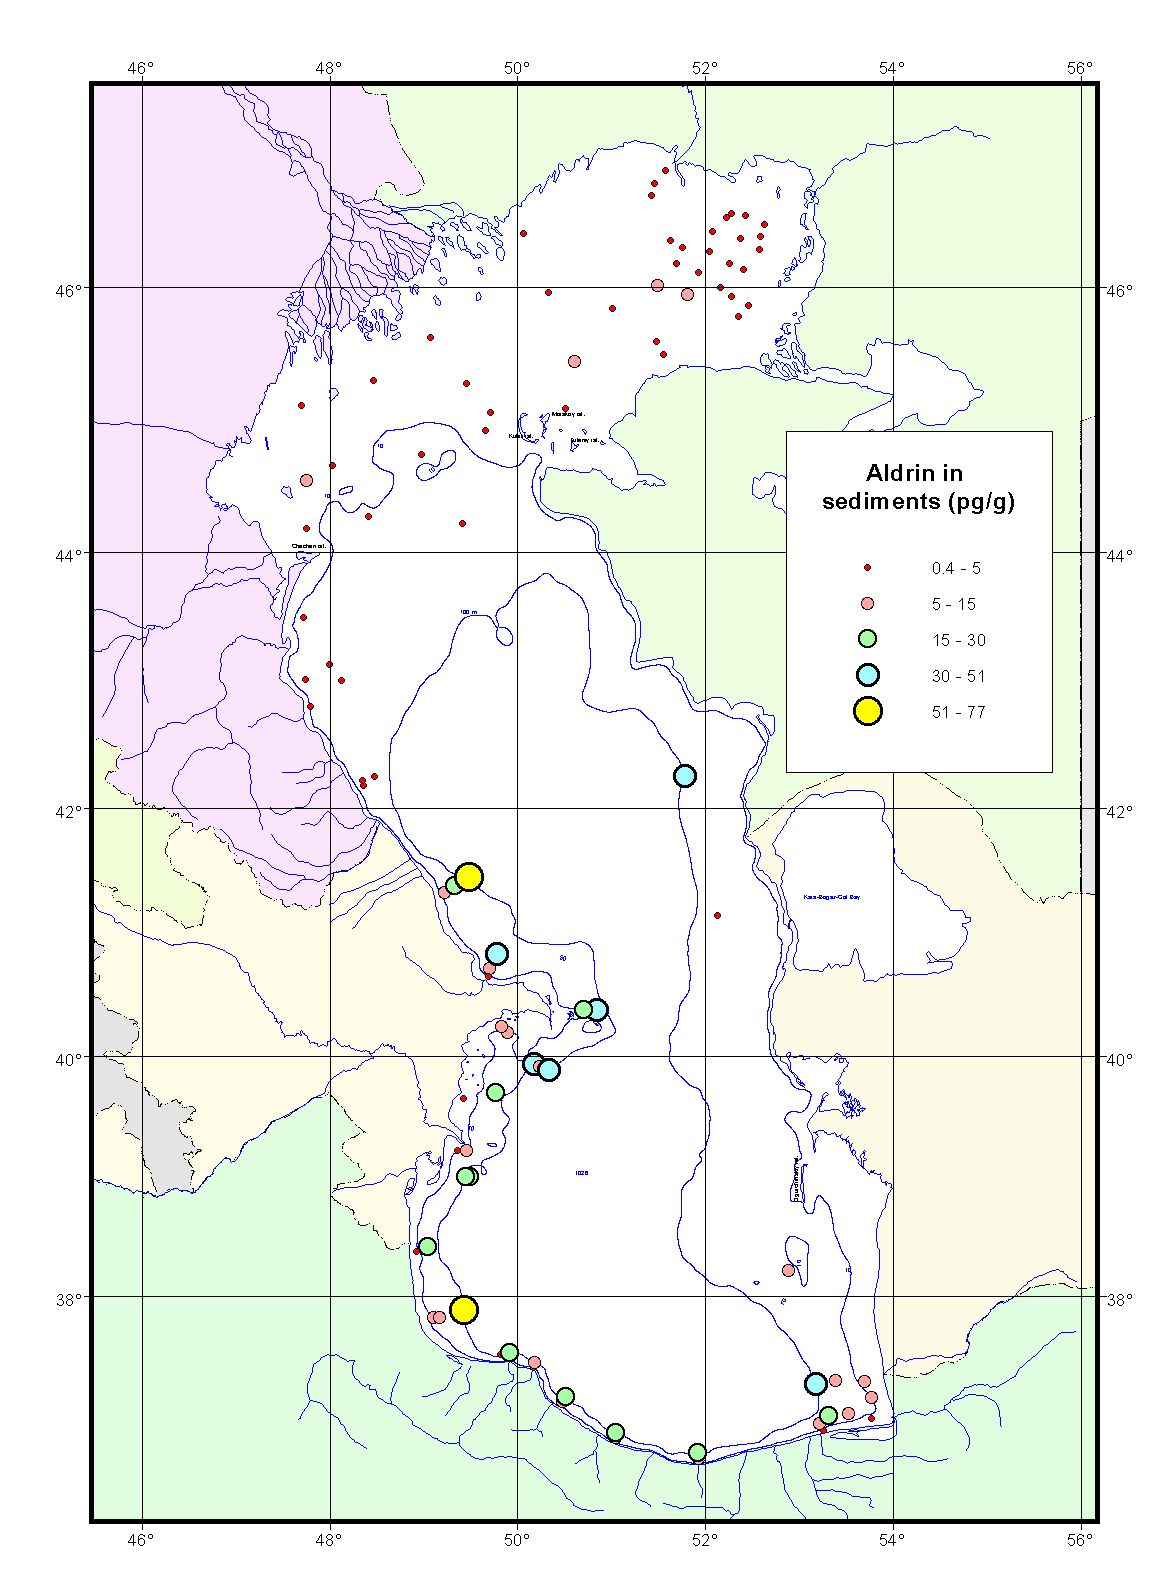
Figure 3.8-3 Alpha Endosulfan in Sediments
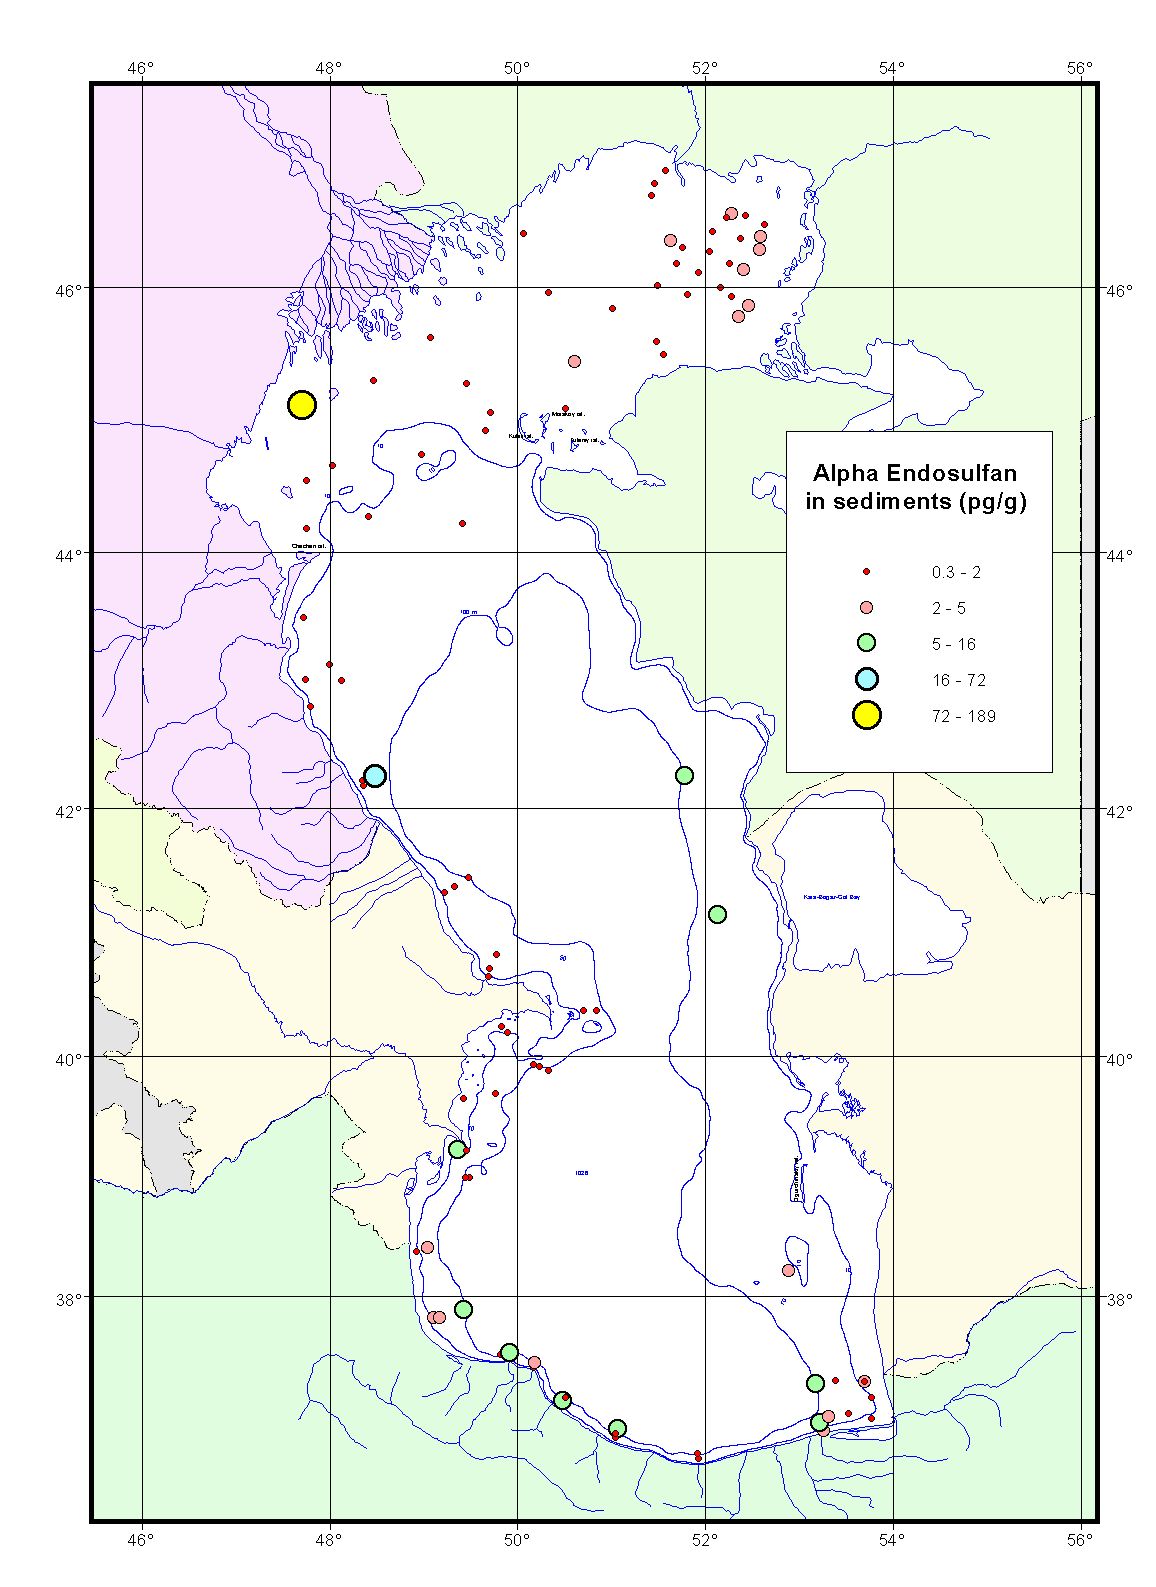
Figure 3.8-4 Aluminum in Sediments
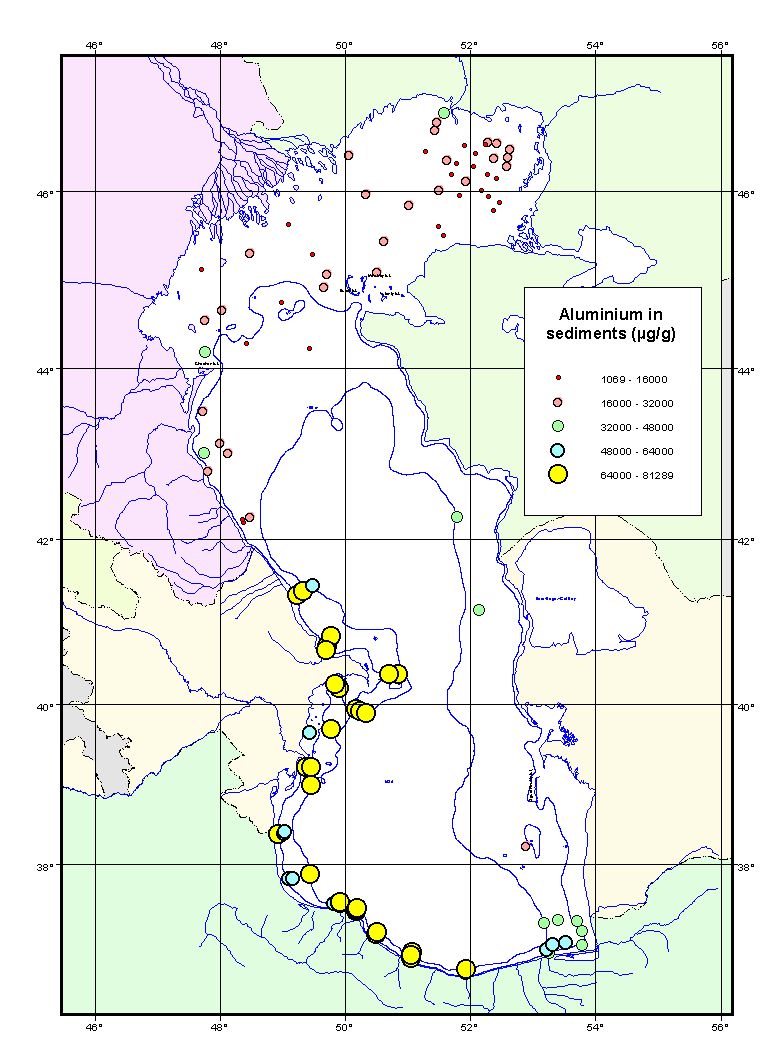
Figure 3.8-5 Aroclor 1254 in Sediments
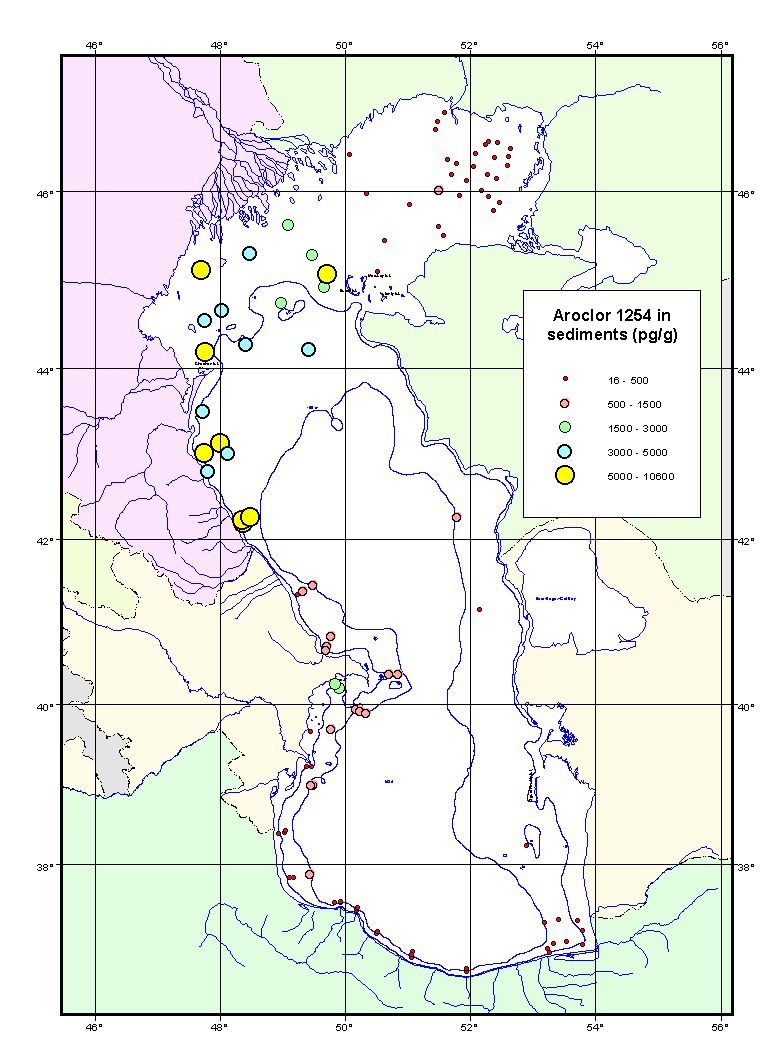
Figure 3.8-6 Arsenic in Sediment
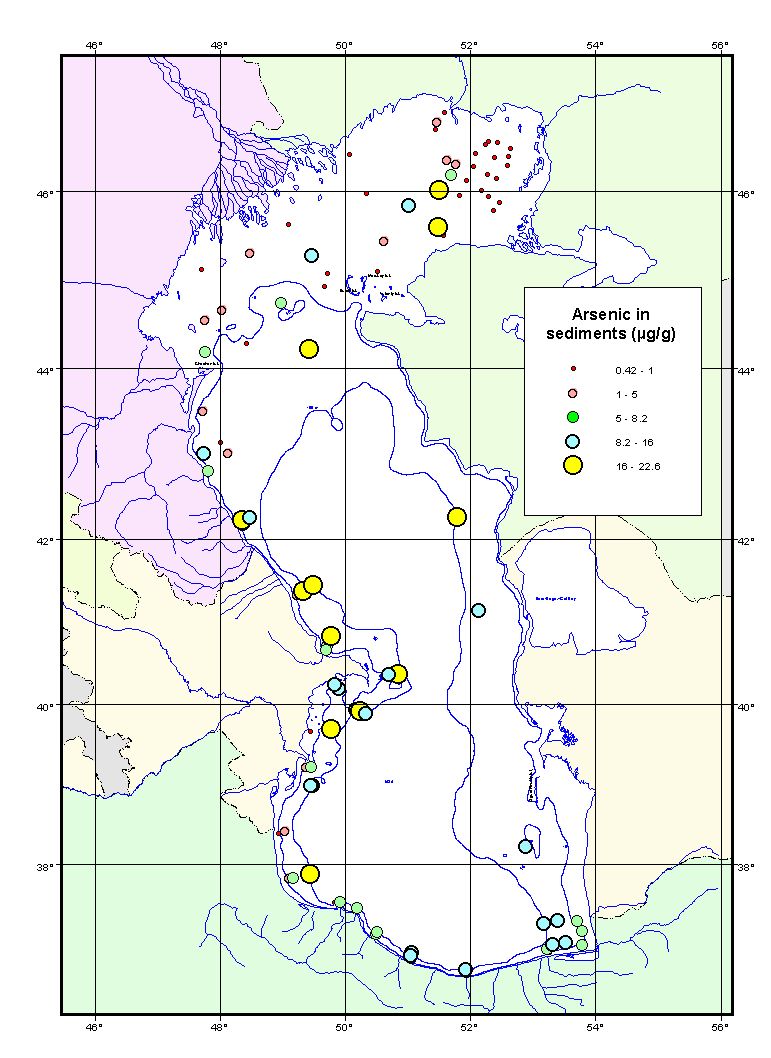
Figure 3.8-7 b HCH in Sediment
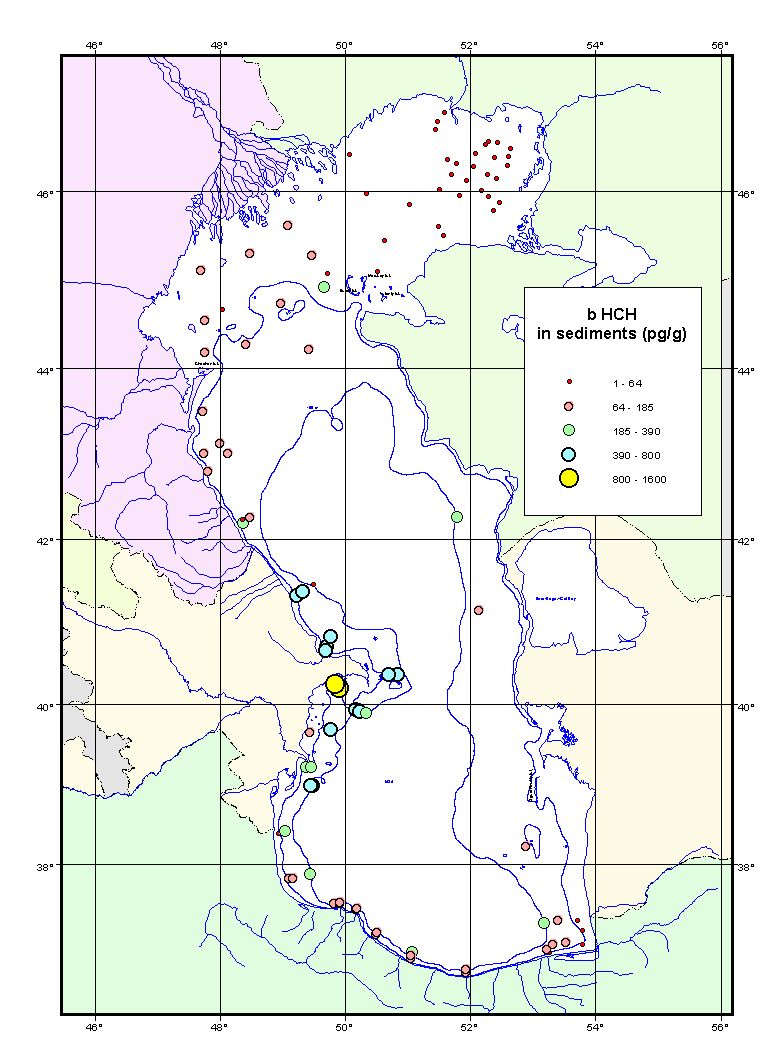
Figure 3.8-8 Barium in Sediment
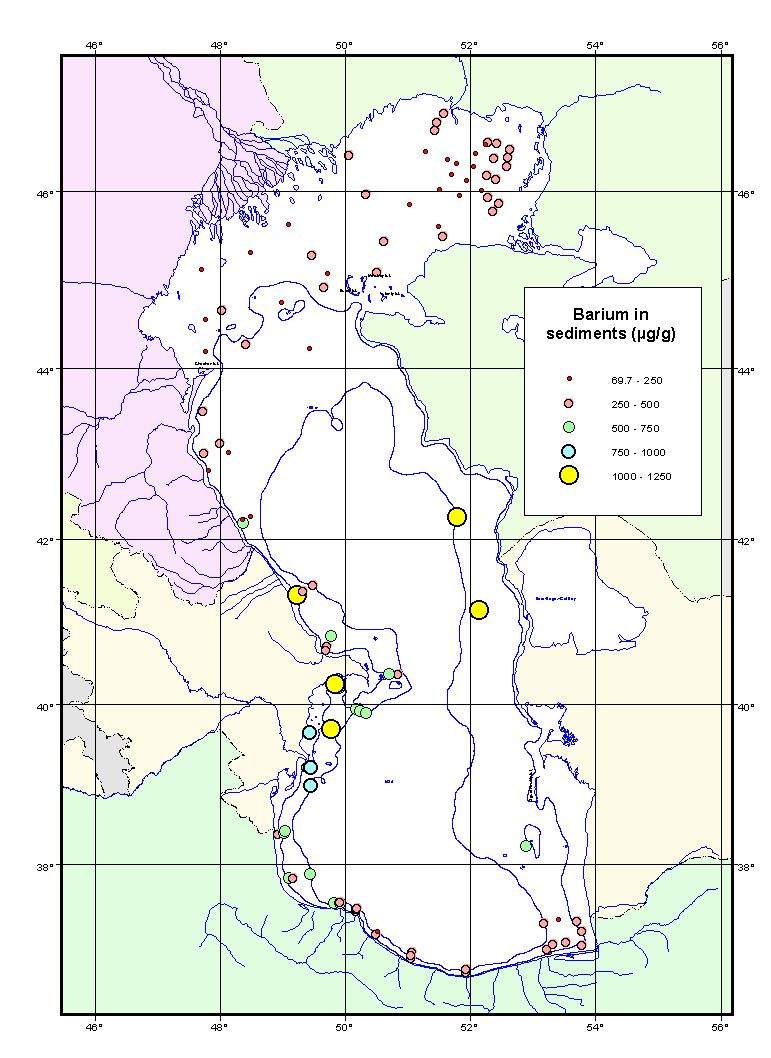
Figure 3.8-9 Beta Endosulfan in Sediment

Figure 3.8-10 Cadmium in Sediment

Figure 3.8-11 Carbonate in Sediment
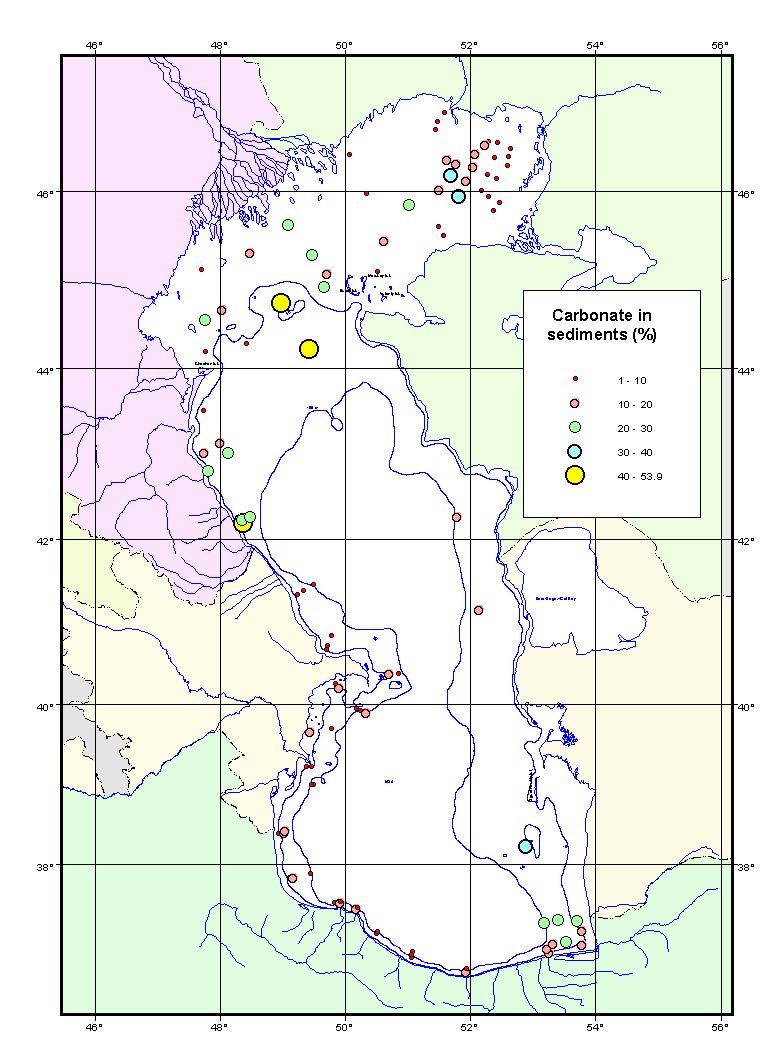
Figure 3.8-12 Chromium in Sediment
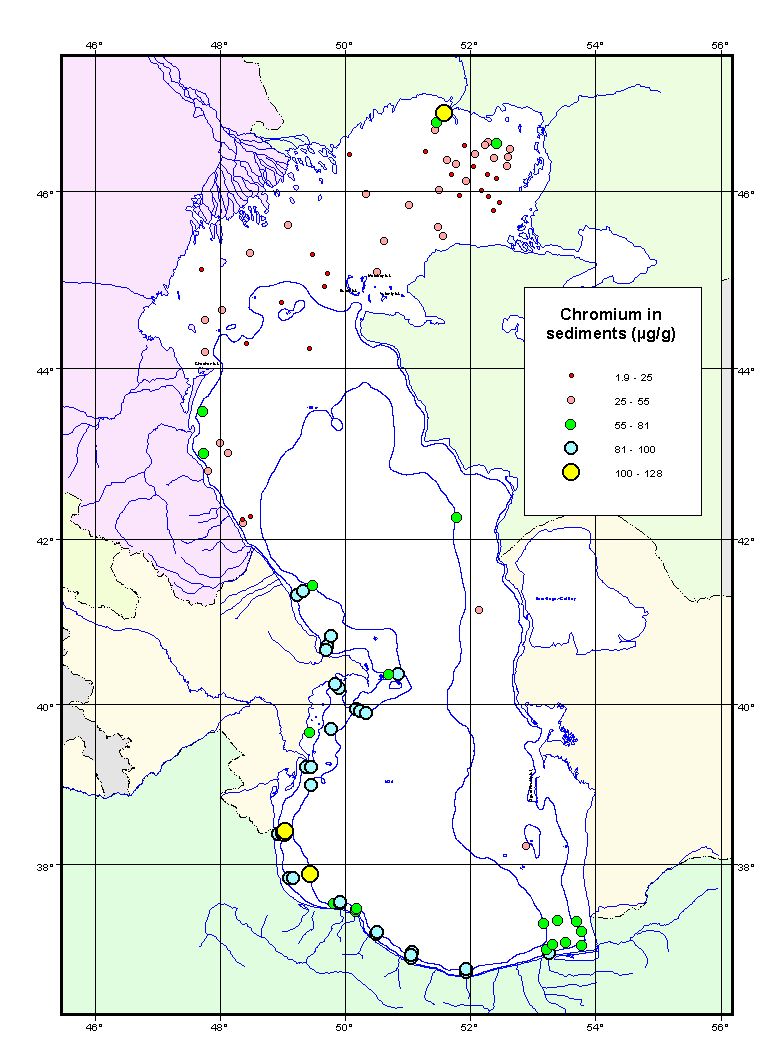
Figure 3.8-13 CIS Chlordane in Sediment

Figure 3.8-14 Copper in Sediment
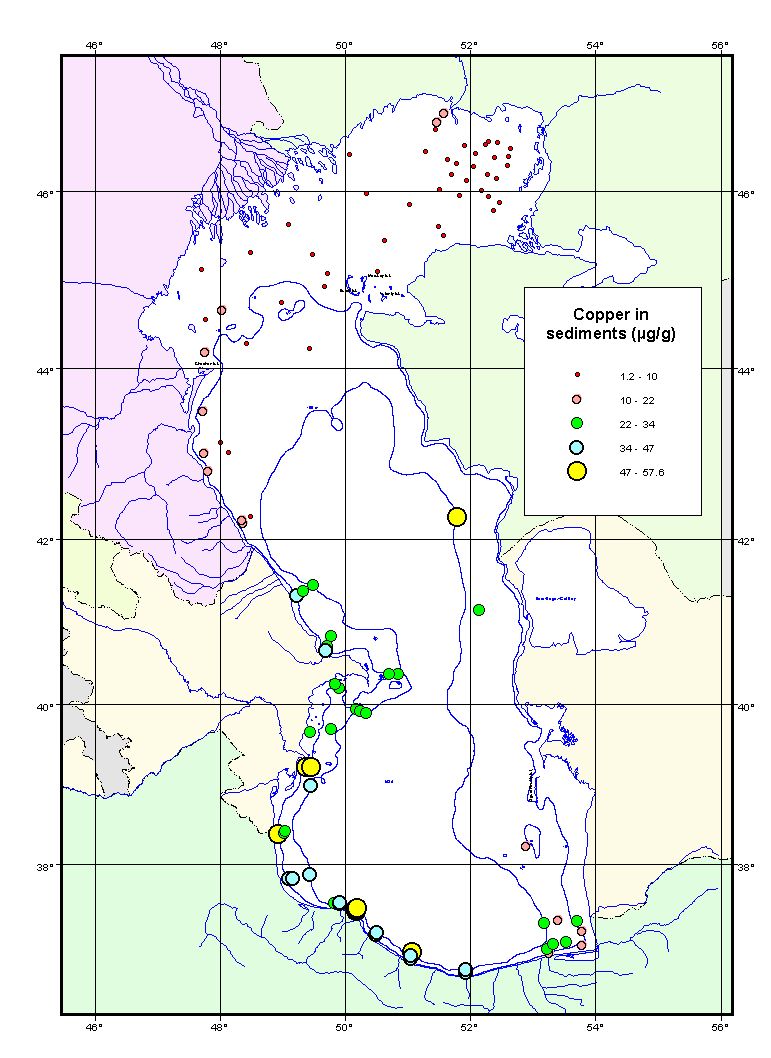
Figure 3.8-15 d HCH in Sediment
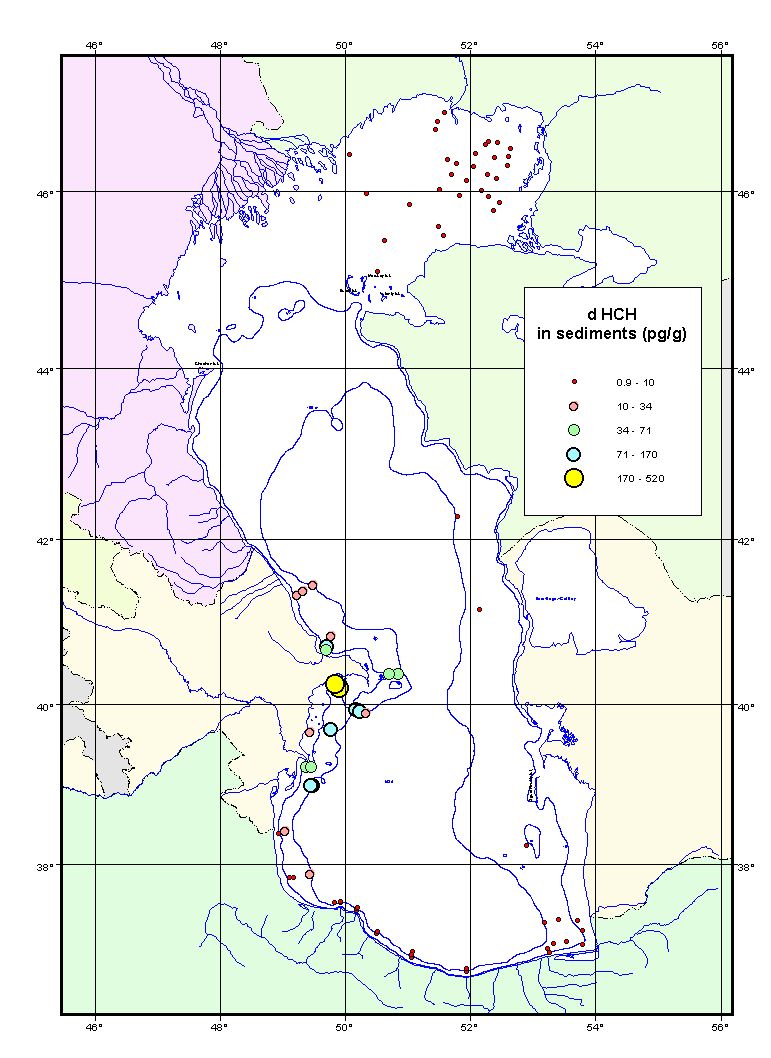
Figure 3.8-16 Dieldrin in Sediment
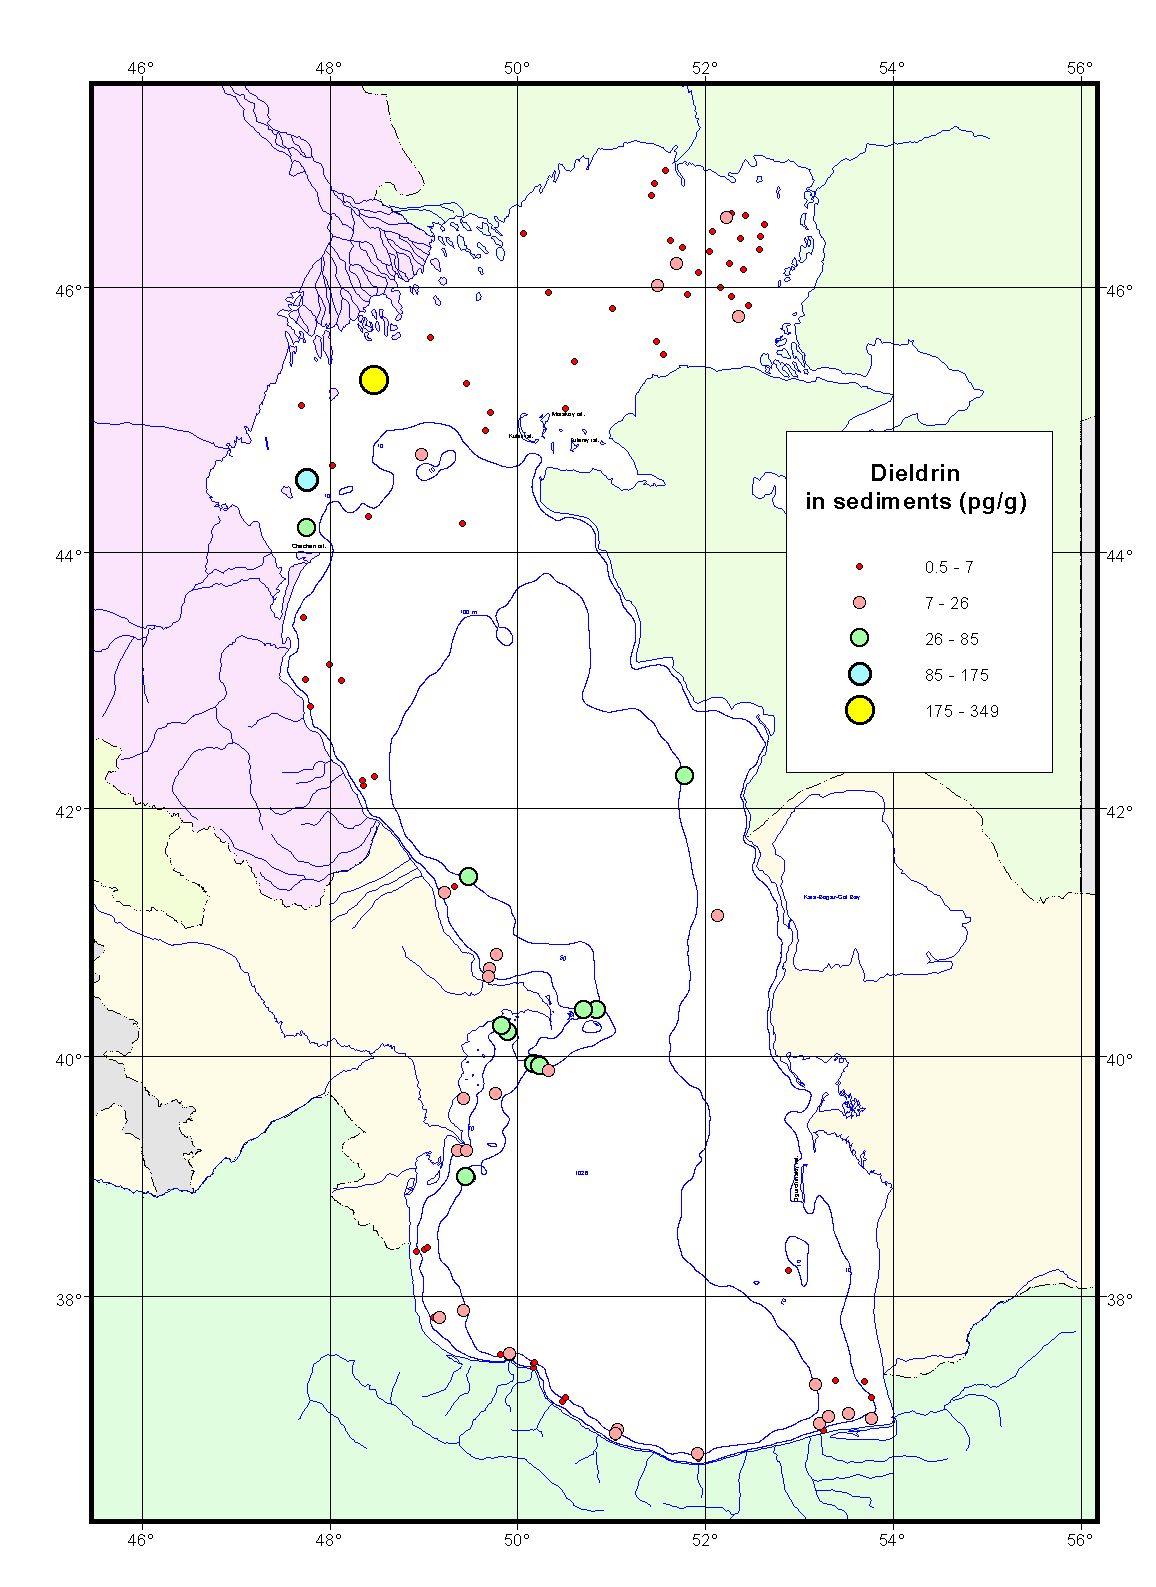
Figure 3.8-17 Endosulfan Sulfate in Sediment

Figure 3.8-18 Endrin in Sediment
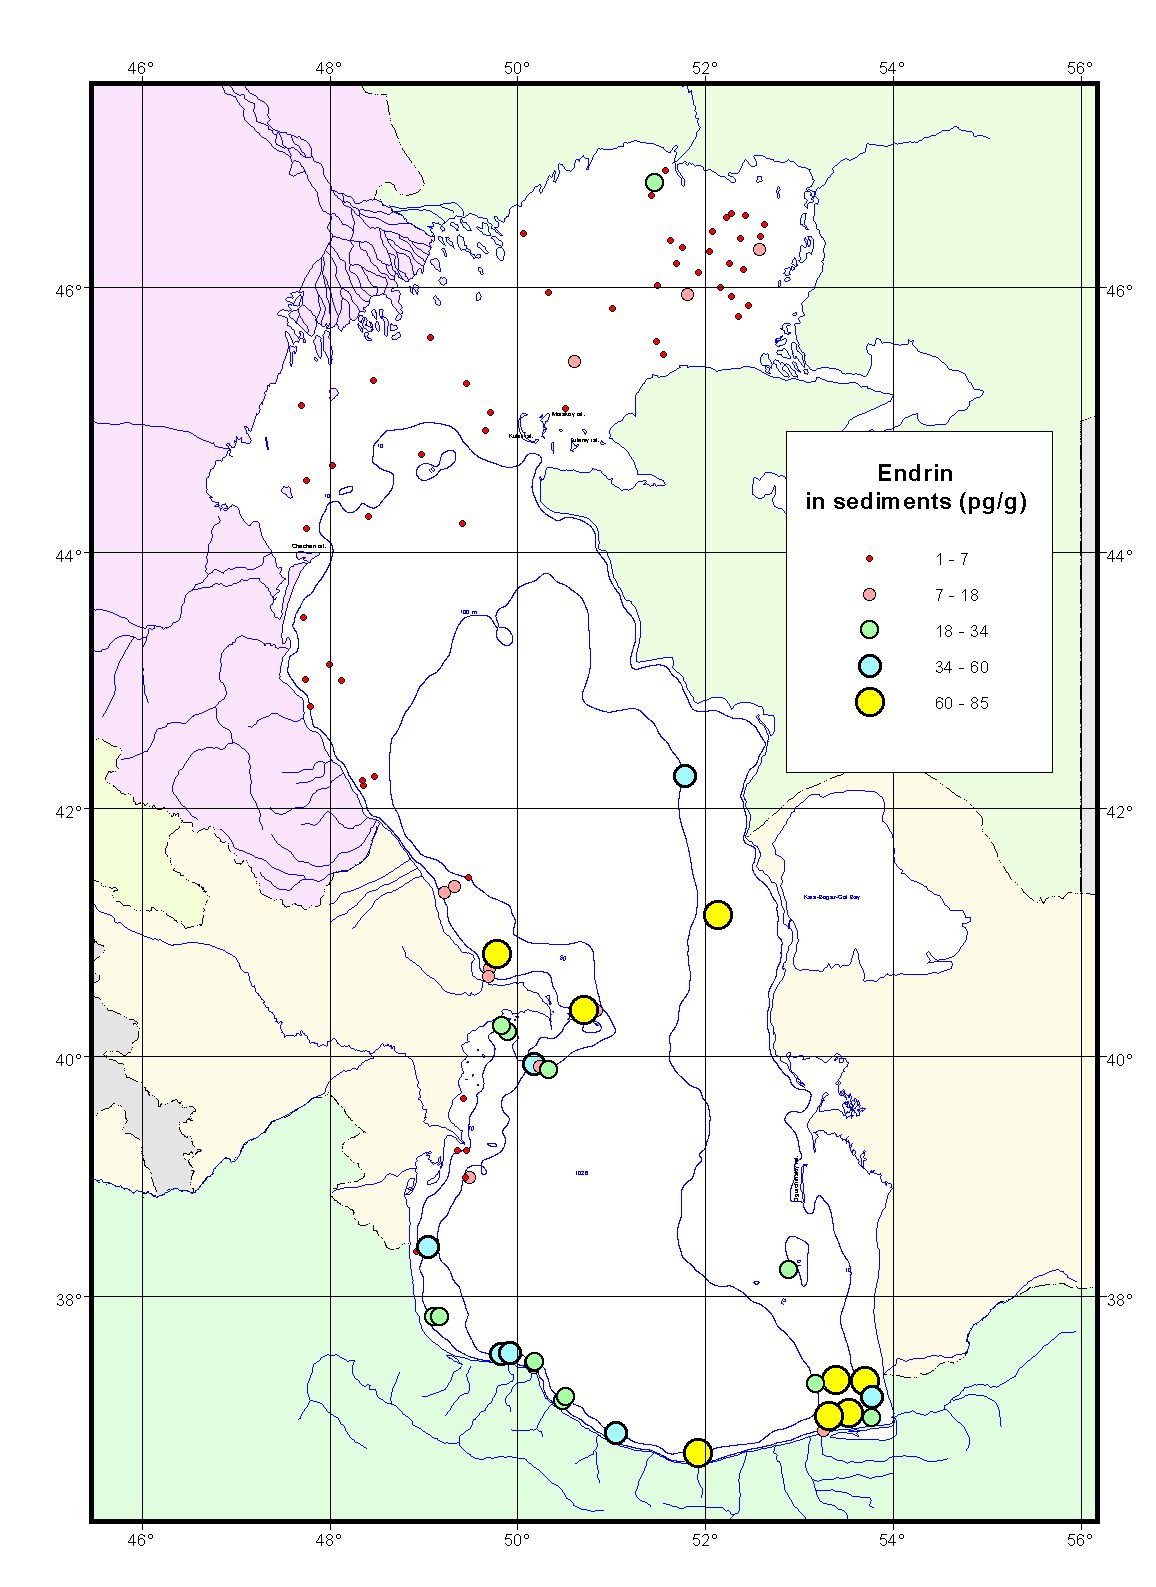
Figure 3.8-19 Fines 62-10 in Sediment
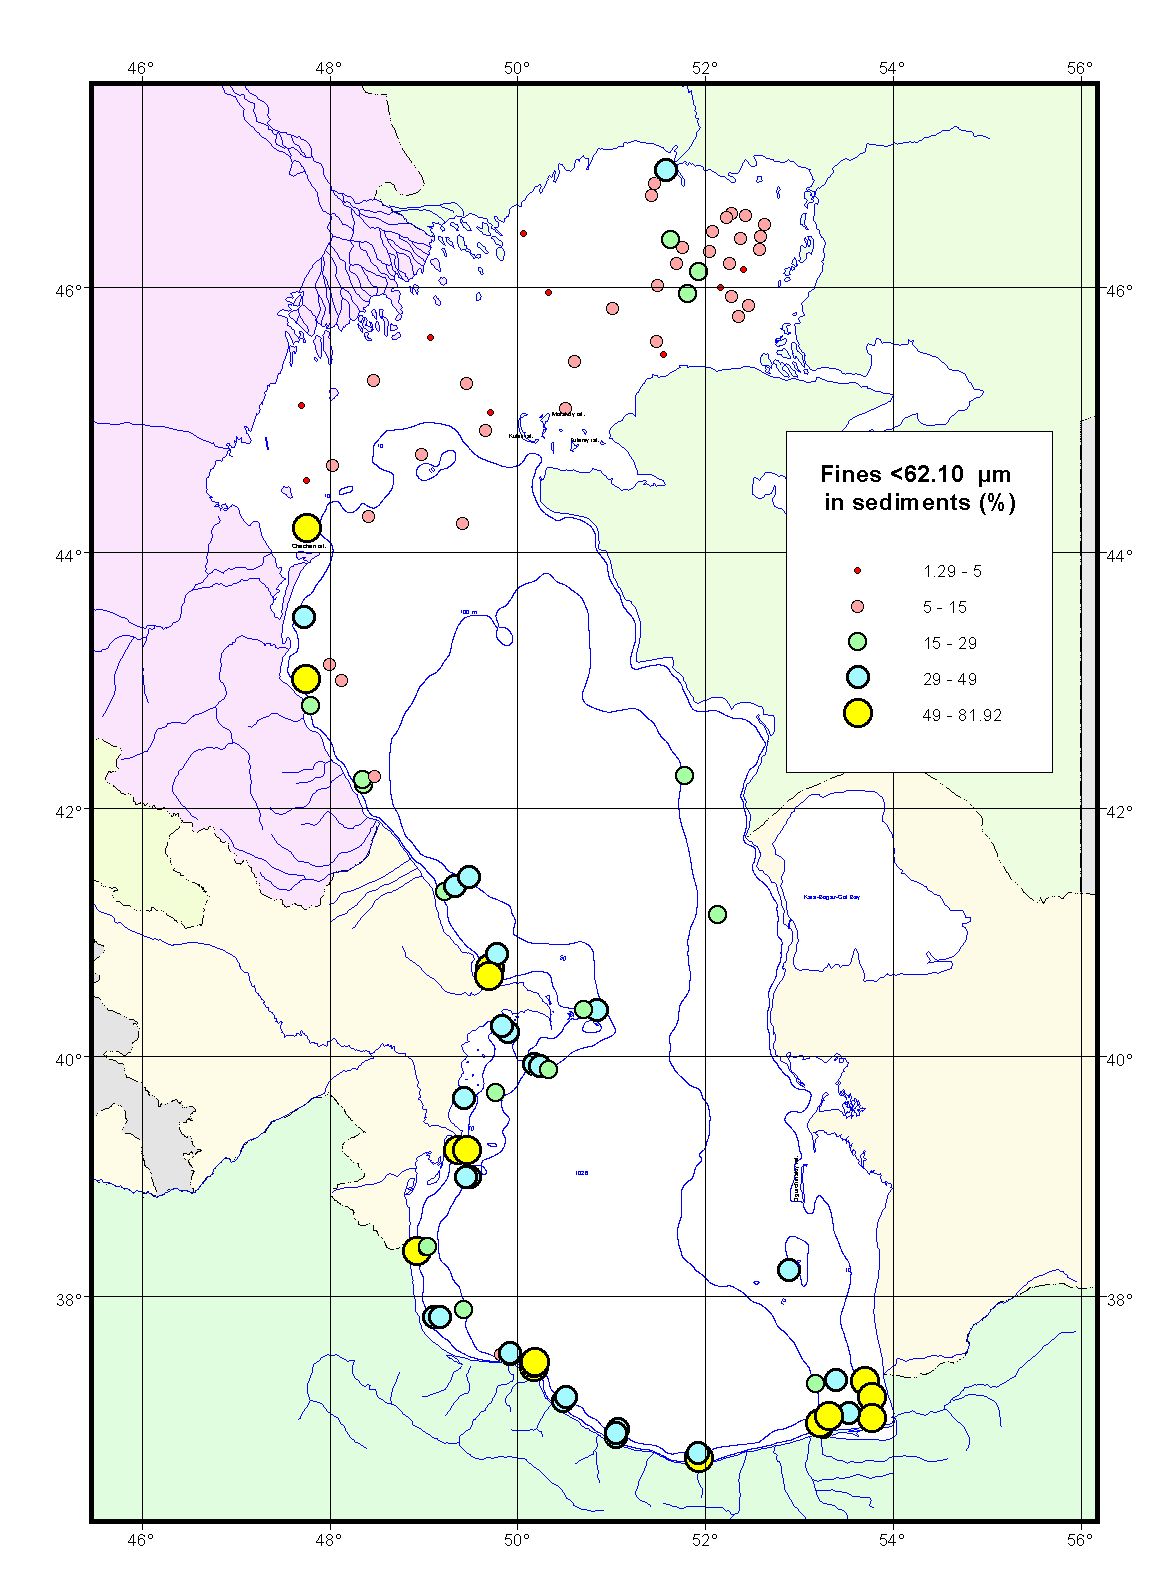
Figure 3.8-20 HCB in Sediment

Figure 3.8-21 Heptachlor Epoxide in Sediment
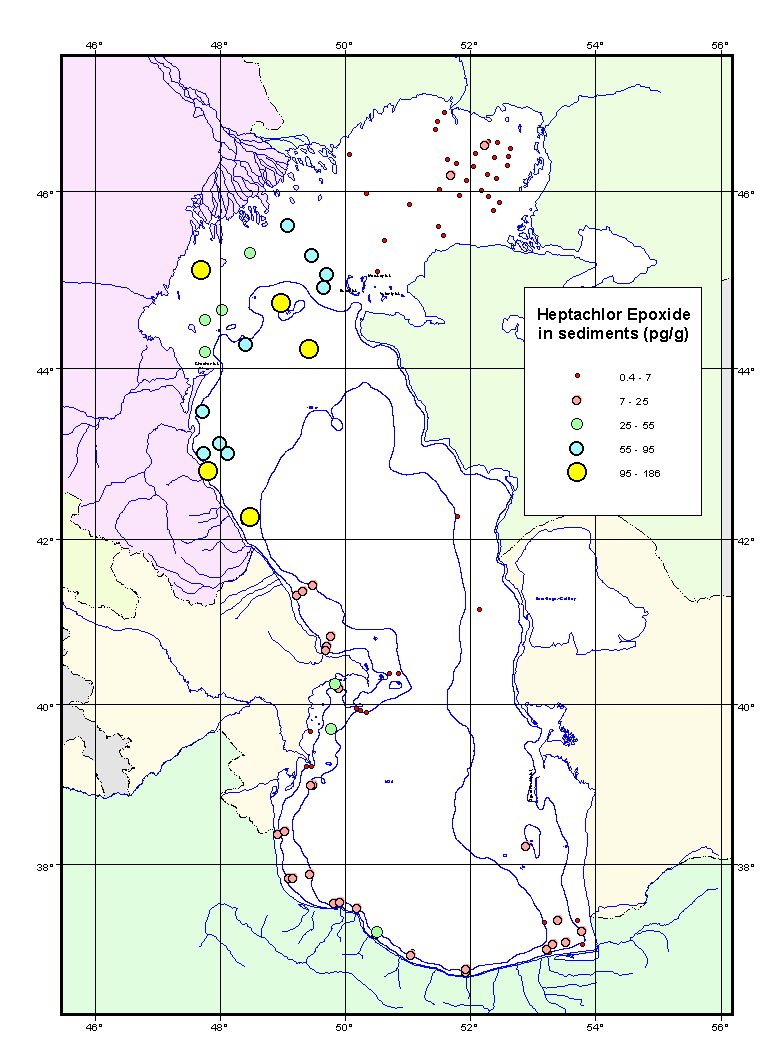
Figure 3.8-22 Heptachlor in Sediment
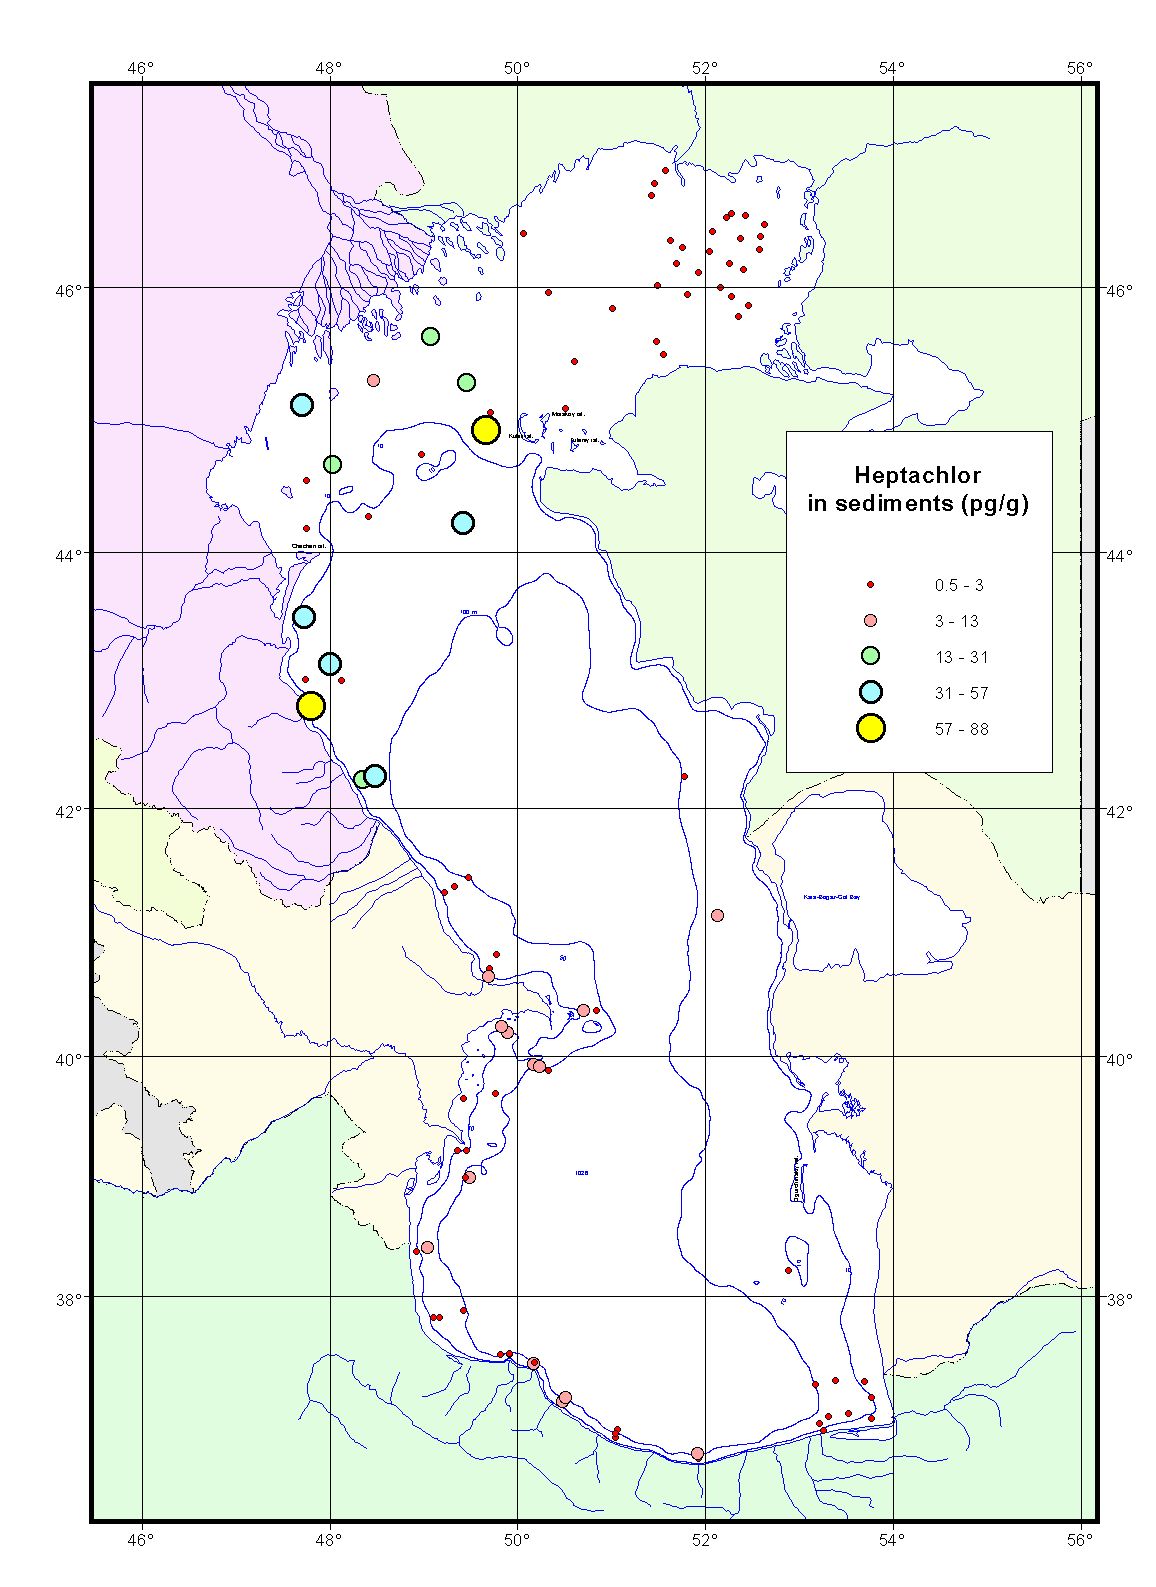
Figure 3.8-23 Lindane in Sediment
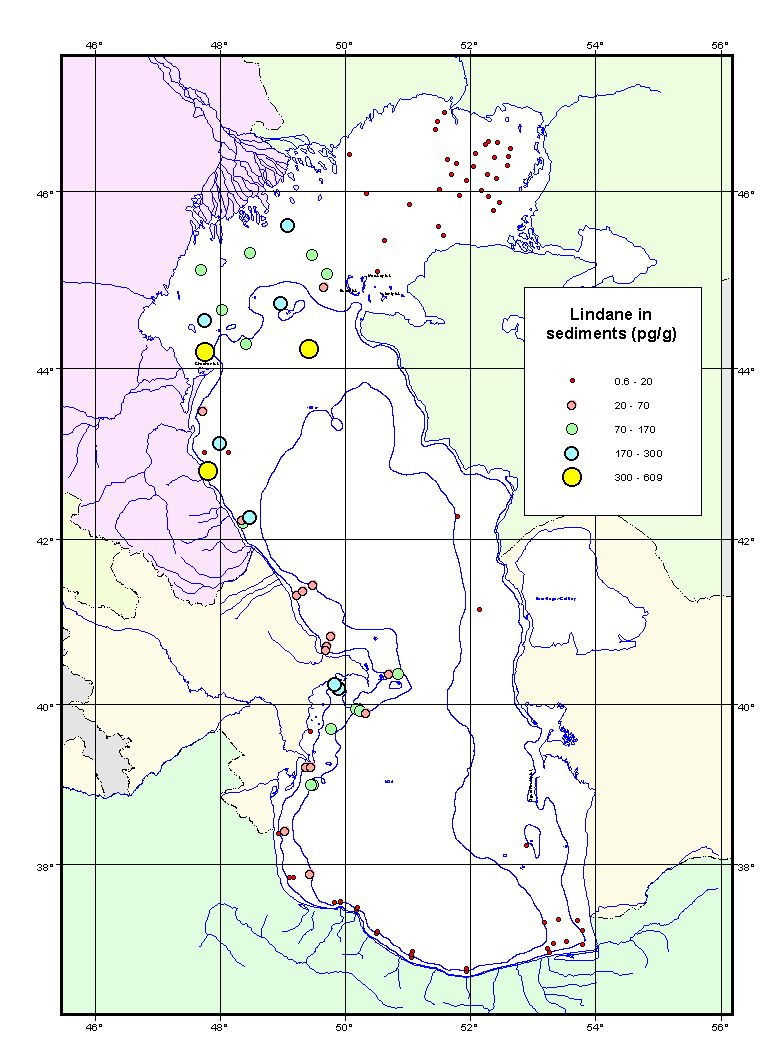
Figure 3.8-24 Mercury in Sediment
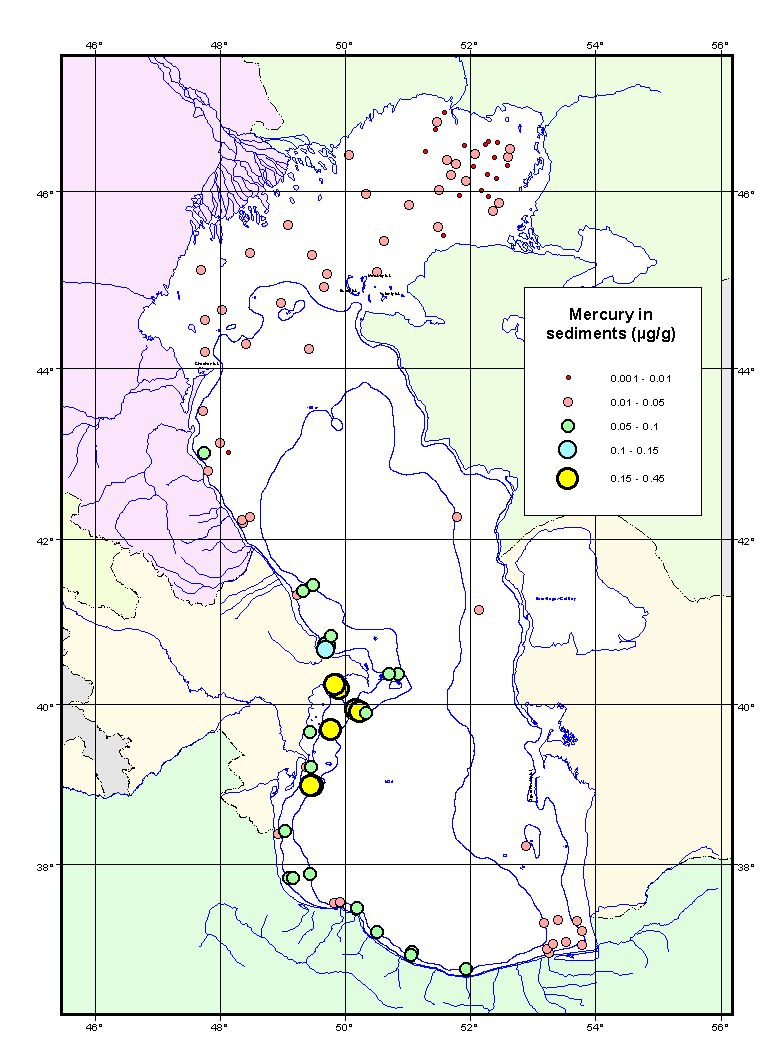
Figure 3.8-25 Methoxychlor in Sediment
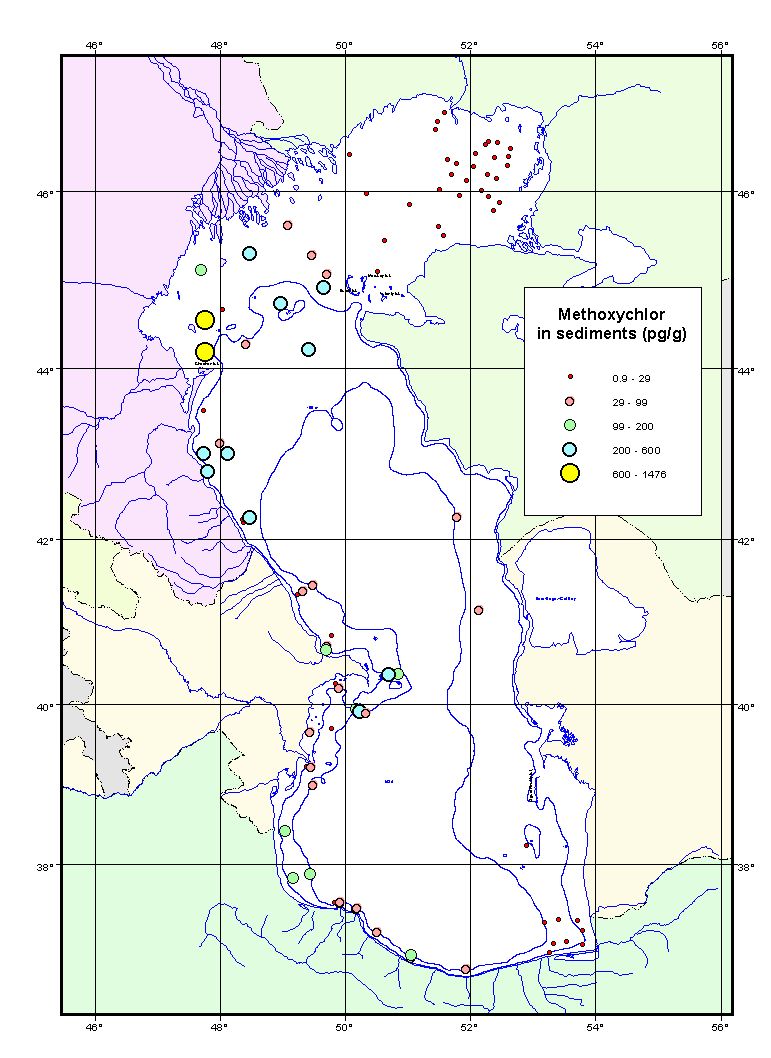
Figure 3.8-26 Nickel in Sediment
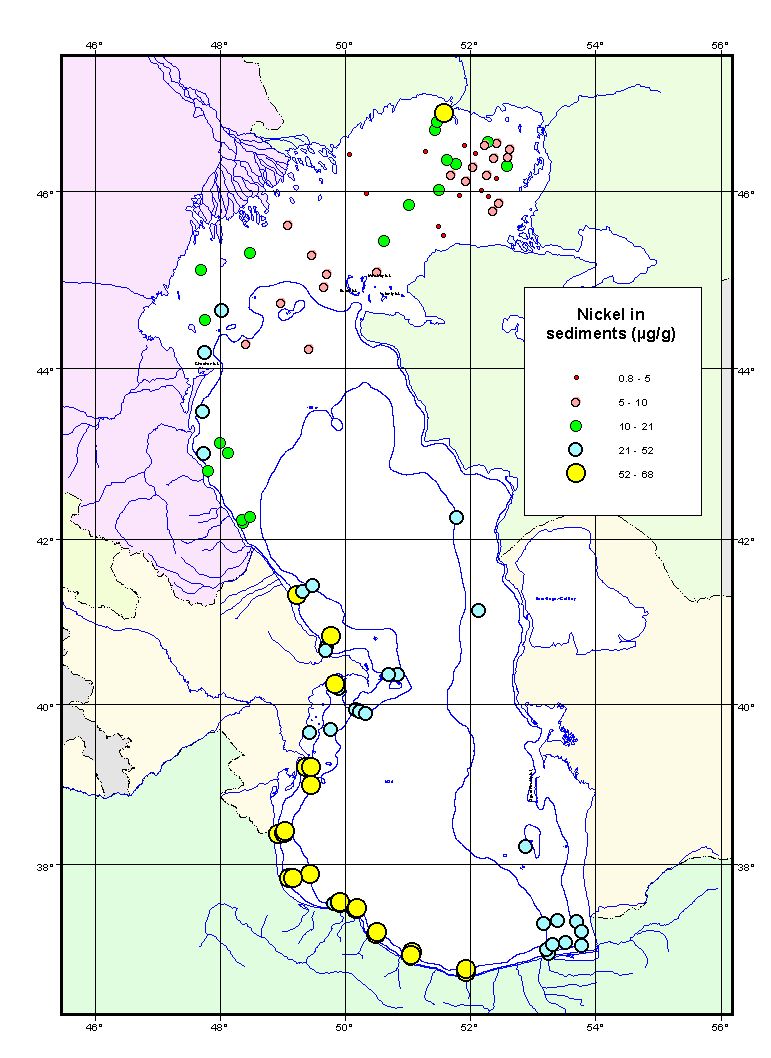
Figure 3.8-27 Silver in Sediment
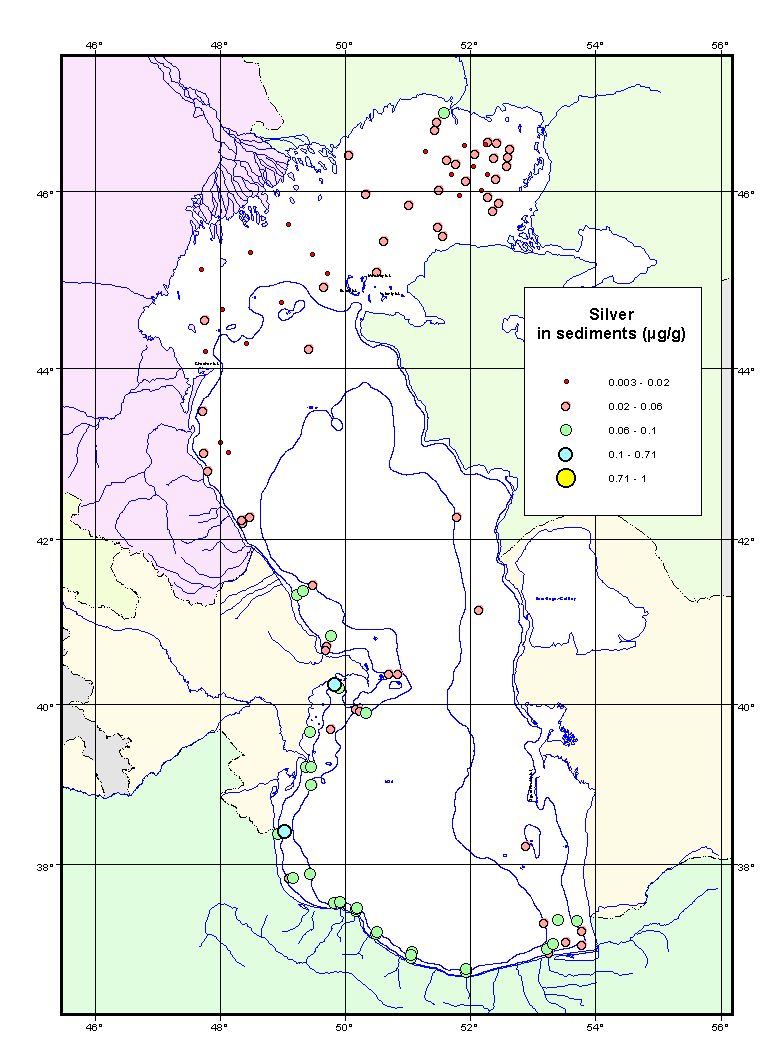
Figure 3.8-28 Total DDT in Sediment
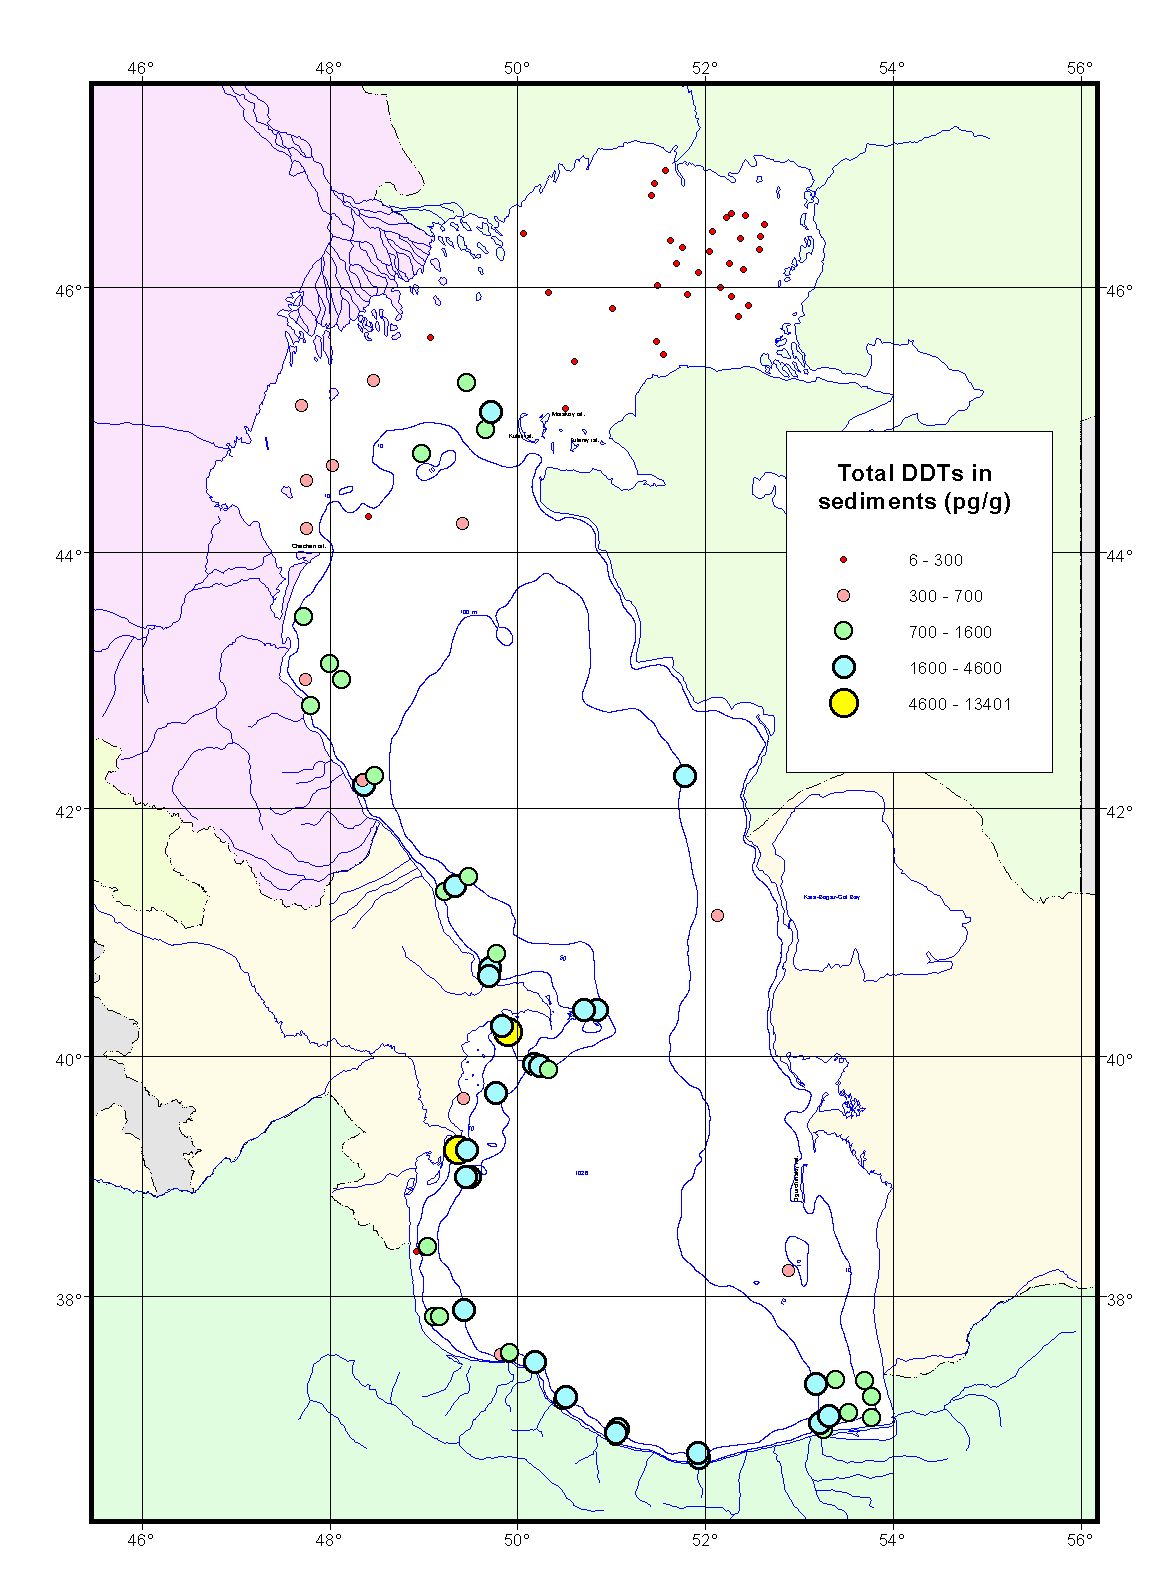
Figure 3.8-29 Total HCH in Sediment
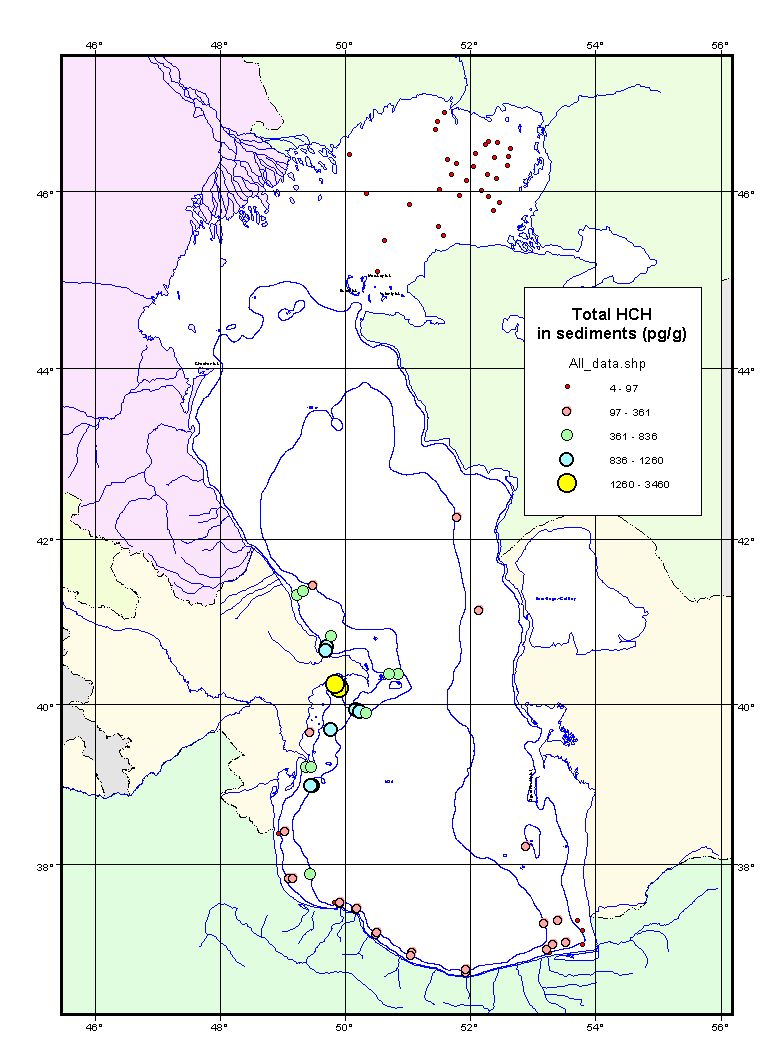
Figure 3.8-30 Total Hydrocarbons in Sediment
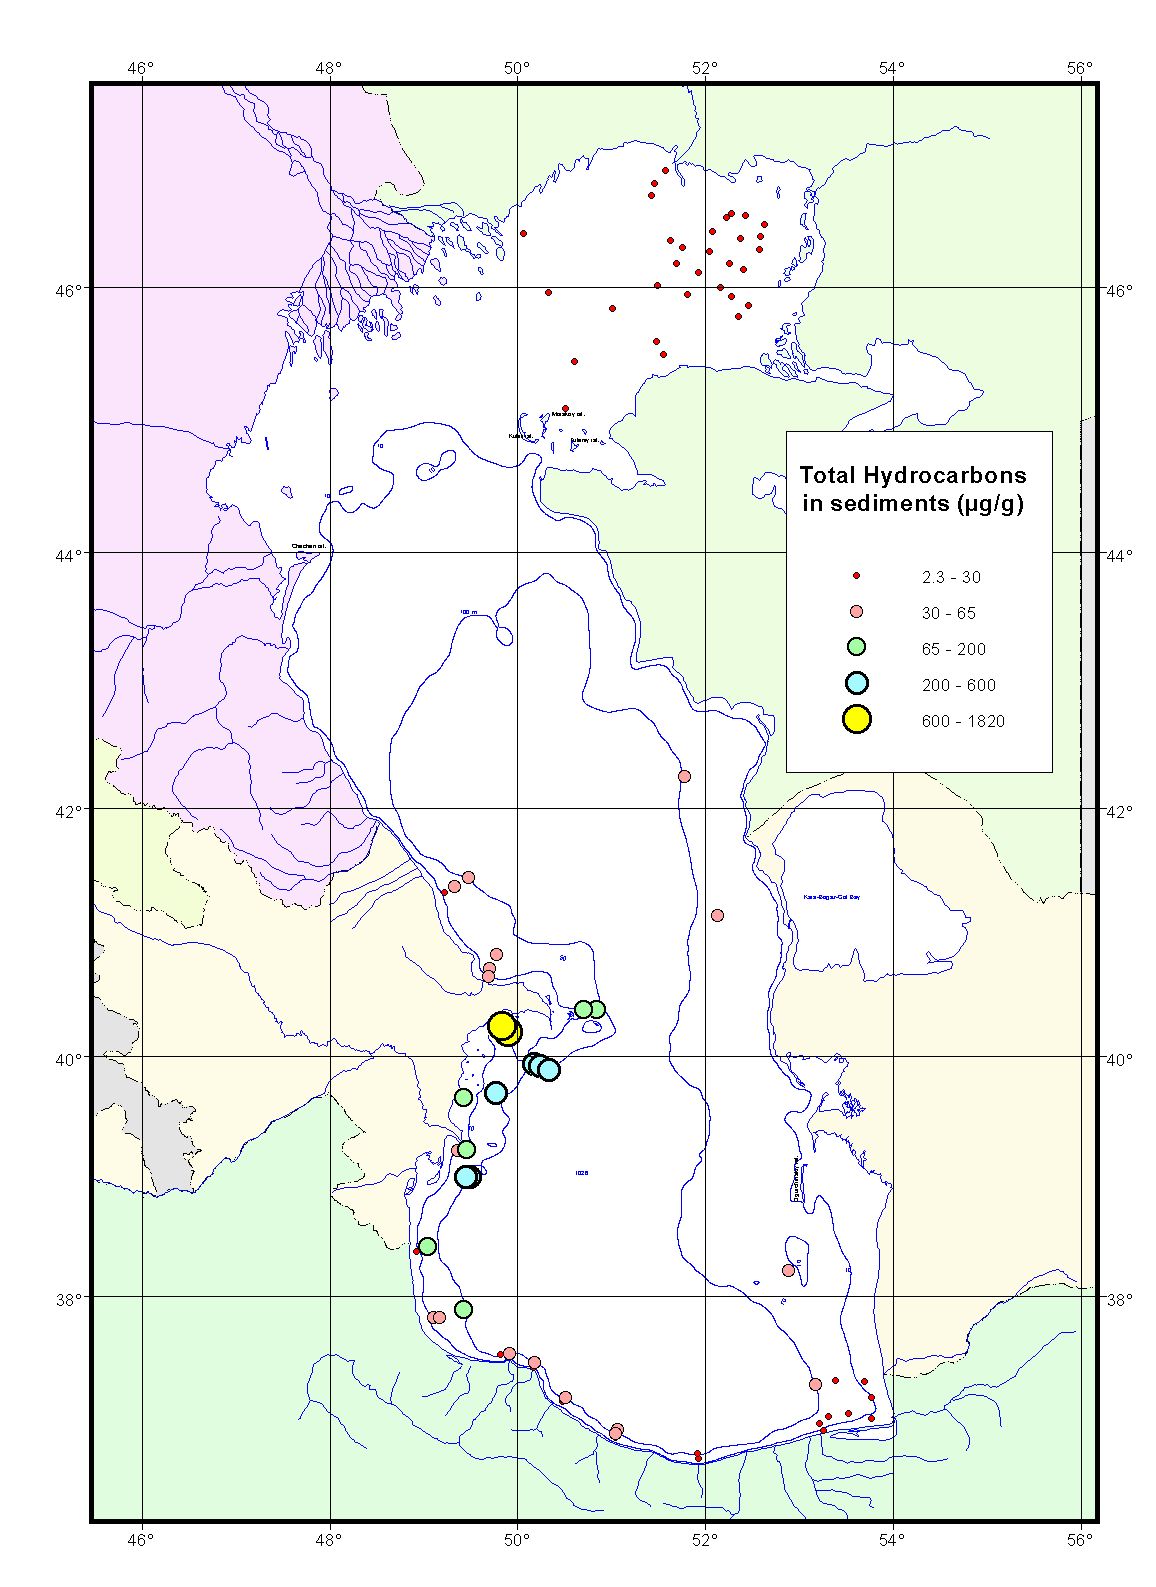
Figure 3.8-31 Total Organic Carbon in Sediment
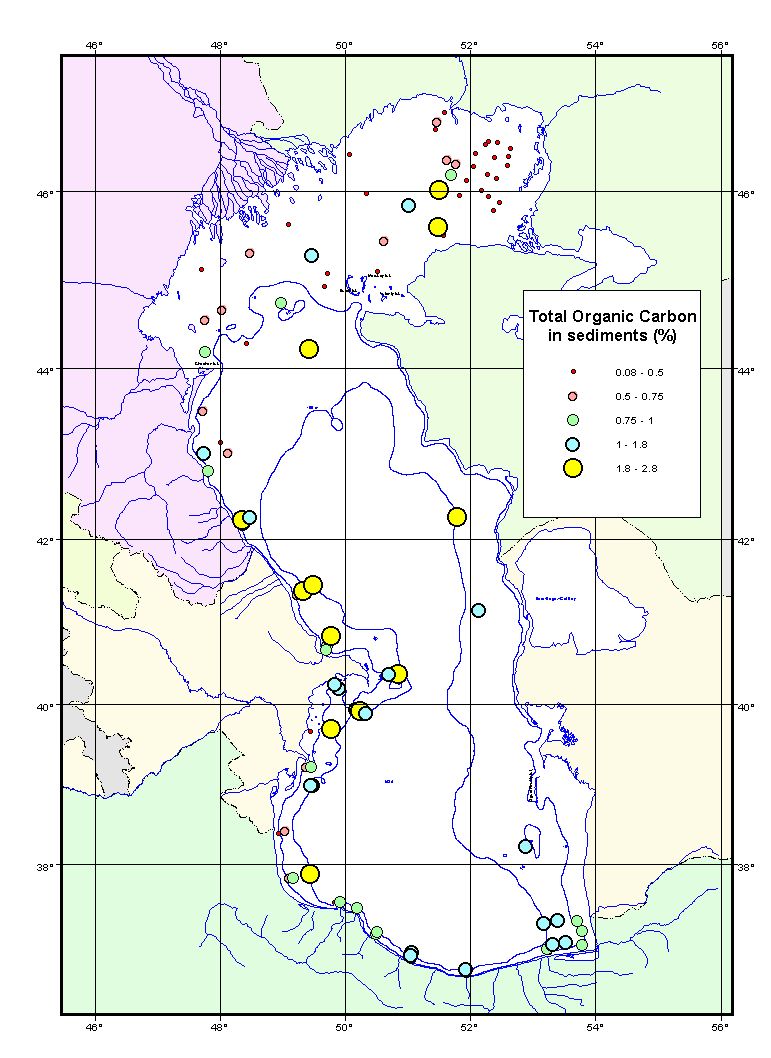
Figure 3.8-32 Total PAHs in Sediment

Figure 3.8-33 Total PCBs in Sediment
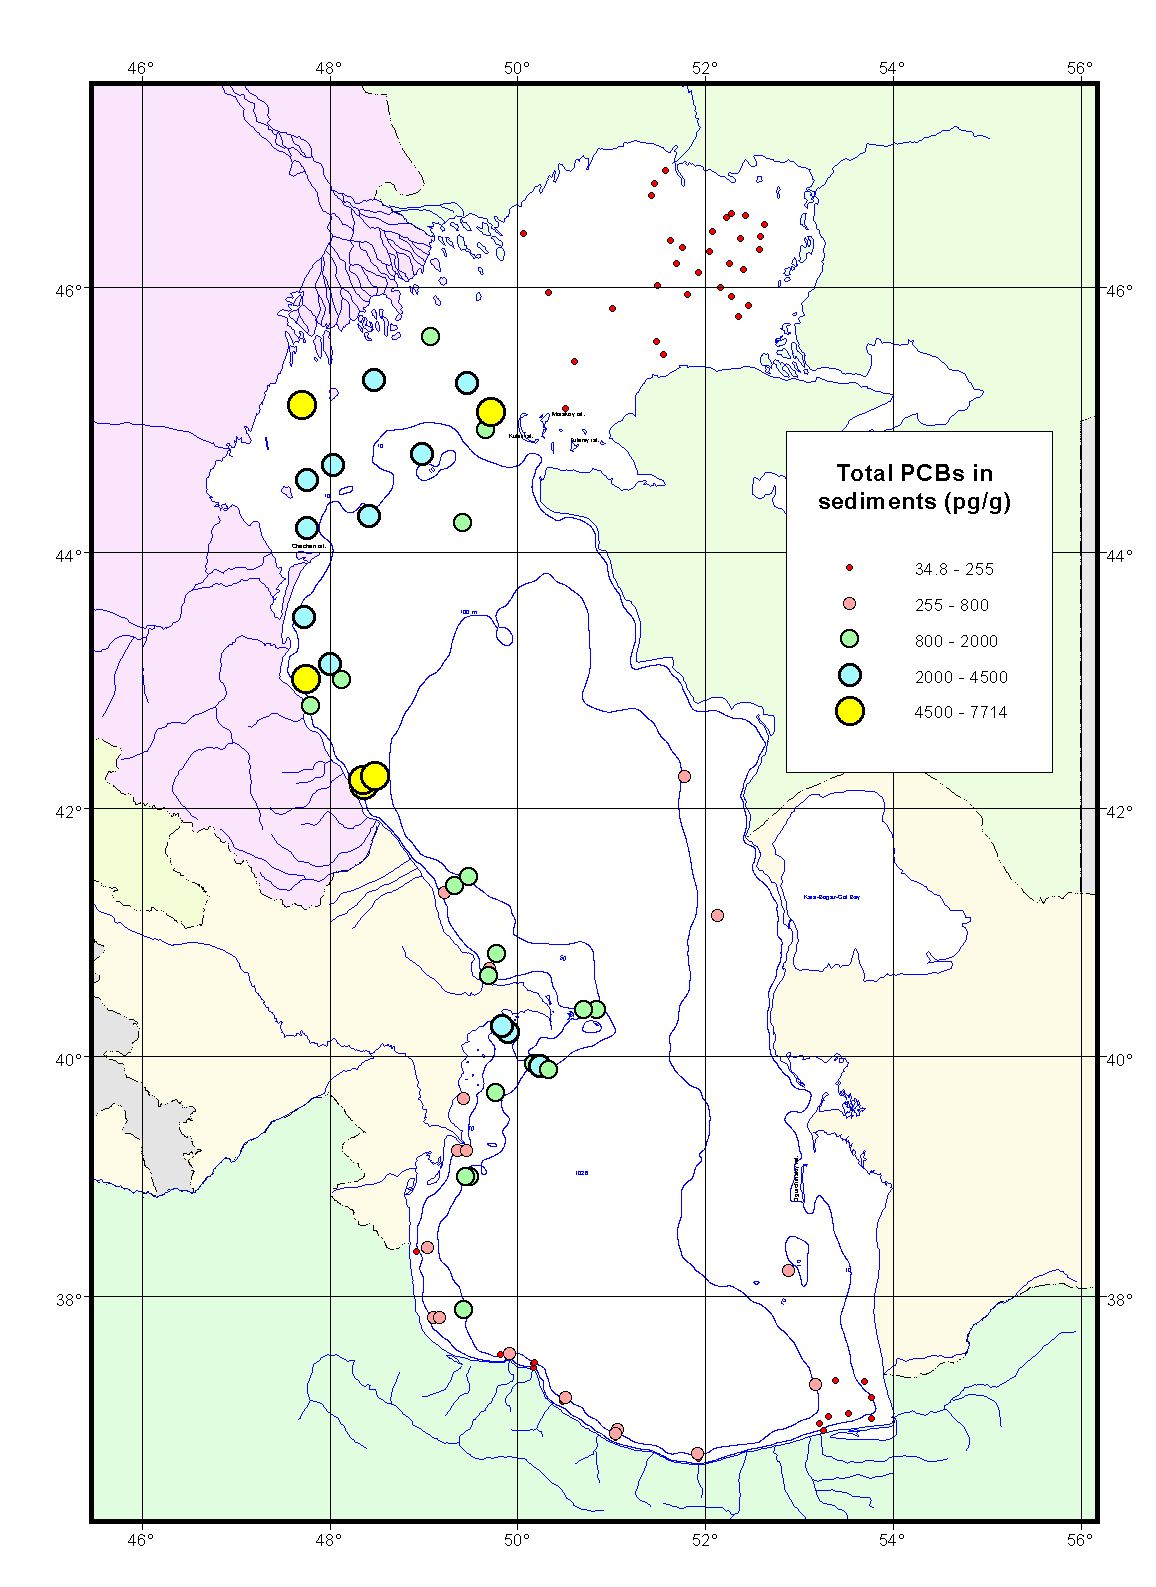
Figure 3.8-34 Trans Chlordane in Sediment
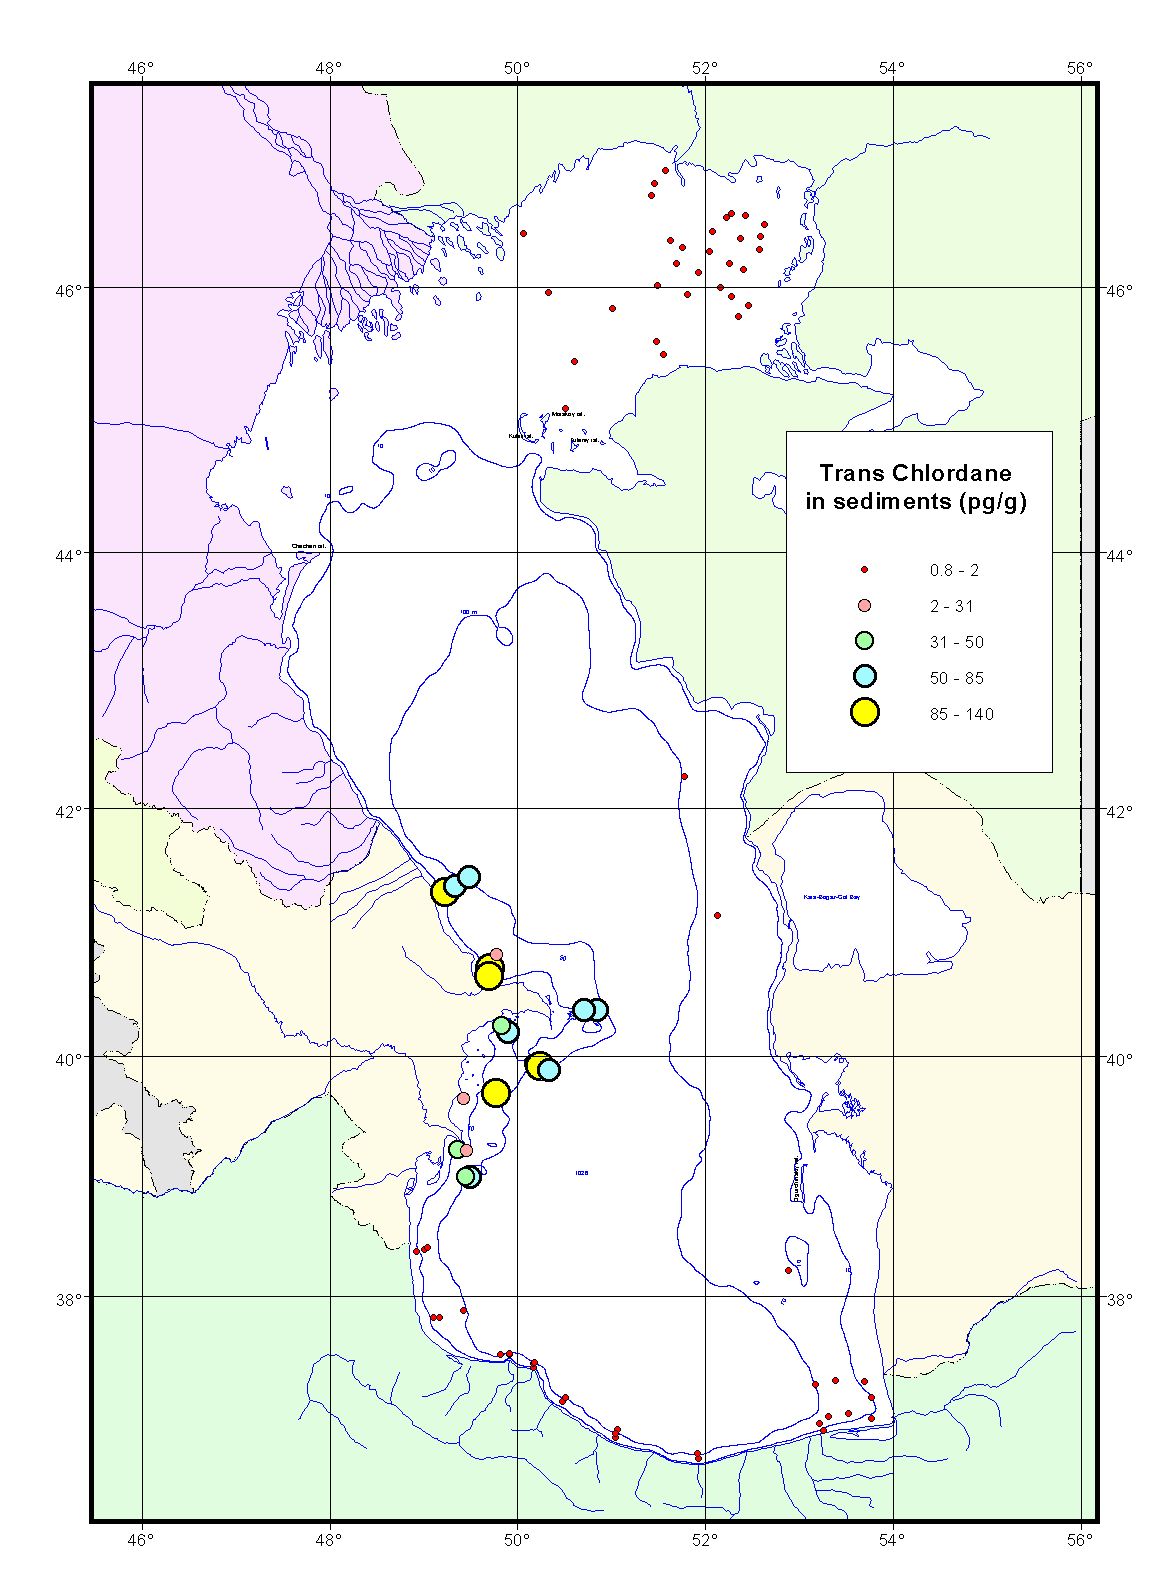
Figure 3.8-35 Unresolved Aliphatics in Sediment
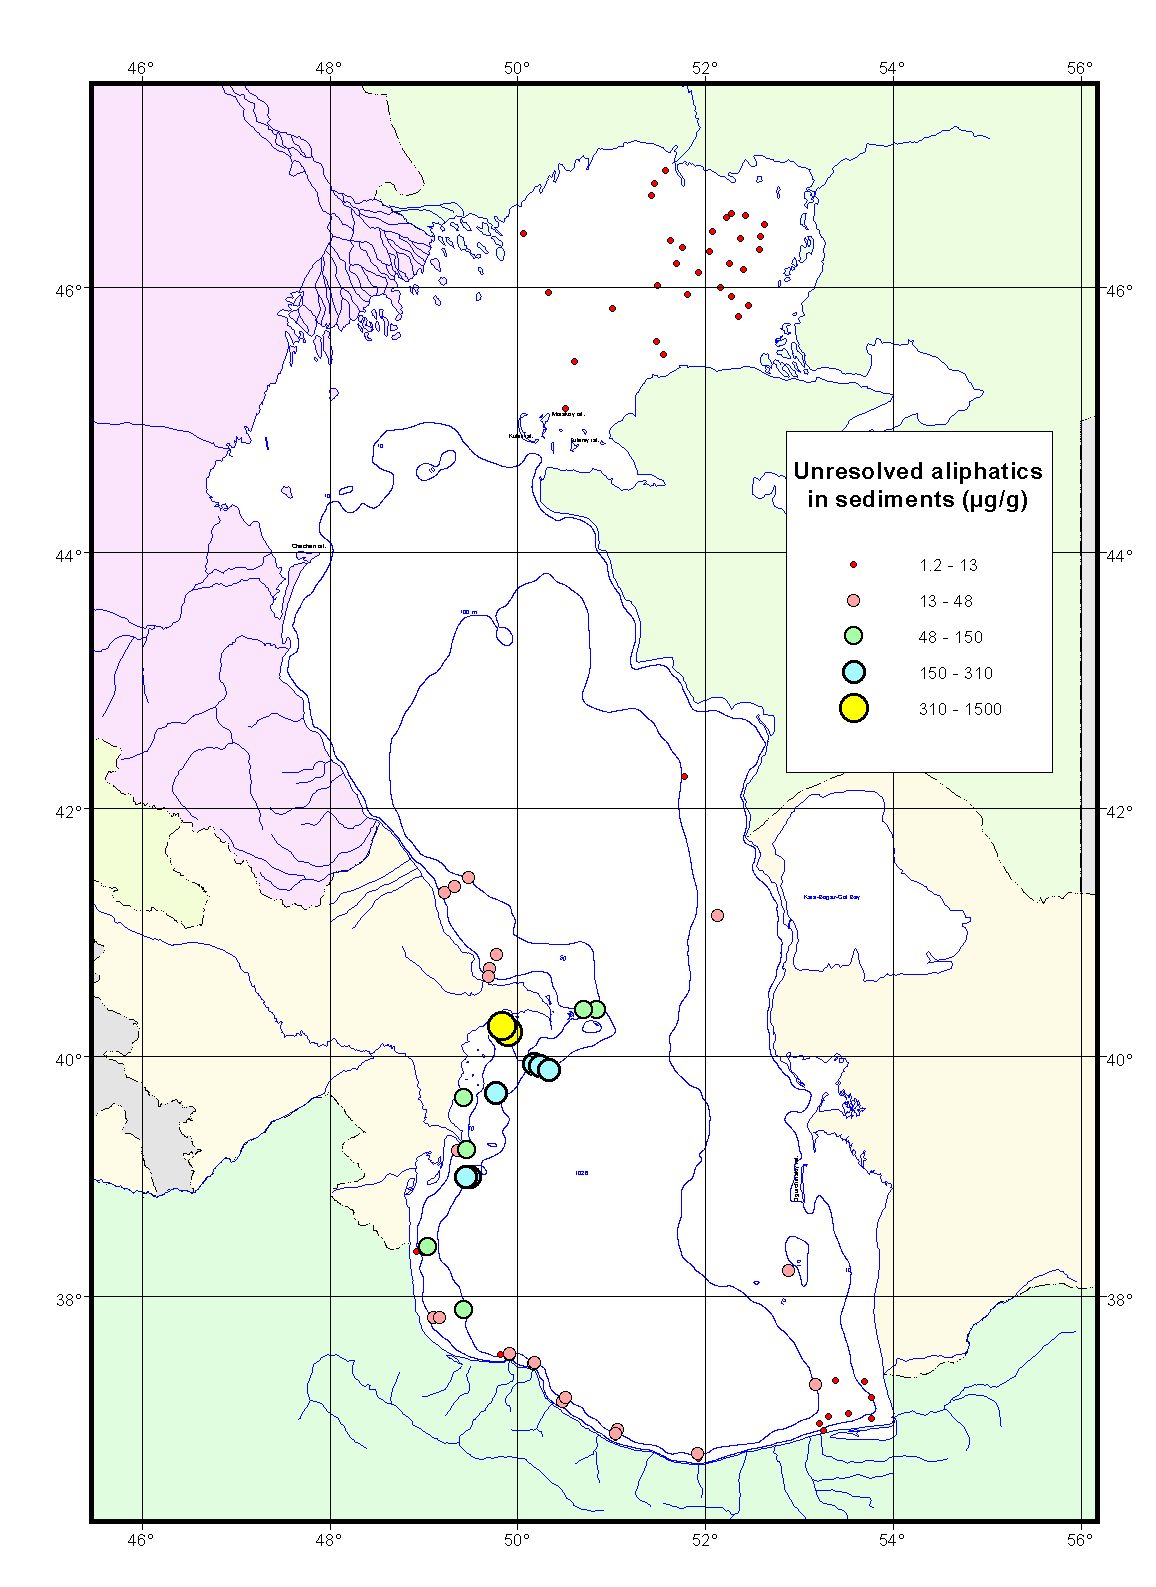
Figure 3.8-36 Unresolved Aromatics in Sediment
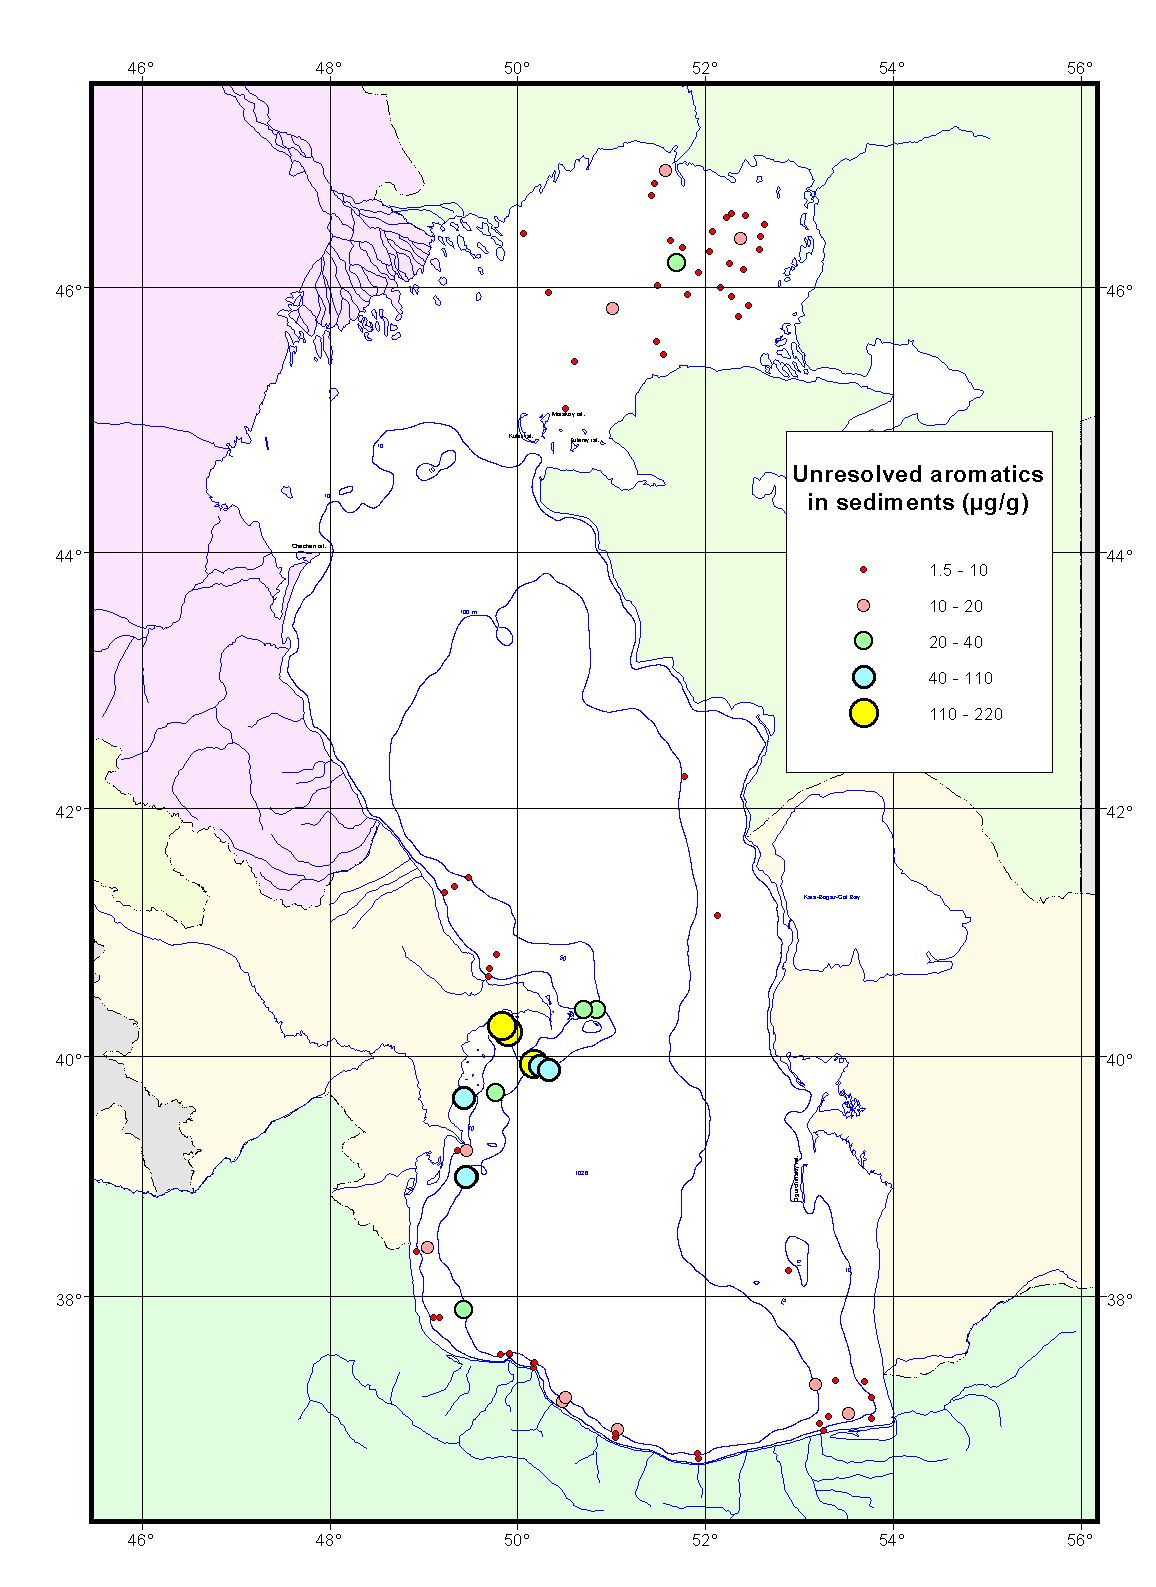
Figure 3.8-37 Vanadium in Sediment

Figure 3.8-38 Zinc in Sediment
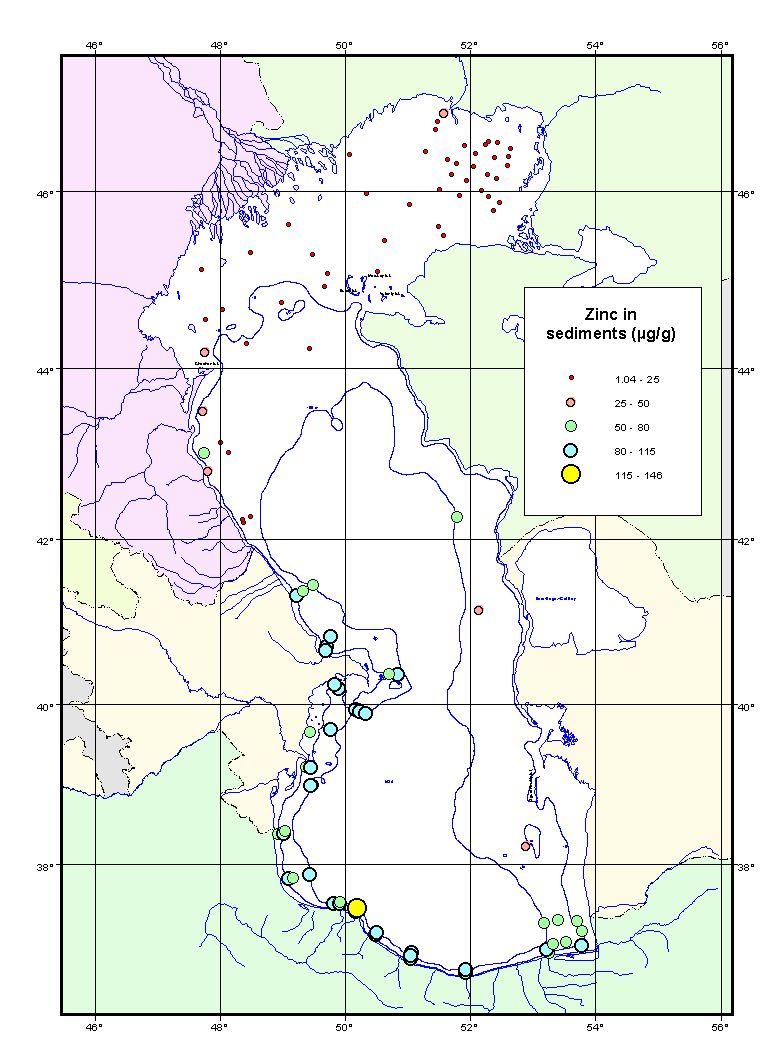
Annex 3.9
Supplemental Material for
Section 2.6
Contamination in Tissue in Seal Blubber
(from ECOTOX project)
Contents
Figure 3.6-1 Arsenic in Fish Tissue 3
Figure 3.6-2 Cadmium in Fish Tissue 4
Figure 3.6-3 Copper in Fish Tissue 5
Figure 3.6-4 Mercury in Fish Tissue 6
Figure 3.6-5 Zinc in Fish Tissue 7
MPC: Maximum permitted concentration (CIS standard) 2
Figure 3.7-1 Arsenic in Water 3
Figure 3.7-2 Barium in Water 4
Figure 3.7-3 Cadmium in Water 5
Figure 3.7-4 Chromium in Water 6
Figure 3.7-5 Copper in Water 7
Figure 3.7-6 Iron in Water 8
Figure 3.7-7 Lead in Water 9
Figure 3.7-8 Mercury in Water 10
Figure 3.7-9 Nickel in Water 11
Figure 3.7-10 Vanadium in Water 12
Figure 3.7-11 Zinc in Water 13
Figure 3.7-12 Phenols in Water 14
Figure 3.7-13 Total Hydrocarbons in Water 15
Figure 3.8-1 a HCH in Sediments 3
Figure 3.8-2 Aldrin in Sediments 4
Figure 3.8-3 Alpha Endosulfan in Sediments 5
Figure 3.8-4 Aluminum in Sediments 6
Figure 3.8-5 Aroclor 1254 in Sediments 7
Figure 3.8-6 Arsenic in Sediment 8
Figure 3.8-7 b HCH in Sediment 9
Figure 3.8-8 Barium in Sediment 10
Figure 3.8-9 Beta Endosulfan in Sediment 11
Figure 3.8-10 Cadmium in Sediment 12
Figure 3.8-11 Carbonate in Sediment 13
Figure 3.8-12 Chromium in Sediment 14
Figure 3.8-13 CIS Chlordane in Sediment 15
Figure 3.8-14 Copper in Sediment 16
Figure 3.8-15 d HCH in Sediment 17
Figure 3.8-16 Dieldrin in Sediment 18
Figure 3.8-17 Endosulfan Sulfate in Sediment 19
Figure 3.8-18 Endrin in Sediment 20
Figure 3.8-19 Fines 62-10 in Sediment 21
Figure 3.8-20 HCB in Sediment 22
Figure 3.8-21 Heptachlor Epoxide in Sediment 23
Figure 3.8-22 Heptachlor in Sediment 24
Figure 3.8-23 Lindane in Sediment 25
Figure 3.8-24 Mercury in Sediment 26
Figure 3.8-25 Methoxychlor in Sediment 27
Figure 3.8-26 Nickel in Sediment 28
Figure 3.8-27 Silver in Sediment 29
Figure 3.8-28 Total DDT in Sediment 30
Figure 3.8-29 Total HCH in Sediment 31
Figure 3.8-30 Total Hydrocarbons in Sediment 32
Figure 3.8-31 Total Organic Carbon in Sediment 33
Figure 3.8-32 Total PAHs in Sediment 34
Figure 3.8-33 Total PCBs in Sediment 35
Figure 3.8-34 Trans Chlordane in Sediment 36
Figure 3.8-35 Unresolved Aliphatics in Sediment 37
Figure 3.8-36 Unresolved Aromatics in Sediment 38
Figure 3.8-37 Vanadium in Sediment 39
Figure 3.8-38 Zinc in Sediment 40
Figure 3.9-1 Chlordane –related compounds in Seal Blubber 3
Figure 3.9-2 DDT –related compounds in Seal Blubber 4
Figure 3.9-3 Dieldrin in Seal Blubber 5
Figure 3.9-4 HCB in Seal Blubber 6
Figure 3.9-5 HCHs in Seal Blubber 7
Figure 3.10-1.5 Al (g g-1), Ca (g g-1) and carbonate (%) as a function of the percentage of fine material in Caspian Sea sediments. 3
Figure 3.10-2.4 Plots of sedimentary concentrations of Unresolved Complex Mixture (UCM, g g-1) and ratios to resolved aliphatics (UCM/R) and n-alkanes (UCM/n-alkanes) for stations in Azerbaijan (A) and Iran (B). 4
Figure 3.10-2.6 Ternary diagram showing the relative amounts of PAHs from different sources (fossil oil, combustion products and natural biological activity) and distinguished on a country basis. 5
Figure 3.10-2.8 Ternary diagram showing the relative amounts of DDT (i.e. fresh input) and its breakdown products DDD and DDE for sediments samples from throughout the Caspian Sea. 6
Figure 3.10-2.26 A plot of the Goldberg Index for coastal sediments from throughout the Caspian Sea, together with the concentrations of PCBs to DDTs from which it is calculated. 7
Figure 3.10-3.3 Ba plotted against Al concentrations (g g-1) for all sites in the Caspian Sea. 8
8
Figure 3.10-3.6 Cr as a function of Al concentrations (g g-1) in Azerbaijan, Iran, Kazakhstan and Russia.. 9
9
Figure 3.10-3.9 Co and Pb as a function of Al concentrations (g g-1) for all sites in the Caspian Sea. 10
Figure 3.9-1 Chlordane –related compounds in Seal Blubber
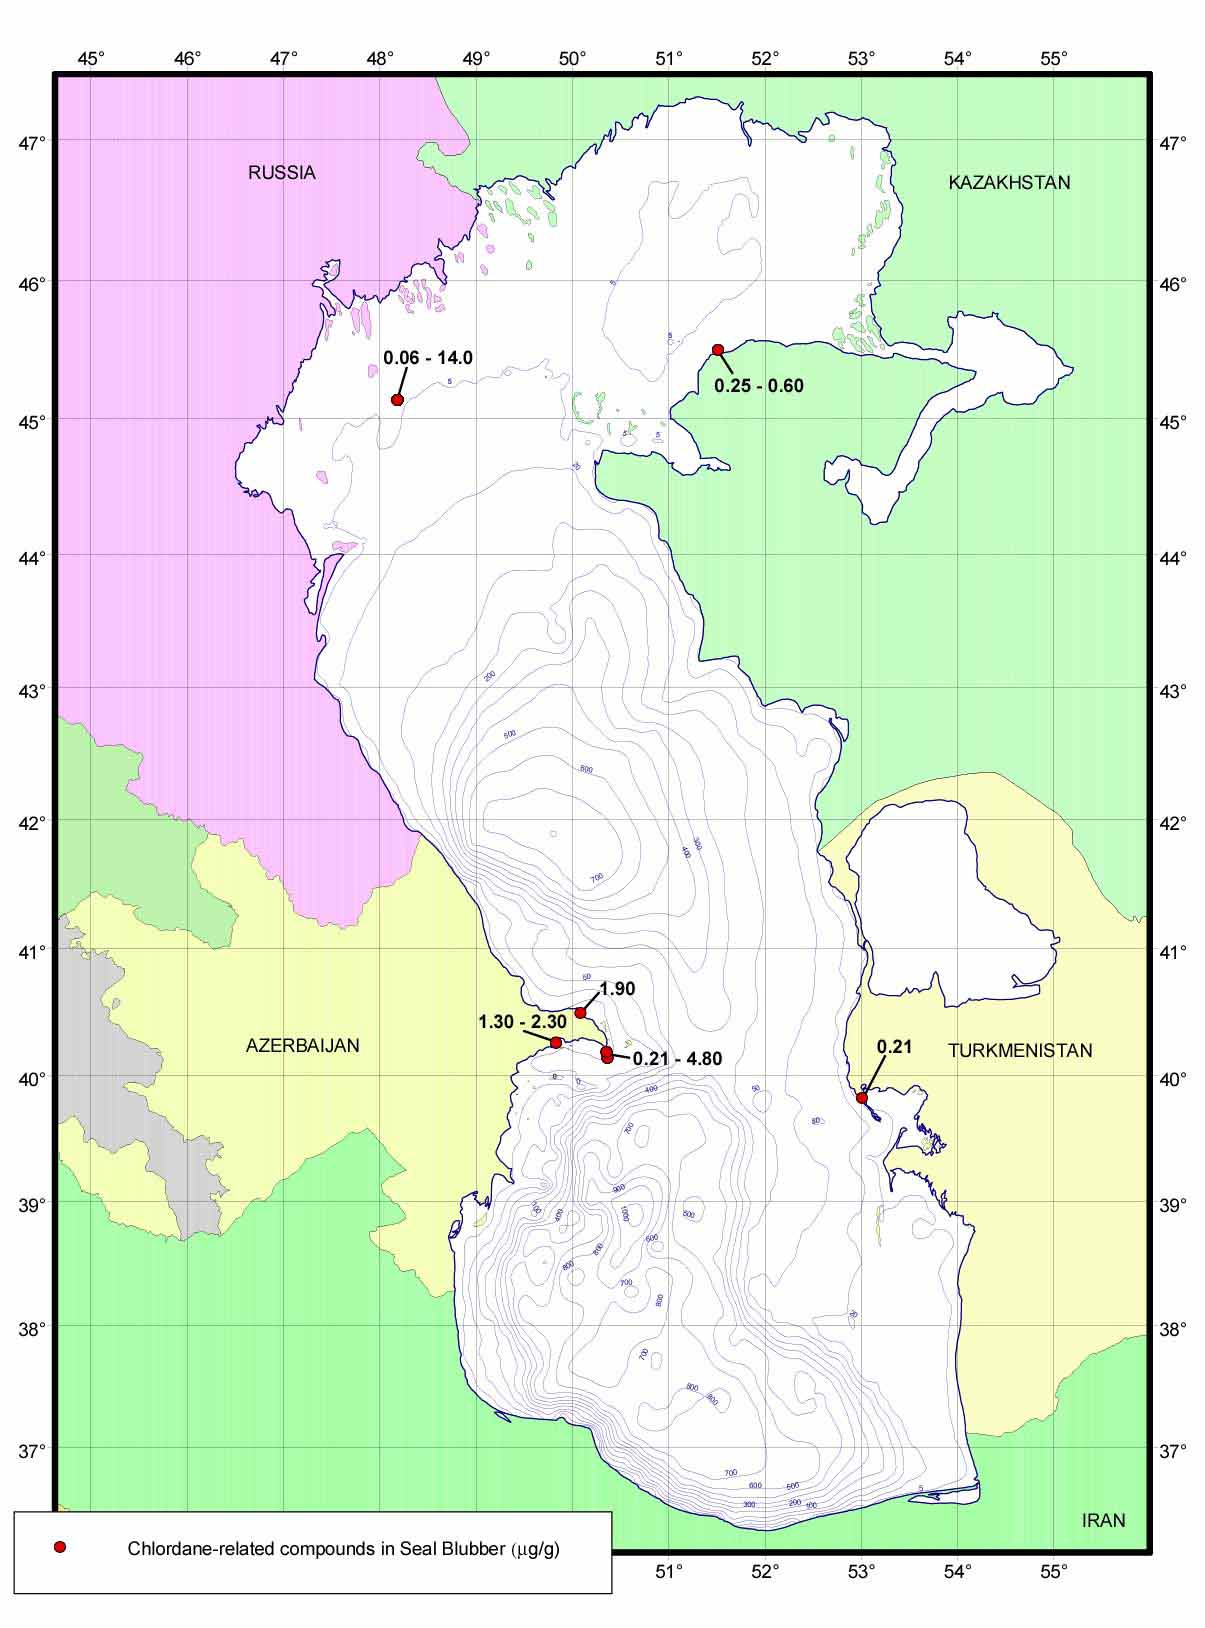
Figure 3.9-2 DDT –related compounds in Seal Blubber
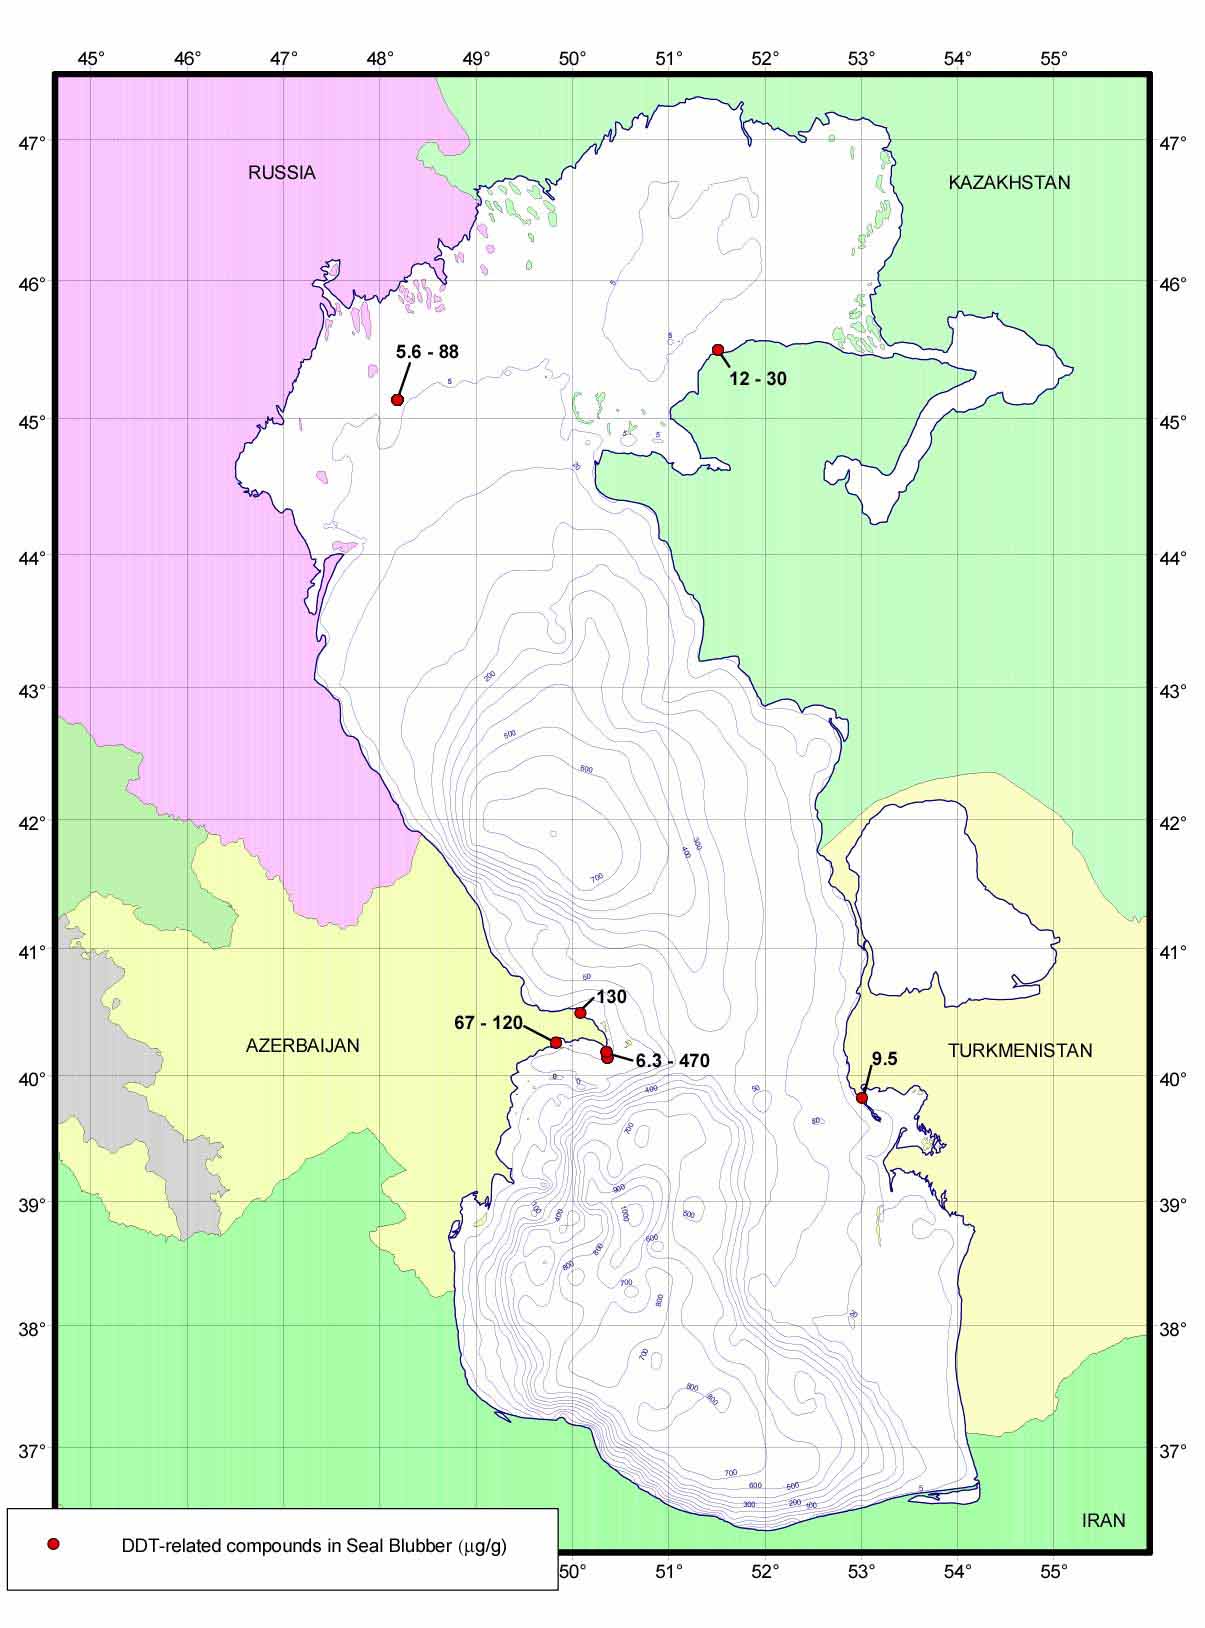
Figure 3.9-3 Dieldrin in Seal Blubber
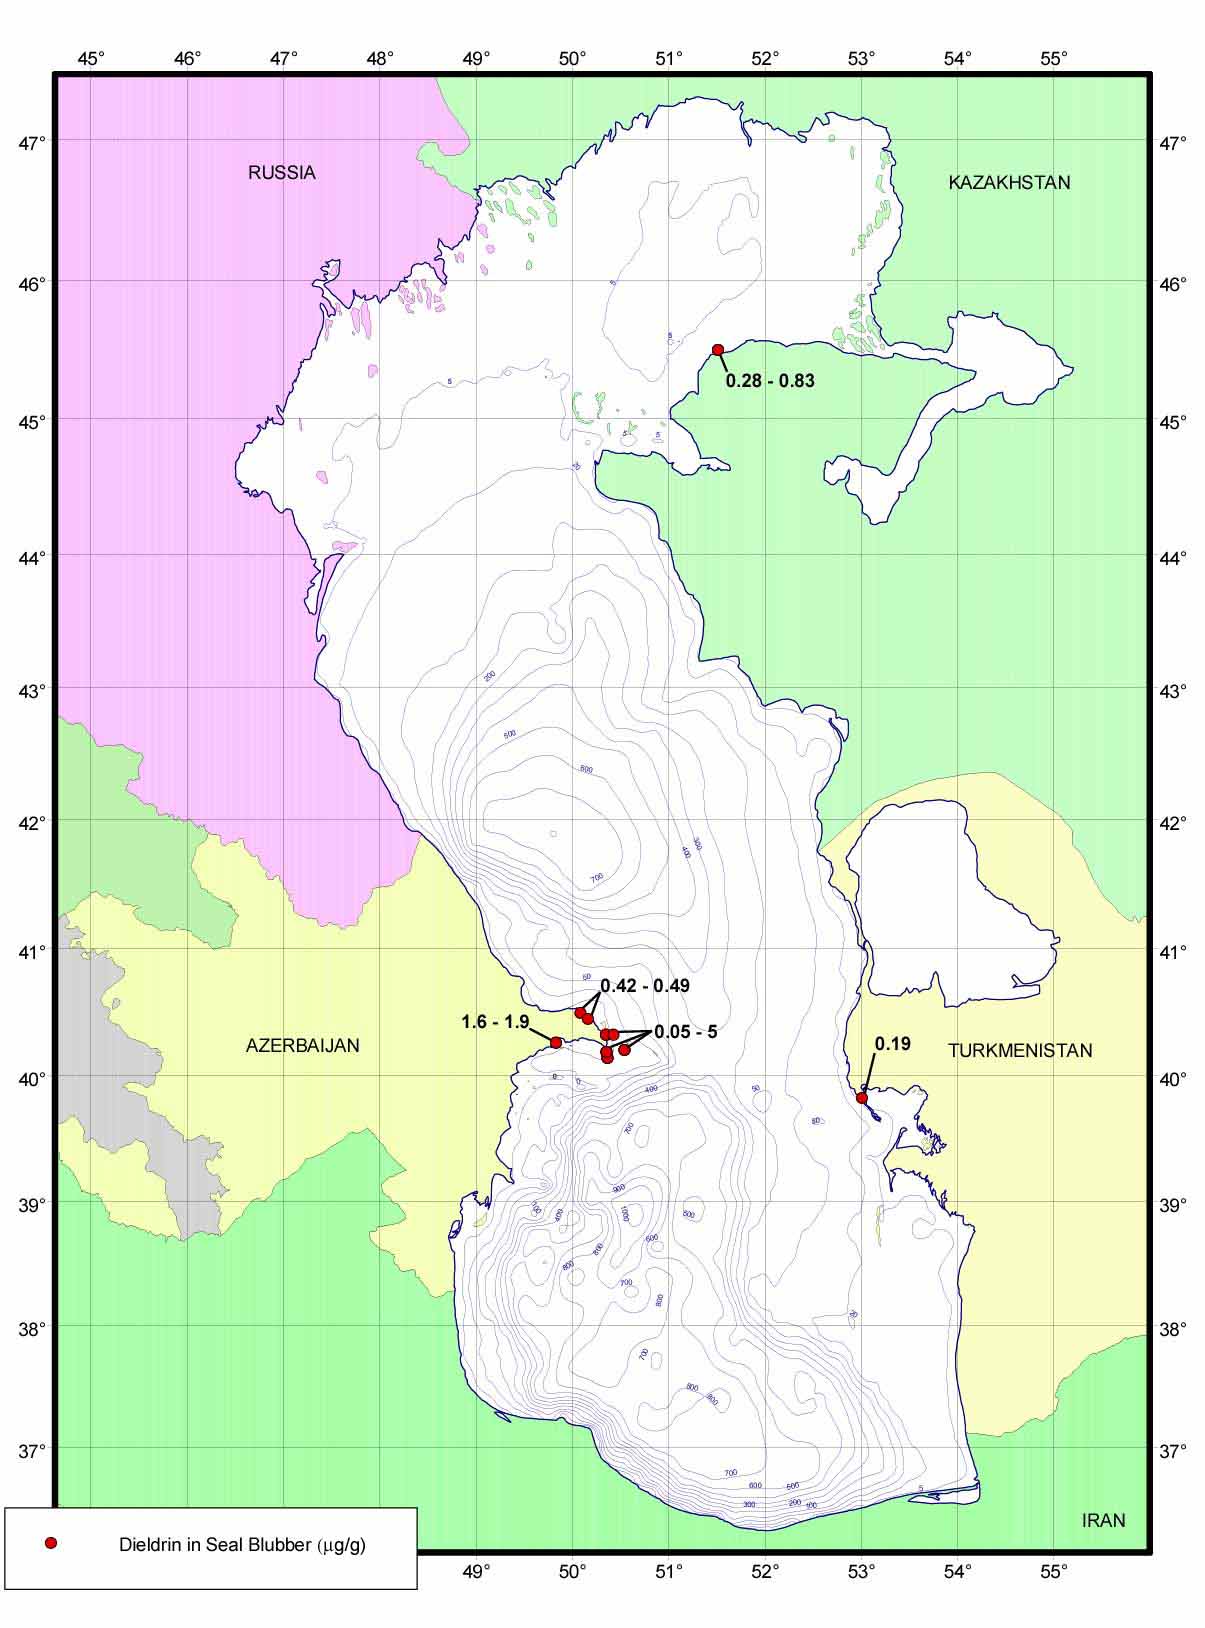
Figure 3.9-4 HCB in Seal Blubber
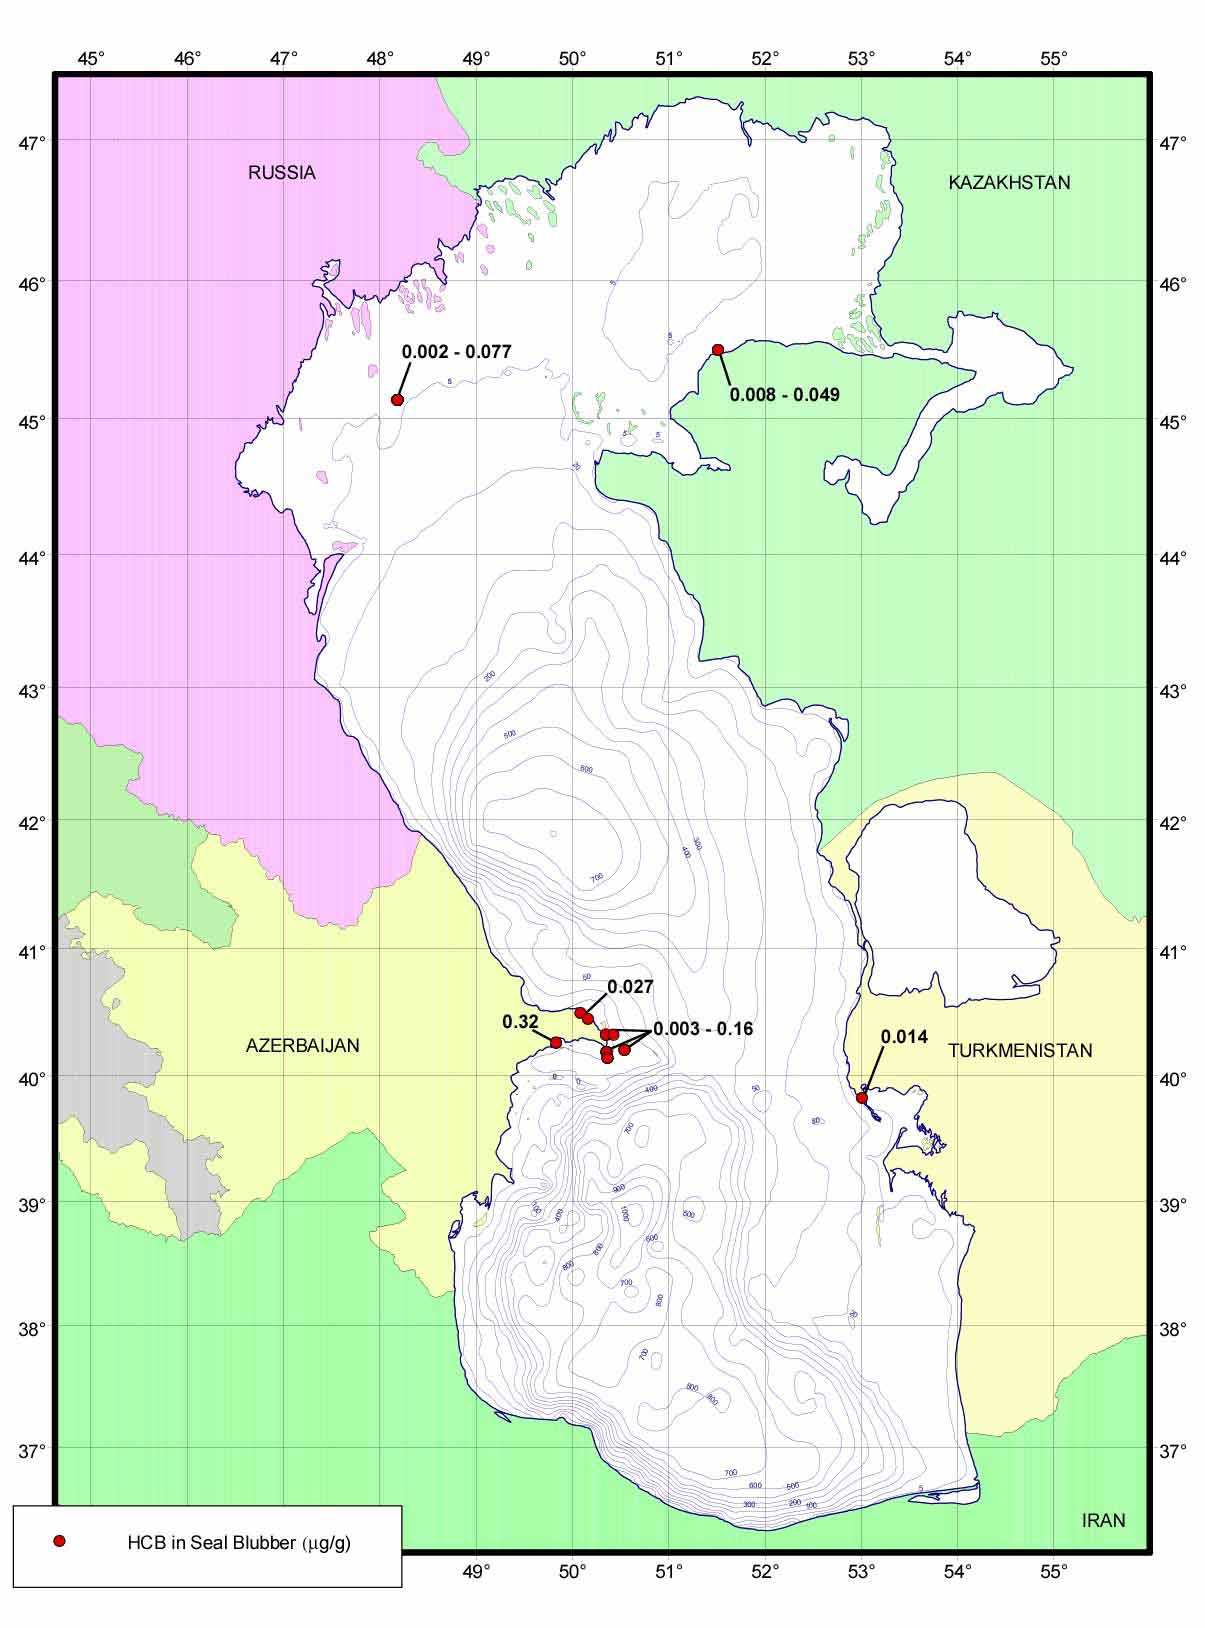
Figure 3.9-5 HCHs in Seal Blubber

Annex 3.10
Supplemental Material for
Section 2.6
Selected Graphics from the ASTP Final Report
Contents
Figure 3.6-1 Arsenic in Fish Tissue 3
Figure 3.6-2 Cadmium in Fish Tissue 4
Figure 3.6-3 Copper in Fish Tissue 5
Figure 3.6-4 Mercury in Fish Tissue 6
Figure 3.6-5 Zinc in Fish Tissue 7
MPC: Maximum permitted concentration (CIS standard) 2
Figure 3.7-1 Arsenic in Water 3
Figure 3.7-2 Barium in Water 4
Figure 3.7-3 Cadmium in Water 5
Figure 3.7-4 Chromium in Water 6
Figure 3.7-5 Copper in Water 7
Figure 3.7-6 Iron in Water 8
Figure 3.7-7 Lead in Water 9
Figure 3.7-8 Mercury in Water 10
Figure 3.7-9 Nickel in Water 11
Figure 3.7-10 Vanadium in Water 12
Figure 3.7-11 Zinc in Water 13
Figure 3.7-12 Phenols in Water 14
Figure 3.7-13 Total Hydrocarbons in Water 15
Figure 3.8-1 a HCH in Sediments 3
Figure 3.8-2 Aldrin in Sediments 4
Figure 3.8-3 Alpha Endosulfan in Sediments 5
Figure 3.8-4 Aluminum in Sediments 6
Figure 3.8-5 Aroclor 1254 in Sediments 7
Figure 3.8-6 Arsenic in Sediment 8
Figure 3.8-7 b HCH in Sediment 9
Figure 3.8-8 Barium in Sediment 10
Figure 3.8-9 Beta Endosulfan in Sediment 11
Figure 3.8-10 Cadmium in Sediment 12
Figure 3.8-11 Carbonate in Sediment 13
Figure 3.8-12 Chromium in Sediment 14
Figure 3.8-13 CIS Chlordane in Sediment 15
Figure 3.8-14 Copper in Sediment 16
Figure 3.8-15 d HCH in Sediment 17
Figure 3.8-16 Dieldrin in Sediment 18
Figure 3.8-17 Endosulfan Sulfate in Sediment 19
Figure 3.8-18 Endrin in Sediment 20
Figure 3.8-19 Fines 62-10 in Sediment 21
Figure 3.8-20 HCB in Sediment 22
Figure 3.8-21 Heptachlor Epoxide in Sediment 23
Figure 3.8-22 Heptachlor in Sediment 24
Figure 3.8-23 Lindane in Sediment 25
Figure 3.8-24 Mercury in Sediment 26
Figure 3.8-25 Methoxychlor in Sediment 27
Figure 3.8-26 Nickel in Sediment 28
Figure 3.8-27 Silver in Sediment 29
Figure 3.8-28 Total DDT in Sediment 30
Figure 3.8-29 Total HCH in Sediment 31
Figure 3.8-30 Total Hydrocarbons in Sediment 32
Figure 3.8-31 Total Organic Carbon in Sediment 33
Figure 3.8-32 Total PAHs in Sediment 34
Figure 3.8-33 Total PCBs in Sediment 35
Figure 3.8-34 Trans Chlordane in Sediment 36
Figure 3.8-35 Unresolved Aliphatics in Sediment 37
Figure 3.8-36 Unresolved Aromatics in Sediment 38
Figure 3.8-37 Vanadium in Sediment 39
Figure 3.8-38 Zinc in Sediment 40
Figure 3.9-1 Chlordane –related compounds in Seal Blubber 3
Figure 3.9-2 DDT –related compounds in Seal Blubber 4
Figure 3.9-3 Dieldrin in Seal Blubber 5
Figure 3.9-4 HCB in Seal Blubber 6
Figure 3.9-5 HCHs in Seal Blubber 7
Figure 3.10-1.5 Al (g g-1), Ca (g g-1) and carbonate (%) as a function of the percentage of fine material in Caspian Sea sediments. 3
Figure 3.10-2.4 Plots of sedimentary concentrations of Unresolved Complex Mixture (UCM, g g-1) and ratios to resolved aliphatics (UCM/R) and n-alkanes (UCM/n-alkanes) for stations in Azerbaijan (A) and Iran (B). 4
Figure 3.10-2.6 Ternary diagram showing the relative amounts of PAHs from different sources (fossil oil, combustion products and natural biological activity) and distinguished on a country basis. 5
Figure 3.10-2.8 Ternary diagram showing the relative amounts of DDT (i.e. fresh input) and its breakdown products DDD and DDE for sediments samples from throughout the Caspian Sea. 6
Figure 3.10-2.26 A plot of the Goldberg Index for coastal sediments from throughout the Caspian Sea, together with the concentrations of PCBs to DDTs from which it is calculated. 7
Figure 3.10-3.3 Ba plotted against Al concentrations (g g-1) for all sites in the Caspian Sea. 8
8
Figure 3.10-3.6 Cr as a function of Al concentrations (g g-1) in Azerbaijan, Iran, Kazakhstan and Russia.. 9
9
Figure 3.10-3.9 Co and Pb as a function of Al concentrations (g g-1) for all sites in the Caspian Sea. 10
Figure 3.10-1.5 Al (g g-1), Ca (g g-1) and carbonate (%) as a function of the percentage of fine material in Caspian Sea sediments.
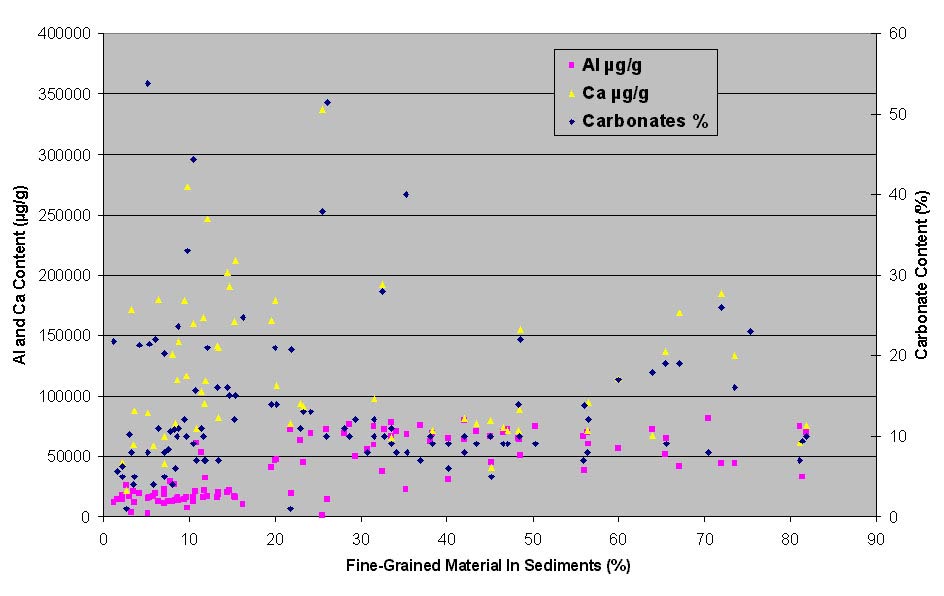
Figure 3.10-2.4 Plots of sedimentary concentrations of Unresolved Complex Mixture (UCM, g g-1) and ratios to resolved aliphatics (UCM/R) and n-alkanes (UCM/n-alkanes) for stations in Azerbaijan (A) and Iran (B).
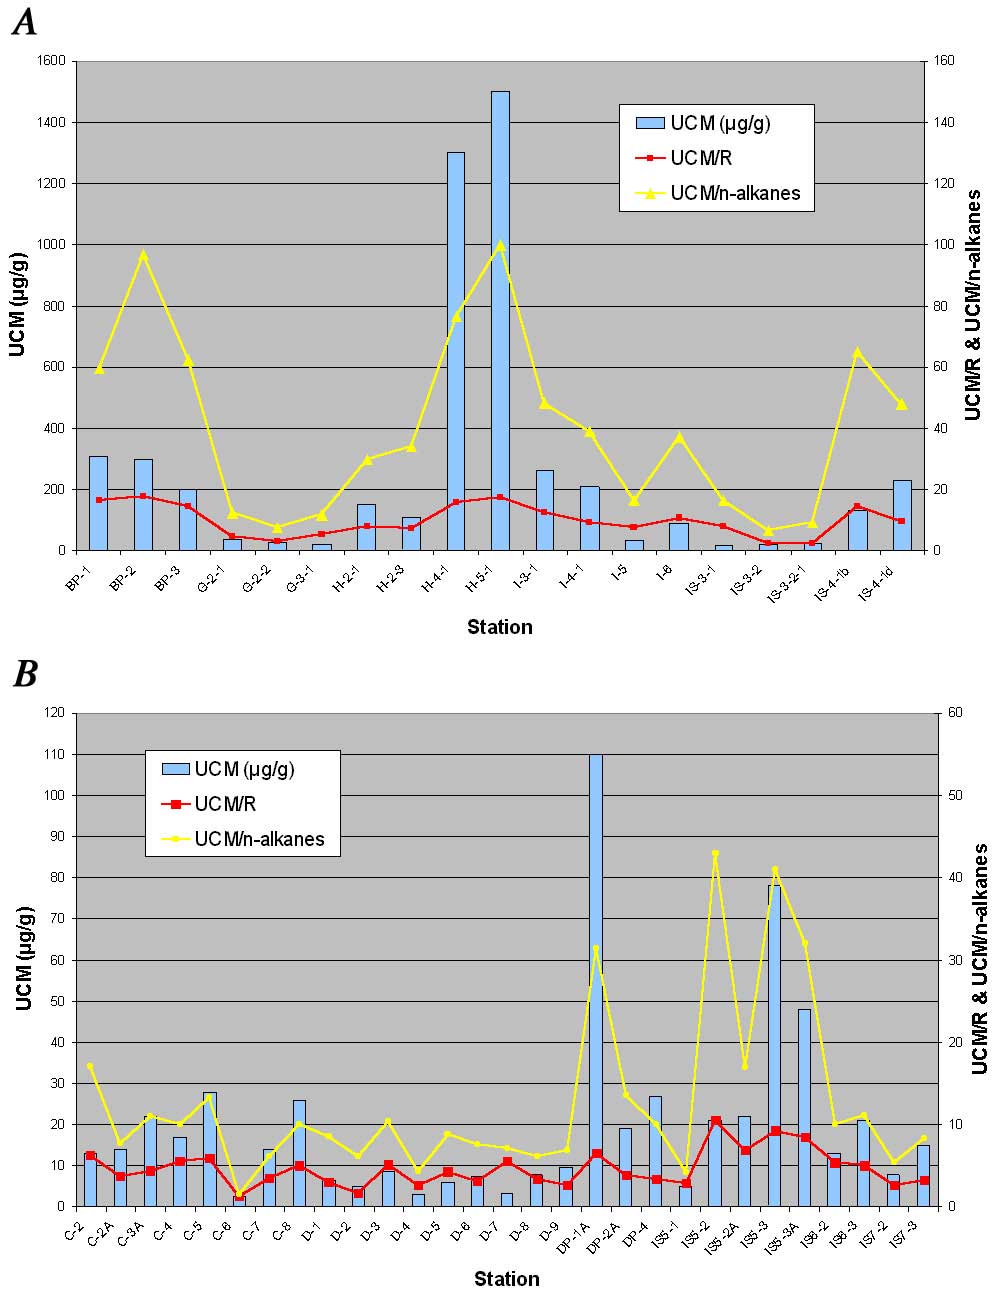
Figure 3.10-2.6 Ternary diagram showing the relative amounts of PAHs from different sources (fossil oil, combustion products and natural biological activity) and distinguished on a country basis.
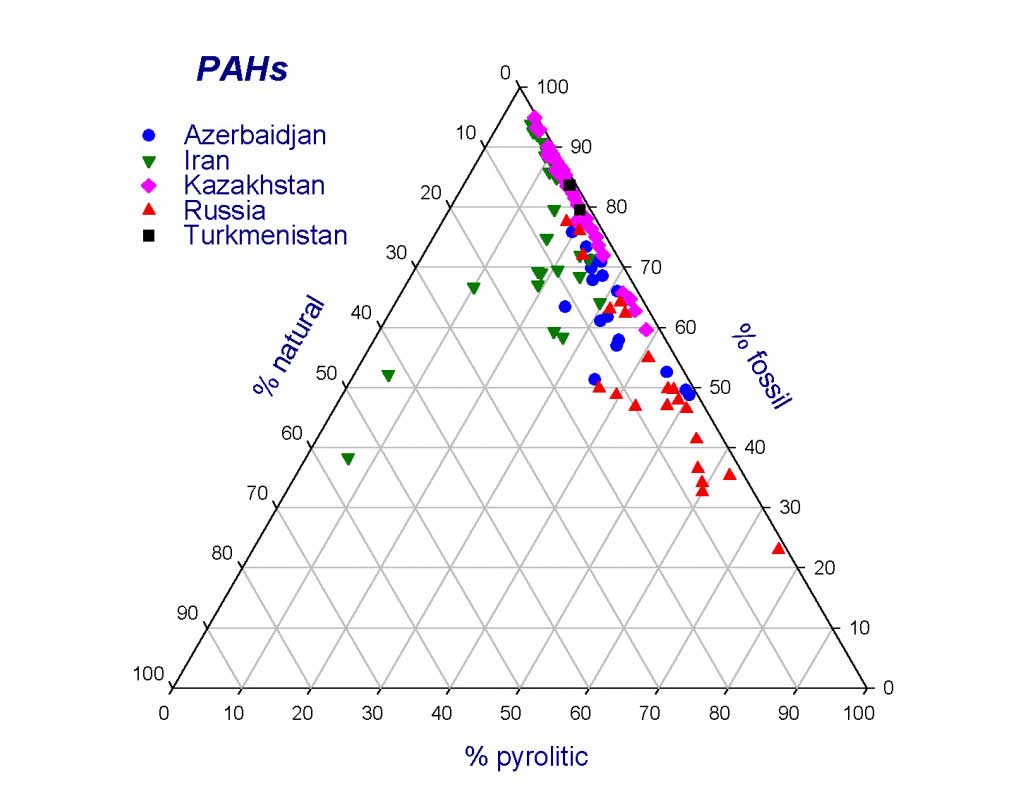
Figure 3.10-2.8 Ternary diagram showing the relative amounts of DDT (i.e. fresh input) and its breakdown products DDD and DDE for sediments samples from throughout the Caspian Sea.
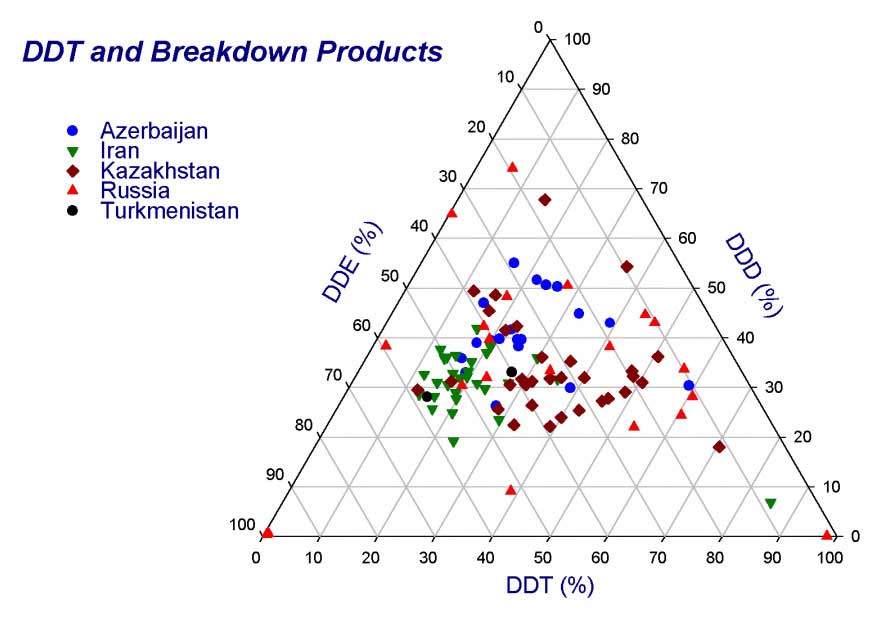
Figure 3.10-2.26 A plot of the Goldberg Index for coastal sediments from throughout the Caspian Sea, together with the concentrations of PCBs to DDTs from which it is calculated.
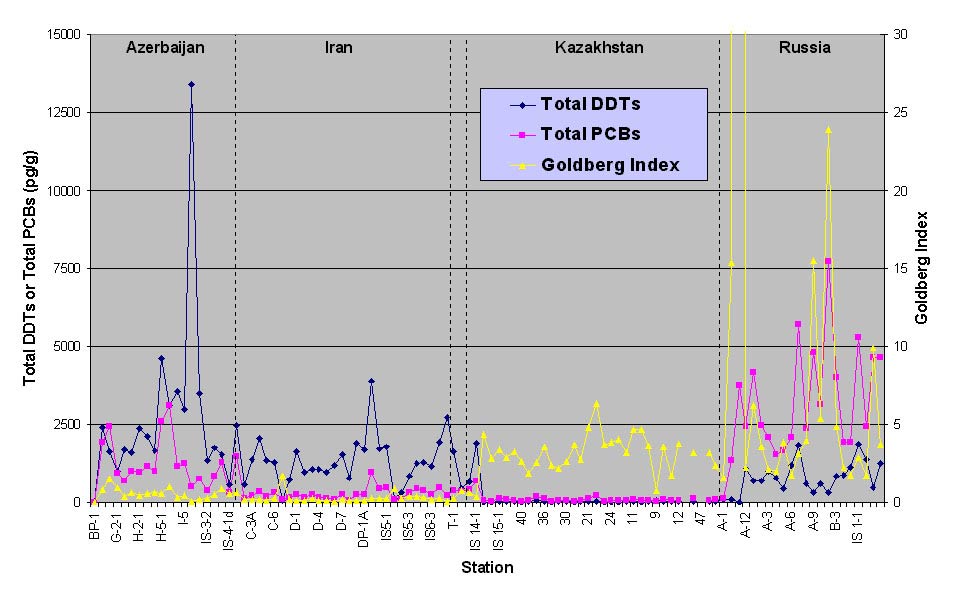
Figure 3.10-3.3 Ba plotted against Al concentrations (g g-1) for all sites in the Caspian Sea.
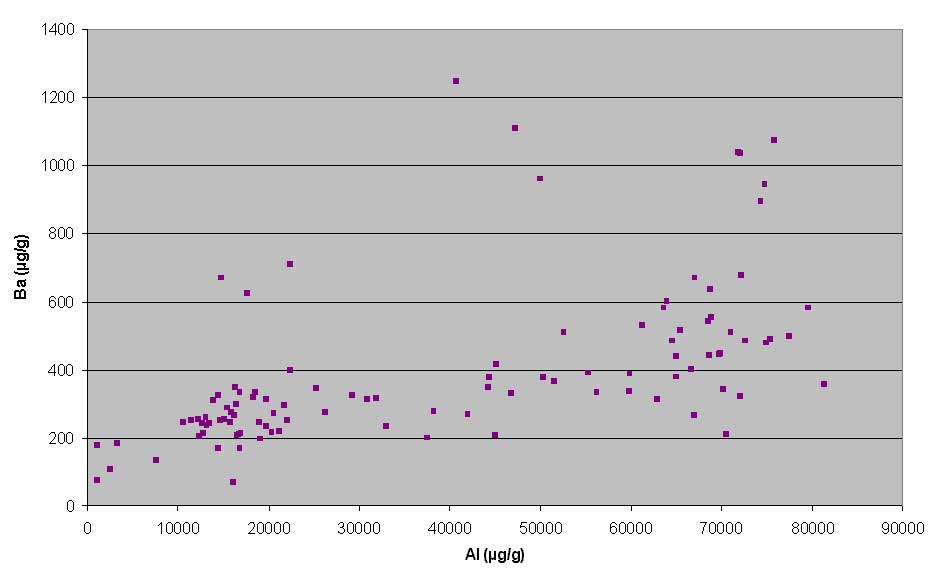
Figure 3.10-3.6 Cr as a function of Al concentrations (g g-1) in Azerbaijan, Iran, Kazakhstan and Russia..
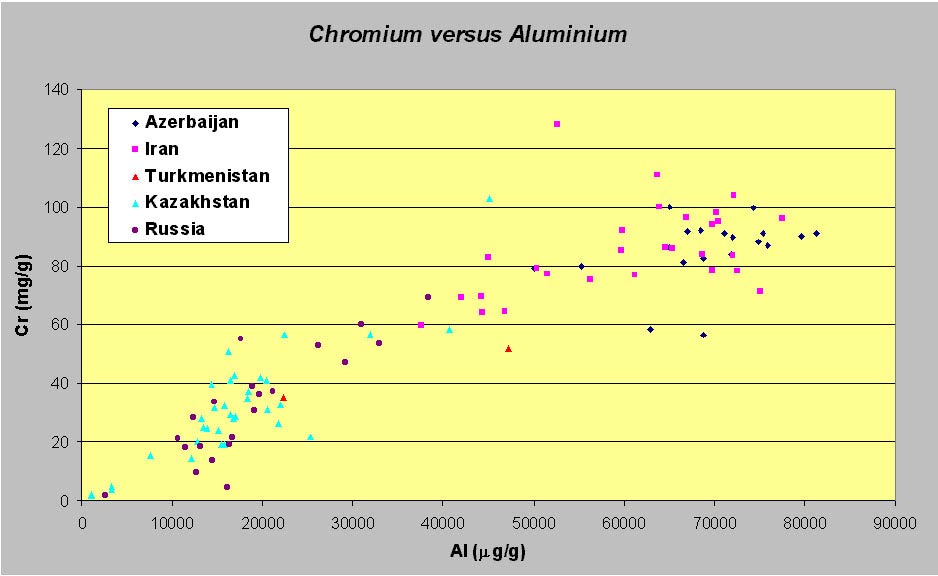
Figure 3.10-3.9 Co and Pb as a function of Al concentrations (g g-1) for all sites in the Caspian Sea.
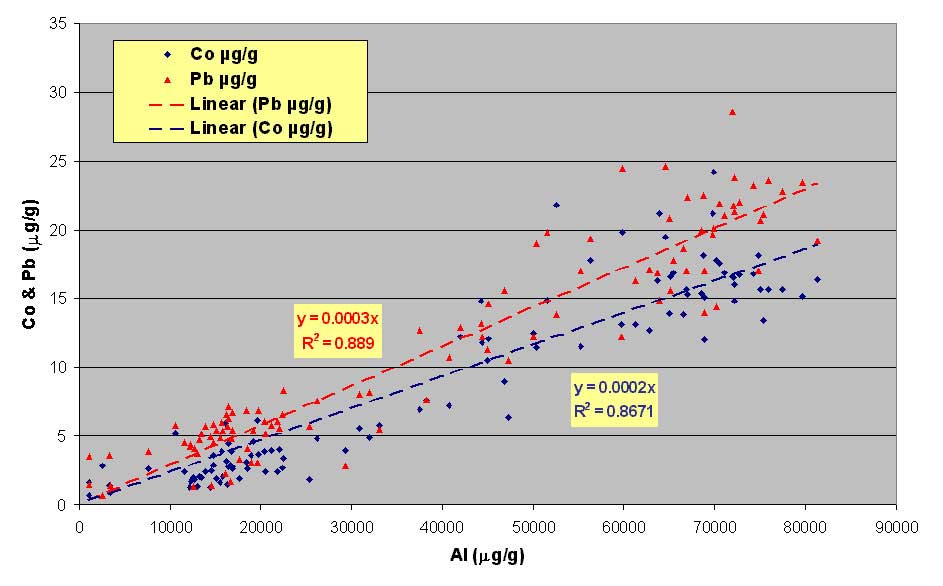
Annex 3.11
Supplemental Material for
Section 2.7 Decline in Human Health
Contents
Annex 3.1 1
Supplemental Material for 1
Section 3.1 Physical and Biogeochemical Characteristics Caspian Sea 1
Table 3.1-1 Major sensitive habitats in the Caspian Sea Region 1
Table 3.1-1 Surface Water Salinity during summer in the Caspian Sea (Aubrey, 1994) 1
Table A2.2-1 Major Sensitive Habitats in the Caspian Sea Region 2
Figure A2.2-1 Surface Water Salinity During Summer in the Caspian Sea (from Aubrey et al., 1994a) 9
Table A3.2-1. UNDP Human Development Index (HDI) – 1999 Data 3
Table A3.2-2. UNDP Human Development Index Trends 3
Table A3.2-3. Population Data (World Bank, 1999) 3
Table A3.2-4. Projected Population Trends (UNDP Human Development Report 2001) 3
Table A3.2-5. Expenditures for Public Health, Education, and Social Protection in Azerbaijan 4
Table A3.2-6. Population in the Coastal Zone 4
Table A3.2-7. Cities and Towns in the Coastal Zone 5
Table A3.2-8. Azerbaijan: Dynamics of Population Number in 1999 (Coastal Profile) 5
Table A3.2-9. Education System in Caspian Coastal Zone 5
Table A3.2-10. Azerbaijan: Characteristics of Education System for 1999 (Coastal Profile) 6
Table A3.2-11. Principal Indices of Education in Azerbaijan 7
Table A3.2-12. Employment Characteristics in Caspian Hinterland 7
Table A3.2-13. Azerbaijan: Labor Resources and Population Employment in 1999 8
Table A3.2-14. Dynamics of Living Standards in CEZ in Russian Federation 8
Table A3.2-15. Employment in Turkmenistan CEZ (Balkan Province) 9
Table A3.2-16. Economic Indicators in Caspian Hinterland 9
Table A3.2-17. Main Social-Economic Indexes of the Development of Kazakhstan Republic 9
Table A3.2-18. Kazakhstan Income Data 10
Table A3.2-19. The industrial mix for CEZ (1999) in Russian Federation 11
Table A3.2-20. Turkmenistan (in the province of Balkan) Industry (5200 manat = $1) 11
Table A3.2-21. Areas Under Cultivation in Caspian Region 12
Table A3.2-22. Agricultural Production in the Caspian Region 12
Table A3.2-23. Agricultural Output in Iran CEZ 12
Table A3.2-24. Chemical Fertilizer Used in the Northern Provinces of Iran (1990) 13
Table A3.2-25. The Number of Employees in the Agricultural Sector in Iran 13
Table A3.2-26 Agricultural Indices in CEZ of Russian Federation 13
Table A3.2-27 Structure of Livestock Population in All Management Categories in the Balkan Province of Turkmenistan 14
Table A3.2- 28 Fishing Industry Statistics in the Caspian Region 14
Table A3.2-29 Industrial Production in the Caspian Region 14
Table A3.2-30 Distribution of Industrial Facilities in Iran 14
Table A3.2-31 Industrial Mix for CEZ of the Russian Federation (1999) 15
Table A3.2-32 Oil and Gas Activities in the Caspian Region 16
Table A3.2-33 Production of Oil in Azerbaijan (million tons) 16
Table A3.2-34 Outputs of Oil and Power Complex in the Balkan Province of Turkmenistan 17
Table A3.2-35 Water Use in the Caspian Coastal Zone 17
Table A3.2-36. Azerbaijan: Generalized Indices on the Centralized Water Supply and Drainage for 1999 (m.m3) 17
Table A3.2-37 Azerbaijan: Irrigated Lands Distribution (thousand ha) 18
Table A3.2-38 Azerbaijan: Indices of Irrigated Lands Use 18
Table A3.2-39 Urbanization Trends (UNDP Human Development 2001 and Country Socio -Economic Reports) 18
Table A3.2-40 Possibilities for Tourism in the Caspian Coastal Zone 19
Annex 3.3 1
Supplemental Material for 1
Section 3.3 Legal and Regulatory Setting 1
Table A3.3-2 International Environmental Conventions Ratified by the Republic of Azerbaijan 3
Table A3.3-4 International Environmental Conventions and Agreements Ratified by the Republic of Kazakhstan (as of June 1, 2001) 4
Table 3.5-1 Decline in Fisheries 4
Table 3.5-2 Decline in Environmental Quality 6
Table 3.5-3 Decline in Biodiversity 8
Table 3.5-4 Decline in Human Health 10
Table 3.5-5 Decline in Infrastructure 12
Table 3.5-6 Degradation of Coastal Landscape 14
Table 3.5-7 Emerging Issue: Increase in Pollution from Oil and Gas Activities 15
Table 3.5-8 Introduction of Exotic Species 17
Table 3.11-1 Commitment to Health: Access, Services and Resources (UNDP Human Development Report 2001) 3
Table 3.11-2 Leading Global Health Crises and Challenges (UNDP Human Development Report 2001) 3
Table 3.11-3 Access to Healthcare in Caspian Coastal Zones 4
Table 3.11-4 Survival Rates (UNDP Human Development Report 2001) 4
Table 3.11-5 Principal indices of the public health in Azerbaijan 4
Table 3.11-6 Azerbaijan: Deaths attributed to illnesses in 1999. (Number of diseases per 100,000) (Coastal Profile) 5
Table 3.11-7 Disease Rates in Kazakhstan (per 100,000 people) 6
The attached tables, derived from published reports from the UNDP and other sources, illustrate some of the human health issues. Data for Iran comes partly from their excellent Coastal Profile (IRI, 2001). Table 3.11-1 shows the commitment to health of the Caspian countries. In general, Iran has fewer physicians per capita than other countries, and expends less of their budget on public health.
Table 3.11-1 Commitment to Health: Access, Services and Resources (UNDP Human Development Report 2001)
|
|
Pop. using adequate sanitation facilities ( %) 1999 |
Pop. using improved water sources (%) 1999 |
Physicians (per 100,000 people) 1990-99 |
Public health expenditure per capita (% of GDP) 1998 |
|
Azerbaijan |
-- |
-- |
360 |
1.6 |
|
I.R. Iran |
81 |
95 |
85 |
1.7 |
|
Kazakhstan |
99 |
91 |
353 |
3.5 |
|
Russian Fed. |
-- |
99 |
421 |
-- |
|
Turkmenistan |
100 |
58 |
300 |
4.1 |
Table 3.11-2 shows some of the major health crises in the countries, including undernourishment, infants with low birth rates, adults living with HIV/AIDS, and tuberculosis. Undernourishment is high in Azerbaijan and Turkmenistan compared to other Caspian countries, whereas Iran leads the region in infants with low birthweight. HIV/AIDS data are not thought to be accurate, so comparison is difficult. Tuberculosis is a major issue in Kazakhstan, particularly in Atyrau Oblast (which has the highest rate of tuberculosis in Kazakhstan), and Aktau Oblast (fifth place).
Table 3.11-2 Leading Global Health Crises and Challenges (UNDP Human Development Report 2001)
|
|
Undernourished people (% total) 1996/98 |
Infants with low birthweight (%) 1995-99 |
Adults living with HIV/AIDS 1999 |
Tuberculosis cases (per 100,000) 1998 |
|
Azerbaijan |
32 |
6 |
<0.01 |
61 |
|
I.R. Iran |
6 |
10 |
<0.01 |
18 |
|
Kazakhstan |
5 |
9 |
0.04 |
126 |
|
Russian Fed. |
6 |
7 |
0.18 |
82 |
|
Turkmenistan |
10 |
5 |
0.01 |
89 |
Access to healthcare in Caspian coastal zones is listed in table 3.11-3. Data are not complete for the region.
Table 3.11-3 Access to Healthcare in Caspian Coastal Zones
|
|
Pop. with adequate access to healthcare (%) |
Ratio of doctors to residents (per 10,000) |
Number of hospital beds (per 10,000) |
|
Azerbaijan |
|
|
|
|
I.R. Iran |
92% |
10.8 |
12 |
|
Kazakhstan |
|
32.2 |
79.6 |
|
Russian Fed. |
|
|
|
|
Turkmenistan |
|
29.3 |
137.1 |
Table 3.11-4 shows the birth-related and youth mortality rates for the Caspian states. Results are mixed across countries, though mortality rates are higher than in most developed countries.
Table 3.11-4 Survival Rates (UNDP Human Development Report 2001)
|
|
Life expectancy at birth (years) 1995-2000 |
Infant mortality rate (per 1000 births) 1999 |
Under-five mortality rate (per 1000 live births) 1999 |
Maternal mortality rates reported (per 100,000 live births) 1980-99 |
|
Azerbaijan |
71.0 |
35 |
45 |
43 |
|
I.R. Iran |
68.0 |
37 |
46 |
37 |
|
Kazakhstan |
64.1 |
35 |
42 |
70 |
|
Russian Fed. |
66.1 |
18 |
22 |
50 |
|
Turkmenistan |
65.4 |
52 |
71 |
65 |
Table 3.11-5 shows data on Azerbaijan public health sector. It indicates a marked increase in general mortality, child mortality, and maternity deaths following independence. State expenditure for public health meanwhile dropped considerably. Analogous data were not available for the other Caspian states.
Table 3.11-5 Principal indices of the public health in Azerbaijan
|
Public health indices |
Before and immediately after independence |
After independence |
Change rate (in %) |
|
General mortality (for 1,000 people) |
6.0 (1990) |
6.4 (1996) |
6.7 |
|
Child mortality (per 1,000 births) |
23.0 (1990) |
37.0 (1997) |
60.9 |
|
Maternity death (per 100,000 births) |
29.0 (1988) |
70.0 (1994) |
141.4 |
|
State expenditure for public health (in % of GDP) |
2.9 (1991) |
1.6 (1997) |
- 44.8 |
Table 3.11-6 shows some disease statistics for Azerbaijan, whereas Table 3.11-7 shows some statistics for Kazakhstan. Data for other Caspian states were not available. These data are broken out by geographic location along the coast. In general, people living in Baku or on the Apsheron peninsula are less healthy than those living in other parts of the coast. In Kazakhstan, the coastal regions (Atyrau and Aktau) have generally higher disease rates than other parts of the country.
Table 3.11-6 Azerbaijan: Deaths attributed to illnesses in 1999. (Number of diseases per 100,000) (Coastal Profile)
|
Diseases |
economical-geographical region
|
||||
|
Guba-Khachmaz |
Apsheron |
Central Aran |
Lenkaran |
||
|
Baku and Sumgayit |
rural regions |
||||
|
Infection and parasitic |
3348 |
4665 |
2089 |
1443 |
2852 |
|
New emergence |
170 |
228 |
22 |
77 |
73 |
|
Diseases of endocrine system, indigestion, disorders of immunology |
671 |
937 |
98 |
208 |
711 |
|
Blood disease, and hematologicorgans |
1165 |
794 |
205 |
356 |
459 |
|
Psycologic disorder |
73 |
826 |
48 |
228 |
65 |
|
Diseases dealing with nervous system and sense organs |
849 |
6144 |
1225 |
2068 |
1172 |
|
Diseases of blood circulation |
1192 |
1340 |
2236 |
5255 |
1220 |
|
Respiration organs diseases |
15874 |
23759 |
23100 |
9886 |
19932 |
|
Diseases dealing with indigestion |
1321 |
2783 |
3935 |
788 |
1474 |
|
Diseases dealing with urinogenital |
928 |
1367 |
3497 |
423 |
1019 |
|
Complications dealing with pregnancy and births |
481 |
457 |
1978 |
71 |
237 |
|
Derma and hypodermic cellulose diseases |
1470 |
2469 |
2571 |
911 |
4556 |
|
Osseous-muscular diseases |
122 |
620 |
- |
539 |
122 |
|
Inner anomalies |
29 |
176 |
- |
221 |
50 |
|
Infants diseases under 1 years old |
52 |
629 |
- |
708 |
154 |
|
Non-clarified symptoms features |
270 |
496 |
6 |
341 |
1810 |
|
Trauma-poisoning |
5847 |
2083 |
17577 |
5359 |
9236 |
|
Total: |
33862 |
49773 |
58587 |
28882 |
45142 |
Table 3.11-7 Disease Rates in Kazakhstan (per 100,000 people)
|
|
1995 |
1995 |
1996 |
1996 |
% increase |
|
|
|
|
Pre-Caspian Region |
Other |
Pre -Caspian |
Other |
Pre -Caspian Region |
Other |
|
|
The initial sickness rate per 100,000: |
|
|
|
|
|
|
|
|
Total diseases |
47000 |
51000 |
43100 |
46000 |
91 |
90 |
|
|
Infectious and parasitic diseases |
4700 |
2700 |
4600 |
2700 |
99 |
92 |
|
|
Neoplasm |
175 |
390 |
146 |
401 |
83 |
139 |
|
|
Diseases of the endocrine system; immune system and |
398 |
380 |
398 |
471 |
100 |
124 |
|
|
Diseases of blood and blood-producing organs |
1015 |
664 |
1140 |
716 |
112 |
108 |
|
|
Mental illness |
270 |
413 |
331 |
391 |
123 |
95 |
|
|
Diseases of the nervous system and sensory organs |
3900 |
4900 |
3800 |
4900 |
97 |
100 |
|
|
Diseases of the circulatory system |
957 |
1100 |
1100 |
1100 |
120 |
98 |
|
|
Diseases of the respiratory organs |
18400 |
21400 |
15600 |
17300 |
85 |
81 |
|
|
Diseases of the digestive system |
3100 |
3500 |
2800 |
3000 |
92 |
86 |
|
|
Diseases of the urine-genital system |
2100 |
2600 |
1600 |
2800 |
77 |
107 |
|
|
Complications while pregnancy, childbirth and postnatal period |
4500 |
4300 |
4700 |
3800 |
104 |
89 |
|
|
Skin diseases and subcutaneous cellular tissue |
5900 |
4600 |
4900 |
4400 |
83 |
95 |
|
|
Skeletal and muscular diseases |
1100 |
1800 |
1000 |
1700 |
92 |
98 |
|
|
Congenital abnormalities |
74 |
90 |
106 |
110 |
142 |
123 |
|
|
Injuries and cases of intoxication |
3500 |
5000 |
3800 |
4500 |
107 |
90 |
|
|
Demographic parameters: |
|||||||
|
Birth-rate, for 1000 people |
20 |
16 |
20 |
15 |
96 |
92 |
|
|
Death-rate, for 1000 people |
8 |
10 |
8 |
10 |
100 |
100 |
|
|
Infant mortality rate per 1000 born births |
33 |
27 |
33 |
|
98 |
- |
|
Bibliography
Abaee, S., 2001. Rapid Assessment of Point Sources of Pollution in Iranian Part of Caspian Sea Area. Caspian Environment Programme, Baku, AZ.
Academic Council of KaspNIRKH, 2001. Report Summary on Mass Mortality of Kilka. Astrakhan, RF.
Aladin, N.V., 2001. Biodiversity of the Caspian Sea. Caspian Environment Programme, Baku, AZ.
Aladin, N. V. and I.S. Plotnikov, 1993. “Large saline lakes of former USSR: a summary review.” Hydrobiologia: (267) 1-12.
Amineh, M.P., 1999. Towards the Control of Oil Resources in the Caspian Region. St. Martin’s Press, New York, New York, USA.
Anonymous. Integrated Coastal Management and Planning in the Lagan Region of the Republic of Kalmykia (Russian Federation.)
Aubrey, D.G., 2001. Third Meeting on Transboundary Diagnostic Analysis, National Caspian Action Plans, and Strategic Action Programme. Caspian Environmental Programme, Baku, AZ.
Aubrey, D.G., V.A. Ivanov, T.A. Glushko, and J.D. Winston, 1994a. The North Caspian Basin: Environmental Satus and Oil and Gas Operational Issues. Mobil Oil Corporation, Dallas, TX, USA, 311 pp. + Appendices.
Aubrey et al., 1994b. Conservation of Biological Diversity of the Caspian Sea and Its Coastal Zone. Woods Hole, MA, USA.
Azerbaijan, 1998. Azerbaijan National Report for PDF-B Phase. Caspian Environment Programme, Baku, AZ.
Azerbaijan, 2001. National TDA Meeting Report, 13-14 March, 2001, Baku, Azerbaijan. Caspian Environment Programme, Baku, AZ.
Azerbaijan, 2001. Social and Economic Situation in Azerbaijan (Summary Review). Caspian Environment Programme, Baku, AZ.
Azerbaijan International Operating Company (AIOC), 1996. Environmental Impact Assessment – Early Oil Production.
Azerbaijan National Coastal Profile, 2000. National Report. Caspian Environment Programme, Baku.
Azerbaijan Republic State Committee on Ecology and Control of Natural Resources Utilization, 1998. National Environmental Action Plan. Press-Alyans. Baku, AZ.
Baranova, I., 2001. Leaking Operations:
Environmental Consequences of World Bank and EBRD Involvement in the
Russian Oil Sector. CEE Bankwatch Network, Prague, Czech Republic.
Bartocci, J., J.P. Villeneuve, and E. Wyse, 2001. Caspian Sea 2000 - Phase 1. Contaminant Screening in Sediment Screening. Samples collected from Caspian Sea, October 2000 Preliminary Report. International Atomic Energy Agency, Marine Environmental Laboratory. Monaco.
Bekkaliev, S., ed., 2001. Socio-Economic Study of Kazakhstan. Ministry of Natural Resources and Environment Protection of Kazakhstan. Kokchetau, KZ.
Blum, D.W., 2000. “National, Subnational, and International Politics: Environmental Regime-Building in the Caspian.” in Ascher, William and Natalia Mirovitskaya. eds. The Caspian Sea: A Quest for Security. NATO Science Series. Klewer Academic Publishers, Dordrecht, Boston, and London. pp. 313 - 326.
Bolshov, A., ed., 2000. State of the biodiversity of the Kazakhstan part of the Caspian Sea. Regional Caspian Biodiversity Center. Atyrau, KZ.
Bouwman, L. and F. van Vuuren, 1999. Global assesment of Acidification and Eutrophication of natural ecosystems. UNEP/DEIA&EW/TR 99-6, RIVM/4002001012, UNEP, Nairobi, Kenya.
British Petroleum, Azerbaijan. February, 2001. Sustainable Development (SD) and Biodiversity (BD) Strategy and Action Plan (SAP). Baku, AZ.
Busek, E., 2000. “Regional Cooperation: Lessons for the Caspian Sea” in Ascher, William and Natalia Mirovitskaya, eds. The Caspian Sea: A Quest for Security, NATO Science Series. Klewer Academic Publishers, Dordrecht, Boston, and London.
Caspian Center for Pollution Control, 2000. Summary Report of The Caspian Centre for Pollution Control. Tacis Project of the Caspian Environment Programme, Baku, AZ, 45 pp.
Caspian Environment Programme, 2001. Report of the First Meeting of the CEP Regional Mnemiopsis Advisory Group, Baku, AZ, 3-4 December 2001, 7 pp. + 8 attachments.
Caspian Environment Working Group. Framework for Environmental Assistance to the Caspian Sea Region, 2001-2004. Caspian Environment Programme, Baku, AZ.
Caspian National Thematic Center on Emergency Response, 2001. Report on acquisition of information needed related to sensitive areas as part of national and regional Action Plan on Oil Spill Response. Ministry of Natural Resources and Environment Protection of the Republic of Kazakhstan. Committee on the Caspian Sea and Oil and Gas Production NEC SD of the Republic of Kazakhstan. Kokshetau, KZ.
Caspian Regional Thematic Center for Integrated Transboundary Coastal Area Management Planning, 2001. Caspian Coastal Regional Profile (Draft). Caspian Environment Programme, Baku, AZ.
Caspian Regional Thematic Center for Legal, Regulatory, and Economic Issues, 2001. Economic Instruments for Solving Environmental Problems of the Caspian Sea. Caspian Environment Programme, Baku, AZ.
Caspian Regional Thematic Center on MB, 2001. Report on the results of the Caspian Marine Expedition. Tacis, Caspian Environment Programme, Baku, AZ, 157 pp. + two appendices and maps.
Caspian Regional Thematic Center on Pollution Control, 2001. Environmental Management in the Caspian Oil Industry. Tacis, Caspian Environment Programme, Baku, AZ, 27 pp.
Caspian Regional Thematic Center for Water Level Fluctuation, 2001. Modeling Framework. Caspian Environment Programme, Baku, AZ.
Charalambous, A., 2001. End of Mission Report. Tacis, Caspian Environment Programme CRTC PC, Baku, AZ, 49 pp.
Convention on International Trade in Endangered Species of Wild Fauna and Flora,,2000. Sixteenth Meeting of the CITES Animals Committee, Shepherdstown, USA, 11-15 December 2000. Implementation of Resolution Conf. 8.9 (Rev.) – Acipenseriformes.
De Mora, S., J.P. Villeneuve, and E. Wyse, 2001. Interpretation of Caspian Sea Sediment Data – ASTP Phase 2 (Iran). Preliminary Report. International Atomic Energy Agency, Marine Environmental Laboratory. Monaco.
De Mora, S. and M.R. Sheikholeslami, 2002. ASTP: Contaminant Screening Programme, Final Report: Interpretation of Caspian Sea Sediment Data. Caspian Environment Programme, CRTC ERACL, Baku, AZ, 27 pp. + figures and tables.
Dickson, M.W., 1997. Marine Aquaculture and Aquaculture Feeds in Turkmenistan. Agri-Livestock consultants Ltd/ Landell Mills Ltd. Prepared for European Commission, Project # FDTU 9502, Technical Assistance in the Fisheries Sector, Turkmenistan.
Dumont, H., 1995. Ecocide in the Caspian Sea. Nature 377: 673-674.
Dumont, H. J., 1998. The Caspian Lake: History, biota, structure, and function. Limnol. Oceanogr., 43 (1), p.44-52.
Environment & Resource Technology, Ltd., 1997. NE Caspian Sea pre-drilling environmental baseline survey, 1996. Final Report. ERT 96/053. Prepared for AGRA Earth & Environmental Limited (for Caspian Sea Consortium and the Kazakstan CaspiShelf Joint Stock Company). Edinburgh, Scotland.
Environment & Resource Technology, Ltd., 1998. OKIOC, Kashagan West, East, and Beautino Environmental Surveys. Prepared for Shell Kazakhstan Development BV. South Queensferry.
Environment & Resource Technology, Ltd., 1999. Kashagan East Post-Berm Construction Monitoring Report – Winter 1998. Prepared for OKIOC. Edinburgh, Scotland.
Environmental Resources Management, 1999. Dragon Oil Block II Field Development Project: Environmental Impact Assessment, London.
ERT Caspian, 1998. Shah Deniz Exploration Project - Environmental Impact Assessment. Final Report.
ERT Caspian, 2000. Inam Exploration Drilling Environmental Impact Assessment – Final Version.
EU/Tacis, 2000. Monitoring and Information Exchange Under the Caspian Marine Convention. Caspian Environment Programme, Baku, AZ.
Farshchi, P., 2001. Meeting Summary of National Transboundary Diagnostic Analysis, National Caspian Action Plan, and National Core Group, Tehran, I.R. Iran, 26-28 May 2001. Tehran. Caspian Environment Programme, Baku, AZ.
Gajiyev, N. E., 2001. Report on Ecological Audit of Flooded Wells. (Azerbaijan Sector of the Caspian Sea.) Caspian Environment Programme, Baku, AZ.
GESAMP (IMO/FAO/UNESCO-IOC/WMO/WHO/IAEA/UN/UNEP Joint Group on Experts on the Scientific Aspects of Marine Environmental Protection), 1997. Opportunistic settlers and the problem of the ctenophore Mnemiopsis leidyi invasion in the Black Sea. Rep. Stud. GESAMP, (58):84pp.
Gistov, A.P, 1996. Environmental Studies of the Background State of Birds and the Caspian Seal in the Northern Part of the Caspian Sea (Spring 1996). Kazakhstankaspiishelf Consortium. Almaty, KZ.
Glantz, M.H. and I.S. Zonn (eds.), 1997. Scientific, Environmental, and Political Issues in the Circum-Caspian Region. NATO ASI Series. Kluwer Academic Publishers, Dordrecht/Boston/London.
Global Environment Facility (GEF), 1998. United Nations Development Programme, Project Development Facility (PDF-B), Caspian Environment Programme, Caspian Transboundary Diagnostic Analysis Framework. New York, New York, USA.
Inland Water Resources and Aquaculture Service, FAO, 1997. Review of the State of World Aquaculture. Report FAO Fisheries Circular Number 886 (Rev. 1), Food and Agriculture Organization of the United Nations (FAO), Rome, 145 pp.
I.R. Iran, 1974. The Environmental Protection and Enhancement Act of 1974. Department of Environment, Tehran, I.R. Iran.
I.R. Iran, 1998. National Report Iran. Caspian Environment Programme, Baku, AZ.
I.R. Iran, 2000. Assessment of Deforestation Impact on Biodiversity of Caspian Coastal Area in I.R. Iran (Draft).
I.R. Iran, 2001. Habitat and Biodiversity of Caspian Sea. Caspian Environment Programme, Baku, AZ.
I.R. Iran, 2001. National Coastal Profile. Caspian Environment Programme, Baku, AZ.
I.R. Iran, 2001. Socio- Economic Report - Iran. Caspian Environment Programme, Baku, AZ.
Ivanov, V.P. and D.N. Katunin, 2001. Report on the Results of the Caspian Marine Expedition. Tacis, Caspian Environment Programme, Baku, AZ.
IWACO, 1999. Baku Bay Gulf Oil Pollution, Project Azerbaijan. Component 1: Phase 1 Report – Baseline Survey. Prepared for Republic of Azerbaijan and Ministry of Economic Affairs, Government of the Netherlands.
IWACO, 2000. Baku Bay Gulf Oil Pollution, Project Azerbaijan. Component 1: Baku Bay Cleanup – Future Steps. Prepared for Republic of Azerbaijan and Ministry of Economic Affairs, Government of the Netherlands.
IWACO, 2001. Integrated Water Resources Management Plan, Crash Program for one year of surface water quality monitoring. Final Report. Prepared for The World Bank. Rotterdam.
Kelleher, K., 2000. Proposal for a Management System for the Transboundary Fishery Resources of the Caspian Sea, TACIS (Caspian Environment Programme), Baku, AZ. 75pp.
Kajiwara, N., S. Nimi, M. Waatanabe, Y. Ito, S. Takahashi, S. Tanabe, L.S. Khuraskin, N. Miyazaki, 2001. Organochloride and organotin compounds in Caspian seals (Phoca caspica) collected during an unusual mortality event in the Caspian Sea in 2000. ECOTOX Report, Caspian Environment Programme, Baku, AZ.
Kaplin, P., 1997. Geo-ecological changes resulting from changes in Caspian Sea levels. Report number 1, Moscow State University, Russian Federation.
Kasymov, A.G., 1994. Ecology of the Caspian Sea. Baku, AZ.
Kazakhstan, 2000. National report of the Republic of Kazakhstan on Integrated Coastal management. Caspian Environment Programme, Baku, AZ.
KazNIRKH, 2001. Caspian Flora and Fauna Species Checklist. Caspian Environment Programme, Baku, AZ.
Kobegenova, S.S., 1996. Report on the Subject of “Studies of the Background State of the Environment in the Northeast Caspian – Pathomorphological Analysis of the Reproductive System, Liver, and Muscles of fish of the Northeast Caspian” Section. Al-Farabi Kazakh state National University. Almaty, KZ.
Kosarev, A.N. and E.A. Yablonskaya, 1994. The Caspian Sea. SPB Academic Publishing. The Hague, 259 pp.
Krasnova, I., 2001. Legal, Regulatory, and Institutional Measures for the Protection and Sustainable Management of the Caspian Sea Ecosystem in the Riparian States. Caspian Environment Programme, Baku, AZ.
Krivitskii, S.V., 1996. Evaluation of the Size and Sitling of Approach Channels in the Three Regions of the Northeast Caspian. The Oceanography Society of Russia. The Commercial Ecology and Coastal Engineering Scientific and Technical Center. Moscow, RF.
Kvaerner Environmental Ltd., 2001. Kalamakas pre-operational environmental surveys, May 1996-October 2000. Prepared for OKIOC, Almaty, Kazakhstan.
Kvaerner Environmental Ltd., 2001. Kashagan East post-drill environmental monitoring survey, September 2000. Prepared for OKIOC, Almaty, Kazakhstan.
Mahmudov, R.H., 2001. Rapid Assessment of Pollution Load from Point Sources in Azerbaijan, Kazakhstan, Russia, and Turkmenistan. Caspian Environment Programme, Baku, AZ.
Mason, P., 2002. An Economic Analysis of the Problems of the Sturgeon Depletion in the Caspian Sea. Prepared for Environmental Valuation Workshop. Caspian Environment Programme, Baku, AZ.
Matthews, M.M. and D.G. Aubrey, draft. Corporate citizenry in the Caspian Sea: Is the oil industry greening up its act?
Mekhtiev, A.S. and A.K. Gul, 1997. “Ecological Problems of the Caspian Sea and Perspectives on Possible Solutions.” . 3-10 M.H. Glantz and I.S. Zonn Eds. Scientific, Environmental and Political Issues in the Circum-Caspian Region. NATO ASI Series. Klewer Academic Publishers, Dordretch/Boston/London. pp. 79-95.
Mel’nikov, V.A., 1996. Environmental Studies of the Background State of the Environment in the North Caspian –Ichthyology Section (Spring 1996). Kazkah Scientific Research Institute of the Fishing Industry. Almaty, KZ.
Mikhailichenko, Y.G., V.N. Mikhailov, B.N. Morozov, Y.G Puzachenko, G.K. Voyolovsky, EB. Gabunshina, E.B. Grigoriev, 2001. Caspian Coastal Profile Within Russian Federation. Caspian Environment Programme, Baku, AZ.
Minister for Ecology and Natural Resources of the Republic of Kazakstan, 1998. National Report of the Republic of Kazakhstan for PDF-B Phase. Caspian Environment Programme, Baku, AZ.
Ministry of Natural Resources and Environmental Protection of the Republic of Kazakhstan, 1999. National Environmental Action Plan for Sustainable Development of the Republic of Kazakhstan. Almaty, KZ.
Ministry of Natural Resources Use and the Environment Protection of Turkmenistan, 1998. National Report for the PDF-B Phase. Caspian Environment Programme, Baku, AZ.
Mirkoo, N., 2001. Agrochemical Application in Iranian Caspian Area. Caspian Environment Programme, Baku, AZ.
Mitrofanov, I.V., 2001. Review and evaluation of impact on fauna of invertebrates, fish, birds, and marine mammals of Kazakhstan part of the Caspian Sea by heavy metals, pesticides, and hydrocarbons. Caspian Environment Program, Baku, AZ, 36 pp.
Mitrofanov, V., ed., 2001. Kazakhstan Action Plan Conservation of Caspian Sea Habitats. Caspian Environment Program, Baku.
Moscow State University, 2001. Assessment of the Impact of the Major River Impoundments on the Long-term Health of the Deltas in the Caspian Sea Region. Caspian Environment Program, Baku, AZ.
Nezami, Shaban A., Ahmad Savari, Mahyar Sakari, and Mohamad Alizadeh, 2000. National Report – Biodiversity in the Caspian Coastal Zone. Caspian Environment Programme, Baku, AZ.
Offshore Kazakhstan International Operating Company (OKIOC), 1997. North Caspian Sea Pre-Drilling Environmental Baseline Survey, May 1996 – Final Report. Prepared for Ministry of Ecology and Bioresources of the Republic of Kazakhstan.
Ogar, N.P., 1996. Environmental Studies of the Background State of the Environment in the North Caspian –Flora and Vegetation Section (Spring 1996). Almaty, KZ.
Ogar, N.P., 2002. Regional Action Plan for Protection of Caspian Habitats. Caspian Environment Programme, Baku, Azerbaijan.
Oguz Operating Company, 2000. Oguz Contract Area Exploration Drilling Environmental Impact Assessment.
Organization for Economic Co-operation and Development, 1999. Environmental Performance Reviews – Russian Federation. Paris, France.
Panin, G. N., 2000. Further Caspian Sea Evaporation Studies. Caspian Environment Programme, Baku, Azerbaijan.
Puzachenko, Y., (ed.), 2000. Status of Protection of the Biodiversity of the Caspian Sea. National Report of Russian Federation. Center for International Projects. Caspian Environment Programme, Baku, Azerbaijan.
Rakhmatullina, L.T., 1996. Phytoplankton of the Northern Part of the Caspian Sea (May-June 1996.) Almaty, KZ.
Raymakers, C., 2001. Study on the Social and Economic Aspects of Illegal Fishing in the Caspian Sea. Interim Report. Caspian Environment Programme, Baku, Azerbaijan.
Romanov, A.A. and Y.V. Altufiev, 1990. “Tumors in gonads and livers of Caspian Sea sturgeons.” Journal of Ichthyology. 30:44-49.
Sablina, O. and D. Leavitt, 1997. An investigation into the potential of using heat shock protein 70 as an indicator of physiological stress in the Zebra mussel (Dreissena polymorpha) from the Northeast Caspian Sea. Final Technical Report prepared for Mobil Foundation Kazakhstan Training Program at the Woods Hole Oceanographic Institution, WHOI, Woods Hole, MA.
Salmanov, M.A., 1987. The Role of Microflora and Phytoplankton in the Production Processes of the Caspian. М.: Nauka. P.214.
Salmanov, M.A. 1999. Ecology and biological productivity of the Caspian Sea. Institute of Zoology, Baku, AZ. 398pp.
Schrader, F., 2001. Caspian Sea Potential Inundation and Impacts on Human and Natural Environment. Caspian Environment Programme, Baku, AZ, 39 pp.
Shamuradov, A., (ed.), 2000. National Biodiversity Report of Turkmenistan part of the Caspian Sea. Ministry of Environmental Protection. Caspian Environment Programme, Baku, AZ.
Sharapova, L.I., 1996. Environmental Studies of the Background State of the Environment in the North Caspian – Zooplankton Section (Spring 1996). Kazakh Scientific Research Institute of the Fishing Industry. Almaty, KZ.
Shaw, B., T. Paluszkiewicz, S. Thomas, A. Drum, P. Becker, L. Hibler, and C. Knutson, 1998. Environmental Baseline Analysis of the Caspian Sea Region. Prepared for the U.S. Department of Energy, Pacific Northwest National Laboratory, Richland, Washington, USA.
Shell Corporation, 2001. Appendices for the Transboundary Diagnostic Analysis to be Performed by each National Oil Spills Work Group by April 2001.
Shilo, N. A., 1989. Causes of Fluctuations in the Level of the Caspian Sea. Doklady Akademii Nauk SSSR 305(2): 412-416. (translated from Russian).
Sievers, E.W, 2000a. “How NGOs Abandoned Governance in the Caspian Region.” in Ascher, William and Natalia Mirovitskaya, eds. The Caspian Sea: A Quest for Security: NATO Science Series. Klewer Academic Publishers, Dordrecht, Boston, London. pp. 219 - 234.
Sievers, E.W, 2000b. “Caspian Environmental Programme: Prospects for Regime Formation and Effectiveness.” in Ascher, William and Natalia Mirovitskaya, eds.,The Caspian Sea: A Quest for Security. NATO Science Series. Klewer Academic Publishers, Dordrecht, Boston, London. pp.327 - 345.
Speer, L., L. Lauck, E. Pikitch, S. Boa, L. Dropkin, and V. Spruill, 2000. Roe to Ruin: the Decline of Sturgeon in the Caspian Sea and the Road to Recovery. (National Resources Defense Council, Wildlife Conservation Society, and SeaWeb).
State Committee of the Russian Federation for Environmental Protection and Hydrometerology, 1998. Environmental Problems of the Caspian Region – National Report of the Russian Federation for the PDF-B Phase. Caspian Environment Programme, Baku, AZ.
Stygar, V.M., 1996. Zoobenthos of the Easter Part of the North Caspian Sea (17 May-3 June 1996.) All-Union Scientific Research Institute of Marine Fishing Industry and Oceanography (VNIRO) Moscow, RF.
Tacis, 1998. Review of Hydrometeorological Data Collecting Stations Adjacent to the Caspian Sea. Caspian Environment Programme, Baku, AZ.
Tacis, 1999. Caspian Sea Monthly Water Balance Studies. Caspian Environment Programme, Baku, AZ.
Tacis, 2000. Assessment of Data Availability of Ambient Monitoring Data of Sea and Rivers. Caspian Environment Programme, Baku, AZ.
Tacis, 2000. Assessment of Pollution Control Measures - Azerbaijan. Caspian Environment Programme, Baku, AZ.
Tacis, 2000. Assessment of Pollution Control Measures - Kazakhstan. Caspian Environment Programme, Baku, AZ.
Tacis, 2000. Assessment of Pollution Control Measures – Turkmenistan. Caspian Environment Programme, Baku, AZ.
Tacis, 2000. Data Collection Scheme, Pollution Load Database, and GIS Development. Caspian Environment Programme, Baku, AZ.
Tacis, 2000. Draft Preliminary Transboundary Diagnostic Analysis. Caspian Environment Programme, Baku, AZ.
Tacis, 2000. Design of a Decision Support System for the Caspian Sea. Caspian Environment Programme, Baku, AZ.
Tacis, 2000. Industrial Survey. Part II: Pollution Loads and Assessment of Environmental Performance and Pollution Prevention Measures. Caspian Environment Programme, Baku, AZ.
Tacis, 2000. Main Results of the Study of the CRTC for “Combating Desertification” Phase 1 Evaluation and Mapping of Desertification Processes. Caspian Environment Programme, Baku, AZ.
Tacis, 2000. Municipal Wastewater – Load Inventory and Abatement Scenarios. Caspian Environment Programme, Baku, AZ.
Tacis, 2000. Oil Contamination of the Caspian Sea. Caspian Environment Programme, Baku, AZ.
Tacis, 2000. Pollution Load Industry of the Caspian Sea: A Demonstration of the Decision Support System. Caspian Environment Programme, Baku, AZ.
Tacis, 2000. Summary Report of the Caspian Centre for Pollution Control. Caspian Environment Programme, Baku, AZ.
Tacis, 2001. Bibi-Heyat Oil Field Restructuring and Remediation Project Identification (Draft). Project sponsored by SOCAR. Azerbaijan. Caspian Environment Programme, Baku, AZ.
Tacis, 2001. State and Challenges of the Marine and Coastal Environment of the Caspian Sea (Transboundary Diagnostic Analysis.) Caspian Environment Programme, Baku, AZ.
Tacis and The Caspian Scientific and Research Institute of Fishery (KASPNIRKH), 2000. Transboundary Diagnostic Analysis of Relevantly Important Commerical Bioresources. Caspian Environment Programme, Baku, AZ.
Tagiev, R. (ed.), 2000. Biological Diversity of the Azerbaijan Sector of the Caspian Sea. Caspian Environment Programme, Baku, AZ.
Tagiev, R. (ed.), 2001. Caspian Habitats Action Plan – Azerbaijan. Caspian Environment Programme, Baku, AZ.
Turkmenistan, 2001. Caspian Habitats Action Plan – Turkmenistan. Caspian Environment Programme, Baku, AZ.
Turkmenistan, 2001. Socio- Economic Review - Turkmenistan. Caspian Environment Programme, Baku, AZ.
Turkmenistan, 2001. The Summary of the Meeting on National TDA, 13-14 March, 2001, Ashgabat, Turkmenistan. Caspian Environment Programme, Baku, AZ.
Turkmenistan National Coastal Profile, 2001. Overall Planning of Transboundary Coastal Zone Management. Caspian Environment Programme, Baku, AZ.
Tzhilkin, V., 2001. Hydrochemical properties of water and sediments in the Caspian Sea 1978-1999. Caspian Environment Programme, Baku, AZ.
United Nations. Economic Commission for Europe. Committee on Environmental Policy. 2000. Environmental Performance Reviews – Kazakhstan. Environmental Performance Reviews Series No. 8. United Nations Publications. New York and Geneva.
UNIDO, 1998. Project for the Governments of Azerbaijan, Kazakhstan, Iran, Russia, and Turkmenistan. Program for the Protection of the Caspian from Industrial Pollution (Review of Ecological Problems). Vienna, Austria.
Vaisman, A. and Raymakers, C., 2001. The Status of Sturgeon Resources in Russia. TRAFFIC Bulletin Vol 19, 1: 33-43.
Villeneuve, Jean-Pierre, 2001. Caspian Sea 2000 - Phase 2. Contaminant Screening in Sediment Samples. Samples collected from Caspian Sea, Iranian Coast, 14-22 March 2000. International Atomic Energy Agency, Marine Environmental Laboratory Report. Monaco.
Watters, Kate. 2000. “Environment and the Development of Civil Society in the Caspian Region: The Role of NGOs.” in Ascher, William and Natalia Mirovitskaya, eds. The Caspian Sea: A Quest for Security. NATO Science Series. Klewer Academic Publishers, Dordrecht, Boston, London. pp. 203 - 218.
Winkels, H.F., S.B. Kroonenberg, M.Y. Lychagin, G. Marin, G.V. Rusakov, and N.S. Kasimov, 1998. Geochronology of priority pollutants in sedimentation zones of the Volga and Danube delta in comparison with the Rhine delta. Applied Geochemistry, v. 13, no 5, p. 581-591.
Woods Hole Group, Inc., 1999. Caspian Comparative Risk Assessment for Oil and Gas Development - Environmental Issues Related to the Oil and Gas Development in the Caspian Sea. Prepared for Abt Associates, Inc. East Falmouth, MA USA
World Federation of Scientists, Permanent Monitoring Panel on Pollution, 2001. Workshop Report on Environmental Pollution in the Caspian Sea, Ettore Majorana Centre, Erice, Italy, 24-25 August 2001.
Zonn, I.S., 2000. “Ecological Consequences of Oil and Gas Development.” in Ascher, William and Natalia Mirovitskaya, eds. The Caspian Sea: A Quest for Security. NATO Science Series. Klewer Academic Publishers, Dordrecht, Boston, London.
Zonn, I.S., 1997. “Assessment of the State of the Caspian Sea.” in M.H. Glantz and I.S. Zonn Eds. Scientific, Environmental and Political Issues in the Circum-Caspian Region. NATO ASI Series. Klewer Academic Publishers, Dordrecht, Boston, London. pp. 27-39.