HELCOM news
4 / 2 0 0 5 N e w s l e t t e r
Special issue:
The health of the Baltic Sea
Ł Eutrophication still a widespread and persistent problem, page 5
Ł More action still needed on hazardous substances, page 11
Ł Habitats and biodiversity at risk, page 14
Ł Increasingly crowded shipping lanes, page 15

HELCOM
3/2005
Newsletter
Contents
Foreword by the Executive Secretary, page 2
The health of the Baltic Sea
Summary, page 3
Eutrophication still a widespread and persistent
problem, page 5
Ł Inputs of nutrients
This is a special issue of the Helsinki
Ł Airborne nitrogen
Commission's newsletter, featuring
Ł Waterborne inputs
an overview of current trends in the
Ł Transboundary pollution loads
Baltic marine environment. The arti-
Ł Long-term trends in nutrient inputs
cles are based on the latest HELCOM
Ł Impacts of nutrient inputs
assessments, which form the back-
bone of the Commission's work pro-
More action still needed on hazardous substances,
viding objective information on the
page 11
health of the Baltic Sea, and helping
Ł Inputs of hazardous substances
to defi ne the need for further envi-
Ł Airborne inputs
ronmental actions.
Ł Waterborne inputs
Ł Transboundary pollution
This overview provides a quick
Ł Long-term trends in inputs of hazardous substances
insight into the environmental
Ł Impacts of hazardous substances
issues affecting the Baltic Sea today,
while also serving as a useful foun-
Habitats and biodiversity at risk, page 14
dation for a wider study of the Baltic
Ł Natural sensitivity and human threats
marine environment.
Ł Impacts
Ł Trends
The scientifi c data contained in
this issue of HELCOM News was
Increasingly crowded shipping lanes, page 15
presented at the Baltic Sea Infor-
Ł Impacts of shipping
mal Meeting for Ministers of the
Ł Illegal discharges
Environment, which took place on
Ł Accidents
23rd November 2005 in Stockholm,
Ł Air pollution from shipping
Sweden.
Ł Non-native species
Anne Christine Brusendorff
Ł Impacts
Executive Secretary
HELCOM NEWS 4/2005
Published by: Helsinki Commission
Katajanokanlaituri 6 B
FI-00160 Helsinki, Finland
E-mail: info@helcom.fi
Web: http://www.helcom.fi
Editor: Nikolay Vlasov,
Helsinki Commission
Language revision: Fran Weaver
Design and layout: Leena Nõrhi
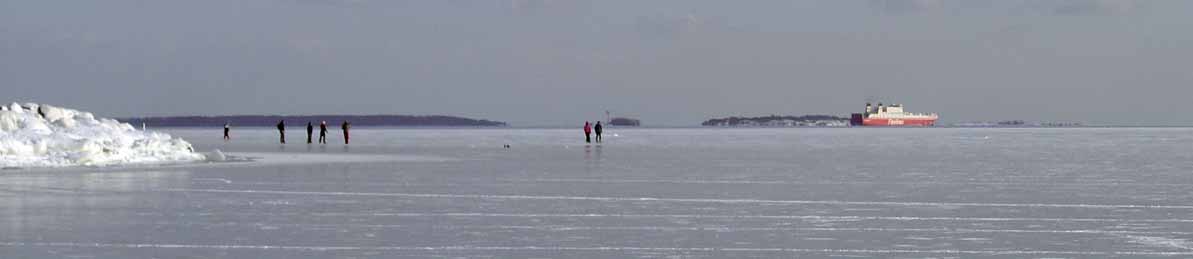
Photo: Kaj Granholm
Cover photos: HELCOM
2
The health of the Baltic Sea
Summary
The Baltic Sea is impacted by
many human act ivities and the
widespread use of its natural
resources. This overview focuses
on the four main areas of
concern defi ned by HELCOM:
eutrophication, hazardous
substances, shipping, and the
loss of biodiversity and habitats.
As the environmental focal point of
the Baltic Sea, the Helsinki Commission
- HELCOM - has been assessing the
sources and inputs of nutrients and
hazardous substances and their effects
on marine ecosystems for almost 30
years. The resulting reports are unique
compilations of data and analyses
based on wide-ranging scientifi c
research carried out around the Baltic
Sea, including special monitoring pro-
grammes co-ordinated by HELCOM.
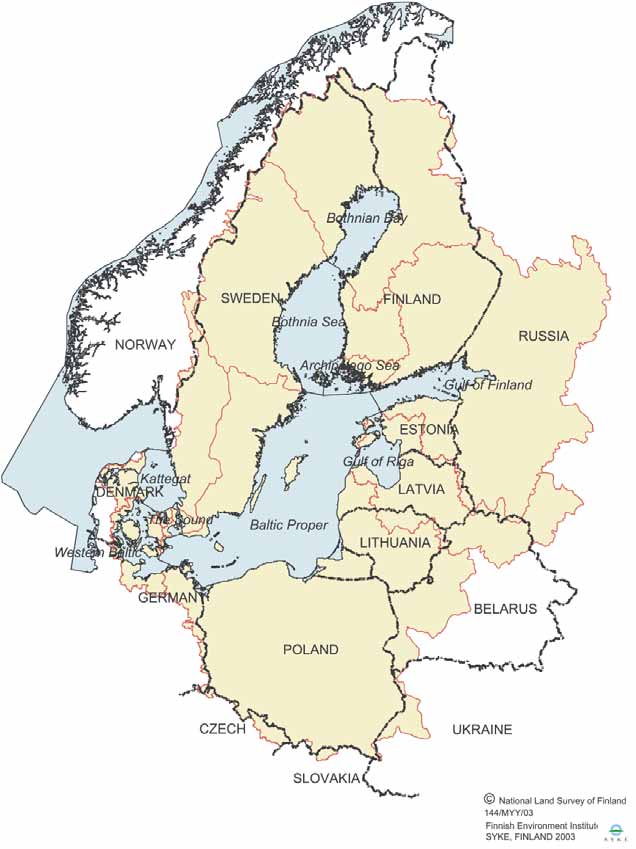
The Baltic Sea, as one of the world's
largest bodies of brackish water, is
ecologically unique. Due to its special
geographical, climatological, and ocea-
nographic characteristics, the Baltic Sea
is highly sensitive to the environmental
impacts of human activities in its catch-
ment area, which is about four times
larger than the sea area itself, and is
clear-water sea into a eutrophic
algal blooms have become more
home to some 85 million people.
marine environment. Nitrogen inputs
common, and oxygen depletion has
have more than doubled, and phos-
considerably worsened, leading to
The Baltic Sea is only connected to
phorus inputs are on average over
increased internal nutrient loading.
the world's oceans by the narrow
three times higher than about one
Biodiversity and fi sh stocks have also
and shallow waters of the Sound and
century ago. Agriculture currently
been seriously affected.
the Belt Sea. This greatly limits the
accounts for the majority of water-
exchange of water with the North Sea,
borne and airborne nutrient inputs.
The loads of some hazardous sub-
and means that water may remain in
stances entering the Baltic Sea have
the Baltic for up to 30 years, together
As a result, eutrophication is an issue
been reduced considerably over the
with any pollutants it contains.
of major concern almost everywhere
past 20 to 30 years. But their concen-
around the Baltic Sea. Average
trations in the Baltic are still up to 20
Since the 1800s, the Baltic Sea has
biomass production has increased by
times higher than in the North Atlantic.
changed from a pristine oligotrophic
a factor of 2.5, exceptionally intense
Where heavy metals are concerned,
3
Photo: Sergey Vlasov
the best news is the clear decrease
are to some degree threatened today,
emissions, the introduction of non-
in lead concentrations in herring
and many of these areas are impor-
native species in discharged ballast
observed in most areas. Concentra-
tant habitats for rare or endangered
water, and spills due to accidents.
tions of several organic pollutants in
species.
marine ecosystems declined in the
On the brighter side, signs of the
1980s, but this decrease levelled off
Present commercial fi shing practices
success of HELCOM's environmental
in the 1990s. Dioxin levels in fi sh still
have environmental impacts through-
programmes and nature conservation
exceed the new EU food safety limits
out the Baltic Sea, affecting species
measures include steady increases in
in some areas, particularly further
caught accidentally as by-catches, as
the populations of top predators such
north.
well as the stocks of commercially
as the white-tailed eagle and the Bal-
exploited species.
tic's three seal species.
Several Baltic Sea species and habitats
are declining or endangered. As much
Major impacts of shipping on the
as 90% of the marine and coastal
marine environment include pollution
biotopes around the Baltic Sea area
by ship-generated waste, airborne
4
Eutrophication still a
These fi gures include inputs from
Waterborne inputs
widespread and persistent
natural background sources as well as
Waterborne inputs encompass inputs
problem
anthropogenic sources.
entering the sea in rivers as well as
emissions from point sources discharg-
Inputs of nutrients
Airborne nitrogen
ing directly into the sea. Riverine
The total annual input of nitrogen
The atmospheric deposition entering
inputs include contributions from parts
entering the Baltic Sea amounts to
the Baltic Sea originates from emission
of the Baltic Sea catchment area which
some 1 009 700 tonnes, of which
sources both inside and outside the
lie outside the HELCOM countries.
25% consists of atmospheric deposi-
Baltic's own catchment area.
tion, and 75% of waterborne inputs.
Agriculture and forestry contribute
Nitrogen compounds are emitted into
almost 60% and 50% of the water-
The total annual input of phospho-
the atmosphere as nitrogen oxides and
borne nitrogen and phosphorus inputs
rus entering the Baltic Sea is about
ammonia. Shipping, road transport
to the sea, respectively. For nitrogen,
34 500 tonnes. Phosphorus enters
and combustion for energy are the
28% originates from natural back-
the Baltic Sea mainly as waterborne
main sources for emissions of nitrogen
ground sources and 13% from point
inputs, and the contribution of
oxides (see diagram below). Agricul-
sources. Point sources and natural
atmospheric deposition is only 1-5%
ture accounts for around 90% of all
background sources each contribute
of the total.
ammonia emissions in the HELCOM
approximately 25% of the phosphorus
countries, and about 40% of total
input to the Baltic Sea.
nitrogen emissions.
Other mobile sources
incl. shipping 14 %
14 %
Energy
com
29 bustion 29 %
Road
transport
Non-industrial
40 %
combustion 5 %
Combustion in
Com
manufacturing 11 %
Production
processes 1 %
Percentage of total emissions of nitrogen
Proportion of atmospheric deposition of
oxides (NOx) from different sectors in the
nitrogen entering the Baltic Sea by HELCOM
HELCOM Contracting Parties (EMEP 2004a)
contributor in 2000. The diagram shows that
more than one third of the total nitrogen
input originates from sources outside the
HELCOM Contracting States.
5

Proportions of waterborne inputs of nitrogen (left) and phosphorus (right) enter-
ing the Baltic Sea from the HELCOM countries in 2000. Figures include inputs from
natural background sources as well as anthropogenic sources.
Proportions of sources contributing to waterborne
Proportions of airborne and waterborne nitrogen
nitrogen input into the Baltic Sea sub-regions in 2000
inputs into the Baltic Sea sub-regions in 2000
6
Anthropogenic nutrient loads per
Anthropogenic nutrient loads per capita by country in 2000
capita by country are shown on the
right. The fi gures include discharges
16.00
0.80
from both diffuse and point sources,
14.00
0.70
but not natural background loads.
12.00
0.60
10.00
0.50
Transboundary
8.00
0.40
pollution loads
6.00
0.30
4.00
0.20
Signifi cant waterborne transboundary
2.00
Nitrogen load (kg/yr)
0.10
pollution loads fl ow from Belarus, the
0.00
0.00
Phosphorus load (kg/yr)
Czech Republic and Ukraine into the
k
ia
Baltic Sea.
land
many
Latv
Estonia Fin
Poland
Fin
Russia
Denmar
Ger
Lithuania
Sweden
Lithuania
Country
The total riverine loads of nitrogen and
Phosphorus
Nitrogen
phosphorus originating in these coun-
tries, measured at the borders, amount
to about 8% and 7% respectively
Long-term trends in
emissions from the HELCOM Contract-
of the total loads measured at river
nutrient inputs
ing Parties. On the other hand, deposi-
mouths along the Baltic Sea coast. The
Compared to the pristine conditions
tion levels have only declined by some
signifi cance of these transboundary
that prevailed in the Baltic Sea two
15% during the same time period. This
pollution loads in sub-catchments of
centuries ago, nitrogen inputs have
because deposition rates are highly
certain rivers are naturally higher. Com-
more than doubled, and phosphorus
dependent on meteorological condi-
pared to loads at the river mouths, the
inputs are on average more than three
tions, which change from year to year,
transboundary pollution loads for nitro-
times higher. According to HELCOM
meaning that reductions in nitrogen
gen and phosphorus respectively are
assessment, these inputs are slowly
emissions do not necessarily lead to
31% and 56% for the River Nemunas;
decreasing, however.
corresponding reductions in deposition.
63% and 60% for the Daugava; 5%
and 5% for the Vistula; and 16% and
Since 1980 there has been a reduction
Progress in reducing waterborne nutri-
14% for the Oder, without taking into
of approximately 40% in total nitrogen
ent discharges from point sources such
account riverine retention.
The same countries are also signifi cant
sources for airborne nitrogen deposited
into the Baltic Sea. The Czech Republic
is the 11th largest depositor of nitrogen
into the Baltic Sea - accounting for
higher contributions than Finland or
Russia. Ukraine and Belarus rank 15th
and 16th on the list of the most signifi -
cant contributors, meaning that their
inputs exceed the levels of airborne
nitrogen coming from Estonia, Latvia or
Lithuania into the Baltic Sea.
Photo: Tadas Navickas
7
3500
0 00
0
3000
0 00
0
2500
0 00
0
2000
0 00
0
1500
0 00
0
1000
0 00
0
50000
0
85 00
0
1985
85 00
1985
2000
2
19852000
1985
19 20
2000
2
19852000
2
k
k 2000
2000
19852000
19 20
2000
1985
19852000
k 2000
1985
k 2000
k
1985200
ar
ar
a 1985
ar
a 1
ar
a
ar
via 1985
and
via
and
vi
and
v via
vi
v
toni
t
t
oni onia
and
any any
tonia
t
Lat Lat
huania
huania
Es Es
Finl
Fi
F Finland
huania
Finland
Fi
Poland
Po
P
Poland
edeneden
Poland
eden
Poland
Po
Denm
Russia 1985
Russia
Russi
Russ Russia 2000
Denm
Russia
Denm
Russi
Denm
Russ
Denm
Es Es
FinlFinland
Denm
D
Germ
Ger
Ge
G Germ
Ger
Ge
G
Lit Lit
Sw
S
Sw
S
Poi
Po n
i t
n so
s u
o rce
u
Agri
Ag c
ri u
c l
u t
l ur
u e
r
Nitrogen inputs from point sources and agriculture within the Baltic Sea
catchment area by HELCOM countries in 1985 and in 2000
Phosphorus inputs from point sources and agriculture within the Baltic Sea
catchment area by HELCOM countries in 1985 and in 2000
8
as municipal and industrial wastewa-
Impacts of nutrient inputs
Eutrophication remains an issue of
ter treatment plants has been good,
Since the 1800s, the Baltic Sea has
major concern almost everywhere
with the 50% reduction target for
changed from an oligotrophic clear-
around the Baltic Sea. The problems
phosphorus achieved by almost all the
water sea into a eutrophic marine
described above have been recorded
HELCOM countries.
environment.
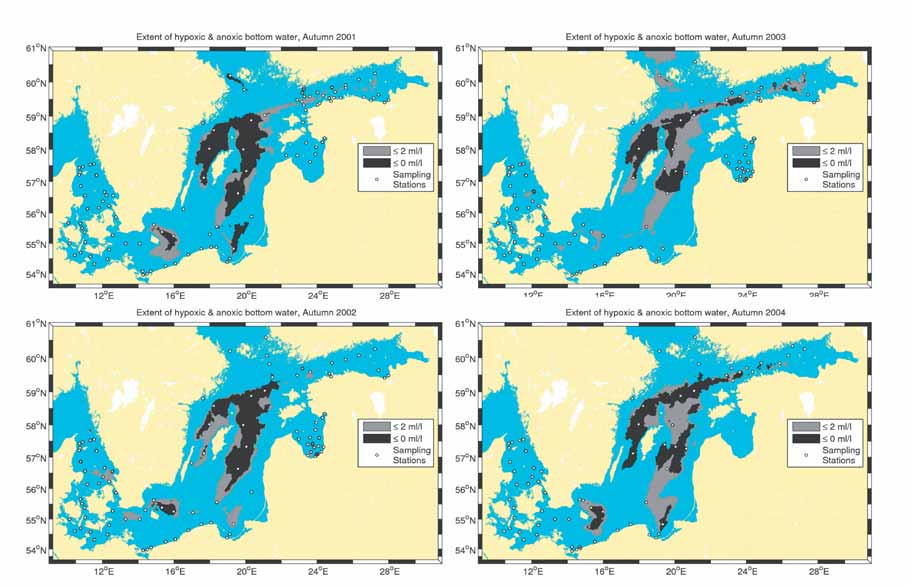
in both coastal waters and the open
sea. The maps below show the
Measures to reduce nutrient loads
Nitrogen and phosphorus are impor-
regional distributions of bottom areas
from agriculture, contrastingly, have
tant natural nutrients, which as such
with oxygen concentrations below the
fallen short of their aims, although this
do not pose any direct hazards to
critical level of 2 ml/l. The large salt-
is partly due to the fact that it can take
marine organisms. Where eutrophica-
water infl ows during 1993 and 1994
decades for such measures to achieve
tion occurs, however, aquatic ecosys-
oxygenated the bottom waters in the
their full effects. Furthermore, climatic
tems become burdened by excessively
Baltic Proper. However, due to the lack
conditions should also be taken into
high nutrient inputs, stimulating algal
of any further infl ow events and the
account when comparing fi gures for
growth, and leading to imbalances in
strong stratifi cation built up by the
agriculture from 1985 with 2000.
the functioning of ecosystems. Prob-
infl ows, oxygen levels decreased again
lems caused by eutrophication include:
due to the excessive sedimentation of
The overall reductions in discharges for
Ł intense algal growth: excessive fi la-
organic material in comparison to the
both phosphorus and nitrogen have
mentous algae and phytoplankton
amounts of oxygen transported into
been roughly 40% from all sources.
blooms
deep waters.
Ł production of excess organic matter
Ł increase in oxygen consumption
Ł oxygen depletion
Ł death of benthic organisms, including
fi sh
Extents of hypoxic and anoxic bottom water (oxygen content below 2 ml/l
and 0 ml respectively) observed annually in Autumn 2001 Ł 2004
9
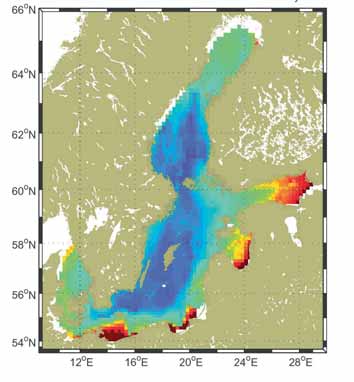

The map on the right shows how high
anoxia in the lower part of the water
winter concentrations of nutrients
column. This can in turn lead to the
in coastal waters (shown in red) are
widespread death of benthic organ-
mainly located where major rivers
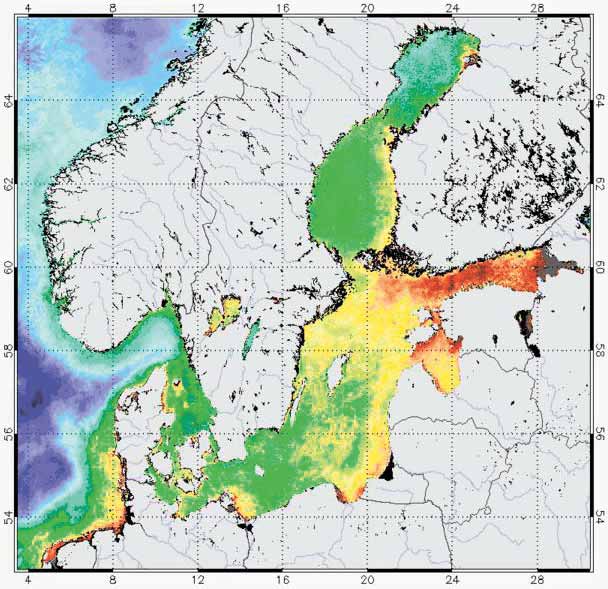
isms. The regional distribution of phy-
enter the Baltic Sea. Nutrient enrich-
toplankton growth shown in the map
ment of these waters stimulates the
below refl ects the related impacts as
growth of phytoplankton, leading, in
observed near the mouths of major
certain circumstances, to algal blooms
rivers during the summer months.
and subsequent sedimentation and
Mean winter surface concentra-
tions of dissolved inorganic nitro-
gen over the period 1996 Ł 2004,
showing high accumulations in
areas affected by major rivers
0
3
6
9
12
15
DIN ,umd/l
Chlorophyll-a map of the Baltic
Sea compiled from remote
sensing satellite data, showing
the regional distribution of phyto-
plankton, refl ecting the primary
impacts of the excess nutrient
inputs illustrated in the preceding
map
Chlorophyll concentration mg/m -3
Baltic Sea Chl-a 2002 July-August Mean
10
0.2
0.6
1.2
2.0
3.0
5.0
10.0
More action still needed on
Airborne inputs
energy production and waste incin-
hazardous substances
In 2002, total annual emissions by
eration in the HELCOM countries
Inputs of hazardous
the HELCOM countries amounted to
accounted for about 40-50% of the
substances
120 tonnes of cadmium, 65 tonnes of
total atmospheric deposition into the
The loads of some hazardous sub-
mercury, and 3,320 tonnes of lead.
Baltic Sea in 2002. Natural sources and
stances entering the Baltic Sea have
distant sources from outside the Baltic
been reduced considerably over
Deposition rates for cadmium and lead
Sea catchment area also contributed
the past 20 to 30 years. Discharges
show a decrease from south to north,
signifi cantly. By individual countries,
of heavy metals have particularly
due to the distance from the main
the most signifi cant depositions of
decreased, although no clear general
emission sources. The total annual
lead and cadmium originated from
trends have been observed for the con-
atmospheric deposition rates for heavy
sources in Poland, Germany, and
centrations of certain heavy metals in
metals entering the whole of the Baltic
Russia. For mercury, the largest contri-
marine biota since 1990.
Sea are over 7 tonnes for cadmium,
butions came from Germany, Poland,
3 tonnes for mercury, and about 149
and Denmark (see diagrams below).
Riverine inputs and direct discharges
tonnes for lead. The highest levels of
are the main sources of mercury
heavy metal deposition are experi-
(50%), lead (60-70%) and cadmium
enced in the Belt Sea sub-basin.
(75-85%). The remaining shares are
mainly accounted for by atmospheric
Anthropogenic emission sources of
deposition of these heavy metals.
heavy metals, such as industries,
Cadmium
Lead
Mercury
Main cadmium, lead, mercury emission sources contributing to deposition
over the entire Baltic Sea Basin in 2000. Other = all other European countries;
IND = indeterminate sources, incl. natural, previous and remote anthropo-
genic sources.
11
Waterborne inputs
The total reported riverine loads of
hazardous substances entering the
Baltic Sea, including direct discharges
from coastal areas, amounted to 7.3
tonnes of mercury, 285.8 tonnes of
lead and 8.1 tonnes of cadmium. The
riverine inputs of the heavy metals
cadmium, lead and copper are highest
in the Gulf of Finland, while mercury
inputs are highest in the Baltic Proper.
A few large rivers account for very
large proportions of the total riverine
heavy metal loads.
Transboundary pollution
Signifi cant transboundary pollution
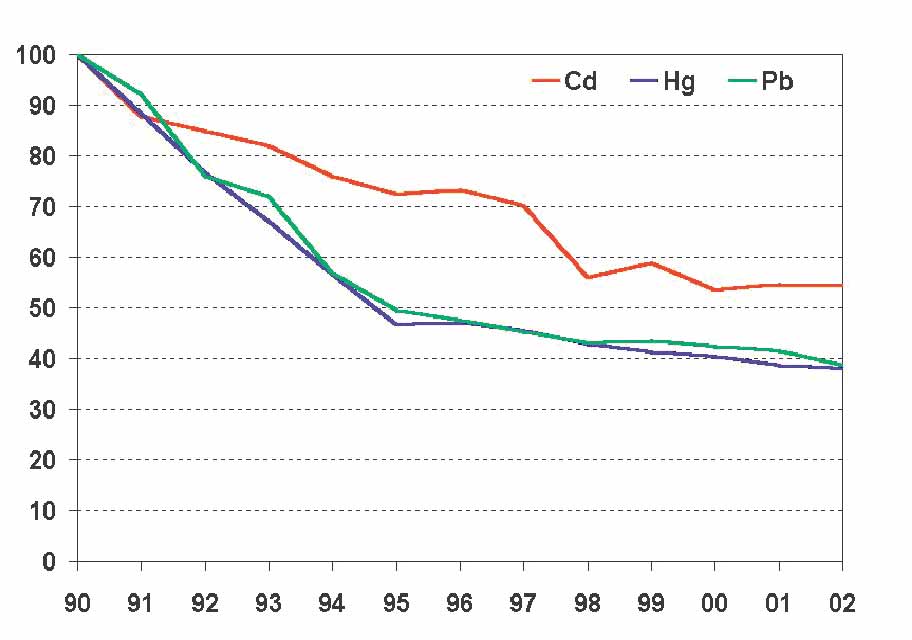
Total annual emissions of cadmium (Cd), mercury (Hg), and
loads of heavy metals originate from
lead (Pb) to air from HELCOM countries, 1990-2002 (as % of
Belarus, the Czech Republic and
1990 fi gures)
Ukraine. The proportions of the total
pollution loads entering the Baltic Sea
originating from these upstream coun-
Annual deposition rates of these heavy
Impacts of hazardous
tries are in the range of 5% to 15%
metals have halved since 1990 in the
substances
for heavy metals such as mercury,
Baltic Sea as a whole. Deposition rates
Despite reductions in inputs, concen-
cadmium and lead. The signifi cance of
for mercury have not decreased since
trations of heavy metals and organic
this transboundary pollution is natu-
the mid 1990s, however. During the
pollutants in the Baltic Sea are still up
rally higher in certain sub-catchments
1990s the use of lindane in HELCOM
to 20 times higher than in the North
than in the Baltic Sea overall.
countries was practically ceased, and
Atlantic.
atmospheric depositions of lindane
Long-term trends in inputs
in the Baltic Sea region have conse-
Heavy
North Atlantic
Baltic Sea
of hazardous substances
quently decreased signifi cantly. Due to
metal
Emissions of heavy metals from the
variations in meteorological conditions
Mercury 0.15-0.3
5-6
HELCOM countries decreased during
the decreases in emissions do not
Cadmium 2-6
12-16
the period 1990-2002 by 46% for
always lead to corresponding reduc-
Lead 5-9
12-20
cadmium, 62% for mercury, and 61%
tions in deposition rates.
Zinc 10-75
600-1000
for lead.
Copper 65-85 500-700
Since the mid 1990s, riverine loads of
The reductions in heavy metal emis-
heavy metals (notably cadmium and
Concentrations of dissolved trace
sions to the atmosphere are largely
lead) have decreased in several coun-
metals in the North Atlantic and
due to the increased use of lead-free
tries. Research has indicated that the
the Baltic Sea (ng/kg)
fuels and the wider use of cleaner
50% reduction target has been largely
production technologies, as well as
achieved for the 46 hazardous sub-
the economic decline and industrial
stances prioritised by HELCOM.
restructuring that occurred in Poland,
Estonia, Latvia, Lithuania, and Russia in
the early 1990s.
12
The concentrations of some metals,
such as cadmium, are declining in
marine organisms in some areas
(e.g. the Gulf of Bothnia and the Gulf
of Finland) but increasing in others
(e.g. the western Baltic Proper).
The best news is the clear decrease
in lead concentrations in herring
observed in most areas.
Concentrations of HCH-isomers
(lindane) in water and biota have
decreased considerably since the early
1980s.
Temporal trends in PCB concentrations (Ąg/g lipid) in herring muscle
tissue since the 1980s
Concentrations of dioxin and PCBs
in marine ecosystems declined in the
1980s, but this decrease levelled off
in the 1990s. Dioxin levels in fi sh still
9
exceed the new EU food safety limits
in some areas, particularly further
8
north.
7
TBT concentration levels are still so
6
high that they have potential biologi-
/kg wet weight 5
cal effects, at least in the Kattegat,
the Belt Sea and the Sound. For other
Maximum allowable level
4
Maximum allowable level
4
endocrine disrupting substances and
-TEQ, ng
3
new contaminants, such as fl ame
PCDD/F
retardants, a full assessment of their
WHO 2
WHO
levels or effects is not possible due to
area
the lack of monitoring data.
1
gen
³
0
North Sea
Skagerrak
Kattegat
Coast of
Mecklenburg
R
South of
Bornholm
East of Bornholm
Coast of Poland
Coast of Latvia
South of Gotland
W Gulf of Finland
E Gulf of Finland
Archipelago Sea
Bothnian Sea
Bothnian Bay
0
North Sea
Skagerrak
Kattegat
Coast of
Mecklenburg
R
The chemical weapons dumped in
the deep waters of the Baltic Sea in
Dioxin content in the muscle tissue of herring from different fi shing
the 1940s are not currently seen as
waters
a serious threat to marine ecosys-
tems. Research also indicates that any
attempt to recover these munitions
would be more likely to cause harm
than good.
13
Habitats and biodiversity
Impacts
As much as 90% of the marine and
at risk
Nearly all of the Baltic's top predators,
coastal biotopes around the Baltic Sea
including marine mammals and several
area are to some degree threatened
Natural sensitivity and
bird species, still suffer from pollution,
today, and many of these areas are
human threats
fi sheries' by-catch and habitat destruc-
important habitats for rare or endan-
The biodiversity of the Baltic Sea is
tion. The Baltic harbour porpoise is
gered species.
naturally limited by its unique brack-
still endangered and all of the Baltic's
ish water conditions, but is now also
seal species are still to some degree
Trends
considerably affected by human
threatened.
HELCOM's aims are comprehensive,
activities. Signifi cant factors include
and concern the health and ecological
pollution with nutrients and hazard-
About 100 non-native species have
balance of the the whole Baltic Sea
ous substances, coastal development,
been recorded in the Baltic Sea, and
ecosystem, but trends in the popula-
fi sheries and the introduction of non-
almost 70 of them have been able to
tions of top predators and the status
native species. As the diagram below
establish viably reproducing popula-
of biotopes can be seen as indicators
shows, marine biodiversity is very much tions.
of the overall health of the Baltic Sea.
infl uenced by salinity levels, and the
numbers of species present in ecosys-
Some of the commercially important
One sign of the success of HELCOM's
tems vary greatly by sub-region. Vari-
fi sh stocks in the Baltic Sea are cur-
environmental programmes and
ations in salinity levels make the Baltic
rently exploited in excess of "safe
nature conservation measures is the
Sea a harsh environment for many
biological limits". This overfi shing can
steady increase over recent decades in
species, and external pressures can
put entire marine ecosystems under
the breeding success rates of top pred-
easily disrupt such delicately balanced
pressure by changing their species
ators, such as the white-tailed eagle
ecosystems.
composition and predator-prey ratios.
and the Baltic's three seal species.
Overfi shing of Baltic cod is currently a
But seals still face health problems,
particularly serious problem. Spawning
with sterility levels high among young
stocks of herring have also decreased
ringed seals, other pollution-related
steadily since the 1970s, mainly due to
disorders evidently increasing in grey
changing environmental conditions.
seals, and harbour seals suffering from
Baltic
an epidemic of seal distemper in 2002.
Sea
North Atlantic
Reproduction failures have been
A more positive sign is an increase in
observed among coastal fi sh stocks
the annual productivity of wild salmon
since the mid 1990s. While the reason
of one million young fi sh a year over
for these problems is not fully under-
the period 1995-2001.
species
stood, increasing eutrophication is
widely implicated. The spawning areas
No. of
of several coastal fi sh species are
Kattegatt
situated in the inner archipelago and
Bothnian Bay
coastal bays, where their reproduction
may be affected by the pronounced
effects of eutrophication, changes in
10
20
30
40
50
Adapted from
Remane, 1934
the sea-bed and oxygen depletion.
Total: 13 700
Salinity (PSU)
The infl uence of salinity on species
The species make-up of fi sh communi-
Number of ships passing the Skaw,
diversity
ties in coastal waters has also changed
July-October 2005
due to eutrophication.
14
Increasingly crowded
shipping lanes
Impacts of shipping
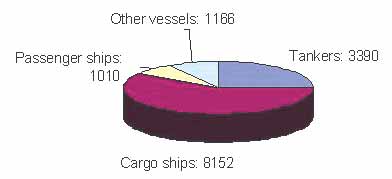
Shipping traffi c densities in the Baltic
Sea are among the highest anywhere
in the world. The transportation of
oil and other potentially hazardous
cargoes is growing steeply and stead-
ily. According to the new HELCOM
ship traffi c monitoring system, which
was launched in July 2005, during a
three month period almost 14,000
ships passed the Skaw at the north-
ernmost tip of Denmark on their way
into or out of the Baltic. Approximately
25% of these ships were tankers.
The major impacts of shipping on
the marine environment include pol-
lution by ship-generated waste or
from accidents, air emissions and the
introduction of non-native species in
discharges of ballast water.
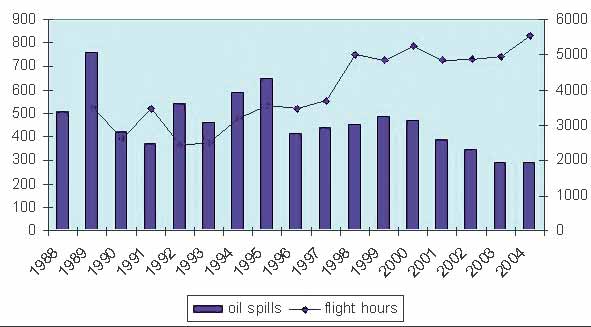
Illegal discharges
Deliberate illegal oil discharges from
ships have been regularly surveyed
EXCLUSIVE ECONOMIC ZONE
TERRITORIAL WATERS
within the Baltic Sea since 1988.
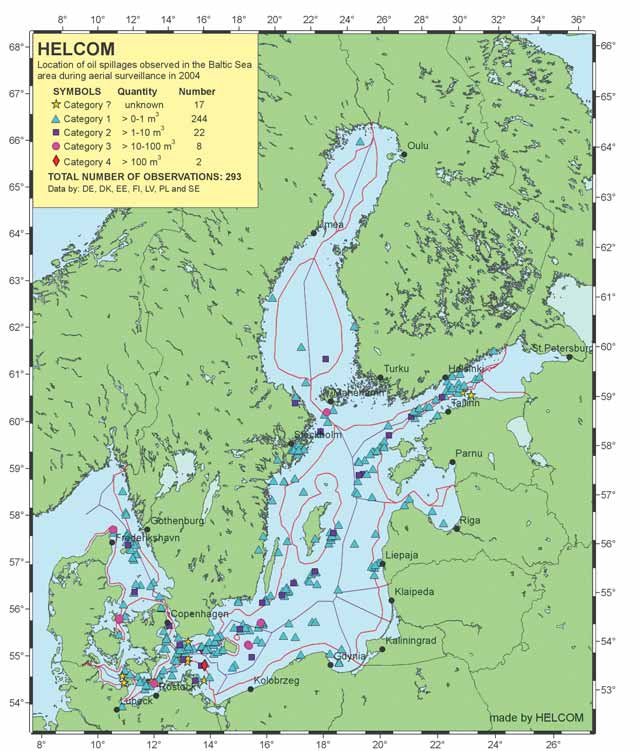
Around 300-400 illegal discharges
Location of oil spills observed in the Baltic Sea during aerial surveillance
are detected every year. The average
in 2004
number of observed illegal oil dis-
charges has been gradually decreas-
ing recently, thanks to the increasing
likelihood of offenders being spotted
and reported by increased surveil-
lance fl ights or other ships. Although
the numbers of observations of illegal
oil discharges have been decreasing
overall for the last 5 years, it should
be noted that reliable fi gures are not
available for some areas where aerial
surveillance is not regularly carried out.
Trends in the numbers of oil spills (left-hand scale) observed during
the HELCOM co-ordinated aerial surveillance fl ights since 1988. Annual
totals for surveillance fl ight hours are indicated on the right-hand scale.
15
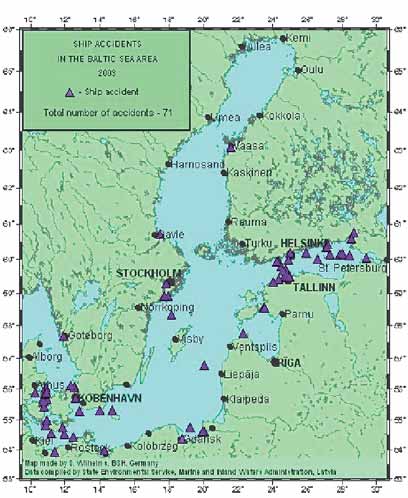
Ship accidents in the Baltic 2000Ł2003
Accidents
rally low biodiversity. These risks are
Every year 60-100 ship accidents
compounded by the large amounts of
80
are reported to HELCOM, with an
ballast water brought into the Baltic
70
average of 8% of these accidents
by the rapidly growing numbers of
60
resulting in some kind of pollution.
ships coming from all of the world's
50
Two of the fi ve most serious accidents
oceans.
60
40
57
53
63
in the Baltic have occurred since 2001
30
Ł "Baltic Carrier" in 2001 (2,700
Impacts
20
tonnes of oil spilt); and "Fu Shan Hai"
Oil spills contaminate the water by
10
5
4
11
0
0
in 2003 (1,200 t).
creating an oily layer on the surface,
2000
2001
2002
2003
or by mixing and dissolving in the
No pollution
Pollution
Air pollution from
water. The most visible effects of oil
shipping
spills are caused by oil on the surface.
Increasing maritime transport also
Seals and birds can easily become
means increases in air pollution,
smothered with oil, and their chances
including nitrogen oxide (NOx)
of survival are hampered by problems
emissions. According to recent esti-
with their mobility or the insulating
mates NOx emissions from interna-
properties of their feathers or skin. Oil
tional shipping traffi c on Europe's
pollution also destroys the habitats of
seas increased by more than 28%
many plants and animals, including
between 1990 and 2000. Emis-
the spawning areas of fi sh. Moreover,
sions from international shipping are
many of the chemicals in oil spills are
expected to increase by two-thirds by
toxic, and can have serious effects
the year 2020, even after the imple-
on plankton, fi sh and animals living
mentation of the current MARPOL
on the sea fl oor. Oil decomposes
requirements concerning air pollution
slowly in the cold waters of the Baltic.
by ships. By 2020 NOx emissions from
Coastal areas contaminated by oil
international shipping across Europe
spills need to be actively cleaned up,
are expected to surpass emissions
which is a slow and laborious process.
from all land-based sources in the 25
The necessary clean-up operations
EU member states combined.
may themselves unavoidably harm
marine life and coastal habitats. Oil
Non-native species
spills can also have serious repercus-
Locations of ship accidents in the Baltic
The Baltic Sea is considered to be
sions for tourism and commercial
Sea area in 2003
particularly sensitive to invasions of
fi sheries.
non-native species due to its natu-
www.helcom.fi