
Modelling the Carrying Capacity of the South China Sea Marine
Basin with respect to Nutrient Loading from Land-Based Sources
in the Context of the UNEP/GEF Project Entitled:
"Reversing Environmental Degradation Trends in the South China Sea
and Gulf of Thailand"
South China Sea Knowledge Document UNEP/GEF/SCS/Inf.5

First published in Thailand in 2007 by the United Nations Environment Programme.
Copyright © 2007, United Nations Environment Programme
This publication may be reproduced in whole or in part and in any form for educational or non-profit
purposes without special permission from the copyright holder provided acknowledgement of the
source is made. UNEP would appreciate receiving a copy of any publication that uses this publication
as a source.
No use of this publication may be made for resale or for any other commercial purpose without prior
permission in writing from the United Nations Environment Programme.
UNEP/GEF
Project Co-ordinating Unit,
United Nations Environment Programme,
UN Building, 2nd Floor Block B, Rajdamnern Avenue,
Bangkok 10200, Thailand.
Tel.
+66 2 288 1886
Fax.
+66 2 288 1094
http://www.unepscs.org
DISCLAIMER:
The contents of this report do not necessarily reflect the views and policies of UNEP or the GEF. The
designations employed and the presentations do not imply the expression of any opinion whatsoever
on the part of UNEP, of the GEF, or of any cooperating organisation concerning the legal status of
any country, territory, city or area, of its authorities, or of the delineation of its territories or boundaries.
Cover Illustration: The Chinese coast showing areas that are more (red) and less sensitive (green)
to nutrient input from land. Dr. Anond Snidvongs
For citation purposes this document may be cited as:
UNEP, 2007. Modelling the Carrying Capacity of the South China Sea Marine Basin with respect to
Nutrient Loading from Land-Based Sources in the context of the UNEP/GEF Project entitled:
"Reversing Environmental Degradation Trends in the South China Sea and Gulf of Thailand". South
China Sea Knowledge Document No. 5. UNEP/GEF/SCS/Inf.5
NUTRIENT CARRYING CAPACITY OF THE SOUTH CHINA SEA 1
MODELLING THE CARRYING CAPACITY OF THE SOUTH CHINA SEA MARINE BASIN WITH
RESPECT TO NUTRIENT LOADING FROM LAND-BASED SOURCES
INTRODUCTION
The UNEP/GEF South China Sea Project Document specifies that the Land-based Pollution Component
should evaluate carrying/assimilation capacity of sub-regions and sensitive ecosystems and
transboundary movements of contaminants within the South China Sea. Evaluation of the carrying
capacity of an open ecosystem with respect to contaminants can be done in a variety of ways, perhaps
the simplest of which is to estimate the `assimilative capacity, that is the capacity of the ecosystem to
internally absorb or convert some or all of the contaminant through some process, natural or manmade,
into forms that have negligible impact on the biological processes of that system and are not exported into
neighbouring ecosystems. The ecosystem is said to have a high assimilative capacity if all, or a large
fraction, of the contaminant input is removed and the net export to the neighbouring ecosystems is either
zero or only a small fraction of the input. The ecosystem is said to have a low or no `assimilative' capacity
if only a small fraction, or none, of the contaminant input is removed within the system and the export of
the contaminant to neighbouring ecosystems is equal to, or almost equal to, the input. Some ecosystems
may even have a negative `assimilative' capacity if the export of a contaminant to the neighbouring
ecosystems is greater than the total input to the system. Such a condition would indicate that there exist
one or more internal sources of the contaminant within the system.
The fifth Meeting of the Regional Working Group on Land-based Pollution (UNEP, 2005) agreed to use
the ambient concentrations of contaminants in coastal waters as indicators of the input of contaminants
derived from riverine sources. Subsequently, the Regional Scientific and Technical Committee (RSTC)
endorsed this approach and recommended that SEA START RC of Chulalongkorn University undertake a
regional project to estimate the carrying capacity of the open shelf system based on its natural capacity to
assimilate contaminants, in particular nutrient inputs from land. The RSTC recognised that the modelling
of heavy metal inputs and impacts required more reliable data for heavy metal concentrations in coastal
waters and loading in the South China Sea marine basin than are currently available.
CONCEPTUAL FRAMEWORK
Contaminant inputs into a coastal system are naturally subjected to physical and biogeochemical
processes that effect the concentration of the contaminant in the water column. A substance or property
whose concentration depends solely on physical transport and dilution is said to be a `conservative'
substance. Salinity is an example of such a property. Most contaminants are non-conservative and
therefore their distributions are subject to other processes in addition to physical transport including:
biological uptake and release; adsorption and desorption from suspended and sedimentary particles; and
interaction with the atmosphere. If the physical transport and mixing of a contaminant in a parcel of water
can be estimated then the difference in concentration distribution of a non-conservative contaminant may
be assumed to be due to additional processes
In an open shelf system, physical transport and mixing may be estimated using a variety of numerical
models based on the conservation of mass and salinity. Such principles have been known and applied to
numerous coastal systems such as those considered under the Land Ocean Interactions in the Coastal
Zone (LOICZ) core project of the International Geosphere Biosphere Programme (IGBP).Over most of the
South China Sea continental shelf, water depths of approximately 50-80 metres generally coincide with
the thickness of the surface, mixed layer. This means that modelling may be carried out on a 2-
dimensional basis making the assumption that the surface, mixed layer is vertically homogeneous. This
assumption simplifies both the modelling and data requirements substantially.
The mass balance of a non-conservative property of a two dimensional water mass can be estimated
from the input and output of such a property along the two horizontal axes, physical advection and mixing
terms and ambient concentration of the property. A transfer coefficient can be estimated for each water
parcel. The conceptual framework for the modelling system is illustrated in Figure 1. Exchange of water
and nutrients between the South China Sea and adjacent water bodies, such as the Western Pacific
Ocean, East China Sea, Sulu Sea and Java Sea are all assumed to be zero due to the narrow widths and
2 SOUTH CHINA SEA KNOWLEDGE DOCUMENT NO. 5
shallow depths of most channels/straits connecting the South China Sea with these water bodies. The
hydrographic properties of water masses on each side of the Bashi Channel, the largest channel that
connects the South China Sea with the Pacific, are clearly distinct over distances of only a few hundreds
kilometers (Zhang and Su 2006) suggesting limited exchange between the two seas.
Figure 1
Conceptual framework for the modelling system and material transfer processes within the
South China Sea marine basin.
Simulation of the ambient concentration of a property under different contaminant loads may be
undertaken assuming the same physical transport terms and transfer coefficients. The ambient
concentrations obtained from the model can be compared with water quality standards for the property,
such as those agreed by ASEAN. The carrying capacity of an open shelf system can be said to have
been exceeded when the ambient concentration exceeds the standard.
APPROACH
Nutrient inputs from land via rivers into tropical seas are rapidly assimilated by phytoplankton such that
they are generally not found in dissolved inorganic form but largely (>80%) in the form of organic
particulates. The biomass of primary producers, particularly phytoplankton, in a tropical semi-enclosed
coastal sea such as the South China Sea may be assumed to be directly related to the total loading of
essential nutrients (N and P) derived from the nearby land mass. Consequently, nutrient elements carried
NUTRIENT CARRYING CAPACITY OF THE SOUTH CHINA SEA 3
by rivers become part of the particulate organic pool in the surface water layer and may be assumed to
be eventually removed into deep water layers or to sediments through organic particle settling.
At any given location and at any given time, the concentration of organic particulate matter is not only
controlled by biological/ecosystem production and the vertical removal of particles but also depends on
horizontal transport to and from adjacent water masses. The physical transport terms, including advection
rates and various mixing processes, can be estimated using hydrodynamic principles but, in an open
water system where the horizontal gradients of contaminant and particulate concentrations are usually
small, mixing does not cause large net horizontal transport and only the advection term is significant. This
can be practically estimated using an ocean circulation model driven by external forcing, such as wind
stress, and internal forcing, such as density and pressure gradients.
Organic particles that settle from the euphotic surface, mixed layer into deeper water layers continue to
oxidise and deplete dissolved oxygen in the bottom water masses. The capacity of the system to maintain
above zero concentrations of dissolved oxygen depends on the replenishment of oxygen through vertical
exchange across the thermocline from the surface, mixed layer (which is assumed to be saturated with
oxygen) and through the horizontal transport of dissolved oxygen from adjacent deep waters that can also
be modelled. Figures 2 and 3 illustrate the observed surface chlorophyll concentrations and deep water
oxygen concentrations derived from MODIS satellite data in February and May.
Figure 2
MODIS satellite observations of surface chlorophyll (left) and oxygen concentration (right) in
the deep layer beneath the surface, mixed layer for the month of February. Red and yellow
indicate areas where concentration of surface chlorophyll are 0.2-2 mg/m3, and >2 mg/m3,
respectively. Orange indicates areas where dissolved oxygen concentration is less than 3.5
mg/l.
4 SOUTH CHINA SEA KNOWLEDGE DOCUMENT NO. 5
Figure 3
MODIS satellite observations of surface chlorophyll (left) and oxygen concentration (right) in
the deep layer beneath the surface, mixed layer for the month of May. Red and yellow
indicate areas where concentration of surface chlorophyll are 0.2-2 mg/m3, and >2 mg/m3,
respectively. Orange indicates area where dissolved oxygen concentration is less than 3.5
mg/l.
Blooms of phytoplankton in coastal waters induced by land-derived nutrient loading were cited in the
Transboundary Diagnosis Analysis (Talaue-McManus, 2000) as one of the top priority impacts of land-
based activities in the South China Sea. This report recognises that different coastal areas could have
different capacities to assimilate nutrients and, therefore, not all nutrients delivered from nearby land
masses end up in planktonic biomass in the area. Dispersion as well as particle settling, were suggested
as important processes that remove nutrients from the surface water system that could also induce
anoxia in bottom water masses. These removal processes operating in the surface, photic layer of the
sea can be estimated and the potential assimilative capacity and hence "carrying capacity", of each sub-
region of the South China Sea can be determined.
METHODOLOGY
The mass balance model for phytoplankton biomass and dissolved oxygen as functions of total nutrient
loading were calibrated and verified using contemporary baseline ambient concentrations and loading.
Once the model was satisfactorily calibrated, it was used to simulate such variables in both surface and
deep layers of the South China Sea. This model couples ocean circulation with the biogeochemical mass
balance to simulate the geographic distribution of phytoplankton biomass and bottom anoxia under
different scenarios of nutrient loading from rivers into the South China Sea. Such a model is an objective
approach to quantifying the net capacity of the natural systems within the South China Sea to maintain
the concentration of dissolved oxygen at a level sufficient for organisms to survive and ecosystem
function and services to be maintained. The model was run to achieve steady state over a time step of 1
month and has been developed based on the following assumptions:
· Chlorophyll and oxygen concentration in the surface layer are the state variables of the water
column that functionally respond to land-based nutrient loading;
NUTRIENT CARRYING CAPACITY OF THE SOUTH CHINA SEA 5
· The upper/surface water is defined as the layer between the sea surface and a depth of 50 m or
the sea bottom, whichever is less;
· The water in the surface layer is vertically well mixed and can only move horizontally due to wind
forcing calculated using the Princeton Ocean Model (POM);
· Suspended particulate biomass in the upper layer is removed by particle fallout that follows a
first-order kinetics; and
· Organic particles respire in the lower layer and consume oxygen.
Ocean Circulation and Transport Modelling
Physical oceanographic data, comprising monthly wind, temperature, salinity, surface current and
bathymetry, were compiled from regional and global sources such as NOGAPS, NOAA, JODC and
SEAFDEC. A common bathymetry and grided modelling domain was created for the South China Sea
using spatial grid of 0.1o in both horizontal dimensions. The Princeton Ocean Model (POM) was run for
the defined domain using wind and density as the primary forcing functions. The model was run both in
barotropic and baroclinic modes so that both depth-integrated transport and velocities in each layer were
obtained. The monthly aggregated surface velocity from the baroclinic output of the POM and the
resulting u and v components of the vectors are interpolated to obtain the surface currect streamline that
was verified against the observed surface current from JODC ship-drift data as shown in Figure 4.
Figure 4
A comparison between JODC current implied from ship drift data (left) and POM output in this
study. Data were aggregated to 1-degree.
The net horizontal transport among grids in the domain was calculated from the barotropic output of the
POM and the monthly output was manually checked to ensure that quasi-steady state was maintained in
all grids.
Compilation of Ambient Concentration Data
The depth integrated phytoplankton biomass expressed as chlorophyll in the surface, mixed layer and
dissolved oxygen in deep water layer were compiled from oceanographic profiling station data from global
and regional sources, such as NOAA (WDC-A), JODC, WESTPAC-GoT and SEAFDEC. To maximise the
aerial coverage from the limited available data, data from the same month but for different years between
1970 and 2004 were combined.
A preliminary review of profile data from major global and regional sources indicated that data from these
sources could contribute up to about 20% of the monthly mixed layer biomass (chlorophyll) and about
70% of the monthly deep layer dissolved oxygen contours for the South China Sea. To fill in the
remaining gaps in space and time, additional data from national sources were compiled. It is not
absolutely necessary that chlorophyll and oxygen data are completed for all 12 months to make good
contour maps of these variables. Missing data in space and time can always be interpolated using a
mathematical function.
6 SOUTH CHINA SEA KNOWLEDGE DOCUMENT NO. 5
Figure 5
A comparison of MODIS observations and modelled chlorophyll concentration
Biogeochemical Mass Balance Modelling
A tool for the estimation of the phytoplankton biomass and dissolved oxygen concentration in the South
China Sea was developed and the model was based on the principle that the South China Sea is a
closed system and that the concentration at any location, in time and space, depends only on internal
physical transport and non-conservative removal, namely particle settling in the case of phytoplankton
and chlorophyll, and biological consumption of oxygen in the deep layer.
A computer program was written to reiteratively calculate the mass balance of chlorophyll and oxygen in
each grid cell for a monthly time interval taking into consideration both conservative transport and non-
conservative production and removal terms. The program was designed such that it could be linked to
some standard visualisation tools in order to display the outputs in terms of horizontal contours of
chlorophyll and dissolved oxygen. The model was calibrated by forcing with the current loading of
nutrients from major rivers and parameterised such that the model outputs best match the observed
contours of mixed layer chlorophyll and deep layer DO for the same month.
OUTCOMES
Modelling Principles, Domain and Constraints
The modelling system was based on a series of box models of biogeochemical mass balance,
comparable to those used in LOICZ Project but with the individual boxes connected into a horizontal 2-
dimensional array that covered the entire South China Sea marine basin (Figure 1).
Organic particles that leave the surface layer were originally assumed to be respired and to consume
oxygen in the lower layer. This assumption was proven to be unrealistic as no correlation was found
between observed surface chlorophyll biomass and the oxygen concentration in the water layer
immediately beneath the surface, mixed layer in the South China Sea (Figures 2 and 3). The deep water
in many parts of the South China Sea appeared to be better oxygenated than predicted by the model,
which might be due to ventilation of the water mass through physical process in the deep water layer.
NUTRIENT CARRYING CAPACITY OF THE SOUTH CHINA SEA 7
Modelling of the bottom oxygen distribution was discontinued until a better modelling concept could be
developed and applied (Snidvongs 2005).
The modelling domain was between 10oS 30oN and 99oE 124oE and segmented into 100,651 grids of
dimension 0.1o x 0.1o each. Of this total number, 58,618 grids were `sea' grids. Bottom topography from
U.S. National Geophysical Data Center ETOPO5 (http://www.ngdc.noaa.gov/mgg/global/etopo5.html)
was used and the surface layer was defined as the upper 50 m layer of the sea.
Surface Circulation
Circulation of water in the surface layer was estimated using the Princeton Ocean Model (POM) driven by
reanalysis of daily wind data for 2004 from U.S. Navy Operational Global Atmospheric Prediction System
(NOGAPS--https://www.fnmoc.navy.mil). The modelled outputs were verified with observed ship-drift
data Japan Oceanographic Data Center (JODC) archive (http://jodc.go.jp).
Mass Balance Equation and Numerical Solution
The mass balance equation at a quasi steady state for phytoplankton biomass (as indicated by
chlorophyll concentration) in any grid i, j (Ci,j) can be described as a function of transport in x and y
directions (ui,j and vi,j,), intrinsic removal (ki,j), and river input (Ri,j,) as:
u
C
- u C + v
C
- v C - k C + R = 0
i- ,
1 j
i- ,
1 j
i, j
i, j
i, j 1
-
i, j 1
-
i, j
i, j
i, j
i, j
i, j
The total sum of the square of errors (SSE) between calculated and MODIS chlorophyll concentration
(http://oceancolor.gsfc.nasa.gov/PRODUCTS/L3_chlo.html) for each grid was:
250 400
SSE = (u
C
- u C + v
C
- v C - k C +
2
R )
i- ,
1 j
i- ,
1 j
i, j
i, j
i, j-1
i, j-1
i, j
i, j
i, j
i, j
i, j
i=0 j=0
Monthly input of nutrient by each river (Ri,j) was obtained by optimizing the above inverse problem, that is,
optimizing such that SSE is a minimum. Monthly loading of nutrients estimated by the modelling system,
developed in this project could be verified for only 19 of the total of 200 rivers around the South China
Sea (Figure 6). Nutrient budgets for these 18 rivers were calculated during the LOICZ Project
(http://data.ecology.su.se/mnode/).
Figure 6 A comparison between modelled loading of total nitrogen and values estimated by LOICZ for 18
catchments in the South China Sea, including Daya Bay, Qing River-Qinzhou Bay, Pearl Estuary,
Modao outlet-Pearl River Estuary, Jidi outlet-Pearl River Estuary, Jiulong (China); Terengganu
(Malaysia); Agno, Pampanga (Philippines); Pak Phanang, Bangpakong, Tapi, Mae Klong,
Prasae, Tha Chin, Chao Phraya (Thailand); Thu Bon, Hau Giang, Phan Thiet Bay (Viet Nam).
8 SOUTH CHINA SEA KNOWLEDGE DOCUMENT NO. 5
Sensitivity Assessment and Assimilating Capacity
The calibrated model was analysed for its sensitivity to an increase in nutrient loading by rivers. River
loadings were increased by ten and one hundred times using the model, and the resultant distribution of
surface chlorophyll was calculated (Figure 7). Because there have been no standards for marine
chlorophyll concentration adopted in the South China Sea countries, this study assumed that marine
waters with concentrations above 2 mg m-3 would be `eutrophic'. This arbitrary indicator is well within the
range used elsewhere, e.g., from 1 mg m-3 for the Great Barrier Reef lagoon (Steven et al. 1998) to 10
mg m-3 for the North Sea region (Allen et al. 2002).
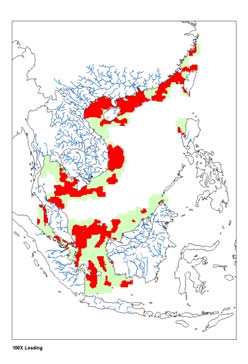
Figure 7
Sensitivity analysis of the responses of chlorophyl concentration to increases in nutrient
loading. (10x and 100x) Upper row: Modelled surface chlorophyll concentrations for current
baseline nutrient loading (left), for 10 times current nutrient loading (middle), and for 100
times current nutrient loading (right). White <0.2, yellow 0.2-2, and red >2 mg/m3,
respectively. Lower row: Sensitivity analysis of the responses of chlorophyll concentration to
increases in nutrient loading. Legend: red = high sensitivity (response is proportionally higher
than loading increase), low sensitivity response is proportionally lower than loading increase),
white = chlorophyll concentration not response to land-based nutrient loading.
An area was said to be sensitive to land-based nutrient loading and had a higher risk of becoming
eutrophic, that is, it potentially has a low assimilative capacity, when the chlorophyll concentration
increased disproportionally.
NUTRIENT CARRYING CAPACITY OF THE SOUTH CHINA SEA 9
Figure 8
Proportion of the area classified as eutrophic, mesotrophic and oligotrophic under nutrient
loading scenarios of 1x present load, 10 and 100 times present load.
High-Risk Marine Areas and Hotspot Rivers/Catchments
Increased nutrient loadings, even as much as 100 times above present, could only cause eutrophication
in nearshore waters of the South China Sea, mostly in shallow areas within 150 km of the coast. Marine
water along the Philippine coast from Luzon to the Palawan Islands has the highest assimilative capacity
and this part of the South China Sea should never become eutrophic. However, this would not apply to
the potential eutrophication of bays and estuaries that were not the foci of the modelling system. Another
area that has relatively high assimilative capacity is the Gulf of Thailand where the response of
chlorophyll biomass in marine waters was comparatively less sensitive to the loading from nearby rivers.
Examples of areas with low and high carrying capacity, as well as rivers that are potential hotspots for
nutrient loading into coastal waters, are shown in Figures 9 to 12.
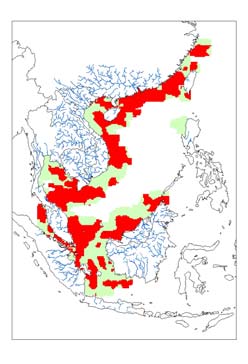
Figure 9
The Chinese coast showing areas that are more (red) and less (green) sensitive to nutrient
input from land.
10 SOUTH CHINA SEA KNOWLEDGE DOCUMENT NO. 5
Figure 11 The Gulf of Thailand showing
Figure 10 The Vietnamese coast of the South
areas that are more (red) and less (green)
China Sea showing areas that are more (red)
sensitive to nutrient input from land.
and less (green) sensitive to nutrient input from
land.
NUTRIENT CARRYING CAPACITY OF THE SOUTH CHINA SEA 11
Figure 12 The Malaysian and Indonesian coasts bordering the South China Sea showing areas that are
more (red) and less (green) sensitive to nutrient input from land.
Modelling Workshop
A modelling workshop was held at Chulalongkorn University, Bangkok, 2-5 July 2005, and attended by 23
participants from South China Sea Project countries. Participants were trained in the use of the modelling
system developed in this project that is executed on a Microsoft Excel platform. The modelling system
was also distributed to all participants to continue modelling tasks at their home institutions. Using only
MODIS satellite chlorophyll data, participants in the workshop were able to estimate the baseline monthly
nutrient loading from catchments around the South China Sea to be within the right order of magnitude,
usually within less than 0.5 times on the logarithmic scale. These estimates, however, need to be verified
against some direct estimation of total nutrient loading by rivers.
During the workshop, participants also simulated the distribution of chlorophyll under different nutrient
loading scenarios. It was apparent that different areas of the South China Sea have different capacities to
assimilate nutrient input. The model seems to show that nutrient loading from the small but numerous
rivers and streams and from non-point sources along the coast could be even more important in
controlling phytoplankton biomass and eutrophication at the South China Sea regional scale. More
thorough modelling for the whole South China Sea over an annual cycle is needed. Rivers and
catchments where loading of nutrients into the adjacent coastal area could easily trigger the proliferation
of chlorophyll biomass need to be carefully assessed and higher priority given to actions to control or curb
generation and/or disposal of nutrients.
DISCUSSION AND CONCLUSIONS
A modelling system was developed and enabled the estimation of land-based nutrient loading via rivers
despite the limited chemical and hydrological data for these rivers. Nutrient loading from particular rivers,
stretches of coastline, or catchments may be varied and the distribution of surface chlorophyll in the
South China Sea or a sub-region or sub-basin therein can be simulated for each month of the year. The
results, in terms of concentration and horizontal distribution patterns, may be evaluated and the response
of the phytoplankton biomass to nutrient input from land can be varied in time and space. The model
developed is freely available to anyone; uses US Navy NOGAPS global wind reanalysis to force the POM
circulation model; uses the JODC ship drift data to verify surface circulation/current outputs; uses MODIS
satellite-based chlorophyll concentration as the frame to calibrate the present monthly nutrient loading
from 190+ rivers; and uses national data to verify such loads for some rivers. The modelling system is run
entirely in Microsoft Excel and can be accessed by visiting <http://www.unepscs/nutrient_model/>.
12 SOUTH CHINA SEA KNOWLEDGE DOCUMENT NO. 5
The region now has a tool and human resources in each country to perform such modelling. The model
can be run to estimate the monthly `effective' loading of total nutrient from any catchment, as point or non-
point loading, in chlorophyll equivalent units that can be converted to nutrient elements, such as N, using
a Chl:nutrient ratio; can simulate the monthly responses of the chlorophyll biomass in any area of the
South China Sea (at a resolution 0.1o x 0.1o) to different loading scenarios; and can be used to estimate
the maximum monthly load of nutrient from any selected catchment to ensure that the chlorophyll-defined
biomass remains under a pre-defined limit.
The regional modelling effort should be continued and linked with other regional programmes such as
COBSEA and GPA/LBA; and with development of regional criteria for chlorophyll concentrations in
marine waters of the South China Sea. Model improvements, including the linkage between loading and
social/economic development in a catchment, will lead to better estimates of loading scenarios for each
river, improved treatment of mixing and internal removal kinetics, and use the ambient chlorophyll data or
scenario more comprehensively to calculate directly inputs from individual rivers.
Anond Snidvongs & John Pernetta,
Bangkok, September 21st 2007
REFERENCES
Allen, J. I., F.J. Gilbert, J.T. Holt, M. Hol, D.K. Mills, R. Proctor, and J.R. Siddorn. 2003. Eutrophication Modelling of
the Southern North Sea. Final Report MERSEA Strand 1 Contract No. EVK3-CT-2002-00089.
Snidvongs, A. 2005. Carrying Capacity of the South China Sea with respect to Land-based Pollution Loading.
Southeast Asia START Regional Technical report Number 14, 23pp. Bangkok, Thailand.
Steven, A D L, F Pantus, D Brooks, and L Trott 1998. Long-term Chlorophyll Monitoring in the Great Barrier Reef
Lagoon: Status Report 1, 1993-1995. Great Barrier Reef Marine Park Authority Research Publication No. 55
Talaue-McManus, L. 2000. Transboundary Diagnostic Analysis for the South China Sea. 106pp. EAS/RCU Technical
Reports Series No.14. UNEP, Bangkok, Thailand.
UNEP, 2005. Reversing Environmental Degradation Trends in the South China Sea and Gulf of Thailand. Report of
the Fifth Meeting of the Regional Working Group on Land-Based Pollution. UNEP/GEF/SCS/RWG-LbP.5/3.
UNEP, 2005. Reversing Environmental Degradation Trends in the South China Sea and Gulf of Thailand. Report of
the Sixth Meeting of the Regional Working Group on Land-Based Pollution. UNEP/GEF/SCS/RWG-LbP.6/3.
Zhang J. and Su J., 2006. Nutrient dynamics of the China Seas: the Bohai Sea, Yellow Sea, East China
Sea and South China Sea. In: The Global Coastal Ocean Interdisciplinary Regional Studies and
Synthesis (edited by Robinson A.R. and Brink K. H.). Harvard University Press, Cambridge, MA:
637-672.
GEF
Issued and printed by:
UNEP/GEF South China Sea Project:
"Reversing Environmental Degradation Trends
In the South China Sea and Gulf of Thailand"
Additional copies of this and other publications issued by
UNEP/GEF South China Sea Project can be obtained from:
UNEP/GEF
Project Co-ordinating Unit
United Nations Environment Programme
UN Building, 2nd Floor Block B, Rajdamnern Avenue
Bangkok 10200, Thailand
Tel: (662) 288 1886
Fax: (662) 288 1094
http://www.unepscs.org