
Procedure for Selection of Demonstration Sites in the
context of the UNEP/GEF Project Entitled:
"Reversing Environmental Degradation Trends in the
South China Sea and Gulf of Thailand"
South China Sea Knowledge Document UNEP/GEF/SCS/Inf.2

First published in Thailand in 2007 by the United Nations Environment Programme.
Copyright ę 2007, United Nations Environment Programme
This publication may be reproduced in whole or in part and in any form for educational or non-profit
purposes without special permission from the copyright holder provided acknowledgement of the
source is made. UNEP would appreciate receiving a copy of any publication that uses this publication
as a source.
No use of this publication may be made for resale or for any other commercial purpose without prior
permission in writing from the United Nations Environment Programme.
UNEP/GEF
Project Co-ordinating Unit,
United Nations Environment Programme,
UN Building, 2nd Floor Block B, Rajdamnern Avenue,
Bangkok 10200, Thailand.
Tel.
+66 2 288 1886
Fax.
+66 2 288 1094
http://www.unepscs.org
DISCLAIMER:
The contents of this report do not necessarily reflect the views and policies of UNEP or the GEF. The
designations employed and the presentations do not imply the expression of any opinion whatsoever
on the part of UNEP, of the GEF, or of any cooperating organisation concerning the legal status of
any country, territory, city or area, of its authorities, or of the delineation of its territories or boundaries.
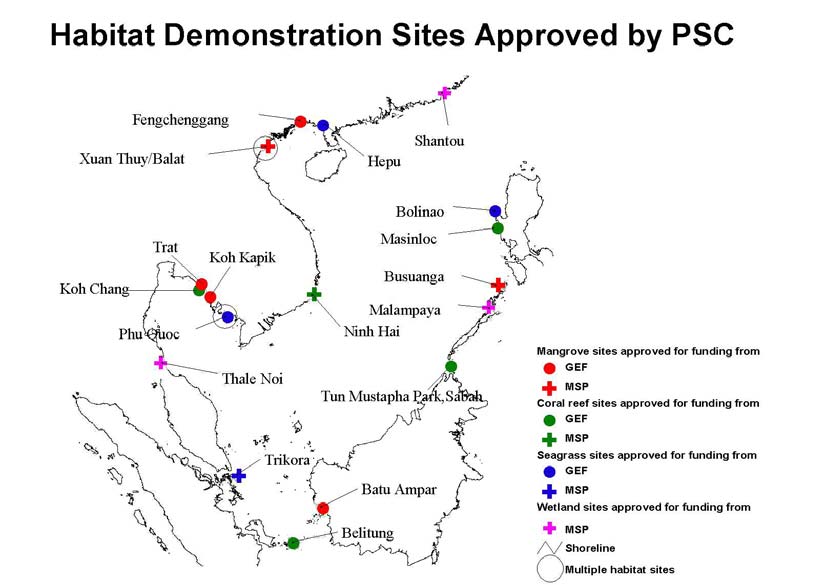
Cover Illustration: Habitat Demonstration Sites approved by the project Steering Committee of the
UNEP/GEF Project Entitled: "Reversing Environmental Degradation Trends in the
South China Sea and Gulf of Thailand".
For citation purposes this document may be cited as:
UNEP, 2007. Procedure for Selection of Demonstration Sites in the context of the UNEP/GEF Project
Entitled: "Reversing Environmental Degradation Trends in the South China Sea and Gulf of Thailand".
PROCEDURE FOR SELECTION OF DEMONSTRATION SITES 1
PROCEDURE FOR SELECTION OF DEMONSTRATION SITES IN THE CONTEXT OF THE
UNEP/GEF PROJECT ENTITLED: "REVERSING ENVIRONMENTAL DEGRADATION TRENDS IN
THE SOUTH CHINA SEA AND GULF OF THAILAND"
INTRODUCTION
The project entitled "Reversing Environmental Degradation Trends in the South China Sea and Gulf of
Thailand" is funded by the Global Environment Facility (GEF) and implemented by the United Nations
Environment Programme (UNEP) in partnership with seven riparian states bordering the South China
Sea1. A brief history of the development of the project and the Management Framework can be found in
IW-Learn Knowledge document UNEP/GEF/SCS/Inf.1. Planning commenced in 1996 and the project
became fully operational in February 2002.
The Project is complex since it addresses three priority areas of concern identified in the Transboundary
Diagnostic Analysis (TDA)2, (Talaue-McManus, 2000) namely the loss and degradation of coastal
habitats, over-exploitation of fisheries in the Gulf of Thailand, and land-based pollution. Of these three
substantive project components the first, relating to habitat degradation and loss is the largest, being
divided into four sub-components. The fourth component of the project is that concerned with regional
co-ordination including facilitation of national level execution and securing inter-country agreement on
project related matters. The financial appropriations approved by the GEF Council are presented in
Table 1, where it can be seen that the allocations from all sources for the priority habitats (mangroves,
coral reefs, seagrass and wetlands) total just over 21 million US dollars or 65% of total project costs.
Table 1
Project Budget Summary and Component Financing in Million US$.
Co-financing
Grand
Project Activities
GEF
Governments Other Sources
Total
1. Habitat Degradation & Loss
1.1 Mangroves
2.733
2.374
1.585 6.692
1.2 Non-oceanic Coral Reefs
2.587
2.326
1.560 6.473
1.3 Seagrass
2.529
2.305
1.585 6.419
1.4 Wetlands
0.975
0.400
0.082 1.457
2. Over-exploitation of fisheries in the Gulf of
1.650
0.735
0.960 3.345
Thailand
3. Land-based Pollution
1.760
0.461
0.110 2.331
4. Project Co-ordination and Management
3.580
0.294
0.505 4.379
EA Overheads
0.600
0.600
Project Total
16.414
8.895
6.622
31.931
PDF-B
0.335
0.176
0.076 0.587
Grand Total
16.749
9.071
6.698
32.518
The project was designed to be implemented over a period of five years and involved the signing of
Memoranda of Understanding (MoUs) between UNEP as the GEF Implementing Agency and seven
focal Ministries, (the Ministries responsible for Environment in each country) and thirty-one Specialised
Executing Agencies (SEAs) in the seven participating countries, each responsible for one component or
sub-component3.
1 Cambodia, China, Indonesia, Malaysia, Philippines, Thailand and Viet Nam.
2 All project related documents cited in this paper can be found on the project website at www.unepscs.org.
3 In the case of Cambodia the limited human capacity in the country resulted in the coral reef and seagrass sub-components
being combined under responsibility of a single Specialised Executing Agency, the Department of Fisheries. The mangrove
and wetlands sub-components were similarly combined resulting in the creation of only four rather than six national
committees in Cambodia.
2 PROCEDURE FOR SELECTION OF DEMONSTRATION SITES
THE PROBLEM
The GEF allocation for demonstration sites was stated in the Project Brief and noted by the project
Steering Committee during its' first meeting (UNEP, 2000a, Appendix) as 3 demonstration sites in
each of the habitat sub-components of Mangroves, Coral Reefs and Seagrass. The size of each
allocation for demonstration sites, by habitat sub-component was as follows:
Mangroves:
1.2 million US$ over 3 years
Coral Reefs: 1.2 million US$ over 3 years
Seagrass:
1.1 million US$ over 3 years
Wetlands4:
no allocation
These funds were "blocked" in the project document and their purpose identified but the sites were not
chosen at that time since the preparatory activities during the first two years of project implementation
were intended inter alia to develop the process of selection.
The consequences were quite clearly that:
Ě with seven participating countries, no one country could "expect" a demonstration site in
each habitat sub-component;
Ě if the principal of equity were to be applied, each country could only "expect" 1.3
demonstration sites (more realistically 5 countries would get one site each and two would get
two);
Ě "wetlands" would have no demonstration sites unless the Project Co-ordinating Unit (PCU5)
could raise additional funds.
Potential y, therefore, the process of site selection could have been divisive and acrimonious. It might
also have resulted in the choice of sites that: did not adequately represent the range of biological and
environmental conditions found throughout the South China Sea; and, did not address the
achievement of the global environmental benefits anticipated from GEF interventions.
THE APPROACH:
Past practice in regional programmes has generally been based on "equity" considerations such that
the available resources tend to be divided equally, or near equally, between all participating countries.
In addition, decisions on specific site-related activities in the framework of UNEP's regional seas
action plans for example, has reflected the individual national priorities with little attempt being made
to either determine, or take into consideration, regional priorities independently of national priorities.
Regional priorities have been generally derived from a process of consensus building on the basis of
the nationally defined priorities with each party recognising that they would get "something". National,
regional and global priorities are however, rarely congruent.
Past experience has shown that, where a limited pool of resources is to be divided amongst a large
number of possible recipients, there is a general trend for those with the best command of written
English to prepare proposals that are superficially more attractive; and if the decision, is taken by
"consensus" during an open meeting with few or no guidelines, the individuals with the greatest facility
in spoken English (or who shout the loudest) have a higher probability of carrying their argument
forwards. Selection of demonstration sites in other contexts is therefore frequently based upon
"perceptions" of what are good sites; thus, individuals in the Southeast Asian region will quote Apo
Island in the Philippines as a good example of community-based coral reef management, even though
the site is small and the current operation is no longer as successful as it was initial y.
4 It should be noted that the definition of wetlands in the context of the project excluded the three itemised habitat types and
restricted consideration to coastal wetlands, such as estuaries, mudflats, and lagoons.
5 It should be noted that although the consequences of the original allocations was accepted by the representatives of the
participating countries, it resulted in significant lowering of morale amongst the expert focal points who saw their colleagues
having the prospect of substantial activities during the operational phase of the project whilst they, on the other hand, could
potentially have nothing to show in concrete terms from the preparatory phase activities.
PROCEDURE FOR SELECTION OF DEMONSTRATION SITES 3
Recognising these problems, it was decided to attempt to construct a more "objective" approach to
selecting demonstration sites in the framework of the South China Sea Project. This required that, at
the very least:
Ě all parties accept that the funds were limited and that equitable (equal) division of the
resources among all countries would compromise the integrity and success of the
demonstration sites6;
Ě the process of site selection be fully transparent and comprehensible to all parties, both
technical and political, and that it be based as far as possible on "objective" quantifiable
criteria and indicators; and,
Ě the criteria used in assessing the comparative importance of the sites should reflect
importance from the perspectives of biological diversity, transboundary relevance, and the
regional and global significance or importance of the site.
STEPS IN THE PROCESS:
Defining the data and information needs
The first action required securing agreement at the regional level regarding the data and information
needed to characterise individual sites. Such characterisation, for example, would include: indicators
of environmental state, such as percentage seagrass cover; of indicators of biological diversity, such
as presence or absence of individual mangrove genera, and/or the numbers of hard coral species.
This process was initiated during the first meeting of the Regional Scientific and Technical Committee
(RSTC) (UNEP, 2002a) during which specific guidance was developed for each regional working
group regarding the "types" of data that should be considered and selected within each habitat sub-
component.
The first meeting of each Regional Working Group (RWG) (UNEP, 2002b; UNEP, 2002c; UNEP,
2002d; UNEP, 2002e) defined the data and information required to characterise specific sites. Tables
1 and 2 provide as examples, the lists of parameters initial y identified by the mangrove and coral reef
regional working groups. In all instances, these lists were comprehensive and overly ambitious, listing
parameters (i.e., properties and variables) that were difficult to obtain from published information and
existing databases. Subsequent to this, a regional GIS meeting was convened (UNEP, SEA START,
2002) and SEA START RC7 prepared GIS data formats based on the lists of parameters prepared by
each regional working group. During the inter-sessional, six month, period between the first and
second regional working group meetings, national focal points in each SEA commenced the process
of assembling site specific data sets from existing published and unpublished sources8.
The second meeting of each regional working group (UNEP, 2002f; UNEP, 2002g; UNEP, 2003a;
UNEP, 2003b) reviewed the initial data sets that had been compiled and, in most instances, agreed to
drop from consideration parameters that were either generally unavailable throughout the region or
which were too difficult to standardise across countries. In addition, clarification of the exact
interpretation of defined parameters was required. For example, mangrove data relating to the density
of trees was clearly not comparable between countries with some data sets reflecting the occurrence
of all classes of "tree" including seedlings, saplings and mature trees. This parameter was re-defined
as the density of mangrove trees exceeding 1.5 metres in height, thereby excluding seedlings but not
excluding species with low maximum mature height. During its second meeting, the RSTC (UNEP,
2003c) reviewed the parameters selected by each working group and provided some comments and
guidance to the RWGs.
6 In this context the GEF Project brief was explicit in stipulating 3 demonstration sites in the three habitat sub-components. The
approval of the project budget by the Project Steering Committee at its first meeting resulted in implicit acceptance of this
limitation by the participating countries.
7 South East Asian Regional Centre for START (SysTem for Analysis, Research and Training.
8 In the case of China the absence of any national data sets regarding the distribution and/or diversity of seagrass habitats
was addressed through substantial co-financing made available through the central government to enable the SEA to
prepare distribution maps based on remotely sensed images, and assemble basic data through field surveys. The outcome
was the first internationally available data sets regarding seagrass in China.
4 PROCEDURE FOR SELECTION OF DEMONSTRATION SITES
Table 1
Details of Parameters, Data and Information requirements for Mangrove Site Characterisation.
Parameter
Data & Information needed
Latitude & Longitude central position of areas <50 Ha; GPS Boundary
Geographic information
Co-ordinates
or number (min 4) of paired co-ordinates for larger areas; end points
for linear strips.
Area (Units
Km2 or Ha)
Physical Environment
Substrate (soil)
Proportion of sand, silt, clay
Bulk
Density
Freshwater regime
Mean monthly rainfall (mm)
Mean monthly River discharge (m3sec-1)
Tidal regime
Range (m)
Diurnal,
semi-diurnal,
mixed
Slope Degrees
(tangent)
Temperature
Mean, max, min, monthly (oC)
Soil Salinity
Range (psu)
Water quality
Total suspended solids
Contaminant
concentration/flux
Other parameters as available
Geomorphic class
Description, lagoon, tidal flats, estuaries, islands etc.
Environmental state
Present status
Vegetation Canopy Cover (% area)
information
Pressure (threats) ş present
% loss of species or area or canopy cover in last five years
Pressure (threats) ş future
Estimated future losses from known development plans
Social & use information
Ownership
Description: Federal, State, Community, private
Description: Land-use planning, Institutional framework, stakeholder
Management regime
co-ordination, forestry practices, restoration replanting, stakeholder
investment, fishery practices.
Current use
Description: Commercial, subsistence
Potential use
Alternative livelihoods
Significance/national importance
Use designation in national/state master plans
Biological data
Natural/Managed
Proportions of total area natural and replanted
Species diversity
(True) Mangrove9 tree species Density (no ha-1)
Crustacea ş Crab genera, density
Molluscs ş Bivalve genera, density
Molluscs ş gastropods genera, density
Fish ş Residents, species abundance
Fish ş Transient for breeding, species abundance
Mammals,
resident
Birds,
resident
species
Birds,
migratory
species
Reptiles, resident species
List others as available (e.g. mud lobster)
Genetic diversity
Heterogeneity
Formations ş number of canopy layers (strata)
Average and range Height (m), by species
Average and range Girth, (cm) by species
Zonation ş number of zones by dominant species
Ecotones ş average width (m), major species
SCS Endemic species
List species and abundance
Endangered or threatened species
List species and abundance if data available
(IUCN criteria)
Stress-pressure Information
Intrinsic/internal sources of change
Resident human population
Natural e.g. frequency of typhoon throw, change in allochthonous
sediment inputs, marine based flooding
Extrinsic/external sources of change
Changes in catchment basin e.g. dam construction water diversion etc.
Rates of change, historical review
Rates of loss of cover and/or species over the period 1990-2000
Social and economic drivers of
Description, quantitative if possible e.g. pop'n growth, immigration,
change in environmental state
income/livelihood, demand/ consumption, management regime)
Economic valuation10
Timber, charcoal, living marine resource extraction Yr 2000 local
Values of direct use
currency total
Carbon sequestration, ecotourism, nursery areas for shrimps Yr 2000
Values of indirect use
local currency total
Coastal protection, sediment stabilisation, water quality enhancement,
Values from environmental services
contaminant sink, reduction of wave energy & erosion
Value of investment
Restoration, replanting
Values of potential (commercial)
sustainable use
Total Economic Value
Yr 2000 local currency total
9 Tomlinson, P.P.. 1986 Botany of Mangroves, Cambridge University Press.
10 Barbier, E.B. 1997. Economic Valuation of wetland: A guide for policy makers and planners. RAMSAR Convention Bureau,
IUCN.
PROCEDURE FOR SELECTION OF DEMONSTRATION SITES 5
Table
2
Details of Parameters, Data and Information requirements for Coral Reef Site
characterisation.
Parameter
Data & Information needed
Latitude & Longitude central position of areas, GPS Boundary or
Geographic information
Co-ordinates
number (min 4) of paired co-ordinates for larger areas; end points for
linear strips.
Area
(Units Km2 or Ha)
Physical Environment
Reef type
Fringing (mainland & island), barrier, atoll, patch, other
Slope Degrees (tangent)
Bathymetry Depth
contour
Prevailing wind; sea surface temperature, (seasonal mean, max &
Climate
min); rainfall mean monthly rainfall (mm)
Current pattern
Seasonal current pattern
River discharge
Sediment load, quantity of freshwater discharge salinity
Tidal regime
Range (m)
Diurnal, semi-diurnal, mixed
Water quality
Nutrients, total P, N, nitrite, total suspended solids
Turbidity
Other parameters as available
Environmental state
Present status
Live coral cover, dead coral cover, algae, abiotic
information
Level of exploitation (indicator species, catch per unit)
Present threats
Sedimentation
Destructive fishing (no. of cases, both bombing & poisoning, reported
per year
Pollution (no. pop'n & distance to the sources of pollutants)
Crown of Thorns (COT) infestation (density of COT, no. of cases, and
infested areas)
Bleaching (% bleaching of live coral, % of covered )
Others
Trends
Increase or decrease of live coral cover
Pressure (threats) ş
Development plan & distance to the coral reef area
future
Social & use information
Ownership
Description: Federal, State, Community, private, common property
Description: Land-use planning and coastal zoning, Institutional
Management regime
framework, stakeholder co-ordination, restoration, stakeholder
investment, fishery practices
Description: Commercial, subsistence, fishing ground, tourism and/or
Current use
MPA
Traditional use
Description of
Potential use
Tourism and MPA (sustainable use)
Significance/national
Use designation in national/state master plans
importance
Biological data
Species diversity
No. of species and coverage of hard coral
No. of species and coverage of soft coral
Molluscs ş species and density (no. per m2)
Crustacean- species and density (no. per m2)
Fish ş coral reef fish, species abundance
Fish ş Transient for breeding, species abundance
Mammals
Reptiles
Echinoderm
No. species of algae
Other species
Diversity index
Genetic diversity
SCS Endemic species
List species and abundance
Endangered or
threatened species
List species and abundance
(IUCN criteria)
Source & sink of larvae
Location & types (breeding ground), density of larvae
Migratory species
List species and abundance
Ecosystem diversity
Description of complexity of habitats
Interaction with other
Description of associated ecosystems
ecosystems
Economic valuation11
Extractive
Reef related fish landing (mt/$$)
Subsistence fishery (no. of fishers dependent on reef ş mt/$)
Commercial y (live fish and fish landing ş mt/$)
Non extractive (tourism)
No. of visitors. ($ generated)
No. of people involved in industry (income generated) ş no. of
chalets/hotels operators - no. ferry/boats operator - no. guide/agents
Environment services
Education
Others
11 Barbier, E.B. 1997. Economic Valuation of Wetlands: A guide for policy makers and planners. RAMSAR Convention Bureau,
IUCN, Gland, Switzerland.
6 PROCEDURE FOR SELECTION OF DEMONSTRATION SITES
Defining the process:
Also, at its second meeting, the RSTC (UNEP, 2003c) considered the process of site selection and
ranking. It agreed to recommend to the PSC a three-step process involving: characterisation of the
sites; a cluster analysis to identify major groupings of similar sites; and, ranking of sites within each
cluster, using both environmental and socio-economic criteria. It is important to note that only at the
end of the first year was a discussion initiated as to how sites would be selected; the reason being
that by assembling preliminary data sets without specifying that these might ultimately be used in site
selection and ranking, some objectivity could be ensured in the process, by preventing individuals
from presuming the purpose and outcome.
The recommendation of the PCU to the RSTC to use cluster analysis was based on the fact that each
RWG had prepared site characterisation sheets for in excess of forty sites and to select three sites
without some form of preliminary screening would have been a difficult, if not impossible task. The
argument presented was that clustering resulted in sites being grouped on the basis of their similarity;
and that, identifying at least three major clusters and then selecting one priority site from each cluster,
would ensure maximum coverage of the range of biological diversity exemplified by sites bordering
the South China Sea12. The rationale, in simple terms, was that three contrasting sites would be
preferable as demonstration sites, rather than three similar ones if global and regional biological
diversity objectives were to be addressed. This approach maximises the range of different
environmental and biological conditions encompassed by the three sites selected as demonstration
sites within each habitat type.
This recommendation was adopted by the Project Steering Committee (UNEP, 2003d) during its
second meeting and involved the PCU essentially providing, to both the RSTC and PSC members, a
"short course" in the statistics of cluster analysis as well as presenting the arguments as to why a
preliminary screening was required.
Evaluating the data:
During the third meetings of the RWGs, (UNEP, 2003e; UNEP, 2003f; UNEP, 2003g; UNEP, 2003h).
the data and information were reviewed, anomalies identified and discussed, and a series of
preliminary cluster analyses conducted using different data sets and transformations. At the same
time, criteria to be used in the ranking process were discussed and agreed upon and preliminary
rankings using the environmental criteria were prepared. The outcomes of these activities were
presented to the third meeting of the RSTC, (UNEP, 2003i) which reviewed them in some detail. The
RSTC made specific comments and criticisms and recommended modifications or changes prior to
their finalisation. It also agreed that supporting data for certain parameters must be provided in order
to verify the data quality.
During the inter-sessional period, data were reviewed, anomalies corrected and the data sets finalised
for the conduct of a final clustering in advance of the fourth meeting of the RWGs. Agreed principles
used in the final analysis were that any site for which less than fifty percent of the agreed data set was
available would be dropped from further consideration, and any parameter for which fewer than 50%
of the sites had data would be excluded from further consideration.
During the fourth meetings of the RWGs, (UNEP, 2004a; UNEP 2004b; UNEP, 2004c; UNEP, 2004d)
the data sets were given a final review prior to their acceptance and the system for determining
ranking scores was reviewed in the light of the empirical data collected for the sites on the list. The
final data sets used in the cluster analysis are presented in Tables 3, 4, 5, 6 and 7.
Where data could not be verified via species lists and/or published surveys, the sites were discussed
and reviewed individually and the majority excluded from further consideration. In the case of the
Regional Working Group on Mangroves for example, data were initially assembled for forty-four
mangrove sites, of which twenty-six data sets, were judged by, the Regional Working Group13 to be
sufficiently well documented, to merit inclusion in a regional comparison.
12 It is well recognised in the field of ecology that ecosystems at the margins of the overall global distribution differ quite
significantly in terms of their species composition, productivity and ecosystem process from those located at the "centre" of
the distribution. Were mangrove sites to be selected, for example, solely on the basis of their species diversity, then the three
most diverse sites were quite likely to be found in Indonesia and the particular associations characteristic of Northern Viet
Nam and southern China, with their very different species composition, would have been unlikely to have been selected.
13 At the time of this decision the ten person working group had combined experience of research and mangrove management
totalling 191 person years.
PROCEDURE FOR SELECTION OF DEMONSTRATION SITES 7
One consequence of these decisions was that, sites of potential regional or global significance for
which data were not available could not be included in the ranking procedure. This risk was not
considered significant since most sites of global and/or regional significance are also considered of
national significance14; hence data sets are generally available for these sites. An exception to this
occurs in the case of Cambodia where basic data relating to coastal habitats are general y lacking;
accordingly some funds were allocated to Cambodian focal points during the preliminary phase to
conduct basic habitat surveys.
Whilst each regional working group considered, and critically reviewed the data and information
available for each site, the value of a higher-level body reviewing the outcome is demonstrated in the
insights and comments provided, by the RSTC on the outcome of the wetlands analysis. In the case
of the wetlands sites the excessively large size of some potential sites was questioned in terms of the
uniformity of the habitats contained therein and the RSTC was of the opinion that integrated
management of these areas was unlikely to be achieved due to the multiple administrative
jurisdictions covered by the sites concerned. Furthermore the RSTC noted that the wetlands
component of this project focuses on only five wetland types (inter-tidal, unvegetated mudflats;
coastal brackish water lagoons; estuaries; coastal freshwater peat swamp forest; and coastal swamp
forest), hence if each site was designated according to its major habitat type the maximum number of
additional (associated) ecosystems/or habitats that should be included would be four. These and
other queries resulted in a second review and reconsideration of the data by the working group
resulting in the final cluster analysis being completed only during the sixth meeting of the working
group.
Cluster Analysis
Recognising that there exist sub-regional differences in the biological diversity contained in the
seagrass, coral reef and mangrove habitats bordering the South China Sea it was agreed that, a
statistical comparison of all sites be undertaken in order to determine the relative similarity (and
difference) between the sites. These data are presented in Tables 3, 4, 5, 6 and7. It can be seen that:
in the case of mangroves 12 parameters for a total of 26 sites were used in the analysis; for seagrass,
and coral reefs, 11, and 8 parameters, and 26, and 44 sites respectively were included. In the case of
mangroves 17 cells (5.4%) in Table 3 lack entries while for seagrass, and coral reefs missing data
represented 5.2%, and 15.6% of the possible total data sets. In the case of the wetlands sites it was
finally agreed to analyse the sites on the basis of wetland types namely, estuaries, inter-tidal mudflats,
coastal lagoons and peat and non peat swamp. The data for the first three habitats are presented in
Table 6 including six parameters for 15 estuaries, 12 inter-tidal mudflats and 7 coastal lagoons. The
data for seven parameters for 4 peat swamp and 2 non-peat swamp forest locations are presented in
Table 7.
These data sets represent a compromise between a fully comprehensive and descriptive set of data
and that, which was available for the largest number of sites.
A cluster analysis was performed using the Clustan Graphic 6 software programme that enables
estimation of missing values and all values were transformed to z scores thus giving equal weight in
the analysis to each variable. The resulting dendrograms are presented in Figures 1, to 6.
It can be seen that the mangrove sites fall into three clusters, two of which are comparatively small
(four sites each). These two small clusters encompass sites in China, Thailand and Viet Nam
representing the northern and northwestern, margins of the South China Sea. The larger central
cluster of 18 sites is more heterogenous, encompassing both insular and mainland sites general y
lying in the Southern and Eastern portions of the region.
14 In contrast the reverse is not necessarily true; sites of national importance may be insignificant from a regional or global
perspective, see below.
8 PROCEDURE FOR SELECTION OF DEMONSTRATION SITES
Table 3
Selected physical and biological data set for mangrove potential demonstration sites bordering the South China Sea. (M = data unavailable)
Zones
True
Density
No.
No.
No
Present
% change
No
No Fish No Bird
Site
spp.
mangrove >1.5m % cover Crustacean.
Gastropod
migratory
Area
in area
Bivalve
spp.
spp.
assoc
spp.
high /Ha
spp.
spp.
bird spp.
China
Shangkou 812
4
11
9
11,980
90
65
40
33
95
28
76
Quinglangang 1,189
6
-56
25
10,183
80
60
50
62
90
39
32
DongXhaiGang 1,513
5
-14
16
8,433
80
32
24
27
84
43
35
Futien 82
3
-26
7
10,233
80
29
16
21
11
58
99
Fangchenggang
1,415
4 -10
10 12,300
90 67 62 40 71 42 145
Indonesia
Belitung Island
22,457
5
0
8
467
100
5
26
43
71
M M
Angke Kaput
328
9
-2
12
569
70
29
21
4
22
40
4
Batu Ampar
65,585
5
0
21
2,391
100
11
15
17
51
19
27
Ngurah Rai
1,374
6
27
25
660
100
38
10
32
34
38
42
Bengkalis 42,459
7
-15
18
490
99
12
8
9
3
16
15
Philippines
Busuanga 1,298
5
-5
24
7,550
90
6
15
36
9
45
27
Coron 1,296
5
-50
26
7,080
M
7 15 37
13
42
34
San Vicente
133
5
-15
14
3,780
80
6
15
36
13
36
40
Ulugan 790
4
-10
16
5,100
85
8
15
36
13
42
39
San Jose
483
4
-80
25
3,180
60
7
13
34
7
48
37
Subic 148
3
-20
23
1,420
90
8
14
35
16
44
57
Quezon 1,939
5
-40
32
4,000
80
5
14
37
11
44
37
Thailand
Trad Province
7,031
5
2
33
1,100
90
32
M M 55 98 24
Thung Kha Bay - Savi Bay
3,543
4
34
23
1,628
90
58
M M 36 13 8
Pak Phanang Bay
8,832
3
2
25
1,282
56
36
M M 85 72 45
Kung Kraben Bay
640
2
0
27
6,100
80
19
M M 35 75 16
Welu River Estuary
5,478
3
31
33
1,400
60
25
M M 52 69 15
Viet Nam
Tien Yen
2,537
2
-25
13
7,000
60
51
M M 79
M M
Xuan Thuy
1,775
3
98
11
9,500
75
61
25
30
90
31
62
Can Gio
8,958
3
100
32
6,000
80
28
17
32
103
96
34
Ca Mau
5,239
3
60
30
7,500
85
12
6
15
36
18
53
PROCEDURE FOR SELECTION OF DEMONSTRATION SITES 9
Table 4 Biodiversity and other environmental indicators for selected seagrass sites in the South China
Sea. (M = data unavailable)
Area
% Depth Seagrass Penaeid Gastropod Siganid Urchin Threatened Associated Migratory
Site Name
(ha) cover range
spp.
spp.
spp.
spp.
spp
spp.
ecosystems species
Cambodia
Kampot 25,240
45
2
6
M M M
M
2 2
2
China
Hepu
540
85
4
4
5
12
1
3
3
1
2
Liusha
900
90
3
2
5
11
1
1
2
2
2
LiAn 320
82
3.2
5
4
17
1
1
3
2
2
Xincun
200
87
2
4
4
6
1
1
2
2
1
Indonesia
Trikora Beach
280
95
2
9
3
16
3
4
6
2
3
Mapur 275
85
3
9
3
11
3
4
5
2
3
Malaysia
Tanjung Adang Laut Shoal
40
80
1.2
9
2
2
1
1
2
2
2
Tanjung Adang Darat Shoal
42
80
0.7
9
2
2
1
1
2
1
2
Merambong Shoal
30
80
0.7
10
2
2
2
M
2 1
2
Sungal Paka Shoal
43 M
4
2
M
2
M
2
1
1
1
Pulau Tinggi Mersing
3
70
3
6
M
M
2
2
2
1
2
Setiu Terengganu
3
70
6
3
M
3
2
M
1 1
1
Pulau Besar Mersing
3
70
4
5
M
1
2
M
2 1
2
Philippines
Cape Bolinao
2,500
75
1.7
9
7
23
6
4
3
2
1
Puerto Galera
114
95
4.5
9
3
11
2
3
3
2
1
Ulugan Bay
11
90
2.5
8
3
10
2
5
4
2
0
Puerto Princesa/Honda Bay
670
90
4
8
4
18
4
5
3
2
1
Thailand
Kung Krabane Bay
700
80
4
5
4
5
2
M
2 1
1
Surat Thani
500
65
3
6
2
73
3
1
2
1
2
Pattani Bay
273
80
3
4
8
35
5
M
2 1
2
Viet Nam
Bai Bon, Phu Quoc Is
2,000
70
6
7
3
46
1
3
5
2
2
Rach Vem, Phu Quoc Is
900
65
6
6
3
30
1
3
3
2
2
Con Dao Island
200
25
9.6
10
8
45
1
3
4
2
4
Phu Qui Island
300
50
2.5
6
2
35
3
3
3
2
2
Thuy Trieu (Khan Hoa)
800
60
1
7
4
10
3
2
4
2
0
10 PROCEDURE FOR SELECTION OF DEMONSTRATION SITES
Table 5
Data set for potential coral reef demonstration sites used in determining similarity and
difference between sites. (M = data unavailable)
No. of
live
No. of
Hard
No. of
No. of
No. of
endangered
coral
coral
Other
Site Name
coral
algae crustacean echinoderm
and
cover
reef fish ecosystem
species
spp.
species
species
threatened
(%)
species
species
Viet Nam
Cu Lao Cham
131
33.9
122
84
4
178
1
4
Nha Trang bay
351
26.4
55
69
27
222
2
3
Con Dao
250
23.3
84
110
44
202
2
4
Phu Quoc
89
42.2
98
9
32
135
2
3
Ninh
Hai
197 36.9 190
24
13 147 1
4
Ca Na bay
134
40.5
163
46
26
211
1
3
Ha Long - Cat Ba
170
43
94
25
7
34
2
4
Hai Van ş Son Tra
129
50.5
103
60
12
132
1
4
Bach Long Vi
99
21.7
46
16
8
46
M
2
Philippines
Batanes, Basco
M
55.00 41 M M 86 1
3
Bolinao/Lingayen Gulf
199
40.00
224
M M
328 2
4
Masinloc, Zambales
M
33.00 57 M M
249 2
4
Batangas bay/Maricaban
290
48.00
141
M M
155 2
4
Puerto Galera, Mindoro
267
33.00
75
M M
333 2
5
El Nido, Palawan
305
40.00
129
M M
480 2
5
Thailand
Mu Koh Chumporn
120
55
M
304 21
106
4 5
Mu Koh Chang
130
40
43
250
20
113
4
6
Mu Koh Ang Thong
110
55
7
136
21
106
4
1
Mu Koh Samui
140
40
7
136
21
106
4
5
Mu Koh Samet
41
35
38
134
11
74
4
5
Sichang
Group
90 20 40
304
11 86 4
2
Sattaheep
Group
90 33 40
304
15 75 4
2
Lan and Phai Group
72
18
40
304
15
75
2
2
Chao Lao
80
30
33
123
12
105
2
3
Prachuab 74
40
18
106
16
162
2
4
Koh Tao Group
79
45
7
136
21
106
2
4
Song Khla
12
20
2
M M 30 2
2
Koh Kra
80
40
M M M 80 1
2
Losin 90
40
M M M 90 1
2
Indonesia
Anambas 206
M
26 24 25
128
3 2
Bangka 126
M M
25 23
169
3 2
Belitung 164
38.46
M
10 35
170
3 2
Karimata 192
M M
15 15
200
3 2
Malaysia
Batu Malang, Pulau
96 62.6 3.8 M M
123 1
4
Tioman
Pulau Lang Tengah
86
41.3
3.1
M M
117 2
4
Pulau Lima, Pulau Redang
96
46.3
10
M M
113 1
4
Teluk Jawa, Palau Dayang
80
38.4
11.9
M M
156 1
4
Tun Mustapha, Sabah
252
M
69
M
45 375 4
4
Cambodia
KKCR2 67
29.3
M M
1 51 2
M
SHVCR1 34
23.1
M M
14 6 3
M
SHVCR2 23
58.1
3
M M 51 3
M
SHVCR3 70
M M M
14 42 3
M
KEPCR1 67
41
M M
14 51 3
M
PROCEDURE FOR SELECTION OF DEMONSTRATION SITES 11
Table 6
Final agreed data set used for the cluster analysis of wetland potential demonstration
sites. (M = data unavailable)
No.
No.
Total no.
Total no.
Site specific
Site Area
(ha)
wetland
migratory
fish spp. birds spp.
endemic spp.
types
spp.
Data set for estuaries
Welu
River
Estuary
10,400 52 74 2 21
M
Ban Don Bay Estuary
49,459
35
46
2
12
M
Thung Kha Bay-Savi Bay Estuary
5,204
86
115
2
33
M
Pattani Bay Estuary
6,149
215
93
2
43
M
Pak Phanang Bay Estuary
13,597
140
226
2
84
M
Pansipit
River
Estuary
15 75 24 1 10
1
Balat
Estuary
26,397 130 181 2 136
6
Tien River Estuary
100,691
155
41
3
20
2
Dong Nai River Estuary
49,711
155
130
2
22
5
Van Uc Estuary
6,990
123
118
2
90
2
Bach Dang Estuary
80,358
117
153
2
25
5
Tien
Yen
Estuary
24,738 82 57 2 31
5
Beilun Estuary
1,083
145
133
2
93
13
Pearl River Estuary
12,783
302
227
2
141
37
Koh
Kapik
Estuary
12,000 25 30 2 6
4
Data set for Inter-tidal Mudflats
Mu Koh Chang National Park Tidal Flat
65,000
11
72
1
16
M
Don Hoi Lord Tidal Flat
2,490
3
18
2
12
M
Mu Koh Ang Thong Marine National Park
10,200 75 53 1 13
M
Tidal Flat
Balayan Bay Tidal flats
75,000
M
25
2
20
15
Manila Bay Tidal Flat
30,000
M
25
3
20
10
El Nido, Palawan mudflats
54,303
M
26
2
10
1
Ca Mau Southwest Tidal Flat
60,711
147
171
2
27
3
Kim Son Tidal Flat
12,620
132
140
3
54 5
Dan zhou lingao Intertidal Flat
806
149
157
3
101 21
Hepu Intertidal
3,951
227
193
3
137 27
Shantou Inter-tidal
1,435
213
179
3
100 15
Russey Srok-Tourl Sragnam Tidal flat
4,890
10
9
2
3 2
Data set for Coastal Lagoons
Tam Giang-Cau Lagoon
21,600
171
73
3
35
5
Tra
O
Lagoon
2,000 67 55 3 25
3
Malampaya Sound
24,500
156
26
3
10
0
Degi Lagoon (Binh Dinh Province)
1,600
105
40
2
25
2
Thi Nai lagoon (Binh Dinh Province)
5,000
119
37
3
25
2
Wenchang
Lagoon
218 227 193 3 137
20
Beung Kachhang Lagoon
4,503
17
12
2
4 1
Table 7
Final agreed data set used for the cluster analysis of peat and non-peat swamp wetlands
potential demonstration sites. (M = data unavailable)
Total no. Total no. No. vascular No. resident No. wetland No. migratory
Site Area
(ha)
fish
birds
plant spp. mammal spp.
types
spp.
Data set for Non-peat swamp
Khao Sam Roi Yot National Park
9,808 34
150 M
14 3 M
freshwater marsh
Taal Lake freshwater
65,720
242
24
26
0
1
76
Peat swamp
Thale Noi Wildlife Non-hunting Area
45,700 30 202 260
7
2
60
Peat swamp
Thale Sap Song Khla Non- hunting
36,467 106 143
25
M
2
63
Area Peat swamp
Phru To Daeng Wildlife Sanctuary
20,120 42
194 14
61
2
21
Peat Swamp
Phru Kan Tulee Peat swamp
140
29
47
35
16
1
6
12 PROCEDURE FOR SELECTION OF DEMONSTRATION SITES
Figure 1 Cluster diagram of twenty-six mangrove sites
Figure 2 Cluster analysis of twenty-six potential seagrass
Figure
3 Cluster diagram of 44 coral reef sites
bordering the South China Sea based on
demonstration sites bordering the South China
bordering the South China Sea based on
Euclidean distance and mean proximity.
Sea based on Euclidean distance and mean
Euclidean distance and mean proximity.
proximity.
Figure 4 Results of Cluster Analysis of 15 estuarine sites
Figure 5 Results of Cluster Analysis of 12 inter-tidal
Figure 6 Results of Cluster Analysis of 7 coastal, brackish
bordering the South China Sea based on
mudflats bordering the South China Sea based
water lagoons on the margins to the South China
Euclidean distance and mean proximity.
on Euclidean distance and mean proximity.
Sea based on Euclidean distance and mean
proximity.
PROCEDURE FOR SELECTION OF DEMONSTRATION SITES 13
In the case of the seagrass sites the resulting dendrogram presented in Figure 2 shows that sites fall
into three major clusters with two outlying sites. The clusters in this case do not appear to reflect
recognisable geographic sub-divisions of the South China Sea, with for example, the Chinese Hepu site
falling into the uppermost cluster composed in the main of sites bordering the Gulf of Thailand.
Figure 3 presents the dendrogram resulting from a cluster analysis of the data for coral reef sites
presented in Table 5. Four clusters of sites are apparent, the lower cluster consisting of a grouping of
outlying sites that for various reasons are somewhat distinct from the remainder of the set. Figure 4
presents the outcome of the analysis of wetlands sites, and it should be noted that the number of sites
is not evenly distributed among the six clusters; the first cluster having many more sites (17) than any
other. It was decided therefore that three major groups should be considered, with the second and
third clusters being grouped as one, and the fourth, fifth, and sixth groups being combined as a third
cluster.
Figures 4, 5 and 6 present the dendrograms resulting from three separate cluster analyses conducted
on the data presented in Table 6. It can be seen that the data for estuaries suggests the existence of
two clusters, whilst the data for intertidal mudflats falls into three clusters and that for coastal lagoons
into two with a single outlier. The sample size for peat swamp and non-pear swamp forest is too smal
to permit a meaningful analysis.
The purpose of performing such analyses was to identify groups of similar sites and ultimately to
spread the interventions across different groups thus maximising the between site variation covered
by the selected demonstration sites.
DETERMINING REGIONAL PRIORITY OF POTENTIAL DEMONSTRATION SITES
National and Regional Priority. Whilst most countries have determined national priorities for
intervention including conservation, and sustaining coastal biodiversity, such priorities have generally
been determined and agreed independently of one another. The determination of national priority may
not necessarily include consideration of the regional and or global significance of a particular site or of
the species found there. Hence the top priority mangrove site in one country may fall far below the
lower priority sites from a second country, when both sets are compared from the perspective of
regional or global significance. One major chal enge faced by the South China Sea Project was the
determination of the comparative significance of different national areas of each habitat that included
consideration of transboundary, regional and global factors.
To initiate the process of determining the comparative regional importance of national sites it was
agreed by, the Regional Working Groups to develop a set of environmental criteria and indicators
reflecting the biological diversity, transboundary and regional significance of each site. A similar
system of criteria and indicators was also developed for the social and economic characteristics of the
sites. Both sets of criteria and indicators are presented in Appendix 1 of this document and were
reviewed by, the Regional Scientific and Technical Committee (UNEP, 2003c; 2003i) prior to being
applied to data from each site, to produce a score representing a regional view of priority.
Environmental Indicators
Table 8 presents a summary of the major classes of indicator, the number of individual indicators and
the weight assigned to them by each working group. It can be seen that all four groups adopted the
same four basic classes of indicator, but that the number of indicators within each class varies
somewhat between the groups.
Within each class of indicator a series of one or more specific indicators were identified on the basis
of the outcome of the initial site characterisations, hence indicators were not included by most groups
when it was apparent that the information and/or data were difficult to assemble as evidenced by the
frequency of missing data in the preliminary set.
Following a careful analysis of the range of values demonstrated by the site data available to the
meetings the regional working groups then considered the number of divisions and weighting that
would be appropriate to assign to any individual site value. Hence for example the number of
migratory bird species recorded from each mangrove site ranged from 13 at Trad Province in Thailand
to 145 species at Fangchenggang in China. For this indicator it was decided to distinguish five
categories based on an increment of 30 species and weights were assigned accordingly.
14 PROCEDURE FOR SELECTION OF DEMONSTRATION SITES
Table 8 Comparison of the number of indicators in each class of environmental indicator and the
weight assigned to different classes by the Regional Working Groups on habitats.
Mangrove Coral
Reef Seagrass Wetland
Class
No.
No.
No.
No.
Weight
Weight
Weight
Weight
Indicators
Indicators
Indicators
Indicators
Area
1
35 1
10 2
25 1
10
Biological Diversity15
7
50 8
60 8
60 5
60
Sub-set 1 - Species
5
30
-
-
7
52
-
-
Sub-set 2 - Community
2
20
-
-
1
8
-
-
Transboundary
1
10 3
20 1
5 1
15
significance
Regional/Global Signif.
2
5 1
10 1
10 2
15
Socio-Economic Indicators
Table 9 lists the indicators selected by the regional working groups as being indicative of socio-
economic conditions including indicators of national priority, stakeholder involvement and threats. As
in the case of the environmental indicators each regional working group discussed and agreed the
comparative weight that should be assigned to each class of indicator, then to individual indicators
within each class, finally deciding on the divisions and weights that should be assigned to the
observed values at any one site.
Table 9 Comparison of the number of indicators in each class of socio-economic indicator and the
weight assigned to different classes by the Regional Working Groups on habitats.
Mangrove Coral
Reef Seagrass Wetland
Class
No
No
No
No
Weight
Weight
Weight
Weight
Indicators
Indicators
Indicators
Indicators
Threats 116
2 -30
5 +15
2 -10
2 +20
National
1 20
3 25
1 16
3 40
Significance
Financial
2 20
1 20
2 22
1 20
Stakeholder
4 30
1 20
4 22
1 20
involvement
Transboundary
- -
1
20
- -
- -
Management
Management
- -
- -
3
30
- -
Potential
It was noted by all groups that a number of the indicators listed in Table 2 were highly subjective. A
major issue for discussion at the RSTC concerned the way in which the "threats" category should be
scored. Two regional working groups scored it positively with high threats getting high scores, whilst
two groups scored in the reverse manner, with low threats getting high scores. The rationale for the
latter being that, if the threat is large or strong enough then there is no possibility of mitigating it with
the resources available. The RSTC discussed this matter and agreed that the issue that should be
considered is not the threat itself, but rather the reversibility of the threat. Hence the "reversibility of
threat", should be scored such that high probability of reversing a threat received a higher score, and
low probability of reversing the threat received a low score.
Priority sites for intervention and Agreeing the outcome:
Having agreed the criteria, indicators and scoring system and conducted an independent cluster
analysis to group similar sites the rank order within each cluster was determined and a set of
demonstration proposals prepared for consideration by the Regional Scientific and Technical
Committee and the Project Steering Committee (UNEP, 2004e; UNEP, 2004f).
15 Biological diversity was sub-divided into two levels species and community diversity by two groups.
16 "Reversibility of threat", should be scored; with high probability of reversing a threat receiving a higher score, and low
probability of reversing the threat receiving a low score.
PROCEDURE FOR SELECTION OF DEMONSTRATION SITES 15
By the end of the fourth round of RWG meetings, each group had produced an agreed data set, an
agreed final cluster analysis, and agreed set of criteria and indicators for ranking sites and an agreed
ranking of individual sites within each cluster. These agreements were presented to the fourth
meeting of the Regional Scientific and Technical Committee together with the recommendations from
each group regarding the demonstration sites that should be financed from the GEF Project budget.
The RSTC reviewed these recommendations and outcomes making some comments and criticism
regarding some aspects of the application of the process but essentially approved the
recommendations for consideration by the Project Steering Committee.
The third meeting of the Project Steering Committee considered the recommendations of the RSTC
and the RWGs and accepted the recommendations with some minor additions/alterations based
primarily on political considerations of "equity".
The system was developed in an open and transparent manner through the process of consensus
involving all focal points, such that all parties understood and accepted the final outcome.
FINAL OUTCOMES:
The original outcome of the project was anticipated as being nine regional priority demonstration sites,
three each focussing on mangroves, seagrass and coral reefs.
Additional Outcomes not envisaged during project design:
1. Regionally prioritised listings of sites as follows:
Ě 26 mangrove sites
Ě 43 coral reef sites
Ě 26
seagrass
sites
Ě 40 wetlands sites (15 estuaries; 12 inter-tidal mudflats; 7 coastal lagoons; and 6 swamp
forest sites)
2. Draft proposals for intervention in 23 sites across all habitats types;
3. A regionally agreed process for determining regional priority that is independent, but takes
account of, national priorities that can be used in ranking the regional significance/of sites
either nationally or regionally in the future;
4. A regional GIS database having an extensive number of sites characterised in geographical
and environmental, including biological, terms;
5. Application of the approach at the national level in two countries to determine national
priorities for intervention;
6. Decisions taken in an amicable manner by consensus by all participating countries;
7. A procedure and process that serves as a potential model for replication elsewhere when
choices between alternative sites for intervention must be made based on financial limitations.
John C. Pernetta
July 18th 2007.
16 PROCEDURE FOR SELECTION OF DEMONSTRATION SITES
REFERENCES
Talaue-McManus, L. 2000. Transboundary Diagnostic Analysis for the South China Sea. EAS/RCU Technical
Report Series No. 14. UNEP, Bangkok, Thailand.
UNEP, 2000a. First Meeting of the Project Steering Committee for the UNEP/GEF Project "Reversing
Environmental Degradation Trends in the South China Sea and Gulf of Thailand". Report of the meeting,
UNEP/GEF/SCS/PSC.1/3, 110 pp. UNEP, Bangkok, Thailand.
UNEP, 2002a. First Meeting of the Regional Scientific and Technical Committee for the UNEP/GEF Project
"Reversing Environmental Degradation Trends in the South China Sea and Gulf of Thailand". Report of the
meeting, UNEP/GEF/SCS/RSTC.1/3. 30 pp. UNEP, Bangkok, Thailand.
UNEP, 2002b. First Meeting of the Regional Working Group for the Wetland Sub-component of the UNEP/GEF
Project "Reversing Environmental Degradation Trends in the South China Sea and Gulf of Thailand".
UNEP/GEF/SCS/RWG-W.1/3. 44 pp In: UNEP, "Reversing Environmental Degradation Trends in the South
China Sea and Gulf of Thailand", report of the First Meetings of the Regional Working Groups on Marine
Habitats. 179 pp. UNEP, Bangkok, Thailand.
UNEP, 2002c. First Meeting of the Regional Working Group for the Mangrove Sub-Component of the UNEP/GEF
Project "Reversing Environmental Degradation Trends in the South China Sea and Gulf of Thailand".
UNEP/GEF/SCS/RWG-M.1/3. 44 pp In: UNEP, "Reversing Environmental Degradation Trends in the South
China Sea and Gulf of Thailand", report of the First Meetings of the Regional Working Groups on Marine
Habitats. 179 pp. UNEP, Bangkok, Thailand.
UNEP, 2002d. First Meeting of the Regional Working Group for the Seagrass Sub-component of the UNEP/GEF
Project "Reversing Environmental Degradation Trends in the South China Sea and Gulf of Thailand". Report
of the meeting, UNEP/GEF/SCS/RWG-SG.1/3. 44 pp In: UNEP, "Reversing Environmental Degradation
Trends in the South China Sea and Gulf of Thailand", report of the First Meetings of the Regional Working
Groups on Marine Habitats. 179 pp. UNEP, Bangkok, Thailand.
UNEP, 2002e. First Meeting of the Regional Working Group for the Coral Reef Sub-component of the UNEP/GEF
Project "Reversing Environmental Degradation Trends in the South China Sea
and Gulf of Thailand".
Report of the meeting, UNEP/GEF/SCS/RWG-CR.1/3. 40 pp In: UNEP, "Reversing Environmental
Degradation Trends in the South China Sea and Gulf of Thailand", report of the First Meetings of the
Regional Working Groups on Marine Habitats. 179 pp. UNEP, Bangkok, Thailand.
UNEP, 2002f. Second Meeting of the Regional Working Group for the Wetland Sub-component of the UNEP/GEF
Project "Reversing Environmental Degradation Trends in the South China Sea and Gulf of Thailand". Report
of the meeting, UNEP/GEF/SCS/RWG-W.2/3. 25 pp. In: UNEP, Report of the Second Meetings of the
Regional Working Groups on Mangrove & Wetlands. UNEP, Bangkok, Thailand.
UNEP, 2002g. Second Meeting of the Regional Working Group for the Mangrove Sub-Component of the
UNEP/GEF Project "Reversing Environmental Degradation Trends in the South China Sea and Gulf of
Thailand". Report of the meeting, UNEP/GEF/SCS/RWG-M.2/3. 45 pp. In: UNEP, Report of the Second
Meetings of the Regional Working Groups on Mangrove & Wetlands. UNEP, Bangkok, Thailand.
UNEP, SEA START, 2002. Report of the UNEP/GEF/SCS and SEA START RC, GIS Workshop in support of the
GEF Project "Reversing Environmental Degradation Trends in the South China Sea and Gulf of Thailand".
UNEP/GEF/SCS/EW.1/3. 186 pp. UNEP, Bangkok, Thailand.
UNEP, 2003a. Second Meeting of the Regional Working Group for the Seagrass Sub-component of the UNEP/GEF
Project "Reversing Environmental Degradation Trends in the South China Sea and Gulf of Thailand". Report
of the meeting, UNEP/GEF/SCS/RWG-SG.2/3. 50 pp. In: UNEP, Report of the Second Meetings of the
Regional Working Groups on Coral Reefs and Seagrass. UNEP, Bangkok, Thailand.
UNEP, 2003b. Second Meeting of the Regional Working Group for the Coral Reef Sub-component of the
UNEP/GEF Project "Reversing Environmental Degradation Trends in the South China Sea
and Gulf of
Thailand". Report of the meeting, UNEP/GEF/SCS/RWG-CR.2/3. 64 pp. In: UNEP, Report of the Second
Meetings of the Regional Working Groups on Coral Reefs and Seagrass. UNEP, Bangkok, Thailand.
UNEP, 2003c. Second Meeting of the Regional Scientific and Technical Committee for the UNEP/GEF Project
"Reversing Environmental Degradation Trends in the South China Sea and Gulf of Thailand". Report of
the meeting, UNEP/GEF/SCS/RSTC.1/3. 72 pp. UNEP, Bangkok, Thailand.
UNEP, 2003d. Second Meeting of the Project Steering Committee for the UNEP/GEF Project "Reversing
Environmental Degradation Trends in the South China Sea and Gulf of Thailand". Report of the meeting,
UNEP/GEF/SCS/PSC.2/3, 49 pp. UNEP, Bangkok, Thailand.
UNEP, 2003e. Third Meeting of the Regional Working Group for the Mangrove Component of the UNEP/GEF
Project "Reversing Environmental Degradation Trends in the South China Sea and Gulf of Thailand". Report
of the meeting, UNEP/GEF/SCS/RWG-M.3/3, 54 pp. UNEP. Bangkok, Thailand.
UNEP, 2003f. Third Meeting of the Regional Working Group for the Wetland Sub-component of the UNEP/GEF
Project "Reversing Environmental Degradation Trends in the South China Sea and Gulf of Thailand". Report
of the meeting, UNEP/GEF/SCS/RWG-W.3/3, 42pp. UNEP. Bangkok, Thailand.
PROCEDURE FOR SELECTION OF DEMONSTRATION SITES 17
UNEP, 2003g. Third Meeting of the Regional Working Group for the Coral Reef Sub-component of the UNEP/GEF
Project "Reversing Environmental Degradation Trends in the South China Sea and Gulf of Thailand". Report
of the meeting, UNEP/GEF/SCS/RWG-CR.3/3. 33pp. UNEP. Bangkok, Thailand.
UNEP, 2003h. Third Meeting of the Regional Working Group for the Seagrass Sub-component of the UNEP/GEF
Project "Reversing Environmental Degradation Trends in the South China Sea and Gulf of Thailand". Report
of the meeting, UNEP/GEF/SCS/ RWG-SG.3/3. 45pp. UNEP. Bangkok, Thailand.
UNEP, 2003i. Third Meeting of the Regional Scientific and Technical Committee for the UNEP/GEF Project
"Reversing Environmental Degradation Trends in the South China Sea and Gulf of Thailand". Report of the
meeting, UNEP/GEF/SCS/RSTC.3/3. 78pp. UNEP. Bangkok, Thailand.
UNEP, 2004a. Fourth Meeting of the Regional Working Group for the Mangrove Component of the UNEP/GEF
Project "Reversing Environmental Degradation Trends in the South China Sea and Gulf of Thailand". Report
of the meeting, UNEP/GEF/SCS/RWG-M.4/3. 40 pps. UNEP. Bangkok, Thailand.
UNEP, 2004b. Fourth Meeting of the Regional Working Group for the Coral Reef Sub-component of the UNEP/GEF
Project "Reversing Environmental Degradation Trends in the South China Sea and Gulf of Thailand". Report
of the meeting, UNEP/GEF/SCS/RWG-CR.4/3. 48 pps. UNEP, Bangkok, Thailand.
UNEP, 2004c. Fourth Meeting of the Regional Working Group for the Seagrass Sub-component of the UNEP/GEF
Project "Reversing Environmental Degradation Trends in the South China Sea and Gulf of Thailand". Report
of the meeting, UNEP/GEF/SCS/RWG-SG.4/3. 48 pps. UNEP, Bangkok, Thailand.
UNEP, 2004d. Fourth Meeting of the Regional Working Group for the Wetland Sub-component of the UNEP/GEF
Project "Reversing Environmental Degradation Trends in the South China Sea and Gulf of Thailand". Report
of the meeting, UNEP/GEF/SCS/RWG-W.4/3. 48 pps. UNEP. Bangkok, Thailand.
UNEP, 2004e. Fourth Meeting of the Regional Scientific and Technical Committee for the UNEP/GEF Project
"Reversing Environmental Degradation Trends in the South China Sea and Gulf of Thailand". Report of the
meeting, UNEP/GEF/SCS/RSTC.4/3. 52 pps. UNEP, Bangkok, Thailand.
UNEP, 2004f. Third Meeting of the Project Steering Committee for the UNEP/GEF Project "Reversing
Environmental Degradation Trends in the South China Sea and Gulf of Thailand". Report of the meeting,
UNEP/GEF/SCS/PSC.4/3. 76 pps. UNEP, Bangkok, Thailand.
UNEP, 2005 Managing Multi-Lateral Intergovernmental Projects And Programmes: The Case of the UNEP/GEF
Project Entitled: "Reversing Environmental Degradation Trends in the South China Sea and Gulf of
Thailand". UNEP/GEF/SCS/INF.1, 15pp. UNEP, Bangkok, Thailand.
18 PROCEDURE FOR SELECTION OF DEMONSTRATION SITES
Appendix 1
Table 1
Indicators and weight for criteria used in ranking mangrove systems in terms of biological
diversity, transboundary, regional and global significance.
Indicator scale
Class of Indicator
Score
1. Area maximum 35 points
1.1 Total existing natural mangrove area (ha)
< 500
500-1,000
1,001-5,000
5,001-15,000
>15,000
Score 7
14
21
28
35
2. Biological diversity 50 points
2.1 Species diversity Score maximum 30 points
2.1.1 True mangrove species
< 10
10-20
21-30
30-40
>40
Score Maximum 14 points
1
3
6
10
14
2.1.2 Associate mangrove species
<10
11-20
>20
Score Maximum 4 points
1
2
4
2.1.3 Total fish species4
<50
51-150
>150
Score Maximum 4 points
1
2
4
2.1.4 Crustacean
40
41-90
>90
Score Maximum 4 points
1
2
4
2.1.5 Resident bird species
< 15
16-50
>50
Score Maximum 4 points
1
2
4
2.2 Community diversity 20 points
2.2.1 Number of zones or associations
1-2
3-4
>4
Score Maximum 11 points
3
6
11
2.2.2 Number of trophic levels below the top
1-2 3-4
>4
carnivore in the terrestrial food chain 9 points
Score Maximum 9 points
3
6
9
3. Transboundary significance 10 points
3.2 No migratory bird species include seasonal
<30 30-59 60-89 90-120 >120
migratory spp. and long distance migrators
Score Maximum 10 points
2
4
6
8
10
4. Regional/Global significance 5 points
4.1 Number of associate and true mangrove species
0.5 points for each endemic to a maximum of 2.5
found only in the South China Sea
Score Maximum 2.5 points
4.2 Number of endangered & threatened species
0.5 points for each endangered species to a maximum of 2.5
Score Maximum 2.5 points
Table 2
Indicators for socio-economic considerations used in the ranking of mangrove
sites bordering the South China Sea.
Indicator scale
Class of Indicator
Score
1. Reversibility of Threats
1. Change of area (% Lost over ten years)
<5
6-10
11-25
>25
Score ş max 20
20
15
10
5
2. Human
population
stress
(population density, people/Km2) in
<40 40-199
200-400 >400
the site 10
Score ş max 10
10
6
4
2
2. National significance/priority-Government support
1. National
priority
Low
Medium
High
Score ş max 20
2
10
20
3. Financial considerations /co-financing
1. Project cost ($US)
<150,000
150,000
>150,000
Score ş max 10
10
5
0
2. Co-financing commitment 10
<1/1
1/1
>1/1
Score ş max 10
0
5
10
4. Stakeholders involvement 30
Local government (in cash/in-kind)
Low
Medium
High
Score ş max 8
2
5
8
Central government (in cash/in-kind)
Low
Medium
High
Score ş max 8
2
5
8
NGOs/Civil Society (in cash/in-kind)
Low
Medium
High
Score ş max 8
2
5
8
Private Sector (in cash/in-kind)
Low
Medium
High
Score ş max 6
1
3
6
PROCEDURE FOR SELECTION OF DEMONSTRATION SITES 19
Table 3
Indicators and weight for environmental characteristics used in ranking of coral reef potential
demonstration sites.
Indicators Scale
of
Indicators
1 2 3 4 5
Biological diversity, 60 points
No. Hard coral Genera
< 30
31-40
41-50
51-60
> 60
Maximum score, 10
1
4
6
8
10
No. Hard coral species
< 100
101-150
151-200
201-300
> 300
Maximum score, 10
2
4
6
8
10
Percentage live coral cover
0-10
11-25
26-50
51-75
>75
Maximum score, 8
1
2
4
6
8
Percentage algal cover
>40
10-40
<10
Maximum score, 3
1
2
3
Number of coral reef fish genera
< 20
21-30
31-50
51-60
>60
Maximum score, 9
1
3
5
7
9
Number of coral reef fish species
<100
101-250
251-400
401-600
>600
Maximum score, 10
2
4
6
8
10
Number of other ecosystems
<1
1-2
> 3
Maximum score, 10
0
6
10
Transboundary Significance, 20 points
No. of Migratory Species
<5
5-10
> 10
Maximum score, 8
3
6
10
Tourism (yes or no)
no
yes
Maximum score, 5
0
5
Cross-boundary Fishing (yes or no)
no
yes
Maximum score, 5
0
5
Regional/Global Significance, 10 points
Number of endangered and threatened
<5 5-10 >10
species
Maximum score, 10
3
6
10
Area, 10 points
Area of coral reefs (ha)
< 100
101- 500
> 500
Maximum score, 10
3
6
10
Table 4
Indicators for socio-economic considerations of coral reef systems used in the ranking
of coral reef sites bordering the South China Sea.
Scale of Indicators
Indicators
1 2 3
Threats, 15 points
Reversibility of fishing impact
Low
Medium
High
Maximum
score,
3
1 2 3
Reversibility of development impact
Low
Medium
High
Maximum
score,
3
1 2 3
Reversibility of coral mining
Low
Medium
High
Maximum
score,
3
1 2 3
Reversibility of land-based pollution
Low
Medium
High
Maximum
score,
3
1 2 3
Natural impact( typhoon, bleaching and COT star fish)
Low
Medium
High
Maximum
score,
3
1 2 3
National significance, 25 points
Identified as a national priority
Rest
3
2
1
Maximum score, 10
0
3
6
10
Level of direct stakeholder involvement in management
Low
Medium
High
Maximum
score,
5
1 3 5
socio-economic value
Low
Medium
High
Maximum score, 10
3 6 10
Finance consideration - co financing, 20 points
Potential for co financing
< 1:1
1:1
> 1:1
Maximum score, 20
10
15
20
Local stakeholder/ community involvement, 20 points
Local stakeholder/ community involvement
Low
Medium
High
Maximum score, 20
10
15
20
Transboundary management, 20 points
Potential transboundary management
no
yes
Maximum score, 20
0
20
20 PROCEDURE FOR SELECTION OF DEMONSTRATION SITES
Table 5
Indicators and weight for seagrass systems of biological diversity, transboundary, regional
and global significance.
Indicator scale
Class of Indicator
Score
1. Area maximum 25 points
1.1 Total area (ha) maximum 15 points
<20 21-100 101-300 301-500 >500
Score 3
6
9
12
15
1.2 Percent coverage maximum 10 points
<20 21-40 41-60 61-80 >80
Score 2
4
6
8
10
2. Biological diversity 60 points
2.1 Species diversity Score maximum 52 points
2.1.1 Seagrass species
<2
3-4
5-6
7-8
>8
Score Maximum 15 points
3
6
9
12
15
2.1.2 Gastropods
<20
21-40
41-70
71-100
>100
Score Maximum 5 points
1
2
3
4
5
2.1.3 Penaeid shrimps
0
1-3
4-5
6-7
>7
Score Maximum 8 points
0
2
4
6
8
2.1.4 Sea Urchins
0
1-2
>2
Score Maximum 4 points
0
2
4
2.1.5 Siganids
0
1-2
3-4
>4
Score Maximum 8 points
0
2
5
8
2.1.6 Holothurians
0
1-5
>5
Score Maximum 8 points
0
4
8
2.1.7 Starfish
0
1-3
>3
Score Maximum 4 points
0
2
4
2.2 Community diversity Score maximum 8 points
2.2.1 Number of other aquatic ecosystems
1
2
>2
Score Maximum 8 points
3
5
8
3. Transboundary significance 5 points
3.1 Number of migratory aquatic species
Score Maximum 5 points
score 1 point per species
4. Regional/Global significance 10 points
4.1 Number of endangered & critically endangered aquatic species
Score Maximum 10 points
score 1 point per species
Table 6
Indicators for socio-economic considerations of seagrass systems, to be used in
the ranking of seagrass sites bordering the South China Sea.
Indicator scale
Class of Indicator
Score
1. Reversibility of Threats maximum 10 points
1.1 From destructive fishing
Low
Medium
High
Score ş max 5
1
3
5
1.2 From pollution
Low
Medium
High
Score ş max 5
1
3
5
2. National significance/priority-Government support maximum 16 points
2.1 National priority
Low
Medium
High
Score ş max 16
5
10
16
3. Financial considerations /co-financing maximum 22 points
3.1 Project cost ($US)
>150,000
150,000
<150,000
Score ş max 10
3
6
10
3.2 Co-financing commitment
<1/1
1/1
>1/1
Score ş max 12
4
8
12
4. Stakeholders involvement maximum 22 points
4.1 Local government (in cash/in-kind)
Low
Medium
High
Score ş max 6
2
4
6
4.2 Central government (in cash/in-kind)
Low
Medium
High
Score ş max 4
1
2
4
4.3 NGOs/Civil Society (in cash/in-kind)
Low
Medium
High
Score ş max 6
2
4
6
4.4 Private Sector (in cash/in-kind)
Low
Medium
High
Score ş max 6
2
4
6
5. Management potential maximum 30 points
5.1 Accessibility
Low
Medium
High
Score ş max 10
3
6
10
5.2 Existing institutional framework
Low
Medium
High
Score ş max 10
3
6
10
5.3 Existing information
Low
Medium
High
Score ş max 10
3
6
10
PROCEDURE FOR SELECTION OF DEMONSTRATION SITES 21
Table 7
Environmental Indicators and Scores for Criteria used in the Ranking of Peat and Non-Peat
Swamp Wetlands potential demonstration sites. In the case of inter-tidal mudflats, estuaries
and coastal lagoons the criterion on the Number of mammals was omitted.
Environmental Indicators
1. Area (ha) 10%
Area 10%
100 - 10,000 10,000-50,000 50,000-100,000 100,000-150,000 > 150,000
2%
4%
6%
8%
10%
2. Biological diversity 60%
2.1 No. of Fish species 18%
1 - 50
51 - 100
101 - 150
151-200
> 200
4%
7%
11%
15%
18%
2.2 No. of bird species 18%
1 - 50
51 - 100
101 - 150
151-200
> 200
4%
7%
11%
15%
18%
2.3 No. of plant species 6%
1- 100
101-200
201-250
251-300
> 300
1%
2%
3%
5%
6%
2.4 No. of mammal species 6%
1-10
11- 20
21 - 30
31-50
> 50
1%
2%
3%
5%
6%
2.5 Wetland types 12%
1
2
3
4
> 5
2% 4% 6% 10% 12%
3. Transboundary Significance 15%
3.1 No. of migratory. Species 15%
1 - 10
11- 20
21 - 30
31-40
> 40
3%
6%
9%
12%
15%
4. Regional/Global Significance 15%
4.1 No. of endemic species 7%
1
2
> 3
2%
4%
7%
4.2 No. of endangered. species 8%
1 - 6
7 -10
> 10
3%
5%
8%
Table 8
Socio-economic Indicators and Scores for wetlands bordering the South China
Sea.
Socio-Economic indicators
1. Threats 20%
1.1 Reversibility of External sources of change, 10%
Low
Medium
High
2%
6%
10%
1.2 1 Reversibility of Internal source of change, 10%
Low
Medium
High
2%
6%
10%
2. National significance 40%
2.1 Identified as a national priority, 25%
1
2
3
25%
15%
10%
2.2 Level of direct stakeholder involvement in management, 10%
Low
Medium
High
2%
6%
10%
2.3 Commitments to RAMSAR, 5%
no
planned
yes
0 3% 5%
3. Financial considerations 20%
3.1 Potential for co financing (% of potential project budget), 20%
25
50
100
5%
10%
20%
4. Local stakeholder involvement 20%
4.1 Local stakeholder/community involvement
Low
Medium
High
2% 12% 20%