


United Nations
UNEP/GEF
Environment Programme
South China Sea Project
Global Environment Facility
SEA START RC
UNEP/GEF/SCS/EW.1/3
Original: ENGLISH
Distr. Restricted
9th August 2002
UNEP/GEF/SCS and SEA START RC, GIS Workshop
in support of the UNEP/GEF Project
"Reversing Environmental Degradation Trends
in the South China Sea and Gulf of Thailand"
Bangkok, Thailand, 7th Ł 9th August 2002
REPORT OF THE UNEP/GEF/SCS AND SEA START RC, GIS WORKSHOP
IN SUPPORT OF THE UNEP/GEF PROJECT
"REVERSING ENVIRONMENTAL DEGRADATION TRENDS
IN THE SOUTH CHINA SEA AND GULF OF THAILAND"
UNEP/GEF/SCS/EW.1/3
TABLE OF CONTENTS
1. OPENING OF THE WORKSHOP ..........................................................................................1
1.1 WELCOME ADDRESS........................................................................................................ 1
1.2 INTRODUCTION OF PARTICIPANTS......................................................................................... 1
2. RATIONALE FOR THE WORKSHOP .................................................................................... 1
3. INTRODUCTION OF THE EXISTING GIS DATABASE AT SEA START RC ............................. 2
4. TECHNICAL DISCUSSION OF THE GIS DATABASE REQUIREMENTS FOR THE HABITAT
COMPONENT OF THE UNEP /GEF PROJECT ENTITLED: "REVERSING ENVIRONMENTAL
DEGRADATION TRENDS IN THE SOUTH CHINA SEA AND GULF OF THAILAND"............... 5
4.1 MANGROVES ................................................................................................................. 5
4.2 CORAL REEFS................................................................................................................ 6
4.3 SEAGRASS.................................................................................................................... 7
4.4 WETLANDS.................................................................................................................... 7
5. TECHNICAL DISCUSSION OF THE GIS DATABASE REQUIREMENTS FOR THE POLLUTION
COMPONENT OF THE UNEP/GEF PROJECT ENTITLED: "REVERSING
ENVIRONMENTAL DEGRADATION TRENDS IN THE SOUTH CHINA SEA AND
GULF OF THAILAND"....................................................................................................... 10
6. TECHNICAL DISCUSSION OF THE GIS DATABASE FOR THE FISHERIES COMPONENT OF
THE UNEP/GEF PROJECT ENTITLED: "REVERSING ENVIRONMENTAL DEGRADATION
TRENDS IN THE SOUTH CHINA SEA AND GULF OF THAILAND" ...................................... 11
7. FORMAT OF THE REGIONAL META-DATABASE ............................................................... 11
8. POTENTIAL TECHNICAL ASSISTANCE TO BE PROVIDED BY SEA START RC AND
THE PROJECT COORDINATING UNIT TO THE FOCAL POINTS FOR THE
PROJECT COMPONENTS AND SUB-COMPONENTS.......................................................... 12
9. GENERAL DISCUSSION AND PRESENTATION OF SUMMARY OF THE WORKSHOP
CONCLUSIONS ................................................................................................................ 13
10. ADOPTION OF THE REPORT AND TECHNICAL AGREEMENTS.......................................... 14
11. CLOSURE OF THE WORKSHOP ...................................................................................... 14
i
UNEP/GEF/SCS/EW.1/3
LIST OF ANNEXES
Annex 1
List of Participants
Annex 2
List of Documents
Annex 3
Agenda
Annex 4
SEA START RC Presentation of Common Base Maps
Annex 5
Habitat Component GIS Requirements: Mangrove, Coral Reef, Seagrass, and
Wetland
Annex 6
Fisheries Component GIS Requirements
Annex 7
Pollution Component GIS Requirements
Annex 8
Example Set of Questionnaires for all Components and Sub-components for
Indonesia
Annex 9
Regional Meta-database Format for the UNEP/GEF South China Sea Project
Annex 10
Agreed Workplan for the GIS Related Activities in the UNEP/GEF South China
Sea Project
UNEP/GEF/SCS/EW.1/3
Page 1
1.
OPENING OF THE WORKSHOP
1.1
Welcome address
1.1.1
The Project Director, Dr. John Pernetta, opened the workshop on behalf of UNEP and SEA
START, and provided an introduction to the UNEP/GEF Project entitled "Reversing Environmental
Degradation Trends in the South China Sea and Gulf of Thailand" and its overall objectives. He stated
that this significant GEF project (32 million US$), implemented by UNEP, represents the first attempt to
develop regionally co-ordinated programmes of action designed to reverse environmental degradation
particularly in the area of coastal habitat degradation and loss, halt land-based pollution and address the
issue of fisheries over-exploitation.
1.1.2
Dr. Snidvongs then gave a brief background to the work of the Southeast Asia START (Global
Change SysTem for Analysis, Research and Training), Regional Centre (SEA START RC) an
organisation hosted by Chulalongkorn University. The purpose of the Regional Centre is to encourage
multidisciplinary research on the interactions of human populations and environment affecting and being
affected by, global changes. SEA-START RC has established a regional GIS database comprising
numerous publicly available data sets from both the natural and social sciences domains, which can
potentially be used as a GIS platform for the UNEP/GEF Project.
1.2
Introduction of participants
1.2.1
The Participants briefly introduced themselves to the workshop and provided an outline of their
background and level of expertise in using GIS systems. The list of participants is appended as Annex 1
to this report. All countries were represented by participants with a reasonable level of expertise in either
GIS or in one of the components (fisheries, land-based pollution, or habitats) covered by the project,
2.
RATIONALE FOR THE WORKSHOP
2.1
The Project Director explained the rational for convening the workshop, including the objectives
and expected outputs, which were to secure agreement on the technical specifications for the regional
GIS database and meta-database to be used in the UNEP/GEF Project. Agreement regarding a
common regional approach to data management was required in order that the various national
committees could use a common platform in assembling data and information relevant to the three
substantive components of the project, namely habitat degradation and loss, land-based pollution and
over-exploitation of fisheries. The list of documents and agenda of the meeting are attached as Annexes
2 and 3 respectively. He explained that the use of a common GIS system, will allow the collection of
compatible and comparable data that will enable comparisons between countries and between project
components and can be used to make recommendations to the Project Steering Committee regarding
priorities for action needed to reverse environmental degradation in the area of the South China Sea.
2.2
Dr. Anond Snidvongs enlarged upon the comments of Dr. Pernetta. He highlighted particularly
the role that participants could play during the workshop in reaching a common understanding on the
geographic units to be used. He stated that the workshop will be informal, and encouraged participants
to intervene at any time. He also noted that the GIS work will need to be done as far as possible at the
national level, and that the participants, as the designated GIS contact points, will need to relay
information on the outcome of the workshop to the Specialised Executing Agencies (SEAs) in each
country.
2.3
Ms. Vergara (Philippines) asked whether the agreements on the format of the database reached
at this meeting would be placed in a formal protocol. In response Dr. Anond stated that there were some
formats, which would need to be discussed and defined, but at this stage a fully comprehensive protocol
was not envisaged for all the attributes. The first step would be to develop and agree on a base map for
the region in order that by the end of this year, the project should have, for example, regional
distributions for all the major habitats in the region. The framework and format for the site-specific
characterisations that would take place in the second year will be refined during the second round of
component and sub-component Regional Working Group (RWG) Meetings. Thus it would be premature
to establish a strict protocol for this set of activities at this stage.
UNEP/GEF/SCS/EW.1/3
Page 2
2.4
Dr. Pernetta explained that during the first RWG meetings, the kinds of data, and information to
be assembled had been discussed and decided. However, it is likely that much of this information will
not be available at the level of detail discussed, if at all. Therefore the requirements are likely to be re-
defined and reduced in extent during the second round of RWG meetings later this year. At this
workshop the intention was to develop an overall framework in which that data and information can be
placed.
2.5
Mr. Jiang noted that there is a large variation in available data. For example, there is an
abundance of information on coral reefs, but very little data available on sea grass. He added that this
workshop was not originally planned, but after the first round of RWG meetings, it became apparent that
there was a need for regional agreement on the format for the data and information. The framework
agreed during this workshop will be used at the 2nd RWG meetings, starting in September, as the basis
for further deliberations on the data and information that can reasonably be expected to be collected.
2.6
Mr. Winardi, from Indonesia, asked at what scale the base map is to be. He also expressed
some confusion on the relationship between the GIS designated individuals in this workshop and the 6
Regional Working Groups, and asked if there was to be a separate budget allocation for the GIS work in
country.
2.7
In response to the first question, Dr. Anond noted that initially a scale of 1:250,000 would be
used for the regional base map, but that a higher resolution may be possible later, depending on the
available data. In answering Mr. Winardi's second question Dr. Pernetta said that the GIS activity was
not outside the agreed scope of the existing working groups, and national committees and that, funds
had been allocated to the national committees for the preparation and assembly of national level data
and information. Money can be reallocated from within the existing national budgets, and this could
receive support through presentation of the needs to the PSC when the next year's budget was tabled
for approval. He noted that there should be technical GIS expertise on the National Committees and
stated further that the convening of this workshop had been funded using savings from the first round of
Regional Working Group meetings.
2.8
There followed some general discussion regarding the GIS base maps or platforms that would
be acceptable, and the transferability from systems, such as that used in China, to ARCview shapefiles,
or other internationally accepted GIS format. Dr. Anond stated that there should be no problem with this.
2.9
Mr. Bastiawan (Indonesia) stated that there is also sometimes a problem with data in different
formats from different institutions within the country, and asked how this should be addressed. Dr.
Anond agreed that this would be a problem common, to a number of countries, and that difficulties such
as these suggest that, the project should not attempt to be too ambitious. He felt that each RWG
meeting report indicated that the working groups were too ambitious in their data requirements, but he
was sure that this would be refined at the second RWG meetings. We can make some
recommendations however at this workshop. The questionnaires that were distributed prior to this
workshop were not to be completed as is, but are for the consideration of participants, to recommend
how we can reduce the data required.
2.10
Mr. Bastiawan (Indonesia) asked who could access the data that is collected during the project.
Dr. Pernetta explained that the UN has an open data policy, however, there may be data sets that
countries do not wish to make public. In this case, classified information would be considered as not
available whilst some other data sets might be partially available in processed form, though the raw data
might be classified. Restrictions on data availability and access depend on the individual country and
any conditions they might wish to impose on its availability and/or use. Dr. Narawat (Thailand)
suggested that the GIS experts and SEAs should consult with the SCS National Focal Point and/or
National Technical Focal Points for further information on such restrictions and what information can be
provided to the regional database.
3.
INTRODUCTION OF THE EXISTING GIS DATABASE AT SEA START RC
3.1
The Director, of the SEA START RC, Dr. Anond Snidvongs, introduced the present structure of
the South China Sea GIS database operated by SEA START RC, including the structure, contents, and
UNEP/GEF/SCS/EW.1/3
Page 3
sources of existing data, and provided suggestions for further improvements that might be possible with
the assistance of the experts from the participating countries. Deatilas of the basemaps are attached in
Annex 4 of this report. He noted that the three key elements included the shoreline, administrative
boundaries and river drainage network.
3.2
Ms. Vergara asked if the World Vector Shoreline (WVS) is the same as that used by the World
Resources Institute and Dr. Anond confirmed that it was.
3.3
Dr. Anond asked participants whether there were shoreline maps available in each country and
whether these should be used in place of the WVS shoreline. The responses indicated that the following
maps were available:
Ę Cambodia
1:50k
Ę China
1:250k
Ę Indonesia
1:250k, with some areas at higher resolution
Ę Malaysia
available, but not sure of the scale.
Ę Philippines
Not complete, but officially is 1:50k
Ę Thailand
1:250k
Ę Vietnam
1:25k, 1:50k, 1:100k,.
3.4
Dr. Anond noted that countries will now need to decide what they want to make available to the
project, bearing in mind that whatever is submitted will be made generally available to others. He added
that it is up to the group to decide whether to use a remote sensing shoreline, but it will be very difficult
within the two months available, to change to something other than WVS. Countries will have to decide
whether to use the WVS shoreline or locally available alternatives such as the TEI shoreline for Thailand
or the NAMRIA shoreline for the Philippines.
3.5
It was agreed that the following tasks relating to the shoreline base map needed to be
completed at the national level prior to the next round of working group meetings:
Ę To review geographic position of shoreline and correct/replace with a more acceptable GIS if
necessary;
Ę To review any missing/non-existent features (such as islands) and add/remove from map; and,
Ę If new data from national sources are added or used to replace those on the existing GIS file,
provide original coordinate system of that data according to format given in file "GIS
coordinate.doc" and dispatch to SEA START RC.
It was noted that the shoreline will be the critical geo-reference for habitat components to locate the
position of habitat units, and that it is very important that every component of each country use the
SAME shoreline.
3.6
Dr. Anond then presented the regional database of administrative boundaries, based on the
CEISIN world database and requested that participants check the names and the boundaries of the
administrative units in their own countries, and correct as necessary, as some reorganisation of
administrative units may have occurred. He also said that, all countries need to use a standard Roman
alphabet script, for consistency.
3.7
Mr. Chen Xiaoxiang from China stated that information on some administrative boundaries in
China may be restricted, and how should that problem be addressed? He further stated that the SEA
START map presented here is not accurate, and asked whether China should provide data on the
presented base map, or the correct one? In response Dr. Anond noted that if there were problems
releasing a more accurate map, and if this map is inaccurate, then the existing map could be used, ad
interim and that the decision regarding the choice of baseline maps lay with the individual countries. Dr.
Anond also noted that at this point we do not have a clear definition of the boundaries of the SCS,
particularly in the cases of China and Indonesia, countries whose entire shoreline does not border the
South China Sea marine basin.
3.8
There followed some general discussion on the ID codes that should be used, and whether the
system could use existing codes, for example those used in systems such as Reefbase. Dr. Anond
UNEP/GEF/SCS/EW.1/3
Page 4
said that SEA START had in consultation with the UNEP/GEF PCU devised a code in the attribute
table. However, they would also look at existing codes to see if they could be used. He added that
immediately after this workshop the SEA will decide exactly which provinces would be covered under
which component, as these will not be the same across all components.
3.9
Mr. Sokha (Cambodia) reported that Cambodia has changed some administrative boundaries,
notably with the establishment of Sihanoukville as a separate administrative unit. He also asked whether
the code for Cambodia could be changed from Kh, as this was outdated now. Dr. Anond noted that an
alternate could be used but noted further that the Internet code for Cambodia was kh.
3.10
It was agreed that the following tasks relating to the administrative units base map need to be
completed at the national level prior to the next round of working group meetings:
Ę To review and update the WRI/CIESIN geographic position of boundary of general administrative
units of the country;
Ę To review the attribute table and correct for names and other attributes; and,
Ę If new data from national source are added or to replace to the GIS, provide original coordinate
system of that data according to format given in file "GIS coordinate.doc".
It should be noted that, administrative boundaries will be a basic geographic unit used in the Fisheries
and Pollution Components, and that administrative units will be represented as `polygons'.
3.11
Dr. Kirkman queried whether the decision to use latitude and longitude, instead of the UTM
system (Eastings and Northings), for locations, was final. Dr. Anond replied that so far Latitude and
Longitude had been used, but this was not finally decided, and use of the UTM system was certainly
possible. He asked what the countries are currently using. Cambodia, and China, currently use the UTM
system, Indonesia uses both geographic and UTM, Malaysia was not sure, Thailand and Viet Nam use
both WGS 84 and UTM, and the Philippines are converting Geographic to UTM.
3.12
Dr. Anond then asked the GIS experts whether it would present a problem having a wide range
of UTM zones across countries. Mr. Winardi (Indonesia) replied that it would be a problem using the
UTM system when map sheets from different zones are used.
3.13
Dr. Anond noted that it would be necessary to establish a central zone for all countries to use,
when combining map sheets from countries using the UTM system with different reference zones. Dr.
Anond queried what the advantage of using the UTM system would be, within the framework of the
project, whereupon Dr. Kirkman replied that distances and areas can be easily measured e.g. distances
on shore lines and areas of habitats etc.
3.14
It was agreed that countries could submit data in any form, and that SEA START can convert to
the finally agreed format, but that to do so, countries must clearly indicate the co-ordinate system,
projection, datum ellipsoid, and meridian, that had been used in assembling the original data set. As
data are not being used to define sensitive boundaries or for navigation, minor discrepancies are not of
great significance. Mr. Winardi noted that it is extremely important to record the datum in order to
convert to WGS 84.
3.15
Dr. Anond reported on the Digital Chart of the World, which has river and drainage network maps
at 1:1million and was included in the SEA START database as the catchment maps are important for
identifying pollution sources, although he noted that every river and stream may not be needed. He
asked countries to check the existing map, and remove the minor tributaries etc. if it is thought that they
do not have a significant impact on the coastal area. He requested participants to add the names to the
rivers that they considered important, as no names were on the current map.
3.16
In response to a question from the Indonesian participant, Dr. Anond stated that if estuaries are
important for wetlands or other habitats, then the information is needed as a polygon.
3.17
In response to a question regarding classified data, Mr. Jiang stated that if China wants to
propose a demonstration site, it will need detailed data and information to support its proposal, since the
Project Steering Committee was unlikely to agree to demonstration sites for which insufficient data are
UNEP/GEF/SCS/EW.1/3
Page 5
presented. He noted further that at this workshop participants are deciding on issues of format and
technical details rather than the nature of the data required. It is up to the National Committees to
decide what data they will provide, but the less data provided, the weaker the case for a demonstration
site in any country.
3.18
Dr. Anond concluded by saying that, if the existing base map and information are used then,
work can proceed quickly. However, if countries want to use their own digital shoreline, this needs to be
distributed to their SEAs immediately, and also sent to SEA START RC, if the work required before the
next RWG2 was to be accomplished on schedule.
3.19
It was agreed that the following tasks relating to the river basins base map (Annex 4), need to
be completed at the national level prior to the next round of working group meetings:
Ę To review and update the DCW river network or replace with national GIS if necessary;
Ę To select only rivers and segment of rivers that are signification and relevant to the context of
the SCS Project, especially to the wetland (estuary) and land based pollution components, and
remove other irrelevant river/stream lines;
Ę Check the position of the selected river mouths and make corrections if necessary;
Ę For each river segment selected, provide name of river that segment belong to as required in
attribute table; and,
Ę If new data from national sources are added or to replace to the GIS, provide original coordinate
system of that data according to the format given in file "GIS coordinate.doc".
4.
TECHNICAL DISCUSSION OF THE GIS DATABASE REQUIREMENTS FOR THE HABITAT
COMPONENT OF THE UNEP/GEF PROJECT ENTITLED: "REVERSING ENVIRONMENTAL
DEGRADATION TRENDS IN THE SOUTH CHINA SEA AND GULF OF THAILAND"
4.1
Mangroves
4.1.1
Dr. Anond presented general technical considerations regarding the acquisition and inclusion of
data in the GIS database with a view to facilitating discussion and agreement on a regional format for the
habitat data sets covering the four habitat sub-components of the project (Annex 5). He noted that in
some instances the GIS specialists in each country might be in a position to immediately identify
current sources of electronic data relating to mangroves, coral reefs, seagrass and wetlands that could
be immediately incorporated into the GIS database. A summary of these general considerations is
contained in the introductory section of Annex 5 of this report.
4.1.2
Dr. Anond explained to the meeting that the resolution in the current base map is 1:250,000,
however, depending on available data, it may be necessary in some instances to go to 1,000,000. At
1:250,000, anything smaller than 250 m2 will appear as a single point. Larger areas will be polygons,
while areas longer than 250m, but less than 250m wide, would appear as a line.
4.1.3
Dr. Kirkman raised several questions relating to the scope of work involved in the data collection
on mangroves, for example density of stand needs to be included, as does the distribution along the
shore line, etc. It was agreed that these questions should be passed to the RWG-M2 for resolution.
4.1.4
Dr. Anond went briefly through the draft questionnaire for acquiring the GIS data on mangroves,
and Ms. Vergara asked how dynamic information was to be handled since the present list is all static.
Dr. Anond responded by stating that the RWG-M had decided to focus initially on a description of the
present state of mangroves and that issues relating to change in state can be further discussed with
SEAs in each country, for consideration at the next meeting of the RWG-M.
4.1.5
Dr. Anond also noted that if data are not available, then it should be reported as N/A. The codes
for availability of data should be included in the agenda for the next round of RWG meetings. Mr. Jiang
noted that for wetlands and land-based pollution, there is already an agenda item to present the results
of this meeting to the RWGs. The RWG will consider this report and then decide how to collect the data
and information required. Dr. Cabanban added that if as a result of this meeting, participants thought
UNEP/GEF/SCS/EW.1/3
Page 6
anything should be added to the agendas for the RWG meetings, they should inform the relevant Focal
Point in the SEA.
4.1.6
In response to a question on whether the work to be undertaken now would be duplicated when
working with the demonstration sites, Mr. Jiang replied that regional information on distribution, and
regional significance, were needed before the PSC makes decisions on the choice of demonstration
sites, after which the PSC would need site specific information. The decision on demonstration sites will
not rely totally on GIS data, as there are other criteria to be developed. The initial requirement is to
identify significant sites, from which the demonstration sites can be chosen. A total of nine sites will be
selected for funding from current resources, although it is expected that in future additional sites will also
be added utilising funds sourced elsewhere.
4.1.7
In response to a question from Ms. Vergara, on acknowledging sources of information, Dr.
Anond pointed out the part of the questionnaire where this information was collected.
4.1.8 It was agreed that the following tasks relating to the mangrove subcomponent (Annex 5) need to
be completed at the national level prior to the next round of working group meetings:
Ę To review the position and name of each mangrove polygon from R@R/WCMC and make
corrections if necessary, especially to conform with the nationally agreed shoreline;
Ę To add data from national sources as polygon, line (arc) or point according to the project's
arbitrary criteria;
Ę To give an ID to the feature in each theme as xxyyyy, where xx = country code and yyyy =
number from 0001 to 9999; and,
Ę If new or replacement data from national sources are added to the GIS, provide original
coordinate system of that data according to the format given in file "GIS coordinate.doc".
4.2
Coral Reefs
4.2.1
Dr. Anond presented the reefs at risk data on the base map to the meeting, as a guideline. He
asked that the CR SEA in each country review the names and correct position, size, and shape, and
update as much as possible the data in the table for each site. The first three fields in each table are the
bare minimum required.
4.2.2
In response to a question from Dr. Kirkman on the scale of the maps, Dr. Anond stated that the
scale was appropriate at this stage for the available regional information. As more information is
available, it can be added to the table, and it may then be appropriate to reduce the scale to 1 in 50,000.
4.2.3
Dr. Anond then presented the draft questionnaire for coral reefs for the consideration of the
meeting. Ms. Vergara informed the meeting that the Philippines had already reviewed the questionnaire,
and sent comments for consideration by the SEA START and PCU. Mr. Jiang informed the meeting that
each national SEA needs to check the information on the CDs that will be distributed during this
meeting, and make corrections. If SEA START does not get the verification of the existing data, or
corrections, they will assume that the data set is acceptable as the baseline for the Project. It was the
responsibility of participants to pass the results of this meeting to the component working groups. An
information paper with contact details for each Working Group had been distributed during the meeting.
The PCU will distribute the report of this meeting to the National Technical Focal Points and the Focal
Points in the Specialised Executing Agencies in each country.
4.2.4
Dr. Cabanban provided some clarification on the data that were put into reef base for the reefs at
risk, and noted in particular that, different projections, were used by, different countries. When the
information is reviewed, this should be considered. She also referred the meeting to the Reefs at Risk
website for further information.
4.2.5 It was agreed that the following tasks relating to the coral reefs sub-component (Annex 5) need
to be completed at the national level:
UNEP/GEF/SCS/EW.1/3
Page 7
Ę To review the position and name of each coral reef theme from R@R and make necessary
corrections, especially to conform with the nationally agreed shoreline;
Ę Verify R@R points that are close to each other if they are the same location;
Ę To add and update coral reef feature data as polygon or line (arc) or point as appropriate;
Ę To classify each coral reef into predefined types
Code
Type
1
Atoll
2
Barrier
3
Fringing
4
Patch
Ę To give an ID for each coral reef in each theme as xxyyyy, where xx = country code and yyyy
= number from 0001 to 9999; and,If new or replacement data from national sources are added to
the GIS, provide original coordinate system of that data according to the format given in file "GIS
coordinate.doc".
4.3
Seagrass
4.3.1
Dr. Anond said that at present, he was not aware of any regional GIS data available on
seagrass, though paper maps are available for some areas. It is however a simple matter to digitise any
existing paper maps, and asked the meeting to share any existing information they had on seagrass
distributions with the PCU and SEA START RC. The responses from participants indicated that there
are some GIS data available on seagrass in Cambodia, and that Malaysia has some paper maps of
seagrass distribution. Dr. Anond then showed the base map, and demonstrated how to add data to the
map.
4.3.2
In response to a question from Ms. Vergara on the use of drop down menus to make selections,
to minimise data entry errors, Dr. Anond said that his team would investigate and see what was
possible.
4.3.3
Dr. Kirkman pointed out that the resolution agreed at the first meeting of the RWG-S was 1
hectare, i.e. a scale of 1:100,000, not 1:250,000, and that this needs to be addressed at next the RWG-
S meeting.
4.3.4
Dr. Anond then went through the draft questionnaire for seagrass. There followed some general
discussion on classifications and codes, particularly for substrate. Ms. Vergara informed the meeting of
the ASEAN-Australia Living Coastal Resource database, which has categories for corals, which could
be perhaps also used for seagrass. There was also a UNEP publication (Fortes, 1996) that could be
used as reference. It was agreed that Dr. Kirkman will bring up the classification of seagrass and
substrate at the next RWG-S meeting.
4.3.5 It was agreed that the following tasks relating to the seagrass sub-component (Annex 5) need to
be completed at the national level:
Ę To input the digital position and name of each seagrass bed based on the nationally agreed
shoreline as polygon or line (arc) or point according to the project's arbitrary criteria;
Ę To classify each seagrass bed by substrate (or degree of exposure) into predefined types:
Code
Type
1
Sand coralline (exposed)
2
Muddy (non-exposed)
3
Transition (mixed: sandy -muddy);
Ę To give ID for each seagrass bed in each theme as xxyyyy, where xx = country code and yyyy
= number from 0001 to 9999; and,
Ę If new or replacement data from national sources are added to the GIS, provide original
coordinate system of that data according to the format given in file "GIS coordinate.doc".
4.4
Wetlands
UNEP/GEF/SCS/EW.1/3
Page 8
4.4.1
Dr. Anond stated that at the RWG-W it had been decided to cover only estuaries (including
deltas), coastal lagoons, and intertidal flats. He noted that there is a Digital Chart of the World, (DCW)
available, which locates the mouths of major rivers, some coastal lagoons, and hence provides some
relevant existing GIS information, but this is not very detailed. Each country should enter the information
that they want to appear on the GIS database for the South China Sea, though the DCW data could be
used as an initial guide.
4.4.2
There followed discussion on the definitions for coastal lagoon, intertidal flat, and estuary, as
definitions can overlap considerably. The meeting was informed that the definition of the scope of work
under this component is under review by the RWG-W, and may be extended to include coastal
freshwater habitats, but that the definitions to be used followed the agreed Ramsar definitions.
4.4.3
In response to a query from Dr. Anond on available data, participants indicated that some is
available for all countries. In the Philippines some data is already available, while other useful information
can be easily generated. China also has the data for the three categories, and more types if required.
4.4.4
In response to a question from Ms. Vergara on the currency used for values, Mr. Jiang said that
the issue was discussed at the RSTC meeting, and it was decided to express the value in local
currency. It can always be converted to $US later. A US$ exchange rate foot note could be added to any
report to reflect the exchange rate current at the particular time the values were assessed.
4.4.5
Dr. Anond went through the questionnaire, and asked for comments. It was agreed that the
questionnaire was acceptable as a draft for further consideration by the RWG-W. Dr. Anond asked if
there was anything that the SEA START team should do in the next two days to clarify any issues
before the closure of the workshop.
4.4.6 It was agreed that the following tasks relating to the wetland sub-component (Annex 5) need to
be completed at the national level:
Ę To review the position, extent and name of each DCW estuary/lagoon and make corrections if
necessary, especially to confo rm with the nationally agreed shoreline;
Ę To add the location and name of intertidal flats into themes;
Ę To classify (and sub-classify) each wetland into predefined type:
Code
Type
1
Estuary
2
Coastal lagoon
3
Intertidal flat
Ę To check and make corrections so that each wetland is properly represented as polygon, line
(arc), or point, according to the project's arbitrary criteria;
Ę To give an ID for each wetland in each theme as xxyyyy, where xx = country code and yyyy =
number from 0001 to 9999; and,
Ę If new or replacement data from national sources are added to the GIS, provide original
coordinate system of that data according to the format given in file "GIS coordinate.doc".
4.4.7
Dr. Kirkman noted that there were some items missing in the components. For example, the
valuation of seagrass is missing from that component, and he would raise the issue at the next RWG-S
meeting.
4.4.8
Mr. Jiang again reminded participants to share the base maps with each component, and Dr.
Anond agreed to make 7 copies available on CD to each country by the end of the workshop for
immediate distribution to the SEAs.
4.4.9
Dr. Anond presented the outcomes of an informal discussion during the previous evening when
the ID code and the reefbase code system of Latitude and Longitude, had been discussed. He explained
that, using this system the object can be only defined as a point. He suggested that as agreed during
UNEP/GEF/SCS/EW.1/3
Page 9
the previous days plenary session each country works in the Country agreed ID system, and it can be
consolidated and redefined at SEA START RC.
4.4.10 Regarding the issue of whether the Lat/Long or UTM system was the most appropriate for the
regional database, he noted that if the project is concerned with location, then Latitude and Longitude
may be the more appropriate system. However, if measuring size and distance are required, then UTM
is more appropriate. He invited comments on the two and Mr. Jiang noted that from the project
perspective, at least in the initial stages, the location is more important and hence Lat/Long, would be
more appropriate. It was also noted that at least in the case of the mangrove working group more that
one pair of co-ordinates had been specified by the group. There was a general agreement that when
work was required at the site level, the UTM system would be more appropriate, as size and precise
distances were important.
UNEP/GEF/SCS/EW.1/3
Page 10
5.
TECHNICAL DISCUSSION OF THE GIS DATABASE REQUIREMENTS FOR THE
POLLUTION COMPONENT OF THE UNEP/GEF PROJECT ENTITLED: "REVERSING
ENVIRONMENTAL DEGRADATION TRENDS IN THE SOUTH CHINA SEA AND GULF OF
THAILAND"
5.1
Dr. Anond presented the technical considerations regarding the acquisition and inclusion of
pollution related data in the GIS database with a view to facilitating discussion and agreement on a
regional format for the pollution component. Participants were invited to comment on the GIS base map
for the land-based pollution component in the South China Sea and the Gulf of Thailand. This was
discussed and agreed upon. Dr. Anond informed the meeting that in general the project would be
working with administrative units of 10,000 km2 or less. What was needed at this stage was: a general
indication of pollution loading along the coast line. The position of the administrative boundary is not as
important as details on any pollution monitoring stations.
5.2
It was agreed that each country SEA would need to provide the ID for the monitoring stations
The extent of the area to be included is up to the countries to decide. For example, how far up the rivers
that should be included in pollution loading data will depend on a number of factors that would require
local knowledge. Mr. Jiang asked why only a code of 1 or 0, yes or no, was used for loading or health
impact. Dr. Anond explained that this information was for use in deciding whether further information on
the area needed to be included in the map, and not to indicate the extent of the problem.
5.3
Mr. Bastiawan suggested using watershed or catchments as a reporting unit, in place of
administrative units, as it was hard for Indonesia to link the loading to one province. Mr. Jiang said that it
might also be better for China, if watershed or catchment areas can be defined, since administrative
boundary definition can be difficult. Mr. Mean and Mr. Sokha from Cambodia agreed that including
catchment areas for big rivers, such as the Mekong river, and Tonle Sap Great Lake, even though well
inland, was useful as they can still be a source of pollution. They also suggested setting up regional
standards for determining pollution levels.
5.4
Dr. Anond said that his understanding of what was required for this project was an indication of
hotspots in terms of impacts and type of pollution, as there is another parallel UNEP project, which will
be measuring and identifying sources of pollution. Mr. Jiang confirmed that he was also involved in that
project, and that the loading is not the focus of the present project, as it is covered under the parallel
regional Global Programme of Action project.
5.5
It was agreed that, the following tasks relating to, the land-based pollution component of the
project (See annex 7), need to be completed at the national level:
Ę To input the digital position and name of each environmental monitoring station as a point based
on the nationally agreed shoreline;
Ę To provide the types of sample collected from each station, as water, sediment or biological;
Ę To input the digital position and name of each hospital to which any impacts of pollution on
human health will most likely be reported, as a point;
Ę To give an ID for each pollution monitoring station and hospital as xxyyyy, where xx = country
code and yyyy = number from 0001 to 9999;
Ę To check and correct for the coastal administration units for the reporting of the human health
impact;
Ę To check and correct for the administration units along the coastline and upstream in the basins
for the reporting pollutant loading;
Ę To check and correct the catchments/drainage basins for the reporting of pollutant loading,
including dissolving subcatchment polygons into main catchment; and,
Ę If new or replacement data from national sources are added to the GIS, provide original
coordinate system of that data according to format given in file "GIS coordinate.doc".
5.6
Dr. Anond then presented the questionnaire that countries will use to provide the required data,
as agreed at the first RWG-LbP meeting, for consideration of the workshop. He displayed a map of
catchment boundaries, from the DCW, but said that these boundaries may also need to be corrected.
UNEP/GEF/SCS/EW.1/3
Page 11
Dr. Anond further informed participants that when the questionnaires are finalised they would be better
documented, with explanations for completing each field.
6.
TECHNICAL DISCUSSION OF THE GIS DATABASE FOR THE FISHERIES COMPONENT OF
THE UNEP/GEF PROJECT ENTITLED: "REVERSING ENVIRONMENTAL DE GRADATION
TRENDS IN THE SOUTH CHINA SEA AND GULF OF THAILAND"
6.1
Dr. Anond presented technical considerations regarding the acquisition and inclusion of fisheries
related data in the GIS database with a view to facilitating discussion and agreement on a regional
format for the fisheries data sets.
6.2
Mr. Passfield explained that this component of the project was largely concentrating on
transboundary issues, which include migratory species and straddling stocks, and the habitats that are
significant in maintaining these stocks. A list of those families and/or species has been circulated for
consideration by the National Fisheries Committees.
6.3
A GIS base map for the fisheries component in the South China Sea and the Gulf of Thailand
was discussed. Some suggestions for administrative units, which border the SCS for some countries,
were made. Mr. Passfield offered to assist with terminology in the questionnaires and GIS map before
the documents are finalised.
6.4
It was agreed that, the following tasks relating to, the fisheries component (See annex 6), need
to be completed at the national level:
Ę To review and correct for the coastal administration units for the reporting of fishery statistics;
Ę To input the digital position and name of each fishing port/landing as a point based on the
nationally agreed shoreline for the reporting of fishery statistic;
Ę To provide the location (as polygon) of the areas that are important in the maintenance of
exploited fish stocks, and for each area provide names for up to 5 fishes/shellfishes (using
SEAFDEC Code) which are caught in the area, or that use the area as a spawning ground,
nursery ground, or feeding ground;
Ę To give ID for each port/landing and stock maintenance area as xxyyyy, where xx = country
code and yyyy = number from 0001 to 9999; and,
Ę If new or replacement data from national sources are added to the GIS, provide original
coordinate system of that data according to the format given in file "GIS coordinate.doc".
6.5
Mr. Passfield noted that there were a number of things in the questionnaire that would need to
be discussed and agreed upon at the next RWG-F. He pointed out that annual data from 1990 was
agreed upon at the first RWG-F meeting, though the data at 10-year intervals suggested here was also
useful if available. A single set of questionnaires for all components and subcomponents for one country
(Indonesia) is contained in Annex 8 of this report.
7.
FORMAT OF THE REGIONAL META-DATABASE
7.1
A draft regional meta-database format , for the South China Sea Project was introduced by Dr.
Anond (Annex 9). He explained how the format was developed from a combination of other formats, and
utilised MS Word, as it was the most commonly used software in the region. Participants discussed the
format presented and agreed on the regional meta-database format to be used at both national and
regional levels taking into account existing regional and national meta-databases.
7.2
In response to a question from Ms. Vergara, Dr. Anond explained that the GIS would be linked
to a database such that it could be queried on line. In addition, countries could add data via the Internet
through e-mail messages to SEA START RC, or through sending hard copies if necessary. He added a
request that countries do not overlook any data, including internal reports and other grey literature,
including tide tables, or maps that, may be accessible in each country, and to please convey these to
the appropriate SEAs.
UNEP/GEF/SCS/EW.1/3
Page 12
7.3
Mr. Jiang reminded participants that the development of a meta-database is a commitment
made by each country, and covered by the existing Memoranda of Understanding that each country and
Specialised Executing Agency had signed. He requested that participants share this message with the
SEAs in their countries.
7.4
As the meeting was running ahead of schedule, the afternoon session was devoted to technical
presentations by the participants. Presentations demonstrating the range and value of existing
databases were made by Ms. Vergara and Mr. Ferdinand from the Philippines, Mr. Sokhla from
Cambodia; Mr. Chen from China; and Mr. Bastiawan and Mr. Winardi from Indonesia.
8.
POTENTIAL TECHNICAL ASSISTANCE TO BE PROVIDED BY SEA START RC AND THE
PROJECT COORDINATING UNIT TO THE FOCAL POINTS FOR THE PROJECT
COMPONENTS AND SUB-COMPONENTS
8.1
Based on the information and agreements reached under the foregoing agenda items concerning
the form of the GIS database and regional meta-database, participants were invited to consider their
requirements for technical assistance in implementing these agreements. Countries were invited by Dr.
Anond to make any technical assistance requirements known to the PCU and SEA START.
8.2
Mr. Esa from Malaysia said he would need to discuss with his superiors and the SEAs
regarding any requirements for assistance, but asked whether it is possible for UNEP to provide training.
In response, it was noted that whilst UNEP could support training if necessary this would be provided
through a third party.
8.3
Ms. Vergara said the Philippines has some expertise for GIS in pollution and mangroves, but
would follow Malaysia's lead on going back to the country to determine any further needs. Mr. Yen from
Vietnam informed the meeting that they have some expertise, but may need some training on seagrass
and fisheries in terms of how to input data, and help with other (external) sources of data. Mr. Pirochana
Saikliang from Thailand, said there was no GIS expertise in the fisheries committee, but they can
provide all the information required Could this be submitted to SEA START RC to input data? He added
that some fishing port locations will be difficult to get exactly, but can get approximate location from
navigation chart. He reminded the meeting that each component may have different shoreline maps, so
must agree on one.
8.4
Dr. Anond noted that actual inputting should be done by the SEA or contracted out to
institutions, at the national level. SEA START RC and PCU are for coordination. He noted further that
geographic location data, based on 1:250,000 scale maps should be appropriate for the purpose of this
regional scale GIS.
8.5
Dr. Anond noted that training would need to be very specifically designed since data collection
was a national responsibility and activities such as linking a table to an object is basic, and the
expertise should already exist in various institutions in each country.
8.6
In response to wuestions relating to the possibility of training raised by a number of participants,
Dr. Pernetta said that the project cannot offer training from within the PCU, but training can be organised
if needed. However, he said that he was aware that there is a lot of GIS expertise available in the
countries, and that often the problem was one of access to the expertise rather than the need for
training. SEAs have funds for sub-contracting expertise from other institutions. Some funds have been
disbursed to all countries, except Malaysia, which has not signed the MOUs.
8.7
The participants from each country have a responsibility to liaise with each SEA FP on
technical matters and their financial requirements in undertaking the work. Funds have already been
disbursed to the SEAs and include allocations, which can be used in support of the GIS and meta-
database development since these are outputs envisaged in the Memoranda of Understanding between
UNEP and each SEA. JP will contact each NFP to advise them of the outcome of this meeting and
suggest that they consider the levels of support, which can be provided from within existing resources. In
the case of any difficulties the participants were advised to contact the PCU.
UNEP/GEF/SCS/EW.1/3
Page 13
8.8
Mr. Esa noted that he would need to consult with the SEAs regarding the extent to which the
work could be completed within the time frames envisaged. In the event that there were technical
questions the SEAs may contact SEA START RC directly. Dr Anond said yes, but we would expect
some basic data would be presented at the next RWG meetings. Malaysia is quite advanced with GIS
and much of the required data is probably already available in GIS format, hence it would be a question
of contacting the right people in the country. It was noted that the LbP Committee in Thailand will have a
meeting at the end of this month, so the workshop report will be presented to them then.
8.9
Mr. Winardi raised the possibility of assistance in obtaining Satellite imagery data And Dr.
Anond noted that satellite imagery would be useful in the second step of phase 1, by which time UNEP
should be able to provide these images. He noted that there was insufficient time to obtain imagery
before the next round of regional meetings.
8.10
Dr. Pernetta confirmed that UNEP will provide access to Land Sat images and that all that was
required were the geographical coordinates of the area for which imagery was required. Dr. Anond
Informed the meeting that SEA START RC had prepared a list of approximately 70 LandSat images
required to cover the coastal area of the South China Sea
8.11
Replies from Indonesia and China to a question from Dr. Anond to the participants, led to a
consensus that countries would need 6 months to analyse LandSat images. Based on this, Dr. Pernetta
and Dr. Anond agreed to ensure the images would be available to the countries before the end of 2002,
so that they could be analysed by the time of step 3 of the workplan (April-June, 2003).
8.12
It was also agreed that an e-forum of GIS experts be established with participants and other GIS
experts in the region, to facilitate progress on the agreed tasks.
9.
GENERAL DISCUSSION AND PRESENTATION OF SUMMARY OF THE WORKSHOP
CONCLUSIONS
9.1
Dr. Anond presented a draft workplan and timetable for discussion by the participants. He noted
that the decisions on the shoreline map to be used for each country would need to be taken by the end
of next week 16 August. He also advised that any data provided from other GIS systems should be
compatible with SEA START system. ARCview and MapInfo were suitable, but some nationally
developed software may not be. The workplan as discussed and agreed is contained in Annex 10 of this
report.
9.2
Mr. Chen expressed some concern at committing here to a timetable, since decisions regarding
the release of data may take some time. Dr. Anond reminded the meeting that all countries, at the first
PSC meeting, had agreed the overall project workplan and that it is up to all participants to try and meet
the schedule. Dr. Pernetta advised that a revision of the schedule may be presented to the next PSC in
December, after progress achieved by the end of the second round of RWG meetings, as a workplan to
the end of 2004 needs to be finalised at that meeting.
9.3
The workshop agreed that the work to be done before the second round of Regional Working
Group meetings should be focussed on the setting up of the GIS layout at a regional scale including
agreement on shorelines, administrative boundaries, rivers and the location of habitats, which should be
completed for each component 1 week prior to the scheduled date of the second meetings. During the
intersessional period between the second and third regional working group meetings work would be
focussed on the compilation of regional data and linkage of those data to the Geographic Units
established earlier. Between the third and fourth regional working group meetings the work will focus on
the compilation of site specific data to be used to support the decisions of the Project Steering
Committee with respect to the selection of demonstration sites.
9.4
In response to a question from Dr. Pernetta as to whether another technical GIS meeting such
as this would be required, prior to the initiation of step 3 of the workplan. It was agreed that an email
forum would probably be all that is required. Cambodia did say they have some problems with email
service, so would prefer a second meeting and it was agreed that this issue would be kept under review.
The e-forum would involve all the participants from this workshop together with the SEA focal points and
UNEP/GEF/SCS/EW.1/3
Page 14
any other appropriate experts. Participants were invited to provide names and contact details of
appropriate individuals to the SEA START RC.
10.
ADOPTION OF THE REPORT AND TECHNICAL AGREEMENTS
10.1
The draft report and technical agreements, prepared by the workshop secretariat, were
presented to the workshop which discussed amended and agreed the report as it appears in this
document. The PCU was authorised to finalise the editing and formatting of the text in consultation with
Dr. Anond.
11.
CLOSURE OF THE WORKSHOP
11.1
Dr. Anond closed the workshop after thanking participants for the hard work and constructive
attitude he expressed the wish that successful regional cooperation would result in achieving the
anticipated outcomes.
UNEP/GEF/SCS/EW.1/3
Annex 1
Page 1
ANNEX 1
List of Participants
Country Nominated Experts
Cambodia
Mr. Suon MEAN, Chief
Mr. Chrin SOKHA, Chief
GIF/Remote Sensing Unit
Water and Soil Quality Management
Department of Natural Resource and Environmental Department of Environmental Pollution Control
Data Management
Ministry of Environment
Ministry of Environment
#48 Samdech Preah Sihanouk
#48 Samdech Preah Sihanouk
Tonle Bassac, Chamkamon
Tonle Bassac, Chamkamon
Phnom Penh
Phnom Penh, Cambodia
Cambodia
Tel:
(855 23) 212580; (855) 11 873993
Tel:
(855 23) 210492; (855) 12 893001
Fax: (855 23) 427844, 219164
Fax:
(855 23) 987880
E-mail: 012893001@mobitel.com.kh
E-mail: 012893001@mobitel.com.kh
China
Mr. CHEN Xiaoxiang
Mr. FANG Huaiyang
Centre for Remote Sensing
South China Institute of Environmental Sciences,
Zhongshan (San Yet-sen) University
SEPA
135 Xingangxi Road
7 West Street, Yuancun
Guangzhou 510275, China
Guangzhou 510655, China
Tel:
(86 20) 8411 2496; (86) 13022048145
Tel:
(86 20) 8553 8223; (86) 139 2605 4539
Fax: (86 20) 8411 3678
Fax: (86 20) 8555 7064
E-mail: eescxx@zsu.edu.cn
E-mail: sunnyhouse@scies.com.cn
Indonesia
Mr. Benny BASTIAWAN
Mr. WINARDI
Senior Technical Supporting GIS Staff
Remote Sensing & GIS for Marine Application
Coastal and Marine Ecosystem Affairs
Researcher
Ministry of Environment
Research Center for Oceanography (PPO)
Jl. Panjaitan Kav. 24A
Indonesian Institute of Sciences (LIPI)
Building 5th Floor, Kebon Nanas
Jl. Pasir Putih I, Ancol Timur
Jakarta 13410, Indonesia
Jakarta 14430, Indonesia
Tel:
(62 21) 8590 5638; (62) 812 9952542
Tel:
(62 21) 683850 ext. 308;
Fax: (62 21) 85904929
62 812 9206683
E-mail: pkepl@bapedal.go.id;
Fax: (62 21) 681948; 62 21 682287
bastiawan@hotmail.com
E-mail: winardi@coremap.or.id
winardi@hotmail.com
Malaysia
Mr. Hazizi ESA
Environmental Control Officer
Department of Environment
Ministry of Science, Technology and the
Environment, Level 6, Block C4
Federal Government Administrative Centre
Pusat Pentadbiran Kerajaan Persekutuan
62662 Putrajaya, Malaysia
Tel:
(603) 8885 8293; 8885 8200
Fax:
(603) 8889 1045; 8888 9987
E-mail: he@jas.sains.my
UNEP/GEF/SCS/EW.1/3
Annex 1
Page 2
Philippines
Mr. Francis Ferdinand DIZON
Ms. Sheila G. VERGARA
Information Systems Analyst II
International Center for Living Aquatic Resources
Management Information Systems Unit
Management
Environmental Management Bureau
Mabango Street, Jubileeville
Department of Environment & Natural Resources
Masaya Bay, Laguna 4033
Visayas Avenue, Diliman, Quezon City, Philippines Philippines
Tel:
(632) 920 2232; 920 2280;
Tel:
(632) 845 0563/69/70/73/75 ext. 6892
639192491165
Fax: (632) 8911292
Fax: (632) 927 1518
E-mail: s.vergara@cgiar.org
E-mail: infinia09@yahoo.com
Thailand
Dr. Nawarat KRAIRAPANOND
Mr. Sanay ROJANADIT
Chief of Coastal and Marine Resources Group
Department of Geography
Natural Resource and Environmental Management
Faculty of Education
Co-ordination Division
Ramkhamkaeng University
Office of Environmental Policy and Planning
Huamark
60/1 Soi Phibunwattana 7, Rama VI Road
Bangkok 10240
Bangkok 10400, Thailand
Thailand
Tel:
(662) 279 5202; 279 8088
Tel:
(661) 653 7739
Fax:
(662) 279 8088; 271 3226
Fax:
(662)
E-mail: nawarat@oepp.go.th
E-mail: sanayr@hotmail.com
Viet Nam
Mr. Tran Cong YEN
Senior, GIS Specialist
Ministry of Science, Technology and Environment
39 Tran Hung Dao
Hanoi, Viet Nam
Tel:
(844) 943 8346; (84) 09 13321872
Fax:
(844) 825 2733
E-mail: yencong@yahoo.com
Observers
Mr. Somsak BOONDOWN
Mr. Hugh KIRKMAN
Chief of Soil and Land Resources Section
Coordinator EAS/RCU
Natural Resource and Environmental Management
United Nations Environment Programme
Co-ordination Division
Regional Coordinating Unit for East Asian Seas
Office of Environmental Policy and Planning (SEAs- 9th Floor, Block A, United Nations Building
Wetlands)
Rajdamnern Avenue
60/1 Soi Phibunwattana 7, Rama VI Road
Bangkok 10200
Bangkok 10400, Thailand
Thailand
Tel:
(662) 279 5202; 279 8088
Tel:
(662) 288 1860
Fax:
(662) 279 8088; 271 3226
Fax:
(662) 281 2428
E-mail: somsak@oepp.go.th
E-mail: kirkman.unescap@un.org
UNEP/GEF/SCS/EW.1/3
Annex 1
Page 3
Dr. Sura PATTANAKIAT
Mr. Sirichai ROUNGRIT
Assistant Professor
Environmental Specialist
Faculty of Environment and Resources Studies
Natural Resource and Environmental Management
Mahidol University (SEAs-Seagrass)
Co-ordination Divi sion
Phuttamonthon 4, Salaya
Office of Environmental Policy and Planning
Nakhon Phatom, 73170
60/1 Soi Phibunwattana 7, Rama VI Road
Thailand
Bangkok 10400, Thailand
Tel:
(662) 441 5000 ext. 172
Tel:
(662) 279 5202; 279 8088
Fax:
(662) 441 9509-10
Fax:
(662) 279 8088; 271 3226
E-mail: enspt@mahidol.ac.th
E-mail: sirichai48@hotmail.com
Mr. Pirochana SAIKLIANG
Dr. Tanuwong SANGTIEAN
Senior Fishery Biologist (SEAs-Fisheries)
Forest Official
Upper Gulf Marine Fisheries Development Center
Royal Forest Department (SEAs-Mangroves)
49 Soi Phrarachaveriyaporn 16
61 Paholyothin Rd
Bangphoung, Prapradeang
Chatuchak, Bangkok 10900
Samutprakarn 10130, Thailand
Thailand
Tel:
(662) 816 7635-8 ext 15; 018439887
Tel:
(662) 579 8626; 01 988 0114
Fax:
(662) 816 7634
Fax:
(662) 579 8626
E-mail: pirochas@fisheries.go.th
E-mail: tanuwong@forest.go.th
Dr. Somboon SIRIRAKSOPHON
Ms. Wimolporn WILAIRATANADILOK
Southeast Asian Fisheries Development Center
Pollution Control Department
SEAFDEC/Training Department
(SEAs-Land-based pollution)
P.O.Box 97, Phrasamutchedi
92 Soi Pahon Yothin 7, Pahon Yothin Rd.
Samutprakan 10290
Samsen-Nai, Phaya Thai
Thailand
Bangkok 10400, Thailand
Tel:
(662) 425 6100 to 9; 425 6137
Tel:
(662) 298 2241-2; 669 683 6211
Fax: (662) 425 6110 to 1
Fax
(662) 298 2240
E-mail: somboon@seafdec.org
E-mail: wimolporn@hotmail.com
Southeast Asia START Regional Centre
(SEA START RC)
Dr. Anond SNIDVONGS, Director
Mr. Boonlue KACHENCHART
Southeast Asia START Regional Centre
Researcher
SWU Pathumwan 5 Building, 5th Floor
Faculty of Environment and Resource studies
Henri Dunant Road
Mahidol University, Salaya
Bangkok 10330, Thailand
Nakhon Pathom 73170, Thailand
Tel:
(66 2) 218 9464
Tel:
(66 2) 441 5000 ext. 122
Fax: (66 2) 251 9416
Fax: (66 2) 441 9509 to 10
E-mail: anond@start.or.th
E-mail: boonlue@rocketmail.com;
boonlue@mju.ac.th
UNEP/GEF/SCS/EW.1/3
Annex 1
Page 4
Ms. Kannika KOMWONG
Mr. Chanutchai PORNSALNUWAT
Research Associate
Research Assistant
Southeast Asia START Regional Centre
Southeast Asia START Regional Centre
SWU Pathumwan No.5, 5th floor
SWU Pathumwan No.5, 5th floor
Henri Dunant Road, Pathumwan
Henri Dunant Road, Pathumwan
Bangkok 10330, Thailand
Bangkok 10330, Thailand
Tel:
(66 2) 218 9466
Tel:
(66 2) 219 9463
Fax:
(66 2) 251 9416
Fax:
(66 2) 251 9416
E-mail: kannika@start.or.th
E-mail: chanutchai@start.or.th
United Nations Environment Programme
UNEP/GEF Project Co-ordinating Unit
Dr. John PERNETTA, Project Director
Mr. Yihang JIANG, Senior Expert
UNEP/GEF Project Co-ordinating Unit
UNEP/GEF Project Co-ordinating Unit
United Nations Environment Programme
United Nations Environment Programme
9th Floor, Block A, United Nations Building
9th Floor, Block A, United Nations Building
Rajdamnern Avenue
Rajdamnern Avenue
Bangkok 10200, Thailand
Bangkok 10200, Thailand
Tel:
(66 2) 288 1886
Tel: (66 2) 288 2084
Fax:
(66 2) 281 2428
Fax:
(66 2) 281 2428
E-mail: pernetta@un.org
E-mail: jiang.unescap@un.org
Mr. Kelvin Passfield, Expert
Dr. Annadel CABANBAN
UNEP/GEF Project Co-ordinating Unit
Expert Ł Community Based Management
United Nations Environment Programme
UNEP/GEF Project Co-ordinating Unit
9th Floor, Block A, United Nations Building
United Nations Environment Programme
Rajdamnern Avenue
9th Floor, Block A, United Nations Building
Bangkok 10200, Thailand
Rajdamnern Avenue, Bangkok 10200, Thailand
Tel: (66 2) 288 1116
Tel:
(66 2) 288 2279
Fax: (66 2) 281 2428
Fax:
(66 2) 281 2428
E-mail: passfield@un.org
E-mail: cabanban@un.org
Ms. Charuvan KALYANGKURA
Ms. Unchalee KATTACHAN
Administrative Assistant, EAS/RCU
Secretary, UNEP/GEF Project Co-ordinating Unit
United Nations Environment Programme
United Nations Environment Programme
9th Floor, Block A, United Nations Building
9th Floor, Block A, United Nations Building
Rajdamnern Avenue
Rajdamnern Avenue
Bangkok 10200, Thailand
Bangkok 10200, Thailand
Tel:
(66 2) 288 1894
Tel: (66 2) 288 1670
Fax:
(66 2) 281 2428
Fax:
(66 2) 281 2428
E-mail: kalyangkura@un.org
E-mail: kattachan.unescap@un.org
UNEP/GEF/SCS/EW.1/3
Annex 2
Page 1
ANNEX 2
List of Documents
Working documents
UNEP/GEF/SCS/RWG-EW.1/1
Provisional agenda
UNEP/GEF/SCS/RWG-EW.1/2
Annotated provisional agenda
UNEP/GEF/SCS/RWG-EW.1/3
Report of the meeting (prepared during the meeting)
UNEP/GEF/SCS/RWG-EW.1/4
Data and information needs for the Mangrove Sub-component
UNEP/GEF/SCS/RWG-EW.1/5
Data and information needs for the Coral Reefs Sub-component
UNEP/GEF/SCS/RWG-EW.1/6
Data and information needs for the Seagrass Sub-component
UNEP/GEF/SCS/RWG-EW.1/7
Data and information needs for the Wetlands Sub-component
UNEP/GEF/SCS/RWG-EW.1/8
Data and information needs for the Pollution Component
UNEP/GEF/SCS/RWG-EW.1/9
Data and information needs for the Fisheries Component
Information documents
UNEP/GEF/SCS/RWG-EW.1/INF.1
Provisional list of documents
UNEP/GEF/SCS/RWG-EW.1/INF.2
Provisional list of participants
UNEP/GEF/SCS/RWG-EW.1/INF.3
Draft programme
UNEP/GEF/SCS/RWG-EW.1/INF.4
Burke, L., E. Selig, and M. Spalding. 2002. Reefs at Risk in
Southeast Asia, Washington, DC. : World Resources Institute.
72 pp.
UNEP/GEF/SCS/EW.1/3
Annex 3
Page 1
ANNEX 3
Agenda
1.
OPENING OF THE WORKSHOP
1.1
Welcome address
1.2 Introduction of participants
2.
RATIONAL FOR THE WORKSHOP
3.
INTRODUCTION OF THE EXISTING GIS DATABASE AT SEA-START RC
4.
TECHNICAL DISCUSSION OF THE GIS DATABASE REQUIREMENTS FOR THE HABITAT
COMPONENT OF THE UNEP/GEF PROJECT ENTITLED: "REVERSING ENVIRONMENTAL
DEGRADATION TRENDS IN THE SOUTH CHINA SEA AND GULF OF THAILAND"
4.1
Mangroves
4.2
Coral Reefs
4.3
Seagrass
4.4
Wetlands
5.
TECHNICAL DISCUSSION OF THE GIS DATABASE REQUIREMENTS FOR THE POLLUTION
COMPONENT OF THE UNEP/GEF PROJECT ENTITLED: "REVERSING ENVIRONMENTAL
DEGRADATION TRENDS IN THE SOUTH CHINA SEA AND GULF OF THAILAND"
6.
TECHNICAL DISCUSSION OF THE GIS DATABASE FOR THE FISHERIES COMPONENT OF
THE UNEP/GEF PROJECT ENTITLED: "REVERSING ENVIRONMENTAL DEGRADATION
TRENDS IN THE SOUTH CHINA SEA AND GULF OF THAILAND"
7.
FORMAT OF THE REGIONAL META-DATABASE
8.
POTENTIAL TECHNICAL ASSISTANCE TO BE PROVI DED BY SEA START RC AND THE
PROJECT COORDINATING UNIT TO THE FOCAL POINTS FOR THE PROJECT
COMPONENTS AND SUB-COMPONENTS
9.
GENERAL DISCUSSION AND PRESENTATION OF SUMMARY OF THE WORKSHOP
CONCLUSIONS
10.
ADOPTION OF THE REPORT AND TECHNICAL AGREEMENTS
11.
CLOSURE OF THE WORKSHOP
UNEP/GEF/SCS/EW.1/3
Annex 4
Page 1
ANNEX 4
SEA START RC Presentation of Common Base Maps
COMMON BASE MAPS (to be shared by several components)
Ę Shoreline
Ę Administration units (preferably <10,000 km2)
Ę Rivers
WORLD VECTOR SHORELINE (WVS)
Ę Original source of data: Defense Mapping Agency now National Imagery and Mapping Agency
(NIMA)
Ę World-wide coverage
Ę Suitable for scales close to 1:250,000
Ę Accuracy; requirement for this data is that 90% of all identifiable shoreline features be located
within 500 meters (2.0mm at 1:250,000) circular error of their true geographic positions with
respect to the preferred datum (WGS 84)
Ę Horizontal Datum - World Geodetic System (WGS 84)
Ę Vertical Datum - shoreline based on Mean High Water (MHW)
Advantages of Using WVS as Basemap
Ę Available for every country.
Ę Compatible with many other global and regional GIS projects, so data can be transferred and
overlay without much adjustment.
Digital Shorelines from National Sources
Ę Viet Nam
Ę Philippines
Viet Nam Shoreline
Produced by:
Unknown
Production Year:
Unknown
Digitizing Accuracy: ~500m
Format:
MapInfo Polygon
Projection:
Geographic
Availability:
Whole country
Original Source Maps: Unknown
Original Scale:
1:200,000?
Survey Year:
Unknown
Philippines Shoreline
Produced by:
National Mapping and Resource Information Agency (NAMRIA)
Production Year:
~2000?
Digitizing Accuracy:
Unknown
Format:
Autocad DWG Line
Projection:
UTM Zone 51
Availability:
Cagayan-Pangasinan; Zambales -Batangas; Palawan (N & S tips only)
Original Source Maps: NAMRIA
Original Scale:
1:250,000
Survey Year:
1993?
National Tasks for Shorelines
UNEP/GEF/SCS/EW.1/3
Annex 4
Page 2
Ę To review geographic position of shoreline and correct/replace with a more acceptable GIS if
necessary;
Ę To review any missing/non-existent features (such as islands) and add/remove from map; and,
Ę If new data from national sources are added or used to replace those on the existing GIS file,
provide original coordinate system of that data according to format given in file "GIS
coordinate.doc" and dispatch to SEA START RC.
Notes:
Ę The shoreline will be the critical geo-reference for habitat components to locate the position of
habitats;
Ę It is very important that every component of each country use the SAME shoreline.
Working GIS Themes
From WVS
cn_shore_wvs
id_shore_wvs
kh_shore_wvs
my_shore_wvs
ph_shore_wvs
th_shore_wvs
vn_shore_wvs
ADMINISTRATIVE BOUNDARIES WRI/CIESIN
NAME 1
NAME 2
NAME 3
Cambodia
Koh Kong
Thmar Baing
N.A.
China
Hainan
Wenchang
N.A.
Indonesia
Jambi
Tanjung jabung
N.A.
Malaysia
Kelantan (Negara
N.A.
N.A.
Philippines
Reg 1 (Iiocos)
La Union
Bangar
Thailand
Eastern (Pak)
Cholburi (Changwat)
Sriracha (Amphur)
Viet Nam
Minh hai (Tinh)
Bac Lieu (Huyen)
N.A.
National Tasks for Administrative Boundaries
Ę To review and update the WRI/CIESIN geographic position of boundary of general administrative
units of the country;
Ę To review the attribute table and correct for names and other attributes; and,
Ę If new data from national source are added or to replace to the GIS, provide original coordinate
system of that data according to format given in file "GIS coordinate.doc"
Notes:
Ę Administrative boundary will be a basic geographic unit used in Fisheries and Pollution
Components.
Ę Administrative units will be represented as `polygons'.
UNEP/GEF/SCS/EW.1/3
Annex 4
Page 3
Working GIS Themes (all are from WRI/CIESIN)
cn_admin_wri
id_admin_wri
kh_admin_wri
my_admin_wri
ph_admin_wri
th_admin_wri
vn_admin_wri
Supporting GIS Themes
cn_shore_wvs
id_shore_wvs
kh_shore_wvs
my_shore_wvs
ph_shore_wvs
th_shore_wvs
vn_shore_wvs
DCW RIVER AND DRAINAGE NETWORK
Source:
ESRI Digital Chart of the World (DCW)
Original Scale:
1:1,000,000
Year Published:
1993
Format:
Line
Criteria:
From theme DNNET (line)
National tasks for rivers and drainage networks
Ę To review and update the DCW river network or replace with national GIS if necessary;
Ę To select only rivers and segment of rivers that are signification and relevant to the context of
the SCS Project, especially to the wetland (estuary) and land based pollution components, and
remove other irrelevant river/stream lines;
Ę Check the position of the selected river mouths and make correction if necessary;
Ę For each river segment selected, provide name of river that segment belong to as required in
attribute table; and,
Ę If new data from national source are added or to replace to the GIS, provide original coordinate
system of that data according to format given in file "GIS coordinate.doc".
Working GIS Themes (all from DCW)
cn_river_dcw
id_river_dcw
kh_river_dcw
my_river_dcw
ph_river_dcw
th_river_dcw
vn_river_dcw
Supporting GIS
cn_shore_wvs
id_shore_wvs
kh_shore_wvs
my_shore_wvs
ph_shore_wvs
th_shore_wvs
vn_shore_wvs
DEVELOPMENT OF THE REGIONAL GIS DATABASE
Step 1. To establish the regionally consistent GIS basemap that contain geographic unit for data
reporting (this should be accomplished before the next RWG meetings);
Step 2. To provide attributed data for each feature in the basemap (to be completed in 2003?).
Data in Step 2 will be linked to the GIS features in Step 1 through the ID of the feature in each theme--
i.e. once an ID is assigned to a feature it can NOT be changed, but that feature may be deleted as well
as a new feature with new ID may be added at any time.
UNEP/GEF/SCS/EW.1/3
Annex 5
Page 1
ANNEX 5
Habitat Component GIS Requirements: Mangrove, Coral Reef, Seagrass, and Wetland
General location and extent of `large' sites will be represented either as Line (Arc) for site that is longer
than ~250m but less than ~250m wide, or Polygon for a site that is longer than ~250m and wider than
~250m. Points will serve 2 purposes:
1. As an indication of the position of `small' sites, or sites with `unknown' size, or;
2. To indicate that the particular location may have additional data/information available.
MANGROVES SUB- COMPONENT
Available GIS/Maps Distribution of Mangrove
Source:
WRI Reef at Risk Southeast Asia
Year Published:
2002
Format:
Polygon
Projection:
Geographic
Availability:
Original Source:
WCMC
National GIS Tasks for Mangrove Sub-Component
Ę To review the position and name of each mangrove polygon from R@R/WCMC and make
corrections if necessary, especially to conform with the nationally agreed shoreline;
Ę To add data from national sources as polygon, line (arc) or point according to the project's
arbitrary criteria;
Ę To give an ID to the feature in each theme as xxyyyy, where xx = country code and yyyy =
number from 0001 to 9999; and,
Ę If new or replacement data from national sources are added to the GIS, provide original
coordinate system of that data according to format given in file "GIS coordinate.doc".
Working GIS Themes (Available data in polygon (pol) themes were from WRI R@R/WCMC)
cn_m_pol
cn_m_arc
cn_m_pnt
id_m_pol
id_m_arc
id_m_pnt
kh_m_pol
kh_m_arc
kh_m_pnt
my_m_pol
my_m_arc
my_m_pnt
ph_m_pol
ph_m_arc
ph_m_pnt
th_m_pol
th_m_arc
th_m_pnt
vn_m_pol
vn_m_arc
vn_m_pnt
Supporting Data Themes
cn_shore_wvs
id_shore_wvs
kh_shore_wvs
my_shore_wvs
ph_shore_wvs
th_shore_wvs
vn_shore_wvs
UNEP/GEF/SCS/EW.1/3
Annex 5
Page 2
CORAL REEFS SUB-COMPONENT
Available GIS/MapsDistribution of Coral Reefs
Source:
WRI Reef at Risk Southeast Asia
Year Published:
2002
Format:
Polygon, Line, Point
Projection:
Geographic
Availability:
Original Source:
ICLARM ReefBase
National GIS Tasks for Coral Reef Sub-component
Ę
To review the position and name of each coral reef theme from R@R and make necessary
corrections, especially to conform with the nationally agreed shoreline;
Ę
Verify R@R points that are close to each other if they are the same location;
Ę
To add and update coral reef feature data as polygon or line (arc ) or point as appropriate;
Ę
To classify each coral reef into predefined types:
Code
Type
1
Atoll
2
Barrier
3
Fringing
4
Patch
Ę
To give an ID for each coral reef in each theme as xxyyyy, where xx = country code and yyyy
= number from 0001 to 9999; and, If new or replacement data from national sources are added to
the GIS, provide original coordinate system of that data according to format given in file "GIS
coordinate.doc".
Working GIS Themes (Available data in all these themes were from WRI R@R SEA)
id_cr_pol
ph_cr_pol
th_cr_pol
vn_cr_pol
id_cr_arc
kh_cr_arc
my_cr_arc
ph_cr_arc
th_cr_arc
vn_cr_arc
id_cr_pnt
kh_cr_pnt
my_cr_pnt
ph_cr_pnt
th_cr_pnt
vn_cr_pnt
Supporting Data Themes
id_shore_wvs
kh_shore_wvs
my_shore_wvs
ph_shore_wvs
th_shore_wvs
vn_shore_wvs
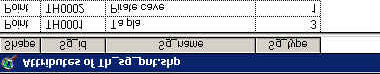
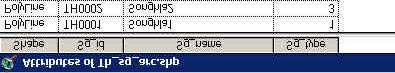
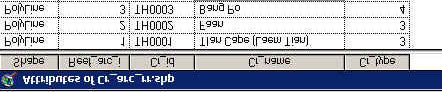
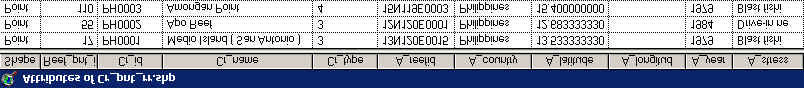
UNEP/GEF/SCS/EW.1/3
Annex 5
Page 3
SEAGRASS SUB-COMPONENT (Available GIS/Maps Distribution of seagrass)
None National GIS Tasks for Seagrass Sub-component
Ę To input the digital position and name of each seagrass bed based on the nationally agreed
shoreline as polygon or line (arc) or point according to the project's arbitrary criteria;
Ę To classify each seagrass bed by substrate (or degree of exposure) into predefined types:
Code
Type
1
Sand coralline (exposed)
2
Muddy (non-exposed)
3
Transition (mixed: sandy-muddy)
Ę To give ID for each seagrass bed in each theme as xxyyyy, where xx = country code and
yyyy= number from 0001 to 9999; and,
Ę If new or replacement data from national sources are added to the GIS, provide original
coordinate system of that data according to format given in file "GIS coordinate.doc".
Working GIS Themes (There are no seagrass data available in these themes)
cn_sg_pol
cn_sg_arc
cn_sg_pnt
id_sg_pol
id_sg_arc
id_sg_pnt
kh_sg_pol
kh_sg_arc
kh_sg_pnt
my_sg_pol
my_sg_arc
my_sg_pnt
ph_sg_pol
ph_sg_arc
ph_sg_pnt
th_sg_pol
th_sg_arc
th_sg_pnt
vn_sg_pol
vn_sg_arc
vn_sg_pnt
Supporting Data Themes
cn_shore_wvs
id_shore_wvs
kh_shore_wvs
my_shore_wvs
ph_shore_wvs
th_shore_wvs
vn_shore_wvs
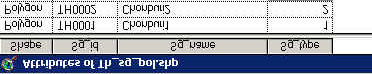
UNEP/GEF/SCS/EW.1/3
Annex 5
Page 4
WETLANDS SUB-COMPONENT
Available GIS/Maps
Distribution of Estuaries+Coastal Lagoons
Source:
ESRI Digital Chart of the World (DCW)
Original Scale:
1:1,000,000
Year Published:
1993
Format:
polygon
Criteria:
From DNNET and Dnpytype = 1
Distribution of Intertidal Flats
Source:
None
National GIS Tasks for Wetlands Sub-component
Ę To review the position, extent and name of each DCW estuary/lagoon and make corrections if
necessary, especially to conform with the nationally agreed shoreline;
Ę To add the location and name of intertidal flats into themes;
Ę To classify (and sub-classify) each wetland into predefined type:
Code
Type
1
Estuary
2
Coastal lagoon
3
Intertidal flat
Ę To check and make corrections so that each wetland is properly represented as polygon, line
(arc), or point, according to the project's arbitrary criteria;
Ę To give an ID for each wetland in each theme as xxyyyy, where xx = country code and yyyy =
number from 0001 to 9999; and,
Ę
If new or replacement data from national sources are added to the GIS, provide original
coordinate system of that data according to format given in file "GIS coordinate.doc".
Working GIS Themes
cn_w_pol
cn_w_arc
cn_w_pnt
id_w_pol
id_w_arc
id_w_pnt
kh_w_pol
kh_w_arc
kh_w_pnt
my_w_pol
my_w_arc
my_w_pnt
ph_w_pol
ph_w_arc
ph_w_pnt
th_w_pol
th_w_arc
th_w_pnt
vn_w_pol
vn_w_arc
vn_w_pnt
(Estuary and coastal lagoon data in polygon themes were from DCW)
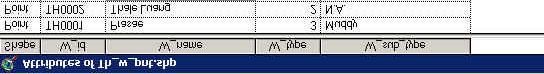
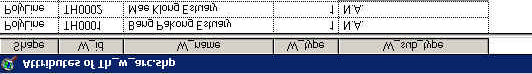
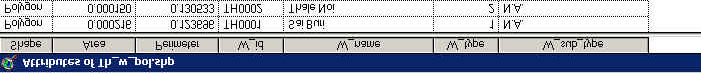
UNEP/GEF/SCS/EW.1/3
Annex 5
Page 5
Supporting Data Themes
Shoreline
cn_shore_wvs
id_shore_wvs
kh_shore_wvs
my_shore_wvs
ph_shore_wvs
th_shore_wvs
vn_shore_wvs
River network from DCW
cn_river_dcw
id_river_dcw
kh_river_dcw
my_river_dcw
ph_river_dcw
th_river_dcw
vn_river_dcw
UNEP/GEF/SCS/EW.1/3
Annex 6
Page 1
ANNEX 6
Fisheries Component GIS Requirements
AVAILABLE GIS/MAPS
Administrative Unit Boundary
Source:
WRI/CIESIN and national GIS for Thailand and Viet Nam
Fishing Ports/Landings
Source:
None
Areas of importance in the maintenance of exploited fish stocks
Source:
None
NATIONAL GIS TASKS FOR FISHERIES COMPONENT
Ę To review and correct for the coastal administration units for the reporting of fishery statistic;
Ę To input the digital position and name of each fishing port/landing as a point based on the
nationally agreed shoreline for the reporting of fishery statistic;
Ę To provide the location (as polygon) of the areas that are important in the maintenance of
exploited fish stocks, and for each area provide names for up to 5 fishes/shellfishes (using
SEAFDEC Code) which are caught in the area, or that use the area as a spawning ground,
nursery ground, or feeding ground;
Ę To give ID for each port/landing and stock maintenance area as xxyyyy, where xx = country
code and yyyy = number from 0001 to 9999; and,
Ę If new or replacement data from national sources are added to the GIS, provide original
coordinate system of that data according to format given in file "GIS coordinate.doc".
WORKING GIS THEMES
Coastal Administration Unit for Fishery Statistic (polygon)
cn_admin_f
id_admin_f
kh_admin_f
my_admin_f
ph_admin_f
th_admin_f
vn_admin_f
Fishing Ports/Landings for Fishery Statistic (point)
cn_port
id_port
kh_port
my_port
ph_port
th_port
vn_port
Areas of importance in the maintenance of exploited fish stocks
cn_spawning
id_spawning
kh_spawning
my_spawning
ph_spawning
th_spawning
vn_spawning
cn_nursing
id_nursing
kh_nursing
my_nursing
ph_nursing
th_nursing
vn_nursing
cn_feeding
id_feeding
kh_feeding
my_feeding
ph_feeding
th_feeding
vn_feeding
cn_fishing
id_fishing
kh_fishing
my_fishing
ph_fishing
th_fishing
vn_fishing
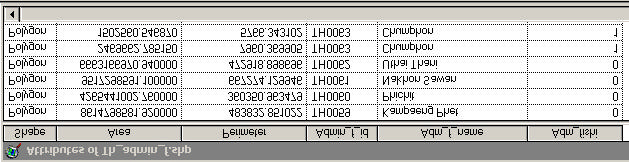
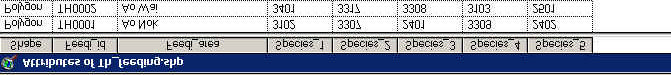
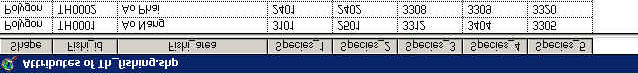
UNEP/GEF/SCS/EW.1/3
Annex 6
Page 2
SUPPORTING DATA THEMES
Shoreline from WVS
cn_shore_wvs
id_shore_wvs
kh_shore_wvs
my_shore_wvs
ph_shore_wvs
th_shore_wvs
vn_shore_wvs
UNEP/GEF/SCS/EW.1/3
Annex 7
Page 1
ANNEX 7
Pollution Component GIS Requirements
AVAILABLE GIS/MAPS
Administrative Unit Boundary
Source:
WRI/CIESIN and national GIS for Thailand and Viet Nam
Pollution Monitoring Station
Source:
None
NATIONAL GIS TASKS FOR POLLUTION COMPONENT
Ę To input the digital position and name of each environmental monitoring station as a point based
on the nationally agreed shoreline;
Ę To provide the types of sample collected from each station, as water, sediment or biological;
Ę To input the digital position and name of each hospital to which any impacts of pollution on
human health will most likely be reported, as a point;
Ę To give an ID for each pollution monitoring station and hospital as xxyyyy, where xx = country
code and yyyy = number from 0001 to 9999;
Ę To check and correct for the coastal administration units for the reporting of the human health
impact;
Ę To check and correct for the administration units along the coastline and upstream in the basins
for the reporting pollutant loading;
Ę To check and correct the catchments/drainage basins for the reporting of pollutant loading,
including dissolving subcatchment polygons into main catchment; and,
Ę If new or replacement data from national sources are added to the GIS, provide original
coordinate system of that data according to format given in file "GIS coordinate.doc".
WORKING GIS THEMES
Pollution Monitoring Station (point)
cn_poll_st
id_poll_st
kh_poll_st
my_poll_st
ph_poll_st
th_poll_st
vn_poll_st
Administration Unit for Health Impact (polygon)
cn_admin_h
id_admin_h
kh_admin_h
my_admin_h
ph_admin_h
th_admin_h
vn_admin_h
Hospital (point)
cn_hospital
id_hospital
kh_hospital
my_hospital
ph_hospital
th_hospital
vn_hospital
Administration Unit for Pollutant Loading (polygon)
cn_admin_l
id_admin_l
kh_admin_l
my_admin_l
ph_admin_l
th_admin_l
vn_admin_l
Catchments/Drainage Basins
cn_basin_start
id_basin_start
kh_basin_start
my_basin_start
ph_basin_start
th_basin_start
vn_basin_start
UNEP/GEF/SCS/EW.1/3
Annex 7
Page 2
SUPPORTING DATA THEMES
WVS shoreline
cn_shore_wvs
id_shore_wvs
kh_shore_wvs
my_shore_wvs
ph_shore_wvs
th_shore_wvs
vn_shore_wvs
River network from DCW
cn_river_dcw
id_river_dcw
kh_river_dcw
my_river_dcw
ph_river_dcw
th_river_dcw
vn_river_dcw
Population Density
cn_pop
id_pop
kh_pop
my_pop
ph_pop
th_pop
vn_pop
Cities
cn_cities
id_cities
kh_cities
my_cities
ph_cities
th_cities
vn_cities
List of administrative units for Cambodia mapped on the base map for Land-Based Pollution
Koh Kong
Tonle Sap
Kampot
Pursat
List of administrative units for China mapped on the base map for Land-Based Pollution
New Territories
Dianbai
Sanya shi
Kowloon and New Kowloon
Lianjiang
Raoping
Lufeng
Hepu
Zhao`an
Chenghai
Yangxi
Nan`ao
Chaoyang
Wuchuan
Conghua
Shantou SXQ
Beihai SXQ
Zengcheng
Huiyang
Suixi
Hua xian
Huidong
Zhanjiang: Potou qu
Guangzhou SXQ
Haifeng
Zhanjiang shi CC
Nanhai
Huilai
Haikang
Foshan SXQ
Dongguan shi
Xuwen
Shunde
Panyu
Wenchang
Heshan
Shanwei SXQ
Qiongshan
Jiangmen SXQ
Bao`an
Haikou shi (SXQ) +
Xinhui
Chengmai
Zhongshan shi
Lin`gao
Shenzhen SXQ
Dan xian
Qinzhou shi
Changjiang Lizu zizhixian
Taishan
Qionghai
Zhuhai SXQ
Dongfang Lizu zizhixian
Doumen
Wanning
Yangjiang SXQ
Ledong Lizu zizhixian
Fangcheng Gezu Zizhixian
Lingshui Lizu zizhixian
List of administrative units for Indonesia mapped on the base map for Land-Based Pollution
Sambas
Indragiri Hilir
Ogan Kemering Ilir
Kampar
Ketapang
Belitung
Riau Kepulauan
Tanjung Jabung
Bengkalis
Pontianak
Bangka
Indragiri Hulu
Musi Banyuasin
UNEP/GEF/SCS/EW.1/3
Annex 7
Page 3
List of administrative units for Malaysia mapped on the base map for Land-Based Pollution
Sabah
Terengganu
Pahang
Kelantan
Saraw ak
Johor
List of administrative units for Philippines mapped on the base map for Land-Based Pollution
Tarlac
Island in Lake Taal
Bulacan
Rizal
Ilocos Norte
Pampanga
Laguna
Ilocos Sur
Bataan
Laguna De Bay
La Union
Manila
Batangas
Pangasinan
Cavite
Lake Taal
Zambales
Occidental Mindoro
Palawan
List of administrative units for Thailand mapped on the base map for Land-Based Pollution
Chumphon
Chanthaburi
Prachuap Khilikhan
Surat Thani
Rayong
Phatthalung
Nakhon Si Tammarat
Trad
Nakhon Nayok
Songkhla
Bangkok
Pathum Thani
Pattani
Samut Sakhon
Nakhon Pathom
Narathiwat
Samut Prakarn
Nonthaburi
Chachoengsao
Samut Songkham
Ratchaburi
Chonburi
Phetchaburi
List of administrative units for Vietnam mapped on the base map for Land-Based Pollution
Ha Noi
Quang Binh
Binh Thuan
Hai Phong
Quang Tri
Tien Giang
Hai Hung
Thua Thien-Hue
Dong Thap
Ha Tay
Quang Ngai
An Giang
Quang Ninh
Binh Dinh
Can Tho
Quang Nam-Da Nang
Phu Yen
Kien Giang
Thai Binh
Khanh Hoa
Phu Quoc
Hoa Binh
Tay Ninh
Ben Tre
Nam Ha
Ninh Thuan
Vinh Long
Ninh Binh
Ho Chi Minh City
Soc Trang
Thanh Hoa
Dong Nai
Tra Vinh
Lang Son
Binh Phuoc
Minh Hai
Nghe An
Long An
Vinh Phu
Ha Tinh
Ba Ria - Vung Tau
Thai Nguyen
UNEP/GEF/SCS/EW.1/3
Annex 8
Page 1
ANNEX 8
Example Set of Questionnaires for all Components and Sub-components for Indonesia
Indonesia - Data and information needs for the mangrove component
Indonesia - Data and information needs for the coral reef component
Indonesia - Data and information needs for the seagrass component
Indonesia - Data and information needs for the wetland component
Indonesia - Data and information needs for the fishery component
Indonesia - Data and information needs for the land-based pollution component
1
Indonesia
Data and information needs for the mangrove component
2
M1 Distribution of mangrove in the South China Sea part of Indonesia
Table M1.1 Available GIS map of mangrove distribution
- Geographic coverage
None
Whole country
Parts of country, Species general locations
(1) ................................. Mapping or survey year .................. Original scale .............
(2) ................................... Mapping or survey year .................. Original scale ...............
(3) .................................. Mapping or survey year .................. Original scale ...............
(4) .................................. Mapping or survey year .................. Original scale ...............
(5) .................................. Mapping or survey year .................. Original scale ...............
(Please add more areas on separate sheets of papers)
- Original data source
Remote sensing, Species..............
Ground survey
Nautical chart
Other, .......................
- Estuaries feature represented as
Polygon
Line
Point
Other, ........................................
- Please attach samples of attribute tables for the features
3
Table M1.2 Available non GIS map of mangrove distribution
- Format
Paper map, scale ......................
Image file (gif, jpeg, tif, etc.)
Other, .............................................
- Geographic coverage
None
Whole country
Parts of country, Species general locations
(1) ................................. Mapping or survey year .................. Original scale .............
(2) ................................... Mapping or survey year .................. Original scale ...............
(3) .................................. Mapping or survey year .................. Original scale ...............
(4) .................................. Mapping or survey year .................. Original scale ...............
(5) .................................. Mapping or survey year .................. Original scale ...............
(Please add more areas on separate sheets of papers)
- Original data source
Remote sensing, Species..............
Ground survey
Nautical chart
Other, .......................
- Please attach samples of map
4
Table M1.3 Available non map data for mangrove distribution
- Format
x,y coordinate file
Other, (1)........................
Other, (2)..................
- Geographic coverage
None
Whole country
Parts of country, Species general locations
(1) ................................. Data year ........................................
(2) ...................................
Data year ........................................
(3) ..................................
Data year ........................................
(4) ..................................
Data year ........................................
(5) ..................................
Data year ........................................
(Please add more areas on separate sheets of papers)
- Original data source
Remote sensing, Species..............
Ground survey
Nautical chart
Other, .......................
- Please attach samples of data
5
M2. Environmental data of each mangrove in the South China Sea
part of Indonesia
Mangrove Name .........................................................
The geographical coordinates (latitude and longitude) of the approximate centre of each
mangrove, expressed in degrees and minutes.
Latitude................................. Longitude.....................................
(Please reproduce this table M2 for more mangrove site)
Table M2.1
Category
Unit
Data
Remark*
Physical Environment
(Present status)
1. Average soil texture
Sand
%
Silt
%
Clay
%
2. Average cross
degree
sectional slope
3. Present (Year 2000)
hectare
area
4. Average rate of change
hectare/year
over the last decade in
area cover
* Add more papers if space provided is not enough
6
Table M2.2
Category
Unit
Data
Remark*
Vegetation
(Present status)
1. Number of zone (by
number
Specify:
dominant species)
2. Total number of tree
number
species
3. Average height (all
m
species)
4. Average height of
Species (1) .................. m
dominant species (by
species)
...............................
Species (2).................. m
...............................
Species (3).................. m
...............................
5. Average girth (all
cm
species)
6. Average girth of
Species (1) .................. cm
dominant species (by
species)
...............................
Species (2).................. cm
...............................
Species (3).................. cm
...............................
7. Tree density (all
number/
species)
hectare
8. Density of dominant
Species (1) .................. number/
tree species (by species)
hectare
...............................
Species (2).................. number/
hectare
...............................
Species (3).................. number/
hectare
...............................
9. Present (year 2000)
%
vegetation canopy cover
(all species)
10. Present (year 2000)
Species (1) .................. %
vegetation canopy cover
(by species)
...............................
Species (2).................. %
...............................
%
Species (3)..................
* Add more papers if space provided is not enough
7
Table M2.3
Category
Unit
Data
Remark*
Other organism
1. Number of
number&
phytoplanktons
number
genera&species
2. Density of
number/ m3
phytoplanktons
3 Number of
number&
zooplanktons
number
genera&species
4. Density of
number/ m3
zooplanktons
5. Number of
number&
macrobenthos
number
genera&species
6. Density of
number/ m2
macrobenthos
7. Number of crustacea
number&
genera&species
number
8. Density of crustacea
number/ m2
9. Number of bivalve
number&
genera&species
number
10. Density of bivalve
number/ m2
11. Number of gastropods
number&
genera&species
number
12. Density of gastropods
number/ m2
13. Number of polychaete
number&
genera&species
number
14. Density of polychaete
number/ m2
15. Number of resident
number&
fish genera&species
number
16. Abundance of
ton
resident fish
17. Number of transient
number&
fish genera&species
number
18. Abundance of
ton
transient fish
19. Number of resident
number&
reptiles/ amphibient
number
genera&species
20. Density of resident
number/
reptiles/amphibient
hectare
21. Number of resident
number&
birds species
number
22. Abundance of
number
resident birds
23. Number of migratory
number&
birds species
number
* Add more papers if space provided is not enough
8
Table M2.4
Category
Unit
Data
Remark*
24. Abundance of
number
migratory birds (at peak)
25. Number of resident
number&
mammal species
number
26. Abundance of
number
resident mammals
* Add more papers if space provided is not enough
9
Table M2.5
Category
Unit
Data
Remark*
Uses and services
valuation (approximate
year 2000)
1. Landuse type and area
Aquaculture
hectare
Agriculture
hectare
Urbanization
hectare
Other
hectare
(1)...............................
Other
hectare
(2)...............................
2. Values of direct use
Timber
IDR/year
Charcoal
IDR/year
Living marine resource
IDR/year
Other
IDR/year
(1)...............................
Other
IDR/year
(2)...............................
3. Values of indirect use
Carbon sequestration
IDR/year
Ecotourism
IDR/year
Nursery areas for shrimps IDR/year
Other
IDR/year
(1)...............................
Other
IDR/year
(2)...............................
* Add more papers if space provided is not enough
10
Table M2.5
Table M2.6
Category
Unit
Data
Remark*
4. Values from
Coastal protection
IDR/year
environmental services
Sediment stabilisation
IDR/year
Water quality
IDR/year
enhancement
Contaminant sink
IDR/year
Reduction of wave
IDR/year
energy& erosion
Other
IDR/year
(1)...............................
Other
IDR/year
(2)...............................
5. Average investment
Restoration
IDR/year
value
Replanting
IDR/year
Other
IDR/year
(1)...............................
Other
IDR/year
(2)...............................
6. Average value of
potential or sustainable
IDR/year
use
7. Total economic value
IDR/year
* Add more papers if space provided is not enough
11
Table M2.7
Category
Unit
Data
Remark*
Management
1. Proportion of natural
ratio
versus managed area
2. Ownership
Federal
Yes
State
Yes
Community
Yes
Private
Yes
Other
(1)...............................
Other
(2)...............................
3. Management regime
Landuse planning
Yes
Institutional framework
Yes
Stakeholder co-ordination
Yes
Forestry practices
Yes
Restoration replanting
Yes
Stakeholder investment
Yes
Fishery practices
Yes
Other
(1)...............................
Other
(2)...............................
* Add more papers if space provided is not enough
12
Table M2.7
Table M2.8
Category
Unit
Data
Remark*
4. Existing management
- Long-term
Yes
Detail:
plans (provide short
detail)
- Medium-term
Yes
Detail:
- Short-term
Yes
Detail:
5. Existing international
Ramsar site
Established
recognition
year
World heritage site
Established
year
Other
Established
year
(1)...............................
Other
Established
year
(2)...............................
6. Commitment with
Yes
Specify:
international agreements/
issues
7. Existing national
- Strict nature reserve
Established
recognition (IUCN
year
Category)
www.iucn.org/themes/ma
- Wilderness area
Established
rine/pdf/mpaguid.pdf
year
- National park
Established
year
- Natural monument
Established
year
- Habitat/Species
Established
management area
year
- Protected landscape/Sea
Established
scape
year
- Managed resource
Established
protected area
year
Other
Established
year
(1)...............................
Other
Established
year
(2)...............................
* Add more papers if space provided is not enough
13
Table M2 continued
Table M2.9
Category
Unit
Data
Remark*
Stress/pressure
information
1. Intrinsic/internal
Resident human
number
sources of change
population
Average of typhoon
number/year
frequency
Change in allocthonous
%/decade
+> 100%
sediment inputs over last
+50 to
decade
100%
+10 to
49%
-10 to
+10%
-50 to
-10 %
->50%
Average marine based
number/year
flooding frequency
2. Extrinsic/external
Dam constructions in the
number
sources of change
catchment
Water diversion projects
number
in the catchment
Other
number
(1)...............................
Other
number
(2)...............................
Other
number
(3)...............................
3. Social and economic
Population growth
%/year
drivers of change in
Immigration
environmental state over
%/year
last decade
Average GDP growth
%/year
* Add more papers if space provided is not enough
1
Indonesia
Data and information needs for the coral reef component
2
C1 Distribution of coral reef in the South China Sea part of Indonesia
Table C1.1 Available GIS map for coral reef distribution
- Geographic coverage
None
Whole country
Parts of country, specify general locations
(1) ................................. Mapping or survey year .................. Original scale .............
(2) ................................... Mapping or survey year .................. Original scale ...............
(3) .................................. Mapping or survey year .................. Original scale ...............
(4) .................................. Mapping or survey year .................. Original scale ...............
(5) .................................. Mapping or survey year .................. Original scale ...............
(Please add more areas on separate sheets of papers)
- Original data source
Remote sensing, specify..............
Ground survey
Nautical chart
Other, .......................
- Estuaries feature represented as
Polygon
Line
Point
Other, ........................................
- Please attach samples of attribute tables for the features
3
Table C1.2 Available non GIS map for coral reef distribution
- Format
Paper map, scale ......................
Image file (gif, jpeg, tif, etc.)
Other, .............................................
- Geographic coverage
None
Whole country
Parts of country, specify general locations
(1) ................................. Mapping or survey year .................. Original scale .............
(2) ................................... Mapping or survey year .................. Original scale ...............
(3) .................................. Mapping or survey year .................. Original scale ...............
(4) .................................. Mapping or survey year .................. Original scale ...............
(5) .................................. Mapping or survey year .................. Original scale ...............
(Please add more areas on separate sheets of papers)
- Original data source
Remote sensing, specify..............
Ground survey
Nautical chart
Other, .......................
- Please attach samples of map
4
Table C1.3 Available non map data for coral reef distribution
- Format
x,y coordinate file
Other, (1)........................
Other, (2)..................
- Geographic coverage
None
Whole country
Parts of country, specify general locations
(1) ................................. Data year ........................................
(2) ...................................
Data year ........................................
(3) ..................................
Data year ........................................
(4) ..................................
Data year ........................................
(5) ..................................
Data year ........................................
(Please add more areas on separate sheets of papers)
- Original data source
Remote sensing, specify..............
Ground survey
Nautical chart
Other, .......................
- Please attach samples of data
5
C2 Environmental data of each coral reefs in the South China Sea
part of Indonesia
Coral reef site name.............................................................
The geographical coordinates (latitude and longitude) of the approximate centre of the coral
reef site, expressed in degrees and minutes.
Latitude................................. Longitude.....................................
Table C2.1
Category
Unit
Data
Remark*
Physical environment
1. Reef type
Fringing (mainland &
island)
Yes
Barrier
Yes
Atoll
Yes
Patch
Yes
Other
(1).........................
Other
(2).........................
2. Depth Range
Mean
m
Maximun
m
Minimum
m
3. Average cross sectional
degree
slope
4. Present (Year 2000) area
hectare
5. Average Rate of change
hectare /year
over the last decade in area
cover
* Add more papers if space provided is not enough
6
Table C2.2
Category
Unit
Data
Remark*
Present environmental
state
1. Coral
1.1 Number of coral zone (by
dominant species)
number
1.2 Number of hard coral
number
genera/species
/number
1.3 Number of soft coral
number
genera/species
1.4 Hard coral diversity
number
index
1.5 Soft coral diversity index
number
1.6 Live coral cover (all
percent
species)
1.7 Change live coral cover
percent/decade
area over last decade (all
(+/-)
species)
2. Algae
2.1 Number of algae
number
genera/species
/number
2.2 Present algae cover
percent
2.4 Change algae cover area
percent/decade
over last decade
(+/-)
3. Molluscs
3.1 Number of molluscs
number
genera/species
/number
3.3 Molluscs density
number/m2
* Add more papers if space provided is not enough
7
Table C2.3
Category
Unit
Data
Remark*
4. Crustacean
4.1 Number of crustacean
number
genera/species
/number
4.2 Crustacean density
number /m2
5. Echinoderm
5.1 Number of echinoderm
number
genera/species
/number
5.2 Echinoderm density
number/m2
6. Polychaete
6.1 Number of polychaete
number
genera/species
/number
6.2 Polychaete density
number/m2
7. Coral reef fish
7.1 Number of coral reef fish
genera/species
number
/number
7.3 Coral reef fish density
number/ha
8. Transient fish
8.1 Number of transient fish
number
genera/species
/number
8.3 Transiesnt fish density
number/ha
* Add more papers if space provided is not enough
8
Table C2.4
Category
Unit
Data
Remark*
9. Mammal
9.1 Number of mammal
species
number
9.3 Mammal density
number/ha
10. Larvae
10.1 Number of larvae
number
genera/species
/number
10.3 Larvae density
number/m3
11. Exploitation
- Species (1)
11.1 Major exploited species
kg./year
and level of exploitation
...........................
- Species (2)
kg./year
...........................
- Species (3)
kg./year
...........................
12 Ecosystem interaction
12.1 No. of other ecosystems
number
Specify:
interact with this coral reef
* Add more papers if space provided is not enough
9
Table C2.5
Category
Unit
Data
Remark*
Regional and/or global
significance
Number of endemic species
number
Specify:
Number of indigenous
number
Specify:
species
Number of rare species
number
Specify:
Number of endangered and
- Critically
number
Specify:
threatened species (IUCN
Endangered (CR)
Red List Categories)
- Endangered (EN)
number
Specify:
- Vulnerable (VU)
number
Specify:
Existing international
Ramsar site
Established
recognition
year
World heritage site
Established
year
Established
Other (1)...............
year
Established
Other (2)...............
year
* Add more papers if space provided is not enough
10
Table C2.6
Category
Unit
Data
Remark*
National significance
Existing management plans
- Long-term
Yes
Detail:
(provide short detail)
- Medium-term
Yes
Detail:
- Short-term
Yes
Detail:
Existing status (IUCN
- Strict nature reserve
Established
Category)
year
www.iucn.org/themes/marine
- Wilderness area
Established
/pdf/mpaguid.pdf
year
- National park
Established
year
- Natural monument
Established
year
- Habitat/Species
Established
management area
year
- Protected
Established
landscape/Sea scape
year
- Managed resource
Established
protected area
year
Management or reservation
Yes
Identify:
activities on site
Existing level and quality of
High
site management
Medium
Low
Existing support to
High
institutional management
Medium
Low
Long-term sustainability
Yes
Identify:
including prospects for
revenue generation (identify
activities)
Potential aspects that can be
Yes
Specify:
developed wisely in the site
(identify activities)
Average level of direct
High
stakeholder involvement in
Medium
management
Low
Long term environmental
perspective
High
Medium
Low
* Add more papers if space provided is not enough
11
Table C2.7
Category
Unit
Data
Remark*
Threats to this area
1. Present threats
1-10
11-50
1.1 Destructive harvestation
Bombing
number/year
>50
None
1-10
11-50
Poisoning
number/year
>50
None
Bottom trawl
Yes
Plant/animal removal
Yes
Other (1).................
Other (2).................
1.2 Pollution
Sediment
Yes
Oil
Yes
Heavy metals
Yes
Organic pollutants
Yes
Eutrophication
Yes
Salinity change
Yes
Thermal
Yes
Pesticides
Yes
Other (1).................
Other (2).................
1.3 Coastal development
Dredging
High
Medium
Low
None
Tourism
High
Medium
Low
None
Other (1).................
Other (2).................
* Add more papers if space provided is not enough
12
Table C2.8
Category
Unit
Data
Remark*
High
Medium
1.4 Natural disaster
Storm
Low
None
High
Medium
Volcano
Low
None
High
Medium
Land subsidance
Low
None
High
Medium
Sea level rise
Low
None
High
Medium
Case of bleaching of
coral over last decade
Low
None
Other (1).................
Other (2).................
1.5 Other
Starfish Crown of
number/m2
Thorn
Number/decad
Bleaching event
e
* Add more papers if space provided is not enough
13
Table C2.9
Category
Unit
Data
Remark*
2. Future threats
Development plan
Distance to the coral
reef area
km2
Stress-pressure information
Social and economic drivers
Population growth
Percent/year
of change in environmental
state
Resident human
Number
population
Immigration
Percent/year
Average GDP growth
Percent/year
during the last decade
* Add more papers if space provided is not enough
14
Table C2.10
Category
Unit
Data
Remark*
Management
Ownership
Federal
Yes
State
Yes
Community
Yes
Private
Yes
Common property
Yes
Other (1).................
Other (2).................
Management regime
Landuse planning
Yes
Coastal zoning
Yes
Institutional
Yes
framework
Stakeholder co-
Yes
ordination
Restoration
Yes
Stakeholder
Yes
investment
Fishery practices
Yes
Other (1).................
Other (2).................
* Add more papers if space provided is not enough
15
Table C2.11
Category
Unit
Data
Remark*
Current use
Commercial
Subsistance
Fishing ground
Tourism
MPA
Other
(1)......................
Other
(2)......................
Tradition use
(1)......................
(2)......................
(3)......................
Potential use
Tourism
MPA
Other
(1)......................
Other
(2)......................
* Add more papers if space provided is not enough
16
Table C2.12
Category
Unit
Data
Remark*
Uses and services
Extractive use (year 2000)
Reef related fish
IDR/year
landing
Subsistence fishery
IDR/year
Other (1)................ IDR/year
Other (2)................ IDR/year
Non extractive use -Tourism
Number of visitors
number/year
(year 2000)
Number of people
number
involved in industry
Number of
number
chalets/hotels
operators
Number of ferry/boasts number
operators
Number of
number
guide/agents
Other (1)................
Other (2)................
Other non extractive use
(year 2000)
Specify (1)............
Specify (2)............
Environmental services
Coastal protection
IDR/year
Sediment stabilisation
IDR/year
Water quality
IDR/year
enhancement
Contaminant sink
IDR/year
Reduction of wave
IDR/year
energy& erosion,
Other (1)................ IDR/year
Other (2)................ IDR/year
* Add more papers if space provided is not enough
1
Indonesia
Data and information needs for the seagrass component
2
S1 Distribution of estuaries in the South China Sea part of
Indonesia
Table S1.1 Available GIS map of seagrass distribution
- Geographic coverage
None
Whole country
Parts of country, specify general locations
(1) ................................. Mapping or survey year ..................Original scale ..............
(2) ...................................
Mapping or survey year ..................Original scale ..............
(3) ..................................
Mapping or survey year ..................Original scale ..............
(4) .................................. Mapping or survey year ..................Original scale ..............
(5) .................................. Mapping or survey year ..................Original scale ..............
(Please add more areas on separate sheets of papers)
- Original data source
Remote sensing, specify..............
Ground survey
Nautical chart
Other...............................
- Estuaries feature represented as
Polygon
Line
Point
Other ........................................
- Please attach samples of attribute tables for the features
3
Table S1.2 Available non GIS map of seagrass distribution
- Format
Paper map, scale ....................... Image file (gif, jpeg, tif, etc.)
Other......................................
- Geographic Coverage
None
Whole country
Parts of country, specify general locations
(1) ................................. Mapping or survey year ..................Original scale ..............
(2) ...................................
Mapping or survey year ..................Original scale ..............
(3) ..................................
Mapping or survey year ..................Original scale ..............
(4) .................................. Mapping or survey year ..................Original scale ..............
(5) .................................. Mapping or survey year ..................Original scale ..............
(Please add more areas on separate sheets of papers)
- Original data source
Remote sensing, specify..............
Ground survey
Nautical Chart
Other...............................
- Please attach samples of map
4
Table S1.3 Available non map data of seagrass distribution
- Format :
x,y coordinate file
Other, (1)........................
Other, (2)..................
- Geographic Coverage
None
Whole country
Parts of country, specify general locations
(1) .................................
Data year ........................................
(2) ...................................
Data year ........................................
(3) ..................................
Data year ........................................
(4) ..................................
Data year ........................................
(5) ..................................
Data year ........................................
(Please add more areas on separate sheets of papers)
- Original data source
Remote sensing, specify..............
Ground survey
Nautical Chart
Other...............................
- Please attach samples of data
5
S2 Environmental data of each seagrasss in the South China Sea
part of Indonesia
* Limited to seagrass bed larger than 1 hectare
Seagrass site name.......................................................................
The geographical coordinates (latitude and longitude) of the approximate
centre of the seagrass site, expressed in degrees and minutes.
Latitude................................. Longitude.....................................
Table S2.1
Category
Unit
Data
Remark*
1. Topography
1. Substrate
- Mean particle size
micron
2. Class of seagrass
- Sandy coralline
Yes
(exposed)
- Muddy
Yes
(non-exposed)
- Transition
Yes
(mixed; sandy-muddy)
3. Depth Range
Mean
m
Maximum
m
Minimum
m
4. Present (year 2000)
hectare
area
* Add more papers if space provided is not enough
6
Table S2.2
Category
Unit
Data
Remark*
2. Present
environmental state
1. Seagrass
- Number of seagrass
species
number
- Dominant seagrass
Species 1
g/m2
density
.............................
Species 2
g/m2
...........................
Species 3
g/m2
...........................
- Seagrass productivity
mg/m2/d
2. Penaeids
- Number of penaeids
number/
genera/species
number
- Penaeids density
number/m2
3. Gastropods
- Number of gastropods
number/
genera/species
number
- Gastropods density
number/m2
4. Seahorses
- Number of seahorses
number/
genera/species
number
- Seahorses density
number/m2
5. Urchins
- Number of urchins
number/
genera/species
number
- Urchins density
number/m2
6. Siganids
- Number of siganids
number/
genera/species
number
- Siganids density
number/m2
* Add more papers if space provided is not enough
7
Table S2.3
Category
Unit
Data
Remark*
7. Holothurians
- Number of
number/
holothurians
genera/species
number
- Holothurians density
number/m2
8. Starfish
- Number of starfish
number/
genera/species
number
- Starfish density
number/m2
9. Number of endemic
number
Specify:
species
10. Number of
number
Specify:
indigenous species
11. Number of rare
number
Specify:
species
12. Number of
- Critically
number
Specify:
endangered and
Endangered (CR)
threatened species
- Endangered (EN)
number
Specify:
(IUCN Red List
Categories)
- Vulnerable (VU)
number
Specify:
13. Number of
number
Specify:
Migratory species
14. Ecological
Diversity
- Number of other
number
Specify:
ecosystems interact
with this seagrass bed
* Add more papers if space provided is not enough
8
Table S2.4
Category
Unit
Data
Remark*
3. Present threats
1. Salinity fluctuation
Distance to freshwater
inflow
km
Extreme lowest salinity
ppt
Extreme highest salinity
ppt
2. Water quality
Heavy metals
mg/l
Specify:
POPs
mg/l
Specify:
Nutrients
mg/l
Specify:
Algal blooms
events/year
3. Suspended sediment
Sediment traping rate
g/m2/d
from dredging and
reclamation
Secchi disk depth
m
4. Fishing damage
Damaged shoot
shoots/m2
Damaged biomass
g/m2
Damaged area
m2
5. Over fishing
Declining in CPUE over
%/decade
last decade
6. Trampling and
Damaged seagrass
shoots/m2
gleaning
Gleaned organisms
number/m2
* Add more papers if space provided is not enough
9
Table S2.5
Category
Unit
Data
Remark*
4. Management status
1. Existing status
- Strict nature reserve
Established
(IUCN Category)
year
www.iucn.org/themes/
- Wilderness area
Established
marine/pdf/mpaguid.pd
year
f
- National park
Established
year
- Natural monument
Established
year
- Habitat/Species
Established
management area
year
- Protected landscape/sea
Established
scape
year
- Managed resource
Established
protected area
year
Established
Other (1)...................
year
Established
Other (2)...................
year
* Add more papers if space provided is not enough
1
Indonesia
Data and information needs for the wetland component
I. Estuary
2
WE1 Distribution of estuaries in the South China Sea part of the country
Table WE1.1 Available GIS map of estuaries distribution
- Geographic coverage
None
Whole country
Parts of country, specify general locations
(1) ................................. Mapping or survey year ..................Original scale ......................
(2) ...................................
Mapping or survey year ..................Original scale ......................
(3) ..................................
Mapping or survey year ..................Original scale ......................
(4) .................................. Mapping or survey year ..................Original scale .....................
(5) .................................. Mapping or survey year ..................Original scale ......................
(Please add more areas on separate sheets of papers)
- Original data source
Remote sensing, specify..............
Ground survey
Nautical chart
Other, ..................................
- Estuaries feature represented as
Polygon
Line
Point
Other, ........................................
- Please attach samples of attribute tables for the features
3
Table WE1.2 Available non GIS map of estuaries distribution
- Format
Paper map, scale ......................
Image file (gif, jpeg, tif, etc.)
Other, .............................................
- Geographic Coverage
None
Whole country
Parts of country, specify general locations
(1) ................................. Mapping or survey year ..................Original scale ......................
(2) ...................................
Mapping or survey year ..................Original scale ......................
(3) ..................................
Mapping or survey year ..................Original scale ......................
(4) .................................. Mapping or survey year ..................Original scale .....................
(5) .................................. Mapping or survey year..................Original scale ......................
(Please add more areas on separate sheets of papers)
- Original data source
Remote sensing, specify..............
Ground survey
Nautical Chart
Other, ..................................
- Please attach samples of map
4
Table WE1.3 Available non map data of estuaries distribution
- Format :
x,y coordinate file
Other, (1)........................
Other, (2)..................
- Geographic Coverage
None
Whole country
Parts of country, specify general locations
(1) .................................
Data year ........................................
(2) ...................................
Data year ........................................
(3) ..................................
Data year ........................................
(4) ..................................
Data year ........................................
(5) ..................................
Data year ........................................
(Please add more areas on separate sheets of papers)
- Original data source
Remote sensing, specify..............
Ground survey
Nautical Chart
Other, ..................................
- Please attach samples of data
5
WE2 Environmental data for each estuary in the South China Sea part of
the country
Estuary name .............................................................................................
The geographical coordinates (latitude and longitude) of the approximate center of the estuary,
expressed in degrees and minutes.
Latitude................................. Longitude.....................................
Table WE2.1
Category
Unit
Data
Remark*
1. Biological diversity
1.1 Species diversity
- Number of species of plants
Number
- Density of plants (all
Number/ha
species)
- Number of species of:
Phytoplantons
Number
Zooplantons
Number
Macrobenthos
Number
Resident fishes
Number
Transient fishes
Number
Resident mammals
Number
Resident birds
Number
Migratory birds
Number
1.2 Ecosystem diversity
- Number of types of
-
Number
Specify:
adjacent aquatic
habitats/ecosystems
* Add more papers if space provided is not enough
6
Table WE2.1
Table WE2.2
Category
Unit
Data
Remark*
2. significance
2.1 Number of species that spawn
Number
None
in this estuary
1-10
11-50
> 50
2.2 Number of species that feed
Number
None
or roost in this estuary
1-10
11-50
> 50
2.3 Number of species that
Number
None
migrate through/to this estuary
1-10
11-50
> 50
2.4 Number of people that visit in Tourism
Number/
None
this estuary for
year
1-1,000
1,001-
10,000
> 10,000
Fishing
Number/
None
year
1-1,000
1,001-
10,000
> 10,000
Number
None
Other (1)...............
1-1,000
1,001-
10,000
> 10,000
Number
None
Other (2)...............
1-1,000
1,001-
10,000
> 10,000
2.5 Top 3 international goods that Type (1)................
produced in this estuary
Volume per year
Value per year
Major destination
Type (2)................
Volume
Value per year
Major destination
Type (3)................
Volume
Value per year
Major destination
* Add more papers if space provided is not enough
7
Table WE2.1
Table WE2.3
Category
Unit
Data
Remark*
3. Regional and/or global 3.
significance
3.1 Number of endemic species
Number
3.2 Number of indigenous
Number
species
3.3 Number of rare species
Number
3.4 Number of endangered and
- Critically
Number
threatened species (IUCN Red
Endangered (CR)
List Categories)
- Endangered (EN)
Number
- Vulnerable (VU)
Number
3.5 Existing international
Ramsar site
Established
recognition
year
World heritage site
Established
year
Established
Other (1)............
year
Established
Other (2)...............
year
* Add more papers if space provided is not enough
8
Table WE2.1
Table WE2.4
Category
Unit
Data
Remark*
4. National significance
4.1 Existing management plans
- Long-term
Yes
Detail:
(provide short detail)
- Medium-term
Yes
Detail:
- Short-term
Yes
Detail:
4.2 Commitment with
Yes
Specify:
international agreements/ issues
4.3 Existing status (IUCN
- Strict nature reserve
Established
Category)
year
www.iucn.org/themes/marine/pd - Wilderness area
Established
f/mpaguid.pdf
year
- National park
Established
year
- Natural monument
Established
year
- Habitat/Species
Established
management area
year
- Protected
Established
landscape/sea scape
year
- Managed resource
Established
protected area
year
Established
Other (1)...............
year
Established
Other (2)...............
year
4.4 Management or reservation
Yes
Identify:
activities on site
4.5 Existing level and quality of
High
site management
Medium
Low
4.6 Existing support to
High
institutional management
Medium
Low
4.7 Average level of direct
High
stakeholder involvement in
Medium
management
Low
* Add more papers if space provided is not enough
9
Table WE2.1
Table WE2.5
Category
Unit
Data
Remark*
5. Extent of threats
5.1 Intrinsic/internal sources of
- Existing resident
Number
change
human population
- Frequency of
Number/
typhoon
year
- Change in
High
allocthonous
Medium
sediment inputs
Low
- Marine based
Number/
flooding
year
Other (1)............... ...............
Other (2)............... ...............
5.2 Extrinsic/external sources of
- Dam construction
High
change
Medium
Low
- Water diversion
High
Medium
Low
- Other changes in
High
Specify:
catchment basin
Medium
Low
Other (1)............... ...............
Other (2)............... ...............
5.3 Socio-economic drivers of
% /year
change in environmental state
- Population growth
% /year (+/-
- Migration
)
High
- GDP Development
Medium
Low
Other (1)............... ...............
Other (2)............... ...............
5.4 Rate of change in the
% /decade
estuarine area over the past
(+/-)
decade
* Add more papers if space provided is not enough
10
Table WE2.1
Table WE2.6
Category
Unit
Data
Remark*
6. Financial and practical
considerations
6.1 Average investments for
IDR/year
existing management or
reservation activities
6.2 Trend of investment for
Increase
management in the future
Decrease
Stable
6.3 Average level of local
IDR/year
revenue generation over the past
decade
6.4 Level of stakeholder support
IDR/year
6.5 Potential for external
High
investment
Medium
Low
6.6 Estimated revenue if estuary
IDR/year
is sustainably managed
6.7 Long-term sustainability
Yes
Identify:
including prospects for revenue
generation
6.8 Potential aspects that can be
Yes
Identify:
developed wisely in the site
6.9 Long term environmental
High
perspective
Medium
Low
* Add more papers if space provided is not enough
11
Indonesia
Data and information needs for the wetland component
II. Intertidal flat
12
WTF1 Distribution of intertidal flat in the South China Sea part of the
country
Table WTF1.1 Available GIS map of intertidal flat distribution
- Geographic coverage
None
Whole country
Parts of country, specify general locations
(1) ................................. Mapping or survey year ..................Original scale ......................
(2) ...................................
Mapping or survey year ..................Original scale ......................
(3) ..................................
Mapping or survey year ..................Original scale ......................
(4) .................................. Mapping or survey year ..................Original scale .....................
(5) .................................. Mapping or survey year ..................Original scale ......................
(Please add more areas on separate sheets of papers)
- Original data source
Remote sensing, specify..............
Ground survey
Nautical chart
Other, ..................................
- Intertidal flat feature represented as Polygon
Line
Point
Other, ........................................
- Please attach samples of attribute tables for the features
13
Table WTF1.2 Available non GIS map of intertidal flat distribution
- Format
Paper map, scale ......................
Image file (gif, jpeg, tif, etc.)
Other, .............................................
- Geographic Coverage
None
Whole country
Parts of country, specify general locations
(1) ................................. Mapping or survey year ..................Original scale ......................
(2) ...................................
Mapping or survey year ..................Original scale ......................
(3) ..................................
Mapping or survey year ..................Original scale ......................
(4) .................................. Mapping or survey year ..................Original scale .....................
(5) .................................. Mapping or survey year..................Original scale ......................
(Please add more areas on separate sheets of papers)
- Original data source
Remote sensing, specify..............
Ground survey
Nautical Chart
Other, ..................................
- Please attach samples of map
14
Table WTF1.3 Available non map data of intertidal flat distribution
- Format :
x,y coordinate file
Other, (1)........................
Other, (2)..................
- Geographic Coverage
None
Whole country
Parts of country, specify general locations
(1) .................................
Data year ........................................
(2) ...................................
Data year ........................................
(3) ..................................
Data year ........................................
(4) ..................................
Data year ........................................
(5) ..................................
Data year ........................................
(Please add more areas on separate sheets of papers)
- Original data source
Remote sensing, specify..............
Ground survey
Nautical Chart
Other, ..................................
- Please attach samples of data
15
WTF2 Environmental data for each intertidal flat in the South China
Sea part of the country
Intertidal flat name .................................................................................
The geographical coordinates (latitude and longitude) of the approximate center of the
intertidal flat, expressed in degrees and minutes.
Latitude................................. Longitude.....................................
Table WTF2.1
Category
Unit
Data
Remark*
1. Biological diversity
1.1 Species diversity
- Number of species of plants
Number
- Density of plants (all
Number/ha
species)
- Number of species of:
Phytoplantons
Number
Zooplantons
Number
Macrobenthos
Number
Resident fishes
Number
Transient fishes
Number
Resident mammals
Number
Resident birds
Number
Migratory birds
Number
1.2 Ecosystem diversity
- Number of types of
-
Number
Specify:
adjacent aquatic
habitats/ecosystems
* Add more papers if space provided is not enough
16
Table WTF
Table W 2.1
TF
2.2
Category
Unit
Data
Remark*
2. significance
2.1 Number of species that spawn
Number
None
in this intertidal flat
1-10
11-50
> 50
2.2 Number of species that feed
Number
None
or roost in this intertidal flat
1-10
11-50
> 50
2.3 Number of species that
Number
None
migrate through/to this intertidal
1-10
flat
11-50
> 50
2.4 Number of people that visit in Tourism
Number/
None
this intertidal flat for
year
1-1,000
1,001-
10,000
> 10,000
Fishing
Number/
None
year
1-1,000
1,001-
10,000
> 10,000
Number
None
Other (1)...............
1-1,000
1,001-
10,000
> 10,000
Number
None
Other (2)...............
1-1,000
1,001-
10,000
> 10,000
2.5 Top 3 international goods that Type (1)................
produced in this intertidal flat
Volume per year
Value per year
Major destination
Type (2)................
Volume
Value per year
Major destination
Type (3)................
Volume
Value per year
Major destination
* Add more papers if space provided is not enough
17
Table WTF
Table W 2.1
TF
2.3
Category
Unit
Data
Remark*
3. Regional and/or global 3.
significance
3.1 Number of endemic species
Number
3.2 Number of indigenous
Number
species
3.3 Number of rare species
Number
3.4 Number of endangered and
- Critically
Number
threatened species (IUCN Red
Endangered (CR)
List Categories)
- Endangered (EN)
Number
- Vulnerable (VU)
Number
3.5 Existing international
Ramsar site
Established
recognition
year
World heritage site
Established
year
Established
Other (1)............
year
Established
Other (2)...............
year
* Add more papers if space provided is not enough
18
Table WTF
Table W 2.1
TF
2.4
Category
Unit
Data
Remark*
4. National significance
4.1 Existing management plans
- Long-term
Yes
Detail:
(provide short detail)
- Medium-term
Yes
Detail:
- Short-term
Yes
Detail:
4.2 Commitment with
Yes
Specify:
international agreements/ issues
4.3 Existing status (IUCN
- Strict nature reserve
Established
Category)
year
www.iucn.org/themes/marine/pd - Wilderness area
Established
f/mpaguid.pdf
year
- National park
Established
year
- Natural monument
Established
year
- Habitat/Species
Established
management area
year
- Protected
Established
landscape/sea scape
year
- Managed resource
Established
protected area
year
Established
Other (1)...............
year
Established
Other (2)...............
year
4.4 Management or reservation
Yes
Identify:
activities on site
4.5 Existing level and quality of
High
site management
Medium
Low
4.6 Existing support to
High
institutional management
Medium
Low
4.7 Average level of direct
High
stakeholder involvement in
Medium
management
Low
* Add more papers if space provided is not enough
19
Table WTF
Table W 2.1
TF
2.5
Category
Unit
Data
Remark*
5. Extent of threats
5.1 Intrinsic/internal sources of
- Existing resident
Number
change
human population
- Frequency of
Number/
typhoon
year
- Change in
High
allocthonous
Medium
sediment inputs
Low
- Marine based
Number/
flooding
year
Other (1)............... ...............
Other (2)............... ...............
5.2 Extrinsic/external sources of
- Dam construction
High
change
Medium
Low
- Water diversion
High
Medium
Low
- Other changes in
High
Specify:
catchment basin
Medium
Low
Other (1)............... ...............
Other (2)............... ...............
5.3 Socio-economic drivers of
% /year
change in environmental state
- Population growth
% /year (+/-
- Migration
)
High
- GDP Development
Medium
Low
Other (1)............... ...............
Other (2)............... ...............
5.4 Rate of change in the
% /decade
estuarine area over the past
(+/-)
decade
* Add more papers if space provided is not enough
20
Table WTF
Table W 2.1
TF
2.6
Category
Unit
Data
Remark*
6. Financial and practical
considerations
6.1 Average investments for
IDR/year
existing management or
reservation activities
6.2 Trend of investment for
Increase
management in the future
Decrease
Stable
6.3 Average level of local
IDR/year
revenue generation over the past
decade
6.4 Level of stakeholder support
IDR/year
6.5 Potential for external
High
investment
Medium
Low
6.6 Estimated revenue if
IDR/year
Intertidal flat is sustainably
managed
6.7 Long-term sustainability
Yes
Identify:
including prospects for revenue
generation
6.8 Potential aspects that can be
Yes
Identify:
developed wisely in the site
6.9 Long term environmental
High
perspective
Medium
Low
* Add more papers if space provided is not enough
21
Indonesia
Data and information needs for the wetland component
III. Coastal brackish/saline lagoon
22
WL1 Distribution of Coastal brackish/saline lagoon in the South China
Sea part of the country
Table WL1.1 Available GIS map of coastal brackish/saline lagoon distribution
- Geographic coverage
None
Whole country
Parts of country, specify general locations
(1) ................................. Mapping or survey year ..................Original scale ......................
(2) ...................................
Mapping or survey year ..................Original scale ......................
(3) ..................................
Mapping or survey year ..................Original scale ......................
(4) .................................. Mapping or survey year ..................Original scale .....................
(5) .................................. Mapping or survey year ..................Original scale ......................
(Please add more areas on separate sheets of papers)
- Original data source
Remote sensing, specify..............
Ground survey
Nautical chart
Other, ..................................
- Coastal brackish/saline lagoon feature represented as Polygon Line
Point
Other, ........................................
- Please attach samples of attribute tables for the features
23
Table WL1.2 Available non GIS map of coastal brackish/saline lagoon
distribution
- Format
Paper map, scale ......................
Image file (gif, jpeg, tif, etc.)
Other, .............................................
- Geographic Coverage
None
Whole country
Parts of country, specify general locations
(1) ................................. Mapping or survey year ..................Original scale ......................
(2) ...................................
Mapping or survey year ..................Original scale ......................
(3) ..................................
Mapping or survey year ..................Original scale ......................
(4) .................................. Mapping or survey year ..................Original scale .....................
(5) .................................. Mapping or survey year..................Original scale ......................
(Please add more areas on separate sheets of papers)
- Original data source
Remote sensing, specify..............
Ground survey
Nautical Chart
Other, ..................................
- Please attach samples of map
24
Table WL1.3 Available non map data of coastal brackish/saline lagoon
distribution
- Format :
x,y coordinate file
Other, (1)........................
Other, (2)..................
- Geographic Coverage
None
Whole country
Parts of country, specify general locations
(1) .................................
Data year ........................................
(2) ...................................
Data year ........................................
(3) ..................................
Data year ........................................
(4) ..................................
Data year ........................................
(5) ..................................
Data year ........................................
(Please add more areas on separate sheets of papers)
- Original data source
Remote sensing, specify..............
Ground survey
Nautical Chart
Other, ..................................
- Please attach samples of data
25
WL2 Environmental data for each coastal brackish/saline lagoon in the
South China Sea part of the country
Coastal brackish/saline lagoon name ...............................................................
The geographical coordinates (latitude and longitude) of the approximate center of the coastal
brackish/saline lagoon, expressed in degrees and minutes.
Latitude................................. Longitude.....................................
Table WL2.1
Category
Unit
Data
Remark*
1. Biological diversity
1.1 Species diversity
- Number of species of plants
Number
- Density of plants (all
Number/ha
species)
- Number of species of:
Phytoplantons
Number
Zooplantons
Number
Macrobenthos
Number
Resident fishes
Number
Transient fishes
Number
Resident mammals
Number
Resident birds
Number
Migratory birds
Number
1.2 Ecosystem diversity
- Number of types of
-
Number
Specify:
adjacent aquatic
habitats/ecosystems
* Add more papers if space provided is not enough
26
Table WL2.1
Table WL
2.2
Category
Unit
Data
Remark*
2. significance
2.1 Number of species that spawn
Number
None
in this coastal brackish/saline
1-10
lagoon
11-50
> 50
2.2 Number of species that feed
Number
None
or roost in this coastal
1-10
brackish/saline lagoon
11-50
> 50
2.3 Number of species that
Number
None
migrate through/to this coastal
1-10
brackish/saline lagoon
11-50
> 50
2.4 Number of people that visit in Tourism
Number/
None
this coastal brackish/saline lagoon for
year
1-1,000
1,001-
10,000
> 10,000
Fishing
Number/
None
year
1-1,000
1,001-
10,000
> 10,000
Number
None
Other (1)...............
1-1,000
1,001-
10,000
> 10,000
Number
None
Other (2)...............
1-1,000
1,001-
10,000
> 10,000
2.5 Top 3 international goods that Type (1)................
produced in this Coastal
Volume per year
brackish/saline lagoon
Value per year
Major destination
Type (2)................
Volume
Value per year
Major destination
Type (3)................
Volume
Value per year
Major destination
* Add more papers if space provided is not enough
27
Table WL2.1
Table WL
2.3
Category
Unit
Data
Remark*
3. Regional and/or global 3.
significance
3.1 Number of endemic species
Number
3.2 Number of indigenous
Number
species
3.3 Number of rare species
Number
3.4 Number of endangered and
- Critically
Number
threatened species (IUCN Red
Endangered (CR)
List Categories)
- Endangered (EN)
Number
- Vulnerable (VU)
Number
3.5 Existing international
Ramsar site
Established
recognition
year
World heritage site
Established
year
Established
Other (1)............
year
Established
Other (2)...............
year
* Add more papers if space provided is not enough
28
Table WL2.1
Table WL
2.4
Category
Unit
Data
Remark*
4. National significance
4.1 Existing management plans
- Long-term
Yes
Detail:
(provide short detail)
- Medium-term
Yes
Detail:
- Short-term
Yes
Detail:
4.2 Commitment with
Yes
Specify:
international agreements/ issues
4.3 Existing status (IUCN
- Strict nature reserve
Established
Category)
year
www.iucn.org/themes/marine/pd - Wilderness area
Established
f/mpaguid.pdf
year
- National park
Established
year
- Natural monument
Established
year
- Habitat/Species
Established
management area
year
- Protected
Established
landscape/sea scape
year
- Managed resource
Established
protected area
year
Established
Other (1)...............
year
Established
Other (2)...............
year
4.4 Management or reservation
Yes
Identify:
activities on site
4.5 Existing level and quality of
High
site management
Medium
Low
4.6 Existing support to
High
institutional management
Medium
Low
4.7 Average level of direct
High
stakeholder involvement in
Medium
management
Low
* Add more papers if space provided is not enough
29
Table WL2.1
Table WL
2.5
Category
Unit
Data
Remark*
5. Extent of threats
5.1 Intrinsic/internal sources of
- Existing resident
Number
change
human population
- Frequency of
Number/
typhoon
year
- Change in
High
allocthonous
Medium
sediment inputs
Low
- Marine based
Number/
flooding
year
Other (1)............... ...............
Other (2)............... ...............
5.2 Extrinsic/external sources of
- Dam construction
High
change
Medium
Low
- Water diversion
High
Medium
Low
- Other changes in
High
Specify:
catchment basin
Medium
Low
Other (1)............... ...............
Other (2)............... ...............
5.3 Socio-economic drivers of
% /year
change in environmental state
- Population growth
% /year (+/-
- Migration
)
High
- GDP Development
Medium
Low
Other (1)............... ...............
Other (2)............... ...............
5.4 Rate of change in the
% /decade
estuarine area over the past
(+/-)
decade
* Add more papers if space provided is not enough
30
Table WL2.1
Table WL
2.6
Category
Unit
Data
Remark*
6. Financial and practical
considerations
6.1 Average investments for
IDR/year
existing management or
reservation activities
6.2 Trend of investment for
Increase
management in the future
Decrease
Stable
6.3 Average level of local
IDR/year
revenue generation over the past
decade
6.4 Level of stakeholder support
IDR/year
6.5 Potential for external
High
investment
Medium
Low
6.6 Estimated revenue if Coastal
IDR/year
brackish/saline lagoon is
sustainably managed
6.7 Long-term sustainability
Yes
Identify:
including prospects for revenue
generation
6.8 Potential aspects that can be
Yes
Identify:
developed wisely in the site
6.9 Long term environmental
High
perspective
Medium
Low
* Add more papers if space provided is not enough
1
Indonesia
Data and information needs for the fishery component
2
Administrative units to be include in this component
a. Bangka
b. Belitung
c. Indragiri Hilir
d. Kampar
e. Ketapang
f. Musi Banyuasin
g. Ogan Kemering Ilir
h. Pontianak
i. Riau Kepulauan
j. Sambas
k. Tanjung Jabung
3
Indonesia
F1: General landing statistic by administrative unit: Bangka
Recent, ....
1990
1980
1970
1960
Catch (ton/y)
All
Species
Value
(VND2)
Top 10 landing fisheries or inveterates
Common name1:
1st
Catch (ton/y)
Value (VND2)
Common name1:
2nd
Catch (ton/y)
Value (VND2)
Common name1:
3rd
Catch (ton/y)
Value (VND2)
Common name1:
4th
Catch (ton/y)
Value (VND2)
Common name1:
5th
Catch (ton/y)
Value (VND2)
Common name1:
6th
Catch (ton/y)
Value (VND2)
Common name1:
7th
Catch (ton/y)
Value (VND2)
Common name1:
8th
Catch (ton/y)
Value (VND2)
4
Recent, ....
1990
1980
1970
1960
Common name1:
9th
Catch (ton/y)
Value (VND2)
Common name1:
10th
Catch (ton/y)
Value (VND2)
Note:
1. Select from common name list in annex 1
2. Value (VND) = Value at the actual year (VND)
5
Indonesia
F1: General landing statistic by administrative unit: Belitung
Recent, ....
1990
1980
1970
1960
Catch (ton/y)
All
Species
Value
(VND2)
Top 10 landing fisheries or inveterates
Common name1:
1st
Catch (ton/y)
Value (VND2)
Common name1:
2nd
Catch (ton/y)
Value (VND2)
Common name1:
3rd
Catch (ton/y)
Value (VND2)
Common name1:
4th
Catch (ton/y)
Value (VND2)
Common name1:
5th
Catch (ton/y)
Value (VND2)
Common name1:
6th
Catch (ton/y)
Value (VND2)
Common name1:
7th
Catch (ton/y)
Value (VND2)
Common name1:
8th
Catch (ton/y)
Value (VND2)
6
Recent, ....
1990
1980
1970
1960
Common name1:
9th
Catch (ton/y)
Value (VND2)
Common name1:
10th
Catch (ton/y)
Value (VND2)
Note:
1. Select from common name list in annex 1
2. Value (VND) = Value at the actual year (VND)
7
Indonesia
F1: General landing statistic by administrative unit: Indragiri Hilir
Recent, ....
1990
1980
1970
1960
Catch (ton/y)
All
Species
Value
(VND2)
Top 10 landing fisheries or inveterates
Common name1:
1st
Catch (ton/y)
Value (VND2)
Common name1:
2nd
Catch (ton/y)
Value (VND2)
Common name1:
3rd
Catch (ton/y)
Value (VND2)
Common name1:
4th
Catch (ton/y)
Value (VND2)
Common name1:
5th
Catch (ton/y)
Value (VND2)
Common name1:
6th
Catch (ton/y)
Value (VND2)
Common name1:
7th
Catch (ton/y)
Value (VND2)
Common name1:
8th
Catch (ton/y)
Value (VND2)
8
Recent, ....
1990
1980
1970
1960
Common name1:
9th
Catch (ton/y)
Value (VND2)
Common name1:
10th
Catch (ton/y)
Value (VND2)
Note:
1. Select from common name list in annex 1
2. Value (VND) = Value at the actual year (VND)
9
Indonesia
F1: General landing statistic by administrative unit: Kampar
Recent, ....
1990
1980
1970
1960
Catch (ton/y)
All
Species
Value
(VND2)
Top 10 landing fisheries or inveterates
Common name1:
1st
Catch (ton/y)
Value (VND2)
Common name1:
2nd
Catch (ton/y)
Value (VND2)
Common name1:
3rd
Catch (ton/y)
Value (VND2)
Common name1:
4th
Catch (ton/y)
Value (VND2)
Common name1:
5th
Catch (ton/y)
Value (VND2)
Common name1:
6th
Catch (ton/y)
Value (VND2)
Common name1:
7th
Catch (ton/y)
Value (VND2)
Common name1:
8th
Catch (ton/y)
Value (VND2)
10
Recent, ....
1990
1980
1970
1960
Common name1:
9th
Catch (ton/y)
Value (VND2)
Common name1:
10th
Catch (ton/y)
Value (VND2)
Note:
1. Select from common name list in annex 1
2. Value (VND) = Value at the actual year (VND)
11
Indonesia
F1: General landing statistic by administrative unit: Ketapang
Recent, ....
1990
1980
1970
1960
Catch (ton/y)
All
Species
Value
(VND2)
Top 10 landing fisheries or inveterates
Common name1:
1st
Catch (ton/y)
Value (VND2)
Common name1:
2nd
Catch (ton/y)
Value (VND2)
Common name1:
3rd
Catch (ton/y)
Value (VND2)
Common name1:
4th
Catch (ton/y)
Value (VND2)
Common name1:
5th
Catch (ton/y)
Value (VND2)
Common name1:
6th
Catch (ton/y)
Value (VND2)
Common name1:
7th
Catch (ton/y)
Value (VND2)
Common name1:
8th
Catch (ton/y)
Value (VND2)
12
Recent, ....
1990
1980
1970
1960
Common name1:
9th
Catch (ton/y)
Value (VND2)
Common name1:
10th
Catch (ton/y)
Value (VND2)
Note:
1. Select from common name list in annex 1
2. Value (VND) = Value at the actual year (VND)
13
Indonesia
F1: General landing statistic by administrative unit: Musi Banyuasin
Recent, ....
1990
1980
1970
1960
Catch (ton/y)
All
Species
Value
(VND2)
Top 10 landing fisheries or inveterates
Common name1:
1st
Catch (ton/y)
Value (VND2)
Common name1:
2nd
Catch (ton/y)
Value (VND2)
Common name1:
3rd
Catch (ton/y)
Value (VND2)
Common name1:
4th
Catch (ton/y)
Value (VND2)
Common name1:
5th
Catch (ton/y)
Value (VND2)
Common name1:
6th
Catch (ton/y)
Value (VND2)
Common name1:
7th
Catch (ton/y)
Value (VND2)
Common name1:
8th
Catch (ton/y)
Value (VND2)
14
Recent, ....
1990
1980
1970
1960
Common name1:
9th
Catch (ton/y)
Value (VND2)
Common name1:
10th
Catch (ton/y)
Value (VND2)
Note:
1. Select from common name list in annex 1
2. Value (VND) = Value at the actual year (VND)
15
Indonesia
F1: General landing statistic by administrative unit: Ogan Kemering Ilir
Recent, ....
1990
1980
1970
1960
Catch (ton/y)
All
Species
Value
(VND2)
Top 10 landing fisheries or inveterates
Common name1:
1st
Catch (ton/y)
Value (VND2)
Common name1:
2nd
Catch (ton/y)
Value (VND2)
Common name1:
3rd
Catch (ton/y)
Value (VND2)
Common name1:
4th
Catch (ton/y)
Value (VND2)
Common name1:
5th
Catch (ton/y)
Value (VND2)
Common name1:
6th
Catch (ton/y)
Value (VND2)
Common name1:
7th
Catch (ton/y)
Value (VND2)
Common name1:
8th
Catch (ton/y)
Value (VND2)
16
Recent, ....
1990
1980
1970
1960
Common name1:
9th
Catch (ton/y)
Value (VND2)
Common name1:
10th
Catch (ton/y)
Value (VND2)
Note:
1. Select from common name list in annex 1
2. Value (VND) = Value at the actual year (VND)
17
Indonesia
F1: General landing statistic by administrative unit: Pontianak
Recent, ....
1990
1980
1970
1960
Catch (ton/y)
All
Species
Value
(VND2)
Top 10 landing fisheries or inveterates
Common name1:
1st
Catch (ton/y)
Value (VND2)
Common name1:
2nd
Catch (ton/y)
Value (VND2)
Common name1:
3rd
Catch (ton/y)
Value (VND2)
Common name1:
4th
Catch (ton/y)
Value (VND2)
Common name1:
5th
Catch (ton/y)
Value (VND2)
Common name1:
6th
Catch (ton/y)
Value (VND2)
Common name1:
7th
Catch (ton/y)
Value (VND2)
Common name1:
8th
Catch (ton/y)
Value (VND2)
18
Recent, ....
1990
1980
1970
1960
Common name1:
9th
Catch (ton/y)
Value (VND2)
Common name1:
10th
Catch (ton/y)
Value (VND2)
Note:
1. Select from common name list in annex 1
2. Value (VND) = Value at the actual year (VND)
19
Indonesia
F1: General landing statistic by administrative unit: Riau Kepulauan
Recent, ....
1990
1980
1970
1960
Catch (ton/y)
All
Species
Value
(VND2)
Top 10 landing fisheries or inveterates
Common name1:
1st
Catch (ton/y)
Value (VND2)
Common name1:
2nd
Catch (ton/y)
Value (VND2)
Common name1:
3rd
Catch (ton/y)
Value (VND2)
Common name1:
4th
Catch (ton/y)
Value (VND2)
Common name1:
5th
Catch (ton/y)
Value (VND2)
Common name1:
6th
Catch (ton/y)
Value (VND2)
Common name1:
7th
Catch (ton/y)
Value (VND2)
Common name1:
8th
Catch (ton/y)
Value (VND2)
20
Recent, ....
1990
1980
1970
1960
Common name1:
9th
Catch (ton/y)
Value (VND2)
Common name1:
10th
Catch (ton/y)
Value (VND2)
Note:
1. Select from common name list in annex 1
2. Value (VND) = Value at the actual year (VND)
21
Indonesia
F1: General landing statistic by administrative unit: Sambas
Recent, ....
1990
1980
1970
1960
Catch (ton/y)
All
Species
Value
(VND2)
Top 10 landing fisheries or inveterates
Common name1:
1st
Catch (ton/y)
Value (VND2)
Common name1:
2nd
Catch (ton/y)
Value (VND2)
Common name1:
3rd
Catch (ton/y)
Value (VND2)
Common name1:
4th
Catch (ton/y)
Value (VND2)
Common name1:
5th
Catch (ton/y)
Value (VND2)
Common name1:
6th
Catch (ton/y)
Value (VND2)
Common name1:
7th
Catch (ton/y)
Value (VND2)
Common name1:
8th
Catch (ton/y)
Value (VND2)
22
Recent, ....
1990
1980
1970
1960
Common name1:
9th
Catch (ton/y)
Value (VND2)
Common name1:
10th
Catch (ton/y)
Value (VND2)
Note:
1. Select from common name list in annex 1
2. Value (VND) = Value at the actual year (VND)
23
Indonesia
F1: General landing statistic by administrative unit: Tanjung Jabung
Recent, ....
1990
1980
1970
1960
Catch (ton/y)
All
Species
Value
(VND2)
Top 10 landing fisheries or inveterates
Common name1:
1st
Catch (ton/y)
Value (VND2)
Common name1:
2nd
Catch (ton/y)
Value (VND2)
Common name1:
3rd
Catch (ton/y)
Value (VND2)
Common name1:
4th
Catch (ton/y)
Value (VND2)
Common name1:
5th
Catch (ton/y)
Value (VND2)
Common name1:
6th
Catch (ton/y)
Value (VND2)
Common name1:
7th
Catch (ton/y)
Value (VND2)
Common name1:
8th
Catch (ton/y)
Value (VND2)
24
Recent, ....
1990
1980
1970
1960
Common name1:
9th
Catch (ton/y)
Value (VND2)
Common name1:
10th
Catch (ton/y)
Value (VND2)
Note:
1. Select from common name list in annex 1
2. Value (VND) = Value at the actual year (VND)
25
Indonesia
F2: General landing statistic by fishery ports or landing site:
Port/Landing site name .............................................................
The geographical coordinates (latitude and longitude) of the approximate centre of the fishery ports or
landing site, expressed in degrees and minutes.
Latitude................................. Longitude.....................................
Recent, ....
1990
1980
1970
1960
All
Catch (ton/y)
Species Value (VND2)
Top 10 landing common
Common name1:
1st
Catch (ton/y)
Value (VND2)
Common name1:
2nd
Catch (ton/y)
Value (VND2)
Common name1:
3rd
Catch (ton/y)
Value (VND2)
Common name1:
4th
Catch (ton/y)
Value (VND2)
Common name1:
5th
Catch (ton/y)
Value (VND2)
Common name1:
6th
Catch (ton/y)
Value (VND2)
Common name1:
7th
Catch (ton/y)
Value (VND2)
Common name:
8th
Catch (ton/y)
Value (VND2)
26
Recent, ....
1990
1980
1970
1960
Common name1:
9th
Catch (ton/y)
Value (VND2)
Common name1:
10th
Catch (ton/y)
Value (VND2)
Note:
1. Select from common name list in annex 1
2. Value (VND) = Value at the actual year (VND)
(Please reproduce this table for more ports)
27
Annex 1
List of Marine Species
SEAFDEC
Code
Family/Scientific name
Name
No.
2401 1. Shads
Clupeidae
- Anodontostoma chacunda
- Pellona ditchela
2402 2. Milkfish
Chanidae
- Chanos chanos
2501 1. Barramundi
Centropomidae
- Lates calcarifer
3101 1. Flounders
Bothidae
3102 2. Indian halibuts
Psettodidae
3103 3. Tongue soles
Cynoglossidae
3104 4. Soles
Soleidae
3301 1. Marine catfishes
Ariidae
3302 2. Catfish eels
Plotosidae
- Plotosus spp.
3303 3. Lizard fishes
Synodontidae
- Saurida spp.,
Trachinocephalus myops
3304 4. Sharp-toothed pike eels, Muraenesocidae
- Muraenesox spp.
conger eels
(including Congridae, Muraenidae and
Synbranchidae)
3305 5. Groupers
Serranidae
-Epinephelus spp., Plectropomus spp.
3306 6. Sillago whitings
Sillaginidae
3307 7. Red snappers
Lutjanidae
- Lutjanus spp.
(L. argentimaculatus, L. sabae, L.
malabaricus,
L. sanguineus, L. altifrontalis, L. bohar)
3308 8. Other snappers
Lutjanidae
- Lutjanus spp.
(L. johni, L. vitta, L. russelli, L. lineolatus,L.
latjanus,
L. fulviflamma, L. monostigma, L. kasmira,
L. vaigiensis)
- Pristipomoides spp.
3309 9. Fusiliers
Lutjanidae
- Caesio spp.
3310 10. Threadfin breams
Nemiplendae
- Nemipterus spp. (including Scolopsis spp.)
3311 11. Pony fishes
Leiognathidae
3312 12. Grunters & sweetlips
Pomadasyidae
3313 13. Drums & croakers
Sciaenidae
3314 14. Goat fishes
Mullidae
- Upeneus spp.
3315 15. Emperor breams
Lethrinidae
- Lethrinus spp. (including Gymnocranius spp.)
3316 16. Big-eye snappers
Priacanthidae
- Priacanthus spp.
3317 17. Breams
Sparidae
3318 18. Horseheads
Branchiostegidae
3319 19. Rabbitfishes
Siganidae
- Siganus spp.
3320 20. Other species
Main groups to be indicated, if possible
3401 1. Halfbeaks and
Exocoetidae
- Hemirhamphus spp. (including Cypselurus
needlefishes
spp.)
3402 2. Barracudas
Belonidae
- Tylosurus spp.
3403 3. Mullets
Sphyraenidae
- Sphyraena spp
3404 4. Threadfins
Mugilidae
3405 5. Round scads
Polynemidae
28
SEAFDEC
Code
Family/Scientific name
No.
Name
3406 6. Jacks, cavalla, trevallies Carangidae
- Decapterus spp.
Carangidae
- Caranx spp.
Gnathanodon speciosus (including Alectis
spp.,
Atropus atropus, Caranx chrysophrys, C.
malabaricus,
C. ignobilis)
3407 7. Selar scads
Carangidae
- Selar crumenophthalmus Selaroides leptolepis
(including Alepes spp., Selar spp.)
3408 8. Hardtail scad
Carangidae
- Megalaspis cordyla
3409 9. Queenfishes
Carangidae
- Scomberoides (= Chorinemus) spp.
3410 10. Black pomfret
Formionidae
- Formio niger
3411 11. White pomfrets
Stromateidae
- Pampus argenteus (including Pamopus
chinensis)
3412 12. Other species
Main groups to be indicated, if possible
3501 1. Sardines
Clupeidae
- Sardinella spp.
3502 2. Round herring
Clupeidae
- Dussumieria acuta
3503 3. Anchovies
Engraulidae
- Stolephorus spp.
3504 4. Clupeoids
Clupeoidei
3505 5. Wolf herring
Chirocentridae
- Chirocentrus dorab
3601 1. Skipjack tuna
Scombridae
- Katsuwonus pelamis
3602 2. Yellowfin tuna
Scombridae
- Thunnus albacares
3603 3. Big-eye tuna
Scombridae
- Thunnus obesus
3604 4. Longtail tuna
Scombridae
- Thunnus tonggol
3605 5. Albacore
Scombridae
- Thunnus alalunga
3606 6. Eastern little tuna
Scombridae
- Euthynnus affinis
3607 7. Frigate and bellet tuna
Scombridae
- Auxis thazard, A. rochei
3608 8. Indo-Pacific swordfish, Istiophoridae
- Istiophorus spp., Makaira spp.
sailfishes and marlins
Xiphiidae
- Xiphias spp.
3609 9. Narrow-barred king
Scombridae
- Scomberomorus commerson
mackerel
3610 10. King mackerels
Scombridae
- Scomberomorus guttatus
3701 1. Indian mackerels
Scombridae
- Rastrelliger kanagurta (including R. Faughni)
3702 2. Indo-Pacific mackerels
Scombridae
- Rastrelliger brachysoma
3703 3. Hairtails
Trichiuridae
3801 1. Sharks
Carcharhinidae, Sphynidae, Orectolobidae, etc.
3802 2. Rays
Trygonidae, Sphyrnidae, Myliobatidae,etc.
3901 1. Miscellaneous
Mixed species
3902 2. Trash fish
4201 1. Swimming crabs
Portunidae
- Portunnus spp.
4202 2. Mangrove crab
Portunidae
- Scylla serrata
4301 1. Spiny lobsters
Palinuridae
- Panulirus spp.
4302 2. Slipper lobster
Scyllaridae
- Thenus orientalis
4501 1. Tiger prawn
Penaeidae
- Penaeus monodon
4502 2. Penaeid prawns
Penaeidae
- Penaeus spp.
- Metapenaeus spp.
4503 3. Other prawns
Penaeidae
- Parapenaeopsis spp.
Sergestidae
- Acetes spp.
Solenoceridae
- Solenocera spp.
4701 1. Miscellaneous
Mixed species
29
SEAFDEC
Code
Family/Scientific name
No.
Name
5301 1. Flat oysters
Ostreidae
- Ostrea spp.
5302 2. Cupped oysters
Ostreidae
- Cassostrea spp.
5401 1. Sea mussels
Mytilidae
- Mytilus spp., Modiolus spp., Perna spp.,
Glauconome spp.
5501 1. Scallops
Pectinidae
5601 1. Blood cockles
Arcidae
- Anadara spp.
2. Clams and cone shells
Mactridae, Veneridae, Tridacnidae, Conidae
5701 1. Cuttlefishes
Sepiidae, Sepiolidae
5702 2. Squids
Loliginidae
- Loligo spp.
5703 3. Octopuses
Octopodidae
- Octopus spp.
5801 1. Miscellaneous
Other mollusks
7201 1. Sea turtles
Chelonia
7501 1. Sea urchins
Echinoidea
7502 2. Sea cucumbers
Holothurioidea
7601 1. Jellyfishes
Rhopilema spp.
7701 1. Miscellaneous aquatic
Invertebrata
animals
8101 1. Mother-of-pearl
Pearl oyster shells
8102 2. Other shells
Ex Mollusca
8201 1. Corals
Faviidae
8301 1. Sponges
Spongidae
9101 1. Brown seaweeds
Phaeophyceae
9201 1. Red seaweeds
Phodophyceae
9301 1. Green seaweeds
Chlorophyceae
9401 1. Miscellaneous aquatic
Algae
plants
30
Indonesia
F3: Fishing effort as number of fishing days per year by gear by administrative unit: Bangka
Recent, ....
1990
1980
1970
1960
Surrounding net
Seine net
Trawl
Lift net
Falling net
Gill net
Trap
Hook & Line
Scoop net
Drive-in-net
Dredges
Miscellaneous gear
31
Indonesia
F3: Fishing effort as number of fishing days per year by gear by administrative unit: Belitung
Recent, ....
1990
1980
1970
1960
Surrounding net
Seine net
Trawl
Lift net
Falling net
Gill net
Trap
Hook & Line
Scoop net
Drive-in-net
Dredges
Miscellaneous gear
32
Indonesia
F3: Fishing effort as number of fishing days per year by gear by administrative unit: Indragiri Hilir
Recent, ....
1990
1980
1970
1960
Surrounding net
Seine net
Trawl
Lift net
Falling net
Gill net
Trap
Hook & Line
Scoop net
Drive-in-net
Dredges
Miscellaneous gear
33
Indonesia
F3: Fishing effort as number of fishing days per year by gear by administrative unit: Kampar
Recent, ....
1990
1980
1970
1960
Surrounding net
Seine net
Trawl
Lift net
Falling net
Gill net
Trap
Hook & Line
Scoop net
Drive-in-net
Dredges
Miscellaneous gear
34
Indonesia
F3: Fishing effort as number of fishing days per year by gear by administrative unit: Ketapang
Recent, ....
1990
1980
1970
1960
Surrounding net
Seine net
Trawl
Lift net
Falling net
Gill net
Trap
Hook & Line
Scoop net
Drive-in-net
Dredges
Miscellaneous gear
35
Indonesia
F3: Fishing effort as number of fishing days per year by gear by administrative unit: Musi Banyuasin
Recent, ....
1990
1980
1970
1960
Surrounding net
Seine net
Trawl
Lift net
Falling net
Gill net
Trap
Hook & Line
Scoop net
Drive-in-net
Dredges
Miscellaneous gear
36
Indonesia
F3: Fishing effort as number of fishing days per year by gear by administrative unit: Ogan Kemering Ilir
Recent, ....
1990
1980
1970
1960
Surrounding net
Seine net
Trawl
Lift net
Falling net
Gill net
Trap
Hook & Line
Scoop net
Drive-in-net
Dredges
Miscellaneous gear
37
Indonesia
F3: Fishing effort as number of fishing days per year by gear by administrative unit: Pontianak
Recent, ....
1990
1980
1970
1960
Surrounding net
Seine net
Trawl
Lift net
Falling net
Gill net
Trap
Hook & Line
Scoop net
Drive-in-net
Dredges
Miscellaneous gear
38
Indonesia
F3: Fishing effort as number of fishing days per year by gear by administrative unit: Riau Kepulauan
Recent, ....
1990
1980
1970
1960
Surrounding net
Seine net
Trawl
Lift net
Falling net
Gill net
Trap
Hook & Line
Scoop net
Drive-in-net
Dredges
Miscellaneous gear
39
Indonesia
F3: Fishing effort as number of fishing days per year by gear by administrative unit: Sambas
Recent, ....
1990
1980
1970
1960
Surrounding net
Seine net
Trawl
Lift net
Falling net
Gill net
Trap
Hook & Line
Scoop net
Drive-in-net
Dredges
Miscellaneous gear
40
Indonesia
F3: Fishing effort as number of fishing days per year by gear by administrative unit: Tanjung Jabung
Recent, ....
1990
1980
1970
1960
Surrounding net
Seine net
Trawl
Lift net
Falling net
Gill net
Trap
Hook & Line
Scoop net
Drive-in-net
Dredges
Miscellaneous gear
41
Indonesia
F4: Fishing effort as number of boats per year by gear by administrative unit: Bangka
Recent, ....
1990
1980
1970
1960
Surrounding net
Seine net
Trawl
Lift net
Falling net
Gill net
Trap
Hook & Line
Scoop net
Drive-in-net
Dredges
Miscellaneous gear
42
Indonesia
F4: Fishing effort as number of boats per year by gear by administrative unit: Belitung
Recent, ....
1990
1980
1970
1960
Surrounding net
Seine net
Trawl
Lift net
Falling net
Gill net
Trap
Hook & Line
Scoop net
Drive-in-net
Dredges
Miscellaneous gear
43
Indonesia
F4: Fishing effort as number of boats per year by gear by administrative unit: Indragiri Hilir
Recent, ....
1990
1980
1970
1960
Surrounding net
Seine net
Trawl
Lift net
Falling net
Gill net
Trap
Hook & Line
Scoop net
Drive-in-net
Dredges
Miscellaneous gear
44
Indonesia
F4: Fishing effort as number of boats per year by gear by administrative unit: Kampar
Recent, ....
1990
1980
1970
1960
Surrounding net
Seine net
Trawl
Lift net
Falling net
Gill net
Trap
Hook & Line
Scoop net
Drive-in-net
Dredges
Miscellaneous gear
45
Indonesia
F4: Fishing effort as number of boats per year by gear by administrative unit: Ketapang
Recent, ....
1990
1980
1970
1960
Surrounding net
Seine net
Trawl
Lift net
Falling net
Gill net
Trap
Hook & Line
Scoop net
Drive-in-net
Dredges
Miscellaneous gear
46
Indonesia
F4: Fishing effort as number of boats per year by gear by administrative unit: Musi Banyuasin
Recent, ....
1990
1980
1970
1960
Surrounding net
Seine net
Trawl
Lift net
Falling net
Gill net
Trap
Hook & Line
Scoop net
Drive-in-net
Dredges
Miscellaneous gear
47
Indonesia
F4: Fishing effort as number of boats per year by gear by administrative unit: Ogan Kemering Ilir
Recent, ....
1990
1980
1970
1960
Surrounding net
Seine net
Trawl
Lift net
Falling net
Gill net
Trap
Hook & Line
Scoop net
Drive-in-net
Dredges
Miscellaneous gear
48
Indonesia
F4: Fishing effort as number of boats per year by gear by administrative unit: Pontianak
Recent, ....
1990
1980
1970
1960
Surrounding net
Seine net
Trawl
Lift net
Falling net
Gill net
Trap
Hook & Line
Scoop net
Drive-in-net
Dredges
Miscellaneous gear
49
Indonesia
F4: Fishing effort as number of boats per year by gear by administrative unit: Riau Kepulauan
Recent, ....
1990
1980
1970
1960
Surrounding net
Seine net
Trawl
Lift net
Falling net
Gill net
Trap
Hook & Line
Scoop net
Drive-in-net
Dredges
Miscellaneous gear
50
Indonesia
F4: Fishing effort as number of boats per year by gear by administrative unit: Sambas
Recent, ....
1990
1980
1970
1960
Surrounding net
Seine net
Trawl
Lift net
Falling net
Gill net
Trap
Hook & Line
Scoop net
Drive-in-net
Dredges
Miscellaneous gear
51
Indonesia
F4: Fishing effort as number of boats per year by gear by administrative unit: Tanjung Jabung
Recent, ....
1990
1980
1970
1960
Surrounding net
Seine net
Trawl
Lift net
Falling net
Gill net
Trap
Hook & Line
Scoop net
Drive-in-net
Dredges
Miscellaneous gear
52
Indonesia
F5: Fishing effort as number of fishing days per year by gear by Port/Landing site name ........................
The geographical coordinates (latitude and longitude) of the approximate centre of the fishery ports or
landing site, expressed in degrees and minutes.
Latitude................................. Longitude.....................................
Recent, ....
1990
1980
1970
1960
Surrounding net
Seine net
Trawl
Lift net
Falling net
Gill net
Trap
Hook & Line
Scoop net
Drive-in-net
Dredges
Miscellaneous gear
(Please reproduce this table for more ports)
53
Indonesia
F6: Fishing effort as number of boats per year by gear by Port/Landing site name ........................
The geographical coordinates (latitude and longitude) of the approximate centre of the fishery ports or
landing site, expressed in degrees and minutes.
Latitude................................. Longitude.....................................
Recent, ....
1990
1980
1970
1960
Surrounding net
Seine net
Trawl
Lift net
Falling net
Gill net
Trap
Hook & Line
Scoop net
Drive-in-net
Dredges
Miscellaneous gear
(Please reproduce this table for more ports)
54
Indonesia
F7: Importance of the fisheries sector in terms of employment & dependence by administrative unit: Bangka
Year
Number of fishermen
Number of fishing household
members
Number of fish processing plants or
factories
Number of employees in fish
processing industry
Estimate proportion fishery product
consumed locally
<10 10-50 >90
(Please round-up number to the nearest 1,000)
Indonesia
F7: Importance of the fisheries sector in terms of employment & dependence by administrative unit: Belitung
Year
Number of fishermen
Number of fishing household
members
Number of fish processing plants or
factories
Number of employees in fish
processing industry
Estimate proportion fishery product
consumed locally
<10 10-50 >90
(Please round-up number to the nearest 1,000)
Indonesia
F7: Importance of the fisheries sector in terms of employment & dependence by administrative unit: Indragiri Hilir
Year
Number of fishermen
Number of fishing household
members
Number of fish processing plants or
factories
Number of employees in fish
processing industry
Estimate proportion fishery product
consumed locally
<10 10-50 >90
(Please round-up number to the nearest 1,000)
55
Indonesia
F7: Importance of the fisheries sector in terms of employment & dependence by administrative unit: Kampar
Year
Number of fishermen
Number of fishing household
members
Number of fish processing plants or
factories
Number of employees in fish
processing industry
Estimate proportion fishery product
consumed locally
<10 10-50 >90
(Please round-up number to the nearest 1,000)
Indonesia
F7: Importance of the fisheries sector in terms of employment & dependence by administrative unit: Ketapang
Year
Number of fishermen
Number of fishing household
members
Number of fish processing plants or
factories
Number of employees in fish
processing industry
Estimate proportion fishery product
consumed locally
<10 10-50 >90
(Please round-up number to the nearest 1,000)
Indonesia
F7: Importance of the fisheries sector in terms of employment & dependence by administrative unit:
Musi Banyuasin
Year
Number of fishermen
Number of fishing household
members
Number of fish processing plants or
factories
Number of employees in fish
processing industry
Estimate proportion fishery product
consumed locally
<10 10
-50 >90
(Please round-up number to the nearest 1,000)
56
Indonesia
F7: Importance of the fisheries sector in terms of employment & dependence by administrative unit:
Ogan Kemering Ilir
Year
Number of fishermen
Number of fishing household
members
Number of fish processing plants or
factories
Number of employees in fish
processing industry
Estimate proportion fishery product
consumed locally
<10 10-50 >90
(Please round-up number to the nearest 1,000)
Indonesia
F7: Importance of the fisheries sector in terms of employment & dependence by administrative unit: Pontianak
Year
Number of fishermen
Number of fishing household
members
Number of fish processing plants or
factories
Number of employees in fish
processing industry
Estimate proportion fishery product
consumed locally
<10 10-50 >90
(Please round-up number to the nearest 1,000)
Indonesia
F7: Importance of the fisheries sector in terms of employment & dependence by administrative unit:
Riau Kepulauan
Year
Number of fishermen
Number of fishing household
members
Number of fish processing plants or
factories
Number of employees in fish
processing industry
Estimate proportion fishery product
consumed locally
<10 10-50 >90
(Please round-up number to the nearest 1,000)
57
Indonesia
F7: Importance of the fisheries sector in terms of employment & dependence by administrative unit: Sambas
Year
Number of fishermen
Number of fishing household
members
Number of fish processing plants or
factories
Number of employees in fish
processing industry
Estimate proportion fishery product
consumed locally
<10 10-50 >90
(Please round-up number to the nearest 1,000)
Indonesia
F7: Importance of the fisheries sector in terms of employment & dependence by administrative unit:
Tanjung Jabung
Year
Number of fishermen
Number of fishing household
members
Number of fish processing plants or
factories
Number of employees in fish
processing industry
Estimate proportion fishery product
consumed locally
<10 10-50 >90
(Please round-up number to the nearest 1,000)
58
Indonesia
F8: Top ten species of regional, global and/or transboundary significance
Species and/or common name Number 1..........................................................
Fish Type
IUCN status
(http://www.redlist.org/info/categories_criteria.html)
Large pelagic fishes
Extinct (EX)
Small pelagic fish species
Extinct in the wild (EW)
Demersal fish species
Critically endangered (CR)
Commercially exploited invertebrates
Endangered (EN)
Other, specify ..............................
Vulnerable (VU)
Lower risk (LR)
Data Deficient (DD)
Special concerns
Not evaluated (NE)
Endemic
Other (1), specify ..............................
Other (2), specify ..............................
None
Status of population
CPUE
Stock Size
MSY
Year
Unit ........................... Unit ...........................
Unit ........................
Recent, ..............
1990
1980
1970
1960
Major threats to the species (please select upto 3 most important threats)
Present
Future (next decade)
Declining in spawning or nursing grounds
Declining in spawning or nursing grounds
Over fishing
Over fishing
Destructive fishing practices
Destructive fishing practices
Alien species/disease
Alien species/disease
Pollution
Pollution
Climate change
Climate change
Natural disasters
Natural disasters
Population fragmentation
Population fragmentation
Unknown
Unknown
Other (1), specify ..............................
Other (1), specify ..............................
Other (2), specify .............................
Other (2), specify ..............................
59
Species and/or common name Number 2..........................................................
Fish Type
IUCN status
(http://www.redlist.org/info/categories_criteria.html)
Large pelagic fishes
Extinct (EX)
Small pelagic fish species
Extinct in the wild (EW)
Demersal fish species
Critically endangered (CR)
Commercially exploited invertebrates
Endangered (EN)
Other, specify ..............................
Vulnerable (VU)
Lower risk (LR)
Data Deficient (DD)
Special concerns
Not evaluated (NE)
Endemic
Other (1), specify ..............................
Other (2), specify ..............................
None
Status of population
CPUE
Stock Size
MSY
Year
Unit ........................... Unit ...........................
Unit ........................
Recent, ..............
1990
1980
1970
1960
Major threats to the species (please select upto 3 most important threats)
Present
Future (next decade)
Declining in spawning or nursing grounds
Declining in spawning or nursing grounds
Over fishing
Over fishing
Destructive fishing practices
Destructive fishing practices
Alien species/disease
Alien species/disease
Pollution
Pollution
Climate change
Climate change
Natural disasters
Natural disasters
Population fragmentation
Population fragmentation
Unknown
Unknown
Other (1), specify ..............................
Other (1), specify ..............................
Other (2), specify .............................
Other (2), specify ..............................
60
Species and/or common name Number 3..........................................................
Fish Type
IUCN status
(http://www.redlist.org/info/categories_criteria.html)
Large pelagic fishes
Extinct (EX)
Small pelagic fish species
Extinct in the wild (EW)
Demersal fish species
Critically endangered (CR)
Commercially exploited invertebrates
Endangered (EN)
Other, specify ..............................
Vulnerable (VU)
Lower risk (LR)
Data Deficient (DD)
Special concerns
Not evaluated (NE)
Endemic
Other (1), specify ..............................
Other (2), specify ..............................
None
Status of population
CPUE
Stock Size
MSY
Year
Unit ........................... Unit ...........................
Unit ........................
Recent, ..............
1990
1980
1970
1960
Major threats to the species (please select upto 3 most important threats)
Present
Future (next decade)
Declining in spawning or nursing grounds
Declining in spawning or nursing grounds
Over fishing
Over fishing
Destructive fishing practices
Destructive fishing practices
Alien species/disease
Alien species/disease
Pollution
Pollution
Climate change
Climate change
Natural disasters
Natural disasters
Population fragmentation
Population fragmentation
Unknown
Unknown
Other (1), specify ..............................
Other (1), specify ..............................
Other (2), specify .............................
Other (2), specify ..............................
61
Species and/or common name Number 4..........................................................
Fish Type
IUCN status
(http://www.redlist.org/info/categories_criteria.html)
Large pelagic fishes
Extinct (EX)
Small pelagic fish species
Extinct in the wild (EW)
Demersal fish species
Critically endangered (CR)
Commercially exploited invertebrates
Endangered (EN)
Other, specify ..............................
Vulnerable (VU)
Lower risk (LR)
Data Deficient (DD)
Special concerns
Not evaluated (NE)
Endemic
Other (1), specify ..............................
Other (2), specify ..............................
None
Status of population
CPUE
Stock Size
MSY
Year
Unit ........................... Unit ...........................
Unit ........................
Recent, ..............
1990
1980
1970
1960
Major threats to the species (please select upto 3 most important threats)
Present
Future (next decade)
Declining in spawning or nursing grounds
Declining in spawning or nursing grounds
Over fishing
Over fishing
Destructive fishing practices
Destructive fishing practices
Alien species/disease
Alien species/disease
Pollution
Pollution
Climate change
Climate change
Natural disasters
Natural disasters
Population fragmentation
Population fragmentation
Unknown
Unknown
Other (1), specify ..............................
Other (1), specify ..............................
Other (2), specify .............................
Other (2), specify ..............................
62
Species and/or common name Number 5..........................................................
Fish Type
IUCN status
(http://www.redlist.org/info/categories_criteria.html)
Large pelagic fishes
Extinct (EX)
Small pelagic fish species
Extinct in the wild (EW)
Demersal fish species
Critically endangered (CR)
Commercially exploited invertebrates
Endangered (EN)
Other, specify ..............................
Vulnerable (VU)
Lower risk (LR)
Data Deficient (DD)
Special concerns
Not evaluated (NE)
Endemic
Other (1), specify ..............................
Other (2), specify ..............................
None
Status of population
CPUE
Stock Size
MSY
Year
Unit ........................... Unit ...........................
Unit ........................
Recent, ..............
1990
1980
1970
1960
Major threats to the species (please select upto 3 most important threats)
Present
Future (next decade)
Declining in spawning or nursing grounds
Declining in spawning or nursing grounds
Over fishing
Over fishing
Destructive fishing practices
Destructive fishing practices
Alien species/disease
Alien species/disease
Pollution
Pollution
Climate change
Climate change
Natural disasters
Natural disasters
Population fragmentation
Population fragmentation
Unknown
Unknown
Other (1), specify ..............................
Other (1), specify ..............................
Other (2), specify .............................
Other (2), specify ..............................
63
Species and/or common name Number 6..........................................................
Fish Type
IUCN status
(http://www.redlist.org/info/categories_criteria.html)
Large pelagic fishes
Extinct (EX)
Small pelagic fish species
Extinct in the wild (EW)
Demersal fish species
Critically endangered (CR)
Commercially exploited invertebrates
Endangered (EN)
Other, specify ..............................
Vulnerable (VU)
Lower risk (LR)
Data Deficient (DD)
Special concerns
Not evaluated (NE)
Endemic
Other (1), specify ..............................
Other (2), specify ..............................
None
Status of population
CPUE
Stock Size
MSY
Year
Unit ........................... Unit ...........................
Unit ........................
Recent, ..............
1990
1980
1970
1960
Major threats to the species (please select upto 3 most important threats)
Present
Future (next decade)
Declining in spawning or nursing grounds
Declining in spawning or nursing grounds
Over fishing
Over fishing
Destructive fishing practices
Destructive fishing practices
Alien species/disease
Alien species/disease
Pollution
Pollution
Climate change
Climate change
Natural disasters
Natural disasters
Population fragmentation
Population fragmentation
Unknown
Unknown
Other (1), specify ..............................
Other (1), specify ..............................
Other (2), specify .............................
Other (2), specify ..............................
64
Species and/or common name Number 7..........................................................
Fish Type
IUCN status
(http://www.redlist.org/info/categories_criteria.html)
Large pelagic fishes
Extinct (EX)
Small pelagic fish species
Extinct in the wild (EW)
Demersal fish species
Critically endangered (CR)
Commercially exploited invertebrates
Endangered (EN)
Other, specify ..............................
Vulnerable (VU)
Lower risk (LR)
Data Deficient (DD)
Special concerns
Not evaluated (NE)
Endemic
Other (1), specify ..............................
Other (2), specify ..............................
None
Status of population
CPUE
Stock Size
MSY
Year
Unit ........................... Unit ...........................
Unit ........................
Recent, ..............
1990
1980
1970
1960
Major threats to the species (please select upto 3 most important threats)
Present
Future (next decade)
Declining in spawning or nursing grounds
Declining in spawning or nursing grounds
Over fishing
Over fishing
Destructive fishing practices
Destructive fishing practices
Alien species/disease
Alien species/disease
Pollution
Pollution
Climate change
Climate change
Natural disasters
Natural disasters
Population fragmentation
Population fragmentation
Unknown
Unknown
Other (1), specify ..............................
Other (1), specify ..............................
Other (2), specify .............................
Other (2), specify ..............................
65
Species and/or common name Number 8..........................................................
Fish Type
IUCN status
(http://www.redlist.org/info/categories_criteria.html)
Large pelagic fishes
Extinct (EX)
Small pelagic fish species
Extinct in the wild (EW)
Demersal fish species
Critically endangered (CR)
Commercially exploited invertebrates
Endangered (EN)
Other, specify ..............................
Vulnerable (VU)
Lower risk (LR)
Data Deficient (DD)
Special concerns
Not evaluated (NE)
Endemic
Other (1), specify ..............................
Other (2), specify ..............................
None
Status of population
CPUE
Stock Size
MSY
Year
Unit ........................... Unit ...........................
Unit ........................
Recent, ..............
1990
1980
1970
1960
Major threats to the species (please select upto 3 most important threats)
Present
Future (next decade)
Declining in spawning or nursing grounds
Declining in spawning or nursing grounds
Over fishing
Over fishing
Destructive fishing practices
Destructive fishing practices
Alien species/disease
Alien species/disease
Pollution
Pollution
Climate change
Climate change
Natural disasters
Natural disasters
Population fragmentation
Population fragmentation
Unknown
Unknown
Other (1), specify ..............................
Other (1), specify ..............................
Other (2), specify .............................
Other (2), specify ..............................
66
Species and/or common name Number 9..........................................................
Fish Type
IUCN status
(http://www.redlist.org/info/categories_criteria.html)
Large pelagic fishes
Extinct (EX)
Small pelagic fish species
Extinct in the wild (EW)
Demersal fish species
Critically endangered (CR)
Commercially exploited invertebrates
Endangered (EN)
Other, specify ..............................
Vulnerable (VU)
Lower risk (LR)
Data Deficient (DD)
Special concerns
Not evaluated (NE)
Endemic
Other (1), specify ..............................
Other (2), specify ..............................
None
Status of population
CPUE
Stock Size
MSY
Year
Unit ........................... Unit ...........................
Unit ........................
Recent, ..............
1990
1980
1970
1960
Major threats to the species (please select upto 3 most important threats)
Present
Future (next decade)
Declining in spawning or nursing grounds
Declining in spawning or nursing grounds
Over fishing
Over fishing
Destructive fishing practices
Destructive fishing practices
Alien species/disease
Alien species/disease
Pollution
Pollution
Climate change
Climate change
Natural disasters
Natural disasters
Population fragmentation
Population fragmentation
Unknown
Unknown
Other (1), specify ..............................
Other (1), specify ..............................
Other (2), specify .............................
Other (2), specify ..............................
67
Species and/or common name Number 10..........................................................
Fish Type
IUCN status
(http://www.redlist.org/info/categories_criteria.html)
Large pelagic fishes
Extinct (EX)
Small pelagic fish species
Extinct in the wild (EW)
Demersal fish species
Critically endangered (CR)
Commercially exploited invertebrates
Endangered (EN)
Other, specify ..............................
Vulnerable (VU)
Lower risk (LR)
Data Deficient (DD)
Special concerns
Not evaluated (NE)
Endemic
Other (1), specify ..............................
Other (2), specify ..............................
None
Status of population
CPUE
Stock Size
MSY
Year
Unit ........................... Unit ...........................
Unit ........................
Recent, ..............
1990
1980
1970
1960
Major threats to the species (please select upto 3 most important threats)
Present
Future (next decade)
Declining in spawning or nursing grounds
Declining in spawning or nursing grounds
Over fishing
Over fishing
Destructive fishing practices
Destructive fishing practices
Alien species/disease
Alien species/disease
Pollution
Pollution
Climate change
Climate change
Natural disasters
Natural disasters
Population fragmentation
Population fragmentation
Unknown
Unknown
Other (1), specify ..............................
Other (1), specify ..............................
Other (2), specify .............................
Other (2), specify ..............................
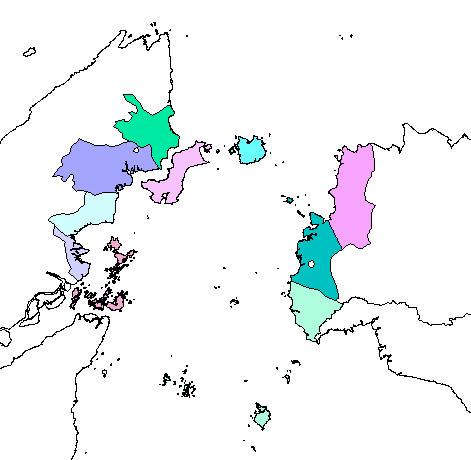
68
Indonesia
F9: Areas of importance in the maintenance of exploited fish stocks
Instruction
1. Locate as many areas that are important for maintaining of exploited stocks and indicate their names in
the map. (you may substitute this map by any other maps or GIS as appropriate.)
2. For each area in the map provide information in each Table F9.
69
F10: Name of area ......................................................
The geographical coordinates (latitude and longitude) of the approximate centre of the fishery area
expressed in degrees and minutes.
Latitude................................. Longitude.....................................
(Please reproduce this page for more area)
Common name1 and/or species of top 5 fishes that use this area for:
Spawning grounds
Nursing areas
Feeding grounds
Fishing grounds
1st
2nd
3rd
4th
5th
Threats to this area
Present
Future (next decade)
Destructive harvestation
Destructive harvestation
Explosive fishing
Bottom trawl
Explosive fishing
Bottom trawl
Plant/animal removal
Plant/animal removal
Other (1), specify ...........................
Other (1), specify ...........................
Other (2), specify ...........................
Other (2), specify ...........................
Pollution
Pollution
Sediment Oil
Sediment Oil
Heavy metals Organic pollutants
Heavy metals Organic pollutants
Eutrophication Salinity change
Eutrophication Salinity change
Thermal Pesticides
Thermal Pesticides
Other (1), specify ...........................
Other (1), specify ...........................
Other (2), specify ...........................
Other (2), specify ...........................
Natural disaster
Natural disaster
Storm
Volcano
Flood
Storm
Volcano
Flood
Land subsidance
Drought
Land subsidance
Drought
Fire
Fire
Other (1), specify ...........................
Other (1), specify ...........................
Other (2), specify ...........................
Other (2), specify ...........................
70
Global changes
Global changes
Thermal
Thermal
Sea level rise .................................
Sea level rise .................................
Other (1), specify ...........................
Other (1), specify ...........................
Other (2), specify ...........................
Other (2), specify ...........................
Coastal development
Coastal development
Land fill
Dredging
Tourism
Land fill
Dredging
Tourism
Coastal erosion
Coastal erosion
Other (1), specify ...........................
Other (1), specify ...........................
Other (2), specify ...........................
Other (2), specify ...........................
Upland development
Upland development
Changing discharge and runoff
Changing discharge and runoff
Other (1), specify ...........................
Other (1), specify ...........................
Other (2), specify ...........................
Other (2), specify ...........................
71
F11: Sources of data (Please add more pages if necessary)
Please provide reference to data given
1. ...........................................................................................................................
..............................................................................................................................
2. ...........................................................................................................................
..............................................................................................................................
3. ...........................................................................................................................
..............................................................................................................................
4. ...........................................................................................................................
..............................................................................................................................
5. ...........................................................................................................................
..............................................................................................................................
Name of data providers
1. Name....................................................................................................................
Address ...................................................................................................................
Tel: .................................... Fax: ................................. E-mail:..................................
2. Name....................................................................................................................
Address ...................................................................................................................
Tel: .................................... Fax: ................................. E-mail:..................................
3. Name....................................................................................................................
Address ...................................................................................................................
Tel: .................................... Fax: ................................. E-mail:..................................
4. Name....................................................................................................................
Address ...................................................................................................................
Tel: .................................... Fax: ................................. E-mail:..................................
1
Indonesia
Data and information needs for
the land-based pollution component
2
LBP1 Data of each pollution monitoring station in the South China Sea
part of Indonesia
Pollution site name.............................................................
The exact geographical coordinates (latitude and longitude) of the pollution monitoring
station every 100 km along coastaline, expressed in degrees and minutes.
Latitude................................. Longitude.....................................
Data
Table LBP1.1
Category
Unit
Annual
Annual
Remark*
average ~1990 average ~2000
Coastal impact data
Ambient water quality
Ammonia
Ąg-N/l
Cadmium
Ąg/l
Chromium (VI)
Ąg/l
Copper
Ąg/l
O
Temperature
C
Cyanide
mg/l
Dissolved oxygen
mg/l
Lead
Ąg/l
Mercury
Ąg/l
Nitrate
Ąg-N/l
Nitrite
Ąg-N/l
Oil and grease
mg/l
Total phenol
Ąg/l
Phosphate
Ąg-P/l
Tributyltin
Ąg-Sn/l
BOD
mg/l
COD
mg/l
Total suspended
mg/l
solids
Bacteria,
specify.................
Other (1) ............
Other (2) ............
* Add more papers if space provided is not enough
3
Data
Table LBP1.2
Category
Unit
Annual
Annual
Remark*
average ~1990 average ~2000
Sediment Quality
Sand
percent
Silt
percent
Clay
percent
Cadmium
ppm
Chromium (VI)
ppm
Copper
ppm
Lead
ppm
Mercury
ppm
Tributyltin
ppm
POPs,
specify................. ppm
Hydrocarbon
ppm
Total N
ppm
Total P
ppm
Organic carbon
ppm
Other (1)
..........................
Other (2)
..........................
* Add more papers if space provided is not enough
4
Administration unit name:...............................................................
Belong to river catchment or basin name:..............................................
Table LBP1.3 Impact of pollution on Human health
Other (1)
Other (2)
Year
Cases of
Remark*
diarhea
Cases of PSP
.................... .....................
1990
1991
1992
1993
1994
1995
1996
1997
1998
1999
2000
* Add more papers if space provided is not enough
5
Administration unit name:...............................................................
Belong to river catchment or basin name:..............................................
Table LBP1.4
Category
Unit
1990
2000
2010
Remark*
Loading data
Industrial sources Type of factory (1) number
Annual production
........................ .......................
Type of factory (2) number
Annual production
........................ .......................
Type of factory (3) number
Annual production
........................ .......................
Agriculture
Rice
source
Area (hectare)
Production
(ton/year)
Plantation area
hectare
(fruits, rubber)
Other crop (1)
Area (hectare)
Production
........................ (ton/year)
Other crop (2)
Area (hectare)
Production
........................ (ton/year)
* Add more papers if space provided is not enough
6
Table LBP1.5
Category
Unit
1990
2000
2010
Remark*
Livestock source Poultry (duck,
number
chicken)
Lifestock (cow,
number
buffalo, sheep)
Other livestock
(1)...............
number
Other livestock
(2).................. number
Aquaculture
Pond area
hectare
Production
ton/year
Solid waste
Waste generated
ton/year
Waste collected
ton/year
Waste water
Number of facility
number
treatment
facilities
Capacity
m3 /d
Groundwater
Groundwater yield
m3 /d
* Add more papers if space provided is not enough
UNEP/GEF/SCS/EW.1/3
Annex 9
Page 1
ANNEX 9
Regional Meta-database Format for the UNEP/GEF South China Sea Project
Metadata Entry Form
Example Metadata Entry Form
UNEP/GEF Project "Reversing Environmental Degradation Trends in the South China
Sea and Gulf of Thailand" (UNEP/GEF SCS Project)
Metadata Entry Form
(Save this form under a new filename for each metadata)
1. Entry Identifier:
Metadata Form5
2. Data Set Name:
3. Data Set Producer(s):
4. Parameter(s):
LAND SURFACE
ATMOSPHERE
FRESHWATER
Topography
Atmospheric Chemistry/Air Quality
Ground Water
Soil
Atmospheric Physics/Meteorology/Climate
Surface Water
Land Use/Land Cover
Other Atmospheric Aspects
Water Quality
Other Land Surface
OCEAN
Other Hydrosphere
AGRICULTURE
Bathymetry
BIOSPHERE
Aquaculture
Coastal Processes
Terrestrial Habitats
Fisheries
Marine Geophysics
Freshwater Aquatic Habitats
Agriculture/Cropping
Marine Sediments
Mangrove
Animal Production
Marine Chemistry/Water Quality
Coral Reef
Forestry
Marine Physics/Physical Oceanography
Seagrass
Other Agriculture
Other Ocean/Marine Aspects
Estuary
SOLID EARTH
HUMAN DIMENSIONS
Lagoon
Geochemistry
Attitude/Behavior
Intertidal
Geophysics
Boundaries
Pelagic
Rocks/Minerals
Economics
Other Marine Habitats
Volcanoes
Health
Ecological Dynamics
Other Solid Earth
Infrastructure
Microbiota
Environmental Impacts
Vegetation
Other Human Dimension
Zoology
Other Biosphere
Vegetation
5. Location(s):
Name(s):
Country(s)
China
Cambodia
Indonesia
Malaysia
Philippines
Thailand
Viet Nam
6. Spatial Coverage:
Horizontal Boundaries:
Southernmost Latitude:
Northernmost
Latitude:
Westernmost
Longitude:
Easternmost
Longitude:
Horizontal Resolution:
Minimum:
Maximum:
Vertical Boundaries:
Minimum Altitude:
Maximum
Altitude:
Minimum
Depth:
Maximum
Depth:
Vertical Resolution:
Minimum:
Maximum:
7. Temporal Coverage: Start
Date:
Stop Date:
Temporal Resolution:
Minimum:
Maximum:
8. Additional Keywords:
9. Data Quality:
Procedures:
Position Accuracy:
Data Accuracy:
Completeness:
Recognition:
Knows errors:
10. Data Set Progress:
Planed
On Going
Complete
11. Summary:
12. Data Center:
Long Name:
Short Name:
Contact Person:
Given Name:
Middle Name:
Family Name:
E-mail:
Phone:
Fax:
Mailing Address:
URL:
12. Access Constraints:
13. Use Constraints:
14. Distribution:
Distribution Media:
Online Internet (HTTP)
Online FTP
E-mail
Other Online Modes
CD-ROM
Diskette
Other Digitally Encoded Media
Hardcopy Media
Photographic Media
Distribution Size:
Distribution Format:
ASCII
BIL
EXCEL
CDF
DBF
DEM
DIF
DOC
DXF
EPS
ERDAS
GIF
GRASS
HDF
HTML
IGES
JPEG
MS Word
MPEG
Native Format
netCDF
PLT
PS
SHP
TIFF
WK1
WKS
Other
Fee:
15. Metadata Creation Date:
16. Last Revision Date:
17. Metadata Revised by:
Given Name:
Middle Name:
Family Name:
E-mail:
Phone:
Fax:
Mailing Address:
UNEP/GEF Project "Reversing Environmental Degradation Trends in the South China
Sea and Gulf of Thailand" (UNEP/GEF SCS Project)
Metadata Entry Form
(Save this form under a new filename for each metadata)
1. Entry Identifier:
SEA START RC 006.doc
2. Data Set Name:
High Resolution CTD from the South China Sea, 1996-1999
3. Data Set Producer(s):
Southeast Asian Fisheries Development Center
4. Parameter(s):
LAND SURFACE
ATMOSPHERE
HUMAN DIMENSIONS
Topography
Atmospheric Chemistry/Air Quality
Attitude/Preferences/Behavior
Soil
Atmospheric Physics/Meteorology/Climate
Boundaries
Land Use/Land Cover
Other Atmospheric Aspects
Economics
Other Land Surface
HYDROSPHERE (FRESHWATER)
Health
AGRICULTURE
Ground Water
Infrastructure
Aquaculture
Surface Water
Environmental Impacts
Fisheries
Water Quality
Other Human Dimension
Agriculture/Cropping
Other Hydrosphere
BIOSPHERE
Animal Production
OCEAN
Terrestrial Habitats
Forestry
Bathymetry
Aquatic Habitats
Other Agriculture
Coastal Processes
Wetlands
SOLID EARTH
Marine Geophysics
Ecological Dynamics
Geochemistry
Marine Sediments
Microbiota
Geophysics
Marine Chemistry/Water Quality
Vegetation
Rocks/Minerals
Marine Physics/Physical Oceanography
Zoology
Volcanoes
Other Ocean/Marine Aspects
Other Biosphere
Other Solid Earth
5. Location(s):
Name(s):
Country(s)
China
Cambodia
Indonesia
Malaysia
Philippines
Thailand
Viet Nam
6. Spatial Coverage:
Horizontal Boundaries:
Southernmost Latitude:
1N
Northernmost
Latitude:
24E
Westernmost
Longitude:
99E
Easternmost
Longitude:
127E
Horizontal Resolution:
Minimum:
0.25 degree
Maximum:
0.5 degree
Vertical Boundaries:
Minimum Altitude:
Maximum
Altitude:
Minimum
Depth:
0 m
Maximum
Depth:
2000 m
Vertical Resolution:
Minimum:
1 dbar
Maximum:
1 dbar
7. Temporal Coverage: Start
Date:
1996-09-25
Stop Date:
1999-06-10
Temporal Resolution:
Minimum:
3 hour
Maximum:
155 day
8. Additional Keywords:
salinity, temperature, oxygen, fluorescense, profile
9. Data Quality:
Procedures:
Only uninterrupted downcast data were used. Original data were collected at 25 Hz.
Data were pressure averaged at every 1bar. Outlier points were removed manually.
Position Accuracy:
+/- 0.005 degree
Data Accuracy:
Temperature +/-0.001 C, salinity +/-0.001 psu, oxygen +/-0.01 ml/l, fluorescense +/-
0.01 V
Completeness:
Cover only EEZ of Thailand, Malaysia, Philippines and Vietnam. Only 1-2 cruises per
year.
Recognition:
Several scientific papers were published based on this dataset.
Knows errors: None
10. Data Set Progress:
Planed
On Going
Complete
11. Summary:
CTD data were collected as a part of the SEAFDEC Collaborative Research on Marine Fishery Resources Survey
in the South China Sea.
12. Data Center:
Long Name:
Southeast Asian Fisheries Development Center
Short Name: SEAFDEC
Contact Person:
Given Name: Penjan
Middle Name:
Family Name: Rojana-anawat
E-mail: penjan@seafdec.org
Phone: 66
24256100
Fax: 66
24259919
Mailing Address:
P.O. Box 97, Phrasamutchedi, Samut Prakan 10290, Thailand
URL: www.seafdec.org
12. Access Constraints:
13. Use Constraints:
14. Distribution:
Distribution Media:
Online Internet (HTTP)
Online FTP
E-mail
Other Online Modes
CD-ROM
Diskette
Other Digitally Encoded Media
Hardcopy Media
Photographic Media
Distribution Size:
1 MB
Distribution Format:
ASCII
BIL
EXCEL
CDF
DBF
DEM
DIF
DOC
DXF
EPS
ERDAS
GIF
GRASS
HDF
HTML
IGES
JPEG
MS Word
MPEG
Native Format
netCDF
PLT
PS
SHP
TIFF
WK1
WKS
Other
Fee:
15. Metadata Creation Date: 1999-1201
16. Last Revision Date: 2002-01-16
17. Metadata Revised by:
Given Name: Anond
Middle Name:
Family Name: Snidvongs
E-mail: anond@start.or.th
Phone: 66
22189464
Fax: 66
22519416
Mailing Address:
Southeast Asia START Regional Center
SWU Building No. 5
Chulalongkorn University
Henri Dunant Road
BAngkok 10330, Thailand.
UNEP/GEF/SCS/EW.1/3
Annex 10
Page 1
ANNEX 10
Agreed Workplan for the GIS Related Activities in the UNEP/GEF South China Sea Project
Year
2002
2003
Month 1 2 3 4 5 6 7 8 9 10 11 12 1 2 3 4 5 6 7 8 9 10 11 12
Step 1
1Specialised Executing Agencies
2nd meetings of the RWGs 2
x x
3Southeast Asian START4 Regional
Centre
2nd meetings of: Regional Scientific &
x
Technical Committee & Project
Steering Committee
Step 2
Specialised Executing Agencies
Southeast Asian START Regional
Centre
3rd meetings of the RWGs
x x
Step 3
Specialised Executing Agencies
Southeast Asian START Regional
Centre
4th meetings of the RWGs
x x
3rd meetings of: Regional Scientific &
x
Technical Committee & Project
Steering Committee
The First Phase of the project will be sub-divided into 3 steps to be carried out by the Specialised
Executing Agencies in each country in close collaboration with the Southeast Asian START Regional
Centre:
Step 1
(SEA): Each SEA in each country locates and identifies the distribution of each habitat, pollution impact
sites, and locations that are significantly related to transboundary fish stock onto the national level
Geographic Information System. This should be done before the Second RWG for each component.
SEA START RC to commence compilation of national information from SEA's into a regional GIS.
Step 2
SEAs to associate the national locations identified in Step 1 with general data/information to be agreed
in the second RWG meetings of each component.
SEA START RC to compile national information from SEA's into a regional GIS.
1 SEA: Actions to be undertaken by the Specialised Executing Agencies in country
2 RWGs: Regional Working Group meetings
3 Actions to be completed by SEA START RC
4 START: SysTem for Analysis Research and Training
UNEP/GEF/SCS/EW.1/3
Annex 10
Page 2
Steps one and two need to be substantially completed by the end of 2002 in time for presentation to the
regional Scientific & Technical Committee (RSTC) and Project Steering Committee (PSC) meetings in
December 2002. The second RSTC meeting will discuss the criteria to be used in prioritising sites at a
regional scale and amongst the different components and sub-components of the project.
The second meetings of the six regional working groups (RWGs), which will take place during
September and October 2002, will discuss site selection criteria among sites, which have been
prioritised at the national level.
The third meetings of the six regional working groups (RWGs), which will take place from Late February
to early April 2003 and will finalise the criteria and undertake and initial prioritisation based on available
site data and information in order to test the validity and workability of the criteria.
Step 3
Specialised Executing Agencies will compile detailed data/information required on the basis of the
criteria established during the second Regional Working Group meetings for specific sites within each
country considered as national priorities for nomination as candidate regional demonstration sites.
SEA START RC to compile national information from SEA's into a regional GIS.
The fourth meetings of the six regional working groups (RWGs), which will take place during late August
through to October 2003. These regional working group meetings will recommend to the third RSTC
meeting the potential demonstration sites within each component based on the criteria agreed during
RWG-3.
The third meeting of the Regional Scientific & Technical Committee will consider the recommendations
of the fourth meetings of the Regional Working Groups and evaluate synergies complementarities and
duplications across all components and sub-components of the project. This meeting will select and
prioritise potential demonstration sites within each component based on the criteria agreed and make
recommendation to the third meeting of the Project Steering Committee.
The third meeting of the Project Steering Committee to be convened in December 2003 will make the
final decisions regarding the choice of demonstration site selection.