


United Nations
UNEP/GEF South China Sea
Global Environment
Environment Programme
Project
Facility
Reversing Environmental Degradation Trends
in the
South China Sea and Gulf of Thailand
REPORT
Third Meeting of the Regional Working Group for
the Seagrass Sub-component
Kota Kinabalu, Malaysia, 25th Ł 28th March 2003
__________________________________________________________________________________
UNEP/GEF
Bangkok, March 2003
UNEP/GEF/SCS/RWG-SG.3/3
Table of Contents
1. OPENING OF THE MEETING................................................................................................ 1
1.1 WELCOME ADDRESS ....................................................................................................... 1
1.2 INTRODUCTION OF MEMBERS ............................................................................................ 1
2. ORGANISATION OF THE MEETING ..................................................................................... 1
2.1 ELECTION OF OFFICERS .................................................................................................. 1
2.2 DOCUMENTS AVAILABLE TO THE MEETING ........................................................................... 2
2.3 ORGANISATION OF WORK ................................................................................................. 2
3. ADOPTION OF THE MEETING AGENDA .............................................................................. 2
4. OPENING REMARKS FROM THE FOCAL POINTS FOR SEAGRASS FROM EACH
PARTICIPATING COUNTRY ................................................................................................. 2
5. REPORTS FROM THE PROJECT CO-ORDINATING UNIT (PCU) REGARDING OVERALL
PROGRESS TO DATE.......................................................................................................... 3
5.1 STATUS OF END-YEAR PROGRESS REPORTS, EXPENDITURE REPORTS, AND BUDGETS ................ 3
5.2 STATUS OF PLANNED SUBSTANTIVE OUTPUTS FROM THE NATIONAL LEVEL ACTIVITIES ................. 4
6. REVIEW AND EVALUATION OF NATIONAL OUTPUTS ACCORDING TO THE AGREED
WORKPLAN......................................................................................................................... 5
6.1 PAST AND ON-GOING ACTIVITIES INCLUDING ECONOMIC VALUATION......................................... 5
6.2 REVIEW OF NATIONAL DA TA AND INFORMATION, CREATION OF NATIONAL META-DATABASE
AND NATIONAL INPUTS TO THE REGIONAL GIS DATABASE...................................................... 5
6.3 REVIEW OF NATIONAL LEGISLATION, INSTITUTIONAL AND ADMINISTRATIVE ARRANGEMENTS......... 5
7. CHARACTERISATION OF NATIONAL SEAGRASS SITES AND THEIR REGIONAL
PRIORITISATION ................................................................................................................. 7
8. PREPARATION OF SITE SPECIFIC PROPOSALS FOR DEMONSTRATION SITES
INCLUDING THE REVIEW OF THREATS AT SITE LEVEL AND IDENTIFICATION OF
THE PROXIMATE AND ULTIMATE CAUSES OF DEGRADATION....................................... 12
9. REVISION OF THE WORKPLAN AND ACTIVITIES FOR THE REGIONAL WORKING
GROUP ON SEAGRASS..................................................................................................... 13
10. DATE AND PLACE OF THE FOURTH MEETING OF THE REGIONAL WORKING
GROUP ON SEAGRASS..................................................................................................... 13
11. ANY OTHER BUSINESS..................................................................................................... 14
12. ADOPTION OF THE REPORT OF THE MEETING................................................................ 14
13. CLOSURE OF THE MEETING ............................................................................................. 14
ii
UNEP/GEF/SCS/RWG-SG.3/3
List of Annexes
ANNEX 1
List of Participants
ANNEX 2
List of Documents
ANNEX 3
Agenda
ANNEX 4
Tabulation of Raw Data Relating to Identified Seagrass Sites Bordering the
South China Sea
ANNEX 5
Preliminary List of Threatened and Near Threatened Species for the South
China Sea
ANNEX 6
Dendrograms Resulting from the Preliminary Cluster Analyses Conducted
During the Third Meeting of the Regional Working Group on Seagrass
ANNEX 7
Ranking Indicators and Weights for Determination of Priority within Clusters of
Potential Demonstration Sites, and Results of Preliminary Ranking of Seagrass
Sites Bordering the South China Sea
ANNEX 8
Schedule of Meetings, Workplan and Timetable for the Seagrass Focal Points,
2003
iii
UNEP/GEF/SCS/RWG-SG.3/3
Page 1
Report of the Meeting
1.
OPENING OF THE MEETING
1.1
Welcome address
1.1.1 The Project Director opened the meeting on behalf of Dr. Klaus T÷pfer, the Executive Director
of the United Nations Environment Programme (UNEP) and Dr. Ahmed Djoghlaf, the Director,
Division of Global Environment Facility Co-ordination (UNEP/DGEF). He welcomed the participants to
the meeting, and highlighted some of the achievements of the past year, in particular the significant
co-financing for the project received from the Government of China.
1.1.2 He noted that the Project Steering Committee had, during its second meeting in December
2002, made a number of significant decisions including: the decision to adopt a portfolio of 24
demonstration sites by the end of the year; the decision to include the Focal Ministry and Specialised
Executing Agency Logos on the Project website; and their agreement to adopt the approach and
guidelines for selection of demonstration sites proposed by the Regional Scientific and Technical
Committee.
1.1.3 He noted that other key decisions for the longer term included the agreement to develop a
strategy for long-term sustainable financing; the approval of the processes for engaging a wider range
of institutions and stakeholders in project activities and the agreement to establish two regional task
forces one composed of legal experts and one composed of environmental economists to advise the
regional working groups and provide a regional overview of these matters.
1.1.4 Dr. Pernetta advised the group of the importance of the work before the present meeting
which sets the foundation for successful completion of the planned adoption of a regional portfolio of
demonstration sites by the Project Steering Committee in December. He noted that following
agreement by the Project Steering Committee of the process, it was the responsibility of the Regional
Working Group on Seagrass to finalise the detail of the selection procedures during the course of this
week and thus provide guidance to the Focal Points on priorities for the development of
demonstration site proposals.
1.2
Introduction of members
1.2.1 Dr. Pernetta welcomed Mr. Suy Serywath alternate for Mr. Kim Sour from Cambodia to his first
meeting and invited members to introduce themselves to the meeting. The list of participants is
attached as Annex 1 to this report.
2.
ORGANISATION OF THE MEETING
2.1
Election of Officers
2.1.1 Dr. Pernetta reminded the meeting of The Rules of Procedure, adopted during the first regional
working group meeting, which state that, the Regional Working Group on Seagrass shall elect, from
amongst the members, a Chairperson, Vice-Chairperson and Rapporteur to serve for one year. He
noted further that the rules also state that, officers shall be eligible for re-election no more than once.
Professor Xiaoping Huang, and Dr. Suvaluck Satumanatpan who have served as Chairperson and Vice-
Chairperson during 2002 were therefore eligible for re-election. Dr. Kirkman, the previously elected
Rapporteur has recently retired, and is no longer a member of the Group.
2.1.2 Mr. Kamarruddin bin Ibrahim, Focal Point from Malaysia, suggested and members agreed
that new officers should be elected on an annual basis and proposed Dr. Miguel Fortes as the
Chairperson and Mr. Tri Edi Kuriandewa from Indonesia as the Vice-Chairperson. Mr. Xiaoping Huang
proposed Dr. Chittima Aryuthaka as Rapporteur and these members were elected to their respective
offices by acclamation.
UNEP/GEF/SCS/RWG-SG.3/3
Page 2
2.2
Documents available to the meeting
2.2.1 Dr. Fortes expressed his appreciation at being elected Chairperson, and invited the Secretariat
to introduce the documentation available to the meeting. Dr. Pernetta introduced the documents,
available in both hard copy and on CD-ROM. He noted that the published reports of the second round of
regional meetings were available in hard copy and that all the documentation for the meeting had been
made available by e-mail and had been posted on the website in advance of the meeting. Additional
documents tabled by Focal Points at the meeting were noted and added to the list of documents
(UNEP/GEF/SCS/RWG-SG.3/INF.2). The revised list of documents is attached as Annex 2 to this
report.
2.3
Organisation of work
2.3.1 Dr. Pernetta briefed participants on the administrative arrangements for the conduct of the
meeting, and the proposed organisation of work (UNEP/GEF/SCS/RWG-SG.3/INF.3). Formal
sessions of the meeting would be conducted in English and in plenary although it is envisaged that,
sessional working groups will be formed to complete the various reviews and analyses required under
agenda item 7. A joint session will also be held together with the Regional Working Group on coral
reefs (RWG-CR) to consider jointly, matters relating to the selection of demonstration sites.
2.3.2 Mr. Kamarrudin advised the meeting that there would be a field trip to a nearby seagrass site
on the 28th March, which Dr. Ridzwan Abdul Rahman had kindly arranged. Dr. Ridzwan had also
extended an invitation to participants to a dinner with the Coral Reef Working Group on the evening of
the 26th March, on behalf of the Borneo Marine Research Institute, whilst UNEP would host a joint
dinner for the two Working Groups on 27th March.
3.
ADOPTION OF THE MEETING AGENDA
3.1
The Chairperson invited members to consider the provisional agenda prepared by the
Secretariat as document UNEP/GEF/SCS/RWG-SG.3/1, propose any amendments or additional
items for consideration, and adopt the agenda. There being no proposals for addition or amendment
the agenda was adopted as proposed and is attached in Annex 3 to this report.
4.
OPENING REMARKS FROM THE FOCAL POINTS FOR SEAGRASS FROM EACH
PARTICIPATING COUNTRY
4.1
The Chairperson invited the focal points from the SEAs to provide a short overview of their
progress subsequent to the second meeting of the RWG-SG and to highlight any additional
documentation tabled at the meeting.
4.2
Dr. Suvaluck Satumanatpan advised the meeting that much of the work in Thailand
subsequent to the last meeting had involved meetings and discussions with stakeholders at potential
demonstration sites and with the necessary site characterisations, which were available to the
meeting.
4.3
Dr. Nguyen Van Tien advised the meeting that the Vietnamese national committee had
completed the questionnaire on metadata, and completed 35 site characterisations in GIS format. They
had also worked extensively on the criteria for selecting demonstration sites.
4.4
Dr. Hutomo Malikusworo explained that he had assisted the Indonesian Seagrass group to
select demonstration sites, and to put the data into the GIS format. The Indonesian Seagrass group
had also refined the policy strategy and management plan, the legal and institutional arrangements
for seagrass, and were in the process of planning national workshops on policy and legal
arrangements. Mr. Kuriandewa added that for this meeting they had chosen 7 demonstration sites,
based on transboundary significance, accessibility, and management potential, and prioritised three of
these sites. They had used mainly information from the COREMAP project, and have not validated
data as yet through site visits.
UNEP/GEF/SCS/RWG-SG.3/3
Page 3
4.5
Mr. Suy Serywath advised the meeting that in Cambodia, information on seagrass is scarce.
The national seagrass and coral reef committee had conducted meetings with local staff and
institutions and NGOs, and had selected 4 sites for further intensive work although a total of thirteen
sites had been characterised.
4.6
Mr. Xiaoping Huang advised that China has characterised 4 sites and prepared site based
GIS databases whilst 2 sites have so far been fully characterised with text reports available to the
meeting.
4.7
Mr. Kamarruddin stated that project implementation in Malaysia presents formidable problems
due to the delayed start but noted that Dr. Pernetta had visited Malaysia and that the focal points had
all received an initial tranche of funds. He noted however that additional administrative procedures
need to be completed in order for the Focal Points to access the money, and requested the Project
Director to draft a letter to the Treasury to satisfy these internal requirements. In response Dr.
Pernetta advised that if he received details today of what was required he would draft an official letter
to assist in overcoming these difficulties.
4.8
Dr. Fortes informed the meeting that the Philippines have completed the review of national
data and information, they have made some national inputs to the GIS database and the meta-
database, while the review of national legislation including institutional arrangement, had been
finalised and a causal chain and threat analysis had been conducted for 4 sites. The Committee had
finalised a Philippine National Seagrass Management plan, and he noted that he would share more
details of these developments later in the meeting.
5.
REPORTS FROM THE PROJECT CO-ORDINATING UNIT (PCU) REGARDING OVERALL
PROGRESS TO DATE
5.1
Status of end-year progress reports, expenditure reports, and budgets
5.1.1 The Chairperson invited Mr. Kelvin Passfield to introduce document UNEP/GEF/SCS/RWG-
SG.3/4 containing a summary of the current status of budgets and reports from the Specialised
Executing Agencies in the participating countries. Mr. Kelvin Passfield highlighted the difficulties of the
PCU and problems consequent upon the failure of the Focal Points to meet agreed timelines and
submission dates and noted that the Project Steering Committee had agreed that the SEAs would
present these reports in future, within 10 working days of the due date (30th June and 31st December).
5.1.2 In reply to a question from Dr. Fortes on the apparent lack of substantive reports from the
Philippines, Mr. Passfield explained that the report was based on electronic and hard copy files
currently available in the PCU and noted that with the turnover of staff in the PCU some electronic
files had been misplaced. Drafts of reports submitted by the Philippines to the last RWG meeting had
been apparently overlooked, for which he apologised.
5.1.3 Some discussion followed regarding progress on the legislation and economic valuation
reviews. Dr. Pernetta briefed members on the decision of the Project Steering Committee to establish
two regional task forces, one for legal matters and one covering issues relating to economic
evaluation of coastal resources. He outlined the proposed mode of operation of these task forces and
the relationship between their work and the work of the regional working groups. The first meetings of
these task forces were to be convened in June or July this year, and would review the outputs from
each country, and provide suggestions if and as required to each country.
5.1.4 Dr. Pernetta noted that, to date there had been nominations from only three countries for
members of these task forces. The Chairperson suggested that, nominations should be sent to the
PCU as soon as possible, including name, institution, email address, and expertise roster form.
5.1.5 Dr. Suvaluck stated that one problem with legal and economic experts that she had dealt with
was that they have little expertise in matters relating to the coastal zone. Dr. Fortes noted in this
connection that it was important to work alongside these experts and give them appropriate advice
UNEP/GEF/SCS/RWG-SG.3/3
Page 4
and background regarding the project and the substantive issues being addressed through the
various activities.
5.2
Status of planned substantive outputs from the national level activities
5.2.1 In introducing the agenda item Mr. Passfield noted that Annex 12 of the second meeting report
(UNEP/GEF/SCS/RWG-SG.2/3) indicated that the following outputs were to be prepared by the Focal
Points in advance of the third meeting:
Ę
Review of past and on-going projects
November 2002
Ę
Complete questionnaires on site characterisation
January 2003
Ę
Complete questionnaire on metadata
January 2003
Ę
Review economic valuation criteria
January 2003
Ę
Review threats at site level
January 2003
Ę
Review national legislation
November 2002
Ę
Causal chain analysis list (for threats)
January 2003
5.2.2 He noted that documentation received by the Secretariat from the Focal Points up to the end of
February was listed in appendix 1 of the list of documents (UNEP/GEF/SCS/RWG-SG.3/INF.2) and
that electronic copies of all reports and documents received from the countries were provided on CD-
ROM, together with hard copies of the site characterisations for reference of each member during
discussion under agenda item 7. He noted further that arrangements were being made to provide all
members with electronic copies of the presentations made and documents tabled at the meeting.
5.2.3 Mr. Passfield noted that the indicative measure of output quantity (cost per page) was just
that, indicative, and that, it was intended for internal use as a comparative measure of the productivity
of the various Specialised Executing Agency. He noted that these numbers were now outdated and
that a review of the quality of the outputs was also required to satisfy the requirements of the funding
agency.
5.2.4 The Project Director then briefed members on the decisions of the Project Steering
Committee regarding the implementation of the independent peer review of country reports approved
by the second meeting of the Project Steering Committee. It is proposed that the Project Co-ordinating
Unit manage an independent review of project outputs to ensure their quality and acceptability
internationally and that knowledgeable experts from the region be commissioned to review the reports
and to provide concrete criticism and advice. In the interests of objectivity these reviews will be
conducted anonymously and the names of the reviewers will not be disclosed by the PCU when the
substance of the review is passed back to the focal point concerned.
5.2.5 Dr. Fortes noted the proposal that, by the end of March, all products (with the exception of the
review of national legislation and administrative arrangements) received by the PCU, will be
dispatched for such review and proposed that the meeting consider the proposed schedule when
finalising the programme of work and timetable. The proposed schedules is as follows:
Ę PCU formats the reports and sends them for review by March 30th.
Ę No less than two, independent, peer reviewers will review each output.
Ę The reviewers will complete the substantive reviews no later than April 30th and send to the
PCU.
Ę The PCU will evaluate the review and dispatch the review together with advice to the
appropriate Focal Point.
Ę The Focal Points will be expected to revise the documents in the light of the reviewer's
comments within thirty working days of dispatch of the comments.
Ę Following revision and return to the PCU, the reports will be converted to pdf format and
lodged on the project website at <www.unepscs.org>
UNEP/GEF/SCS/RWG-SG.3/3
Page 5
5.2.6 Finally it was noted that in the case of the reviews of national legislation and institutional
arrangements these will be dispatched to the task forces for review, but it was agreed that members
would seek advice from legal experts regarding the reviews of legislation prior to their submission to
the regional task force.
6.
REVIEW AND EVALUATION OF NATIONAL OUTPUTS ACCORDING TO THE AGREED
WORKPLAN
6.1
Past and on-going activities including economic valuation
6.2
Review of national data and information, creation of national meta-database and
national inputs to the regional GIS database
6.3
Review of national legislation, institutional and administrative arrangements
6.3.1 The Chairperson proposed and the meeting agreed to cover the three sub-items concurrently.
Dr. Fortes then invited the focal points from the SEAs to provide a short overview of their reports.
6.3.2 On behalf of China, Professor Huang made a presentation covering the review of past and
on-going activities, followed by the overview of economic valuation. He indicated a provisional figure
of around $17,000 per ha. as the estimated value of seagrass in China. He presented an overview of
the status of the review of national legislation, and noted that he would welcome input from the
regional task force on legislation in finalising this report.
6.3.3 He noted that China had submitted 7 metadata-base forms, completed four GIS site
characterisations, and completed 4 GIS maps of these seagrass sites. He presented the GIS maps of
Hepu seagrass beds, Xincun Gulf, Li An Gulf in Hainan, and Liusha Gulf in Guangdong.
6.3.4 The Chairperson congratulated Professor Huang on behalf of the participants for his excellent
presentation, which included maps and photographs that represented the most comprehensive set of
information known from China concerning the status of seagrass habitats.
6.3.5 Mr. Serywath presented a progress report on behalf of the Cambodian Committee. He noted
that since 1998 some research has been conducted under the Ministry of Environment. The report on
the review of national data and information for seagrass in Cambodia contains some information
regarding two seagrass areas at Koh Kong, one of 17,000 ha, and one of 21,000 ha. In Kampot there
is one area of 24,000 ha, and in Kep another site though they have not yet determined the size.
6.3.6 He noted that the review of past and ongoing projects had revealed that most projects related
to socio-economic and environmental aspects, and that economic valuation was difficult, but that the
committee was addressing this under 4 sub-headings, i.e. transboundary, aquatics, tourism, and
transportation.
6.3.7 Mr. Serywath noted that threats at the site level included; trawling, aquaculture particularly
seaweed farming, and cutting mangroves resulting in increased sedimentation in seagrass beds. He
outlined the findings of the review of legislation, which included information on the Constitution, draft
fisheries law, forestry law, tourism law, environmental law, transportation law, land law, and other less
relevant laws. Mr. Serywath ended with a resume of threats to be examined in the causal chain
analysis.
6.3.8 The Chairperson congratulated Mr. Serywath on his report, considering the scarcity of
information available. Dr. Hutomo suggested that Mr. Serywath use the direct and indirect use
approach to economic valuation, and also offered some suggestions on the causal chain analysis. Dr.
Pernetta noted that the areas given for the seagrass beds were very large, and suggested that there
may be an error in estimation. Mr. Passfield also commented that for some countries GIS site
characterisations, the latitude and longitude co-ordinates implied huge areas.
6.3.9 Mr. Kuriandewa made a presentation of Indonesian data for seagrass relevant to the South
China Sea, though the table format of past and ongoing activities covered the whole of Indonesia. He
commented that there are a number of potential demonstration sites that do not occur in the South
UNEP/GEF/SCS/RWG-SG.3/3
Page 6
China Sea area. He presented maps of the locations of the seven sites characterised to date, and
informed the meeting that the committee has prioritised 3 of these sites for possible demonstration
sites. He completed his presentation with the table of legislation relevant to seagrass in Indonesia.
6.3.10 Mr. Kamarruddin informed the meeting of a plan for a jointly managed area by the Philippines,
Indonesia, and Malaysia, the Sulo-Suluwesi Marine Ecoregion (SSME) and asked if there were
significant Indonesian seagrass beds in the area. Dr. Hutomo Malikusworo advised that there was a
significant seagrass bed in Derawan, East Kalimantan, but this was just outside the South China Sea
area.
6.3.11 Dr. Suvaluck presented the Thai review of past and on going projects and noted that the
report was complete but that some of the report is still in Thai. The national committee has been
working on the economic criteria, and after a meeting with a number of institutions in February, a
number of researchers had expressed interest in working on seagrass valuation. Dr. Suvaluck was
very pleased with the interest shown in valuing the seagrass and other coastal habitats based on the
value of the fisheries and total economic value of sites. She noted that they had arrived at a tentative
value of seagrass beds of 1.4 million baht per Rai (1,600 m2).
6.3.12 Dr. Suvaluck then presented site characterisations data for six proposed sites, and the criteria
developed for national ranking. These presentations included a review of the threats at each site. She
noted that the GIS questionnaires have been 90% completed, and maps have been produced as
shape files (Arcview). The national meta-database currently has 6 entries, and work is continuing. The
review of National Legislation suggests that there is no legislation directly related to seagrass, but that
a number of national policies are relevant to the conservation and sustainable use of seagrass
habitats.
6.3.13 The Chairperson thanked Dr. Suvaluck for her comprehensive presentation and Dr. Pernetta
added his appreciation for the clarity of the presentation, which clearly indicated that Dr. Suvaluck and
her committee had invested substantial time and effort since the last meeting. There followed some
discussion of the data that had been presented, how reliable and complete it was, and its relationship
to the projects goal of reversing degradation suffered by seagrass. It was acknowledged that while the
data available may not be comprehensive at this stage, there was a need to use available data and to
begin to address the issues and problems which were well recognised by everyone.
6.3.14 Dr. Nguyen Van Tien presented the report from Viet Nam on past and ongoing projects,
referring to the table from his report and followed with a presentation of the legislation and policies,
stating that there is almost no policy or legislation specifically referring to seagrass. Some fisheries
legislation and environmental protection legislation is relevant, though ineffective.
6.3.15 Dr. Tien then presented the site characterisations from Viet Nam, starting with Phu Quoc
Island. He said that at least 10 families are known to have recently caught dugong in this area, and
this is a significant problem. He suggested that Phu Quoc would be a good demonstration site
because of the biodiversity, and as it was an important site for threatened species. Site
characterisations were then presented for the Con Dao area, which had been chosen as one of the
two coastal areas of Viet Nam in the Global Representative System of Marine Protected Areas review
of the World Bank. The third site presented was Phu Quy island.
6.3.16 Mr. Kamarruddin briefly outlined the approach to be used by Malaysia in order to try and
catch up with other countries as soon as possible. He presented a map showing the general
distribution of seagrass beds in Malaysia, and a table showing the distribution and size of seagrass
beds in Peninsular Malaysia. There were some other seagrass beds around other parts of the
country, but at this stage he could not provide exact locations and areas covered.
6.3.17 He informed the meeting that contractors have been identified to produce the required outputs
for the project however, contracts have not yet been issued.
6.3.18 Dr. Fortes outlined progress in the Philippines since the last meeting and informed the
meeting that electronic copies of all reports were now with the PCU. He began with the review of past
UNEP/GEF/SCS/RWG-SG.3/3
Page 7
and ongoing activities, including the economic valuation, which was broken down into direct and
indirect use values. He also informed the meeting on the number of references available on
seagrasses in the Philippines.
6.3.19 He explained that the Philippines committee had started with an initial 10 sites, which will be
included in a GIS database. This list had been reduced to a priority list of 5, which may be further
reduced to 3 sites for more detailed characterisation. He showed maps of the locations of the 5 sites,
and outlined the threats to these sites, with sedimentation and unsustainable and destructive fishing
practices being the major threats.
6.3.20 Dr. Fortes then presented a separate causal chain analysis at site level for siltation,
unsustainable fishing practices, and non-transparency of the navy. For the review of legislation, he
noted that the Philippines has one legal instrument directed specifically to seagrass, and another 245
pieces of legislation that had varying degrees of relevance to seagrass.
7.
CHARACTERISATION OF NATIONAL SEAGRASS SITES AND THEIR REGIONAL
PRIORITISATION
7.1
The Chairman invited the Project Director to introduce this item and Dr. Pernetta made two
presentations, introducing to the meeting the principles and procedures agreed and approved by the
Regional Scientific and Technical Committee and the Project Steering Committee concerning the
nature of proposed demonstration sites, their description and ranking for determination of regional
priorities. For the first presentation he referred to document UNEP/GEF/SCS/RSTC.2/10/Amend.1.
7.2
Dr. Pernetta explained that the development of full proposals for demonstration sites will
involve considerable effort and it is unlikely that proposals can be properly developed for more that
three to five sites in each country. He said that it was necessary therefore, to complete an initial
ranking of sites during this meeting, in order to provide guidance to the national committees on those
sites for which concrete proposals should be prepared.
7.3
Dr. Pernetta advised the group of the decision of the Project Steering Committee at its last
meeting to increase the number of demonstration site proposals from 9 to 24, with the 15 additional
sites to be funded using funds raised from other sources, including Government co-financing. In this
regard, he informed the meeting of the adoption by the Project Steering Committee of an action plan
to develop a strategy for sustainable financing that would focus during this year on raising co-
financing for the demonstration sites.
7.4
Dr. Fortes asked whether the group should be encouraging the preparation of site proposals
to demonstrate the connectivity between habitats. Dr. Pernetta agreed that there was some merit in
this, and that when a demonstration site is proposed it may be appropriate to apply a score in the
ranking for sites that are associated with more than 1 habitat type.
7.5
In response to a question from Mr. Kuriandewa on the criteria for site selection, Dr. Pernetta
reminded the meeting that the GEF focus in funding this project was biodiversity, and therefore a
higher emphasis could be directed towards biodiversity in site selection. Mr. Kuriandewa then
expressed some concern that the Indonesian sites may fall behind in the scoring, as they have been
unable to collect all the data originally listed due to a lack of fieldwork funds. Dr. Pernetta said that in
fact there would probably be a much, reduced list of parameters as other countries also would not be
able to provide data for all parameters.
7.6
Dr. Pernetta then made the second presentation, introducing to the meeting the concept of
cluster analysis and regional ranking. This presentation was based on document
UNEP/GEF/SCS/RSTC.2/8, which was originally presented at the second meeting of the Regional
Scientific and Technical Committee meeting and drew heavily on the preliminary analysis that had
been completed by the Regional Working Group on Mangroves at their meeting two weeks before.
This information was drawn from annexes 4, 5, 6, and 7 of the meeting report, document
UNEP/GEF/SCS/RWG-M.3/3, which are included in the meeting documents.
UNEP/GEF/SCS/RWG-SG.3/3
Page 8
7.7
Dr. Pernetta presented the tabulation of raw data compiled at the third meeting of the
mangrove, working group held in Bali in early March. He explained the rationale for removing some
columns of data based on an absence of data, and also explained that columns for some of the
parameters that were not available but were considered important were to be filled for the final
analysis by April 7th.
7.8
Mr. Passfield then presented a table based on Annex 7 of the first meeting report, containing
parameters that were initially to be included in the site characterisations. Participants were requested
to take this table and overnight enter whatever data they have available from their sites. This would
be reviewed the following morning, and parameters for which no data were available, and which were
not considered crucial to site selection and ranking, would be removed during the initial discussion.
Special Joint Session of the Regional Working Groups on Coral Reefs and Seagrass
7.9
On the morning of 26th March a joint session between the Regional Working Groups on Coral
Reefs and Seagrass was convened. The Project Director opened the special joint session, and stated
that during the second round of regional working group meetings various members had expressed the
desire to have such a joint session for collaboration and discussion of issues of mutual interest. He
noted that the programme for the session was flexible and that the purpose was to share experiences
between the two groups and to perhaps discuss the overlap in coverage of site characterisations at the
national level and implications for the choice of demonstration sites. In particular, the group might wish
to discuss how to handle sites that contain multiple habitats, and how these should be developed with
regard to the agreed site selection process.
7.10
Following this, Dr. Pernetta invited, Dr. Miquel Fortes and Mr. Abdul Khalil, the Chairs of the
Regional Working Groups for Seagrass and Coral Reefs respectively to co-chair the session.
7.11
Dr. Fortes and Mr. Khalil assumed the joint chair and following a brief round of introductions Dr.
Fortes invited participants to identify issues for discussion and opened the floor for any suggestions or
proposals that members felt required joint discussion. He noted that, it would be useful for the group to
hear an overview of the experiences of the coral reefs working group with the application of the cluster
analysis and perhaps hear from the secretariat regarding the outcome of the joint mangrove wetlands
discussions. It was agreed that any additional issues would be dealt with, if and when, they arose.
During discussion it was noted that the RWG-CR had given primary importance to indicators of
biological diversity, rather than to connectivity of habitats although allowance was made in the ranking
scheme for including scores reflecting the diversity of habitats at a particular site.
7.12
Dr. Alino suggested that transboundary sites, as well as sites that covered more than one
habitat should be discussed and Dr. Fortes asked what criteria the coral reef group had identified as
indicators of regional priority. In the ensuing discussion, the SSME area, Philippines/Sabah area, and an
area around Batam adjoining Singapore, Malaysia, and Indonesia were mentioned as examples of
transboundary areas that may be considered for development of demonstration proposals. It was also
noted that seagrass and coral reefs often occupy adjacent areas, and that there would be advantages in
having sites covering both habitats. Dr. Huang mentioned that the 2 habitat types are very different in
terms of appropriate management regimes, and that it was too early to discuss the connectivity between
these two habitat types in the case of China.
7.13
The Batam area connecting Malaysia, Indonesia, and Singapore was noted as having important
stocks of globally threatened species including dugong, and turtles and that these animals were
dependent on the seagrass beds in the area.
7.14
Dr. Tuan asked why we needed to separate biodiversity, connectivity, management, and other
parameters. Dr. Hutomo noted that as this was a GEF project, biodiversity needed to be given
prominence amongst the criteria for site selection. A number of participants indicated that they were
looking at sites common to two or more habitats.
7.15
Dr. Pernetta noted that it was the role of the National Technical Focal Point and National
Technical Working Group to ensure coordination between national activities in each component and
UNEP/GEF/SCS/RWG-SG.3/3
Page 9
sub-component of the project, so that confusion and conflicts do not arise. Dr. Pernetta reminded the
participants as to how the choice of habitats had been decided, noting that the Transboundary
Diagnostic Analysis had concluded that mangroves were the most threatened habitat bordering the
South China Sea whilst the biological and socio-economic importance of seagrass habitats were not
well understood.
7.16
He noted that although the site characterisation process was focussed on individual habitats,
once a decision had been taken to develop a demonstration site proposal this should be based on a
functional management unit that would reflect administrative boundaries since it should involve directly
both the local communities and local government in developing the proposal and managing the site.
Consequently it would be necessary to develop an overall management framework that took account of
all habitats within the area to be managed.
7.17
Dr. Fortes enquired about the transboundary area between the Philippines and Sabah that had
been mentioned earlier. This prompted Dr. Ridzwan to present an overview of the North Borneo Islands
Marine Managed Area (NBIMMA) that had been recently gazetted as a marine park by the Sabah
Government. Dr. Pernetta sought clarification regarding the status of the boundary between the two
EEZ's and for clarification regarding management initiatives on the Philippines side of the boundary. It
was the consensus of participants that this particular boundary was accepted by both parties, and was
not a matter for dispute. The Philippines participants noted that although they had originally intended to
include this area amongst their sites it had not been included to date due to the political unrest in
Palawan.
7.18
Mr. Kamarrudin then showed some slides of satellite tracking studies of turtle migration from
Redang Island in West Malaysia to the area around the NBIMMA, 2000km in 36 days from Thailand to
the Sulu Sea. Professor Ridzwan concluded that potentially this would be a valuable site, which if
adopted in the framework of the project could focus initially on management activities in the Malaysian
areas that might serve as a platform for development of Philippines activities and then joint
management.
7.19
Dr. Tuan asked if anybody in the group had any experience in transboundary management of
sites. Mr. Khalil noted that the Turtle Islands Habitat Protection Area represented such a joint
programme designed to manage turtles and had demonstrated the transboundary importance of
national management of some resources and habitats.
7.20
Dr. Pernetta stated that he was not aware of any transboundary ecosystem that was managed
through a single management mechanism but that the normal mode was for each country to manage
the area under their own jurisdiction and then to include some bilateral mechanism for joint discussion
and agreement of individual actions and priorities.
7.21
Dr. Fortes, informed the meeting of several transboundary management examples of which he
was aware, including the Antarctic treaty; a bilateral agreement on joint management of disputed islands
between Russia and Japan; and the joint management programme between the Philippines and
Indonesia for yellowfin tuna stocks. Dr. Ridzwan informed the meeting of joint arrangements that
permitted the sale of a limited number of turtle eggs in Malaysia harvested on the Philippines side of this
area under a joint agreement that included arrangements for setting quotas.
7.22
Dr. Tuan mentioned an area only three kilometres from the Cambodian border that Viet Nam
was proposing, which would have obvious transboundary significance, whilst Mr. Sour mentioned the
Koh Kong sites, where Cambodia is considering a joint site including both habitats, which would have
transboundary significance with Thailand. They had also considered some sites close to Viet Nam that
might be selected and the following discussion suggested that a joint proposal could be developed
including both Viet Nam and Cambodia. In response to a query from Dr. Tuan, Dr. Pernetta advised that
a proposal for a transboundary demonstration site from two countries would be looked upon very
favourably.
7.23
Dr. Pernetta noted the urgent need for simple national maps indicating the site locations, in
order to determine if sites are in or outside of the SCS and the possibilities for aggregating proposals.
UNEP/GEF/SCS/RWG-SG.3/3
Page 10
7.24
Professor Huang indicated that there was a seagrass area in China close to Viet Nam that is
very important for turtles and dugongs.
7.25 Prof. Chou pointed out that consideration could be given to a site that did not transcend national
boundaries but play an important role in connectivity to the region or harbours biological diversity of
regional or global significance (possible example is the Natunas).
7.26
Dr. Fortes sought clarification as to how funds would be disbursed where a site encompassed
two habitats or was a transboundary site. Dr. Pernetta noted that there were no hard and fast rules or
any decisions regarding the magnitude of funds, which should be dispersed to individual sites. He noted
that expensive sites would be disadvantaged given the limited budget but that this should not result in
proponents cutting the budgets to unrealistically low levels. In the case of transboundary sites he
suggested that it would be simpler to disburse money to a single entity in each country rather than
attempting to establish joint funds.
7.27
In response to a question on how funds would be disbursed if a site were across 2 habitats
managed by different Government Departments, Dr. Pernetta said that UNEP would prefer to disburse
funds to a single entity, which would then be responsible for sub-contracting appropriate stakeholders
according to the activities envisaged and the contributions of each set of stakeholders.
7.28
A question was raised regarding the required co-financing ratio, and how to approach
government to ask for co financing. In response Dr. Pernetta stated that the minimum level of cash co-
financing would be one to one but that the overall co-financing ratio should be higher since there was
the additional in-kind contribution reflected in the proportion of the governments regular budgets that
were applied to the envisaged activities.
7.29
There being no further issues raised by the participants, Dr. Fortes and Mr. Khalil thanked the
participants for their useful contributions to the discussions and the session was concluded at 1145 on
26th March.
Resumption of the meeting of the Regional Working Group on Seagrass
7.30
Following completion of the data tabulations by participants overnight, these were combined
into a single table for all sites from all countries, which is attached as Table 1 in Annex 4. This was
projected on the LCD projector, for participants to discuss and resolve any difficulties regarding the
manner in which individual focal points had recorded the information and agree on those parameters
to be included in the cluster analysis.
7.31
It was agreed that for the cluster analysis, density expressed as shoots per square metre,
would be discarded since only one country had recorded such information. Although not complete,
percent cover would be retained and some estimates were inserted for Thailand based on the expert
opinion of the group.
7.32
Seahorses were considered a very important component of the seagrass fauna and a good
indicator of stress as they are subject to high demand. However the lack of information on the number
of species resulted in the decision to include this parameter as simple presence or absence in the
final analysis. It was noted however that for the present exercise, insufficient values were included in
the table to permit estimation of missing values and hence the parameter would not be included in the
initial analysis.
7.33
The number of echinoderm genera and species were removed since these represented
duplications of information contained in other data columns. The parameter, "Urchin genera", was
removed since this represented a duplication of the species column, and "holothurian genera", was
changed to species. Echinoderm density was also deleted.
7.34
In view of the scarcity of information and the enormous variation in estimates it was agreed to
delete the column containing gastropod density, but retain the number of species.
UNEP/GEF/SCS/RWG-SG.3/3
Page 11
7.35
In order to avoid duplication of information in the columns relating to rare, endangered, and
migratory species it was agreed that migratory species would include turtles, and that endangered
species would include dugong. Depth range was changed from the absolute measurements to a
difference between lowest and highest depth, although it was recognised that the determination of this
value had been made in different ways by different observers.
7.36
A number of other parameters were considered worth including, but due to insufficient data, it
was agreed that these could not be included at this stage. The final agreed set of parameters for
inclusion in the cluster analysis is included in Table 2 of Annex 4. Whilst Table 3 of the same annex
presents the final data set used in the cluster analysis.
7.37
During the review of the raw data and the selection of parameters to be included in the cluster
analysis, it became apparent that much of the data were not directly comparable, due to different
methods and sources of information being used. For example, the number of endangered species
was particularly high in Viet Nam, and it was discovered that the Viet Nam Red Data Book of locally
endangered species had been used rather than the IUCN global listing. It was agreed that the global
listing was the source that should be used in determining whether a species was or was not rare or
endangered and the preliminary listing prepared by the PCU for the fisheries component of
threatened and near threatened species in the South China Sea (Annex 5 of document
UNEP/GEF/SCS/RWG-F.2/3) was tabled for reference of the members. This is appended as Annex 5
to this report.
7.38
Best estimates were then made to complete the table for the cluster analysis and estimated
values are shaded in Table 3 of Annex 4. It was noted that these data and missing data for the
parameters not included at this stage should be provided to the PCU within the next three weeks or
so if the preparation of demonstration site proposals was to proceed on schedule. The members
agreed to finalise the submission dates when considering the work plan under agenda item 8.
7.39
Following an initial review of the raw data table contained in Table 3 of Annex 4 the data were
entered into the SPSS statistical package and a cluster analysis run of the untransformed data. The
resulting dendrogram is presented in Figure 1 of Annex 6. It can be seen that the result is dominated
by the values for area, which range from sites of less than 10 hectares to sites apparently as large as
2,500 hectares.
7.40
Following this a series of transformations were undertaken, firstly logarithmic transformation
of the area, followed by logarithmic transformation of the values for both area and percentage cover
(Figure 2). It was noted that sites number 9, 22, and 23 were outliers in these analyses and a
discussion followed concerning the reasons for their dissimilarity. In the case of site number 9
Termiang it was noted that, the depth range of 14 metres was the largest recorded and that the
percentage cover was very low, 10%. In the case of sites 22 and 23, Phu Quoc and Con Dao Islands
several peculiarities were identified including the high number of "rare" species recorded. In the case
of Phu Quoc it was noted that the island was some 40 kilometres long with seven large seagrass
beds located at various points around the margin. It was noted that the area of individual seagrass
beds around this island was large, up to 800 hectares and following an extensive discussion it was
agreed that these should in fact be entered as individual sites rather than en bloc.
7.41
Questions were raised regarding the actual area of seagrass at the Cape Bolinao site in the
Philippines, since it was the view of several members that the value of 2,500 hectares seemed rather
high. This led to an extensive discussion on what constituted a seagrass site since the GIS
questionnaire set a lower limit of 1 hectare but no upper limit and no guidance had been agreed
regarding the aggregation of small beds that were adjacent to one another. It was agreed that where
seagrass beds were distinct from one another, but occurred within a reasonable distance of one
another such that there would be easy movement of animal species and or propagules between the
beds then these could be aggregated up to the limit of the appropriate administrative unit.
7.42
It was agreed to remove site number 9, Temiang Island from the analysis since it had very
low cover, but following discussion on Phu Quoc Island, Con Dao Island and Cape Bolinao, it was
agreed to leave these in for the sake of the exercise. It was noted however, that, the data for these
UNEP/GEF/SCS/RWG-SG.3/3
Page 12
sites would need to be carefully checked, and in some cases where the sites contained a number of
large seagrass beds, these should be submitted as separate sites for purposes of the cluster analysis.
7.43
The cluster programme was re-run with the area and percentage cover logarithmically
transformed and the depth transformed as square root plus one. The resultant dendrogram (Figure 3
of Annex 6) was felt by all members to be an adequate reflection of reality based on their experience
of seagrass beds in the region.
7.44
In commencing discussion of the ranking process, namely determination of the indicators and
weighted scores the vice-chairperson referred participants to annexes 4, 5, 6, and 7 of document
UNEP/GEF/SCS/RWG-M.3/3, which contain the results of the cluster, rank, and prioritisation work for
potential mangrove demonstration sites in the South China Sea. He then invited the Project Director
to provide some background on the process described in these annexes.
7.45
Dr. Pernetta noted that this process constituted the second and third steps of the entire
process described in document UNEP/GEF/SCS/RSTC.2/8 and that whilst the set of indicators and
weighting for the environmental class of indicators could be undertaken in a comparatively objective
manner the weighting for the socio-economic class of indicators would always contains some
subjective elements.
7.46
Participants then discussed the indicators they wished to use in the environmental class, and
reviewed the data table used in the site characterisation process. Following an extensive discussion
of the relative weights that should be assigned to each indicator members agreed on the scores
contained in Table 1 of Annex 7.
7.47
The members considered the indicators that should be used for socio-economic
characterisation and their relative weight, finally agreeing upon the indicators and weights contained
in Table 2 of Annex 7 of this report. Members then agreed to enter the appropriate data for their sites
into the tables overnight for initial review at the commencement of the final session of the meeting.
7.48
The preliminary rank scores for all sites based on data currently available are presented in
Tables 3 and 4 of Annex 7. It can be seen that values for a number of indicators, particularly those in
the socio-economic class of indicators (Table 4) could not be assigned at this time.
8.
PREPARATION OF SITE SPECIFIC PROPOSALS FOR DEMONSTRATION SITES
INCLUDING THE REVIEW OF THREATS AT SITE LEVEL AND IDENTIFICATION OF THE
PROXIMATE AND ULTIMATE CAUSES OF DEGRADATION
8.1
The Vice-Chairperson, Mr. Kuriandewa invited the Project Director to introduce document
UNEP/GEF/SCS/RWG-SG.3/6, which contains the format and guidance for the focal points for seagrass
in preparing site-specific proposals for demonstration sites. He explained that the reason for developing
this format was to ensure that all proposals were in a comparable format, thus making them easier for
the PSC members and potential donors to analyse.
8.2
Various questions were raised initially including a query regarding whose signature should go
on the front summary page of the proposal. Dr. Pernetta advised that this could be either the NFP or the
NTFP.
8.3
In response to a question on how a site outside the South China Sea would be considered, Dr.
Pernetta told the meeting that sites adjoining the SCS might be considered, but that, sites further away
would almost certainly be considered ineligible for GEF support by the Project Steering Committee. This
should not prevent proponents from submitting potential demonstration site proposals from outside the
South China Sea if these were, existing activities that could be added to the regional portfolio of sites, at
little or no cost to the Project.
8.4
Dr. Pernetta proceeded to review the document page by page, explaining the contents in more
detail and providing guidance as to how it should be completed, and what level of detail should be
presented in the accompanying annexes.
UNEP/GEF/SCS/RWG-SG.3/3
Page 13
8.5
Finally, Dr. Pernetta referred the meeting to the preliminary guidelines regarding completion of
the causal chain analysis, threat analysis, and management interventions for potential demonstration
sites, which were included in document UNEP/GEF/SCS/RWG-SG.3/6. He noted that this document
had been presented to the second RSTC meeting in December, 2002. Dr. Pernetta advised the meeting
that the activities associated with the preparation of demonstration site proposals will comprise the bulk
of the work of the focal points leading up to the fourth meeting of the RWG-SG.
8.6
Dr. Huang asked when these proposals needed to be prepared, to which Dr. Pernetta replied
that a first draft was needed for review by the PCU no later than September 1st, and a camera ready
copy would be required by October 1st, 2003 for distribution to potential donors and for consideration at
the RSTC and PSC meetings in December. He stated that he believed 3 or 4 proposals would be the
maximum that it would be possible for any one focal point to prepare to a suitable standard by these
dates.
9.
REVISION OF THE WORKPLAN AND ACTIVITIES FOR THE REGIONAL WORKING
GROUP ON SEAGRASS
9.1
During the first and second meetings of the Regional Working Group a flow chart of activities
and work plan and timetable were developed and agreed. However it is noticeable that some
countries have been unable to meet the deadlines for submission of outputs as originally planned. In
the light of the discussion and agreements reached under prior agenda items, the meeting reviewed and
revised the work plan and schedule of meetings extending to January 2004.
9.2
Dr. Pernetta went through the work plan line by line, and reviewed the progress of participants
for each output, making the point that all proposals must be in final form in advance of the Regional
Scientific Conference if they are to be presented to donors in an acceptable form. Most of the
participants reported that they had submitted drafts of all the required reports, but they wished to submit
final versions. Following discussion it was agreed that the PCU would distribute for review whatever
versions of the reviews of past and ongoing projects and data and information were available by 31st
March and following the independent review the PCU would transmit the outcome to the authors by the
end of April such that the reports can be finalised by 30th June 2003. The revised workplan and
timetable are attached as Annex 8 to this report.
9.3
Members noted that all demonstration site proposals must be in final form by 1st October 2003.
It was agreed that all missing data for the cluster analysis and ranking procedures would be provided to
the Project Co-ordinating Unit no later than April 15th for analysis in advance of the Regional Scientific
and Technical Steering Committee meeting in May. The Project Co-ordinating Unit would conduct the
analysis, review the results and provide a report to the members of the Regional Working Group within
10 working days of the receipt of the final set of data. This report would include the outcome in terms of
relative priority of the different demonstration sites and hence provide guidance to the focal points upon
which site proposals should be prepared for the first tranche.
10.
DATE AND PLACE OF THE FOURTH MEETING OF THE REGIONAL WORKING GROUP
ON SEAGRASS
10.1
Members were invited to consider and agree upon the proposed time and place for the fourth
meeting of the RWG-SG, noting that the overall schedule of meetings approved by the Project
Steering Committee currently has the fourth meeting scheduled for September 23rd to 26th, 2003.
Members indicated that they had no conflicting commitments during this period and agreed to the
dates as proposed.
10.2
The previous offer of Professor Huang to host the next meeting was noted, and SanYa and
Bei Hai were noted as possible venues. The exact location of the meeting would be determined by the
PCU, in consultation with Professor Huang.
10.3
The Project Director drew to the attention of the members the fact that, PEMSEA has, in
collaboration with the Government of Malaysia scheduled a major East Asian Seas Congress during
UNEP/GEF/SCS/RWG-SG.3/3
Page 14
the week commencing 8th December, which conflicts with the approved dates for the Regional
Scientific Conference and fourth meeting of the Regional Scientific and Technical Committee.
10.4
Members were invited to discuss potential conflicts and to consider possible alternative dates
for the Regional Scientific Conference. Members had no conflict of interest and suggested that the
PCU consider possible changes in date in consultation with the RSTC.
11.
ANY OTHER BUSINESS
11.1
Members were invited to consider and discuss any further items of business under this agenda
item. Mr. Kamarruddin noted that it would be necessary to develop and agree a detailed work plan for
the Malaysian team.
11.2
In reply to a question from Mr. Kamarruddin on sites for which very little data were available, Dr.
Pernetta answered that these would be unlikely to be selected as a demonstration site because of the
lack of information, but funds may be available in future to collect data such that the site could be
considered in future.
12.
ADOPTION OF THE REPORT OF THE MEETING
12.1
The Rapporteur, Dr. Chittima introduced the draft report of the meeting prepared by the
Secretariat, which was considered, amended and adopted as it appears in this document.
13.
CLOSURE OF THE MEETING
13.1
There followed an exchange of courtesies during which the Vice-Chairperson and Project
Director thanked participants for their hard work and constructive inputs to the meeting and members
expressed thanks to the Secretariat and to the Malaysian hosts for the successful preparation and
organisation of the meeting.
13.2
The Vice-Chairperson closed the meeting at 1700 on 28th March 2003.
UNEP/GEF/SCS/RWG-SG.3/3
Annex 1
Page 1
ANNEX 1
List of Participants
Focal Points
Cambodia
People's Republic of China
Mr. Mr. Suy Serywath (alternate)
Mr. Xiaoping Huang
Department of Fisheries
South China Sea Institute of Oceanology
Ministry of Agriculture, Forestry and Fisheries
Chinese Academy of Sciences
186 Norodom Boulevard
164 West Xingang Road
P.O. Box 852
Guangzhou 510301
Phnom Penh, Cambodia
Guangdong Province, China
Tel: (855 23) 215796
Tel: (86 20) 8902 3210
Fax: (855 23) 215796
Fax: (86 20) 8445 1672
E-mail: catfish@camnet.com.kh
E-mail: xphuang@scsio.ac.cn
Indonesia
Malaysia
Mr. Tri Edi Kuriandewa
Mr. Kamarruddin bin Ibrahim
Puslit Oseanografi, LIPI
Department of Fisheries
Pasir Putih 1, Ancol Timur
Turtle and Marine Ecosystem Center (TUMEC)
Jakarta, Indonesia
23050 Rantau Abang, Dungun
Terengganu, Malaysia
Tel: (62 251) 683 850; 316 9288;
08129005737
Tel:
(609) 845 8169; 845 3169 (direct)
Fax: (62 251) 681 948
Fax: (609) 845 8017
E-mail: indo-seagrass@centrin.net.id;
E-mail: kdin55@yahoo.com
kuriandewa@plasa.com
Philippines
Thailand
Dr. Miguel Fortes
Dr. Suvaluck Satumanatpan
Marine Science Institute
Faculty of Environment and Resource Studies
University of the Philippines (MSI/UP)
Mahidol University, Salaya Campus
Diliman, Quezon City
Nakorn Pathom 73170
Philippines 1101
Thailand
Tel:
(632) 922 3959; 922 3958
Tel: (66 2) 441 5000 ext. 187; (01) 700 7512
Fax: (632) 924 7678
Fax: (66 2) 441 9509-10
E-mail: fortesm@upmsi.ph
E-mail: ensnt@mahidol.ac.th
Viet Nam
Dr. Nguyen Van Tien
Haiphong Institute of Oceanology
246 Da Nang Street
Hai Phong City, Viet Nam
Tel:
(84 31) 760 599, 761 523
Fax:
(84 31) 761 521
E-mail: nvtien@hio.ac.vn
UNEP/GEF/SCS/RWG-SG.3/3
Annex 1
Page 2
Expert Members
Dr. Chittima Aryuthaka
Dr. Hutomo Malikusworo
Department of Marine Science
Indonesian Institute of Science
Faculty of Fisheries
Pasir Putih 1
Kasetsart University
Ancol Timur
Bangkhen, Bangkok 10900
Jakarta 14330
Thailand
Indonesia
Tel:
(66 2) 579 7610; 561 3469
Tel: (62 21) 683850
Fax: (66 2) 561 4287
Fax: (62 21) 681948
E-mail: ffiscta@ku.ac.th
E-mail: indo-seagrass@centrin.net.id
Project Co-ordinating Unit Member
Mr. Kelvin Passfield
Expert (Fisheries)
UNEP/GEF Project Co-ordinating Unit
9th Floor, Block A, United Nations Building
Rajdamnern Avenue
Bangkok 10200, Thailand
Tel:
(66 2) 288 1116
Fax: (66 2) 281 2428; 288 1094
E-mail: passfield@un.org
Project Co-ordinating Unit
Dr. John Pernetta, Project Director
Mr. Yihang Jiang, Senior Expert
UNEP/GEF Project Co-ordinating Unit
UNEP/GEF Project Co-ordinating Unit
United Nations Environment Programme
United Nations Environment Programme
9th Floor, Block A, United Nations Building
9th Floor, Block A, United Nations Building
Rajdamnern Avenue
Rajdamnern Avenue
Bangkok 10200, Thailand
Bangkok 10200, Thailand
Tel:
(66 2) 288 1886
Tel:
(66 2) 288 2084
Fax:
(66 2) 281 2428; 288 1094
Fax:
(66 2) 281 2428; 288 1094
E-mail: pernetta@un.org
E-mail: jiang.unescap@un.org
Ms. Unchalee Kattachan
Secretary, UNEP/GEF Project Co-ordinating Unit
United Nations Environment Programme
9th Floor, Block A, United Nations Building
Rajdamnern Avenue
Bangkok 10200, Thailand
Tel:
(66 2) 288 1670
Fax: (66 2) 281 2428; 288 1094
E-mail: kattachan.unescap@un.org
UNEP/GEF/SCS/RWG-SG.3/3
Annex 2
Page 1
ANNEX 2
List of Documents
Discussion documents
UNEP/GEF/SCS/RWG-SG.3/1
Provisional agenda
UNEP/GEF/SCS/RWG-SG.3/2
Provisional annotated agenda
UNEP/GEF/SCS/RWG-SG.3/3
Draft report of the meeting (to be prepared during the
meeting)
UNEP/GEF/SCS/RWG-SG.3/4
Current status of budgets and reports from the
Specialised Executing Agencies in the participating
countries.
UNEP/GEF/SCS/RWG-SG.3/5
Preliminary seagrass site characterisations for
consideration during the 3rd meeting of the Regional
Working Group on Seagrass.
UNEP/GEF/SCS/RWG-SG.3/6
Guidelines for the preparation of demonstration site
proposals and format for use in their presentation.
UNEP/GEF/SCS/RWG-SG.3/7
Schedule of meetings and current workplan for the
Regional Working Group on Seagrass.
CD-ROM
National reports and site characterisations for coral reefs
and seagrass (see the Appendix 1 for the list of seagrass
related reports).
Information documents
UNEP/GEF/SCS/RWG-SG.3/INF.1
Provisional list of participants
UNEP/GEF/SCS/RWG-SG.3/INF.2
Provisional list of documents
UNEP/GEF/SCS/RWG-SG.3/INF.3
Draft programme
UNEP/GEF/SCS/RSTC.2/8
Draft proposal for regional criteria and procedures to be
used in ranking and selecting demonstration sites in the
framework of the UNEP/GEF Project entitled: "Reversing
Environmental Degradation Trends in the South China
Sea and Gulf of Thailand."
UNEP/GEF/SCS/RSTC.2/10/Amend.1
Guidance to the PSC on the nature and types of
potential demonstration sites to be established within the
Framework of the UNEP/GEF Project
UNEP/GEF/SCS/RWG-M.3/3 Annexes 4, 5, 6 & 7
Cluster Rank and Prioritisation of potential
Mangrove demonstration sites in the South China Sea.
UNEP/GEF/SCS/RWG-W.2/3
Second Meeting of the Regional Working Group on the
Wetlands Sub-component for the UNEP/GEF Project
"Reversing Environmental Degradation Trends in the
South China Sea and Gulf of Thailand". Report of the
meeting. UNEP/GEF/SCS/RWG-W.2/3 Shenzhen, China,
4 - 7 September 2002.
UNEP/GEF/SCS/RWG-M.2/3
Second Meeting of the Regional Working Group on the
Mangroves Sub-component for the UNEP/GEF Project
"Reversing Environmental Degradation Trends in the
South China Sea and Gulf of Thailand". Report of the
meeting. UNEP/GEF/SCS/RWG-M.2/3 Ho Chi Minh City,
Viet Nam, 10 - 13 September 2002.
UNEP/GEF/SCS/RWG-SG.3/3
Annex 2
Page 2
UNEP/GEF/SCS/RWG-LbP.2/3
Second Meeting of the Regional Working Group on the
Land-based Pollution Component for the UNEP/GEF
Project "Reversing Environmental Degradation Trends in
the South China Sea and Gulf of Thailand". Report of the
meeting.
UNEP/GEF/SCS/RWG-LbP.2/3 Batam,
Indonesia, 18 - 21 September 2002.
UNEP/GEF/SCS/RWG-F.2/3
Second Meeting of the Regional Working Group on the
Fisheries Component for the UNEP/GEF Project
"Reversing Environmental Degradation Trends in the
South China Sea and Gulf of Thailand". Report of the
meeting. UNEP/GEF/SCS/RWG-F.2/3 Phuket, Thailand,
7 - 11 October 2002.
UNEP/GEF/SCS/RWG-CR.2/3
Second Meeting of the Regional Working Group on the
Coral Reef Sub-component for the UNEP/GEF Project
"Reversing Environmental Degradation Trends in the
South China Sea and Gulf of Thailand". Report of the
meeting. UNEP/GEF/SCS/RWG-CR.2/3 Sihanoukville,
Cambodia, 23 - 26 October 2002.
UNEP/GEF/SCS/RWG-SG.2/3
Second Meeting of the Regional Working Group on the
Seagrass Sub-component for the UNEP/GEF Project
"Reversing Environmental Degradation Trends in the
South China Sea and Gulf of Thailand". Report of the
meeting. UNEP/GEF/SCS/RWG-SG.2/3 Hue, Viet Nam,
28 - 31 October 2002.
UNEP/GEF/SCS/RSTC.2/3
Second Meeting of the Regional Scientific & Technical
Committee for the UNEP/GEF Project "Reversing
Environmental Degradation Trends in the South China
Sea and Gulf of Thailand". Report of the meeting.
UNEP/GEF/SCS/RSTC.2/3 Nha Trang, Viet Nam, 11 - 13
December 2002.
UNEP/GEF/SCS/PSC.2/3
Second Meeting of the Project Steering Committee for the
UNEP/GEF Project
"Reversing Environmental
Degradation Trends in the South China Sea and Gulf of
Thailand". Report of the meeting. UNEP/GEF/SCS/
PSC.2/3 Hanoi, Vietnam, 16 - 18 December 2002.
UNEP/GEF/SCS/RWG-SG.3/3
Annex 2
Page 3
Appendix 1
List of Substantive Reports Relating to the Seagrass Sub-component, Received by the Project
Co-ordinating Unit as of February 1st 2003.
Supplied to the third meeting of the Regional Working Group on Seagrass,
as pdf files on cd-rom.
Documentation has been received by the Secretariat from the Focal Points up to the 15th of March as
follows:
Cambodia
Report of National Data and information for Seagrass in Cambodia, 9pp
Table of past and ongoing activities, 3pp.
Reports Tabled during the meeting
- Review of National Data/Information for Seagrass in Cambodia, 15pp.
China
Legal aspects, 9pp.
Threats and management suggestions, Hainan Province, 12pp.
Relevant data and information on Seagrass, 6pp.
Management plans, Guangdou Province, 7pp.
Surveys and data, 8pp.
Surveys and historical data, Guanxi province, 11pp.
Economic Evaluation, 10pp.
Reports Tabled during the meeting
-
Indonesia
Review of National Data: The Status of Indonesian Seagrass Ecosystem
(October 2002), including chapters on economic valuation and legal aspects, 66pp.
Policy, Strategy, & Action Plan for Management of Seagrass Ecosystem in Indonesia, 13pp.
Legal aspects (in Indonesian), 18pp.
Site Characterisations (in GIS format), 56pp
Reports Tabled during the meeting
-
Philippines
Reports Tabled during the meeting
- Puento Gialera Ł Philippines, 9pp.
- Bolinao Ł Philippines, 9pp.
- Ulugan Bay Ł Philippines, 9pp.
- Prierto Princess/Honda Bay Palawan Ł Philippines, 9pp.
- Draft Ł Philippine National Seagrass Management Program 2002-2012, 9pp.
- Chronology of National and Local Legislation Relevant to the Concerns of Seagrass, 11pp.
- G. Caugal Chain Analysis, 1pp.
UNEP/GEF/SCS/RWG-SG.3/3
Annex 2
Page 4
Thailand
Seagrass Valuation. A discussion document on technique, 10pp.
Review of National Legislation, 8pp.
Draft National Report on the Seagrasses of Thailand, 4pp.
Tabulation of past and ongoing projects, 9pp.
Reports Tabled during the meeting
-
Vietnam
1. Development of Seagrass Metadatabase for Vietnam. (October 2002), 66pp.
Not a metadatabase at all. Contains site characterisations for 9 seagrass sites.
2. Review of Data and information on seagrasses in Vietnam October 2002), 92pp.
- Contains chapters on
- Review of past and ongoing activities, 4pp.
- Legislation and policies, 4pp.
- Seagrass restoration, 7pp.
- Exploitation and use, 1pp.
- Habitat value of Seagrass, 7pp.
- Biodiversity, 5pp.
- Seagrass biology, distribution, and primary production, 22pp.
- Ecology and distribution, 7pp.
- Species composition, 2pp.
- Threats, 14pp.
3. Review of Economic Valuation Criteria of Seagrasses in Vietnam Jan 2003, 7pp.
4. Review of threats to Seagrass in Vietnam Table, specific seagrass beds, (Jan 2003), 5pp.
5. National Seagrass Report, 102pp.
Reports Tabled during the meeting
- Site Specific Information Characterization of Seagrass Site: Phu Quoc Islands, 18pp.
UNEP/GEF/SCS/RWG-SG.3/3
Annex 3
Page 1
ANNEX 3
Agenda
1.
OPENING OF THE MEETING
1.1
Welcome address
1.2
Introduction of members
2.
ORGANISATION OF THE MEETING
2.1
Election of Officers
2.2
Documents available to the meeting
2.3
Organisation of work
3.
ADOPTION OF THE MEETING AGENDA
4.
OPENING REMARKS FROM THE FOCAL POINTS FOR SEAGRASS FROM EACH
PARTICIPATING COUNTRY
5.
REPORTS FROM THE PROJECT CO-ORDINATING UNIT (PCU) REGARDING OVERALL
PROGRESS TO DATE
5.1
Status of end-year progress reports, expenditure reports, and budgets
5.2
Status of planned substantive outputs from the national level activities
6.
REVIEW AND EVALUATION OF NATIONAL OUTPUTS ACCORDING TO THE AGREED
WORKPLAN
6.1
Past and on-going activi ties including economic valuation
6.2
Review of national data and information, creation of national meta -database
and national inputs to the regional GIS database
6.3
Review of national legislation, institutional and administrative arrangements
7.
CHARACTERISATION OF NATIONAL SEAGRASS SITES AND THEIR REGIONAL
PRIORITISATION
8.
PREPARATION OF SITE SPECIFIC PROPOSALS FOR DEMONSTRATION SITES
INCLUDING THE REVIEW OF THREATS AT SITE LEVEL AND IDENTIFICATION OF THE
PROXIMATE AND ULTIMATE CAUSES OF DEGRADATION
9.
REVISION OF THE WORKPLAN AND ACTIVITIES FOR THE REGIONAL WORKING
GROUP ON SEAGRASS
10.
DATE AND PLACE OF THE FOURTH MEETING OF THE REGIONAL WORKING GROUP
ON SEAGRASS
11.
ANY OTHER BUSINESS
12.
ADOPTION OF THE REPORT OF THE MEETING
13.
CLOSURE OF THE MEETING
UNEP/GEF/SCS/RWG-SG.3/3
Annex 4
Page 1
ANNEX 4
Tabulation of Raw Data Relating to Identified Seagrass Sites Bordering
the South China Sea
Background
Focal Points in the Specialised Executing Agencies were requested to assemble data and information
relating to seagrass sites bordering the South China Sea in GIS format and/or using the agreed lists
of data and information requirements developed during the first two regional working group meetings.
These were brought to the third meeting of the regional working group for use in the preliminary
cluster analysis and these data are presented in Table 1.
Review of the data
In reviewing the data it became apparent that certain parameters which had originally been identified
as being critical to site characterisation were in fact not readily available. Only two countries had data
relating to density of shoots for example, whilst data relating to mammal abundance and planktonic
larvae were not presented for any site. These parameters were not used in the subsequent analyses
and it was agreed that certain parameters should not be included in the cluster analysis, these
columns are shaded in grey in Table 1.
A review of the data contained in Table 1 indicates that certain data sets represent correlated items
and the inclusion of both sets of data would automatically weight the final dendrogram. Such paired
data sets include the numbers of species and genera of, crustacea, and echinoderms. The inclusion
of indices reflecting the biological diversity within these taxa is justified since each major taxon serves
as an indicator of diversity in different components of the seagrass food-web, however inclusion of
both genera and species numbers was not justified. The RWG-SG agreed that in these instances only
the data on species numbers would be used in the initial cluster analysis. It was further agreed that in
the final analysis the presence or absence of seahorses rather than the numbers of species or genera
would be included and Gower's Index of similarity would be applied to the data sets.
Transformations and estimations of data
Table 2 presents the data for those parameters that should be included in the final cluster analysis. In
the case of columns where less than 50% of the cells contained real data it was decided to eliminate
these parameters from further consideration at this stage. Therefore the parameters relating to
seahorse presence or absence, numbers of species of crustacea, gastropods, siganids, holothurians,
urchins and starfish were eliminated from further consideration.
The final set of data used in the analysis is presented in Table 3 and includes data for 8 parameters
and 25 sites: 4, China; 7 Indonesia; 4, Philippines; 6, Thailand; 4, Viet Nam. Shaded cells are cells for
which empirical data were absent, but for which an expert estimate was made by the regional working
group in order to retain both the parameter and the site in the initial cluster analysis. Too little data
were available for the Cambodian sites to justify their inclusion in the preliminary analysis.
Initially data were used without transformations and subsequently the data for area and percentage
cover were log transformed whilst the depth range was transformed using the square root plus one.
The transformed data are presented in Table 1 of Annex 5.
UNEP/GEF/SCS/RWG-SG.3/3
Annex 4
Page 2
Table 1
Data compilation from site characterisations based on the agreed set of parameters. Shaded columns indicate those parameters to be excluded from the
final cluster analysis
Density of
No. of
No
No.
No. of
No
No.
No.
No.
No.
No.
Site Name
Area (ha) depth range
dominant
Echinoderm
gastropod
Urchin Urchin Siganid holothurian starfish
Seagrass
% cover
seagrass
Seahorse Seahorse Penaeid
gastropod
crustacean
crustacean
echinoderm echinoderm
mammal
species
density
density
genera spp.
spp.
spp.
genera
shoots per sq M
genera
species species
spp.
genera
spp.
genera
spp.
spp.
THAILAND
Makhoam Pom Bay
250
1
2
Kung Krabane Bay
700
1-5
5
4
5
1
Trat
13
2.5
5
1
Tungka Bay
1,080
1-2
1
1
Sarat Thani
500
1-4
6
2
73
3-132
1
2
1
10
1
Pattani Bay
273
1-4
4
8
35 109-3,185
5
2
1
INDONESIA
Galang Baru
> 15
1 - 5
8
-
0
1
3
Medang-Mesanak
3 to 6
1-3
7
- 30 < 40
1
3
Temiang
> 5
1-15
2
- > 10%
1
3
Senayang-Kentar
> 10
1-5
8
-
0
1
3
Limbong Bay
> 10
1-5
5
-
32
1
3
Trikora Beach
> 15
1-3
-
99
1
3
Mapor
> 20
1-4
-
50
1
3
PHILIPPINES
Cape Bolinao
2,500 <0.1- 1.8
9
192
75
2
7
3
3
4
3
0
Puerto Galera
114 <0.5 - 5
9
82
95
1
2
3
3
0
Ulugan Bay
11 <0.5 - 3
8
876
100
1
2
Puerto
Princesa/Honda Bay
670 <.5-2m
8
90
4
3
4
CHINA
Hepu seagrass bed
540
0-4
3
80
5
4
200
1
1
1
1
12
41
4
6
3
Liusha seagrass bed
900
0-3
2
90
5
11
14
1
15
50
5
8
LiAn seagrass bed
300
0-3.2
5
75
3
17
1,453
1
1
1
2
1
Xincun seagraas
bed
200
0~2.0
4
80
3
6
16
1
1
1
1
1
3
3
1
1
VIETNAM
Phu Quoc Island
1,500 1.5-7.5m
9
1,685 40-50%
1
1
8
46
n/a
32
1
2
1
1
6
4
Con Dao Island
200 1.4-11m
10 1,400-2,330 20-25%
1
1
23
124
n/a
20
1
2
1
2
4
3
Phu Quy Island
300
0.5-3
6
1,328
2
3
2
4
4
1
Cam Ranh Bay
800
1-2
6
60-90
2
3
2
4
4
13
12
CAMBODIA
KKSG1
17,243
4
KKSG2
6
9
KapSG1
24,034
KepSG1
4,500
UNEP/GEF/SCS/RWG-SG.3/3
Annex 4
Page 3
Table 1 continued.
Data compilation from site characterisations based on the agreed set of parameters. Shaded columns indicate those parameters to be excluded
from the final cluster analysis
No.
Algal
Fishing
Decline Trampling
Direct
No. of No. of
No.
No. endangered
No
Salinity
Salinity Distance to Heavy
Sediment Sechi
damaged
gleaning Damaged
Trans-
Site Name
Mammal
POPs nutrients blooms
damage
damaged in CPUE
Conservation Trans-
larvae endemic indigenous rare
and
migratory highest
lowest freshwater metals
trapping
disk
biomass
damage
organisms
boundary
abundance
no. per
shoots
in last 10
boundary
families
spp.
spp.
spp. threatened species extreme extreme
inflow
mg/l
mg/l
mg/l
area
status
year
rate
depth
/sq.m
g/sq.m
yrs
shoots per
/sq.m.
(y/n)
effects
spp.
sq.m.
THAILAND
Makhoam Pom Bay
Kung Krabane Bay
1
Royal
Trat
1
Development
Project
Tungka Bay
1
Sarat Thani
1
National Park
Pattani Bay
1
INDONESIA
Galang Baru
Medang-Mesanak
Temiang
Senayang-Kentar
Limbong Bay
Trikora Beach
Mapor
PHILIPPINES
Cape Bolinao
1
41
Municipal
Reserv
Puerto Galera
1
2
39
90
Biosphere
Reserve
Ulugan Bay
36
30
Biosphere
Reserve
Puerto Princesa
Biosphere
/Honda Bay
Reserve
CHINA
Biomass
g/m2
Hepu seagrass bed
1
6
3
30.1
23.5
0.5
3
300
4
50
100
20
37
Liusha seagrass bed
32
28.1
1.5
2.5
120
9
45
85
10
127
LiAn seagrass bed
29.6
33.1
0.5
3
15
1.2
60
21
10
1180
Xincun seagrass bed
34.1
33.5
2.5
4
20
0.8
40
15
4
1934
VIETNAM
Phu Quoc Island
4
6
23
15 32.50
5.50
0.5kmHg:0.04
National Park
y
y
Con Dao Island
5
6
27
19
33
20
2km
National Park
y
y
Phu Quy Island
3
4
2 33-35
33
0.5
y
Cam Ranh Bay
34-37
0.5
1
CAMBODIA
KKSG1
KKSG2
KapSG1
KepSG1
UNEP/GEF/SCS/RWG-SG.3/3
Annex 4
Page 4
Table 2
Final agreed set of parameters for use in the cluster analysis
No. of
Seahorses No. of
No.
No
No. endangered
Site Name
Area (ha) depth range
Siganid holothurian
No migratory
Seagrass % cover present or Penaeid crustacean gastropod
Urchin spp starfish
spp.
spp.
genera and threatened
species
spp.
absent
spp.
spp.
spp
spp.
THAILAND
Makhoam Pom Bay
250
1
2
Kung Krabane Bay
700
1-5
5
4
5
1
Trat
13
2.5
5
1
Tungka Bay
1,080
1-2
1
1
Sarat Thani
500
1-4
6
2
73
2
1
1
10
1
Pattani Bay
273
1-4
4
8
35
5
2
1
INDONESIA
Galang Baru
> 15
1 - 5
8
0
+
3
Medang-Mesanak
3 to 6
1-3
7 30 < 40
+
3
Temiang
> 5
1-15
2
> 10%
+
3
Senayang-Kentar
> 10
1-5
8
0
+
3
Limbong Bay
> 10
1-5
5
32
+
3
Trikora Beach
> 15
1-3
99
+
3
Mapor
> 20
1-4
50
+
3
PHILIPPINES
Cape Bolinao
2,500 <0.1- 1.8
9
75
+
7
3
4
3
Puerto Galera
114
<0.5 - 5
9
95
+
2
3
3
2
Ulugan Bay
11
<0.5 - 3
8
100
+
2
Puerto Princesa/Honda Bay
670
<.5-2m
8
90
4
3
4
CHINA
Hepu seagrass bed
540
0-4
3
80
5
41
4
1
1
1
3
Liusha seagrass bed
900
0-3
2
90
5
50
11
1
LiAn seagrass bed
300
0-3.2
5
75
3
17
1
2
1
1
Xincun seagraas bed
200
0~2.0
4
80
3
3
6
1
1
1
1
VIET NAM
Phu Quoc Island
1,500
1.5-7.5m
9 40-50%
+
8
1
46
1
2
32
1
23
15
Con Dao Island
200
1.4-11m
10 20-25%
+
23
2
124
1
2
20
1
27
19
Phu Quy Island
300
0.5-3
6
+
2
4
3
4
4
2
Cam Ranh Bay
800
1-2
6
+
3
13
4
2
4
CAMBODIA
KKSG1
17,243
4
KKSG2
6
9
KapSG1
24,034
KepSG1
4,500
UNEP/GEF/SCS/RWG-SG.3/3
Annex 4
Page 5
Table 3
Final data set used in the preliminary cluster analysis. Shaded cells contain estimates
Number of
No. of
No. of
Number of Number of endangered
No.
Site Name
Area
depth
and
(ha)
range Seagrass % cover Penaeid
other
rare
species
species ecosystems species
threatened
species
1 Makhoam Pom Bay
250
1
2
60
4
0
0
1
2 Kung Krabane Bay
700
4
5
80
4
1
0
1
3 Trat
13
3
5
30
6
2
0
1
4 Tungka Bay
1,080
1
1
70
6
2
0
1
5 Sarat Thani
500
3
6
40
2
1
0
1
6 Pattani Bay
273
3
4
70
8
1
0
1
7 Galang Baru
15
4
8
40
3
2
0
1
8 Medang-Mesanak
5
2
7
35
3
2
0
1
9 Temiang
5
14
2
10
3
2
0
1
10 Senayang-Kentar
10
4
8
21
3
2
0
1
11 Limbong Bay
10
4
5
32
3
2
0
1
12 Trikora Beach
15
2
9
99
3
2
0
1
13 Mapor
20
3
8
50
3
2
0
1
14 Cape Bolinao
2,500
2
9
75
7
2
1
0
15 Puerto Galera
114
5
9
95
3
2
1
2
16 Ulugan Bay
11
3
8
100
4
2
0
0
17 Puerto Princesa
670
2
8
90
7
2
0
0
Honda Bay
18 Hepu seagrass bed
540
4
3
80
5
1
6
1
19 Liusha seagrass bed
900
3
2
90
5
2
0
0
20 LiAn seagrass bed
300
3
5
75
3
2
0
0
21 Xincun seagraas bed
200
2
4
80
3
2
0
0
22 Phu Quoc Island
1,500
6
9
45
8
3
6
0
23 Con Dao Island
200
10
10
35
4
3
6
3
24 Phu Quy Island
300
3
6
50
4
1
3
4
25 Cam Ranh Bay
800
1
6
60
3
2
0
0
UNEP/GEF/SCS/RWG-SG.3/3
Annex 5
Page 1
ANNEX 5
Preliminary List of Threatened and Near Threatened Species for the South China Sea
Scientific name
Common name
IUCN cat. (v3.1)*
Aetobatus narinari
Spotted eagle ray
DD
Alopias vulpinus
Thin tail thresher shark
DD
Anoxypristis cuspidata
Knifetooth sawfish
En
Atherinomorus lineatus
Line silverside
Vu
Butis butis
Duckbill sleeper
NT
Carcharhinus amblyrhynchoides
Graceful shark
NT
Carcharhinus amblyrhynchos
Grey reef shark
NT
Carcharhinus borneensis
Borneo shark
En
Carcharhinus brevipinna
Spinner shark
NT
Carcharhinus hemiodon
Pondicherry shark
Vu
Carcharhinus leucas
Bull shark
NT
Carcharhinus limbatus
Blacktip shark
NT
Carcharhinus longimanus
Oceanic whitetip shark
NT
Carcharhinus melanopterus
Blacktip reef shark
NT
Carcharhinus obscurus
Dusky shark
NT
Carcharhinus plumbeus
Sandbar shark
NT
Carcharias taurus
Sand tiger shark
Vu
Carcharodon carcharias
Great white shark
Vu
Cephalopholis boenak
Chocolate hind
DD
Cheilinus undulatus
Humphead wrasse
Vu
Cromileptes altivelis
Humpback grouper
DD
Dalatias licha
Kitefin shark
DD
Doryrhamphus dactyliophorus
Ringed pipefish
DD
Eleotris melanosoma
Broadhead sleeper
NT
Epinephelus lanceolatus
Giant grouper
Vu
Eurypegasus draconis
Short dragonfish
DD
Galeocerdo cuvier
Tiger shark
NT
Glossogobius biocellatus
Sleepy goby
NT
Glyphis gangeticus
Ganges shark
Cr
Glyphis glyphis
Speartooth shark
En
Hexanchus griseus
Blunt-nose six-gill shark
NT
Hippocampus barbouri
Barbour's seahorse
Vu
Hippocampus comes
Tiger tail seahorse
Vu
Hippocampus fuscus
Sea pony
Vu
Hippocampus histrix
Thorny seahorse
Vu
Hippocampus kuda
Spotted seahorse
Vu
Hippocampus mohnikei
Japanese seahorse
Vu
Hippocampus spinosissimus
Hedgehog seahorse
Vu
Hippocampus trimaculatus
Longnose seahorse
Vu
Isurus oxyrinchus
Shortfin Mako shark
NT
Lagocephalus gloveri
Kuro sabafugu (Jap)
DD
UNEP/GEF/SCS/RWG-SG.3/3
Annex 5
Page 2
Scientific name
Common name
IUCN cat. (v3.1)*
Liza melinoptera
Otomebora mullet
En
Notorynchus cepedianus
Broadnose seven-gill shark
DD
Papillogobius reichei
Indo-Pacific tropical sand goby
NT
Pegasus laternarius
Sticklebacks and seamoths
Vu
Pegasus volitans
Longtail seamoth
DD
Prionace glauca
Blue shark
NT
Pristis microdon
Largetooth sawfish
En
Pristis pectinata
Smalltooth sawfish
En
Pristis zijsron
Longcomb sawfish
En
Rhincodon typus
Whale shark
Vu
Scoliodon laticaudus
Spadenose shark
NT
Solegnathus hardwickii
Hardwicke's pipefish
Vu
Solegnathus lettiensis
Gunther's pipe horse
Vu
Sphoeroides pachygaster
Blunthead puffer
Vu
Sphyrna lewini
Scalloped hammerhead
NT
Sphyrna mokarran
Great hammerhead
DD
Sphyrna zygaena
Smooth hammerhead
NT
Syngnathoides biaculeatus
Alligator pipefish
DD
Taeniura lymma
Bluespotted ribbontail ray
NT
Takifugu niphobles
Puffers and filefishes
DD
Takifugu poecilonotus
Puffers and filefishes
DD
Takifugu xanthopterus
Puffers and filefishes
DD
Teramulus kieneri
Kiener's silverside
DD
Thunnus alalunga
Albacore tuna
DD
Thunnus obesus
Big eye tuna
Vu
Triaenodon obesus
Whitetip reef shark
NT
Urogymnus asperrimus
Porcupine ray
Vu
Xiphias gladius
Swordfish
DD
Marine mammals
Balaenoptera borealis
Coalfish whale
En
Balaenoptera musculus
Blue whale
En
Balaenoptera physalus
Finbacked whale
En
Megaptera novaeangliae
Humpbacked whale
Vu
Orcaella brevirostris
Irawaddy dolphin
DD
Dugong dugon
Dugong
Vu
Marine Turtles
Caretta caretta
Loggerhead turtle
En
Chelonia mydas
Green turtle
En
Dermochelys coriacea
Leatherback turtle
Cr
Eretmochelys imbricata
Hawksbill turtle
Cr
Lepidochelys olivacea
Olive ridley turtle
En
*IUCN categories criteria version 3.1, 2001. Cr = critically endangered; En = endangered; Vu = vulnerable;
NT=, near threatened; DD = data deficient. The term "threatened" includes categories Cr, En and Vu.
Sources. For fishes, Fishbase 2000, ICLARM- The World Fish Centre.
For Marine mammals and reptiles; IUCN 2002. 2002 IUCN Red List of Threatened Species.
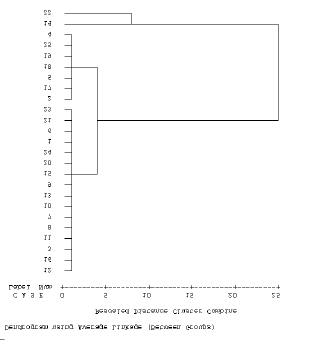
UNEP/GEF/SCS/RWG-SG.3/3
Annex 6
Page 1
ANNEX 6
Dendrograms Resulting from the Preliminary Cluster Analyses Conducted During the
Third Meeting of the Regional Working Group on Seagrass
Introduction
The purpose of the cluster analysis is to group sites on the basis of their similarity, thus enabling
ranking and selection of demonstration sites from different groups to ensure that as wide a range of
conditions as possible are included within the final selection of demonstration sites.
Results
Table 3 of Annex 4 presents the data available for inclusion in the preliminary analyses representing
25 sites from 5 countries. The cluster programme from the SPSS package was utilised for these
preliminary analyses and Figure 1 presents the outcome using average between groups linkage, for
these data without transformation.
Figure 1
Dendrogram using average linkage between groups based on the untransformed data
presented in Table 3 of Annex 4
It can be seen that this figure fails to distinguish similarities amongst the majority of the sites and
appears to be strongly influenced by the figures for total area of the site, and percentage cover. This
results in the majority of sites (16) falling into one cluster with a second cluster of 7 sites and two
outliers. The two outliers are the sites with largest areas 2,500 and 1,500 hectares, whilst the
remaining two groups represent sites of area between 500 and 1080 hectares and between 10 and
300 hectares.
The outcome is neither very informative nor helpful for the intended purpose hence it was decided to
transform the data for area of the site, and percentage cover using a log transformation. The
transformed data are presented in Table 1 and the resultant dendrogram is shown in Figure 2. It can
be seen from Figure 2 that one site, Temiang in Indonesia, lies outside the remaining set, reflecting
the large depth range of 14 metres.
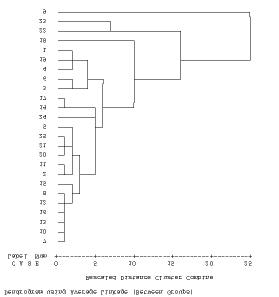
UNEP/GEF/SCS/RWG-SG.3/3
Annex 6
Page 2
Table 1
Logarithmic Transformation of Area and Percentage Cover. Shaded cells contain
estimates agreed by the RWG-SG
Number of
depth
No. of percent No. of Number of Number of endangered
No.
Site Name
Area (ha) range Seagrass
Penaeid
other
rare
and
species
cover species ecosystems species threatened
species
1 Makhoam Pom Bay
2.40
1.00
2.00
1.78
4.00
0.00
0.00
1.00
2 Kung Krabane Bay
2.85
4.00
5.00
1.90
4.00
1.00
0.00
1.00
3 Trat
1.11
3.00
5.00
1.48
6.00
2.00
0.00
1.00
4 Tungka Bay
3.03
1.00
1.00
1.85
6.00
2.00
0.00
1.00
5 Sarat Thani
2.70
3.00
6.00
1.60
2.00
1.00
0.00
1.00
6 Pattani Bay
2.44
3.00
4.00
1.85
8.00
1.00
0.00
1.00
7 Galang Baru
1.18
4.00
8.00
1.60
3.00
2.00
0.00
1.00
8 Medang-Mesanak
0.70
2.00
7.00
1.54
3.00
2.00
0.00
1.00
9 Temiang
0.70
14.00
2.00
1.00
3.00
2.00
0.00
1.00
10 Senayang-Kentar
1.00
4.00
8.00
1.32
3.00
2.00
0.00
1.00
11 Limbong Bay
1.00
4.00
5.00
1.51
3.00
2.00
0.00
1.00
12 Trikora Beach
1.18
2.00
9.00
2.00
3.00
2.00
0.00
1.00
13 Mapor
1.30
3.00
8.00
1.70
3.00
2.00
0.00
1.00
14 Cape Bolinao
3.40
2.00
9.00
1.88
7.00
2.00
1.00
0.00
15 Puerto Galera
2.06
5.00
9.00
1.98
3.00
2.00
1.00
2.00
16 Ulugan Bay
1.04
3.00
8.00
2.00
4.00
2.00
0.00
0.00
Puerto Princesa
17
2.83
2.00
8.00
1.95
7.00
2.00
0.00
0.00
Honda Bay
18 Hepu seagrass bed
2.73
4.00
3.00
1.90
5.00
1.00
6.00
1.00
19 Liusha seagrass bed
2.95
3.00
2.00
1.95
5.00
2.00
0.00
0.00
20 LiAn seagrass bed
2.48
3.00
5.00
1.88
3.00
2.00
0.00
0.00
21 Xincun seagrass bed
2.30
2.00
4.00
1.90
3.00
2.00
0.00
0.00
22 Phu Quoc Island
3.18
6.00
9.00
1.65
8.00
3.00
6.00
0.00
23 Con Dao Island
2.30
10.00
10.00
1.54
4.00
3.00
6.00
3.00
24 Phu Quy Island
2.48
3.00
6.00
1.70
4.00
1.00
3.00
4.00
25 Cam Ranh Bay
2.90
1.00
6.00
1.78
3.00
2.00
0.00
0.00
Figure 2
Dendrogram using average linkage between groups based on logarithmic
transformations of the data for area and percentage cover presented in Table 1 above
UNEP/GEF/SCS/RWG-SG.3/3
Annex 6
Page 3
It was decided to transform the depth range using the square root plus one and these data are
presented in Table 2. The resulting dendrogram (Figure 3) shows that Temiang is no longer an outlier
being somewhat similar to four of the sites from Thailand. This figure suggests that sites 18, 22 and
23 form outlier groups, which may reflect the unusually high numbers of "rare" species recorded from
these three Vietnamese sites. During discussion it was noted that the Vietnamese had used the
national Red Data book in defining rare, endangered and threatened species rather than the IUCN
Red Data Book and these numbers will need to be checked prior to the final analysis.
Table 2
Logarithmic Transformation of Area and Percentage Cover, and transformation of the
depth range using (square root +1). Shaded cells contain estimates agreed by the
RWG-SG
Number of
No. of
No. of
No. of endangered
No.
Site Name
Area
depth
No. of other
(ha)
range Seagrass % cover Penaeid ecosystems rare
and
species
species
species threatened
species
1 Makhoam Pom Bay
2.40
2.00
2.00
1.78
4.00
0.00
0.00
1.00
2 Kung Krabane Bay
2.85
3.00
5.00
1.90
4.00
1.00
0.00
1.00
3 Trat
1.11
2.73
5.00
1.48
6.00
2.00
0.00
1.00
4 Tungka Bay
3.03
2.00
1.00
1.85
6.00
2.00
0.00
1.00
5 Sarat Thani
2.70
2.73
6.00
1.60
2.00
1.00
0.00
1.00
6 Pattani Bay
2.44
2.73
4.00
1.85
8.00
1.00
0.00
1.00
7 Galang Baru
1.18
3.00
8.00
1.60
3.00
2.00
0.00
1.00
8 Medang-Mesanak
0.70
2.41
7.00
1.54
3.00
2.00
0.00
1.00
9 Temiang
0.70
4.74
2.00
1.00
3.00
2.00
0.00
1.00
10 Senayang-Kentar
1.00
3.00
8.00
1.32
3.00
2.00
0.00
1.00
11 Limbong Bay
1.00
3.00
5.00
1.51
3.00
2.00
0.00
1.00
12 Trikora Beach
1.18
2.41
9.00
2.00
3.00
2.00
0.00
1.00
13 Mapor
1.30
2.73
8.00
1.70
3.00
2.00
0.00
1.00
14 Cape Bolinao
3.40
2.41
9.00
1.88
7.00
2.00
1.00
0.00
15 Puerto Galera
2.06
3.24
9.00
1.98
3.00
2.00
1.00
2.00
16 Ulugan Bay
1.04
2.73
8.00
2.00
4.00
2.00
0.00
0.00
17 Puerto Princesa Honda Bay
2.83
2.41
8.00
1.95
7.00
2.00
0.00
0.00
18 Hepu seagrass bed
2.73
3.00
3.00
1.90
5.00
1.00
6.00
1.00
19 Liusha seagrass bed
2.95
2.73
2.00
1.95
5.00
2.00
0.00
0.00
20 LiAn seagrass bed
2.48
2.73
5.00
1.88
3.00
2.00
0.00
0.00
21 Xincun seagrass bed
2.30
2.41
4.00
1.90
3.00
2.00
0.00
0.00
22 Phu Quoc Island
3.18
3.45
9.00
1.65
8.00
3.00
6.00
0.00
23 Con Dao Island
2.30
4.16
10.00
1.54
4.00
3.00
6.00
3.00
24 Phu Quy Island
2.48
2.73
6.00
1.70
4.00
1.00
3.00
4.00
25 Cam Ranh Bay
2.90
2.00
6.00
1.78
3.00
2.00
0.00
0.00
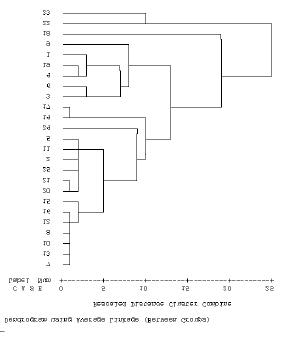
UNEP/GEF/SCS/RWG-SG.3/3
Annex 6
Page 4
Figure 3
Dendrogram using average linkage between groups based on logarithmic
transformations of the data for area and percentage cover and transformation of the
depth range using (square root +1) presented in Table 2 above. Shaded cells contain
estimates agreed by the RWG-SG
Conclusions
It is apparent that, the data need to be carefully verified prior to the conduct of the final cluster
analysis, and hence full species lists for all the taxa used must be provided for each site. It was
agreed to use Gower's Index of Similarity and to include the presence or absence of seahorses rather
than numbers of species and/or genera in the final analysis.
UNEP/GEF/SCS/RWG-SG.3/3
Annex 7
Page 1
ANNEX 7
Ranking Indicators and Weights for Determination of Priority within Clusters of
Potential Demonstration Sites, and Results of Preliminary Ranking of Seagrass Sites
Bordering the South China Sea
Background
The second meetings of the Regional Scientific and Technical Committee and the Project Steering
Committee agreed to a three-step process of selecting demonstration sites based on, an initial
clustering of similar sites followed by, ranking and determination of the priority of sites within clusters.
The Focal Points in each Specialised Executing Agency assembled, in advance of the third Regional
Working Group meeting, data and information required to characterise seagrass sites bordering the
South China Sea. These data and information were based on the needs identified during the first
regional working group meeting and listed in Annex 7 of the meeting report1. The table is reproduced
here as appendix 1 for comparative purposes.
Examination of this table clearly indicates that the range of data and information, envisaged to be
assembled, in characterising seagrass sites, was both comprehensive and overlapping in terms of
various aspects of each major class of parameter. In considering the indicators to be used in ranking
the priority of sites within each cluster two major considerations were applied, the first the over-riding
need for transparency in the process of site selection, and secondly, the need to ensure that data
were comparable for all sites considered by the focal points in each country. The necessity for
transparency in the process means that the indicators used in ranking sites must be simple, and non-
overlapping in terms of the inherent characteristics covered by each indicator type. Hence the use of
multiple indicators such as genera and species of the same larger taxon should be avoided, as should
the use of any indicator, however important it might theoretically be, if such data cannot be supplied
for the majority of sites.
Choice of Indicators
Discussion of the choice of indicators was based on the preliminary sets of data and information
assembled for 25 seagrass sites and made available to the third meeting of the Regional Working
Group on Mangroves. These data are presented in Table 1 of Annex 4.
As noted in the meeting report, data and information for some parameters such as rates of change in
vegetation cover had not been assembled for most sites and such parameters were excluded from
the cluster analysis. In some cases these have also been excluded from the choice of indicators used
in the ranking process whilst in others they have been more broadly defined and included in the
choice of indicators.
Table 1 lists the indicators selected by the Regional Working Group as being indicative of biological
diversity, transboundary, regional and global significance.
The weighting to be assigned to the classes of indicator reflects the consensus view of members
concerning the relative importance of each class. Hence the indicators of biological diversity were
considered to merit the greatest weight overall, 60 points from the total of 100. It should be
recognised that in reality the indicators of transboundary, regional and global significance are in fact
also indicators of biological diversity, hence this set of indicators is strongly weighted towards the
biological characteristics of the sites concerned.
1 UNEP, 2002. Report of the First Meeting of the Regional Working Group for the Seagrass Sub-component of the Project
Reversing Environmental Degradation Trends in the South China Sea and Gulf of Thailand. UNEP GEF/SCS/RWG-SG.1/3
Bangkok, Thailand, 6 Ł 8 May 2002.
UNEP/GEF/SCS/RWG-SG.3/3
Annex 7
Page 2
Table 1
Indicators and weight for biological diversity, transboundary, regional and global
significance
Indicator scale
Class of Indicator
Score
1. Area maximum 25 points
1.1 Total area (ha) maximum 15 points
<20
21-100
101-300
301-500
>500
Score
3
6
9
12
15
1.2 Percent coverage maximum 10 points
<20
21-40
41-60
61-80
>80
Score
2
4
6
8
10
2. Biological diversity 60 points
2.1 Species diversity Score maximum 52 points
2.1.1 Seagrass species
<2
3-4
5-6
7-8
>8
Score Maximum 15 points
3
6
9
12
15
2.1.2 Gastropods
<20
21-40
41-70
71-100
>100
Score Maximum 5 points
1
2
3
4
5
2.1.3 Penaeid shrimps
0
1-3
4-5
6-7
>7
Score Maximum 8 points
0
2
4
6
8
2.1.4 Sea Urchins
0
1-2
>2
Score Maximum 4 points
0
2
4
2.1.5 Siganids
0
1-2
3-4
>4
Score Maximum 8 points
0
2
5
8
2.1.6 Holothurians
0
1-5
>5
Score Maximum 8 points
0
4
8
2.1.7 Starfish
0
1-3
>3
Score Maximum 4 points
0
2
4
2.2 Community diversity Score maximum 8 points
2.2.1 Number of other aquatic ecosystems
1
2
>2
Score Maximum 8 points
3
5
8
3. Transboundary significance 5 points
3.1 Number of migratory aquatic species
Score Maximum 5 points
score 1 point per species
4. Regional/Global significance 10 points
4.1 Number of endangered & critically endangered aquatic species
Score Maximum 10 points
score 1 point per species
Within each class of indicator a series of one or more specific indicators were identified on the basis
of the outcome of the initial site characterisations, hence indicators were not included when it was
apparent that the information and/or data were difficult to assemble as evidenced by the frequency of
missing data in the preliminary set.
Following a careful analysis of the range of values demonstrated by the site data available to the
meeting, the Regional Working Group then considered the number of divisions and weighting that
would be appropriate to assign to any individual site value.
Table 2 lists the indicators selected by the Regional Working Group as being indicative of socio-
economic conditions including indicators of national priority, stakeholder involvement and threats. As
in the case of the environmental indicators, the Regional Working Group discussed and agreed the
comparative weight that should be assigned to each class of indicator, then to individual indicators
within each class, finally deciding on the divisions and weights that should be assigned to the
observed values at any one site.
It was noted that a number of the indicators listed in Table 2 were highly subjective and it is clear that
the proposals for demonstrations sites will need to present quite detailed reasoning as to why
particular scores have been assigned.
UNEP/GEF/SCS/RWG-SG.3/3
Annex 7
Page 3
Table 2
Indicators for socio-economic considerations including indicators of national priority,
stakeholder involvement and threats to be used in the ranking of seagrass sites
bordering the South China Sea
Indicator scale
Class of Indicator
Score
1. Threats maximum 10 points
High
Medium
Low
None
1.1 From destructive fishing
Score Ł max 5
1
2
3
5
1.2 From pollution
Score Ł max 5
1
2
3
5
2. National significance/priority-Government support maximum 16 points
2.1 National priority
Low
medium
high
Score Ł max
5
10
16
3. Financial considerations /co-financing maximum 22 points
3.1 Project cost ($US)
>150,000
150,000
<150,000
Score Ł max 10
3
6
10
3.2 Co-financing commitment
<1/1
1/1
>1/1
Score Ł max 12
4
8
12
4. Stakeholders involvement maximum 22 points
4.1 Local government (in cash/in-kind)
Low
medium
high
Score Ł max 6
2
4
6
4.2 Central government (in cash/in-kind)
Low
medium
high
Score Ł max 4
1
2
4
4.3 NGOs/Civil Society (in cash/in-kind)
Low
medium
high
Score Ł max 6
2
4
6
4.4 Private Sector (in cash/in-kind)
Low
medium
high
Score Ł max 6
2
4
6
5. Management potential maximum 30 points
5.1 Accessibility
low
medium
high
Score Ł max 10
3
6
10
5.2 Existing institutional framework
low
medium
high
Score Ł max 10
3
6
10
5.3 Existing information
low
medium
high
Score Ł max 10
3
6
10
Results of Preliminary Ranking of Seagrass Sites Bordering the South China Sea
Having agreed upon the nature of the indicators and the weight to be assigned to them the site
characterisations available to the third meeting of the Regional Working Group on Seagrass were
scored according to the agreed indicators and weights, presented and discussed above.
The outcome of the preliminary ranking for all twenty-nine seagrass site characterisations with respect
to the environmental indicators is presented in, Table 3, and with respect to the socio-economic
indicators, in Table 4. Due to the incomplete nature of the data sets, together with differences in the
definitions of the indicators used by each focal point it is not possible to obtain final rank scores at the
present time. Where the data set for a particular site is incomplete then the preliminary rank score will
be automatically lower, this is particularly evident in the case of the Thai, Cambodian and Indonesia
sites where up to 6 of the environmental indicators cannot be scored.
UNEP/GEF/SCS/RWG-SG.3/3
Annex 7
Page 4
Table 3
Scores for environmental indicators in respect of seagrass sites bordering the South China Sea
Transboundary Regional &
Area
Species Diversity
Community
Diversity
Significance
Global
Significance
Site Name
No
No. of
Total
Area
No
No
Penaeid
No
No
No
No
No. of other No. of migratory endangered
(ha) % cover Seagrass Gastropod
Urchin Siganid
holothurian
starfish
and
Spp.
Spp.
shrimp
ecosystems
Spp.
Spp.
Spp.
Spp.
Spp.
Spp.
threatened
Spp.
THAILAND
Makhoam Pom Bay
9
6
3
n/a
4
n/a
n/a
n/a
n/a
3
n/a
1
26
Kung Krabane Bay
15
8
9
1
4
n/a
2
n/a
n/a
5
n/a
1
45
Trat
3
4
9
n/a
6
n/a
n/a
n/a
n/a
5
n/a
1
28
Tungka Bay
15
8
3
n/a
6
n/a
n/a
n/a
n/a
5
n/a
1
38
Sarat Thani
12
4
9
4
2
2
2
4
4
3
n/a
1
47
Pattani Bay
9
8
6
2
8
n/a
8
0
2
3
n/a
1
47
INDONESIA
Galang Baru
3
4
12
1
2
n/a
n/a
n/a
n/a
5
n/a
1
28
Medang-Mesanak
3
4
12
1
2
n/a
n/a
n/a
n/a
5
n/a
1
28
Temiang
3
2
3
1
2
n/a
n/a
n/a
n/a
5
n/a
1
17
Senayang-Kentar
3
4
12
1
2
n/a
n/a
n/a
n/a
5
n/a
1
28
Limbong Bay
3
4
9
1
2
n/a
n/a
n/a
n/a
5
n/a
1
25
Trikora Beach
3
15
15
1
2
n/a
n/a
n/a
n/a
5
n/a
1
42
Mapor
3
6
12
1
2
n/a
n/a
n/a
n/a
5
n/a
1
30
PHILIPPINES
Cape Bolinao
15
8
15
n/a
6
n/a
5
4
2
5
n/a
n/a
60
Puerto Galera
9
10
15
n/a
2
n/a
2
4
2
5
n/a
2
51
Ulugan Bay
3
10
12
n/a
4
n/a
2
n/a
n/a
5
n/a
n/a
36
Puerto Princesa/ Honda
15
10
12
n/a
6
n/a
5
4
4
5
n/a
n/a
61
Bay
UNEP/GEF/SCS/RWG-SG.3/3
Annex 7
Page 5
Table 3 continued.
Scores for environmental indicators in respect of seagrass sites bordering the South China Sea
Transboundary Regional &
Area
Species Diversity
Community
Diversity
Significance
Global
Significance
Site Name
No
No. of
Total
Area
No
No
Penaeid
No
No
No
No
No. of other No. of migratory endangered
(ha) % cover Seagrass Gastropod
Urchin Siganid
holothurian
starfish
and
Spp.
Spp.
shrimp
Spp.
Spp.
Spp.
Spp.
ecosystems
Spp.
Spp.
threatened
Spp.
CHINA
Hepu seagrass bed
15
10
6
1
4
2
2
0
2
3
3
2
50
Liusha seagrass bed
15
10
3
1
4
0
0
0
2
5
n/a
1
41
LiAn seagrass bed
9
8
9
1
2
2
2
4
2
5
n/a
0
44
Xincun seagrass bed
9
10
6
1
2
2
2
4
2
5
n/a
0
43
VIET NAM
Phu Quoc Island
15
6
15
3
8
2
4
2
8
n/a
n/a
63
Con Dao Island
9
4
15
5
4
2
4
2
8
n/a
3
56
Phu Quy Island
9
6
9
n/a
4
4
2
4
4
3
2
4
51
Cam Ranh Bay
15
6
9
n/a
2
n/a
4
4
5
n/a
n/a
45
CAMBODIA
KKSG1
15
6
6
n/a
n/a
n/a
n/a
n/a
n/a
n/a
n/a
n/a
27
KKSG2
n/a
n/a
n/a
n/a
n/a
n/a
n/a
n/a
n/a
n/a
n/a
n/a
0
KapSG1
15
6
6
n/a
n/a
n/a
n/a
n/a
n/a
n/a
n/a
n/a
27
KepSG1
15
8
9
n/a
n/a
n/a
n/a
n/a
n/a
n/a
1
n/a
33
UNEP/GEF/SCS/RWG-SG.3/3
Annex 7
Page 6
Table 4
Scores for Socio-economic indicators in respect of seagrass sites bordering the South China Sea
Threat
Financial Considerations
Stakeholder Participation
Management Potential
National
Country and Site
significance
Existing
TOTAL
Fishing Pollution
Local Central NGOs Civil Private
Existing
priority
Project Cost
Co-
financing Gov't Gov't
Society
Sector
Access
Institutional Information
Arrangements
THAILAND
Makhoam Pom Bay
2
3
10
10
2
1
2
2
10
3
3
48
Kung Krabane Bay
2
1
16
6
2
4
2
2
10
6
6
57
Trat
3
3
5
10
2
2
2
2
6
3
3
41
Tungka Bay
3
2
10
6
2
1
2
2
6
6
3
43
Sarat Thani
3
3
5
10
2
1
2
2
6
3
3
40
Pattani Bay
1
1
16
6
4
2
6
2
6
3
6
53
INDONESIA
Galang Baru
n/a
n/a
n/a
n/a
n/a
n/a
n/a
n/a
n/a
n/a
n/a
n/a
0
Medang-Mesanak
n/a
n/a
n/a
n/a
n/a
n/a
n/a
n/a
n/a
n/a
n/a
n/a
0
Temiang
n/a
n/a
n/a
n/a
n/a
n/a
n/a
n/a
n/a
n/a
n/a
n/a
0
Senayang-Kentar
n/a
n/a
n/a
n/a
n/a
n/a
n/a
n/a
n/a
n/a
n/a
n/a
0
Limbong Bay
n/a
n/a
n/a
n/a
n/a
n/a
n/a
n/a
n/a
n/a
n/a
n/a
0
Trikora Beach
n/a
n/a
n/a
n/a
n/a
n/a
n/a
n/a
n/a
n/a
n/a
n/a
0
Mapor
n/a
n/a
n/a
n/a
n/a
n/a
n/a
n/a
n/a
n/a
n/a
n/a
0
PHILIPPINES
Cape Bolinao
n/a
n/a
n/a
n/a
n/a
n/a
n/a
n/a
n/a
n/a
n/a
n/a
0
Puerto Galera
n/a
n/a
n/a
n/a
n/a
n/a
n/a
n/a
n/a
n/a
n/a
n/a
0
Ulugan Bay
n/a
n/a
n/a
n/a
n/a
n/a
n/a
n/a
n/a
n/a
n/a
n/a
0
Puerto Princesa/
Honda Bay
n/a
n/a
n/a
n/a
n/a
n/a
n/a
n/a
n/a
n/a
n/a
n/a
0
UNEP/GEF/SCS/RWG-SG.3/3
Annex 7
Page 7
Table 4 continued.
Scores for Socio-economic indicators in respect of Seagrass sites bordering the South China Sea
Threat
Financial Considerations
Stakeholder Participation
Management Potential
National
Country and Site
significance
Existing
TOTAL
Fishing Pollution
Local Central NGOs Civil Private
Existing
priority
Project Cost
Co-
financing Gov't Gov't
Society
Sector
Access
Institutional Information
Arrangements
CHINA
Hepu seagrass bed
2
3
16
10
12
6
4
6
2
10
6
10
87
Liusha seagrass bed
3
3
10
10
12
6
4
4
2
6
6
10
76
LiAn seagrass bed
3
3
10
10
12
4
4
4
2
10
6
10
78
Xincun seagrass bed
3
3
16
10
12
4
4
4
2
10
6
10
84
VIET NAM
Phu Quoc Island
n/a
n/a
n/a
n/a
n/a
n/a
n/a
n/a
n/a
n/a
n/a
n/a
0
Con Dao Island
n/a
n/a
n/a
n/a
n/a
n/a
n/a
n/a
n/a
n/a
n/a
n/a
0
Phu Quy Island
n/a
n/a
n/a
n/a
n/a
n/a
n/a
n/a
n/a
n/a
n/a
n/a
0
Cam Ranh Bay
n/a
n/a
n/a
n/a
n/a
n/a
n/a
n/a
n/a
n/a
n/a
n/a
0
CAMBODIA
KKSG1
1
3
n/a
n/a
n/a
n/a
n/a
n/a
n/a
n/a
3
3
10
KKSG2
n/a
n/a
n/a
n/a
n/a
n/a
n/a
n/a
n/a
n/a
n/a
n/a
0
KapSG1
1
3
n/a
n/a
n/a
n/a
n/a
n/a
n/a
n/a
6
6
16
KepSG1
1
3
n/a
n/a
n/a
n/a
n/a
n/a
n/a
n/a
6
6
16
UNEP/GEF/SCS/RWG-SG.3/3
Annex 7
Page 8
Table 4 presents the rank scores for the socio-economic classes of indicator and it can be seen that
only Thailand had assembled the data necessary to assign rank scores at this time. The absence of
data from the other countries is not unsurprising, since at this stage the details of proposed
interventions have still to be finalised and hence the extent of community involvement, co-financing
support and other indicators are difficult to estimate at the present time.
Conclusion
The regional working group agreed on the use of this selection of indicators in a two tier process with
the indicators in Table 1 be used as the primary means of ranking regional importance of sites within
the clusters and the indicators in Table 2 being applied at a later stage when final decisions regarding
the choice of sites are being made.
The assignment of rank according to the agreed classes of indicators and their respective weighting
can be finalised rapidly provided that, the focal points submit the missing data to the PCU promptly.
UNEP/GEF/SCS/RWG-SG.3/3
Annex 7
Page 9
Appendix 1
Parameters, Indicators, Data and Information Requirements for Characterising, Seagrass Sites for the UNEP/GEF Project
"Reversing Environmental Degradation Trends in the South China Sea and Gulf of Thailand"
Parameters
Indicators
Data & Information Requirements
Units
Remarks
Geographical
Location
Seagrass bed
Central position of areas<10 ha
Lats and longs
Provide location map
GPS boundary or number (min. 4) paired
coordinates for larger areas; end points for
linear strips
Area - extent
Seagrass bed
> 1ha
ha
Large scale map
Physical/chemical
Substrate type
Substrate
Particle size
Micron-cm
Class of seagrass2
class
3 categories
Sediment Quality
Organic matter
Historic & available data
mg/g
Heavy Metals
mg/l, Ąg/l
Nitrate
mg/l, Ąg/l
Exposure
Fetch, current
Typhoons, wind speed, direction, frequency
Km, km/h
Monsoon exposure
Tidal regime
Range; type (diurnal, semi-diurnal, mixed)
m
Depth
Tape measure
m
light
Light meter
ĄE/ m2/sec
Salinity
Distance to freshwater inflow,
GPS
km
hyper salinity
Refractometer
Salinity meter
ppt
Water Quality
Heavy metals, POPs, nutrients,
Historic & available data
mg/l, Ąg/l
Algal blooms
Historic & available data
mg/l
Dredging and
Suspended sediment
Sediment traps
g/ m2/d
reclamation,
Secchi disks
m
2 Seagrass classes are based on substrate type namely: sandy coralline (exposed); muddy (non-exposed); transition (mixed; sandy-muddy).
UNEP/GEF/SCS/RWG-SG.3/3
Annex 7
Page 10
Parameters
Indicators
Data & Information Requirements
Units
Remarks
Biological
Diversity
Seagrass
Number of species
#
Seagrass
Density of each species
g/m2
Penaeids
Number of species
#/ m2
Gastropods
Number of species
#/ m2
Seahorses
Number of species
#/ m2
urchins
Number of species
#/ m2
Siganids
Number of species
#/ m2
holothurians
Number of species
#/ m2
starfish
Number of species
#/ m2
Presence of endangered3 and/or
Provide details of presence or absence
#/ha
threatened species e.g. Dugong,
and abundance where possible.
turtles, seahorses, giant clams
Productivity
seagrass
mg/ g/ d
Associated habitats
Mangrove, coral & assoc. habitats,
Km to nearest associated habitat
estuaries, freshwater
Socio economic
Poverty
Low standard of living
statistics
Income/person/yr
Pop'n pressure
Population size
Density
No.people/km2
Population growth
Growth rate
Increase per
annum
Distance
km of Seagrass bed to centre of nearest
km
coastal centre of population
Fishing damage
Damaged seagrass
Seagrass Density
shoots/m2
biomass
g/ m2
area
m2
Over fishing
Declining resource catch
Resource statistics
cpue
Trampling, gleaning
Seagrass damage
Density shoots/m2
Density of gleaned organisms
# / h
#/ m2
3 Use the IUCN criteria for endangered, threatened, and commercially threatened species.
UNEP/GEF/SCS/RWG-SG.3/3
Annex 7
Page 11
Parameters
Indicators
Data & Information Requirements
Units
Remarks
Management status
managed
Yes or No
Describe management
regime
Transboundary
Shared
Yes or No
Provide map
Biodiversity,
Migratory species or shared stocks Number and kind species
List species
Cross border impacts
Impacts on seagrass
Area of impact
m2 , ha
List species lost
Change is species composition or
nos species nos.
abundance
individuals
Overfishing
Declining catch
cpue
UNEP/GEF/SCS/RWG-SG.3/3
Annex 8
Page 1
ANNEX 8
Schedule of Meetings, Workplan and Timetable for the Seagrass Focal Points, 2003
Table 1
Schedule of meetings for 2003
M T W T F S S M T W T
F
S
S M T
W T
F
S
S
M T
W T
F
S
S
M T
W T
F
S
S
M
January
1
2
3
4
5
6
7
8
9
10
11
12 13
14
15
16
17 18
19
20
21
22 23
24
25
26
27 28
29
30
31
February
1
2
3
4
5
6
7
8
9
10
11
12
13
14 15
16
17
18
19 20
21
22
23
24 25
26
27
28
Chinese N.Y.
March
1
2
3
4
5
6
7
8
9
10
11
12
13
14 15
16
17
18
19 20
21
22
23
24 25
26
27
28
29 30
31
RWG-M-3
RWG-S-3
RWG-W-3
RWG-CR-3
April
1
2
3
4
5
6
7
8
9
10
11
12
13 14
15
16
17
18 19
20
21
22
23 24
25
26
27
28 29
30
RWG-F-3
Thai N.Y.
RWG-LbP-3
May
1
2
3
4
5
6
7
8
9
10
11 12
13
14
15
16 17
18
19
20
21 22
23
24
25
26 27
28
29
30
31
RSTC-3
June
1
2
3
4
5
6
7
8
9
10
11
12
13 14
15
16
17
18 19
20
21
22
23 24
25
26
27
28 29
30
July
1
2
3
4
5
6
7
8
9
10
11
12
13 14
15
16
17
18 19
20
21
22
23 24
25
26
27
28 29
30
31
August
1
2
3
4
5
6
7
8
9
10 11
12
13
14
15 16
17
18
19
20 21
22
23
24
25 26
27
28
29
30 31
RWG-LbP-4
September 1
2
3
4
5
6
7
8
9 10
11
12
13
14 15
16
17
18
19 20
21
22
23
24 25
26
27
28
29 30
RWG-F-4
RWG-S-4
RWG-CR-4
October
1
2
3
4
5
6
7
8
9
10
11
12 13
14
15
16
17 18
19
20
21
22 23
24
25
26
27 28
29
30
31
Cont.
RWG-W-4
RWG-M-4
Ramadan
November
1
2
3
4
5
6
7
8
9
10
11
12
13
14 15
16
17
18
19 20
21
22
23
24 25
26
27
28
29 30
Ramadan
December
1
2
3
4
5
6
7
8
9 10
11
12
13
14 15
16
17
18
19 20
21
22
23
24 25
26
27
28
29 30
31
Regional
RSTC-4
PSC-3
Sci. Mtg
Xmas
UNEP/GEF/SCS/RWG-SG.3/3
Annex 8
Page 2
Table 2
Revised Workplan and Timetable of Agreed National and Regional Activities in the Seagrass Sub-component: 2002-2003.
[1. National Seagrass Committee/Working Group prepare first draft for discussion with stakeholders; 2. National Seagrass Committee/Working Group prepare
second draft for discussion with stakeholders; 3. Initial prioritisation will be conducted at the third RSTC meeting; 4. Final decision on the 3 demonstration sites for
seagrass; 5. First draft of the SAP; 6. Final draft of the SAP; 7. 22-26 September 2003, Fourth Meeting of the RWG-SG, China, exact venue to be decided.]
Year
2002
2003
Quarter
1st
2nd
3rd
4th
1st
2nd
3rd
4th
Month
1
2
3
4
5
6
7
8
9
10
11
12
1
2
3
4
5
6
7
8
9
10
11
12
National Committee meetings
x
x
x
x
x
x
x
x
x
x
x
x
x
x
x
x
x
x
x
x
x
x
x
x
NTWG Meetings
x
1
x
Review National Reports
Review of Regional Database and Respond
NATIONAL ACTIVITIES
1. Review of past and on-going projects
R
F
2. Complete questionnaire on status of data and
information4
R
F
3. Complete questionnaire on metadata
R
4. Review national criteria5
D
5. Review economic valuation criteria
R
6. Review threats at site level
D
F
7. Review national legislation
R
8. Review national level management regimes
R
9. Causal chain analysis list (for threats)6
D
F
10. Identify priority points of intervention
D
F
11. Evaluate barriers to action and possible
solutions
D
F
12. Submit missing data for cluster analysis
F
13. Preparation/revision of the NAP
17
2
REGIONAL ACTIVITIES
14. Regional criteria development
15. Development of Regional Priorities
16. Selection of demonstration sites
3
4
17. Finalisation of the Regional SAP
5
6
18. Regional GIS database tasks:
Step 1
Step 2
Step 3
4th meetings RWG-SG
7
D = draft, R = draft for independent review of the reports, F = finalisation of reports on the basis of the review.
4 Please refer to Annex 7 of the Report of the First Meeting of the RWG-SG for details on the parameters and corresponding requirements for data and information.
5 Criteria for assigning conservation and/or management status and/or zoning and importance given to seagrass meadows in coastal zone management plans.
6 For all seagrass sites that were identified and characterised.
7 Please see caption for notes referring to the numbers 1 to 7.