


`
United Nations
UNEP/GEF South China Sea
Global Environment
Environment Programme
Project
Facility
Reversing Environmental Degradation Trends
in the
South China Sea and Gulf of Thailand
REPORT
Third Meeting of the Regional Working Group for
the Mangrove Sub-component
Bali, Indonesia, 3rd Ł 6th March 2003
__________________________________________________________________________________
UNEP/GEF
Bangkok, March 2003
UNEP/GEF/SCS/RWG-M.3/3
Table of Contents
1.
OPENING OF THE MEETING.............................................................................................. 1
1.1 WELCOME ADDRESS ..................................................................................................... 1
1.2 INTRODUCTION OF MEMBERS .......................................................................................... 1
2.
ORGANISATION OF THE MEETING ................................................................................... 1
2.1 ELECTION OF OFFICERS ................................................................................................ 1
2.2 DOCUMENTS AVAILABLE TO THE MEETING ......................................................................... 2
2.3 ORGANISATION OF WORK ............................................................................................... 2
3.
ADOPTION OF THE MEETING AGENDA ............................................................................ 2
4.
OPENING REMARKS FROM THE FOCAL POINTS FOR MANGROVES FROM EACH
PARTICIPATING COUNTRY ............................................................................................... 2
5.
REPORTS FROM THE PROJECT CO-ORDINATING UNIT (PCU) REGARDING OVERALL
PROGRESS TO DATE........................................................................................................ 4
5.1 STATUS OF END-YEAR PROGRESS REPORTS, EXPENDITURE REPORTS, AND BUDGETS .............. 4
5.2 STATUS OF PLANNED SUBSTANTIVE OUTPUTS FROM THE NATIONAL LEVEL ACTIVITIES ............... 4
6.
REVIEW AND EVALUATION OF COUNTRY REPORTS ...................................................... 5
6.1 PAST AND ON-GOING ACTIVITIES INCLUDING ECONOMIC VALUATION....................................... 5
6.2 REVIEW OF NATIONAL DA TA AND INFORMATION, CREATION OF NATIONAL META-DATABASE
AND NATIONAL INPUTS TO THE REGIONAL GIS DATABASE .................................................... 6
6.3 REVIEW OF NATIONAL LEGISLATION, INSTITUTIONAL AND ADMINISTRATIVE ARRANGEMENTS ....... 7
7.
CHARACTERISATION OF NATIONAL MANGROVE SITES AND THEIR REGIONAL
PRIORITISATION ............................................................................................................... 7
8.
PREPARATION OF SITE SPECIFIC PROPOSALS FOR DEMONSTRATION SITES
INCLUDING THE REVIEW OF THREATS AT SITE LEVEL AND IDENTIFICATION
OF THE PROXIMATE AND ULTIMATE CAUSES OF DEGRADATION ............................... 13
9.
REVISION OF THE WORKPLAN AND ACTIVITIES FOR THE REGIONAL WORKING
GROUP ON MANGROVES ............................................................................................... 14
10. DATE AND PLACE OF THE FOURTH MEETING OF THE REGIONAL WORKING
GROUP ON MANGROVES ............................................................................................... 15
11. ANY OTHER BUSINESS................................................................................................... 15
12. ADOPTION OF THE REPORT OF THE MEETING.............................................................. 15
13. CLOSURE OF THE MEETING ........................................................................................... 16
ii
UNEP/GEF/SCS/RWG-M.3/3
List of Annexes
ANNEX 1
List of Participants
ANNEX 2
List of Documents
ANNEX 3
Agenda
ANNEX 4
Tabulation of Raw and Transformed Data Relating to Identified Mangrove Sites
Bordering the South China Sea and Used in the Preliminary Cluster Analysis
ANNEX 5
Dendrograms Resulting from the Preliminary Cluster Analyses Conducted During
the Third Meeting of the Regional Working Group on Mangroves
ANNEX 6
Ranking Indicators and Weights for Determination of Priority within Clusters of
Potential Demonstration Sites
ANNEX 7
Results of Preliminary Ranking of Mangrove Sites Bordering the South China Sea
ANNEX 8
Schedule of Meetings, Workplan and Timetable for the Mangrove Focal Points,
2003
iii
UNEP/GEF/SCS/RWG-M.3/3
Page 1
Report of the Meeting
1.
OPENING OF THE MEETING
1.1
Welcome address
1.1.1 The Project Director, Dr. John Pernetta, opened the meeting on behalf of Dr. Klaus T÷pfer, the
Executive Director of the United Nations Environment Programme (UNEP) and Dr. Ahmed Djoghlaf,
the Director, Division of Global Environment Facility Co-ordination (UNEP/DGEF).
1.1.2 In his opening address, he reminded participants of the overall project timetable that
necessitated the Project Steering Committee (PSC) making decisions regarding the choice of
demonstration sites at the third meeting, scheduled for December 2003. To meet this timetable the
Regional Working Group on Mangroves (RWG-M) needs to make a number of critical decisions
regarding the nature of the analysis of existing data and information contained in the site
characterisations, in order to arrive at a preliminary ranking of the regional priority of various
mangrove sites. He noted that at the present time not all of the required data and information were
available but noted further that, sufficient site characterisations had been prepared by the Focal
Points to enable a preliminary analysis of priority using the guidelines agreed by the second meetings
of the Regional Scientific and Technical Committee (RSTC) and the Project Steering Committee
convened in Viet Nam in December 2002.
1.1.3 The Project Director noted that this was a critical meeting, since it was at this meeting that the
RWG-M must agreed on the mode of determining priority, in order to ensure that, proper guidance
was provided to the Focal Points and national committees and sub-committees regarding the sites for
which more detailed demonstration site proposals should be prepared between the third and fourth
meetings of the Regional Working Group. He noted also the need to ensure that proposals were
sufficiently well prepared to be suitable for presentation at the Regional Scientific Conference and to
potential donors by the end of the third quarter of 2003. He noted that the task before the Working
Group was substantial but noted further that, the group had successfully achieved a considerable
amount of progress to date. On behalf of the Executive Director and Director of the Division of GEF
Co-ordination, his wished the group every success in their deliberations.
1.2
Introduction of members
1.2.1 Dr. Pernetta noted with regret that neither Dr. Hangqing Fan nor Professor Sanit Aksornkoae
were able to be present for the opening of the meeting but noted that, they would be arriving on 4th
March, he welcomed the Indonesian observers and Dr. Ian Campbell from the Mekong River
Commission and then invited the members and observers to introduce themselves to the meeting. A
list of participants is attached as Annex 1 to this report.
2.
ORGANISATION OF THE MEETING
2.1
Election of Officers
2.1.1 Dr. Pernetta reminded members that the Rules of Procedure adopted by the RWG-M at their
first meeting state that, the Regional Working Group shall elect, from amongst the members, a
Chairperson, Vice-Chairperson and Rapporteur to serve for one year. The rules state further that,
officers shall be eligible for re-election no more than once. He noted that, Dr. Sonjai Havanond
(Thailand), Dr. Hangqing Fan (China), and Mr. Florendo Barangan (Philippines) who had served, as
Chairperson, Vice-Chairperson, and Rapporteur during 2002 were therefore eligible for re-election.
2.1.2 Members were invited to nominate members as Chairperson, Vice-Chairperson, and
Rapporteur for 2003. Following extensive discussion regarding the merits of electing new members and
retaining the serving officers in the interest of continuity, the meeting re-elected Dr. Sonjai Havanond,
Dr. Hangqing Fan and Mr. Florendo Barangan as Chairperson, Vice-Chairperson and Rapporteur,
respectively.
UNEP/GEF/SCS/RWG-M.3/3
Page 2
2.1.3 The elected Officers assumed their responsibilities for the subsequent conduct of the
meeting.
2.2
Documents available to the meeting
2.2.1 The Project Director introduced the documentation that had been prepared in advance of the
meeting and outlined the documents available to participants in both hard copy and on CD-ROM, which
had been up-loaded to the project website in advance of the meeting. He noted that numerous
documents had been provided to the Project Co-ordinating Unit (PCU) at the commencement of the
meeting for consideration of members, copies of which were distributed, together with an amended list
of the documents for consideration, and discussion during the meeting. The final list of documents is
attached as Annex 2 to this report.
2.3
Organisation of work
2.3.1 The Chairperson invited the Project Director to brief participants on the administrative
arrangements for the conduct of the meeting, and the proposed organisation of work contained in
document UNEP/GEF/SCS/RWG-M.3/INF.3. The Project Director noted that the meeting would be
conducted in English and that formal sessions would be conducted in plenary although it was
envisaged that, sessional working groups would need to be convened to complete the various reviews
and analyses required in order to complete the business outlined under agenda item 7.
2.3.2 The Project Director noted that, following the request of members of the regional working
groups for greater interaction between the components at the regional level a joint session between
the RWG-M and the regional Working Group on Wetlands (RWG-W) would be convened on
Wednesday morning.
3.
ADOPTION OF THE MEETING AGENDA
3.1
The Chairperson then invited members to consider the provisional agenda prepared by the
PCU as document UNEP/GEF/SCS/RWG-M.3/1, and to propose any amendments or additional items
for consideration.
3.2
Dr. Hoang Tri sought clarification regarding arrangements for the field trip and Mr. Santoso
advised that a visit to the JICA mangrove project site was planned for March 6th, the final day of the
meeting.
3.3
There being no proposals for amendment or addition, the draft agenda was adopted and is
attached as Annex 3 to this report.
4.
OPENING REMARKS FROM THE FOCAL POINTS FOR MANGROVES FROM EACH
PARTICIPATING COUNTRY
4.1
The Chairperson invited the focal points from the Specialised Executing Agencies (SEAs) to
provide a short overview of their work, and progress subsequent to the second meeting of the RWG-
M and to highlight the contents of any additional documentation tabled at the meeting.
4.2
Dr. Sonjai advised that there had been some administrative delays in execution of planned
activities in Thailand, due to restructuring of the Government Departments responsible for mangroves
that had resulted in difficulties in accessing and spending the GEF grant funds. He noted however
that, Thailand would do its utmost to meet the agreed schedule and that although some administrative
problems had been encountered, progress had been substantial since the last meeting. He noted that
in Thailand 9 sites are currently under consideration and that this number was likely to increase. He
also stated that many mangrove areas under consideration are adjacent to seagrass and coral reef
areas, and that discussions will take place with the other National Committees on selecting sites that
incorporate more than one habitat type, hence promoting synergy and co-operation between a wider
range of institutions and organisations in the country.
UNEP/GEF/SCS/RWG-M.3/3
Page 3
4.3
Mr. Santoso noted that, in Indonesia overall responsibility for mangroves comes under the
joint responsibility of the Forestry Department, and the Department of Fisheries, which is responsible
for activities in mangrove areas, such as fish and shrimp farming. He noted that as the national
mangrove focal point, he had facilitated co-operation between the Institute of Mangrove Research &
Development, the Forestry Department, and JICA in order to revise mangrove management within the
country.
4.4
Mr. Santoso then provided background information on some of the potential demonstration
sites and noted that these proposals had been developed as partnerships with private sector donors
for mangrove rehabilitation; and with community based management groups concerned with
mangroves in West Kalimantan. He noted that, sand mining in Riau Island and illegal cutting of
mangroves are two major issues that need attention, whilst in the case of Rambut Island the important
population of migratory water birds associated with mangroves, was a key focus for the proposed
demonstration activities. He referred participants to the reports from Indonesia that were tabled at the
meeting, and which contained more detailed information.
4.5
Dr. Sukristijono Sukardjo provided some key information regarding the distinction between the
government classification of state, and non-state forest areas in Indonesia. He noted that through the
National Mangrove Committee attempts were being made to resolve the conflicts that can arise
between the management policies applicable in the two types of designated forest areas. He also
provided information on the efforts made to raise the awareness of stakeholders regarding the
benefits of mangroves to the local community.
4.6
In reply to a question from Dr. Hoang Tri, Mr. Santoso elaborated on the impacts resulting
from different ownership regimes of state and non-state forest, noting that state forests were under
the jurisdiction of the Department of Forestry, while non-state forests were under variable regimes of
local government and Department of Fisheries control. He noted that the status of particular areas
could be changed and that on occasion state forest could be converted to non-state forest.
4.7
Dr. Do Dinh Sam gave a brief summary of the activities of the Vietnamese National Mangrove
Committee that had elaborated 14 site characterisations. He noted that in 2003, the Ministry of
Natural resources and Environment will organise a policy workshop concerning mangrove forest
management and that the World Bank Project is also working on Policy and management of
mangrove forests. Problems include land use change, including clearance for shrimp farms in the
Mekong River Delta, and in areas of North Viet Nam.
4.8
Mr. Ke Vongwattana gave a brief summary of progress in Cambodia where four meetings had
been convened since the last RWG meeting. During these national meetings consideration had been
given to the types of data required for site characterisation, and reports prepared for the SCS project
had been reviewed prior to submission to the PCU. He noted that the national mangrove and
wetlands sub-committee had selected 3 sites for characterisation as potential demonstration sites.
4.9
During discussion the Project Director noted that the 3 sites for Cambodia had been
characterised in a single document, making it difficult to incorporate the information into a regional
level analysis.
4.10
Mr. Florendo Barangan reviewed progress by the Philippines National Mangrove Committee
and noted that illegal conversion of mangrove to shrimp farms continues, in spite of legislation
banning such destructive practices. Illegal cutting of mangroves is a continuing problem, especially in
southern Palawan, partly due to the fact that this area is difficult to police, and in spite of the fact that
the whole of Palawan is designated as a biosphere reserve. Foreshore development also contributes
to mangrove destruction. He noted that other than Palawan, Mindanao is the area in the Philippines
with significant mangrove stands.
4.11
Mangrove reforestation, with assistance from the ADB, has been continuing throughout the
1990s and involves promoting community-based management. Mr. Barangan noted that conflicts of
interest sometimes arise between national and local governments. He noted further that, the
UNEP/GEF/SCS/RWG-M.3/3
Page 4
government is also promoting planting of mangroves, even in small areas, in the hope that this will
help preserve mangrove and that utilisation of mangroves for fuel wood by local communities has
been minimised, due to the use of other cooking fuels, and the promotion of planting of alternative fuel
woods.
5.
REPORTS FROM THE PROJECT CO-ORDINATING UNIT (PCU) REGARDING OVERALL
PROGRESS TO DATE
5.1
Status of end-year progress reports, expenditure reports, and budgets
5.1.1 The chairperson invited the Project Director to introduce document UNEP/GEF/SCS/RWG-
M.3/4, which provides a summary of the current status of budgets and reports from the Specialised
Executing Agencies in the participating countries. The dates of receipt of the 6 monthly progress
reports, expenditure reports, and cash advance requests from each Focal Point are detailed in Table
1 of this document and the Project Director highlighted the difficulties encountered by the PCU
consequent upon the failure of the Focal Points to meet agreed timelines and submission dates. He
noted that where submission of reports was delayed then their receipt overlapped with the preparation
of the Regional Working Group meetings and the PCU was unable to devote sufficient time to
responding and finalising the reports and authorising subsequent cash advances.
5.1.2 Dr. Pernetta noted that, the GEF Secretariat and UNEP were interested in monitoring
progress in project execution and that a simple, if crude estimate of progress was to calculate a dollar
cost per page of output. He noted that this figure was extremely simplistic but nevertheless provided a
simple guide to the productivity of individual SEAs. He noted further that all participants should be
concerned, not merely about the quantity but also about the quality of the outputs and that
consequently the Project Steering Committee had agreed that the PCU should initiate a process of
independent evaluation of the outputs. He drew the attention of the members to the procedures
agreed by the Project Steering Committee and contained in the document, UNEP/GEF/SCS/RWG-
M.3/4.
5.1.3 Following some discussion of the contents of this report it was agreed that any difficulties
concerning the outstanding 6 month reports should be discussed and resolved during the course of
the meeting, using time available outside the formal sessions. It was agreed that finalisation of the
outstanding matters must be resolved such that, all individuals were clear regarding their
responsibilities prior to the closure of the meeting.
5.1.4 In reply to a question from Dr. Sukardjo, Dr. Pernetta explained the difference between the
substantive and administrative progress reports, noting that the primary business of the meeting was
to discuss and agree on substantive matters. He explained that the administrative reports should be
discussed and any difficulties resolved through bilateral discussions rather than in the plenary
sessions since these were obligations of the Specialised Executing Agencies (SEAs) consequent
upon the signature of the individual memoranda of understanding, which had been signed between
UNEP and the individual SEAs.
5.2
Status of planned substantive outputs from the national level activities
5.2.1 It was noted that Annex 8 of the first meeting report (UNEP/GEF/SCS/RWG-M.1/3) and Annex
8 of the second meeting report (UNEP/GEF/SCS/RWG-M.2/3) provided specific dates by which outputs
were to have been produced by the individual Focal Points in advance of the second and third meetings:
These dates were as follows:
1.
Review of past & ongoing activities:
1st draft June; final draft September 2002
2.
Review of national data and information: Final draft September 2002
3.
Identification & characterisation of "sites" 1st draft September, Final December
The second meeting agreed that first drafts would be produced by November and the
second set by end of January 2003
UNEP/GEF/SCS/RWG-M.3/3
Page 5
4.
Review National legislation
1st draft September, Final December 2002
The second meeting agreed to defer the first draft to November, the second to
January, and the final document for publication by end March, 2003
5.2.2 The Project Director noted that, documentation received by the PCU from the Focal Points by
the time of this meeting and detailed in the appendix to document UNEP/GEF/SCS/RWG-M.3/INF.2 did
not fully cover these anticipated outputs, and that the delivery of substantial documents on the first day
of the meeting did not permit adequate evaluation and consideration of their contents during the
meeting. He noted further that, the United Nations internal auditors and the monitoring and evaluation
units of both UNEP and the GEF Secretariat might raise serious questions concerning the execution of
the project if further additional postponements of outputs were proposed by this meeting of the Regional
Working Group.
5.2.3 The Project Director noted that, this issue had been considered by the Project Steering
Committee which had decided that: the SEAs should submit their mandatory 6 month progress
reports within ten working days of the due date and that the PCU would respond substantively within
ten working days of receipt; that a process of independent peer review of substantive reports should
be initiated by the PCU immediately. It was noted that the Project Steering Committee had agreed to
the establishment of two Regional Task Forces, one for legal matters and one covering issues relating
to economic evaluation of coastal resources and that the specific terms of reference for the legal task
force had been approved by the PSC and were contained in Annex 4 of the report of the second
meeting. He noted further that the specific outputs relating to economic evaluation and legal matters
would be referred to these two groups who would provide assistance to the Focal Points in each
country.
6.
REVIEW AND EVALUATION OF COUNTRY REPORTS
6.1
Past and on-going activities including economic valuation
6.1.1 The Chairperson invited the focal points from the SEAs to provide a short overview of the
status of their reports following which discussion and comments from the floor would be considered
prior to deciding on the next steps required to finalise the reports. Appendix 1 of Annex 2 lists the
reports available to the meeting, and individual members elaborated on the status of these reports
during their brief presentations.
6.1.2 Mr. Santoso, outlined the status of the Indonesian reports indicating that although not
comprehensive, the report on past and on-going activities was fairly comprehensive and makes
specific reference to the economic valuation studies some of which were ongoing. Dr. Hoang Tri
referred to a report by J. Ruitenbeek (1992)1 on economic evaluation of mangroves in Indonesia and
queried why this was not referred to in the report. In reply Mr. Santoso noted that this work
encompassed areas of Indonesia that are not adjacent to the South China Sea, although these could
still be a useful reference for the work of the national committee.
6.1.3 Dr. Sam noted that in Viet Nam there was insufficient data to conduct a fully comprehensive
economic evaluation for all 14 potential demonstration sites, and that a major difficulty lay in
determining Total Environmental Value. Despite this, comprehensive information on economic values
had been assembled for ten sites and the review of past and ongoing activities was as
comprehensive as could reasonably be expected at this time. Several participants noted similar
problems in preparing their reviews of past and ongoing activities and economic evaluations.
6.1.4 Following individual presentations by the focal points from each country, the Project Director
noted that very few of the reviews of past and ongoing activities had been prepared in the agreed
format contained in Annex 5 of the report of the second meeting of the RWG-M. He also noted that,
this had been envisaged as a preparatory activity to be completed in draft by June 2002 and that the
1 Ruitenebeek, J. 1992. Mangrove Management: An Economic Analysis of Management Options with a focus on Bintuni
Bay, Irian Jaya. Environmental Management Devel opment in Indonesia Project (EMDI).
UNEP/GEF/SCS/RWG-M.3/3
Page 6
second RWG-M meeting had agreed to postpone submission but that even the second set of agreed
deadlines had now already passed. He noted that the RSTC and PSC during their meetings in
December had agreed that these preparatory reports should be finalised in the first quarter of 2003.
6.1.5 The Chairman invited the Regional Working Group to consider, discuss and decide on the
finalisation and future use of these reports. During discussion it was noted that a considerable amount
of information had been assembled but that, what was needed was a consolidated effort on the part of
the SEAs to finalise these reports, using perhaps the services of research assistants and that
individual focal points should seriously consider revising their budget allocations accordingly.
6.1.6 In response to a suggestion from Dr. Tri that regional expertise be utilised to assist in the
finalisation of these and other reviews Dr. Pernetta informed the meeting that, the PSC had agreed to
such an approach in the case of the economic valuation and legal reviews but that the remaining
tasks most properly fell within the purview of the SEAs. Dr. Pernetta noted further that, part of the
purpose of these preparatory activities was to build a regional knowledge base that could be
presented in the form of a decision making tool to the Project Steering Committee, and that this
objective had not changed.
6.1.7 In response to a comment from Dr. Sam on the scope of activities under the budget allocation
for the first two years of the project, Dr. Pernetta agreed that it was the original intention that the main
national activities during this initial phase consisted of collecting existing information, and for
convening of meetings. The money was not intended for fieldwork or new surveys however, it was
agreed that where absolutely necessary, some primary data could be collected using some of the
funds.
6.1.8 Dr. Gong, referring to the limited time, asked whether it would be acceptable to compromise
to some extent on the comprehensiveness of the coverage of data for past and ongoing activities, and
allow countries to complete their reports with the data collected to date on the understanding that
more data could be added subsequently. It was agreed that the purpose of the review was not to be
one hundred percent comprehensive and that individual SEAs were to use their best judgement in
deciding on the cut-off, in terms of the returns, consequent upon further additional investment of time
and resources.
6.1.9 In response to a question from Dr. Sonjai on how demonstration sites were ranked in Viet
Nam, Dr. Sam gave some background on the process used by the national committee and Mr.
Santoso then elaborated on the process used in Indonesia. Dr. Pernetta said that countries could rank
sites using any criteria they wished since national ranking and priority became only one criterion of
many in determining the regional priority.
6.1.10 The meeting concluded that the end of March was the absolute deadline for finalisation of the
review of past and ongoing activities and that the PCU would then send the draft documents received
to date for independent review. The review would be completed by the end of March and despatched
to the focal points, so that comments could be considered by the SEAs in preparing their final reports
by the end of August. In finalising these reviews Focal Points were urged to pay particular attention to
the review of on-going projects, since this information would be critical in identifying potential sources
of co-financing for the SCS demonstration activities. He further stated that information collected
should be for the country in general, and not restricted to the potential demonstration sites.
6.2
Review of national data and information, creation of national meta-database and
national inputs to the regional GIS database
6.2.1 The focal points were invited by the Chairperson to provide short overviews of their reports
and the status of the national meta-databases. It was noted that following the identification of
inaccuracies in the GIS questionnaire during the second meeting of the RWG-M Dr. Anond of SEA
START RC had reviewed the questionnaires and identified only a single discrepancy between the
questionnaire and the tabulation of data and information requirements made by the first RWG-M
meeting. It was further noted that Dr. Fan had already completed the questionnaire for five sites in
China, and that there was no reason why other countries could not do the same.
UNEP/GEF/SCS/RWG-M.3/3
Page 7
6.2.2 There followed a general discussion on the availability of maps of mangrove distribution and
the need for a regional map of mangrove habitat distribution. It was agreed that any, and all, available
maps of mangrove habitat distribution were acceptable, and that individual species distribution maps
could be prepared on the basis of specific site characterisations if they were completed in the agreed
format.
6.2.3 Mr. Yihang Jiang informed the meeting that a CD ROM distributed at the GIS workshop last
year included a map of mangrove distribution for the region and that at the very least focal points
could review the reliability and accuracy of the information contained in these maps.
6.2.4 It was agreed that the original deadline for receipt of the maps from all Focal Points was well
past, and that such maps would be submitted as soon as possible.
6.3
Review of national legislation, institutional and administrative arrangements
6.3.1 It was noted that reviews of national legislation had been prepared by most focal points and
that these reviews would be finalised as inputs to the first meeting of the Regional Task Force on
legal matters which was to be convened in May 2003.
7.
CHARACTERISATION OF NATIONAL MANGROVE SITES AND THEIR REGIONAL
PRIORITISATION
7.1
The Project Director was invited by the Chairperson to introduce documents
UNEP/GEF/SCS/RSTC.2/10/Amend.1 & UNEP/GEF/SCS/RSTC.2/8, which had been presented to,
discussed and agreed by, the second meetings of the Regional Scientific and Technical Committee
and the Project Steering Committee in December 2002. He introduced the principles and procedures
agreed and approved by the RSTC and PSC concerning the nature of proposed demonstration sites,
and the procedures to be used in clustering and ranking potential demonstration sites.
7.2
During these presentations it was noted that the development of full proposals for
demonstration sites will involve considerable effort and it is unlikely that proposals can be properly
developed for more than three to five sites in each country. It was therefore critical that this meeting
conduct a preliminary cluster analysis and ranking of sites in order to provide guidance to the
individual focal points concerning regional priorities for demonstration sites, which should be subject
to the preparation of specific proposals.
7.3
In reply to a question from Dr. Sam, the Project Director stated that in his view it would be
best to have demonstration activities that addressed the basic causes of biodiversity loss, rather than
focussing on "preservation" or conservation of biodiversity per se. He noted however, that there
existed no prior decision regarding the nature of the demonstration sites to be funded and that the
RWG-M would be responsible for developing the criteria and ranking procedures for mangrove
demonstration sites. He drew the attention of members to the guidance on the nature of potential
demonstration sites contained in document UNEP/GEF/SCS/PSC.2/10 Amend.1 that had been
presented to, and approved by, the Project Steering Committee.
7.4
There followed a general discussion regarding the various advantages of the protected area
approach to maintaining biodiversity compared with an approach that focussed on sustainable use. It
was suggested that whilst protected areas could be important as refugia for biodiversity and as the
core of any system of sustainable use, management activities focussed purely on such an approach
were unlikely to achieve the overall objectives of the project in this region given the existing use levels
and pressures on coastal and marine resources.
7.5
Following a presentation on the proposed cluster analysis approach and the actions required
to attempt a preliminary analysis of similarity it was agreed that the members would tabulate the data
and information regarding each site for input to an analysis during the following mornings session. It
was noted that various decisions would need to be made regarding the nature of the data to be
included in the analyses and the implied weightings that would be accepted by the group.
UNEP/GEF/SCS/RWG-M.3/3
Page 8
7.6
Following resumption of the session, the tabulated data prepared overnight were consolidated
into a single table for further review and analysis. Included in this initial consideration were data for 7
sites from Thailand; 14 sites from Viet Nam; five sites from China, three sites from Cambodia; four
sites from the Philippines and data from 13 Indonesian Provinces bordering the South China Sea.
These raw data are presented in Table 1 of Annex 4.
7.7
An initial review of the data revealed that no data were provided for the change in area of
mangrove at any site. During the ensuing discussion it became apparent that such data were not
easily obtained at the site level but statistics on mangrove forest area were available at larger
geographic scales such as the Province in Indonesia, Thailand and Viet Nam. It was agreed that
where such data were available then these figures would be included in the site descriptions, together
with an explanatory note regarding the scale at which the data had been collected. It was further
agreed that such data should reflect single trends rather than being an average of opposite trends
such as a period of reduction in area followed by extension of mangrove cover as a consequence of
replanting or natural regeneration of abandoned shrimp farm areas. Rates were to be expressed in
terms of average annual loss (or gain) in area over a specified period of time.
7.8
A consideration of the figures for area resulted in an initial discussion of exactly what the data
encompassed, and it was noted that in the case of Thailand, Indonesia and Viet Nam figures
represented vegetation cover only and not areas of shrimp ponds or natural open waters since they
had been derived from interpretation of satellite images. It was agreed that where possible the figures
for area used in the analysis would reflect actual areas of mangrove vegetation rather than the total
areas inclusive of open water and cleared vegetation.
7.9
During discussion of the areas of mangrove, certain anomalies were noted in the data with
figures being unrealistically high in some instances. It was noted that such data needed to be checked
for accuracy and that it could not be included in the analysis at the present time since it would
introduce an unrealistic bias into the cluster analysis. It was further noted that the Indonesian data
had been aggregated by Province, rather than being assembled by site, and consequently it was
agreed to conduct an independent cluster analysis of these data noting that the Indonesian site data
would need to be assembled and included in the analysis at a subsequent date.
7.10
In examining the data concerning the numbers of zones present at each site it was noted that
such data had not been assembled for a large number of sites. During discussion it became apparent
that zones were not easily identified in some of the more extensive areas of mangrove in Indonesia
for example, where associations or communities of species were more easily recognised and these
did not follow a recognisable transition from the seaward to landward side of the land-ocean
transition. It was agreed that the definition of this indicator should be extended to include the number
of different recognisable plant communities or associations identified at a particular site.
7.11
A question was raised regarding the high number of zones apparently recognised in the
Vietnamese sites and during discussion it became apparent that these data were not comparable to
the others since they reflected the biogeographic zones defined in Viet Nam rather than the within site
zonation characteristic of the transition within mangrove stands from seaward to landward margin.
7.12
Comparison of the numbers of tree species recorded at different sites revealed that the
figures for Cambodia were unreasonably high being greater than 50 mangrove tree species.
Clarification was provided that these figures included both true and associate mangrove species and
it was agreed that the figures, which should be reported should be the number of true mangrove
species only, as listed in Annex 6 of the report of the second meeting of the RWG-M.
7.13
In discussion of the figures for tree density it became apparent that the definition of "tree"
differed in the different data sets. In the case of Thailand, "trees" were defined in terms of anything
greater than 1.5 metres in height whereas in the case of Indonesia, seedlings, saplings and trees
were distinguished on the basis of girth, with seedlings being less than 5cm, saplings being between
5 and 10 cms and trees being greater than 10 cms in girth. An extensive discussion of what criterion
should be used to define "trees" resulted in a general consensus that height should be the
determining factor with 1.5 m being the cut-off for defining "trees" for the purpose of this indicator.
UNEP/GEF/SCS/RWG-M.3/3
Page 9
7.14
The data regarding animal species and genera were then reviewed and it was agreed that
since the numbers of species rather than genera had been recorded for most sites, and given that
within a single taxon such as crustacea or bivalve molluscs, genera and species numbers would be
closely correlated, only the numbers of species would be used in the cluster analysis.
7.15
Following a review of the revised table of data, the Regional Working Group made some
estimations for missing data values in order to extend the sites and parameters used in the initial
analysis. The final, set of data used in the initial cluster analysis, are presented in Table 2 of Annex 4.
There followed preparation of a series of clusters with the group discussing the outcomes of each
analysis in turn. These analyses involved consideration of a number of technical matters and
alternative forms of analysis including:
(i)
Log transformation of some parameters where the arithmetic values were orders of
magnitude greater than others (area of mangroves and tree density, for example);
(ii)
Log transformation of all parameters;
(iii)
1/100 transformation of the present area;
(iv)
1/1000 transformation of present area; and
(v)
Removal of the parameter of "abundance of migratory birds".
7.16
The results of these analyses were presented to the meeting and examined by the members;
they are included in Annex 5. Following extensive discussion it was agreed that the cluster analysis
resulting from log transformation of the mangrove area and tree density, resulted in the most
appropriate dendrogram based on the expert opinion of the group concerning their views of similarity
and difference between the sites under consideration. The resulting dendrogram is attached as Figure
3 in Annex 5.
7.17
As noted during the initial consideration of the raw data, the data from Indonesia had been
aggregated on the basis of Province making it difficult to include them in a cluster analysis involving
sites from the other participating countries. In order to provide some preliminary guidance to the
Indonesian National Committee regarding site characterisation and ranking, a cluster analysis of the
13 Indonesian Provinces was conducted independently and the resulting dendrogram is presented in
Figure 4 of Annex 5.
7.18
Following this extensive and detailed review the meeting agreed that the method and
procedure, approved by the Regional Scientific and Technical Committee, were scientifically sound
and useful as the initial step in the process of site prioritisation and ranking. After careful
consideration of the results of these analyses, the Regional Working Group agreed to continue the
analysis with improved data and information. It was also agreed that, the presence or absence of
mangrove tree genera should be included in the data set to be used for the final cluster analysis,
since this would provide a stronger reflection of similarities based on the biological diversity of the
mangrove habitats within the region. It was suggested that the PCU should purchase the computer
software package, needed to enable inclusion of non-metric data in the matrix, based on Gower's
Index of Similarity rather than continuing to use the SPSS software, which allowed only the entry of
metric data and did not provide a mechanism for computing missing data.
7.19
The meeting then initiated discussion of the indicators and weighting that should be used for
ranking individual mangrove sites within the same cluster. The Chairperson invited Dr. Sam, Focal
Point for Mangroves from Viet Nam to give a presentation on the criteria and weighting used in the
prioritisation of mangrove sites in Viet Nam, as a starting point for discussion of the regional criteria.
7.20
Dr. Sam presented the national criteria, including the indicators and associated scoring
system that had been developed and used at the national level in Viet Nam. The meeting expressed
its appreciation to Dr. Sam for his contribution, and proceeded to discuss the criteria and indicators in
detail. Initial discussion focused on the indicators and criteria, identified and agreed by the Regional
Working Group at its first meeting on which the data and information needs for site characterisation
had been agreed and the GIS questionnaire prepared.
UNEP/GEF/SCS/RWG-M.3/3
Page 10
Special Joint Session of the Regional Working Groups on Mangroves and Wetlands
7.21
On the morning of 5th March a joint session between the Regional Working Groups for
wetlands and mangroves was convened. The Project Director opened the special joint session, and
said that this session had been convened at the request of several members of the regional working
groups who felt there was a need for greater communication between the working groups at the regional
level. He noted that the programme for the session was flexible and that the purpose was to share
experiences between the two groups and to perhaps discuss the overlap in coverage of site
characterisations at the national level.
7.22
Dr. Pernetta noted that as this was a joint session, and some members of each of the working
groups might not be known to each other. He therefore invited the participants to introduce themselves,
and there followed a "tour de table" in which all participants briefly outlined their experience and
involvement in the project.
7.23
Following this, Dr. Pernetta invited the Chairs of the two regional working groups to co-chair the
session and opened the floor for any suggestions or proposals that members felt required joint
discussion, noting that he felt it would be useful for the group to hear an overview of the experiences of
the mangrove working group with the application of the cluster analysis. It was agreed that any issues
would be dealt with, if and when, they arose.
7.24
Dr. Pernetta then invited, Dr. Gong to present an overview of the results of the exercise
conducted by the mangrove group in undertaking the cluster analysis and developing the criteria that
could be used for the ranking of sites within clusters. The limitation of parameters that, could be used,
was set by, those sites with the least available sets of data and ultimately seven parameters were
identified and used in the initial set of cluster analyses. It was noted by the group however that seven
was not sufficient for the purpose or developing final clusters, and attempts should be made to expand
the number of parameters used including presence or absence data for genera of true mangrove trees.
7.25
The mangrove group felt that it was important to give more weight to the trees, by including the
genera (presence or absence) in the final table although this had not been done at this time. Mr. Jiang
noted that the cluster analysis had also used only data from only 5 countries, as Indonesia had collated
their data by Province rather than by site. Dr. Pernetta noted that the purpose of conducting the initial
cluster analysis was to assist in the process of selection of sites by grouping similar sites that would be
ranked within the finally identified clusters.
7.26
Dr. Tri highlighted the importance of being careful in collecting and entering data in order to
ensure that anomalous results did not result from inaccurate data collection or entry.
7.27
During discussion, the issue of whether the assumption that large size would automatically
mean higher biodiversity, was a reflection of reality. It was noted that this is not always the case, as
some extensive mangrove areas could be close to monoculture systems for example. It was also noted
that, high biodiversity was not necessarily the sole reason for selecting demonstration sites, but sites
could also be selected to demonstrate effective management regimes in low diversity areas. It was also
noted that the cluster analysis was merely the first of three steps in making recommendations for the
choice of demonstration sites.
7.28
Dr. Gong then presented the results of the work of the RWG-M in addressing the second step,
of the process in which the indicators, criteria and weights were to be discussed and decided. She noted
that the starting point for the work of the group had been the Vietnamese national criteria presented by
Dr. Do Dinh Sam.
7.29
A question was raised regarding how the missing data sets were to be addressed in
determining an overall rank for a particular site since there are likely to be a high number of these. Dr.
Gong indicated that this issue had not yet been discussed but would need to be considered by the group
as the tabulation was developed.
UNEP/GEF/SCS/RWG-M.3/3
Page 11
7.30
Dr. Sonjai commented that certain key characters of international importance were not covered
by the parameters used for site characterisation and ranking, and cited the example of the work done
with Japanese and Thai scientists, which indicates that mangroves are better for carbon sequestration
than terrestrial forests. Dr. Pernetta alerted the meeting to the fact that there are a number of venture
capital companies investing in reforestation, on the basis of agreements with the governments, which
gave the companies vested rights in the carbon credits. He noted that such considerations might be
added to the criteria and that private capital might be a possible source of future co-financing restoration
activities.
7.31
Mr. Santoso raised an important question regarding the boundaries of areas designated as
demonstration sites, using as an example Rambut Island, which is a very extensive breeding site for
many bird species which feed in areas quite a long distance from the Island. It was noted that in this
example merely protecting the breeding ground, would be completely ineffective if the feeding grounds
were destroyed, hence management interventions on the island alone would be ineffective. It was vital
therefore that the objectives need to be considered carefully in establishing each demonstration site. In
this example, one would need to manage both the breeding and roosting site (Rambut Island), and the
feeding grounds. This should be addressed in the proposals for demonstration sites, which should be
integrated where required.
7.32
Dr. Fan stated that, there must be a consideration of the types of species present, and not just
the number of species. For example, there are sub-tropical mangroves that do not exist in tropical areas
and these were characterised by different communities of species.
7.33
Dr. Pernetta asked whether the members of the wetlands group had any comments or
observations, which they wished to make on the work of the mangrove group and the value of the
cluster analysis. He noted that perhaps the combined session might wish to discuss how one might
rank sites, which encompassed more than one habitat type in a single demonstration proposal. There
followed a discussion of the relationships between the mangrove and wetland ecosystems, as defined
under the project.
7.34
During the discussion Dr. Sonjai noted that it was very difficult to separate a mangrove
demonstration site from the adjacent mudflats, estuaries and swamp forests and it was generally
agreed that the demonstration sites should encompass all "habitat" types within the defined area of
the demonstration site. This problem was further elaborated in diagrammatic form and it was
suggested that each group might wish to include a criterion reflecting the number of habitat types in
each demonstration site with higher scores going to multiple habitat sites. Dr. Pernetta noted that,
where the same physical location had been considered by the national focal points then, these data
should be ranked independently by the regional working groups but that, at a national level some co-
ordination would be necessary particularly if such a location was identified as a priority for the
development of a demonstration site proposal. It was also agreed that not all sites chosen should be
multiple habitat sites but that this should be used as one criterion to be added to the overall ranking.
7.35
Dr. Gong reminded participants that different demonstrations would have different purposes
but that the overall goal was to select demonstration sites at which it was possible to demonstrate
reversal of environmental degradation trends. In this connection Dr. Pernetta noted that it was
important to not consider demonstration sites as individual sites, but as components of an integrated
framework of demonstration activities that would serve to raise awareness of the problems and
potential solutions at all levels and amongst all stakeholders having interests in the South China Sea.
7.36
Dr. Fan emphasised the importance of the demonstration sites in successful outreach,
coordination and dissemination of lessons that, can be transferred to the rest of the country and to the
region as a whole.
7.37
Dr. Ian Campbell noted that the discussion had shown the importance of the review of past
and ongoing projects, as this review will be extremely useful for information transfer, identifying
potential lessons learned, and hence in deciding on the types of existing demonstration sites that
could be included in the regional framework.
UNEP/GEF/SCS/RWG-M.3/3
Page 12
7.38
Dr. Sanit suggested that one might decide to allocate demonstration sites on the basis of for
example; one integrated site, one isolated mangrove ecosystem, and one other type to make up the
three selected.
7.39
Dr. Mai asked about the mechanism for national coordination in demonstration site selection
between the components. Dr. Pernetta indicated that initially this is the responsibility of the NTWG in
each country and that it was at that level that the consideration of relative importance of
demonstration activities in each component should be decided.
7.40
Ms. Mendoza, Co-Chair, concluded the session with a request for closer collaboration with
the mangrove group in the selection of demonstration sites during the course of this year.
Resumption of the Third Meeting of the Regional Working Group on Mangroves
7.41
The resumed session opened in the afternoon with a consideration of the initial draft tables
prepared during the preceding day and based on the work of the Vietnamese national mangrove
committee. Initial discussion identified the fact that the categories and classes of criteria were in fact
too detailed and too prescriptive to be easily completed, hence their value as a tool in ranking the
priority of sites within clusters was open to question. It was agreed that simplicity was required both to
ensure completeness of the data and that sufficient sites were clustered and ranked.
7.42
It was agreed that initially the four major clusters of indicators concerned with biological
diversity would be considered, discussed and agreed upon, prior to turning to a consideration of some
of the more subjective parameters such as extent of co-financing or stakeholder involvement in plan
preparation. The four initial groups or classes of criteria were area, biological diversity, transboundary
significance and regional/global significance. The group considered the elements originally tabulated
during the first meeting of the RWG-M, the tabulation produced by Viet Nam and agreed that these
four elements were adequate but that they contained too much detail.
7.43
An extensive discussion ensued during which the relative importance of these four classes of
criteria were examined and debated. It was agreed that biological diversity should be considered the
most important class followed by area and transboundary significance with regional and global
significance being the least important class. Part of the basis for this decision was the weight which
the experts considered should be given to these classes and part, to the availability and reliability of
data used as indicators in each class.
7.44
Following assignment of overall values of: Area, 35; Biological Diversity 50; Transboundary
significance, 10; and regional/global significance 5, the relative weights that should be assigned to the
sub-components in each class followed, thus it was agreed for example that greater weight should be
assigned to species diversity than to community level diversity and that no indicator of genetic
diversity should be included since the data available were sparse and patchy. On the basis of
discussion 30 points were assigned to species diversity and 20 to community diversity. Similar
discussion and weighting of the "quantifiable" indicators resulted in the assignments presented in
Annex 6.
7.45
During the discussion of the second major grouping of characters which, include various
subjective and anthropocentric indicators such as "stakeholder involvement" and national significance
it was recognised that, not all of these parameters could be objectively quantified hence simple
classes to indicate low, medium or high were included for a number of these indicators. Weights were
again assigned on the basis of a total potential score for these indicators of 100.
7.46
Following agreement on the ranking procedures and weight each focal point was requested
to score their sites overnight for review and discussion during the following session, the results of this
work are presented in Annex 7.
7.47
Analysis of the results presented in Annex 7 highlighted a number of key issues, the first of
which is the difficulty of assigning "priority" which distinguished between the individual sites from each
country. Similar difficulties were encountered with a number of the indicators included in the more
UNEP/GEF/SCS/RWG-M.3/3
Page 13
subjective, anthropocentric class. The consequence of this is that the biological indicators clearly rank
sites, whereas the more subjective class does not. Examination of actual values revealed that, not
unexpectedly, within each national set, the ranking of each site was not the same in the two classes
of indicator and that simple addition of the outcome of the two classes was not an appropriate way in
which to determine overall rank. It was agreed that the initial set of indicators was more appropriate
for determining rank in the first instance whilst the second set could be used to distinguish between
the top ranked sites.
7.48
It was noted that in cases where the data were not available to determine a numerical score
then the overall rank of a site was correspondingly lower. During discussion it was agreed that all sites
could be scored and that it was merely a case that these data were not to hand during the meeting. It
was agreed that all site scores would be submitted to the Project Co-ordinating Unit, no later than 7th
April and that they would be submitted sequentially as they were completed.
7.49
Professor Sanit raised an issue regarding the "purpose" of the demonstration sites noting that
a number of the Thai sites represented ongoing funded activities which could be added to the regional
demonstration site framework at little or not cost to the Project, beyond the costs of bringing people to
the site. In such cases regional approval or agreement for their inclusion would result in substantial
benefits to the project, three Thai sites were of this kind whereas one, also of high priority from the
national perspective, currently had little or no investment in activities hence it would require inputs
from the Project. Again it was noted that if these were agreed and accepted at the regional level this
would result in substantial government investment in the planned activities.
7.50
The list of Thai sites was annotated to indicate the distinction between these two types of site
and it was agreed that the second class of indicator should theoretically enable a reader to distinguish
between the two sites since the analysis of costs was an integral part of this section of the ranking
procedures. During discussion the participants noted that the Project Steering Committee had agreed
to adopt a portfolio of twenty-four sites in December 2003 although GEF grant funds were available
only to support nine sites. Existing sites such as the King's Projects in Thailand would contribute
substantially to achieving this goal.
7.51
During the final discussion, participants agreed that overall, the approach to selecting
demonstration sites was objective and easy to understand and that furthermore the outcome of the
ranking fitted the expert perceptions of the participants. It was noted with regret that it had not been
possible to provide guidance to the Focal Points regarding the regional priority of the sites identified
due to the incomplete nature of the data and in some instances its non-comparability. The importance
of completing the ranking exercise and site characterisations, and submitting the data to the PCU on
time (April 7th), was noted by the participants.
8.
PREPARATION OF SITE SPECIFIC PROPOSALS FOR DEMONSTRATION SITES
INCLUDING THE REVIEW OF THREATS AT SITE LEVEL AND IDENTIFICATION OF THE
PROXIMATE AND ULTIMATE CAUSES OF DEGRADATION
8.1 The Project Director introduced document UNEP/GEF/SCS/RWG-M.3/4 containing a proposed
format for the completion of the demonstration site proposals. In introducing this document Dr. Pernetta
indicated that it was extremely important for proposals to conform to a minimum format if they were to be
considered equally and that production of a portfolio of proposals was necessary if potential donors
were to become involved in the activities. He noted further that the intention was to convene a
partnership workshop in connection with the Regional Science Conference and that all proposals should
be available for distribution to potential donors not later that 1st October 2003.
8.2 The format was reviewed section by section with clarification of the intended content and the
explanatory notes. The Regional Working Group accepted the proposed format recognising that, it
would require at least two iterations and that drafts would need to be reviewed by the project Co-
ordinating Unit who would provide advice and assistance regarding any required amendments or
additions prior to finalisation and submission to the Regional Science Conference.
UNEP/GEF/SCS/RWG-M.3/3
Page 14
9.
REVISION OF THE WORKPLAN AND ACTIVITIES FOR THE REGIONAL WORKING
GROUP ON MANGROVES
9.1
The status of the outputs from 2002 including the required reports and data were then reviewed
and it was noted that the Project Steering Committee had agreed during the second meeting to an
independent review process for all outputs. Under these procedures reports produced from the national
level will be sent to an independent expert reviewer in the region for a critical evaluation that is intended
to provide guidance to the authors on necessary amendments and revisions in order to ensure that the
documents reach internationally acceptable standards. The reviewers will be asked to complete the
reviews, which will be forwarded to the authors, by the PCU. The reviewer's names will not be revealed
to the authors at the time the reports were returned.
9.2
Members discussed the various reports and outputs and agreed that copies of the reports
concerning the review of past and ongoing projects and data and information would be sent by the PCU
for review by the end of March. Reviewers would be requested to provide their reviews and advice no
later that the end of April, at which time the authors would be asked to amend and revise their reports.
Final drafts of these two reports should be provided to the PCU no later than 1st September where-upon
they would be formatted for final review by the fourth meeting of the Regional Working Group, which
would consider and decide on the final form of publication.
9.3
In the case of the reviews of national legislation, institutional and administrative arrangements
and the review of economic evaluation, the country reports will be used as initial inputs to the two
regional task forces which will review their contents and advise the focal points on any required
modifications. The task forces will also consider how these national contributions may be used to
contribute to a regional level overview. The national reviews will be dispatched to the members of the
regional task forces once these groups have been established. In this regard it was noted that to date
members have been nominated from three countries.
9.4
In relation to the site characterisations, preparation of the national meta-database and the
inputs to the regional GIS database it was noted that the contributions to the Regional GIS database
were somewhat limited, and that the finalisation of the site characterisations could have been done via
the GIS site questionnaires thereby providing immediate inputs to the Regional GIS database. Members
recognised that they also needed to review the information currently contained in the system and
provide immediate feedback to Dr. Anond in SEA START RC regarding the accuracy of the existing
data sets. It was agreed that all members would provide the required site characterisation data both in
the GIS questionnaire and in a more extensive written form along the lines of the submissions made to
date.
9.5
Concerning the production of the site specific proposals for demonstration sites that need to be
prepared during the course of the year members agreed on the following schedule of events:
Ę April 7th
All site specific data and information for site characterisation to be
received by the Project Co-ordinating Unit.
Ę April 21st
PCU completes and dispatched the cluster analysis and ranking results to
all members of the Regional Working Group, together with advice
regarding the priority demonstration sites for which focal points should
commence preparation of proposals.
Ę May - August
Focal points prepare site proposals in the agreed format, submitting these
sequentially as they are finalised for comment and review by the PCU.
Ę 1st September
Focal Points submit final drafts of demonstration site proposals for
formatting and review by the PCU and independent reviewers if
necessary.
Ę 1st October
Demonstration site proposals camera-ready format for printing and
distribution to potential donors, stakeholders and partners.
Ę October - November Negotiation and follow-up with potential stakeholders and partners
regarding support for demonstration activities.
UNEP/GEF/SCS/RWG-M.3/3
Page 15
Ę December
Regional Scientific Conference at which the demonstration sites and
other outputs are presented to the wider scientific community.
Ę December 19-23rd
Project Steering Committee agrees upon the recommendations of the
Regional Scientific and Technical Committee concerning the choice of
demonstration sites and operation of the regional programme.
9.6
In discussion of the timing of production of various outputs and recognising that the agenda
for the fourth meeting of the RWG-M would be quite heavy the members agreed to extend the
meeting to five days inclusive of the field trip to accommodate the volume of work anticipated to be
required during that critical meeting. A workplan and schedule indicating the dates of production of
various outputs is appended as Annex 8 to this report.
9.7
During the final discussion under this agenda item it was noted that the deadlines with respect
to outputs relating to the preparation of site proposals were absolute and that proposals, which
missed the deadlines for 2003 would have to be held over for a possible second tranche during 2004.
10.
DATE AND PLACE OF THE FOURTH MEETING OF THE REGIONAL WORKING GROUP
ON MANGROVES
10.1
Members were invited to consider and agree upon the proposed time and place for the fourth
meeting of the RWG-M, noting that the overall schedule of meetings for the Project currently has the
fourth meeting scheduled for October 14th to 17th. It was agreed that the meeting would be extended
by one day and would commence on Monday 13th October, running to the evening of Friday 17th
October. Participants would therefore travel to the meeting on Sunday 12th and leave on Saturday 18th
October. All members agreed on the suitability of these dates that, they had no conflicts at the present
time, and that they would all endeavour to participate in the entire meeting. The revised schedule of
meetings is appended as Annex 8 to this report.
10.2
In discussing possible locations for the next meeting the Project Director drew to the attention
of members the table of comparative costings for meetings convened during 2002 and in particular
that the preliminary estimates suggested that the meeting in Bali would be amongst the most
expensive convened to date. Dr. Fan expressed his willingness to host the next meeting in China and
this possibility, was considered by the group. Following examination of the UN rates for DSA in
various locations it was agreed that Beihai would be an excellent choice providing an opportunity to
visit the potential mangrove site on the Viet Nam/Chinese border. The meeting requested that, the
Project Director liaise with Dr. Fan to arrange for the meeting to be convened in Beihai, October 13th
to 17th inclusive.
10.3
Members noted that PEMSEA has, in collaboration with the Government of Malaysia
scheduled a major East Asian Seas Congress during the week commencing 8th December, which
conflicts with the approved dates for the Regional Science Conference and fourth meeting of the
Regional Scientific and Technical Committee. Members were invited to indicate whether this posed a
potential conflict and whether any member planned to attend the PEMSEA Congress. Only one
member saw this as a potential conflict but agreed that moving the RSTC and Science Congress was
impractical.
11.
ANY OTHER BUSINESS
11.1
The chairperson invited members to propose any additional items of business, which they
wished to be considered by the meeting. No additional items were raised.
12.
ADOPTION OF THE REPORT OF THE MEETING
12.1
The meeting noted that it had before it, the complete text of the meeting report up to agenda
item 7, paragraph 7.42 and that if the remainder of the report were to be drafted, presented, considered
and adopted this would necessitate either a night session or delaying closure of the meeting.
Participants accepted the draft report as presented on the understanding that: minor suggestions for
UNEP/GEF/SCS/RWG-M.3/3
Page 16
change to the existing text would be submitted in writing to the Project Director prior to members
departure; the Project Director would be responsible for English editing.
12.2
It was agreed that given the lateness of the hour the Project Director be authorised to complete
the report on behalf of the Regional Working Group, and that, prior to its public release the final report
as drafted by the Project Director, would be cleared by the Chairperson, Vice-Chairperson and
Rapporteur of the group.
13.
CLOSURE OF THE MEETING
13.1
The Chairperson thanked all members, focal points, experts and the Secretariat for their hard
and constructive work and the Project Director for once again providing good preparation in advance
of the meeting, which had facilitated the meeting reaching agreement on all matters before the group.
He urged all members to try and work to meet the deadlines and timetable established during the
meeting and in particular the immediate deadlines with respect to the submission of the site
characterisations for proposed demonstration sites. He invited Mr. Santoso and Dr. Pernetta to say a
few words.
13.2
Mr. Santoso expressed his pleasure, on behalf of the Government of Indonesia at being
given the opportunity to host this important meeting in Bali, he noted with regret that the Deputy
Minister had unfortunately been prevented from attending the joint session due to pressure of work,
and apologised for any problems which participants had encountered before or during the meeting.
13.3
The Project Director expressed his pleasure, both personal and on behalf of UNEP, for the
privilege of working with the mangrove group and expressed his satisfaction that, once again the
group had managed to accomplish a considerable amount of work in a short period of time whilst at
the same time retaining a harmonious and friendly working atmosphere. He thanked the Officers of
the Committee for their continued leadership, the experts for their wisdom, and the focal points for
their hard work before and during the meeting.
13.4
There being no further business the chairperson closed the meeting at 1915 on the evening
of Thursday 6th March 2003.
UNEP/GEF/SCS/RWG-M.3/3
Annex 1
Page 1
ANNEX 1
List of Participants
Focal Points
Cambodia
People's Republic of China
Mr. Ke Vongwattana, Assistant
Dr. Hangqing Fan, Professor
Minister in charge of Mangrove and Wetland
Guangxi Mangrove Research Centre
Department of Nature Conservation and
92 East Changqing Road
Protection, Ministry of Environment
Beihai City 536000
48 Samdech Preah Sihanouk
Guangxi Zhuang Autonomous Region
Tonle Bassac, Chamkarmon, Cambodia
China
Tel: (855 23) 213908; 855 16 703030
Tel: (86 779) 205 5294; 206 5609
Fax: (855 23) 212540; 215925
Mobile: (86) 13 006992303
E-mail: moe-cabinet@camnet.com.kh
Fax: (86 779) 205 8417; 206 5609
kewattana@yahoo.com
E-mail: fanhq@ppp.nn.gx.cn
Indonesia
Malaysia
Mr. Nyoto Santoso
No National Focal Point designated
Lembaga Pengkajian dan Pengembangan
Mangrove
(Institute of Mangrove Research & Development)
Multi Piranti Graha It 3 JL. Radin Inten II No. 2
Jakarta 13440, Indonesia
Tel:
(62 21) 861 1710; (62 251) 621 672
Fax: (62 21) 861 1710; (62 251) 621 672
E-mail: imred@indo.net.id; puryanti@indo.net.id
Philippines
Thailand
Mr. Florendo Barangan, Executive Director
Dr. Sonjai Havanond, Chief
Coastal & Marine Management Office
Mangrove Research and Development Division
Department of Environment and Natural
Royal Forest Department
Resources (CMMO/DENR)
61 Phaholyothin Road, Bangkhen
DENR Compound Visayas Avenue
Bangkok 10900
Diliman, Quezon City, Philippines
Thailand
Tel: (632) 926 1004, 63 917 873 3558
Tel: (662) 298 2591; 298 2058
Fax: (632) 926 1004; 426 3851
Fax: (662) 298 2059
E-mail: cmmo26@yahoo.com
E-mail: sonjai_h@hotmail.com
Viet Nam
Dr. Do Dinh Sam, Professor
Forest Science Institute of Viet Nam
Dong Ngac, Tu Liem
Hanoi, Viet Nam
Tel: (844) 838 9815
Fax: (844) 838 9722
E-mail: ddsam@netnam.vn
UNEP/GEF/SCS/RWG-M.3/3
Annex 1
Page 2
Regional Experts
Dr. Sanit Aksornkoae, Professor Emeritus
Dr. Gong Wooi Khoon
Department of Silviculture Faculty of Forestry
Centre for Marine and Coastal Studies
Kasetsart University
Universiti Sains Malaysia
Chatujak, Bangkok 10900
11800 Penang
Thailand
Malaysia
Tel:
(66 2) 579 0171 ext. 113, 942 8112
Tel:
(604) 653 3888 ext. 2371
Fax:
(66 2) 942 8112
Fax: (604) 657 2960; 656 5125
E-mail: fforsna@nontri.ku.ac.th
E-mail: wkgong@usm.my; gongwk@yahoo.com
Dr. Nguyen Hoang Tri, Director
Center for Environmental Research and Education
(CERE)
Hanoi University of Education
136 Xuan Thuy, Quan Hoa, Cau Giay
Hanoi, Viet Nam
Tel:
(844) 733 5625; 768 3502
Mobile: (84) 9 13527629
Fax:
(844) 733 5624; 762 7908
E-mail: CERE@hn.vnn.vn
Project Co-ordinating Unit Member
Dr. John Pernetta, Project Director
UNEP/GEF Project Co-ordinating Unit
United Nations Environment Programme
9th Floor, Block A, United Nations Building
Rajdamnern Avenue
Bangkok 10200, Thailand
Tel:
(66 2) 288 1886
Fax: (66 2) 281 2428
E-mail: pernetta@un.org
Observers
Dr. Ian Campbell, Senior Environmental Specialist Dr. Sukristijono Sukardjo, Mangrove Ecologist
Environment Division, Mekong River Commission
Institute of Mangrove Research and Development
P.O. Box 1112
Komplex IPB II, Jl. Mercurius No. Kav. C/4
364, M.V. Preah Monivong
Sindang Barang Ł Bogor 16680
Phnom Penh, Cambodia
Indonesia
Tel:
(855 23) 720 979;(855 12) 990 650
Tel:
(62 251) 621 672
Fax
(855 23) 720 972
Fax:
(62 251) 621 672
E-mail: Campbell@mrcmekong.org
E-mail s_sukardjo@telkom.net
Dr. Ir. Ning Purnomohadi
Jl. Ridwan III/ 71, Patal Senayan
Jakarta Selatan, 12210, Indonesia
Tel:
(62 21) 579 92743; 579 92691
Fax:
(62 21) 573 7230
E-mail: prasetyo@centrin.net.id
UNEP/GEF/SCS/RWG-M.3/3
Annex 1
Page 3
Project Co-ordinating Unit
Mr. Kelvin Passfield2, Expert - Fisheries
Ms. Unchalee Kattachan
UNEP/GEF Project Co-ordinating Unit
Secretary, UNEP/GEF Project Co-ordinating Unit
United Nations Environment Programme
United Nations Environment Programme
9th Floor, Block A, United Nations Building
9th Floor, Block A, United Nations Building
Rajdamnern Avenue
Rajdamnern Avenue
Bangkok 10200, Thailand
Bangkok 10200, Thailand
Tel:
(66 2) 288 1116
Tel: (66 2) 288 1670
Fax:
(66 2) 281 2428
Fax: (66 2) 281 2428
E-mail: passfield@un.org
E-mail: kattachan.unescap@un.org
2 Mr Passfield acted as Secretary during the first two days of the meeting, subsequent to which he participated in and acted
as Secretary for the Regional Working Group for Wetlands.
UNEP/GEF/SCS/RWG-M.3/3
Annex 2
Page 1
ANNEX 2
List of Documents
Discussion documents
UNEP/GEF/SCS/RWG-M.3/1
Provisional agenda
UNEP/GEF/SCS/RWG-M.3/2
Provisional annotated agenda
UNEP/GEF/SCS/RWG-M.3/3
Report of the meeting
UNEP/GEF/SCS/RWG-M.3/4
Current status of budgets and reports from the
Specialised Executing Agencies in the participating
countries.
UNEP/GEF/SCS/RWG-M.3/5
Preliminary Mangrove site characterisations for
consideration during the 3rd meeting of the Regional
Working Group for Mangroves.
UNEP/GEF/SCS/RWG-M.3/6
Guidelines for the preparation of demonstration site
proposals and format for use in their presentation.
UNEP/GEF/SCS/RWG-M.3/7
Schedule of meetings and current workplan for the
Regional Working Group on Mangroves.
CD-ROM
National reports and site characterisations for
mangroves and wetlands (see the Appendix 1 for the list
of mangrove related reports).
UNEP/GEF/SCS/RSTC.2/8
Draft proposal for regional criteria and procedures to be
used in ranking and selecting demonstration sites in the
framework of the UNEP/GEF Project entitled: "Reversing
Environmental Degradation Trends in the South China
Sea and Gulf of Thailand."
UNEP/GEF/SCS/RSTC.2/10/Amend.1
Guidance to the PSC on the nature and types of
potential demonstration sites to be established within the
Framework of the UNEP/GEF Project.
Information documents
UNEP/GEF/SCS/RWG-M.3/INF.1
Provisional list of participants
UNEP/GEF/SCS/RWG-M.3/INF.2
Provisional list of documents (this document)
UNEP/GEF/SCS/RWG-M.3/INF.3
Draft programme
The following documents are supplied on CD-ROM and in hard copies.
UNEP/GEF/SCS/RWG-M.2/3
Second Meeting of the Regional Working Group on the
Mangroves Sub-component for the UNEP/GEF Project
"Reversing Environmental Degradation Trends in the
South China Sea and Gulf of Thailand". Report of the
meeting. UNEP/GEF/SCS/RWG-M.2/3 Ho Chi Minh City,
Viet Nam, 10 - 13 September 2002.
UNEP/GEF/SCS/RWG-W.2/3
Second Meeting of the Regional Working Group on the
Wetlands Sub-component for the UNEP/GEF Project
"Reversing Environmental Degradation Trends in the
South China Sea and Gulf of Thailand". Report of the
meeting. UNEP/GEF/SCS/RWG-W.2/3 Shenzhen, China,
4 - 7 September 2002.
UNEP/GEF/SCS/RWG-M.3/3
Annex 2
Page 2
UNEP/GEF/SCS/RWG-LbP.2/3
Second Meeting of the Regional Working Group on the
Land-based Pollution Component for the UNEP/GEF
Project "Reversing Environmental Degradation Trends in
the South China Sea and Gulf of Thailand". Report of the
meeting.
UNEP/GEF/SCS/RWG-LbP.2/3 Batam,
Indonesia, 18 - 21 September 2002.
UNEP/GEF/SCS/RWG-F.2/3
Second Meeting of the Regional Working Group on the
Fisheries Component for the UNEP/GEF Project
"Reversing Environmental Degradation Trends in the
South China Sea and Gulf of Thailand". Report of the
meeting. UNEP/GEF/SCS/RWG-F.2/3 Phuket, Thailand,
7 - 11 October 2002.
UNEP/GEF/SCS/RWG-CR.2/3
Second Meeting of the Regional Working Group on the
Coral Reef Sub-component for the UNEP/GEF Project
"Reversing Environmental Degradation Trends in the
South China Sea and Gulf of Thailand". Report of the
meeting. UNEP/GEF/SCS/RWG-CR.2/3 Sihanoukville,
Cambodia, 23 - 26 October 2002.
UNEP/GEF/SCS/RWG-SG.2/3
Second Meeting of the Regional Working Group on the
Seagrass Sub-component for the UNEP/GEF Project
"Reversing Environmental Degradation Trends in the
South China Sea and Gulf of Thailand". Report of the
meeting. UNEP/GEF/SCS/RWG-SG.2/3 Hue, Viet Nam,
28 - 31 October 2002.
UNEP/GEF/SCS/RSTC.2/3
Second Meeting of the Regional Scientific & Technical
Committee for the UNEP/GEF Project "Reversing
Environmental Degradation Trends in the South China
Sea and Gulf of Thailand". Report of the meeting.
UNEP/GEF/SCS/RSTC.2/3 Nha Trang, Viet Nam, 11 - 13
December 2002.
UNEP/GEF/SCS/PSC.2/3
Second Meeting of the Project Steering Committee for the
UNEP/GEF Project
"Reversing Environmental
Degradation Trends in the South China Sea and Gulf of
Thailand". Report of the meeting. UNEP/GEF/SCS/
PSC.2/3 Hanoi, Viet Nam, 16 - 18 December 2002.
UNEP/GEF/SCS/RWG-M.3/3
Annex 2
Page 3
Appendix 1
List of Substantive Reports Relating to the Mangrove Sub-component, Received by the Project
Co-ordinating Unit as of February 1st 2003.
Supplied to the Third Meeting of the Regional Working Group on Mangroves,
as pdf files on cd-rom
Cambodia
Reports
1
Ke Vongwattana, October. Review and Develop National Data and Information for Mangrove.
5 pages.
2. Ke Vongwattana, October. Review of past and ongoing mangrove activities in Cambodia.
10 pages.
3. Ke Vongwattana, October Cambodia Meta-database for Mangroves.
4
Ke Vongwattana, Image of map of Mangrove distribution in Cambodia, 1 page.
5. Ke Vongwattana, Image of map of potential mangrove demonstration sites, 1 page.
Site Characterisations
Ę Mangrove demonstration sites in Cambodia, 15 pages.
Reports tabled during the meeting
1. Report of Review of National Legislation and Management Regime for Mangrove, February
2003, 29 pages.
2. Report of Review of Identification and Characterization of the Site, January 2003.
3. Report of Review of National Data and Information for Mangrove, February 2003, 18 pages.
4. Report of Review of Past and Ongoing Mangrove Activities, February 2003, 17 pages.
5. Report of Review of National Criteria and Priority, February 2003.
6. Report of Review of Economic Valuation, February 2003, 26 pages.
7. Draft Paper: Report for the UNEP/GEF Project Reversing Environmental Degradation Trends
in the South China Sea and Gulf of Thailand: a Focus on Causal Chain Analysis of Peam-
Krasoap, Dongpeng-Botum Sakor and Ream-Veal Rihn, February 2003, 17 pages.
China
Reports
1. Guangxi Mangrove Research Center. October, draft report - Review of past and ongoing
mangrove activities in China 14 pages.
2. Guangxi Mangrove Research Center. October, draft report - Review of National Data and
Information. 100 pages.
Site characterisations:
Ę
Mangroves of Fangchenggang City. 4 pages.
Ę
Hainan Qinglangang National Mangrove Natural Reserve. 4 pages.
Ę
Hainan Dongzhaigang National Mangrove Natural Reserve. 4 pages.
Ę
Shankou National Mangrove Natural Reserve. 4 pages.
Ę
Shenzhen Futian National Mangrove And Birds Natural Reserve. 4 pages.
Indonesia
Reports
1. Institute of mangrove research & development. June, Review of National Data Report of
Indonesia. 21 pages.
2. Institute of mangrove research & development. June, Review of Data and Information of
Mangrove ecosystem condition in the South China Sea, Indonesia 18 pages.
3. Institute of mangrove research & development. June, Review of National Legislation of
Mangrove ecosystem 19 pages.
4. Institute of mangrove research & development. June, Review of National level Management
Regime of mangroves 12 pages.
UNEP/GEF/SCS/RWG-M.3/3
Annex 2
Page 4
5. Institute of mangrove research & development. June, Action Plan for Mangrove Management
in Indonesia. 23 pages.
All the above are contained in the single volume: Progress Report Reversing Environmental
Degradation trends in the South China Sea and Gulf of Thailand.
Reports tabled during the meeting
1. Guidelines and Criteria Assessment of Mangrove Demonstration Site (Indonesia), December,
2002, 30 pages.
2. List Species Flora and Fauna in Indonesia Mangrove Ecosystem in the South China Sea,
December 2002.
Malaysia
No Focal Point yet designated.
Philippines
Reports
GIS files with partial completion of data relating to selected mangrove sites.
Reports tabled during the meeting
1. Overview of Mangrove RD & E in Selected Regions of the Philippines: Status Report, 2003.
2. Initial Analysis on Mangrove and Mangrove-related Policy Issuances (Philippines), 2003,
11 pages.
3. Six Monthly Progress Report.
Thailand
Reports
1. Royal Forestry Department July. Draft Report of Thailand 44 pages.
2. Royal Forestry Department, October. Reversing Environmental Degradation in the South
China Sea and Gulf of Thailand. Mangrove component Country Report for Thailand 35 pages.
3. Royal Forestry Department October. Tabulation of past and ongoing activities 2 pages.
Site characterisations:
Ę Ban Don Bay, 2 pages.
Ę Don Hoi Lot, 2 pages.
Ę Khoa Sam Roi Yot, 3 pages.
Ę Khung Kraben Bay, 2 pages.
Ę Mu Koh Chang, national park 2 pages.
Ę Pak Panang Bay, 2 pages.
Ę Pattani Bay, 2 pages.
Ę Thang Kha, 2 pages.
Ę Welu Rvier estuary, 2 pages.
Viet Nam
Reports
1. Forest Research Institute of Viet Nam. October. Review of National Data and Information On
Mangrove Forest of Viet Nam. 62 pages + 122 pp annexes.
2. Forest Research Institute of Viet Nam. Review of past and on-going activities including
economic valuation. 17 pages.
3. Forest Research Institute of Viet Nam. December. Review of National Legislation on Forest
Protection and development in Viet Nam. 20 pages.
Reports tabled during the meeting
1. Viet Nam Report on National Criteria for Identification of Mangrove Sites and Demonstration
Sites, February 2003, 16 pages.
2. Report on Economic Valuation of Mangrove Sites, November 2002, 11 pages.
UNEP/GEF/SCS/RWG-M.3/3
Annex 2
Page 5
Site characterisations:
Ę An Thanh, 21 pages
Ę Con Dau Island, 5 pages
Ę CanGio, 17 pages
Ę Cat Ba, 5 pages
Ę Hui Ninh Tien Yen Yen Hu, 27 pages
Ę Kien Giang, 10 pages
Ę Camau, 7 pages.
Ę Red River, 7 pages
Ę Sao Luoi, 9 pages
Ę Thanh Phu Ben Tre, 12 pages
Ę Van Uc, 6 pages
UNEP/GEF/SCS/RWG-M.3/3
Annex 3
Page 1
ANNEX 3
Agenda
1.
OPENING OF THE MEETING
1.1 Welcome address
1.2 Introduction of members
2.
ORGANISATION OF THE MEETING
2.1 Election of Officers
2.2 Documents available to the meeting
2.3 Organisation of work
3.
ADOPTION OF THE MEETING AGENDA
4.
OPENING REMARKS FROM THE FOCAL POINTS FOR MANGROVES FROM EACH
PARTICIPATING COUNTRY
5.
REPORTS FROM THE PROJECT CO-ORDINATING UNIT (PCU) REGARDING OVERALL
PROGRESS TO DATE
5.1 Status of end-year progress reports, expenditure reports, and budgets
5.2 Status of planned substantive outputs from the national level activities
6.
REVIEW AND EVALUATION OF COUNTRY REPORTS
6.1 Past and on-going activities including economic valuation
6.2 Review of national data and information, creation of national meta-database and
national inputs to the regional GIS database
6.3 Review of national legislation, institutional and administrative arrangements
7.
CHARACTERISATION OF NATIONAL MANGROVE SITES AND THEIR REGIONAL
PRIORITISATION
8.
PREPARATION OF SITE SPECIFIC PROPOSALS FOR DEMONSTRATION SITES
INCLUDING THE REVIEW OF THREATS AT SITE LEVEL AND IDENTIFICATION OF THE
PROXIMATE AND ULTIMATE CAUSES OF DEGRADATION
9.
REVISION OF THE WORKPLAN AND ACTIVITIES FOR THE REGIONAL WORKING
GROUP ON MANGROVES
10.
DATE AND PLACE OF THE FOURTH MEETING OF THE REGIONAL WORKING GROUP
ON MANGROVES
11.
ANY OTHER BUSINESS
12.
ADOPTION OF THE REPORT OF THE MEETING
13.
CLOSURE OF THE MEETING
UNEP/GEF/SCS/RWG-M.3/3
Annex 4
Page 1
ANNEX 4
Tabulation of Raw and Transformed Data Relating to Identified Mangrove Sites
Bordering the South China Sea and Used in the Preliminary Cluster Analysis
Background
Focal Points in the Specialised Executing Agencies were requested to assemble data and information
relating to mangrove sites bordering the South China Sea in GIS format and/or using the agreed lists
of data and information requirements developed during the first two Regional Working Group
meetings. These were brought to the third meeting of the Regional Working Group for use in the
preliminary cluster analysis and these data are presented in Table 1.
Review of the data
In reviewing the data it became apparent that certain parameters which had originally been identified
as being critical to site characterisation were in fact not readily available. For only one site were data
available relating to the rates of vegetation cover change for example, and data relating to migratory
bird species abundance were also not readily available for all sites. These parameters were not used
in the subsequent analyses and are shaded in light grey in Table 1. It was agreed that data relating to
rates of mangrove loss on wider than site scales were available and that these would be compiled for
subsequent use.
In some instances parameters were included that were not originally contained in either the list of
parameters for site characterisation, or in the GIS questionnaires such as, for example, resident
reptiles, and resident mammals. In one instance data had been collected regarding the number of
mollusc species, rather than separating bivalves and gastropods, hence the data could not be used
and such information are shaded dark grey in Table 1.
Also indicated by footnotes, are anomalous data points reflecting either errors in transcription or
calculation, or data which are not directly comparable such as the areas of mangroves presented by
Indonesia where the data have been collected at the provincial rather than the site level. To avoid
similar problems in the future it was agreed that all site characterisations would include a scale map of
the site and lists of all species to be used in the cluster analysis as indicators of biological diversity.
A review of the data contained in Table 1 indicates that certain data sets represent correlated items
and the inclusion of both sets of data would automatically weight the final dendrogram. Such paired
data sets include the numbers of species and genera of, bivalves, gastropods, crustaceans and fish.
The inclusion of indices reflecting the biological diversity within these taxa is justified since each major
taxon serves as an indicator of diversity in different components of the mangrove food-web, however
inclusion of both genera and species numbers was not justified. The RWG-M agreed that in these
instances only the data on species numbers would be used in the initial cluster analysis. The columns
not considered further are shaded in dark grey. It was further agreed that in the final analysis the
presence or absence of mangrove tree genera would be included and Gower's Index of similarity
would be applied to the data sets.
UNEP/GEF/SCS/RWG-M.3/3
Annex 4
Page 2
Table 1
Raw data compiled from site characterisations and GIS questionnaires for mangrove sites bordering the South China Sea
Change
Trees
Crustacea
Bivalves
Gastropods
Fish
Birds
in Area Zones - Spp
No
Site
Present
per
Area Ha
Associations No. true Density
mollusc No.
No.
No.
No.
No.
No.
Migratory Abundance
annum
Present No.
Resident
- community Mangrove >1.5m
Spp Bivalve Bivalve Gastropod Gastropod resident resident
species Migratory
over 10
Spp.
high /Ha Cover Genera
No. Spp.
Gen
Spp.
Gen
Spp.
genera species Bird Spp.
Birds
Spp.
years
THAILAND
Trad Province
9,240
35
2,600
90
61
13
Thung Kha Bay -
Savi Bay
2,080
3
18
4,500
90
50
53
46
Pak Phanang
Bay
6,987
3
15
4,400
95
50
30
Kung Kraben
Bay
640
2
10
6,100
80
35
Pattani Bay
3,700
3
25
2,800
95
32
3
25
Ban Don Bay
3,700
210
3
19
655
90
75
57
18
Welu River
Estuary
25,000
2
32
4,200
60
59
22
VIET NAM
Hai Ninh
2,104
1
10 15,000
70
23
65
25
113
36
106
194
7
Tien Yen
4,228
1
14 15,000
80
23
65
25
113
36
106
194
7
Yen Hung
8,824
1
8
4,000
80
11
Cat Ba
396
1
5 15,000
90
105
120
69
Van Uc
1,342
1
7 25,000
90
124
172
143
5
Xuan Thuy
1,855
1
20,000
62
61
55
64
1813
Can Gio
30,304
5
35 10,000
90
49
21
127
Thanh Phu
2,513
7
25
80
135
61
169
Soc Trang
1,441
7
24
7,000
80
21
33
1194
Ca Mau
8,899
7
17
6,000
90
69
32
52
Sao Luoi
3,123
7
18 15,000
90
7
FE184
3,414
7
33 15,000
90
7
15
Kien Giang
5,736
7
20,000
70
7
15
Con Dao
52
6
23 15,000
90
5
2
100
65
3 These numbers include resident, transitory and migratory species .
4 These numbers include resident, transitory and migratory species .
UNEP/GEF/SCS/RWG-M.3/3
Annex 4
Page 3
Table 1 continued.
Raw data compiled from site characterisations and GIS questionnaires for mangrove sites bordering the South China Sea5 (Light
shading indicates parameters eliminated form further consideration due to difficulties of data collection. Dark shading indicates parameters eliminated from further consideration
due to strong correlations with other parameters in the matrix.)
Change
Trees
Crustacea
Bivalves
Gastropods
Fish
Birds
in Area Zones - Spp
No
Site
Present
per
Tree
No.
No.
Area Ha
Associations No. true
mollusc No.
No.
No.
No.
Abundance
annum - community Mangrove Density Percent No.
No.
Spp Bivalve Bivalve Gastropod Gastropod resident resident Resident Migratory Migratory
over 10
Cover Genera Spp.
Spp
Spp.
Spp.
>1.5m
Gen
Spp.
Genera
Spp.
fish
fish
Spp
years
high /Ha
genera species
CHINA
Shangkou
776
+
2
15
11,980
90
40
68
32
40
17
33
20
24
28
76
30,000
Quinglangang
2,722
24
10,183
80
60
13
DongXhaiGang
1,760
24
8,433
80
32
51
43
35
Futien
111
10
10,233
19
29
14
16
13
21
20
24
28
76
30,000
Fangchenggang
1,337
3
15 67,4486
95
38
64
48
59
21
38
19
20
42
145
50,000
7
CAMBODIA
Peam Krasop
33,445
-
4
> 50 8
80
21
30
62
3,7879
Dong Peng-
Botum Sakor
53,320
-
3
> 50
70
29
Ream-Veal Rinh
34,090
-
3
74
60
30
Province
INDONESIA
East Java
97,712
18
13
18
13
23
2
3
Central Java
95,338
18
15
17
West Java
128,290
24
25
33
11
15
24
39
Banten
16
10
10
42
46
90
101
DKI Jakarta
260
17
14
14
18
23
48
78
Lampung
18,370
12
15
21
5
7
4
7
South Sumatera 1,046,896
15
9
12
25
29
1
1
Babel
11
3
5
20
25
27
46
Jambi
263,349
15
3
10
Riau
1,155,085
23
32
31
10
11
8
9
West Kalimantan
472,365
22
2
3
6
6
15
17
Central
Kalimantan
2,228,587
9
South Kalimantan 208,620
7
2
2
5 Light shading indicates parameters eliminated form further consideration due to difficulties of data collection. Dark shading indicates parameters eliminated from further consideration due to strong
correlations with other parameters in the matrix.
6 This figure includes seedlings .
7 The figures for Area in Cambodia relate to coastal Provinces rather than specific sites.
8 These figures include both true and associate mangrove species .
9 This figure represents numbers of individuals of resident and migratory birds rather than number of resident bird species .
UNEP/GEF/SCS/RWG-M.3/3
Annex 4
Page 4
Table 1 continued.
Raw data compiled from site characterisations and GIS questionnaires for mangrove sites bordering the South China Sea
Change
Trees
Crustacea
Bivalves
Gastropods
Fish
Birds
in Area Zones - Spp
No
Site
Present
per
Species -
Tree
No.
No.
No.
No.
Abundance
Area Ha
Associations
mollusc
annum
Density Percent No.
No.
No.
Resident Migratory
- community
True
Spp
Gastropod Gastropod resident resident
Migratory
over 10
Cover Genera Spp.
Gen No. Spp.
Spp
Spp.
mangroves >1.5m
Gen
Spp.
genera species
Spp
years
high /Ha
PHILIPPINES
Pasuquin
118
19
109
Busuanga
1,299
3
19
53
3
Ulugan
5
30
6
Dumaran
1,421
3
19
114
Ave.
Parameters recorded for Philippines sites but not
Tree
Ave.
Ave. ht
Av.
Den.
girth
Res.
Res.
included in the agreed list for site characterisation density
Height dom. sp girth
Dom
Dom spp. reptile Mammals
spp.
Pasuquin
290
5.88
6.06
63.02 65.83
Busuanga
1,000 8
12.14
21.09 70.98
654
2
3
Ulugan
2,000 10.6
69.34
1,610
2
Dumaran
63.02 8.5
12.63
21.21 71.37
2
UNEP/GEF/SCS/RWG-M.3/3
Annex 4
Page 5
Transformations and estimations of data
Table 2 presents the data for those parameters that should be included in the cluster analyis. In the
case of columns where less than 50% of the cells contained real data it was decided to eliminate these
parameters from further consideration at this stage. Therefore the parameters relating to numbers of
crustacean, bivalve, gastropod and migratory bird species and rates of loss, were eliminated from
further consideration. These columns are shaded in dark grey.
Shaded in light grey in Table 2 are cells for which empirical data were absent but for which an expert
estimate was made by the regional working group in order to retain both the parameter and the site in
the initial cluster analysis. Indicated by footnotes are anomalous values retained in the analysis but
which need to be checked and validated prior to finalisation of the cluster analysis.
The final set of data used in the analysis involved 7 parameters for 33 sites: 3, Cambodia; 5, China; 4,
Philippines; 7, Thailand; 14, Viet Nam. An independent cluster analysis of the Indonesian data was
performed using five parameters as indicated in the last section of Table 2.
Initially data were used without transformations and subsequently the data for tree density and area
were log transformed. The transformed data are presented in Table 1 of Annex 5.
UNEP/GEF/SCS/RWG-M.3/3
Annex 4
Page 6
Table 2
Selected data sets for cluster analysis including estimates for missing data (light shading) and columns, which were not included since less
than 50% of the cells contained data (dark shading). Anomalous data points are annotated with footnotes.
Trees
Site
Present Zones - Spp
True
No.
No.
No.
No
No.
No.
Area
Associations
Density >1.5m high Present
mangrove
Crustacean. Bivalve Gastropod Reside nt Resident Migratory
Spp.
/Ha
Cover
Spp.
Spp.
Spp.
Fish Spp. Bird Spp. Bird Spp.
Trad Province
9,240
3
35
2,600
90
50
61
13
Thung Kha Bay -
Savi Bay
2,080
3
18
4,500
90
50
53
46
Pak Phanang Bay
6,987
3
15
4,400
95
50
30
Kung Kraben Bay
640
2
10
6,100
80
50
35
Pattani Bay
3,700
3
25
2,800
95
32
3
25
Ban Don Bay
3,700
3
19
655
90
75
57
18
Welu River Estuary 25,000
2
32
4,200
60
59
22
Hai Ninh
2,104
1
10
15,000
70
65
113
106
194
7
Tien Yen
4,228
1
14
15,000
80
65
113
106
194
7
Yen Hung
8,824
1
8
4,000
80
50
20
Cat Ba
396
1
5
15,000
90
105
50
69
Van Uc
1,342
1
7
25,000
90
124
143
5
Xuan Thuy
1,855
1
5
20,000
62
61
64
18110
Can Gio
30,304
5
35
10,000
90
49
127
30
Thanh Phu
2,513
7
25
1,000
80
135
169
30
Soc Trang
1,441
7
24
7,000
80
33
11910
Ca Mau
8,899
7
17
6,000
90
69
32
52
Sao Luoi
3,123
7
18
15,000
90
7
50
35
FE184
3,414
7
33
15,000
90
7
15
50
35
Kien Giang
5,736
7
20
20,000
70
7
50
35
Con Dao
52
6
23
15,000
90
5
2
100
65
10 Numbers require confirmation considered too high.
UNEP/GEF/SCS/RWG-M.3/3
Annex 4
Page 7
Table 2 continued.
Selected data sets for cluster analysis including estimates for missing data (light shading) and columns, which were not included since
less than 50% of the cells contained data (dark shading). Anomalous data points are annotated with footnotes.
Trees
No.
No.
No.
No
No.
No.
Site
Present Zones - Spp
Area
Associations Mangrove
Density >1.5m high Present Crustacean. Bivalve Gastropod Resident Resident Migratory
true Spp.
/Ha
Cover
Spp.
Spp.
Spp.
Fish Spp. Bird Spp. Bird Spp.
Shangkou
776
2
15
11,980
90
68
40
33
24
28
76
Quinglangang
2,722
3
24
10,183
80
60
13
30
DongXhaiGang
1,760
3
24
8,433
80
32
51
15
43
35
Futien
111
3
10
10,233
80
29
16
21
24
28
76
Fangchenggang
1,337
3
15
67,448
95
64
59
38
20
42
145
Peam Krasop
33,445
4
50
1,000
80
21
62
20
34
Dong Peng-Botum Sakor
53,320
3
50
1,000
70
29
30
Ream -Veal Rinh
34,090
3
74
1,000
60
30
20
30
Pasuquin
118
3
19
1,000
80
109
4
Busuanga
1,299
3
19
1,000
80
53
3
Ulugan
1
3
5
1,000
80
30
6
Dumaran
1,421
3
19
1,000
80
114
5
INDONESIA
East Java
97,712
18
18
23
3
Central Java
95,338
18
17
5
West Java
128,290
24
33
15
39
Banten
16
10
46
101
DKI Jakarta
260
17
14
23
78
Lampung
18,370
12
21
7
7
South Sumatera
1,046,896
15
12
29
1
Babel
11
5
25
46
Jambi
263,349
15
10
15
25
Riau
1,155,085
23
31
11
9
West Kalimantan
472,365
22
3
6
17
Central Kalimantan
2,228,587
9
25
22
15
South Kalimantan
208,620
7
2
22
15
UNEP/GEF/SCS/RWG-M.3/3
Annex 5
Page 1
ANNEX 5
Dendrograms Resulting from the Preliminary Cluster Analyses Conducted During the
Third Meeting of the Regional Working Group on Mangroves
Introduction
The purpose of the cluster analysis is to group sites on the basis of their similarity, thus enabling
selection of demonstration sites from different groups and hence encompassing as wide a range of
conditions as possible within the final selection of demonstration sites, subject to limitations of
available opportunities and financial resources.
Results
Tables 1 and 2 present the data finally selected for inclusion in the analyses with Table 1 presenting
the data for 33 sites from 5 countries and Table 2 the data for thirteen coastal Provinces in Indonesia
bordering the South China Sea. The cluster programme from the SPSS package was utilised for
these preliminary analyses and Figure 1 presents the outcome using average between groups
linkage, for the data contained in Table 1.
It can be seen that this figure fails to distinguish similarities amongst the majority of the sites and
appears to be strongly influenced by the figures for total area of the site and density of trees. This
results in the vast majority of sites (27) falling into a single cluster. The outcome is neither very
informative nor helpful for the intended purpose hence it was decided to transform the data for area of
the site in hectares and the density of trees per hectare into logarithms.
The transformed data are presented in Tables 3 and 4 and the resultant dendrograms in Figures 2
and 4. It can be seen from Figure 2 that two Vietnamese sites (numbers 13 and 16) form a single
outlier group, which may reflect the unusually high numbers of resident bird species. Given the
differences in interpretation of the term "resident" with respect to bird species by the different focal
points and the need to verify these data it was decided to run a further analysis without the inclusion
of this data set. Removing these data from the analysis results in the cluster pattern displayed in
Figure 3 where sites 13 and 16 no longer form a single outlier group.
Conclusions
It was apparent that, the data need to be carefully verified prior to the conduct of the final cluster
analysis, and hence full species lists for all the taxa used must be provided for each site. Given the
uncertainties and inaccuracies inherent in some of the data sets it was agreed to use Gower's Index
of Similarity and to include the presence or absence of genera of mangrove trees in the final analysis.
If this were the final analysis then three demonstration sites would be selected, one from each of the
clusters 1, 2 and 3 indicated in Figure 3.
UNEP/GEF/SCS/RWG-M.3/3
Annex 5
Page 2
Table 1
Untransformed data set, for mangrove sites from 5 countries, selected for cluster
analysis, including estimates for missing data
Trees
No
No.
Site
Present Zones - Spp
True
Area
Associations
Resident Resident
mangrove
Density >1.5m high Present
/Ha
Cover Fish Spp. Bird Spp.
Spp.
Trad Province
9,240
3
35
2,600
90
50
61
Thung Kha Bay -
Savi Bay
2,080
3
18
4,500
90
50
53
Pak Phanang Bay
6,987
3
15
4,400
95
50
30
Kung Kraben Bay
640
2
10
6,100
80
50
35
Pattani Bay
3,700
3
25
2,800
95
32
3
Ban Don Bay
3,700
3
19
655
90
75
57
Welu River Estuary 25,000
2
32
4,200
60
59
22
Hai Ninh
2,104
1
10
15,000
70
194
7
Tien Yen
4,228
1
14
15,000
80
194
7
Yen Hung
8,824
1
8
4,000
80
50
20
Cat Ba
396
1
5
15,000
90
50
69
Van Uc
1,342
1
7
25,000
90
143
5
Xuan Thuy
1,855
1
5
20,000
62
64
181
Can Gio
30,304
5
35
10,000
90
127
30
Thanh Phu
2,513
7
25
1,000
80
169
30
Soc Trang
1,441
7
24
7,000
80
33
119
Ca Mau
8,899
7
17
6,000
90
69
32
Sao Luoi
3,123
7
18
15,000
90
50
35
FE184
3,414
7
33
15,000
90
50
35
Kien Giang
5,736
7
20
20,000
70
50
35
Con Dao
52
6
23
15,000
90
100
65
Shangkou
776
2
15
11,980
90
24
28
Quinglangang
2,722
3
24
10,183
80
13
30
DongXhaiGang
1,760
3
24
8,433
80
15
43
Futien
111
3
10
10,233
80
24
28
Fangchenggang
1,337
3
15
67,448
95
20
42
Peam Krasop
33,445
4
50
1,000
80
20
34
Dong Peng-Botum
Sakor
53,320
3
50
1,000
70
29
30
Ream -Veal Rinh
34,090
3
74
1,000
60
20
30
Pasuquin
118
3
19
1,000
80
109
4
Busuanga
1,299
3
19
1,000
80
53
3
Ulugan
1
3
5
1,000
80
30
6
Dumaran
1,421
3
19
1,000
80
114
5
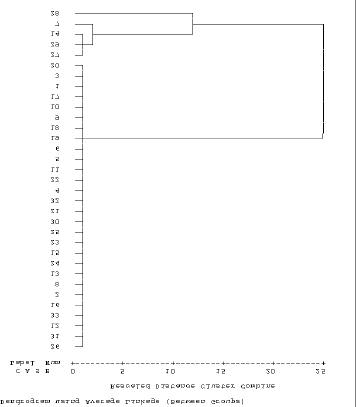
UNEP/GEF/SCS/RWG-M.3/3
Annex 5
Page 3
Figure 1
Dendrogram using average linkage between groups based on the untransformed data
presented in Table 1.
Table 2
Untransformed data sets, for mangrove forest areas in 13 coastal Provinces of
Indonesia bordering the South China Sea.
No. True
No.
No.
Site
Present
No. Bivalve
Area
Mangrove Crustacean.
Spp.
Gastropod
Spp.
Spp.
Spp
East Java
97,712
18
18
23
3
Central Java
95,338
18
17
20
5
West Java
128,290
24
33
15
39
Banten
15,000
16
10
46
101
DKI Jakarta
260
17
14
23
78
Lampung
18,370
12
21
7
7
South Sumatera
1,046,896
15
12
29
1
Babel
250,000
11
5
25
46
Jambi
263,349
15
10
15
25
Riau
1,155,085
23
31
11
9
West Kalimantan
472365
22
3
6
17
Central Kalimantan
2,228,587
9
25
22
15
South Kalimantan
208,620
7
2
22
15
UNEP/GEF/SCS/RWG-M.3/3
Annex 5
Page 4
Table 3
Data set, for mangrove sites from 5 countries, selected for cluster analysis, including
estimates for missing data. Area of the site and density of trees have been
transformed using a logarithmic transformation.
Trees
No
No.
Site
Present Zones - Spp
True
Area
Associations
Density >1.5m high Present Resident Resident
mangrove
Fish Spp. Bird Spp.
Spp.
/Ha
Cover
Trad Province
3.97
3
35
3.41
90
50
61
Thung Kha Bay - Savi
Bay
3.32
3
18
3.65
90
50
53
Pak Phanang Bay
3.84
3
15
3.64
95
50
30
Kung Kraben Bay
2.81
2
10
3.79
80
50
35
Pattani Bay
3.57
3
25
3.45
95
32
3
Ban Don Bay
3.57
3
19
2.82
90
75
57
Welu River Estuary
2
32
3.62
60
59
22
4.4
Hai Ninh
3.32
1
10
4.18
70
194
7
Tien Yen
3.63
1
14
4.18
80
194
7
Yen Hung
3.95
1
8
3.6
80
50
20
Cat Ba
2.6
1
5
4.18
90
50
69
Van Uc
3.13
1
7
4.4
90
143
5
Xuan Thuy
3.27
1
5
4.3
62
64
181
Can Gio
4.48
5
35
4
90
127
30
Thanh Phu
3.4
7
25
4
80
169
30
Soc Trang
3.16
7
24
3.85
80
33
119
Ca Mau
3.95
7
17
3.78
90
69
32
Sao Luoi
3.49
7
18
4.18
90
50
35
FE184
3.53
7
33
4.18
90
50
35
Kien Giang
3.76
7
20
4.3
70
50
35
Con Dao
1.72
6
23
4.18
90
100
65
Shangkou
2.89
2
15
4.08
90
24
28
Quinglangang
3.43
3
24
4.01
80
13
30
DongXhaiGang
3.25
3
24
3.93
80
15
43
Futien
2.05
3
10
4.01
80
24
28
Fangchenggang
3.13
3
15
4.83
95
20
42
Peam Krasop
4.52
4
50
3
80
20
34
Dong Peng-Botum
Sakor
4.73
3
50
3
70
29
30
Ream -Veal Rinh
4.53
3
74
3
60
20
30
Pasuquin
2.07
3
19
3
80
109
4
Busuanga
3.11
3
19
3
80
53
3
Ulugan
0
3
5
3
80
30
6
Dumaran
3.15
3
19
3
80
114
5

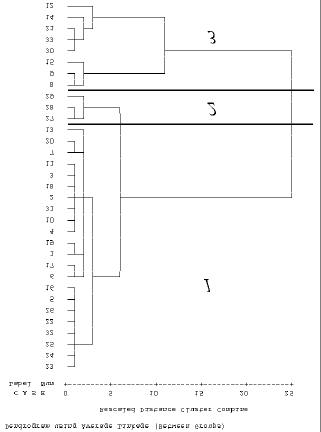
UNEP/GEF/SCS/RWG-M.3/3
Annex 5
Page 5
Figure 2
Dendrogram using average linkage between groups based on the transformed data
presented in Table 3.
Figure 3
Dendrogram using average linkage between groups based on the transformed data
presented in Table 3 but without the inclusion of the data set for resident bird species.
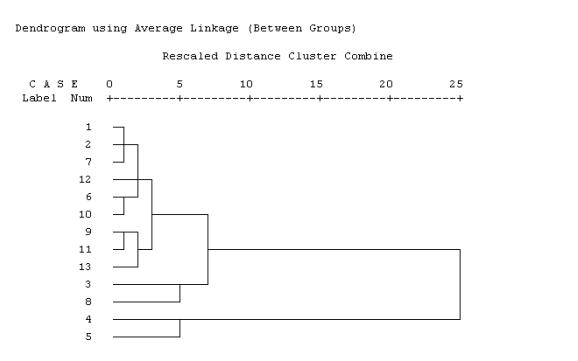
UNEP/GEF/SCS/RWG-M.3/3
Annex 5
Page 6
Table 4
Data set, for mangrove forest areas in 13 coastal Provinces of Indonesia bordering
the South China Sea, area of site transformed and presented as logarithms. Shaded
cells contain estimated values.
No. True
No.
No.
Site
Present
No. Bivalve
Area
Mangrove Crustacean.
Gastropod
Spp.
Spp.
Spp.
Spp
East Java
5
18
18
23
3
Central Java
5
18
17
20
5
West Java
5
24
33
15
39
Banten
4
16
10
46
101
DKI Jakarta
2
17
14
23
78
Lampung
4
12
21
7
7
South Sumatera
6
15
12
29
1
Babel
5
11
5
25
46
Jambi
5
15
10
15
25
Riau
6
23
31
11
9
West Kalimantan
6
22
3
6
17
Central Kalimantan
6
9
25
22
15
South Kalimantan
6
7
2
22
15
Figure 4
Dendrogram using average linkage between groups based on the transformed data
presented in Table 4.
UNEP/GEF/SCS/RWG-M.3/3
Annex 6
Page 1
ANNEX 6
Ranking Indicators and Weights for Determination of Priority within Clusters of
Potential Demonstration Sites
Background
The Focal Points in each Specialised Executing Agency assembled, in advance of the third Regional
Working Group meeting, data and information required to characterise mangrove sites bordering the
South China Sea. These data and information were based on the needs identified during the fi rst
regional Working Group meeting and listed in Annex 6 of the meeting report. The table is reproduced
here as appendix 1 for comparative purposes.
Examination of this table clearly indicates that the range of data and information, envisaged to be
assembled, in characterising mangrove sites, was both comprehensive and overlapping in terms of
various aspects of each major class of parameter. In considering the indicators to be used in ranking
the priority of sites within each cluster two major considerations were applied, the first the over-riding
need for transparency in the process of site selection and secondly the need to ensure that data were
comparable for all sites considered by the focal points in each country. The necessity for transparency
in the process means that the indicators used in ranking sites must be simple, and non-overlapping in
terms of the inherent characteristics covered by each indicator type. Hence the use of multiple
indicators such as genera and species of the same larger taxon should be avoided, as should the use
of any indicator, however important it might theoretically be, if such data cannot be supplied for the
majority of sites.
Choice of Indicators
Discussion of the choice of indicators was based on the preliminary sets of data and information
assembled for 37 mangrove sites and made available to the third meeting of the Regional Working
Group on Mangroves. The sites included: 7 from Thailand, 13 from Viet Nam, 3 each from Cambodia
and the Philippines 5, from China, and thirteen Provinces from Indonesia bordering the South China
Sea.
As noted in the meeting report, data and information for some parameters such as rates of change in
vegetation cover had not been assembled for most sites and such parameters were excluded from
the cluster analysis. In some cases these have also been excluded from the choice of indicators used
in the ranking process whilst in others they have been more broadly defined and included in the
choice of indicators. Hence rates of change in vegetation cover are available not at the site level but
for entire Provinces and districts and it was agreed that these data should be included in the site
characterisation information even though they refer more specifically to a wider region.
Table 1 lists the indicators selected by the Regional Working Group as being indicative of biological
diversity, transboundary, regional and global significance. An extensive discussion of the merits of
including area in this category resulted in agreement that area did reflect to some extent the
biodiversity present, although it was recognised that some very extensive mangrove stands in fact
had lower diversity than smaller transitional stands since they consisted in large part of extensive
areas of "mono-specific" formations.
The weighting to be assigned to the classes of indicator reflects the consensus view of members
concerning the relative importance of each class. Hence the indicators of biological diversity were
considered to merit greater weight than either transboundary, regional or global significance. It should
be recognised that in reality the indicators of transboundary, regional and global significance are in
fact indicators of biological diversity, hence this set of indicators is strongly weighted towards the
biological characteristics of the sites concerned.
UNEP/GEF/SCS/RWG-M.3/3
Annex 6
Page 2
Table 1
Indicators and weight for biological diversity, transboundary, regional and global
significance
Class of Indicator
Indicator scale
Score
1. Area maximum 35 points
1.1 Total existing natural mangrove area (ha)
< 500
501-1,000
1,001-5,000
5,001-15,000
>15,000
Score
7
14
21
28
35
2. Biological diversity 50 points
2.1 Species diversity Score maximum 30 points
2.1.1 True mangrove species
<10
11-20
21-30
31-40
>40
Score Maximum 14 points
1
3
6
10
14
2.1.2 Associate mangrove species
<10
11-20
>20
Score Maximum 4 points
1
2
4
2.1.3 Total fish species4
<50
51-150
>150
Score Maximum 4 points
1
2
4
2.1.4 Crustacean
<40
41-90
>90
Score Maximum 4 points
1
2
4
2.1.5 Resident bird species
<15
16-50
>50
Score Maximum 4 points
1
2
4
2.2 Community diversity 20 points
2.2.1 Number of zones or associations
1-2
3-4
>4
Score Maximum 11 points
3
6
11
2.2.2 Number of trophic levels below the top carnivore in
the terrestrial food chain 9 points
1-2
3-4
>4
Score Maximum 9 points
3
6
9
3. Transboundary significance 10 points
3.2 Number of migratory bird species incl.s/d seasonal
migratory spp and long distance migrators
<30
31-59
60-89
90-120
>120
Score Maximum 10 points
2
4
6
8
10
4. Regional/Global significance 5 points
4.1 Number of associate and true mangrove species
found only in the South China Sea
0.5 points for each endemic to a maximum of 2.5
Score Maximum 2.5 points
4.2 Number of endangered & threatened species
0.5 points for each endangered species to a maximum of 2.5
Score Maximum 2.5 points
Within each class of indicator a series of one or more specific indicators were identified on the basis
of the outcome of the initial site characterisations, hence indicators were not included when it was
apparent that the information and/or data were difficult to assemble as evidenced by the frequency of
missing data in the preliminary set.
Following a careful analysis of the range of values demonstrated by the site data available to the
meeting the Regional Working Group then considered the number of divisions and weighting that
would be appropriate to assign to any individual site value. Hence for example the number of
migratory bird species recorded from each site ranged from 13 at Trad Province in Thailand to 145
species at Fangchenggang in China. It was decided to distinguish five categories based on an
increment of 30 species and weights were assigned accordingly.
Table 2 lists the indicators selected by the Regional Working Group as being indicative of socio-
economic conditions including indicators of national priority, stakeholder involvement and threats. As
in the case of the environmental indicators the Regional Working Group discussed and agreed the
comparative weight that should be assigned to each class of indicator, then to individual indicators
within each class, finally deciding on the divisions and weights that should be assigned to the
observed values at any one site.
It was noted that a number of the indicators listed in Table 2 were highly subjective with, for example
the Thai sites being given equal weight in the column reflecting national priority. It was noted that
such an equal (and high) weighting not only influences the total score and hence rank, when
calculated regionally but also fails to distinguish between the comparative importance of sites ranked
equally.
UNEP/GEF/SCS/RWG-M.3/3
Annex 6
Page 3
Table 2
Indicators for socio-economic considerations including indicators of national priority,
stakeholder involvement and threats to be used in the ranking of mangrove sides
bordering the South China Sea
Indicator scale
Class of Indicator
Score
1. Threats
1. Change of area (% Lost over ten years)
0-5
6-10
11-25
>25
Score Ł max 20
20
15
10
5
2. Human population stress
0-40
41-199
200-400
>400
(population density, people/Km2) in
the site 10
Score Ł max 20
10
6
4
2
2. National significance/priority-Government support
1. National priority
Low
medium
high
Score Ł max 20
2
10
20
3. Financial considerations /co-financing
1. Project cost ($US) 10
<150,000
150,000
>150,000
Score Ł max 20
10
5
0
2. Co-financing commitment 10
<1:1
1:1
>1:1
Score Ł max 20
0
5
10
4. Stakeholders involvement 30
Local government (in cash/in-kind)
Low
medium
high
Score Ł max 8
2
5
8
Central government (in cash/in-kind)
Low
medium
high
Score Ł max 8
1
3
6
NGOs/Civil Society (in cash/in-kind)
Low
medium
high
Score Ł max 8
2
5
8
Private Sector (in cash/in-kind)
Low
medium
high
Score Ł max 6
1
3
6
Conclusion
Having applied the weighting and indicators to the initial data set the regional Working Group agreed
on the use of this selection in a two tier process with the indicators in Table 1 be used as the primary
means of ranking regional importance of sites within the clusters and the indicators in Table 2 being
applied at a later stage when final decisions are being made.
UNEP/GEF/SCS/RWG-M.3/3
Annex 6
Page 4
Appendix 1
Details of Parameters, Data and Information requirements for Mangrove Site
characterisation. Extract from Annex 6 of the report of the first meeting or the Regional
Working Group on Mangroves (UNEP/GEF/SCS/RWG-M.1/3)
Parameter
Data & Information needed
Lat. Long. central position of areas <50 Ha; GPS Boundary or number
Geographic information
Co-ordinates
(min 4) of paired co-ordinates for larger areas; end points for linear
strips.
Area
(Units Km 2 or Ha)
Physical Environment
Substrate (soil)
Proportion of sand, silt, clay
Bulk Density
Freshwater regime
Mean monthly rainfall (mm)
Mean monthly River discharge (m3sec-1)
Tidal regime
Range (m)
Diurnal, semi-diurnal, mixed
Slope
Degrees (tangent)
Temperature
Mean, max, min, monthly (oC)
Soil Salinity
Range (psu)
Water quality
Total suspended solids
Contaminant concentration/flux
Other parameters as available
Geomorphic class
Description, lagoon, tidal flats, estuaries, islands etc.
Environmental state
Present status
Vegetation Canopy Cover (% area)
Pressure (threats) Ł present
% loss of species or area or canopy cover in last five years
Pressure (threats) Ł future
Estimated future losses from known development plans
Social & use information
Ownership
Description: Federal, State, Community, private
Description: Land-use planning, Institutional framework, stakeholder
Management regime
co-ordination, forestry practices, restoration replanting, stakeholder
investment, fishery practices.
Current use
Description: Commercial, subsistence
Potential use
Alternative livelihoods
Significance/national importance
Use designation in national/state master plans
Biological data
Natural/Managed
Proportions of total area natural and replanted
Species diversity
(True) Mangrove11 tree species Density (no ha-1)
Crustacea Ł Crab genera, density
Molluscs Ł Bivalve genera, density
Molluscs Ł gastropods genera, density
Fish Ł Residents, species abundance
Fish Ł Transient for breeding, species abundance
Mammals, resident
Birds, resident species
Birds, migratory species
Reptiles, resident species
List others as available (eg mud lobster)
Genetic diversity
Heterogeneity
Formations Ł number of canopy layers (strata)
Average and range Height m, by species
Average and range Girth, cm by species
Zonation Ł number of zones by dominant species
Ecotones Ł average width m, major species
SCS Endemic species
List species and abundance
Endangered or threatened species
List species and abundance if data available
(IUCN criteria)
Stress-pressure Information
Intrinsic/internal sources of change
resident human population
Natural e.g. frequency of typhoon throw, change in allocthonous
sediment inputs, marine based flooding
Extrinsic/external sources of
Changes in catchment basin e.g. dam construction water diversion etc.
change
Rates of change, historical review
Rates of loss of cover and/or species over the period 1990-2000
Social and economic drivers of
Description, quantitative if possible e.g. pop'n growth, immigration,
change in environmental state
income/livelihood, demand/ consumption, management regime)
Economic valuation12
Values of direct use
Timber, charcoal, living marine resource extraction Yr 2000 local
currency total
Values of indirect use
Carbon sequestration, ecotourism, nursery areas for shrimps Yr 2000
local currency total
Values from environmental
Coastal protection, sediment stabilisation, water quality enhancement,
services
contaminant sink, reduction of wave energy & erosion,
Value of investment
Restoration, replanting
Values of potential (commercial)
sustainable use
Total Economic Value
Yr 2000 local currency total
Causal Chain analysis
11 Tomlinson, P.P.. 1986 Botany of Mangroves, Cambridge University Press.
12 Barbier, E.B. 1997. Economic Valuation of wetland: A guide for policy makers and planners. RAMSAR Convention Bureau, IUCN.
UNEP/GEF/SCS/RWG-M.3/3
Annex 7
Page 1
ANNEX 7
Results of Preliminary Ranking of Mangrove Sites Bordering the South China Sea
Background
The second meetings of the Regional Scientific and Technical Committee and the Project Steering
Committee agreed to a three-step process of selecting demonstration sites based on, an initial
clustering of similar sites followed by, ranking and determination of priority of sites within clusters.
Having agreed upon the nature of the indicators and the weight to be assigned to them the site
characterisations available to the third meeting of the Regional Working Group on Mangroves were
scored according to the agreed indicators and weights, presented and discussed in Annex 6 of this
report.
Results
Table 1 presents the outcome of this exercise for all thirty-three, site characterisations and the 13
coastal Provinces of Indonesia with respect to the indicators of biological diversity, transboundary,
regional and global significance. Due to the incomplete nature of the data sets, together with
differences in the definitions of the indicators used by each focal point it is not possible to combine the
outcome of the ranking at a regional scale, nor is it possible to include all indicators in the initial cluster
analysis at this time.
Within each national set of data however the comparative ranking reflects the regional importance of
each site. Where the data set for a particular site is incomplete then the rank score will be
automatically lower, this is particularly evident from a comparison of the Thai and Vietnamese rankings
where the highest scored Vietnamese site is comparatively low due to the absence of certain data
sets.
Table 1 presents two summary columns the first representing the rank with respect to biological
diversity, transboundary, regional and global significance and the second the grand total representing
the sum of the scores for both environmental, and socio-economic, classes of indicator. The first,
second and third highest scores are highlighted in green, blue and yellow respectively and it can be
seen that there is little apparent correlation between the rank determined via the environmental class
of indicators and the rank determined on the basis of the sum of the environmental and socio-
economic indicators.
Table 2 presents the rank scores for the socio-economic classes of indicator and it is apparent that the
scores assigned within each national grouping display little, cross-group comparability. In the case of
Thailand for example maximum scores are assigned to all sites for three of the indicators resulting in
these being of little overall value in determining priority either at the national or at the regional level. In
a number of instances these scores reflect inadequate data and information available to provide
concrete, objective measures of say NGO and Civil society support. This is not unsurprising since at
this stage the details of proposed interventions have still to be finalised.
Conclusions
The assignment of rank according to the agreed classes of indicators and their respective weighting
can be finalised promptly provided that the focal points submit the missing data to the PCU by the due
date.
UNEP/GEF/SCS/RWG-M.3/3
Annex 7
Page 2
Table 1
Comparative rank score for mangrove sites bordering the South China Sea based on site characterisations available to the third Regional Working Group meeting,
March 2003. Indicators of biological diversity, transboundary, regional, and global significance are included together with their total and the grand total of both
environmental and socio-economic indicators. Green indicates the highest, blue the second highest and yellow the third ranked sites rank in each national set.
South
GRAND TOTAL
SITES OR
Indication of
True
Associate
No. Zones
No.
Area
Total Crustacean Resident
Migratory China Sea Endangered TOTAL [Environmental &
LOCATIONS
required GEF
mangrove mangrove
or plant
Trophic
support
tree Spp.
Spp.
fish Spp
Spp.
bird Spp. associations levels bird Spp. Endemic
Spp.
Socio-economic
Spp.
indicators combined]
THAILAND
Trad
GEF funds
28
14
4
2
2
4
6
11
2
0
2
75.0
162.0
Tung Kha
National Pk
21
6
2
1
2
4
6
11
4
0
0
57.0
137.0
Pak Phranong Existing
28
6
1
2
2
2
6
11
4
0
1
63.0
148.0
Kung Kraben
Existing
14
3
1
1
2
2
3
11
2
0
0.5
39.5
132.5
Pattani
Existing
21
10
1
2
2
1
6
11
2
0
2.5
58.5
142.5
Bandon
GEF funds
21
6
2
2
2
4
6
11
2
0.5
2
58.5
130.5
Welu
Existing
35
10
1
2
2
2
3
11
4
0
0.5
70.5
137.5
VIET NAM
Hai Ninh
21
3
n/a
4
4
4
3
n/a
n/a
1
0
40.0
62.0
Tien Yen
21
3
n/a
4
4
n/a
3
n/a
n/a
1.5
0
36.5
48.5
Yen Hung
28
1
n/a
4
4
1
6
n/a
n/a
1
0
45.0
57.0
Cat Ba
7
1
n/a
n/a
4
4
3
n/a
n/a
1
0
20.0
60.0
Van Uc
7
1
n/a
4
4
4
3
n/a
n/a
0.5
0
23.5
37.5
Xuan Thuy
14
1
n/a
2
2
4
3
n/a
n/a
1
0
27.0
44.0
Can Gio
7
10
4
4
2
4
6
n/a
n/a
n/a
2.5
39.5
83.5
Thanh Phu
7
6
n/a
4
4
n/a
3
n/a
n/a
2
0
26.0
41.0
Soc Trang
14
6
4
1
n/a
n/a
6
n/a
n/a
2
1.5
34.5
39.5
Ca Mau
28
3
n/a
2
n/a
n/a
6
n/a
n/a
2
17
58.0
83.0
Sao Luoi
18
3
n/a
n/a
n/a
n/a
6
n/a
n/a
2
18
47.0
54.0
Kien Giang
19
10
n/a
n/a
1
n/a
6
n/a
n/a
0.5
2
38.5
38.5
Con Dao
20
n/a
n/a
n/a
n/a
n/a
3
n/a
n/a
n/a
n/a
23.0
40.0
CHINA
Qinlan Bay
21
6
2
1
2
3
3
11
4
0.5
2.5
56.0
96.0
Dongzai Bay
21
6
1
1
1
3
3
11
4
0
2.5
53.5
111.5
Fangchenggang
21
1
1
1
2
3
3
11
10
0
2.5
55.5
131.5
Shoukou
14
1
1
1
2
3
3
11
6
0
2.5
44.5
93.5
Futian
7
1
1
1
1
3
3
11
6
0
2.5
36.5
92.5
UNEP/GEF/SCS/RWG-M.3/3
Annex 7
Page 3
Table 1 continued.
Comparative rank score for mangrove sites bordering the South China Sea based on site characterisations available to the third
Regional Working Group meeting, March 2003. Indicators of biological diversity, transboundary, regional, and global significance are
included together with their total and the grand total of both environmental and socio-economic indicators. Green indicates the
highest, blue the second highest and yellow the third ranked sites rank in each national set.
South
GRAND TOTAL
Indication of
True
No. Zones or
[Environmental &
SITES OR LOCATIONS
Associate
Total fish Crustacean
Resident
No. Trophic Migratory China Sea
required GEF Area mangrove
Endangered Spp TOTAL
mangrove Spp
Spp
Spp
bird Spp
plant
levels
bird Spp Endemic
Socio-economic
support
tree Spp.
associations
Spp
indicators
combined]
CAMBODIA
Peam Krasop
35
6
2
1
2
2
6
n/a
n/a
n/a
n/a
54.0
105.0
Dong Peng-botum
Sakor
35
3
2
1
1
1
3
n/a
n/a
n/a
n/a
46.0
97.0
Ream Veal Rinh
28
6
1
1
1
2
3
n/a
n/a
n/a
n/a
42.0
93.0
PHILIPPINES
Pasuquin
7
n/a
n/a
2
n/a
n/a
n/a
n/a
n/a
n/a
n/a
9.0
74.0
Busuanga
21
3
2
4
n/a
1
n/a
n/a
n/a
n/a
n/a
31.0
83.0
Uluanga
21
1
n/a
4
n/a
n/a
n/a
n/a
n/a
n/a
n/a
26.0
69.0
Dumaran
21
3
n/a
n/a
n/a
n/a
n/a
n/a
n/a
n/a
n/a
24.0
46.0
INDONESIA
East Java
35
3
1
2
1
1
6
3
4
1
1
58.0
114.0
Central Java
35
3
1
1
1
1
11
6
2
0.5
0.5
62.0
118.0
West Java
35
6
1
2
1
4
6
3
6
0.5
1
65.5
123.5
Banten
35
3
2
1
1
4
3
3
2
0.5
1
55.5
113.5
Jakarta
7
3
2
1
1
4
3
6
2
0.5
1
30.5
91.5
Lampung
35
3
1
1
1
1
6
9
4
1
1.5
63.5
119.5
South Sumatra
35
3
1
2
1
2
11
9
8
2
2
76.0
124.0
Babel
35
3
1
1
1
1
6
6
4
0.5
1
59.5
134.5
Jambi
35
3
1
1
1
1
11
9
8
2.5
2.5
75.0
146.0
Riau
35
6
1
1
1
2
11
9
6
2
2.5
76.5
138.5
West Kalimantan
35
6
1
2
1
4
11
9
4
2.5
1
76.5
147.5
Central Kalimantan
35
1
1
1
1
1
11
9
4
1.5
1
66.5
122.5
South Kalimantan
35
1
1
1
1
2
11
9
4
2
1
68.0
117.0
UNEP/GEF/SCS/RWG-M.3/3
Annex 7
Page 4
Table 2
Com parative rank score for mangrove sites bordering the South China Sea, based on site characterisations available to the third Regional Working Group
meeting, March 2003. Indicators of national priority, stakeholder involvement and threats are included together with their total and the grand total of both
environmental and socio-economic indicators. Green indicates the highest, blue the second highest and yellow the third ranked sites rank in each national set.
GRAND TOTAL
SITES
Indication of Rate of Human National
Local
Central
NGO civil
Private
[Environmental &
LOCATIONS
required GEF
Government
Government
society
support
change stress
priority Cost co-finance
support
support
involvement
sector
TOTAL
Socio-economic
indicators combined]
THAILAND
Trad
GEF funds
20
10
20
10
5
8
3
8
3
87
162.0
Tung Kha
National Pk
20
6
20
10
5
5
6
5
3
80
137.0
Pak Phranong
Existing
20
6
20
10
10
5
6
5
3
85
148.0
Kung Kraben
Existing
20
10
20
10
5
8
6
8
6
93
132.5
Pattani
Existing
20
10
20
10
5
5
6
5
3
84
142.5
Bandon
GEF funds
20
6
20
10
0
5
3
5
3
72
130.5
Welu
Existing
20
4
20
10
0
2
3
5
3
67
137.5
VIET NAM
Hai Ninh
20
n/a
2
n/a
n/a
n/a
n/a
n/a
n/a
22
62.0
Tien Yen
10
n/a
2
n/a
n/a
n/a
n/a
n/a
n/a
12
48.5
Yen Hung
10
n/a
2
n/a
n/a
n/a
n/a
n/a
n/a
12
57.0
Cat Ba
20
10
10
n/a
n/a
n/a
n/a
n/a
n/a
40
60.0
Van Uc
10
2
2
n/a
n/a
n/a
n/a
n/a
n/a
14
37.5
Xuan Thuy
5
2
10
n/a
n/a
n/a
n/a
n/a
n/a
17
44.0
Can Gio
20
4
20
n/a
n/a
n/a
n/a
n/a
n/a
44
83.5
Thanh Phu
15
n/a
n/a
n/a
n/a
n/a
n/a
n/a
n/a
15
41.0
Soc Trang
5
n/a
n/a
n/a
n/a
n/a
n/a
n/a
n/a
5
39.5
Ca Mau
5
10
10
n/a
n/a
n/a
n/a
n/a
n/a
25
83.0
Sao Luoi
5
2
n/a
n/a
n/a
n/a
n/a
n/a
n/a
7
54.0
Kien Giang
n/a
n/a
n/a
n/a
n/a
n/a
n/a
n/a
n/a
0
38.5
Con Dao
5
2
10
n/a
n/a
n/a
n/a
n/a
n/a
17
40.0
CHINA
Qinlan Bay
10
2
10
0
10
2
3
2
1
40
96.0
Dongzai Bay
15
4
10
0
10
5
6
5
3
58
111.5
Fangchenggang
15
6
20
0
10
8
6
5
6
76
131.5
Shoukou
20
4
2
0
10
2
6
2
3
49
93.5
Futian
20
2
2
0
10
8
6
5
3
56
92.5
UNEP/GEF/SCS/RWG-M.3/3
Annex 7
Page 5
Table 2 continued.
Comparative rank score for mangrove sites bordering the South China Sea, based on site characterisations available to the third Regional Working
Group meeting, March 2003. Indicators of national priority, stakeholder involvement and threats are included together with their total and the grand
total of both environmental and socio-economic indicators. Green indicates the highest, blue the second highest and yellow the third ranked sites
rank in each national set.
GRAND
TOTAL
SITES
Indication of Rate of Human National
Local
Central
NGO civil
Private
[Environmental &
LOCATIONS
required GEF change stress priority Cost co-finance Government
Government
society
sector
TOTAL
support
support
support
involvement
Socio-economic
indicators
combined]
CAMBODIA
Peam Krasop
15
n/a
20
n/a
n/a
2
3
8
3
51
105.0
Dong Peng-
botum Sakor
15
n/a
20
n/a
n/a
2
3
8
3
51
97.0
Ream Veal
15
n/a
20
n/a
n/a
2
3
8
3
51
93.0
Rinh
PHILIPPINES
Pasuquin
15
6
20 10
n/a
8
3
2
1
65
74.0
Busuanga
n/a
6
20 10
n/a
8
n/a
2
6
52
83.0
Uluanga
n/a
6
20
n/a
n/a
n/a
3
8
6
43
69.0
Dumaran
n/a
6
10
n/a
n/a
n/a
1
2
3
22
66.0
INDONESIA
East Java
5
2
20
5
5
5
8
5
1
56
114.0
Central Java
5
2
20
5
5
5
8
5
1
56
118.5
West Java
5
2
20
5
5
5
8
5
3
58
123.5
Banten
5
2
20
5
5
5
8
5
3
58
113.5
Jakarta
5
2
20
5
5
8
5
5
6
61
91.5
Lampung
5
2
20
5
5
5
8
5
1
56
119.5
South Sumatra
5
4
10
5
5
5
8
5
1
48
124.0
Babel
20
6
20
5
5
5
8
5
1
75
129.5
Jambi
15
10
20
5
5
5
5
5
1
71
146.0
Riau
15
6
10
5
5
5
8
5
3
62
138.5
West
20
10
10
5
5
5
5
5
6
71
147.5
Kalimantan
Central
20
10
10
5
5
5
5
5
1
66
122.5
Kalimantan
South
15
6
2
5
5
5
5
5
1
49
117.0
Kalimantan
UNEP/GEF/SCS/RWG-M.3/3
Annex 8
Page 1
ANNEX 8
Schedule of Meetings, Workplan and Timetable for the Mangrove Focal Points, 2003
Table 1
Schedule of meetings for 2003
M T W T F S S M T W T
F
S
S M T
W T
F
S
S
M T
W T
F
S
S
M T
W T
F
S
S
M
January
1
2
3
4
5
6
7
8
9
10
11
12 13
14
15
16
17 18
19
20
21
22 23
24
25
26
27 28
29
30
31
February
1
2
3
4
5
6
7
8
9
10
11
12
13
14 15
16
17
18
19 20
21
22
23
24 25
26
27
28
Chinese N.Y.
March
1
2
3
4
5
6
7
8
9
10
11
12
13
14 15
16
17
18
19 20
21
22
23
24 25
26
27
28
29 30
31
RWG-M-3
RWG-S-3
RWG-W-3
RWG-C-3
April
1
2
3
4
5
6
7
8
9
10
11
12
13 14
15
16
17
18 19
20
21
22
23 24
25
26
27
28 29
30
RWG-F-3
Thai N.Y.
RWG-LbP-3
May
1
2
3
4
5
6
7
8
9
10
11 12
13
14
15
16 17
18
19
20
21 22
23
24
25
26 27
28
29
30
31
RSTC-3
June
1
2
3
4
5
6
7
8
9
10
11
12
13 14
15
16
17
18 19
20
21
22
23 24
25
26
27
28 29
30
July
1
2
3
4
5
6
7
8
9
10
11
12
13 14
15
16
17
18 19
20
21
22
23 24
25
26
27
28 29
30
31
August
1
2
3
4
5
6
7
8
9
10 11
12
13
14
15 16
17
18
19
20 21
22
23
24
25 26
27
28
29
30 31
RWG-LbP-4
September 1
2
3
4
5
6
7
8
9 10
11
12
13
14 15
16
17
18
19 20
21
22
23
24 25
26
27
28
29 30
RWG-F-4
RWG-S-4
RWG-C-4
October
1
2
3
4
5
6
7
8
9
10
11
12 13
14
15
16
17 18
19
20
21
22 23
24
25
26
27 28
29
30
31
Cont.
RWG-W-4
RWG-M-4
Ramadan
November
1
2
3
4
5
6
7
8
9
10
11
12
13
14 15
16
17
18
19 20
21
22
23
24 25
26
27
28
29 30
Ramadan
December
1
2
3
4
5
6
7
8
9 10
11
12
13
14 15
16
17
18
19 20
21
22
23
24 25
26
27
28
29 30
31
Regional
RSTC-4
PSC-3
Sci. Mtg
Xmas
UNEP/GEF/SCS/RWG-M.3/3
Annex 8
Page 2
Table 2
Workplan and Timetable for completion of agreed activities in the Mangroves Sub-component: 2002 - 2003 Numbers refer to specific outputs listed
in the accompanying key. Cells highlighted in red indicate time of production of national outputs. Cells highlighted in green indicate regional
deadlines.
Year
2002
2003
Quarter
1st
2nd
3rd
4th
1st
2nd
3rd
4th
Month 1
2
3
4
5
6
7
8
9
10 11 12
1
2
3
4
5
6
7
8
9
10 11 12
NATIONAL ACTIVITIES
National Committee meetings
x
x
x
x
x
x
x
x
x
x
x
x
x
x
x
x
x
x
x
x
x
x
x
x
NTWG Meetings
x
x
x
x
x
x
x
x
Review National Reports
Review of past and ongoing projects
1
2
3
Review of national data and information
4
5
6
Creation of National metadatabase
Review National legislation
Review National level management
x
x
regimes
Preparation Of demo site proposals
Identification & characterisation of "sites"
7
8
Review National Criteria & priorities
Review economic valuation data &
information
Review threats at site level & prepare
causal chain analyses
Identify proximate to ultimate cause by
source
National Prioritisation
Identify priority points of intervention
Evaluate barriers and possible solutions
Finalisation of elements of the SAP
Preparation/revision of the National Action
Plan
REGIONAL ACTIVITIES
Regional GIS database related tas ks
Regional Criteria development
x
Development of Regional Priorities
Meetings RWG-M
X
Finalisation of the Regional SAP
UNEP/GEF/SCS/RWG-M.3/3
Annex 8
Page 3
Key to Numbered Outputs Scheduled in Table 2 of the Workplan and Timetable of Agreed
Activities in the Mangroves Sub-component.
1.
Final drafts of Review of Past & Ongoing projects to PCU
2.
External review of Review of Past & Ongoing projects
3.
Final draft for publication of Review of Past & Ongoing projects
4.
Final drafts of Review of National Data and Information to PCU
5.
External review of Review of National Data and Information
6.
Final draft for publication of Review of National Data and Information
7.
First draft of full demonstration site proposals
8.
Final draft of demonstration site proposals