
REBYC
Reduction of Environmental Impact from Tropical Shrimp Trawling, through the introduction of By-catch
Reduction Technologies and Change of Management
(EP/GLO/201/GEF)
Nigeria
Progress Report to the Project Coordinator
EP/GLO/201/GEF
2005
___________________________________________________________
FOOD AND AGRICULTURE ORGANIZATION OF THE UNITED NATIONS

EP/210/GLO/GEF Ł Nigeria.
REDUCTION OF ENVIRONMENTAL IMPACT FROM TROPICAL SHRIMP
TRAWLING THROUGH THE INTRODUCTION OF BYE-CATCH
REDUCTION TECHNOLOGIES AND CHANGE OF MANAGEMENT.
FUNDING:
GLOBAL ENVIRONMENTAL FACILITY (GEF)
IMPLEMENTING:
UNITED NATIONS ENVIRONMENTAL PROGRAMME (UNEP)
EXECUTING:
FOOD& AGRICULTURE ORGANISATION (FAO); FEDERAL
DEPARTMENT OF FISHERIES (FDF); NIGERIAN INSTITUTE OF
OCEANOGRAPHY & MARINE RESEARCH (NIOMR);
RELEVANT AGENCY IN CAMEROON.
National Institutions
-
FDF & NIOMR
National Steering Committee -
G.N.Shimang (Director FDF - Chairman)
National Coordinator
-
Mr. J.C. Ogbonna
Consultant (Nigeria)
-
A.A. Aderounmu (FFS)
MCS
-
Mr. A.V. Amire (FDF)
Technology
-
Dr. B.B. Solarin (NIOMR)
Socioeconomics
-
Mr. P. Aboheyere (NIOMR)
Statistics
-
Mr. B.C. Udeh (FDF)
-
Mrs. T.O. Esan (FDF)
1
EP/201/GLO/GEF Ł Nigeria: Reducing Environmental Impact from TROPICAL
Shrimp Fisheries through the use of By-Catch Reduction Technologies and
change in management.
The Nigerian Marine Industrial Fisheries operate about 240 registered
fishing/shrimping vessels which exploit the living marine resources of the Nigerian
Inshore waters and the EEZ. Some of these vessels are also licensed to fish in the
marine waters of other neighbouring countries like Cameroon, Gabon, Equitorial
Guinea and Benin Republic Ł all in the Gulf of Guinea region. All the vessels carry on
dermersal trawling for shrimps and fish including crustaceans but a few do paired
trawling to harvest the pelagic and midwater species.
The shrimp resources are fairly rich and made up of:-
Panaeus notialis
-
White Shrimp
Panaeus Keraturus
-
Tiger Shrimp
Parapenaropsis Atlantic -
Brown Shrimp - (carry carry)
Panaeus monodon
-
Giant Tiger Shrimp
The annual harvest of these shrimps yield about 12.500 mt of which about 7,000 mt is
exported and yielding $50 million. It is pertinent to note that only 15% of registered
fleet are licensed for fishing operations even on that the fishing vessels land
significant amount of shrimps are mainly to the use of unregulated nets.
While trawling for shrimps, there are a lot of incidental catches ranging from mature
food fish to juveniles of the same variety. Because Nigerian fisheries is multispecies,
small sized fish (but adults) of certain species are also caught along with the juveniles
of target species of food fish.
The landing of these juveniles has negative effect on recruitment and species diversity
and therefore makes shrimp trawling in its current form unsustainable.
In Nigeria, the quantum of discards of immature, undersized fishes is minimal; this so-
called trash is bought and processed (smoked) by canoe fishermen with the result that
very efficient fish trash markets have developed along the coasts even into the
2
hinterland. The level of landing of By Catch occasioned by shrimping operations has
always remained more of educated guess work in Nigeria. What is very clear is that
during trawling canoes surround the fishing trawlers to buy off the unsortable catch,
which could be anything from debris, juveniles of large food fish and mature small
sized fish.
The purpose of the project is therefore to investigate the level of trash in the overall
catch and take appropriate management/regulatory decision that would make shrimp
trawling sustainable by using environmentally mitigating technologies.
The project in Nigeria was hinged on three broad components;
1. Data Collection
2. Socioeconomic.
3. Technology
The Federal Department of Fisheries implemented the data collection while NIOMR
is carrying on with the other two components.
FDF
The National Co-coordinator of the project is domiciled in the FDF.
The activities under FDF were as follows:
1. Improved routine shore-based collection of fisheries statistics (over an
annual cycle).
2. Collection of on-board fisheries statistics over an annual cycle.
3. Conduct at least three Steering Committee Meetings.
4. Initiation of a campaign for wide-spread introduction of use of appropriate
BRD.
5. Compilation of existing fisheries regulation plus measures for ongoing
MCS of shrimp trawl fisheries.
3
Workshops/Meetings attended/Organized during the period.
4

5
There has been several consultation and workshops;
a. Scheduled to attend International Project Steering Committee in Guaymas,
Mexico September 2002.
b. Consultation in Rome in December 2002 with Mr. Mann and others
c. Attended Shrimp Bye-Catch workshop in Mombassa ŁKenya Ł 13th Ł 15th April
2003.
d. Steering Committee Meetings: 1st Inauguration and first meeting July, 2003
2nd Meeting 11th Ł 12th March, 2004
3rd Meeting 11th Ł 12th August, 2004
Attendance in the meetings was always complete. Fishing Companies and staff of
FDF & NIOMR always joined to make the meeting very vibrant. NIOMR provided
the facilities for the meeting in terms of meeting hall and public address system.
e. Workshop in Thailand on JTEDs was attended by two Nigerian candidates i.e.
B.B. Solarin and E.E. Ambrose.
f. Two missions were received during the period
i. Mr. Broadhurst
-
27th May Ł 3rd June, 2004
ii. Thomas Moth-Poulsen
-
4th Ł 12th Nov. 2004
2. Collection of shore-based Fisheries Statistics.
A format for the collection of fish landing data was designed and administered to
collect data from fishing/shrimping trawlers.
Information was gathered on 224 vessels.
Result: The result of the activities carried out between August 2003 to July 2004 is as
follows;
a. Size of vessels
-
(24 Ł 26.6)m LOA
b. GRT
-
130 - 150
6
c. Number of fishing days
-
43,621
d. Quantity of fish landed
-
5,700,901.3 kg (5,701 mt.)
e. Quantity of Shrimp landed
-
5,703,032 kg (5,703 mt.)
f. Quantity of Mix
-
11,065,612.5 kg (11,066 mt.)
g. Total Landings
-
22,469,546.25kg (22,470 mt.)
h. Percentage composition of Bye-Catch -
74%
i. Fishing Hours
-
761,192.6 Hrs
j. Catch per fishing day
-
515.11 Kg/Day
k. Catch Per Unit Effort (CPUE)
-
29.52 Kg/Hr.
Fish Landing Data for Shrimp and Bye- Catch for August 2003 to July 2004 (kg)
MONTH PRAWNS CROAKER SOLE
SHARK RAY
CATFISH GROUPER
Aug-03
478988
219552
151124
8326
3671
5120
249
Sep-03 459159.2
271925.5
212943
28722
3348
10260
510
Oct-03 385312.4
304324
205086
24496
11246
6544
1413
Nov-03 390855.4
246648
112248
16017
3673
6016
1007
Dec-03
349992
239882.4
157326
16629
2860
10321
875
Jan-04 310929.6
215044.7
106346
5790.5
4439
4140
112
Feb-04 370260.4
196975.5 121582.5
2619
4267
8001
241.5
Mar-04 510019.3
199251.8 117741.5
1986
4516
4980
257.5
Apr-04 512794.4
64113.8 108034.5
6578
26073
22425
557
May-04 545816.5
110756.5
128379
7450.5
1402
3860
1051
Jun-04
525093
170078 132779.5
10832
7195
2489
2364
Jul-04 863812.3
283360.5
236907
3402
9096
4289
5482
TUNA
CRAB
LOBSTER CUTTLE MIX I
MIX II
MIX III
MIX IV
1995 48112.4
305
58816
164940
120890
244470
254800
1935 77827.5
514
52734
227688
152672
311379
416164
1740 75142.5
175 38295.6 264427.5
164060
350464
450431
2489
82431
153
28640
167053
86760
218717
303665
142
38852
44 12556.8
182612
72740
229270
271536
160
24093
294
11357
219063
114698
272769
354763
123 52147.5
227 14068.8
162058
72946
235031
324021
178
57130
288 15396.8
184077
67589
261369
404523
730 67480.5
628.5 11017.2
158319
90260 267677.5
394876
3660
41020
153 18099.4
154216
78510
275106
354794
3549
52818
373 21109.9 191703.5
111498 273403.5
360820
4681.5 84304.5
8662 54644.2
223259
116300 318406.5
368818
7
PRAWNS
Shrimp/Fish Landings For Aug. 2003 - Jul. 2004 CROAKER
SOLE
1000000
SHARK
RAY
800000
CATFISH
600000
GROUPER
400000
TUNA
200000
CRAB
0
LOBSTER
CUTTLE
MIX I
MIX I
Aug-03Sep-03Oct-03Nov-03Dec-03Jan-04Feb-04Mar-04Apr-04May-04Jun-04Jul-04
MIX II
MIX IV
SHRIMP/FISH DATA CHART AUG.2003 - JUL. 2004
PRAWNS
CROAKER
SOLE
20%
SHARK
26%
RAY
CATFISH
GROUPER
TUNA
14%
CRAB
11%
LOBSTER
CUTTLE
6%
MIX I
8%
10%
MIX I
1%3%
MIX II
MIX IV
8
Monthly Total Bye-Catch/Prawn Landings (kg.)
BY-Catch
PRAWNS
MONTH
1,282,370.4
478,988
Aug-03
1,768,622
459,159.2
Sep-03
1,897,844.6
385,312.4
Oct-03
1,275,517
390,855.4
Nov-03
1,235,646.2
349,992
Dec-03
1,333,069.2
310,929.6
Jan-04
1,194,308.8
370,260.4
Feb-04
1,319,283.6
510,019.3
Mar-04
1,218,770
512,794.4
Apr-04
1,178,457.4
545,816.5
May-04
1,341,012.4
525,092.95
Jun-04
1,721,612.2
863,812.3
Jul-04
A very clear pattern of percentage landing showed that lowest catch of shrimp
was in December Ł January Ł February and catches started to appreciate in
March and peaked in July before coming down from September through
November. It is yet to be established whether shrimping during the lean months
brings the desired economic returns. However when the monthly shrimping
landing was plotted, a slightly different pattern was desired i.e. the peak
production was in July.
9
Monthly Catch of Prawns and Bye-Catch for Aug. 2003 - Jul.
2004
2000000
1800000
1600000
1400000
1200000
1000000
PRAWNS
800000
BY-Catch
600000
400000
200000
0
Aug-03Sep-03Oct-03Nov-03Dec-03Jan-04Feb-04Mar-04Apr-04May-04Jun-04Jul-04
Landing Data for Shrimp and Bye-Catch for Aug. 2003 - July
2004.
27%
BY-Catch
PRAWNS
73%
If this data is taken as it is 27% to 73% by volume, the fishers would have fish in line
with government fish/shrimp ratio 25/75% provided for as in the regulation. However
the issue lies in the composition of the bye-catch which is dominated by juveniles of
commercially important species.
10
3. ONBOARD DATA COLLECTION:
11
Training of Data Collectors.
As a prelude to the collection of data on board shrimping vessels, a 5 day training
workshop was organized for Data Collectors in order to equip them for on-board data
collection. Twenty-two Fisheries Assistants were expected to be trained but forty-nine
candidates were issued certificates as follows:-
NIOMR
-
5
FCFMT
-
12
FDF
-
25
Industry
-
7
This was understandable because many of these personnel have not had this type of
training for a long time. The training itself emphasized practicals on fish
identification, sampling methods, sorting/measurement/recording of fish catch data by
Data Collectors on board fishing vessels and general guidelines on board fishing
vessels. It is necessary to state right away that the industry had reservations in putting
observers on board. This delayed the take-off of the observer programme until January
2004. However from that month on the industry had been a willing partner.
4. On-Board Data Collection.
After the training, 22 Data Collectors were deployed to 11 major fishing companies.
However, 4 of the candidates declined to participate leaving only 18 Collectors.
Furthermore, two other student observers left for school at various times.
The result of the On-Board data collection is as listed below:
a. Size of vessels
-
(24 Ł 26.6) m LOA
b. GRT
-
130 - 150
c. Number of fishing days
-
2479
d. Quantity of fish landed
-
1,497,863.51 kg (1,498 mt)
e. Quantity of Shrimp landed
-
385,883.8 kg (386 mt)
f. Quantity of Mix
-
702,317 kg (702 mt)
g. Mix III & IV
- 510,758 kg (510 mt)
12
h. Total Landings
-
1,883,747.31 kg (1,884 mt)
i. Percentage composition of Bye-Catch -
80%
j. Fishing Hours
-
40,609 Hrs
k. Catch per fishing day
-
759.88 Kg/day
l. Catch Per Unit Effort (CPUE)
-
46.39 Kg/Hr.
The sorting/grading of fish into sizes especially the commercially important species
has over the years followed a very interesting pattern. Twenty years ago when trips
are made between 28 Ł 35 days, sorting used to be in the form of;
-
Large
-
Medium
-
Small
-
Mixed/or Miscellaneous fish
Later as fishing trips started lasting up to 40 Ł 45 days, the mix became disaggregated
into Mix I & II but Mix III was rare. With fishing trips getting as long as 55 Ł 60 days
Mix III Mix IV became prominent. By this period CPUE /day have become relatively
small; there was enough time to sort/grade the smallest fish in the haul. The bottom
line of this is that the so-called Mix III and IV are virtually not different from the
completely ungraded trash/miscellaneous.
MONTH PRAWNS CROAKER SOLE
SHARK RAY
CATFISH GROUPER TUNA
JAN.04
572
560
140
20
FEB.04
3846
1380
1200
44.97
118
84
26.61
MAR.04
49951.8
17473
14040
300
172
418
21
195
APR.04
39067.8
10000
18940
400.43
360
4960
15
MAY.04
50399
10063
9940
1075
60
383.5
158
3915
JUN.04
32727.2
12758
15702
140
145
460
100
30.5
JUL.04
28050
5470
5710
731
52
220
15
33
AUG.04
6948
1322
1248
76.3
38.1
SEPT.04
110862
20605
18957
833
83
143
43
60
OCT.04
10342
5490
6486
20
80.6
80
NOV.04
17100
13284
9037
457
404
240
29.5
90
DEC.04
36,018
4792.8
4088
36.7
70.6
303.7
8.8
3.8
13
CRAB
LOBSTER CUTTLE MIX I
MIX II
MIX III
MIX IV
TRASH/MISC.
560
620
900
20
100
1347
186
1000
2560
3160
1640
1447
15215
106
4018.8
20210
4720
30245
72092
45740
8663.5
10
716
9670
14490
25200
48530
56371
11249
21
883
18060
6600
25110
35030
49058
2327
73
2145.6
11774
10388
25792
33002
104570
9651
1592
7460
9908
13170
13070
41500
11
816
960
540
340
120
500
5137.5
204
6358.8
22070
12700
39025
48993
78582
1764
40
890
3240
4360
6720
5260
44260
1466.5
30
442.4
9332
11037
24829
38150
26875
1554
12.1
2132
5500
3800
10500
9860
41041.38
SHRIMP/FISH DATA CHART
PRAWNS
JAN.2004 - DEC. 2004
CROAKER
SOLE
120000
SHARK
100000
RAY
CATFISH
80000
GROUPER
60000
TUNA
CRAB
40000
LOBSTER
20000
CUTTLE
MIX I
0
MIX I
MIX I I
JAN.04FEB.04
MIX IV
MAR.04APR.04MAY.04JUN.04JUL.04AUG.04
SEPT.04
OCT.04NOV.04
DEC.04
TRASH/MISC.
Three prawn production peaks are discernable from the graph Ł July, September and
October with the highest production in September. Production of both shrimps and
bye-catch were very low in January and February.
14
SHRIMP/FISH DATA CHART
JAN.2004 - DEC. 2004.
PRAWNS
CROAKER
SOLE
21%
27%
SHARK
RAY
CATFISH
GROUPER
5%
TUNA
CRAB
6%
LOBSTER
CUTTLE
3%
16%
MIX I
1%
MIX II
4%
6%
11%
MIX III
MIX IV
TRASH/MISC.
Trash/Misc, Mix III and Mix IV constitute 54% production while commercially
important species like the Soles, Croakers and Groupers constitute only 17%. Only
species that were up to 1% of the total catch were indicated.
The comparism of the volume of bye-catch/shrimp landing showed that bye-catch
overshot the legal volume of 75% as stipulated in the fishing regulation.
Bye-Catch
Shrimp
1,497,864
385,883.8
Percentage Composition of Shrimp
and Bye-Catch for Jan. 2004 - Dec.
2004
20%
Bye-Catch
Shrimp
80%
15
Information was collected on quantity of fish landed and quantity that could not be
sorted further. It is from this last category that the crew of fishing vessels make private
money by selling to artisanal fishermen who are always available. On occasions where
there are no buyers the unsorted fish is thrown overboard as trash. It is pertinent to
note that these occasions were very rare. However this class of fish (so called Trash)
formed 27% of the total landings higher than the prawns and other species of premium
food fish.
TRASH COMPOSITION
A look at the composition of the trash fish shows that only juveniles of large species
occurred in significant percentages e.g. the Croakers Ł 27%, Silver fish Ł 13%,
Treadfins Ł 11%, Soles Ł 9%, Grouper Ł 5%, while the genetically small fish big eye
4%, Sardinella Species 2% and the rest less than 2%.
SN Species
Frequency Percentage
1
Albula vulpes
1
0
2
Alectis alexandrinus
13
1
3
Arius heudeolitti
1
0
4
Batrachoides spp.
1
0
5
Bothus guibei
6
0
6
Bothus podas africanus
10
1
7
Brachydeuterus auritus
51
4
8
Caranx bicolor
1
0
9
Caranx carangus
1
0
10 Caranx chrysos
14
1
11 Caranx hippos
2
0
12 Caranx lugubris
1
0
13 Caranx senegal us
11
1
14 Chaetodipterus goreensis
1
0
15 Chloroscombrus chrysurus
47
4
16 Cynoglossus browni
32
3
17 Cynoglossus cadenati
9
1
18 Cynoglossus senegalensis
16
1
19 Cynoponticus ferox
24
3
20 Dasyatis margarita
2
0
21 Dentex angoensis
1
0
22 Dentex congolensis
1
0
16
23 Drepane africana
70
6
24 Elops lacerta
3
0
25 Ephipus goreensis
1
9
26 Epinephelus aeneus
31
3
27 Ethmalosa fimbriata
13
1
28 Eucinostomus melanopterus
4
0
29 Galeoides decadactylus
150
12
30 Ilisha africana
18
1
31 Lagocephalus laevigatus
14
1
32 Mugil cephalus
9
1
33 Ophichthus ophis
1
0
34 Pagel us bel oti
1
0
35 Pegusa cadenati
8
1
36 Pentanemus quinquarius
12
1
37 Platycephalus gruveli
9
1
38 Platycephalus lavigatus
8
1
39 Pomadasys jubelini
37
3
40 Pseudepeneus prayensis
7
1
41 Pseudolithus senegalensis
10
1
42 Pseudopeneaus prayensis
1
0
43 Pseudotolithus brachygnathus
11
1
44 Pseudotolithus elongatus
39
3
45 Pseudotolithus epipercus
2
0
46 Pseudotolithus moori
16
1
47 Pseudotolithus senegalensis
114
9
48 Pseudotolithus typus
82
6
49 Pteroscion peli
30
2
50 Raja miraletus
11
1
51 Sardinela maderensis
15
1
52 Sardinel a eba
1
0
53 Scomberomerus tritor
15
1
54 Scyris alexandrinus
17
1
55 Selar crumenoptthalmus
1
0
56 Selene dorsalis
61
5
57 Sphyraena guachancho
16
1
58 Sphyraena sphyraena
1
0
59 Symphurus liguatus
1
0
60 Syphurus nigrescens
1
0
61 Trachinotus trachinotus
2
0
62 Trachinus lineolatus
1
0
63 Trichiurus lepturus
167
13
64 Trophius val ianti
1
0
65 Uranoscopi pol i
1
0
66 Vomer setapinnis
14
1
17
One obvious conclusion from the data collection exercise is that high level of trash
production is not healthy and something positive need to be done to reduce the trash
fish production. The pertinent question is what to do with the beneficiaries of these
trash fish markets.
A few incidentals were reported by the observers which management is looking into
and this includes;
i. Violent attacks by pirates and one occasion an observer was shot at.
ii. All the vessels carried the required TEDs but only seldomly used them
iii.
Many vessels often purposely ventured into the non-trawl zone to scoop
shrimps (Parapaenopsis atlantica) mainly and small fish (Juveniles)
iv.
Some of the vessels were aging and often had broken voyages
v.
Vessels now stay at an average of 60 days and at Sea for a complete
fishing trip compared to the usual 30 days.
PUBLIC ENLIGHTENMENT.
Initiation of Campaigns for widespread use of Bye-Catch Reduction Devices.
In all the pre-commencement meetings the harmful effects of the current methods of
shrimp trawling were highlighted. Visits were paid to fishing companies and the Chief
Executive Officers of the companies were individually sensitized.
The FAO had fielded consultants to Nigeria and they have helped a lot by going
around fishing companies to show the efficiency of the new net modifications Ł BRDs
and to further highlight the advantages of using the BRDs.
The climax of the campaign is the production of a flyer which details the focus and
expected output of the project, the advantages of the use of BRDs and the dire
consequences of fishing in a non sustainable manner. More of the flyers, which would
deal on issues of performance of the BRDs will be produced in future.
18
5. MCS.
Fisheries Resources Monitoring Control and Surveillance, as an effective tool in the
management of fisheries resources, is very relevant to the successful implementation
of Bye-Catch Reduction Technology and Change Management Project. The legal
platforms for the implementation of the MCS programme in the country are the Sea
Fisheries Act No. 71 of 1992 and its related Fishing and Licensing Regulations. These
and the provisions of the FAO's impetus to constantly mobilize the stakeholders in the
fisheries sector towards accepting and complying with the various management
measures.
i. PROGRAMME IMPLEMENTATION
Inspection of Fishing Vessels and Enforcement of the Sea Fisheries Act:
This entails routine inspection of all fishing and shrimping vessels that land in any
port or jetty in the country. Fishing/Shrimping gears are inspected to ensure
compliance with the provisions of the legislation. Also data on fish/shrimp are
collected, collated and processed. In order to ensure that the data collected and
analyzed are more purposeful and relevant to the programme, new formats for
fish/shrimp and vessels inspection have been introduced in accordance with
international reporting system.
ii. Review of the Turtle Excluder Device (TED) and Bye-Catch Reduction
Devices (BRD) Regulation.
The existing Turtle Excluder Device Regulation has been reviewed in line with
the new U.S.A. TED'S regulation and to ensure full compliance. In this
direction the Draft on TEDs and other Bye-Catch Reduction Devices was
submitted in April for ratification and gazetting.
iii. Training Workshops on TEDs Fabrication and Installation
The MCS Unit has already incorporated the shrimp fisheries project into its
programme. Apart from including the BRDs in the NEW DRAFT Regulation
19
on TEDs, the unit has equally created time for the discussion of the project in
the regular meetings with the industry/all stake holders.
iv. Establishment of Standards for the Sorting of Fish
Prescribed uniform standards for the sorting of fish into various approved
grades and labelling of packages have been introduced. Hitherto, standards
were Company specific, with no basis for comparing products bearing the same
label in different Companies.
vi.
Collaboration with Gulf of Guinea States on the Management of
Marine Fisheries Resources.
Efforts are being made to facilitate the establishment of a common fisheries
policy in the sub-region. In this direction, contacts have been made with
embassies of Benin Republic, Gabon, Cameroon, Togo, requesting for copies of
their Fisheries Laws for study, and probable discussion at a suitable sub-
regional meeting, with a view to possibly harmonizing our fisheries legislations.
TECHNOLOGY COMPONENT.
Preparations for the component commenced same time with that of data collection.
The only BRD familiar with the Nigerian Industrial fishing before now was the TEDs.
Gradually, during the workshop on TEDs the industry was made to know about other
possibilities. The coming of the consultants from FAO expanded the knowledge of
industry on the other alternatives and made these net adaptations look friendlier than
the operators had imagined. Two general training workshop sessions were conducted
by the consultants earlier mentioned. The Nigerian Industry was exposed to all
possible net adaptations to reduce bye-catch namely;
a. Square mesh pane/window (SMW) attached to a diagonal mesh codend.
b. Composite square mesh panels.
c. Square mesh codend (SMW) codend constructed entirely with square mesh
nettings.
20
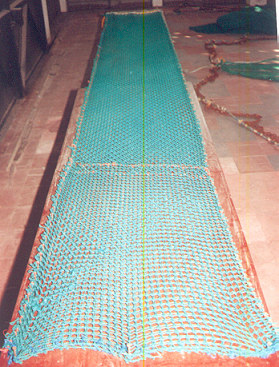
d. 90 degree turned or gentle codend. Diagonal mesh netting is re-oriented or
turned (from normal to transverse run of netting) to construct the codend.
e. Nordmore grid.
f. Fish eye.
g. Rectangular Shape JTED.
h. Circular shape JTED.
i. Rectangular shaped rigid sorting grid.
j. Semi circular rigid sorting grid.
k. Square mesh plastic panels/window.
Currently the Nigerian Fishing Industry has zeroed its trial/selection on three net
adaptations;
- the square mesh codend
- 90 degree Turned BRD
21
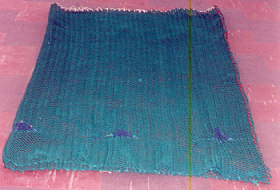
- 90 o turned mesh or gentle codend.
- square mesh window cod-end
- Square mesh window
22
The selection of these so far was based on their simplicity of application. Seven 1-day
Sea trials have been conducted using the three mentioned adaptations.
The result is that catches by the trawl nets using BRD cod end were cleaner and
thereby made sorting easier and time-saving. Also BRD Cod-ends retained much
lower quantity of trash fish compared to the traditional gear (Diamond mesh). Their
was no significant reduction in the quantity of shrimp landed. There was a significant
increase in the landing of Commercial fish when the square mesh cod-end was
applied.
400
350
300
250
Shrimp
200
Comm.fish
150
Crabs and
100
Thrash
50
0
Trad.net
90 deg
Sq. mesh window
Sq. mesh codend
Fig. 8a. Grand total of the weight of fish/shrimps caught by trawlnet codends on board
commercial vessels in Nigeria.
S
SOCIO-ECONOMIC COMPONENT.
The form for collecting socio-economic data had been developed. The collection of
socioeconomic data have commenced in areas along the coastline and some islands of
profuse trash fish trade. Training of staff for the exercise had been carried out. The
following achievements have been recorded under the socioeconomic programme;
23
1. 5 Ł Training of six officer Ł survey assistants by P.O. Abohweyere
2. Reconnaissance surveys of five coastal states have been successfully carried
out.
3. Preliminary visits have been paid to the following states.
Cross River State;
- National Inland Waterways Authority
- Nsidung Beach Market Calaber
Akwa-Ibom State;
- Ibaka Beach
- Ibeno Beach
- Uta-Ewa Beach
Rivers State;
- Oyorokoto Beach
The trash fish market centres in Bayelsa and Delta States could not be reached
because of security problems.
24