


EFA Namibia Socio-economics
Okavango River Basin Technical
Diagnostic Analysis:
Environmental Flow Module
Final Specialist Report
Country: Namibia
Discipline: Socio-economics
J. Barnes & D. Wamunyima
November 2009
1
EFA Namibia Socio-economics
Okavango River Basin Technical
Diagnostic Analysis:
Environmental Flow Module
Final Specialist Report
Country: Namibia
Discipline: Socio-economics
Authors: J Barnes & D. Wamunyima
Date: 20-11-2009
2
EFA Namibia Socio-economics
TABLE OF CONTENTS
ACKNOWLEDGEMENTS ............................................................................................... 6
1INTRODUCTION ........................................................................................................... 7
1.1 Background ........................................................................................................ 7
1.2 Okavango River Basin EFA objectives and workplan ........................................ 7
1.3 Layout of this report ............................................................................................ 8
1.4 Methods for data collection and analysis............................................................ 8
1.5 Description of the Okavango Basin .................................................................... 9
1.6 Delineation of the Okavango Basin into Integrated Units of Analysis ............... 11
2RESULTS - THE SITES .............................................................................................. 13
2.1 Overview of Namibian sites .............................................................................. 13
2.2 Socio-economic description of Namibian sites ................................................. 15
2.3 Habitat integrity of the sites in Namibia ............................................................ 19
3RESULTS - THE INDICATORS .................................................................................. 21
3.1 Indicators .......................................................................................................... 21
3.2 Flow categories river sites ............................................................................. 26
4RESULTS - RESPONSES AND IMPACTS ................................................................. 30
4.1 Socio-economic responses to potential changes in the flow regime ................ 30
5VALUES AND FLOW-RESPONSE RELATIONSHIPS IN THE OKAVANGO EFA
MODEL ................................................................................................................ 34
5.1 Base values ...................................................................................................... 34
5.2 Flow responses ................................................................................................ 36
6CONCLUSION ............................................................................................................ 68
7REFERENCES ............................................................................................................ 69
APPENDIX A: STAKEHOLDERS PARTICIPATION ..................................................... 70
REPORT ....................................................................................................................... 70
3
EFA Namibia Socio-economics
TABLE OF FIGURES
Figure 1. 1: Upper Okavango River Basin from sources to the northern end of the Delta10
Figure 1. 2: The Okavango River Basin, showing drainage into the Okavango Delta and
................................................................................................. 11
Figure 2. 1: Location of Site 4 at Kapako ...................................................................... 14
Figure 2. 2: Location of Site 5 at Popa Falls ................................................................. 15
Figure 3. 1: Three representative years for Site 1: Cuebe River @ Capico, illustrating 27
Figure 3. 3: Three representative years for Site 3 Cuito River @ Cuito Cuanavale,
illustrating the ........................................................................... 28
Figure 3. 4: Three representative years for Site 4: Okavango River @ Kapako
(hydrological data ..................................................................... 28
Figure 3. 5: Three representative years for Site 5: Okavango River @ Popa (hydrological
data .......................................................................................... 28
TABLE OF FIGURES
Table 2. 1: Population estimates for the Namibian Okavango river basin ..................... 16
Table 3. 1: List of socio-economic indicators and their links to the broader economy .. 22
4
EFA Namibia Socio-economics
ABBREVIATIONS
AIDS
Acquired Immunodeficiency Syndrome
DTM
Digital terrain model
EFA
Environmental flow assessment
EPSMO
Environmental Protection and Sustainable Management of the
Okavango River Basin Project
FAO
Food and Agriculture Organisation of the United Nations
GDP
Gross domestic product
GEF
Global Environment Facility
GNI
Gross national income
GNP
Gross national product
HDI
Human development index
HIV
Human immunodeficiency virus
IUA
Integrated unit of analysis
MET
Ministry of Environment and Tourism
NGO Non-governmental
organisation
OBSC
Okavango Basin Steering Committee
OKACOM
Permanent Okavango River Basin Water Commission
PRB
Population Reference Bureau
SAM
Social accounting matrix
TDA
Transboundary diagnostic analysis
UN-FAO
Food and Agriculture Organisation of the United Nations
5
EFA Namibia Socio-economics
ACKNOWLEDGEMENTS
This study was funded by the Global Environment Facility (GEF), and managed by the
EPSMO Project, through the Food and Agriculture Organisation (FAO) of the United Nations,
and under the overall guidance of OKACOM.
We wish to thank the EPSMO TDA Project Management Team, the Environmental Flows
Assessment (EFA) team, and the Namibia Nature Foundation administrative team. The
Namibian country team for the TDA project assisted greatly in providing us with essential
data, and advice.
Special assistance was received from Chaminda Rajapakse, Manuel Quintino, Jackie King,
Cate Brown, Alison Joubert, Casper Bonyongo, Shirley Bethune and Laura Namene, and
those others who were in the Namibian country team
We are grateful to all the people in the basin, natural resource users, farmers, tourism
operators officials, and others (too numerous to mention by name) who provided data,
information, and responses during surveys and research.
6
EFA Namibia Socio-economics
1 INTRODUCTION
1.1 Background
An Environmental Protection and Sustainable Management of the Okavango River Basin
(EPSMO) Project is being implemented under the auspices of the Food and Agriculture
Organization of the United Nations (UN-FAO). One of the activities is to complete a trans-
boundary diagnostic assessment (TDA) for the purpose of developing a Strategic Action Plan
for the basin. The TDA is an analysis of current and future possible causes of transboundary
issues between the three countries of the basin: Angola, Namibia and Botswana. The
Okavango Basin Steering Committee (OBSC) of the Okavango River Basin Water
Commission (OKACOM) noted during a March 2008 meeting in Windhoek, Namibia, that
future trans-boundary issues within the Okavango River basin are likely to occur due to
developments that would modify flow regimes. The OBSC also noted that there was
inadequate information about the physico-chemical, ecological and socioeconomic effects of
such possible developments. OBSC recommended at this meeting that an Environmental
Flow Assessment (EFA) be carried out to predict possible development-driven changes in
the flow regime of the Okavango River system, the related ecosystem changes, and the
consequent impacts on people using the river's resources.
The EFA is a joint project of EPSMO and the Biokavango Project. One part of the EFA is a
series of country-specific specialist studies, of which this is the socio-economic Report for
Namibia.
1.2
Okavango River Basin EFA objectives and workplan
1.2.1 Project objectives
The goals of the EFA are:
· To summarise all relevant information on the Okavango River system and its users, and
collect new data as appropriate within the constraints of the EFA
· to use these to provide scenarios of possible development pathways into the future for
consideration by decision makers, enabling them to discuss and negotiate on sustainable
development of the Okavango River Basin;
· to include in each scenario the major positive and negative ecological, resource-
economic and social impacts of the relevant developments;
· to complete this suite of activities as a pilot EFA, due to time constraints, as input to the
TDA and to a future comprehensive EFA.
The specific objectives are:
· to ascertain at different points along the Okavango River system, including the Delta, the
existing relationships between the flow regime and the ecological nature and functioning
of the river ecosystem;
· to ascertain the existing relationships between the river ecosystem and peoples'
livelihoods;
· to predict possible development-driven changes to the flow regime and thus to the river
ecosystem;
· to predict the impacts of such river ecosystem changes on people's livelihoods.
· To use the EFA outputs to enhance biodiversity management of the Delta.
· To develop skills for conducting EFAs in Angola, Botswana, and Namibia.
7
EFA Namibia Socio-economics
1.3
Layout of this report
This report contains the following elements: A description of the methods used is followed by
a description of the findings including a description of the socio-economic characteristics of
the study area, i.e., the Namibian part of the Okavango river basin. This includes delineation
of the Namibian basin into integrated units of analysis (IUAs), the identification of river
/wetland based natural resource uses, and the identification of the socio-economic indicators
for the EFA model. The characteristics of all these indicators are described and this is
followed by a description on the responses to scenario flow change in terms of livelihoods
and economic contribution.
1.4
Methods for data collection and analysis
The Namibian socio-economic team collated, reviewed and summarised all available
published and unpublished information on the social and economic characteristics in the
Namibian part of the basin. Other related, published and unpublished information on
livelihood and economic values in similar environments and in other river systems of the
southern African region was also scanned.
A rapid multidisciplinary field survey was carried out by the TDA/EFA core team, with
assistance within each country from the relevant country teams. Among eight target sites in
the basin, two in Namibia (Kapako and Popa) were visited to collect basic data for all
disciplines. Socio-economic data was collected at these sites through focus group discussion
meetings with basin community members and from key informants. The following tasks were
carried out.
i.
The key social and economic indicator resources, which can be linked to the river and
flow changes at each site were identified. These included those of the indicators
identified at the EFA Delineation Workshop (fish, reeds, papyrus, floodplain grass and
water lilies), that are used at the site.
ii.
Local key informants and/or focus groups regarding the use of the resources in
question were identified and located. Interviews were conducted with these. Particular
note was taken of harvest techniques, effort (particularly time invested),
equipment/gear (capital requirements), input and product prices, spatial and seasonal
patterns of use, perceptions about sustainability, and the relative importance of the
use to households/users compared to other resource use.
iii.
In interviews and focus group discussions it was determined as far as possible, how
all uses and their spatial and seasonal patterns relate to flow conditions. Examples
were uses that take place on seasonally on floodplains or uses that depend on
particular depth of flow or flood.
iv.
In the discussions with local informants, any signs or local knowledge of any other
indicators, such as those for health, culture, social well-being, that may be linked to
flows were recorded.
Of the 12 integrated units of analysis (IUAs) delineated as relatively homogeneous socio-
economic zones for the whole basin, two were selected for the Namibian basin. These were
used to guide data gathering, and as the basis for extrapolation and aggregation of livelihood
and economic values.
8
EFA Namibia Socio-economics
During the EFA/TDA process, two specific surveys were carried out to address important
data gaps. One was a detailed household and community level survey, carried out in the
Angolan part of the basin. The results are presented in Saraiva (2009). The other was a
small quantitative questionnaire survey was carried out among tourism operators in the
Botswana part of the basin. Here a systematic sample of 48 tourism operators, were
surveyed with the aim of measuring the likely effects that river flow change, and associated
flood change, might have on tourism incomes. The results of this were described by Mbaiwa
& Mmopelwa (2009).
Empirical results from literature and the surveys were used to develop natural resource use
and tourism enterprise models. These formed the basis for valuation. Most of the enterprise
models were adapted from those developed during a recent, detailed valuation of wetland
values in the Okavango delta (Turpie et al. 2006).The economic analysis for the EFA model
was focused only on the river and wetland values, i.e., those values that could be affected by
flow change. These included values for household use of river-based natural resources such
as fish, reeds, floodplain grass, floodplain gardens and floodplain grazing, as well as
commercial river- and floodplain-based tourism.
The socio-economic analyses measured the private wellbeing of the basin inhabitants, as
well as the national wellbeing of the basin countries. Private wellbeing was measured as the
net change in household livelihoods. This is the net gain in welfare, due to the resources of
the river basin and its functions, experienced by households. It is the net profits earned by
households in their income-earning activities. Private wellbeing as affected by intangible
factors such as water quality was subjectively assessed, but not included in livelihood
measures. National wellbeing was measured as the direct net change in national income. In
this case the enterprise models were used to measure the value added to the national
income by the enterprise. The specific national income measure used was gross national
product.
Measurement of the direct contribution to the national income was extended to illustrate the
total direct and indirect impact of resource use the on national economies. This was done
using multipliers calculated from the Namibian social accounting matrix (SAM) model (Lange
et al. 2004). National wellbeing as affected by indirect use values, or ecosystem services,
and national wellbeing as affected by non-use value (existence, bequest and option value)
was not assessed directly in the EFA process.
In the Namibian basin valuation work, values were first estimated in Namibia dollars (N$).
Where impacts of scenarios were compared between scenarios, these values were
converted to United States Dollars (US$) to allow basin-wide comparison. During the study in
2008, US$1.00 was worth N$8.16.
1.5
Description of the Okavango Basin
The Okavango River Basin consists of the areas drained by the Cubango, Cutato, Cuchi,
Cuelei, Cuebe, and Cuito rivers in Angola, the Okavango River in Namibia and Botswana,
and the Okavango Delta (). This basin topographically includes the area that was drained by
the now fossil Omatako River in Namibia. Outflows from the Okavango Delta are drained
through the Thamalakane and then Boteti Rivers, the latter eventually joining the
Makgadikgadi Pans. The Nata River, which drains the western part of Zimbabwe, also joins
the Makgadikgadi Pans. On the basis of topography, the Okavango River Basin thus
includes the Makgadikgadi Pans and Nata River Basin (). This study, however, focuses only
on the perennial parts of the basin in Angola and Namibia, and the Panhandle/Delta/Boteti
River complex in Botswana. The Omatako and other ephemeral drainages to the south west
as well as the and Makgadikgadi Pans and Nata River to the south east are not included.
9
EFA Namibia Socio-economics
Upper Okavango River Basin
N
W
E
S
C
u
ta
Cu
#
to
ch
i
#
C
C
u
u
#
it
a
o
nava
#
le
Cu
#
C
Menongue
ba
u
n
c
g
h
#
Major settlement
o
i
# Cuito Cuanavale
River
C
#
ue
Fossil river
be
C
Panhandle
ANGOLA
uiri
Permanent swamps
ri
#
Seasonal swamps
Cubango
Cuito
NAMIBIA
Okavango
#
Rundu
#
#
#
0
300 Kilometers
#
Figure 1. 1: Upper Okavango River Basin from sources to the northern end of the Delta
10
EFA Namibia Socio-economics
Okavango River Basin
N
W
E
S
Cu
t
a
Cu
#
t
o
c
h
i#
C
C
ui
ua
#
t
o
nava
#
l
e
C
# Menongue
ub
C
a
u
n
c
g
h
o
i
# Cuito Cuanavale
# Cuebe
C
ANGOLA
uirir
#
i
Cubango
Cuito
NAMIBIA
Okavango
#
Rundu #
# #
#
##
#
#
#
Maun
#
Makgadikgadi Pans
# Ghanzi
#
Major settlement
River
Fossil river
Panhandle
0
600 Kilometers
Permanent swamps
Seasonal swamps
Figure 1. 2: The Okavango River Basin, showing drainage into the Okavango Delta and
1.6
Delineation of the Okavango Basin into Integrated Units of Analysis
Within the Okavango River Basin, no study could address every kilometre stretch of the river,
or every person living within the area, particularly a pilot study such as this one. Instead,
representative areas that are reasonably homogeneous in character may be delineated and
used to representative much wider areas, and then one or more representative sites chosen
in each as the focus for data-collection activities. The results from each representative site
can then be extrapolated over the respective wider areas.
Using this approach, the Basin was delineated into Integrated Units of Analysis
(EPSMO/Biokavango Report Number 2; Delineation Report) by:
· dividing the river into relatively homogeneous longitudinal zones in terms of:
· hydrology;
· geomorphology;
· water
chemistry;
· fish;
· aquatic
invertebrates;
11
EFA Namibia Socio-economics
· vegetation;
· harmonising the results from each discipline into one set of biophysical river zones;
· dividing the basin into relatively homogeneous areas in terms of social systems;
· harmonising the biophysical river zones and the social areas into one set of Integrated
Units of Analysis (IUAs).
The recognised IUAs were then considered by each national team as candidates for the
location of the allocated number of study sites:
· Angola:
three
sites
· Namibia:
two
sites
· Botswana:
three
sites.
The sites chosen by the national teams are given in .
EFA Site No
Country
River
Location
1 Angola Cuebe
Capico
2 Angola
Cubango Mucundi
3 Angola Cuito Cuito
Cuanavale
4 Namibia
Okavango
Kapako
5 Namibia
Okavango Popa
Falls
6
Botswana
Okavango
Panhandle at Shakawe
7
Botswana
Khwai
Xakanaka in Delta
8 Botswana Boteti
Chanoga
Table 1. 1: Location of the eight EFA sites
This report deals only with the Namibian sites as well as their respective IUAs. Namibia was
divided into two IUAs each of which, in turn, subdivided into sub IUAs. Thus IUA 8 extended
along the basin from the Angolan border post at Katwitiwi to Mukwe, and it was divided into
two: 8a - above the junction with the Angolan Cuito tributary, and 8b - below this. IUA 9
extended along the Namibian basin from Mukwe to the Botswana border, and it was also
divided into two: 9a - the stretch between Mukwe and the Mahango core area of the
Bwabwata National Park, and 9b - the short section of the river wholly within the park. Site 4
at Kapako was representative of IUA 8 and in particular 8a. Site 5 at Popa Falls was
representative of IUA 9 in particular 9a.
Functionally, the river basin represented by IUAs 8 and 9 occupies both sides of the river
while the river forms the border between Namibia and Angola. There is relatively free
movement of people across the river, and resources are used on both sides, but about 80%
of the population lives on the Namibian side, including many Angolans, and nearly all the
economic activity is attributable to the Namibian side. From the point of view of the EFA
analytical work IUAs 8 and 9 are treated as part of Namibia. Adjustments were only made
when extrapolating the values between countries.
12
EFA Namibia Socio-economics
2 RESULTS - THE SITES
2.1 Overview
of
Namibian sites
The sites are specific localities, selected primarily so that their hydrological and biophysical
characteristics can be measured where needed. They need to be representative not only of
the IUA within which they fall, because the information gained from site visits needs to be
extrapolated to the whole IUA. Furthermore, this information needs to be suitable for
extrapolation to those IUAs which do not have sites. This is particularly the case with the
socio-economic component of the EFA, since the impacts of flow change need to be
measured in terms of their impact on aggregate household welfare and economic income
within the IUAs, the countries, and the basin as a whole.
From the socio-economic perspective the sites provided only reference points where field
visits were enabled, but the field literature and research was aimed more at the broader IUA
concerned. When the EFA field trip took place in Kavango Region, between the 17th and 23rd
of October, 2008, communities in the vicinity of Sites 4 and 5 were interviewed using focus
group and key informant methods.
2.1.1 Site 4: Okavango River at Kapako
Site 4 was located 20km upstream from Rundu on the Okavango river and was
representative of integrated unit of analysis (IUA) number 8. As stated, IUA 8 stretched from
the Angolan border post at Katwitiwi to Mukwe. This part of the river is characterised by
having a sandy substrate and a narrow floodplain. The division of IUA 8 into two: 8a - above
the junction with the Angolan Cuito tributary, and 8b - below this, reflects the fact that above
the Cuito junction, floods are more marked and seasonal river flow more varied. Inflows from
the Cuito are more constant and seasonally stable and this stabilises the flow regime in 8b.
Map 2.1 shows the locality of Site 4 at Kapako. Land is state owned with communal use
rights, and households live concentrated along the river. The locality of a strip of households
can be seen in the map.
13

EFA Namibia Socio-economics
Figure 2. 1: Location of Site 4 at Kapako
2.1.2 Site 5: Okavango River at Popa Falls
As stated, Site 5 is representative of the river between Mukwe and the Botswana border at
Mohembo or IUA 9. Here the river flows over a mixture of rock and sand and, for most of its
length, characteristically does not have a floodplain. It has also been divided into two: 9a -
the populated stretch between Mukwe and the Mahango core area of the Bwabwata National
Park, and 9b the section of the river wholly within the park. Section 9b does have a
moderately developed floodplain, which in Botswana's IUA 10, downstream widens
considerably into the delta panhandle.
Map 2.2 shows the locality of Site 5 at Popa Falls. The land is state owned under communal
tenure and households are scattered along the river as in IUA 8. These can be seen in the
map.
14

EFA Namibia Socio-economics
Figure 2. 2: Location of Site 5 at Popa Falls
2.2 Socio-economic
description of Namibian sites
2.2.1 Site 4: Kapako
The work of Mendelsohn & el Obeid (2003, 2004) and Mendelsohn et al. (2002) as well as
Yaron et al. (1992) provided significant amounts of data relevant to the descriptions that
follow.
The floodplain in IUA 8 effectively distinguishes it from IUA 9 which generally has a rocky
substrate and no floodplain. The river is at the heart and core of the Okavango Basin, and a
variety of aquatic plants animals live in and make good use of the river water. The river
channels are often flanked with broader margins consisting of floodplains, particularly so as
one progresses down the basin from the source. Away from the rivers and floodplains there
are uplands dominated by drier, deciduous woodlands. A variety of organisms are
specialised inhabitants of the river channels and floodplains.
The fish communities can be divided into two categories according to food habits, with
species that feed on plant materials and species that are predators of other fish. Further fish
communities tend to be broadly divided according to habitat, with different fish preferring the
mainstream channels, rocky areas and rapids, backwaters, permanent swamps and the
seasonal floodplains. The floodplains are of greatest value as places in which most fish
breed.
15
EFA Namibia Socio-economics
The floodplains are also of importance for the harvest of other resources. The wetter parts
contain reeds, and some papyrus which can be used for construction and crafts
manufacture. In permanent pools and backwaters some water lilies can be harvested as
food. In the less frequently or heavily flooded floodplain areas, Specific grasses grow which
can be harvested for building, and used as grazing. Crops can also be grown on the
floodplains, where receding floods, associated water tables, and more fertile, humic soils can
provide more favourable conditions than those on the uplands.
The Kavango region, through which the Okavango river flows in Namibia, is state land under
communal land tenure. An estimated 219,090 people in 35,120 households are estimated to
live in the Namibian part of the Basin, or within some 20 km of the river in Namibia, as
demarcated in the EFA/TDA delineation exercise. This amounts to some 80% of the total
population of the Kavango region. The river provides water and a number of resources that
attract people to settle. Infrastructure in the form of roads and the regional capital, Rundu,
are concentrated along the river. Of the estimated 219,090 people, some 94% live within 5
km of the river, on raised river terraces, in a strip served by a river road. Rundu contains 20%
of the people. Nearly half of the Namibian basin population speak Rukwangali, with other
languages, mostly Rumanyo, Nyemba and Thimbukushu spoken by the rest.
Population growth rates in the Namibian basin population have been very high, up to 7% per
annum between 1981 and 1991. This was due in part to the prevalent underdeveloped and
rural setting, but also to influx of Angolans from across the river, displaced as a result of civil
war and poverty. Some 20% of the Namibian basin population is estimated to be of Angolan
origin. Since 1991 there has been a noticeable decline in average fertility rates in the
Namibian basin population, from 7.1 children per woman per lifetime, to 4.2. This is due to
urbanisation, but also the impact of HIV and AIDS.
Table 2.2 shows the breakdown of the population in the IUAs of the Namibian part of the
basin. 98% of the population, or 214,050 people in 34,360 households, reside in IUA 8 which
represented by Site 4 at Kapako. 74% of the IUA 8 population is in IUA 8a which contains
Site 4.
The population mostly lives on river terraces above the floodplain where soils are more fertile
than in the sandy hinterland. Households grow rain-fed crops, graze livestock and harvest
woodland products away from the river, as well as making use of river-based resources.
Kapako where Site 4 was situated has a population of approximately 2,500 people within
10km.
Zone
No. of people
No. of households
Integrated Unit of Analysis 8a (Site 4, Kapako)
157,690
25,720
Integrated Unit of Analysis 8b
56,360
8,640
Integrated Unit of Analysis 9a (Site 5, Popa Falls)
5,040
760
Integrated Unit of Analysis 9b
0
0
Total for Namibian Okavango Basin
219,090
35,120
Table 2. 1: Population estimates for the Namibian Okavango river basin
16
EFA Namibia Socio-economics
The rural economy in the in the communal land is dominated by the small scale traditional
agriculture sector. Households derive a living from a strategic range of activities, including
small scale low input crop production, small scale livestock keeping, harvest of natural plant
products, fishing, formal employment and crafts production. Pension payments also
contribute to this living. Most agricultural and natural resource harvesting products are
consumed directly and only a small amount is traded in markets. Formal employment is
gained in government services, tourism, and commercial agriculture.
As stated, most of the population of Kavango Region is within the Namibian part of the
Okavango river basin. A recent poverty analysis (CBS 2008) shows that Kavango has the
highest incidence of poverty among all 13 regions in Namibia. In Kavango, 57% of
households are classified as poor (with expenditure of N$262 or less per adult equivalent per
month), and 36% of households are classified as severely poor (with expenditure of N$186
or less per adult equivalent per month). This can be compared with the incidence for the
whole country where 27.6% of households are poor or severely poor, and 13.8% are
severely poor.
In Kavango the incidence of poor among rural households (which make up 80% of the total
number) is 62%, while that among the urban population (20% of the total) is only 33%.The
high incidence of poverty in IUA 8 would underline the importance of natural resources
harvesting in the coping strategies of households. Government has an obligation both to
target these households for poverty reduction as well as to avoid interventions which might
exacerbate their poverty. Levine (2007) used a multi-dimensional human poverty index (HPI)
which accounts for survival, literacy and income to show that poverty in Kavango, despite
remaining the highest among the nation's regions, has declined between 1991-1994 and
2001-2004.
The high levels of poverty are associated with high dependency ratios (around 46% of the
population is below 15 years, or older than 64 years, of age). A very high rate of HIV
infection, as measured among pregnant women visiting hospitals and clinics, has been
recorded. This rate rose from 7.5% in 1994 to 20% in 2002 (Mendelsohn & el Obeid 2003).
Average life expectancy has declined from 57 in 1991 to 40 years in 2000, as a result of
AIDS, and this has impacted negatively on the human development index (HDI), despite
improvements in other HDI component measures such as education and income. Levine
(2007) showed that the average HDI for Kavango declined from 0.48, between 1991 and
1994, to 0.41, between 2001 and 2004. As expected, the human development index (HDI)
for Kavango is lower than that for Namibia as a whole. Between 2001 and 2004 the average
HDI was 0.41 for Kavango, while it was 0.56 for Namibia.
High poverty levels have also contributed to high incidence of tuberculosis (TB), malaria,
acute respiratory infections, diarrhoea, and urinary bilharzia, intestinal bilharzia, and
malnutrition in Kavango and IUA 8. Some of these are secondary to AIDS and increased as
a result of the AIDS epidemic. Others such as malaria, which affects half the population each
year, is linked to the summer rains and associated standing water. Urinary and intestinal
bilharzia are water borne and both prevalent in the river. Their incidence appears to have
increased dramatically (Mendelsohn & el Obeid 2003).
Seasonal flooding in February, March and April has a significant impact on the fish
populations which spike during this period. Fish catches from floodplain channels are very
high during the floods, and they are lower from the river channel in the rest of the year. The
floodplain results in a number of other resources being available for household livelihoods.
Communities harvest reeds, Phragmites sp., from upper wet banks and lower floodplain
reaches. They harvest specific grasses for thatching material (notably Miscanthus junceus)
from lower floodplain and middle floodplain vegetation zones. They grow crops in lower and
middle floodplain sites, deriving enhancement of yield from the more humic soils and wetter
17
EFA Namibia Socio-economics
soils. They also derive some of their livestock grazing in middle and upper floodplain
vegetation zones benefitting from enhanced productivity from the moister soils.
Compared with IUA 9 downstream, a higher portion of household income in IUA 8 is derived
from harvest of river resources. This is the direct result of the floodplain. IUA 8 also contains
an estimated 24 private tourism establishments, sited along the river, about 20 of these are
close to Rundu, and another 4 are scattered downstream from this. These facilities host
business travellers and leisure tourists passing through Kavango region and they make use
of the river and river-associated scenery for their tourism product. Households in the IUA
derive some of their income from employment in these facilities. Beyond these household
incomes the tourism sector also contributes value added to the national income through
private sector profits, taxes and returns to and of capital. The location of Site 4 was
representative of the IUA8 with respect to the household harvest of natural resources, but did
not contain any tourism establishments which are concentrated in the IUA downstream of
this.
Irrigation, mostly undertaken by government agencies and sometimes involving private
sector contractors, is practised on some 2,600 hectares at 11 sites along the river, for
commercial crop production. Various high value crops are grown along with staple grains.
Better quality soils on the river terraces are used rather than the sandy upland soils. The
setting is remote from input and product markets and the financial viability is difficult. Only
production dominated by high value cash and horticultural crops is economically attractive
(Liebenberg 2009; Shuh et al. 2006) and all require subsidisation. Nevertheless commercial
agriculture, at the scale practised, generates very significant income and significant amounts
of employment.
Focus group discussions at Kapako, Site 4, confirmed these findings, generally. During the
focus group discussion the basin residents described the flooding process where rising river
and channel waters push out over flat surrounding ground and the most extensive floods
form in years when river levels are highest. Floods provide access for fish to extensive
vegetation and detritus for feed and breed. They also offer the young fish refuge from larger,
predatory species and greatest survival of young fish and overall increase in fish population
occur in years when water levels are high and flooding lasts longest
Local people have recognised the quality of water and fish recourses is decreasing in the
Okavango River. Fish remain a significant income source in the lives of people at Kapako,
who fish for food or earn incomes by selling their catches or providing trips for tourists. In
terms of numbers, the fish stock explodes during flood times. On the flooded plains fish
numbers can be four times higher there than in the main river channel. Fish are caught by
households using both traditional and modern methods. Traditional gear includes fish
funnels, kraal traps, scoop baskets, push baskets, bows and arrows, set fish hooks and
spears. Modern gear consists of line and hooks, mosquito nets, and gill and seine nets.
The use of fish for recreational angling forms part of the tourism value associated with the
river. However, only a small part of tourism values is attributable to angling. The increase in
human population on the southern bank in IUA 8 means that the natural riparian landscape,
consisting of the main Okavango river channel and the floodplains are being subjected to
considerable pressure. The vegetation along the river bank and floodplain on the Namibian
side is heavily grazed and depleted. Thus, at Kapako, the residents graze their livestock
across the river on the Angolan floodplain
Despite the increase in grazing pressure and deforestation on the southern bank and
although the extent of bare ground has increased residents consider that overall water
quality has not declined substantially with the exception of very localised increase in
phosphorus concentration and a very slight decrease in water clarity from an increase in
18
EFA Namibia Socio-economics
suspended sediments. They perceive short term seasonal variation in water quality than long
term change.
2.2.2 Site 5: Popa Falls
IUA 9 is relatively small, compared with IUA 8, and it includes significant areas of national
park. As a result, and as can be seen from Table 2.2, it contains only 3% of the total
population of the Namibia portion of the basin. Many of the socio-economic characteristics
associated with the IUA 8 are the same for IUA 9 and Site 5. However the lack of a floodplain
in IUA 9 means that many of the benefits that people derive from the river in IUA 8 are
absent. Fishing is restricted to the river channel resulting in constant, but relatively lower
catches during the year. Use of mokoros (canoes) along with hook-and-line and gill nets is
necessary for effective fishing in the main channel. Community representatives, in focus
group discussion, confirmed that fishing is a secondary activity for most people in the Popa
area, contributing little to the overall cash or in-kind incomes of the majority of households.
People thus pay much less attention to fishing than to farming and other activities. Fishing
actually declines somewhat during the higher water levels around March as it is more difficult
to fish the strongly flowing channel then. Fishing is small-scale and mostly for home
consumption. A commercial fishing operation involving drag and gill nets, started by a
person, non-resident to the area, was asked to cease operations by the community,
demonstrating the existence of some property rights in fishing.
The use of reeds and floodplain grasses is restricted to a very narrow wet bank strip and
floodplain crops and floodplain derived grazing are absent. Species used are reed,
Phragmites australis, for building, the sedge, Cyperus papyrus for mats, and the grass,
Miscanthus, junceus for thatch. Communities in IUA 9 derive a lower proportion of their
household income from the harvest of river resources than those in IUA 8. According to
community informants interviewed during a focus group meeting at Popa Falls, Site 5,
tourism is a major source of income to the Popa residents; most of them are employed within
the lodges around Popa area. They value tourism as their major source of income. Indeed
estimations confirm that a large proportion of the river-derived incomes for households
comes from employment in tourism. There are some 6 private sector tourism lodges and
camps which make use of the river and the river associated wildlife in Bwabwata National
Park downstream for their tourism product.
As in IUA 8, households reported being dependent on a mix of incomes, including wages,
business earnings, pensions and remittances. Households also derive income from small
scale livestock keeping, small-scale low-input upland crops, and use of wild upland plant
resources for thatch, fuelwood, and poles. Farming activity is considered an important source
of income; households engage in both crop and livestock farming activity. Planting is
staggered through the rain season and is undertaken after there has been good rainfall. This
increases the chance of crop survival during the hot dry periods. Livestock farming is
dominated by cattle and goats, which are grazed in upland woodlands under common
tenure. They are moved between grazing and sources of water, mainly the Okavango river
2.3
Habitat integrity of the sites in Namibia
The concept of habitat integrity is applied in the socio-economic report in terms of the degree
to which natural resource uses are sustainable or not. This was assessed, based on
information gleaned from communities during focus group meetings, key informant
interviews, discussions with members of the EFA bio-physical team and the literature.
19
EFA Namibia Socio-economics
Generally, more so than at all other sites and IUAs in the basin, natural resources harvesting
at least in parts of IUAs 8 and 9, is at levels close to or exceeding sustainable limits. Thus
livestock grazing pressure on open access uplands and floodplains is very high,
deforestation in upland river terraces and woodlands has resulted in reduced woodland cover
on the southern bank of the river. In terms of the river-based natural resources, fish are being
used at close to the sustainable limits (B. van der Waal, 2008, pers. comm.). Reeds and
floodplain grass is being used intensively in most of the IUAs.
Utilisation pressure on natural resource in the populated southern bank of the river, in both
IUA 8 and IUA 9, can only increase in the future, as the population grows, at a rate,
estimated at between 0.9% and 1.5% per annum (Mendelsohn et al. 2002; Mendelsohn & el
Obeid 2003, 2004).
Currently the resources on the north bank of the river in Angola are underutilised, and these
are being used increasingly by people based on the southern bank, for example for
floodplain grazing, harvesting of reeds, harvesting of grass, etc. The protected Bwabwata
National Park in IUA 9 contains a pristine array of resources with significant value as a
reservoir for breeding and dispersal, as well as a base for tourism.
During the derivation of response curves in the EFA models during water use scenario
analysis, no consideration was given to population growth and the impact that this will have
on the resources in question. This was to prevent excessive complexity. However, in the
extrapolation of livelihood and economic values to measure impacts during scenario
analysis, discounted future streams of values incorporation the effects of future change were
used. These included consideration of change driven by population growth.
20
EFA Namibia Socio-economics
3 RESULTS - THE INDICATORS
3.1 Indicators
3.1.1 Introduction
Biophysical indicators are discipline-specific attributes of the river system that respond to a
change in river flow by changing in their:
· abundance;
· concentration;
or
· extent
(area).
Social indicators are attributes of the social structures linked to the river that respond to
changes in the availability of riverine resources (as described by the biophysical indicators).
The indicators are used to characterise the current situation and changes that could occur
with development-driven flow changes.
3.1.2 Indicator list for socio-economics
In order to cover the major characteristics of the river system and its users many indicators
may be deemed necessary. For any one EFA site, however, the number of indicators is
limited to ten (or fewer) in order to make the process manageable. The full list of socio-
economic indicators was developed collaboratively by country representatives for the
discipline, and is provided in Figure 1. With a few exceptions all of the indicators are
applicable to all of the sites. The exceptions apply where, for example, there is no floodplain
of significance, and thus no floodplain grazing or floodplain crop production.
It is important to note that the indicators selected are limited to values that are expected to
change under differing water use scenarios. Some natural resource uses associated with the
riverine environment provide livelihood and economic value but are unlikely to change with
flow change. An example would be use of riparian tree fruits. Another is the use of water for
irrigated commercial agricultural production. Some 2,610 hectares are irrigated in this way in
IUA 8, contributing significant income and employment for local residents. But irrigated crop
production would draw water in any case, regardless of flow change. It would also
presumably be augmented and expanded as part of the water use scenarios, itself affecting
water flow.
Possible indicators affecting human wellbeing are those related to health and disease, such
as malaria, bilharzia and diarrhoea were examined. These although their incidence is linked
to the aquatic environment were found to not be affected specifically by flow change. Other
possible indicators included natural resource uses such as water lily use (Nymphaea sp.) for
food, and use of the sedge (Cyperus papyrus) for mat making, were rejected as indicators
either because they were considered of small import or because in some sites their use was
unlikely to be affected by flow changes. Further not all indicators have been assigned values.
Where data are unavailable some have been treated only in discussion, despite being
recognised as likely to be affected by flow change.
The indicators in Figure 3.1 are divided into those affecting local household income, or
livelihoods (1 to 8) as well as the broader economy, and those impacting directly on the
broader economy or on societal well-being (9.1 to 9.4). The table shows how these all
21
EFA Namibia Socio-economics
contribute ultimately to overall social and economic wellbeing. All indicators were considered
relevant at Site 4 (IUA 8). At Site 5 (IUA 9) indicator 4 (floodplain crops) and indicator 5
(floodplain grazing for livestock) were not measured due to the general absence of a
floodplain.
Indicator
1. Household income - fish
2. Household income - reeds
3. Household income - floodplain grass
Total income
a. Household income
change as %
4. Household income - floodplain gardens (e.g. molapo)
%PD
PD
ng
A. SOCIAL WELL-
ei
5. Household income and wealth - livestock
BEING FOR
l
-
b
LOCAL
6. Household income - tourism
HOUSEHOLDS
i
c
wel
(=a+b+c)
b. Potable
7. Potable water/water quality
water/water quality
-
econom
%PD
cio
so
c. Wellbeing/welfare
l
8. Wellbeing/welfare from intangibles
from intangibles %Pd
Overal
9.1 Macro effects from tourism income excluding hh
(including multipliers)
(=A+B).
9.2 Macro effects from hh income 1-6 (including
d. National income
B. ECONOMIC-
C
multipliers etc.)
(=9.1+9.2+9.3+9.4)
WELL BEING
%PD
(nationally)
9.3 Indirect use
9.4 non-use
Table 3. 1: List of socio-economic indicators and their links to the broader economy
3.1.3 Description and location of indicators
Socio-economic Indicator 1
Name:
Household income - fish
Description:
Small-scale household-based fishing activity, using traps,
and/ or gill nets, hook and line and mokoros (canoes), for
own use as fresh food product, and very limited marketing,
with very limited processing (drying).
Representative species:
Vegetarian and predatory bream (Cichlidae), tiger, barbel
(Claridae),
Flow-related location:
Channels, floodplains during floods, residual floodplain
pools
Known water needs:
Perennial flows in channels, regular seasonal floods on
floodplains
22
EFA Namibia Socio-economics
Socio-economic Indicator 2
Name:
Household income - reeds
Description:
Small-scale household-based harvesting of reeds using
sickles, for own use in housing and compound wall
construction, and very limited marketing
Representative species:
Reed, Phragmites australis
Flow-related location:
Upper wetbank 1, river lower floodplain
Known water needs:
Perennial flows in channels, regular seasonal floods on
upper wetbank 1 and river lower floodplain
Socio-economic Indicator 3
Name:
Household income floodplain grass
Description:
Small-scale household-based harvesting of grass using
sickles for own use as specialised construction thatch and
very limited marketing
Representative species:
Thatch grass, Miscanthus junceus, other species
Flow-related location:
River lower floodplain, river middle floodplain
Known water needs:
Regular seasonal floods on floodplains
Socio-economic Indicator 4
Name:
Household income floodplain gardens (e.g. molapo)
Description:
Small-scale household-based flood-recession crop
production using animal draft power and manual labour, on
floodplains for own consumption as food and very limited
marketing and with home milling, complementary to
household upland rain-fed crop production.
Representative species:
Maize, sorghum, millet, vegetables
Flow-related location:
River lower floodplain, river middle floodplain
Known water needs:
Regular seasonal floods on floodplains and regular
transitional season 2 to allow crop growth
Socio-economic Indicator 5
Name:
Household income and wealth - livestock
Description:
Small-scale household-based open access grazing of
livestock on floodplain as part of broader upland small-
scale livestock keeping for meat milk, transport and as a
store of wealth, with limited marketing
Representative species:
Local breeds of cattle (Bos indicus) and goats
23
EFA Namibia Socio-economics
Flow-related location:
River middle floodplain and river upper floodplain
Known water needs:
Regular seasonal floods on floodplains
Socio-economic Indicator 6
Name:
Household income - tourism
Description:
Household-based and migratory, full- and part-time
employment in local tourism industry as labour, skilled
labour, and occasionally management
Representative species:
General wildlife, including semi aquatic animals, lower,
middle, and outer floodplain grazers, associated predators
and birds generally, general scenic habitats and attributes
linked to a mosaic of all the vegetation indicators
Flow-related location:
Sited commonly on upper dry banks but making use of all
vegetation indicators as part of product dependent on dry
season low flow and flood volume
Known water needs:
Perennial flows in channels, regular seasonal floods on
floodplains
Socio-economic Indicator 7
Name:
Potable water/water quality
Description:
Small-scale household-based use of river water for
household needs
Representative species:
None water quality indicators generally
Flow-related location:
Channels, floodplains during floods, residual floodplain
pools
Known water needs:
Perennial flows in channels, good water quality
Socio-economic Indicator 8
Name:
Wellbeing/welfare from intangibles
Description:
Small-scale household-based welfare linked to income
from indicators 1 to 7 but also to general individual,
household and community feeling on ecosystem integrity
in the face of flow change
Representative species:
None specific, but linked to indicators 1 to 7 as well as
overall ecosystem integrity
Flow-related location:
Channels, floodplains, all habitats associated with
ecosystem integrity
24
EFA Namibia Socio-economics
Known water needs:
Perennial flows in channels, regular seasonal floods on
floodplains
Socio-economic Indicator 9.1
Name:
Macro-effects from tourism income, excluding household
income (including multipliers)
Description:
Medium to large scale lodge based, non-consumptive
wildlife viewing and some consumptive hunting or angling
tourism, hosting middle- and up-market foreign and
regional tourists for water and/or land-based activities
Representative species:
General wildlife, including semi aquatic animals, lower,
middle, and outer floodplain grazers, associated predators
and birds generally, general scenic habitats and attributes
linked to a mosaic of all the vegetation indicators
Flow-related location:
Sited commonly on upper dry banks but making use of all
vegetation indicators as part of product dependent on dry
season low flow and flood volume
Known water needs:
Perennial flows in channels, regular seasonal floods on
floodplains
Socio-economic Indicator 9.2
Name:
Macro-effects from household income 1-6, (including
multipliers, etc)
Description:
All small-scale household-based activities described under
indicators 1 to 6
Representative species:
All species, ecosystems, attributes listed under indicators
1 to 6
Flow-related location:
All locations described under indicators 1 to 6
Known water needs:
perennial flows in channels, regular seasonal floods on
floodplains
Socio-economic Indicator 9.3
Name:
Indirect use
Description:
Indirect use values, i.e., off-site local, national, regional, or
global use values associated with river-based ecosystem
services, including carbon sequestration, wildlife refuge,
groundwater recharge, flood attenuation, scientific and
educational value, among others etc., poorly studied
Representative species:
General ecosystem integrity, providing the range of
ecosystem services referred to above
25
EFA Namibia Socio-economics
Flow-related location:
No specific location associated with a range of geo-
morphological and ecological features, including
vegetation and wildlife, which affect seasonal flooding
patterns as well as perennial nature of flow
Known water needs:
Perennial flows in channels, regular seasonal floods on
floodplains, generally
Socio-economic Indicator 9.4
Name:
Non-use
Description:
Existence bequest and option values for preservation,
manifested as local, national, regional and global
willingness to pay for preservation of resources in the river
system, values poorly researched and/or known
Other characteristics:
General wildlife, including semi aquatic animals, lower,
middle, and outer floodplain grazers, associated predators
and birds generally, general scenic habitats and attributes
linked to a mosaic of all the vegetation indicators
Flow-related location:
Embracing the broader ecosystem including all the
vegetation and wildlife indicators, mostly in the better
known lower parts of the basin (Okavango delta)
Known water needs:
Perennial flows in channels, regular seasonal floods on
floodplains
3.2
Flow categories river sites
One of the main assumptions underlying the EF process to be used in the TDA is that it is
possible to identify parts of the flow regime that are ecologically relevant in different ways
and to describe their nature using the historical hydrological record. Thus, one of the first
steps in the EFA process, for any river, is to consult with local river ecologists to identify
these ecologically most important flow categories. This process was followed at the
Preparation Workshop in September 2008 and four flow categories were agreed on for the
Okavango Basin river sites:
· Dry
season
· Transitional
Season
1
· Flood
Season
· Transitional
Season
2.
Tentative seasonal divisions for river Sites 1-5 are shown in to . These seasonal divisions
will be formalised by the project hydrological team in the form of hydrological rules in the
hydrological model. In the interim they provide useful insights into the flow regime of the
river system suggesting a higher within-year flow variability of the Cuebe River and a higher
year-on-year variability of the Cubango River.
It is planned to use similar flow seasons for the remaining river sites: 6 and 8.
26
EFA Namibia Socio-economics
120
Wet
100
Trans 1
Trans 2
Dry
80
Year
Y
2
ear
60
Year
Y
1
ear
Year
Y
3
ear
40
20
0
O
N
D
J
D
F
M
A
M
J
J
M
J
A
S
Figure 3. 1: Three representative years for Site 1: Cuebe River @ Capico, illustrating
1200
Wet
1000
Trans 1
Trans 2
Dry
800
Year 1
Y
600
Year 2
Y
Year 3
Y
400
200
0
O
N
D
J
D
F
M
A
M
J
J
M
J
A
S
Figure 3. 2: Three representative years for Site 2: Cubango River @ Mucundi, illustrating the
27
EFA Namibia Socio-economics
250
1
Wet
2
Dry
200
a
ns
a
ns
Tr
Tr
150
Year 1
ear
Year 2
ear
100
Year 3
ear
50
0
O
N
D
J
F
M
A
M
J
J
M
J
A
S
Figure 3. 3: Three representative years for Site 3 Cuito River @ Cuito Cuanavale, illustrating the
1000
900
Wet
We
800
Dry
Dr
Tra
Tr n
a s
n 1
s
Tra
Tr n
a s
n 2
s
Dry
Dr
700
600
Year 1
500
Year 2
400
Year 3
300
200
100
0
O
N
D
J
F
M
A
M
J
J
M
J
A
S
Figure 3. 4: Three representative years for Site 4: Okavango River @ Kapako (hydrological data
1800
1600
Wet
1400
Dry
Trans
n 1
Trans 2
Dry
1200
1000
Year 3
00
Year 2
800
Year 1
600
400
200
0
O
N
D
J
F
M
A
M
J
J
M
J
A
S
Figure 3. 5: Three representative years for Site 5: Okavango River @ Popa (hydrological data
28
EFA Namibia Socio-economics
The data collection and analysis exercises were focused on addressing what is initially
expected to be nine main questions related to these flow seasons (Table 3.2).
Question
Season
Response of indicator if:
number
1
Onset is earlier or later than natural mode/average
2
Dry Season
Water levels are higher or lower than natural mode/average
3
Extends longer than natural mode/average
Duration is longer or shorter than natural mode/average - i.e. hydrograph is
4
Transition 1
steeper or shallower
5
Flows are more or less variable than natural mode/average and range
Onset is earlier or later than natural mode/average synchronisation with rain
6
Flood season
may be changed
7
Natural proportion of different types of flood year changed
8
Onset is earlier or later than natural mode/average
Transition 2
Duration is longer or shorter than natural mode/average i.e. hydrograph is
9
steeper or shallower
Table 3. 2: Questions addressed at the Knowledge Capture Workshop, per indicator per site. In
29
EFA Namibia Socio-economics
4 RESULTS - RESPONSES AND IMPACTS
4.1
Socio-economic responses to potential changes in the flow regime
The socio-economic discipline differs to some extent from the biophysical ones, in that the
ultimate answer is not simply how much of an indicator natural resource there, but how much
does a change impact on livelihoods and on the economy. First the status of the particular
natural resource or attribute contributing to the livelihood and economic income is taken into
account. This usually comes out of biophysical response to flow change. If the example of
fish is taken, the abundance and availability of fish for fish catch may respond to change in
flood season flood type. The first socio-economic response curve follows this by measuring
how fish catches respond to fish abundance. In the example, if fish abundance rises
dramatically, fishers may only be able to catch some of these by virtue of limits to their
capacity and or the markets.
The second stage in the socio-economic process can be seen as the valuation of fish catch
within the fishing enterprise. Thus the short term response to change in fish catch is
measured in terms of private net income (livelihood), and contribution made to national
economic income (economic impact). This done using financial and economic budget cost
benefit models for fishing enterprises. Thus response curves for livelihoods and national
income contribution are made.
The socio-economic responses are thus related to resource abundance/availability and not
directly related to the flow categories in the previous section except in a few cases. One such
case is in the tourism sector which benefits from a complex array of natural attributes.
Operators are each faced with a unique and complex set of flow/flood characteristics. These
differ, depending on things like if they are on river bank, wetter middle delta or in the drier
lower delta, and if they specialise in water-based and/or land-based products or both. Nearly
every lodge site has permanently, frequently, occasionally, and rarely flooded areas of
varying quantity and in a complex mosaic, and this makes up their tourism product (along
with all the other attributes of the site). Here key to success are the abundance of wildlife, the
degree and nature of flooding and the dry season low flow characteristics. Tourism is
important in the basin and most important for the response curves is an understanding of
how flow/flood changes are likely to affect tourism income in the short to long term. As part of
the TDA process, a simple survey was conducted among some 50 tour operators in
Botswana. This was focused on their perceptions on how flow/flood changes (in ceteris
parabis), might affect tourism. Mbaiwa & Mmopelwa (2009) give the results of this.
Table 4.1 shows how these flow categories can affect tourism numbers, and thus the socio-
economic values.
30
EFA Namibia Socio-economics
Table 4. : Predicted response to possible changes in the flow regime of tourism numbers in the Okavango River ecosystem
Confidence in
Question
prediction (very
Season
Possible flow change
Predicted response of indicator
number
low, low, medium,
high)
Onset is earlier or later than
Small effect
1
natural
Dry
Water levels are higher or
The dry season low flow is expected to reduce tourism volumes
2
Season
lower than natural
(tourism numbers) if it drops to very low levels.
3
Extends longer than natural
Small effect
Duration is longer or shorter
Nil
4
than natural - i.e. hydrograph
Transition
is steeper or shallower
1
Flows are more or less variable Nil
5
than natural
Onset is earlier or later than
Small effect
6
natural synchronisation with
rain may be changed
Flood
The degree and nature of flooding measured primarily in terms of
season
volume and level have important effects on the amount of permanent,
Natural proportion of different
7
frequently, occasionally, and rarely flooded land in the tourism
types of flood year changed
concessions. This affects the amount of tourism with both high floods
and low floods generally having detrimental short term impacts.
Onset is earlier or later than
Nil
8
natural
Transition
2
Duration is longer or shorter
Nil
9
than natural i.e. hydrograph
is steeper or shallower
31
EFA Namibia Socio-economics
The scenarios which were tested in the environmental flows assessment (EFA)
model were four; the 'present day' plus three alternative water use development
scenarios. The present day (PD) scenario included all existing water resource
developments, notably:
Some 2,600 ha of irrigation in Namibia
The urban water demands of Menongue and Cuito Cuanavale (Angola), Rundu
(Namibia), and Maun (Botswana)
A low growth (Low Dev) scenario was based on the continuation of historical growth
in water demands in the three countries. Growth rates in Angola reflected recent
acceleration associated with resettlement in demined areas. Increased water
consumption was mainly due to growth in urban and rural domestic, livestock and
irrigation water demands. The largest water demands were represented by:
Some 3,100 ha of irrigation in Namibia
Some 18,000 ha of irrigation along the Cuebe River in Angola
One storage based and three runofriver hydropower stations in Angola
A medium growth (Med Dev) or "businessasusual" scenario included:
Some 8,400 ha of irrigation in Namibia
Development of a first phase of the Eastern National Carrier (17 Mm3/a) for water
supply from the Kavango to Grootfontein and Windhoek,
Some 198,000 ha of irrigation at various locations in Angola
One storage based and four runofriver hydropower stations in Angola
A high growth (High Dev) scenario included:
Some 15,000 ha of irrigation in Namibia
Some 338,000 ha of irrigation at various locations in Angola
Completion of all planned hydropower stations in Angola, i.e. one storage based and
nine runofriver hydropower stations in Angola ,
Completion of a second phase of the Eastern National Carrier (total capacity
100Mm3/a),
Development of a scaled down version of the Southern Okavango Integrated Water
Development Scheme (SOIWD) for urban and industrial water supply from the Delta
to Maun. At these levels of demand, it was necessary to introduce a hypothetical
dam in the upper basin (Cuchi River) with a capacity of some 500 million m3 to
provide for shortfalls in irrigation water supply and interbasin transfers.
Below, response curves from the EFA model are presented, for all the socio-
economic indicators at the two study sites in the Namibian basin. The EFA analysis,
though the response curves, captures the short term changes in the socio-economic
livelihoods and economic contributions. It does not deal with the longer term question
of how communities and investors in river/wetland natural resource use will adapt to
changes in the flow. The EFA process thus contained a further step where prediction
of future changes in resource uses and their socio-economic values was made.
These future streams of value extended over 40 years and were discounted, at a 4%
discount rate, to measure the net present value (NPV). These NPVs included
expected future population growth, tourism demand growth and expected long term
32
EFA Namibia Socio-economics
adaptations where relevant. Thus, growth in natural resources use due to population
increase was assumed to be 1.5% per annum in Namibia. Tourism demand was
anticipated to grow at 5% per annum on average in all scenarios. Where tourism was
found to collapse in the short term it was assumed to adapt, with its output settling at
between 5% and 25% depending on the scenario. Further, carrying capacity limits to
growth for certain activities were assumed, +75% of starting output in the case of
tourism, and +100% of starting output in the case of fishing. The adaptation
assumptions were subjective, while assumptions on growth in tourism demand and
populations were more analytical. The Bar charts below which show long term
impacts incorporate all these considerations.
Direct contribution to the national income is a comprehensive measure that includes
the basin household net income, as well as the income to other basin investors, and
stakeholders. Household net income has been used as a useful indicator, but the
direct economic contribution provides a better measure the true impact on socio-
economic welfare attributable to activities in the basin. It has thus been used as the
critical measure to value change as discussed below.
33
EFA Namibia Socio-economics
5 VALUES AND FLOW-RESPONSE RELATIONSHIPS
IN THE OKAVANGO EFA MODEL
5.1 Base
values
Current aggregate values estimated for the household income derived from each
socio-economic indicator in the Namibian basin are shown in Figure 5.1. It is clear
that tourism is an important river/wetland based contributor to livelihoods, while fish
and floodplain grass are also important. Aggregate livelihood values for each of the
two IUAs (8 and 9) in the Namibian basin are shown in Figures 5.2 and 5.3. IUA 8
has livelihood characteristics more typical of the Namibian river as a whole. In IUA 9,
which does not have a floodplain and is partly occupied by protected area, the
river/wetland-based livelihoods are dominated by tourism.
Figure 5.4 shows the aggregate direct and indirect economic contribution to the
national income derived from use of those resources constituting the socio-economic
indicators in the Namibian basin. Here the picture is similar to that for livelihoods,
except that the values are much higher, and the share attributable to tourism is
greater. The values are higher because all income is measured, not just that
accruing to households, and the multiplier effect is included. The multiplier effect
reflects the impact of these uses and the broader economy. It is greater for tourism
than it is for the other river/wetland based resource uses.
Namibia Household income from Okavango River
US$ 8.2 million
18%
Fish
Reeds
45%
7%
Grass
Gardens
Grazing
21%
Tourism
5% 4%
Figure 5. 1: Estimated livelihood value of Okavango river/wetland based natural
resource use in Namibia in 2008 (US$1.00 = N$ 8.16)
34
EFA Namibia Socio-economics
IUA 8 (Kapako Site) Household income from River US$ 7.3
million
Fish
19%
Reeds
40%
7%
Grass
Gardens
Grazing
23%
5%
Tourism
4%
Figure 5. 2: Estimated livelihood value of river/wetland based natural resource use in
IUA 8 in Namibia, 2008 (US$1.00 = N$ 8.16)
IUA 9 (Popa Site) Household Income from River
US$837,000
4% 1%5% 1% 1%
Fish
Reeds
Grass
Gardens
Grazing
88%
Tourism
Figure 5. 3: Estimated livelihood value of river/wetland based natural resource use in
IUA 9 in Namibia, 2008 (US$1.00 = N$ 8.16
35
EFA Namibia Socio-economics
Namibia Total Economic Impact of Okavango River
US$43 million
1%
3%
Fish
10%
12%
Reeds
Grass
10%
1%
Gardens
2%
Grazing
Tourism
61%
Function
Nonuse
Figure 5. 4: Estimated total direct and indirect impact of Okavango river/wetland based
natural resource use in the Namibian basin on the Namibian economy in
2008 (US$1.00 = N$ 8.16)
5.2 Flow
responses
Indicator 1 - Fish
KAPAKO - IUA 8 - Study site 4
Fishing at present day is near biological capacity. Floodplain here allows annual
large increases in fish abundance. Large changes will be only partly matched in
catch by volume, but demand will rise with some commercialisation. Decrease in fish
abundance will result in some over harvesting but this is offset by lower ability to
catch.
250
200
150
100
50
0
0
50
0
0
0
0
0
0
0
0
10
15
20
25
30
35
40
45
Fish catch response to fish abundance (% of present day)
36
EFA Namibia Socio-economics
900
800
700
600
500
400
300
200
100
0
0
50
100
150
200
250
Household net income response to fish catch (N$ per household per annum)
5000
4000
3000
2000
1000
0
0
50
100
150
200
250
Economic impact response to fish catch (N$ per household per annum)
...
...
...
...
...
...
...
...
...
...
...
...
...
...
...
...
...
...
...
...
...
...
1
1
1
1
1
1
1
1
1
1
1
1
1
1
1
1
1
1
1
1
1
2
140
1800
1600
120
1400
100
D
1200 rs
f
P
80
l
l
a
1000
% o
Do
60
800 ia
i
b
600
40
m
400 Na
20
200
0
0
1
2
3
4
5
6
7
8
9
10
11
12
13
14
15
16
17
18
19
20
21
22
23
24
25
26
27
28
29
30
31
32
33
34
35
36
37
38
39
40
41
42
43
Catch%
1. Household net income - fish
9.1. Contrib to national - fish
Changes in fish catch, livelihood and total economic impact in last 43 years
37
EFA Namibia Socio-economics
200
FISH
180
160
140
120
PD Simulated
100
Low Dev
80
Med Dev
High Dev
60
40
20
0
59
62
65
68
71
74
77
80
83
86
89
92
95
98
01
19
19
19
19
19
19
19
19
19
19
19
19
19
19
20
Simulated fish catch response to scenarios over last 43 years
POPA - IUA 9 - Study site 5
Lack of floodplain at Popa means fish abundance more stable than at Kapako.
Fishing at present day is close to capacity at lower fish abundance, communities in
the area enforce a local policy prohibiting commercial fishing. Decrease in fish
abundance will result in some over harvesting but this is offset by lower ability to
catch.
160
140
120
100
80
60
40
20
0
0
50
0
0
0
0
0
0
0
0
10
15
20
25
30
35
40
45
Fish catch response to fish abundance (% of present day)
38
EFA Namibia Socio-economics
600
500
400
300
200
100
0
0
50
100
150
200
Household net income response to fish catch (N$ per household per annum)
2500
2000
1500
1000
500
0
0
50
100
150
Economic impact response to fish catch (N$ per household per annum)
...
...
...
...
...
...
...
...
...
...
...
...
...
...
...
...
...
...
...
...
...
...
1
1
1
1
1
1
1
1
1
1
1
1
1
1
1
1
1
1
1
1
1
2
140
1600
1400
120
1200
100
D
r
s
1000
f
P
80
l
l
a
% o
800 Do
60
i
a
600 ib
40
m
400 Na
20
200
0
0
1
2
3
4
5
6
7
8
9
10
11
12
13
14
15
16
17
18
19
20
21
22
23
24
25
26
27
28
29
30
31
32
33
34
35
36
37
38
39
40
41
42
43
Catch%
1. Household net income - fish
9.1. Contrib to national - fish
Changes in fish catch, livelihood and total economic impact in last 43 years
39
EFA Namibia Socio-economics
Fish catch
140
120
100
80
PD 60
% of 40
20
0
1959
1962
1965
1968
1971
1974
1977
1980
1983
1986
1989
1992
1995
1998
2001
PD Simulated
Low Dev
Med Dev
High Dev
PD Obs/Wshop
Simulated fish catch response to scenarios over last 43 years
Namibia Effect of scenario on household
fish income US$
1,600,000
1,400,000
1,200,000
1,000,000
800,000
600,000
400,000
200,000
0
PD
Low
Med
High
Aggregate short term effect of scenario on livelihoods from fish in Namibian basin
(US$/annum, where US$1.00 = N$8.16)
40
EFA Namibia Socio-economics
Namibia fish direct economic contribution
40 year NPV @ 4% (US$)
50,000,000
45,000,000
40,000,000
35,000,000
30,000,000
25,000,000
20,000,000
15,000,000
10,000,000
5,000,000
0
PD
Low Dev
Med Dev
High Dev
Aggregate long term effect of scenario on direct economic impact from fish in
Namibian basin (US$, 40 year NPV @ 8%, where US$1.00 = N$8.16)
Indicator 2 - Reeds
KAPAKO - IUA 8 - Study site 4
The PD demand exceeds supply. With decreasing area the full amount available is
harvested. With increasing area harvest is also likely to increase but will tapers off
with demand. Reeds harvested both on wet banks and middle floodplain
160
140
120
100
80
60
40
20
0
0
50
100
150
200
250
Reed harvest response to reed abundance on wet bank (% of present day)
41
EFA Namibia Socio-economics
160
140
120
100
80
60
40
20
0
0
50
100
150
200
Reed harvest response to reed abundance on middle floodplain (% of present day)
1200
1000
800
600
400
200
0
0
50
100
150
200
Household net income response to reed harvest (N$ per household per annum)
3000
2500
2000
1500
1000
500
0
0
50
100
150
200
Economic impact response to reed harvest (N$ per household per annum)
42
EFA Namibia Socio-economics
...
...
...
...
...
...
...
...
...
...
...
...
...
...
...
...
...
...
...
...
...
...
1
1
1
1
1
1
1
1
1
1
1
1
1
1
1
1
1
1
1
1
1
2
140
2500
120
2000
100
D
f
P
1500 rs
80
l
l
a
o
% o 60
D
1000 ia
i
b
40
m
500 Na
20
0
0
1
2
3
4
5
6
7
8
9
10
11
12
13
14
15
16
17
18
19
20
21
22
23
24
25
26
27
28
29
30
31
32
33
34
35
36
37
38
39
40
41
42
43
Harvest%
2. Household income - reeds
9.2. Contrib to national - reeds
Changes in reed harvest, livelihoods and total economic impact on in last 43 years
102
upper wetbank floodplain
101
100
99
PD Simulated
98
97
Low Dev
96
Med Dev
95
High Dev
94
93
92
9
2
5
8
1
4
7
0
3
6
9
2
5
8
1
195
196
196
196
197
197
197
198
198
198
198
199
199
199
200
Simulated reed harvest response to scenarios on wet banks over last 43 years
105
middle floodplain
100
95
PD Simulated
90
Low Dev
Med Dev
85
High Dev
80
75
1959
1961
1963
1965
1967
1969
1971
1973
1975
1977
1979
1981
1983
1985
1987
1989
1991
1993
1995
1997
1999
2001
Simulated reed harvest response to scenarios on middle floodplains over last 43
years
43
EFA Namibia Socio-economics
Reed harvest
150
100
PD
% of 50
0
1
959
1
962
1
965
1
968
1
971
1
974
1
977
1
980
1
983
1
986
1
989
1
992
1
995
1
998
2
001
PD Simulated
Low Dev
Med Dev
High Dev
PD Obs/Wshop
Simulated general reed harvest response to scenarios over last 43 years
POPA - IUA 9 - Study site 5
Lack of floodplain at Popa means reeds only available on upper wet-banks. Used to
capacity on south bank, but availability of reeds is high in the northern upper wet-
bank, which area is partly protected and difficult to access
140
120
100
80
60
40
20
0
0
50
100
150
200
250
Reed harvest response to reed abundance (% of present day)
900
800
700
600
500
400
300
200
100
0
0
50
100
150
200
44
EFA Namibia Socio-economics
Household net income response to reed harvest (N$ per household per annum)
2500
2000
1500
1000
500
0
0
50
100
150
Economic impact response to reed harvest (N$ per household per annum)
1
1
1
1
1
1
1
1
1
1
1
1
1
1
1
1
1
1
1
1
1
2
120
1800
1600
100
1400
D 80
1200sr
P
f
1000
60
l
l
a
800
% o
Do
40
600 ia
400 ib
20
m
200 Na
0
0
1
2
3
4
5
6
7
8
9
10
11
12
13
14
15
16
17
18
19
20
21
22
23
24
25
26
27
28
29
30
31
32
33
34
35
36
37
38
39
40
41
42
43
Harvest%
2. Household income - reeds
9.2. Contrib to national - reeds
Changes in reed harvest, livelihood and total economic impact in last 43 years
Reed harvest
100
80
60
PD
40
% of 20
0
1959
1962
1965
1968
1971
1974
1977
1980
1983
1986
1989
1992
1995
1998
2001
PD Simulated
Low Dev
Med Dev
High Dev
PD Obs/Wshop
Simulated reed harvest response to scenarios over last 43 years
45
EFA Namibia Socio-economics
Namibia reeds direct economic contribution
40 year NPV @ 4% (US$)
16,000,000
15,500,000
15,000,000
14,500,000
14,000,000
13,500,000
13,000,000
PD
Low Dev
Med Dev
High Dev
Aggregate long term effect of scenario on long term direct economic impact from
reed harvest in Namibian basin (US$, 40 year NPV @ 8%, where US$1.00 = N$8.16)
Indicator 3 - Floodplain grass
KAPAKO - IUA 8 - Study site 4
The present day demand exceeds supply. With decreasing area the full amount
available will be harvested. With increasing area, harvest increases but tapers off
with demand. Grass harvested both on middle and upper floodplain
160
140
120
100
80
60
40
20
0
0
20
40
60
80
0
0
0
0
0
10
12
14
16
18
Grass harvest response to grass abundance on middle floodplain (% of present day)
46
EFA Namibia Socio-economics
160
140
120
100
80
60
40
20
0
0
50
100
150
200
250
Grass harvest response to grass abundance on upper floodplain (% of present day)
2500
2000
1500
1000
500
0
0
50
100
150
Household net income response to grass harvest (N$ per household per annum)
6000
5000
4000
3000
2000
1000
0
0
50
100
150
Economic impact response to reed harvest (N$ per household per annum)
47
EFA Namibia Socio-economics
1
1
1
1
1
1
1
1
1
1
1
1
1
1
1
1
1
1
1
1
1
2
140
5000
4500
120
4000
100
3500
D
s
P
3000 r
80
2500 llao
% of 60
2000 Dia
40
1500 ib
1000 m
20
500 Na
0
0
1
2
3
4
5
6
7
8
9
10
11
12
13
14
15
16
17
18
19
20
21
22
23
24
25
26
27
28
29
30
31
32
33
34
35
36
37
38
39
40
41
42
43
Harvest%
3. Household income - floodplain grass
9.3. Contrib to national - fp grass
Changes in grass harvest, livelihoods and total economic impact on in last 43 years
Grass harvest
150
100
PD
% of 50
0
1959
1962
1965
1968
1971
1974
1977
1980
1983
1986
1989
1992
1995
1998
2001
PD Simulated
Low Dev
Med Dev
High Dev
PD Obs/Wshop
Simulated grass harvest response to scenarios over last 43 years
POPA - IUA 9 - Study site 5
Lack of floodplain at Popa means grass only available on upper wet-banks. Used to
capacity on south bank, but availability of grass is high in the northern upper wet-
bank, which area is partly protected and difficult to access
48
EFA Namibia Socio-economics
140
120
100
80
60
40
20
0
0
50
100
150
200
250
Grass harvest response to grass abundance (% of present day)
2000
1500
1000
500
0
0
50
100
150
200
Household net income response to grass harvest (N$ per household per annum)
5000
4000
3000
2000
1000
0
0
50
100
150
Economic impact response to grass harvest (N$ per household per annum)
49
EFA Namibia Socio-economics
...
...
...
...
...
...
...
...
...
...
...
...
...
...
...
...
...
...
...
...
...
...
1
1
1
1
1
1
1
1
1
1
1
1
1
1
1
1
1
1
1
1
1
2
120
4500
4000
100
3500
D 80
3000rs
f
P
2500lla
% o 60
Do
2000iaib
40
1500m
1000Na
20
500
0
0
1
2
3
4
5
6
7
8
9
10
11
12
13
14
15
16
17
18
19
20
21
22
23
24
25
26
27
28
29
30
31
32
33
34
35
36
37
38
39
40
41
42
43
Harvest%
3. Household income - floodplain grass
9.3. Contrib to national - fp grass
Changes in grass harvest, livelihood and total economic impact in last 43 years
Grass harvest
100
80
60
PD
40
% of 20
0
1959
1962
1965
1968
1971
1974
1977
1980
1983
1986
1989
1992
1995
1998
2001
PD Simulated
Low Dev
Med Dev
High Dev
PD Obs/Wshop
Simulated grass harvest response to scenarios over last 43 years
50
EFA Namibia Socio-economics
Namibia Effect of scenario on household
grass income US$
2,500,000
2,000,000
1,500,000
1,000,000
500,000
0
PD
Low
Med
High
Aggregate short term effect of scenario on livelihoods from floodplain grass harvest
in Namibian basin (US$/annum, where US$1.00 = N$8.16)
Namibia grass direct economic contribution
40 year NPV @ 4% (US$)
52,000,000
51,000,000
50,000,000
49,000,000
48,000,000
47,000,000
46,000,000
45,000,000
44,000,000
43,000,000
42,000,000
PD
Low Dev
Med Dev
High Dev
Aggregate long term effect of scenario on direct economic impact from floodplain
grass harvest in Namibian basin (US$, 40 year NPV @ 8%, where US$1.00 =
N$8.16)
51
EFA Namibia Socio-economics
Indicator 4 - Floodplain gardens
KAPAKO - IUA 8 - Study site 4
Present day gardens occupy half of lower floodplain. With decreasing floodplain area
gardens reduce proportionally. With increasing flood plain area, garden increase
tapers off due to capacity /demand / priority.
150
100
50
0
0
0
0
0
0
50
10
15
20
25
Floodplain gardens response to lower floodplain extent (% of present day)
120
100
80
60
40
20
0
0
50
100
150
200
Floodplain gardens harvest response to middle floodplain extent (% of present day)
400
350
300
250
200
150
100
50
0
0
50
100
150
Household net income response to floodplain gardens (N$ per household per
annum)
52
EFA Namibia Socio-economics
800
600
400
200
0
-200
-400
0
50
100
150
Economic impact response to floodplain gardens (N$ per household per annum)
...
...
...
...
...
...
...
...
...
...
...
...
...
...
...
...
...
...
...
...
...
...
1
1
1
1
1
1
1
1
1
1
1
1
1
1
1
1
1
1
1
1
1
2
120
500
400
100
300
D80
200
P
r
s
100 lla
% of60
Do
0 ia
i
b
40
-100m
Na
-200
20
-300
0
-400
1
2
3
4
5
6
7
8
9
10
11
12
13
14
15
16
17
18
19
20
21
22
23
24
25
26
27
28
29
30
31
32
33
34
35
36
37
38
39
40
41
42
43
Harvest%
4. Household income - floodplain gardens (e.g. molapo)
9.4. Contrib to national - fp gardens
Changes in floodplain gardens livelihood and total economic impact in last 43 years
250
lower floodplain
200
PD Simulated
150
Low Dev
100
Med Dev
High Dev
50
0
1
959
1
961
1
963
1
965
1
967
1
969
1
971
1
973
1
975
1
977
1
979
1
981
1
983
1
985
1
987
1
989
1
991
1
993
1
995
1
997
1
999
2
001
Simulated floodplain gardens response to scenarios in lower floodplain over last 43
years
53
EFA Namibia Socio-economics
105
middle floodplain
100
95
PD Simulated
90
Low Dev
Med Dev
85
High Dev
80
75
1
959
1
961
1
963
1
965
1
967
1
969
1
971
1
973
1
975
1
977
1
979
1
981
1
983
1
985
1
987
1
989
1
991
1
993
1
995
1
997
1
999
2
001
Simulated floodplain gardens response to scenarios in middle floodplain over last 43
years
Gardens
150
100
PD
% of 50
0
1959
1962
1965
1968
1971
1974
1977
1980
1983
1986
1989
1992
1995
1998
2001
PD Simulated
Low Dev
Med Dev
High Dev
PD Obs/Wshop
Simulated general floodplain gardens response to scenarios over last 43 years
Indicator 5 - Floodplain grazing
KAPAKO - IUA 8 - Study site 4
Present day floodplain grazing is on lower middle and upper floodplain. Present day
grazing is above carrying capacity. Decreasing area could result in drop in stock
numbers. Increasing area may result in increased stock numbers.
54
EFA Namibia Socio-economics
160
140
120
100
80
60
40
20
0
0
50
100
150
200
250
Floodplain grazing response to lower floodplain extent (% of present day)
150
100
50
0
0
50
100
150
200
Floodplain gardens harvest response to middle floodplain extent (% of present day)
160
140
120
100
80
60
40
20
0
0
100
200
300
Floodplain gardens harvest response to upper floodplain extent (% of present day)
1200
1000
800
600
400
200
0
0
50
100
150
Household net income response to floodplain grazing (N$ per household per annum)
55
EFA Namibia Socio-economics
4000
3000
2000
1000
0
-1000
0
50
100
150
Economic impact response to floodplain grazing (N$ per household per annum)
...
...
...
...
...
...
...
...
...
...
...
...
...
...
...
...
...
...
...
...
...
...
1
1
1
1
1
1
1
1
1
1
1
1
1
1
1
1
1
1
1
1
1
2
120
1600
1400
100
1200 s
D 80
P
1000 llaro
% of 60
800 ia D
600 ib
40
am
400 N
20
200
0
0
1
2
3
4
5
6
7
8
9
10
11
12
13
14
15
16
17
18
19
20
21
22
23
24
25
26
27
28
29
30
31
32
33
34
35
36
37
38
39
40
41
42
43
Numbers
5. Household income and wealth - livestock
9.5. Contrib to national - livestock
Changes in floodplain grazing, livelihood, and total economic impact in last 43 years
250
lower floodplain
200
PD Simulated
150
Low Dev
100
Med Dev
High Dev
50
0
1
959
1
961
1
963
1
965
1
967
1
969
1
971
1
973
1
975
1
977
1
979
1
981
1
983
1
985
1
987
1
989
1
991
1
993
1
995
1
997
1
999
2
001
Simulated floodplain grazing response to scenarios in lower floodplain over last 43
years
56
EFA Namibia Socio-economics
105
middle floodplain
100
95
PD Simulated
90
Low Dev
Med Dev
85
High Dev
80
75
1
959
1
961
1
963
1
965
1
967
1
969
1
971
1
973
1
975
1
977
1
979
1
981
1
983
1
985
1
987
1
989
1
991
1
993
1
995
1
997
1
999
2
001
Simulated floodplain grazing response to scenarios in middle floodplain over last 43
years
180
upperfloodplain
160
140
120
PD Simulated
100
Low Dev
80
Med Dev
60
High Dev
40
20
0
59
61
63
65
67
69
71
73
75
77
79
81
83
85
87
89
91
93
95
97
99
01
19
19
19
19
19
19
19
19
19
19
19
19
19
19
19
19
19
19
19
19
19
20
Simulated floodplain grazing response to scenarios in upper floodplain over last 43
years
57
EFA Namibia Socio-economics
Livestock output
160
140
120
100
PD 80
60
% of 40
200
1959
1962
1965
1968
1971
1974
1977
1980
1983
1986
1989
1992
1995
1998
2001
PD Simulated
Low Dev
Med Dev
High Dev
PD Obs/Wshop
Simulated general floodplain grazing response to scenarios over last 43 years
Indicator 6 - Tourism
KAPAKO - IUA 8 - Study site 4
Dry season channel flow only affects tourism numbers at very low levels. Flood type
is measured by volume (in this example). Response is estimated based on empirical
survey results. Enhanced wildlife mainly birds increases tourism numbers but
decreasing wildlife has a relatively small effect on the general demand. Demand in
this area is not primarily driven by wildlife.
140
120
100
80
60
40
20
0
0
10
20
30
40
50
60
70
80
Tourist numbers response to dry season low flow (% of present day)
58
EFA Namibia Socio-economics
120
100
80
60
40
20
0
0
200
400
600
800
1000
1200
Tourist numbers response to flood type (% of present day)
250
200
150
100
50
0
0
100
200
300
Tourist numbers response to wildlife abundance (% of present day)
1200000
1000000
800000
600000
400000
200000
0
0
50
100
150
Household net income response to tourist numbers (N$ per household per annum)
5000000
4000000
3000000
2000000
1000000
0
-1000000
-2000000
-3000000
-4000000
-5000000
0
50
100
150
Economic impact response to tourist numbers (N$ per household per annum)
59
EFA Namibia Socio-economics
59
61
63
65
67
69
71
73
75
77
79
81
83
85
87
89
91
93
95
97
99
01
19
19
19
19
19
19
19
19
19
19
19
19
19
19
19
19
19
19
19
19
19
20
100
2000000
90
1000000
80
r
s
70D
0
l
l
a
60f P
50
-1000000 Do
% o
i
a
40
-2000000ib
30
m
20
-3000000Na
10
0
-4000000
1
2
3
4
5
6
7
8
9
10
11
12
13
14
15
16
17
18
19
20
21
22
23
24
25
26
27
28
29
30
31
32
33
34
35
36
37
38
39
40
41
42
43
Numbers
6. Household income - tourism
9.6. Contrib to national - tourism
Changes in tourist numbers, livelihood, and total economic impact on in last 43 years
60
Min dry season Q
50
40
PD Simulated
30
Low Dev
Med Dev
20
High Dev
10
0
59
61
63
65
67
69
71
73
75
77
79
81
83
85
87
89
91
93
95
97
99
01
19
19
19
19
19
19
19
19
19
19
19
19
19
19
19
19
19
19
19
19
19
20
Simulated tourist numbers response to scenarios in case of dry season minimal flow
over last 43 years
1000
Max wet season Q
900
800
700
PD Simulated
600
500
Low Dev
400
Med Dev
300
High Dev
200
100
0
1
959
1
961
1
963
1
965
1
967
1
969
1
971
1
973
1
975
1
977
1
979
1
981
1
983
1
985
1
987
1
989
1
991
1
993
1
995
1
997
1
999
2
001
Simulated tourist numbers response to scenarios in case of flood type over last 43
years
60
EFA Namibia Socio-economics
120
wildlife
100
80
PD Simulated
60
Low Dev
Med Dev
40
High Dev
20
0
1959
1961
1963
1965
1967
1969
1971
1973
1975
1977
1979
1981
1983
1985
1987
1989
1991
1993
1995
1997
1999
2001
Simulated tourist numbers response to scenarios in case of wildlife numbers over last
43 years
Tourist numbers
160
140
120
100
PD 80
60
% of 40
200
1959
1962
1965
1968
1971
1974
1977
1980
1983
1986
1989
1992
1995
1998
2001
PD Simulated
Low Dev
Med Dev
High Dev
PD Obs/Wshop
Simulated general tourist numbers response to scenarios over last 43 years
POPA - IUA 9 - Study site 5
Dry season channel flow only affects tourism numbers at very low levels. Flood type
is measured by volume (in this example). Response is estimated based on empirical
survey results. Enhanced wildlife mainly birds increases tourism numbers but
decreasing wildlife has a relatively small effect on the general demand. Demand in
this area is not primarily driven by wildlife.
61
EFA Namibia Socio-economics
140
120
100
80
60
40
20
0
0
50
100
150
200
250
Tourist numbers response to dry season low flow (% of present day)
120
100
80
60
40
20
0
0
500
1000
1500
2000
Tourist numbers response to flood type (% of present day)
250
200
150
100
50
0
0
100
200
Tourist numbers response to wildlife abundance (% of present day)
1040000
1020000
1000000
980000
960000
940000
920000
900000
880000
860000
840000
0
50
100
150
62
EFA Namibia Socio-economics
Household net income response to tourist numbers (N$ per household per annum)
3000000
2000000
1000000
0
-1000000
-2000000
-3000000
-4000000
0
50
100
150
Economic impact response to tourist numbers (N$ per household per annum)
59
61
63
65
67
69
71
73
75
77
79
81
83
85
87
89
91
93
95
97
99
01
19
19
19
19
19
19
19
19
19
19
19
19
19
19
19
19
19
19
19
19
19
20
100
2000000
90
1000000
80
r
s
70D
0
l
l
a
60f P
50
-1000000 Do
% o
i
a
40
-2000000ib
30
m
20
-3000000Na
10
0
-4000000
1
2
3
4
5
6
7
8
9
10
11
12
13
14
15
16
17
18
19
20
21
22
23
24
25
26
27
28
29
30
31
32
33
34
35
36
37
38
39
40
41
42
43
Numbers
6. Household income - tourism
9.6. Contrib to national - tourism
Changes in tourist numbers, livelihood, and total economic impact on in last 43 years
160
Dq - dry low
140
120
100
80
60
40
20
0
59
62
65
68
71
74
77
80
83
86
89
92
95
98
01
19
19
19
19
19
19
19
19
19
19
19
19
19
19
20
PD Simulated
Low Dev
Med Dev
High Dev
Simulated tourist numbers response to scenarios in case of dry season minimal flow
over last 43 years
63
EFA Namibia Socio-economics
1600
Fq - flood peak
PD Simulated
1400
Low Dev
1200
Med Dev
1000
High Dev
800
600
400
200
0
9
2
5
8
1
4
7
0
3
6
9
2
5
8
1
195
196
196
196
197
197
197
198
198
198
198
199
199
199
200
Simulated tourist numbers response to scenarios in case of flood type over last 43
years
140
Wildlife
120
100
80
60
40
20
0
959
962
965
968
971
974
977
980
983
986
989
992
995
998
001
1
1
1
1
1
1
1
1
1
1
1
1
1
1
2
PD Simulated
Low Dev
Med Dev
High Dev
Simulated tourist numbers response to scenarios in case of wildlife numbers over last
43 years
64
EFA Namibia Socio-economics
Tourist numbers
100
80
60
f
PD
40
% o 20
0
1959
1962
1965
1968
1971
1974
1977
1980
1983
1986
1989
1992
1995
1998
2001
PD Simulated
Low Dev
Med Dev
High Dev
PD Obs/Wshop
Simulated general tourist numbers response to scenarios over last 43 years
Namibia Effect of scenario on household tourism
income US$
4,000,000
3,500,000
3,000,000
2,500,000
2,000,000
1,500,000
1,000,000
500,000
0
PD
Low
Med
High
Aggregate short term effect of scenario on livelihoods from tourism in Namibian basin
(US$/annum, where US$1.00 = N$8.16)
65
EFA Namibia Socio-economics
Namibia tourism direct economic contribution
40 year NPV @ 4% (US$)
350,000,000
300,000,000
250,000,000
200,000,000
150,000,000
100,000,000
50,000,000
0
PD
Low Dev
Med Dev
High Dev
Aggregate long term effect of scenario on direct economic impact from tourism in
Namibian basin (US$, 40 year NPV @ 8%, where US$1.00 = N$8.16)
Overall aggregate effects on livelihoods and the economy are presented below.
Namibia households direct economic
contribution
40 year NPV @ 4% (US$)
250,000,000
200,000,000
150,000,000
100,000,000
50,000,000
0
PD
Low Dev
Med Dev
High Dev
66
EFA Namibia Socio-economics
Aggregate long term effect of scenario on direct economic impact from household
use of natural resource use in Namibian basin (US$, 40 year NPV @ 8%, where
US$1.00 = N$8.16)
Namibia total direct economic contribution
40 year NPV @ 4% (US$)
600,000,000
500,000,000
400,000,000
300,000,000
200,000,000
100,000,000
0
PD
Low Dev
Med Dev
High Dev
Aggregate long term effect of scenario on direct economic impact from all natural
resource use in Namibian basin (US$, 40 year NPV @ 8%, where US$1.00 =
N$8.16)
67
EFA Namibia Socio-economics
6 CONCLUSION
The EFA model has been successfully used to measure impacts of water change on
the socio-economic environment in the Namibian part of the Okavango river basin.
Many of the biophysical impacts of flow change on the river and the river ecosystem,
as measured in the EFA model, translate into impacts on the livelihoods and
economic welfare of the basin's people and economies. The biophysical responses
modeled are linked to changes in abundance and availability of natural resource
products used in the basin. These abundance responses, when applied to enterprise
models, measure change in private net incomes (livelihoods) and economic national
income (economic contribution).
Both livelihoods and national income are predicted to decline in the water use
development scenarios. Livelihoods derived from river/wetland resources may
decline in the long term by some 50%. The economic national income contribution
may decline in the long term by up to about 70%. Short term impacts may be even
more devastating.
68
EFA Namibia Socio-economics
7 REFERENCES
CBS (Central Bureau of Statistics). 2008. A review of poverty and inequality in
Namibia. Central Bureau of Statistics, National Planning Commission, Windhoek,
Namibia. 99pp.
Lange, G., Schade, K., Ashipala, J. & Haimbodi, N. 2004. A social accounting
matrix for Namibia 2002: a tool for analyzing economic growth, income distribution
and poverty. NEPRU Working Paper 97 Namibia Economic Policy Research Unit,
Windhoek, Namibia. 47pp.
Mbaiwa, J.E. & Mmopelwa, G. 2009. Climate change and tourism development:
Assessing the impact of climate change on tourism activities and their economic
benefits in the Okavango Delta. Unpublished Report, EPSMO Project, Harry
Oppenheimer Okavango Research Centre (HOORC), University of Botswana, Maun,
Botswana. 17pp.
Mendelsohn, J. & el Obeid, S. 2003. Sand and water: A profile of the Kavango
region. Struik Publishers, Cape Town, South Africa. 136pp.
Mendelsohn, J.M. & el Obeid, S. 2004. Okavango River: The flow of a lifeline.
Struik Publishers, Cape Town, South Africa. 176pp.
Mendelsohn, J., Jarvis, A., Roberts, C. & Robertson, T. 2002. Atlas of Namibia: a
portrait of the land and its people. David Philip Publishers, Cape Town, South Africa.
200pp.
Saraiva, R. (Ed.) 2009. Diagnóstico transfronteiriço Bacia do Okavango: Análise
socioeconómica Angola. Relatório năo Publicado, Projecto de Proteccçăo Ambiental
e Gestăo Sustentável da Bacia Hidrográfica do Okavango (PAGSO), Luanda,
Angola. 54pp.
Turpie, J., Barnes, J., Arntzen, J., Nherera, B., Lange, G-M. & Buzwani, B. 2006.
Economic value of the Okavango Delta, Botswana, and implications for
management. Department of Environmental Affairs, Gaborone, Botswana. 136pp.
Yaron, G., Janssen, G., Maamberua, U. & Hubbard D. 1992. Rural development in
the Okavango region of Namibia: an assessment of needs, opportunities and
constraints, Gamsberg Macmillan, Windhoek, Namibia, 245pp.
69
EFA Namibia Socio-economics
APPENDIX A: STAKEHOLDERS PARTICIPATION
REPORT
EFA-Stakeholders Participation information in Kapako and Popa
D. Wamunyima
The stakeholder dialogue of the EFA was introduces in two sites in the Namibia side
of the Okavango River Basin, (Kapako and Popa) as a unique participatory
mechanisms enabling direct interaction between female and male participants of
Chefs, local senior headman, village development committees, constituency
development committee, extension officer, farmers, fisherman and basin residents at
large on specific topics.
With the increasing recognition of the essential role played by major groups as
custodian /users of the natural resources, meetings were conducted using the focus
group discussion, and this was a participatory approach, continued to be developed,
aimed at stimulating more productive dialogue and inspiring collaborative efforts
among major resource user groups, local authorities as land custodian an the
government system, building on lessons learned from the past traditional practices
During the focus group discussion the basin resident mentioned that, the flooding
starts when the rising river and channel waters push out over flat surrounding ground
and the biggest floodplains form in years when river levels are highest.
The most important feature of the flooded areas is that they are rich in nutrients. The
floodplains also offer the young fish refuge from larger, predatory species and
greatest survival of young fish and overall increase in fish population occurs in years
when water levels are high and flooding lasts longest.
Local people have recognised the quality of water and fish recourses is decreasing in
the Okavango River. Fish remain the significant feature in the lives of people at
Kapako, who fish for food or earn incomes by selling their catches or providing trips
for tourists. Fish stock in the floodplains is estimated to be four times higher than in
the main channel.
The environmental flow analysis dialogues helped to promote meaningful
stakeholders participation. The dialogues emerged as a significant component of the
official meeting
The dialogues emerged as a significant component of the official meetings, and grew
to become accepted as part of the process, rather than as an ancillary event taking
place on the margins of negotiations.
The preparation for the collection of EFA data was itself a stakeholder participation
process, involving a steering group of organizing partners from each major group.
The content of the dialogue was determined in consultation with the EFA consultant
and the organizing partners facilitated by the delineation process.
The organizing partners engaged in consultations with their major group to draft a
'dialogue starter paper' (a position questioner paper) and determine who would speak
for the group during the dialogue. The dialogue papers were released as part of the
official documentation in languages without editing the content. The Chair's Summary
70
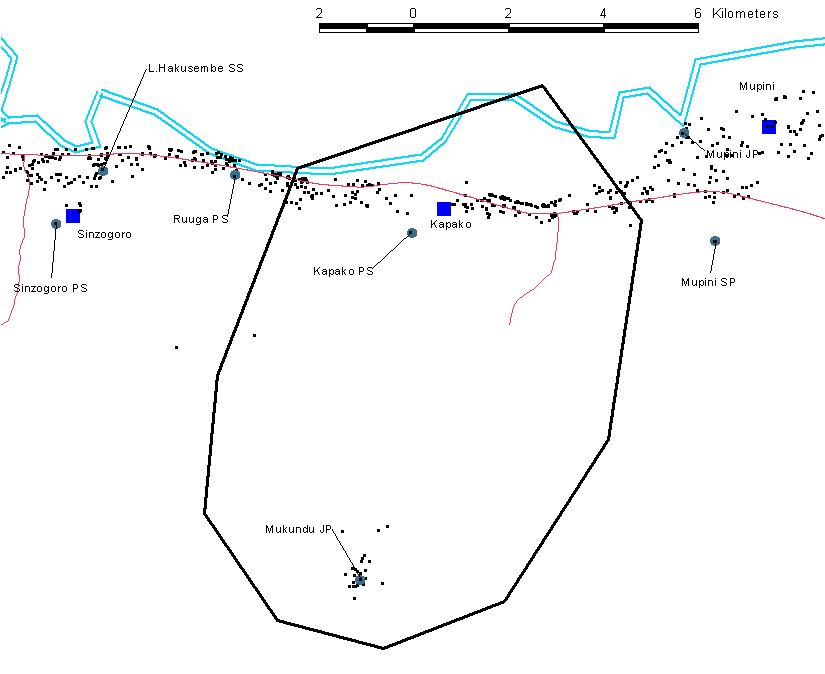
EFA Namibia Socio-economics
of the stakeholder participation segments reflected the areas of discussion covered
during the dialogues and highlighted recommendations made by the major groups.
Chair's summaries were included in the official report of each target sites are as
below.
Site I: Kapako
Site 2: Popa
71
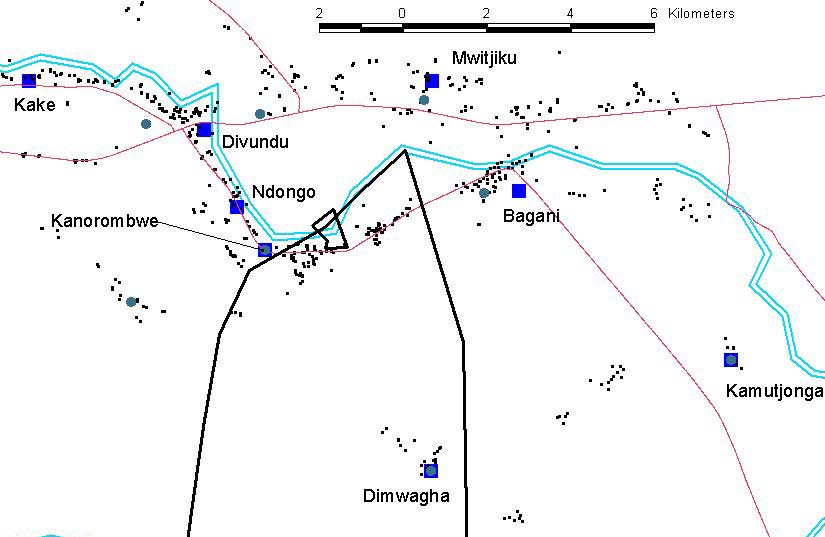
EFA Namibia Socio-economics
The EFA succeeded in integrating major groups fully into the stakeholders
participation process, continuing the tradition of the multi-stakeholder dialogue and
going further to establish the presence of major groups in high-level roundtables,
expert panels, and partnerships for sustainable development.
About 47% of households at Kapako catch fish, the number of households that catch
fish into accounts each person consumes an average of 10-20 kilograms of fish per
year.
September to December when the river is at its lowest and fish are concentrated is
the peak months for fishing at Kapako.
The kinds of traps or gear used to catch fish are separated into traditional and
modern methods.
The most used traditional gear are fish funnels, kraal traps, scoop baskets, push
baskets, bows and arrows, set fish hooks and spears
Modern gear consists of line and hooks, wire mesh fykes, mosquito nets, and gill and
seine nets.
The use of fish for recreational angling forms part of the tourism value associated
with the river. Biophysical response curves for the angling species would feed into
the tourism values for the river reducing them to a partial extent. Only a small part of
tourism values is attributable to angling
The riverine landscape comprises of main Okavango river channel, floodplains with
braided channels, fluvial terrace with alluvial deposits are flooded regularly
72
EFA Namibia Socio-economics
The increase in human population and clearing for crops and livestock has put more
pressure on the natural resources along the main channel
The vegetation along the river bank is overgrazed and depleted, thus at Kapako the
residents graze their livestock across the river on the Angolan floodplain
Physical changes in land use, land cover and population density within a river's
watersheds usually have an impact on the hydrology and water-quality of the river.
About 47% of households at Kapako catch fish, the number of households that catch
fish into accounts each person consumes an average of 10-20 kilograms of fish per
year.
September to December when the river is at its lowest and fish are concentrated is
the peak months for fishing at Kapako.
The kinds of traps or gear used to catch fish are separated into traditional and
modern methods.
The most used traditional gear are fish funnels, kraal traps, scoop baskets, push
baskets, bows and arrows, set fish hooks and spears
Modern gear consists of line and hooks, wire mesh fykes, mosquito nets, and gill and
seine nets.
The use of fish for recreational angling forms part of the tourism value associated
with the river. Biophysical response curves for the angling species would feed into
the tourism values for the river reducing them to a partial extent. Only a small part of
tourism values is attributable to angling
The riverine landscape comprises of main Okavango river channel, floodplains with
braided channels, fluvial terrace with alluvial deposits are flooded regularly
The increase in human population and clearing for crops and livestock has put more
pressure on the natural resources along the main channel
The vegetation along the river bank is overgrazed and depleted, thus at Kapako the
residents graze their livestock across the river on the Angolan floodplain
Physical changes in land use, land cover and population density within a river's
watersheds usually have an impact on the hydrology and water-quality of the river.
Recommendations
It is important that the role of social science and technology in human affairs be more
widely known and better understood, both by decision makers who help determine
public policy and by the general public. The cooperative relationship existing between
the scientific and technological community and the general public should be
extended and deepened into a full partnership.
Improved communication and cooperation between the scientific and technological
community and decision makers will facilitate greater use of scientific and technical
information and knowledge in policies and programme implementation. Decision
73
EFA Namibia Socio-economics
makers should create more favourable conditions for improving training and
independent research in sustainable development
Existing multidisciplinary approaches will have to be strengthened and more
interdisciplinary studies developed between the scientific and technological
community and policy makers and with the general public to provide leadership and
practical know-how to the concept of sustainable development.
The public should be assisted in communicating their sentiments to the scientific and
technological community concerning how science and technology might be better
managed to affect their lives in a beneficial way. By the same token, the
independence of the scientific and technological community to investigate and
publish without restriction and to exchange their findings freely must be assured.
The adoption and implementation of ethical principles and codes of practice for the
scientific and technological community that are internationally accepted could
enhance professionalism and may improve and hasten recognition of the value of its
contributions to environment and development, recognizing the continuing evolution
and uncertainty of scientific knowledge, e.g. the National development Action Plan
(NDAC) for the Okavango River Basin
74
EFA Namibia Socio-economics
The Okavango River Basin Transboundary Diagnostic Analysis
Technical Reports
In 1994, the three riparian countries of the
a base of available scientific evidence to guide
Okavango River Basin Angola, Botswana and
future decision making. The study, created
Namibia agreed to plan for collaborative
from inputs from multi-disciplinary teams in
management of the natural resources of the
each country, with specialists in hydrology,
Okavango, forming the Permanent Okavango
hydraulics, channel form, water quality,
River Basin Water Commission (OKACOM). In
vegetation, aquatic invertebrates, fish, birds,
2003, with funding from the Global
river-dependent terrestrial wildlife, resource
Environment Facility, OKACOM launched the
economics and socio-cultural issues, was
Environmental Protection and Sustainable
coordinated and managed by a group of
Management of the Okavango River Basin
specialists from the southern African region in
(EPSMO) Project to coordinate development
2008 and 2009.
and to anticipate and address threats to the
river and the associated communities and
The following specialist technical reports were
environment. Implemented by the United
produced as part of this process and form
Nations Development Program and executed
substantive background content for the
by the United Nations Food and Agriculture
Okavango River Basin Transboundary
Organization, the project produced the
Diagnostic Analysis
Transboundary Diagnostic Analysis to establish
Final Study
Reports integrating findings from all country and background reports, and covering the entire
Reports
basin.
Aylward, B.
Economic Valuation of Basin Resources: Final Report to
EPSMO Project of the UN Food & Agriculture Organization as
an Input to the Okavango River Basin Transboundary
Diagnostic Analysis
Barnes, J. et al.
Okavango River Basin Transboundary Diagnostic Analysis:
Socio-Economic Assessment Final Report
King, J.M. and Brown,
Okavango River Basin Environmental Flow Assessment Project
C.A.
Initiation Report (Report No: 01/2009)
King, J.M. and Brown,
Okavango River Basin Environmental Flow Assessment EFA
C.A.
Process Report (Report No: 02/2009)
King, J.M. and Brown,
Okavango River Basin Environmental Flow Assessment
C.A.
Guidelines for Data Collection, Analysis and Scenario Creation
(Report No: 03/2009)
Bethune,
S.
Mazvimavi,
Okavango River Basin Environmental Flow Assessment
D. and Quintino, M.
Delineation Report (Report No: 04/2009)
Beuster, H.
Okavango River Basin Environmental Flow Assessment
Hydrology Report: Data And Models(Report No: 05/2009)
Beuster,
H. Okavango River Basin Environmental Flow Assessment
Scenario Report : Hydrology (Report No: 06/2009)
Jones, M.J.
The Groundwater Hydrology of The Okavango Basin (FAO
Internal Report, April 2010)
King, J.M. and Brown,
Okavango River Basin Environmental Flow Assessment
C.A.
Scenario Report: Ecological and Social Predictions (Volume 1
of 4)(Report No. 07/2009)
King, J.M. and Brown,
Okavango River Basin Environmental Flow Assessment
C.A.
Scenario Report: Ecological and Social Predictions (Volume 2
of 4: Indicator results) (Report No. 07/2009)
King, J.M. and Brown,
Okavango River Basin Environmental Flow Assessment
C.A.
Scenario Report: Ecological and Social Predictions: Climate
Change Scenarios (Volume 3 of 4) (Report No. 07/2009)
King, J., Brown, C.A.,
Okavango River Basin Environmental Flow Assessment
Joubert, A.R. and
Scenario Report: Biophysical Predictions (Volume 4 of 4:
Barnes, J.
Climate Change Indicator Results) (Report No: 07/2009)
King, J., Brown, C.A.
Okavango River Basin Environmental Flow Assessment Project
and Barnes, J.
Final Report (Report No: 08/2009)
Malzbender, D.
Environmental Protection And Sustainable Management Of The
Okavango River Basin (EPSMO): Governance Review
Vanderpost, C. and
Database and GIS design for an expanded Okavango Basin
Dhliwayo, M.
Information System (OBIS)
Veríssimo, Luis
GIS Database for the Environment Protection and Sustainable
Management of the Okavango River Basin Project
75
EFA Namibia Socio-economics
Wolski,
P.
Assessment of hydrological effects of climate change in the
Okavango Basin
Country Reports
Angola
Andrade e Sousa,
Análise Diagnóstica Transfronteiriça da Bacia do Rio
Biophysical Series
Helder André de
Okavango: Módulo do Caudal Ambiental: Relatório do
Especialista: País: Angola: Disciplina: Sedimentologia &
Geomorfologia
Gomes, Amândio
Análise Diagnóstica Transfronteiriça da Bacia do Rio
Okavango: Módulo do Caudal Ambiental: Relatório do
Especialista: País: Angola: Disciplina: Vegetaçăo
Gomes,
Amândio
Análise Técnica, Biofísica e Socio-Económica do Lado
Angolano da Bacia Hidrográfica do Rio Cubango: Relatório
Final:Vegetaçăo da Parte Angolana da Bacia Hidrográfica Do
Rio Cubango
Livramento, Filomena
Análise Diagnóstica Transfronteiriça da Bacia do Rio
Okavango: Módulo do Caudal Ambiental: Relatório do
Especialista: País: Angola: Disciplina:Macroinvertebrados
Miguel, Gabriel Luís
Análise Técnica, Biofísica E Sócio-Económica do Lado
Angolano da Bacia Hidrográfica do Rio Cubango:
Subsídio Para o Conhecimento Hidrogeológico
Relatório de Hidrogeologia
Morais, Miguel
Análise Diagnóstica Transfronteiriça da Bacia do Análise Rio
Cubango (Okavango): Módulo da Avaliaçăo do Caudal
Ambiental: Relatório do Especialista País: Angola Disciplina:
Ictiofauna
Morais,
Miguel
Análise Técnica, Biófisica e Sócio-Económica do Lado
Angolano da Bacia Hidrográfica do Rio Cubango: Relatório
Final: Peixes e Pesca Fluvial da Bacia do Okavango em Angola
Pereira, Maria Joăo
Qualidade da Água, no Lado Angolano da Bacia Hidrográfica
do Rio Cubango
Santos,
Carmen
Ivelize
Análise Diagnóstica Transfronteiriça da Bacia do Rio
Van-Dúnem S. N.
Okavango: Módulo do Caudal Ambiental: Relatório de
Especialidade: Angola: Vida Selvagem
Santos, Carmen Ivelize
Análise Diagnóstica Transfronteiriça da Bacia do Rio
Van-Dúnem S.N.
Okavango:Módulo Avaliaçăo do Caudal Ambiental: Relatório de
Especialidade: Angola: Aves
Botswana Bonyongo, M.C.
Okavango River Basin Technical Diagnostic Analysis:
Environmental Flow Module: Specialist Report: Country:
Botswana: Discipline: Wildlife
Hancock, P.
Okavango River Basin Technical Diagnostic Analysis:
Environmental Flow Module : Specialist Report: Country:
Botswana: Discipline: Birds
Mosepele,
K. Okavango River Basin Technical Diagnostic Analysis:
Environmental Flow Module: Specialist Report: Country:
Botswana: Discipline: Fish
Mosepele, B. and
Okavango River Basin Technical Diagnostic Analysis:
Dallas, Helen
Environmental Flow Module: Specialist Report: Country:
Botswana: Discipline: Aquatic Macro Invertebrates
Namibia
Collin Christian &
Okavango River Basin: Transboundary Diagnostic Analysis
Associates CC
Project: Environmental Flow Assessment Module:
Geomorphology
Curtis, B.A.
Okavango River Basin Technical Diagnostic Analysis:
Environmental Flow Module: Specialist Report Country:
Namibia Discipline: Vegetation
Bethune, S.
Environmental Protection and Sustainable Management of the
Okavango River Basin (EPSMO): Transboundary Diagnostic
Analysis: Basin Ecosystems Report
Nakanwe, S.N.
Okavango River Basin Technical Diagnostic Analysis:
Environmental Flow Module: Specialist Report: Country:
Namibia: Discipline: Aquatic Macro Invertebrates
Paxton,
M. Okavango River Basin Transboundary Diagnostic Analysis:
Environmental Flow Module: Specialist
Report:Country:Namibia: Discipline: Birds (Avifauna)
Roberts, K.
Okavango River Basin Technical Diagnostic Analysis:
Environmental Flow Module: Specialist Report: Country:
Namibia: Discipline: Wildlife
Waal,
B.V. Okavango River Basin Technical Diagnostic Analysis:
Environmental Flow Module: Specialist Report: Country:
Namibia:Discipline: Fish Life
Country Reports
Angola
Gomes, Joaquim
Análise Técnica dos Aspectos Relacionados com o Potencial
Socioeconomic
Duarte
de Irrigaçăo no Lado Angolano da Bacia Hidrográfica do Rio
Series
Cubango: Relatório Final
Mendelsohn,
.J.
Land use in Kavango: Past, Present and Future
76
EFA Namibia Socio-economics
Pereira, Maria Joăo
Análise Diagnóstica Transfronteiriça da Bacia do Rio
Okavango: Módulo do Caudal Ambiental: Relatório do
Especialista: País: Angola: Disciplina: Qualidade da Água
Saraiva, Rute et al.
Diagnóstico Transfronteiriço Bacia do Okavango: Análise
Socioeconómica Angola
Botswana Chimbari, M. and
Okavango River Basin Trans-Boundary Diagnostic Assessment
Magole, Lapologang
(TDA): Botswana Component: Partial Report: Key Public Health
Issues in the Okavango Basin, Botswana
Magole,
Lapologang
Transboundary Diagnostic Analysis of the Botswana Portion of
the Okavango River Basin: Land Use Planning
Magole, Lapologang
Transboundary Diagnostic Analysis (TDA) of the Botswana p
Portion of the Okavango River Basin: Stakeholder Involvement
in the ODMP and its Relevance to the TDA Process
Masamba,
W.R.
Transboundary Diagnostic Analysis of the Botswana Portion of
the Okavango River Basin: Output 4: Water Supply and
Sanitation
Masamba,W.R.
Transboundary Diagnostic Analysis of the Botswana Portion of
the Okavango River Basin: Irrigation Development
Mbaiwa.J.E. Transboundary Diagnostic Analysis of the Okavango River
Basin: the Status of Tourism Development in the Okavango
Delta: Botswana
Mbaiwa.J.E. &
Assessing the Impact of Climate Change on Tourism Activities
Mmopelwa, G.
and their Economic Benefits in the Okavango Delta
Mmopelwa,
G.
Okavango River Basin Trans-boundary Diagnostic Assessment:
Botswana Component: Output 5: Socio-Economic Profile
Ngwenya, B.N.
Final Report: A Socio-Economic Profile of River Resources and
HIV and AIDS in the Okavango Basin: Botswana
Vanderpost,
C.
Assessment of Existing Social Services and Projected Growth
in the Context of the Transboundary Diagnostic Analysis of the
Botswana Portion of the Okavango River Basin
Namibia
Barnes, J and
Okavango River Basin Technical Diagnostic Analysis:
Wamunyima, D
Environmental Flow Module: Specialist Report:
Country: Namibia: Discipline: Socio-economics
Collin Christian &
Technical Report on Hydro-electric Power Development in the
Associates CC
Namibian Section of the Okavango River Basin
Liebenberg, J.P.
Technical Report on Irrigation Development in the Namibia
Section of the Okavango River Basin
Ortmann, Cynthia L.
Okavango River Basin Technical Diagnostic Analysis:
Environmental Flow Module : Specialist Report Country:
Namibia: discipline: Water Quality
Nashipili,
Okavango River Basin Technical Diagnostic Analysis: Specialist
Ndinomwaameni
Report: Country: Namibia: Discipline: Water Supply and
Sanitation
Paxton,
C.
Transboundary Diagnostic Analysis: Specialist Report:
Discipline: Water Quality Requirements For Human Health in
the Okavango River Basin: Country: Namibia
77


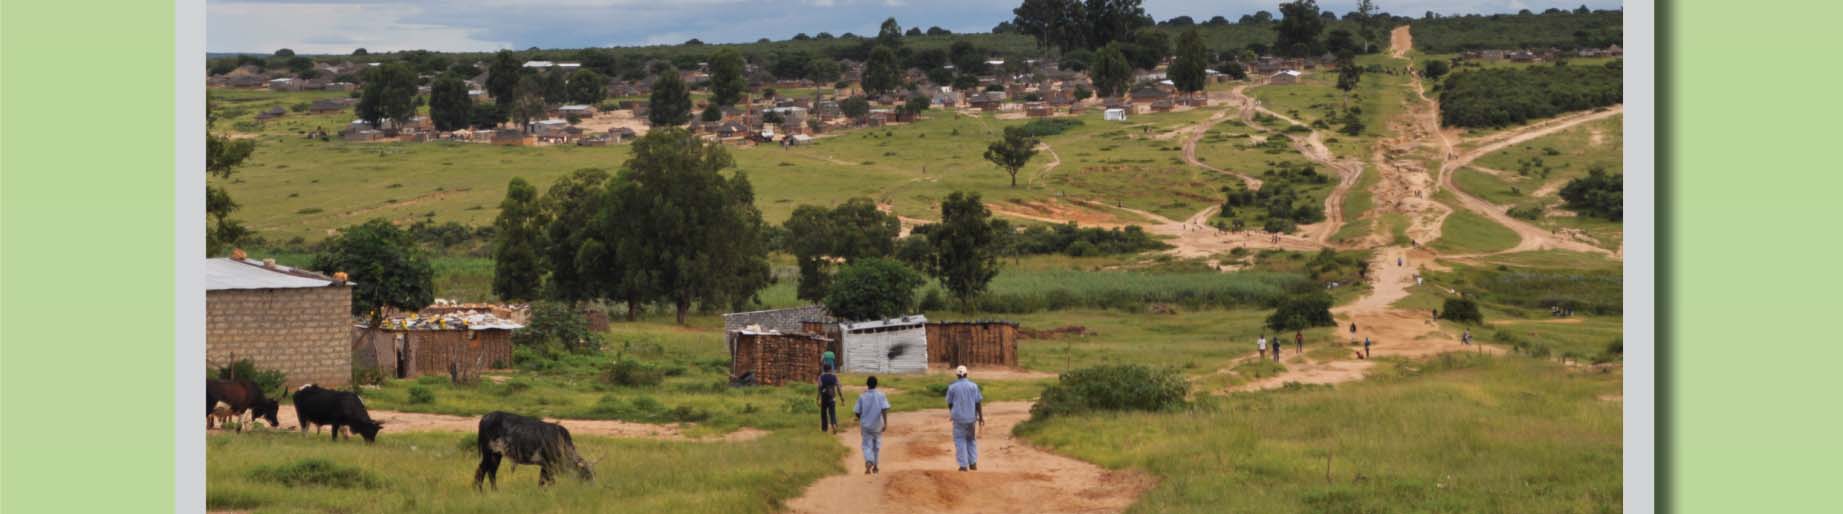

EFA Namibia Socio-economics
78