TDA RIVER BASIN SOCIO-ECONOMIC ASSESSMENT.
Economic Valuation of Basin Resources:
Final Report to EPSMO Project of the UN
Food & Agriculture Organization as an
Input to the Okavango River Basin
Transboundary Diagnostic Analysis:
Final Draft
Bruce Aylward
October 2009
1
TDA River Basin Economic Valuation
Economic Valuation of Basin Resources
Final Report to EPSMO project of the UN Food & Agriculture
Organization as an input to the Okavango River Basin
Transboundary Diagnostic Analysis
Final Draft October 2009
Bruce Aylward
PO Box 2602, Bend, OR 97709, USA
bruce@ecosystemx.com
(541) 480-5694
2
TDA River Basin Economic Valuation
CONTENTS
1.
Introduction ................................................................................................................... 6
2. Macroeconomic Status ..................................................................................................... 7
2.1 Country Status and Trends .............................................................................................. 7
2.2 Sectoral Baseline: Angola ................................................................................................ 9
2.3 Sectoral Baseline: Namibia .............................................................................................. 9
2.4 Sectoral Baseline: Botswana.......................................................................................... 10
2.5 Basin Macroeconomic Issues and Opportunities .......................................................... 11
3. Transboundary Analysis, Market Failure and Basin Water Allocation ............................ 13
4.
Quantitative Evaluation Framework: Costs, Benefits and Water Resource Withdrawal
Alternatives ......................................................................................................................... 15
4.1 Valuation of Basin Resources ........................................................................................ 15
4.2 Formulation of the Alternatives Analysis ...................................................................... 16
4.2.1 Countries .................................................................................................................... 16
4.2.2 Alternatives ................................................................................................................ 16
4.2.3 Sectors ........................................................................................................................ 17
4.3 Economic Issues in Deriving Changes in Values ............................................................ 21
4.3.1 Gross Value vs Net Value Added ................................................................................ 21
4.3.2 Value Added and Alternatives Analysis ...................................................................... 22
4.3.3 Direct vs. Indirect Economic Impacts ......................................................................... 22
4.3.4 Financial vs. Economic Values .................................................................................... 24
4.4 Data Collection .............................................................................................................. 25
4.4.1 Ecosystem Values ....................................................................................................... 26
4.4.2 Water Resource Projects ............................................................................................ 26
5. Quantitative Evaluation ................................................................................................... 28
5.1 Model Development: General Parameters and Assumptions ....................................... 28
5.2 Domestic Water Supply: Ecosystem Direct Use Values and Water Supply & Sanitation
Values .................................................................................................................................. 29
5.3 Hydropower ................................................................................................................... 44
5.4 Irrigation ........................................................................................................................ 45
5.5 Summary of Economic Results ...................................................................................... 50
5.5.1 The Tradeoff Analysis ................................................................................................ 50
5.5.2 Angola ......................................................................................................................... 52
5.5.3 Namibia ...................................................................................................................... 54
5.5.4 Botswana .................................................................................................................... 56
3
TDA River Basin Economic Valuation
5.5.5 A Basin Perspective .................................................................................................... 58
5.5.6 Comparing sustainable development, stagnation and high water withdrawal paths 61
6. Investment in the Presence of Uncertainty, Irreversibility and Choice of Timing .......... 66
6.1 Analytical Framework .................................................................................................... 66
6.2 The Theory and Argument: The Incompleteness of CBA in the Presence of Uncertainty,
Irreversibility and Choice of Timing ..................................................................................... 67
6.3 Application to Water Resource Development ............................................................... 68
Transboundary Diagnostic Analysis of the Botswana Portion of the Okavango River Basin:
Land Use Planning ............................................................................................................... 73
Table of Figures
FIGURE 5 1 ............................................................................................................................................. 53
FIGURE 5 2 ............................................................................................................................................. 55
FIGURE 5 3 ............................................................................................................................................. 57
FIGURE 5 4 ............................................................................................................................................. 59
Table of Tables
TABLE 1: SUMMARY OF MACROECONOMIC INDICATORS ....................................................................... 8
TABLE 2: ANGOLA, GDP BREAKDOWN BY SECTOR, 2006 ......................................................................... 9
TABLE 3: NAMIBIA, GDP BREAKDOWN BY SECTOR, 2007 ...................................................................... 10
TABLE 4: BOTSWANA, GDP BREAKDOWN BY SECTOR, 2007 .................................................................. 11
TABLE 5: ALTERNATIVES MATRIX ........................................................................................................... 19
TABLE 6: SUMMARY OF WATER USE AND AVAILABILITY ....................................................................... 20
TABLE 7: ACCESS TO IMPROVED WATER SUPPLY AND SANITATION, OKAVANGO RIPARIAN COUNTRIES
...................................................................................................................................................... 29
TABLE 8: HOUSEHOLD ACCESS TO WATER SOURCES, NGAMILAND, BOTSWANA, 1991 AND 2001 ...... 31
TABLE 9: PER CAPITA REQUIREMENTS FOR WATER SERVICE LEVEL TO PROMOTE HEALTH .................. 32
TABLE 10: PRESENT DAY WATER USE, BOTSWANA ................................................................................ 32
TABLE 11: ESTIMATED WATER USE BY SOURCE, NAMIBIA ..................................................................... 33
TABLE 12: POPULATION SERVED AND DOMESTIC WATER USE, BOTSWANA ......................................... 37
TABLE 13: POPULATION SERVED AND DOMESTIC WATER USE, NAMIBIA ............................................. 38
TABLE 14: ESTIMATED WATER USE BY SOURCE, ANGOLA ..................................................................... 39
TABLE 15: ECOSYSTEM DIRECT USE VALUES, CHANGES DUE TO SHIFT IN WATER SUPPLY SOURCES,
BOTSWANA ................................................................................................................................... 40
TABLE 16: ECOSYSTEM DIRECT USE VALUES, CHANGES DUE TO SHIFT IN WATER SUPPLY SOURCES,
NAMIBIA ........................................................................................................................................ 42
TABLE 17: ECOSYSTEM DIRECT USE VALUES, CHANGES DUE TO SHIFT IN WATER SUPPLY SOURCES,
ANGOLA ........................................................................................................................................ 42
TABLE 18: COST AND BENEFIT PARAMETER VALUES FOR DOMESTIC WATER SUPPLY .......................... 44
TABLE 19: HYDROPOWER PROJECTS ...................................................................................................... 45
TABLE 20: HYDROPOWER COST AND BENEFIT PARAMETERS ................................................................ 45
TABLE 21: IRRIGATION PROJECTS, AREA ................................................................................................ 46
TABLE 22: IRRIGATION PROJECTS, WATER WITHDRAWALS ................................................................... 47
TABLE 23: IRRIGATION PROJECT COST AND BENEFIT PARAMETERS ...................................................... 49
TABLE 24: COMPARISON OF PER CAPITA INDICATORS FOR DIFFERENT BASIN DEVELOPMENT
ALTERNATIVES .............................................................................................................................. 64
TABLE 25: PERCENTAGE OF THE POPULATION SERVED UNDER DIFFERENT BASIN DEVELOPMENT
ALTERNATIVES .............................................................................................................................. 65
4
TDA River Basin Economic Valuation
ACRONYMS
EPSMO
Environmental Protection and Sustainable Management
of the Okavango
FAO
UN Food and Agriculture Organization
BRD
International Bank for Reconstruction and Development
IDA
International Development Association
IFA
Integrated Flow Assessment
GDP
Gross Domestic Product
GEF
Global Environmental Facility
HEP
Hydroelectric power or hydropower
M&I
Municipal and Industrial
O&M
Operations and maintenance
TDA
Transboundary Diagnostic Analysis
UN
United Nations
UNDP
United Nations Development Programme
WTP
Willingness to pay
WHO
World Health Organization
NOTES
All $ (dollar) figures refer to US $. References to other national currency are
made explicit as follows:
N$ = Namibian dollar
Pula = Botswana Pula
Kwanza = Angolan Kwanza
ZAR = South African Rand
5
TDA River Basin Economic Valuation
1. Introduction
This report serves as a portion of the work carried out under the auspices of the
EPSMO project, which is a Global Environment Facility grant under the GEF's
International Waters Program. A Transboundary Diagnostic Analysis (TDA) for the
Okavango River Basin along with the preparation of a Strategic Action Program
forms the basis of the work under EPSMO. The UN Food and Agriculture
Organization is the executing agency under arrangement with the United Nation
Development Program. This report serves as an input to the TDA.
The terms of reference for the consultancy entitled "Value of Basin Resources" calls
for the following outputs:
an economic valuation of the basin resources (including ecosystem services) under
current
· development and use patterns;
· total for the basin
· disaggregated by sector and
· disaggregated by country
1. valuation of direct and indirect contribution of basin resources
(including ecosystem services) to the national economies in all three
countries
2. analysis of macro-economic benefits of three specified water
resources development scenarios and corresponding costs of
possible losses in ecosystem services
3. a sectoral analysis (i.e. tourism, agriculture, forestry, ecosystem
services etc) focusing on feasible development pathways
corresponding to the specified water resources development
scenarios.
During the course of the work the unfolding scope of the companion Integrated
Flow Analysis (IFA), in particular the socio-economic component, as well as the
specific demands of the TDA itself helped to shape the ultimate interpretation of
the terms of reference and the research tasks. The end result of this work is
incorporated in the TDA document, however, a full write up of the approach, data
and results is provided here as a reference for those so interested.
The document begins with a brief review of the macroeconomic context in order to
provide the setting within which the resources of the Okavango River will be
managed. A brief section then outlines the economic issues confronted by the
TDA, principally being the existence of market failure at the regional with regard to
water allocation between countries and the resulting uncertainty of water
management in the Basin. The quantitative analysis of potential economic
consequences of future alternatives for the management of water in the basin is
then explored, with sections on the analytical framework and then the data and
assumptions employed and results. Given issues of uncertainty, the timing of future
investment decisions, as well as the reversibility of the alternatives considered, the
report concludes by briefly suggesting the basis for a qualitative analysis that might
be employed to better frame investment decisions in the basin regarding water
infrastructure in the future.
6
TDA River Basin Economic Valuation
2. Macro-economic Status
2.1 Country Status and Trends
Angola has the largest economy of the three basin countries, in large part due to its
much larger population (eight times as large as Namibia or Botswana, as shown in
the table below). The Angolan economy is also growing at a much faster rate,
currently almost 20%, then the other two economies which are growing at about
5% per year. In large part this reflects the rapid economic gains Angola is making
after two decades of internal strife. The recent run up in the price of oil has also
been fortuitous as Angola is now the leading oil exporting country in Africa.
Meanwhile Namibia and Botswana, while growing more slowly, have had decades
of steady but significant growth. Botswana's gross domestic product (GDP) per
capita at 5,739 is by far the largest of the three countries.
Botswana also has the largest level of government expenditure at 35% of GDP,
reflecting the government's efforts to provide basic services to its rural populations.
In part this factor, plus the higher level of GDP may explain the lower level of
household consumption at 24% in Botswana. With similar GDP per capita levels,
household consumption in Namibia is much higher than that in Angola, with figures
at 53% and 32%. This most likely reflects much lower living standards of the bulk
of population in Angola. In other words, Angola's GDP has grown rapidly but is not
as well distributed as that in Namibia which has had a longer period to develop
post-independence. As expected gross capital formation is higher in Angola,
reflecting its early stage in development and the capital intensive nature of the oil
industry.
The latest UNDP figures on gini coefficients suggest that income inequality
remains more exaggerated in Namibia (74) than Botswana (60). No inequality
measure was available for Angola, however, it is likely to exceed that of both of the
other countries. Exploitation of the countries oil reserves, the rapid rise in the price
of oil and the resulting windfall profits are likely exacerbating the gap between the
urban elites, the urban poor and rural populations. Unemployment and
underemployment in Angola are major issues for the country as it demobilizes
forces and works to create economic opportunities. No unemployment numbers
are reported by UN agencies for Angola. Unemployment in Botswana is relatively
low for the region at 17.5%, while in Namibia the rate is fully double this at 33.8%.
Finally, all three countries have strong export-led economies, reflected in positive
or near-positive trade balances, as well as current account balances. In terms of
liquidity, at the end of 2007 Angola had $19 billion in liquid reserves (not counting
gold). Botswana had half this amount, but Namibia had just $1.2 million. The World
Bank classifies Namibia and Botswana as upper-middle-income countries. Neither
Namibia nor Botswana are currently IDA eligible for grants from the World Bank
Group, but could qualify for IBRD loans. Namibia has developed an Interim
Strategy Notes with the Bank and may engage in borrowing in the future.
Botswana recently completed a Country Partnership Strategy with the Bank, which
looks to reengage in lending with Botswana in the near future.
Angola is classified as a lower-middle-income country by the Bank and is IDA-
eligible. The Bank and other donors have been supporting Angola's transition since
the war ended and with recent rapid growth the European Union, the African
Development Bank and the Bank are all updating their country strategies to focus
on governance, particularly development of an effective private sector, as well as
7
TDA River Basin Economic Valuation
continuing the attempt to provide social services and assist in providing economic
opportunities for the poor. The World Bank reports that Angola received $442 in
international assistance in 2006 and that the country had programmed investments
of up to $7 billion in new infrastructure between 2008 -2010.
Table 1: Summary of Macroeconomic Indicators
Indicator
Angola
Namibia
Botswana Source
Population 2007 (millions)
17.02
2.07
1.88 UNPD
Unemployment rate 2006/7
20%
33.8%
17.5% Various
Gini Coefficient 2007/8
n/a
74.3
60.5 UNDP
HDR
Gross Domestic Product 2007
GDP (NC millions)
4,006,900
52,208
66,287 UNSD
GDP (US$ millions)
52,237
7,410
10,798 UNSD
GDP per capita (US$)
3,068
3,573
5,739 UNSD
GDP growth (average, 5 yrs)
14.96
4.68
5.92 UNSD
GDP growth (average 10 yrs)
9.87
4.27
5.91 UNSD
Composition of GDP (as % of GDP)
Household Consumption
32%
53%
24% UNSD
Gross Capital Formation
12%
26%
18% UNSD
Government Expenditure
22%
24%
35% UNSD
Exports
71%
49%
58% UNSD
Prices
CPI - 2007 (%)
12.25
6.73
7.08 IMF IFS
GDP Deflator (average, 2002-07))
20%
14%
20% UNSD
Exchange Rates
NC/$ -2007 average (NC/$)
76.71
7.05
6.14 IMF IFS
2008 end of period (NC/$)
75.17
9.31
7.52 IMF IFS
Balance of Payments 2007 (US$
millions)
Goods Imports
(13,662)
(3,102)
(3,447) IMF IFS
Goods Export
44,396
2,922
5,158 IMF IFS
Trade Balance
30,734
(180)
1,711 IMF IFS
Goods& Service Balance
18,402
(95)
1,675 IMF IFS
Current Account Balance
9,402
693
2,434 IMF IFS
International Liquidity (US$ millions)
Reserves 2007 (less Gold)
18,359
1,293
9,118 IMF IFS
Sources: UNPD = United Nations Population Division, UNDP HDR = United Nations Development
Program, Human Development Report, UNSD= Statistical Division of the United Nations, IMF IFS =
International Monetary Fund, International Financial Statistics
8
TDA River Basin Economic Valuation
2.2 Sectoral Baseline: Angola
As alluded to earlier, the dominant feature of Angola's economy is the extractive
sector, particularly oil and gas, which accounts for over half of GDP. The resources
sectors agriculture, hunting, forestry and fishery are together the third most
prominent sector making up 7.8% of GDP or US$ 3.8 billion in 2006. Despite their
relatively small participation in GDP, the resource sector employs a large share of
the workers in the country, by some estimates up to 85%. Further, a large
percentage of this activity is of a subsistence nature. Just 10% of agricultural land
is being used on a commercial basis. Despite this high level of activity in the
agricultural sector the country recently became a net importer of foodstuffs.
Table 2: Angola, GDP Breakdown by Sector, 2006
Economic Activity
Share of
GDP Value
GDP Employment
(in
change
GDP (%)
US$ million)
(%)
rate (%)
Oil and gas
57.1
28,350
n/a
n/a
Services
14.0
6,951
13.3
10.0
Agriculture, hunting, forestry and
7.8
3,873
18.3
60 to 85%
fishery
Manufacturing
4.9
2,433
17.1
n/a
Construction and public works
4.4
2,185
17.0
0.3
Mining and utilities
2.4
1,192
3.9
n/a
Source: UNSD, World Bank and African Development Bank, in Boccalon (2008)
2.3 Sectoral Baseline: Namibia
Namibia probably has the most diversified economy of the three countries. Trade,
transport, manufacturing and mining all contribute around 10% of GDP. Agriculture
and forestry contribute 6.6% or US$ 491 million. Farming itself is fairly limited due
to climate and soils, but large areas are in communal conservancies or private
lands are devoted to livestock and game ranching/wildlife. Tourism is also a
significant factor in the economy earning 2% or US$ 139 million. A portion of this
tourism comes from the Okavango region, though probably the bulk of it is
associated with Etosha, the coast and the dunes. Water and electricity contribute
an additional $99 million, or on average $50 per capita.
9
TDA River Basin Economic Valuation
Table 3: Namibia, GDP Breakdown by Sector, 2007
Economic Activity
Share of
GDP Value
GDP
Employment rate
(in
change
(%)
GDP (%)
US$ million)
(%)
General Government
20.65
1,530
(0.5)
56 (services
overall)
Trade
12.18
903
6.0
Transport
11.70
867
7.5
Manufacturing
11.20
830
13.0
12 (industry
overall)
Mining and quarrying
10.46
775
0.2
a. Diamond mining
8.26
612
(0.8)
b. Other mining
2.19
162
4.1
Agriculture and forestry
6.62
491
3.2
31
a. Commercial
4.32
320
6.5
b. Subsistence
2.30
170
(2.4)
Construction
5.44
403
32.7
Banks, Insurance and
4.36
323
2.4
Business
Services
Fishing
2.80
207
(16.2)
Hotels and Restaurants
1.88
139
3.8
Water and Electricity
1.33
99
(18.2)
Social and Personal
0.94
70
2.6
Services
Source: Central Bureau of Statistics (Namibia), in Boccalon (2008)
2.4 Sectoral Baseline: Botswana
Botswana, like Angola, is heavily reliant on extractive industries for its economic
well-being. Diamond mining brings in 40% of GDP. Manufacturing is limited at just
3.7% of GDP. Given the climate agriculture is limited, making only a 1.6%
contribution to GDP, the lowest of the three countries. As a consequence, services
government, banking, trade, transport, tourism, utilities and social services
make up a large portion of the remainder of the economy. Tourism plays a modest
role in the country's economy providing almost US$ 200 million, a large share of
which comes from the Okavango (as discussed later in this report). Water and
electricity are also responsible for US$ 200 million in value added. The higher level
of development in the country compared to its neighbors is revealed by the higher
level of spending on these basic services at $100/per capita.
10
TDA River Basin Economic Valuation
Table 4: Botswana, GDP Breakdown by Sector, 2007
Economic Activity
Share of GDP Value (in
GDP change Employment
GDP
(%)
(%)
US$ millions)
rate (%)
Mining
40.7
3,775
5.2
2.63
General Government
15.6
1,447
1.7
19.18
Banks, Insurance and
10.3
955
6.6
1.56
Business
Services
Trade
8.3
770
15.5
14.36
Construction
4.5
417
8.7
5.12
Social and Personal
3.8
352
1.6
4.56
Services
Manufacturing
3.7
343
12.0
6.67
Transport
3.5
325
20.3
2.98
Water and Electricity
2.2
204
5.9
0.77
Hotels and Restaurants
2.1
195
19.7
2.72
Agriculture
1.6
148
2.9
28.35
Source: Central Statistics Office (Botswana), in Boccalon (2008)
2.5 Basin Macroeconomic Issues and Opportunities
The brief macroeconomic review provided above shows that each of the three
countries in the basin have strong, open economies that have benefited from
sound macro-economic management and the intelligent use of their natural
endowments. That said the Okavango Basin region clearly is on the periphery of
the economy for each of the countries. Probably the most significant economic
activity in the basin is that of the tourism in Botswana's Delta region (and in the
panhandle in Namibia). Even in this case the contribution to GDP is small in
relative terms. Still, given the low populations in the basin there is no need for the
basin to be a dominant economic force in each country's economy. In fact, it may
be useful going forward to consider what the areas in each country within the basin
have in common and to try and build off these regional strengths in further
developing the basin economy.
With this in mind a number of macroeconomic issues and opportunities were
identified in the process of preparing the TDA. These relate more to the macro-
economy of the basin, linked as it is by the water resource, rather than the
macroeconomy of each country.
Regional Integration. There is a need to consider how to achieve closer social and
economic integration between the basin areas in each of the three countries. Such
integration would assist in building forwards and backwards economic linkages in
the basin. One idea that surfaced was to consider whether there are artificial trade
barriers, particularly in the panhandle area where all three countries come
together. Finding ways such as through including Angola, or the basin in the
existing Customs Union to promote the movement of tourists, workers, families,
as well as goods and capital within the border area or the basin as a whole might
yield considerable economic efficiencies and create new opportunities.
11
TDA River Basin Economic Valuation
Basin Comparative Advantage. While natural endowments of water, land, carbon,
flora and fauna, ecosystem goods and services in the basin appear advantageous
it is largely only in the Delta that commercial use of the resources occurs. The
majority of basin inhabitants live are engaged in subsistence activities. While it is
fortunate that resources are plentiful enough to supply this subsistence there are
two routes for the basin to develop. The first is for each country's province in the
basin to remain on the periphery and rely on resources from the center to provide
basic services while waiting for economic opportunities to arise. The second is for
the basin to determine what is its comparative advantage and market this
advantage to bring in the revenues needed to bring sustained livelihoods and
economic development to the basin. Central to this conversation over comparative
advantage will be the discussion over how to deploy the water resource to further
rather than retard development. At present if the basin has a comparative
advantage it is its reliance on wildlife tourism and its relatively undeveloped state.
Its comparative disadvantage remains its geographic isolation and hence the
distance to central markets and populations in each country.
Further effort is required to evaluate these issues and then strategize and plan in
what direction to move the basin macro-economy. Using the water resource as the
driver for this effort is sensible given its importance to livelihoods and income under
present conditions, as well as its role in linking communities in each of the three
countries. In the next section a brief description of the overarching economics
driving water allocation and use in the basin is provided and its relevance to the
transboundary analysis.
12
TDA River Basin Economic Valuation
3. Transboundary Analysis, Market Failure and Basin Water
Allocation
From an economic perspective the need for a transboundary analysis presupposes
the existence of some critical market failure between countries. For example if all
goods and services in the Okavango Basin, including those in the three countries
of Angola, Namibia and Botswana were private goods, traded in markets and not
subject to any unusual degree of government regulation then a transboundary
analysis would not be necessary. The economy of each country could be
segregated into tradable and non-tradable sectors (or goods and services).
Economic exchange across borders (i.e. trade) would take place between willing
sellers and willing buyers at prices established on the international market. The
private sector would invest in economic activities with attractive risk and rate of
return profiles, taking into account the local market for non-tradables and the
international market for tradables. These choices would be determined by a
number of factors, including the natural resource endowment at hand in each
country.
In the Okavango Basin, it is precisely the natural resource endowment that raises
the need for a transboundary analysis. Each country has its own endowment of
natural resources. Many of these resources are fixed and unchanging pending their
transformation by humans, for example soil, minerals and trees. Some resources
are mobile or migratory like wildlife, birds, fish or water. Each of these has it's own
natural range. In the case of the Okavango Basin, the primary migratory resource
is surface water. It starts in the headwaters of the Basin in Angola, travels
downstream through a large portion of Angola, briefly transits Namibia and then
spreads out across the Okavango Delta in Botswana, where it is stored as
groundwater, evaporated from surface water bodies, or evapotranspired by plants,
animals and human activities.
Over the course of geologic and human history the water resources of the
Okavango Basin have been informally shared between the countries, based on the
one hand on climate, geomorphology and vegetation, and on the other hand, the
limited efforts to date by humans to use and develop the resource. From the
perspective of its water resources the Okavango River is generally regarded as in
about as pristine a condition as any found in Africa today (Milzow et al. 2009). In an
arid environment increasing development pressure from the upstream riparian
states, as well as new uses in Botswana is inevitable. In economic terms this
shared water resource is a perfect example of a common pool resource. No one
country can exclude the other from using the resource and the use of the resource
by any one of the countries effectively to limit its consumption by another. The non-
excludability of common pool resources is the source of market failure. In effect at
present the Okavango River is largely used by Botswana, the downstream country
to provide a variety of ecosystem goods and services that have local and
international value. To the extent that the River really is congestible and therefore
rival in consumption i.e. that the use of water by an upstream riparian country will
affect the downstream uses and values then exercise of upstream location in the
form of extraction of water or re-regulation of flow is an act with economic
consequences, creating opportunity costs for Botswana, and those people outside
of Botswana that visit the delta or care about its continued existence (in its present
state).
The lack of an explicit and enforceable regime for managing the sharing of the
waters of the Okavango River is a source of market failure and may impede its
13
TDA River Basin Economic Valuation
efficient allocation and the equitable sharing of its benefits. While resolving this
dilemma is beyond the scope of the present work or the TDA, it is expected that
clearly defining the present and potential allocations of the water resource and then
estimating the associated values and their distribution across sectors and countries
should serve to stimulate further discussion between the countries.
For example, one possibility for the future governance of the Okavango would be
to make an explicit allocation of the water between states. In this case an
understanding of the economic consequences of water resource development,
would provide information to the states and the larger community of states about
the values inherent in the allocation of shares. The tradeoffs between different
uses of these allocations would thus be clear and open up a basis for negotiations
between states and with the international community over how to share the
benefits and costs of any master plan for the Okavango.
In order to shed light on the nature and extent of the choices that basin countries
are presented a quantitative analysis of the potential costs and benefits of
alternative future courses of action is presented below.
14
TDA River Basin Economic Valuation
4. Quantitative Evaluation Framework: Costs, Benefits and
Water Resource Withdrawal Alternatives
In its present allocation the Okavango River sustains the Okavango Delta in
Botswana, an important environmental and economic asset for the country and the
global community. The river and its derivative groundwater have also been
"developed" by humans for a number of uses in each of the three countries.
However, these uses remain minimal to date. Previous authors have noted that
withdrawing more of the flow of the River for off-stream uses will at some point
imply some loss of downstream economic benefits that exist today. This is
expected to occur as changes to the flow regime downstream lead to a loss of the
ecosystem goods and services provided by the river and its derivative groundwater
in the Okavango Delta. These foregone net ecosystem benefits would be the
opportunity cost of taking action to deploy the water resource to off-stream uses. In
a similar vein, any decision not to develop the water resource potential in the
upstream countries implies giving up the net economic benefits of hydropower,
irrigation, and municipal and industrial (M&I) uses. These would be the opportunity
costs of not withdrawing additional amounts of the water resource. The main
components of any economic analysis of future states of the system are future
changes in net ecosystem benefits and water withdrawal benefits, each with its
component changes in costs and benefits. In this document alternative paths for
developing the water resource are examined and therefore the economic gains
from water withdrawals are contrasted with the losses in ecosystem goods and
services.
4.1 Valuation of Basin Resources
The ToR call for a valuation of basin resources under current development and use
patterns (ToR output #1). This valuation is to be disaggregated by sector and by
country (ToR output #1), and this is to include not only direct, but indirect (including
ecosystem services), contributions of basin resources to the national economies
(TOR output #2). This analysis is not sought in and of itself but rather to set the
stage to then analysis what changes in value occur as different water withdrawal
alternatives are imposed on current conditions (TORs outputs #3 and #4). The
analysis of alternatives is to include not only water resource development benefits
but any costs in terms of the loss of ecosystem services.
Ultimately, then the valuation of basin resources is required for the purpose of
evaluating the impacts of gains and losses in economic welfare associated with
decisions to develop or not develop the water resources of the Okavango River
(and its tributaries, distributaries and groundwater). For this reason the analysis of
basin resources is best circumscribed to include only those resources and sectors
that will be affected by changes in the timing and amount of the flow regime
either in terms of impacts from changes in flow and timing downstream or in terms
of the development benefits and impacts from the changes in development and
land use patterns that accompany the water resource developments themselves.
The ensuing sub-section attempts to specify how such an analysis will be
constructed, indicates what data will be needed to this effect, and reports on data
already identified and in hand.
15
TDA River Basin Economic Valuation
4.2 Formulation of the Alternatives Analysis
The analysis involves assessing the economic impacts on sectors in each country.
In order to construct the matrices for each alternative the countries, alternatives
and sectors are identified.
4.2.1 Countries
The three riparian states are Angola, Namibia and Botswana. Typically, the scale
of an economic analysis needs to be at the level that incorporates all relevant
welfare changes. An economic analysis of the Okavango that did not include the
upstream (Angola) or downstream (Namibia) states, for example, would be of little
use in decision-making. In the case of the Okavango River, the environmental
asset represented by the Okavango Delta has value that is not realized only within
the three states. Tourists travel from all around the world to experience and use the
resource. The economic impacts of that travel are experienced well beyond the
three countries. Further, as a Ramsar site and one of the world's few remaining
pristine wetland areas, as well as the larger reservoir of biodiversity, the Okavango
Delta has value to the international community that goes beyond mere travel and
tourism. As such a comprehensive economic analysis would need to incorporate a
fourth "country" or region, represented by these international stakeholders.
4.2.2 Alternatives
Three alternatives are analyzed in companion efforts by the TDA team. These
alternatives (called "scenarios" in the IFA analysis) each involve a mix of additional
hydropower, irrigation and M&I projects to those already in existence. The
alternatives are identified as future possible combinations of these projects that
yield low, medium and high water withdrawal levels. Each successive alternative
includes the projects from the prior alternative and adds in more projects. Thus the
high withdrawal alternative includes all the projects in the medium alternative
(which in turn includes all the projects in the low alternative). These alternatives are
thus not independent sets of projects. Rather the analysis of these alternatives
investigates the impacts of a progression of projects that could be developed.
A reference case alternative is necessary to represent the valuation of basin
resources under current development and use patterns, i.e. present day,
extrapolated forward for the full duration of the analysis. Analysis of each
successive alternative will lead to new valuations of basin resources. The
difference between these outcomes and that of the reference case represent the
net change in economic welfare (by sector and country) of each water withdrawal
alternative, including the impacts on biodiversity and ecosystem goods and
services. Positive results indicate that there is a net increase in economic welfare
of the withdrawal alternative. Negative results indicate a net decrease. The choice
of which alternative is preferable to a given stakeholder group should be informed
by these results, but will likely incorporate other decision criteria.
16
TDA River Basin Economic Valuation
4.2.3 Sectors
The variable that changes in each alternative is how the water of the Okavango
River and its tributaries are used. Changes in flow lead to changes in economic
welfare and, therefore, it is necessary to only examine those basin resources and
sectors that are likely to respond to new water resources projects and the
subsequent, downstream impacts of alterations in the timing and amounts of flows.
On the water resources side the changes will occur in hydropower production,
irrigated lands and production, and water supply for M&I. On the ecosystem side,
changes in flows are expected to alter the production of natural resources, tourism,
ecosystem services and nature conservation.
A brief characterization of each sector and discussion of issues that may need to
be addressed is provided below.
· Tourism. Tourism is best understood as a result of biodiversity and
ecosystem services. The surface water discharge of the Okavango River
underpins the wetland ecosystems, the groundwater system and a rich oasis
of biodiversity in the Delta. Thus, while tourists may visit to marvel at the
wildlife, this wildlife is effectively reliant on the ecological function of the
Delta which in turn depends in large part on the timing and availability of
water. As a major service sector in the economy of Botswana this one sector
is separated out from the other natural resource sectors for special attention
and prominence.
· Natural Resources. Natural Resources is a catch all sector that will be used
here to capture the impacts of changes in river flows on the direct use values
of resources like water, food, fibre, timber, wildlife etc that can be
categorized as components of local livelihoods for communities in the Basin.
In the context "natural resources" are in effect ecosystem "goods." The
emphasis here is on distinguishing between the primary goods provided by
new water resource projects. Water projects may increase water supply and
food, for example, but the manner in which they do so oftentimes means that
there are impacts on those communities previously relying on this water (or
flow). New projects mean that these goods are provided through different
economic production systems and, at times, to different groups of people.
So, modern irrigated agriculture has often come at the expense of traditional,
flood recession agriculture, for example. Thus, under the natural resources
heading the impacts of changes in river flows and subsequent effects on the
full variety of natural resources that enter into household production and
consumption will be captured.
· Ecosystem Services. Ecosystem Services is used consonant with the
interpretation provided in Turpie et al (2006) and thus refers to carbon
sequestration, water supply, water purification, etc. In other words these are
the natural hydrological and ecological functions that only indirectly enter
into the economy. For example, boreholes support a variety of livestock and
agricultural uses in and around
· the Delta. These uses of water may not be considered in the reference case
as they do not reflect formal sector M&I water supply. As development
proceeds these groundwater uses may be affected with knock-on impacts on
livelihoods in the Delta. The value of the groundwater is derived from its end
use in this case, and end use reflected in the natural resources produced (as
above). A key consideration then with respect to natural resources and
ecosystem services is to ensure that benefits, or the ensuing welfare
17
TDA River Basin Economic Valuation
changes, are not double-counted. Thus, the analysis needs to be clear in
this case as to whether the resource production based on groundwater
extraction is classified under natural resources or ecosystem services (but
not both). Priority is given to recording those services that lead to the
production of direct use values as natural resources. Measuring the change
in these direct use values under different flow regime could then be used to
demonstrate the ecological value of the ecosystem services provided by the
natural flow regime. However, these are not added back in to the analysis as
that would be double counting.
· Nature Conservation. This sector is again not a typically recognized
economic sector. However, this heading is used to reflect the economic
importance of conserving the Okavango Delta as a Ramsar Site - a world
renown wetland rich in biodiversity. In other words, this category is designed
to capture the global willingness to pay to conserve nature, as represented
in this case by the Delta. This value is separate from that reflected under
Tourism, as an additional value above and beyond that which actual tourists
engage in when they purchase tourism services. People who have never
visited the Delta and never will may still be willing to pay to conserve this
environmental asset. Similarly, people who have not visited the Delta may
wish to preserve their option (and that of their children) to someday visit
and this value may be reflected in an option value for the delta. Probably
most importantly, is that those who have visited the Delta may come away
from the experience convinced of the importance of protecting this rare intact
system and may be willing to contribute to efforts to implement such actions.
So this sector is considered as global, which is not meant to say that only
those outside the region value nature, but rather that any effort to capture
this values would be global in scope.
· Hydropower (HEP). The hydropower sector is a subsector of the national
energy sector and changes in hydropower production will need to be placed
in the context of their expected benefits to the national energy sector.
However, the energy sector may also include biomass energy, which in the
Basin may be a natural resource sector that is affected by changes in river
flows and water availability (decrease in biomass if water is not available) or
by water resources development (i.e. availability of agricultural or livestock
wastes for use as fuel). In order to keep these impacts separated out, we will
keep the hydropower designation separate from these other energy sector
impacts.
· Irrigation. Irrigated agriculture or irrigation is likewise a sub sector of the
agriculture sector and is defined here as such for similar reasons as for the
hydropower/energy distinction, i.e. in order to keep any impacts on
traditional agriculture separated out from the impacts of water resource
development.
· Water supply. Water supply is used here to reflect large-scale infrastructure
to provide M&I water to settlements, commerce and industry. Domestic
water supply is used to refer to water supplied to homes and communities
for the purpose of household use.
The resulting sectoral and country matrix that needs to be created for the current situation
and each of the three alternatives is shown in Table 5.
18
TDA River Basin Economic Valuation
Table 5: Alternatives Matrix
Country Sector
Botswana
Namibia
Angola
Global
Tourism
Natural Resources
Ecosystem Services
Nature Conservation
Hydropower
Irrigated Agriculture
Water Supply
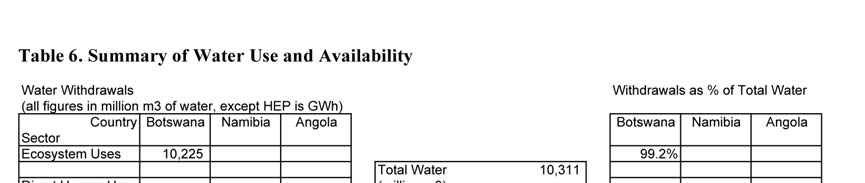
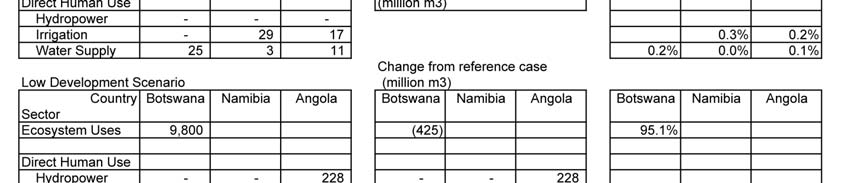
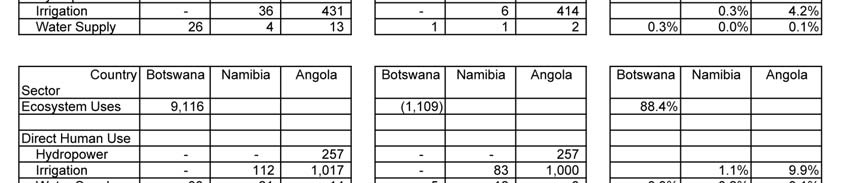
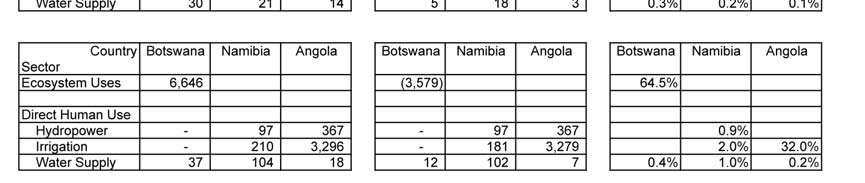
Table 6 below takes a very rough cut at stating where water is currently used and
where it will be used based on information from the TDA team about each of the
alternatives. For the three alternatives the new usage and change in absolute usage
of water is compiled along with an indication of the percent of mean water available
that is consumed by each use in each country. As hydropower uses are non-
consumptive (except for some evaporation at two reservoir sites) and use and reuse
the same water as it flows downstream they are included in terms of the Gwh of
power produced.
In the reference scenario the bulk of the flow in the Okavango River is ultimately
used in Botswana (in the Delta and outlying areas). As this water supports
ecosystem function it is called "ecosystem use" even though a good portion of it
probably indirectly supports human uses of water and water-related ecosystem
goods and services. The physical use of the water in Botswana clearly supports
global nature conservation values, although for simplicity sake the global scale is not
included in the charts.
19
TDA River Basin Economic Valuation
Table 6: Summary of Water Use and Availability
20
TDA River Basin Economic Valuation
Please note that the changes in water withdrawals in the middle portion of the table
are calculated by subtracting current withdrawals of water in the reference case
from the numbers for each alternative. This is not the same change in value that
would occur under these alternatives against a negotiated allocation of the water
resources of the Okavango River. Given, that any such negotiations would be
unlikely to grant the downstream country more than the current use allocation of
water these changes would be unlikely to increase in magnitude. Thus, as
calculations in the table suggest it is the downstream state, Botswana, is currently
consumptively using the vast majority of the flow of the Okavango river.
4.3 Economic Issues in Deriving Changes in Values
Quite a number of challenges exist in gathering, interpreting, compiling and
aggregating the economic information that may be available for these different
values, sectors and countries. These are too numerous to mention here, however, a
number of basic challenges are discussed here along with the suggested approach
to handing these.
4.3.1 Gross Value vs Net Value Added
In simple terms there are three concepts associated with value: production costs,
price of market transactions, and consumer willingness to pay (WTP). The value to
the economy represented by a market good is reflected by the total willingness to
pay for goods traded in the marketplace. This total WTP will typically exceed the
price paid by the consumer in the marketplace. The difference between these two is
called consumer surplus and represent the economic gains received by the
consumer. The difference between the total amount paid (quantity times price) by
consumers and the total production costs represents the economic gains garnered
by producers in the market, or the producer surplus. Production costs reflect
payments for land, labor, equipment and capital made by the producer. Each of
these payments is therefore part of the total payment made in other markets, i.e. the
markets for land, labor, equipment and capital.
Gross value added in a particular market should be represented by total WTP.
However, in practice WTP of consumers is not known and only market purchases
are observed. Thus Gross Value Added typically reflects the value of purchased
goods and services in the markets that make up a national economy. This gives the
gross size of the economy but does not accurately reflect the true value added
provided by the economy. This, as some of the items bought and sold in the
economy are imported or exported. So, for example, the gross value of automobiles
sold in a country may be quite large, but if the automobiles are imported attributing
the full gross value to the country would not accurately measure economic value
added in the country. In this case it the local economic contribution would simply be
the set of services needed to import, distribute and market the vehicles, which would
be just a portion of the purchase price. Net Value Added is therefore a more
appropriate measure of the size of an economy. Net value for a given market is
arrived at by taking the gross value and subtracting the costs of production. The net
value added for the input costs are in turn valued in their respective markets. So for
example local labor employed to bring imported automobiles to market is valued at
what it is paid. Assuming labor has no cash costs then all labor contributed to the
automobile market would represent net value added to the economy. Conversely,
amounts paid by automobile importers to foreign vendors are imports and are not
registered as national value added.
21
TDA River Basin Economic Valuation
With regard to natural resources like timber, fish, wildlife and water it is often
assumed in conventional economics that the resource has no cost. In the simplest
case, hunters provide their time and equipment, harvest animals and sell them in
meat, hide and other markets. Ultimately, in this case the amount paid for
purchased products is the sum of all the different net value added associated with
the wildlife markets. Even if it is assumed that there is some real opportunity cost
associated with the resource it probably does not change this calculation as long as
that opportunity cost is local. However, if this opportunity cost is borne by those
outside the country then the situation will differ. In other words, if all external effects
were compensated and an upstream country wished to use water already in use
and, therefore, impose costs on its downstream riparian neighbors then implicitly the
net value added associated with the upstream use of water would need to be
reduced proportionately (i.e. as if the water was being imported).
4.3.2 Value Added and Alternatives Analysis
In evaluating policy or projects the analyst is not so much interest in static measures
of gross value added for the entire economy, as in tracing through how shifts in
particular markets will play out and what the net effect will be on the economy. In
this regard it is important to be clear that economic measures are typically only
reliable when the changes that are evaluated take place within the range of
observed data. Quantities and prices in observed markets are always in flux, rising
and falling, and in some cases are subject to large shocks. However, when it comes
to large increases or decreases in supply or demand, these may push the analysis
beyond the bounds of existing data making it hard to predict price and quantity
response. For the analysis contemplated here this is an important point, both in
terms of any large decrease in water and ecosystem services available in Botswana
and any large increase in food production and hydropower in the upstream
countries.
For cases where these responses can be estimated the question is whether they
should be calculated as changes in gross value or net value added. For a specific
change in a specific market the best metric would be the change in net value added.
Ideally this would reflect both consumer and producer surplus, but at a minimum it
would consist of producer surplus for the measurement reasons described in the
prior sub-section. One rationale for not including any changes in production costs in
the market is the assumption that markets are in equilibrium. For example, if tourism
declined slightly in the Delta due to changes in water availability the change in the
quantity and price of labor employed in tourism is reflected in the change in
production costs. It is assumed that any labor freed up in tourism goes to its next
best use in the economy and that the price of labor adjusts to keep labor "fully"
employed. On this basis, the change in net value added is the best measure of the
welfare changes resulting from the water withdrawal alternatives evaluated here.
This said, once again it is clear that for marginal changes this assumption may hold,
but for rapid and large changes that might accompany such projects there will
clearly be volatility in these markets as labor may be constrained by location and
wages may be "sticky."
4.3.3 Direct vs. Indirect Economic Impacts
As suggested above an economic analysis of water withdrawal alternatives will
involve examination of welfare changes in a number of sectors. Each of these
sectors may involve a number of markets, i.e. so the irrigation sector will involve a
range of crop and livestock markets depending on what plants and animals are
22
TDA River Basin Economic Valuation
grown in a given irrigation projects. As stated above estimating the change in net
value added in each and every product market associated with each of the
development projects associated with each alternative will yield the best measure of
the economic impacts associated with that alternative (relative to the reference
case).
However, the economic impacts from irrigation, for example, are not limited just to
the market for wheat, beef or milk, but the markets for inputs to agricultural
production, as well as those for further processing of agricultural products. So, for
example, dramatic expansion in agricultural production in Angola may stimulate the
market for fertilizer, tractors and farm labor. Similarly, the onset of milk production in
the Okavango region may lead to new businesses for the processing and production
of a variety of diary products for internal or external consumption. Recalling the
discussion above this is the same as saying that the change in agricultural
production may increase the gross value in agricultural production which of course
includes the wages and prices paid for agricultural inputs. It may also create or
expand agricultural processing markets leading to new opportunities to create value
for the economy. These impacts are secondary to the impacts in the markets for
agricultural products per se. Oftentimes the primary impacts are refereed to as the
direct economic impacts and the secondary impacts as the indirect economic
impacts. These indirect economic impacts are what is being referred to when people
talk of the "multiplier" impacts of a given project or action. This reflects the idea that
the specific action in a given market generates economic benefits (direct), which are
then multiplied through backward (inputs) or forward (processing) linkages to other
markets. The idea being that $1 of direct benefit actually creates, for example, $1.5,
of value as it circulates through the economy.
It is safe to say that there is some debate as to what role these indirect economic
impacts should play in decision-making. From the perspective of positive economic
analysis there are conditions under which these indirect economic benefits might be
legitimately included along with the direct economic impacts in considering whether
a given project (or alternative) will maximize economic efficiency. But generally it is
recommended that they not be included (as explained further below) and that
decisions be made on the basis of the direct benefits alone (Aylward et al. 2001;
etc). The explanation for this mirrors that found above which is basically that in a
well-functioning economy resources will be priced at their opportunity cost and as
economic activity shifts will move from sector to sector. If resources to be devoted to
a proposed project are priced at their opportunity cost the only thing that matters is
whether it is worth dedicating these resources to the project and that is only the
case if net benefits are generated. In other words the inputs will generate more
economic value to the economy in the new, proposed use than in their alternative
use.
The crucial exception to this is, of course, if the resources will be un- or under-
employed if the project does not go ahead. This argument has been used to tout
large dam projects for a very long time. This is where the perspective of normative
economics applies. Oftentimes considerations of political economy have driven the
development of large water resource projects on the premise of employment and
large multiplier benefits, the interests of the unemployed coincide with that of
politicians seeking popular support. However, it needs to be clear that positive
economic analysis does not support the contention that devoting idle resources to a
project that generates net economic losses (and not net gains) is not an effective
way to build a national economy. The question that needs to be answered is what
other activity could be funded with the same development monies that would
provide employment and generate net economic benefits.
23
TDA River Basin Economic Valuation
A further difficulty is that once marginal economic projects are funded and input
and processing markets develop, the existence of these multipliers becomes a
normative argument for continuing these projects and activities. For example, in
developed countries where full employment of resources is largely taken as a given
(subject to the ups and downs of economic cycles) the argument that restricting the
use of water for agriculture and putting it to ecosystem uses will have adverse
affects on local economies in rural areas is now a frequently heard argument. A
recent review of the literature however, provides little support for the contention that
these multipliers are of a significant magnitude (MacDonnell et al. 2009). The
inclination to place undue importance on these indirect economic benefits, therefore,
can be seen as a potential poverty trap first lowering the bar to investment in
unproductive activities and then raising the bar to abandoning these activities.
A final point with regard to indirect economic benefits is that these are often
considered as unmitigated positives of water resource development activities.
Implicitly this reflects the view that there is no opportunity cost to developing the
water resource. But, as discussed in detail above, in the case of the Okavango it is
clear that the resource is already being used for the production of tourism,
ecosystem goods and services, and global existence value. In other words, an
increase in agricultural production in Angola or Namibia may be accompanied by a
decline in tourism in Botswana. These alternative economic uses of water also have
indirect economic, as well as direct, benefits. The point being that if the indirect
benefits are to be included on one side of the equation they may well need to be
included on the other. This issue also, therefore, needs to be considered in the
economic analysis. Indeed, this would be one argument for just focusing in the
alternative analysis on the direct changes in net value added.
The approach taken in the analysis is therefore to focus on these direct impacts and
leave the indirect impacts for future consideration. Predicting the multipliers
associated with processing industries that may or may not emerge alongside
irrigation projects would be haphazard at best in any case. The one exception here
would be to explicitly consider potential employment multipliers from labor markets
directly engaged in irrigation developments under the alternatives.
4.3.4 Financial vs. Economic Values
Prices and quantities appearing in national accounts are typically what can be
observed by data collectors or what is reported by producers and consumers. As
indicated above, in the first instance then these figures reflect prices of real market
transactions. These are typically referred to as financial values. However, there are
a large number of market and policy failures that may skew market quantities and
prices away from what they would be in an efficient market that allocates goods and
services to their highest and best use from an economic perspective (Anandarup
1984: ; Asian Development Bank 1997: ; Belli et al. 1998: ; Gittinger 1982: ; Jenkins
and Harberger 1989). This underlying "true" economy and its associated economic
values can be derived from market transaction data and knowledge of the
distortions imposed by market failures and distortionary policies. This type of
analysis is often undertaken in evaluating projects, although actual practice lags that
recommended as best practice (Jenkins 1997). Thus, there would be a financial
cost-benefit analysis carried out at market prices and quantities and an economic
cost-benefit analysis carried out at so-called "shadow" market prices and quantities.
Where market and policy distortions are significant it is very useful to undertake an
economic analysis, as otherwise a project that looks good in financial terms but is
24
TDA River Basin Economic Valuation
actually deleterious to the economy might be approved. Some of the typical issues
that arise and are usefully dealt with through economic analysis include:
· transfers i.e. where costs are not borne by the purchaser and thus do
not appear in the financial accounts even though the resources deployed
in the activity have an economic opportunity costs. Examples include free
provision of inputs, lack of cost recovery on infrastructure and failure to
account for opportunity costs of resources that can be extracted or
harvested for "free."
· own labor in particular small scale production oftentimes pays the
owner in profits not in hourly wages and thus economic analysis involves
specifying the labor hours and valuing them at the appropriate wage rate
in order to accurately convey not just financial but economic profit
· wages the true economic market-clearing price for labor of different
categories may diverge from that observed in the market place, for example,
in Botswana and Namibia the shadow price of unskilled labor is suggested to
be 35 to 50% of market price due to high unemployment levels (Barnes 1994)
· trade barriers i.e. where import or export subsidies or tariffs lead to under-
or over-valuing the costs and benefits to the economy of resources
· taxes and subsidies where the government partially subsidizes (or taxes)
inputs, provides direct subsidies (taxes) to the production and sale of goods,
or puts sales or other taxes on consumption or income appropriate discounts
or increase in values may be needed
· price controls i.e. where the government exerts direct control over the price
of inputs or outputs
· opportunity cost of foreign exchange i.e. manipulation or setting of foreign
exchange rates, which will effectively have same impacts as trade barriers
· opportunity cost of capital whereas financial analysis uses market lending
and borrowing rates of interest, economic analysis should account for
intragenerational equity (not penalize future generations) and therefore lower
rates for the cost of capital are generally recommended although the range of
views on this is large. This becomes an issue only where projects are likely to
have costs and benefits that vary greatly over longer time horizons. In this
case working with a future annual expected value may be sufficient to avoid
this problem.
In gathering data for the quantitative analysis some studies and figures
encountered will have applied shadow-pricing methods and in others this will not
have been done. This poses a consistency problem that will be hard to eliminate.
An effort will however be made to use economic values and not financial values
where these are available. Where these are not available an effort will be made to
indicate the likely net direction and magnitude of expected changes in any financial
values. In this regard the paper by Barnes (1994) provides useful guidance for the
region.
4.4 Data Collection
As alluded to in the discussion above a comprehensive and internally consistent (in
terms of methods and results) quantitative analysis will not be possible within the
frame of this consultancy. In large, part this is due to the scale of the alternatives that
need to be analyzed, the sheer number of projects in each alternative, and the gaps
25
TDA River Basin Economic Valuation
in information that will be available regarding these projects. However, the analytical
framework will be employed in making a first approximation at compiling and
evaluating such data as is available and filling in the alternative matrices to the extent
possible. Again, the interest is not in reaching some overarching conclusion about
what should be done, but providing the riparian countries with formatted information
that begins to indicate the values involved and the tradeoffs that need to be
discussed in future negotiations. A further objective will to highlight which information
remains to be gathered in order to attain a more comprehensive analysis going
forward.
The discussion below presents the approach taken in gathering information to fill in
the matrices with the efforts divided into those related to the ecosystem uses of
water and those for the water resource developments themselves.
4.4.1 Ecosystem Values
This category covers the tourism, natural resource, ecosystem service and global
nature conservation sectors. For the tourism, natural resource and ecosystem
service sectors the socio-economic results from the IFA were extended by the TDA
Team's Socio-Economist, in coordination with the author of the present study, and
thus could be incorporated directly into the quantitative analysis.
For the global nature conservation values, no primary research exists on the
existence values held by the global community with respect to the Okavango Delta.
Nonetheless there is the assumption that the willingness to pay is significant in total.
Literature review and where feasible benefits transfer could be used to see if at least
a range in order of magnitude can be assigned to this value. Due to time and
resource constraints, as well as the nature of the initial results for values within each
countries, these were not pursued for this study. If as expected, a policy option to be
considered would be having the global community engage with the three countries in
a system of compensated payments for development rights foregone based on a
negotiated sharing of the waters of the Okavango River carrying out such a review
would be a useful exercise and could be included in the Strategic Action Programme.
4.4.2 Water Resource Projects
For each alternative and each project within each alternative there are a number of
ways to arrive at alternative-level or project-by-project costs and benefits, or perhaps
simply the net benefits of water use in irrigation, water supply and hydropower:
1. detailed project economic cost-benefit analysis
2. project-level cost-benefit analysis at some level of detail and precision in
terms of reconnaissance through engineering/cost design proposal and
financial/economic analysis
3. costs and benefits from similar projects already implemented (along the
continuum of financial/economic cost-benefit analyses)
4. net values derived from larger evaluation datasets of similar projects (for
example the World Commission on Dams case studies, cross-check
analysis, and similar evaluation reports from development agencies such
as the World Bank)
26
TDA River Basin Economic Valuation
5. net values for irrigation, hydropower and water supply projects found in
the grey and academic literature as selected for their likely applicability
alternative
These sources are organized in order of preference. Project and site-specific
numbers as indicated in items 1 and 2 above were not available or obtained under
items 1-2. However, a range of information of the type mentioned in items 3 through
5 are available and were employed to identify likely cost, benefits or net values of
these activities. Depending on the type of value some of the methodological issues
mentioned above were dealt with, but it remains the case that the distinction
between, for example, financial and economic values was not apparent in much of
the literature. Where possible an economic as opposed to financial approach was
taken but given the crude nature of the extrapolations required the lack of consistent
economic data is probably not a major constraint.
It is also worth emphasizing that to some extent figures obtained from actual
evaluation work or research are probably more reliable indicators that early stage
reconnaissance project work. Indeed, one of the lessons learned from the World
Commission on Dams process is that pre-project economic analysis has often
understated project costs and overstated project benefits. For this reason, even if
information was available under item 1, it might still need to be adjusted to account
for this bias in pre-project analysis. In the end, the objective of the analysis was to
ensure that rough orders of magnitude for the alternatives were first achieved
knowing that this first approximation would probably clarify which projects would be
worthy of further scrutiny with more site and project numbers.
27
TDA River Basin Economic Valuation
5. Quantitative Evaluation
5.1 Model Development: General Parameters and
Assumptions
The analysis is undertaken over a 40-year time horizon. In order to synchronize with
a number of varying population estimates and water supply information the analysis
begins with 2008 and extends to 2048. All costs and benefits are discounted at an
8% cost of capital. To evaluate the sensitivity of results to a lower discount rate,
perhaps reflective of a lower social opportunity cost of capital, net present values are
also calculated at a 4% discount rate. These rates are chosen to be consistent with
those employed in the socio-economic analysis under the EPSMO project.
The projects that make up the alternatives are phased in over the first 20 years of
the time horizon. Broadly speaking the projects set forth in the IFA for each of the
three "scenarios" make up the alternatives. The low water withdrawal alternative
assumes a limited set of developments that are completed in the first five years (i.e.
by 2013); the medium water use alternative includes a more aggressive
development schedule that includes additional projects that are implemented over
the subsequent five years (to 2018); and the high water use alternative includes a
further set of projects implemented over the next 10 years (to 2028); in years 20
through 40 projects are maintained but no increase in population or projects is
assumed. This is done to allow the costs and benefits that result from the
alternatives to play out over a time period sufficient to ensure that the long-lived
benefits of the infrastructure projects, as well as their long-term costs, are
adequately accounted for given the two different discount rates employed.
The reference case scenario against which these alternatives are compared simply
incorporates population growth in the absence of any of these water resource
development projects. The reference case is thus analogous to a "stagnation"
alternative in which no further investment is made in these projects. The reference
case thus includes the present value of current and projected future net benefits
derived from ecosystem goods and services in each country. Based on the IFA and
the subsequent results for changes in the tourism, natural resource values and
ecosystem services from the socioeconomic report, the expected net benefits under
each of the water withdrawal alternatives is also specified. Subtracting the reference
case net benefits from those calculated for water resource developments, and
ecosystem goods and services, yields the net benefits of selecting and pursuing
each of the alternatives.
The specific parameters and assumptions employed in developing cost and benefit
profiles for the water supply, hydropower, and irrigation, along with the sectoral
outputs (improved water supply delivered to households, GWhs of electricity and
lands irrrigated) are reviewed below, before proceeding to the results. The results are
presented in terms of the present values of net benefits per sector and country, but
also in terms of how the outputs translate into populations served.
28
TDA River Basin Economic Valuation
5.2 Domestic Water Supply: Ecosystem Direct Use Values and
Water Supply & Sanitation Values
5.2.1 Water Supply and Sanitation Overview
Access to improved water supply and sanitation varies between the riparian
countries, the urban and rural areas within each country (see Table 7). The basin
does have a number of towns and cities, but is generally remote from the population
and governance hubs of each country. Actual, confirmed detail as to the level of
water supply and sanitation for communities in the basin is scarce for Angola. Some,
limited information is available for the other countries from EPSMO reports. As
described further in the sub-sections below for each country, efforts are made to
gather available data in order to portray what are at best imprecise estimates of
source of water supply, level of improvements, and quantities withdrawn for the
populations living in the basin.
Table 7: Access to Improved Water Supply and Sanitation, Okavango Riparian
Countries
MDGs
Angola
Botswana
Namibia
Population Accessing Improved Drinking Water (% in 2004)
Urban
75
100
98
Rural
40
90
81
Total
53
95
87
Population Accessing Improved Sanitation Systems (% in
2004)
Urban
56
57
50
Rural
16
25
13
Total
31
42
25
Source: (WHO and UNICEF 2006)
5.2.2 Water Supply and Sanitation Benefits: Approach
Using the information for each country produced by EPSMO and that available from
other secondary sources, the water supply and sanitation analysis is developed in
four steps:
Step 1: Establish the value of present day use of water in the basin as part of the
socioeconomics contribution to the valuation of basin resources:
· estimating present day populations, their level of current household
service and current daily/annual volume of water use, and
· estimating the water supply benefits garnered by populations
from the ecosystem direct use values associated with domestic
water supply under present day conditions and for the
reference case.
· Step 2: Establish the reference case and water withdrawal
alternatives by:
· estimating expected growth in populations over the time horizon, and
29
TDA River Basin Economic Valuation
· projecting improved service levels and changes in water use for
the reference case and the three water withdrawal alternatives.
· Step 3: Establish the change in ecosystem direct use values
· by estimating the change in reliance on the river (or other
untreated, natural sources) as opposed to improved water
supply between the reference case and the different withdrawal
alternatives
· Step 4: Establish the net benefits of improved service levels
under the three withdrawal alternatives (as against the
reference case) by:
· estimating the investment, and operations and maintenance (O&M) costs
of improved water supply and sanitation for the withdrawal alternatives,
based on World Health Organization (WHO) global studies, and
· estimating the benefits of improved water supply and sanitation, based on
global WHO studies and country-by-country adjustments, and
· deducting costs from benefits for each year in the 40-year time horizon
and discounting net benefits (and calculating internal rates of return where
feasible, i.e. where non-negative)
The calculations for Step 3 provide the people served and water withdrawn for the
reference case and alternatives. It is useful to note that one consequence of
improved service levels is a higher withdrawal and use of water by households. This
dynamic is not addressed in the IFA analysis, but is reported here. Also, as
populations increase and coverage of populations by water supply schemes
expands, the number of people who will rely on ecosystem direct use values for
water will be reduced. Thus, even as increasing water withdrawal may impair these
ecosystem values, the basis for these values will be reduced. In effect the reference
case and water withdrawal alternatives will each vary in how they treat the latter two
trends listed above. In order to evaluate this second dynamic, the domestic water
supply analysis needed to compile an internally consistent picture of the populations
in each country and how they are supplied with water over the 40-year time horizon
of the economics analysis of the scenarios. Thus, the water withdrawal numbers
here will diverge from those in the IFA. However, the numbers are generally lower
as this analysis deals only with domestic water use by households and not the full
range of water withdrawals for industrial, commercial, livestock, etc.
Another caveat is that modeling water supply while ignoring sanitation is not only
difficult but largely meaningless. Providing improved water supply will increase
water withdrawals. Without concurrent investments in sanitation improvements in
water supply would just increase the scale of the sewage and effluent problem,
most likely with negative impacts on water supply and treatment costs
downstream. Perhaps indicative of this, the global WHO studies of the benefits of
improved service exist for water supply and sanitation taken together not
separately. Thus, while there is disaggregated information on costs of supply and
sanitation to undertake the analysis only in terms of supply would not only be
meaningless but would not be possible on the benefit side. For this reason the
analysis considers improvements in water supply and sanitation jointly.
Each of the steps are reviewed below with the analysis for each country presented in
turn. Botswana is the first country reviewed under each step as it served as the trial
country for the purpose of developing the necessary estimates. More detail is thus
provided for Botswana in order to show how the approach for the countries was
30
TDA River Basin Economic Valuation
developed and applied, particularly with respect to the direct ecosystem use values.
For the other countries the data and parameters applied are simply summarized.
5.2.3 Step 1: Present Day
Botswana
Population. A number of sources provide information on populations in the study area:
· National Water Master Review of 2006 is cited as suggesting
that in 2005 were are 133,000 people in Ngamiland region,
although the language is not clear if this is rural and urban or
just urban (Beuster et al. 2009)
· Central Statistics Office is cited as reporting a Ngamiland
population of 138,654 for 2006 (Vanderpost 2009)
· Barnes (pers. com 2009) suggest a rural population in the
study area of 14,000 households or 111,000 people
· population in Maun of around 50,000 people with household
size of 4.4 (in 2001) (Vanderpost 2009)
The final population numbers employed by EPSMO are 157,690 for 2008, with a
1.5% population growth rate.
Household Water Sources/Service Levels. According to Central Statistical Office
numbers for 2001, (shown in the table below) just 9% of Ngamiland Region
households collect water directly from the river and 8% of households obtain their
water from boreholes (Vanderpost 2009). Over two-thirds of the Region's
households are connected to a water system that includes either a pipe to the yard
or the house, or the use of a communal standpipe. The source of water use is not
identified for 7% of the population.
Table 8: Household Access to Water Sources, Ngamiland, Botswana, 1991 and 2001
Type of Water Supply
% Households 1991
% Households 2001
Piped water in house or yard
15
23
Communal pipe
37
54
River
17
9
Borehole
8
7
Other
23
7
Total
100
100
Source: CSO, 2003 in Vanderpost (2009)
Trends between 1991 and 2001 suggest, that households using unimproved
sources such as collection from the river and "other" sources are moved on to
improved water supply, either in the form of piped water or communal pipe. The
percentage of households using boreholes, on the other hand, remain roughly
constant suggesting that these sources are improved boreholes (i.e. with surface
protection) and provide adequate source of water given the remoteness of the
location and distance to other sources.
31
TDA River Basin Economic Valuation
Household Water Use/Demand. National Water Master Review of 2006 is cited in
Beuster et al. (2009) as suggesting water demand for Ngamiland Region is 3,644
m3/yr. However, this amount of water demand is far too low for the region's
population - about 300 l/c/yr as opposed to a daily minimum suggested for
household needs by WHO of 20 l/c/d which is equal to 7,500 l/c/yr (see Table 9).
Table 9: Per Capita Requirements for Water Service Level to Promote Health
Service level
Access measure
Needs met
Level of
health
concern
No access
More than 1000m or
Consumption cannot be
Very high
(quantitycollected
30 minutes total
assured Hygiene not possible
often below 5 l/c/d)
collection time
(unlesspractised at source)
Basic access
Between 100 and
Consumption should be
High
(averagequantity
1000m or 5 to 30
assured Hygiene
unlikely toexceed
minutes total collection
handwashing and basicfood
20 l/c/d)
time
hygiene possible;
laundry/bathing difficult to
assure unlesscarried out at
source
Intermediate
Water delivered
Consumption assured
Low
access (average
throughone tap on-
Hygiene all basic personal
quantityabout 50
plot (orwithin 100m or
and foodhygiene assured;
l/c/d)
5 minutes total
laundry and bathingshould also
collection time
be assured
Optimal
Water supplied
Consumption all needs met
Very low
access(average
through multiple
Hygiene all needs should be
quantity100 l/c/d
tapscontinuously
met
and above)
Source: Howard and Bartram (2003)
Using the information provided above on populations and water sources it is
possible to disaggregate between the Maun urban population and rural gazetted
settlements, and use information on urban and rural household size and total
regional population to work through and allocate population numbers by type of
household access to water sources. WHO estimates for different service levels are
used to estimate per capita water use. It is assumed that piped water to the house
or yard results in use of 75 l/c/d (midway between intermediate and optimal access
levels), communal pipe leads to use of 35 l/c/d (midway between basic and
intermediate access levels), and that all others use 20 l/c/d (basic access). The end
result is 2.14 million m3/yr of water use by households in Ngamiland Region. Water
volumes can then be valued by applying an appropriate measure of the per unit
economic value of water for domestic use. In this case a value of US$ 0.50/m3 is
employed based on prior work in the Delta (Turpie et al. 2006). This suggests an
annual current value of $1.07 million per year.
Table 10: Present Day Water Use, Botswana
Table 10.
% HH
Location Population
HH Households
Water Use
Size
Water
l/c/d
M
Source
m3/yr
Piped
23% Urban
25,295
4.4
5,749
75
0.69
32
TDA River Basin Economic Valuation
Water
Communal
54% Rural/Urban
86,979
6.4
13,497
35
1.11
Pipe
Borehole
7% Rural
13,822
7.9
1,750
20
0.10
River
9% Rural
17,772
7.9
2,250
20
0.13
Other
7% Rural
13,822
7.9
1,750
20
0.10
Total, of
157,690
24,995
2.14
which
Urban
45%
50,000
4.4
11,364
Rural
55%
107,690
7.9
13,632
Note: HH = household, Urban population assumed based on Vanderpost (2009)
Ecosystem Direct Use Value. For water sourced from improved sources, particularly
the treated water supplied to residences and communal pipes, the investment in
infrastructure and water treatment effectively reduces the household's reliance on
the river ecosystem. Given the emphasis on providing access to safe and secure
water as a matter of global concern and national policy under the Millennium
Development Goals the relatively low reliance on unimproved sources, i.e. the river,
must be regarded as a positive development indicator even if it lowers the extent
to which humans are reliant on the ecosystem for their water supply. Based on the
proportion of households and total population relying directly on the river, boreholes
and other sources and using the water use under these categories, produces an
estimate of 0.33 million m3/yr and $165,000 per year of present day direct
ecosystem use value (valued at the same $0.50/m3).
Namibia
Population. The starting population for Namibia is 219,090 and a 1.7% growth rate
used. The growth rate reflects the 2.5% growth rate for urban areas and the 1.5%
for rural areas weighted for the relative share of population.
Household Water Sources/Service Levels and Demands. A range of estimates of
which populations are served by what source and level of improvement are cited by
the relevant EPSMO documents and these are employed to derive the assignment
of populations to the different service levels (Nashipili 2009). Estimates for use by
households that are on piped water systems are high for the region at 165 lcd, but
appear to be substantiated by NAMWATER so are included in the analysis. Overall
expected water use in 2008 for domestic purposes is 2.8 million m3.
Table 11: Estimated Water Use by Source, Namibia
Table 11.
Service Segments
2008 Population
% of
Water Water Use
Total
Population
Use
(m/yr)
Use
(l/c/d)
(mill m3)
Rundu-Regulated
18,000
8%
165
60.225
1.08
Pipe
StandPipe
46,668
21%
35
12.8
0.60
Namwater
39,055
18%
20
7.3
0.29
Boreholes
River
115,367
53%
20
7.3
0.84
Totals
219,090
2.81
Of which
154,422
Unimproved
33
TDA River Basin Economic Valuation
Ecosystem Direct Use Value. Based on water withdrawals of 1.13 million m3 by
those households drawing from boreholes or the river the annual ecosystem direct
use value of the river is $565,000.
Angola
Population. The Angolan population in the basin is estimated at 505,180 in 2008
with a 2.7% growth rate.
Household Water Sources/Service Levels. EPSMO information on service levels
was not precise with respect to households or populations with improved standpipe
or piped systems. It does appear that these systems do exist in the major towns,
such as Menongue and Cuito Cuanavale. One source cited in an EPSMO report
suggests that some 17.5%s (or 90,000) people may be receiving treated surface
water (Saraiva et al. 2009). Another source, however, reports that just 0.2% of the
population of Menongue receives water from the public grid and that 80% rely on
water holes and wells, and another 14% rely on the river. No complete and reliable
picture is therefore available for the source and level of improvement of the Angolan
population in the basin. Moreover, it is likely that where improved, piped systems
exist that these systems probably date back to 1975 or earlier. Nor is it likely that
much investment was made since then given the war. In the absence of better
information it was assumed that what systems are in place are likely to be
antiquated and in poor repair, and likely would need replacing. For the purpose of
this analysis it was therefore assumed that the entire population is on unimproved
sources, with 25% on boreholes and 75% on the river as their source.
Household Water Use/Demand. Estimated using 20 lcd in consumption for
river/borehole sources the total annual domestic water withdrawal would be 3.69
million m.3.
Ecosystem Direct Use Value. The total ecosystem direct use value would be $1.84
million given the assumptions above.
5.2.4 Step 2: Projecting Service Levels and Withdrawals
Future domestic water use is important to the economic analysis in two respects"
1. The degree to which domestic water use relies on unimproved
sources and thus is subject to risk from future shortfalls or water
quality impairment of flow and groundwater. These factors enable
projection of the future direct ecosystem use value of water under the
reference case and the water use scenarios
2. The extent to which improved water supply (and sanitation) is
provided to the population. This motivates projection of the costs and
benefits associated with existing or new populations receiving access
to improved water supply (and sanitation) under the reference case
and the water use scenarios.
In order to arrive at these figures it is necessary to (a) project future area population,
(b) determine how the numbers of people reliant on unimproved and improved
sources of water change over time, and (c) calculate the respective costs and
benefits under the reference case (no change in water resource use) and the three
water use scenario (low, medium and high). Comparing these values between each
of the three scenarios and the reference case will provide the gain/loss in direct
ecosystem use value and improved water supply and sanitation.
34
TDA River Basin Economic Valuation
Thus, in Step 2 the present day domestic water sources, service level and
withdrawals are combined with a series of assumptions about future investment
levels in order to forecast the reference case (no further investment) and low,
medium and high withdrawal alternatives. These alternatives represent increasing
levels of investment in improved water supply and sanitation. The assumptions
made are as follows:
· For the reference case it is assumed that there is no further provision of
improved water supply and thus this additional population added each
year collects water from the river (i.e. no further investment in improved
water supply), with the exception of those rural populations using
boreholes, which are assumed to increase at the rate of population
growth. In other words, the bulk of the increase in population goes on the
unimproved source that puts populations at risk from poor ecosystem
management.
· For the low water use scenario, the additional population is served from
the same set of improved and unimproved sources, with no change in
the proportionate share of each source in the population (i.e. percentage
shares by source are maintained). In other words, the population
increase is spread across both improved and unimproved sources, but
access to improved sources is limited. In the Angolan case standpipe
water is supplied to the urban population over the twenty-year period to
2028.
· For the medium water use scenario access to improved sources is
increased, with households using the river and "other" sources put on
improved sources by 2018 (2028 for Angola given the larger number on
unimproved sources at present). Borehole numbers remain the same as
under the previous scenarios. For those households that receive access
to improved sources, the existing proportion of piped (23%) vs
communal pipe systems (77%) is maintained as the population grows.
Proportionatlely these are 23% and 28% for in house piped systems
versus 77% and 72% for Botswana and Namibia respectively. In the
case of Botswana these proportions are In other words, the bulk of the
population is moved to the less costly improved source of water:
communal standpipes. In the case of Angola the split between piped and
communal pipe systems is 25% and 75% respectively.
· For the high water use scenario the same assumptions as the medium
scenario, apply except that it is assumed that households on communal
pipe systems are gradually upgraded, so that by 2028 all non-borehole
users are on household pipe systems for their water supply. This moves
the vast majority of the population to the highest level of improved water
supply, in-house piped supply. In the Angolan case, with no households
on piped or communal systems to start with all households (except those
on boreholes) are gradually transitioned to piped systems by 2028.
Botswana
In the IFA model the numbers for Maun/Delta withdrawals for water supply vary from
25 million m3/yr (2005) for the reference case to 36 million m3 for the high water
withdrawal scenario (i.e. in 2035) (Beuster et al. 2009). These water supply numbers
actually come from total surface and ground water abstractions for 2005 (and 2025)
as determined by the ODMP. These abstractions meet domestic water supply,
livestock, game, small-scale irrigation and construction needs. These numbers
apparently also include wild game water needs. They also may include water
demand on the part of tourists. Background documentation suggests tourist demand
35
TDA River Basin Economic Valuation
of 32,000 m3/yr in 2005, suggesting that this is minor in total quantity. Clearly the
present day estimates of household water use (2.14 million m3/yr) arrived at above
are just a fraction (7.5%) of the 2005 water use employed in the IFA analysis. The
numbers employed in the IFA analysis presumably do not affect the IFA scenario
outputs for flows into the Delta as the water is withdrawn in or around the Delta. The
difference between these two sets of numbers is therefore not of consequence, and
the analysis below proceeds on the basis of the bottom-up calculation of domestic
water use.
The results for the reference case and the water withdrawal alternatives are
presented for Botswana in the table below. In sum:
· with a 1.5% growth rate the population increase of 35% over the 40-year
time horizon, to just over 212,000
· in the reference case, annual water use increases by 20% to 2025 in the
reference case, with a fourfold increase in the population reliant on the
river.
· with each of the water withdrawal alternatives, the reliance on the river
decreases and the numbers served by improved sources rises. As a
consequence the volumes of water used also increase, from
2.14 million m3/yr under present day to 5.44 million m3/yr under the high water
use alternative, a 150% increase. However, with increasing levels of improved
water supply, the population relying on unimproved sources decreases.
36
TDA River Basin Economic Valuation
Table 12: Population Served and Domestic Water Use, Botswana
Table 12.
Scenario
Present Day
Projections for 2028
Reference
Low
Medium
High
Population Served
Pipe
25,295
25,295
34,069
43,656 193,769
Communal
86,979
86,979
117,148
150,113
-
Borehole
13,822
18,616
18,616
18,616
18,616
River
17,772
67,673
23,936
-
-
Other
13,822
13,822
18,616
-
-
Water Use in million m3/yr (present day value is 2.81 million m3/yr )
2013
2.22
2.30
2.46
3.08
2018
2.32
2.48
2.80
4.05
2028
2.53
2.88
3.25
5.44
Namibia
The results for the reference case and the water withdrawal alternatives are
presented for Namibia in the table below. In sum:
· with a 1.7% growth rate the population increase of 35% by 2028, to just
over 295,000
· in the reference case, annual water use increases by 20% to 2028, with a
50% increase in the population reliant on the river.
· with each of the water withdrawal scenarios, the reliance on the river
decreases and the numbers served by improved sources rises. As a
consequence the volumes of water used also increase, from 2.81 million
m3/yr under present day to 14.99 million m3/yr under the high water use
scenario, a 430% increase. However, with increasing levels of improved
water supply under the water use scenarios, the population relying on
unimproved sources decreases.
37
TDA River Basin Economic Valuation
Table 13: Population Served and Domestic Water Use, Namibia
Table 13.
Scenario
Present Day
Projections for 2028
Reference
Low Medium
High
Population Served
Pipe
18,000
18,000
24,243
67,493 242,479
Communal
46,668
46,668
62,855
174,987
-
Borehole
39,055
54,714
52,602
52,602
52,602
River
115,367 175,699
155,381
-
-
Water Use in million m3/yr (present day value is 2.81 million m3/yr )
2013
2.93
3.03
4.27
7.27
2018
3.07
3.26
5.76
11.81
2028
3.36
3.78
6.69
14.99
Angola
The results for the reference case and the water withdrawal alternatives are
presented for Angola in the table below. In sum:
· with a 2.7% growth rate the population increase of 70% by 2028, to just
over 860,000
· in the reference case, annual water use increases by 70% to 2028, with
an 80% increase in the population reliant on the river.
· with each of the water withdrawal scenarios, the reliance on the river
decreases and the numbers served by improved sources rises. As a
consequence the volumes of water used also increase, from 3.69 million
m3/yr under present day to 20.0 million m3/yr under the high water use
scenario, a 440% increase. However, with increasing levels of improved
water supply under the water use scenarios, the population relying on
unimproved sources decreases.
38
TDA River Basin Economic Valuation
Table 14: Estimated Water Use by Source, Angola
Table 14.
Scenario
Present Day
Projections for 2028
Reference
Low Medium
High
Population Served
Pipe
-
-
-
170,944 683,774
Communal
-
-
341,179
512,831
-
Borehole
126,295 176,932
176,932
176,932 176,932
River
378,885 683,774
342,595
-
-
Water Use in million m3/yr (present day value is 3.69 million m3/yr )
2013
4.21
4.68
5.63
7.34
2018
4.81
5.75
7.74
11.25
2028
6.28
8.15
12.52
20.01
5.2.5 Step 3: Evaluation of Ecosystem Direct Use Values with the Alternatives
The analysis of potential changes in ecosystem direct use value with the water
withdrawal alternatives is explored in full below for Botswana and only briefly
summarized for the other two countries. Employing the figures for the population
using borehole, river and other as their supply source, the ecosystem direct use
value of water supplied is calculated for each scenario. The impact of changing mix
of water supply sources on ecosystem direct use values is examined first. Then the
impact from any degradation in ecosystem function due to changes in flow and water
quality resulting from increased water resource development under the scenarios is
examined.
The direct use values for the reference case and the three scenarios are presented
in the table below, for the two values of the discount rates employed across the
valuation studies. The 8% figure is the best estimate for the discount rate and values
for this figure will be cited in the text. The 4% figures are presented for the reader's
information. Under the reference case the net present value of the ecosystem direct
use values is $3.1 million (reflecting the heavy reliance on unimproved sources and
the calculation of a discounted value over the 40-year time horizon for the economic
analysis of the scenarios). These figures decrease to $1.1 million for the medium and
high scenarios, as households are switched to improved sources. The net result is
that the water use scenarios result in a loss of ecosystem direct use value, rising to
$2.0 million for the medium and high use scenarios, merely due to the switch in water
supply source. As documented later these losses are balanced by the net benefits of
moving households to improved sources.
39
TDA River Basin Economic Valuation
Table 15: Ecosystem Direct Use Values, Changes due to Shift in Water Supply
Sources, Botswana
Discount Rates
(all figures US$ milliions)
8%
4%
Ecosystem Direct Use Values
Reference Case
$3.1
$5.7
Low
$2.3
$4.0
Medium
$1.1
$1.7
High
$1.1
$1.7
Change in Values from Reference
Case
Low
($0.83)
($1.72)
Medium
($2.04)
($4.04)
High
($2.04)
($4.04)
Notes: Numbers in parentheses are negative values
The possible impacts of reductions in flow and water quality on unimproved domestic
water supply was not explicitly included in the IFA analysis. Below a brief attempt is
made to use the IFA analysis to assess the case that the water withdrawal
alternatives would affect the ecosystem direct use values of domestic water supply,
and then to simulate what these impacts might be in quantitative terms.
The first point to emphasize is that the decreasing reliance on unimproved domestic
water supply sources will tend to limit the significance of any degradation of these
ecosystem direct use values. With a maximum loss of value of $2 million under the
low withdrawal alternative, such degradation may have an important and localized
impact on human health, but would be of minor consequence in the overall economic
analysis of the IFA scenarios, where changes in values are on the order of hundreds
of millions, if not billions, of US dollars.
Changes in flow amounts and timing due to upstream changes in water use under
the water withdrawal alternatives may lead to reductions in flow and water quality,
with consequent negative impacts on households and the economy. A shortage in
flow may lead to a shortage in water availability for collection from the river by the
household for domestic uses. Households then face the choice of doing without (or
with less) water or acquiring it from other, more costly sources. Typically water can
always be purchased from entrepreneurs who abstract water in other locales (or from
boreholes) and bring it by tanker for sale. In the case of boreholes, temporary deficits
in flow are unlikely to cause shortages per se in groundwater. On a seasonal or long-
term basis, flow deficits might result in a lowering of groundwater levels, leading to
shortfalls or necessitating extra expenditure to deepen boreholes.
Reductions in flow may also negatively affect water quality by increasing the
concentration of physical, chemical or biological contaminants. This imposes costs
on households either in the form of treating the water, finding an alternative source
or using the water and suffering from consequent increases in morbidity or mortality.
In the case of the Botswana portion of the Okavango the results of the IFA analysis
suggest the following conclusions with respect to ecosystem direct use values:
40
TDA River Basin Economic Valuation
· while river inflows to Botswana are reduced, water remains available in
the river throughout the year so no absolute shortages are foreseen (King
et al. 2009)
· the reduction in river inflows to Botswana may affect groundwater levels in
the Delta, however, information from the IFA does no provide explicit
information about drops in the water table
· examination of impacts of scenarios on water quality parameters show no
change under all three scenarios for PH and under the low and medium
scenarios for all other variables; but for the high water use scenario show
significant percentage increases for conductivity, temperature, dissolved
oxygen, total nitrogen, phosphorus, chlorophyl and a decrease for
turbidity.
In other words the IFA did not directly examine the issue of impacts on drinking water
collected from streams and rivers. Moreover, the available proxy information
suggests that while there might be some impacts at some times of year from water
quality impacts, it would be hard to derive a quantitative estimate of these losses.
Further, even if these had a significant impact on the direct ecosystem use values for
water these would be quite small relative to those of other ecosystem values (and
indeed the direct costs and benefits of the water supply and sanitation improvements
envisioned). While, reductions in water quality or flow would remain a concern, there
is not a need to include any such adjustment in the alternatives analysis.
Botswana and Angola
Given the difficulty of establishing any clear impact from low flows or degraded water
quality on domestic water supply in the case of Botswana it is not pursued further for
the other countries except to summarize that no severe impacts were expected in
Namibia and that while there might be seasonal issues with water quality and flow
availability in Angola, these are not well enough established to investigate further.
The only point worth making is that in the reference case the reliance on the river in
Angola as a water source would increase considerably, however, the lack of
investment in increasing withdrawals would in effect mean that there is no threat from
further development. In actuality, the threat would come from untreated human
sewage finding its way back into the river. This, is of course, precisely the argument
for moving populations onto improved water supply and sanitation (as explored
further in Step 4).
Under the withdrawal scenarios there are changes in the ecosystem direct use value
attributable to the shift from unimproved to improved sources. The present value of
these changes are summarized for Botswana and Angola in the two tables below.
41
TDA River Basin Economic Valuation
Table 16: Ecosystem Direct Use Values, Changes due to Shift in Water Supply
Sources, Namibia
Discount Rates
(all figures US$ milliions)
8%
4%
Ecosystem Direct Use Values
Reference Case
$8.3
$14.5
Low
$7.9
$13.5
Medium
$3.4
$5.1
High
$3.4
$5.1
Change in Values from Reference
Case
Low
($0.48)
($0.99)
Medium
($4.90)
($9.45)
High
($4.90)
($9.45)
Notes: Numbers in parentheses are negative values
Table 17: Ecosystem Direct Use Values, Changes due to Shift in Water Supply
Sources, Angola
Discount Rates
(all figures US$ milliions)
8%
4%
Ecosystem Direct Use Values
Reference Case
$29.3
$51.9
Low $21.8
$36.4
Medium $14.7
$21.5
High $14.7
$21.5
Change in Values from Reference
Case
Low
($7.54)
($15.52)
Medium
($14.60)
($30.39)
High
($14.60)
($30.39)
Notes: Numbers in parentheses are negative values
5.2.6 Step 4: Net Benefits of Improved Service Levels
Step 2 provides the numbers of people moving on to improved water supply and
sanitation. In order to complete the analysis the per capita costs and benefits off
changing service levels is needed to obtain the total net benefits of undertaking any
one of the alternative. Figures employed by a number of WHO global estimates for
meeting the Millennium Development Goals provide the requisite cost and benefit
estimates (Haller et al. 2007: ; Hutton and Haller 2004: ; Hutton et al. 2007). As with
all the net benefit calculations a conservative and optimistic range of projections for
42
TDA River Basin Economic Valuation
the costs and benefits is employed based on expected variation in the key
parameter values.
The cost data are for African countries and the benefit data are provided for a
number of regions in Africa. Angola is classified in one region and Namibia and
Botswana in another. These benefit levels are based largely on the time savings from
avoiding morbidity and mortality and thus are very sensitive to the value placed on
time. To confront the likelihood that the WHO figures are over-estimates the per
capita benefits from improvements are adjusted downward in a conservative
projection. Shadow water rate adjustments are made to these benefit levels based
on country information provided by Barnes (pers. com. 2009) for unskilled labor at
20% for Angola, 30% for Namibia, and 50% for Botswana. The shadow wage rate in
effect compensates for the potential effect of overstating the value of wage labor,
given the varying degrees of unemployment and underemployment in the countries.
While these reductions are severe and lead to negative net present values under the
conservative projection they are the best that can be done to reflect the possibility
that the WHO numbers may vastly overstate the economic benefits of time savings.
In the case of Namibia withdrawals of 17 and 100 million m3 for the Eastern National
Carrier project are forecasted for the medium and high water withdrawal alternatives
respectively. This project will simply connect water from the Okavango into the
existing NAMWATER network at Grootfontein. The costs of the project are thus the
installation and maintenance of the required diversion and conveyance facilities. The
benefits of the project are simply provision of additional water to the grid which
services households in the major population centers of the country. Rather than
make assumptions about the potential costs of the project the approach taken here is
simply to assume that additional water provided to the system is valued at $0.50/m3
as elaborated above. Cost figures are then chosen that generate 15% (conservative
projection) and 25% (optimistic scenario) rates of return. These are purely
assumptions taken in the interest of the time available for this report and should not
be taken to suggest that the project is, or is not, a beneficial use of economic
resources. Rather the intent was to neutralize the potential impact that the project
would have on the overall basin-wide analysis by assuming a reasonable set of
positive returns to the project.
The parameters employed are provided in the table below. The results are provided
by country in Section
5.5.
43
TDA River Basin Economic Valuation
Table 18: Cost and Benefit Parameter Values for Domestic Water Supply
Value Parameters by Projection Conservative
Optimistic
Investment Cost ($/c/served)
Piped and Sewer
$222
$222
Standpipe
$48
$48
ENC-Medium ($/m3)
$3.80
$2.50
ENC-High ($/m3)
$2.10
$1.10
Maintenance Cost ($/c/served)
Piped and Sewer
$13.88
$13.88
Standpipe
$0.31
$0.31
Benefits ($/c/yr)
Angola
Piped and Sewer
$10.63
$53.17
Standpipe
$2.05
$10.24
Namibia
Piped and Sewer
$24.34
$81.12
Standpipe
$3.40
$11.33
Botswana
Piped and Sewer
$40.56
$81.12
Standpipe
$5.66
$11.33
Notes: c stands for capita or per person
5.3 Hydropower
Currently there are no hydropower schemes in operation in the basin (Table 6). Each
of the water withdrawal scenarios envisions a number of largely run-of-river
hydropower projects as described further in the IFA (Beuster et al. 2009). These
projects and their key parameters are summarized in Table 19). Power capacities
were determined based on flow rate and height. As with the other projects the low
withdrawal alternatives are developed from 2008 to 2013, the medium from 2013 to
2018, and the high from 2018 to 2028. Capacities and generation figures are taken
as end of period figures and are considered to be phased in over the relevant period.
Investment costs, O&M costs and power benefits are the determinants of economic
profitability (see Table 20). With no experience in the basin to pull from, not detailed
feasibility work on each project, and with the site specific nature of any individual
hydropower project industry figures for costs and benefits are employed as likely
parameters for all projects, again employing a conservative and optimistic projection.
The economic profitability of any individual project will depend on the site
characteristics and, thus, the evaluation of alternatives merely provides an indication
of how much net benefits the projects might generate. It is important to note that the
investment costs employed do not include transmission and distribution systems for
the power. Again, any particular site may be close to or far from conveyances and
may serve populations that have or do not have an existing grid. For this reason the
positive nature of economic returns under each of the two projections must be
regarded as an upper bound. Clearly, having site feasibility studies and placing such
project in the context of a power development plan would be ideal to further
investigate the pros and cons of each project. But for the purposes of the basin-wide
analysis the projections illustrate the potential order of magnitude that a set of such
projects might have. The results are provided by country in Section 5.5.
44
TDA River Basin Economic Valuation
Table 19: Hydropower Projects
Table 19.
Power Generation (GWH/yr)
Project
Low Medium High
Qa (m3/s)
Height (m)
Capacity
(MWs)
Angola
Cuvango_HP
8.40
8.30
8.30
4
40
1.37
Liapeca_HP
21.60
21.50
21.50
24
16
3.76
Maculungungu
35.90
35.10
36.00
24
22
5.17
Malobas_HP
2.40
2.20
2.20
3
14
0.41
Mucundi_HP
159.10 148.50
155.50
70
40
27.44
Chamavera_HP
0.00
0.00
38.10
100
6
5.88
Cuito_HP
0.00
40.90
40.90
90
7
6.17
Cutato_HP
0.00
0.00
12.00
6
30
1.76
MPupa_HP
0.00
0.00
33.60
100
5
4.90
Menongue_HP
0.00
0.00
6.60
12
8
0.94
Rapides do Cuelei HP
0.00
0.00
11.50
8
22
1.72
Namibia
Popa Site 2
0.00
0.00
96.70
280
8
20.58
Table 20: Hydropower Cost and Benefit Parameters
Conservative
Optimistic
Price ($per Kwh)
$0.08
$0.10
Investment Cost ($/MW)
$3,000
$2,500
Maintenance Cost (% of IC)
5%
3%
5.4 Irrigation
At present there are just a few irrigation projects that withdraw water from the
Okavango and its tributaries for irrigation. A large number of additional projects were
identified as part of the IFA consultations. These can be classified by location, their
extent in hectares, and the amount of water they are likely to withdraw (see Table 21
and
Table 22). If the full extent of the projects were developed then the extent of irrigation
would go from 3,251 hectares to 352,981 hectares, a 100-fold increase. Water
withdrawals under present conditions are estimated at just less than 50 million m3/yr.
This would increase ten-fold to under 500 million m3 under the low water withdrawal
scenario (by 2013), double again to 1,100 million m3 under the medium withdrawal
alternative (by 2018), and increase another three times to 3,500 million m3/yr under
the high withdrawal alternative (by 2028). As the IFA emphasizes these projects are
not part of an approved development plan, but rather represent the compiling of a
number of possible projects for the purpose of examining the impacts of changes to
45
TDA River Basin Economic Valuation
the flow regime on the social, economic and environmental conditions and values in
the basin. This, as unlike, the water supply and sanitation projects, and the
hydropower projects, large-scale development of the water resource for irrigation is
at a scale that is significant relevant to the total overall basin yield. At peak
development, the irrigation projects schemes listed here would withdraw 38% of
mean annual volume for the basin of 9,209 million m3/yr.
Table 21: Irrigation Projects, Area
Table 21.
Project Name
Area Irrigated (Has)
Present Day
Low (2013)
Medium (2018)
High (2028)
Angola
Missombo
1,000
1,000
1,000
1,000
Kahenge
300
700
900
900
Cuchi
15,000
150,000
150,000
Ebritex
17,000
17,000
17,000
Menongue
10,000
10,000
10,000
Cuvango
-
10,000
10,000
Longa
-
10,000
10,000
Calai Dirico
-
-
35,000
Calais Dirico B
-
-
60,000
Cuangar Calai
-
-
45,000
Namibia
Mukwe
560
560
560
560
Ndiyona
870
1,270
1,270
1,270
Rundu Mashare
521
551
551
551
Mukwe Future
-
4,000
10,600
Rundu Future
-
1,100
1,100
Totals
3,251 46,081
206,381
352,981
46
TDA River Basin Economic Valuation
Table 22: Irrigation Projects, Water Withdrawals
Table 22.
Project Name
Water Withdrawn (million m3)
Present Day Low (2013)
Medium (2018)
High (2028)
Angola
Missombo
12.96 11.12
11.12 11.11
Kahenge
4.50 10.50
13.50 13.50
Cuchi
0.00 109.59
554.41 1020.34
Ebritex
0.00 189.06
188.99 188.82
Menongue
0.00 111.21
111.17 111.07
Cuvango
0.00 0.00
74.42 74.42
Longa
0.00 0.00
63.40 63.40
Calai Dirico
0.00 0.00
0.00 453.20
Calais Dirico B
0.00 0.00
0.00 776.91
Cuangar Calai
0.00 0.00
0.00 583.20
Namibia
Mukwe
8.34 8.34
8.34 8.34
Ndiyona
13.05 19.05
19.05 19.05
Rundu Mashare
7.82 8.27
8.27 8.27
Mukwe Future
0.00 0.00
60.00 157.78
Rundu Future
0.00 0.00
16.50 16.50
Totals
46.67 467.14
1,129.17 3,505.91
Assessing the costs and benefits of these developments is fraught with the same
difficulties in terms of site specific assessment - expressed above for water supply
and sanitation, and hydropower projects. As with hydropower projects, irrigation
projects are prone to considerable potential variability in economic returns. With
hydropower the upside potential is, however, more considerable. Large irrigation
projects built in areas remote from major markets do not have this upside potential as
they will typically end up producing food for local markets. Basic grains and
foodstuffs tend to be the least profitable crops, in part because they are not as
perishable as high value fruits and vegetables, and are well-commodified. Instead,
irrigation projects have considerable downside potential, particularly if the works
involved prove expensive compared to the net value of crops produced, or if large
works (particularly dams) are built and the command area set aside for irrigation is
not developed, or takes much longer than anticipated to development. The World
Commission on Dams report suggests that irrigation projects in developing countries
are particularly vulnerable to these problems, and hence, often produce economic
returns that are far less than expected and that often do not even cover the cost of
capital (WCD 2000).
In order to evaluate the possible direction and magnitude of these returns
conservative and optimistic projections are developed for the projects (see
47
TDA River Basin Economic Valuation
Given the above discussion the parameters employed here do not attempt to rely on
farm models or project appraisal work. Rather in a related FAO-funded venture
data was gathered from the academic and grey literature of economic studies of the
net returns to water employed in irrigated agriculture. The global literature was
reviewed, but with an emphasis on developing countries, and particularly those in
Africa. A total of 52 datapoints suggested an average annual return of $0.24/m3.
However, there is extreme variation between high value and low value crops. In the
sample, nine datapoints for basic grains suggested an average of $0.02/m3, whereas
fourteen studies of high value crops and rice came in at just over $0.30/m3. Breaking
these out by region, lowers these values in the case of Asia and Africa. For Asia,
nine datapoints for a mix of crops averaged $0.15/m3, while seven studies of rice
and other grains came in at $0.07/m3. For Africa, fewer studies were found but
seven studies of mixed crops averaged $0.15/m3. Based on this review a floor of
$0.05/m3 was chosen for the conservative scenario and $0.15 for the optimistic
scenario. In all likelihood, these are high estimates for the full expansion under the
high water use withdrawal alternative.
The investment costs required for construction will vary with size of the project and
distance from the river. Figures cited in EPSMO work and appraisal of recent
projects in Africa were used to establish a range of these costs. An EPSMO
document from Angola suggests these costs will vary from $15,000 to $25,000 per
hectare depending on the type of project, with construction of projects greater than
100 hectares expected to cost $15,000 (EPSMO 2009). A couple of donor project
appraisals in southern Africa suggest costs on the order of $7,000 to $10,000 per
hectare. A range of $10,000/ha to $15,000/ha is used to capture this range. On the
one hand the Angolan numbers seem quite high, but on the other it is typical for
donor projects to understate project costs at appraisal (WCD 2000). The results of
the analysis are presented by country in the next section.
Table 24). The parameters employed are net returns to the agricultural activity and
the investment costs for developing the irrigation schemes. Review of similar projects
in the region suggest that irrigation schemes are conceptualized in terms of two
steps, the first being the construction of the scheme and the second being the
recruitment of farmers to prepare the ground and then conduct annual farming
operations. A quick review of available donor appraisal documents suggests that
farming models are often used to evaluate the potential returns to irrigated
agriculture. The models often indicate reasonable rates of return to the farmers.
Similarly, academic studies of the net value of water in agricultural production
typically show positive returns. These findings are not surprising as farmers would
presumably not engage in irrigated farming if they could not produce net farm income
with the help of the irrigation water.
The difficulty with using the results of farm models is that they assume that farmers
will choose specific crops and will all operate at some pre-specified level of
efficiency. Reality of course does not often run to plan, and irrigation schemes that
fail to reach their full command area and farms that are abandoned are part of the
history of irrigation expansion globally, but certainly in Africa. As referred to above,
ex post (after the fact) evaluation work by major donor agencies shows that actual
returns for irrigation are typically much lower than projected at appraisal (WCD
2000). A further issue is whether the farm models incorporate the associated costs of
the project component in which the irrigation scheme is engineered and built. As, the
irrigation water pricing literature pretty much assumes that the best that can be
hoped is for irrigators to cover project O&M costs, this does not suggest that their are
sizeable returns to cover both capital costs of the works and still provide necessary
returns to the farm operation.
48
TDA River Basin Economic Valuation
Given the above discussion the parameters employed here do not attempt to rely on
farm models or project appraisal work. Rather in a related FAO-funded venture
data was gathered from the academic and grey literature of economic studies of the
net returns to water employed in irrigated agriculture. The global literature was
reviewed, but with an emphasis on developing countries, and particularly those in
Africa. A total of 52 datapoints suggested an average annual return of $0.24/m3.
However, there is extreme variation between high value and low value crops. In the
sample, nine datapoints for basic grains suggested an average of $0.02/m3, whereas
fourteen studies of high value crops and rice came in at just over $0.30/m3. Breaking
these out by region, lowers these values in the case of Asia and Africa. For Asia,
nine datapoints for a mix of crops averaged $0.15/m3, while seven studies of rice
and other grains came in at $0.07/m3. For Africa, fewer studies were found but
seven studies of mixed crops averaged $0.15/m3. Based on this review a floor of
$0.05/m3 was chosen for the conservative scenario and $0.15 for the optimistic
scenario. In all likelihood, these are high estimates for the full expansion under the
high water use withdrawal alternative.
The investment costs required for construction will vary with size of the project and
distance from the river. Figures cited in EPSMO work and appraisal of recent
projects in Africa were used to establish a range of these costs. An EPSMO
document from Angola suggests these costs will vary from $15,000 to $25,000 per
hectare depending on the type of project, with construction of projects greater than
100 hectares expected to cost $15,000 (EPSMO 2009). A couple of donor project
appraisals in southern Africa suggest costs on the order of $7,000 to $10,000 per
hectare. A range of $10,000/ha to $15,000/ha is used to capture this range. On the
one hand the Angolan numbers seem quite high, but on the other it is typical for
donor projects to understate project costs at appraisal (WCD 2000). The results of
the analysis are presented by country in the next section.
Table 23: Irrigation Project Cost and Benefit Parameters
Table 24. Irrigation Project Cost and Benefit Parameters
Conservative
Optimistic
Net Operating Benefits ($/m3)
$0.05
$0.15
Investment Cost ($/ha)
$15,000
$10,000
49
TDA River Basin Economic Valuation
5.5 Summary of Economic Results
5.5.1 The Trade-off Analysis
The information and analyses explained in the prior section were then used to
evaluate the potential economic consequences of future water withdrawals in the
Basin under the different alternatives for water withdrawals. A summary of the
parameters, data and assumptions is provide in This involved setting off the potential
economic net benefits of increased water withdrawals for municipal and domestic
water supply, hydropower and irrigation with the net change in economic benefits
that results from the response to flow changes of ecosystem goods and services.
In this fashion the economic tradeoffs for each country of different levels of water
withdrawals are made explicit. This is a preliminary analysis given the rudimentary
information available on many of the water resource projects involved. Further work
at the level of individual projects would provide a better basis for actually choosing
beneficial projects to include in alternatives for water development and use. In order
to cope with this limitation, conservative and optimistic projections regarding the
economic profitability of water in each of the three levels of water withdrawals were
employed based on literature review and secondary sources.
In the tradeoff analysis, the existing natural resource and tourism benefits garnered
from the basin are denoted as ecosystem goods and services and the water supply
and sanitation, irrigation and hydropower values are grouped as water resource
developments.
50
TDA River Basin Economic Valuation
Box 1. Summary of Macroeconomic Parameters and Assumptions
The analysis builds on where the IFA scenarios left off and develops an
integrated set of costs and benefits over 40 years, as follows:
· the expected changes in direct economic contributions of natural resources
in the Basin found in the IFA analysis are used to project future streams of
costs and benefits over 40 years for different water withdrawal alternatives
· data from each country on population, population growth and existing
sources of domestic water supply are used to develop low, medium and
high intervention levels that reflect progressive
· implementation of improved water supply and sanitation (as opposed to
the use of raw water from the river and boreholes).
· data from the IFA analysis on hydropower and irrigation projects is used to
develop low, medium and high levels of infrastructure development for
power production irrigation; existing sources of water supply are derived
from available data and incremental improvements to water supply and
sanitation are projected for low, medium and high levels of infrastructure
development.
· the resulting low water withdrawal alternative assumes a limited set of
developments that are completed in the first five years (i.e. by 2013); the
medium water withdrawal alternative includes a more aggressive
development schedule that includes additional projects that are
implemented over the next five years (to 2018); and the high water
withdrawal alternative includes a further set of projects implemented over
the next 10 years (to 2028); in years 20 40, projects are maintained but
no increase in population or projects is assumed
· benefit and costs were based on literature and project data from the region
(and elsewhere as necessary) choosing conservative and optimistic
projections for economic profitability as follows: (a) irrigation - net operating
income of $0.05 to $0.015/m3 for irrigation water and investment cost of
$15,000 to $10,000/ha, (b) hydropower revenue at $0.08 to $0.10/KwH,
investment cost at $3,000 to $2,500/MW, and O&M costs at 5% to 3% of
investment costs, (c) water supply and sanitation benefits and costs for
improvements are based on WHO studies.
· the streams of costs and benefits are discounted at 8% to arrive at present
values for each sector by country (with 4% used for a low discount rate
sensitivity analysis
51
TDA River Basin Economic Valuation
5.5.2 Angola
For Angola, the analysis suggests the following outcomes:
Under the conservative projection, large and increasing economic losses of from
$250 to $1,600 million are generated by the water resource developments.
Hydropower generates increasing but modest net benefits of $60 to $100 million, and
water supply and sanitation imposes net costs on the economy of from $5 to $85
million as the level of improved access is increased. Irrigation is a major drain on the
economy posting $300 million in losses for the low water withdrawal alternative,
growing to $1.6 billion under the high water withdrawal alternative. The conservative
projection demonstrates the risk of investing in costly irrigation infrastructure a
likely prospect in an area remote from major markets and with poor soils.
Under the optimistic projection, water supply and sanitation generate increasing net
economic benefits from low to high alternatives (in the $10 to $85 million range); the
net benefits of hydropower double in value and irrigation benefits generate positive
ranging from $300 million to $950 million, with the exception of the medium water
withdrawal alternative where the large Cuchi scheme (at 150,000 has) reaches only
half its proposed command area. Such failures to complete very large irrigation
schemes, leaving stranded infrastructure costs are often observed. In this case under
the medium water withdrawal alternative net benefits of just $38 million are
generated on the back of $1.2 billion in investment.
The impacts of water withdrawal on Angolans reliant on the river for ecosystem
goods and services is on the order of a loss of $30 to $50 million, reflecting the
relatively small change in ecosystem function expected for upstream inhabitants of
the basin (compared to that lower in the basin)
Investment costs for the water resource development projects can be expected to
range widely from one alternative to the next (and with the projections), with
investment costs for the low water withdrawal alternative of from $400 to $600 million
and for the high withdrawal alternative from $1.7 to $2.6 billion.
52
TDA River Basin Economic Valuation
Figure 5-1: Macro-economic trade-offs for different water withdrawals according to quantity
of water diverted for Angola1
a) Conservative projection
Figure 5- 1
Notes: Given that the analysis envisions further development that subsequently cause losses of
ecosystem goods and services, the figures included for each country show the benefits of further
development as the line extending above the x-axis, while the losses of ecosystem values are portrayed
as costs, i.e. below the x-axis.
53
TDA River Basin Economic Valuation
b) Optimistic projection
For Angola, the net benefits vary considerably by level of water withdrawal. Under
the conservative projection net losses to the economy of $290 million for the low
water withdrawal alternative are far exceeded for the medium and high alternatives at
$1.4 and $1.6 billion respectively. The net losses are cut in half for the low alternative
under the sensitivity analysis, but for the medium and high alternatives little change
is noted in the large losses.
Under optimistic assumptions the picture improves substantially with net benefits
ranging from $184 million to $1.2 billion. Prospects for economic returns from large
areas devoted to irrigation are the principal drivers behind the differences for Angola
between the conservative and optimistic projections. Employing the lower discount
rate drastically increases these net benefits due to the large up front investment
costs and the sizeable returns through year 40 of the analysis.
As the Angolan loss in ecosystem goods and services varies only slightly (around
$10 million), between the levels of water withdrawal, the net benefits of water
development would drive the choice of alternative projects. The wide range of
potential benefits from the water developments highlights the importance of studying
these projects more closely, as the economic risk of the proposed irrigation is
significant.
5.5.3 Namibia
For Namibia, the analysis suggests the following outcomes:
Under the conservative projection, Namibia sees positive net benefits under the
medium and high levels of water withdrawal for water supply and sanitation, with just
minor losses and gains for the limited hydropower and irrigation efforts overall the
54
TDA River Basin Economic Valuation
water developments provide little economic return under the low level of water
withdrawal, growing to $60 million under the high level.
Under the optimistic projection, Namibia benefits even more greatly from
improvements in water supply and sanitation up to $230 million under the high level
of water withdrawal, with hydropower and irrigation net benefits ranging from $6 to
$90 million depending on the alternative.
The impacts of water withdrawal on the Namibian economy is considerable,
particularly in terms of the loss of tourism revenues losses of from $150 million to
$190 million accrue as levels of water withdrawal proceed from low to high.
Investment costs for the water resource development projects will range widely from
one alternative to the next, with maximum investment costs for low water withdrawal
development of just $5 million and for the high withdrawal alternative up to $300
million (a large part of which would be associated with the ENC project).
Figure 5-2: Macro-economic trade-offs for different water withdrawals according to
quantity of water diverted fro Namibia
a) Conservative projection
Figure 5- 2
55
TDA River Basin Economic Valuation
b) Optimistic projection
Totaling up gains and losses, under the conservative projection all the alternatives
generate large economic losses for the Namibian economy, of the order of $125
million to $175 million. The only bright spot are the water supply and sanitation
benefits.
Under the low discount sensitivity analysis the water supply benefits and ecosystem
losses increase significantly from the low to high levels, exaggerating the net losses
under the low and medium levels of water withdrawal and exaggerating the positive
water supply and sanitation returns under the high withdrawal alternative leading
this alternative to be break even at the 4% discount rate.
Under the optimistic projection net benefits remain negative under the low (-$150
million) and medium (-$60 million) alternatives, but positive returns for the country's
economy are seen for high withdrawal levels (from $150 with the 8% discount rate to
$530 million, with the lower rate).
Practically all the positive sectoral benefits in Namibia come from the water supply
and sanitation, which is a negligible factor in causing the large ecosystem losses.
Other things being equal, the optimal choice for Namibia would be to avoid the
ecosystem losses and economic risks associated with major water withdrawals for
irrigation, but move forward with improvements in water supply and sanitation.
5.5.4 Botswana
For Botswana, the alternatives analysis suggest the following outcomes
Under both conservative and optimistic projections Botswana sees positive net
benefits from water supply and sanitation, implementation of the low water
withdrawal alternative generates net benefits of the order of a few million dollars,
while providing improved water supply and sanitation for all under the high water
56
TDA River Basin Economic Valuation
withdrawal alternative generates up to $55 million in net benefits (under the optimistic
projection)
Ecosystem losses due to changes in harvesting and use of natural resources is of
the order of $4 to $8 million, while losses from a precipitous decline in tourism
revenues generates $500 million in losses under low water withdrawal on up to over
$1,150 million in losses under the medium and high levels of water withdrawal.
Under the low discount sensitivity analysis, the water supply and sanitation net
benefits and the ecosystem losses practically double in size exaggerating the net
losses under all water withdrawal alternatives
Investment costs in the case of Botswana are limited to that of water supply and
sanitation and vary from a million dollars through $25 million depending on the level
of improvements and the population served.
For Botswana, then, the impacts of all three levels of water withdrawal is hugely
negative, from a loss of $500 million for the low water withdrawal to a loss of the
order of $1,150 for the medium and high water withdrawal. Botswana would clearly
be better off without the upstream development of irrigation, which the IFA analysis
shows will have devastating impacts on tourism in the Delta and the Delta economy.
Figure 5-3: Macro-economic trade-offs for different water withdrawals according to
quantity of water diverted for Botswana
a) Conservative projection
Figure 5- 3
57
TDA River Basin Economic Valuation
b) Optimistic Projection
5.5.5 A Basin Perspective
The analysis above suggests that the potential large ecosystem losses faced by the
downstream riparian countries are from $700 million for the low levels of water
withdrawal through $1.4 billion for the medium and high water withdrawal levels.
Under conservative assumptions regarding the profitability of irrigated agriculture
these losses may double in size under the large expansion of irrigated area expected
under the medium and high water withdrawal alternatives. Under optimistic
assumptions the net returns remain negative under the low (-$260 million) and
medium (-$1 billion) alternatives. Only, with the full implementation of the large Cuchi
irrigation scheme do net returns generate positive returns (of $215 million) under the
optimistic projection. However 60% of the positive returns under this alternative come
from water supply and sanitation, and hydropower. Measured in terms of net benefits
to irrigation and the resulting ecosystem losses from the large increase in water
consumed, the net impact of irrigation may be a loss of half a billion dollars to the
basin. These results occur prior to taking into account any willingness to pay for the
continued existence of the Okavango Delta as a Ramsar Site.
Figure 5-4: Macro-economic trade-offs for different water withdrawal alternatives from a
Basin Perspective
58
TDA River Basin Economic Valuation
a) Conservative Projection (by water withdrawal)
Figure 5- 4
b) Optimistic Projection (by water withdrawal)
59
TDA River Basin Economic Valuation
b) Optimistic Projection (by investment costs)
60
TDA River Basin Economic Valuation
In sum, prospective water withdrawals generate an order of magnitude of economic
losses and risk such that they overwhelm the potential benefits of the full suite of
water resource developments as implemented across all three countries.. From a
basin-wide perspective then, caution and further study is called for before proceeding
with the alternative projects given that these developments might not produce
"optimistic" results (collectively or individually) and given the now-documented risk
that such developments might result in substantial economic loss of ecosystem
goods and services.
Despite the overall note of caution, the analysis above does clarify a few key findings
that should be considered in future development planning:
· the provision of improved water supply and sanitation requires
relatively small amounts of water to be extracted from the system and
therefore may be judged and promoted based on its contribution to
human well-being and socio-economic development (and not linked to
the loss of ecosystem goods and services) within the scope of national
development plans and budgets
· the hydropower schemes considered here are run of river schemes
and will also not have a significant impact on downstream ecosystems
and, therefore, may be considered purely within the context of the
planned development of the Angolan and Namibian power sector plans
(and not linked to the loss of ecosystem goods and services).
Sediment discharge through such schemes would be a major issue to
be resolved.
· the cumulative impact of the irrigation schemes suggested under the
medium and high levels of water withdrawal generate the vast majority
of the economic losses in terms of ecosystem goods and services. For
this reason it may be best to contemplate only limited development of
economically sound irrigation projects while simultaneously exploring
further development of realistic alternative sources of income
generation that have low water withdrawals such as wildlife and
tourism
The next step in planning is to consider how the existing water economy one
producing important ecosystem goods and services can work to ensure its
continued existence. That the most promising future economic path for the basin is
one of low water withdrawal does not resolve the current asymmetry in levels of
development and economic opportunity between riparian countries. One potential
tool in this regard would be to leverage the considerable international goodwill that
would be generated by assuring the protection of the Okavango Delta as a
functioning (if not pristine) wetland of international importance under the Ramsar
Convention. While not explicitly covered in the analysis above, studies have shown
significant willingness to pay on behalf of the international (and local) community for
the conservation of unique ecosystems, including wetlands. Arguably, the Okavango
Delta is not just a jewel of the Kalahari but a gem of great value to people around the
world.
5.5.6 Comparing sustainable development, stagnation and
high water withdrawal paths
The alternatives considered above, assume a continued progress of economic
development. However, under an economic stagnation scenario, such as may be
envisaged with continued global recession, populations in the basin continue to grow
61
TDA River Basin Economic Valuation
but investment resources to pursue low water withdrawal developments that raise
social and economic development levels are limited. The end result is that no
improvements in domestic water supply, hydropower or irrigation are made. As
populations are projected to continue growing this leaves increasing numbers of
people in the basin without access to improved water supply; and the basin will have
to import or find alternative sources of food and electric power to underpin basin
development.
This situation compares poorly with indicators derived from the high levels of water
withdrawal.
Presents extent of water developments through 2028. In the high water withdrawal
alternative substantial gains are made in these indicators, particularly in Angola and
Namibia. For example, new hydropower projects in these two countries could supply
up to 2.4 million Angolans and 62,000 Namibians with electric power (at current
national average consumption levels). If projections for 2028 were made at current
national average consumption levels for South Africa (considerably higher than
current levels in the basin) these hydropower projects would produce enough power
for 100,000 people or 7% of the basin's expected population in 2028. The large
extent of irrigation development contemplated under the high water withdrawal
alternative would likewise greatly improve food production in Angola and Namibia.
For low meat diets (roughly approximating consumption levels for sub-Saharan
Africa) these irrigation schemes would make Angolan and Namibian portions of the
basin self-sustaining in caloric terms. Even if the proportion of meat shifted by 2028
to reflect higher meat diets, these projects might greatly increase food self-
sufficiency. Again, these projections are limited by significant assumptions about the
uptake and profitability of these schemes. If they do not perform well, these benefits
would be greatly reduced.
The stagnation and high water withdrawal alternatives may also be compared to a
sustainable development alternative. Under this alternative the linkages between
water withdrawal and the triple bottom line is recognized and a more discerning,
moderate level of water withdrawal is pursued. In this case, the medium water
withdrawal alternative for domestic water supply and hydropower is combined with
the low water withdrawal alternative for irrigation. The results suggest that significant
gains in social and economic development can occur in the basin without the need to
put the Okavango Delta and the Namibian and Botswana basin economies at risk.
Under the sustainable development alternative some 82% of the population receives
access to improved water supply as compared to 13% under a stagnation scenario
(Table 27). The difference between the two scenarios would simply be that a much
larger proportion would be on the less expensive community standpipe systems
which in turn would lead to lower water withdrawals (40% less in fact).
With the sustainable development alternative, less hydropower and irrigated food
would be produced in Namibia and Angola, however the tradeoff would be the
maintenance of the sizeable wildlife tourism economies in Namibia and Botswana.
Hydropower production would be constrained but still provide Angolans with twice
the national average consumption (down from almost three times under the high
water withdrawal alternative). If per capita consumption levels are assumed for the
basin in 2028 that match today's consumption levels for South Africa the percent of
basin consumption supplied under these two alternatives are 7% (high withdrawal)
and 4% (sustainable development) respectively. In other words, even under the high
water withdrawal alternative the amount of power provided from the river is fairly
limited in absolute terms.
62
TDA River Basin Economic Valuation
It is with respect to food production that the two alternatives show the most
difference. Using the low meat consumption figures, moving to the sustainable
development alternative lowers the percent of basin food requirements provided by
irrigation from 400% to 53%. While this is a large drop it still indicates that with only
limited irrigation expansion (and limited water withdrawal) irrigation can provide
almost half of basin requirements. This is a significant improvement over the status
quo where irrigation meets only 5% of the need. Obviously, rain-fed agriculture and
imports to the basin provide the bulk of current food supply and would maintain an
important role under a sustainable development alternative..
63
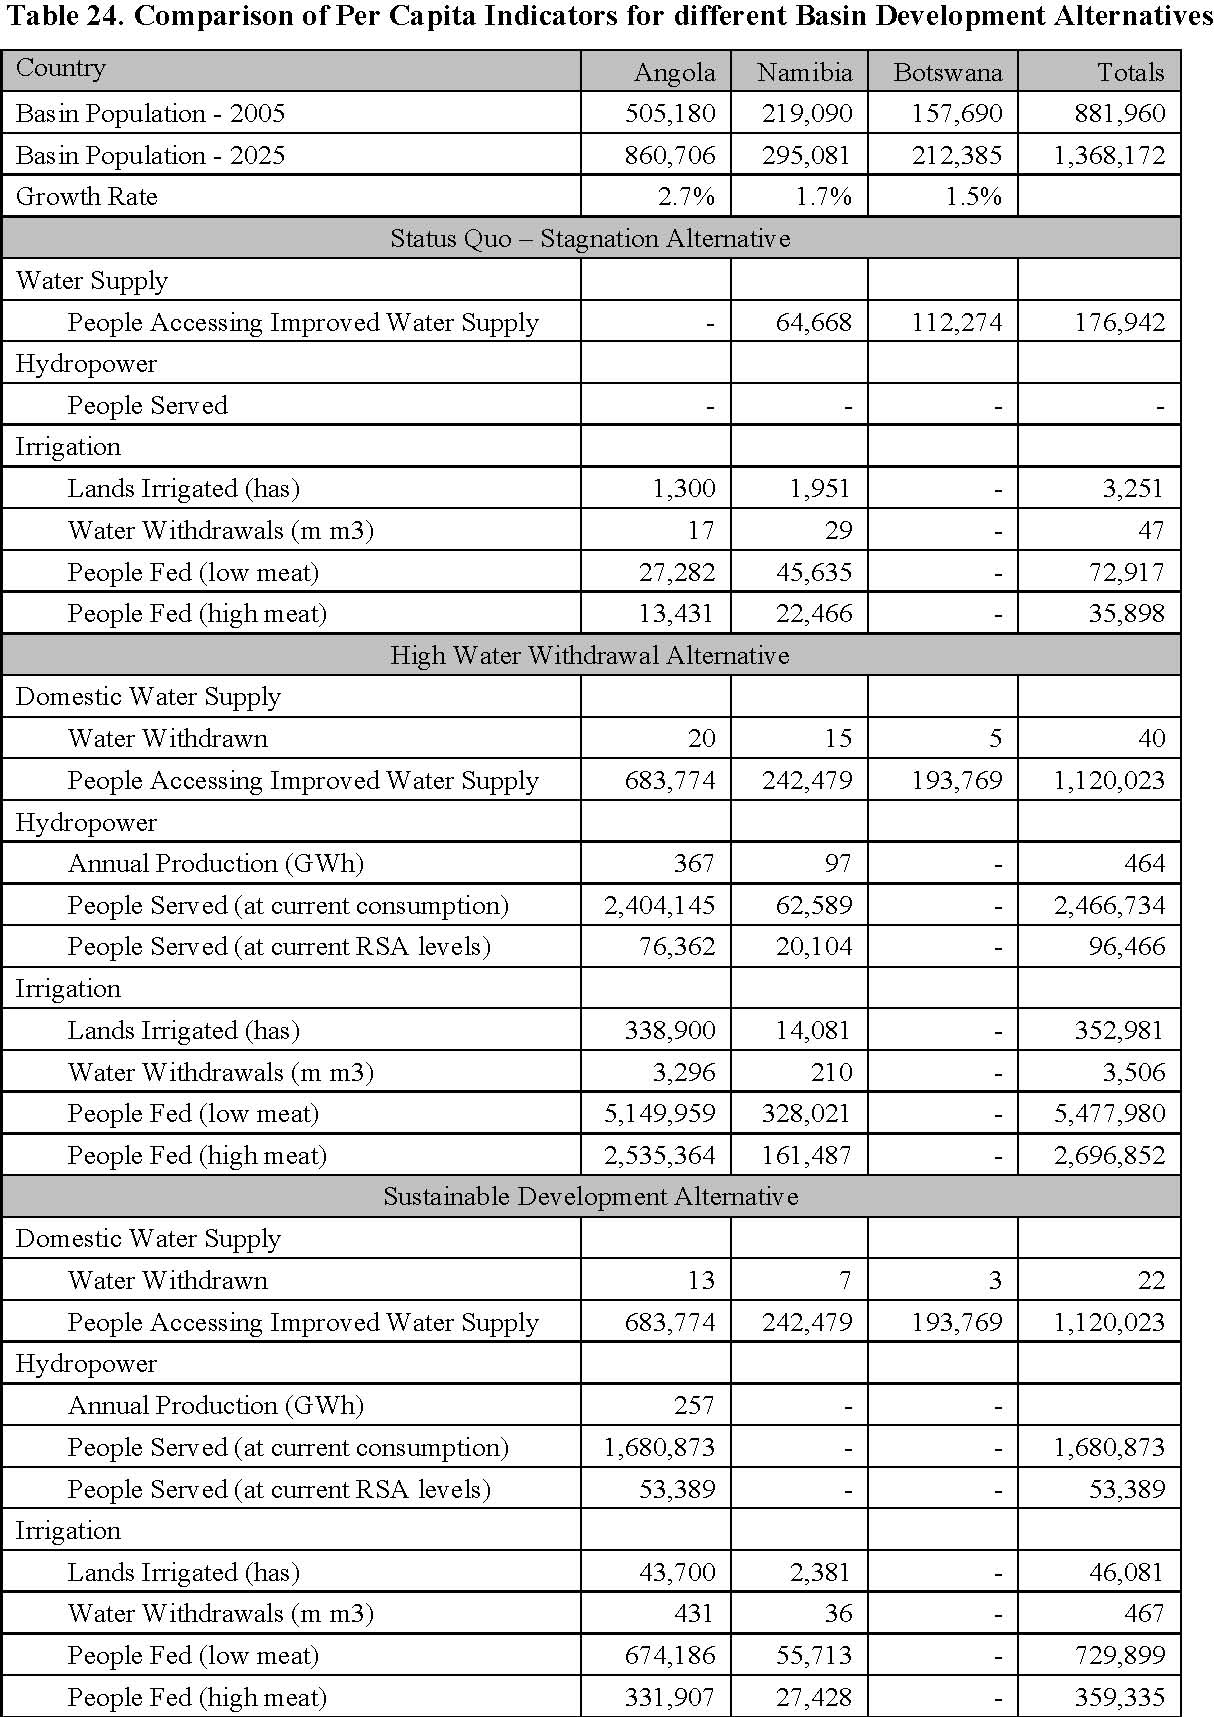
TDA River Basin Economic Valuation
Table 24: Comparison of Per Capita Indicators for Different Basin Development
Alternatives
Note: People served with electric power is based on national averages, with Namibia and
Botswana at 10 times the Angolan level and RSA (South Africa) at 3 times the Namibian and
Botswana levels.
64
TDA River Basin Economic Valuation
Table 25: Percentage of the population served under different Basin Development
Alternatives
Population Served (as percent of total
population)
Country
Angola
Namibia
Botswana
Totals
Satus Quo - Stagnation
Improved Domestic 0%
22%
53%
13%
Water Supply
Hydropower -
0%
0%
0%
0%
Electric Power
Irrigation - Food
3%
15%
0%
5%
Production (low
meat)
Irrigation - Food
2%
8%
0%
3%
Production (high
meat)
High Water Withdrawal Alternative
Improved Domestic 79%
82%
91%
82%
Water Supply
Hydropower -
279%
21%
0%
180%
Electric Power
(current levels)
Hydropower -
9%
7%
0%
7%
Electric Power
(RSA levels)
Irrigation - Food
598%
111%
0%
400%
Production (low
meat)
Irrigation - Food
295%
55%
0%
197%
Production (high
meat)
Sustainable Development Alternative
Improved Domestic 79%
82%
91%
82%
Water Supply
Hydropower -
195%
0%
0%
123%
Electric Power
(current levels)
Hydropower -
6%
0%
0%
4%
Electric Power
(RSA levels)
Irrigation - Food
78%
19%
0%
53%
Production (low
meat)
Irrigation - Food
39%
9%
0%
26%
Production (high
meat)
65
TDA River Basin Economic Valuation
6. Investment in the Presence of Uncertainty, Irreversibility
and Choice of Timing
6.1 Analytical Framework
While the development of water resources can be positive for a country's socio-
economic development it is important to heed the advice of the World Commission
on Dams (see Box 1) and other major assessments that suggest caution and
forethought before moving forward with such developments given the potential of
failing to realize hoped for economic benefits and incurring negative social and
environmental impacts.
It is therefore useful to create an overarching framework into which the information
about the alternatives for water resource development can be placed for comparison
and evaluation. As experienced in the evaluation above, information on the economic
costs and benefits of these options will be partial in nature due to a lack of data on
some values and the imprecise nature of some of the estimated impacts that can be
provided. As an example, the understanding of the relationship between changes in
flow timing and volume, and ecosystem net benefits can only be approximately
judged and is anyway based on alternatives that consist of large intervals in water
use. While these serve the purposes of broadly illustrating the economic choices that
confront the riparian countries over the long-term for the purposes of the TDA, they
may not be wholly satisfactory as the basin continues to grapple with how it should
develop.
In other words, the quantitative assessment will be useful in providing what
information there is on the economic costs and benefits but will leave a number of
questions unanswered. One way to address this problem is to take this information
and incorporate it into a more qualitative analysis that directly addresses the
uncertainties in the data and the missing information. In standard economic cost-
benefit analysis sensitivity and risk analysis can be used to determine how the
results of a project analysis respond to a number of key variables. While this is useful
it remains reliant on the quantitative estimates, and therefore cannot really move
much beyond the data limitations, particularly when these are significant.
For this reason a second, qualitative, framework could be applied to the information
generated in the course of conducting the quantitative analysis. Beyond standard
project appraisal methods there exists a more robust consideration of the investment
environment, an environment that includes not only uncertainty, but the potential
irreversibility of financial investment and its consequences (e.g. social and
environmental impacts). Further, real world decisions are not "now or never" but
involve a choice of timing of investment. Dixit and Pindyck (1994) provide an
innovative and comprehensive application of the use of modern options theory to
investment decisions involving issues of uncertainty, irreversibility and timing. The
intent of the remainder of this section is to reiterate the general theory and
arguments advanced by these authors and indicate the potential relevance of the
theory and methods to water resources development as first laid out in the
Economics Thematic of the World Commission on Dams (Aylward et al. 2001). So
first material from Aylward et al. (2001) is repeated below to lay out the theoretical
framework and then a rough sketch of how the approach could be applied to the
Okavango case is provided. Bear in mind that the reference to NPV (or net present
value) is roughly equal to the metric of net value added employed above for the
quantitative analysis. The latter is more relevant to calculations of national income
66
TDA River Basin Economic Valuation
but is effectively the same as NPV as it emerges from microeconomic project
analysis.
6.2 The Theory and Argument: The Incompleteness of CBA in
the Presence of Uncertainty, Irreversibility and Choice of
Timing
According to conventional theory and practice, a positive expected net present value
(NPV) returned by economic or financial CBA tells the investor to go ahead with an
investment. Dixit and Pindyck (1994) describe two hidden assumptions that underpin
this approach. The NPV rule assumes that one of two cases apply. In the first case,
the investment is reversible insofar as the investor can exit from the investment and
recover the expenditure if the future (i.e. market conditions) turns out worse than
expected. In the second case, the NPV rule assumes that if the investment is
irreversible that there is no choice of timing, i.e. the investment is a "now or never"
proposition. Not only do most investment decisions of course not fulfil either of these
assumptions, but irreversibility and the possibility of postponing investment are very
important characteristics of investments faced by firms and by society.
As indicated above the "simple" net present value rule does not account for the ability
to delay an irreversible investment. The value of delaying investment is equivalent to
holding an "option" to invest the right but not the obligation to invest and, thus,
can be called an option value (analogous to a financial call option). When an
irreversible investment is made the investor exercises the option, or, in so many
words "kills" the option. At this point the investor has effectively given up the
opportunity to wait for additional information, i.e. to reduce the uncertainty over the
present worth or timing of the expenditure. The central point made by Dixit and
Pindyck (1994) is that the decision to go ahead with the investment implies the loss
of this option value. This is an opportunity cost of the decision to proceed with the
project that standard CBA does not count. Thus the NPV rule needs to be reworked
so that the decision to invest is taken only when the benefits of the investment
exceed the standard costs of investment plus the value of keeping the option alive.
Dixit and Pindyck (1994) suggest that the opportunity cost represented by the value
of an option to invest will be very sensitive to uncertainties, such as the risk and
uncertainty of realizing future cash flows. Given that the growing literature on these
options values shows that they can "profoundly affect" the decision to invest, they
argue that these uncertainties may therefore be better at explaining variation in
investment behavior than variables such as interest rates. They also find that this
may explain the large gap between private sector "hurdle rates" and the cost of
riskless capital thus explaining why firms tend not to invest until prices are well over
long-run average costs (as conventionally measured) and why they do not exit
immediately upon prices falling under this level. Instead, there is an area of
profitability the upper and lower threshold of which must be exceeded for entry and
exit, respectively, to occur. This phenomenon, whereby investment decisions fail to
reverse themselves when the underlying causes are fully reversed is called
economic hysteresis (Dixit and Pindyck 1994).
Dixit and Pindyck (1994) suggest that this advance in thinking undermines the
theoretical foundation of standard neoclassical investment models. The authors,
however, do not seek to overturn the analysis of costs and benefits of a decision, but
rather to expand the notion of costs and benefits to include the option value
67
TDA River Basin Economic Valuation
associated with uncertainty and irreversibility. In other words this is another case of
standard CBA omitting another type of value. Indeed, there is a somewhat parallel
stream of thought in the environmental economics literature which posits the
existence of a "quasi-option value" that is associated with the irreversible decision to
develop an environmental resource under uncertainty. The general methodological
implications of this are as follows:
. . . the implication, however is not the overthrow of marginal analysis. Just
because and action is irreversible does not mean that it should not be
undertaken. Rather, the effect of irreversibility is to reduce the benefits, which
are then balanced against costs in the usual way . . . the point is that the
expected benefits of an irreversible decision should be adjusted to reflect the
loss of options it entails (Arrow and Fisher 1974: 319).
In terms of the application of these ideas it should be clear that they are not only
useful in evaluating a particular investment but in comparing alternative investments
or, more simply, alternative courses of action. Clearly, the characteristics of a given
alternative in terms of its flexibility of timing, its degree of reversibility and its level of
uncertainty will affect the option value associated with the decision to invest or not at
the present time.
Both types of literature the financial investment literature and the environmental
economics literature on quasi-option value emphasize the dynamic nature of
uncertainty and information. For the purposes of valuation it is not simply the degree
of uncertainty that is important but how it will change over time. Other things equal
the more uncertainty associated with an alternative, the more it will pay to postpone
the decision. However, if uncertainty is unlikely to be resolved over the relevant
decision period then this will also affect the value of the option. In the case of a
financial option one of the determinants of the value of the option is the expected
volatility of the price of the underlying asset (such as a stock). If there will be no
"news" that will affect the stock price during the option period then there is, implicitly,
no expected volatility and the value of the option will be zero. Thus, if there is no
additional information expected over the relevant period about the timing of the
decision that will "reduce" the uncertainty then the value of postponing the decision
over that period will be marginal. On the other hand, the theory suggests that where
additional information will become available as to the profitability of the intended
course of action, the most economically sound strategy may be to "wait and see."
6.3 Application to Water Resource Development
The fairly obvious first point to make regarding how relevant these ideas are to water
resources development is that large infrastructure projects such as dams, irrigation
schemes, hydropower projects and water supply and sanitation systems, are a case
of an irreversible financial investment. Dixit and Pindyck (1994) indicate that
investment expenditures are sunk costs and hence irreversible when they are
firm or industry specific. In other words, once infrastructure is built it has little value
for alternative uses or in terms of salvage value. For example, as physical structures
and equipment, a large dam that cannot fulfill its purpose will have a very low
salvage value. Further consideration is required in the case of dams that are multi-
purpose or that have the potential for multi-purpose use. A hydroelectric reservoir
built in an area with little to no irrigation potential could be said to be industry specific.
However, in the case of a multi-purpose facility a fall in the price of agricultural prices
leading to a decline in irrigation demand may lead to a switch in water use from
irrigation to power generation. Thus, reversibility must be carefully interpreted with
68
TDA River Basin Economic Valuation
respect to the financial investment in the specific type of infrastructure, but many of
these investments will certainly have strong characteristics of irreversibility in this
regard.
In addition to the infrastructure itself, it should also be clear that there are a series of
social and environmental impacts of construction and operation of water projects that
exhibit irreversibility. For example, in the case of a dam, the negative impacts of
resettlement, flooding of reservoir land, biodiversity and upstream/downstream
ecosystems will be regarded as having irreversible characteristics. An irreversible
decision can be characterized as one that "significantly reduces for a long time the
variety of choices that would be possible in the future" (Henry 1974). Whether the
same statement can be made of the environmental and social benefits generated by
water projects like massive extraction of water for irrigation requires further
consideration. Key questions would be to what extent do the benefits and costs
disappear or persist once the project is removed. Relevant here is that ecosystems
are not easily or quickly regenerated, nor is social cohesion.
With regard to decommissioning of projects it is also worth pointing out that the
implications of the hysteresis argument. Once the irreversible decision is taken and
investment made, the activity may have to fall to a lower than expected profitability
before the investment is abandoned. Here again the option to exit carries with it an
option value that reflects the benefit of waiting. In this case the option to "sell" is
analogous to a put option in financial terms. Decommissioning of a dam, for example,
is irreversible and is characterized by a high degree of uncertainty. The debate over
the likelihood that the decommissioning of the Lower Snake dams (in the US) will
bring back the salmon runs is indicative of this uncertainty. Thus, even if a dam is
unprofitable the operator may wish to wait before exiting the activity as waiting may
provide additional information that resolves uncertainty regarding the future
profitability of the enterprise. In this case then, the option value provides an extra
incentive (above and beyond the standard CBA result) not to exit the activity. The
possibility of being stuck in an unproductive investment may need to be worked into
the decision to invest in the first place. How these issues play out for different types
of water infrastructure projects is unexplored.
So the construction of large water infrastructure projects may involve both a large
financial investment and a significant divestiture of environmental and social assets.
In terms of uncertainty, there are clearly uncertainties and risks associated with the
financial investment as highlighted in previous sections of this paper, but it is
probably fair to say that the uncertainties are significantly larger when it comes to the
social and environmental divestiture. Thus, it is clear that the argument made by Dixit
and Pindyck (1994) warrants further exploration in the case of these projects. It may
therefore be valuable to apply this framework in a qualitative fashion to the
Okavango case. It is expected that such an approach to explicit consideration of the
uncertainties, irreversibilities and timing issues involved will sharpen and quite
possibly greatly expand on the conclusions that are drawn from the quantitative
analysis.
As is stated in Aylward et al (2001):
The application of the theory of investment under uncertainty and irreversibility to
dams, and to water resources development more generally is novel at this stage.
Further investigation is needed to determine the applicability of these ideas to the
project planning and evaluation process. Still, it seems likely that at least the
insertion of a qualitative discussion and analysis of different alternatives in this
regard may be useful at an early stage in the screening and ranking of projects.
69
TDA River Basin Economic Valuation
Indeed, it is possible to argue that stakeholder discussion of different scenarios
for water and energy resources development should include these issues in an
explicit fashion, given that they may have significant bearing on the CBA
outcomes.
In terms of specific areas for further investigation, it would be worth considering the
extent to which, in practice, the passage of time is likely to significantly reduce the
uncertainty about future values of the irreversible investments and divestitures
associated with different options, particularly the environmental and social impacts.
Attention should examine how the costs and benefits of investments may differ in
terms of irreversibility, uncertainty and timing. The objective here would be to see if
the different components of the alternatives under consideration are likely to have the
same characteristics in this regard and, thus, can be bypassed or whether important
differences between alternatives are expected and should be accounted for in the
decision process.
70
TDA River Basin Economic Valuation
References
Anandarup, R. 1984. Cost-Benefit Analysis: Issues and Methodologies. Edited by
W. Bank. Washington DC: The Johns Hopkins University Press.
Arrow, Kenneth J, and Anthony C Fisher. 1974. Environmental Preservation,
Uncertainty, and Irriversibility. Quarterly Journal of Economics 88
(2):312-319.
Asian Development Bank. 1997. Guidelines for the Economic Analysis of
Projects. Manila: Asian Development Bank.
Aylward, Bruce, Jeremy Berkhoff, Colin Green, Pablo Gutman, Anneli Lagman,
Michelle Manion, Anil Markandya, Bruce McKenny, Kyra Naudascher-
Jankowski, Bert Oud, Alec Penman, Sarah Porter, Chaminda Rajapakse,
Douglas Southgate, and Robert Unsworth. 2001. Financial, Economic and
Distributional Analysis. Cape Town: World Commission on Dams.
Barnes, Jon. 1994. Suggested Criteria for Shadow Pricing in Cost-Benefit
Analysis of Projects in Namibia. Windhoek, Namibia: Directorate of
Environmental Affairs, Ministry of Environment and Tourism.
Belli, Pedro, Jock Anderson, Howard Barnum, John Dixon, and Jee-Peng Tan. 1998.
Handbook on Economic Analysis of Investment Operations. Washington, DC:
The World Bank, Operational Core Services Network Learning and
Leadership Center.
Beuster, Hans, K Dikgola, A.N. Hatutale, M. Katjimune, N. Kurugundla, D.
Mazvimavi, P.E. Mendes, G.L. Miguel,
A.C. Mostert, M.G. Quintino, P.n. Shidute, F. Tibe, and P. Wolski. 2009.
Hydrology Report: Data and models. EPSMO-BIOKAVANGO.
Boccalon, Agnese, Emerging Water Needs in the Okavango River Basin: an
Analysis of Shared Water Uses, Report to the Land and Water Division,
FAO, Rome.
EPSMO. 2009. Aspectos da Irrigacao: Na Bacia Hidrografica do Okavango.
Powerpoint presentation.
Dixit, Avinash K., and Robert S. Pindyck. 1994. Investment under Uncertainty.
Princeton: Princeton University Press.
Gittinger, J. Price. 1982. Economic Analysis of Agricultural Projects. Baltimore: Johns
Hopkins University Press.
Haller, Laurence, Guy Hutton, and Jamie Bartram. 2007. Estimating the Costs
and Health Benefits of Water and Sanitation Improvements at Global
Level. Journal of Water and Health 05 (4):467-480.
Henry, Claude. 1974. Investment Decisions Under Uncertainty: The
"Irreversibility Effect". The American Economic Review 64 (6):1006-
1012.
Howard, G. and J. Bartram. 2003. Domestic Water Quantity, Service Level and
Health. Geneva: World Health Organization
Hutton, Guy, and Laurence Haller. 2004. Evaluation of the Costs and
Benefits of Water and Sanitation Improvements at the Global
Level. Geneva: World Health Organization.
Hutton, Guy, Laurence Haller, and Jamie Bartram. 2007. Global Cost-Benefit
Analysis of Water Supply and Sanitation Interventions. Journal of
Water and Health 05 (4):481-502.
71
TDA River Basin Economic Valuation
Jenkins, G.P, and A.C. Harberger. 1989. Manual: Cost Benefit Analysis of
Investment Decisions: Harvard Institute for International Development.
Jenkins, Glenn. 1997. Project Analysis and the World Bank. American Economic
Review 87 (2):38-42.
King, J. M., C. A. Brown, A.R. Joubert, J. Barnes, H. Beuster, and P. Wolski. 2009.
Scenario Report: Ecological and Social Predictions (Volume 1 of 2). EPSMO-
BIOKAVANGO.
Milzow, Christian, Lesego Kgotlhang, Peter Bauer-Gottwein, Philipp Meier, and
Wolfgang Kinzelbach. 2009. Regional Review: the Hydrology of the
Okavango Delta, Botswana - Processes, Data and Modelling.
Hydrogeology Journal Published online: 20 February 2009.
Nashipili, Ndinomwaameni.2009. Specialist Report: Water Supply and
Sanitation, Namibia. Report for the Transboundary Diagnostic
Analysis, Okavango Basin. EPSMO: Luanda.
Saraiva, Ruta and others. 2009. Angolan Socio-economic Analysis. Report for
the Transboundary Diagnostic Analysis, Okavango Basin. EPSMO:
Luanda.
Turpie, Jane, Jon Barnes, Jaap Arntzen, Bertha Nherera, Glenn-Marie Lange,
and Baleseng Buzwani. 2006. Economic Value of the Okavango Delta,
Botswana, and Implications for Management. Cape Town: Anchor
Environmental Consultants.
Vanderpost, Cornelis. 2009. Assessment of Existing Social Services and
Projected Growth in the Context of the Transboundary Diagnostic
Analysis of the Botswana Portion of the Okavango River Basin. Maun:
University of Botswana.
WHO, and UNICEF. 2006. Human Health in Water Development. In Water A
Shared Responsibility, the United Nations World Water Report 2, edited
by UNESCO World Water Assessment Program. Paris and New York:
UNESCO and Berghahn Books.
72
TDA River Basin Economic Valuation
The Okavango River Basin Transboundary Diagnostic Analysis
Technical Reports
In 1994, the three riparian countries of the
a base of available scientific evidence to guide
Okavango River Basin Angola, Botswana
future decision making. The study, created
and Namibia agreed to plan for collaborative
from inputs from multi-disciplinary teams in
management of the natural resources of the
each country, with specialists in hydrology,
Okavango, forming the Permanent Okavango
hydraulics, channel form, water quality,
River Basin Water Commission (OKACOM). In
vegetation, aquatic invertebrates, fish, birds,
2003, with funding from the Global
river-dependent terrestrial wildlife, resource
Environment Facility, OKACOM launched the
economics and socio-cultural issues, was
Environmental Protection and Sustainable
coordinated and managed by a group of
Management of the Okavango River Basin
specialists from the southern African region in
(EPSMO) Project to coordinate development
2008 and 2009.
and to anticipate and address threats to the
river and the associated communities and
The following specialist technical reports were
environment. Implemented by the United
produced as part of this process and form
Nations Development Program and executed
substantive background content for the
by the United Nations Food and Agriculture
Okavango River Basin Transboundary
Organization, the project produced the
Diagnostic Analysis.
Transboundary Diagnostic Analysis to establish
Final Study
Reports integrating findings from all country and background reports, and covering the entire
Reports
basin.
Aylward, B.
Economic Valuation of Basin Resources: Final Report to
EPSMO Project of the UN Food & Agriculture Organization as
an Input to the Okavango River Basin Transboundary
Diagnostic Analysis
Barnes, J. et al.
Okavango River Basin Transboundary Diagnostic Analysis:
Socio-Economic Assessment Final Report
King, J.M. and Brown,
Okavango River Basin Environmental Flow Assessment Project
C.A.
Initiation Report (Report No: 01/2009)
King, J.M. and Brown,
Okavango River Basin Environmental Flow Assessment EFA
C.A.
Process Report (Report No: 02/2009)
King, J.M. and Brown,
Okavango River Basin Environmental Flow Assessment
C.A.
Guidelines for Data Collection, Analysis and Scenario Creation
(Report No: 03/2009)
Bethune,
S.
Mazvimavi,
Okavango River Basin Environmental Flow Assessment
D. and Quintino, M.
Delineation Report (Report No: 04/2009)
Beuster, H.
Okavango River Basin Environmental Flow Assessment
Hydrology Report: Data And Models(Report No: 05/2009)
Beuster,
H. Okavango River Basin Environmental Flow Assessment
Scenario Report : Hydrology (Report No: 06/2009)
Jones, M.J.
The Groundwater Hydrology of The Okavango Basin (FAO
Internal Report, April 2010)
King, J.M. and Brown,
Okavango River Basin Environmental Flow Assessment
C.A.
Scenario Report: Ecological and Social Predictions (Volume 1
of 4)(Report No. 07/2009)
King, J.M. and Brown,
Okavango River Basin Environmental Flow Assessment
C.A.
Scenario Report: Ecological and Social Predictions (Volume 2
of 4: Indicator results) (Report No. 07/2009)
King, J.M. and Brown,
Okavango River Basin Environmental Flow Assessment
C.A.
Scenario Report: Ecological and Social Predictions: Climate
Change Scenarios (Volume 3 of 4) (Report No. 07/2009)
King, J., Brown, C.A.,
Okavango River Basin Environmental Flow Assessment
Joubert, A.R. and
Scenario Report: Biophysical Predictions (Volume 4 of 4:
Barnes, J.
Climate Change Indicator Results) (Report No: 07/2009)
King, J., Brown, C.A.
Okavango River Basin Environmental Flow Assessment Project
and Barnes, J.
Final Report (Report No: 08/2009)
Malzbender, D.
Environmental Protection And Sustainable Management Of The
Okavango River Basin (EPSMO): Governance Review
Vanderpost, C. and
Database and GIS design for an expanded Okavango Basin
Dhliwayo, M.
Information System (OBIS)
73
TDA River Basin Economic Valuation
Veríssimo, Luis
GIS Database for the Environment Protection and Sustainable
Management of the Okavango River Basin Project
Wolski,
P.
Assessment of hydrological effects of climate change in the
Okavango Basin
Country Reports
Angola
Andrade e Sousa,
Análise Diagnóstica Transfronteiriça da Bacia do Rio
Biophysical Series
Helder André de
Okavango: Módulo do Caudal Ambiental: Relatório do
Especialista: País: Angola: Disciplina: Sedimentologia &
Geomorfologia
Gomes, Amândio
Análise Diagnóstica Transfronteiriça da Bacia do Rio
Okavango: Módulo do Caudal Ambiental: Relatório do
Especialista: País: Angola: Disciplina: Vegetaçăo
Gomes,
Amândio
Análise Técnica, Biofísica e Socio-Económica do Lado
Angolano da Bacia Hidrográfica do Rio Cubango: Relatório
Final:Vegetaçăo da Parte Angolana da Bacia Hidrográfica Do
Rio Cubango
Livramento, Filomena
Análise Diagnóstica Transfronteiriça da Bacia do Rio
Okavango: Módulo do Caudal Ambiental: Relatório do
Especialista: País: Angola: Disciplina:Macroinvertebrados
Miguel, Gabriel Luís
Análise Técnica, Biofísica E Sócio-Económica do Lado
Angolano da Bacia Hidrográfica do Rio Cubango:
Subsídio Para o Conhecimento Hidrogeológico
Relatório de Hidrogeologia
Morais, Miguel
Análise Diagnóstica Transfronteiriça da Bacia do Análise Rio
Cubango (Okavango): Módulo da Avaliaçăo do Caudal
Ambiental: Relatório do Especialista País: Angola Disciplina:
Ictiofauna
Morais,
Miguel
Análise Técnica, Biófisica e Sócio-Económica do Lado
Angolano da Bacia Hidrográfica do Rio Cubango: Relatório
Final: Peixes e Pesca Fluvial da Bacia do Okavango em Angola
Pereira, Maria Joăo
Qualidade da Água, no Lado Angolano da Bacia Hidrográfica
do Rio Cubango
Santos,
Carmen
Ivelize
Análise Diagnóstica Transfronteiriça da Bacia do Rio
Van-Dúnem S. N.
Okavango: Módulo do Caudal Ambiental: Relatório de
Especialidade: Angola: Vida Selvagem
Santos, Carmen Ivelize
Análise Diagnóstica Transfronteiriça da Bacia do Rio
Van-Dúnem S.N.
Okavango:Módulo Avaliaçăo do Caudal Ambiental: Relatório de
Especialidade: Angola: Aves
Botswana Bonyongo, M.C.
Okavango River Basin Technical Diagnostic Analysis:
Environmental Flow Module: Specialist Report: Country:
Botswana: Discipline: Wildlife
Hancock, P.
Okavango River Basin Technical Diagnostic Analysis:
Environmental Flow Module : Specialist Report: Country:
Botswana: Discipline: Birds
Mosepele,
K. Okavango River Basin Technical Diagnostic Analysis:
Environmental Flow Module: Specialist Report: Country:
Botswana: Discipline: Fish
Mosepele, B. and
Okavango River Basin Technical Diagnostic Analysis:
Dallas, Helen
Environmental Flow Module: Specialist Report: Country:
Botswana: Discipline: Aquatic Macro Invertebrates
Namibia
Collin Christian &
Okavango River Basin: Transboundary Diagnostic Analysis
Associates CC
Project: Environmental Flow Assessment Module:
Geomorphology
Curtis, B.A.
Okavango River Basin Technical Diagnostic Analysis:
Environmental Flow Module: Specialist Report Country:
Namibia Discipline: Vegetation
Bethune, S.
Environmental Protection and Sustainable Management of the
Okavango River Basin (EPSMO): Transboundary Diagnostic
Analysis: Basin Ecosystems Report
Nakanwe, S.N.
Okavango River Basin Technical Diagnostic Analysis:
Environmental Flow Module: Specialist Report: Country:
Namibia: Discipline: Aquatic Macro Invertebrates
Paxton,
M. Okavango River Basin Transboundary Diagnostic Analysis:
Environmental Flow Module: Specialist
Report:Country:Namibia: Discipline: Birds (Avifauna)
Roberts, K.
Okavango River Basin Technical Diagnostic Analysis:
Environmental Flow Module: Specialist Report: Country:
Namibia: Discipline: Wildlife
Waal,
B.V. Okavango River Basin Technical Diagnostic Analysis:
Environmental Flow Module: Specialist Report: Country:
Namibia:Discipline: Fish Life
Country Reports
Angola
Gomes, Joaquim
Análise Técnica dos Aspectos Relacionados com o Potencial
Socioeconomic
Duarte
de Irrigaçăo no Lado Angolano da Bacia Hidrográfica do Rio
74
TDA River Basin Economic Valuation
Series
Cubango: Relatório Final
Mendelsohn,
.J.
Land use in Kavango: Past, Present and Future
Pereira, Maria Joăo
Análise Diagnóstica Transfronteiriça da Bacia do Rio
Okavango: Módulo do Caudal Ambiental: Relatório do
Especialista: País: Angola: Disciplina: Qualidade da Água
Saraiva, Rute et al.
Diagnóstico Transfronteiriço Bacia do Okavango: Análise
Socioeconómica Angola
Botswana Chimbari, M. and
Okavango River Basin Trans-Boundary Diagnostic Assessment
Magole, Lapologang
(TDA): Botswana Component: Partial Report: Key Public Health
Issues in the Okavango Basin, Botswana
Magole,
Lapologang
Transboundary Diagnostic Analysis of the Botswana Portion of
the Okavango River Basin: Land Use Planning
Magole, Lapologang
Transboundary Diagnostic Analysis (TDA) of the Botswana p
Portion of the Okavango River Basin: Stakeholder Involvement
in the ODMP and its Relevance to the TDA Process
Masamba,
W.R.
Transboundary Diagnostic Analysis of the Botswana Portion of
the Okavango River Basin: Output 4: Water Supply and
Sanitation
Masamba,W.R.
Transboundary Diagnostic Analysis of the Botswana Portion of
the Okavango River Basin: Irrigation Development
Mbaiwa.J.E. Transboundary Diagnostic Analysis of the Okavango River
Basin: the Status of Tourism Development in the Okavango
Delta: Botswana
Mbaiwa.J.E. &
Assessing the Impact of Climate Change on Tourism Activities
Mmopelwa, G.
and their Economic Benefits in the Okavango Delta
Mmopelwa,
G.
Okavango River Basin Trans-boundary Diagnostic Assessment:
Botswana Component: Output 5: Socio-Economic Profile
Ngwenya, B.N.
Final Report: A Socio-Economic Profile of River Resources and
HIV and AIDS in the Okavango Basin: Botswana
Vanderpost,
C.
Assessment of Existing Social Services and Projected Growth
in the Context of the Transboundary Diagnostic Analysis of the
Botswana Portion of the Okavango River Basin
Namibia
Barnes, J and
Okavango River Basin Technical Diagnostic Analysis:
Wamunyima, D
Environmental Flow Module: Specialist Report:
Country: Namibia: Discipline: Socio-economics
Collin Christian &
Technical Report on Hydro-electric Power Development in the
Associates CC
Namibian Section of the Okavango River Basin
Liebenberg, J.P.
Technical Report on Irrigation Development in the Namibia
Section of the Okavango River Basin
Ortmann, Cynthia L.
Okavango River Basin Technical Diagnostic Analysis:
Environmental Flow Module : Specialist Report Country:
Namibia: discipline: Water Quality
Nashipili,
Okavango River Basin Technical Diagnostic Analysis: Specialist
Ndinomwaameni
Report: Country: Namibia: Discipline: Water Supply and
Sanitation
Paxton,
C.
Transboundary Diagnostic Analysis: Specialist Report:
Discipline: Water Quality Requirements For Human Health in
the Okavango River Basin: Country: Namibia
75
TDA River Basin Economic Valuation
74
Document Outline
- ţ˙
- ţ˙
- ţ˙
- ţ˙
- ţ˙
- ţ˙
- ţ˙
- ţ˙
- ţ˙
- ţ˙
- ţ˙
- ţ˙
- ţ˙
- ţ˙
- ţ˙
- ţ˙
- ţ˙
- ţ˙
- ţ˙
- ţ˙
- ţ˙
- ţ˙
- ţ˙
- ţ˙
- ţ˙
- ţ˙
- ţ˙
- ţ˙
- ţ˙
- ţ˙
- ţ˙
- ţ˙
- ţ˙
- ţ˙
- ţ˙
- ţ˙
- ţ˙
- ţ˙
- ţ˙
- ţ˙
- ţ˙
- ţ˙
- ţ˙
- ţ˙
- ţ˙
- ţ˙
- ţ˙
- ţ˙