Chapter 7
PTS levels in humans
7.1. Sampling strategy
Chapter 7
Blood sampling was undertaken using vacutainers,
7.1. Sampling strategy
fiberglass plungerless vacuum test-tubes with a needle
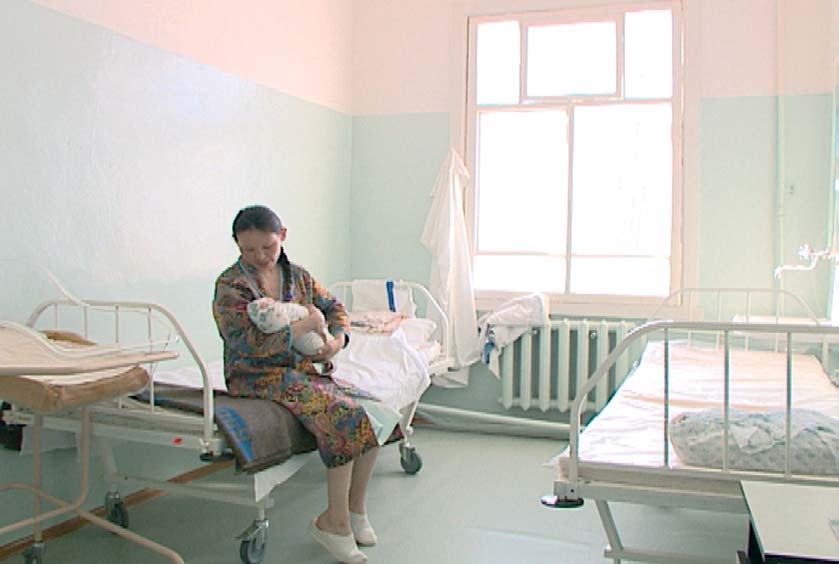
Sampling of human blood was undertaken in parallel
screwed on a holder for dosed intravenous blood sam-
with the dietary and lifestyle surveys, with two sets of
pling. Blood was collected first from the mother's vena
respondents involved: pregnant women, from whom
ulnaris and then from the umbilical cord of the fetus.
blood (and cord blood) were sampled at maternity
For further blood treatment, special pipettes and vials,
departments of local hospitals, and representatives of the
pre-tested to ensure the absence of pollutants that
general adult indigenous population in selected indige-
might confuse blood analysis findings, were used.
nous settlements within the areas chosen for project
Samples were processed in a 3000 rpm centrifuge and
implementation. Additional control samples, from urban
stored in a freezer at 20°. Special thermally insulated
populations in Norilsk and the Aral Sea areas, were ana-
containers were used for the transport of frozen blood
lyzed to compare their PTS levels with those found in
samples.
northern indigenous populations. The Aral Sea area is
generally acknowledged to be an environmental disaster
Blood was collected from mothers on the first to the
area, characterized by high usage of a range of pesticides
third day after delivery. Cord blood was sampled imme-
in previous years, whilst Norilsk is a heavily industrialized
diately after the tying and cutting of the umbilical cord.
area, with a wide range of pollutant sources. Information
Methods used for blood sampling and blood treatment
on the numbers and geographical distribution of samples
techniques were identical for maternal and cord blood.
for each area is presented in Table 7.1.
Mothers were also interviewed on the third to the fifth
day after delivery.
7.2. Analytical methods and quality control
7.2.1. Analysis of POPs
Analysis of blood serum for persistent organic pollu-
tants (POPs) was carried out in the Center for
Environmental Chemistry (CEC) of SPA `Typhoon',
and the laboratory of the Regional Center `Monitoring
of the Arctic' (RCMA). Analyses at CEC were based on
GC/MS, and those conducted at the RCMA laboratory
involved chromatographic separation with electron
capture detection. Quantitative calculations were
based on external calibration using standard solutions.
Extraction of POPs from blood serum
Prior to extraction, blood serum samples were defrost-
ed at room temperature. Each serum sample was
Table 7.1. Numbers of persons interviewed,
weighed to an accuracy of 0.01 g and placed in an
and blood samples taken.
Erlenmeer flask. The isotope-labeled surrogate stan-
dards solution was then added and mixed for 30 min-
The World Health Organization (WHO) recommends
utes, after which methanol (MeOH) was added (in a
the use of breast milk as an indicator of the human
volume equal to that of the sample) and the solution
body load of dioxins, PCBs, and other contaminants of
mixed for a further minute.
this type. Despite this, AMAP human health assess-
ments are usually based on PTS levels in human blood.
The sample solutions were initially extracted using a
This approach was selected after a thorough analysis of
mixture of 1 : 1 hexane-MTBE (methyl-tri-butyl ether),
all factors, which included the ethical principles of
the extraction process repeated twice, using 2035 ml of
undertaking studies among indigenous peoples, and
an extracting agent. After separation of organic and
the population groups to be covered by surveys. In
aqueous layers, the extract was transferred to an
order to ensure that project data would be comparable
Erlenmeer flask using a pipette. The extracts were com-
with both circumpolar and global data, breast milk
bined, and the remaining water removed using anhy-
samples were taken and analyzed in parallel with blood
drous sodium sulfate, for a period of 30 minutes. The
samples from a group of women in the Chukotka
extract was then put through a fiberglass filter and con-
peninsula, one of the project areas.
centrated to a volume of 10 mL, using a rotor evapora-
tor. An extract aliquot of 2 mL was used to determine the
A total of 60 samples of breast milk were analyzed for
level of lipids in blood serum. The remaining extract was
POPs. The samples were collected from different dis-
then further concentrated to a volume of 1 mL, cleaned
tricts of the Chukchi AO: Chukotsky (27 samples),
of lipids using gel-filtration on a Bio-Bead SX-3 column,
Anadyrsky (21 samples), and the town of Anadyr (7 sam-
and impurities were separated out using activated alu-
ples). Five samples were also collected and analyzed
minum oxide and column chromatography with
from St. Petersburg, which was chosen as a control area.
columns of silica gel, Florisil, and carbon AX-21.
130
Chapter 7
7.2. Analytical methods and quality control
Determination of the lipid content in blood serum
ions (NCI) characteristic of toxaphene compounds,
Lipids in blood serum were determined in the 2 mL
i.e, selective ion monitoring (SIM). Analyses were per-
aliquot of primary extract that had been prepared for
formed on a SATURN-1200 MS/MS.
POP analysis, using the gravimetric method.
Analytes were identified by the presence of characteris-
Determination of polychlorinated biphenyls (PCBs)
tic ions and the coincidence of chromatographic
PCBs determined in blood serum included the com-
retention times. Due to the lack of available isotope-
pounds identified by IUPAC nomenclature as: PCB-
labeled compounds, calculations were carried out
28/31, PCB-52, PCB-99, PCB-101, PCB-105, PCB-118,
using external calibration based on the analysis of stan-
PCB-128, PCB-138, PCB-153, PCB-156, PCB-183, PCB-
dard solutions of a mixture of individual toxaphene
187, PCB-170 and PCB-180. A surrogate standard, con-
congeners, TOX-482, manufactured by Promochem.
sisting of a mixture of PCBs that were isotope-marked
with 13C (#28-13C12; #52-13C12; #101-13C12; #118-13C12;
The detection limit for individual congeners of
#138-13C12; #153-13C12; and #180-13C12, manufactured
toxaphene ranged from 0.01 to 0.03 µg/L.
by Wellington Laboratories) was added to samples prior
to extraction to control the efficiency of extraction and
Polybrominated diphenyl ethers (PBDE)
quantification, using PCB-166 as the recovery standard.
Polybrominated diphenyl ethers are widely used in
industry as flame retardants. These are lipophilic com-
After preparation, sample extracts were analyzed using
pounds of low-volatility. The compounds determined
a Varian SATURN-2200T GC/MS, by operating in elec-
in blood serum were those PBDE congeners most fre-
tron impact ionization mode. Analytes were identified
quently used in products, namely:
by comparison of the resulting mass-spectra with chro-
matographic retention times characteristic of different
2,4,4'- tribromodiphenyl ether (BDE-28)
PCB congeners. The detection limit of individual PCB
2,2',4,4'- tetrabromodiphenyl ether (BDE-47)
congeners ranged from 0.002 to 0.2 µg/L.
2,2',4,4',5- pentabromodiphenyl ether (BDE-99)
2,2',4,4',6- pentabromodiphenyl ether (BDE-100)
Determination of organochlorine pesticides (OCP)
2,2',4,4',5,5'-hexabromodiphenyl ether (BDE-153)
Organochlorine pesticides determined in blood serum
2,2',4,4',5,6'-hexabromodiphenyl ether (BDE-154)
included the following compounds: HCB, -HCH, -
2,2',3, 4,4',5',6-heptabromodiphenyl ether (BDE-183)
HCH, -HCH, p,p'-DDD, p,p'-DDT, o,p-DDE, o,p-DDD,
o,p-DDT, heptachlor, cis-chlordane, trans-chlordane,
Analysis was performed by GC/MS using a SATURN
oxychlordane, cis- and trans-nonachlor, dieldrin, and
1200 MS/MS operating in chemical ionization mode,
mirex.
with detection of negative ions (NCI) and selective ion
monitoring (SIM). Identification of analytes was based
Analytical determination of OCPs was performed using
on the presence of characteristic ions and coincidence
a Varian SATURN-2200T GC/MS, with identification
of chromatographic retention times. For calculations,
of components by their characteristic mass-spectra,
data from PBDE calibration solutions based on the
recorded in the range m/z = 80-420 amu. Control of
mixture of EO-4149 standards, manufactured by
the efficiency of extraction and quantification was
Cambridge Isotope Laboratories, and containing all
achieved by adding analogues of analytes marked with
determined compounds, was used. The detection limit
13C (13C12-p,p'-DDE, 13C12-p,p'-DDT, 13C6--HCH, and
of individual PBDE congeners ranged from 0.1 to
13C6HCB; supplied by Cambridge Isotope Labo-
0.4 ng/L.
ratories) to samples prior to extraction. The internal
standard used was PCB #166.
Polychlorinated dibenzo-n-dioxins/dibenzofurans
(PCDD/PCDFs)
The detection limit for organochlorine pesticides
Quality control of the efficiency of extraction, and
ranged from 0.003 to 0.16 µg/L for the various com-
quantitative calculations was achieved by adding a sur-
pounds.
rogate standard prior to extraction. This solution
(EPA-23 ISS, manufactured by Wellington Labo-
Toxaphene
ratories) contains a mixture of PCDD/Fs, isotope-
Analysis of toxaphene In blood serum samples was
marked with 13C, including:
undertaken for those compounds known to be the
most persistent and frequently occurring in the envi-
13C12 2,3,7,8-TCDD
ronment; namely, the octa- and nona- chlorinated
13C12 1,2,3,7,8-PeCDD
toxaphenes that are conventionally referred to as
13C12 1,2,3,6,7,8-HxCDD
Parlar-26, Parlar-50 and Parlar-62.
13C12 1,2,3,4,6,7,8-HpCDD
13C12 OCDD
Extraction of toxaphenes was carried out in conjunc-
13C12 2,3,7,8-TCDF
tion with other OCPs, as described above. After prepa-
13C12 1,2,3,7,8-PeCDF
ration, extracts were analyzed by GC/MS operating in
13C12 1,2,3,6,7,8-HxCDF
chemical ionization mode, with detection of negative
13C12 1,2,3,4,7,8-HpCDF
131
7.2. Analytical methods and quality control
Chapter 7
The recovery standard was the mixture NK-IS-A, con-
The quality criterion used was that the difference in
taining 13C12 1,2,3,4-TCDD and 13C12 1,2,3,7,8,9-
values of the relative response factor (RRF) calculated
HxCDD.
before and after the analysis of each series of samples
should not exceed ±15%.
Analyses we performed on a GC/MS SATURN
1200MS/MS, using chemical ionization with detec-
Instrument contamination by analytes was checked after
tion of negative ions (NCI) and selective ion monitor-
each analysis of the calibration standard solution by
ing (SIM). Identification of analytes was based on
injecting a clean solvent. The value of background
characteristic ions and coincidence of chromato-
errors due to the instrument had to be no more than
graphic retention times. The detection limit for indi-
1% of the mean value of determined concentrations.
vidual congeners of PCDD/Fs ranged from 0.02 to
1.4 ng/kg.
7.2.3. Analysis of samples for lead, cadmium,
mercury, selenium and ferritin
7.2.2. Quality Assurance/Quality Control
of POPs analysis
Analysis of whole blood samples for lead and cadmium
Quality control procedures involved a set of measures
Analysis for metals was performed in batches, exh
to check the accuracy of measurements and to estimate
batch comprising no more than 12 samples of blood, a
the size of any errors arising during sample prepara-
procedural blank, a field blank, and a sample of certi-
tion for analysis and measurement.
fied reference material. One of the samples was also
analyzed twice (replicated).
Analysis of samples was performed in series batches.
Each batch included no more than 12 samples, a pro-
Prior to analysis, samples of whole blood were mixed,
cedural blank, and a sample of a certified reference
transferred to vials, and after Triton X-100 solution was
material or a control sample prepared in the laborato-
added. They were then brought up to 4 mL and 2N with
ry, which contained known amounts of the analyte
nitric acid and centrifuged for 15 minutes at 3000 rpm.
being determined. As the weight of individual blood
Cadmium and lead were measured by flameless atomic-
samples delivered to the laboratory was less than 10 g,
absorption spectrometry using a Perkin Elmer model Z
no duplicate analyses were performed.
3030 spectrophotometer with Zeeman effect back-
ground correction, using pyro-coated graphite cells,
The validity and accuracy of measurements was tested
with a Lvov platform. Analysis was performed by the
using (13C) isotope-labeled surrogate standards intro-
method of standard additions in the presence of
duced to the samples prior to extraction. The surro-
ammonium pyrophosphate, as a modifier. The detec-
gate standards used for analysis of each type of com-
tion limit for cadmium was 0.1 µg/L, and for lead
pound are described in preceding sections.
5.0 µg/L.
Acceptance criteria for analyses were as follows:
Analysis of whole blood samples for mercury
·
Content in a blank: lower than the method detection
Each batch included 10 samples of whole blood, a pro-
limit (MDL) for each analyte according to the max-
cedural blank, a field blank, and a control sample.
imum weight of the sub-sample used for a given
type of analysis.
For measurements, three 1.01.5 mL sub-samples were
·
Extraction of analytes in a control sample: within a range
placed in three conical flasks, to which potassium per-
of 70120% for 90% of compounds introduced to
manganate solution and a mixture of concentrated
the sample.
nitric and sulfuric acids (in the ratio 1:3) were poured,
·
Recovery range for surrogate standards: 40120%.
and 2 g of dry potassium permanganate was added.
The flasks were heated for 4 hours in a water bath at
The performance of analytical instruments was
60°C. After cooling, 15 mL of 10% hydroxylamine chlo-
checked on a daily basis, and included a check of
ride was added and the samples were transferred to aer-
instrument sensitivity and chromatographic and spec-
ation jars.
tral resolution.
Mercury was measured by the `cold vapor' technique
Linearity of instrument calibration was determined by
using the MHS-15 device with the Perkin Elmer model
analysis of 5 standard solutions of analytes with con-
B 3030 spectrophotometer. Analyses were carried out
centrations within the range of measured concentra-
using the method of standard additions, adding 5, 10,
tions in samples. The standard deviation of the esti-
and 15 ng of mercury to sample aliquots prior to meas-
mated relative response factor (RRF) in linearity
urement. The reducing agent used was a 20% solution
checks had to be less than 15%.
of tin chloride, and the carrier gas used was argon.
Instrument performance was tested before and after the
Analysis of serum samples for selenium
analysis of each batch of samples, by undertaking an
Each batch analyzed included 12 serum samples, a pro-
analysis of a calibration solution of medium concentra-
cedural blank, a field blank, a sample of reference
tion.
material, and a replicate sample. The serum samples
132
Chapter 7
7.3. PTS levels in maternal and cord blood
were transferred to conical flasks, to which 0.2 g of
To assess the accuracy of results, a laboratory control
ascorbic acid was added, together with sodium molyb-
sample was analyzed in each sample batch. The labora-
date, aqueous solution of potassium permanganate,
tory control sample was a matrix spike prepared with
and a mixture of concentrated nitric and sulfuric acids.
whole animal blood spiked with mercury in concentra-
Samples were heated for 20 minutes at 120°C. The tem-
tions from 5.0 to 10.0 µg/L. The recovery of mercury
perature was then raised to 160°C and the samples
from the control samples varied from 90 to 100%. The
heated to complete decomposition. The samples were
detection limit for mercury was 1.0 µg/L of whole
cooled and transferred to a separating funnel, after
blood.
which a hydrochloride solution of 1,2 diamino-4
nitrobenzene was added. The resulting 5-nitro-2,1,3-
Quality control for selenium analysis
benzoselendiazol was extracted by chloroform.
Quality control procedures for selenium analysis
involved the determination of the level of contamina-
Selenium was measured by flameless atomic-absorp-
tion of the containers in which the blood samples were
tion spectrometry, using a Perkin Elmer model Z 3030
delivered, analysis of replicates, and the analysis of a
spectrophotometer with Zeeman effect background
blood reference material (IAEA-A-13).
correction, using pyro-coated graphite cells, with a
Lvov platform. For determination of selenium, the
In the replicated analyses, results did not diverge by
modifier used was a mixture of equal volumes of palla-
more than 20% and the recovery of selenium from ref-
dium nitrate, at a concentration of 3000 mg/L and
erence material varied from 80 to 100%. The detection
manganese nitrate, at a concentration of 2000 mg/L.
limit for selenium was 10.0 µg/L of blood serum.
Analysis of serum samples for ferritin
Quality control for ferritin analysis
Determination of ferritin was undertaken using a
For ferritin analysis, quality control procedures
DiaSys Diagnostic Systems (Germany) kit for photo-
involved the analysis of wash-offs from containers in
metric quantification of ferritin in serum, with a
which samples were delivered, analysis of procedural
`Specol-11' spectrophotometer. Ferritin concentra-
blanks, and analysis of acertified reference material
tions were determined using a calibration curve based
prepared using human blood serum with different lev-
on four calibration samples, and a solution of sodium
els of ferritin (Lot #01143-01146). Errors in ferritin
chloride (0.9%) for the determination of the zero
determination in control samples did not exceed 10%.
value. The lower limit for measurement of ferritin con-
Replicates were analyzed in each batch, in order to
centration was 16 µg/L.
assess the repeatability of results. The differences
between replicate measurements did not exceed 19%.
7.2.4. Quality Assurance/Quality Control
of analysis for metals and ferritin
7.3. PTS levels in maternal and cord blood
The results of maternal and cord blood sample analysis
Quality control for lead and cadmium analysis
were grouped according to sampling site and donor
Analysis of blanks: Procedural blanks were analyzed to
type. Sets of analytical results obtained from the differ-
detect possible contamination of blood samples during
ent groups underwent statistical analysis. For the cal-
sample preparation. Procedural blanks were included
culation of geometric mean concentrations of PTS in
in each batch of samples analyzed.
blood and serum, where analysis yielded a result for a
particular substance below the detection limit, a value
Analysis of duplicates: For assessing the repeatability of
of half of the detection limit for the PTS and method
results, replicates were analyzed in each batch. The dif-
concerned was used in the calculation.
ference in results of the analysis of replicates varied
from 0.4 to 22.1% for lead, whereas for cadmium the
The range of PTS concentrations in different blood
difference between the duplicate measurements did
groups can be very broad, and up to an order of mag-
not exceed 20%.
nitude (Tables 7.27.4). Since errors associated with
analytical measurement of PTS in blood samples did
Analysis of certified reference material: In order to test the
not exceed 20% (see section 7.2), such differences can
accuracy of the results obtained, a reference material
largely be attributed to heterogeneity of factors that
(BCR 195), consisting of a sample of the lyophilized
affect blood concentrations (such as age, diet, number
blood of ruminant animals, was analyzed with each
of children, etc). When assessing geometric means of
batch.. The maximum error detected by the analysis of
measured results, therefore, differences in PTS con-
the certified reference material was 14.2% for lead,
centrations in a certain group are taken to represent
and 17% for cadmium.
general tendencies rather than specific trends.
Quality control for mercury analysis
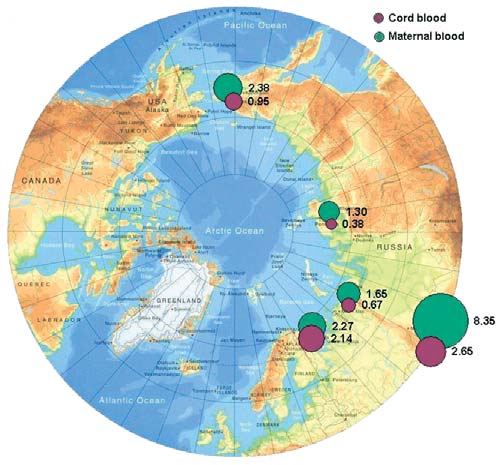
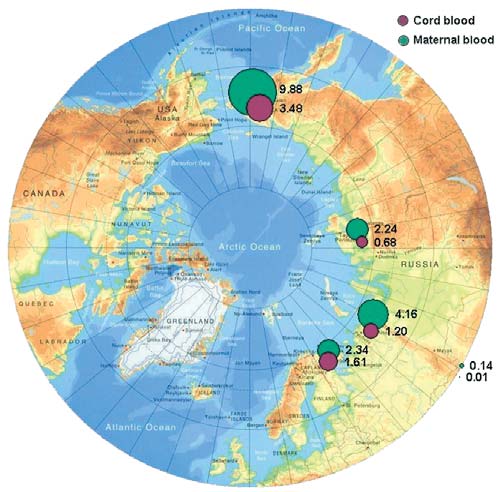
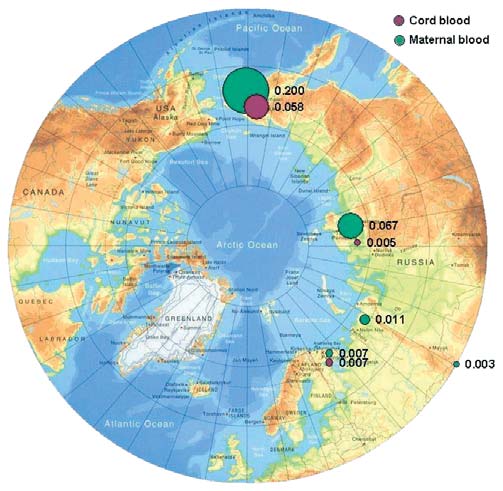
Hexachlorobenzene (HCB)
Procedural blanks were analyzed to detect possible
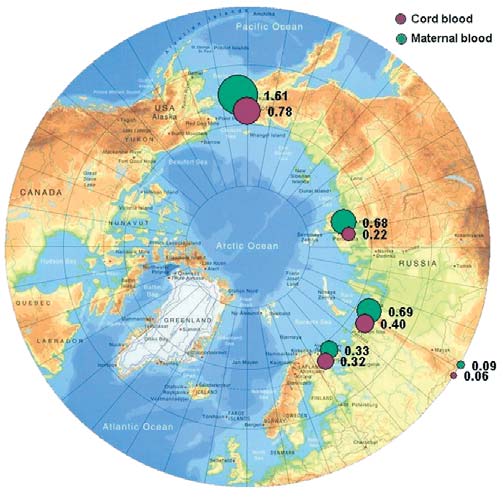
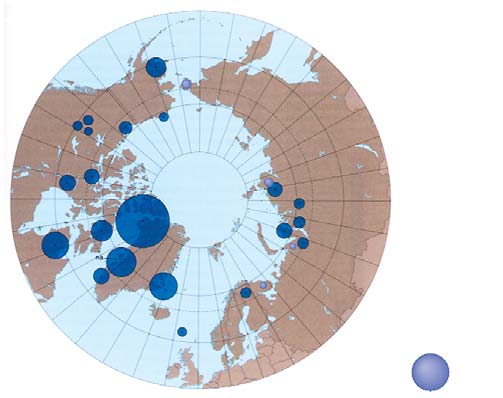
The geometric means of HCB concentrations found
mercury contamination of blood samples during analy-
in maternal and cord blood serum for four project
sis. Procedural blanks were included in each batch of
areas within the Russian Arctic are presented in
samples.
Figure 7.1. The summary tables 7.27.4 and Figure 7.1
133
7.3. PTS levels in maternal and cord blood
Chapter 7
Table 7.2. Concentrations (geometric mean and range; µg/L plasma)
of PTS in maternal and cord blood from various areas of the Chukchi AO.
In control blood samples, mean HCB concentrations
n. d. not detected
are 6 to 8 times lower than those from other study
show that the highest concentrations of HCBs occur
regions, and 20 times lower than concentrations in
in the Chukchi AO. The highest HCB concentrations
maternal blood samples from the Chukotsky district.
of 1.6 µg/L and 0.8 µg/L are found in maternal and
cord blood, respectively, from Chukotsky, the most
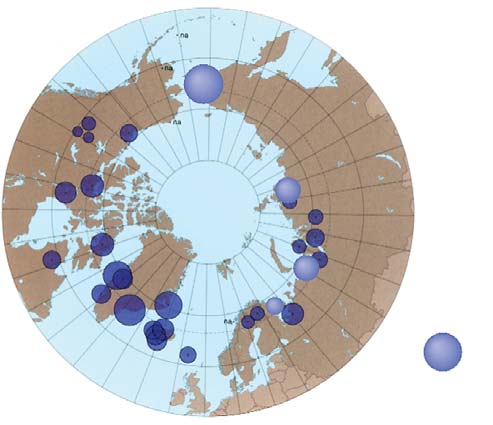
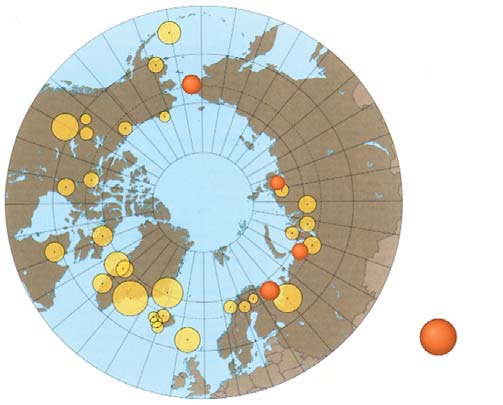
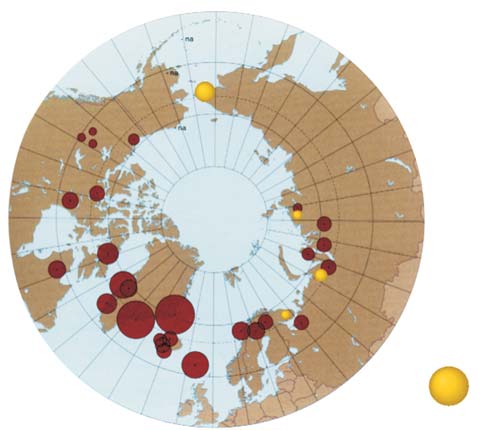
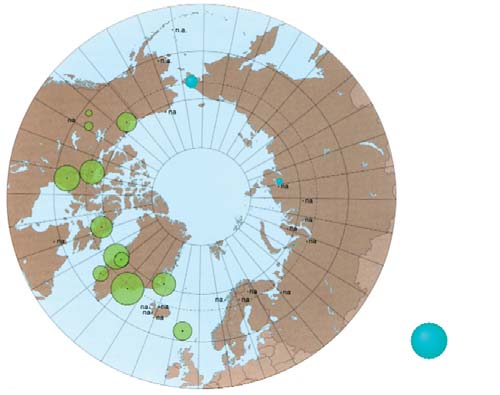
A comparison with results from the AMAP circumpolar
northeasterly, coastal district of the Chukchi AO.
blood survey (AMAP, 2003a) is shown in Figure 7.2.
Blood samples from other areas of the Chukchi AO
This comparison suggests that, on the whole, HCB con-
(Anadyrsky and Iul'tinsky districts, and the town of
centrations measured in maternal blood in the Russian
Anadyr) contain HCBs at levels 2-3 times lower than
Arctic are close to those detected in coastal areas of
in Chukotsky, and more comparable with samples
Greenland and Canada (where means of 1.5 and
from other regions.
1 µg/L of plasma, respectively, were found). Blood
concentrations of HCB reported previously (AMAP,
Concentrations of HCB in cord blood are 1.6 to 3
1997, 1998) for residents of the same territories of
times lower than those in maternal blood. It has there-
Greenland and Canada had geometric mean levels of
fore been suggested that the placenta may act as a bar-
HCB of 0.9 and 0.7 µg/L of plasma, respectively. In the
rier between the mother and fetus and prevents trans-
context of these results, the highest concentrations of
fer of this toxicant from mother to child, although
HCB found in blood samples from coastal Chukotka
though this barrier is not fully effective. A similar
are a cause of concern.
effect was observed for blood groups of all regions,
except the Kola Peninsula, where the difference in
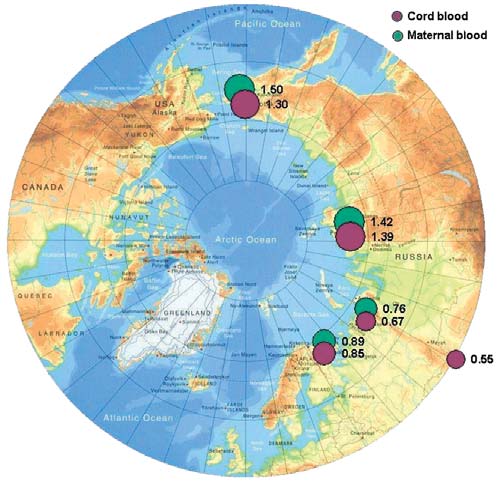
DDT
maternal and cord blood concentrations was not sta-
High concentrations of total DDT in maternal blood
tistically significant.
samples, ranging from 1.4 µg/L (Anadyrsky district,
Table 7.3. Concentrations (geometric mean and range; µg/L plasma) of PTS in maternal and cord blood from various areas of the Taymir AO.
n. d. not detected
134
Chapter 7
7.3. PTS levels in maternal and cord blood
ble 7.4. Concentrations (geometric mean and range; µg/L plasma) of PTS in maternal and cord blood from the Kola Peninsula, the Nenets AO, and Aral (control area).
n.d. not detected
Chukchi AO) to 3.3 µg/L (Norilsk) occur in all four
area, the concentration of total DDT was as high as
regions, with concentrations in maternal blood being
18.2 µg/L in maternal and 5.8 µg/L in cord blood
1.53 times higher than in cord blood.
(Table 7.4).
Within the Chukchi AO, the highest concentrations
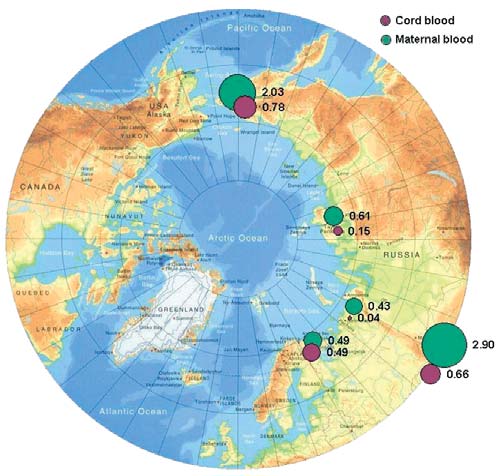
DDE is the most frequently occurring component of
of total DDT in cord blood (1.1 µg/L) were found in
total DDT, with the DDE/DDT concentration ratio
Chukotsky district, while concentrations in other
varying from 3 to 8. Figure 7.3 shows the geographic
districts are 23 times lower. Levels of DDT in mater-
distribution of geometric mean concentrations of DDE
nal blood from the town of Anadyr, however, are also
in maternal and cord blood for the regions of Russia
high (2.7 µg/L). Samples of maternal and cord
involved in the study.
blood from the Kola Peninsula are similar, as DDT
concentrations are high in both, at 2.7 and 2.4 µg/L,
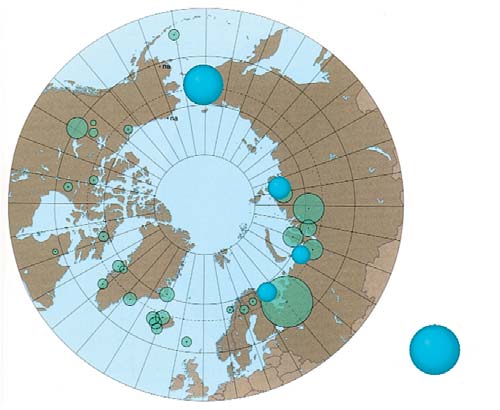
A comparison with the results of the analysis of mater-
respectively.
nal blood from residents of the Russian North reported
by AMAP (AMAP, 2003a), of 1.255.0 µg/L of serum,
It should be noted that control blood groups also con-
Figure 7.4, indicates that DDT concentrations in mater-
tain DDT in significant amounts, with mean values
nal blood from three regions of the Russian Arctic,
varying from 8.7 µg/L in maternal blood to 2.8 µg/L
excluding the control region, (1.43.3 µg/L of serum)
in cord blood. In control blood samples from the Aral
are very similar to previous results. Comparisons of
DDT for the Chukchi population are not possible due
to the lack of available data prior to the present study.
Figure 7.2. Comparison of the results obtained in this project for HCB
Figure 7.1. Levels of HCB in maternal and cord blood in the Russian Arctic
in maternal blood with results from the AMAP circumpolar blood monitoring
(geometric means, µg/L plasma).
study (AMAP, 2003a).
135
7.3. PTS levels in maternal and cord blood
Chapter 7
Figure 7.4. Comparison of the results obtained in this project for DDE
in maternal blood with results from the AMAP circumpolar blood monitoring study
Figure 7.3.
(AMAP, 2003a).
Levels of DDE in maternal and cord blood in the Russian Arctic
(geometric means, µg/L plasma).
As for DDT, -HCH concentrations in control samples
HCH
from the Aral area are high, with a geometric mean of
Total HCH levels in human blood are mainly deter-
2.9 µg/L of plasma. In individual samples, concentra-
mined by -HCH, this being the most stable compound
tions as high as 9.5 µg/L of plasma were found, which
within the HCH group. Consequently, all subsequent
is likely to be the result of the long-term use of pesti-
discussions in this chapter concerning HCH levels are
cides such as HCH, lindane, and DDT in this area.
based on -HCH results. The geometric mean values of
-HCH concentrations in maternal and cord blood in
Concentrations of -HCH in maternal blood do not
the four studied regions of the Russian Arctic are shown
exceed values reported in earlier studies by AMAP
in Figure 7.5. The distribution of -HCH in human
(AMAP, 2003a) for the Russian North (Figure 7.6).
blood in the Russian Arctic is similar to that of HCB,
with the highest levels (0.82.0 µg/L) observed in the
PCBs
blood of residents of Chukotka (Table 7.2). However,
The presence of PCBs in human blood is attributed main-
one difference is that elevated levels of -HCH are also
ly to the consumption of contaminated foodstuffs. In the
found in maternal blood from Norilsk (1.3 µg/L). In all
diet of people living in coastal areas of the Arctic, sources
other maternal blood samples (apart from those from
of PCBs include meat from polar bears, seals, whales, and
the Kola Peninsula) the concentrations of -HCH are
sea birds and bird eggs, as well as from fish; whilst for
24 times higher than in cord blood.
those living in continental areas, sources include freshwa-
ter fish and other meat and fish products (AMAP, 2002).
Figure 7.6. Comparison of the results obtained in this project for
Figure 7.5. Levels of in maternal and cord blood in the Russian Arctic
in maternal blood with results from the AMAP circumpolar blood monitoring study
(geometric means, µg/L plasma).
(AMAP, 2003a).
136
Chapter 7
7.3. PTS levels in maternal and cord blood
Figure 7.8. Comparison of the results obtained in this project for sum of PCBs
(as Aroclor 1260 equivalents) in maternal blood with results from the AMAP
Figure 7.7. Levels of sum of PCBs (shown as Aroclor 1260 equivalents)
circumpolar blood monitoring study (AMAP, 2003a).
in maternal and cord blood in Russian Arctic (geometric means, µg/L plasma).
levels as high as 11 µg/L in some individual samples
The analysis of maternal and cord blood demon-
from this area. In the Taymir area, the highest con-
strates that, as for other toxicants, when examining
centrations are found in Dudinka (mean concentra-
PCB in humans, the transfer of contaminants from
tion of 2.2 µg/L, with a maximum value of 5.2 µg/L).
mother to fetus via the blood appears to be impeded
Figure 7.7 shows the spatial distribution of geometric
by the placental barrier. This is reflected by the ratio
mean concentrations of total PCBs across the Russian
of PTS in maternal and cord blood, and differs for
Arctic.
residents of different districts (as seen in mean val-
ues) and between individuals (as seen in deviations
The results were compared with data obtained in earli-
from the mean).
er studies by AMAP (AMAP, 2003a) on PCB concentra-
tions in maternal blood for various Arctic countries.
Tables 7.27.4 show that the maximum values of total
These included Greenland: 2535 µg/L of plasma (for
PCBs occur in maternal and cord blood samples of
indigenous people of coastal areas), Iceland: 20 µg/L,
residents of the Chukotsky District of the Chukchi
Canada: 215 µg/L, and Russia: 215 µg/L of plasma.
AO (3.9 µg/L and 1.4 µg/L, respectively), with PCB
It can be seen from data in Tables 7.27.4 and Figure
Figure 7.9.
PCB levels in various
districts of the Chukchi AO.
137
7.3. PTS levels in maternal and cord blood
Chapter 7
7.8 that the concentrations of total PCBs in maternal
Chlordane and its decomposition products:
and cord blood sampled in the Russian Arctic during
trans- and cis-chlordanes and oxychlordane
this study, on average, do not exceed the limit value
The predominant chlordane component in blood is
of 5 µg/L of blood, below which toxic effects on
oxychlordane (often constituting 100% of the sum). It
humans have not been observed (Klopov, 2000).
is believed that high concentrations of this compound,
Figure 7.9 illustrates the distribution of PCBs within
found in the blood of indigenous people, are due to
different areas of the Chukchi AO.
the intake of oxychlordane with marine mammal meat.
Oxychlordane concentrations in blood from past stud-
Of all the PCB congeners, PCB-153 (2,2',4,4',5,5'-hexa-
ies were reported to be 0.251.5 µg/L of blood serum
chlorobiphenyl) occurs in humans most frequently
for indigenous women in Greenland, and 0.05-
and in the largest amount. Assessment of PCB con-
0.75 µg/L of blood serum for residents of Canada
geners present in paired maternal and cord blood sam-
(AMAP, 2003a). The sum of chlordanes in the blood of
ples from four regions of the Russian Arctic shows that
women in northwest Greenland, and northern Canada
the distributions of congeners in the paired samples
(Quebec) were reported to be 1.4 and 1.6 µg/L of
are similar. This means that, when PCBs are trans-
blood serum, whereas for women in the Russian Arctic,
ferred to infants via the blood, the PCB congener pat-
levels are found to be 0.10.5 µg/L of blood serum
tern remains essentially the same. However, the pattern
(AMAP, 1998).
of PCB distribution in the paired blood samples col-
lected on the Kola Peninsula differs from that found in
The results of analysis of maternal and umbilical cord
blood of residents of the three other regions. This may
blood in the present study (Figure 7.10) show that the
be due to peculiarities in the diet of residents in the
highest concentrations of oxychlordane occur in the
Kola region. It is worth noting that the distribution pat-
blood of women and children living in Chukotsky
terns found are consistent with data previously
District of the Chukchi AO (with geometric mean lev-
obtained from more limited sets of blood samples
els of 1.0 and 0.2 µg/L, respectively). This is an order
taken in the same areas (Chashchin et al., 2002).
of magnitude higher than in the other regions where
samples were taken. However, the elevated levels of
According to the scientific literature (Chen et al., 1985)
oxychlordanes in maternal blood in Chukotsky district
the highest recorded levels of total PCBs in blood, were
are close to levels found in women living in Greenland
found in those poisoned by PCB-contaminated rice oil
and consuming the meat of marine mammals. A com-
in Japan in 1968 (Yusho disease) and in Taiwan in 1979
parison of levels of oxychlordane found in maternal
(Iu-Cheng disease). Blood concentrations of PCBs in
blood in this study and during previous studies is
the residents of Taiwan who were affected ranged from
shown in Figure 7.11.
10 to 720 µg/L, with the mean value of 38 µg/L.
Symptoms of the poisoning showed a close correlation
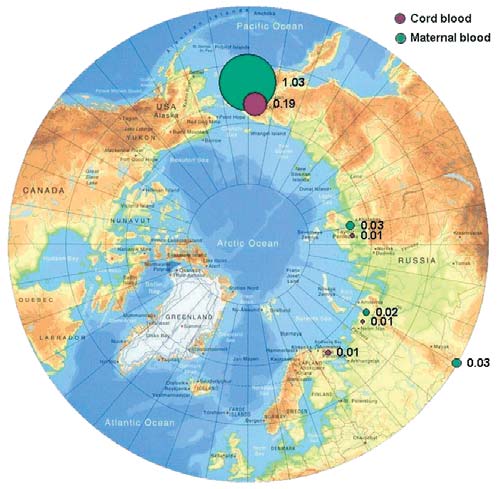
Toxaphene and mirex
with concentrations of hexachlorobiphenyl (congener
Blood samples were analyzed for three enantiomers of
PCB-157) in the blood. However, within a year, the
toxaphene, Parlar-26, -50, and -62 (based on the Parlar
maximum concentration in blood had decreased to
standards). Of these, Parlar-26 (octachlorocamphene)
99 µg/L (Chen et al., 1985).
and Parlar-50 (nonachlorocamphene) were the enan-
tiomers that were primarily detected. Tables 7.27.4
provide total concentrations for the toxaphenes stud-
ied, as determined in blood samples.
Figure 7.11. Comparison of the results obtained in this project for oxychlordane
Figure 7.10. Levels of oxychlordane in maternal and cord blood
in maternal blood with results from the AMAP circumpolar blood monitoring study
in the Russian Arctic (geometric means, µg/L plasma).
(AMAP, 2003a).
138
Chapter 7
7.3. PTS levels in maternal and cord blood
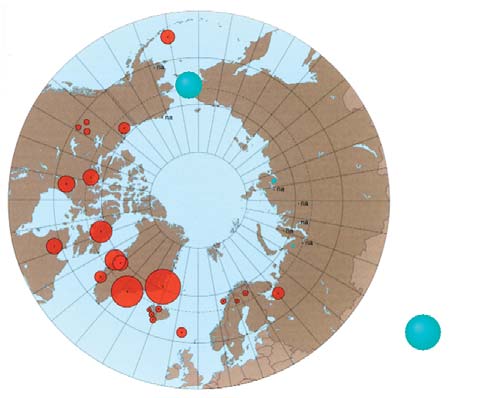
Figure 7.13. Comparison of the results obtained in this project for toxaphene
in maternal blood with results from the AMAP circumpolar blood monitoring study
(AMAP, 2003a).
Figure 7.12. Levels of total toxaphenes in maternal and cord blood
in the Russian Arctic (geometric means, µg/L plasma).
tration in umbilical cord blood reported for a group of
women in Arctic Canada was determined to be
The concentration of toxaphenes in human blood, like
0.010.65 µg/L (CACAR, 1997).
that of mirex, is known to be higher among indigenous
people whose traditional diet includes marine mam-
Mercury
mals and fish (AMAP, 2003a), with the highest levels of
Mercury concentrations in human blood are primarily
toxaphenes observed in inhabitants of Greenland and
governed by diet. For example, blood mercury concen-
northern Canada (up to 1.5 µg/L of blood).
trations measured in women in the Russian Arctic were
1.61.9 times higher for women whose diet included a
Toxaphene levels occurring in the blood of women in
higher level of intake of traditional foods (fish and
the Russian Arctic are much lower (0.0070.2 µg/L),
reindeer meat), compared to those who consumed
and the concentrations in cord blood are found to be
these foods rarely, with geometric mean values for
lower still, at 0.0030.06 µg/L. The concentrations of
blood mercury equal to 2.5 and 1.3 µg/L of blood,
toxaphenes in cord blood areless than 30% of those
respectively (Klopov, 2000). Mercury levels in blood
found in maternal blood, and the placenta barrier,
below 20 µg/L are regarded as acceptable according to
therefore, appears to prevent a major part of the
WHO guidelines (Klopov, 2000).
toxaphene transfer to the fetus via blood. An exception
to this is the ratio of toxaphene concentrations in
The results of the analysis of blood taken from women
maternal and umbilical cord blood for women from
giving birth and from cord blood (Tables 7.27.4) show
the Kola Peninsula.
mercury levels within the ranges reported previously
for areas of the Russian Arctic (Klopov, 2000). Slightly
Figure 7.12 shows the geographic distribution of
higher values were found in the blood of women giving
toxaphenes in the regions of the Russian Arctic stud-
birth in Anadyrsky District of the Chukchi AO
ied, and Figure 7.13 compares the results obtained
(2.0 µg/L), and the Dudinka area of the Taymir AO
with the earlier AMAP results (AMAP, 2003a). The
(2.3 µg/L) (see Tables 7.2 and 7.3). In individual blood
highest concentrations of toxaphenes were detected in
samples from Dudinka, mercury concentrations were
the blood of women from Chukotsky District of the
as high as 1820 µg/L.
Chukchi AO (geometric mean of 0.20 µg/L), with
toxaphene concentrations as high as 0.8 µg/L occur-
For women from the control areas, mercury concentra-
ring in individual samples.
tions were below the detection limit (<1.0 µg/L). In
the mother-infant pair samples, mercury concentra-
The pattern observed for toxaphenes can also be seen
tion in umbilical cord blood did not show a significant
in the distribution of mirex in maternal and cord
decrease in levels when compared to maternal blood
blood in the Arctic regions of Russia. Concentrations
samples, suggesting that the placenta is not an effective
of mirex range from 0.0070.12 µg/L in maternal
barrier in protecting the fetus from mercury transfer.
blood, and from less than the detection limit to
The geographic distribution of mercury concentra-
0.03 µg/L in cord blood. The highest geometric mean
tions in blood in the regions of the Russian Arctic
concentrations of mirex were found for maternal and
under study are shown in Figure 7.14, whilst Figure
cord blood from Chukotsky District, up to 0.5 µg/L in
7.15 compares the results obtained with data from
individual samples. By comparison, the mirex concen-
AMAP (AMAP, 2003a).
139
7.4. PTS levels in blood of the general adult indigenous population
Chapter 7
Figure 7.15. Comparison of the results obtained in this project for mercury
in maternal blood with results from the AMAP circumpolar blood monitoring study
(AMAP, 2003a).
Figure 7.14. Levels of mercury in maternal and cord blood in the Russian Arctic
(geometric means, µg/L plasma).
cadmium found in women giving birth were higher for
residents of Chukotka and Taymir, than for women liv-
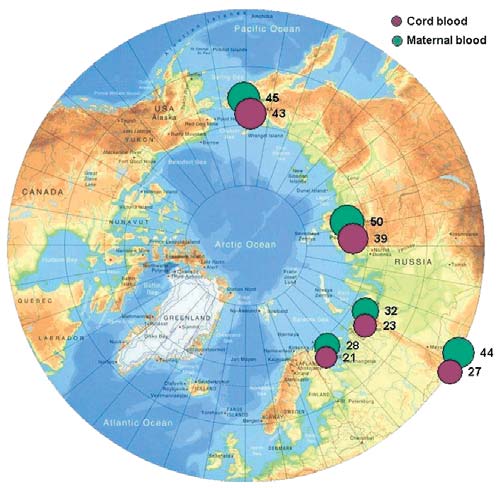
Lead
ing on the Kola peninsula, or in Aral (control area).
The distribution of lead concentrations in maternal
Concentrations of cadmium in women from the Kola
and umbilical cord blood in the Russian Arctic regions
Peninsula were found to be lower than concentrations
is similar to that of mercury. As for mercury, the pla-
in the control area samples.
cental barrier does not appear to prevent the transfer
of lead to the fetus via blood, the lead concentration in
7.4. PTS levels in blood
umbilical cord blood ranging from 7593% of the con-
of the general adult indigenous population
centration in maternal blood. Lead concentrations are
found to range from 13.3 µg/L (Norilsk) to 43 µg/L
7.4.1. Characteristics of PTS levels
(Chukotsky District of the Chukchi AO) in cord blood,
in blood of the general adult indigenous population
and 20 µg/L (Norilsk) to 52 µg/L (Iul'tinsky District
With some exceptions, PTS concentrations in the
of the Chukchi AO) in maternal blood (Tables 7.27.4).
blood of the general adult population are around 35
times, and for mercury, 9 times higher than those in
Figure 7.16 shows the spatial distribution of blood con-
maternal blood in the various areas (Table 7.5).
centrations of lead in the regions of the Russian Arctic
These facts can be explained, at least partially, by the
under study. As can be seen from the figure, the high-
est concentrations of lead are found in indigenous
women of the Chukchi AO. These levels are somewhat
higher than those reported for women living in other
regions (which vary from 21.332.2 µg/L of blood),
but these results may be explained by specific charac-
teristics of selected donor groups (Klopov, 2000).
Cadmium
The results of blood analysis for the four regions of the
Russian Arctic indicate that cadmium concentrations
in maternal and cord blood range from 0.31.1 µg/L,
and 0.10.3 µg/L, respectively (Tables 7.27.4). These
concentrations are lower than the WHO guideline
value of 2.0 µg/L, for a concentration posing no risk of
harmful effects of cadmium exposure (Klopov, 2000).
However, there are individual blood samples from
both the Chukotsky and Anadyrsky Districts of the
Chukchi AO, which exceed this limit by a factor of two.
Figure 7.17 shows the spatial distribution of blood cad-
mium concentrations in the regions of the Russian
Figure 7.16. Levels of lead in maternal and cord blood in the Russian Arctic
Arctic studied. It is worth noting that concentrations of
(geometric means, µg/L plasma).
140