Chapter 4
Persistant toxic substances (PTS)
sources and pathways
4.1. Introduction
Chapter 4
4.1. Introduction
4.2. Assessment of distant sources:
In general, the human environment is a combination
Long range atmospheric transport
of the physical, chemical, biological, social and cultur-
Due to the nature of atmospheric circulation, emission
al factors that affect human health. It should be recog-
sources located within the Northern Hemisphere, par-
nized that exposure of humans to PTS can, to certain
ticularly those in Europe and Asia, play a dominant
extent, be dependant on each of these factors. The pre-
role in the contamination of the Arctic. Given the spa-
cise role differs depending on the contaminant con-
tial distribution of PTS emission sources, and their
cerned, however, with respect to human intake, the
potential for `global' transport, evaluation of long-
chain consisting of `source pathway biological avail-
range atmospheric transport of PTS to the Arctic
ability' applies to all contaminants. Leaving aside the
region necessarily involves modeling on the hemi-
biological aspect of the problem, this chapter focuses
spheric/global scale using a multi-compartment
on PTS sources, and their physical transport pathways.
approach. To meet these requirements, appropriate
modeling tools have been developed.
Contaminant sources can be provisionally separated
into three categories:
Extensive efforts were made in the collection and
·
Distant sources: Located far from receptor sites in
preparation of input data for modeling. This included
the Arctic. Contaminants can reach receptor areas
the required meteorological and geophysical informa-
via air currents, riverine flow, and ocean currents.
tion, and data on the physical and chemical properties
During their transport, contaminants are affected by
of both the selected substances and of their emissions.
the combined effects of physical and chemical fac-
It should be noted that reliable and relatively compre-
tors. Persistence in the environment is, therefore,
hensive information on emission sources is currently
one of the most important characteristic in deter-
not available for most PTS. Therefore, an assessment of
mining the ability of contaminants to reach the
long-range atmospheric transport was undertaken for
Arctic. In this respect, PTS, due to their low degra-
substances for which emission source information is
dation rates, are often considered to be `global con-
sufficient to meet modeling requirements, namely,
taminants' subject to long-range transportation.
mercury (Hg), polychlorinated biphenyls (PCBs) and
-hexachlorocyclohexane (-HCH). It was considered
·
Local sources: These are located in receptor
that modeling results obtained for these contaminants
region, often in the vicinity of indigenous commu-
could be extrapolated to give a general overview on the
nities. Although transport of contaminants from
situation with respect to long-range atmospheric trans-
local sources to recipients is determined by the same
port of other PTS in the study.
physical and chemical processes as contaminants
from distant sources, there are a wider range of path-
An assessment of mercury, PCB and -HCH pollution
ways and mechanisms that may be involved in the
arising from emission sources in the Northern
case of local sources. For example, mechanisms of
Hemisphere and affecting regions of the Russian
soil contamination from local sources can differ sig-
North inhabited by indigenous peoples, was carried
nificantly, such that effects of local contamination
out for the reference year 1996. This assessment
can be much greater than those resulting from con-
included an evaluation of air concentrations and dep-
tamination from distant sources. In contrast to dis-
osition levels, as well as source-receptor relationships
tant sources, local sources can also affect recipients
for selected regions and for the Arctic as a whole.
through contamination by more readily degradable
Particular attention was given to the fate of contami-
substances as well as the persistent contaminants.
nants in different environmental compartments (air,
Although non-persistent contaminants are beyond
soil, water, etc.). The effect of PCBs and -HCH trans-
the scope of this project, it is important to note that
port via ocean currents, ice cover dynamics, and
the effects of PTS, when combined with those of
`Mercury Depletion Event' (MDE) (Schroeder et al.,
other types of contaminants originating from local
1998) chemistry on Arctic pollution were also exam-
sources, may be substantially increased. Similarly,
ined.
humans exposed to and affected by PTS may be
more sensitive to the acute toxic effects of other less
4.2.1. Climate conditions
persistent contaminants from local sources.
and atmospheric circulation patterns
The climate of the Russian Arctic is characterized by a
·
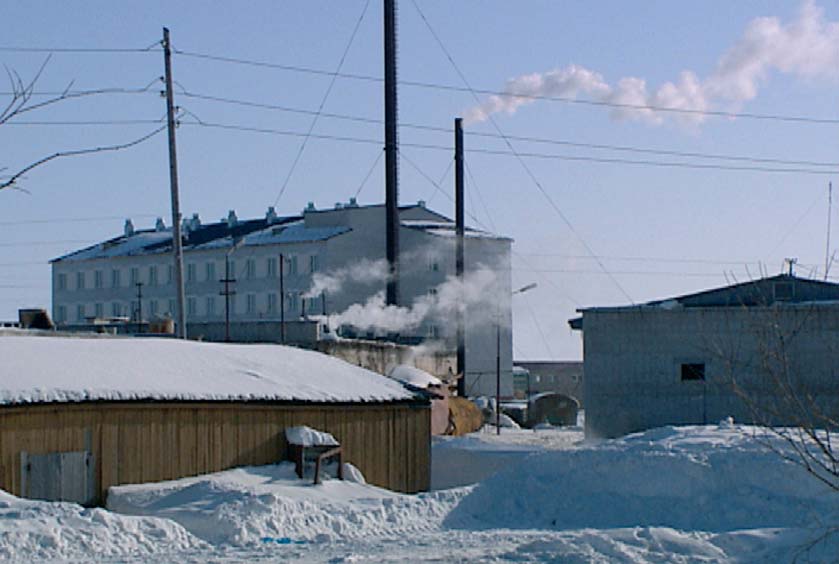
Contact sources: These comprise the intentional or
lack of solar radiation during the winter, which leads to
unintentional use of chemicals by recipients in every-
very low temperatures. In contrast, solar radiation flux
day household and occupational uses. For example,
in the summer is significant, but temperatures are still
the health of individuals using PTS-containing insec-
not high, as most incoming solar energy is utilized in
ticides for pest control or for the treatment of rein-
the melting of ice and snow. Atmospheric circulation is
deer may be directly affected by the products. A typi-
characterized by cyclonic activity in all seasons, which
cal example of an unintentional contact contaminant
promotes the exchange of air masses between the mid-
source would be the use of paints and insulating mate-
dle and high latitudes. As a result of the prevailing west-
rials containing PTS in the indoor environment.
erly airflows, the Russian Arctic experiences the mod-
34
Chapter 4
4.2. Assessment of distant sources: Long range atmospheric transport
erating influence of the Atlantic (North Atlantic
Current). This influence is stronger in western parts
than in central and eastern parts. The western Russian
Arctic is therefore warmer, with a much lower temper-
ature variation between winter and summer than that
found in the eastern part of the Russian North, which
is characterized by the more severe climatic conditions.
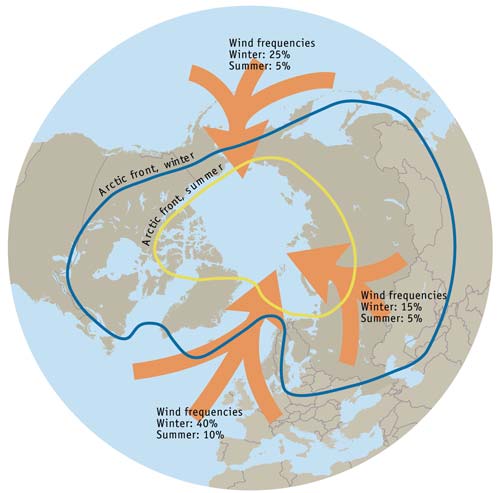
Atmospheric circulation in the Arctic region differs
between winter and summer (Figure 4.1) with the pre-
vailing atmospheric currents in the lower Arctic tropo-
sphere depending upon the location of quasi-station-
ary pressure systems in the Northern Hemisphere, the
Icelandic and Aleutian Lows, and Siberian and North
American Highs.
In winter, due to the geographical position of these sys-
tems, air masses move into the Arctic from Europe in a
northeasterly direction, or from central Asia and
Siberia. Western regions of the Russian North
Murmansk Oblast and the Nenets Autonomous Okrug
Figure 4.1. Mean position of the Arctic air mass in January and July,
(AO) are affected mainly by southwesterly or westerly
and the winter and summer frequencies of winds (AMAP, 1997).
airflows, bringing air masses from Eastern and Central
Europe, as well as from central Russia. In the central
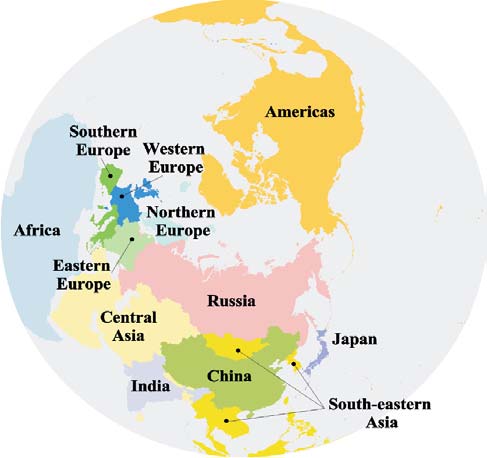
4.2.2. Emission sources
regions Yamalo-Nenets AO, Taymir AO, and the
Emission sources of Hg, PCBs and -HCH were divided
Republic of Sakha (Yakutia) southerly airflows pre-
into several groups according to their geographical
vail, transporting air masses from central Russia, the
location (Figure 4.2). The key criterion used for the
Urals, the south of Siberia and central and eastern
selection of a specific region as an aggregate emission
Asia. Over the easternmost region the Chukchi AO
source was the possible influence of emissions from
northerly airflows predominate in winter.
this region on the Russian North.
In summer, the continental high-pressure systems dis-
appear and oceanic low-pressure systems weaken. Over
the Arctic Ocean, high-pressure systems occur more
frequently than in winter, causing an outflow of Arctic
air in the meridional direction. The European region
comes under the impact of the Azores anticyclone.
Over central Eurasia and the central part of North
America, low-pressure systems dominate. The influx of
air masses to the Arctic mainly occurs over the Aleutian
Islands/Bering Sea region in the east, and from the
North Atlantic, along the north-western periphery of
Azores anticyclone, in the west. Compared with winter,
the northerly component is more frequent in atmos-
pheric transport in summer across all regions of the
Russian Arctic except for Chukotka. Chukotka, during
the summer, is predominantly affected by transport
either from the Pacific Ocean, or from Eastern Asia
and the Russian Far East, some transport from the
north still occurs however.
Figure 4.2. Source regions of the Northern Hemisphere considered
Atmospheric circulation is also responsible for the pre-
in the source receptor analysis.
cipitation pattern in the Russian Arctic. The most abun-
dant annual precipitation takes place in the western part
The number of the selected regions varies for different
and can reach 500-600 mm/y. Annual precipitation
pollutants. For simplicity, generalized names were used
decreases from the west towards the east, and over the
for some regions, e.g., the region identified as `Central
north of the Republic of Sakha (Yakutia) is mainly within
Asia' actually includes central, western, and southern
the range of 100-150 mm/y. In the easternmost part of the
Asia. Selected emission sources regions for the pollutants
Russian Arctic, precipitation is relatively high (300-
under consideration are presented in Table 4.1. Source
600 mm/y), and caused by the southerly transport of air
region boundaries also vary depending upon the contam-
masses from the Pacific Ocean, especially during summer.
inant in question. For example, China and Japan are con-
35
4.2. Assessment of distant sources: Long range atmospheric transport
Chapter 4
sidered as separate sources for mercury, but included in
Mercury
larger Asian source regions for the other contaminants.
The industrial and urbanized regions of the world
For -HCH, China and India are important enough
account for the majority of anthropogenic mercury
sources to consider their emissions separately, whereas
emissions to the atmosphere. To evaluate the anthro-
Northern Europe was omitted as -HCH emissions in this
pogenic input of mercury to the Northern
region in 1996 were insignificant. The Americas (North
Hemisphere, the most recently available global emis-
and Central) are included as a single source region, due
sion inventory, that for 1995, (Pacyna and Pacyna,
to their greater distance from the Russian North.
2002) was used. The original global emissions dataset
has a resolution of 1°x1° lat./long., with mercury emis-
sions speciated into three chemical forms: gaseous ele-
mental mercury (Hg0), gaseous oxidized mercury
(Hg2+), and particulate mercury (Hgpart). These emis-
sion data were redistributed to a lower resolution
(2.5°x2.5°), suitable for input to the air transport
model employed, assuming uniform distribution over
each grid cell.
The most significant emission sources are in Eastern
Asia, Europe and the eastern part of North America.
Considerable emissions also occur in the Indian sub-
continent and the Arabian Peninsula. The total
amount of anthropogenic mercury emissions in 1995
from the Northern Hemisphere was estimated as 1887
tonnes.
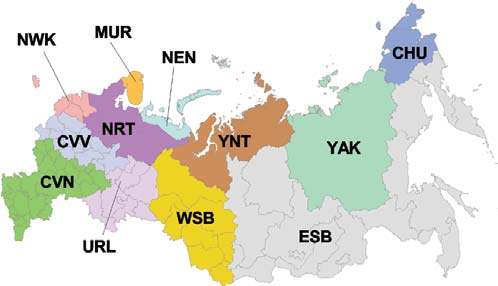
Table 4.1. Regions of the Northern Hemisphere selected as source areas
In order to assess the impact of different mercury emis-
for long range transported pollutants.
sion sources on the contamination of the Russian
North, the entire hemispheric emission field was divid-
Due to their proximity to the Russian North and the sig-
ed into 11 regions: Russia, China, Central Asia, the
nificant polluting influence of some regions of the
Americas, Japan, Southeast Asia, Africa, Eastern
Russian Federation, the territory of Russia was subdivid-
Europe, Western Europe, Southern Europe, and
ed into twelve source regions according to current
Northern Europe. The relative contribution of each
administrative boundaries and to their potential impact
region to total mercury emissions in the Northern
on Arctic ecosystems. The Location of these regions and
Hemisphere is presented in Figure 4.4(a).
abbreviated identification codes is shown in Figure 4.3.
The first five regions (MUR, NEN, YNT, YAK, and
This diagram shows that more than one third (34%) of
CHU) are also considered as the receptor regions.
the total mercury emissions originate in China.
Considerable emissions also originate in Central Asia
(14%), the Americas (11%), Japan (9%), and Russia
(8%). The contribution of other regions specified does
not exceed 7%.
Figure 4.4(b) shows total mercury emissions from differ-
ent regions of the Russian Federation. The most signifi-
cant emission sources are located in the Central-
Chernozem, Volga, and North-Caucasian regions (CVN),
the Ural region (URL), and the Central and Volgo-Viatsky
regions (CVV).
Mercury emissions from natural sources contribute a
MUR Murmansk Oblast;
NWK North-Western region
significant proportion of the total mercury input to the
and Kaliningrad Oblast;
atmosphere. Estimates for the value of natural emis-
NEN The Nenets AO;
CVV Central
and Volgo-Viatsky regions;
sions and re-emissions were based on a literature sur-
YNT The Yamalo-Nenets AO
CVN Central-Chernozem, Volga
vey. Mercury emissions from natural sources were
and Taymir AO;
and Northern Caucasus regions;
YAK The Republic of Sakha (Yakutia); URL Ural region;
apportioned over the Northern Hemisphere on the
CHU The Chukchi AO;
WSB West Siberian region;
basis of the nature of the underlying land/sea surface.
NRT Northern region;
ESB East Siberian and Far-Eastern
Five surface categories were distinguished: ice covered
regions.
land (glaciers, etc), seawater, soil developed from geo-
chemical mercury belts, soils in areas of mercury
Figure 4.3. Aggregated regions of the Russian Federation chosen for source recep
tor analysis. The first five regions listed (MUR, NEN, YNT, YAK, and CHU) are consid
deposits, and other (background) soils. It was assumed
ered as both source and receptor regions, the rest are considered as source regions.
that there is zero mercury emission from ice caps/gla-
36
Chapter 4
4.2. Assessment of distant sources: Long range atmospheric transport
b
Figure 4.4.
(a) Contribution of different regions of the Northern Hemisphere
to total anthropogenic mercury emissions, (b) total anthropogenic
mercury emissions from different regions of the Russian Federation.
a
ciers. Natural emissions from seawater were distributed
in 1996 were about 80, 23, 16, and 4.5 tonnes, respec-
proportionally to the ocean's primary production of
tively. Congener composition of PCB emissions varies
carbon. Emissions from soil are most significant from
between source regions.
soils occurring over mercury deposits and lowest for
background soils. In addition, the temperature
In order to study the contributions of different source
dependence of emission fluxes was also calculated,
regions in the Northern Hemisphere to the contami-
based on data obtained through measurements.
nation of the receptor-regions in the Russian Arctic, six
main regional sources were identified, based on the
PCBs
emission distribution: Russia, Northwest Europe,
Modeling long-range transport of individual PCB con-
Southeast Europe, the Americas, Southeast Asia, and
geners to the Russian North was made using a global
Central Asia and Africa.
emission inventory concerning 22 individual PCB con-
geners covering the period 1930-2000 (Breivik et al.,
The major emission sources of PCBs in the Northern
2002b). This inventory is based on estimates of the
Hemisphere in 1996 were the Americas (24%),
global production and consumption of these PCBs in
Russia (23%), Southeast Europe (19%), and
114 countries (Breivik et al., 2002a). The emissions
Northwest Europe (16%) (Figure 4.5(a)). The main
were distributed to the (2.5° x 2.5° lat./long.) model
Russian emission sources are located in Central-
grid using (as a proxy for emission distribution) a 1990
Chernozem, Volga and North-Caucasus regions (CVN)
population distribution data set obtained from the
as well as in Central and Volgo-Viatsky regions (CVV)
CGEIC website (http://www.ortech.ca/cgeic).
(Figure 4.5(b)).
The total global production of PCBs from 1930-1993
-HCH
amounted to approximately 1.3 million tonnes. Almost
The scenario for -HCH emissions in the Northern
97% of intentionally produced PCBs were used in the
Hemisphere was based on official data submitted to
Northern Hemisphere. Emission data for individual
the UN ECE Secretariat in 2002 (Vestreng and Klein,
congeners for 1996 were used in all model calculations
2000) and available expert estimates (Pacyna et al.,
and, according to the high emission scenario discussed
1999). In addition, -HCH emissions for 1990-1996
by Breivik et al. (2002b), total emissions of the 22 PCB
from the Russian Federation, and some other coun-
congeners in the Northern Hemisphere in 1996
tries in the Northern Hemisphere were estimated
amounted to about 662 tonnes. Total emissions of PCB-
from information in a range of literature sources
28, -118, -153, and -180 from the Northern Hemisphere
(Revich et al., 1999, Year-books, 1992, 1993 1999,
b
Figure 4.5.
(a) Contribution of different regions to PCB emissions (22 congeners)
in the Northern Hemisphere for 1996, (b) PCB emissions (22 congeners)
a
from different regions of the Russian Federation in 1996.
37
4.2. Assessment of distant sources: Long range atmospheric transport
Chapter 4
b
Figure 4.6.
(a) Contribution of different regions to HCH emission
in the Northern Hemisphere for 1996, (b) HCH emissions
a
from different regions of the Russian Federation in 1996.
Ananieva et al., 1990, Li et al., 1996, 1998,1999, and
Mercury, PCB and -HCH concentrations in air and
Macdonald et al., 2000) regarding the use of this insec-
their deposition loads as evaluated for the Northern
ticide. To estimate emissions from data on insecticide
Hemisphere and the Arctic for 1996, are discussed
use, the emission factor for lindane in agricultural use
below in the relevant subsections. Particular attention
(0.5) (Guidebook, 1999) was applied. The resulting
has been given to atmospheric long-range transport to,
estimate for total -HCH emissions from the Northern
and deposition of these pollutants in the Russian
Hemisphere in 1996 was about 3445 tonnes. The spa-
Arctic. For mercury, the effect of Mercury Depletion
tial distribution of these -HCH emissions in the
Event (MDE) chemistry on Arctic deposition was con-
Northern Hemisphere, for modeling purposes, was
sidered. In addition, for the assessment of environ-
made using crop area as a surrogate parameter
mental pollution by PCBs and -HCH, the role of trans-
(Pacyna et al., 1999).
port via sea currents and ice cover dynamics were taken
into account. The marine environment is particularly
To model long-range atmospheric transport of -HCH
important in relation to the transport and fate of
to the Russian North, nine source regions were identi-
-HCH. Characteristic values of mean annual air con-
fied in the Northern Hemisphere: Russia, Western
centrations and deposition fluxes of mercury, PCBs
Europe, Eastern Europe, Southern Europe, the
and -HCH over the Arctic area are summarized in
Americas, China, India, the rest of Asia, and Africa.
Table 4.2. The consistency of the modeling results was
China and India were considered as individual source
verified by comparison with available measurements.
regions due to their high use of this insecticide com-
pared to the rest of Asia. Estimates of the contribution
of main source regions to total -HCH emissions in the
Northern Hemisphere in 1996, based on the selected
emission scenario, is shown in Figure 4.6(a). -HCH
emissions from Russian regions in 1996 are shown in
Figure 4.6(b).
The main contribution to -HCH emissions in the
Northern Hemisphere, was made by India (53%) and
Western Europe (18%). The contribution from
Table 4.2. Characteristic values of mean annual air concentrations and annual
Russia is only 2%. Major Russian -HCH emissions in
deposition fluxes for mercury, selected PCBs, and µ HCH over the Arctic in 1996.
1996 originated from the European part of the
Russian Federation. The highest Russian -HCH con-
Mercury
tributions were made by sources located in the
Figure 4.7 shows the annual deposition flux of mer-
Central-Chernozem, Volga and North-Caucasian
cury in the Northern Hemisphere. Highest deposi-
regions (CVN).
tion levels are in those regions with considerable
emissions: i.e. Southeast Asia, Europe, and the east-
4.2.3. Contamination levels in the Arctic resulting
ern part of North America. For other areas, the depo-
from long range atmospheric transport
sition pattern, to some extent, corresponds to annual
To evaluate levels of contamination of the Arctic region
precipitation values, since wet deposition plays a
by global pollutants (mercury, PCBs, and -HCH)
dominant role in removing mercury from the atmos-
resulting from long-range atmospheric transport, a
phere. From the model results, total deposition over
hemispheric modeling approach was employed. For
the Arctic region in 1996 amounted to 240 tonnes.
this purpose, the EMEP Meteorological Synthesizing
The influence of MDEs on deposition fluxes within
Centre-East (MSC-E) have developed hemispheric
the Arctic region has been the subject of considerable
multi-compartment transport models `MSCE-Hg-Hem'
research in recent years. The postulated MDE mecha-
and `MSCE-POP'.
nism (Lindberg et al., 2002) includes complicated
38
Chapter 4
4.2. Assessment of distant sources: Long range atmospheric transport
chemistry, involving the formation of halogen related
Figure 4.7.
radicals. The development of a detailed model com-
Annual deposition
of total mercury in the
ponent for MDE chemistry is the subject of a separate
Northern Hemisphere.
study. For the purposes of this study, an attempt was
The enlarged panel shows
made to qualitatively estimate the effect of MDE on
elevated mercury deposition
over the Arctic coast due
Arctic Hg contamination by using a simplified set of
to MDEs.
parameters.
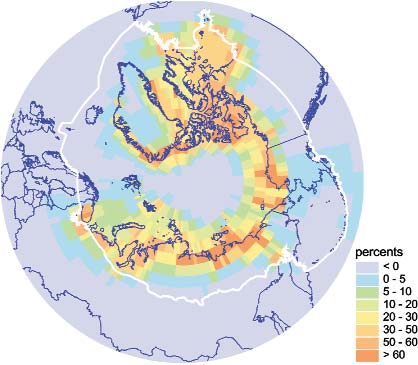
As illustrated in the enlarged panel in Figure 4.7, even
short-term phenomena such as MDEs, which occur
during only a few weeks of the year, can considerably
increase the annual deposition of mercury in some
regions of the Arctic, in particular coastal areas. The
influence of MDEs on total annual mercury deposition
is illustrated in Figure 4.8(a). Additional contributions
of mercury as a result of MDEs can amount to more
than 50 percent of total deposition values in areas adja-
cent to Arctic coasts (i.e. within about 300 km of the
coast inland and offshore). These areas include the
Queen Elizabeth Islands, Hudson Bay, the White Sea,
the Gulf of the Ob river, and the Laptev Sea coast,
among others. Negative values (for percentage
increase in deposition due to MDEs) show that
increased deposition fluxes due to MDEs in some
to the model parameters used), when monthly depo-
regions, lead to decreased fluxes in other areas. A part
sition in the Arctic increased two-fold or greater.
of the mercury transported by the air therefore does
The calculations predict that MDE are responsible
not enter the High Arctic during springtime, due to it
for deposition of about 50 tonnes of mercury per
being scavenged during MDEs over coastal and con-
year in the Arctic about 20% of the total annual
tiguous regions.
deposition.
Figure 4.8(b) shows the seasonal variation in total
Due to the high transport potential of mercury in the
mercury deposition in the Arctic. The model pre-
atmosphere, many anthropogenic and natural sources
dicts that the most pronounced MDE effect is in May
from different regions of the Northern Hemisphere
and June (taking into account a temporal shift due
contribute to Arctic pollution. The contribution from
Figure 4.8.
(a) Influence of MDEs on
total annual mercury deposi
tion in the Arctic (area
defined by the white (AMAP
area) boundary), and (b) sea
sonal variation in total mer
cury deposition to the Arctic
with and without MDEs. The
figures present the difference
between two model compu
tational runs one with and
one without MDEs included.
a
b
a
Figure 4.9. Contribution of different source regions to the annual deposition
of mercury in the Arctic arising from (a) anthropogenic sources and (b) natural
b
sources and re emissions.
39
4.2. Assessment of distant sources: Long range atmospheric transport
Chapter 4
the various regions of the Northern Hemisphere to total
annual mercury deposition in the Arctic from anthro-
pogenic and from natural sources is shown in Figures
4.9(a) and 4.9(b), respectively for the upper (Scenario I)
and lower (Scenario II) limits of emission estimates.
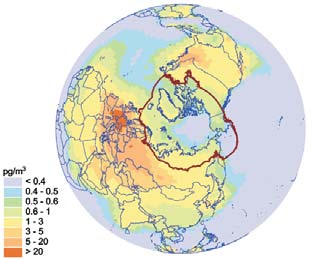
Figure 4.10.
Mean annual air
concentrations of PCB 153
over the Northern
Hemisphere. The enlarged
panel shows the air
concentration pattern
over the Arctic region.
Figure 4.11.
Seasonal variation in the relative contributions of different source regions to PCB 153
deposition in the Arctic.
considerable uncertainty regarding the input parameters
used for the modeling of natural emission and re-emis-
sion processes, and that natural emissions cannot be con-
trolled by political decisions, attention should be focused
on deposition from anthropogenic sources.
PCBs
Levels of PCB contamination are exemplified by PCB-
153. Figure 4.10 shows that areas with the highest air
concentrations of PCB-153 are located close to
European and North American source regions. Air
The most significant contribution to anthropogenic mer-
concentrations range from 5 to 20 pg/m3 in contami-
cury deposition in the Arctic come from sources located
nated areas of North America, and can exceed
in Southeast Asia, Europe and Russia. The most signifi-
20 pg/m3 in Europe. European sources make the
cant contributions to the natural component of annual
largest contribution to the contamination of the Arctic
deposition in the Arctic are from the Pacific and Atlantic
region. The mean annual air concentration of PCB-153
Oceans, and from Asia. Bearing in mind that there is still
over the Arctic ranges from 0.2 to 4 pg/m3.
Figure 4.12.
Air concentrations
of PCB 153 emitted in
January and May from
sources in the Americas
and Northwest Europe.
respectively, from modelling
results for 1996.
a
b
Americas
January
Northwest Europe
c
d
Americas
May
Northwest Europe
40
Chapter 4
4.2. Assessment of distant sources: Long range atmospheric transport
The relative contributions made by different source
preceding 1996 equals 629 kg. Therefore, the esti-
regions to PCB-153 deposition in the Arctic are subject
mated total PCB-153 deposition to the Arctic in 1996
to seasonal variations, as shown in Figure 4.11. The
was 1.15 tonnes.
contribution from sources in Northwest Europe is the
most variable, varying from about 70% in January, to
On the basis of the transport simulations for the four
about 25% in May. The amount contributed by the
congeners (PCB-28, -118, -153, and -180), and taking
Americas is only about 5% in January, but in May it
into account the fractions of these congeners in the
amounts to 26%, and is comparable with the contribu-
typical PCB mixture in air, a rough estimate of total
tion from sources in Northwest Europe.
PCB deposition in the Arctic in 1996 of approximately
40 tonnes was made.
These noticeable variations are explained by the
peculiarities of atmospheric circulation in the Arctic
-HCH
during various seasons, and also by seasonal varia-
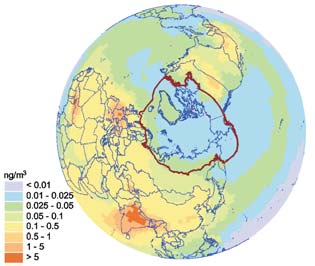
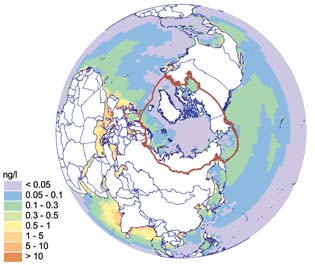
Figure 4.14 represents the spatial distribution of -
tions in temperature, precipitation, and degradation
HCH concentrations in the air over the Northern
rates. Seasonal variation of emissions are not taken
Hemisphere and the Arctic. High concentrations (up
into account in this assessment. To illustrate pathways
to 5 ng/m3 or more) are mainly characteristic of
of atmospheric transport, simulation results of regions with high emissions. However, in spite of the
PCB-153 transport from two source regions (the
fact that there are no significant sources in the Arctic
Americas and Northwest Europe) for 1996 were
region, relatively high concentrations (from 0.01 to
examined. Figures. 4.12 show air concentrations of
0.11 ng/m3) are also observed there. These concentra-
PCB-153 emitted in the Americas and Northwestern
tions result from long-range transport of -HCH from
Europe in January. The air concentrations of PCB-
remote sources, mainly in Western Europe, India, and
153 originating from the same sources in May are
the Americas.
given in Figures. 4.12.
Figure 4.13 shows the contribution of different source
regions to PCB-153 deposition in the Arctic. The major
contribution is from sources in Northwest Europe
(about 40%). Other significant contributors are Russia
(19%), the Americas (17%) and Southeast Europe
(16%). For PCB-28 and PCB-118, Northwest Europe
and Russia are the main contributors. However, for
PCB-180, main contributors are Northwest Europe and
the Americas.
The total amount of PCB-153 deposited in the Arctic
region from emissions in 1996 was estimated at
527 kg. The contribution from re-emission of PCB-
Figure 4.13. Contributions of different source regions to PCB 153
153 accumulated in the environment in the period
deposition in the Arctic region in 1996.
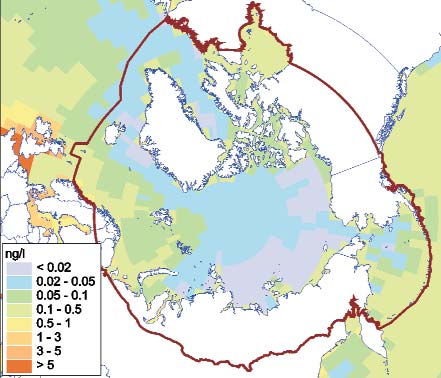
Figure 4.14.
Figure 4.15.
HCH concentrations
Mean annual concentrations
in air of the lower
of HCH in seawater
atmosphere over
in the Northern Hemisphere.
the Northern Hemisphere
The enlarged panel shows
and the Arctic.
the seawater concentrations
pattern over the Arctic
Ocean.
41
4.2. Assessment of distant sources: Long range atmospheric transport
Chapter 4
Since -HCH tends to accumulate in seawater (which
accounts for about 80% of the overall environmental
pool of this substance), the spatial distribution of -
HCH in seawater is of interest. The distribution of -
HCH in seawater (Figure 4.15) reveals that maximum
concentrations are found in the Indian Ocean, the
Mediterranean Sea, and the East Atlantic.
Considerable amounts of -HCH flow into the Arctic
Ocean from the North Atlantic, as reflected in the
higher seawater concentrations in the Barents Sea in
the region between northern Norway and Svalbard.
Seawater concentrations in the seas along the coast of
northern Russian are in the range 0.012 ng/L.
Figure 4.17. Spatial distribution of mean annual air concentrations
of total gaseous mercury in the Russian North.
The total amount of -HCH deposited in the Arctic
region in 1996 from the atmosphere was estimated to
regions including the Yamalo-Nenets AO, the Republic
be 78 tonnes. Due to high deposition rates over the sea
of Sakha (Yakutia), and the Chukchi AO. A possible
(the models assume this rate to be twice as high over
reason for this, in addition to distance from main emis-
sea as on land), and taking into account the large pro-
sions areas, is the decrease in elemental mercury con-
portion of the Arctic area that is covered by ocean
centration over the Arctic coast during springtime, as a
(about 60%, according to figures provided by AMAP,
result of MDEs.
1998), this equates to an estimate for -HCH deposited
Table 4.3.
to the Arctic Ocean in 1996 of 58 tonnes.
Characteristic values of mer
cury air concentrations in the
Modeling results have been used to indicate contribu-
Russian North, ng/m3.
tions of different emission sources to the contamina-
tion of the Arctic region by -HCH (Figure 4.16).
Western Europe is the largest contributor to this region
(about 40%), followed by India (19%), the Americas
(17%), China (10%), and Russia (6%), with other
source regions responsible for the remaining 8%.
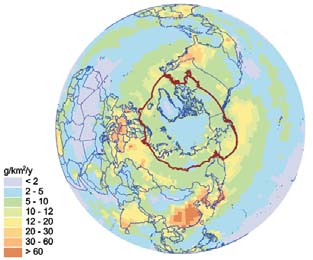
The spatial distribution of annual deposition loads of
total mercury in the Russian North is shown in Figure
4.18. The highest depositions, exceeding 20 g/km2/y,
are observed over the coast of the Arctic Ocean, due to
MDEs (Table 4.4). The lowest depositions (less than
5 g/km2/y), are in Central Yakutia, an area of low
annual precipitation. Values of total mercury deposi-
tion for regions of the Russian North and the Arctic as
a whole are given in Table 4.5.
Figure 4.16. Contributions of different source regions to HCH deposition
in the Arctic in 1996.
4.2.4. Contamination levels and deposition loads
resulting from long range atmospheric transport
to the Russian North
Mercury
Figure 4.17 shows the modeled spatial distribution of
Figure 4.18. Annual deposition of total mercury
mean annual concentrations of total gaseous mercury
in the Russian North.
(TGM) in the air in northern Russia, which are fairly
Table 4.4.
constant across the territory (from 1.4 to 1.8 ng/m3)
Characteristic values of total
(see also Table 4.3). Concentration levels over
annual mercury deposition
Murmansk Oblast and in the central Republic of Sakha
loads in the Russian North,
g/km2/y.
(Yakutia) are slightly elevated, mainly due to local
emission sources. There is also a weak decreasing gra-
dient in mercury concentrations to the north over
42
Chapter 4
4.2. Assessment of distant sources: Long range atmospheric transport
A similar pattern is seen for deposition loads.
Substantial values (>150 mg/km2/y) are estimated for
Murmansk Oblast, the Nenets AO and the southern
part of the Yamalo-Nenets and Taymir AOs as well as for
Table 4.5. Total deposition of mercury in 1996 in different regions
the western part of the Sakha Republic. Moderate val-
of the Russian North, and the Arctic as a whole, t/y.
ues (70-150 mg/km2/y) are obtained for the northern
part of the Yamalo-Nenets and Taymir AOs, the
PCBs
Republic of Sakha (Yakutia), and the western part of
Figures 4.19 and 4.20 show the spatial distributions of
Chukchi AO. The northern parts of the Russian North
mean annual air concentrations and annual deposition
are characterized by lower values for deposition loads
loads of PCB-153 over selected regions of the Russian
(<70 mg/km2/y) (Table 4.7).
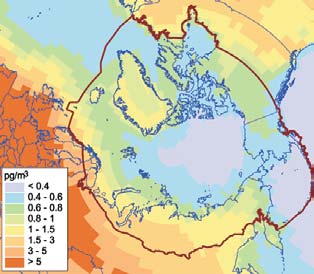
North for 1996. There is a clear decrease in PCB-153
Table 4.7.
air concentrations from western to eastern areas of the
Characteristic values
Russian North, with increasing distance from source
of PCB 153 annual deposition
areas in Europe. Relatively high air concentrations (up
loads in the Russian North,
mg/km2/y.
to 4 pg/m3) occur in Murmansk Oblast, the Nenets
AO, and the southern part of the Yamalo-Nenets and
Taymir AOs (Table 4.6). Moderate values (12 pg/m3)
are characteristic of the northern part of the Yamalo-
Nenets AO, the Taymir AO, and the Republic of Sakha
(Yakutia). The Chukchi AO is characterized by low val-
Depositions of PCB-153 and of total PCBs to the
ues (<1 pg/m3).
Russian North and the Arctic are given in Table 4.8. To
calculate these depositions, emissions of the 22 PCB
congeners considered, from all source regions, were
divided into four groups: di- plus tri-chlorinated PCBs,
tetra- plus penta-chlorinated PCBs, hexachlorinated
PCBs, and hepta- plus octa-chlorinated PCBs. It was
assumed that these groups are transported in a similar
way to PCB-28, -118, -153 and -180, respectively.
Together, these 22 congeners represent about one half
of total PCB emissions, a fact that was taken into
account in the calculation.
Figure 4.19. Spatial distribution of mean annual air concentrations
of PCB 153 in the Russian North, calculated for 1996.
Table 4.8. Total deposition of PCB 153 and total PCB in 1996
Table 4.6.
in different regions of the Russian North, and the Arctic as a whole, t/y.
Characteristic values
of PCB 153 air concentrations
in the Russian North, pg/m3.
By undertaking simulations of long-range transport
and the accumulation of four PCB congeners (PCB-28,
-118, -153 and -180), it was possible to compare the con-
gener compositions in the air of different regions of
the Russian North (Figure 4.21).
Figure 4.21.
PCB congener composition
in air of different regions
of the Russian North.
For all receptor regions, the fraction of PCB-28 is the
highest and PCB-180 the lowest, with other congeners
Figure 4.20. Annual deposition of PCB 153 in the Russian North,
falling between, however, the congener patterns vary
calculated for 1996.
noticeably between the regions.
43
4.2. Assessment of distant sources: Long range atmospheric transport
Chapter 4
-HCH
lower for the Taymir AO, the Republic of Sakha
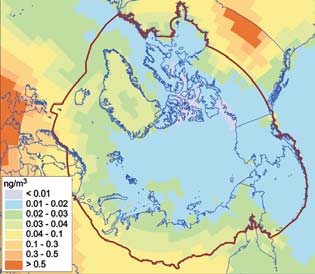
Mean annual air concentrations of -HCH in the recep-
(Yakutia), and the Chukchi AO (0.13 g/km2/y).
tor regions of the Russian North, for 1996, are illustrat-
Annual deposition loads vary from region to region
ed in Figure 4.22. Higher air concentration levels (from
(Table 4.10). This is mainly due to different precipita-
0.02 to 0.07 ng/m3) are characteristic for Murmansk
tion levels in these regions.
Oblast, the Nenets AO, the south of the Yamalo-Nenets
AO, and the Republic of Sakha (Yakutia). Lower levels
Estimated values for total deposition of -HCH in the
(from 0.01 to 0.3 ng/m3) are characteristic for the
regions of the Russian North and the Arctic as a whole
Taymir AO, the Chukchi AO, and the north of the
are given in Table 4.11.
Republic of Sakha (Yakutia) (Table 4.9).
Table 4.11. Total deposition of HCH in 1996 in different regions of the Russian
North, and the Arctic as a whole, t/y.
4.2.5. Source receptor relationships
for the selected pilot study regions.
4.2.5.1. Murmansk Oblast
Mercury
Murmansk Oblast is the most westerly region of
Russia and is located on the Kola Peninsula. This
Figure 4.22. Spatial distribution of mean annual air concentrations of
explains the greater influence of European sources
HCH
in the Russian North, calculated for 1996.
of mercury on this region (including sources both
inside and outside the territories of Russia). Figures
Table 4.9.
4.24(a) and 4.24(b) illustrate the contributions of
Characteristic values
of HCH air concentrations
major Northern Hemispheric and Russian anthro-
in the Russian North, ng/m3.
pogenic mercury source regions to annual mercury
deposition in Murmansk Oblast. The largest contri-
bution is made by Russian sources (35%). Among
these, about 13% is from Murmansk Oblast itself
(MUR) and 18% from other Russian European
regions (NRT, NWK, CVV, CVN and URL). The most
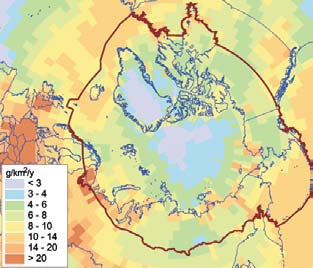
The spatial distribution of -HCH annual deposition
important sources outside of Russia are those in
loads is shown in Figure 4.23. Deposition loads are larg-
Eastern Europe (12%), China (11%), the Americas
er for Murmansk Oblast, the Nenets AO, and the
(10%), and Western Europe (10%). The `other' cate-
Yamalo-Nenets AO (from 2 to 7 g/km2/y or more) and
gory (defined in this and other sections addressing
mercury source-receptor relationships) includes
Northern and Southern Europe, Southeast Asia
(excluding China and Japan), and Africa, due to
their relatively small contributions to depositions in
the receptor area.
PCB
The largest contributions to PCB-153 deposition in
Murmansk Oblast are from emission sources in
Russia (44%), Northwest Europe (35%) and
Southeast Europe (14%) (Figure 4.25(a)). Contri-
butions from sources located in the Americas, Africa,
and Central Asia are less significant due to their con-
Figure 4.23. Annual deposition of
siderable distance from the Oblast. Amongst Russian
HCH in the Russian North,
calculated for 1996.
sources (Figure 4.25(b)), the major contribution is
made by emissions from Murmansk Oblast itself
Table 4.10.
(22%).
Characteristic values of HCH
annual deposition loads in the
Russian North, g/km2/y.
-HCH
-HCH sources in Western Europe make the largest
contribution to deposition in Murmansk Oblast (more
than 50%). Other significant contributors are Russia
(17 %) and India (9%) (Figure 4.26(a)).
44
Chapter 4
4.2. Assessment of distant sources: Long range atmospheric transport
b
Figure 4.24. Contributions from anthropogenic sources in (a) regions
of the Northern Hemisphere, (b) regions of Russia to annual mercury deposition
a
in Murmansk Oblast.
b
Figure 4.25. Contributions from anthropogenic sources in (a) regions
of the Northern Hemisphere, (b) regions of Russia to annual PCB 153 deposition
a
in Murmansk Oblast.
b
Figure 4.26. Contributions from anthropogenic sources in (a) regions
of the Northern Hemisphere, and (b) regions of Russia to annual HCH deposition
a
in Murmansk Oblast.
Russian contributions to -HCH depositions in
4.2.5.2. The Nenets Autonomous Okrug
Murmansk Oblast are mostly made by the Central and
Volgo-Viatsky regions (CVV) and the Central-
Mercury
Chernozem, Volga, and North-Caucasian regions
The Nenets AO is located in the northern part of
(CVN), 5% and 4%, respectively. The inputs from
European Russia. Therefore the main source areas of
other regions are comparatively small (Figure 4.26(b)).
long-range atmospherically transported pollution
For the purposes of this report, contributions from
affecting the region are similar to those affecting
Russian emission sources to -HCH depositions in
Murmansk Oblast. Differences in deposition are asso-
receptor areas are shown only for those regions with
ciated mainly with the greater significance of Russian
significant emissions of -HCH.
emission source regions. Figures 4.27(a) and 4.27(b)
b
Figure 4.27. Contributions from anthropogenic sources in (a) regions of the
a
Northern Hemisphere, (b) regions of Russia to annual mercury deposition in the
Nenets AO.
45
4.2. Assessment of distant sources: Long range atmospheric transport
Chapter 4
show the relative contribution of the different regions
-HCH
to the total annual deposition of mercury in the Nenets
The major contributions to the contamination of the
AO from anthropogenic sources. The largest contribu-
Nenets AO by -HCH are from emission sources in
tion is from Russian sources (35%). However, sources
Western Europe (49%), Russia (23%), and India (9%)
within the Nenets AO itself only contribute 7%, where-
(Figure 4.29(a)). The main sources within the Russian
as the combined contribution of regions in European
Federation are the Central and Volgo-Viatsky regions
Russia make up 24% of the deposition. The most
(CVV) and the Central-Chernozem, Volga, and North-
important of these are the Northern region (NRT) and
Caucasian regions (CNV), contributing 8% each
the Central and Volgo-Viatsky regions (CVV). The most
(Figure. 4.29(b)).
significant external contributors are Eastern Europe
(13%), China (11%), the Americas (10%), Western
4.2.5.3. The Yamalo Nenets and Taymir Autonomous Okrugs
Europe (9%), and Central Asia (9%).
Mercury
PCB
The location of the Yamalo-Nenets AO and the Taymir
The largest contributions to PCB-153 depositions are
AO in the northern part of western Siberia, accounts
made by Russia (41%), Northwest Europe (31%) and
for the fact that Asian sources play a noticeable role in
Southeast Europe (18%) (Figure 4.28(a)). The main
their contamination. European sources, however, still
contributions among Russian sources (Figure 4.28(b))
continue to exert a considerable influence. Up to 30%
are made by the Central and Volgo-Viatsky regions
of all mercury annually deposited in these two regions
(CVV) and the Northern region (NRT), with values of
is from Russian sources (Figure 4.30(a)). The contri-
15% and 10%, respectively.
bution from sources within the Yamalo-Nenets and
b
Figure 4.28. Contributions from anthropogenic sources in (a) regions
of the Northern Hemisphere, (b) regions of Russia to annual PCB 153 deposition
a
in the Nenets AO.
b
Figure 4.29. Contributions from anthropogenic sources in (a) regions
of the Northern Hemisphere, (b) regions of Russia to annual HCH deposition
a
in the Nenets AO.
b
Figure 4.30. Contributions from anthropogenic sources in (a) regions
of the Northern Hemisphere, (b) regions of Russia to annual mercury deposition
a
in the Yamalo Nenets AO and the Taymir AO.
46
Chapter 4
4.2. Assessment of distant sources: Long range atmospheric transport
b
Figure 4.31. Contributions from anthropogenic sources in (a) regions
of the Northern Hemisphere, (b) regions of Russia to annual PCB 153 deposition
a
in the Yamalo Nenets AO and the Taymir AO.
b
Figure 4.32. Contributions from anthropogenic sources in (a) regions
of the Northern Hemisphere, (b) regions of Russia to annual HCH deposition
a
in the Yamalo Nenets AO and the Taymir AO.
b
Figure 4.33. Contributions from anthropogenic sources
in (a) regions of the Northern Hemisphere, (b) regions of Russia
a
to annual mercury deposition in the Chukchi AO.
Taymir AOs themselves is comparatively low (only
10% (Figure 4.32(a)). Russian contributions to deposi-
about 3%), whereas three major Russian contributors
tions in the Yamalo-Nenets and Taymir AOs are mainly
(CVV, CVN, and URL) make up 16% of total deposi-
from the Central and Volga-Viatsky regions (CVV) and
tion (Figure 4.30(b)). The two major external contrib-
the Central-Chernozem, Volga, and North-Caucasian
utors are China (12%) and Eastern Europe (12%).
regions (CVN), 7% and 8% respectively (Figure 4.32(b)).
Some impact is also made by the Americas (11%),
Central Asia (11%) and Western Europe (9%).
4.2.5.4. Chukchi Autonomous Okrug
Mercury
PCB
The Chukchi AO is the most eastern and remote region
Major contributions to PCB deposition in the Yamalo-
of the Russian North. Its location, far from major indus-
Nenets and Taymir AOs are made by sources in Russia
trial regions, accounts for the fact that the global back-
(47%), Northwest Europe (26%) and Southeast Europe
ground pool of atmospheric mercury is the main source
(16%) (Figure 4.31(a)). Among Russian sources (Figure
of mercury contamination in this region. Figure 4.33(a)
4.31(b)), the largest contribution (12%) to depositions
demonstrates the relative contributions of different
are made by the Central and Volgo-Viatsky regions
source regions to annual mercury deposition in the
CVV). The contribution of emission sources located
Chukchi AO. The main contributor is Russia (26%),
within the Yamalo-Nenets and Taymir AOs is 9%.
however, contributions from China are also consider-
able (17%). Among other sources, the Americas (11%),
-HCH
Central Asia (10%), and Eastern Europe (10%) are of
Main contributors to depositions of -HCH in the
note. The contribution from the Chukotka AO itself is
Yamalo-Nenets and Taymir AOs are similar to those for
insignificant compared to emission sources located in
the Nenets AO. Sources in Western Europe make the
Eastern Siberia and the Far East (Figure 4.33(b)).
largest contribution to ongoing deposition in these terri-
However, the influence of major emission regions in
tories (48%). Russia is responsible for 21% and India, for
European Russia (CVV, CVN, URL) are also apparent.
47
4.2. Assessment of distant sources: Long range atmospheric transport
Chapter 4
b
Figure 4.34. Contributions from anthropogenic sources in (a) regions
of the Northern Hemisphere, (b) regions of Russia to annual PCB 153 deposition
a
in the Chukchi AO.
b
Figure 4.35. Contributions from anthropogenic sources in (a) regions
of the Northern Hemisphere, (b) regions of Russia to annual HCH deposition
a
in the Chukchi AO.
PCB
Main contributions to -HCH deposition are made by
The most important contributions to PCB-153 depo-
sources within Western Europe (54%), Russia (17%),
sition in the Chukchi AO are made by sources locat-
and India (9%). Russian contributions to deposition
ed in Russia (25%), Northwest Europe (22%), and
are mainly from sources located in the Central and
Southeast Europe (19%), followed by American
Volgo-Viatsky regions (5%), and Central-Chernozem,
sources (17%). (Figure 4.34(a)). The main contribu-
Volga, and North-Caucasian regions (4%). Total annu-
tion from the Russian source regions (Figure
al deposition of -HCH amounts to 0.8 t.
4.34(b)) is made by emissions from the Chukchi
AO itself (8%).
The Nenets Autonomous Okrug
The most important contribution to anthropogenic
-HCH
mercury depositions in the Nenets AO is made by
For the Chukchi AO, the main contributions to -HCH
Russian emission sources (35%). As well as deposition
contamination are made by India (27%), Western
from sources within the Nenets AO itself (7%), emis-
Europe (27%), China (19%), and the Americas (11%)
sions from regions in the European part of Russia con-
(Figure 4.35(a)). The contribution from all Russian
tribute considerably to the pollution of this region
sources accounts for only 5% (Figure 4.35(b)).
(24%). The most important external contributors are
Eastern Europe (13%), China (11%), and the
4.2.6. Conclusions
Americas (10%). Total annual deposition of mercury in
Murmansk Oblast
the Nenets AO amounts to 4 t, of which 1.8 t is from
The largest contribution to anthropogenic mercury
anthropogenic sources.
deposition in the Oblast is made by Russian sources
(35%) of which 13% is from sources within Murmansk
Main contributions to PCB deposition in the Nenets
Oblast itself. The most important external sources are
AO are from sources in Russia (41%), Northwest
Eastern Europe (12%), China (11%), the Americas
Europe (31%), and Southeast Europe (18%). Major
(10%), and Western Europe (10%). Total annual depo-
contributions from sources within the Russian
sition of mercury is around 3 t, including 1.5 t from
Federation are made by the Central and Volgo-Viatsky
anthropogenic sources.
regions (15%), and the Northern region (10%). The
contribution of local sources to deposition in the
A major contribution to PCB deposition is made by
Nenets AO is negligible. Total annual deposition of
Russian sources (44%) including 22% from sources
PCB-153 in this Okrug amounts to 31 kg, and of total
within Murmansk Oblast itself. Among other emission
PCBs, 1 t.
sources, significant contributions originate in
Northwest Europe (35%), and Southeast Europe
-HCH pollution of the Nenets AO is due to emission
(14%). Total annual deposition of PCB-153 in
sources in Western Europe (49%), Russia (23%), and
Murmansk Oblast amounts to 20 kg, and of total
India (9%). The main sources within the Russian
PCBs, 0.7 t.
Federation are the Central and Volgo-Viatsky regions
48
Chapter 4
4.3. Preliminary assessment of riverine fluxes as PTS sources
(8%), and the Central-Chernozem, Volga, and North-
In addition, the following general conclusions can be
Caucasian regions (8%). Total annual deposition of made, based on the studies undertaken:
-HCH to this Okrug is 1.1 t.
·
Europe, North America, and Southeast Asia are the
most significant emission source regions for mer-
The Yamalo-Nenets
cury, PCBs and -HCH. The main Russian emission
and Taymir Autonomous Okrugs
sources are located in the European part of the
The major contribution to anthropogenic mercury
Russian Federation. Due to their geographical
deposition in these regions is from emissions sources
location, and to meteorological conditions,
in Russia (30%). Among Russian sources, the main
European sources make the greatest contribution
contributors are sources in the Ural, Central and
to the contamination of the western regions of the
Volgo-Viatsky regions, and the Central-Chernozem,
Russian North. Asian and North American sources
Volga, and North-Caucasian regions (16% in total).
play a more significant role in the pollution of the
Main external contributors are China (12%), Eastern
eastern territories of the Russian Arctic, although
Europe (12%), the Americas (11%), and Central Asia
the contribution of European sources is still con-
(11%). Total annual deposition of mercury is estimat-
siderable.
ed at 15 t, of which 6.6 t is from anthropogenic
sources.
·
The results obtained make it possible to make some
predictions for the near future regarding contami-
Major contributions to PCB depositions are made by
nation levels in the Russian Arctic. An analysis of
sources located in Russia (47%), Northwest Europe
emission data shows that mercury emissions are
(26%) and Southeast Europe (16%). Among Russian
decreasing in Europe and North America, whereas
sources, the largest contribution to deposition is made
emissions from Southeast Asia are increasing. Asian
by the Central and Volgo-Viatsky regions (12%). Total
sources may eventually become the more signifi-
annual deposition of PCB-153 is 95 kg, and 3.2 t for
cant, thus contamination levels of this pollutant in
total PCBs.
some regions of the Russian North, in particular the
Chukchi AO, may increase in the future. Regarding
Main contributions to -HCH depositions are made by
-HCH, use of technical-HCH (a mixture of HCH
Western Europe (48%), Russia (21%), and India
isomers, including -HCH) is now banned in most
(10%). Main sources within the Russian Federation are
western countries, and in Russia since the late-
the Central and Volgo-Viatsky regions (7%) and the
1980s; China, a major user, also switched to lindane
Central-Chernozem, Volga, and North-Caucasian
(pure -HCH) in 1984. Although restricted in most
regions (8%). Total annual deposition of -HCH
countries, lindane is still widely used in North
amounts to 4 t.
America, Europe and Asia, for seed treatment and
other applications (AMAP, 2002). Thus the relative
The Chukchi Autonomous Okrug
influence of Asian countries on pollution of the
The main contributions to anthropogenic mercury
Russian Arctic by -HCH is likely to increase. PCB
deposition in this Okrug originate from Russian
contamination levels are expected to decrease with
sources (26%). Emission sources from Eastern Siberia
emission reductions resulting from bans and con-
and the Far East are the dominant influences on mer-
trols on use of PCBs. However PCB contamination
cury contamination of the Chukchi AO. The main
is likely to continue for many years as a result of re-
external contributor to the region's pollution is China
emissions from PCBs accumulated in the general
(17%), with a contribution comparable to that of
environment over the last 50-years.
Russian sources, although this varies slightly during
the year. Among others, the Americas contribute 11%
and Central Asia 10% to the deposition. Total annual
4.3. Preliminary assessment
deposition of mercury is estimated at 7 t, of which 2.9 t
of riverine fluxes as PTS sources
is from anthropogenic sources.
4.3.1. Introduction
The main contributors to PCB deposition are the fol-
Flows of large Arctic rivers are considered one of the
lowing: Russia (25%), Northwest Europe (22%), and
most significant pathways by which contaminants reach
Southeast Europe (19%), followed by American
the Arctic. Riverine transport is particularly relevant
sources (17%). The Chukchi AO itself contributes 8%.
for PTS, as potentially PTS contamination within the
The total annual deposition of PCB-153 amounts to
entire catchment areas of these rivers can be transport-
11.8 kg, and of total PCBs, 0.4 t.
ed to the Arctic through watershed runoff, and these
catchments include heavily industrialized areas and
Main contributions to -HCH deposition are made
agricultural regions (Figure 4.36).
by India (27%), Western Europe (27%), China
(19%), and the Americas (11%). The contribution
Riverine PTS transport is particularly important for
from Russian sources accounts for 5%. Total annual
two of the study areas selected for project implementa-
deposition of -HCH in the Chukchi AO is estimated
tion: the lower Pechora basin, and the eastern part of
at 1.4 t.
the Taymir Peninsula, in the area of the Yenisey river.
49