Chapter 5
PTS levels in biota
and biomagnification
in food chains
5.1. Sampling strategy
Chapter 5
These two aims place somewhat different requirements
5.1. Sampling strategy
on sampling, sample treatment, and analysis. For the
Environmental sampling and analysis within the frame-
first objective, in order to estimate PTS intake with
work of Activity 4 `Biomagnification in Arctic food
food, it is necessary to obtain as reliable and represen-
chains' had two objectives:
tative data as possible on PTS levels in those species
·
determination of current PTS levels in main biota
and tissues that are widely used as traditional food. For
species, particularly those which are a utilised as
the second objective, it is necessary to determine the
part of the traditional diet of the indigenous popu-
average levels of contamination in species representing
lations in the pilot areas covered by the project;
a range of trophic levels (and in specific tissues of
·
evaluation of the extent to which biomagnification
organisms at higher trophic levels), and from this
occurs, i.e., the measurement of PTS accumulation
information, evaluate the degree to which PTS are
in terrestrial, freshwater, and marine food chains,
being accumulated and biomagnified in the various
in which humans represent the uppermost trophic
food chains that form the basis for food items in the
level.
traditional diet.
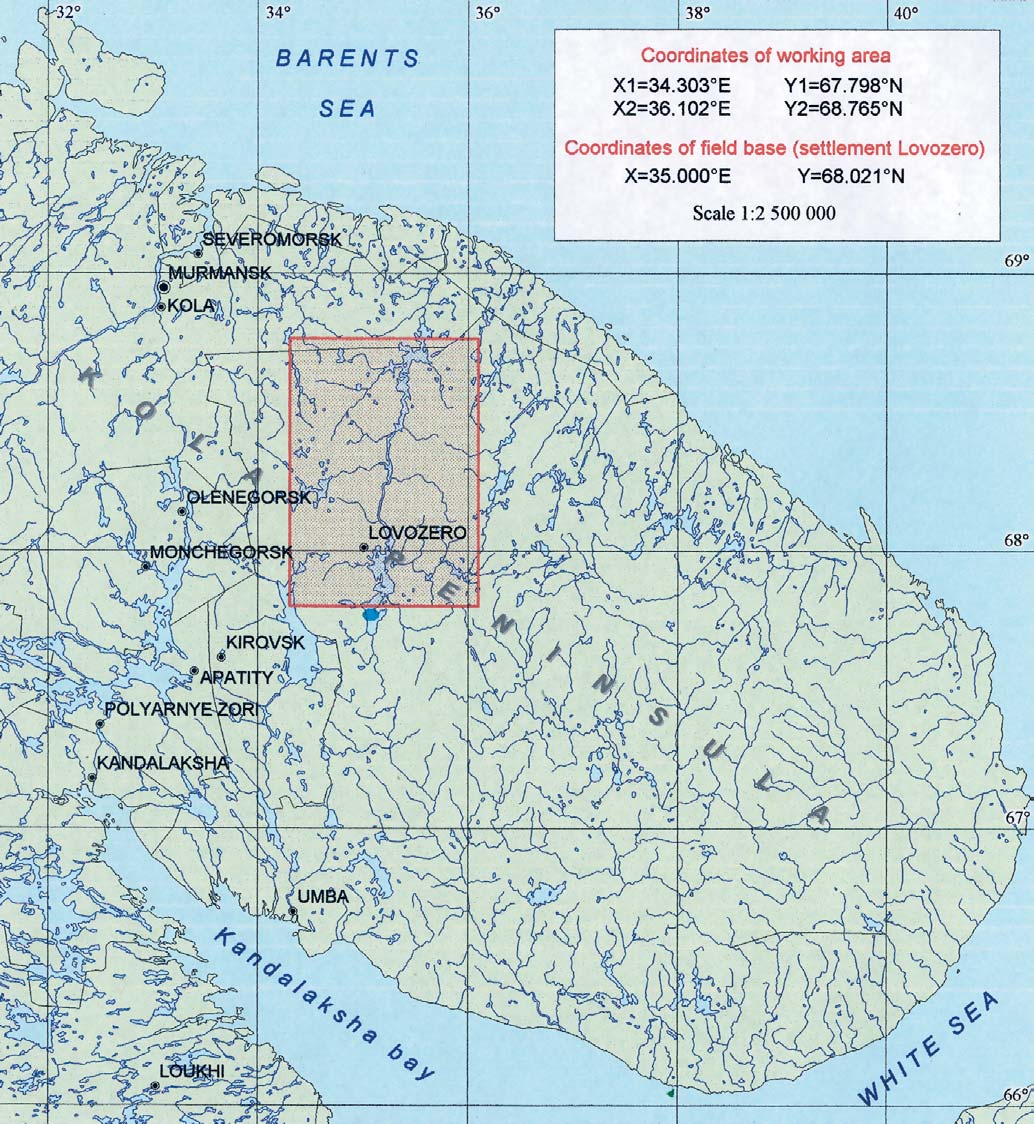
Coordinates of working area
X1=34.303°E
Y1=67.798°N
X2=36.102°E
Y2=68.765°N
Coordinates of field base (settlement Lovozero)
X=35.000°E
Y=68.021°N
Scale 1:2 500 000
Figure 5.1. Location of the environmental sampling area on the Kola peninsula.
82
Chapter 5
5.1. Sampling strategy
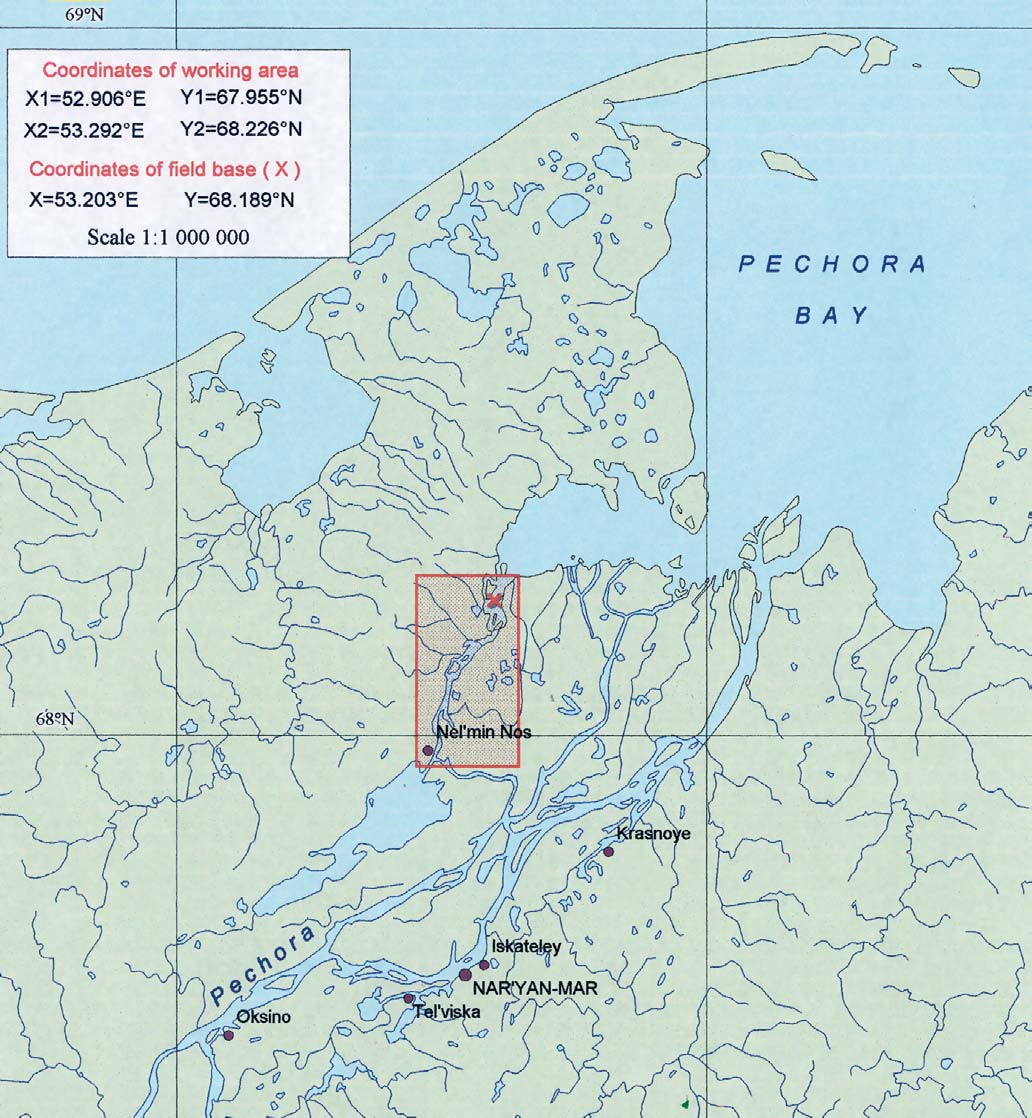
Coordinates of working area
X1=52.906°E
Y1=67.955°N
X2=53.292°E
Y2=68.226°N
Coordinates of field base (X)
X=53.203°E
Y=68.189°N
Scale 1:1 000 000
Figure 5.2. Location of the environmental sampling area
in the lower Pechora basin.
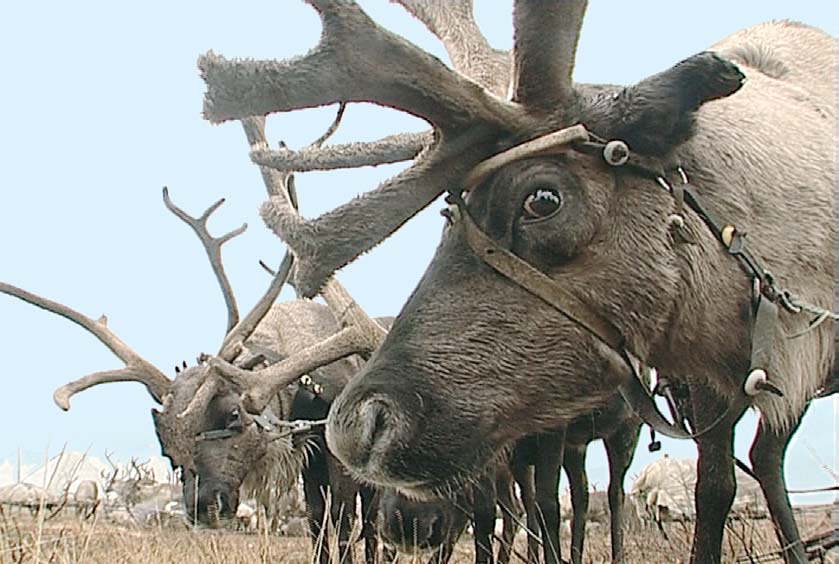
To these ends, environmental sampling was carried
It is also important to note that the optimal season for
out in six areas within the four main project regions,
environmental sampling differed between locations. It
these areas being located around settlements with
depends, not only on availability of the specified
the highest indigenous populations. Bearing in mind
species, but on the hunting seasons, which may vary
that hunting and fishing grounds can be located at
between different regions. In addition, sampling of
some distance from the actual settlements, and that
certain species of biota, particularly those species
migration of reindeer herds depends upon the sea-
which are obtained by hunting or fishing, had to be
son and weather conditions, field sampling was based
arranged in close collaboration with local hunters and
on prior consultations with local indigenous peoples
fishers. This was important, not only to ensure effi-
involved in traditional activities. The environmental
ciency in sampling related to these activities, but also
sampling areas that were defined following these con-
from a legal point of view, since licences for the hunt-
sultations are shown in Figures 5.15.4.
ing of some species and for marine mammals in partic-
ular, can only be obtained by indigenous communities.
83
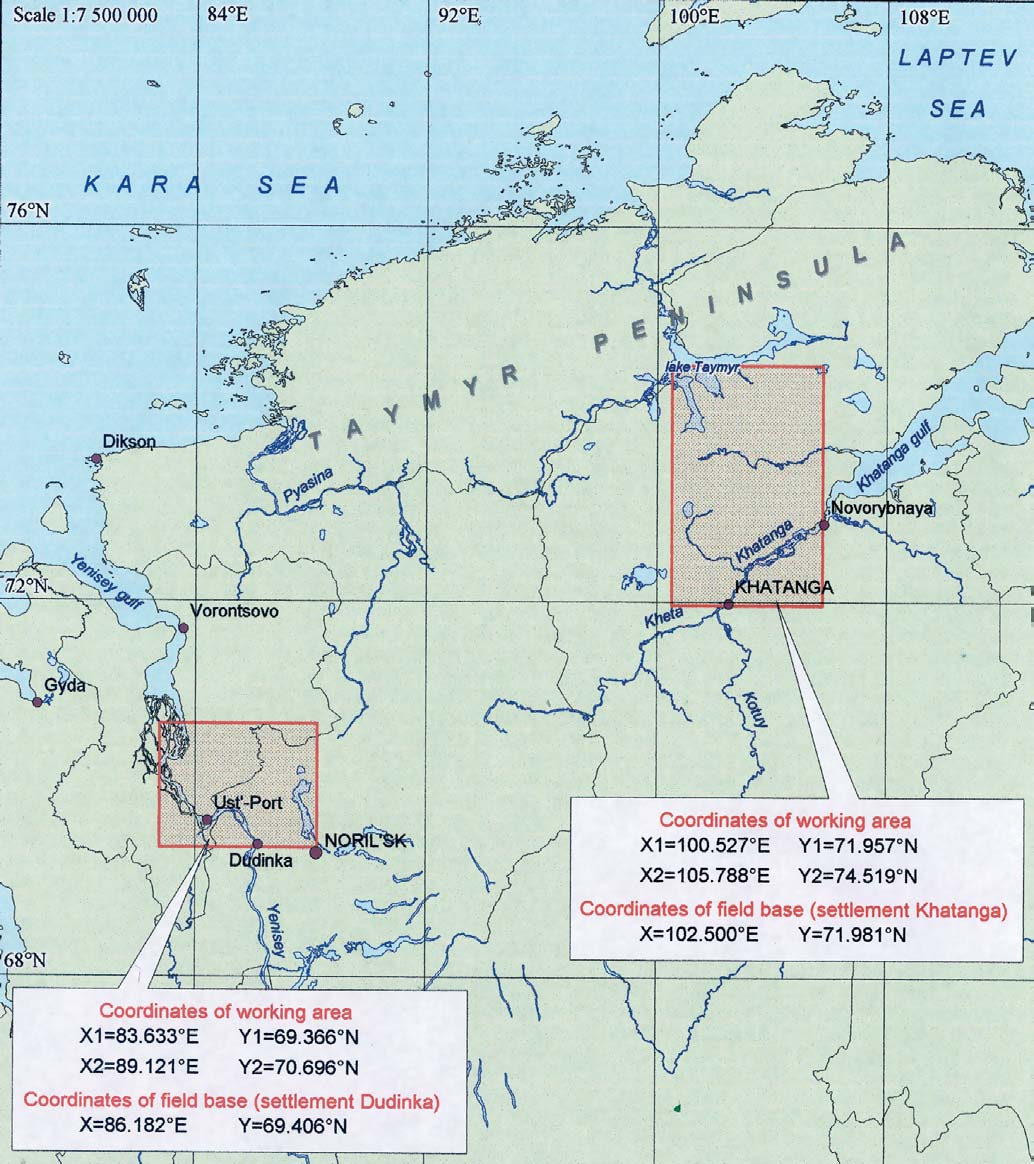
5.1. Sampling strategy
Chapter 5
Coordinates of working area
X1=100.527°E
Y1=71.957°N
X2=105.788°E
Y2=74.519°N
Coordinates of field base (settlement Khatanga)
X=102.500°E
Y=71.981°N
Coordinates of working area
X1=83.633°E
Y1=69.366°N
X2=89.121°E
Y2=70.696°N
Coordinates of field base (settlement Dudinka)
X=86.182°E
Y=69.406°N
Figure 5.3. Location of the environmental sampling areas
on the Taymir peninsula.
media was designed to ensure that reliable data could be
obtained for average concentrations of selected contami-
For these reasons, in addition to the main field sam-
nants at the sample sites. For example, pooled water sam-
pling expeditions undertaken, additional field work in
ples, which combined a number of replicated samples
Chukotka was arranged in order to sample marine
taken at different depths within the water column (e.g.
species (and particularly marine mammals) over the
sub-surface, middle and bottom), were utilized. A similar
area shown in Figure 5.5.
approach, i.e. using pooled samples, was employed for
the lower trophic levels of food chains, and in particular
The number and type of environmental samples were
for vegetation such as lichens, mosses, and mushrooms.
selected in accordance with the stated objectives of the
activity. i.e., to study biomagnification in food chains and
For biota species at higher trophic levels, specific
to measure PTS levels in traditional food sources of select-
organs and tissues known to be important with respect
ed indigenous communities. Sampling of environmental
to PTS accumulation, were sampled. Tissue and organ
84
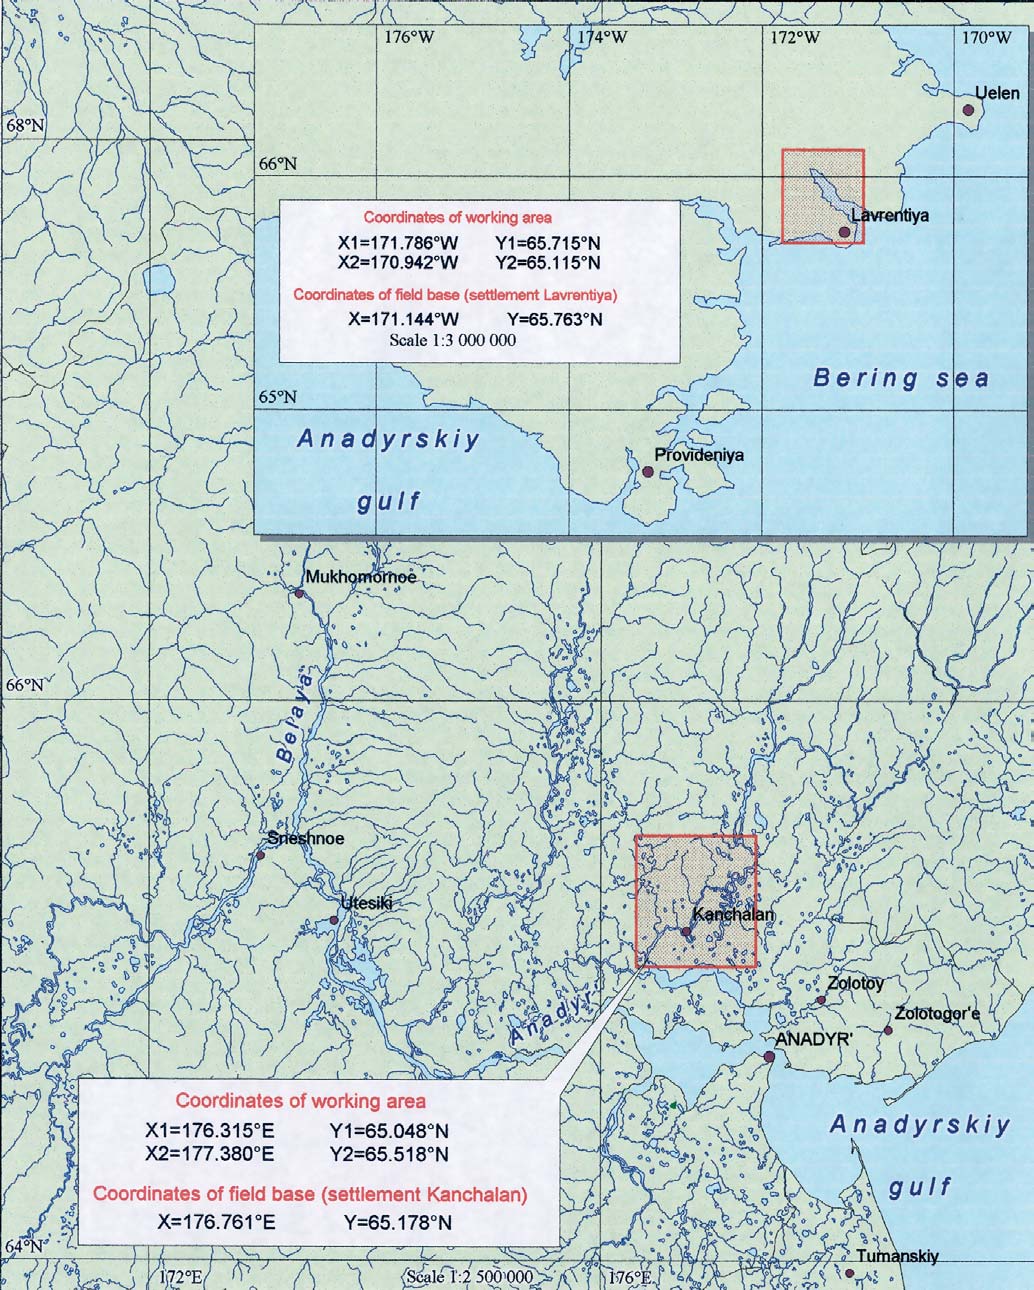
Chapter 5
5.1. Sampling strategy
Coordinates of working area
X1=171.786°W
Y1=65.715°N
X2=170.942°W
Y1=65.115°N
Coordinates of field base (settlement Lavrentiya)
X=171.144°W
Y=65.763°N
Scale 1:3 000 000
Coordinates of working area
X1=176.315°E
Y1=65.048°N
X2=177.380°E
Y2=65.518°N
Coordinates of field base (settlement Kanchalan)
X=176.761°E
Y=65.178°N
Figure 5.4. Location of the environmental sampling areas
on the Chukotka peninsula.
rines, due to the high fat content in their bodies, and
also high levels of methyl mercury. For these animals,
samples from animals of the same sex and similar age
samples were treated and analyzed individually and not
groups were then pooled. An exception to this
pooled. All samples were frozen immediately after
approach was made in the case of marine mammals,
delivery to the field camp, and stored frozen until
which feed at the top of (in some cases, long) marine
shipped to the laboratory. Samples pooling took place
food chains and can accumulate particularly high lev-
in the laboratory as a part of sample treatment prior to
els of lipophilic contaminants, including organochlo-
analysis.
85
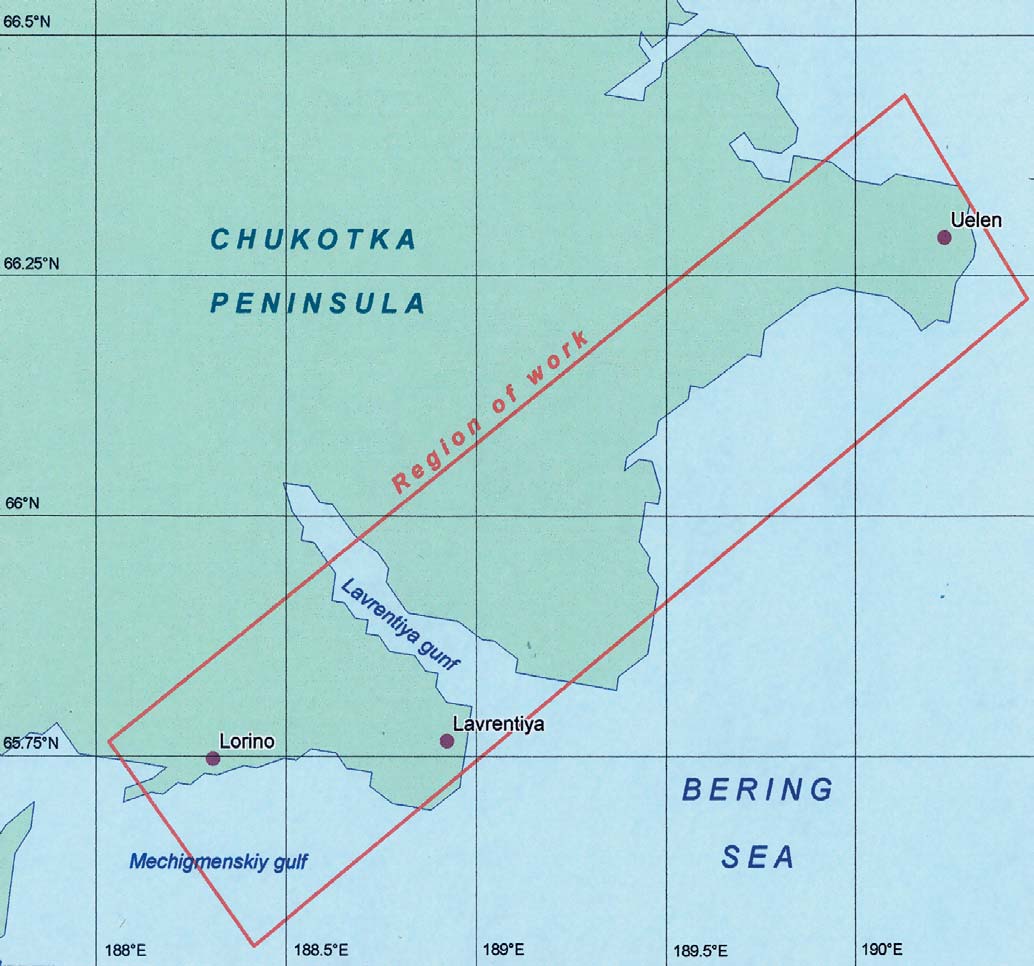
5.2. Analytical methods and quality control
Chapter 5
Figure 5.5. Location of the area in which marine food chain species were collected
around the Chukotka peninsula.
Standardization Committee (Gosstandart), were also
used when appropriate (GOST 17.4.4.02-84, 26929-86,
Table 5.1 contains a list of environmental samples col-
26927-86, 26932-86, 26933-86, 7636-85, PND F
lected during field work, and a list of the pooled and
14.1:2:4.124-97, 14.2:4.74-96, 16.1.7-97, 16.1.4-97
individually analyzed samples of environmental media
14.2:4.70-96, RD 52.10.556-95, 52.18.180-89, 52.18.578-
and biota is presented in Table 5.2.
97, 52.44.590-97, 52.18.191-89, 52.44.592-97).
5.2. Analytical methods and quality control
5.2.1. Quantitative determination of chlorinated and
brominated organic compounds
The analytical methods used for PTS determination in
individual and pooled environmental and biotic sam-
Conventional extraction and clean-up procedures were
ples were based on internationally recognized method-
utilised in the analytical treatment of samples.
ologies (ISO methods 8288:1986, 6468:1996,
Extraction efficiency was checked by introducing inter-
5666:1983, 10382, 11048:1995, 10382, 19258, 14653-2;
nal standards (PCB-198 and dibromo-octafluo-
US EPA methods 200, 245.5, 245.6, 508, 525.1, 550,
rodiphenyl (DBOF)) prior to extraction.
608, 680, 8082, 8275a, 8290a, 8310a, PP-006; ASTM
methods D 3534-85, D 3557-95, D 3559-96, D 5175-91,
Quantitative analysis of organochlorines (OC) was per-
D 5412-93, D-5673-96, D5812-96; JAMP, 1999a and
formed using gas chromatography (GC) with an elec-
1999b; NOAA, 1998; UNEP, 1993) also taking into
tron capture detector (ECD). In addition, gas chro-
account AMAP recommendations. Russian standard
matography with mass spectroscopy (GC-MS) was
methodologies, as certified by the Russian State
employed for samples with an anomalous composition
86
Chapter 5
5.2. Analytical methods and quality control
Table 5.1.
List of environmental media
and biotic samples obtained
in the project study areas.
or high concentrations of pollutants, to confirm the
Analysis of chlorinated compounds by mass-spectrome-
presence of the substances under consideration.
try was carried out using a Fisons 8060 gas chromato-
Samples in which brominated biphenyls and brominat-
graph and an MD800 mass spectrometer operating in
ed diphenyl ethers were detected in significant con-
the electron shock mode (70 eV). For brominated com-
centrations, were also subjected to additional GS-MS
pounds, the comparable system comprised a Carlo-Erba
examination.
8060 gas chromatograph and MD800 mass spectrome-
ter as above. Operational control of the above systems,
Quantitative determination was made using an
recording of mass-spectra, and their subsequent pro-
absolute calibration method, using target components
cessing was undertaken using the MassLab1.3 software
and the (DBOF) internal standard that was added to
package, and the National Institute of Science and
the sample before its analysis.
Technology (NIST) library of organochlorine com-
pounds.
Routine analyses were performed using a measure-
ment system consisting of a Fisons Mega-2 chromato-
A measurement system consisting of a Carlo Erba
graph with ECD800 detector, and a chromatographic
8035 chromatograph, and an Autospec-Ultima (VG)
data processing system consisting of a Multichrome-1.4
high resolution mass-spectrometer, operating in
and Kristall-2000M chromatograph with electron cap-
electron impact mode (36 eV) and with a resolution
ture detector, an automated sampler, and the chro-
of 10.000, was used for isomer-specific analysis of
matographic data processing software, Chromatec
polychlorinated dibenzo-p-dioxin and dibenzofu-
Analytic 1.21.
rans (PCDD/Fs), brominated compounds and
87
5.2. Analytical methods and quality control
Chapter 5
Table 5.2.
List of pooled or individually
analyzed samples of environ
mental media and biota.
toxaphenes. Separation of isomers was carried out
dium layer to ensure mercury retention in the furnace.
in a 60 m non-polar DB-5MS J &W Scientific column.
The detection limit for mercury in the solutions under
consideration was 0.001 µg/L, with a relative error of
All standard solutions of organochlorine pesticides
20% at this level of concentration.
and PCBs used for calibration were produced by Ultra
Scientific (USA) and certified by ISO9001. Standards
Measurements of lead and cadmium were carried
for toxaphenes, brominated diphenyl ethers, and
out using a Kvant-Z-ETA
atomic absorption spec-
brominated biphenyls were produced by St. Petersburg
trophotometer, with electrochemical atomization of
University.
the sample, using Zeeman background correction
and a constant aliquot volume of 5 µL of sample
5.2.2. Quantitative determination of heavy metals
solution. Prior to any measurements, a palladium
Measurements of mercury were carried out using a
modifier (at a concentration of 20 µg/L (Pd)) was
(Russian) Kvant-Z-ETA atomic absorption spectropho-
added to the samples.
tometer (analogous to the Western Varian AA-8000 sys-
tem), operating with a GRG-106 mercury generator in
5.2.3. Quantitative determination
automatic mode, using Zeeman background correc-
of polyaromatic hydrocarbons (PAHs)
tion.
Determination of PAHs in all samples involved liquid
extraction, followed by clean-up of extracts to remove
Mercury in samples was reduced to its metal state using
substances that could cause interference during analy-
tin dichloride, and then transferred in an argon gas
sis. Octafluoronaphthalene (OFN) was introduced as
flow (`Cold Vapor' method) to a graphite furnace, the
an internal standard to check the extraction efficiency
internal surface of which was covered with a fine palla-
of PAHs.
88
Chapter 5
5.2. Analytical methods and quality control
PAH analytical determination was made using High
was added to the sample before its analysis. Analysis was
Resolution Liquid Chromatography (HRLC), with tar-
performed using a measurement system consisting of
get components registered by diode-matrix and fluo-
an 1090 chromatograph with a standard diode-
rescent detectors connected in series. Quantification
matrix component, a Spectraphysics fluorescent detector
of PAH levels was made by absolute calibration, using
with programmed excitation wavelength, and Hewlett-
standard solutions of target components and a control
Packard hardware/software processing system for
based on the internal standard (OFN) solution, which
chromatographic data.
Table 5.3. Quality control analyses performed as part of the analysis of environmental and biotic samples.
89
5.2. Analytical methods and quality control
Chapter 5
Table 5.4.
Comparison of concentra
tions of brominated com
pounds in environmental and
biotic samples obtained by
routine GC, and by high res
olution GC MS methods.
TeBD=tetra brominated
diphenyl, PeBD=pentabromi
nated diphenyl, TeBDE=tetra
brominated diphenyl ether,
PeBDE=pentabrominated
diphenyl ether.
All standard solutions for PAHs used for calibration
analysis using high resolution GC-MS (Carlo Erba
were produced by Ultra Scientific (USA) and certified
8010/Autospec Ultima V6 system, described above)
by ISO9001. The octafluoronaphthalene standard was
(Table 5.4). The control analyses confirmed the validi-
produced by St. Petersburg University.
ty of the data obtained using the routine methods.
5.2.4. Quality control
5.2.5. Processing and presentation of analytical results
Analytical quality control and quality assurance
Results of analyses were grouped according to sam-
involved the execution of a full programme of work
pling site and sample types. Concentrations of individ-
including analyses of blank samples, standard solu-
ual compounds within related groups of substances
tions, replicate samples, samples spiked with target
were summed to provide a total value for the group.
components, and analysis of samples of different
For purposes of calculation, where results were below
matrix compositions containing known levels of the
the detection limit, a value of half the detection limit
determined components (Table 5.3). In addition, labo-
was used if this did not contribute more than 20% of
ratories involved in the work participated in interna-
the summed value; otherwise no sum was calculated.
tional intercalibration exercises within the framework
of the `QUASIMEME' Programme, and the
Sums were calculated for the following groups of sub-
Ring Test on analysis of POPs in human blood samples.
stances:
HCH: the sum of -, - and -isomers of HCH.
Under an arrangement made through the AMAP
DDT: the sum of o,p'- and p,p'-DDT, -DDE, -DDD.
Secretariat, the laboratory responsible for analysis of
CHLOR: the sum of cis- and trans-chlordane and cis-
environmental and biotic samples participated in the
and trans-nonachlor.
first stages of Rounds 22, 24 and 25 of the laboratory
PCB15: the sum of 15 PCB congeners (#28, #31, #52,
performance studies organized by `QUASIMEME'.
#99, #101, #105, #118, #128, #138, #153, #156, #170,
These concerned the analysis of bottom sediments and
#180, #183, and #187).
biota samples for levels of PAHs, OCs and HMs
PCB7: the sum of 7 PCB congeners (#28, #52, #101,
(Rounds 22 and 24), and the analysis of samples of sea
#118, #138, #153, and #180); calculated to allow com-
and estuarine waters for OCs, HM and mercury
parison with data obtained in the Russian North in
(Round 25).
1994/1995.
Toxaphene: the sum of Parlar-26, Parlar-50, and
Calibration standards used were the Russian State
Parlar-62.
Certified Standards and certified standards produced
PCDD/F: the sum of all 2,3,7,8-substituted con-
in other countries (by ULTRA Scientific, Wellington
geners of dibenzo-p-dioxin and dibenzofuran.
Laboratories, etc.). Previously analyzed samples,
spiked with specific components at levels approximate-
Environmental contaminants commonly exhibit a
ly 2-4 times greater than those detected during their
log-normal frequency distribution in their concentra-
original analysis, were employed as matrix samples con-
tion values (WHO, 1983). A log-normal distribution
taining known levels of the determined components.
was therefore assumed to apply for concentrations of
In addition, residual material from test samples dis-
a particular contaminant (and concentration ratios)
tributed as part of the `QUASIMEME' laboratory per-
within any given sample type collected at a particular
formance studies, with known composition and pub-
site. In most cases, therefore, data are reported as the
lished `assigned' concentration values, were also used
geometric mean concentration (or ratio) and the
as control samples.
associated standard deviation. Arithmetic mean con-
centrations and standard deviations were only calcu-
As concentrations of toxaphenes, brominated
lated when concentration variability was low (i.e.
diphenyl ethers and brominated biphenyls in most
where the standard deviation was less than 30% of the
pooled samples were found to be very low (below the
mean for most contaminants). This latter calculation,
levels of reliable determination for these compounds
however, facilitated comparison with results from
using routine methods), 40 samples (6 bottom sedi-
other studies, where PTS concentrations are com-
ment, 6 soil, 6 lichen, 6 berry, 3 reindeer kidney, 4 hare
monly reported in terms of mean values and their
liver, and 3 fish liver samples) were sent for control
standard deviations.
90
Chapter 5
5.3. Results Terrestrial environment
Table 5.5a.
Concentrations (mean and
standard deviation, or range;
ng/g dw) of OCs in vegeta
tion in the Russian Arctic
in 2001.
a A range is given when the
standard deviation is greater
than 50% of the mean, or the
concentration in one of the
samples is below the detec
tion limit. When lower and
upper limits of the concen
tration interval were estimat
ed for summed concentra
tions, any individual values
that were below the detection
limit were either set to zero
or to the detection limit (see
Section 5.2.5).
n = number of pooled sam
ples analyzed.
5.3. Results Terrestrial environment
The number of individual samples of each vegetation
type collected at a given site and used in the prepara-
5.3.1. PTSs in plants and mushrooms
tion of a pooled sample was usually 10, but ranged
The following species were collected and analysed for
between 4 and 20 (see Table 5.1). Vegetation was
PTSs:
analysed for all PTS listed in Section 1.2.4.
Lichens -- Cetraria cuculata, Cetraria islandica, Cladina
rangiferina, Cladina alpica, Cladina stellaris, Cladina
Levels and trends
mitis;
Bryophytes -- Polytrichum commune, Pleurozium schreberi;
(a) Organochlorines
Mosses -- Dicranum sp., Sphagnum balticum, Hylocomium
Concentrations of organochlorines (OCs) in vegeta-
splendens;
tion that significantly exceeded detection limits are
Berries -- low-bush cranberry (Vaccinium vitis-idaea),
shown in Tables 5.5a and 5.5b. Data for those OCs
cloudberry (Rubus chamaemorus), bilberry (Vaccinium
which occurred at concentrations below the detection
myrtillus), blueberry (Vaccinium uliginosum), crowberry
limit in most samples are not presented. The level of
(Empetrum nigrum);
HCB was above the detection limit in all samples of
Mushrooms -- orange-cap boletus (Leccinum auranti-
plants and mushrooms. PCB15 and PCB7, DDT and
acum), brown-cap boletus (Leccinum scabrum), mossi-
HCH were detectable in all samples of lichens and
ness mushroom (Xerocomus sp.).
mosses and PCB7 and DDT also in most of the berry
Table 5.5b.
Concentrations
(mean and standard
deviation, or range; ng/g dw)
of OCs in vegetation in the
Russian Arctic in 2001.
a A range is given when the
standard deviation is greater
than 50% of the mean, or the
concentration in one of the
samples is below the detec
tion limit. When lower and
upper limits of the concen
tration interval were estimat
ed for summed concentra
tions, any individual values
that were below the detection
limit were either set to zero
or to the detection limit (see
Section 5.2.5).
n = number of pooled sam
ples analyzed.
91
5.3. Results Terrestrial environment
Chapter 5
and mushroom samples. The PCB7 value, when mul-
Peninsula; and below the detection limit in the
tiplied by two, can be used to provide an estimate of
Pechora basin). The PCB7 concentration in mosses in
the total PCB concentration in mosses and, most likely,
2001 is significantly higher (10.3013.9 ng/g).
also in other plants (AMAP, 1998). Of the DDT group,
only p,p'-DDT occurs in detectable concentration in all
The PCB congener patterns seen in lichens differ signif-
berry and most mushroom samples. DDT concentra-
icantly from those occurring in most of the common
tion in berries and mushrooms were therefore estimat-
technical mixtures used in Western countries. In
ed using the ratio of p,p'-DDT/DDT found in lichens
Western products, PCB-138 and 153 dominate, while in
and mosses (0.39±0.07). This probably provides a con-
the environment of Russian Arctic, PCB-28 makes the
servative estimate as, at the three sites where DDT in
greatest contribution to the summed value in samples
berries could be calculated directly, this ratio was
from all sites. However, relative levels of the congeners
equivalent to 0.5±0.2.
PCB-28, 52, 118, 138, 153 and 180 found in remote
Arctic areas of North America also differ from those
Concentrations of HCB, HCH, and DDT in mosses are
found in American technical mixtures (Wilcke and
comparable to those in lichens, while PCB levels are 2-
Amelung, 2000) and are close to those found in the
4 times higher in mosses at all sites. Concentrations of
Russian Arctic. Therefore, the PCB composition pat-
these substances in berries and mushrooms are several
terns provided in Figure 5.6 could also be a result of the
times lower than those found in mosses and lichens.
fractionation of congeners during long-range transport.
Levels of HCB, HCH, and DDT follow a similar geo-
Concentrations of CBz (sum of HCB and pen-
graphical trend, with highest levels found at the two
tachlorobenzene (PeCBz), not shown in tables) meas-
locations on the Taymir Peninsula, and in the lower
ured in plants in this study, in 2001, are distinctly high-
Pechora basin. In contrast, no geographical trend in
er than levels previously reported for the Russian
PCB levels was observed. With only one exception
North (see Figure 5.7). In August 1995, on the Taymir
(berries from Dudinka), all differences in PCB con-
Peninsula, concentrations of 0.25 and 0.4 ng/g of
centrations between the sites could be explained by
CBz were found in lichens and mosses, respectively
analytical variability.
(AMAP, 1998). Mean concentrations of CBz in lichens
and mosses obtained during the current study at two
PCB levels in the Arctic have been found to be gener-
sites on the Taymir Peninsula, were 0.64±0.16 and
ally decreasing over time. Over the last few years, how-
1.3±0.3 ng/g, and 0.9±0.1 and 1.4±0.2 ng/g, respec-
ever, the rate of decrease has been small and levels have
tively. Concentration of CBz in 3 samples of lichen
remained relatively constant (AMAP, 2002). In accor-
collected near Khatanga in 1995 (AMAP, 1998) ranged
dance with this tendency, mean PCB7 concentrations
from 0.16 to 0.66 ng/g, while concentrations of 1.2-
measured in 2001 in samples of lichens collected near
1.5 ng/g CBz were found at Khatanga in 2001 (see
Khatanga, in eastern Taymir (2.5 ng/g) and at
Figure 5.7). In the Pechora basin, mean CBz concen-
Chukotka (2.2 and 2.5 ng/g) were slightly lower than
trations in lichens and mosses in 1994/1995 ranged
those determined in these areas in 1995 (3.2 and
from 0 (i.e., below the detection limit) to 0.08 ng/g
3.82 ng/g, respectively) (AMAP, 1998). In contrast, the
(AMAP, 1998), whilst in 2001 values of 0.21.0 ng/g
PCB7 concentration for lichens from the Pechora
were found. Thus, a comparison of the data obtained
basin in 1995 was below the detection limit, while
in 1994/1995 and in 2001, indicates that the concen-
2.3 ng/g was found in 2001. An unexpected increase
tration of chlorinated benzenes in lichens and mosses
was also observed in the PCB7 concentration in moss-
(and by inference in air) in the Russian North has
es, which in 1994/1995 in the Russian North ranged
shown a tendency to increase during recent years.
from 0 to 3.6 ng/g (002.4 ng/g on the Taymir
Figure 5.7. Mean values and ranges of OC concentrations measured in lichen
Figure 5.6. PCB congener contributions to PCB15 levels in lichen in the Russian
in Eastern Taymir and the Pechora Basin in 1995 and in 2001. Values for Eastern
Arctic in 2001. The congeners shown are the main contributors within
Taymir were derived from the analysis of three samples in 1995, and two samples
each homologue group.
in 2001. CBz = sum of HCB and PeCBz, DDT=DDT.
92
Chapter 5
5.3. Results Terrestrial environment
Table 5.6a. Concentrations (geometric means and ranges; ng/g dw) of PAHsa in vegetation in the Russian Arctic in 2001.
a NAP = Naphthalene, ACNLE = Acenaphthylene, BIPN = Biphenyl, NAP2M = 2 Methylnaphthalene, FLE = Fluorene, ACNE = Acenaphthene, PA= Phenanthrene.
The mean HCH concentration in 3 samples of lichens
Mirex has not been used in the fSU/Russia.
collected near Khatanga in 1995 (AMAP, 1998) was twice
However, it does occur at detectable concentrations
as high as those measured in the current study in the
in some samples of lichens and mosses, presumably
same area (3.42 and 1.6 ng/g, respectively). In contrast,
as a result of long-range atmospheric transport from
HCH concentrations in lichens and mosses in the
remote sources. The geographical distribution pat-
Pechora basin in 1995 ranged from 0.17 to 0.38 ng/g,
tern of Mirex is similar to that of DDT, HCH and
whilst concentrations of 0.741.4 ng/g were found in
HCB. In the most highly contaminated areas (the
this area in 2001. Despite the difference in values, these
Pechora basin and the Taymir peninsula), Mirex
results are unlikely to be indicative of a trend, as there is
concentration in lichens and mosses ranged from
known to be a high degree of spatial variability in levels of
0.2 to 0.5 ng/g. However, in the majority of samples
contamination from HCH across the Russian North. In
collected in less contaminated areas (on the Kola
1994/1995, the concentration of HCH, as a function of
peninsula, and Chukotka), Mirex concentrations
sampling site, varied within two orders of magnitude,
were below the detection limit of 0.1 ng/g. The sim-
even for samples taken in the same area (AMAP, 1998).
ilarity between the spatial distribution observed for
DDT, HCH, and HCB, and that of Mirex indicates
No temporal trend in DDT concentrations in lichens
that trans-boundary transport is at least an impor-
and mosses was evident in the Russian North. The mean
tant source, and most likely the main source of con-
concentration of DDT in 3 samples of lichens collected
tamination in the Russian Arctic for these com-
near Khatanga in 1995 (AMAP, 1998) was almost the same
pounds.
as that found in 2001 (2.96 and 2.9 ng/g, respectively).
The range of DDT concentrations (0.73 ng/g) deter-
Samples of plants and mushrooms were also analyzed
mined in lichens and mosses in five other areas in the
for other OCs listed in Section 1.2.4, with the excep-
Russian North in 1994/1995 (AMAP, 1998) is consistent
tion of PCDD/Fs. Of these substances, only hep-
with data obtained from the current study (1.03.1 ng/g).
tachlor was detected in some samples of lichen and
Concentrations of DDT, HCH, and CBz found in
mosses, in concentrations ranging
from 0.1 to
lichens in the Russian Arctic in 2001 are all comparable
0.3 ng/g. As all of these samples were collected in the
with those found in the Canadian Arctic in 1993/4. PCB
Pechora basin and the Taymir peninsula, the spatial
concentrations in Canada in 1993/4 were several times
pattern of heptachlor distribution appears, at least
lower, while toxaphene levels were significantly higher,
qualitatively, similar to that of Mirex, DDT, HCH,
than those measured in Russia in 2001 (AMAP, 1998).
and HCB.
Table 5.6b. Concentrations (geometric means and ranges; ng/g dw) of PAHsa in vegetation in the Russian Arctic in 2001.
a ANT= Anthracene, FLU = Fluoranthene, PYR = Pyrene, BAA = Benz[a]anthracene, CHR = Chrysene, BBF = Benzo[b]fluoranthene, BKF = Benzo[k]fluoranthene.
93
5.3. Results Terrestrial environment
Chapter 5
(b) PAHs
Geometric means and ranges of concentrations of
PAHs in lichen and mosses are provided in Tables
5.6a and 5.6b. PAH composition is similar at all sites,
with naphthalene, 2-methylnaphthalene and
phenanthrene contributing 70-90% of the value of
PAH in both lichen and mosses. The highest con-
centrations, and especially those of heavier PAHs,
are normally found near Khatanga. Lichens and
mosses were also analyzed for benzo[e]pyrene,
benzo[a]pyrene, perylene, dibenz[ah]anthracene,
indeno[1,2,3-cd] pyrene and benzo[ghi] perylene. In
the most cases, concentrations of these compounds
were below the detection limit of 0.5 ng/g. Perylene,
indeno[1,2,3-cd]pyrene and benzo[ghi] perylene
Figure 5.8. Concentrations of HMs in lichen (L) and mosses
were, however, found in concentrations which
(M) in the Russian Arctic in 2001.
ranged from 1 to 10 ng/g in several samples, prima-
rily from the Kola and Taymir peninsulas. A notable
bromodiphenyl ether. In all samples these substances
exception was the concentration of benzo[ghi]pery-
were below the detection limit of 0.2 ng/g dw.
lene found in mosses from Eastern Taymir, which
was as high as 30 ng/g.
(d) Heavy metals
The heavy metals, mercury (Hg), lead (Pb) and cadmi-
Naphthalene levels determined in berries and mush-
um (Cd) were detected in all samples of lichens, moss-
rooms are normally several times lower than those
es and mushrooms (see Figure 5.8 and Table 5.7). In
found in lichen and mosses. The difference in concen-
the majority of berry samples, Hg and Cd were below
trations occurring between the two groups of plants
the detection limits (0.001 and 0.005 µg/g, respective-
increases with the molecular weight of the substance in
ly), while the Pb level was detectable in all samples. Pb
question, and for the heaviest PAHs can be as much as
concentrations ranged from 2.6 to 4.5 µg/g in mosses,
two orders of magnitude. This may indicate that the
from 0.9 to 4.1 µg/g in lichens, from 0.04 to 0.1 µg/g
greater efficiency of lichens and mosses for intercep-
in mushrooms and from 0.01 to 0.05 µg/g in berries.
tion of gaseous and particulate PAHs from the air is
Concentrations of Hg and Cd in samples of lichens and
partially offset by the ability of plants and mushrooms
mosses ranged from 0.01 to 0.2 µg/g. No pronounced
to take up PAHs with logKow < 4 from the soil and
spatial trend was observed in HM contamination of
translocate them to the aboveground parts of the plant
lichens and mosses (see Figure 5.8). The relatively high
(McLachlan, 1996).
Hg concentration in mosses collected at Chukotka is,
very likely, due to a single anomalous sample, and was
(c) Brominated flame-retardants
not confirmed by data for lichen from the same loca-
Vegetation samples were analyzed for 2,2',4,4'-tetra-
tion. The only notable spatial tendency was a slight
bromodiphenyl; 2,2',4,4',5-pentabromodiphenyl; 2,2',
decreasing gradient in Cd concentrations from the
4,4'-tetrabromodiphenyl ether; and 2,2',4,4',5-penta-
Kola Peninsula towards Chukotka.
Table 5.7.
Concentrations (mean and
standard deviations; µg/g
dw) of HMs in vegetation in
the Russian Arctic in 2001.
a Range is given when the
standard deviation is greater
than 50% of the mean,
or the concentration
in one of samples is below
the detection limit.
b Concentration detected
in both samples.
94
Chapter 5
5.3. Results Terrestrial environment
Comparison between data obtained in 1995 (AMAP,
Similarly, differences in OC concentrations between
1998) and 2001, indicates that an increase in the Hg
the two age groups, and between different tissue types
deposition rate in Chukotka may have taken place
were not statistically significant, the ratios for
during this period. Hg levels in lichens and mosses
`old/young' reindeer groups ranging from 0.8 to 1.3
in 1995 (0.02 and 0.03 µg/g, respectively) were sev-
(1.11.3 for p,p'-DDT, p,p'-DDE, PCB-118 and PCB-153
eral times lower than those found in 2001 (0.06 and
and 0.8 for HCB).
0.15 µg/g, respectively). A similar temporal trend in
Hg concentration in lichen is observed on the
The geometric mean of the liver/muscle lipid con-
Taymir Peninsula (0.01 µg/g in 1995, and 0.06 µg/g
centration ratios, from the data collected in this
in 2001).
study, was 1.5. Based on this value, somewhat high-
er concentrations of OCs might be expected in
For the other HMs and sample sites, changes over time
liver tissue when compared with muscle. However,
are less significant, with the exception of a decrease by
the geometric means of both the liver/muscle and
an order of magnitude (from 0.9 to 0.06 µg/g) in Cd
kidney/muscle concentration ratios for all of the
concentration in lichen from Chukotka. However, over
OCs investigated were close to unity and independ-
the same period, an increase in Cd levels in mosses was
ent of site.
also observed in this area. Given the similar pathways
for Cd uptake in mosses and lichen, these results sug-
From these results, it was decided to calculate mean
gest that the above-mentioned differences in HM con-
concentrations based on data from both age groups;
centrations occurring between 1995 and 2001 are most
values for OCs in muscle tissue only are presented in
likely a reflection of normal intersample variability.
Tables 5.8a and 5.8b.
Similar to the majority of OCs, HM concentrations
measured in lichen and mosses in Russia in 2001 are
consistent with concentration ranges obtained in the
Canadian Arctic in 1993/4.
5.3.2. PTS in reindeer
Samples of reindeer (Rangifer tarandus) tissues were
collected at all 6 sites in the four regions. The num-
ber of individual tissue/organ samples collected at a
given site and combined in the preparation of
pooled samples was 2-3 in most cases, but ranged
from 1 to 6 (see Table 5.2). Pooled samples were pre-
pared from tissue samples of animals of the same sex
Table 5.8a. Concentrations (geometric mean and range; ng/g ww) of OCs
and with an age difference of less than 2 years. The
in muscle of reindeer in the Russian Arctic in 2001.
ages of animals ranged from 1 to 8 years, and equal
numbers of animals of each sex were sampled at all
sites, except for Western Taymir, where tissue sam-
ples from 3 male and 2 female reindeer were collect-
ed. Samples were grouped according to sex, (female
and male), age group (1-3 years and 4-8 years), and
tissue type (liver, kidney, or muscle). Reindeer mus-
cle, liver and kidney were analysed for all PTS listed
in Section 1.2.4.
PTS concentration relationships with reindeer sex, age,
and tissue type
Table 5.8b. Concentrations (geometric mean and range; ng/g ww) of OCs
(a) Organochlorines
in muscle of reindeer in the Russian Arctic in 2001.
Concentration dependence on animal sex, age, and
tissue type was investigated for OCs that exhibited con-
(b) Heavy metals
centrations above detection limits in most cases (p,p'-
As for OCs, the concentrations of HMs in reindeer tis-
DDT, p,p'-DDE, PCB-118, PCB-153 and HCB).
sues do not show any significant sex dependence.
However, a slight, but consistent increase in concentra-
Ratios of (geometric mean) concentrations of various
tions does occur with increasing age of the animals
OCs between male and female reindeer were in the
sampled. Concentration ratios between the two age
range 1.1 to 1.3, and were found to be independent of
groups (3 years and under, and over 3 years) are similar
site, age group, and tissue type. The difference
for all HMs, sites, and tissue types; the geometric
between these values and unity had very low statistical
means of the age ratios, calculated for almost 30 sam-
significance and therefore mean concentrations were
ples, equal to 1.8, 1.7 and 1.9 for Hg, Pb, and Cd,
calculated using data for both sexes.
respectively. Figure 5.9 shows examples of age depend-
95
5.3. Results Terrestrial environment
Chapter 5
ency of HM concentrations in reindeer tissues for the
3 times higher for younger animals. Relative concen-
two locations where samples included the greatest
trations of HMs in the muscle, liver and kidney appear,
range of age groups. Similar relationships between con-
respectively, in the ratios of 1:5:5 for Pb, 1:11:33 for Cd
centrations and age are observed in samples from
and 1:11:42 for Hg in reindeer over 3 years of age, and
other sites. In all reindeer tissues, HM concentrations
1:31:136 for Hg in younger reindeer (figures are based
increase in direct proportion to the age of the animal
on the geometric means of the ratios for pooled sam-
sampled. This implies that the effective rate of HM
ples). The degree of variability between liver/muscle
accumulation in various tissues, expressed in µg/g per
and liver/kidney concentration ratios for HMs within
year, is independent of age, at least in the sampled
a herd is greatest for Hg. The level of variability
mean age interval of 1.57.5 years. The only reasonably
between reindeer herds is similar. The liver/muscle
clear deviation from direct proportionality is the rela-
concentration ratios are slightly lower than those cal-
tively low level of muscle contamination, primarily for
culated for Swedish herds, but the difference was not
Hg, seen in the youngest animals of 1.52.5 years of
statistically significant (see Figure 5.10). As the distri-
age. This possibly indicates that a steady state liver/kid-
bution of HMs between tissues is herd specific, the age
ney concentration ratio is established quite rapidly,
concentration ratios for HMs are relatively constant,
whilst a steady state distribution of HM between the
and concentration variability within a herd is quite low,
liver and muscle may require several years to develop.
mean concentrations of Hg, Pb and Cd were calculated
separately for all three tissue types and are shown only
The HM distribution between reindeer tissues,
for the oldest age group. The calculation of separate
appears similar for both age groups and sexes. Only for
mean concentrations for each age group does not sig-
Hg are liver/muscle and kidney/muscle ratios about
nificantly improve the representativeness of the results,
because the variability found in concentrations of HMs
Figure 5.9.
within a herd is low.
Relationships between HM
concentration in reindeer
tissues and age, for the Kola
Levels and trends
peninsula (1) and the
Pechora basin (2).
(a) Organochlorines
Concentrations of OCs reliably detected in reindeer
muscle are given in Tables 5.8a and 5.8b. Levels of
PCB, HCB, HCH and DDT vary within fairly narrow
ranges and do not follow any pronounced spatial
trend, although somewhat higher levels of PCB,
HCB, and DDT are found in inland Chukotka (see
Figure 5.11).
Figure 5.10.
Geometric means
and ranges of HM
liver/muscle concentration
ratios in Swedish and
Russian reindeers.
The Swedish data were
for 10 herds (AMAP, 1998)
and the Russian data
for 6 herds.
Figure 5.11. Geometric means and ranges of OC concentrations in reindeer
muscle in the Russian Arctic in 2001. PCB= PCB15, HCH=HCH, DDT=DDT.
96
Chapter 5
5.3. Results Terrestrial environment
OCs in reindeer show no correlation with the spatial
Samples of reindeer tissue were also analyzed for the
trends found for OC contamination in lichen. All con-
other OCs listed in Section 1.2.4. In the majority of
centrations are far below the maximum permissible
samples, all of these additional OCs exhibited levels
concentrations (MPC) for OCs in meat, established by
below the detection limit. Only Mirex and some of the
the Russian Ministry of Health; the MPC of 0.1 mg/kg
cyclodienes were found in concentrations close to the
for HCH and DDT, given in Chapter 3, is equivalent
detection limit (about 0.1 ng/g), and then only in a
to 100 ng/g. Concentrations for all OCs measured in
few samples. This is again consistent with results of pre-
reindeer liver in 2001 coincide with the lower end of
vious studies carried out in Canada and in the Russian
corresponding ranges obtained for the Russian North
North in 1995 (AMAP, 1998).
in 1994/1995 (AMAP, 1998) Values are also in reason-
ably good agreement with data on reindeer muscle OC
(b) PCDD/Fs
contamination reported from Canada and Norway
Concentrations of 2,3,7,8-substituted PCDD/Fs were
(AMAP, 1998). For example, the following concentra-
analyzed using pooled samples of reindeer tissue. The
tions of OCs were found in muscle samples from two
results are presented in Table 5.9.
Canadian reindeer herds: 1 ng/g for HCH, 1-2 ng/g
for DDT and 2-10 ng/g for PCB. The ranges of the
PCDD/F levels in reindeer in the Russian Arctic follow
geometric means for OC concentrations determined
a distinct spatial distribution, that is reflected in other
in Russia in 2001 were 0.4-1.2 ng/g for HCH; 0.4 -
terrestrial mammals, birds, and fish (see Figure 5.12).
2.6 ng/g for DDT; and 1.3-2.8 ng/g for PCB. The
The highest PCDD/F levels are found at the Kola
Canadian data for summed PCB concentrations
Peninsula, where they are an order of magnitude
included more PCB congeners than did the Russian
greater than those found at other sites. After correc-
2001 data. The agreement between the Canadian and
tion for tissue lipid content, residual differences still
Russian reindeer data is similar to that seen in the data
remain in PCDD/F concentrations between the vari-
concerning OCs measured in lichen and mosses in
ous tissues types. In contrast to other OCs, PCDD/F
Russia in 2001, and in Canada in 1994.
levels occurring in the liver of reindeer are, on average,
7 times higher than those in the muscle. Maximum
contamination levels were found in liver tissue from
the Kola Peninsula (6.5 pg WHO-TEQ/g) and from
the Pechora basin (2.4 pg WHO-TEQ/g). The liver
concentrations associated with these TEQ values, and
also those in muscle of reindeer from the Kola
Peninsula, exceed the maximum permissible level for
meat, established by the Russian Ministry of Health,
which is 0.9 ng/g. All other concentrations measured
were below this level.
Three congeners (2,3,7,8-TeCDD, 1,2,3,7,8-PeCDD,
and 2,3,4,7,8-PeCDF) contribute more than half (and
up to 85%) of the total WHO-TEQ in the majority of
samples. The average contribution of 2,3,4,7,8-PeCDF,
Table 5.9. Concentrations (expressed as TEQ) of PCDD/Fs in reindeer tissues
and the most toxic of the dioxins to the total TEQs are
the Russian Arctic in 2001.
* ratio of PCDD/F concentration in pg WHO TEQ/g to that in pg/g
similar in waterfowl, terrestrial birds, fish and marine
mammals (4.4% and 4.7%, respectively). In terrestrial
animals, the average contribution of 2,3,4,7,8-PeCDF
is significantly higher, whilst the contribution from the
most toxic dioxins is almost the same (13% and 4.2%,
respectively). For this reason, the ratio of concentra-
tion in pg WHO-TEQ to weight concentration for ter-
restrial animals is also higher.
(c) PAH
Reindeer tissue was analyzed for the same PAH set as
vegetation. The geometric means and ranges of PAH
concentrations determined in reindeer muscle in the
Russian Arctic in 2001 are shown in Tables 5.10a and
5.10b. Results obtained from two sites in Chukotka
were treated as one data set, due to the similarity of
contamination levels and the small number of samples
analyzed. PAH concentrations in liver were, on aver-
Figure 5.12. Levels of PCDD/Fs in muscle of reindeer, hare,
waterfowl (molluscivores), fish (whitefish species), and terrestrial birds (browsers)
age, 3-5 times higher than those in muscle, while con-
in the Russian Arctic in 2001.
centrations found in kidney and muscle are comparable.
97
5.3. Results Terrestrial environment
Chapter 5
Table 5.10a. Concentrations (geometric mean and range; ng/g ww) of PAHsa
in reindeer muscle in the Russian Arctic in 2001.
a NAP = Naphthalene, NAP2M = 2 Methylnaphthalene, FLE = Fluorene,
PA = Phenanthrene.
Figure 5.13. Means and ranges of HM concentrations in reindeer liver (wet weight)
in the Russian Arctic in 2001. Red lines indicate the maximum permissible
concentrations allowed by food safety standards.
4,4',5-pentabromodiphenyl ether. In all samples these
occurred at levels below the detection limit of
0.2 ng/g ww.
(e) Heavy metals
Concentrations of HMs in reindeer tissues are shown
in Table 5.11 and Figure 5.13. Levels of Pb are below
the corresponding MPCs in all tissues, although the
difference in the case of liver is quite small. Cadmium
Table 5.10b. Concentrations (geometric mean and range; ng/g ww) of PAHsa
in reindeer muscle in the Russian Arctic in 2001.
and Hg levels in all tissues, and at all sites, except for
a ANT = Anthracene, FLU = Fluoranthene, PYR = Pyrene, CHR = Chrysene
Hg in tissues from Chukotka, are either close to or
exceed corresponding MPCs. The greatest disparity
As for OCs, no trend in spatial distribution was found.
between observed levels of the metals under the scope
The PAH composition pattern in reindeer tissues
and MPCs occurred in kidney tissue from the Pechora
reflects that found in lichen. Naphthalene, 2-methyl-
basin, which exceeded the MPC by two and a half
naphthalene and phenanthrene contribute well over
times.
half of the PAH value. Reindeer tissues were also ana-
lyzed for the other PAH listed in Section 5.3.1.(b). In
The spatial distribution of HM concentrations in rein-
the majority of samples these PAHs were below the cor-
deer liver tissue is shown in Figure. 5.13. HM levels in
responding detection limits (0.52 ng/g) or, in a few
other tissues follow a similar pattern. As for OCs, there
samples of liver tissue, were only slightly above detec-
is no pronounced correlation with the spatial distribu-
tion limits.
tion of HMs in lichen. For all HMs, however, the least
contaminated areas are inland Chukotka and the east
(d) Brominated flame-retardants
Taymir (Khatanga) regions. As mentioned above, the
Samples of reindeer tissues were analyzed for 2,2',
HM concentration relationship with reindeer age is
4,4'-tetrabromodiphenyl, 2,2', 4,4',5-pentabromodi-
almost directly proportional, at least for the first few
phenyl, 2,2', 4,4'-tetrabromodiphenyl ether, and 2,2',
years of the animals' life. The coefficients for this rela-
Table 5.11.
Concentrations (mean and
standard deviation; g/g ww)
of HMs in tissues of reindeer
(>3 years of age) in the
Russian Arctic in 2001.
a Hg level in one sample was
close to the detection limit
(0.001 ng/g ww), and below
the detection limit in another.
b Hg level in both samples
was close to the detection
limit.
c Concentration range.
98
Chapter 5
5.4. Freshwater environment
Table 5.21a. Concentrations (geometric mean and range; ng/g wet weight) of OCs in fish muscle in the Russian Arctic in 2001.
a More than half of concentrations were below the detection limit in at least 50% of the samples. In such cases, when lower and upper limits of the concentration interval were
estimated, concentrations below the detection limits was set to zero or to the detection limit, respectively.
of all species are comparable. The high lipid concen-
group and show no significant relationship to site.
tration of burbot liver makes it a popular component
Geometric means of the liver/muscle concentration
of the diet of indigenous peoples.
ratios for Hg, Pb and Cd in freshwater species are equal
to 2.0, 2.8 and 4.8, respectively. For salmon species
(b) Heavy metals
these values are somewhat higher (2.4, 8.6 and 7.5,
Concentrations of HMs are similar in male and female
respectively).
fish of each species. Concentrations measured in the
oldest fish groups are, on average, twice as high as in the
Levels and trends
corresponding youngest age group, whereas the mid-
age/young-age group ratio is equal to 1.2. These values
(a) Organochlorines
are consistent with ratios of mean ages in the groups,
OC concentrations in fish muscle are shown in Tables
i.e., even for relatively old fishes, HM contamination
5.21a and 5.21b. Concentrations of all OCs that were
levels are close to being proportional to age. Examples
found at detectable levels are broadly similar for both
of Hg concentration dependence on fish age for those
salmon and freshwater groups, although slightly high-
sites with the maximum number of sample age groups
er concentrations were found in salmon species. No
are given in Figure 5.21. Effective rates of HM accumu-
pronounced geographic trend was found for any OC.
lation in fish species are given in Table 5.20. For Pb they
All concentrations in muscle were below the corre-
are comparable with those found in reindeer tissues,
sponding MPCs established in Russia for freshwater
whilst for Hg and particularly Cd, rates are lower.
fish (0.03 mg/kg for HCH, and 0.3 mg/kg for
DDT) as well as those for sea fish. Most OC levels are
Concentrations of HMs in the liver of all species is
comparable with those detected in reindeer. The only
higher than that in the muscle. The liver/muscle con-
exception to this concerned concentrations of DDT,
centration ratios are similar for all species within a fish
which are several times higher in fish. Mean OC con-
Table 5.21b
Concentrations
(geometric mean and range;
ng/g wet weight) of OCs
in fish muscle in the Russian
Arctic in 2001.
a More than half of concen
trations were below the
detection limit in at least
50% of the samples. In such
cases, when lower and upper
limits of the concentration
interval were estimated, con
centrations below the detec
tion limits was set to zero or
to the detection limit, respec
tively.
109
5.4. Freshwater environment
Chapter 5
centrations in muscle of whitefish species from three
Samples of fish tissues were also analysed for other OCs,
lakes in the Canadian Arctic in 19931999 ranged from
listed in Section 1.2.4. In the majority of samples, all
4.7 to 24.7 ng/g for PCB (102 congeners), from 0.32
other OCs were below detection limits. Only Heptaclor
to 2.66 ng/g for HCH, from 1.7 to 9.0 ng/g for
was found in few samples of burbot and whitefish liver
CHLOR, and from 1.9 to 24.6 ng/g for DDT (all --
and in broad whitefish muscle in concentrations close
in ww) (CACAR, 2003). In comparison with the
to the detection limit of 0.05 ng/g ww.
Canadian data, Figure 5.22, the upper limit of concen-
tration ranges for whitefish species in the Russian
(b) PCDD/Fs
North in 2001 coincides with the lower limit of the con-
Concentrations of 2,3,7,8-substituted PCDD/Fs were
centration ranges calculated for whitefish in Canada.
analyzed in pooled fish muscle samples. Results are
The upper limits of concentration ranges for all OCs
presented in Table 5.22 and Figure 5.12. PCDD/Fs in
from the Canadian studies are several times higher than
fish species follow a similar, but less pronounced, geo-
those seen in the Russian Arctic. In comparison with
graphical distribution to that seen in reindeer. All con-
results from studies in northern Scandinavia, however,
centrations are far below the maximum permissible
contamination levels in Russia are reasonably similar to
levels associated with consumption of meat.
concentrations measured in lake whitefish at three
Norwegian sites in 1994 (0.51.6 ng/g for the sum of 6
Levels of PCDD/Fs found in this study (0.03-0.2 WHO-
PCB
congeners;
0.100.12
ng/g
for
HCH;
TEQ/g) were of an order of magnitude lower than in
0.030.23 ng/g for CHLOR; and 0.15-0.63 ng/g for
fish muscle samples from the Grate Slave Lake in
DDT), and also with concentrations measured in
northern Canada in 1994/5 (0.6-1.1 WHO-TEQ/g;
Arctic char in Finland (AMAP, 1998).
CACAR, 2003). PCDD/Fs concentrations in lake white-
fish sampled in Norwegian lakes (1994) were even
higher (5.3 ng I-TEQ/g). At four other sites in
Scandinavian countries, however, PCDD/F levels in
fish muscle were more comparable with those meas-
ured in the Russian North in 2001 (0.05-0.09 and 0.02-
0.15 ng I-TEQ/g, respectively; AMAP, 1998).
Figure 5.22 Comparison of mean OC concentrations
in whitefish species in the Canadian Arctic (1993 1999), Norway (1994), and Russia
(2001). The lower part of each column corresponds to the minimum mean
concentration, and the total column height, to the maximum mean concentration.
Table 5.22. Concentrations (expressed as TEQ) of PCDD/Fs in fish muscle
PCB=PCB15, HCH=HCH, CHLOR=CHLOR, DDT=DDT
the Russian Arctic in 2001.
* ratio of PCDD/F concentration in pg WHO TEQ/pg to that in pg/g
Table 5.23. Concentrations (geometric mean and range; ng/g ww) of PAHsa in muscle of fish species in the Russian Arctic.
a NAP = Naphthalene, NAP2M = 2 Methylnaphthalene, FLE = Fluorene, PA= Phenanthrene, FLU = Fluoranthene
110
Chapter 5
5.4. Freshwater environment
(c) PAHs
centrations measured on the Kola Peninsula are con-
The geometric means and ranges of PAH concentra-
sistently higher than at other sites. Hg and Cd concen-
tions in the muscle of fish species in the Russian Arctic
trations are generally comparable in all species at all
are given in Table 5.23. PAH levels in fish, in contrast to
sites, apart from relatively low Cd levels occurring in
OCs, are higher than those in waterfowl, including the
Arctic grayling. Pb levels are, as a rule, somewhat high-
piscivores. The distribution of PAH between tissues is
er in freshwater species. All concentrations, with one
also very different from that of OCs. For example, the
exception, are significantly below the relevant MPCs
OC concentration in liver tissue in burbot can be sever-
(of 0.6 mg/kg for Hg, 0.2 mg/kg for Cd, and
al hundred times higher than that in muscle, while PAH
1.0 mg/kg for Pb), established in Russia for predatory
levels in both of these tissues are comparable. No geo-
fish. The exception is Hg in whitefish from the
graphic trend in PAH levels in fish is apparent, although
Khatanga River, the concentration of which exceeds
concentrations in pike from inland Chukotka are sever-
permissible limits by a factor of 1.5.
al times higher than those on the Kola Peninsula.
However, for other fish species there are no noticeable
No significant difference was observed in Cd and Pb
differences between Chukotka and other regions.
levels in caregonids in the Russian North between 1995
and 2001. Levels of Hg in these species in the Yenisey
(d) Brominated flame-retardants
and Khatanga Rivers were higher in 2001 than in 1995,
Samples of fish tissues were analysed for 2,2',4,4'-tetra-
while Hg levels reported for whitefish caught in the
bromodiphenyl, 2,2',4,4',5-pentabromodiphenyl, 2,2',
Pechora River in 1995 (AMAP, 1998) are comparable
4,4'-tetrabromodiphenyl ether and 2,2',4,4',5-penta-
with those measured in 2001. Hg levels in species in
bromodiphenyl ether. In the majority of samples, con-
the Russian North are also consistent with results from
centrations were below the detection limit of 0.2 ng/g
the Canadian Arctic. Mean concentrations of Hg in
ww. Only 2,2',4,4'-tetrabromodiphenyl ether was found at
whitefish species in Canadian lakes in 1996-2000
higher levels in a few samples of fish liver (see Table 5.24).
ranged from 0.03 to 0.35 µg/g (CARCAR, 2003), and
those in Russian lakes and rivers in 2001 from 0.055 to
(e) Heavy metals
0.15 µg/g. These concentrations are also similar to
No pronounced geographic trends are apparent in the
those found in fish in northern Norway in 1995
levels of HMs in fish (see Table 5.25), although Hg con-
(AMAP, 1998).
Figure 5.23. Absolute and relative levels of p,p' DDE and p,p' DDT in aquatic food
chains in the Khatanga area. Geometric means and ranges of DDE and DDT levels in
Table 5.24. Concentrations (ng/g ww) of 2,2',4,4' tetrabromodiphenyl ether in liver
sediments are given on a dry weight basis, while levels in the muscle of birds and fish
of fish in the Russian Arctic in 2001.
are on a wet weight basis. Ratios are shown with 95% confidence limits.
Table 5.25.
Concentrations
(geometric mean and range;
µg/g ww) concentrations
of HMs in the freshwater fish
muscle in the Russian Arctic
in 2001.
111
5.4. Freshwater environment
Chapter 5
KOW values of other OC's were taken from the publica-
5.4.2. PTS transfer in the freshwater food chain
tion by Mackay et al. (1992). For fish species harvested in
Lake Lovozero, and from rivers in the study, most TFWF
(a) Organochlorines
values calculated for p,p'-DDT and p,p'-DDE, as well as
The major link in the contamination of many aquatic
for other OCs with detected levels and with logKOW 6
food chains by OCs, is their transfer from water to fish.
are about 1000 mL/g ww, or somewhat higher.
As an example of p,p'-DDT and p,p'-DDE uptake patterns
in freshwater aquatic food chains, Figure 5.23 shows lev-
The TFWF values predicted for p,p'-DDE, with only one
els of these contaminants in fish muscle and waterfowl
exception, overestimate experimental values, while
from the Khatanga area of eastern Taymir, (the only site
those for p,p'-DDT underestimate values in most cases.
where all fish and bird groups were sampled).
This is unlikely to be the result of poor choice of KOW
values, because according to equation 5.5, when KOW is
The characteristic time for hexachlorobiphenyl (PCB-
sufficiently large, the accuracy of its value is not critical
155) absorption/depuration, as determined by labora-
for freshwater, and the relative concentrations of all
tory experiments on adult rainbow trout, is about highly hydrophobic contaminants in fish and water are
1 month (Gobas et al., 1999). This indicates that steady
expected to be similar. However, the measured
state OC concentrations in fish are established within a
DDE/DDT ratio in fish is several times higher (see
period of months, even for OCs with a logKow value as
Figure 5.23 and Table 5.26a and 5.26b), probably indi-
high as 7. As shown, OC distribution between water
cating a faster rate of p,p'-DDT metabolism in fish tissues
and fish tissues can be quite accurately described by a
than predicted. In any event, the assumption seems rea-
simple adsorption/desorption model, with the water-
sonable for waterfowl, in which the DDE/DDT ratio is 1-
to-fish transfer factor (TFWF, mL/g ww of muscle) cal-
2 orders of magnitudes higher than in water, sediments
culated as follows (Verhaar et al., 1999):
and fish. As the chemical and physical properties of p,p'-
DDE and p,p'-DDT are quite similar, it is unrealistic to
TFWF = (VLMKOWa1 + VWM)/(VLWKOWa2 + VWW)
(5.5)
expect that the dramatic difference in their relative con-
centrations could have a non-metabolic explanation.
Where:
Comparison with whitefish species provides further evi-
VLM and VLW are lipid fractions in the muscle
dence of an enhanced rate of metabolic transformation
of fish and in water, respectively;
of p,p'-DDT into p,p'-DDE in birds and/or in their food.
VWM and VWW are water fractions in the muscle
Levels of p,p'-DDT and p,p'-DDE in whitefish are, respec-
of fish and water, as a physical body respectively;
tively, higher and lower than in birds, whilst levels of the
a1 and a2 are Collander coefficients, which com-
sum of p,p'-DDT and p,p'-DDE are comparable and con-
pare the similarity of the lipid in a given compart-
sistent with the corresponding lipid concentrations.
ment with octanol.
Despite feeding at the highest trophic level, piscivore tis-
sues do not contain the highest levels of p,p'-DDT and
A typical value for dissolved organic matter (DOM) con-
p,p'-DDE, nor do they have the highest DDE/DDT ratio.
centration in surface freshwater is about 10 mg/L
Only DDE concentration is consistently higher in pisci-
whilst the normal lipid concentration in the muscle of
vore bird species than in fish, while other OC levels
fish is several percent. A typical value for the Collander
(such as p,p'-DDT) are comparable or even lower. From
coefficient for the organic matter of soil and sediments
this it can be inferred that the fish-to-birds transfer fac-
(a1) is 0.8 (Schwarzenbach et al., 1993). A significantly
tor is close to unity for OCs which do not undergo sig-
smaller coefficient a2 might be expected, however,
nificant metabolic transformation in bird tissues.
when experimental data are applied to equation 5.5 a
similar value is obtained for both coefficients (Verhaar
et al., 1999). Therefore, for the purposes of this study, a
value of 0.8 was used for both a1 and a2. Using these
input parameters, equation 5.5 predicts almost con-
stant transfer factors (TFWF 1000 mL/g ww) for all
hydrophobic substances with logKOW > 6. This is consis-
tent with previously reported experimental TFWF - KOW
dependences (Verhaar et al., 1999). KOW values selected
by Pantolillo and Eganhouse (2001) were used for p,p'-
DDT (logKOW = 6.6, the geometric mean of two selected
Table 5.26a. DDE/DDT ratios (geometric means and 95% confidence interval)
KOW values), and for p,p'-DDE (logKOW 7.0), while the
in freshwater food chains.
Table 5.26b. DDE/DDT
ratios (geometric means
and 95% confidence interval)
in freshwater food chains.
112
Chapter 5
5.5. Marine environment
Contaminants in water also constitute the basis for the
environmental media or in the food supply, contami-
most important food chain pathways that give rise to
nation levels in fish tissues would be expected to be rel-
contaminants in waterfowl. All other conditions (such
atively constant and in equilibrium with levels found in
as forage composition, DOM concentration etc.) being
the environment.
equal, OC levels in birds are directly proportional to
the level of contamination in water. This being so, it is
An example of HM distribution patterns in an aquatic
possible for water-to-bird transfer factors to be calculat-
food chain are presented in Figure 5.25. Despite occu-
ed. These are comparable for all bird groups at all sites
pying a higher trophic level, HM contamination levels
and equal 5700 and 980 mL/g ww for p,p'-DDE, and
in piscivorous birds are comparable with those of fish.
p,p'-DDT, respectively. Transfer factors for HCB and
Water-to-fish and water-to-bird transfer factors for HMs
PCBs range from 460 mL/g ww (HCB, water- to- pisci-
vary within an order of magnitude. Values of water-to-
vores in eastern Taymir) to 67000 mL/g ww (PCB-153,
fish transfer factors for Hg and Cd are similar for
water-to-molluscivores in western Taymir). The geo-
salmon species and for freshwater fish, while the water-
metric means of transfer factors are in a good agree-
to-fish transfer factor for Pb is several times higher for
ment with those predicted using equation 5.5 and
freshwater species. Geometric means of Hg and Cd
equal 1200 mL/g ww for HCB, 1800 mL/g ww for
TFWFs, calculated using pooled sets of data, are equal
PCB-153 and 4100 mL/g ww for PCB-28. The lower
to 3300 and 570 mL/g ww, respectively. Geometric
value obtained for PCB-153 when compared with that
means of Pb TFWFs are equal to 280 mL/g ww for
of PCB-28 may be due to the kinetic limitation of high-
freshwater species and 60 mL/g ww for salmon species.
ly hydrophobic compound levels in bird tissues.
Default values for Hg and Pb biomagnification in fish
Higher transfer factors for waterfowl when compared
edible parts provided in the IAEA Handbook (IAEA,
to fish are consistent with the bird/fish concentration
1994) are consistent with values obtained in this study.
ratio for PCDD/F of ~ 2.2, and with the approximately
two times greater lipid concentration in the muscle of
As shown in section 5.3.4, HM contamination levels are
birds. All differences between waterfowl /fish concen-
close to being directly proportional to fish age, even
tration ratios for lipids and OCs are within a small (fac-
for relatively old fish. This indicates that HM elimina-
tor of two) variance, and there is close correlation
tion rates are low and that the biological half-lives for
between the ranges for OC ratios and those of lipids
the 3 HMs considered are about 10 years. The elimina-
(see Figure 5.24).
tion rates determined in this study are significantly
slower than those measured in laboratory experiments,
(b) Heavy metals
in which a state of equilibrium was normally reached
Equillibrium levels of Hg, Pb and Cd in fish in labora-
within several weeks or months (WHO 1989a, 1989b,
tory experiments can normally be established in sever-
1991, 1992, 1995). A possible explanation for this dis-
al weeks or months (WHO 1989a, 1989b, 1991, 1992,
crepancy is the relatively short duration of laboratory
1995). This indicates that, in the absence of sudden
experiments. If this is the case, HMs could have accu-
temporal or spatial changes in HM concentrations in
mulated primarily in tissues and organs that are capa-
ble of fast absorption and elimination of HMs. This
Figure 5.24.
hypothesis is supported by observations from laborato-
Concentration ratios (geo
metric mean and 95% confi
ry experiments that the elimination rate decreases with
dence limits) for OCs and
time. The biological half-life of the remaining HM frac-
lipid content in waterfowl/
tion may, therefore, be many years. This is the slowest
fish, for all sample sites.
stage of HM elimination and is, quite possibly, the con-
trolling rate under natural conditions.
5.5. Marine environment
5.5.1. PTSs in marine fish
Among marine fish species, only yellowfin sole floun-
Figure 5.25.
der (Limanda aspera), harvested in the Bering Sea was
The HM distribution pattern
in water fish bird food chains
sampled and analysed for PTSs content. However, for
on the Kola Peninsula in
this analysis, some anadromous fish species such as
2001. HM concentrations
smelt (Osmerus eperlanus), chum salmon (Oncorhynchus
and their ranges in bird and
fish muscle are in µg/g ww,
keta) and sea-run Arctic char (Salvelinus alpinus) were
while those in water are in
included in the group of sea fish, since they inhabit sea
µg/L.
waters for a major part of year, migrating into river
mouths only in the fall season for spawning.
(a) Organochlorines
As it is shown in Tables 5.27a and 5.27b, concentrations
of OCs in muscle tissue of yellowfin sole are within the
range of OC levels for anadromous fish. For concen-
113
5.5. Marine environment
Chapter 5
Table 5.27a.
Concentrations
(geometric mean and range;
ng/g wet weight) of OCs
in muscle tissue of marine
and anadromous fish
in the Russian Arctic
in 2001.
Table 5.27b.
Concentrations
(geometric mean and range;
ng/g wet weight) of OCs
in muscle tissue of marine
and anadromous fish
in the Russian Arctic
in 2001.
trations of OCs found above detection limits, such as
broad circumpolar distribution and prefer annual,
PCB15, HCB, HCH and CHLOR, yellowfin sole
land-fast ice, but are also found near multiyear ice.
muscle is approximately in the middle of the range of
Adults are believed to be relatively sedentary, but sub-
values for anadromous fish, although it had the lowest
adults can disperse over long distances. Ringed seals
levels of DDT and its metabolites.
are a key component of the diet of the Inuit in north-
ern Canada and Greenland, and of the Yupik and
(b) Heavy metals
coastal Chukchi on the Chukotka Peninsula of Arctic
From Table 5.28, it can be seen that levels of Hg and Cd
Russia.
in yellowfin sole were, as for OCs, within the range of
values for Hg and Cd found in anadromous fish, how-
14 samples of ringed seal liver, kidney, muscle and
ever, Pb concentrations in its flesh were higher than
blubber, together with 5 samples of bearded seal, and
those in the anadromous fish group. Concentrations of
22 samples of larga seal were collected from various
all HM tested were well below guidelines concerning
communities located on the shores of Lavrentiya Bay in
permissible levels of Hg, Pb and Cd in marine fish (0.4,
the Bering Sea, during the summer and fall periods of
1.0 and 0.2 µg/g ww, respectively).
2000 and 2002.
5.5.2. PTSs in marine mammals
PTS concentration relationships to seal sex, age,
and tissue type
5.5.2.1. Seal species
As the age range of sampled animals among the seal
The seal family (Phoca sp.) in this study is represented
species was very low (from 0.5 to 3.5 years), it was con-
by the ringed seal (Phoca hispida), the bearded seal
sidered that neither age nor sex difference was likely
(Erignatus barbatus) and the larga, or spotted seal
to be particularly important in explaining variations in
(Phoca largha). Seals are the most abundant and widely
contaminant levels. Consequently, averages were cal-
distributed of the resident Arctic pinnipeds. Their diet
culated based on values obtained from both sexes and
consists of fish and crustaceans. Ringed seals have a
all ages.
Table 5.28.
Concentrations
(geometric mean and range;
g/g wet weight) of HMs
in muscle tissue of marine
and anadromous fish
in the Russian Arctic
in 2001.
Table 5.29.
Concentrations (mean ± S.D.
ng/g ww) of OCs in blubber
of male and female seals
harvested in the Russian
Arctic (Chukotka), compared
with data from northern
Canada (CACAR, 1997).
114
Chapter 5
5.5. Marine environment
Table 5.30a. Concentrations (geometric mean and range; ng/g ww) of OCs in organ and tissues of seal species in the Russian Arctic.
a More than a half of concentrations measured were below the detection limit in at least one of the pooled samples.
In the ringed seal samples, PCBs, HCH, chlordanes,
lated (Tables 5.30a and 5.30b). No statistically signifi-
and DDT were the most prominent contaminants,
cant differences were found between concentrations of
while chlorobenzenes and toxaphene were present at
OCs detectable in muscles, liver and kidney of ringed
lower concentrations. Average concentrations of PCB
seal, but OC concentrations in blubber were about 50
and chlordanes in females were higher than those in
times higher in comparison with other organs and tis-
males, while mean levels of HCH and DDT in males
sues. Concentrations of OCs in muscles, liver, kidney
exceeded those in females (Table 5.29). Mean concen-
and blubber of larga seal occured in the approximate
trations of the sum of chlorobenzenes (CBz) and
ratio 1 : 0.3 : 0.2 : 15.
toxaphene were very similar in both males and females.
The highest level of muscle contamination by OCs was
In larga seals, PCBs, CHLOR, DDT, and HCH were
found in larga seal. Concentrations of all OCs in the mus-
the main contaminants found, and average concentra-
cle of other seal species were several times lower and close
tions of all OCs tested were higher in males than in
to those found in terrestrial mammals, waterfowl and fish.
females.
Concentrations of HCH and DDT and its metabolites in
muscle, liver and kidney of seals were below correspon-
Comparison of OC levels in the blubber of ringed seal
ding guidelines established for consumption of seal meat
harvested in the Canadian and Russian Arctic have
in Russia (0.01 mg/kg for HCH, and 0.03 mg/kg for
shown that for all OCs under consideration, except for
DDT). No significant difference was observed between
HCH, concentrations in the blubber of ringed seal
concentrations of any OCs in other tissues of seals, with
from the Canadian Arctic, exceeded those in ringed
the exception of relatively low HCB and HCH levels in
seal from the Bering Sea. The most probable explana-
the muscle and blubber of bearded seal. Like in fish mus-
tion for this is the difference in age between the two
cle, levels of OCs in the blubber of seals were close to the
groups of seals, since seals hunted in the Bering Sea
lower margin of concentration ranges reported for seals
were no older than 3.5 years of age, whereas ringed seals
from the Canadian Arctic in 1998-2001 (CACAR, 2003).
from the Canadian North were 6 years or more in age.
Results of a comparative assessment of OC contamina-
Levels and trends
tion of ringed seal blubber in the Canadian and the
(a) Organochlorines
Russian Arctic are shown in Figure 5.26. As can be seen
For the pooled data set of seal species, which included
from the Figure, concentrations of major OCs in the
all ages and both sexes, geometric means were calcu-
blubber of ringed seal in the Canadian Arctic meas-
Table 5.30b Concentrations (geometric mean and range; ng/g ww) of OCs in organ and tissues of seal species in the Russian Arctic.
a More than a half of concentrations measured were below the detection limit in at least one of the pooled samples.
115
5.5. Marine environment
Chapter 5
Table 5.31.
Concentrations (ng/g ww)
of of 2, 2', 4, 4' tetrabro
modiphenyl ether in seal
species in the Russian Arctic
in 2000 2002.
ured during the period 1989 to 2001 (CACAR, 1997;
CACAR, 2003) were higher when compared with those
measured in the Russian Arctic during the period
2000-2002.
(b) Brominated flame-retardants
Samples of tissues of marine mammals were analyzed for
2, 2', 4, 4'-tetrabromodiphenyl, 2, 2', 4, 4', 5-pentabromo-
diphenyl, 2, 2', 4, 4'-tetrabromodiphenyl ether and 2, 2',
4, 4', 5-pentabromodiphenyl ether. In most samples,
these substances occurred below the detection limit of
0.2 ng/g. Only 2, 2', 4, 4'-tetrabromodiphenyl ether was
found in few samples at higher levels (see Table 5.31).
(c) Heavy metals
Figure 5.26. Comparison of mean OC concentrations in ringed seal blubber
Concentrations of HMs in seal species are shown in
in the Canadian Arctic (Canada 1: 1989 1994, Canada 2: 1998 2001) and Russia
Table 5.32. The highest levels of contamination by Hg
(2000 2002). The lower part of each column corresponds to the minimum mean
concentration, and the total column height, to the maximum mean concentration.
were found in the tissues of bearded and larga seal, and
PCB=PCB (sum of 15 congeners in Russia; sum of more than 100 congeners
the lowest levels in ringed seal. Lead and Cd concentra-
in Canada), HCH=HCH, CHLOR=CHLOR, DDT=DDT.
tions were similar in all seals. Hg concentrations in the
muscle of seal species were significantly higher when
(0.5, 0.6, and 1.0 mg/kg, respectively). However, all Hg
compared with those in terrestrial mammals, birds, and
and most Cd concentrations in seals significantly
fish. Lead levels in seals were somewhat lower than those
exceeded corresponding guidelines (Table 5.33).
in birds and terrestrial animals, while Cd concentrations
in all mammals, birds, and fish were comparable. All Pb
As seen in Table 5.32, the organ showing the greatest
concentrations in the muscle, liver and kidney of seals
degree of contamination by Hg, in all seal species, was
were below corresponding guidelines established for
liver, followed by muscle tissue, and kidney. With
human consumption of meat, liver, and kidney in Russia
respect to Cd, the most contaminated organ was kid-
Table 5.32.
Concentrations (geometric
mean and range; µg/g ww)
of HMs in tissues and organs
of seals in the Russian Arctic
in 2000 2002.
Table 5.33.
Amount by which
concentrations of Hg and Cd
measured in tissues and
organs of seal species
harvested in the Russian
Arctic exceed guidelines for
consumption of meat, liver,
and kidney products.
116
Chapter 5
5.5. Marine environment
Table 5.34a.
Concentrations
(geometric mean and range;
ng/g ww) of OCs in tissues
and organs of male
and female walrus in the
Russian Arctic in 2002.
Table 5.34b.
Concentrations (geometric
mean and range; ng/g ww)
of OCs in tissues and organs
of male and female walrus in
the Russian Arctic in 2002.
ney, followed by liver. Concentrations of Cd in muscle
the bioaccumulation of contaminants in benthic
tissue in seal species were below guideline levels.
marine food webs. Although they have an important
role in the traditional hunts and diets of indigenous
The ranges of all HM concentrations in muscle, liver
peoples, relatively little is known about contaminant
and kidney of seals were consistent with concentrations
levels in walrus. Some individuals, however, are known
determined in 1998-2001 in ringed seal in the
to feed at higher trophic levels and include ringed seal
Canadian Arctic (CACAR, 2003). However, HM con-
in their diet, and as a result have much higher contam-
centrations in ringed seal from Canada are somewhat
inant concentrations in their tissues (AMAP, 1998;
lower than those determined in ringed seal in the
CACAR, 2003). Walrus tissues and organs, including 22
Russian Arctic, this despite the fact that the were
samples each of liver, kidney, muscle, and blubber,
reported on the dry weight basis. HM concentrations
were collected in the summer and fall of 2002 from
in ringed seal muscle in the Russian Arctic fall almost
coastal communities of the Chukotka Peninsula.
in the middle of concentration ranges determined in
Canada in 1987-1994 (CACAR, 1997; see Figure 5.27).
PTS concentrations relationship to walrus sex,
age and tissue type
5.5.2.2. Walrus
The age distribution of male walrus sampled was as fol-
Walrus (Odobenus rosmarus) are long-lived benthic feed-
lows: 3 individuals aged 1.5 years, 2 individuals aged
ers and, as such, are an important indicator species for
3.5 years, 2 individuals aged 4.5 years, and 4 individu-
als aged 5.5 years. Female walrus sampled showed
Figure 5.27.
greater variability in age distribution and were repre-
Comparison of mean HM
concentrations in ringed seal
sented by 1 walrus aged 0.5 years, 4 individuals aged
muscle in the Canadian
2.5 years, 3 individuals aged 3.5 years, and 1 individual
Arctic (1987 1994) and
each of 4.5, 5.5 and 6.5 years.
Russia (2000 2002). The
lower part of each column
corresponds to the minimum
As the mean age difference between male and female
mean concentration, and the
walrus was relatively small (3.8 years vs 3.4 years, respec-
total column height,
to the maximum mean
tively), average PTS levels in walrus tissues and organs
concentration.
were calculated without distinguishing between age
groups. Tables 5.34a, 5.34b show OC concentrations as
measured in different organs and tissues of male and
female animals.
Table 5.35.
Concentrations
(geometric mean and range;
µg/g wet weight) of HMs in
tissues and organs of male
and female walrus in the
Russian Arctic in 2002.
117
5.5. Marine environment
Chapter 5
Table 5.36a.
Concentrations
(geometric mean and range;
ng/g ww) of OCs in tissues
and organs of walrus in the
Russian Arctic in 2002.
Table 5.36b.
Concentrations
(geometric mean and range;
ng/g ww) of OCs in tissues
and organs of walrus in the
Russian Arctic in 2002.
Table 5.37.
Concentrations (geometric
mean and range; µg/g wet
weight) of HMs in tissues
and organs of walrus in the
Russian Arctic in 2002.
The distribution of HM concentrations in walrus tis-
of Cd were highest in kidney and exceeded those in
sues and organs for each sex is shown in Table 5.35.
muscles by a factor of nearly 700, and those in liver by
Levels of Hg in the muscle, liver, and kidney of male
a factor of approximately 6.
walrus were slightly higher than in females, but con-
centrations of Pb and Cd in females, in contrast to Hg,
Concentrations of Cd in the liver and kidney of walrus
exceeded those in males.
were 8- and 14-times higher, respectively, than the
Levels and trends
human consumption guideline values for Cd in inter-
nal organs, established in the Russian Federation.
(a) Organochlorines
Levels of Hg in muscle, liver, and kidney of walrus
For the pooled data set, geometric means were calcu-
were, respectively, 1.4-, 16.6- and 1.3-times higher than
lated including all ages and both sexes of walrus
the associated human consumption guidelines values.
(Tables 5.36a and 5.36b). No statistically significant dif-
Although high, these levels of exceedance of guideline
ferences were found between concentrations of HCB,
values are less than those noted for seal species.
chlordane-related compounds, or DDT in the mus-
cle, liver and kidney of walrus; however, PCB15 con-
5.5.2.3. Grey whale
centrations in blubber were approximately 68, 47, and
Grey whales (Eschrichtius gibbosus), taken from the
21 times higher when compared to the muscle, kidney
Bering Sea by indigenous hunters of the coastal com-
and liver, respectively. Concentrations of HCH in the
munities of Chukotka were sampled. The sampled
muscle, kidney, liver, and blubber of walrus were found
whales included 2 females, with a mean age of 3 years,
in the ratio of 1 : 1.8 : 3.3 : 109; levels of CHLOR in
3 females with the mean age of 7.3 years, and 2 males
these organs and tissues occurred in the ratio of 1 : 1.2 :
with a mean age of 6.5 years.
1.5 : 32; and DDT levels in muscle, kidney, liver, and
blubber were found in the ratio of 1 : 1.4 : 1.9 : 45.
PTS concentration relationships to whale sex,
age and tissue type
Concentrations of HCH and DDT measured in muscle
tissue and the blubber of walrus were compared with
Most OCs, except for HCH, were found in lower con-
existing Russian guidelines for HCH and DDT com-
centrations in female whales than in males, possibly
pounds, in both the meat of marine mammals (includ-
due to the elimination of these lipophilic compounds
ing walrus), and in animal fat. The levels of HCH and
during lactation. No significant trend in OC concen-
DDT measured in walrus muscle were found to be,
tration levels with age was found in male grey whale,
respectively, 12 and 35 times, lower than the corre-
but a substantial decrease in OC concentration in
sponding guidelines values (of 10 and 30 ng/g ww).
females occurred after six years of age, which corre-
The levels of summed HCH isomers in the blubber of
sponds to the age at which first parturition takes place.
walrus, measured at 93.9 ng/g ww and were approxi-
For example, the average concentration of PCB con-
mately 2.1 times lower than the guideline value of
geners in the blubber of grey whale females of 3 years
200 ng/g ww.
was 135 ng/g ww, whilst in female of 7.3 years, PCBs
averaged 87.5 ng/g ww (Table 5.38). The levels of the
(b) Heavy metals
main OCs in the liver, kidney and blubber of females
Concentrations of heavy metals in walrus organs and
aged 3 years, exceeded those in females aged 7.3 years
tissues are shown in Table 5.37. Levels of Hg were high-
1.4- to 1.8-fold. This is consistent with the influence of
est in the liver, 42-fold greater than those in muscle,
parturition and lactation, which are associated with the
and 6-fold greater than those in kidney. Concentrations
elimination of contaminants from maternal whales. An
118
Chapter 5
5.5. Marine environment
Table 5.38. Concentrations (geometric mean and range; ng/g ww) of OCs in tissues and organs of grey whale in the Russian Arctic, by age and sex.
exception to this is seen in muscle tissue, in which lev-
els of DDT, HCB, and chlordane-related compounds
were higher in females of over 7 years than in females
of 3 years. It is important to note however, that the sta-
tistical significance of most age-related differences in
concentrations of PTS from the limited dataset avail-
able is rather low.
As can be seen from Table 5.39, Hg levels varied
according to age and sex, with higher levels observed
in males, followed by females of 7.3 years, and lowest
levels in females of 3 years of age. Concentrations of Pb
and Cd did not follow the same pattern; for Pb, the
highest levels were found in older females, followed by
males, with lowest levels in females of 3 years of age.
Levels and trends
(a) Organochlorines
For the pooled data set, which included all ages and
both sexes, geometric means were calculated for PTS
concentrations in grey whale. From Table 5.40 it can
be seen that the highest concentrations of all OCs
tested were found in the whale blubber. For the other
organs and tissues, levels of PCB15, toxaphene,
Table 5.39.
Concentrations (geometric mean and range; µg/g ww) of HMs
HCH, DDT, and CHLOR were highest in liver,
in tissues and organs of grey whale in the Russian Arctic, by age and sex.
although higher in kidney than in liver in the case of
a Range given, as one of the sampled whales had concentrations below
HCB.
the detection limit.
Table 5.40.
Concentrations (geometric
mean and range; ng/g ww)
of OCs in tissues and organs
of grey whale in the Russian
Arctic.
119
5.5. Marine environment
Chapter 5
whale were high compared to concentrations of these
metals in other organs and tissues. Hg concentrations
in blubber, muscle, kidney, and liver were measured in
the ratio 1 : 2.9 : 4.3 : 7.5, while levels of Pb in kidney,
blubber, muscle, and liver were found in the ratio of
1 : 1.2 : 1.5 : 2.0.
Concentrations of Hg measured in muscle tissue of
grey whale exceeded the human consumption guide-
line values for Hg in meat by almost 1.5 times. Cd lev-
Table 5.41 Concentrations (geometric mean and range; µg/g ww) of HMs in tis
sues and organs of grey whale in the Russian Arctic.
els in liver were 2.5-fold the guideline value for Cd in
a Range given as more than a half of concentrations were below the detection limit in
internal organs (0.3 µg/g ww), and Cd concentrations
at least one of the samples contributing to the mean.
in kidney exceeded the associated guideline value
(1.0 µg/g ww) by almost 1.9 times.
5.5.3. PCDDs/Fs in marine mammals
Concentrations of 2,3,7,8-substituted PCDDs/Fs were
analyzed in samples of marine mammals collected
from the coastal survey site off the Chukotka
Peninsula. Results are presented in Table 5.42.
PCDDs/Fs levels in the blubber of marine mammals
from the Bering Sea measured in 2001 (0.6-1.0 pg
I-TEQ/g) were an order of magnitude lower than levels
in ringed seals from the Barents Sea in measured in 1987
(6-26 pg I-TEQ/g; AMAP, 1998). This difference is, how-
Table 5.42. Concentrations (expressed as TEQ) of PCDD/Fs in marine mammals
ever, consistent with spatial trends observed for other
harvested in the Russian Arctic in 2000 2002.
* ratio of PCDD/F concentration in pg WHO TEQ/g to that in pg/g
non-mammalian marine species, presented above.
5.5.4. PTS transfer in the marine food chain
(a) Organochlorines
Levels of p,p'-DDT and p,p'-DDE, and the DDE/DDT
ratio in the water-fish-seal food chain are shown in
Figure 5.28. The water-to-fish transfer factors for p,p'-
DDT and p,p'-DDE in the marine food chain are signif-
icantly higher than those calculated for the freshwater
environment in the Russian Arctic (14000 and
2500 mL/g ww of muscle, respectively). These results
may be explained by the lower DOM concentration in
sea water, normally, an order of magnitude lower than
in freshwater. However, TFWF values for other OCs are
similar, around 1000 mL/g ww in both freshwater and
Figure 5.28. Absolute and relative levels of p,p' DDE and p,p' DDT in the marine
marine systems. The high TFWF value for DDE is pos-
food chain in the Lavrentiya Bay. Geometric means and ranges are shown for DDE
and DDT concentrations in muscle tissue, water concentrations are in g/L.
sibly a result of accelerated transformation from DDT
Ratios are shown with 95% confidence limits.
to DDE in marine fish or invertebrates.
The observed concentrations of HCH and DDT in the
Concentrations of OCs found in fish and seals mus-
organs and tissues of grey whale were below the human
cles are comparable, which is consistent with the sim-
consumption guidelines values established in Russia
ilar lipid content in their muscles. Slightly higher con-
for these contaminants. For example, levels of HCH
tamination levels occur in larger seals, and slightly
in muscle and blubber were approximately a factor of
lower contamination in ringed seals, compared with
8.5 and 2, respectively, lower than the corresponding
other species, however, all differences are of fairly low
guideline values (10 ng/g ww for meat, and 200 ng/g
statistical significance. Similar patterns between
ww for animal fat). Observed concentrations of DDT
species and values for the fish-to-seal transfer coeffi-
in muscle were two orders of magnitude lower than
cient are observed for other OCs and marine mam-
the guideline value (200 ng/g ww) for human con-
mals. The geometric mean of the fish-to-seal transfer
sumption of meat of marine mammals.
coefficient, calculated using data on all OCs found at
detectable levels is equal to 0.5 for ringed seals and
(b) Heavy metals
1.4 for larga seals. DDE/DDT ratios in fish and seals
Concentrations of HMs in grey whale are presented in
are also comparable and are several times higher than
Table 5.41. Levels of Hg and Pb in the liver of grey
the ratio in water. Comparison of OC levels with cor-
120
Chapter 5
5.6. Conclusions
responding lipid concentrations, indicates that OC
trations, while the Cd level in birds is close to, or
distribution in the marine environment, as for the
slightly higher than the maximum permissible con-
terrestrial and freshwater environment, is close to
centration.
being in a state of equilibrium. However, the differ-
·
Concentrations of Pb and Cd in waterfowl are nor-
ence is clearly seen while comparing OCs in fish and
mally below permissible levels and only in few sam-
blubber of marine mammals, which is consistent with
ples attain a maximum level that exceeds the permis-
high lipid difference.
sible level by a factor of up to two. Concentrations of
Hg in molluscivorous, omnivorous, and piscivorous
(b) Heavy metals
birds are consistently close to the permissible level,
HM water-to-fish transfer factors (i.e., the ratios of the
and in most samples actually exceed it, by a maxi-
geometric mean of concentrations) for chum salmon
mum of up to 4 times. All concentrations in fish mus-
and Arctic char are similar in value. The geometric
cle are below the corresponding maximum permissi-
means of the TFWFs of both species equal 9400, 340
ble concentrations established in Russia for fish, with
and 2900 mL/g ww for Hg, Pb and Cd, respectively.
only one exception; this being Hg in whitefish from
These are somewhat higher than transfer factors calcu-
the Khatanga River, for which concentrations are 1.5
lated for the freshwater environment, the probable rea-
times the permissible level.
son being that anadromous fish species absorb HMs
·
All Hg and most Cd concentrations in seals are sig-
from both fresh and sea waters, and that HM levels are
nificantly higher than the corresponding maximum
normally lower in seawater than in freshwater. HM con-
permissible concentrations. The greatest difference
centrations in marine fish species (flounder and smelt)
between measured and guideline values is for Hg
are comparable with those in seals and walrus (i.e., TF
concentrations in seal muscle, which exceed per-
values are close to unity). The single exception to this
missible concentrations by as much as 100 times. All
is seen for Hg concentrations in seals, which are 7-18
Pb concentrations measured in muscle, liver, and
times higher than those in fish.
kidney of seals occur at levels below the correspon-
ding maximum permissible concentrations.
5.6. Conclusions
·
The level of contamination in male animals is nor-
mally slightly higher than that measured in females,
Levels
but in most cases the difference is not statistically
·
Concentrations of PCDD/Fs in reindeer muscle
significant. The single exception found was for Pb
from the Kola Peninsula, exceed maximum permis-
in browsers, where concentrations in male browsers
sible levels in meat by approximately 10%.
are consistently twice as high as those in females at
Concentrations of HCH and DDT in all tissues of
all 6 sites.
the mammals, birds and fish sampled in the Russian
·
Concentrations of both OCs and HMs are, as a rule,
Arctic are far below the corresponding maximum
higher in older animals. However, the greatest dif-
permissible concentrations established by the
ferences observed in this study between older and
Russian Ministry of Health. Only in some marine
younger age groups is within a factor of two. This
mammal species are concentrations of OC's found
was particularly the case for fish species, where the
to be close to these permissible levels, in some sam-
range in the age groups was relatively small. The
ples.
most pronounced concentration relationship to age
·
Concentrations of PCDD/Fs in muscle tissue are
was observed for HMs in reindeer. For the first few
highest in reindeer and lowest in terrestrial birds,
years of life, this relationship is close to being direct-
however the range is not large and well within an
ly proportional, with the rate of HM elimination cal-
order of magnitude. Other OCs occur in compara-
culated as being around 10 years for all 3 metals
ble concentrations in marine mammals, salmon
studied.
species, and waterfowl. In terrestrial mammals and
·
Contamination levels in the liver and kidney are nor-
birds, concentrations are, as a rule, several times
mally higher than those in muscle, especially for
lower than in other species and are generally high-
HMs. The liver/muscle concentration ratio for Hg
est in reindeer.
in reindeer, and for OCs in burbot, and also the kid-
·
At all sites, Pb concentration in reindeer tissues are
ney/muscle ratio for Cd in marine mammals can be
at least several times lower than the corresponding
up to between two and three orders of magnitude.
maximum permissible concentrations. Cd and Hg
The highest OC concentrations found in this study
levels for all tissues and sites, with the exception of
occur in the liver of burbot, fished from the Yenisey
Hg in Chukotka, are either close to the correspon-
River (580 ng/g ww of PCB15, 470 ng/g ww of
ding maximum permissible concentrations or
DDT, and 39 ng/g ww of CHLOR).
slightly exceed them. The greatest difference
·
Levels of brominated flame-retardants are below
between measured and guideline levels is seen in
the detection limit of 0.2 ng/g ww in all samples of
the Pechora basin, where Cd concentration in rein-
soil, vegetation, terrestrial mammals, and birds.
deer kidney are 2.5 times higher than the permissi-
However, in a few samples of fish and seal liver, as
ble level. Levels of Pb and Hg in muscle tissue of
well as in seal blubber, 2,2',4,4'-tetrabromodipheny
hares and terrestrial birds are significantly below
ether was found in concentrations ranging from 0.2
the corresponding maximum permissible concen-
to 1.9 ng/g ww.
121
5.6. Conclusions
Chapter 5
Trends
the Canadian Arctic in 1996-2000, and in northern
·
PCDD/F levels in the tissues of reindeer and hare
Norway in 1995.
from the Kola Peninsula are an order of magnitude
·
HM concentrations in the muscle, liver, and kidney
higher than those found at other sites.
of seals in the Russian Arctic in 2001 generally
Concentrations of PCDD/Fs in birds and fish fol-
occur within ranges similar to those found in
low similar, but less pronounced, trends.
ringed seal in the Canadian Arctic in 1998-2001.
·
No significant spatial trend in concentrations of
·
No significant temporal trend in contamination lev-
OCs, other than for PCDD/Fs in terrestrial mam-
els in any of the sampled biological species, for
mals, birds, and fish, was identified in the Russian
either OCs or HMs, is evident when the results of
Arctic in 2001. Only OC concentrations found in
this study are compared with those of previous
molluscivorous birds show a distinct maximum in
studies. However, the consistent level of concentra-
eastern Taymir.
tions, and, at some sites, significantly higher con-
·
OC levels measured in reindeer are in reasonably
centrations of HCH and Hg in mosses and lichen in
good agreement with levels previously reported for
2001, indicates that it is possible that some increase
Russian, Canadian, and Norwegian Arctic areas.
in depositions of these contaminants has taken
This is consistent with the finding that levels of
place in the Russian North during the past few
lichen contamination in Arctic Canada and Russia
years.
are comparable.
·
OC levels in fish in the Russian Arctic, are at the
Biomagnification
lower end of corresponding concentration ranges
·
OC concentration distribution patterns in both ter-
for OCs in fish in the Canadian Arctic, and are sim-
restrial and aquatic food chains in the Russian
ilar to those measured at three locations in Norway
Arctic are similar to those of lipids. This indicates
in 1994.
that OCs in Arctic ecosystems, are close to an equi-
·
As seen for OC concentrations in fish, OC levels in
librium state distribution.
the blubber of seals in the Russian Arctic are found
·
Concentrations of OCs in lichens reflect those in
to be close to the lower end of concentration ranges
mosses, with lichen/mosses concentration ratio for
obtained for seals in the Canadian Arctic in 1998-
OCs close to unity. Concentration of OCs in lichen
2001.
can therefore provide a direct estimate of the con-
·
Fish muscle from the Grate Slave Lake in northern
centration in mosses at a given site, and vice versa.
Canada in 1994/5, contained PCDD/Fs at levels an
·
The OC lichen-to-reindeer transfer factor obtained
order of magnitude higher than those determined
in this study is equal to 0.3 (ww muscle to dw lichen)
in samples from Russia in this study. In contrast,
and is consistent with factors previously determined
PCDD/Fs levels measured in the muscle of freshwa-
in the Canadian Arctic.
ter fish at four Scandinavian Arctic sites are close to
·
The OC water-to-fish transfer factors (TFWFs)
those found in the Russian North in 2001.
obtained in this study are in a reasonably good
·
Concentrations of HMs in terrestrial mammals and
agreement with those predicted using octanol-water
birds are lowest in inland Chukotka and in eastern
partition coefficients.
Taymir. However, differences between these and the
·
Values of Hg and Cd water-to-fish transfer factors
other studied locations in northern Russia are with-
are similar for both freshwater and marine fish
in a factor of 3.
groups, while the transfer factor for Pb is several
·
Levels of HMs in fish and waterfowl do not follow a
times higher for freshwater species. Geometric
pronounced spatial trend.
means of Hg and Cd TFWFs, calculated using
·
Levels of HMs in reindeer tissues determined in
pooled sets of data, are 3300 and 570 mL/g ww,
recent studies in the Canadian Arctic are, as a rule,
respectively. The geometric mean of Pb TFWFs is
somewhat higher than those measured in the
280 mL/g ww for freshwater species, and 60 mL/g
Russian Arctic.
ww for marine species. Transfer factor values for Hg
·
Concentrations of Hg in whitefish species in the
and Pb are in a good agreement with corresponding
Russian Arctic in 2001 are close to those found in
default values previously published by the IAEA.
122
Chapter 5
5.3. Results Terrestrial environment
Table 5.12.
Geometric means
and 95% confidence
interval of effective rates
of accumulation of heavy
metals in reindeer tissues
(µg/g ww per year).
tionship are given in Table 5.12, and these can be con-
(b) Heavy metals
sidered as the effective rates of accumulation of metals
HMs occur in detectable concentrations in all samples,
in reindeer tissues. The lowest values normally occur in
except for Hg in muscle tissue. Calculated
the Taymir Peninsula, however, the values do not differ
male/female concentration ratios for Hg, Pb, and Cd
by more than a factor of 3 and the differences are there-
do not differ significantly from unity and are neither
fore of no great significance.
site nor tissue specific. Mean concentrations for HMs
were, therefore, calculated using data for both sexes.
Concentrations of Cd and Hg in muscle tissue sampled
The distribution of the three HMs between tissues is
in 2001 are very close to those found in 1994/1995 in
similar for both sexes, and approximates that found in
the Russian North (AMAP, 1998), while levels of Pb in
reindeer. Relative levels of contaminants in muscle,
muscle are an order of magnitude lower than those
liver and kidney are in the ratio of 1:11:5 for Pb and
reported earlier. In comparison with 1995 values,
1:26:160 for Cd (based on geometric means of ratios
liver/muscle concentration ratios calculated in 2001
for pooled samples).
are significantly higher for all HMs, and are similar to
those measured in other regions of the Arctic (AMAP,
Levels and trends
1998). Levels of all HMs are similar to, or slightly lower
than those determined in the Canadian Arctic in 1998-
(a) Organochlorines
2001 (CACAR, 2003). However, as concentrations of
The levels of OCs that were generally above detection
HM in Canadian reindeer are reported on a dry weight
limits in tissues of hare (HCB, p,p'-DDT, p,p'-DDE, PCB-
basis, direct comparison is not possible; on a dry wt
118 and PCB-153) did not follow any geographical
basis, absolute values are typically up to an order of
trend. Geometric means of OC concentrations range
magnitude greater.
from 0.06 ng/g ww (p,p'-DDT, p,p'-DDE) to 0.12 ng/g
ww (HCB). Concentrations of PCB-138, PCB-180, as
5.3.3. PTS in the Arctic hare
well as - and - HCH occur at similar levels at several
Tissues of Arctic hare (Lepidus timidus) were sampled
sites. In a few samples, some of the other OCs (PCBs,
at all sites, except for coastal Chukotka. The number
Mirex, and cyclodienes) were found in concentrations
of single samples of each tissue, collected at a given
close to the detection limit. Concentrations of all
site and used in the preparation of pooled samples,
detectable OCs in hare tissues are 2-4 times lower than
ranged from 4 to 10 (see Table 5.1). Equal numbers
those in reindeer, and are far below the limit values for
of male and female animals, all younger than these substances established in Russia.
3 years, were sampled at each site. The muscle, liver
and kidney of hare were analyzed for all PTS listed in
Section 1.2.4.
PTS concentration relationships with hare sex
and tissue type
(a) Organochlorines
Only a few OCs (HCB, p,p'-DDT, p,p'-DDE, PCB-118,
PCB-138 and PCB-153) were detectable at all sites and
in the majority of samples. No significant concentra-
Table 5.13. Concentrations (expressed as TEQ) of PCDD/Fs in hares
tion relationship to either sex or tissue type was identi-
in the Russian Arctic in 2001.
fied for these OCs in hare.
* ratio of PCDD/F concentration in pg WHO TEQ/g to that in pg/g
99
5.3. Results Terrestrial environment
Chapter 5
(b) PCDD/Fs
·
Grazers (geese that graze mainly on aquatic and ter-
Concentrations of 2,3,7,8-substituted PCDD/Fs were
restrial vegetation): bean goose (Anser fabalis),
analyzed in pooled samples of hare tissues collected at
white-fronted goose (Anser albifrons), goldeneye
each site. Results are presented in Table 5.13 and
duck (Bucephala clangula) and ptarmigan (Lagopus
Figure 5.12. PCDDFs in hare tissues follow the same
sp.);
spatioal distribution pattern as for reindeer. All con-
·
Omnivores (surface-feeding ducks with a varied
centrations are at levels below the (maximum) permis-
diet consisting mainly of aquatic vegetation): pintail
sible level for meat.
(Anas acuta), wigeon (Anas penelope), and teal (Anas
crecca);
(c) PAH
·
Molluscivores (diving ducks feeding mainly on
Hare tissues were analyzed for the same PAH set as were
invertebrates): eider (Somateria mollissima), and
reindeer tissues. In contrast to OCs, most PAH concen-
long-tailed duck or oldsquaw (Clangula hyemalis);
tration levels in hare are either comparable with those
·
Piscivores (diving ducks feeding mainly on fish):
in reindeer or are higher. Only phenanthrene concen-
scaup (Aythya marila), merganser (Mergus sp.), scoter
trations in hare muscle are, for most sites, found to be
(Melanitta sp).
several time lower than those in reindeer.
For most sites, equal numbers of male and female birds
(d) Brominated flame-retardants
of each groupwere harvested. Exceptions were: omni-
Samples of hare tissue were analysed for 2,2',4,4'-tetra-
vores (1 male pintail) and piscivores (1 female scoter)
bromodiphenyl, 2,2',4,4',5-pentabromodiphenyl, 2,2',
in eastern Taymir; grazers (1 female goose) at inland
4,4'-tetrabromodiphenyl ether and 2,2',4,4',5-pentabro-
Chukotka; and molluscivores (1 male eider) at coastal
modiphenyl ether. In all samples, concentrations of these
Chukotka.
substances were below the detection limit of 0.2 ng/g ww.
PTS concentration relationships with bird sex
(e) Heavy metals
No significant concentration dependence on sex was
HM concentrations measured in hare tissues are given
identified for any of the detectable OCs, for Hg and Cd
in Table 5.14. Concentrations are usually several times
in all bird groups, and for Pb in waterfowl. Pb concen-
lower than those found in reindeer, with the exception
trations in the muscle tissue of male browsers were con-
of Cd in kidney tissue, for which levels in hare and rein-
sistently about twice as high as those measured in
deer are comparable. Spatial distribution patterns
females at all six sites; the male/female ratios ranging
observed for all three HMs are similar to those for rein-
from 1.7 to 2.6, with a geometric mean of 2.1 for the six
deer. The lowest concentrations occur in Chukotka
values. Since the male/female ratios for Pb in browsers
and eastern Taymir. Concentrations of HMs in hare tis-
are not particularly high, the ratio is independent of
sues measured in this study are similar to those report-
site, and the same sample pattern for sexes was fol-
ed for hares in Finland in 1995 (AMAP, 1998).
lowed at all sites (50% male and 50% female), all geo-
Differences in levels between the data from Finland in
metric means, including those for Pb concentrations
1995 and Russia in 2001 are relatively small (within a
in browsers, were calculated using data for both sexes
factor of two), with the exception of Pb in muscle,
which is 4.4 times higher in the Russian North.
Levels and trends
5.3.4. PTS in birds
(a) Organochlorines
Waterfowl and terrestrial game birds harvested by
Concentrations of OCs in birds are shown in Tables
indigenous peoples in the Russian Arctic for the proj-
5.15a and 5.15b and Figures 5.14 and 5.15. The lowest
ect, were analyzed for all contaminants listed in Section
contamination levels are found in the muscle tissue of
1.2.4. Samples tissues of the following groups of birds
browsers. The only OC that was repeatedly detected in
were collected:
these birds was p,p'-DDE. Levels of PCB15 in browsers
Table 5.14.
Concentrations (mean and
standard deviation; µg/g
ww, n=2) of HMs in tissues
of the Arctic hare (< 3 years
of age) in the Russian Arctic
in 2001.
a The range (in brackets)
is given where the standard
deviation is larger than 50%
of the mean.
100
Chapter 5
5.3. Results Terrestrial environment
Table 5.15a. Concentrations (geometric mean and range; ng/g ww) of OCs in the muscle of birds in the Russian Arctic in 2001.
a In at least one sample, more than half of the concentrations were below the detection limit. Concentrations below the detection limit were set to zero or to the detection limit
when determining lower and upper limits of concentration ranges.
b The range is given only for oldsquaw (n=2). Concentrations in eider were below the detection limit.
Figure 5.14. Geometric means and ranges of OC concentrations in molluscivores.
Figure 5.15. Geometric means and ranges of OC concentrations in omnivores.
PCB=PCB15, HCH=HCH, CHLOR=CHLOR, and DDT=DDT.
PCB=PCB15, HCH=HCH, CHLOR=CHLOR, and DDT=DDT.
Table 5.15b. Concentrations (geometric mean and range; ng/g ww) of OCs in the muscle of birds in the Russian Arctic in 2001.
a In at least one sample, more than half of the concentrations were below the detection limit. Concentrations below the detection limit were set to zero or to the detection limit
when determining lower and upper limits of concentration ranges.
b The range is given only for oldsquaw (n = 2). Concentrations in eider were below the detection limit.
c The geometric mean and range is given only for pintail (n = 2). Concentrations in mallard are below the detection limit.
101
5.3. Results Terrestrial environment
Chapter 5
were about 1 ng/g ww, about 2-3 times higher than
DDT at all sites. Other OCs occurred at concentra-
tions below or close to the detection limit in all sam-
ples. As for OCs in reindeer, there was no evident geo-
graphical trend for OCs in terrestrial birds.
OC levels in waterfowl are up to an order of magnitude
greater that those in browsers. Clear maximum concen-
trations of all OCs in molluscivores are found in eastern
Taymir, near Khatanga. In other bird groups, OC levels at
this site are comparable to those found at other sites.
Maximum concentrations range from 0.08 ng/g ww for
Mirex, and 1-3 ng/g ww for HCB, CHLOR, and HCH,
to about 10 ng/g ww for DDT and PCB15. Similar pat-
terns of OC concentrations are seen in other waterfowl at
all sites. Concentrations of p,p'-DDE found at all sites, are
significantly higher than those found in reindeer muscle,
while concentrations of other OCs are comparable with
those in reindeer. The lowest concentrations occur, as a
rule, at sites in Chukotka. Contamination levels in most
cases, decrease in the following order: molluscivores >
omnivores > piscivores > grazers. All OC concentrations
in birds are far below the (maximum) permissible levels
for bird meat established in Russia.
Table 5.16. Concentrations (expressed as TEQ) of PCDD/Fs in bird muscles
(b) PCDD/Fs
in the Russian Arctic in 2001.
Concentrations of 2,3,7,8-substituted PCDD/Fs were
* ratio of PCDD/F concentration in pg WHO TEQ/g to that in pg/g
analyzed in pooled samples of bird muscle tissue col-
lected from each site. Results are presented in Table
2001 are given in Table 5.17. Concentrations of 2-
5.16 and Figure 5.12. PCDD/F concentrations in birds
methylnaphthalene and fluorene in waterfowl are sev-
follow the same geographic distribution pattern as they
eral times higher, whilst concentrations of phenan-
do in reindeer, although the spatial differences are less
threne and pyrene are several times lower than those
pronounced in birds. All concentrations occur at levels
found in browsers. Naphthalene and fluoranthene
which are far below the maximum permissible levels
occur in the two bird groups in comparable concentra-
for these substances in meat.
tions. Those PAHs not included in Table 5.17, were
found in concentrations close to their detection limits,
(c) PAH
and then only in few samples of waterfowl. In contrast,
Bird tissues were analyzed for the same PAH set as rein-
chrysene, benzo[k]fluoranthene, benzo[a]pyrene,
deer. Geometric means and ranges of PAH concentra-
benzo[ghi]perylene, and biphenyl were detectable in
tions found in bird muscles in the Russian Arctic in
most of the browser muscle samples in concentrations
Table 5.17. Concentrations (geometric mean and range; ng/g ww) of PAHs a in muscle of birds in the Russian Arctic in 2001.
a NAP = Naphthalene, NAP2M = 2 Methylnaphthalene, FLE = Fluorene, PA= Phenanthrene, FLU = Fluoranthene, PYR = Pyrene
102
Chapter 5
5.3. Results Terrestrial environment
Table 5.18. Concentrations (geometric mean and range; µg/g ww) of HMs in muscle of birds in the Russian Arctic in 2001.
a Data for one sample which was contaminated by lead shot was discarded. Pb concentrations in contaminated samples range from 0.5 to 11 µg/g wet weight.
from 0.5 to 5 ng/g ww. Levels of all PAHs in browsers,
with the exception of fluorene, were about twice as
high as those found in reindeer. No noticeable geo-
graphic trend was observed for any of the PAHs. For
these substances, the variability between samples was
always comparable with the variability between sites.
(d) Brominated flame-retardants
Samples of bird tissues were analyzed for 2,2',4,4'-tetra-
bromodiphenyl, 2,2',4,4',5-pentabromodiphenyl, 2,2',
4,4'-tetrabromodiphenyl ether, and 2,2',4,4',5-penta-
bromodiphenyl ether. In all samples, these substances
were found at concentrations below the detection limit
of 0.2 ng/g ww.
Figure 5.16. Geometric means and ranges of Hg concentrations in muscle
(e) Heavy metals
of waterfowl in the Russian Arctic in 2001. The red line indicate the maximum
In most of the waterfowl samples, levels of Hg exceed-
permissible concentrations of Hg allowed by food safety standards. The number
ed the MPC for this metal, and only in browsers were
of values used for calculating means varied between 1 and 4.
Hg concentrations below the detection limit at all sites
(see Figure 5.16). Levels of Pb and Cd in terrestrial
used in the preparation of pooled samples ranged
birds and waterfowl are comparable (see Table 5.18).
from 3 to 9 (see Table 5.1). Most of the soils sampled
No pronounced geographic trend was observed for any
were of peat litter.
of the HMs in any bird group. Concentration differ-
ences occurring between any two sites, for a given HM
(a) Organochlorines
and bird group, were not statistically significant,
It is well known that POPs that are present in abiotic
despite inter-sample variability being quite low at
media (soil, water and air) can be taken up by living
almost all sites. The only notable exception to this, was
organisms, and subsequently transferred within food
the concentration of Cd measured in omnivores and
chains. In most cases, intake via the diet is the major
piscivores in eastern Taymir, which was found to be sig-
pathway for human POP exposure. In a steady state sys-
nificantly lower than at other sites. Concentrations of
tem, POPs are distributed throughout the environ-
Pb and Cd in birds were normally below maximum per-
ment according to the fugacity capacities of the various
missible levels for these metals (0.5 and 0.05 mg/kg,
environmental compartments. For POPs, fugacity
respectively), and only in few samples were concentra-
capacities are proportional to the lipid concentration
tions found to be higher (up to twice the MPC level).
in a given biological compartment (Sharpe and
Mackay, 2000; McLachlan, 1996). In this section, the
5.3.5. PTS transfer in the terrestrial food chain
partitioning of OCs between abiotic media and the tis-
For the estimation of soil-to-lichen and water-to-fish
sues of terrestrial organisms in the Russian Arctic is
transfer coefficients, pooled samples of soil were col-
considered, mainly using data on p,p'-DDT and p,p'-
lected at all 6 sites. The number of pooled samples
DDE levels. These two OCs, are convenient reference
ranged from 1 to 5, and the number of single samples
compounds, being detectable in most biotic and abiot-
103
5.3. Results Terrestrial environment
Chapter 5
ic samples collected. In addition, the ratio of p,p'-DDE
KOA is the octanol-air partition coefficient
to p,p'-DDT levels in soil is widely used to estimate the
(the ratio of volume concentrations when
age of the contamination and can, therefore, serve as
at equilibrium).
an indicator of the relative rate of p,p'-DDT metabolic
transformation in organisms. Most other OCs follow
Taking into account of the relatively low variability in
similar patterns of uptake and transport in food chains
lipid content in plant tissues, Equation 5.1 indicates
that have been studied.
that POP concentration ratios between two species
can be considered as being independent of site. If the
The soil-lichen-reindeer food chain is one of the most
kinetic limitations of uptake and depuration are
important in the Arctic. An example of levels of p,p'-
ignored, it could also be expected that the same ratio
DDT and p,p'-DDE in this chain are given for Khatanga
value would apply for all POPs. A comparison of the
in eastern Taymir in Figure 5.17. Geometric means of
concentrations of all OCs (excluding PCB) in lichens
soil-to-lichen transfer factors (concentration ratios) for
and mosses supports these assumptions (see Figure
both p,p'-DDT and p,p'-DDE are equal to 2.9 ranging
5.18). From Figure 5.18, it is evident that OC con-
from 0.7 (for p,p'-DDT on the Kola Peninsula) to 15
centrations in lichens show a clear relationship to
(for p,p'-DDE in western Taymir). The soil-to-lichen
those in mosses. The best correlation is seen for DDT
transfer factors for other OCs show a similar degree of
metabolites, probably because these contaminants
variability and similar geometric means (1.1 for PCB-
are present at higher concentrations and there is a
28 and PCB-153, 1.9 for HCB, and 2.5 for HCH iso-
lower detection error. The lichen/moss concentra-
mers). High levels of within site variability in the ratios
tion ratio for POPs, obtained using linear regression
are most probably explained by a relatively high vari-
analysis, is equal to 0.97. In other words, POPs con-
ability of p,p'-DDT and p,p'-DDE concentrations in soils.
centrations in lichen can be used as a direct estimate
Variability in OC concentrations at a particular site is
of the POP concentrations in mosses in the study
significantly less in lichens and mosses than soils.
area, and vice versa.
Lichens and mosses uptake pollutants primarily from
the air, which, in the absence of local sources of pollu-
tants, has relatively uniform contamination levels.
Even though lichens do not take up OCs directly from
the soil, soil-to-lichen transfer coefficients can still be cal-
culated, is based on the fact that, in the air of remote
areas, OC levels are proportional to those in soil, espe-
cially surface soil. Proportionality of OC levels between
soils and lichens can, therefore, also be expected.
Uptake from the air is the main route by which POPs
contaminate, not only mosses and lichens, but also other
plants; as POPs are highly lipophilic compounds and,
once adsorbed on the root surfaces, they tend not to be
translocated to the aboveground parts of plants
(McLachlan, 1996). Concentrations of OCs in air were
Figure 5.17.
not measured in the current study, therefore, only rela-
Absolute and relative levels of p,p' DDE and p,p' DDT for the soil
lichen reindeer food chain in the Khatanga area. Geometric means and ranges of DDE
tive air-to-plant transfer factors (based on interspecies
and DDT levels in soil and lichen are provided on a dry weight basis, while levels in
concentration ratios) could be calculated. Using such
reindeer muscle are on a wet weight basis; 95% confidence limits are shown for ratios.
ratios, once the OC concentration has been measured in
one particular plant species at a given site, the concen-
tration in any other species can be estimated using the
corresponding species/ species concentration ratio.
This approach relies on the similarity of the uptake
mechanism for POPs in different plant species. The
predominant pathway for uptake of POPs by plants is
dry gaseous deposition from the atmosphere (Paterson
et al., 1994; McLachlan, 1996). The POP concentration
in plants (CP) can be related to that in air (CA) by the
following equation:
CP = L · KOA · CA
(5.1)
where:
Figure 5.18. The relationship between OC concentrations in mosses
L is the lipid fraction in the plant tissue
and lichen (dry weight) in the northern Russia. 1 DDT and its metabolites,
(volume/volume);
2 HCH isomers, 3 Heptachlor, 4 Mirex, 5 HCB.
104
Chapter 5
5.3. Results Terrestrial environment
Berries and mushrooms are both components of the
feed and cow tissues takes place. Data obtained in the
human diet in the Russian North. Assessment of their
current study indicated that OC distribution between
contribution to human OC exposure in the Arctic
soil, lichen, and reindeer tissues was also close to a
requires data on contamination levels. As the available
steady state. The observed lack of dependence of OC
data set for berry and mushroom contamination in the
concentrations in reindeer tissues on animal age, and
Arctic is much more limited than that for lichen and
also the similarity of values calculated for OC concen-
mosses, the calculated lichen/berry and lichen/mush-
tration and lipid content ratios for reindeer/hare and
room concentration ratios are useful. Sufficiently reli-
reindeer/birds also support this conclusion (see
able data for calculation of the berry/lichen concentra-
Figure 5.19). All differences found between rein-
tion ratio were obtained only for p,p'-DDT and HCB
deer/hare and reindeer/bird concentration ratios for
(although data for the Kola Peninsula site where an
lipids and any of the OCs were small and within a fac-
anomalously high p,p'-DDT level was measured were
tor of two, and OC ratio ranges agreed closely with
excluded). The berry/lichen concentration ratio for
those for lipids.
p,p'-DDT was found to be practically the same as that for
Figure 5.19.
HCB. The geometric mean of the nine ratios calculated,
Concentration ratios
using data on both p,p'-DDT and HCB, is equal to 0.27.
(geometric mean and 95%
confidence limits) for OCs
Lichen-to-reindeer transfer factors (TF
and lipid content
LR) were also of
in reindeer/hare
the same value (0.3, based on wet wt. and dry wt. con-
and reindeer/birds,
centrations, respectively) for both p,p'-DDT and p,p'-
for all sample sites.
DDE. They ranged from 0.1 (for p,p'-DDE in western
Taymir) to 1.8 (for p,p'-DDE in Chukotka). In the
Canadian Arctic, in 1993, this factor was found to range
from one to values in the tens (based on lipid wt. and
dry wt. concentrations, respectively) for different OCs
The DDE/DDT ratio in soils immediately following
(CACAR, 1997). The geometric mean of lipid content
application of DDT pesticide is normally about 0.1 or
measured in reindeer muscle in the current study was
less (Harner et al., 1999). As a result of the microbio-
about 5%. Using this value to convert the transfer fac-
logical transformation of p,p'-DDT into p,p'-DDE, and
tors based on wet wt. concentrations to their lipid wt.
other metabolites, this ratio increases with time. In
equivalents yields values that are close to those reported
temperate zones, the DDE/DDT ratio in soils 30 years
for Canada. TFLRs for other OCs that were found at con-
after the last pesticide application ranges from 0.7 to 2
centrations above detection limits in the current study
(Harner et al., 1999). Ratios in the Russian Arctic are,
are of similar values to those determined for p,p'-DDT
as a rule, at the lower end of this range (see Table
and p,p'-DDE (0.2 for PCB-28, 0.8 for PCB-153, 0.5 for -
5.19a). This may indicate that fresh use of DDT is still
and -HCH, and 0.3 for HCB, based on wet wt. and dry
contributing to contamination of the Russian Arctic.
wt. concentrations, respectively).
However, lower ratio values can be also explained by
the slower rate of metabolic processes which occur in
All transfer factors obtained for p,p'-DDT and p,p'-DDE
Arctic soils.
in the soil-lichen-reindeer chain agree reasonably well
with the values expected on the basis of corresponding
Metabolic transformation of p,p'-DDT also takes place
concentration ratios for lipids. This result is reasonable
in higher organisms (WHO, 1982) and the DDE/DDT
since POP concentrations in the soil surface and in
ratio in their tissues can serve as an indicator of the rel-
plants will generally be at close to equilibrium with
ative rate of p,p'-DDT transformation in different
POP concentrations in the air, and will reflect the lipid
species. DDE/DDT ratios in terrestrial food chains in
contents of the soil and plants (McLachlan, 1996).
the Russian Arctic are provided in Figure 5.17 and
Relatively large deviations from equilibrium are
Tables 5.19a and 5.19b. No statistically significant dif-
observed only for concentrations of POPs which have a
ferences were observed between the ratio values, either
very high molecular weight, but even then, these devi-
in soils, lichens, or reindeer tissues, or, between the 6
ations are similar in both plants and soils. POP absorp-
sites (see Table 5.19a and 5.19b). This indicates that
tion and depuration by mammals is significantly slower
the p,p'-DDT transformation rate in reindeer tissues is
than that by plants. For example, the depuration half-
comparable with that in soils and lichens. The ratio
life for PCDD in the human body can be as long as sev-
values for terrestrial birds are, as a rule, somewhat
eral years (Masuda, 2001). However, given relatively sta-
higher than in reindeer (see Table 5.19a), probably
ble levels of air contamination, POP concentrations in
due to a faster rate of metabolic p,p'-DDT transforma-
mammal tissues and in vegetation used for food
tion in birds.
should, in general, be comparable, after correction for
lipid content (McLachlan, 1996). For example, cow
(b) Heavy metals
milk/fodder fugacity quotients measured in Germany
Some HMs, such as copper (Cu) and zinc (Zn) are
were, with a few exceptions, close to unity for HCB,
essential elements for both plants and animals and as
PCBs, and PCDD/Fs (McLachlan, 1996). This indi-
such, their levels in tissues are under homeostatic con-
cates that a steady state partitioning of OCs between
trol (Yagodin et al., 1989; Speidel and Agnew, 1982).
105
5.3. Results Terrestrial environment
Chapter 5
Table 5.19a.
DDE/DDT ratios (geometric
means and 95% confidence
interval) in terrestrial food
chains.
n. d. not detected
Non-essential elements, such as Hg and Cd, do not
As for OCs, the soil-lichen-reindeer food chain is one
appear to be well-regulated by living organisms. Thus,
of the most important pathways for human exposure
tissue concentrations of Hg and Cd proportional to
to HMs in the Arctic. Lichen is able to assimilate min-
environmental (or food) contamination levels can be
eral substances from any material to which it adheres.
expected. The use of transfer factors is based on this
However, the similar pattern of HM concentration
assumption. However, deviations from direct propor-
ratios in lichens, mosses and soils (Hg: Cd: Pb in the
tionality do occur, and quite often are more pro-
ratio of 2:3:95) indicates that mosses, as well as
nounced at higher levels of exposure, especially for Pb
lichen, take up most of their HM burden from the
(WHO 1989a, 1989b, 1991, 1992, 1995). A possible
air, apparently from windblown soil and dust.
explanation for this is that HMs in high concentrations
Geometric mean values of lichen/moss concentra-
are toxic for all organisms and their transfer through
tion ratios ranged from 0.5 to 0.6 for all three HMs.
cell membranes may be limited when tissue contami-
This ratio can be considered indicative of the greater
nation exceeds some critical level. In addition, Pb con-
ability of mosses to intercept particles. The geomet-
tent in tissue is probably under at least some degree of
ric mean for the lichen/moss concentration ratio,
homeostatic regulation, since it belongs to a group of
calculated using the pooled set of data for all three
so-called `conditionally essential elements' (Yagodin et
metals was equal to 0.56.
al., 1989; Speidel and Agnew, 1982). As a result, the HM
transfer coefficient for a particular link in a food chain
An example of HM concentration patterns for the soil-
depends not only upon environmental conditions, but
lichen-reindeer food chain is given in Figure 5.20.
also upon the HM concentration in abiotic media (or
food). It follows that use of HM transfer coefficient val-
ues obtained at low exposure levels, for tissue concen-
tration assessment at high exposure levels, can lead to
an overestimation of the concentration of that HM.
Another important condition for the applicability of the
transfer factor approach, is the absence of kinetic limi-
tations. The biological half-life of HMs in mammals is
difficult to estimate (WHO 1989a, 1989b, 1991, 1992,
1995). The biological half-life of Hg and Pb in blood and
the soft tissues of mammals normally ranges from sever-
al weeks to several months. However, significantly slower
Hg and Pb elimination rates have also been reported.
For example, the half-life of Hg in brain tissue and of Pb
in bone ranges from years to decades, and for a mammal
to eliminate 50% of absorbed Cd can take as long time
as 30 years. Based on these elimination rates, HM food-
Figure 5.20. HM distribution patterns in the soil lichen reindeer food chain
on the Kola Peninsula in 2001. Concentrations of HMs in soil and lichen and their
to-mammal transfer factors can be expected to show a
ranges are given on the dry weight basis, while those for reindeer muscle are provided
significant degree of dependence on mammal age.
on the wet weight basis.
Table 5.19b.
DDE/DDT ratios (geometric
means and 95% confidence
interval) in terrestrial food
chains.
n. d. not detected
106
Chapter 5
5.4. Freshwater environment
Soil-to-lichen transfer coefficients for Hg and Pb are
estimated by applying equation 5.3 to experimental
similar (the geometric mean equal to 0.6, ranging from
data. Because of the small number of age groups and
0.3 to 1.3 based on dry wt. concentrations). The geo-
narrow age intervals recorded, the accuracy of such
metric mean for Cd was about twice as high (1.3), but
estimates using data obtained in this study is low.
the difference is of low statistical significance. Soil-to-
However, it is clear that the elimination half-life for all
lichen transfer factors for HMs are several times lower
three HMs is at least several years, and could be in the
than those for OCs. This is consistent with the hypoth-
order of 10 years.
esis that soil dust interception is the main pathway of
HM uptake by lichens, whilst organic chemicals, in
Using a typical rate of lichen consumption by reindeer
addition to this mechanism, are also absorbed through
(i.e. 40 g dw/kg live weight per day; White et al., 1999)
dry gaseous deposition. Uptake of HMs from soil by
and HM concentrations from Table 5.7, the total annu-
mushrooms is more strongly affected by the chemical
al uptake of HMs from lichen by reindeer can be cal-
state of the metal. Geometric mean values of soil-to-
culated. Based on geometric means, this yields values
mushroom transfer factors (based on dry weight con-
of 0.51, 29, and 1.0 mg/kg live weight per year for
centrations) ranged from 0.12 and 0.25 for Pb and Hg,
uptake of Hg, Pb and Cd, respectively. Comparison of
respectively, to 1.5 for Cd. The geometric mean of the
these values with effective deposition rates from Table
soil-to-berry transfer factor for Pb (0.006) is two orders
5.12 indicate that less than 0.1% of Pb from consumed
of magnitude lower than that calculated for lichens.
lichens is transferred into the muscle, while the effec-
tiveness of Hg and Cd transfer to muscle is up to an
Significant differences between Pb and Hg and Cd also
order of magnitude greater, with values of 0.4% and
occur in the transfer of HMs from lichen to reindeer
1.0%, respectively.
tissues. Geometric means of lichen-to-reindeer transfer
factors for Hg and Cd are similar (0.4 and 0.5, respec-
5.4. Freshwater environment
tively) and an order of magnitude higher than that cal-
culated for Pb (0.03). All transfer factors as a function
5.4.1. PTS in fish
of herd, vary within an order of magnitude. This vari-
Fish were obtained from Lake Lovozero (Kola
ability can be partially explained by differences in the
Peninsula), the Pechora River, the Yenisey River (west-
mean age of animals sampled. The age dependence of
ern Taymir), the Khatanga River (eastern Taymir),
a pollutant concentration in an animal tissues can be
and the Kanchalan River (inland Chukotka). Fish age
described by the following simple model:
ranged from 5 to 14 years. The number of individual
samples of tissue collected at a given location for use
in the preparation of pooled samples ranged from 1
(5.2)
to 13 (see Table 5.1). The following fish species were
sampled:
Where:
·
pike (Esox lucius)
C is the pollutant concentration in the animal,
·
burbot (Lota lota)
ng/g ww;
·
perch (Perca fluviatilis)
ri is the pollutant accumulation rate,
·
ide (Leuciscus idus)
ng/g ww per year;
·
whitefish (Coregonus lavaretus)
ke is the pollutant elimination rate constant,
·
Arctic cisco (Coregonus autumnalis)
per year;
·
broad whitefish (Cerogonus nasus)
t is the animal age, years.
·
Arctic char (Salvelinus alpinus)
·
inconnu (Stenodus leucichthys nelma)
Assuming that the intake rate is constant, this can be
·
grayling (Thymallus thymallus)
expressed as:
Fish muscle and liver tissues were analyzed for all PTS
listed in Section 1.2.4. Results of analysis were divided
(5.3)
into groups according to sex (male or female), age
(either two or three classes), and tissue type (muscle or
When ket is small (i.e., elimination is slow), equation
liver). Age differences within groups ranged from 1 to
5.4 can be simplified and the concentration depend-
2 years. The difference between the mean ages of fish
ence on age becomes directly proportional:
in the oldest and youngest groups was always less than
a factor of two.
(5.4)
PTS concentration relationships to fish sex,
As was shown in section 5.3.2, HM levels in reindeer are
age and tissue type
directly proportional to age. This means that the elim-
ination rate is quite slow (ket is small) during at least the
(a) Organochlorines
first few years of life, and effective rates of HM accu-
Male/female concentration ratios of OCs that could
mulation in reindeer tissue (see Table 5.12) provide an
be reliably quantified (p,p'-DDT, p,p'-DDE, PCB-138,
estimate of ri. Values for the elimination rate (ke) can be
PCB-153, and HCB) were calculated using data from
107
5.4. Freshwater environment
Chapter 5
fish of the same age groups. No statistically significant
difference was found between the geometric mean of
the ratios and unity, for any OCs or any species.
Calculated age ratios (for middle/young and
old/young age groups) are, with a few exceptions,
slightly higher than unity and range from 0.8 to 2.8.
However, in all cases, the standard deviation was com-
parable to, or larger than the mean ratio value. Taking
into account the relatively small number of values
Hginliver,mg/kg
included in the average, this implies that the statistical
significance of any observed age dependency is very
low, and that data for all age groups can be combined
in the calculation of geometric mean OC concentra-
tions. The geometric means of OC liver/muscle con-
centration ratios are close to unity for salmon species
Figure 5.21. Hg concentration in fish liver as a function of the fish age
and range from 2 to 5 for pike, perch and ide. The
in northern Russia in 2001.
highest absolute and relative concentrations of all OCs
from all sites were found in burbot liver samples. In the
those in other species. The liver/muscle concentration
liver of both male and female burbot, fished from
ratio for burbot varied from site to site within two
Yenisey River, OC concentrations were as high as orders of magnitude. The geometric mean for detect-
580 ng/g for PCB15, 470 ng/g for DDT, and ed OCs in burbot ranges from 50 to 160. These obser-
39 ng/g for CHLOR. Levels of OCs in the liver of
vations are explained by the fact that the lipid content
other fish species were much lower. In contrast, OC
of burbot liver is significantly higher than that of the
concentrations in burbot muscle were very close to
other species studied, whilst lipid levels in the muscle
Table 5.20.
Geometric means and 95%
confidence interval of effec
tive rates of accumulation
of heavy metals in fish
tissues (µg/g ww per year).
108