SeCd
Zn
Ni
VPb
AlHg
Cu
As
ELANDER
MAGNUS
Heavy metals
Anthropogenic sources of metals can have
severe and obvious impacts on the local envi-
ronment, but signs of environmental change
across a larger region and on a broader scale
are subtle and difficult to interpret. Connecting
dead trees and bare ground to a nearby smelter
complex is not hard. But what does it mean
when mercury levels are higher in the upper
part of ocean and lake sediments. Could it be
evidence of an increased circulation of this
toxic element, a sign that human activities may
be adding to an existing burden of mercury in
Arctic animals and the people who eat those
animals? With cadmium, what role does nat-
ural geology play in relation to anthropogenic
inputs in explaining levels in animals that are
high enough to raise health concerns? In spite
of such uncertainties, one message is clear:
these metals matter because they accumulate in
the bodies of Arctic animals and hence become
available to humans who depend on wildlife
for their survival.
This chapter discusses the sources of heavy
metals in the Arctic environment and describes
their levels in air, sediment, water, and biota.
Based on current understanding of the behav-
ior of metals in the environment and their tox-
icology, the chapter attempts to assess the
impact of some metals on plants and animals.
The focus is both on large-scale contamination
and on the severe local ecological effects found
near some industrial sites in the Arctic. The
potential impacts of metals on human health
are covered in the chapter Pollution and
Human Health.
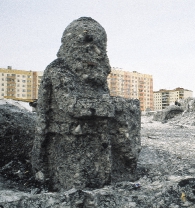
Snowman, Norilsk
AMAP also considers the metals arsenic,
94
Heavy metals
Heavy metals Ł
copper, chromium, nickel, vanadium, and zinc,
an introduction
especially in its assessment of sources.
Organotins are covered in the chapter Per-
Metals occur naturally in the environment and
sistent Organic Pollutants.
are present in rocks, soil, plants, and animals.
Metals occur in different forms: as ions dis-
solved in water, as vapors, or as salts or miner-
Metals in the environment
als in rock, sand, and soil. They can also be
bound in organic or inorganic molecules, or
We start with a short profile of the major met-
attached to particles in the air. Both natural
als in the assessment followed by a general dis-
and anthropogenic processes and sources emit
cussion of environmental factors and chemical
metals into air and water.
transformations that affect the uptake and
Plants and animals depend on some metals
impact of metals on animals.
as micronutrients. However, certain forms of
some metals can also be toxic, even in rela-
Mercury (Hg)
tively small amounts, and therefore pose a risk
to the health of animals and people. While the
Mercury occurs naturally as elemental mer-
effects of chronic exposure to trace amounts of
cury and as organic and inorganic compounds.
some metals is not well understood, a legacy of
Much of the mercury in the environment is
incidents tells us about the seriousness of high
strongly bound to sediments and organic mat-
levels of exposure to some metals, especially
ter, and thus unavailable to organisms. Micro-
cadmium and methyl mercury. In the 1950s,
organisms can convert inorganic mercury into
chronic cadmium poisoning from rice, coupled
methyl mercury, which is a fat-soluble mole-
with dietary deficiencies, caused an epidemic
cule that easily passes through cell membranes,
of kidney damage and a painful skeletal dis-
accumulates in animals, and biomagnifies in
ease among middle-aged women in Japan, the
the food web.
Itai-itai disease. Also in Japan, mercury poison-
Mercury is a nerve toxin and the main
ing from fish in a polluted bay became known
health concern is its effect on the brain, partic-
as Minimata disease. For mercury, severe effects
ularly in the growing fetus and the young. The
on wildlife have been well documented. In the
phrase `mad as a hatter' and the term `hatter's
1950s and 1960s, many farmers laced their
shake' stem from mercury poisoning of hat
seeds with methyl mercury to prevent mold
makers using the metal for curing felt. Mer-
growth. The result was extensive bird kills.
cury can damage reproduction in mammals by
In the Arctic, sources of heavy metals in-
interfering with the formation of sperm. Neu-
clude weathering of rock. As elsewhere, there
rological and reproductive effects have also
is also concern that human activities, such as
been seen in birds. In fish, its effects also in-
mining, metal processing, and burning of fossil
clude a decreased sense of smell, damage to the
fuels, will increase the flux of metals that can
gills, blindness, and changes in the ability to
be transported by wind and water and thus
absorb nutrients in the intestines. Plants can be
become available to plants and animals. More-
sensitive to mercury, where high concentra-
over, heavy metals in consumer goods and in-
tions lead to reduced growth.
dustrial processes enter the environment when
The most important anthropogenic sources
we burn or dump waste. Metals are elements
of mercury to the Arctic atmosphere are com-
and therefore cannot degrade, but can only
bustion of fossil fuels, particularly coal, and
change form. Unless precautions are taken, the
waste incineration. Other sources are the chlo-
legacy of exploiting metal-containing natural
rine-alkali industry and non-ferrous metal pro-
resources is thus likely to stay with us for a
duction. Mercury is used in thermometers,
long time.
barometers, dental fillings, batteries, and fluo-
The major heavy metals of concern to
rescent lamps.
AMAP are mercury, cadmium, and lead. All
three can be toxic at levels that are only mod-
Cadmium (Cd)
erately above background levels. They are
believed to be present in some regions of the
Cadmium is toxic to most forms of life. It can
Arctic at levels that may pose risks to the envi-
be taken up directly from water, and to some
ronment and to human health. Moreover, the
extent from air and via food, and it has a ten-
Arctic region is a recipient of heavy metals
dency to accumulate in both plants and ani-
generated in other regions of the northern
mals. Mushrooms in particular can be very
hemisphere because they are carried on parti-
rich in cadmium.
cles that stay suspended in the cold polar air.
Cadmium is moderately toxic to aquatic
This input adds to naturally high levels of cad-
invertebrates, reducing their growth and
mium and mercury in some parts of the AMAP
decreasing the survival of larvae. In fish, cad-
region. The chapter also discusses selenium,
mium poisoning can lead to an ion imbalance
which is not a true metal, but is important
and interfere with calcium metabolism.
because it reduces the toxicity of mercury.
In higher animals, cadmium accumulates in
95
Heavy metals
BRY
KNUT
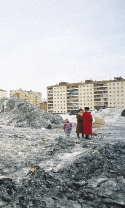
Norilsk, Russia.
the kidneys and liver, where most of it binds to
kidney, spleen, and skeleton. Once it has been
a special protein that makes the metal harm-
integrated into the skeleton, it takes several
less to the animal. If the uptake is greater than
years to leave the body. Lead can also accumu-
this natural defense, cadmium can damage the
late in eggs and embryos.
kidneys and upset metabolism of vitamin D
Damage to the nervous system and gastroin-
and calcium. Kidney damage and a decalcifica-
testinal symptoms are the main signs of lead
tion of the skeleton are the serious chronic
poisoning. Lead also interferes with the forma-
effects of high cadmium exposure. Kidney
tion of red blood cells, leading to anemia. Lead
damage in seabirds has been seen at cadmium
is especially toxic to the growing brain and can
levels in the tissue of 60 to 480 micrograms
affect the behavioral development of young,
per gram. Based on human toxicology, cad-
even at low concentrations. For example, in
mium concentrations of 100 to 200 micro-
polluted cities, fumes from cars burning leaded
grams per gram (wet weight) in the kidneys
gasoline have probably caused air concentra-
probably represent a risk for mammals. With a
tions high enough to affect children's develop-
half-life of decades, cadmium leaves the body
ment. Lead can pass through the placenta and
extremely slowly.
thus affect a growing fetus. Organic lead com-
Cadmium is a byproduct in the production
pounds are fat-soluble and are more toxic than
of zinc and lead, and the pyrometallurgical
other forms.
production of zinc is the most important an-
In fish, lead accumulates primarily in the
thropogenic source to the environment. Other
gill, liver, kidney, and bone. In juvenile fish,
major sources are fossil fuel combustion and
lead causes a blackening of the tail followed by
waste incineration. Cadmium is used in a wide
damage to the spine. It also reduces larvae sur-
spectrum of applications, including alloys, pig-
vival. Birds are only sensitive to lead at very
ments, metal coatings, batteries, and in the
high concentrations but can get lead poisoning
electronics industry. It is also a contaminant in
symptoms and eventually die from ingesting
chemical fertilizer, manure, compost, and
pellets of lead shot.
sewage sludge.
Leaded gasoline is the major source of in-
creased environmental levels on a global scale.
Other anthropogenic sources include mining
Lead (Pb)
and metallurgic industries, ammunition, and
Lead in the environment is strongly absorbed
trash incineration.
by sediments and soil particles, and is there-
fore largely unavailable to plants and animals.
Selenium (Se)
Many of the inorganic salts of lead (lead oxides
and sulfides) are not readily soluble in water
Selenium is not a true metal, but interacts with
and are sequestered in sediments. In aquatic
many metals in the environment. It is an essen-
systems, uptake is influenced by various envi-
tial nutrient in small amounts but toxic in
ronmental factors such as temperature, salin-
higher concentrations, damaging hair and
ity, pH, and the presence of organic matter.
nails. In the environment as well as in the
It is not clear whether animals absorb lead
body, it forms an insoluble salt with mercury,
through the skin or take it up via lungs or con-
which reduces the toxicity of both mercury
taminated food. Lead accumulates in the liver,
and selenium.
Many metals undergo a chemical transforma-
96
Surrounding environment
tion in the body, which sometimes can make
Heavy metals
influences metal uptake
them less toxic but in other cases may increase
The effects of metals in the environment de-
their harmful potential. The most important
pend to a large extent on whether they occur
processes for such biotransformation are the
in forms that can be taken up by plants or ani-
formation of inert complexes and the cleaving
mals. For example, lead may be strongly ad-
or building of bonds with carbon (methyla-
sorbed onto sediment particles and therefore
tion/demethylation).
largely unavailable, while cadmium ions can
The formation of inert metal-protein com-
be directly absorbed from water. Mercury is
plexes plays an important role in detoxifying
strongly bound to sediment and organic mater-
cadmium, zinc, copper, and mercury. Selenium
ial, but microorganisms have an ability to trans-
can reduce the toxicity of arsenic, cadmium,
form inorganic mercury into methyl mercury,
and mercury in a similar manner. High sele-
which is readily taken up by both aquatic and
nium levels in the environment can thus pro-
terrestrial organisms.
tect against the toxicity of these metals.
Environmental variables, such as the pres-
Methylation, i.e. the creation of carbon
ence of ions that may bind the metals, often
bonds, reduces the toxicity of arsenic and sele-
play an important role in uptake. For example,
nium, because it allows an animal to excrete
in saltwater, chloride ions bind some metal
the metal. For mercury, methylation increases
ions, making them less available to living cells.
toxicity, since methyl mercury is more toxic
Cadmium and lead thus appear to be less toxic
than inorganic forms of mercury.
in saltwater than in freshwater. Other factors
If an organism's uptake of a metal is greater
that influence bioavailability are acidity, the
than its ability to get rid of it, the metal will
amount of suspended matter, and the amount
accumulate. Heavy metals tend to accumulate
of organic carbon in the water.
in storage compartments. For example, cad-
Uptake of metals in an animal involves met-
mium accumulates preferentially in the kid-
al ions crossing a cell membrane. Often a lig-
neys, mercury in the liver, and lead in the
and, or carrier, executes this transport. Some-
skeleton. The accumulation can continue
times there are additional specific carriers with-
throughout the organism's life and is the major
in the cell. The biological effects of metals in
cause of chronic toxicity. In contrast to
air, water, or sediment therefore depend as
organic pollutants, metals accumulate in pro-
much on the transport capacity of the cell
tein tissues and bone rather than fat.
membrane as on their concentration in the
Most measurements from animals have
surrounding medium. Several different ions
been made on key storage organs, because of
might compete for the same sites on the carrier
concern for human health and diet intake.
molecule and the levels of one metal may influ-
However, these levels may say very little about
ence the uptake of another.
toxic effects on the animal, since the target tis-
sue may be different than the storage tissue.
For example, very little is known about mer-
Metals can transform and accumulate
cury levels in brain tissue, which is the most
in the body
sensitive target for mercury damage.
Once absorbed, metals are distributed in the
The table below shows some selected values
body by the circulatory system. A fraction of
for how efficiently organisms are able to
this will be taken up in specific organs in
absorb mercury, cadmium, and lead, and how
processes that are not very well understood.
fast they can get rid of these substances.
ŁŁŁŁŁŁŁŁŁŁŁŁŁŁŁŁŁŁŁŁŁŁŁŁŁŁŁŁŁŁŁŁŁŁŁŁŁŁŁŁŁŁŁŁŁŁŁŁŁŁŁŁŁŁŁŁŁŁŁŁŁŁŁŁŁŁŁŁŁŁŁŁŁŁŁŁŁŁŁŁŁŁŁŁŁŁŁŁŁŁŁŁŁŁŁŁŁŁŁŁŁŁŁŁŁ
Uptake efficiency
Half-life
(how much of available metal
(time it takes for the tissue
Metal
Organism
is taken up in the indicated tissue)
concentration to be reduced by half)
ŁŁŁŁŁŁŁŁŁŁŁŁŁŁŁŁŁŁŁŁŁŁŁŁŁŁŁŁŁŁŁŁŁŁŁŁŁŁŁŁŁŁŁŁŁŁŁŁŁŁŁŁŁŁŁŁŁŁŁŁŁŁŁŁŁŁŁŁŁŁŁŁŁŁŁŁŁŁŁŁŁŁŁŁŁŁŁŁŁŁŁŁŁŁŁŁŁŁŁŁŁŁŁŁŁ
Lead
Mammals
5-10% via intestines
40 days in soft tissues
30-50% via the lungs
20 years in bone
----------------------------------------------------------------------------------------------------------------------------------------------
Cadmium
Fish
1% via intestines
24-63 days
0.1% via gills
-
Mammals
1-7% via intestines
10-50% of life span in liver
7-50% via lungs
10-30 years in kidney
----------------------------------------------------------------------------------------------------------------------------------------------
Mercury
Fish
depends on chemical form,
323 days for organic mercury
water temperature,
from diet
and water hardness
45-61 days for inorganic
mercury from water or diet
Mammals
>95% for organic mercury
500-1000 days in seals and
via intestines
dolphins for methyl mercury,
>15% for inorganic mercury
52-93 days for methyl mercury
and 40 days for inorganic mercury
in whole body of humans
ŁŁŁŁŁŁŁŁŁŁŁŁŁŁŁŁŁŁŁŁŁŁŁŁŁŁŁŁŁŁŁŁŁŁŁŁŁŁŁŁŁŁŁŁŁŁŁŁŁŁŁŁŁŁŁŁŁŁŁŁŁŁŁŁŁŁŁŁŁŁŁŁŁŁŁŁŁŁŁŁŁŁŁŁŁŁŁŁŁŁŁŁŁŁŁŁŁŁŁŁŁŁŁŁŁ
% of total emissions
100
Anthropogenic
Natural
50
0
Mercury
Cadmium
Lead
Selenium
Arsenic
Antimony Chromium
Copper
Manganese Molybdenum
Nickel
Vanadium
Zinc
tonnes /year
6100
8900
344 000
16 000
31 000
5900
74 000
63 000
355 000
6300
86 000
114 000
177 000
Sources
Many industrial products containing heavy
Global emissions of
metals eventually end up as trash. Emissions
metals to the atmos-
Both natural and industrial sources contribute
from waste incineration are difficult to esti-
phere in 1983, natural
versus anthropogenic.
metals to the Arctic environment. It is difficult
mate but are an important source of mercury,
The percentages shown
to accurately determine the magnitude of these
cadmium, arsenic, and zinc.
in the bars are based on
sources, but the figure above gives a reason-
The figure below summarizes the relative
range values and there-
able estimate of their relative size and yearly
importance of the sources of world-wide an-
fore do not sum to 100
emissions. Most anthropogenic emissions have
thropogenic emission of mercury, cadmium,
percent.
decreased in recent years, but there is still
and lead.
room for improvement.
Within the Arctic, combustion of fossil fuels
to produce electricity and heat is a major
anthropogenic source of heavy metals, fol-
Natural sources
lowed by industrial processes, particularly in
account for a significant part of emissions
the Russian Arctic.
Atmospheric particles from natural sources
can account for varying proportions of the
% of total emissions
100
atmospheric metal load. In remote areas, the
Coal, oil, wood
proportion due to natural processes may
Gasoline
dominate, while the opposite may be the case
Non-ferrous
metal industry
close to anthropogenic sources. Erosion
Other industries
allows the wind to pick up soil particles and
Waste incineration
such particles might, on a global scale, ac-
50
The relative importance
count for more than half of all chromium
of anthropogenic sources
emissions to the atmosphere, and 20 to 30
of metals world-wide.
percent of emissions of copper, nickel, and
The percentages shown
in the bars are based on
zinc. Eroded soils also end up in rivers that
range values and there-
transport metal-containing particles to lakes
fore do not sum to 100
and to the ocean. Volcanoes spew out mater-
0
percent.
ial from the Earth's mantle and this source
Mercury
Cadmium
Lead
alone can account for a significant portion of
the cadmium and mercury in the air. Metals
Eurasia is the major source region
that have been part of vegetation can be
to Arctic air
released and spread by forest fires.
An accurate inventory of heavy metal
Which emissions of heavy metals are impor-
sources and emissions to the atmosphere from
tant for the Arctic environment? The answer
natural sources is needed to make a complete
depends on the magnitude of emission, the loca-
assessment of the regional and global pollution
tion of the source, and transport pathways.
of heavy metals in the Arctic.
The prevailing air movement over the Arctic is
The metal industry
Chemical form determines environmental fate
is a major source to the atmosphere
The fate of a metal in the environment depends to a large extent on its form. Mercury
is a case in point. When fossil fuels or trash are burned, mercury contained in these
Practically every industry discharges one heavy
materials will evaporate as a gas, some of which will oxidize in the flue gases.
metal or another into the environment. A major
Without emission-control systems, this mercury will reach the atmosphere and be car-
source of air contamination is the non-ferrous
ried by the winds. The residence time of mercury vapor in the atmosphere is between
metals industry, which emits cadmium, lead,
0.4 and 3 years, and, as a consequence, mercury vapor is globally distributed.
Mercury in soluble form has a residence time on the order of weeks and is therefore
nickel, arsenic, copper, selenium, and zinc.
only transported over shorter distances. Modern flue-gas cleaning systems can retain
The use of fossil fuels is also a major con-
the oxidized mercury. Another potential route to the environment is fly ash, as well as
tributor to the increased flux of metals. Coal
bottom ash, which are often disposed of on land. Some of this disposed ash may
burning is the major source of mercury, arsenic,
leach mercury to nearby waterways and lakes.
chromium, and selenium, while combustion of
Other volatile compounds that follow flue gases are elemental cadmium, cadmium
chloride, elemental arsenic, arsenic trioxide, and arsenic chloride. Lead chloride is
oil is the most important source of nickel and
only somewhat volatile. Elemental lead, lead oxide, and cadmium oxide are non-
vanadium.
volatile and will largely be emitted as fly ash, even at high temperatures.
from Eurasia to North America, and models
provement is also likely. If the best-available
98
show that Eurasia contributes more than half
technology is applied, emissions of arsenic
Heavy metals
of the air pollution measured in the Arctic.
could be reduced by a factor of three and cad-
The Russian sources are most important,
mium emissions by a factor of two by the end
partly because they are situated far north,
of the century. For lead, the decrease depends
within the Arctic airmass, and partly because
on how fast leaded gasoline disappears from
the strong Siberian high-pressure system drives
use. The predicted decrease until the year 2000
air northward during the winte; see map below.
ranges from a factor of four to ten.
Emissions from sources in the Urals and the
The amount of mercury transported from
Norilsk area contaminate the air over Alaska
central and eastern Europe to Scandinavia has
and Arctic Canada, whereas emissions from
declined during the past few years. However,
the Kola Peninsula contribute more to north-
this decline may only be temporary. What hap-
ern Fennoscandia. Emissions from Europe
pens in the future depends to a large extent on
contaminate the subarctic in northern Fenno-
how fast industrial production recovers from
scandia, while emissions from North America
the economic slump of the early 1990s. The
reach the subarctic areas of northern Canada.
potential for long-term lower emissions from
western Europe and North America is better,
AMAP boundary
because the technology to clean sulfur and nitro-
gen from industrial emissions also removes mer-
cury and other heavy metals that are emitted
Kola Peninsula
as gases. Efforts to decrease metal emission are
St. Petersburg area
on the agenda in current political negotiations
Pechora Basin
Moscow area
Norilsk area
Yakutsk area
about long-range transboundary pollution.
Urals
Donetsk area
Emissions from Russian smelters have
Kouznetsk area
decreased or remained the same for the past
Caucasus
ten years, mostly because the industry has not
Major point sources in
Baikal area
run on full capacity. Future emissions will
the former Soviet Union
of heavy metals to the air.
depend greatly on the success of efforts to
Fergana area
improve the technology used in the smelters.
Much of the heavy metal contamination in
Metal industry
the Arctic comes from hot spots of emissions.
contaminates rivers, lakes, and the ocean
These are the Pechenganikel industrial com-
plex and the Severonickel smelter complex on
Global budgets of metal discharge to the
the Kola Peninsula and the industries in Norilsk.
aquatic environment show that domestic waste
In the 1980s, Severonickel became the largest
water is a major source of heavy metals into
nickel-copper smelter in the world. Preliminary
rivers, lakes, and oceans. So is sewage sludge.
estimates of emissions to the atmosphere from
Other sources include coal-burning power
Severonickel are approximately 3000 tonnes
plants and the metals industry. Regionally,
of copper and 2700 tonnes of nickel annually,
human inputs into the aquatic environment are
but this information needs verification.
sufficient to elevate levels of heavy metals
above natural background levels. Known
global emissions to water exceed those to the
Most emissions are decreasing
atmosphere.
Most emission and modeling studies have been
The importance of riverine transport of
Time trend in European
performed on data from the early 1980s. Since
heavy metals to the Arctic Ocean varies by the
atmospheric emissions
of cadmium, lead, and
then, the input of most metals seems to be
metal, the distance to the river mouth, and the
zinc.
decreasing; see the figure below. Further im-
season. Though heavy metal concentrations in
Yearly European emission,
Yearly European emission,
Yearly European emission,
tonnes
tonnes
tonnes
3000
160 000
120 000
Cadmium
Lead
Zinc
100 000
120 000
2000
80 000
80 000
60 000
1000
40 000
40 000
20 000
0
0
0
1955 '60
'65
'70
'75
'80
'85
'90
1955 '60
'65
'70
'75
'80
'85
'90
1955 '60
'65
'70
'75
'80
'85
'90
the lower reaches of the largest Russian rivers
99
(Ob, Yenisey, and Lena) are at global back-
ground levels, preliminary mass balance calcu-
lations suggest that for cadmium and lead,
rivers contribute about half of what the atmos-
phere contributes. For zinc, rivers are the most
important source, with inputs up to five times
Red Dog
higher than from the atmosphere.
In the Arctic, mining and metallurgical
industries on the Kola Peninsula and in the
Norilsk region are major contributors of met-
als to the aquatic environment.
Local contamination around mines is a rec-
ognized problem in the Arctic. One docu-
Norilsk
Arctic Bay
mented example is the Black Angel lead and
zinc mine at Maarmorilik, Greenland. The
mine, which operated from 1973 to 1990, dis-
Black Angel
charged its tailings to the bottom of a nearby
fjord. During production, about 10 tonnes of
zinc, 1 tonne of lead, and 50 kilograms of cad-
Copper
mium were released annually in soluble form
Lead
Ivittuut
into the sea.
Zinc
The map to the right shows past and pre-
Nickel
sent mining activities in the AMAP region hav-
Silver
ing a local effect on the environment.
Tin
Gold
Iron
Soils serve as dump sites and as sources
become available to plants, to which they
Other
Soils play an important role for the global flux
might be toxic, and also leach into waterways.
Closed mine
of metals in the environment. Most trash is
For some metals, particularly mercury, soil
stored in dump sites, where metal-containing
is also an important source to the air. In fact,
Past and present metal
mines in the Arctic that
products often contaminate the soil. Ash from
emissions of mercury from soil and water can
still have a significant
coal combustion is another important source
in certain regions be of the same magnitude as
effect on the local envi-
mercury emissions from anthropogenic
ronment.
Acidification and metals
sources. The mercury cycle is so influenced by
Acidification of soil and water has a major affect on
these processes that it is more relevant to talk
many, but not all, metals. Cadmium, lead, and zinc
become more mobile when acidity increases. They may
about preindustrial and postindustrial emis-
then move further down in the soil profile or leach more
sion levels than to distinguish between natural
easily into waterways
and anthropogenic sources.
The mobility of metals into living cells and thus their bio-
logical uptake also depend on the acidity. The form of
metals most easily taken up by plants and animals is the
divalent ion of cadmium, lead, and zinc. Acidification
favors the formation of these ions.
Atmospheric transport,
Mercury behaves differently. It adheres strongly to
levels in the air,
organic material in the soil and does not become more
mobile when the soil is acidified. The opposite can actu-
and deposition
ally be true as the acid environment makes mercury
adhere even more strongly to humus in soil and water.
Air measurements show that long-range trans-
port of metals contributes to the load in the Arc-
to the soil. Wastes from animal husbandry,
tic. However, the highest load in the environ-
agriculture, and logging may not have high
ment is in the vicinity of the Russian smelters.
concentrations of heavy metals, but the vol-
umes of waste are huge, and can affect the
The metals follow the prevailing winds
heavy-metal budget of many soils. Locally,
sewage sludge can also be an important source
Metals in their gas form often condense on fine
of contamination. Global metal budgets for
particles in flue emissions before they are
soil are mostly relevant for mercury due to its
released to the atmosphere. Unless they are
potential to evaporate and be transported far-
trapped by emission control systems, these
ther by air. Other metals disposed on land
particles are carried by the prevailing winds.
cause primarily local problems.
This is especially true in winter when the parti-
Soils have a natural ability to hold on to
cles remain suspended in the air and only a
metals. One concern is that the current input
small proportion are washed out close to the
of contaminants might overload this capacity.
sources. In the Arctic, air measurements show
Moreover, acidification makes some metals
that concentrations of heavy metals are higher
less tightly bound to soil particles, one excep-
in winter than in summer by more than one
tion being mercury. Metals freed in this way
order of magnitude.
100
2
Heavy metals
4
1
5
1
6
3
5
0
4
0
5
Point Barrow
2
Poker Flat
4
4
1
3
3
ng /m3
0
2
3
6
2
Wrangel Island
Arsenic
5
1
2
1
1
Lead
4
Zinc
0
0
Alert
Alert
3
Copper
0 Severnaya Zemlya
2
Manganese
4
Vanadium
3
4
1
3
2
Nickel
<3
2
3
0
2
Air concentration
1
1
2
Tonnes
0
Tonnes
1
1
0
100 000
100 000
North Greenland
North Greenland
0
0
80 000
Ny-┼lesund
80 000
Ny-┼lesund
Winter air concentra-
tions of heavy metals at
60 000
60 000
remote Arctic sites and
40 000
40 000
European emissions of
1980
1990
arsenic, lead, and zinc in
20 000
20 000
European emissions
European emissions
1980 and 1990.
0
0
These metal-carrying particles get trapped
The processes that wash particles out of
in the cold air mass during the winter and can
Arctic air are not well understood, but they are
circulate throughout the Arctic. Therefore,
clearly different over ice sheets than along the
metals that originate in northern Eurasia may
coasts. In trying to understand the impact of
go first to Alaska and then travel back over the
industrial emissions on the High Arctic envi-
pole to the Norwegian Arctic. The map above
ronment, one central question is whether the
shows the winter concentrations at different
deposition process within the Arctic region is
sites. Aside from hot spots of pollution, levels
efficient enough to retain small particles that
around the Arctic are similarly low. Concen-
carry heavy metals, or if they are carried out as
trations of heavy metals in Arctic winter air
Lead, Ąg/m2
are about ten times as high as in the Antarctic,
Cadmium, Ąg/m2
whereas summer levels are similar.
25
50
The air around large point sources is much
Lead
20
40
more contaminated than air in the High Arctic
Ice cores, Greenland
or reference sites in southern Norway; see maps
15
30
on this page. For example, the concentrations
of nickel, copper, and arsenic in parts of north-
10
20
Cadmium
Time trends for estimated
ern Norway and the Kola Peninsula are at least
5
10
deposition of lead and
one order of magnitude higher than the concen-
cadmium as determined
in Greenland ice cores.
trations at Ny-┼lesund. Closest to the smelter
0
0
7760
1970
stacks of Severonickel on the Kola Peninsula,
BP
1773
1850
1992
the contamination is a thousand times higher
fast as they come in. Current models of winter
than the maximum levels at Ny-┼lesund.
air transport suggest that five to ten percent of
the cadmium, lead, arsenic, vanadium, and
15
zinc emitted in the Eurasian region deposits in
10
the High Arctic. In summer, these emissions
5
are less important.
5
Past and present atmospheric deposition
0
of heavy metals in the Arctic can be estimated
5
N O R W A Y
Karpdalen
0
by looking at metals in snow and ice cores.
Viksj°fjell
5
0
A hundred to a thousand times more lead has
Holmfoss
Pechenga
F I N L A N D
been deposited in the period after the indus-
0
5
Svanvik
trial revolution (i.e., since 1773) than was
Birkenes
deposited in the millennium before industrial-
Nikel
Average concen-
0
Zapoljarnyy
tration in air, ng /m3
Kobbfoss
ization. The graph above illustrates lead and
5
cadmium deposition to the Greenland icecap
5
since prehistoric times.
0
0
Nickel
Noatun
Copper
Arsenic
R U S S I A
Deposition is highest close to smelter stacks
Reference station
at Birkenes
Most of the deposition studies for metals have
Average air concentra-
been made in the subarctic region, especially
tions of nickel, copper
around the nickel-copper smelters known to
and arsenic on the Kola
20 km
Peninsula.
emit large amounts of metals. Measurements
Nickel deposition to snow,
mg /m2
1
2
Kirkenes
N o r w a y
5
10
Karpdalen
50
Viksj°fjell
100
Holmfoss
N o r w a y
Svanvik
Kobbfoss
Nikel
Zapolyarnyy
R u s s i a
BRY
20 km
KNUT
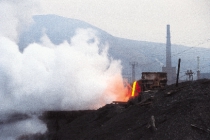
from the Kola Peninsula show that the yearly
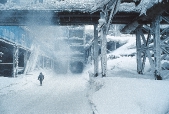
Snow and Ł 40░C at the
deposition of copper and nickel can reach a
Terrestrial ecosystems
Norilsk smelter.
few hundred milligrams per square meter close
to the smelter stacks. However, the levels
The levels of heavy metals in the biota of ter-
Yearly nickel deposition
to snow on the Kola
decrease to a few milligrams per square meter
restrial ecosystems represent weathering of
Peninsula.
within a few tens of kilometers. This lower
local bedrock combined with input from dis-
value is also representative for northern
tant and local pollution sources. The AMAP
Finland. The figure above shows the deposi-
assessment points to two major concerns: the
tion in snow around the Kola smelters.
severe pollution of nickel and copper around
the Russian metallurgical complexes and the
bioaccumulation of cadmium in grazing birds
Concentration of lead
in moss, 1990,
and mammals.
5
mg / kg dry weight
10
Some soil concentrations are high enough
10
to damage vegetation
Metal concentrations in soil vary greatly,
depending on vicinity to pollution sources and
on local geology. Close to the nickel-copper
Latitudinal gradient of
smelters on the Kola Peninsula and in Norilsk,
deposition of lead in
metal concentrations sometimes reach exceed-
Norway, as measured in
10
5
moss, 1990.
5
ingly high levels. For example, some soils close
10
N o r w a y
S w e d e n
F i n l a n d
to the Severonickel copper smelter have copper
concentrations 50 to 80 times higher than the
background level. The overall effect of the
metal pollution in combination with acidifying
emissions has been devastating. The smelters,
constructed approximately 50 years ago, have
30 >40
created industrial deserts, where all or almost
20
all the vegetation is gone. Originally, parts of
Zapolyarnyy, Russia.
30
In some parts of northern Scandinavia,
deposition from smelters results in levels simi-
lar to those caused in southern Scandinavia by
long-range transport from Europe. Lead is an
exception, with higher deposition in the south;
see map immediately above.
Deposition of heavy metals on the Kola
Peninsula has increased, and was at least one
order of magnitude higher in the 1980s than in
the 1960s. Trends over the past 30 years mir-
ror emissions, and deposition has decreased in
the 1990s, reflecting reduced production.
OKSANEN
ERKKI
102
the Kola Peninsula were covered by bogs, but
Birds and caribou/reindeer
the mosses disappeared some decades ago
Heavy metals
accumulate cadmium
from the most heavily polluted areas. Today,
an area of 10 to 15 kilometers around the
The main source of heavy metals for land ani-
smelters is dry sandy and stony ground, with
mals is the food they eat. The figure below
only remnants of peat. The Kola Peninsula is
shows the levels of cadmium and mercury in
one of the eight most seriously polluted `eco-
ptarmigan across the Arctic.
catastrophe' areas of the former Soviet Union.
The willow and rock ptarmigan provide ex-
Away from local pollution sources, metal
amples of how heavy metals can accumulate in
levels in soils depend on the type of bedrock,
specific organs. The birds can get rid of some
movement of water, weathering, and biological
of the metals when they molt, but adult birds
processes. An extreme example of high natural
from Norway and from the Yukon Territory in
levels is Karasjok in Norway, where the copper
Canada still have exceptionally high concen-
content of the soil is so high that the ground is
trations of cadmium in their kidneys, up to
barren in patches. The copper is probably
1020 micrograms per gram dry weight, among
weathered from sulfide minerals, carried with
the highest values ever recorded in birds. This
the groundwater and re-precipitated when the
may be linked to the particular geology of
water emerges from the ground.
these areas. So far, no one has studied the
effects on the birds, but in some individuals,
the concentrations exceed threshold values
Pollution from smelters
that are believed to cause kidney damage.
and oil exploitation shows up in moss
Measurements in Russian birds show that
Studying moss is a useful way to estimate how
lead, cadmium, and mercury are all higher in
much airborne metal ends up on the ground.
predatory birds than in birds that feed only on
Such studies around the nickel-copper smelters
vegetation or have a mixed diet.
on the Kola Peninsula show that the concen-
Reindeer/caribou are also known to accu-
tration of copper can be 200 times higher close
mulate high levels of cadmium, especially in
to the smelters than in northern Finland, 200
the kidneys. Some of these levels exceed thresh-
kilometers west of the emission sources. The
old values believed to cause kidney dysfunction,
nickel content was more than a thousand times
but no such effects have been investigated.
higher close to the smelters. Around Norilsk,
There are clear differences in cadmium concen-
lead and copper from the smelter complex
trations among herds in the Arctic, linked to
show up in a zone up to about 200 kilometers
differences in diet and the natural soil compo-
from the source. Copper concentrations in the
sition of their range areas. The values range
mosses are one to two orders of magnitude
from 0.3 micrograms cadmium per gram kid-
higher than in an area further north of
ney (dry weight) in Norway to 880 micrograms
Norilsk.
cadmium per gram kidney (dry weight) in the
Moss samples taken near the Prudhoe Bay
Finlayson herd in the Yukon Territory. Some
oil fields in Alaska also show high levels of
Russian values are extremely low (0.05 micro-
lead and copper, comparable to the industrial-
gram per gram). The reason for these low val-
ized regions of Siberia and western Russia.
ues is unknown. In Norway, cadmium burdens
Similar levels are found along the Dalton
in the kidneys of reindeer from the Arctic are
Highway, which connects the oilfields to the
strikingly lower than those from farther south.
southern road system.
This is consistent with the decreasing gradient
in acid and cadmium deposition as one moves
from south to north, and also with the concen-
tration of cadmium in the soils.
0.75
0.12
0.13
0.15
147
0.12
524 472
62
104
0.13
103
0.18
0.09
118
0.05
57
47
229
0.30
74
Cd
68
0.08
128
0.04
0.10
Hg
Ąg/g
Ąg/g
600
129
0.60
0.22
500
160
58
0.50
0.07 0.10
400
Circumpolar distribution
0.40
300
56
0.08
of cadmium and mercury
0.30
200
0.20
in ptarmigan kidney.
126
100
0.10
0.10
0
0
In Sweden, livers and kidneys of reindeer
Metal contamination of freshwater in the Murmansk region, Russia, Ąg/liter.
from Saami villages in the easternmost part of
Maximum allowable concentrations are: copper, 1 g/liter; nickel, 10 g/liter.
the mountain chain have been monitored for
ŁŁŁŁŁŁŁŁŁŁŁŁŁŁŁŁŁŁŁŁŁŁŁŁŁŁŁŁŁŁŁŁŁŁŁŁŁŁŁŁŁŁŁŁŁŁŁŁŁŁŁŁŁŁŁŁŁŁŁŁŁŁŁŁŁŁŁŁŁŁŁŁŁŁŁ
Highest recorded level
cadmium, lead, and mercury since the early
Water body
Metal
1991
1992
1993
1994
1980s. So far, no time trends in the levels are
ŁŁŁŁŁŁŁŁŁŁŁŁŁŁŁŁŁŁŁŁŁŁŁŁŁŁŁŁŁŁŁŁŁŁŁŁŁŁŁŁŁŁŁŁŁŁŁŁŁŁŁŁŁŁŁŁŁŁŁŁŁŁŁŁŁŁŁŁŁŁŁŁŁŁŁ
evident.
Kolos-Yoki River, mouth
Cu
47
14
29
27
Other metals in caribou/reindeer are gener-
Ni
102
60
195
53
----------------------------------------------------------------------------------------------------------------
ally not of environmental concern. Mercury
Luotn-Yoki River
Ni
56
38.5
32
17
----------------------------------------------------------------------------------------------------------------
may be an exception in Canadian animals,
Hayki-Lampi-Yoki River
Ni
32
43
24
24
----------------------------------------------------------------------------------------------------------------
probably as a consequence of natural geologi-
Nyuduay River
Cu
2524
300
168
518
cal sources within the Canadian Shield.
Ni
1347
409
465
400
----------------------------------------------------------------------------------------------------------------
In most other land animals, metal concen-
Monche Lake
Cu
225
260
176
113
----------------------------------------------------------------------------------------------------------------
trations are low. The exceptions are moose
Imandra Lake (Monche-Guba)
Cu
105
35
20
11
from the Yukon Territory, which have ex-
Ni
195
6
37
5
tremely high values of cadmium, moose in
ŁŁŁŁŁŁŁŁŁŁŁŁŁŁŁŁŁŁŁŁŁŁŁŁŁŁŁŁŁŁŁŁŁŁŁŁŁŁŁŁŁŁŁŁŁŁŁŁŁŁŁŁŁŁŁŁŁŁŁŁŁŁŁŁŁŁŁŁŁŁŁŁŁŁŁ
Norway, and several small mammals in the
Russian ecologists have noted severe ecolo-
Yukon Territory.
gical damage along portions of major Siberian
rivers and watercourses. However, it is difficult
to say what role metals play. In the most
Freshwater ecosystems
affected areas, sewage, petroleum hydrocar-
bons, acidification, and chemicals are also
Point sources, runoff from surrounding areas,
prominent pollutants.
and deposition from the atmosphere add metals
Wetland ecosystems, which serve as transi-
to lakes and rivers. However, their movement
tional compartments between the terrestrial
and uptake is also governed by acidification. A
and aquatic environment, can accumulate large
major concern for aquatic ecosystems is local
loads of heavy metals and serve as sources to
pollution from metal industries and old mines.
rivers. A survey of more than 250 wetlands in
The AMAP assessment also points to a circum-
the Russian Arctic points to three areas of
polar increase in the load of mercury in freshwa-
local pollution. These are in the Kola Penin-
ter sediments, probably due to global processes.
sula in the vicinity of the non-ferrous smelters,
Lead, cadmium, and mercury generally
the Vorkuta area of the north Komi Republic,
occur at levels below one microgram per liter
and the Norilsk area in central Siberia. These
in all Arctic freshwater, similar to unpolluted
are the same areas that have elevated levels of
areas outside the Arctic. However, in certain
heavy metals in river waters. Metal concentra-
regions of Arctic Canada, Russia, Finland, and
tions in remote parts of the same regions are
Alaska, there are rivers with lead concentra-
close to other unpolluted regions, with the
tions that exceed the most stringent indicators
exception of north-east Asia. Here, a mercury
of water quality for southern latitudes.
ore belt is a natural source that contributes to
elevated environmental levels.
Russian rivers
are severely polluted with metals
Sediments tell about increasing metal loads
There are numerous examples of local metal
Lake sediment profile data (see figure below)
Elevated levels of mer-
cury in the upper layers
contamination of rivers and lakes, often in
indicate that metal levels are highly variable.
of lake sediments reflect
connection with mining and metal processing.
They have been influenced by local conditions
increasing inputs over
One example is Garrow Lake in the Northwest
and by inputs from anthropogenic sources
time.
Territories in Canada, which has been used to
Hg Ąg/g
Hg Ąg/g
dump waste from a leadŁzinc mine. Typical
0.000
0.020
0.040
0.060
0.080
0.100
0.120
0.000
0.020
0.040
0.060
0.080
0.100
0.120
concentrations are 360 micrograms of zinc per
0.5
0.5
1991
1991
liter, in contrast to 0.5-2.5 micrograms per
Fox Lake
Pahtajarvi
2.5
1.5
1988
liter in the Mackenzie River delta.
1972
1980
4.5
2.5
In Arctic Russia and on the Kola Peninsula,
1953
3.5
1976
6.5
the freshwater ecosystem is polluted on a much
1971
8.5
1921
4.5
larger scale. Ten micrograms of copper and
1911
5.5
1964
10.5
1900
nickel per liter of water is not uncommon
1958
6.5
12.5
within a 30-kilometer radius of the major met-
1864
1945
7.5
14.5
al smelters in the Murmansk region. Between
8.5
1934
1833
16.5
1991 and 1994, the copper concentration
9.5
1924
18.5
1809
reached up to 2524 times the permissible limit
11
1912
20.5
and the nickel concentration was occasionally
13
1898
22.5
up to 135 times the permissible limit. The eco-
15
1885
24.5
systems of at least five water bodies are com-
17
1874
26.5
19
1866
pletely destroyed. Similar problems have been
28.5
29
reported from the Norilsk region. The table
Depth
Depth
above shows the extent of the pollution.
cm
cm
over time. The situation can vary consider-
polar. In Canada, levels in recent sediments are
104
ably from lake to lake, but samples from
two to three times higher than preindustrial
Heavy metals
Arctic and subarctic lakes indicate that the
levels. The levels further north are also high.
levels of mercury, cadmium, lead, and zinc are
The excess mercury measured in the Canadian
elevated in the upper parts of the sedimen.
lakes was usually connected to a high content
There is discussion as to whether this phe-
of organic carbon in the sediments, which
nomenon is due to natural physico-chemical
points to the surrounding soils as an important
processes, the so-called diagenic processes, or
source. The increase in mercury concentration
is a result of anthropogenic metal input over
in lake sediments might be caused by an in-
the past century. Decreasing concentrations
crease in fallout of atmospheric mercury in the
from south to north in Norwegian, Swedish,
catchment area.
and Finnish lakes point to long-range trans-
The high level of mercury contamination is
port from sources in Central Europe. The pat-
probably connected to the unique properties of
tern of higher concentrations in the top layer
mercury as a metal. As a gas, it is highly mo-
of the sediment is also more prominent fur-
bile and, similar to many organic contami-
ther south. For example, lead is enriched up
nants, it can be re-emitted into the atmosphere
to 50 times in the top layer in southern Nor-
and thus travel to the Arctic in several hops.
wegian lakes, compared with only a doubling
The cold Arctic climate may favor a final depo-
in northern lakes.
sition here rather than in warmer climates.
In Canada, lead levels have decreased over
the past decade and a half, mirroring the decline
Mercury follows the organic matter
in North American emissions. This decline is
largely a result of eliminating leaded gasoline.
The adverse effects of mercury in fish and fish-
In Scandinavia, copper and zinc have a dif-
eating birds outside the Arctic have provided
ferent geographic pattern than other metals,
an incentive to understand how this metal
with higher levels in the north, which indicates
behaves and why some freshwater ecosystems
that local sources are more important than
seem to be harder hit than others. Many stud-
long-range transport. Sediment studies show
ies support a connection between mercury lev-
clearly that Russian smelters contribute to
els and the concentration of humic matter. For
nickel and copper concentrations in two Nor-
example, mercury concentrations in the soil,
wegian lakes close to the Russian border and
the transport of humic matter from the soil,
downwind from the smelters.
and the humic content of the water seem to be
In Russia, the greatest metal pollution is
the main factors that govern mercury trans-
near the metallurgical complexes of the Kola
port in runoff water in forested areas of Swe-
Peninsula and Norilsk. In an area up to 40
den. High levels of organic matter in the soil
kilometers from the smelters, concentrations
also correlate with high levels of methyl mer-
of nickel, copper, cobalt, cadmium, and mer-
cury in fish.
cury in the surface sediments of the lakes are
The Swedish studies also emphasize that the
10-380 times background values. Because lake
type of landscape can influence the rate of
sediments are excellent storage reservoirs for
leaching. Moraine landscapes with thin soils
metals, these levels will probably remain high
and few wetlands leak more mercury than
for many decades.
landscapes where water passes through bogs
and marshes before it reaches a lake.
Most of the cadmium and zinc in lakes with
Is mercury on the rise?
acid runoff is leached from the surrounding
The most significant trend in the sediment data
soils, while fallout from the atmosphere direct-
is the increasing input of mercury. For exam-
ly on the lake surface plays only a minor role.
ple, two lakes that have been studied in Fin-
As only a small fraction of the metals is leached
nish Lapland show striking increases of mer-
every year, any change in acidity would increase
cury in sediment from recent years. Two other
the input. The fact that lakes in northern Swe-
lakes in the study show a moderate increase.
den have less zinc and cadmium than southern
The high input of mercury seems to be circum-
lakes may partly be a result of widespread aci-
dification in southern Sweden.
Mercury concentrations in Arctic freshwater fish.
ŁŁŁŁŁŁŁŁŁŁŁŁŁŁŁŁŁŁŁŁŁŁŁŁŁŁŁŁŁŁŁŁŁŁŁŁŁŁŁŁŁŁŁŁŁŁŁŁŁŁŁŁŁŁŁŁŁŁŁŁŁŁŁŁŁŁŁŁŁŁŁŁŁŁŁ
Predatory fish
Mercury concentration, g/g wet weight
ŁŁŁŁŁŁŁŁŁŁŁŁŁŁŁŁŁŁŁŁŁŁŁŁŁŁŁŁŁŁŁŁŁŁŁŁŁŁŁŁŁŁŁŁŁŁŁŁŁŁŁŁŁŁŁŁŁŁŁŁŁŁŁŁŁŁŁŁŁŁŁŁŁŁŁ
have the highest mercury levels
Region
Arctic char
Whitefish
Burbot
Most of the studies on metals in fish have
ŁŁŁŁŁŁŁŁŁŁŁŁŁŁŁŁŁŁŁŁŁŁŁŁŁŁŁŁŁŁŁŁŁŁŁŁŁŁŁŁŁŁŁŁŁŁŁŁŁŁŁŁŁŁŁŁŁŁŁŁŁŁŁŁŁŁŁŁŁŁŁŁŁŁŁ
Northern Canada
0.01-0.57
0.01-2.49
0.11-0.30
focused on mercury, and it is clear that high
Greenland
0.17-0.99
Ł
Ł
levels of mercury and organic matter in sur-
Finnish Lapland
0.09-0.32
0.23
0.23
rounding soils can lead to high levels of methyl
Iceland
0.02-0.03
Ł
Ł
mercury in fish. The table left shows mercury
Norway
0.03-0.25
Ł
Ł
levels in Arctic char, whitefish, and burbot.
Russia
0.01
0.01
0.01
The highest levels occur in Greenland and
Sweden
0.10
Ł
Ł
ŁŁŁŁŁŁŁŁŁŁŁŁŁŁŁŁŁŁŁŁŁŁŁŁŁŁŁŁŁŁŁŁŁŁŁŁŁŁŁŁŁŁŁŁŁŁŁŁŁŁŁŁŁŁŁŁŁŁŁŁŁŁŁŁŁŁŁŁŁŁŁŁŁŁŁ
Arctic Canada, which probably reflects the
naturally elevated background of mercury
Mining has added lead and cadmium
105
from the Canadian Shield.
to local fjords
Heavy metals
Because fish get most of their metals from
food, their place in the food web becomes very
Mining has contaminated local Arctic areas
important. Predatory fish such as pike and
with several heavy metals. One documented
perch tend to have larger loads than the graz-
example is in the fjord outside the Black Angel
ers. Moreover, concentrations are usually
zinc mine in Greenland, where the levels of
higher in older fish.
lead in the bottom water are up to 200 micro-
Many other factors than mercury concen-
grams of lead per kilogram of water. These
tration in water and sediment determine the
high lead levels are also reflected in seaweed,
concentrations of mercury in the fish. If sele-
blue mussels, prawns, and in some fish; see the
nium is present, the uptake is lower, because
map below. In capelin, lead levels are up to 5
mercury and selenium bind together in an inert
micrograms per gram in the bone. However,
salt. However, selenium will probably not
no one has been able to document any biologi-
influence the uptake of methyl mercury. An
cal effects in the fish. Cadmium levels in the
acid environment will bind mercury tighter in
water are also high, up to 2.5 micrograms per
soil, and large amounts of humic matter can
kilogram of water, but in contrast to lead, the
make the mercury less available because it
animals in the fjord have cadmium levels close
binds strongly to humus particles. However, in
to background.
spite of this decreased mobility, acidified lakes
The cryolite mine in Ivittuut in southern
often have fish with high mercury concentra-
Greenland has also contaminated the nearby
tions. There are many possible explanations.
water. Lead levels of 18 micrograms per kilo-
One of the most important may be that the
gram of water have been measured. At Strath-
acid environment favors a different plankton
cona Sound in northern Baffin Bay, a lead-zinc
and bottom fauna, which can accumulate the
mine has released lead, making concentrations
metal over longer lifetimes than in non-acidi-
in the fjord water one to two orders of magni-
fied lakes. Other changes in species composi-
tude higher than background concentrations in
tion might also play a role.
the open ocean. Some of the lead has also been
Data from freshwater birds and mammals
taken up by seaweed and crustaceans. Outside
are scarce but provide one of the few docu-
a leadŁzinc mine in east Greenland, shorthorn
mented effects of heavy metals on Arctic
sculpins also have elevated levels of lead,
wildlife. In the 1960s and 1970s, ringed seals
whereas the fish outside the cryolite mine on
in Lake Saimaa in Finland experienced many
southern Greenland have not been affected.
stillbirths and a sharp population decline. One
The mines at Ivittuut and Strathcona Sound
reason may have been insufficient selenium in
have also contaminated their respective fjords
the lake, making the seals more susceptible to
with cadmium, but the levels are much lower
the toxic effects of mercury. The mercury levels
than those outside the Black Angel mine. At
in their hair were 50 micrograms per gram in
these sites, the cadmium is not affecting the
1965. In 1984, mercury levels ranged from 3.2
local sediment, nor are elevated levels found in
to 20.7 micrograms per gram.
nearby plants and animals.
Aquatic birds do not appear to accumulate
Local contamination can be expected
heavy metals as efficiently as terrestrial birds
around several other mine sites in the Arctic,
and none of the measured levels is within the
but there is a lack of information on which to
range of suspected effect thresholds.
base an assessment.
Lead levels tell about anthropogenic input
Marine ecosystems
Metal levels in Arctic Ocean water away from
The Arctic marine environment receives heavy
local sources are generally similar to global
metals from atmospheric deposition, river
background levels. Today's global lead concen-
runoff, and local pollution. The relative
trations in oceans are generally more than ten
Lead levels in mussels in
importance of these sources will differ between
the fjord outside Black
regions. For example, rivers carrying metal-
Angel mine, Greenland.
laden sediments, deposit almost all of their
load in the shelf seas and only a minor portion
Black Angel
reaches the deep ocean. Natural sources of
mine
metals are important and in many cases are
250
81
32.8
89
found to be the main source to the marine
70
environment. The discussion of metals in the
75
51.8
Arctic marine environment is divided into two
67
100
50
parts: local contamination by mines, and the
25
level of contamination in the Arctic Ocean
8
9.8
away from local anthropogenic sources.
1.8
0
3
6 km
Unit : Ąg/g (wet weight)
Danmarkshavn
times higher than in prehistoric times. The lev-
Cd
Ąg/g wet weight
Ittoqqortoormiit
els are consistently higher in surface waters
Kong Oscars Fjord
600
than in deeper layers. One might expect the
Nanortalik
lead levels in the upper Arctic sediments to
Avernersuaq
Upernavik
mirror this increased long-distance transport,
500
Uummannaq
but this does not seem to be the case.
Svalbard
Recent seawater analyses from the Pechora
Bay and the Kara and Laptev Seas show very
400
high lead levels, ranging from 0.16 to 0.5 mi-
crograms per kilogram water. However, these
data require confirmation before any conclu-
300
sions are drawn.
Filter feeders such as mussels take up lead
200
from sediment particles. The concentration
increases slightly with increasing shell length,
indicating a moderate accumulation with the
100
age of the mussel. However, lead levels are low
in crustaceans as well as in fish. The highest
levels, 0.05 micrograms per gram liver, have
0 0
5
10
15
20
25
30
35
40
been recorded in Orkdalsfjorden in Norway.
Age
Lead does not seem to accumulate in fish-
eating birds or in marine mammals. In general,
levels in marine mammals are low.
An overall assessment is that lead levels in
the Arctic marine environment are low, and
Cadmium
there is no indication that they increase at
Ąg/g wet weight
higher trophic levels. The only places where
200
effects on biota are likely to occur are hot
100
spots such as mining areas and possibly in
some Russian estuaries.
Cadmium levels are high in marine biota
Cadmium levels in Arctic seawater fall within
what could be considered natural background
10
levels. Moreover, there is no indication from
sediments that the levels have increased from
preindustrial times, nor have temporal trends
been detected.
An interesting phenomenon relating to cad-
mium is that its concentration increases farther
away from the coast. This is probably con-
1
nected with the change in salinity of the water.
The result is that cadmium levels in both plants
and animals are higher in the open ocean than
in the inner region of large fjords, even when
there are local sources contaminating the wa-
ter. The same pattern is evident in the estuaries
of the large Russian rivers.
0.1
Cadmium accumulates with age in mussels
and crustaceans. In general, the levels in crus-
taceans are higher than global background lev-
els but show large variations.
Cadmium levels in fish muscle are generally
low compared to other species, whereas liver
values can be high, up to 12 micrograms per
0.01
Muscle
Liver
Kidney
Upper figure.
Fish
Fish
Fish
Seals
Seals
Seals
Cadmium in kidney of ringed seals from Greenland and
Whales
Whales
Whales
Seabirds
Seabirds
Seabirds
Svalbard. Levels associated with potential for kidney
Decapods
Polar bear
Polar bear
Polar bear
damage are above 100 to 200 micrograms per gram wet
weight.
Molluscs (soft tissue)
Lower figure.
Summary of ranges of cadmium levels in marine organ-
Copepods and other zooplankton
Decapods (heads, shells or whole)
isms. Solid lines indicate range for Greenlandic data.
gram liver in long-lived species, such as wolff-
Hg mg/kg
ish, Greenland halibut, and redfish. Livers of
0.000
0.020
0.040
0.060
0.080
0.100
0.120
0.140
0.160
Pacific herring and broad whitefish from Tuk-
0.5
toyaktuk Harbor, Canada, have extremely
2
3
cadmium high levels (30.6 and 40.3 micro-
4
grams per gram).
5
In marine mammals and birds, cadmium
6
7
seems to accumulate with age. Despite rela-
8
tively low levels in water, this bioaccumulation
9
leads to cadmium levels in birds and mammals
10
11
Ny-┼lesund
that may be high enough to cause kidney dam-
12
age in certain age groups. See graph at the top
North Pole
13
of opposite page. However, a pilot study in
Eastern
14
Hudson Bay
15
which pathologists examined kidney tissue
16
Central West
from some of the most highly exposed seals
17
Greenland
did not reveal any damage. The seals may have
18
19
developed effective mechanisms for detoxify-
20
ing the cadmium.
21
The diagram at the bottom of opposite page
22.5
24
summarizes cadmium levels in marine animals.
26
Eastern
North Pole
The highest cadmium levels in the marine envi-
27.5
Hudson Bay
ronment are in northeastern Canada and north-
29
Central West
Ny-┼lesund
31
western Greenland, higher than in polluted
32.5
Greenland
seas such as the Baltic. One explanation may
34
Depth
37.5
cm
be that species composition and other charac-
teristics of Arctic ecosystems favor cadmium
uptake because animals grow slowly and live
longer. Food habits may also play a role.
Mercury
Ąg/g wet weight
300
Mercury levels are high
200
and may be increasing
100
Several sets of data indicate that mercury levels
are higher in the upper layers of Arctic marine
sediments than in the layers representing prein-
dustrial inputs; see the diagram at top right.
Mercury is enriched even in the marine sedi-
ments taken at the North Pole. Natural
10
processes may have caused these profiles, as
previously noted for freshwater sediments, but
they could indicate that human activities have
increased the environmental mobility of exist-
ing stores of mercury.
The diagram at the bottom of this page
summarizes mercury levels in marine animals.
1
In bivalves and crustaceans, levels are gener-
ally low, whereas mercury seems to accumu-
late in fish. The highest values in fish are from
northern Canada.
For seals and whales, concentrations often
exceed 0.5 micrograms per gram of muscle,
especially in older individuals. Livers from
0.1
ringed seals in the western Canadian Arctic
have very high levels of mercury; up to 205
micrograms per gram of liver have been mea-
sured; see the map at the top of next page.
Levels in livers of bearded seals from the
Amundsen Gulf are also higher than both
0.01
Muscle
Liver
Kidney
Upper figure.
Fish
Fish
Fish
Seals
Seals
Seals
Mercury concentration at different depths in marine sedi-
Whales
Whales
Whales
Seabirds
Seabirds
Seabirds
ment cores.
Polar bear
Polar bear
Polar bear
Lower figure.
Molluscs (soft tissue)
Summary of ranges for mercury in marine organisms.
Copepods and Amphipods
Crustaceans (whole animals)
Solid lines indicate range for Greenlandic data.
108
Paulatuk
103
50
Heavy metals
40
30
70
20
10
Sachs Harbour
50
0
40
30
Holman
20
50
10
40
0
30
20
10
Resolute Bay
50
Eureka
0
50
40
40
30
30
Inukjuak
20
20
50
10
10
40
0
0
30
20
Nanisivik Mine
Belcher Island
50
10
Admiralty Bay
50
50
40
0
40
40
Avanersuaq
30
50
30
30
20
40
20
20
10
30
10
10
0
20
0
0
Svalbard
10
Danmarkshavn
0
50
40
Upernavik
Wakeman Bay
30
50
50
20
40
40
10
0
30
30
Uummannaq
0
20
50
20
10
40
10
Kong O Fjord
0
30
0
50
20
40
10
30
Mercury levels in liver
0
20
from ringed seals of dif-
10
ferent ages.
0
Ittoqqortormiit
Nanortalik
50
50
40
40
30
30
20
Mercury levels in polar
20
10
bear hair; micrograms
Units :
10
Ąg/g wet weight
0
per gram.
0
18.5
0 yrs
1 yrs
0-1 yrs
2-4 yrs
5-10 yrs
11-15 yrs
>15 yrs
Amundsen Gulf
global background and other Arctic areas, as
10.2
are mercury levels in toothed whales and polar
8.99
Eastern
Beaufort Sea
bears; see the map at the bottom of this page.
Some of the highest levels, 280 microgram per
1.7
gram liver (wet weight) have been recorded in
Wrangel Island
pilot whales from the Faroe Islands.
The effects of these mercury levels on the
7.85
1.6
Western
6.59
Cornwallis
Lena River
animals are difficult to assess, because some of
Hudson Bay
6.93
Island
the mercury may be inactivated by high sele-
Southern
nium levels. Moreover, the scientific focus so
Hudson Bay
Northern
3.12
2.54
3.112.97
Baffin
far has been on tissues relevant for human
2.57
Island
9.51
4
8.38 8.69
consumption and very little information is
3.53
4.92
Southern
1.98
available on the target organs for mercury,
Baffin
1.04
Island
Svalbard
such as the brain. There are no effects studies
Clyde River
from the Arctic. However, even for the most
4.21 4.21
Avanersuaq
exposed animal populations in the western
6.51
Ammassalik
Canadian Arctic and in Greenland, selenium
4.62
should be abundant enough to protect against
1.81
mercury poisoning.
Ittoqqortoormiit
A major concern with mercury is that the
levels in some animals high in the food chain
indicate that the environmental load may have
Metals are taken up by Arctic biota and lev-
109
increased in recent years. For example, mer-
els often reflect local geology or local anthro-
Heavy metals
cury levels in ringed seals from western Cana-
pogenic activities. In the circumpolar assess-
da show that they accumulated mercury about
ment, the most troubling findings concern mer-
three times faster during the late 1980s and
cury and cadmium, as they occur in concentra-
early 1990s than in the early 1970s. Similar
tions that may have health implications for
increases have been seen in ringed seals from
individual animals as well as human con-
northwest Greenland taken in 1984 and 1994
sumers.
and in beluga livers from the western Cana-
Mercury seems to be increasing in both lake
dian Arctic. Interpreting these findings is diffi-
and ocean sediments. An increase over the past
cult because natural variations that may affect
two to three decades is also evident in livers
the trends are unknown. Moreover, other data,
and kidneys from some marine mammals. This
such as those from Atlantic walrus and ringed
may indicate an increased global flux of mer-
seal from central-east Greenland, have not in-
cury, which is deposited in the Arctic because
dicated any temporal trends. Very little infor-
of the cold climate. In some parts of the Arctic,
mation is available on temporal trends in Arc-
notably Greenland and western Canada, any
tic marine fish, but measurements from the
increase in the mercury load is in addition to
Baltic Sea from 1980 to 1993 seem to confirm
high natural levels from the local geology. Sev-
observations that mercury levels are increasing.
eral uncertainties about the observed time
Looking at differences over longer time
trends must be resolved before firm conclu-
spans, hair has been analyzed in seal fur from
sions are drawn. For example, the gradients in
the 15th century and compared with similar
sediments might be caused by natural pro-
analysis of recent fur samples. The mercury
cesses. For biota, lack of information about
concentration has increased approximately
the natural variation of mercury levels compli-
four times. Similar analysis of human mum-
cates the interpretation of results.
mies showed an approximately three-fold
Mercury levels in several species of marine
increase.
mammals seem to be highest in the northwest-
ern part of Canada.
Mercury biomagnifies in freshwater and in
Summary
marine ecosystems. However, in all marine ani-
mal populations, even the most exposed ones,
The most severe effects of metals on Arctic
selenium is abundant enough to detoxify the
ecosystems are from local pollution. The
mercury.
nickel-copper smelters on the Kola Peninsula
From a research point of view, further stud-
and in the Norilsk region of Russia have
ies of the increase in mercury are a high prior-
severely polluted nearby terrestrial and fresh-
ity. It is important to verify time trends and also
water environments. In the areas closest to the
to investigate the sources or processes behind
smelters, the deposition of nickel and copper
the increase, as well as any biological effects.
has, in combination with acidifying emissions,
In some areas, cadmium levels are very high
severely damaged the soil and ground vegeta-
both in terrestrial and marine birds and mam-
tion, resulting in an industrial desert.
mals, possibly due to local geology. For exam-
Moreover, the freshwater ecosystem is com-
ple, in reindeer/caribou, the highest cadmium
pletely destroyed in at least five water bodies.
levels have been recorded in the Yukon Terri-
Most of the smelter emissions are deposited
tory in Canada, which is known to have cad-
very close to their source. However, they are
mium-rich geology. Cadmium levels seem to be
still the major source of circumpolar contami-
highest in marine animals from northeastern
nation. Emissions from the Kola Peninsula are
Canada and Northwest Greenland. For certain
the major source of metals in northern
age groups and populations of marine birds
Fennoscandian air, and emissions from the
and mammals, the levels might be high enough
Urals and Norilsk are the most important for
to cause kidney damage.
air concentrations of metals over Alaska and
Lead generally does not pose a threat to
northern Canada.
Arctic ecosystems because it does not bioaccu-
Mines are sources of local contamination,
mulate. Moreover, lead levels have been
but only a few mines have been assessed.
decreasing for the past two decades.