Arctic Pol ution 2006
AcidificationandArcticHaze
Contents
Preface
iii
ExecutiveSummary
v
Introduction
1
SourcesofAcidifyingPollutantsandArcticHaze
3
ConcentrationsandDepositionofAcidifyingAirPollutants
6
ArcticHaze
11
EffectsonTerrestrialEcosystems
15
EffectsonFreshwaterEcosystems
21
EffectsonHumanHealth
27
AMAP
ArcticMonitoringandAssessmentProgramme
Oslo2006
Arctic Pollution 2006
ISBN82-7971-045-0
ˋArcticMonitoringandAssessmentProgramme,2006
Published by
ArcticMonitoringandAssessmentProgramme(AMAP),P.O.Box8100Dep.,N-0032Oslo,Norway(www.amap.no)
Ordering
AMAPSecretariat,P.O.Box8100Dep,N-0032Oslo,Norway
Thisreportisalsopublishedaselectronicdocuments,availablefromtheAMAPwebsiteatwww.amap.no
AMAP Working Group:
JohnCalder(Chair,USA),YuriTsaturov(Vice-chair,Russia),PerD½vle(Vice-chair,Norway),RusselShearer(Canada),MortenOlsen
(Denmark),OutiMðh—nen(Finland),HelgiJensson(Iceland),GunnarFutsÌter(Norway),CynthiadeWit(Sweden),Jan-IdarSolbakken
(PermanentParticipantsoftheIndigenousPeoplesOrganizations).
AMAP Secretariat:
Lars-OttoReiersen,SimonWilson,YuriSychev,IngerUtne.
ACKNOWLEDGEMENTS
Author:
CarolynSymon(carolyn.symon@btinternet.com).
Scientific and technical editing:
SimonWilson(AMAPSecretariat),MarjutNyman(FinnishEnvironmentInstitute).
Graphical production:
SatuTurtiainen(FinnishEnvironmentInstitute).
Contributing experts:
Aamlid,D.
Gashkina,N.A.
Kðmðri,J.
Mannio,J.
Posch,M.
Svistov,P.Ph.
Aherne,J.
Ginzburg,V.A.
Kashulina,G.
Markkola,A.
Quinn,P.
Tammi,J.
Andrews,B.
Glowacki,P.
Kaste,Ä.
Moiseenko,T.
Ruoho-Airola,T.
T½mmervik,H.
Bergman,T.
Hellstedt,P.
Korhola,A.
Munthe,J.
Ruotsalainen,A.-L.
Vasilenko,V.N.
Bishop,K.
Hesthagen,T.
Kozlov,M.
Niedwied,T.
Salminen,R.
Vuorenmaa,J.
Christensen,J.
Hettelingh,J.-P.
Kuylenstierna,J.C.I.
Nyman,M.
Schartau,A.K.
Weckstr—m,J.
Derome,J.
Hicks,K.
Lappalainen,A.
Odland,J.Ä.
Shaw,G.
Wilander,A.
Dutton,E.
Hole,L.R.
Laudon,H.
Owen,A.
SkjelkvÍle,B.L.
Wilson,S.
Forsius,M.
Huttunen,S.
Makarov,V.
Pershina,N.A.
Stoddard,J.
Yakovlev,V.
Forsstr—m,L.
Jeffries,D.
Manninen,S.
Polischuk,A.I.
Stohl,A.
Zvereva,E.
Indigenous peoples organizations, AMAP observing countries, and international organizations:
AleutInternationalAssociation(AIA),ArcticAthabaskanCouncil(AAC),Gwitch'inCouncilInternational(GCI),InuitCircumpolar
Conference(ICC),RussianAssociationofIndigenousPeoplesoftheNorth(RAIPON),SaamiCouncil.
France,Germany,Netherlands,Poland,UnitedKingdom.
AdvisoryCommitteeonProtectionoftheSea(ACOPS),AssociationofWorldReindeerHerders(AWRH),Circumpolar
ConservationUnion(CCU),EuropeanEnvironmentAgency(EEA),InternationalArcticScienceCommittee(IASC),International
ArcticSocialSciencesAssociation(IASSA),InternationalAtomicEnergyAgency(IAEA),InternationalCouncilfortheExploration
oftheSea(ICES),InternationalFederationofRedCrossandRedCrescentSocieties(IFFCRCS),InternationalUnionforCircumpolar
Health(IUCH),InternationalUnionfortheConservationofNature(IUCN),InternationalUnionofRadioecology(IUR),Nordic
CouncilofMinisters(NCM),NordicCouncilofParliamentarians(NCP),NorthAtlanticMarineMammalCommission(NAMMCO),
NorthernForum(NF),OECDNuclearEnergyAgency(OECD/NEA),OSPARCommission(OSPAR),StandingCommitteeofArctic
Parliamentarians(SCAP),UnitedNationsEconomicCommissionforEurope(UNECE),UnitedNationsEnvironmentProgramme
(UNEP),WorldHealthOrganization(WHO),WorldMeteorologicalOrganization(WMO),WorldWideFundforNature(WWF).
AMAP data centers:
InternationalCouncilfortheExplorationoftheSea(ICES),NorwegianInstituteforAirResearch(NILU),NorwegianRadiation
ProtectionAuthority(NRPA),UniversityofAlaskaÙFairbanks(UAF).
Graphical production of Arctic Pollution 2006
Lay-out and technical production management:
SatuTurtiainen.
Design and production of computer graphics:
SatuTurtiainen,ErikaVarkonyi,PetriPorvari,andMarjutNyman,FinnishEnvironmentInstitute;SimonWilson,AMAPSecretariat.
Cover design:
SimonWilson,basedonphotosbyDanAamlidandSimonWilson.
Printing and binding:
VammalanKirjapainoOy,VammalaFinland.
Photosweresuppliedasdigitalfilesbythephotographers.
Copyrightholdersofphotographicmaterialreproducedinthisvolumearelistedonpage28.


Preface
iii
The Arctic Monitoring and Assessment Programme
AMAP would like to express its appreciation to all of these
(AMAP) is a group working under the Arctic Council.
experts, who have contributed their time, effort, and data;
The Arctic Council Ministers have requested AMAP:
especially those who are involved in the further development
and implementation of the AMAP Trends and Effects Moni-
ñ to produce integrated assessment reports on the status
toring Programme, and related research. A list of the main
and trends of the conditions of the Arctic ecosystems;
contributors is included in the acknowledgements on the
ñ to identify possible causes for the changing
previous page of this report. The list is based on identified
conditions;
individual contributors to the AMAP scientific assessment,
ñ to detect emerging problems, their possible causes,
and is not comprehensive. Specifically, it does not include
and the potential risk to Arctic ecosystems including
the many national institutes, laboratories and organizations,
indigenous peoples and other Arctic residents; and
and their staff, which have been involved in the various
ñ to recommend actions required to reduce risks to Arctic
countries. Apologies, and no lesser thanks, are given to any
ecosystems.
individuals unintentionally omitted from the list.
These assessments are delivered to Ministers at appropri-
Special thanks are due to the lead authors responsible for
ate intervals in the form of `State of the Arctic Environ-
the preparation of the scientific assessments that provide the
ment Reports'. These reports are intended to be readable
basis for this report. Special thanks are also due to the author
and readily comprehensible, and do not contain extensive
of this report, Carolyn Symon, and to the staff of the Finnish
background data or references to the scientific literature.
Environment Institute (SYKE), in particular Marjut
The complete scientific documentation, including sources
Nyman and Satu Turtiainen, for their work in supporting
for all figures reproduced in this report, is contained in
this assessment and producing the reports. The author
a related report, `AMAP Assessment 2006: Acidifying
worked in close cooperation with the scientific experts and
Pollutants, Arctic Haze, and Acidification in the Arctic',
the AMAP Secretariat to accomplish the difficult task of
which is fully referenced. For readers interested in the
distilling the essential messages from a wealth of complex
scientific background to the information presented in this
scientific information, and communicating this in an easily
report, we recommend that you refer to the AMAP
understandable way.
Assessment 2006 report.
The support of the Arctic countries is vital to the success of
This report is the third `State of the Arctic Environment
AMAP. AMAP work is essentially based on ongoing activi-
Report' that has been prepared by AMAP in accordance
ties within the Arctic countries, and the countries also pro-
with its mandate. It presents the results of work
vide the necessary support for most of the experts involved
conducted during the period 1998-2004 in relation to
in the preparation of the assessments. In particular, AMAP
Arctic acidification, which has been identified as a prior-
would like to express its appreciation to Finland for under-
ity issue of concern at the sub-regional level. The assess-
taking the lead role in supporting the Acidification and
ment described in this report builds upon the previous
Arctic Haze assessment. Special thanks are also offered to
AMAP assessment that was presented in two volumes,
the Nordic Council of Ministers for their financial support
the comprehensive `Arctic Pollution Issues: A State of
to the work of AMAP, and to sponsors of other bilateral and
the Arctic Environment Report' and its related scientific
multilateral projects that have delivered data for use in this
background document `AMAP Assessment Report: Arctic
assessment. Finances from the Nordic Council of Ministers
Pollution Issues', published by AMAP in 1997 and 1998,
and some countries also support the participation of indig-
respectively.
enous peoples' organizations in the work of AMAP.
A large number of experts from the Arctic countries
The AMAP Working Group, who are responsible for the
(Canada, Denmark/Greenland/Faroe Islands, Finland,
delivery and content of the AMAP State of the Arctic
Iceland, Norway, Russia, Sweden, and the United States),
Environment Reports, are pleased to present their third
together with experts from indigenous peoples' organiza-
assessment for the consideration by governments of the
tions, from other organizations, and from other countries
Arctic countries. This report is prepared in English, which
have participated in the preparation of this assessment.
constitutes the official version.
Salekhard, October 2006.
John Calder
Lars-Otto Reiersen
AMAP Chair
AMAP Executive Secretary
ExecutiveSummary
v
ThefirstAMAPassessmentÙArctic Pollution Issues: A State
pollutionwithintheArctic.Epidemiologicalstudiesindi-
of the Arctic Environment ReportÙdocumenteddirectevi-
catethatdifferencesinhealthstatusofpopulationsinareas
denceofacidificationeffectsontheKolaPeninsulaandin
oftheArcticwithsomeofthehighestlevelsofacidifying
limitedareasofnorthernNorwayandFinland,andaround
airpollutants,theNorwegianandRussianborderpopula-
NorilskintheTaymirregionofRussia,mainlyrelatedto
tions,aremoreassociatedwithsocio-economicconditions
emissionsfromsmeltersinorclosetothesearcticareas.
thanenvironmentalpollution.
Acidificationeffectswerealsoseeninsomesensitivelow-
depositionareasoftheEuropeanArcticreceivingpollut-
antsfromlong-rangetransport.DataforareasoftheNorth
Trends
AmericanArcticandeasternSiberiathat,duetotheirgeol-
ogy,arepotentiallyvulnerabletoacidificationweregen-
Someairandprecipitationmonitoringstationshavenow
erally lacking. So although the assessment did not find
generatedtimeseriesdatasetsthatarelongenoughtoshow
evidenceofacidificationeffectsintheseareas,itconcluded
whetherconcentrationsareincreasing,decreasing,orstay-
thatimprovedinformationonpossibleacidificationeffects
ingthesameovertime.Sulfateconcentrationsmeasuredin
intheseregionsoftheArcticwasdesirable.
airatmonitoringstationsintheHighArctic(Alert,Canada;
Thepresentassessmentbuildsoninformationinthe
andNy-Alesund,Svalbard)andatseveralmonitoringsta-
firstassessmentandfillsseveralgapsinknowledge.Inpar-
tionsinsubarcticareasofFennoscandiaandnorthwestern
ticularitexaminesinformationontrendsovertheten-year
Russiashowdecreasingtrendssincethe1990s.Incontrast,
period since the first assessment was completed. It also
levelsofnitrateaerosolareincreasingduringthehazesea-
addressestheneedformoreinformationonlocalsources
sonatAlert(Canada),andpossiblyalsoatBarrow(Alaska)
ofacidifyingpollutantswithintheArcticthatwereprevi-
but longer data series are needed to confirm this trend.
ouslyunknownorinsufficientlyquantified;theneedfor
Theincreasingtrendsinnitrateareparticularlyapparent
more information on contaminant levels and trends in
inrecentyearsindicatingadecouplingbetweenthetrends
someareas;theneedtointegratephysicalandbiological
insulfurandnitrogen.Theseobservationsaresupported
modelswithinformationonenvironmentalmeasurements
bymodelingresults.
ofsourcesandpathways;andtheneedformoreinforma-
Although further improvement in the acidification
tiononthecombinedeffectsofclimatechangeandcon-
statusoftheterrestrialandfreshwaterecosystemsofthe
taminantpathwaysonacidificationintheArcticandarctic
Arcticcanbeexpectedduringtheperioduntil2020,thisis
haze,includingimprovementsofmodelsforassessments.
dependentontheimplementationofexistinginternational
Thisassessmentalsoconsiderslinkstohemisphericpol-
agreementstoreduceemissionsofacidifyingsubstances.
lutionissues.
TheGothenburgProtocoltotheUNECELRTAPConven-
tionisthemostimportantagreementinthisconnection.
However,modelprojectionsbasedonfullimplementation
Arctic Acidification
of the Gothenburg Protocol indicate that the decreasing
trendsindepositionobservedbetween1990and2000are
Arcticacidificationisasubregionalissue,andisonlyof
likelytoleveloff.Measurementdataindicatethatdown-
major concern in areas with both sensitive geology and
wardtrendsinconcentrationsmayalreadybelevelingoff
levelsofaciddepositionelevatedtoapointthatexceeds
atsomesites.
the system's acid neutralizing capacity.Arctic haze is a
visiblemanifestationoflong-rangetransportedairpollu-
It is therefore recommended that:
tion.Arctichazeislargelycomposedofsulfateaerosoland
ñ All arctic countries are encouraged to ratify the UN
particulateorganicmatter,whichbuildsupinthearctic
ECE LRTAP protocol to Abate Acidification, Eutroph-
atmosphereduringwintertimeandappearsinspringtime
ication, and Ground-level Ozone (the `Gothenburg
overlargeregionsoftheArctic,bothinNorthAmericaand
Protocol') and to support its implementation.*
Eurasiaashazelayerswithreducedvisibility.
ñ Arctic countries look into the need to strengthen the
Sulfuristhemostimportantacidifyingsubstanceinthe
provisions of the existing international agreements,
Arctic,withnitrogenofsecondaryimportance.Significant
and consider the need for new instruments to reduce
anthropogenicsourcesofsulfuremissions,andtoalesser
emissions of acidifying substances.
extentnitrogenemissions,existwithinthearcticregion.In
addition,long-rangetransportedairpollutantscontribute
Significantreductionsinemissionsfromthenon-ferrous
to acidification and arctic haze in theArctic. Emissions
metalsmeltersontheKolaPeninsula,andtoalesserex-
fromnaturalsourceswithintheArctic(volcanoes,marine
tenttheNorilsksmelters,intheRussianArctichavebeen
algae,andforestfires)areverydifficulttoquantifyand
achieved over the past ten years. Chemical monitoring
almostimpossibletoproject.
datashowthatlakesintheEuro-ArcticBarentsregionare
Studiestodatehavebeenunabletoshowanysignifi-
showingclearsignsofaregional-scalerecoveryfromacidi-
canthealtheffectsthataredirectlyassociatedwithemis-
fication.LakesclosetothesourcesontheKolaPeninsula
sionsfromthesmeltersthatarethemainsourcesofsulfur
areshowingtheclearestsignsofrecovery.
* The Protocol entered into force on 17 May 2005. As of July 2006, Denmark, Finland, Norway, Sweden and the United States have both signed
and ratified, accepted, or approved the Protocol, Canada has signed but not yet ratified the Protocol, and Iceland and the Russian Federation
have neither signed nor ratified the Protocol.
vi
However, non-ferrous metal production remains the
noscandiahasseveralbackgroundairmonitoringstations
dominantsourceofemissionsofacidifyinggasestothe
foracidificationparameters,mostareasoftheArctichave
atmosphere within theArctic. Other significant anthro-
few,ifany,backgroundairmonitoringstations.
pogenicsourcesofsulfuremissionswithinorclosetothe
Remotestationsthatarenotaffectedbylocalorregion-
Arctic include energy production plants and mining in-
alairpollutantsareusefulforstudyingtrendsinthelevels
dustries.SourcesofnitrogenemissionswithintheArctic
ofpollutantstransportedintotheArcticfromlong-range
includetransportation,inparticularshipping,andoiland
sources.UnderAMAP,anetworkofarcticairmonitoring
gasactivities.Detailedinformationonallofthesesources
stationshasbeenestablishedtoassesstrendsinarange
isgenerallylacking.
ofpollutants,includingacidifyingsubstances,persistent
organicpollutants,andmetalssuchasmercury;however
It is therefore recommended that:
inrecentyearstheoverallcoverageofthisnetworkhas
ñ Information on emissions from arctic point sources in
beenreducedsuchthatcoverageislimited,particularlyin
Russia, in particular information on emissions from
RussiaandtheUnitedStates.
the non-ferrous metal smelters on the Kola Peninsula
and at Norilsk should continue to be made available.
It is therefore recommended that:
Information on emissions in other arctic areas should
ñ A critical review of the existing arctic air monitoring
be improved.
network be conducted to identify the optimal number
ñ The impacts of acidification from arctic shipping and
and location of long-term background monitoring
oil and gas activities, including future scenarios for
stations for air and precipitation chemistry.
emissions associated with these sources should be
ñ To the extent possible, this network should be inte-
assessed.
grated with other monitoring and research planning,
with the aim of developing a network of `multi-pur-
pose` background air monitoring stations in the Arc-
Links between Acidification, Arctic
tic.
Haze, and other Environmental Issues
The causes and the effects of acidifying air pollutants
Episodic events
andarctichazearecloselylinkedtootherenvironmental
problems.Itisnotclearhowclimatechangewillinfluence
Short-termeventsofhighatmosphericconcentrationsof
futureacidificationandarctichazepollutionintheArctic.
sulfurdioxideareresponsiblefordirectdamagetoveg-
Theeffectsofhazeaerosolsonthearcticclimatearecom-
etationatvaryingdistancesfromthesmelters.Atmany
plicatedbyfeedbacksbetweenaerosols,clouds,radiation,
sitesalargeproportionoftheannualaciddepositionis
snowandicecover,andverticalandhorizontaltransport
accumulatedinjustafewdays.
processes.Whetherthepollutantaerosolscauseanoverall
Similarly,pollutantsdepositedontothesnowpackac-
warmingoranoverallcoolingisnotyetknown.
cumulate throughout the polar winter and are released
The amount of haze precursors (haze-inducing sub-
rapidly into rivers and lakes with snowmelt in spring.
stances)reachingAlaskaandtheCanadianArcticappears
Thesepulsesofveryacidicwatercancauseshortperiods
tohaveincreasedsincethelate1990s.Thefrequency,se-
ofverytoxicconditions.Freshwaterbiotacanbecritically
verity,anddurationofborealforestfiresappeartobein-
affectedduringacidicepisodesandthereforeassessments
creasingandthepollutionplumesfromthesesummerfires
needtoaddressbothaverageconditionsandconditions
can extend over vast areas. In intense fire years, boreal
thatmayoccurduringepisodicevents.
forestfiresmaybethedominantsourceofblackcarbon
(soot)fortheArctic.TheimportanceofAsiansourcesto
It is therefore recommended that:
acidificationandarctichazepollutionintheArcticisnot
ñ Further studies, with high temporal resolution, be
yetclear.
conducted on the ecological impact of pulses or epi-
sodic events.
It is therefore recommended that:
ñ Future AMAP assessments view acidification and
Effects on terrestrial and
arctic haze in the wider context of air pollution and
freshwater ecosystems
climate change. The issues addressed in this more
integrated type of assessment should include hemi-
IntheEuropeanArctictherearecleardirecteffectsofsulfur
spheric transport of air pollutants, emissions from
dioxideemissionsontrees,dwarfshrubs,andepiphytic
forest fires, particulate matter, and climate change
lichens.Thepresentdepositionofacidifyingcompounds
effects.
resultingfromlong-rangetransportofanthropogenicemis-
sionsatlowerlatitudesdoesnotappeartobeathreatto
terrestrialecosystemsinmostoftheArctic. Intermsoftheir
Gaps in Knowledge Ù Monitoring,
effectsonplants,itisdifficulttodifferentiatebetweenthe
Research, and Modeling
effectsofacidifyingairpollutantsandelevatedheavymet-
Atmospheric monitoring
allevelsinsoils.Habitatdestructionandpossiblechanges
infoodavailabilityarestronglyreducingbiodiversityin
Acidificationisnotknowntohaveseriousimpactsinthe
theimmediatevicinityofthesmelters.
Arctic outside the Kola/Fennoscandia region and the
TaymirregioninthevicinityofNorilsk.However,knowl-
It is therefore recommended that:
edgeofacidificationstatusintheArcticisfarfromcom-
ñ Future studies be conducted on terrestrial ecosystems
plete,particularlyinrelationtofutureeffects.WhileFen-
to address the combined effects of acidifying sub-
vii
stances and heavy metals and other relevant factors
ñ Studies be conducted to identify and provide esti-
in an integrated manner.
mates of sources of black carbon to the Arctic.
ñ Data sets gathered during aircraft and ground-based
Availableterrestrialandfreshwatermonitoringdatapro-
surveys, in particular, long-term data sets, be inte-
videirregularandincompletecoverageoftheArctic,even
grated for use in three-dimensional arctic climate
in acid-sensitive regions. Similarly, assessments of bio-
models designed to evaluate climate forcing by arctic
logicaleffectsofacidificationinarcticsurfacewatersare
haze.
largelybasedonsparseandisolateddata.
Cooperation on monitoring
It is therefore recommended that:
ñ Coordinated monitoring and research be carried out
ClosecooperationbetweenAMAPandotherinternational
to provide more chemical and biological data on ef-
organizations involved with monitoring and modeling
fects and trends in terrestrial and freshwater ecosys-
depositionandeffectsofacidifyingpollutantswithinthe
tems in the most impacted areas of the Arctic.
EuropeanArctic, such as programs under the UN ECE
LRTAPConvention,haveprovenmutuallybeneficial.The
new EANET (Acid Deposition Monitoring Network in
Modeling
EastAsia)initiativerepresentsanopportunitytodevelop
similar cooperation in relation to monitoring in the Far
Modelingisoneofthemostimportanttoolsavailablefor
EastofAsia.
gaining insight into the possible pollution status of the
extensiveareasoftheArcticwheretheobservationalnet-
It is therefore recommended that:
worksareabsentorpoorlydeveloped.Modelsalsoallow
ñ AMAP continues to develop its cooperation with
investigationofscenariosforfuturetrends,andforlink-
relevant international organizations, in particular to
ages between contaminant pathways and, for example,
obtain more precise data on emissions from southeast
climatechange.
Asia and to investigate the possible impact of these
It is therefore recommended that:
emissions on the Arctic.
ñ Existing air transport and deposition models be im-
ñ Resources be made available to ensure that relevant
proved and further validated using measurements of
existing and future national data on acidification pa-
sulfur compounds, nitrogen compounds, and black
rameters, in particular from arctic monitoring sta-
carbon in the Arctic, including measurements con-
tions, are reported to the AMAP database at NILU
ducted during field campaigns.
according to agreed procedures.
viii
1
Introduction
Introduction
Acidificationeffectswerefirstseenasearly
as1850insomenorthernEuropeancities.
However,widespreadawarenessofacidifica-
tionasanenvironmentalproblemdidnot
beginuntilthelate1960swhenfishkillsin
Scandinavia,Canada,andtheUnitedStates
wereallshowntoresultfromacidrainand
snow.Laterstudiesshowedthattheacidity
wasalmostalwaysfromsourcesalongway
fromwheretherainandsnowfell.Thisun-
derstandingledtothestartofinternational
discussionsonwaystocontrolsubstances
N
E
N
A
thatundergolong-rangetransport.The1979
T
R
A
GenevaConventiononLong-rangeTrans-
I
P
N
boundaryAirPollutionwasthefirstinter-
U
A
R
nationallegallybindinginstrumenttodeal
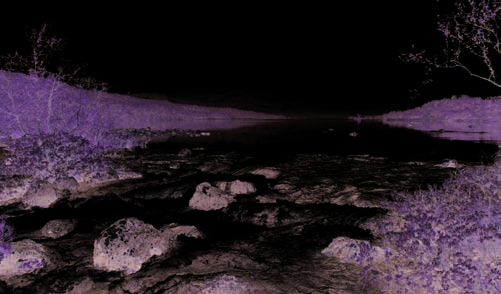
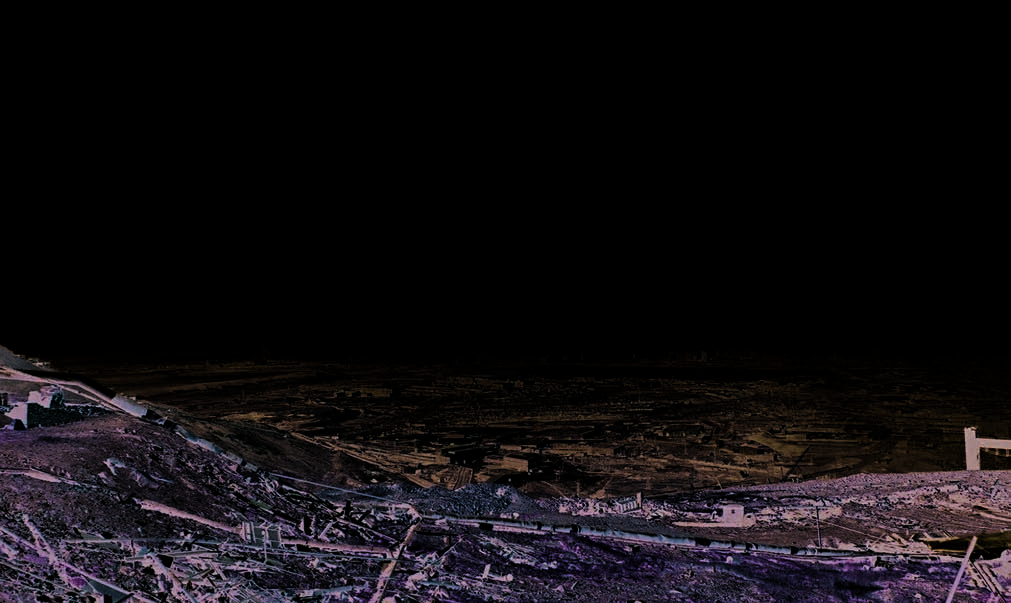
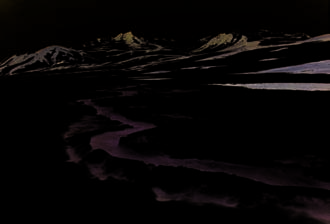
Mountainbirchforestnear
withproblemsofairpollutiononabroad
Kilpisjðrvi,Finland.Lakesand
pondsareabundantinthesub-
regionalbasis(seetheboxtotheright).
arcticFennoscandianlandscape.
Thishassincebeenextendedbyseveral
protocols.Thelatestisthe1999Gothenburg
Convention on Long-range Transboundary Air Pollution
ProtocoltoAbateAcidification,Eutrophica-
tionandGround-levelOzone.TheGothen-
The1972UnitedNationsConferenceontheHumanEnvironmentin
burgProtocolisaneffects-basedprotocol
Stockholmwasthestartofinternationalcooperationtocombatacidi-
fication.Between1972and1977severalstudiesshowedthatairpol-
thatsetsnewtargetsforemissionscutsof
lutantscouldtravelthousandsofkilometersbeforedepositionand
sulfurdioxideandnitrogenoxidesbasedon
damage.Thisimpliedthatcooperationattheinternationallevelwas
scientificassessmentsofpollutioneffectsand
necessarytosolveproblemslikeacidification.Ameetingwithinthe
abatementoptions(seetheboxoncritical
frameworkoftheUNECEinNovember1979resultedinthesigning
loadsandcriticallevelsonpage2).
oftheConventiononLong-rangeTransboundaryAirPollution(the
TheArcticMonitoringandAssessment
`LRTAPConvention')by34governmentsandtheEuropeanCommu-
Programme(AMAP)wasestablishedin1991
nity.Thisenteredintoforcein1983.TheLRTAPConventionprovides
tomonitoridentifiedpollutionrisksand
aframeworkforcontrollingandreducingenvironmentaldamageand
theirimpactsonarcticecosystems.Thefirst
damagetohumanhealthfromtransboundaryairpollution.Thiswas
AMAPassessmentÙArctic Pollution Issues: A
thefirstinternationallegallybindinginstrumenttodealwithproblems
ofairpollutiononabroadregionalbasis.
State of the Arctic Environment ReportÙcon-
TheLRTAPConventionhassincebeenextendedbyeightprotocols.
cludedthattherewasdirectevidenceofacid-
TheseincludetheProtocoltoAbateAcidification,Eutrophicationand
ificationeffectsontheKolaPeninsulaandin
Ground-levelOzoneadoptedinGothenburg(Sweden)on30November
alimitedareaofnorthernNorwayandFin-
1999andsignedby31countries.Theprotocolenteredintoforceon17
land.Thereportshowedthatthewidespread
May2005.AsofJuly2006,Denmark,Finland,Norway,Swedenand
damagetoforests,fish,andinvertebrates
theUnitedStateshavebothsignedandratified,acceptedorapproved
ontheKolaPeninsulawasclearlylinkedto
theprotocol,Canadahassignedbutnotyetratifiedtheprotocol,and
emissionsfromthenon-ferrousmetalsmelt-
IcelandandtheRussianFederationhaveneithersignednorratifiedthe
ersatNikel,Zapolyarnyy,andMonchegorsk.
protocol.
Thevisibledamagetotheforestsandtundra
TheGothenburgProtocolaimsatcontrollingseveralpollutants
aroundanddownwindofthenon-ferrous
andtheireffectsthroughasingleagreementand,amongothers,sets
metalsmelterswasmainlyattributedtothe
newtargetsforemissionscutsby2010forsulfurdioxideandnitrogen
oxides.Countrieswhoseemissionshavethemostseverehealthorenvi-
directtoxiceffectsofsulfurdioxideandto
ronmentalimpactandwhoseemissionsarethecheapesttoreducewill
theaccumulationoftoxicheavymetalsin
havetomakethebiggestcuts.
soils.Similarextensivedamagetovegeta-
2
tionwasdocumentedaroundthesmelter
severalgapsinknowledge.Inparticularit
Introduction
complexatNorilskintheTaymirregionof
examinesinformationontrendsoverthe
Russia.Owingtothesensitivityofarctic
ten-yearperiodsincethefirstassessment
ecosystemssomeacidificationeffectswere
wascompleted.Italsoaddressestheneed
alsoseeninsomelow-depositionareasofthe
formoreinformationonlocalsourcesof
EuropeanArcticreceivingpollutantsfrom
acidifyingpollutantswithintheArcticthat
long-rangetransport.DatafortheNorth
werepreviouslyunknownorinsufficiently
AmericanArcticandeasternSiberiawere
quantified;theneedformoreinformation
extremelysparse.Soalthoughtheassessment oncontaminantlevelsandtrendsinsome
didnotfindevidenceofacidificationeffects
areas;theneedtointegratephysicaland
intheseareas,itconcludedthatasthegeol-
biologicalmodelswithinformationonen-
ogymadepartsoftheseregionspotentially
vironmentalmeasurementsofsourcesand
vulnerabletoacidification,improvedinfor-
pathways;andtheneedformoreinforma-
mationonpossibleacidificationeffectsinthe
tiononthecombinedeffectsofclimate
NorthAmericanArcticandFarEastofRussia changeandcontaminantpathwayson
wasdesirable.Theassessmentalsoaddressed acidificationintheArcticandarctichaze,
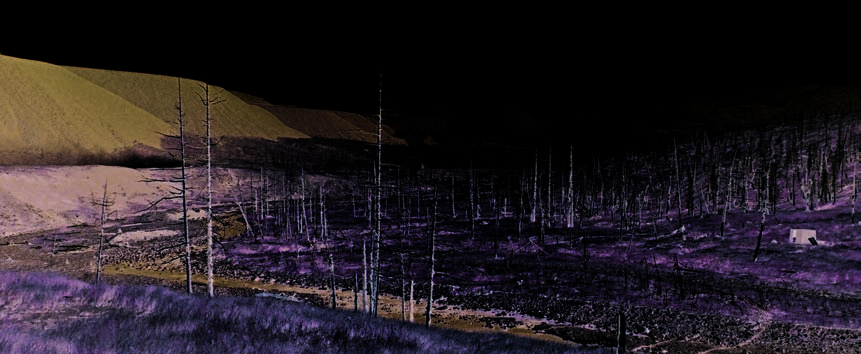
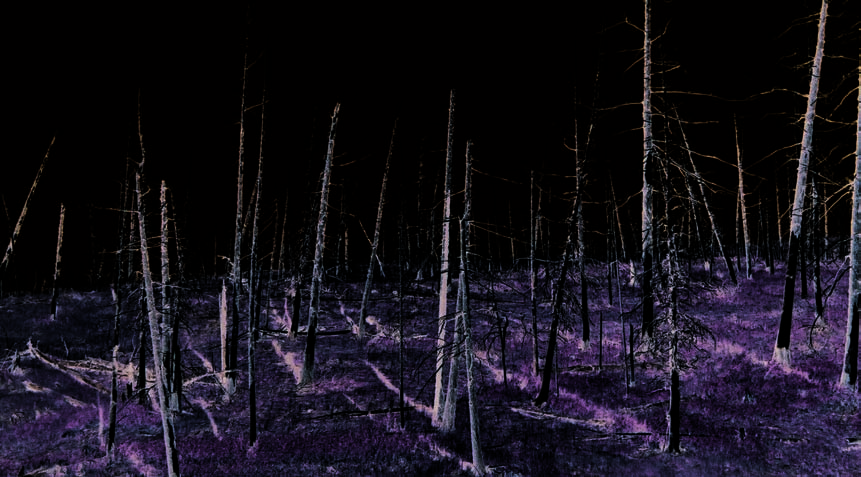
Vegetationdamagein
trendsandimpactsofarctichaze.
includingimprovementsofmodelsforas-
avalley25kmsouthof
Norilsk,westernSiberia.
Thepresentassessmentbuildsonin-
sessments.Theassessmentalsoconsiders
Windsfunnelpollution
formationinthefirstassessmentandfills
linkstohemisphericpollutionissues.
plumesdownthevalley.
Acidification
Gothenburg Protocol, critical loads and critical levels
Achangeintheenvironment'snatural
TheGothenburgProtocoltotheLRTAPConventionisaneffects-based
chemicalbalancethatresultsinan
protocolthatusesecosystemvulnerabilitiestosetemissionsreduction
increaseintheconcentrationofacidic
targets.Thevulnerabilityofecosystemstosulfurandnitrogendeposition
elements,causingtheenvironmentto
isquantifiedby`criticalloads'and`criticallevels'.
becomemoreacidic,isreferredtoas
Criticalloadsaredefinedasaquantitativeestimateofanexposure
`acidification'.Themaincompounds
tooneormorepollutantsbelowwhichsignificantharmfuleffectson
contributingtoacidificationaresulfur
specifiedsensitiveelementsoftheenvironmentdonotoccur,according
oxides,sulfates,nitrogenoxides,
topresentknowledge.
nitrates,andammoniumcompounds.
Criticallevelsaredefinedasconcentrationsofpollutantsinthe
Sulfuristhedominantacidifying
atmosphereabovewhichdirectadverseeffectsonreceptors,suchas
substanceintheArctic,withnitrogen
humanbeings,plants,ecosystemsormaterials,mayoccur,accordingto
ofsecondaryimportance.
presentknowledge.
CriticalloadsforEuropearecalculatedatnationalfocalcentersfol-
lowingagreedmethods.Thedataarecollected,verified,andcollatedby
theCoordinationCentreforEffects(CCE),whichproducesmapsofEu-
Arctic haze
ropeandmakesthedataavailableforintegratedassessments.Although
Arctichazeisapersistentwinter
theUnitedStatesandCanadaarebothsignatoriestotheGothenburg
diffuselayerinthearcticatmosphere
Protocol,criticalloadsdatafortheUnitedStatesarenotyetavailable.An
whoseoriginisthoughttoberelated
initialattemptatmappingcriticalloadshasbeenmadeforCanada.
tolong-rangetransportofcontinental
Areaswherecriticalloadsmaybeexceededareidentifiedbycombin-
pollutants.
ingthecriticalloadmapswithmodeleddepositiondata.
I
R
á
M
á
K
A
H
U
J
Sources
SourcesofAcidifyingPollutantsandArcticHaze
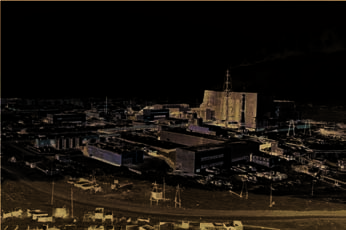
Thesmeltercomplexat
R
Norilsk,westernSiberia
E
D
N
Ùthelargestsourceof
A
X
sulfurdioxideemissions
E
L
withintheArcticregion.
A
Y
R
R
E
H
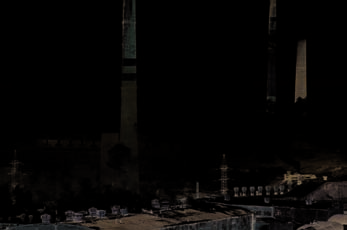
Coal-firedpowerplantat
C
&
Anadyr,Chukotka.Power
N
A
Y
plantsareamajorsource
R
B
ofsulfurdioxideemissions.
TheArcticisasparselypopulatedareawith
Emissions from the non-
Sources
manyofitsalmostfourmillionresidents
ferrous metal smelters have
Sulfurdioxide,nitrogen
concentratedintoafewlargetownsand
oxides,andammonia
cities.Themajoremissionsofacidifying
declined significantly
emissionshavedifferent
pollutantswithintheArcticcomefrom
Emissionsfromthenon-ferrousmetal
sources.Sulfurdioxide
sourceswithinthesefewareasofindustrial
smeltersontheKolaPeninsulainnorthwest
ismainlyemittedfrom
activityand/orpopulation.Exceptforoil
RussiaandthesmeltercomplexatNorilsk
pointsourcessuchas
andgasactivitiesthesesourcesarealmost
innorthernSiberiahavedeclinedsignifi-
powerplants,non-ferrous
entirelywithinthenorthernterritoriesof
cantlysincetheearly1990s(seefigure)but
metalsmelters,pulpand
theRussianFederation.However,despite
arestillthelargestsourceofsulfurdioxide
papermills,andoiland
theselocalemissionsmostoftheacidifying
withintheArctic.Changesinproduction
gasactivities.Fornitrogen
oxides,diffusesources
compoundsinarcticaircomefromsources
andbettertechnologyforcontrollingemis-
suchasvehiclesandship-
atlowerlatitudes,mostlyinEurope,North
sions,particularlyatNorilsk,shouldensure
pingarealsoimportant.
America,andAsia.Theyarecarriedtothe
thattheseemissionscontinuetodecrease.
Ammoniaismostlyfrom
Arcticviathemajorwindsystems.
agriculturalsources.
Sulfur dioxide emission, kt
3000
Althoughtheyremainthe
dominantsourceofsulfur
dioxide(SO2)emissions
2500
withintheArctic,SO2emis-
sionsfromthesmeltersin
ArcticRussiadecreasedby
about21%between1992
2000
Monchegorsk (M)
and2003.Thegreatest
Zapolyarnyy (Z)
reductionsinSO2emis-
sionshaveoccurredonthe
Nikel (Ni)
1500
KolaPeninsula.AtNikel,
Norilsk (No)
emissionsdecreasedby
around68%between1990
(whenemissionspeaked)
1000
and2003,withevenbigger
reductionsatMonchegorsk
whereemissionsdecreased
No
byaround82%overthis
500
Ni Z
period.Emissionsreduc-
M
tionsatNorilskhavebeen
muchless,decreasingby
about16%between1990
0 1992 1993 1994 1995 1996 1997 1998 1999 2000 2001 2002 2003
and2003.
4
Header:
two to three words
J U H A K á M á R I
Prevailingwindsspread
The impact of the oil and gas
undiscoveredpetroleumresources:mostof
thepollutionplumefrom
theNorilsksmelters.
industry on acidification is
theseinAlaska,northernCanada,Norway,
low but may increase
andRussia,includingsubstantialamounts
inoffshoreareas.Acontinuingreduction
Oilandgasrelatedactivitiestakeplace
inseaiceislikelytoresultinanincreasein
throughouttheArcticonlandandatsea
oilandgasactivityoffshore,particularly
andacidifyingpollutantsareemittedat
intermsofincreasedmarinetransportof
GasflaringatYamalin
everystageÙfromexplorationtothefinal
oil(asthenavigationseasonlengthensand
westernSiberia.Ofthe
closureofthefield.Overall,theimpactof
newsearoutesopen).
countrieswithprobable
oilandgasfieldsonthe
theoilandgasindustryonacidificationis
continentalshelf,the
lowbutemissionsmayhavesomeimpact
The relative importance of nitrogen
GothenburgProtocolhas
beenratifiedbyNorway,ac-
onthevegetation,soil,andsurfacewaters
oxides is increasing in the Arctic
ceptedbytheUnitedStates,
neartheemissionsites.TheArctichashuge
andsignedbyCanada.Rus-
oilandgasreservesandisthoughtto
Althoughnitrogenoxideemissionswithin
siahasneithersignednor
ratifiedtheprotocol.
containaroundaquarteroftheworld's
theArcticareverylow,andtheircontribu-
tiontoacidificationeffectsisminimal,their
importancerelativetosulfurdioxideemis-
sionsisincreasing.Thisismainlydueto
thereductionsinsulfurdioxideemissions
fromtheRussiansmelters.Theincreasein
shippingandtheexpansionoftheoffshore
oilandgasindustrythatarethoughtlikely
tofollowwarmertemperaturesintheArctic
willprobablyenhancenitrogenoxideemis-
sionswithintheArctic.
Emissions from natural sources
R
are very difficult to quantify
E
D
N
A
Themajornaturalsourcesofacidifying
X
E
L
pollutantswithintheArcticarevolcanoes
A
Y
R
R
(whichemitsulfurdioxide)andmarine
E
H
algae(whichemitdimethylsulfide).The
C
&
N
majornaturalsourceofarctichazeisfor-
A
Y
R
B
estfires(whichemitsoot).Therearefew


naturalsourcesofnitrogenwithintheArctic
andemissionsareextremelylow.Emissions
Header:
two to three words
fromnaturalsourcesareverydifficultto
quantifyandalmostimpossibletoproject.
However,thefrequency,severity,anddura-
E
I
C
tionofborealforestfiresdoappeartobe
V
R
E
increasingandthepollutionplumesfrom
S
T
S
E
thesesummerfirescanextendovervast
R
O
areas
F
.
N
I
A
D
A
N
A
Most pollutants in arctic air are
/
C
S
from sources outside the Arctic
K
C
O
T
.
S
Despitethemanysourcesofacidifyingpol-
J
N
I
A
lutantswithintheArcticthemajorityofthe
R
B
pollutantsinarcticaircomefromsources
atlowerlatitudes.Thesearecarriedtothe
Arcticbywindspassingoverthethreemain
sourceregionsÙEurope,NorthAmerica,
andAsia.Windscarrythesepollutantsto
E
I
C
theArcticoverperiodsrangingfromdays
V
R
E
toweeks(seethesectiononarctichaze
S
T
S
formoredetailsonlong-rangetransport).
E
R
O
Therearesomeindications(basedon
F
N
I
A
models)thatsouth-eastAsiaisbecomingan
D
A
N
increasinglyimportantsourceofsoottothe
A
/
C
arcticatmosphere.Otherstudiesindicate
S
K
C
thatmostofthesootbeingdepositedin
O
T
.
S
theArcticismorelikelytohavecomefrom
J
N
borealandtemperateforestfires.
I
A
R
B
Astheclimatecontinues
towarm,theforestfire
seasonwillbeginearlier
andendlater.Forestfires
arelikelytobecomean
increasinglyimportant
sourceofsoottotheArctic.
1
5
10
50
100 500 1000
kt/grid cell/yr
Sulfur oxides, emissions in 2000
Nitrogen oxides, emissions in 2000
(total 52 320 kt S)
(total 21 919 kt N)
Estimatedemissionsofoxidesofsulfur(95%ofwhichissulfurdioxide)andnitrogenfor2000.Theheavily
1
5
10
50
100 500 1000
populatedandindustrialisedareasofEurope,thenortheasternUnitedStatesandSoutheastAsiaarethe
kt/grid cell/yr
mainsourceareasforlong-rangeatmospherictransporttotheArctic.WithintheArctic,sulfurdioxideemis-
SO -S emissions in 2000 (total 52320 kt) sionsfromNorilsk,andtheKola NO -N emissions in 2000 (total 21919 kt)
Peninsulaareevident.
x
x

6
Palatka
Stations
Concentrations
Air monitoring
and Deposition
Precipitation monitoring
Air and precipitation monitoring
Ust-Moma
Barrow
Arctic haze monitoring
Deputatskiy
Russian precipitation network
Zhigansk
Snare Rapids
Kyusyur
Tiksi
ConcentrationsandDepositionofAcidifyingAirPollutants
Polyamiy
Norilsk
Turukhansk
Dikson
Alert
Urengoy
Thefateofthesulfurandnitrogenemitted
Widespread contamination of the
Nord
Zeppelin
totheairdependsonwhathappensinthe
Arctic began with the Industrial Era
Ny-élesund Hornsund
atmosphere.Light,moisture,andreactive
Naryan-Mar
Nikel Murmansk
chemicalcompoundsintheairacttogether
Icecoresareusefulforindicatinghistorical
Svanvik
Krasnoshelie
Arkhangelsk
Karasjok
totransformthesulfurdioxideandnitro-
trendsinthebackgroundlevelsofcontami-
Padum
Pinega
Jergul
Mud'yug
Abisko
Zarechensk
genoxidesemittedfromthevarioussources
nantsoverwideareas.Assnowanddust
JaniskoskiOulanka
Reykjavik
intoacidicrainandsnowandintoacidic
settleontothearcticicesheetstheycarry
Irafoss
Tustervann
Bredkðl
particlesthatcansettleontosurfacesthat
withthemarecordofthecurrentlevels
theyencounter.Manyofthetransportand
ofatmosphericpollution:snowscavenges
chemicalprocessesinthesulfurandnitro-
pollutantsfromtheatmosphereasitfalls
gencyclesarestronglylatitudedependent
andthechemicalcompositionofthedust
andintheArcticarelinkedtotheprolonged
reflectsitssource.Pollutantspresentinarc-
periodofdarknessduringwinterandthe
ticicecoresshowthatsignificantchangesin
lackofprecipitation.
atmosphericpollutionhaveoccurredonly
sincethebeginningoftheIndustrialEra.
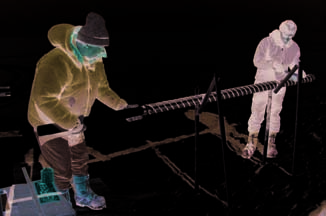
IcecoresÙverticalcolumns
IcecoresfromSvalbardshowtheinfluence
oficeobtainedbydrilling
ofhumanactivitiesduringthelatterhalfof
throughanicecapÙhave
beenusedtoreconstruct
the20thcentury.Thisisdemonstratedby
atmosphericconditions
increasedlevelsofsulfate,nitrate,acidity,
overthelast100000years.
Thecoresareslicedinto
flyash,andorganiccontaminants.Levelsof
sectionsandtheicefrom
sulfateandnitrateinicecoresfromtheCa-
eachsectionismeltedand
nadianArcticconfirmthesetrends.Thereis
analyzed.Eachsection
reflectsatmosphericcondi-
noinformationonsulfateandnitratelevels
tionsduringaparticular
inicecoresfromtheRussianArctic.
periodinhistory.
Atmospheric monitoring data
are mostly for 1980 onwards
N
Atmosphericpollutantsinrain,snow,
E
G
A
dust,andgasesaremonitoredregularly
H
N
E
P
atpurpose-builtstationsthroughoutthe
O
C
Arctic.Mostdataareforthe1980sonwards
F
O
Y
althoughafewstationshaveoperatedfor
I
T
S
R
longer.SomeareasoftheArctichavemore
E
I
V
N
stationsthanothers:Fennoscandiahassev-
,
U
E
eralbackgroundmonitoringstations,while
T
U
I
T
thevastSiberianregionandtheCanadian
T
S
I
N
ArcticandAlaskahaverelativelyfew.
R
H
O
B
S
L
Sulfate levels in air and
I
E
,
N
S
precipitation are decreasing
I
C
S
Y
in many areas of the Arctic
H
P
O
E
G
Someofthedatasetsfromthebackground
F
O
monitoringstationsnowcontaintimeseries
T
N
E
M
thatarelongenoughtoshowwhether
T
R
A
concentrationsareincreasing,decreasing,
P
E
D
orstayingthesameovertime.Thesedata-

Palatka
Stations
Air monitoring
Precipitation monitoring
Air and precipitation monitoring
Ust-Moma
Barrow
Arctic haze monitoring
Deputatskiy
Russian precipitation network
Zhigansk
Snare Rapids
Kyusyur
Tiksi
Polyamiy
Norilsk
Turukhansk
Dikson
Alert
Urengoy
Nord
Zeppelin
Ny-élesund Hornsund
Naryan-Mar
Nikel Murmansk
Svanvik
Krasnoshelie
Arkhangelsk
Karasjok
Padum
Pinega
Jergul
Mud'yug
Abisko
Zarechensk
JaniskoskiOulanka
Reykjavik Irafoss
Tustervann
Bredkðl
U
I
L
N
setsmostlyshowthatbackgroundlevelsof
westtoeastdecreaseinatmosphericsulfur
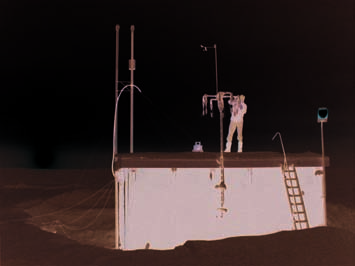
Airandprecipitationmon-
sulfate(fromhumanactivities)andsulfur
itoringstationsaroundthe
andnitrogenlevelspickedupintheairand
Arctichaveprovideddata
dioxideinairaredecreasing,bothinsum-
precipitationdata.
usedinthisassessment.
merandinwinter.Sulfateconcentrations
Backgroundairmonitoring
Therearetoofewdatatoshowwhether
inprecipitationarealsodecreasingatmany
stationssuchastheoneon
therearesimilartrendsinthebackground
Zeppelinmountain,Ny-
sites.Therearenoclearpatternsfornitrate
élesund,Svalbard(photo),
levelsofacidifyingpollutantsinair,rain,or
orammonium(withpositivetrendsat
areparticularlyimportant
snowacrosstheNorthAmericanArctic.
formonitoringlong-range
somesitesandnegativetrendsatothers).
transportofpollutants.
Somestations(e.g.,SvanvikandNikel)are
toonearlocalpollutionsourcestomonitor
pH
backgroundlevels.
pHisameasureofacidity.Itisrepresent-
edbyavalueonascalerangingfrom0
Precipitation
(acid)through7(neutral)to14(alkaline).
Precipitationincludesanyoftheformsof
RainwithpHvaluesof2.1to4.0istypical
waterparticles,whetherliquidorsolid,
inpollutedareasnearthesmelters.
thatfallfromtheatmosphereandreach
theground.Forexample,rain,snow,hail,
andsleet.
Sulfate in air, çg/m3
Alert (A)
Background levels decrease
1.0
from west to east across
0.5
the Russian Arctic
0
A
Backgroundlevelsinrainandsnowshowa
Zeppelin (Z) (Ny-élesund)
1.0
consistentdecreasefromwesttoeastacross
Z
Sv
theRussianArctic.Concentrationsofsulfur
0.5
O
fromhumanactivitiesarehigherinprecipi-
tationfallinginthewesternpartoftheRus-
0
sianArcticthaninthecentralandeastern
Svanvik (Sv)
summer
1.0
parts.Thereisasimilarpatternforback-
winter
groundlevelsofnitrateandammonium.
0.5
PrecipitationfallinginthewesternRussian
0
Arcticismoreacidic(regionalaveragepH
5.6)thaninthecentralRussianArctic(re-
Oulanka (O)
Backgroundlevelsofsulfate
1.0
gionalaveragepH6.7)andtheeasternRus-
inairaredecreasing,both
insummerandinwinter
sianArctic(regionalaveragepH7.0).Snow
0.5
atmostsitesaroundthe
coversamplesfrommorethanahundred
Arctic.Levelsinwinterare
0
particularlyinfluencedby
sitesacrosstheRussianArcticconfirmthe
1980
1985
1990
1995
2000
2005
humanactivities.
8
Peaks in concentration
Climate variability affects pollutant
Concentrations
and deposition are
transport to and within the Arctic
and Deposition
particularly important
Atcertaintimesoftheyearwindsbring-
Monitoringsitescollectsuchlargeamounts
ingpollutantsintotheArcticcanarriveina
ofdatathattheresultsareusuallypre-
matterofweeksorevendaysafterpassing
sentedasaveragesÙaveragedaily,monthly,
oversourceregionstothesouth.Muchof
seasonal,orannualvalues.Butthissmooth-
thenaturalclimatevariabilityinthenorth-
ingremovesanypeaksinthedataandit
ernhemisphereÙwhichaffectsthestrength
isthesepeaksÙshort-termeventsofhigh
andpersistenceofthesewindsÙislinked
concentrationandhighdepositionÙthat
tothe`NorthAtlanticOscillation'.When
areespeciallyimportantfortransporting
thisisina`positive'phase,asoccurred
contaminantstoandwithintheArctic.In
duringthe1990s,transportintotheArctic
the1990s,between20and30%ofthesulfate
fromEurope,NorthAmerica,andAsia(in
depositedinaremoteareaofFinlandar-
orderofsignificance)isenhanced,resulting
rivedonjustfivedaysoftheyear.Peaksin
inhigherlevelsofarcticpollution.Given
airconcentrationalsocausesevereenviron-
thewidespreadimpactofitssuddenand
mentaldamageinareasmoreusedtolower
long-termchangesthestatusoftheNorth
levelsofpollution(seethesectiononacidi-
AtlanticOscillationmustbeconsideredin
ficationeffectsinterrestrialecosystems).
anystudiesontrendsinarcticpollution.
Climatemodelspredictthatthefrequency
ofpositivephasesinthestatusoftheNorth
Althoughthe
Oulanka
AtlanticOscillationislikelytoincrease.
prevailingwinds
Sulfur dioxide exposure, çg/m3/hr
atOulanka,aback-
0.4
groundmonitoring
Summer
Remote stations are useful
1990-1993
Nikel
stationinFinland,
1994-1997
Monchegorsk
for monitoring trends in
arefromthewest
1998-2001
Oulanka
andsouthwest,
0.3
long-range transport
sulfurdioxide
concentrationsare
Remotestationsthatarenotaffectedby
highestinwinds
0.2
fromthenorth-east.
localorregionalairpollutionareusefulfor
Thenon-ferrous
studyingtrendsintheamountsofpollut-
metalsmelterson
antstransportedintotheArcticfromlong-
theKolaPeninsula
0.1
occurtothenorth
rangesources.Forexample,monitoring
ofOulankaandare
datafromStationNordinnorthernGreen-
almostcertainly
0
responsibleforthe
landhavebeenusedtogetherwithlong-
1.00
pulsesofsulfur
Winter
rangetransportmodelstostudytrendsin
dioxidethatarrive
withthenortherly
thelong-rangetransportofemissionsfrom
windsinsummer.
0.75
EasternEuropeandRussia.
0.50
Arctic air monitoring networks
Monitoringstationsrecordingbackground
levelsofairpollutantsthroughoutthe
0.25
Arcticbelongtoseveralnetworks.The
AMAPnetworkisbasedlargelyonongoing
nationalprogrammesandinternationalpro-
0
N
NE
E
SE
S
SW
W
NW
grammes,suchasEMEP(EuropeanMoni-
Direction of air masses
toringandEvaluationProgramme).The
EMEPnetworkcoverstheEuropeanregion
fromIcelandtotheUralsintheeastand
providessignatoriestotheLRTAPConven-
tionwithdatatosupportthedevelopment
andfurtherevaluationofinternational
protocolsonemissionsreduction.Anumber
ofstationswithintheAMAPnetworkare
alsoEMEPstations.TheAcidDeposition
MonitoringNetworkinEastAsiaÙEANET
Ùwasestablishedin1998andhas12par-
ticipatingcountriesbutsofarlacksstations
StationNordin
N
E
intheArcticarea.TheRussiannational
Greenlandmonitored
S
N
E
precipitationmonitoringnetworkhas110
trendsinemissions
T
fromEasternEurope
I
S
R
stationsmeasuringprecipitationchemistry
H
andRussiauntilthe
C
andaciditybutrelativelyfewareinthevast
R
stationwasclosed
E
P
Siberianregion.
in2002.
S
E
J
NAO index, AO index
1
Aleutian Low
NAO index
Winter AO index
0
Icelandic Low
-1
1980
1985
1990
1995
2000
AO+
Winter
North Atlantic Oscillation
TheNorthAtlanticOscillation(andrelatedArcticOscillation)indices
reflectthedifferenceinsurfacepressurebetweenthesubtropicalhighs
attheAzoresandthesubpolarlowsatIceland.AshiftbetweenNAO-
(bluebarsabove)andNAO+(redbarsabove)conditionschangesthe
balanceandtimingofwindsfromsourceregionstotheArctic.
UnderNAO+conditions,theAzoreshighandIcelandiclowpres-
suresystemsarestronger/deeperthannormal.Theresultismoreand
Siberian High
strongerwinterstorms(blackarrowonuppermap),bringingwarm
wetwinterstonorthernEurope(blueshading)andcolddrywinters
(orangeshading)toGreenland.Conversly,weakerpressuresystems
underNAO-conditionsmeanfewerandweakerstormscrossingthe
Atlanticonamoresoutherlytrack(greyarrowonlowermap),bringing
coldwinterstonorthernEuropeandmilderwintersoverGreenland.
Theresultingdifferencesinwindsandprecipitationwillaffectcontami-
nantpathways,andprocessesthatremove,inparticular,particulate-
AO-
associatedcontaminantsfromtheatmospheretothesurface.
Models accurately represent
DEHM model system
the long-range transport
TheDanishEulerianHemisphericModel(DEHM)systemcomprises
of sulfur to the Arctic
athree-dimensionalatmospherictransportmodel(withahorizontalreso-
lutionof150kmby150kmand20verticallayers)andaweatherforecast
Thetransportofairpollutiontothe
modeldrivenbymeteorologicaldatafromtheEuropeanCentrefor
Arcticsince1991hasbeenstudiedus-
Medium-RangeWeatherForecasts.
inglong-rangetransportmodels.The
AirconcentrationsacrosstheArcticcalculatedbytheDEHMsystem
boxdescribestheDEHMmodelsystem
for2000comparewellwithdatafromtheatmosphericmonitoring
Ùawidelyusedapproachforstudying
stations,andthesulfurhotspotsaroundNorilskandontheKolaPenin-
long-rangetransporttotheArctic.Us-
sulaareveryclear.Themonthlyvariationatmostofthemonitoringsta-
ingactualemissionsdataforthesource
tionsisalsorepresentedwell.TheDEHMsystemisnotasgoodfornitrate,
regionsthemodelpredictedthatconcen-
however,andoverestimatesconcentrationsatmostmonitoringstations.
trationsofsulfuroxides
Tocheckitsusefulnessforprojectingpollutantconcentrationsand
andtotalsulfur
depositionacrosstheArcticwouldhave
depositionacrosstheArcticthemodelhasbeenrunusingemissionsdata
fromtheEmissionDatabaseforGlobalAtmosphericResearch(EDGAR)
almosthalvedbetween1990and2000.
modifiedtorepresenttwofutureemissionsscenariosforthenorthern
Thiscorrespondswellwiththegeneral
hemisphere:theCLEandMFRscenarios.TheCLE(CurrentLEgislation)
decreaseinbackgroundsulfurlevels
scenariorepresentsthecurrentperspectivesoftheindividualcountrieson
recordedatmanyoftheatmospheric
futureeconomicdevelopmentandtakesintoaccounttheeffectsofpres-
monitoringstationsacrosstheArctic.
entlyagreedemissioncontrollegislationintheindividualcountries,while
Themodelgavesimilarresultsfornitro-
theMFR(MaximumtechnicallyFeasibleReduction)scenarioassumesthe
genoxides(althoughitislessaccurate
fullimplementationofpresentlyavailableemissioncontroltechnologies,
atmodelingthesebecausethemodel
whilemaintainingtheprojectedlevelsofanthropogenicactivities.
isnotyetasgoodatrepresentingthe
Acomparisonoftheactualsulfurdioxideandnitrogenoxide
atmosphericchemistryofnitrogenand
emissionsin2000withtheCLEandMFRscenariosfor2000showsthat
nitrogenoxides).
theCLEscenarioresultsinlittlechangeinemissionswhiletheMFRsce-
narioresultsinlargeemissionsreductions.
Projected emissions of sulfur oxides in 2020
Projected emissions of sulfur oxides in 2020
(CLE; total 51 268 kt S)
(MFR; total 20 199 kt S)
1
5
10
50
100 500 1000
kt S/grid cell/yr
Projectedemissionsof
sulfuroxidesin2020for
Further recovery in affected arctic
theCLEandMFR
Sulfur oxides in air, çg S/m3
Total deposition, kt S
areas may require more stringent
emissionsscenarios.
0.8
4000
international legislation
0.7
3500
0.6
3000
Long-rangetransportmodelscanalsobe
0.5
2500
usedtoprojecttheeffectsoffuturechanges
0.4
2000
inemissionsfromthesourceregions.The
0.3
1500
effectsofarangeofemissionsscenarios
0.2
1000
onconcentrationsanddepositioninthe
0.1
500
ArctichavebeenprojectedbytheDEHM
modelsystem.Theresultssuggestthat
0
0
implementingtheGothenburgProtocolwill
Nitrogen oxides in air, çg N/m3
Total deposition, kt N
resultinfurtherreductionsinconcentration
0.18
900
anddepositionintheArcticoverthenext
0.16
800
decade,butthat,eveniffullyimplemented,
0.14
700
thesemeasureswillhavelittleeffectinthe
0.12
600
Arcticafter2020.EmissionsfromEurope
0.10
500
andAsianRussiamakethegreatestcon-
0.08
400
tributiontoacidificationintheArcticand
0.06
300
itisfuturechangesintheseemissionsthat
0.04
200
arelikelytohavethegreatestimpacton
0.02
100
concentrationsanddepositionofacidifying
Undermodeledemission
0
0
pollutantsintheArctic.Thisimpliesthat,
reductionscenarios,pol-
1990
2000
2010
2020
beyond2020,furtherrecoveryinaffected
lutionlevelscontinueto
arcticareaswillrequireinternationallegis-
reducebutthereisalevel-
concentration CLE
deposition CLE
lingoffafter2010.
concentration MFR
deposition MFR
lationtobecomemorestringent.

11
Arctic Haze
ArcticHaze
Inthemid-1950s,pilotsflyingovertheCa-
nadianHighArcticbegantoreportperiods
ofreducedvisibilityduetoabrown-tinged
haze.Thisbecameknownas`arctichaze'
andwasseenonmanyoccasionsatdiffer-
entaltitudesandindifferentareas.Together
withresearchstudies,weatherreports
showedthatthehazeinthehighArcticwas
seasonal,peakinginearlyspring,andwas
mostsevereduringperiodsofclear,calm
weather.
Asitssourcewasnotobvious,thehaze
wasinitiallyattributedtonaturalfactors
L
suchasicecrystalsandwindblowndust
L
A
V
fromriverbeds.Thisviewwasoverturned
G
N
E
inthe1970swhen`chemicalfingerprinting'
E
I
N
T
showedthatthesourcewasclearlyrelated
I
S
R
H
tohumanactivities.Sincethen,studieshave
-
C
N
N
shownthatthehazeismostlyduetoemis-
A
sionsfromindustrialactivitiesinEurope
andtheformerSovietUnion.
Arctic haze peaks in spring
Severalmeteorologicalconditionscombine
tocausethespringpeakinarctichaze.First,
thelong-rangetransportofhaze-inducing
substancesintotheArcticisgreatestin
winterandspring,whenthemajorsouth-
to-northwindsaremostfrequent.Second,
thestrongtemperatureinversionsduring
L
L
A
V
Long-range transport of haze-inducing
G
N
substances
E
E
I
N
T
Airpollutioncanbetransportedintothe
I
S
R
Arcticalongthreepathways:low-level
H
-
C
N
transportfollowedbyascentintheArctic,
N
A
low-leveltransportalone,andupliftout-
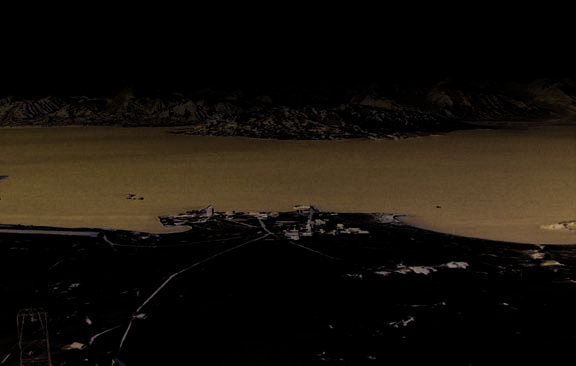
ViewfromtheZeppelin
sidetheArctic,followedbydescentinthe
stationatNy-élesundon
Arctic.Onlythislastpathwayisfrequent
Svalbardinspring2006.
forpollutionoriginatingfromNorth
Particlesoriginatingfrom
agriculturalfiresinEastern
AmericaandAsia,whereasEuropean
Europecombinedwithan
pollutioncanfollowallthreepathways
extremeweathersituation
inwinter,andpathwaysoneandthreein
thattransportedthepollution
summer.
totheArcticwereresponsible
forthispollutionevent.
12
Arctic Haze
Aerosols
Wind frequencies
Aerosolsaretinysolidparticlesorliquid
Winter: 25%
Summer: 5%
dropletssuspendedintheairthatenterthe
atmospherefromeithernaturalorman-
madesources.Theyaretypicallybetween
0.01and10çminsize.
Arctic Front, winter
Front, summer
rctic
A
Haze aerosols have
Wind frequencies
complex structures
Winter: 15%
Summer: 5%
Arctichazeisacomplexmixtureofmicro-
scopicallysmallparticlesandacidifying
pollutantsthatmostlyoccursinthelower
5kmoftheatmosphere,particularlythe
lower2km.Itoftenappearsintheformof
Wind frequencies
`bands'or`layers'.Thesebandsareformed
Winter: 40%
whenindustrialemissionsarecarried
Summer: 10%
northwardbywindstobecometrappedat
aparticularlevelofthearcticairmass;the
lowerbandsdevelopearlierintheyearand
containpollutantsfromnortherlysources
whilethehigherbandsdeveloplaterinthe
Mainatmospheric
thelongdarkwinterresultinacold,sta-
yearandcontainpollutantsfromwarmer
pathwaysfromthe
blebodyofnear-surfaceairthattrapsthe
sourceregionsfurthersouth
industrialisedregions
.Thebands
ofeasternUSA,Europe
incomingmaterialforperiodsofuptoa
rangeinthicknessfromtensofmeterstoa
andSoutheastAsiatothe
month.Theboundarytothiscoldstableair
kilometerandextendoverdistancesof20to
Arctic,andthepositionof
theArcticFrontinsummer
masscenteredovertheArcticÙtheArctic
200km.Visibilitywithinthebandscanbe
andwinter.
FrontÙcanextendfarenoughsouthinwin-
aslittleasafewkilometersduetotheway
tertocoverlargepartsofEurasia.Thisena-
thehazeparticlesscatterandabsorblight.
blesemissionsfromthesmeltersatNorilsk
andontheKolaPeninsulatoenterthearctic
Key pollutants peak in spring
airmassdirectly.Also,wash-outofparticles
byprecipitationoccurslessofteninwinter
Oneofthereasonsthatarctichazehasbeen
andspring.Bylatespring,thetemperature
thefocusofsomuchstudyisitsroleinthe
inversionbeginstobreakdownandthe
transportofpollutantstothearcticenviron-
hazepollutantsarereleased.
ment.Particlescontainingsulfateareama-
Hazelevelsinspringvaryfromoneyear
jorconstituentofarctichaze.Atmospheric
toanother.Studiesshowthatlarge-scale
sulfatelevelscanbeupto25timeshigher
climaticevents,suchastheNorthAtlantic
inthehazeseasonthanatothertimesofthe
Oscillation(seepage9),canhavesignificant
year.Thereisasimilardramaticseasonal
effectsonwindpatterns.Modelspredict
increaseinthelevelsofparticulatenitrate
thatconcentrationsofsomepollutants
andothercontaminantsfromcontinental
duringwintercanbeupto70%higherin
sources.
yearswithstrongerthannormalwinds(i.e.,
Althoughgroundlevelsofaerosolpol-
Monthlyparticulatesulfate
duringpositivephasesoftheNorthAtlantic
lutantsintheArcticarearoundtentimes
andnitrateconcentrations
Oscillation).
lowerthanintheindustrialsourceregions
atBarrowbetween1998
and2004,showingseasonal
furthersouth,theareasaffectedwithinthe
patterns.
Arcticaremoreextensiveandareparticu-
Non-marine sulfate in air, çg S/m3
Nitrate in air, çg N/m3
larlysensitivetothistypeofpollution.The
0.4
0.04
reasonsforthissensitivityarediscussedin
Barrow
Sulfate
Nitrate
thesectionsonacidificationeffectsinter-
0.3
0.03
restrialandfreshwaterecosystems.
Naturalaerosolcomponentsshowvery
0.2
0.02
differentseasonalcycles.Seasaltaerosol
levelsatBarrow(Alaska)arehighestin
0.1
0.01
summerwhenseaiceisataminimumand
aerosolformationattheopenwatersurface
0
0
1998
1999
2000
2001
2002
2003
2004
isatitsgreatest.
Recent trends in sulfate and
Sulfate in air, çg S/m3
Nitrate in air, çg N/m3
nitrate have decoupled
1.00
0.04
Alert
Sulfate
0.75
Nitrate
0.03
Long-termmonitoringatAlertinnorthern
Canadashowedlittlechangeinthespring
0.50
0.02
levelsofsulfateandseveralotherhazepol-
0.25
0.01
lutantsduringthe1980s,butadecreaseof
almost60%inspringsulfatelevelsbetween
0
0
1990and2000.Adeclineinspringsulfate
1980
1985
1990
1995
2000
2005
levelsthroughoutthe1990salsooccurred
atseveralotherarcticsitesandprobably
Long-termtrendsinsulfate
reflectsreducedemissionsfromtheformer
andnitrateinairatAlert,
SovietUnionduringtheearlyyearsofthe
EllesmereIsland,northern
Canada,basedonaveraged
newrepublics.Recentindicationsarethat
valuesforApril.
springsulfatelevelsarestilldecreasing.
Incontrast,springconcentrationsof
D
R
particulatenitrateatAlertincreasedby
A
A
G
about40%between1990and2000.This
S
I
G
S
differenceinthetrendsforsulfateandni-
E
T
T
trateaerosolsduringthehazeseasonmay
O
L
R
A
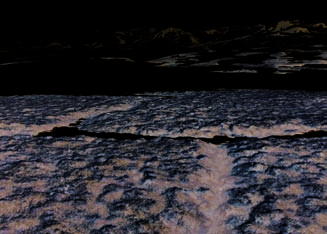
Snowmeltandarunning
alsobeoccurringatBarrowinAlaskabut
H
C
stream.
longerdataseriesareneededtoconfirma
decouplingoftrendsatthissite.
Haze pollutants are retained
within the Arctic
Becausearctichazedevelopsatthesame
D
R
timeasthesnowpack,buthazeconcentra-
A
A
G
tionsdecreasebeforethesnowhasfully
S
I
G
melted,itislikelythatthehazepollutants
S
E
T
T
firstenterthearcticecosystemthrough
O
L
R
depositionontosnowandice.Icecoresand
A
H
C
Snowmeltonthetundra.
snowinGreenlandandAlaskashowpeaks
insulfateandsootdepositsinlatewinter
landandseascausinganoverallincrease
thattendtosupportthis.Asthesnowmelts,
intemperatureandmoremelting.Darker,
pulsesofcontaminantsenterthetundraand
soot-coveredsnowandicereflectlessradia-
rivers.Theeffectsoftheseepisodicpollut-
tionthancleansnowandiceandsoen-
antinputsonthefreshwaterandterrestrial
hancewarming.Therearesomesuggestions
ecosystemsarediscussedinlatersections.
thatsootdepositedontothelandsurface
Itisnotknownhowmuchofthepollution
maybecontributingtoearliersnowmelt
releasedfromthehazeisretainedwithin
ontundrainSiberia,Alaska,Canada,and
theArcticandhowmuchistransportedout
Scandinavia.
oftheArctic.
Lightscatteringmeasured
Light scattering and absorption
atBarrow,Alaska,showing
peaksduringspringwhen
Soot may cause earlier
appear to be increasing
hazelevelsareattheir
snowmelt on tundra
highest.Thelong-term
decreasingtrendinspring-
Aerosolsinfluenceclimateintwoways:
timelightscatteringmasks
Snowandicereflectlightfromthesunback
directlythroughscatteringandabsorb-
amorerecentincrease
tospace.Assnowandicemelt,lessradia-
ingradiation,andindirectlybyactingas
sincetheendofthe1990s.
Thecauseofthisrecent
tionisreflectedandmoreisabsorbedbythe
condensationnucleiforcloudformation
increaseisnotyetknown.
Scattering, 1/Mm
30
Barrow
1982-1996 Trend
20
1997-2005 Trend
10
1977-2005 Trend
0
1976
1978
1980
1982
1984
1986
1988
1990
1992
1994
1996
1998
2000
2002
2004
Polaricereflectslightfrom
orbymodifyingtheopticalpropertiesand
ofapossibleincreaseinlightabsorptionin
thesunbacktospace
lifetimesofclouds.
wintersincetheendofthe1990satAlert
(leftpanel).Darker,soot-
coveredicereflectsless
Changesinthelightscatteringandab-
(Canada).Moremeasurementsareneeded
lightand,thus,enhances
sorbingpropertiesofthehazeÙwhichde-
toconfirmthesetrendsandtoidentifytheir
warming(rightpanel).
pendontheamountofsootwithinthehaze
causes.
Ùdirectlyaffecttheamountofsun'senergy
passingthroughthehaze.Increasedquan-
Haze aerosols and climate change
titiesofsootwithinthehazearethought
likelytocauseawarmingoftheatmosphere
Theeffectsofhazeaerosolsonthearcticcli-
butacoolingattheearth'ssurface,except
matearecomplicatedbyfeedbacksbetween
duringwinterwhenthereisevidencethat
theaerosols,clouds,radiation,seaice,and
soothasaninsulatingeffectandreduces
verticalandhorizontaltransportprocesses.
heatloss.
TheArcticisthoughttobeparticularlysen-
Lightscatteringbyhazeparticulatesat
sitivetochangesintheoverallheatbalance
groundlevelinspringdecreasedthrough-
duetothesmallamountofsolarradiation
outthe1980sandmostofthe1990s.Since
normallyabsorbedinpolarregions.Wheth-
1997therehasbeenaprogressiveincrease
erthepollutantaerosolscauseanoverall
atBarrow(Alaska).Thereisalsoevidence
warmingoranoverallcoolingisnotknown.
1
Terrestrial Effects
EffectsonTerrestrialEcosystems
ThefirstAMAPassessmentdescribedthe
processesinvolvedintheacidificationof
Three regions in the Arctic may be
arcticsoilsandthedirecteffectsofsulfur
susceptible to soil acidification
dioxide,nitrogenoxides,andacidifying
TheKolaPeninsula,theTaymirPeninsula,
depositiononterrestrialecosystems.Atthe
andtheChukotkaregionineasternSibe-
timetherewaslittleempiricalevidenceto
riaarethethreeareasoftheArcticwith
suggestthatsoilacidificationwasanything
thegreatestpotentialforsoilacidification.
otherthanalocalprobleminverylimited
Thisisduetotheirproximitytothemajor
partsoftheKolaPeninsula.Thevisible
sourcesofatmosphericpollutionwithin
damagetotheforestsandtundraaround
theArcticandtothetransportpathways
anddownwindofthenon-ferrousmetal
fortheemissions.Theeffectsofacidifying
smeltersontheKolaPeninsulaÙoneofthe
pollutionontheKolaPeninsulasoilsare
largesthumansourcesofacidifyingpollut-
reasonablywellknown.Muchlessisknown
antsintheArcticÙwasmainlyattributedto
aboutthesituationintheNorilskarea(on
thedirecttoxiceffectsofsulfurdioxideand
theTaymirPeninsula)despitetheveryhigh
theaccumulationoftoxicheavymetalsin
sulfurdioxideemissionsfromthesmelter
soils.Thepresentassessmentlooksbeyond
complexatNorilsk.Itisnotknownwhether
thevisibledamagetothevegetationaround
soilacidificationhasoccurredintheChu-
thesmeltersandexaminesthewiderim-
kotkaregionÙapartoftheArcticthatmay
pactsofthesmelteremissionsonterrestrial
receivesignificantinputsofacidifying
ecosystems.Again,mostoftheinformation
pollutantsfromindustrialsourcesinChina,
concernstheKolaPeninsulaasinformation
India,andotherpartsofeasternAsia.More
Vegetationdamagein
forotherregionsisstillextremelylimited.
informationisrequiredabouttheconcentra-
thevicinityofNorilsk.
I
R
á
M
á
K
A
H
U
J
16
tionsanddepositionofairpollutantsinthe
-150
Critical loads of acidity for terrestrial ecosystems
60
65
60
Terrestrial Effects
Chukotkaregion,andofpossibleeffectson
70
75
thevegetationandsoil.
80
85
AcidifiedsoilsontheKolaPeninsulaare
mostlyrestrictedtotheareasimmediately
-120
aroundthesmeltersandcoincidewiththe
30
areaswherethevegetationhasbeencom-
pletelydestroyed.Outsidetheareaimmedi-
atelyaroundthesmelters,thereisnoclear
eq/ha/yr -90
0
Criticalloadsofacidity
evidenceofsoilacidificationduetosulfur
< 200
200 - 500
forterrestrialecosystems
dioxideemissions(andsubsequentdeposi-
500 - 800
800 - 1000
innorthernEuropeand
-60
1000 - 1500
Canadanorthof60¤N.
tionofacidifyingcompounds),despitethe
-30
> 1500
veryhighemissionsofsulfurdioxidefrom
thesmelters.Thislackofsoilacidification
isusuallyattributedtotheneutralizing
Critical loads of acidity for soils
effectsofflyashemittedfromthesmelters
may be exceeded locally, and
andtheirassociatedpowerstationsandto
regionally near the smelters
thealkalinegeologyoftheregion.Sincethe
InnorthernEurope,modelresultsusing
1990emissionsdataindicatethatcritical
Soil acidification
loadsofacidityforsoilswereexceededover
Theextenttowhichthesoilsbecomeacidifieddependsontheirbuffering
largeareas.Theaffectedregionwouldbe
capacity,i.e.,theirabilitytoresistachangeinpH.Thisisstronglyrelatedto
considerablysmallerfollowingtheimple-
theirbasecationlevels.
mentationofcurrentlyagreedemission
reductionmeasures(the`CLEscenario'),
patternofbasecationlevelsinKolaPenin-
sulasoilsfollowsthatinmosses(which
collectmaterialdepositedfromtheair)
-150
Estimated exceedance of critical loads of acidity for soils
60
Base cations
airbornedustisprobablyamoreimportant
60
65
1990
70
Basecationsareposi-
sourceofbasecationsthanthebedrock.The
75
80
85
tivelychargedions
basecationsinairbornedustcomefrom
suchasmagnesium,
manysources:flyashfromthesmelters
sodium,potassium,and
andpowerplants,open-castminingnear
-120
30
calciumthatincrease
Zapolyarnyy,andmarineaerosolsfromthe
thepHofsoils(i.e.,
BarentsSea.Thelowinterceptionofacidi-
makethemlessacidic)
fyingcompoundsbythesparsecoverof
whenreleasedthrough
coniferoustreesandthelowrateofconver-
-90
0
mineralweatheringand
sionofsulfurdioxidetosulfuricacidinthe
exchangereactions.
Arcticarealsoimportantfactors.
-60
-30
-150
Around1.8milliontonnesofsulfur
60 60
65
CLE 2010
70
dioxideareemittedeachyearintheNo-
(Current Legislation)
75
80
85
rilskarea,whichisoneofthelargestpoint
sourcesofsulfurintheworld.Nevertheless,
theimpactoftheseemissionsonlocalsoil
-120
30
acidificationappearstobelessthanmight
beexpected.Thisisbecausethecalcareous
bedrockgeneratesarelativelyhighbuffer-
ingcapacityintheoverlyingsoilsandso
-90
0
providesadegreeofprotectionforthese
soils.
-60
-30
-150
MFR 2020
60 60
65
(Maximum technically
Long-range transport is unlikely
70
Feasible Reduction)
75
80
to cause soil acidification
85
Projectedexceedanceofthe
now or in the future
criticalloadsofacidityfor
-120
soilsforthreeemission/
WindsfromNorthAmerica,Europe,and
30
depositionscenarios:1990
emissionsdata(upper),
theFarEastcarryacidifyingpollutantsinto
implementationofpres-
theArcticfromhumanactivitiesatlower
entlyagreedemissionre-
ductionsfortheyear2010
latitudes,buttheassociatedlevelsofsulfur
eq/ha/yr -90
(middle),andimplementa-
andnitrogendepositionareconsideredun-
> 500
0
200 - 500
tionofmaximumfeasible
likelytocausewidespreadsoilacidification
100 - 200
emissionreductionsforthe
50 - 100
year2020(lower).
noworinthenearfuture.
< 50
-60
-30
no exceedance
andwouldalmostdisappearassumingthe
impactonterrestrialecosystemsismini-
17
implementationofthemaximumfeasible
mal.However,sincearcticecosystemsare
Terrestrial Effects
emissionreductions(the`MFRscenario').
verysensitivetheymay,overthelongterm,
However,thecriticalloadsofacidityand
showanincreasedabundanceoffast-grow-
criticallevelsofsulfurdioxideinhighly
ingspecies(especiallygrasses)attheex-
sensitiveforestecosystemsarestillexpected
penseofslow-growingspecies(e.g.,lichens
tobeexceededlocallyandregionallynear
andmosses).
thenon-ferrousmetalsmelters.
Criticalloadsofacidityforsoilsin
Adverse effects on soil organisms are
Canadaarenotprojectedtobeexceededin
concentrated around the smelters
anyregionsnorthof60¤N.Theminimum
criticalloadisabout84eq/ha/yrandthe
Microscopicsoilorganismssuchasfungi
maximumsulfurandnitrogendepositions
helptomaintainsoilfertilitybybreaking
areabout30to40eq/ha/yr.Thus,noteven
downplantlitterandotherorganicmate-
thecombinedsulfurandnitrogendeposi-
rial.Thisallowsthenutrientscontained
tionwillexceedacriticalloadinnorthern
inthisorganicmaterialtoenterthesoil.If
Canada.
thegrowthandactivityofthesesoilmicro-
organismsisdecreasedbypollutionthen
Acidic rain and snow only
thenutrientreleasetothesoilwillalso
occur close to the smelters
decrease.Mostofthenegativeeffectsonsoil
organismsseemtooccurinthesoilsaround
Verylowrainandsnowfallinmuchofthe
thesmelters.Reindeerlichens,whichare
Arcticandsubarcticmeansthatupto80%
particularlygoodatinterceptingpollut-
ofthesulfurcarriedintheairenterstheter-
ants,havedeclinedmassivelyintheareas
restrialecosystemviathefalloutofatmos-
affectedbysmelteremissionsandthismay
phericdustparticlesandthedirectuptake
havecontributedtotheeffectsofairpollut-
ofsulfurdioxidebyvegetation.Mostdust
antsonthesoilorganismsthere.Largersoil
andlargeparticlesemittedfromthesmelt-
organismslikeearthwormsandmillipedes
ersdepositquitequicklyclosetothesource.
alsohelptobreakdownorganicmatterand
Studiesshowthatmostofthesulfurinthe
theseoftendisappearcompletelyinsevere-
leavesofsmalltundraplantsontheBar-
lypollutedareas.
entsSeacoastofnorthernNorwaycomes
fromsulfur-carryingdustratherthansulfur
Vegetation damage near the Russian
dioxide.
smelters is likely to continue
Sulfurdioxide,emittedasagasfromthe
smelters,staysairborneforlongerthanthe
Theextentofthevegetationdamagein
Industrialbarrensnearthe
smeltersatMonchegorsk.
dustandlargeparticles;some,however,
theareaaffectedbythesmelteremissions
Thetoxicityofthesoil
iswashedoutbyprecipitationcausingthe
decreaseswithincreasingdistancefrom
preventsseedlingsfrom
establishing,leavinga
rainandsnowtobecome`acidic'.Astudy
thesmeltersandroughlycorrespondstoa
bleaklandscapedevoid
ontheKolaPeninsulafoundthatacidicrain
seriesofconcentriczones:industrialbarrens
oflargetreesandbushes,
andsnowfallsonlywithinabout30kmof
andthezoneofforestdeath,andthezones
withonlysmallpatchesof
vegetationsurroundedby
thesmelters;outsidethiszone,lowersulfur
ofseveredamage,intermediatedamage,
bareland.
dioxidelevelsandthepresenceofalkaline
particlesintheatmosphereareapparently
sufficienttopreventtheprecipitationbe-
comingacidic.Thus,soilsaffectedbyacidic
precipitationontheKolaPeninsulaare
restrictedtorelativelysmallzonesaround
thesmelters.Theamountofsulfurdioxide
enteringsoilsthroughdirectcontactwith
thesurfaceisnotknownbutwillalsocon-
tributetosoilacidity.
Nitrogen inputs may affect
plant communities
R
E
NitrogendioxideemissionsontheKola
D
N
A
X
Peninsulaarelowanddonotcontrib-
E
L
A
utetomakingrainorsnowacidic.Only
Y
R
R
verysmallamountsofnitrogengasesare
E
H
C
broughtintotheArcticthroughlong-range
&
N
A
transportfromlowerlatitudesandtheir
Y
R
B
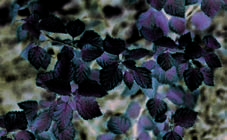


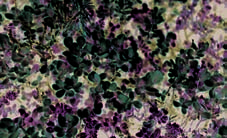

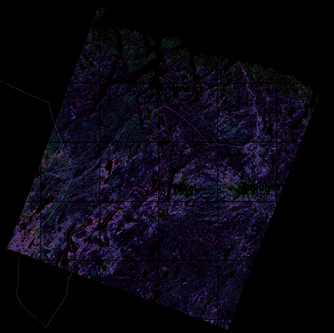
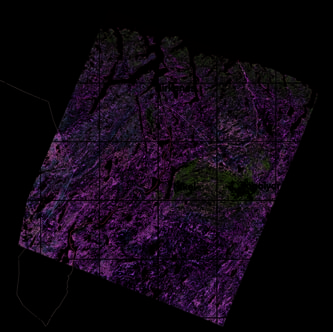
18
moderatedamage,andminordamage.The
lichensandmosses,havedeclinedwhilea
Terrestrial Effects
areasaffectedbythesmelteremissionsare
muchsmallernumberofpollution-resistant
elongatedinthedirectionoftheprevailing
plantshavebecomemoreabundant.The
winds.
changefromthehealthylichen-dominated
Thereisastronglinkbetweenthevisible
vegetationthatpredominatedbefore1970
damagetothevegetationnearthesmelters
tothebarerockandsparselyvegetated
andthelevelsofsulfurdioxideintheair
areasoftodayisgreatestbetween5and40
atgroundlevel.Despitethecontinuingde-
kmfromthesmelters.Bythe1990s,there
creaseinsulfurdioxideemissionsfromthe
werealmostnolichensgrowinganywhere
Russiansmelterstheseemissionsarestill
nearthesmelters.Althoughsmelteremis-
havingsignificantimpactsonthevegeta-
sionsarenowdecliningtherehasonlybeen
tion:visibledamageincludesdiscoloration
averyslightrecovery.Thisispossiblydue
ofbirchleavesandbrowntipsonconifer
toacombinationoflichensgrowingvery
needles,especiallybytheendofthegrow-
slowlyand,innorthernNorway,grazing
ingseason.
reindeermakingitdifficultforthelichensto
Highlevelsofheavymetals(suchas
re-establish.
nickelandcopper)inthesoilsaroundthe
Theimpactsofpastandcontinuing
smeltersalsocontributetothiswidespread
pollutionwillprobablyremainformany
ecosystemdamage.However,becausethere
decadessincearcticvegetationisbothvery
isastrongcorrelationbetweenthelevels
sensitivetopollutionandveryslowto
ofheavymetalsandsulfurdioxideand
recover.Nevertheless,improvementsare
becausetheybothresultinvisuallysimilar
beginningtobeseen,althoughifthemost
detrimentalchangesinplantsitisdifficult
sensitivetundraplantsaredisplacedby
todifferentiatethedamagethattheycause.
moretolerantforestspeciesthesechanges
Theirroleisclearerintheindustrialbar-
intheplantcommunitiesmaywellhave
rens,wherevegetationcoverdeclinesas
negativeconsequencesfortheanimalsthat
plantsageanddiebutthehighlevelsof
dependonthem.Ifsulfurdioxideemis-
heavymetalsinthesoilspreventseedlings
sionsdonotincreaseagain,thestateofthe
fromgrowing.Therearealsoverylowlev-
vegetationaroundthesmeltersontheKola
elsofmanyplantnutrientsinthesoilsim-
Peninsulawillprobablycontinuetoim-
I
D
L
mediatelyaroundthesmeltersduetolow
prove;butthesechangeswilltakedecades
M
A
A
organicinputs(e.g.lowamountsofleaffall)
anditisnotclearwhetherthenewvegeta-
N
A
D
andtheleachingofplantnutrientsfromthe
tionwillbethesameasitwasbeforethe
Leafdamageinpine,
soilduetotheatmosphericdepositionof
pollutionbegan.
dwarfbirch,mountain
acidityandheavymetals.
birch,andbogbilberry
Changesinthestructureofplantcom-
causedbysulfurdioxide
Peaks in sulfur dioxide are
neartheNikelsmelter.
munitiesarecommoninpollutedareasbe-
particularly damaging to plants
causeplantsdifferintheirabilitytotolerate
pollution.Lichensareparticularlysensi-
Someplants,suchasmaturemountain
Landcovermapsfor
tivetosulfurdioxideandtheoncelichen-
birchtrees,cantolerateanincreaseinpol-
thePasvik-Nikelareain
dominatedheathsandforestsintheborder
lutionaslongastheincreaseisgradual.But
1973and1999.Theonce
lichen-dominatedheaths
areasofNorwayandRussiahavebeen
suddenhighsulfurdioxidelevelscanbe
andforestsinthevicinity
verybadlyaffected.Manysensitiveplants
verydamaging,especiallyduringthegrow-
ofthesmeltershavebeen
thatwouldnormallyoccurthere,including
ingseason.Suddenandunusualchangesin
replacedbymorepollution
resistantvegetation.
NORWAY
Kirkenes
1973
1999
FINLAND
Norway
Norway
Nikel
Zapolyarnyy
Finland
Finland
RUSSIA
Unclassified/edge
Lakes/rivers/sea
Heaths/barrens/boulders
Mixed pine-birch forests
Heather woodland and mires
Heather woodland partly damaged
Lichen-dominated forests
Lichen-dominated heaths
Bilberry forests
Meadow forests
Wet bogs/mires
Industrial barrens/bare rocks
Norway
Norway
Ind. barrens/damaged vegetation
Russia
Russia
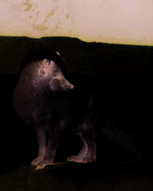


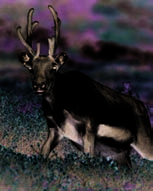

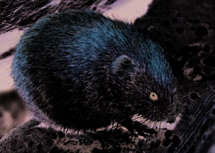
Predatory birds
19
Snowy owl
Terrestrial Effects
Raven
Jaeger
Sedges
Lemming
Grasses
Arctic fox
Arctic hare
Lichens
Reindeer/caribou
Weasel
Ptarmigan
Dwarf shrubs
Muskox
Wolf
Predatory
Small grazers
Vegetation
Large grazers
Predatory
mammals
mammals
N
E
S
I
N
S
S
K
E
R
S
R
E
A
T
T
P
R
O
N
O
I
O
P
N
M
T
E
E
I
M
C
N
A
/
R
R
T
/
K
/
A
A
A
R
A
A
V
I
M
A
V
V
U
T
U
U
I
K
F
I
P
I
K
I
K
T
E
N
T
T
H
S
U
H
H
E
O
A
E
E
L
J
R
L
L
First level predators
Grazers
windstrengthanddirectionhavebrought
inhabitatqualityisalmostalwaysachange
Primary producers
episodicpollutioneventsthathavecaused
inpopulationsize.Thearcticterrestrial
visibleinjuriestobirchleavesandScots
foodwebisrelativelysimpleandchanges
pineneedlesinanareaofnortheastNorway
inpopulationsize,ofkeyspeciesinpar-
Schematicrepresentation
oftheterrestrialfood
neartheRussianborder.
ticular,canhavefollow-onimpactsonother
webintheArctic.
species.
Animals are affected indirectly
Changesinmostanimalpopulationsfol-
through changes in their habitat
lowthedifferentstatesofvegetationdam-
ageÙwithimpactsgreatestinthebarrens
TheRussiansmelteremissionshavealso
andforestdeathzoneandprogressivelyless
hadwide-rangingimpactsonbirds,small
throughtheareasofsevere,intermediate,
mammals,andinvertebratesatthelocal
moderate,andminordamage.However,
scale.Theseimpactsaremostlyindirectand
forsomespeciesthepictureisnotassimple
causedbychangesinhabitats.Damaged
andpopulationnumbersarehighestinthe
vegetationresultsinfewernestingsitesfor
slightly-to-moderatelypollutedareas.This
birds,lesscoverforsmallmammals,fewer
maybebecausethefoodplantsarepol-
orpoorerqualityfoodandhostplants,and
lution-tolerantspeciesthatbecomemore
changesintheratiosofpredatorstoprey.
availableincontaminatedareasascompeti-
Formostspeciestheendresultofachange
torsdie-off.Someanimalsevenpreferthe
Abundance
300
Numbersofgrey-sidedvoles
(photo)arelowestcloseto
250
theMonchegorsksmelterand
M
ø
increasewithincreasingdis-
R
T
tancefromthesmelter.Bank
S
D
vole,redvole,andfieldvole
200
R
O
areeffectivelyabsentfromthe
I
-
N
mostseverelydamagedarea
I
N
O
andstillonlyscarceatthe
150
S
A
moderatelypollutedarea
I
R
M
28kmsouthofthesmelter.
100
Field vole (Microtus agrestis)
50
Red vole (Clethrionomys rutilus)
Bank vole (C. glareolus)
<5
5-10
11-30
>30
Grey-sided vole (C. rufocanus)
0 0
5
10
15
20
25
30 Distance from smelter, km


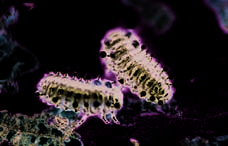

pollutedareas.Forexample,Laplandleaf
ispossiblybecausesnowmeltsearliernear
beetlesarerareinmostsubarcticforests,but
thesmeltersmakingtheseareasseemmore
outbreakssufficienttostripentirebushes
attractiveforfoodandnesting.Butbreed-
havebeenseenneartheMonchegorskand
ingsuccessisoftenlowhereandmanybirds
Nikelsmelters.Thisisprobablydueto
abandontheirnestsduringnestbuildingor
thecombinedeffectsofmorefood(many
beforecompletingtheclutch.Sometimes
typesofwillowcantoleratethehighlypol-
thisisduetoalackoffood.Aswellasless
lutedconditionsnearthesmeltersandso
successfulbreeding,animalsarealsomore
increaseinnumber)andfewerpredators
likelytodieinthesehighlycontaminated
(highsulfurdioxidelevelsremovemanyof
areasastheybecomelessabletocopewith
V
thebeetle'snaturalpredators).Somerare
environmentalstressessuchasdisease,low
O
L
Z
mothsandbutterfliesalsothriveinthevery
wintertemperatures,andfoodshortages.
O
K
I
L
damagedareas.Thelunarhornetclearwing,
Biodiversityisoftenloweratcontami-
A
H
I
K
whichwasconsideredextinctinFinland
natedsites.Sincethe1970s,therehavebeen
M
untilveryrecently,appearsingreatnum-
nosightingsofhazelgrouse,eagleowl,
Laplandleafbeetle
bersinthebarrenareasneartheMonche-
Tengmalm'sowl,ortreecreepercloserthan
(Chrysomela lapponica)
adultandlarvae.
gorsksmelter.
40kmtoMonchegorsk.Thesearealltypical
Mostbirdsfollowthesamepatternasfor
subarcticspecies.
smallmammalsanddecreaseinnumberto-
wardthesmelters,althoughinspringthere
The lichen decline since 1970 has
maybemorebirdsintheverycontami-
affected the arctic food web
natedareasclosetothesmeltersthaninthe
lesscontaminatedareasfurtheraway.This
Lichens are a very important part of the
arctic food web. Consequently lichen dam-
age is one of the most significant impacts of
acidification in the terrestrial Arctic. Pen-
Birds observed
Species recorded
dulous lichens are an important winter food
Thebreedingsuccessof
200
15
redstart(photo),pied
for bank voles and a decline in these lichens
flycatcher,andSiberian
has been linked to changes in the regular
tit,threetypicallyabun-
150
3- to 5-year peaks in bank vole populations.
dantholenestingspecies
10
intheArctic,isseverely
Voles are a key species in the Arctic and
reducedinareasaffected 100
Species
changes in their dynamics can affect the
byemissionsfromthe
non-ferrousmetalsmelt-
many predatory birds and mammals that
5
ers.
50
Birds
feed on them. The long-term decline in vole
numbers near the smelters is probably due
<5
5-10
11-30
>30
to a decrease in the availability of food and
0
0
0
5
10
15
20
25
30
35
40
0
5
10
15
20
25
30 Distance from smelter, km
natural shelter.
T
D
E
T
S
L
L
E
H
O
V
A
A
P
I
.
F
A
V
Redstart(Phoenicurus
U
K
U
phoenicurus)
T
I
N
/
L
Voles,especiallyMicro-
O
U
T
V
D
tusvoles(e.g.fieldvole,
S
E
E
T
S
upper),andtheredvole
R
A
L
L
E
(lower),arekeyspecies
V
S
H
U
innorthernvertebrate
K
O
V
R
A
communities.
A
A
M
P
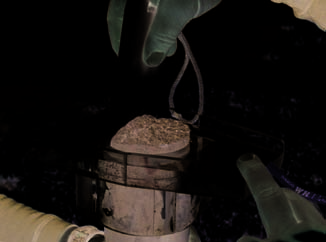
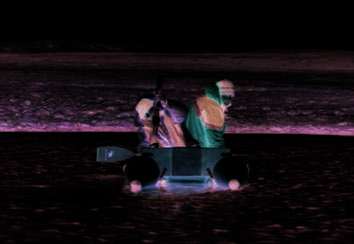
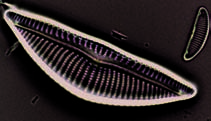

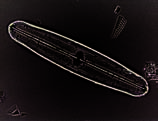

21
Freshwater Effects
EffectsonFreshwaterEcosystems
ThefirstAMAPassessmentfocusedon
Slow natural acidification
acidificationoflakesandriversinnorthern
is the underlying trend in
FennoscandiaandtheKolaPeninsula.This
most northern lakes
areahasbeenverybadlyaffectedbyemis-
sionsfromthenon-ferrousmetalsmeltersat
PollutantsbegantoarriveintheArcticlong
Nikel,Monchegorsk,andZapolyarnyy.Sul-
beforewaterqualitymonitoringbegan.So
fateconcentrationsinsomelakesinnorth-
pastenvironmentalconditionsarerecon-
ernFennoscandiainthemid-1980swere
structedusingchangesinthemicroscopic
morethantwiceashighasinthe1960s
fossilrecordinlakesediments.Diatoms
andsmallmountainlakeswereoftenvery
(atypeofalgae)arewidelyusedforthese
acidic.Manylargelakeshadlittlebuffer-
reconstructionsbecausetheircellwallsare
ingcapacityleft.Somesmalllakesweretoo
abundantandpreservewellinsediments.
acidictosupportfish.OntheKolaPenin-
Theyarealsoexcellentindicatorsofacidi-
sula,acidifiedlakesoccurredaroundthe
fication:asawaterbodybecomesacidified
industrialcentersandalongthenorthern
acid-sensitivespeciesdisappearandacid-
andeasternpartsofthepeninsula(although
tolerantspeciesbecomemoredominant.
heavymetalswerethoughttobeabigger
Diatom-basedpH-reconstructionsover
problemherethanacidification).Between
largeareasofFennoscandia,theKolaPenin-
themid-1980sandtheearly1990sacidifica-
sula,theNorilskareaofSiberia,Svalbard,
tionstoppedincreasingandtherewereeven
andtheCanadianArcticshowthatnatural
indicationsofareductioninacidification
long-termacidificationisacommonfeature
inafewlakes.Thiswasduetodecreasing
inmanyarcticlakes.Changesinland-use
sulfuremissionsinEurope.Acidification
andreindeerherdingdonotappeartohave
ofsurfacewatersintheCanadianArctic
affectedlakeacidityoverthelast1000years.
andAlaskawasconsideredhighlyunlikely
owingtothelowdepositionofacidifying
pollutantsandtothelimitedareasofsensi-
tivegeology.
Averticalsedimentcore
fromalakeisextruded
intosliceswhichcorres-
pondtodiscretetimeinter-
vals.Preservedinthismud
isanarchiveofinforma-
tion(suchasmicroscopic
diatoms)thatcanbeused
tointerpretpastenviron-
mentalconditionsateach
`slice'orinterval.
L
O
M
.
S
P
N
H
O
J
Acharacteristicfeatureof
diatomsistheirsiliceous
(glass)cellwalls.Someare
M
extremelybeautifuland
ø
R
ornate.
T
S
K
C
E
W
N
A
J
second150kmsouthwestoftheNikel
smelters,andthethirdinwesternLapland
alongwayfromthesmelters,shownoreal
changesinaciditydespitethehighlevels
ofaciddepositiontotheeast.Butcores
fromasmalluplandlakeabout30kmfrom
theMonchegorsksmelterdoshowrecent
N
E
acidification,withacid-tolerantdiatoms
S
R
E
F
becomingmoreabundantasgeneralspe-
F
O
T
ciesdiversitydecreased.Thechangesbegan
I
S
R
H
withthestartofindustrialdevelopmentin
C
N
E
theregion.AnotherstudyneartheMonche-
T
S
I
R
gorsksmelterfoundtheusualmidgelarvae
K
tohavebeenreplacedbyspeciesmoreable
Widespread acidification in
totoleratetoxicconditionsatexactlythe
recent times is not apparent
timethatsedimentmetallevelsstartedin-
from sediment cores
creasing.Similarstudiesappeartoconfirm
thatsignificantacidificationeffectsonlake
TopÙbottomsedimentstudiesusing
biologyarerestrictedtolakeswithinafew
diatomsdonotsupportthehypothesisof
tensofkilometersofthesmelters.
large-scalemodernacidificationinnorthern
Swedennorwidespreadacidificationof
Freshwaters vary widely in their
arcticlakesduetosulfurpollutionfromthe
sensitivity to acidification
smeltingandminingindustries.Mostlakes
innorthernRussia,includingseveralwithin
Theextenttowhichlakescanresista
afewhundredkilometersofthelargeemis-
changeinpHandneutralizeacidinputs
sionsourcesatNorilsk,arewellbuffered
ÙtheirbufferingcapacityÙreflectsthe
againstacidificationandthisisreflectedin
amountofbufferingmaterialenteringfrom
theirmicrofossilrecord.Diatomsandmidge
thecatchment.Themostimportantbuffer-
larvaeinlakesedimentsfromtheNorilsk
ingmaterialsinarcticwatersarebicarbo-
areahavechangedlittlesincepre-industrial
nateandorganicacids.
timesandthereisnoevidenceofwide-
spreadlakeacidification.However,itcould
bethatlakesedimentsdonotindicatewide-
Lake water pH
spreadacidificationinrecenttimesbecause
MostlakeshaveapHofbetween6and9.
manyofthelakesstudiedareoutsidethe
Acidificationeffectsbegintoappearinthe
areasofhighdepositionorarenotparticu-
lakebiologybelowaboutpH6.LowpH
maybeduetonaturalcausesaswellas
larlysensitivetoacidification.
humanactivities.
Sediment records
Freshwatersvaryintheirabilityto
ThetopÙbottomapproachisaquickway
withstandacidinputsandthiscanbedeter-
toidentifyachangeinacidificationstatus
minedfromtheirwaterchemistry.Acid-
sincepre-industraltimes.Thisisdoneby
sensitivelakesarescatteredallovernorth-
analysingtwosamplesfromeachsedi-
ernFennoscandiaandtheKolaPeninsula,
mentcore:asamplefromthetopofthe
corerepresentingpresent-dayconditions
butaremostcommoninthenorthernpart
andasamplefromlowerdownrepresent-
oftheKolaPeninsula,Norwegiancoastal
ingpre-industrialconditions.Acompari-
sonofthetwosamplesshowsthechange
sincepre-industrialtimes.
Acid sensitivity
Thistechniqueisalsousefulfordeter-
Averyacid-sensitivelakehasanal-
miningtheextentoflakeacidificationat
kalinityof<20eq/L,amoderatelysen-
theregionallevel.
sitivelakeanalkalinityof20to50eq/L,
andalakethatisinsensitivetoacidificati-
Sediment cores show
onanalkalinityof>200eq/L.Thebase
cationconcentrationalsoindicatessensiti-
acidification is restricted to
vitytoacidification.Averysensitivelake
lakes very near the smelters
hasabasecationconcentrationof<100
eq/L,amoderatelysensitivelakeabase
Sedimentcoresshowrecentacidification
cationconcentrationof100to400eq/L,
onlyinlakesveryclosetothesmelters.
andalakethatisinsensitivetoacidificati-
Coresfromthreesmallacid-sensitivelakes:
onhasabasecationlevelof>400eq/L.
one40kmwestoftheNikelsmelters,the
areas,northeasternandsouthernLapland,
2
andinthewesternpartofNorbottencounty
Freshwater Effects
inSweden.NorthernNorwayhasthehigh-
estpercentageofacid-sensitivelakes,with
around40%oflakesclassedasacidsensi-
85
Critical load
Criticalloadestimatesfor
tive.Icelandiclakesarenotacidsensitive,
eq/ha/yr
acidityinsurfacewatersin
whilesomeinnorthernSvalbardarevery
northernEuropeatascale
< 200
of50x50km.
acidsensitive.Oftheveryfewlakesinthe
200 - 500
NorthAmericanArcticthathavebeenstud-
500 - 800
80
800 - 1000
iedonlyasmallnumberareacidsensitive
1000 - 1500
andmostoftheseareonBaffinIslandorthe
> 1500
centralmainland.Thereisnoinformation
75
abouttheoccurrenceofacid-sensitivelakes
inlargepartsoftheRussianArctic.
Critical loads for surface
70
waters and their exceedance
in the Barents region
Acidificationisonlyaconcerninareaswith
65
bothhighacidicdepositionandsensitive
geology.Thismeansthatthelargestimpacts
onlakechemistryandbiologymostlyoccur
60
insmallsensitiveecosystemsinlocalized
-5
45
areas.Acidifiedareasandareassensitive
5
toacidificationarequantifiedusingcritical
35
15
25
loads(definedinthefirstboxonpage2).
Sulfate levels in Arctic lakes
Highsulfateconcentrations
arecommoninlakesonthe
westernpartoftheKolaPe-
ninsula,particularlynearthe
smeltersinNikelandMonche-
gorsk.Highconcentrations
arealsoscatteredaroundthe
Barentsregionasawhole
(althoughsomeoftheselakes
wereprobablyacidifiedby
sulfatefromcatchmentgeolo-
gy).EasternKolalakeshave
consistentlylowsulfatelevels,
duetolowsulfurdeposition.
Assulfatedepositionin
theCanadianArcticisvery
low,thehighlyvariablesulfa-
teconcentrationsinCanadian
arcticlakesshowgeological
sourcesareimportantin
manyareas.
Non-marine sulfate
in lakes, çeq/L
< 50
50 - 100
> 100
24
Sulfateisthemainacidifierofarcticlakes
Freshwater Effects
Exceedance of critical loads
andstreams.Nitrateconcentrationsare
Theextenttowhichcriticalloadsareexcee-
verylowandprobablyhavelittleimpacton
dedisfoundbycombiningthecriticalload
acidificationofarcticlakes.
mapswithmodeleddepositiondatausing
Criticalloadsofacidityforsurface
theDEHMmodelsystem(describedinthe
watersinnorthernFennoscandiaandthe
boxonpage9).
KolaPeninsulavarywidely.Whencritical
loadsareexceededacidificationmayoccur.
In1990,criticalloadsforsurfacewaters
innorthernEuropewereexceededalmost
Estimated exceedance of critical loads
everywhere.Ifthepresentlyagreedemis-
of acidity for surface waters
sionsreductionsareimplementeditisvery
85
eq/ha/yr
likelythatby2010theareaandextentof
< 20
1990
20 - 50
exceedanceacrossnorthernEuropewillbe
50 - 100
100 - 200
reducedsubstantially.Itisalsoclear,how-
80
200 - 500
> 500
ever,thatcriticalloadsforsurfacewaters
in2020willstillbeexceededinpartsofthe
75
Kolaregionevenifthemaximumfeasible
emissionsreductionsareimplemented.
70
Lakes are showing regional-scale
improvements in water chemistry
65
Long-termmonitoringintheBarents
regionshowsclearsignsofregional-scale
improvementsinwaterchemistry.This
-5
60
45
isalmostcertainlyduetothedecreasein
5
35
sulfurdepositionoverthelasttenyears.
15
25
Lakesclosetothepollutionsourcesonthe
85
KolaPeninsulashowtheclearestsignsof
CLE 2010
(Current Legislation)
recovery.
80
Information on biological impacts
and recovery is very limited
75
Thepotentialforbiologicaldamageinacid-
Thefigureshowsexceed-
anceofcriticalloadsin
sensitivelakescanbepredictedbycalcu-
surfacewatersforthree
70
latingtheacidneutralizingcapacityofthe
emission/deposition
scenarios:1990emissions
water.
data(upper),implementa-
MostacidificationstudiesintheArctic
tionofpresentlyagreed
65
emissionreductionsfor
focusonwaterchemistry.Therearevery
theyear2010(middle),
feweffectsstudiesonfreshwaterplantsand
andimplementationof
60
animals,exceptforstudiesofmicrofossils
maximumfeasibleemis-
-5
45
sionreductionsforthe
inlakesedimentcores.Thestudiesthatdo
5
year2020(lower).
35
15
25
85
MFR 2020
(Maximum technically
Non-marine sulfate in lakes
Waterchemistrydatafrom
Feasible Reduction)
59lakesacrossFinland,
no trend
80
Norway,andSweden
significant decrease
showaclearrecoveryin
significant increase
waterchemistrysince
1990.Sulfatelevels
75
decreasedinmostlakes
between1990and2004.
2
Thegreatestdecreases
occurredineasternFinn-
70
marknearthesmelters.
Althoughlakesinsouthern
andcentralLaplandare
moreaffectedbyinputs
65
fromlong-rangetransport
3
thanlocalsources,sulfate
concentrationsinthese
lakesalsodecreased.The
1
-5
60
1 Lapland, Finland
45
smallestdecreasesoccur-
2 Eastern Finnmark, Norway
redinnorthernNorway
5
35
15
Northern Norway and Sweden
andSweden.
25
3
Daphnia longiremis as a percentage of the zooplankton community
existaremostlyforareasofnortheastern
30
NorwayandFinlandthathavebeenbadly
affectedbyemissionsfromthesmelterson
25
theKolaPeninsula.Thereistoolittleinfor-
20
mationtodrawconclusionsaboutbiologi-
15
caleffectsonsurfacewatersintherestof
A
I
L
theEuropeanArctic.Therearenobiologi-
T
T
10
N
caldataforanyacid-sensitiveareasofthe
U
J
O
5
NorthAmericanArctic.
V
A
A
P
Diatomsareexcellentindicatorsofacidi-
0
1990
1992
1994
1996
1998
2000
2002
2004
ficationand,outsidetheareasimmediately
aroundthesmelters,thereisnoevidence
tosuggestthatdiatomcommunitiesare
zooplanktoncommunityofanacid-sensitive Theacid-sensitivewater
fleaDaphnia longiremis
switchingfromacid-sensitivetoacid-toler-
lakeinFinnmark(seefigure)andinthefish
isnotfoundinacidified
antspeciesinarcticlakes.Acidificationef-
populationsoflakesandstreamsthroughout lakes.Itwasfirstrecorded
inthelakeDalvatnonthe
fectsoninvertebrateslivinginoronthebot-
northeasternFinlandshowaclearimprove-
VarangerPeninsulain
tomsedimentsarerarebutasacid-sensitive
mentinacidificationstatus.
Norwayin1995.Sincethen
speciesarecommonintheArcticthepoten-
Althoughchangesinwaterchemistry
itsnumbershaveprogres-
sivelyincreasedanditnow
tialforfutureeffectsishigh.Anextensive
suggestthattheBarentsregionlakesare
comprisesover25%ofthe
studyofmidgelarvaeinlakesediments
recoveringfromacidification,thereisnot
zooplanktoncommunity.
Thisshowsabigimprove-
acrossFinnishLaplandshowednoevidence
enoughdatatoshowwhetherthebiology
mentintheacidification
ofacidification.Thereislittleevidenceof
isshowingasimilarrecovery.Butasmany
statusofthelake.
widespreadeffectsonfishcommunitiesin
ofthelakesthathadlargeacidicinputsin
acid-sensitivepartsoftheArctic.
thepastwerenotnecessarilyacidifiedtothe
Acidificationoflakesdirectlydownwind
pointwheremeasurabledamagetothebiota
ofpointsourcesontheKolaPeninsula
couldbeobserved,itmightbethatabiologi-
seemstobedecreasing.Changesinthe
calrecoverywouldnotbeseenanyway.
Acid Neutralizing Capacity
AcidNeutralizingCapacity
(ANC)isameasureofthe
abilityofthewatertoneutra-
lizeaddedacids.Itisagood
measureforestablishing
dose/responserelationships
betweenwaterchemistry
anddamagetothebiological
community.Waterswitha
lowacidneutralizingcapacity
(<50eq/L)indicatepossible
damagetothebiota.
ANC
< 20
20 - 50
50 - 200
> 200
26
Freshwater ecosystems are
significantimprovementsinwaterquality
Freshwater Effects
very vulnerable to pulses of
duringspringrunoff;episodicacidification
highly acidic meltwater
decreasedbybetween40and80%during
theperiod1990to1999.Astrongcorrela-
Pulsesofveryacidicwateroftenenter
tionbetweenwintersulfatedepositionand
freshwaterecosystemsduringsnowmelt.
episodicacidificationinnorthernSweden
Acidifyingpollutantsdepositfromtheair
suggeststhatfuturereductionsinacid
ontothesnowandthenbuildupduring
depositionwillfurtherreducespringflood
winter.Whenthesnowmelts,thesepollut-
acidificationinnorthernregions.A65%
antsarereleasedinonebigpulseduring
reductioninsulfurdepositioninnorthern
theshortspringflood.Thisresultsinshort
Swedenbetween1970and1990hasreduced
periodsofmuchlowerpHthannormal.On
theareaofveryacidicspringfloodsacross
theKolaPeninsula,pHdepressionduring
northernSwedenby75%.
springfloodisshortusuallylastingforno
Althoughlargefishpopulationlossesare
morethanfivetosevendays.
welldocumentedinthemosthighlyaci-
Surfacewatersinareaswithsignificant
difiedregionsofsouthernNorwayand
heavymetaldepositionfromsmelteremis-
Sweden,thereiscurrentlylittleevidence
sions,oftenexperiencesimultaneouspulses
ofsimilareffectsinthenorthernareas.A
ofheavymetalsduringsnowmeltthatcan
studyof13riversinnorthernFinlandfound
contributeanadditionaltoxicstress.The
nosignsofacid-inducedfailureinsalmonid
greateststressonfreshwaterbiotaoccurs
reproductionand/orrecruitment.Further
duringspringfloodperiods,whenpHisat
research,focusingonthemostsensitive
itslowestandtheconcentrationsoftoxic
sitesandextremeconditionswouldbewar-
formsofmetalsarehighest.Acidicepisodes
rantedtoconfirmthesefindings.
havebeenreportedfromSweden,Finland,
Norway,andRussia.
Climate change may delay
recovery from acidification
Spring floods
Thecausesandeffectsofacidifyingairpol-
Inarcticregions,anabruptdropin
lutantsarecloselylinkedtootherenviron-
waterpHinashortfloodperiodisoften
mentalissues.Forexample,climatechange,
accompaniedbyapulseofmetals.The
theeffectsofheavymetals,andincreasing
leachingofmetalsduringspringfloods
exposuretoultravioletradiation.Thecom-
canaccountforupto75%oftheirtotal
binedeffectsofthesedifferentstresseson
annualload.DataonstreamsintheKola
ecosystemsaredifficulttopredictandmay
Northshowedthatintheperiodsoflow
besmallerorgreaterthanexpected.Climate
pHduringspringfloods,thetotalmetal
changewillalmostcertainlybecome
concentrationincreasedinalltypesof
amajorenvironmentalstressintheArcticas
stream,despitedilutionbysnowmelt
water.
conditionsbecomewarmerandwetter.
Higherwatertemperatures,thawingperma-
frost,changesinicecover,andhigherpol-
lutionlevelswillallhavemajorimpactson
Becauseepisodicacidificationisdiffi-
freshwaterecosystems.
culttoassess,manyacidificationrecovery
Large-scalechemicalrecoveryfrom
assessmentshavefocusedonchangesin
surfacewateracidificationinEuropeand
averagelakeconditions.However,amodel
NorthAmericaiswidelyaccepted.Re-
abletopredictpHinnorthernFinnishlakes
coveryfromacidificationisalsoclearin
fromthesedimentinvertebrates,found
northernFennoscandia.Thereisnotenough
theminimumpHduringtheshortspring
informationtodrawanyconclusionsabout
snowmelttobemoreimportantfordeter-
recoveryintherestoftheArctic.
miningthegeneralbenthiccommunity
Modelingstudiesbasedoncurrentemis-
structurethantheaveragepH.Therehave
sionsreductionplanspredictfurtherchemi-
beenseveralinvestigationsoftherelation-
calrecovery.Uncertaintiesintheseassumed
shipbetweentheaveragepHofsurface
reductionsmainlyconcerntheeffectsof
watersandpHduringacidicepisodes.
climatechange,includingitseffectsonni-
ManystreamsinnorthernSwedenhave
trogencycling.Otheruncertaintiesconcern
veryacidicspringfloodsfollowingsnow
howthebiologywillrespondtoclimate
melt.Althoughtherehasbeennosignificant
change.Present-dayclimaticconditionsare
changeintheaverageacidityofthestream
commonlyassumedinmodelprojections,
waterfortheyearasawhole,reduced
althoughlargechangesinclimateareantici-
sulfurdioxideemissionshavecaused
patedfortheArctic.

27
Human Health
EffectsonHumanHealth
Humanhealtheffectsfromairpollutionin
theArcticmostlyoccurwithinthefewlarge
townsandcities.Becauseitisdifficultto
isolatethehealtheffectsofindividualpol-
lutants,researchersoftenconsiderthemajor
groupsofpollutantsas`indicators'ofthe
mixofairpollutantspresent.Thehealthef-
fectsofsulfurdioxideandacidaerosols,as
wellasthehealtheffectsofdustandsmall
particles,includethroatirritationandan
exacerbationofcardiorespiratorydiseases,
includingasthma.
Studieshavenotfoundanysignificant
effectsonhumanhealthofthegeneral
populationthataredirectlyassociated
withemissionsfromthenon-ferrousmet-
R
E
D
alssmelters.Infact,humanhealthinthe
N
A
X
NorwegianandRussianborderareasthat
E
L
A
havebeenbadlyaffectedbyemissionsfrom
Y
R
R
E
theKolaPeninsulasmeltersseemsmore
H
C
relatedtosocio-economicconditionsthanto
&
N
A
environmentalpollution.
Y
R
B
R
E
D
Workersinsmeltersare
N
A
X
exposedtohighlevelsof
E
L
sulfurdioxide.However,
A
Y
studieshavenotfoundany
R
R
significanthealtheffects
E
H
associatedwithsmelter
C
&
emissionsinthegeneral
N
A
populationinareascloseto
Y
R
B
thesmelters.
28 Copyright holders of photographic material reproduced in this volume:
Dan Aamlid,NorwegianForestsResearchInstitute,H½gskoleveien8,1432és,NorwayÙdan.aamlid@skogforsk.no
Bryan & Cherry Alexander,HigherCottage,Manston,SturminsterNewton,DorsetDT101EZ,UKÙalexander@arcticphoto.co.uk
Jesper H. Christensen,NationalEnvironmentalResearchInstitute,P.O.Box358,4000Roskilde,DenmarkÙjc@dmu.dk
Kirsten S. Christoffersen,FreshwaterBiologicalLaboratory,UniversityofCopenhagen,3400Hiller½r,DenmarkÙ
kchristoffersen@bi.ku.dk
Department of Geophysics, Niels Bohr Institute, University of Copenhagen Ùwww.glaciology.gfy.ku.dk/ngrip
Ann-Christine Engvall,MeteorologiskaInstitutionenStockholmsUniversitet(MISU),10691Stockholm,SwedenÙanki@misu.su.se
Paavo Hellstedt,FacultyofBiosciences,P.O.Box65,00014UniversityofHelsinki,FinlandÙpaavo.hellstedt@helsinki.fi
Paavo Junttila,FacultyofBiosciences,P.O.Box65,00014UniversityofHelsinki,FinlandÙpaavo.junttila@helsinki.fi
Juha Kðmðri,FinnishEnvironmentInstitute,P.O.Box140,Helsinki,FinlandÙjuha.kamari@ymparisto.fi
Mikhail Kozlov,SectionofEcology,UniversityofTurku,20014Turku,FinlandÙmikoz@utu.fi
Lehtikuva,Pictureagency,P.O.Box406,00101Helsinki,FinlandÙinfo@lehtikuva.fi
NILU (Norwegian Institute for Air Research),P.O.Box100,N-2007Kjeller,NorwayÙinfo@nilu.no
Rauni Partanen,UniversityofHelsinki,KilpisjðrviBiologicalStation,99490Kilpisjðrvi,FinlandÙrauni.partanen@helsinki.fi
Charlotte Sigsgaard,UniversityofCopenhagen,DepartmentofGeography,1350CopenhagenK,DenmarkÙcs@geogr.ku.dk
John P. Smol,PaleoecologicalEnvironmentalAssessmentandResearchLab(PEARL),Dept.Biology,116BarrieSt.,
Queen'sUniversity,Kingston,OntarioK7L3N6,CanadaÙsmolj@biology.queensu.ca
Mira Soini-Nordstr—m,FacultyofBiosciences,P.O.Box65,00014UniversityofHelsinki,FinlandÙmira.soini-nordstrom@helsinki.fi
Brian J. Stocks,WildfireInvestigationsLtd.,128ChambersAvenue,SaultSte.Marie,ONP6A4V4,CanadaÙbrianstocks@sympatico.ca
Josef TimarÙjosef.timar@aon.at
Markus Varesvuo,Pursilahdenranta2D54,00980Helsinki,FinlandÙmarkus.varesvuo@lintukuva.fi
Jan Weckstr—m,FacultyofBiosciences,P.O.Box65,00014UniversityofHelsinki,FinlandÙjan.weckstrom@helsinki.fi