Update on Selected Climate
Is ues of Concern
Observations, Short-lived Climate Forcers, Arctic
Carbon Cycle, and Predictive Capability
Arctic Monitoring and Assessment Programme (AMAP)
ISBN 978-82-7971-049-3
AMAP 2009
Update on Selected Climate Issues of Concern
Observations, Short-lived Climate Forcers, Arctic
Carbon Cycle, and Predictive Capability
Contents
Preface .................................................................................................................................................... i i
Executive Summary ................................................................................................................................. v
Introduction ................................................................................................................................................ 1
Arctic Report Cards ................................................................................................................................. 1
Short-lived Climate Forcers ......................................................................................................................... 7
The Arctic Carbon Cycle ............................................................................................................................... 9
Improving predictive capacity for the Arctic region ................................................................................... 13
Summary .................................................................................................................................................... 14
AMAP
Arctic Monitoring and Assessment Programme
Oslo 2009
ii
Citation: AMAP, 2009. AMAP 2009 Update on Selected Climate Issues of Concern. Arctic Monitoring and Assessment Programme, Oslo. v+15pp
ISBN 978-82-7971-049-3
© Arctic Monitoring and Assessment Programme, 2009
Published by
Arctic Monitoring and Assessment Programme (AMAP), P.O. Box 8100 Dep., N-0032 Oslo, Norway (www.amap.no)
Ordering
AMAP Secretariat, P.O. Box 8100 Dep, N-0032 Oslo, Norway (amap@amap.no)
This report is also published as electronic documents, available from the AMAP website at www.amap.no
AMAP Working Group:
John Calder (Chair, USA), Per Dřvle (Vice-chair, Norway), Yuri Tsaturov (Vice-chair, Russia), Russel Shearer (Canada), Henrik Larsen (Den-
mark), Morten Olsen (Denmark), Outi Mähönen (Finland), Helgi Jensson (Iceland), Yngve Brodin (Sweden), Jonas Rodhe (Sweden), Tom
Armstrong (USA).
AMAP Secretariat:
Lars-Otto Reiersen, Simon Wilson, Yuri Sychev, Inger Utne.
ACKNOWLEDGEMENTS
Author:
Henry P. Huntington (Huntington Consulting, hph@alaska.net).
Contributing experts:
B. Ĺdlandsvik
T.V. Callaghan
T.J. Garrett
T. Jorgenson
A. Massling
J. Pulliainen
L-L. Sřrensen
A. Ahlstrřm
P. Canadell
A. Genrikh
M. Kahnert
S.D. Mathiesen
P.K. Quinn
H. Sřrgaard
O. Alexandrova
L. Chen
B. Goodison
E. Källén
J. Mathis
V. Rachold
A. Stohl
M. Ananicheva
J. Christensen
V. Gordeev
E. Kasischke
J. McClelland
J. Rackley
R. Striegl
L. Anderson
J.H. Christensen
J. Grebmeier
A. Klepikov
J. McConnell
S.H. Ramberg
J. Strřm
L.G. Anderson
T.R. Christensen
M. Grigoriev
D. Koch
P.C. McCroy
D. Rasse
E. Sveinbjřrnsson
O.A. Anisimov
Ř. Christophersen L. Guo
J. Kohler
A.D. McGuire
L-O. Reiersen
M.P. Tamstorf
D. Bancroft
K. Crane
J. Haapala
O. Krankina
R.J. Minjares
J. Reist
H. Třmmervik
N. Bates
D. Dahl-Jensen
J.O. Hagen
D. Kruger
U. Molau
O. Rogne
H. Toresen
T.S. Bates
S. Dallimore
N.T.M. Hamilton K. Kupiainen
P. Murdoch
N. Roulet
D. Verseghy
I. Bauer
B.J. DeAngelo
E. Hanna
N. Larsen
S. Naidu
N.R. Sćlthun
V. Vestreng
E. Baum
E. Dlugokencky
B. Hansen
T. Laurila
O.J. Nielsen
F. Schmidt
J.O. Vik
R. Bellerby
R. Döscher
B.U. Hansen
D. Lawrence
S. Nilsson
M. Sejr
C. Vorosmarty
R.E. Benstad
H. Drange
G.H. Hansen
R. Leaitch
O.A. Nřst
I.P. Semiletov
J.E. Walsh
T.K. Berntsen
K. Drinkwater
I. Hanssen-Bauer
H. Lihavainen
W.C. Oechel
N. Shakhova
K. Walter
J. Bluestein
T. Engen-Skaugen H.R. Harvey
J. Liski
J-B. Řrbćk
I. Shiklomanov
P. Wassmann
S. Bodin
C. Eskjeberg
D.J. Hayes
H. Loeng
H. Óskarsson
D. Shindell
S.J. Wilson
C.E. Břggild
A.M. Fiore
M. Heimann
T.D. Lorenson
J.E. Overland
A. Shvidenko
C. Witherspoon
T. Bond
M. Flanner
G.K. Hovelsrud
M.T. Lund
J. Pawlak
H-R. Skjoldal
Z. Yang
L.W. Brigham
M. Forchammer
R. Huth
C. Lund Myhre
L.T. Pedersen
H.I. Browman
E. Fřrland
L. Illeris
R.W. Macdonald
A. Proshutinsky
H. Skov
N. Ye. Chubarova
J.F. Burkhart
N.H.F. French
M. Johansson
J. Madsen
T. Prowse
J. Smol
Q. Zhuang
J. Calder
C. Furgal
T. Jorgenson
M. Manizza
S.C. Pryor
Á. Snorrason
S. Zimov
Indigenous peoples' organizations, AMAP observing countries, and international organizations:
Aleut International Association (AIA), Arctic Athabaskan Council (AAC), Gwitch'in Council International (GCI), Inuit Circumpolar
Conference (ICC), Russian Association of Indigenous Peoples of the North (RAIPON), Saami Council.
France, Germany, Netherlands, Poland, Spain, United Kingdom.
Arctic Circumpolar Route (ACR), Association of World Reindeer Herders (AWRH), Circumpolar Conservation Union (CCU), European Envi-
ronment Agency (EEA), International Arctic Science Committee (IASC), International Arctic Social Sciences Association (IASSA), International
Atomic Energy Agency (IAEA), International Council for the Exploration of the Sea (ICES), International Federation of Red Cross and Red
Crescent Societies (IFFCRCS), International Union for Circumpolar Health (IUCH), International Union for the Conservation of Nature (IUCN),
International Union of Radioecology (IUR), International Work Group for Indigenous Affairs (IWGIA), Nordic Council of Ministers (NCM),
Nordic Council of Parliamentarians (NCP), Nordic Environment Finance Corporation (NEFCO), North Atlantic Marine Mammal Commission
(NAMMCO), Northern Forum (NF), OECD Nuclear Energy Agency (OECD/NEA), OSPAR Commission (OSPAR), Standing Committee of
Parliamentarians of the Arctic (SCPAR), United Nations Development Programme (UNDP), United Nations Economic Commission for Europe
(UN ECE), United Nations Environment Programme (UNEP), University of the Arctic (UArctic), World Health Organization (WHO), World
Meteorological Organization (WMO), World Wide Fund for Nature (WWF).
Graphical production of AMAP 2009 Update on Selected Climate Issues of Concern
Lay-out and technical production:
John Bellamy (johnbellamy@swipnet.se).
Design and production of computer graphics:
Simon Wilson and John Bellamy.
Cover design:
John Bellamy.
Printing and binding:
Narayana Press, Gylling, DK-8300 Odder, Denmark (www.narayanapress.dk); a Swan-labelled printing company, 541 562.
Copyright holders and suppliers of photographic material reproduced in this volume are listed on page 15.
iii
Preface
The Arctic Monitoring and Assessment Programme (AMAP) is a
well as workshops conducted under AMAP's auspices. Main source
Working Group of the Arctic Council. The Arctic Council Ministers
documents are listed on page 15. The report has been reviewed by
have requested AMAP to:
the authors of the scientific reports, by the members of the AMAP
· produce integrated assessment reports on the status and trends of
Working Group, and through national review processes in each Arc-
the conditions of the Arctic ecosystems, including humans;
tic country to ensure that the summary is an accurate representation
of the scientific background documentation.
· identify possible causes for the changing conditions;
A large number of experts from the Arctic countries (Canada,
· detect emerging problems, their possible causes, and the potential
Denmark/Greenland/Faroe Islands, Finland, Iceland, Norway, Russia,
risk to Arctic ecosystems including indigenous peoples and other
Sweden, and the United States), from indigenous peoples organiza-
Arctic residents; and to
tions, from other organizations, and countries with an interest in Arc-
· recommend actions required to reduce risks to Arctic ecosystems.
tic monitoring, have participated in the work presented in this report.
AMAP would like to express its appreciation to all of these
AMAP assessments are generally delivered to Ministers at ap-
experts, who have contributed their time, effort, and data. A list of
propriate intervals in the form of `State of the Arctic Environment
the main contributors is included in the acknowledgements on the
Reports' on pollution and climate related issues. However, on occa-
previous page of this report. The list is based on identified individual
sion, the AMAP, WG consider it appropriate to inform Ministers
contributors to the AMAP scientific assessments, and is not compre-
about some of the results of ongoing work before it is fully incor-
hensive. Specifically, it does not include the many national institutes,
porated in a comprehensive assessment report, for example, where
laboratories and organizations, and their staff, which have been
such information may be relevant to policy-related discussions that
involved in the various countries. Apologies, and no lesser thanks,
are currently ongoing within the Arctic countries. AMAP convey
are given to any individuals unintentionally omitted from the list.
this information to the Arctic Council Ministers in interim `Update
Special thanks are due to the lead authors responsible for the
Reports on Issues of Concern'.
preparation of the scientific assessments that provide the basis for
The `AMAP 2009 Update on Selected Climate Issues of Concern'
this report. Special thanks are also due to the author of this report,
is intended to be readable and readily comprehensible report. It
Henry Huntington. The author worked in close cooperation with
summarizes recent observations of changing climate parameters, a
the scientific experts and the AMAP Secretariat to accomplish the
review of the significance of short-lived climate forcers and prospects
difficult task of distil ing the essential messages from a wealth of
for their mitigation, a new evaluation of the Arctic carbon cycle, and
complex scientific information, and communicating this in an easily
new initiatives to improve understanding of the cryosphere and the
understandable way.
ability to model climate changes and impacts at the regional scale.
The support of the Arctic countries is vital to the success of
The report does not contain extensive background data or references
AMAP. AMAP monitoring work is essentially based on ongoing
to the scientific literature. The complete and fully-referenced scien-
activities within the Arctic countries, and the countries also provide
tific documentation, including sources for all figures reproduced in
the necessary support for most of the experts involved in the prepa-
the report, is contained in accessible scientific background reports
ration of the assessments, including the participation of indigenous
and papers published in the scientific literature.
peoples organizations in the work of AMAP. AMAP would in
AMAP `Update Reports on Issues of Concern' are based on the same
particular like to acknowledge the contributions of Norway and the
type of rigorous scientific background assessment process, as that
United States that acted as the (co-)lead countries for several of the
which forms the basis for the `State of the Arctic Environment Reports'.
work components presented in this report.
Therefore, whereas the climate information presented in this report
The AMAP Working Group, who are responsible for the deliv-
is not the result of a comprehensive assessment of Arctic climate
ery and content of this `Update Report on Selected Climate Issues',
change issues, it does provide an update on some of the work that has
are pleased to present this report for the consideration by govern-
been undertaken by AMAP as follow-up of the 2004 `Arctic Climate
ments of the Arctic countries. This report is prepared in English,
Impact Assessment'. It draws upon peer-reviewed publications as
which constitutes the official version.
Tromsř, April 2009
John Calder
Lars-Otto Reiersen
AMAP Chair
AMAP Executive Secretary
iv
v
Executive Summary
1. The Arctic Climate Impact Assessment and the Intergovernmental
bon dioxide being released to the air but also more being absorbed
Panel on Climate Change have established the importance of
in the ocean and by growing plants on land and in the ocean. The
climate change in the Arctic both regionally and globally. Following
change in net releases of carbon dioxide and methane is difficult to
those reports, emphasis has been placed on continued observations,
predict. It appears unlikely, however, that changes in the Arctic car-
a new assessment of the Arctic carbon cycle, the role of short lived
bon cycle will have more than a modest influence on global climate
climate forcers in the Arctic, and the need for improved predictive
over the next 50-100 years, but large uncertainties exist.
capacity at the regional level in the Arctic.
5. Global climate models are limited in their ability to provide reliable,
2. The Arctic continues to warm. Since publication of the Arctic
regional-scale projections of various climate parameters. Current
Climate Impact Assessment in 2005, several indicators show
and planned projects and programs aim to improve understand-
further and extensive climate change at rates faster than previously
ing of regional processes, the role of short lived climate forcers, and
anticipated. Air temperatures are increasing in the Arctic. Sea ice
local impacts of climate change. Improved regional-scale models
extent has decreased sharply, with a record low in 2007 and ice-free
and projections will help bridge the gap between global studies and
conditions in both the Northeast and Northwest sea passages for
models and local impacts and changes in the Arctic, and improve
first time in recorded history in 2008. As ice that persists for several
evaluation of adaptive and mitigative actions, particularly concern-
years (multi-year ice) is replaced by newly formed (first-year) ice, the
ing local impacts and the likely benefits of reducing emissions of
Arctic sea-ice is becoming increasingly vulnerable to melting. Sur-
short-lived climate forcers.
face waters in the Arctic Ocean are warming. Permafrost is warming
and, at its margins, thawing. Snow cover in the Northern Hemi-
Recommendations on monitoring:
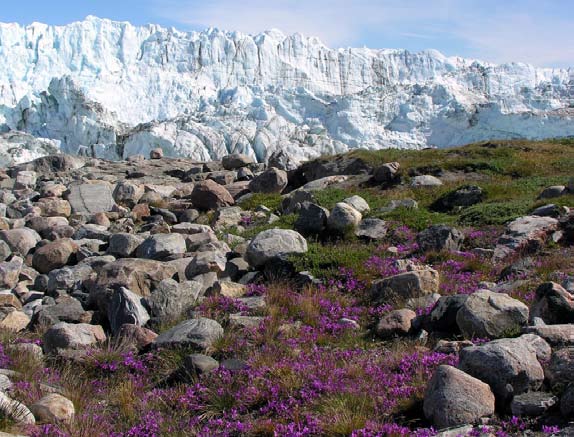
sphere is decreasing by 1-2% per year. Glaciers are shrinking and
· Sustainandenhancethecurrentlevelofmonitoringof
the melt area of the Greenland Ice Cap is increasing. The treeline is
climatechange,updatinginformationonkeyaspectsofthe
moving northwards in some areas up to 3-10 meters per year, and
Arcticclimatesystem(2)
there is increased shrub growth north of the treeline.
· Enhanceandexpandnetworksofmonitoringandobserva-
3. Reductions in emissions of CO to the atmosphere constitute the
2
tionpointsforshort-livedclimateforcers,buildingonexisting
backbone of any meaningful effort to mitigate global climate warm-
networks,suchastheWMOGlobalAtmosphereWatch
ing. Black carbon, tropospheric ozone, and methane may, however,
Programme(3)
contribute to Arctic warming to a degree comparable to the impacts
· Initiateandmaintaincircumpolarmeasurementsofcarbon
of carbon dioxide, though there is still considerable uncertainty
fluxeswithintheArcticandimportstoandexportsfromthe
regarding the magnitude of their effects. Black carbon and ozone, in
Arctic(4)
particular, have a strong seasonal pattern that makes their impacts
particularly important in the Arctic, especially during the spring
· Integrateandexpandmonitoringeffortstoenhanceun-
melt. These climate forcers are also relatively short-lived and have
derstandingofcause-effectrelationshipsandtemporaland
the potential for relatively rapid reductions in emissions and thus in
spatialvariabilitydrivingregionalscaleclimate(5)
atmospheric levels. There are various options for emissions reduc-
Recommendations for studies to address gaps in knowledge:
tions that can be taken in northern regions and globally. Improving
quantitative estimates of the potential benefits of reducing emissions
· Conductstudiesonnon-carbondioxideclimateforcersto
of short-lived climate forcers requires improved climate modelling
improveunderstandingoftheirroleinArcticclimateand
capability.
develop recommendations for national and international fol-
4. The Arctic carbon cycle is an important factor in the global climate
lowupaction(3)
system. Considerable quantities of carbon, much of it in the form
· ConductstudiesontheArcticcarboncycletoidentifykeysensi-
of methane are stored in the Arctic. Should these be released to the
tivitiesandmajorfeedbackstoregionalandglobalclimate(4)
atmosphere, they will increase greenhouse gas concentrations and
· Developreliableregional-scaleclimatemodelstosupport
thus drive further climate change (an example of positive feedback).
assessmentofimpactsandevaluationoftheeffectivenessof
At present, the Arctic appears to be a sink for carbon dioxide and a
adaptiveandmitigativeactions(5)
source for methane. Climate change is likely to result in more car-


1
Introduction
of the ACIA and acknowledged the importance of
the Arctic within the global climate system. The
This report provides an update on selected topics
reduction of summer sea ice means more sunlight
concerning Arctic climate change, which remains a
is absorbed, leading to additional warming. The
major issue of concern. In 2004, the Arctic Monitor-
cycling of water and carbon with, to, and from the
ing and Assessment Programme (AMAP), together
Arctic also has the potential for substantial regional
with the program for the Conservation of Arctic
and global impacts. Observations since the ACIA
Flora and Fauna (CAFF), and the International Arc-
was published show that climate-driven changes are
tic Science Committee (IASC) produced the Arctic
occurring even faster than were anticipated in that
Climate Impact Assessment1 (ACIA). The comprehen-
Assessment. This report summarizes recent observa-
sive ACIA built on a chapter in the earlier AMAP
tions of changing climate parameters, a review of
Assessment Report: Arctic Pollution Issues, published
the significance of short-lived climate forcers and
in 19982, and its accompanying plain-language
prospects for their mitigation, a new evaluation
summary, Arctic Pollution Issues: A State of the Arctic
of the Arctic carbon cycle, and new initiatives to
Environment Report3, released the year before. AMAP
improve understanding of the cryosphere and the
is currently conducting a more thorough update on
ability to model climate changes and impacts at the
certain aspects of Arctic climate change (Changes in
regional scale.
the Cryosphere: Snow, Water, Ice, and Permafrost in
the Arctic) for delivery in 2011. This new study will
Arctic Report Cards
incorporate results of the International Polar Year.
A preliminary report on the Greenland Ice Sheet
To track changes in Arctic environment, the U.S.
component of this study will be presented in the fall
National Oceanic and Atmospheric Administration
of 2009 as an Arctic Council contribution to the
(NOAA) produced a report titled State of the Arctic:
UNFCCC COP15.
October2006.5 Since then, AMAP and CAFF have
The Arctic Report
The climate information presented in this report
contributed to subsequent annual "report cards" on
Cards website provides an
is, therefore not the result of a comprehensive as-
the Arctic. This section provides a summary of what
annually-updated summary
sessment of Arctic climate change issues, but rather
has changed, based on the three reports issued as of
of the changing state of the
is an update on some of the work that has been
April 2009.
Arctic environment.
undertaken by AMAP as follow-up of the Arctic
Climate Impact Assessment. The report draws upon
peer-reviewed publications as well as workshops
conducted under AMAP's auspices. From these
Arctic Report Card 2008
materials, this plain-language summary has been
Home
Atmosphere
Sea Ice
Ocean
Land
Greenland
Biology
written to capture the main messages and make
Atmosphere
Ocean
them accessible to general readers. The summary
Sea Ice
Greenland
There continues to be widespread and, in some cases, dramatic evidence of an
Biology
Land
overall warming of the Arctic system.
has been reviewed by the authors of the scientific
Warming (red) and mixed (yellow) signals
reports, by the members of the AMAP Working
Atmosphere
Ocean
Group, and through national review processes in
5° C temperature increases were
Observed increase in temperature of
recorded in autumn
surface and deep ocean layers
each Arctic country. These reviews have ensured
Sea Ice
Greenland
that the summary is an accurate representation of
Near-record minimum summer sea ice
Records set in both the duration and
extent
extent of summer surface melt
the scientific reports.
Biology
Land
The Arctic Climate Impact Assessment provided a
Fisheries and marine mammals
Permafrost temperatures tend to
impacted by loss of sea ice
increase, while snow extent tends to
decrease
comprehensive view of the topic through the early
2000s. The 2007 report of the Intergovernmental
About the Report Card
Printable Handout : Ful Arctic Report Card (PDF)
Panel on Climate Change4 affirmed the findings
NOAA Arctic Theme Page
1ACIA, 2004. Impacts of a Warming Arctic. Arctic Climate Impact Assessment. Cambridge University Press. 139 pp.
2AMAP, 1998. AMAP Assessment Report: Arctic Pollution Issues. Arctic Monitoring and Assessment Programme, Oslo. xii+859 pp.
3AMAP, 1997. Arctic Pollution Issues: A State of the Arctic Environment Report. Arctic Monitoring and Assessment Programme, Oslo. 188 pp.
4IPCC, 2007. Climate Change 2007: Synthesis Report. Fourth Assessment Report of the Intergovernmental Panel on Climate Change. IPCC, Geneva, Switzerland, 104 pp.
5NOAA, 2006. State of the Arctic: October 2006. NOAA OAR Special Report, NOAA/OAR/PMEL, Seattle, WA. 36 pp. (www.arctic.noaa.gov/reportcard/).
2
Change in annual aver-
Air continues to warm, and atmospheric
Arctic Oscillation index, winter time
age Arctic surface tempera-
circulation is highly variable
Surface air temperature anomaly (60-90 N), C
3
ture relative to 1961-1990
Surface temperatures around the Arctic have continued
average, based on land
2.5
to be higher than the 20th century average. The year
station observations (purple
2
Surface air
Arctic Oscillation index
line). The Arctic Oscillation
2007 was the warmest on record, continuing a trend
1.5
temperature anomaly
index reflects natural vari-
that began in the 1960s. In contrast to a previous
ability that cause conditions
warming phase in the 1930s, the current warming
1
to vary on an approximately
covers the entire Arctic and extends south to the mid-
0.5
10-year cycle; however, re-
latitudes. A recent exception is the Bering Sea region,
0
cent years appear to diverge
which experienced below-average temperatures in the
from this natural cycle.
-0.5
winters of 2006 and 2007. As a result, winter ice extent
returned to its long-term average, although summer ice
-1
retreated far to the north in 2007 and 2008.
-1.5
Atmospheric circulation in the Arctic typically
-2
oscillates between two general patterns. This phenom-
-2.5
enon is known as the Arctic Oscillation (AO), and is
-3
similar to (and connected with) the El Nińo/La Nińa
1900
1920
1940
1960
1980
2000
switch in the southern Pacific. The Arctic Oscillation
is measured against an index, with positive values
patterns in temperatures and barometric pressure,
indicating one dominant pattern and negative values
however, differ from the characteristic patterns seen
indicating the other. A negative AO index means
during the 20th century under positive and negative
weaker winds, lower winter temperatures, and more
AO values. These changes may reflect alterations in
sea ice. A positive AO means the opposite. The oscil-
atmospheric circulation patterns in the Arctic.
lation between positive and negative AO values is the
Maps of the difference in
main source of climate variability in the Arctic.
Summer sea ice has decreased dramatically
January-May surface tem-
From the mid-1980s to the mid-1990s, the AO
perature in 2007 and 2008
The most striking change in the Arctic in recent years
was strongly positive, consistent with rising tempera-
relative to the long-term
was the great reduction in summer sea ice extent in
average show that although
tures and reduced sea ice. From the mid-1990s to
2007. In March of that year, the sea ice had covered
the Arctic as a whole is
about 2006, the AO moved between weakly positive
nearly all of its long-term average extent. By Septem-
warming, the pattern of the
and weakly negative values. In 2007 and 2008, the
ber, however, sea ice covered only 4.3 million square
change is variable over time;
AO was again strongly positive, though not quite as
kilometers, 23% less than the previous record low
some areas exhibit cooling.
high as it had been in the 1980s and 1990s. Recent
of 5.6 million square kilometers in 2005 and 39%
2007
2008
5
4
3
2
1
0C -1
-2
-3
-4
-5
3
Perennial sea ice extent, million km2
Sea ice extent, percent di erence from 1979-2007 average
September 2007
Ice cover at the time
8.0
20
of minimum ice extent
Trend
(September) is decreasing
5.6
10
more rapidly than that at the
5.4
Model
time of maximum ice extent
0
March
(March). September 2007
4.8
was the lowest ice extent on
4.4
record.
-10
4.0
-20
3.6
September
Observations
3.2
-30
Changes in Arctic sea
2.8
March 2008
ice extent from September
-40
2007 to March 2008 to
2.4 1957 1967 1977 1987 1997 2007
1978
1988
1998
2008
September 2008. The red
lines indicate the 1979-2000
average minimum (Septem-
lower than the 1979-2000 average. Most of the loss
ber) and maximum (March)
occurred in the Beaufort, Chukchi, and East Siberian
sea-ice extent. Despite the
Seas. In 2008, despite cooler weather in spring and
extreme summer minima
summer, the minimum sea ice extent was 4.7 million
in 2007 and 2008, the 2008
square kilometers, the second lowest ever recorded.
winter ice extent was near
For the first time in existing records, both the North-
the long-term average.
west and Northeast Passages were ice free.
Less obvious but still significant is the continued
September 2008
thinning of Arctic sea ice. Recent satellite data support
previous observations that sea ice at the end of the melt
season is thinner than it used to be, and that the trend
is continuing. One cause of this trend is the loss of
perennial ice, floes that last through at least one sum-
mer. Perennial sea ice extent has been decreasing since
at least 1957, and has been dropping even more sharply
in recent years. Thinner, younger ice is more susceptible
to rapid melting from warmer waters and air, increasing
the potential for more dramatic declines in ice extent.
Perennial sea ice extent, million km2
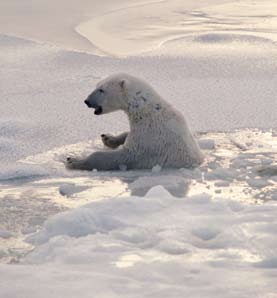
Sea ice extent, percent di erence from 1979-2007 averagePolar bear falls through
8.0
20
thin sea ice, Cape Churchill,
Canada
5.6
Trend
10
Model
In addition to chang-
5.4
ing ice extent, the thickness
March
4.8
0
of Arctic sea ice is decreas-
ing, as illustrated by time
4.4
-10
series showing the extent
4.0
of perennial ice ice thick
-20
enough to survive for more
3.6
September
than one Arctic ice season
Observations
in March. Even if winter
3.2
-30
y Alexander
ice extent remains near the
2.8
long-term average, thinner
-40
ice is more susceptible to
2.4 1957 1967 1977 1987 1997 2007 Bryan and Cherr
1978
1988
1998
rapid summer r
2008
etreat.
4
Arctic sea level at nine
Arctic Ocean surface waters are warming
Arctic Oscillation index
Sea level, cm
stations along the Russian
Consistent with the rapid retreat of sea ice in the
Sea level pressure, hpo
Arctic coastline in relation to
10
summer of 2007, the surface waters of the Arctic
the Arctic Oscil ation index
Ocean have been warming in recent years. In 2007,
Sea level
and sea level pressure and
some ice-free areas were as much as 5° C warmer
the North Pole. All indices
5
than the long-term average. Overall, Arctic waters
are shown as five-year run-
Sea level pressure at
the North Pole
ning averages.
appear to have warmed as a result of the influx of
0
warmer water from the Pacific and the Atlantic. In
Annual mean Arctic Oscillation
addition, the loss of sea ice means that more solar
index anomaly multiplied by 3
radiation is absorbed, heating surface layers further.
-5
The circulation of surface waters in the Arctic Ba-
1960
1970
1980
1990
2000
sin is driven by wind. Wind patterns reflect the state
of the Arctic Oscillation. In recent years, circulation
has been generally anticyclonic, as expected with a
Beaufort Gyre. Along the Eurasian coast, freshwater
weak AO index. One result is that freshwater tends
from rivers is a major influence, especially because
to accumulate in the Arctic Ocean, especially in the
river discharge has increased over the past century
at least. Recently the patterns of ocean circula-
tion have kept river water close to the coast rather
Mean summer surface
C
C
1982-2007
than spreading towards the central basin. In 2007,
temperature in the Arctic for
2.5
7
mean
2
the extensive melt of sea ice put vast quantities of
the period 1987-2007.
6
1.5
relatively fresh water into the surface layers of the
5
1
Arctic Ocean.
0.5
4
Sea level in the Arctic Ocean followed the Arctic
-0.5
Oscillation until about 1996, influenced primarily
Temperature anomalies
3
-1
by barometric pressure. After that, sea level contin-
in recent years. The blue
2
-1.5
ued to stay above the long-term average despite the
line indicates minimum sea
-2
1
ice extent. Note the high
switch of the AO from strongly positive to weak
-2.5
temperatures in 2007 in
0
and fluctuating. This suggests that other factors
the Chukchi Sea and the
-1
have come into play, such as ocean expansion from
extreme retreat of sea ice in
heating, increased freshwater content, or the effects
-2
that sector.
of wind.
2000
2001
2002
2003
C
C
2004
2005
2006
2007
2.5
7
2
6
1.5
5
1
0.5
4
-0.5
3
-1
2
-1.5
-2
1
-2.5
0
-1
-2

5
The terrestrial Arctic also shows signs
Mean phenological change (days/decade)
The timing of flowering
-40
-20
0
20
of change
Cassiope tetragona
of plants, emergence of
Plants Dryas sp.
Papaver radicatum
insects, and egg laying of
On land, several indicators show continued warm-
Salix arctica
Salixfraga oppositifolia
birds have been recorded
ing around the region. Permafrost, defined as
Silene acaulis
Acari*
at different locations In the
Arthropods
ground that has remained below the freezing point
Chironomidae
Coccoidea
Zackenberg valley (north-
Collembola*
for at least two consecutive summers, is warming.
Culicidae
east Greenland) since 1996.
Ichneumonidae
At its margins, permafrost is thawing. In northern
Linyphiidae*
On average, the timing of
Lycosidae
Alaska, temperatures at depths below seasonal influ-
Muscidae
these events has advanced
Nymphalidae
ence show a warming trend since at least the 1970s.
Phorideae
by 2 weeks during the last
Sciaridae
Dunlin
The trend has not been uniform, and indeed has had
Birds
decade, with the active
Sanderling
Ruddy turnstone
a few periods of cooling, but overall the tempera-
growing season extended
Earlier Later
tures have risen by 0.5°C to 2°C. In 2007, the trend
by one month.
turned upwards again.
The Zackenberg val ey,
Plants respond more quickly to changes in tem-
northeast Greenland.
perature. They grow more vigorously and densely
when the air is warmer. This response can be de-
tected from satellites by measuring the green-ness of
the landcover. Most of the Arctic, especially tundra
areas, showed increased plant growth over the period
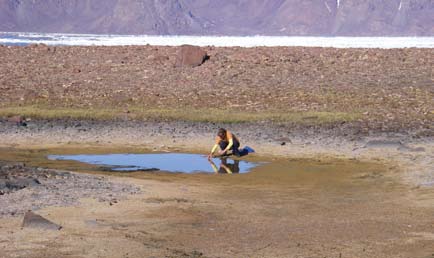
Sampling of Camp
from 1981 to 2005. Some areas, especially in the
Pond (El esmere Island,
boreal forest, have showed a slight decline. Over
Nunavut, Canada) on the
longer periods, warming has led to increased shrub
day before it completely
growth north of the treeline as well as a slow move-
dried. Drying out of small
ment of the treeline itself. In Russia, treeline has dis-
ponds on the tundra is one
placed tundra patches as quickly as 3-10 meters per
example of ecosystem shift
year. In Scandinavia and Canada, tree growth near
enning Thing
H
in the terrestrial Arctic.
treeline has become denser, with some indication of
slow movement into previously exposed areas.
Snow cover in the Northern Hemisphere appears
to be declining at about 1-2% per year, depending
on the method used to measure it. Because snow
reflects sunlight back into space, less snow is a
positive feedback to warming trends. In 2007, the
average snow cover was 24.0 million square kilom-
eters, which is 1.5 million square kilometers below
the 38-year average, and the third-lowest figure on
record.
Glaciers can be difficult to use as indicators of
change, in part because melt area is not as direct a
mol
measure of change as the change in mass of a glacier,
J
ohn S
but mass is more difficult to measure. Changes in
mass correspond to accumulation or loss of ice. Near-
Eurasian river discharge
North America river discharge
Runoff to the Arctic
ly all glaciers studied are decreasing in mass, resulting
km3/year
km3/year
Ocean from large rivers
in rising sea level as the water drains to the ocean.
2100
800
in Eurasia and North
Excluding Antarctica and Greenland, the rate of sea
2000
Eurasia
America show that runoff
level rise from glacial melt is estimated at 0.58 mil-
1900
700
from Eurasian rivers is
limeters per year from 1961 to 2005, with a higher
1800
increasing.
rate of 0.98 millimeters per year between 1993 and
1700
600
2005. The largest contributors to this rise are glaciers
1600
in Alaskaand other parts of the Arctic, and the high
1500
500
North America
mountains of Asia. By 2100, glacial melt may increase
1400
sea level by a further 0.1 to 0.25 meters.
1300
400
1935 1945 1955 1965 1975 1985 1995 2005


6
Duration of summer sur-
Greenland's ice sheet continues to melt
2007
face melt on Greenland in
The Greenland ice sheet is the largest in the north-
2007 relative to 1973-2000
ern hemisphere and has been studied extensively.
average.
The ice sheet has experienced summer temperatures
consistently above the long-term average since at
least the mid-1990s. Temperatures along the coast
have followed the same pattern, reversing an earlier
cooling trend in West Greenland from the 1960s to
the 1990s. In 2007, temperatures at various locations
were generally above average, though not for every
season of the year.
Melting on the ice sheet in 2007 was the most
extensive since record-keeping began in 1973. The area
experiencing melt was 60% larger than in 1998, the
year with the next largest area in the record. Melting
lasted on average 20 days longer than usual, up to 53
days longer than usual at elevations between 2000
Surface
and 3000 meters between the north and south domes
melt
of the ice sheet. The Jakobshavn Isbrae, Greenland's
duration
anomaly, days
largest glacier, continued the rapid retreat begun in
2001. The Tissarissoq bay on the south side of the fjord
50
became ice free in 2007, probably for the first time in
40
centuries and perhaps longer. Other outlet glaciers in
30
southern Greenland, such as the Kangerlussuaq Glacier
20
and the Helheim Glacier, show the same pattern.
10
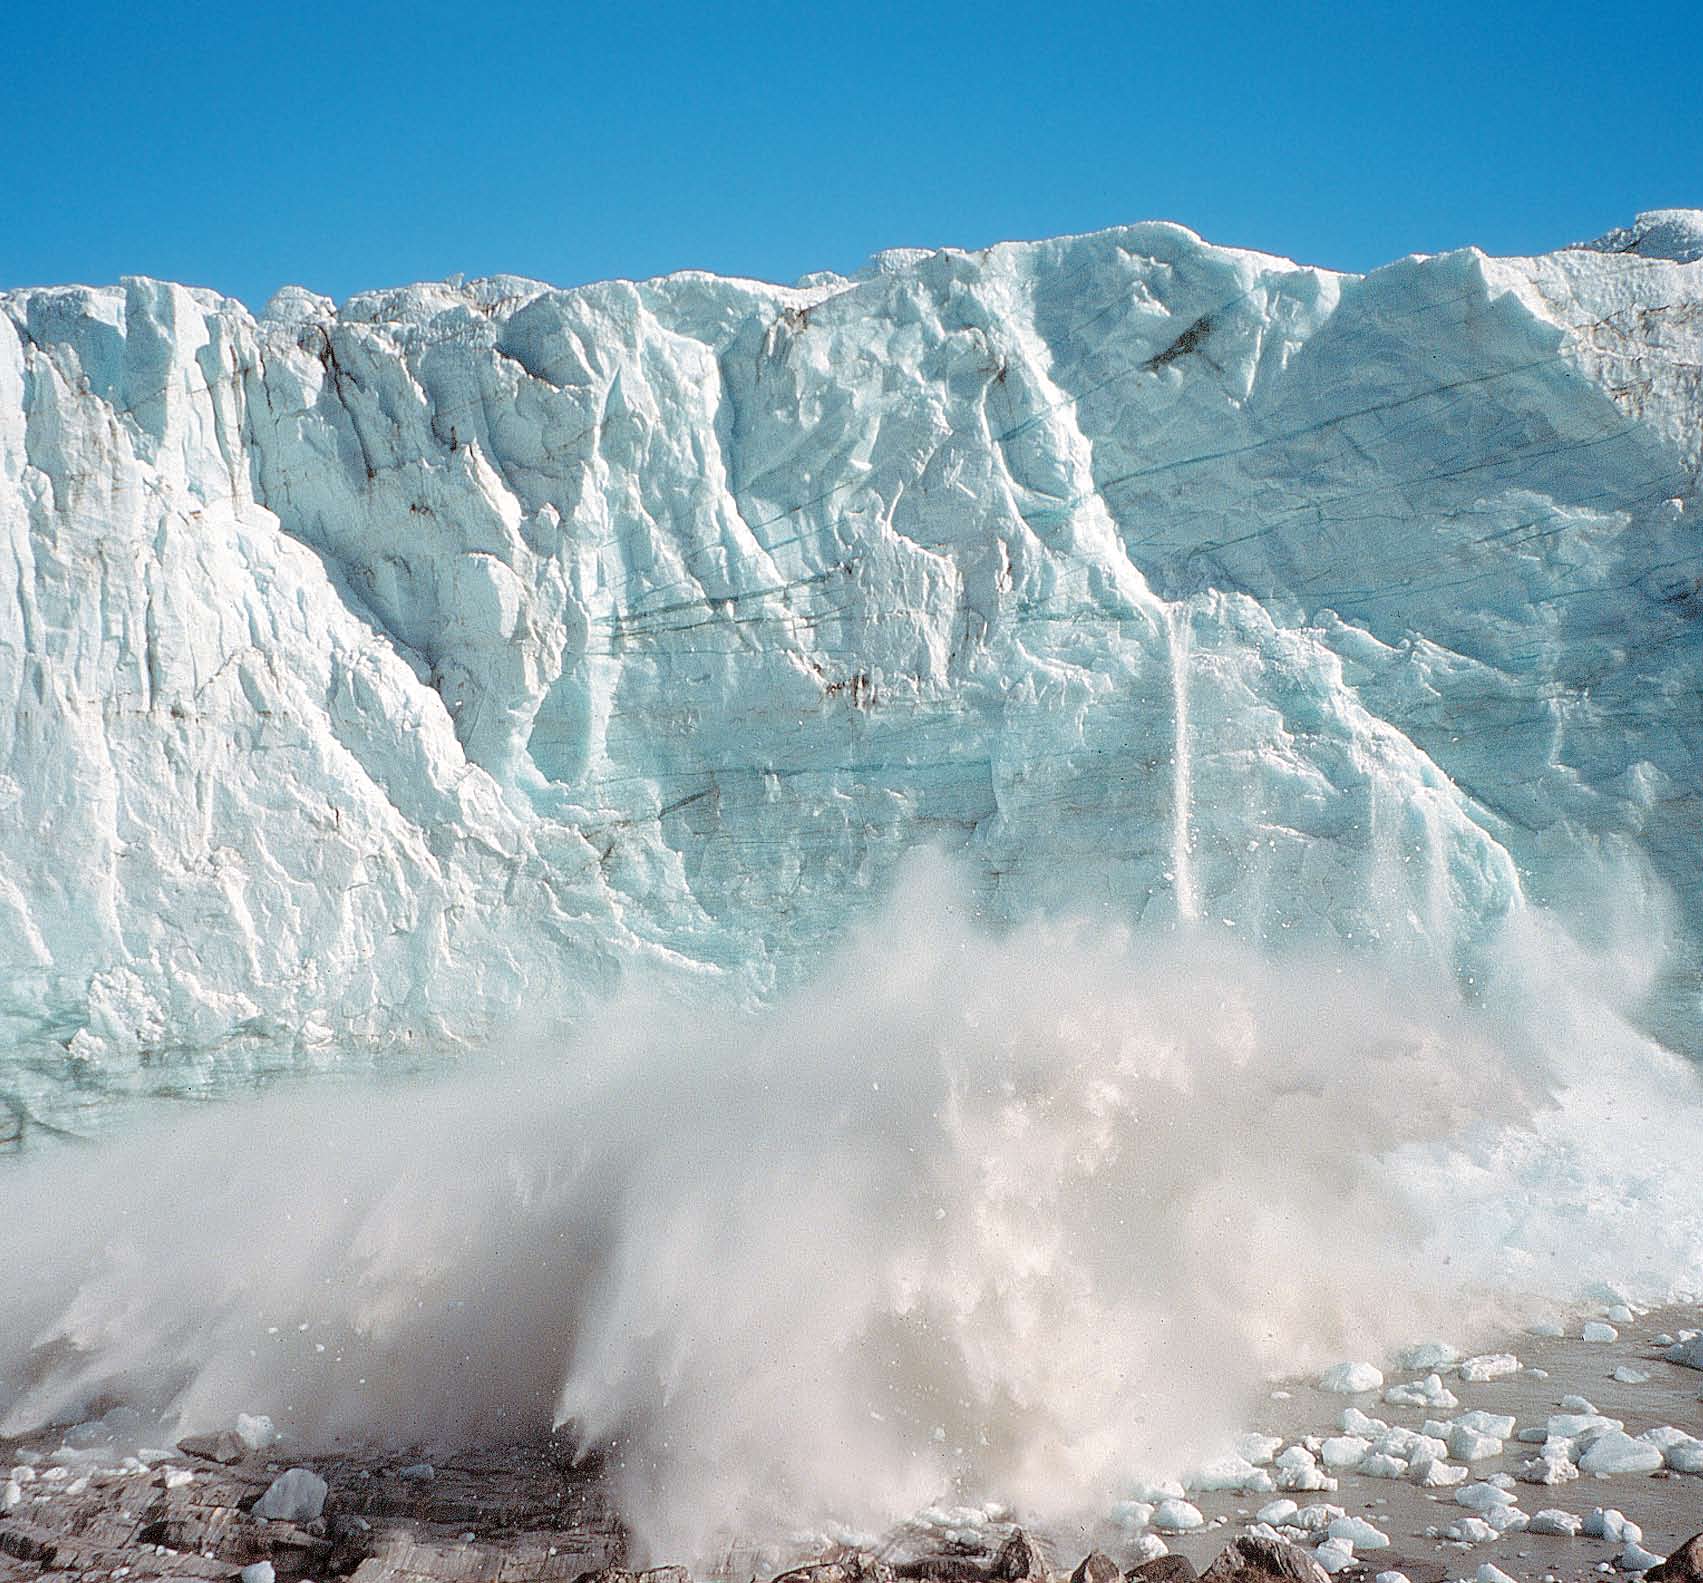
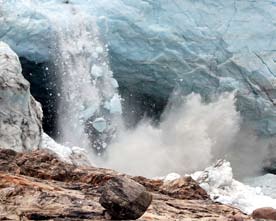
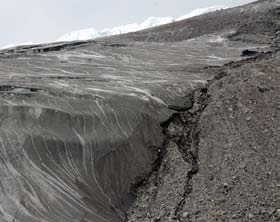
Ice breaks off the Russell
Glacier east of Kangerlus-
suaq, Greenland.
Extensive summer
melting at the edge of
the Greenland Ice Sheet
northeast of Kangerlussuaq,
Greenland.
enning Thing
enning Thing
H
H
The Ilulissat glacier
(Jakobshavn Isbrae)
continues to retreat.
1931
2003
Ilulissat
1942
1953
1964
1879
2001
1883
1929
1850
2003
2007
2004
2006
1913
1875
1880 1893
1902
Tissarissoq

7
Short-lived Climate Forcers
Temperature increase, OC
Short-lived climate forc-
1.6
Global average
Arctic average
ers such as black carbon,
Carbon dioxide (CO ) is the main driver of global
2
methane and ozone may
climate change, but black carbon (or soot), ozone,
1.4
have warming effects similar
and methane may have a combined effect comparable
Carbon dioxide
in magnitude to the long-
1.2
to those of carbon dioxide, both in the Arctic and
lived greenhouse gases
globally. While there is still considerable uncertainty
such as CO . Estimates of the
1.0
2
regarding the magnitude of effects from these sub-
warming due to SLCFs are
stances, these forcers of climate change do not stay in
0.8
still very uncertain and need
Atmosphere
Black carbon
the atmosphere nearly as long as carbon dioxide, and
Snow
to be further refined.
0.6
thus will respond more quickly in the short-term to
reductions in emissions. Part of the powerful Arctic
0.4
Methane
impact of these short-lived forcers comes from their
0.2
Ozone
seasonal nature, with the strongest impacts coming
from late winter to mid-summer. Therefore, while re-
0.0
ductions in carbon dioxide emissions remain essential
CO
Short-lived
CO
Short-lived
2
2
forcers
forcers
for long-term global (and Arctic) climate stabiliza-
tion, reducing emissions of short-lived climate forcers
the region is deposited onto ice and snow, resulting in
has the potential to slow warming in the near-term.
a darkening of the surface. Since dark surfaces absorb
By delaying the onset of spring melt, for example,
more solar radiation, this enhances melting. Recent
reductions in short-lived climate forcers could slow
extensive modeling indicates that the majority of the
Arctic warming and ice melt and `buy time' while
black carbon deposited in this manner comes from
the longer-term benefits of carbon dioxide reductions
northern latitudes. In Greenland, up to 80% of black
take effect. Each forcer has unique characteristics im-
carbon is from such sources, divided equally between
portant to designing appropriate mitigation measures.
North America and Europe. On Arctic sea ice, the
Reductions would additionally benefit the health
figure is 70%, with a greater proportion coming from
of Arctic residents and, indeed, people around the
Europe and perhaps northern Asia.
world, providing another reason for prompt action.
Further sampling of snow and ice in the Arctic will
Black carbon, methane, and ozone may be
help validate these modeling results. Because deposi-
tion in late winter and spring has the greatest impact
substantial contributors to Arctic warming
on the spring melt, seasonal reductions in emissions,
Black carbon consists of small, dark particles emitted
such as reductions in springtime burning in agricul-
into the atmosphere from inefficient burning, such as
tural areas, will be particularly important.
wood stoves and diesel engines. It warms the Arctic
Ozone, which is important in the stratosphere for
in two ways. First, a haze layer of dark particles in the
protecting the Earth from ultraviolet light, also occurs
atmosphere absorbs sunlight, which contributes to
in the lower atmosphere or troposphere. It is formed by Polar ice reflects light
overall global warming including that occurring in the
chemical reactions between various pollutants, includ-
from the sun back to space
Arctic. Most of the black carbon that reaches the Arctic
ing carbon monoxide, nitrogen oxides, and organic
(a). Darker, soot-covered ice
is emitted from sources in the northern mid-latitudes.
compounds such as methane. In the troposphere,
reflects less light and, thus,
Second, some of the airborne black carbon that reaches
ozone is a harmful pollutant and a greenhouse gas.
enhances warming (b).
a
b
8
Seasonal scenario of radiation, sources, and transport within the Arctic
Winter/Early Spring
Spring
Late Spring/Summer
Solar radiation is limited so that the Solar radiation becomes available
Solar radiation is at a maximum
radiation balance is driven primarily
for photochemical production of
by thermal fluxes
ozone and aerosols
Surface melt begins
Also the time of the year when
Transport of pollutants from mid-
Snow-albedo feedback maximizes
transport of pollutants from the
latitudes still efficient (Arctic Haze)
mid-latitudes is most efficient
More powerful greenhouse effect
(Arctic Haze)
Agricultural fires begin
due to warmer temperatures
Build-up of ozone and aerosol
Boreal forest fire season
precursors
Ozone, which is destroyed by sunlight, has a longer
will benefit the Arctic by decreasing global warming.
lifetime in the atmosphere during the winter, when it
In addition, reductions in methane emissions will
can last for months, than during the summer, when it
have a more immediate effect on global warming than
lasts for only few days or weeks. As a result, ozone and
reductions in longer-lived greenhouse gases.
the gasses it is formed from are transported efficiently
to the Arctic during the winter leading to warming
Mitigation efforts could provide benefits in the
during the spring melt season. Most tropospheric
short-term
ozone in the Arctic comes from North America.
A global analysis of the potential benefits of reducing
Methane is a greenhouse gas recognized under
emissions of short-lived forcers globally suggests that
the Kyoto Protocol. Its lifetime in the atmosphere, of
reductions in black carbon and methane emissions
about nine years, is relatively short when compared
have the most promise. The seasonal impacts of black
with longer-lived greenhouse gasses such as carbon
carbon and ozone may provide an additional op-
dioxide. As a result, methane is well-mixed through-
portunity for rapid benefits from seasonal emissions
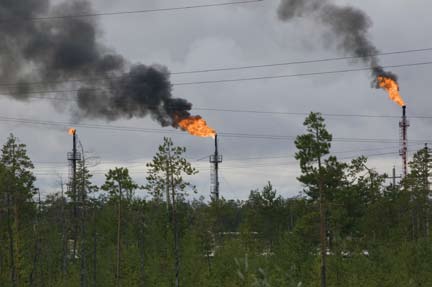
Gas flaring on the
out the world's atmosphere. Hence, reductions in
reductions. Improving the quantitative estimates of
Yamal, western Siberia.
methane anywhere in the world during any season
both the effects of short-lived climate forcers and the
potential benefits of reducing their emissions requires
improved climate modelling capability.
There are a number of options for reducing emis-
sions of these short-lived climate forcers. Those that
appear to have the most potential for early and effective
action include emissions controls on diesel engines
and oil and gas flaring, improvements in agricultural
practices such as reduced burning, and capturing or
eliminating methane emissions from major industrial
and waste treatment sources. Additional measures
could be pursued over a number of years, such as
identifying major point sources of black carbon and
y Alexander
applying existing pollution-control technology, and
using pollution-control measures on vehicle engines to
B
r
yan and Cherr
reduce emissions of chemicals that produce ozone.
Global Warming Potential
Global Warming Potential is a scale for comparing the warming effects over time of different compounds or
substances released into the atmosphere, relative to carbon dioxide and weighted according to the length of
time they remain in the air. Reducing emissions of
short-lived but powerful forcers such as black carbon
Emissions in
20-year global
and methane will have rapid effects. For example,
2000, millions of
warming potential,
tonnes
CO equivalents
2
reducing black carbon emissions by one tonne is the
Black carbon
5
10 000
equivalent, over a twenty-year period, of reducing
carbon dioxide emissions by 2000 tonnes.
Methane
287
20 664
9
Overview of carbon
The Arctic Carbon Cycle
Atmosphere
transfer between land, sea,
The Arctic has been warming rapidly in the past few
and air. A detailed diagram
decades. A key question is how that warming will
Carbon
Carbon
Methane
Methane
with estimated quantities
dioxide
dioxide
affect the cycling of carbon in the Arctic system. At
Dissolved
Dissolved
appears on the following
present, the Arctic is a global sink for carbon. If that
organic
inorganic
carbon
carbon
page.
Arctic Land
Arctic Ocean
changes, and the Arctic becomes a source of carbon,
Carbon Stocks Particulate Particulate Carbon Carbon Stocks
the feedback to global climate has the potential to en-
organic
inorganic
dioxide
carbon
carbon
hance warming. This section discusses what is known
Paci c/Atlantic
about the sensitivity of carbon cycling in the Arctic
Ocean Exchange
and what still needs to be understood.
Dissolved Dissolved Carbon
organic inorganic dioxide
carbon
carbon
Vast amounts of carbon are stored in the Arctic
For the purposes of this carbon cycle analysis, the
Rivers are responsible for most of the direct
Arctic has been defined as the Arctic Ocean plus the
transport of carbon from land to ocean. In the Arctic,
lands that drain into the Arctic Ocean and its marginal
this is especially important because rivers contribute
seas, as well as lands that have permafrost, except for
a much larger amount of water relative to the size of
high-elevation areas farther south such as the Tibetan
the ocean than is true elsewhere. The Arctic Ocean
Plateau; see map below.
holds only one percent of the world's ocean water, but
This area includes about one quarter of the world's
receives about a tenth of the world's river runoff and
land where plants grow. In the low temperatures of
about a tenth of the dissolved organic carbon carried
the Arctic, much plant matter does not decompose.
from land to sea worldwide. Peatlands in the Arctic
Instead, it accumulates in thick, carbon-rich soil layers.
provide particularly large amounts of carbon into
Thus, the land area considered here contains about
river systems and thus the ocean. Coastal erosion, too,
one third of the carbon held in the world's terrestrial
is a major source of carbon to the ocean.
ecosystems. Furthermore, it holds 40% of the carbon in
In addition to the usual sources of carbon, pri-
near-surface soils worldwide. The exchange of carbon
marily from plant matter, the Arctic appears to have
dioxide and methane between land and air varies greatly
huge quantities of methane hydrates. These are ice-
with place and time, as discussed in more detail later.
like crystals in which water molecules form cages that
Oceans contain carbon in various forms. Dis-
each holds one methane molecule. Methane hydrates
solved organic carbon comes from decaying biological
are stable in cold conditions and under high pres-
material. Dissolved inorganic carbon includes carbon
sure, and thus are found in permafrost on land and
dioxide and other simple molecules and ions contain-
continental shelves and also beneath the sediments
ing carbon. Both organic and inorganic carbon are
of the Arctic Basin. As hydrates warm or as pressure
also present in particulates. Of these forms, dissolved
is reduced, the methane is released. The amount of
inorganic carbon is the most common, and also has
methane hydrate present is not well known, but some
the least seasonal variation. The other forms cycle
global estimates suggest it may rival the amounts of
throughout the year in response to biological activity.
all known sources of gas and oil.
Sediments also contain carbon, deposited over time as
various materials settle to the sea floor.
Arctic Carbon Stocks
Location
Amount, billions of tones
Arctic Ocean
Land
Soil
1400-1850
Permafrost
Living plants
60-70
Ocean
Water column
Arctic Ocean
Dissolved inorganic
catchment
carbon
310
Dissolved organic
carbon
9
Sediments
9.4
Methane Hydrates
Ocean
30-170
The region considered
Land
2-65
in the Arctic carbon cycle
Total
~1820-2485
analysis.
10
of carbon taken up by plants and also the amount
Atmosphere
released by decomposition. On the whole, dry tundra
Surface sink
Surface source
15 - 50
systems appear to be sources of carbon, but wet tundra
400 +/- 400
and boreal forest are sinks. Combining various studies
Adjacent ocean
and estimates for the terrestrial Arctic, it appears that
exchange
300-600
land areas are a sink for approximately 300-600 million
24-100
31-100
21-30
1-12
~ 33
tonnes per year. This amount is 30-60% of the global
0.02 - 0.08~ 1100
40-84
~ 43
estimate for the net sink of carbon on land. Growth of
0.001 - 0.11
~ 6
trees in the boreal forest appears responsible for most of
Rivers
Arctic land stocks
Sea ice
0-4
the sink activity in the Arctic.
Vegetation: 60000-70000
Soil: 1400000-1850000
Lakes and rivers are a source of carbon to the atmos-
~ 8
Erosion
phere. They also carry carbon to the ocean, as noted
earlier. Few measurements of carbon flow have been
Arctic Ocean stocks
Subterranean intra- /
made in Arctic lakes. In the absence of specific data
sub-permafrost
310000
9000
0 - 3
3000-130000
from the region, global estimates can be scaled down.
Sediment
Flux to sediment
The Arctic holds 36% of the world's lake surface area
9000
~ 9
and accounts for 10% of global river discharge to the
Flux to sediment
ocean. Taking the same proportions of estimates of
~ 2
global freshwater carbon releases gives an estimate for
Arctic Continental
the Arctic of 25-54 million tonnes of carbon from lakes
Slope permafrost
Arctic Ocean oor
2000-65000
each year and 15-30 million tonnes from rivers.
30000-170000
Although the Arctic Ocean is relatively small, its
marginal seas in particular are highly productive and
Carbon dioxide (CO )
Methane (CH )
Methane hydrate
Carbon
2
4
thus take up considerable amounts of carbon during
Dissolved organic carbon (DOC)
Dissolved inorganic carbon (DIC)
Particulate organic carbon (POC)
Particulate inorganic carbon (PIC)
the spring bloom. The Arctic is also where much of the
world's deep ocean water is formed, as surface waters
descend to the depths, carrying carbon with them. Ice
Current state of the
At present, the Arctic is a sink for carbon dioxide
cover forms a barrier to ocean-atmosphere exchange,
Arctic Carbon Cycle showing
Measuring the flow of carbon throughout the entire
and changes in sea ice will affect the net carbon flow to
amounts of carbon stored
Arctic is not a simple task. One approach is to measure
or from the ocean. There are few direct measurements
in various environmental
atmospheric levels of carbon dioxide. Variations over
from the Arctic Ocean, and thus estimates of flow have
reservoirs (units: millions
of tonnes C, or millions of
time and space indicate the movement of carbon to or
high uncertainty. Nonetheless, seawater in the Arctic
tonnes CH for methane
from the atmosphere. This method provides little insight
appears to be a sink for 24-100 million tonnes of
4
and methane hydrate) and
into the reasons for changing carbon concentrations in
carbon per year. This accounts for 1-5% of the global
the net flux of compounds
the atmosphere. Another approach is to measure actual
estimate for ocean sink activity for carbon.
(units: mil ions of tonnes
flows of carbon dioxide and methane at local sites. These
Carbon is also carried from land to rivers, from
C per year, or mil ions of
data can be scaled up for an entire region, based on the
rivers to ocean, and from ocean to ocean. Much of
tonnes CH per year for
particular characteristics of local climate, vegetation, and
this carbon is in the form of dissolved and particulate
4
methane) that determine
so on. Although these extrapolations make a number
carbon. This transport is important for determining
the movement of carbon
of assumptions, they do provide information on the
where carbon may be emitted to the atmosphere or
between environmental
specific processes that govern carbon flow.
captured in sediments. There is considerable uncer-
compartments.
Atmospheric measurements indicate that the Arctic
tainty involved in most estimates of carbon transport,
is a modest sink for carbon, with about 400 million
but river transport, ocean currents, and coastal erosion
tonnes taken from the atmosphere in an average year.
appear responsible for the largest amounts.
This amount can vary greatly from year to year. While
different studies generally agree on the size of the sink,
...and a source for methane
they provide different estimates of uncertainty and
Methane is a different story. As with carbon dioxide, the
interannual variation. Changes in weather patterns and
flow of methane involves many factors. Methane also
variation in forest fire activities are major contributors
reacts with other molecules in the air. In sum, recent
to the differences among years.
atmospheric studies indicate that the Arctic is a source
Studies of carbon dioxide flows at specific sites also
for 15-50 million tonnes of methane each year, or 3-9%
indicate great variation from year to year. The details of
of the global total net emissions from land and sea. Site
the growing season have great influence on the amount
studies show a higher emission rate, of 31-100 million
11
Similarly, little information is available to assess
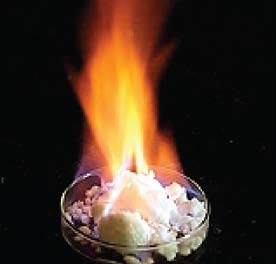
Large amounts of carbon
the flow of methane to or from the Arctic Ocean, but
are bound up in sub-surface
what data there are suggest a modest contribution as
methane hydrates. This `ice
a source. Much remains to be understood, however,
that burns' is now being con-
about the transport and reactions of methane in seawa-
sidered as a possible energy
ter in the Arctic.
source.
The response of the Arctic carbon cycle to global
climate change is far from clear
In the next decade or two, the boreal forest may con-
tinue to grow, absorbing more carbon as trees become
larger and treeline expands. On the other hand, forest
fires may increase in frequency and extent and insect
outbreaks may kill more trees, both of which would re-
tonnes per year, from land and freshwater sources com-
lease carbon to the atmosphere. Which trend dominates
bined. The role of small lakes in permafrost areas is great-
the other depends in part on precipitation. Dry condi-
er than previously thought. These lakes are surrounded
tions may reduce plant growth and lead to more fires. It
by carbon rich soils laid down in the last ice age, now
is also unclear whether increased carbon dioxide in the
being released as the water thaws the frozen soil.
atmosphere will stimulate plant growth.
Methane hydrates at present do not appear to con-
Over the next half century to a century, the north-
tribute much to Arctic emissions. Permafrost effectively
ward movement of deciduous forest types may reduce
seals off the ground below, though as permafrost warms
carbon storage in the boreal forest overall. Broadleaf
it becomes more permeable. Most of the emissions from
deciduous forests typically store less carbon than conif-
hydrates come from coastal and continental shelf areas
erous forests of the type that now dominate the boreal
where permafrost is warming, thawing, or eroding.
zone. Although shrubs are moving into tundra areas,
Although no estimates have been made for the Arctic
the movement of the actual treeline is very slow and
specifically, estimating the Arctic share based on the area
will likely only have an effect on the carbon cycle of the
of continuous permafrost yields a first-order estimate
Arctic over the course of several centuries.
of less than a million tonnes per year. In other words,
Thawing of near-surface permafrost will mobilize
the contribution from methane hydrates is at present
stored carbon. Different studies show different patterns
insignificant compared with emissions from land.
over time, but agree that much carbon will become
Model projections of the
loss of permafrost around
the Arctic between 2000
and 2050 and between 2050
and 2100.
Projected loss of perma-
frost during the period
2000-2050
Projected loss of perma-
frost during the period
2050-2100
Projected permafrost
in 2090-2100
12
available by the end of this century. Furthermore, fire in
largely uncertain in both the short- and long-term.
permafrost landscapes may accelerate thawing, a factor
that has not been considered in studies to date. Once
Further research should focus on sensitive
permafrost is thawed, the release of carbon depends pri-
elements of the carbon cycle
marily on the wetness of the soil. Wetter soils will release
Current understanding of the Arctic carbon cycle is
more methane but relatively less carbon dioxide than dry
limited by considerable uncertainties. Even the ques-
soils. Recent trends in the Arctic indicate that landscapes
tion of whether the Arctic will be a source or a sink
are typically drying as a result of climate change.
for carbon depends on the extent to which increased
The impact of Arctic carbon cycle changes on global
carbon dioxide in the atmosphere will stimulate plant
climate appear likely to be modest. One study pro-
growth. The interactions between climate and carbon
jected a potential maximum release of 50 billion (i.e.,
cycling in many other areas of the Arctic environment
thousand million) tonnes of carbon from the Arctic
are similarly unclear.
terrestrial environment through this century, far lower
Integrated studies of regional carbon dynamics are
than the 1500 billion tonnes that are expected to be re-
needed to provide better information on key elements
leased by even low-end estimates of fossil fuel burning
of the Arctic carbon cycle. Such studies should link
over the same period. This and other studies also found
observations of carbon dynamics to the processes that
that the Arctic may continue to be a sink for carbon,
influence those dynamics. The resulting information
depending on responses to increased carbon dioxide in
should be incorporated into modeling efforts that con-
the atmosphere and other factors.
nect carbon dynamics and climate. The studies should
In the marine environment, too, feedbacks from
focus on sensitive parts of the system, for example
climate to carbon can be both positive and negative.
areas experiencing major changes or thresholds such as
Reduced sea ice will allow more exchange of carbon
permafrost loss or increased fire disturbance. Similarly,
from sea water to the atmosphere. It will also al-
more research is needed on the relative importance of
low more light to reach the water, stimulating more
various processes to determine whether carbon uptake
plankton growth and thus uptake of carbon. Melting
or release will predominate.
of ice will mean more freshwater in upper ocean layers,
A major challenge for carbon modeling is connect-
which can reduce biological activity and result in less
ing fine-scale observational studies with the larger scales
carbon being taken up by biota. These effects will act
at which models describe the environment. Observa-
very differently in each season, making projections of
tional networks should be designed to capture regional
the net change even more difficult.
variations and also reveal the underlying processes that
As the ocean warms, it can hold less dissolved car-
govern carbon dynamics at various scales. That infor-
bon dioxide. Furthermore, warmer water may lead to
mation can be used to model the interactions among
increased production of carbon dioxide and methane
various parts of the carbon cycle. Observational studies
through decomposition and other biological activity.
should also focus on small- and large-scale processes so
The discharge of water from land to sea increased
that both can be incorporated in models.
in the Arctic throughout the 20th century, and is
For example, uptake of carbon through photo-
projected to continue to rise and perhaps accelerate
synthesis and release through decomposition depend
during the 21st century. Increased water flow will likely
greatly on local temperature and moisture. Growth or
mean increased carbon transport, though the relative
loss of wetlands can be measured at larger scales, as can
proportions of different types of carbon are difficult to
disturbances such as fires. Since all these factors affect
predict. One possibility is that carbon carried by rivers
the carbon cycle, studies that ignore one or more of
ends up stored in coastal sediments. Another possibil-
these influences will not provide an accurate picture of
ity is that this carbon decomposes in the water column
carbon dynamics. In turn, models will not be able to
and is released as carbon dioxide and methane.
capture the major influences on the carbon cycle if they
The release of methane from gas hydrates currently
do not reflect all of the major factors that are involved.
locked in permafrost is likely to be a very slow process.
The improved understanding of carbon dynamics
Most hydrates are at considerable depth and so would
can be incorporated first in simpler models where the
not be affected in the short-term by near-surface thaw-
basic ideas can be tested. Then, more complex models
ing. Furthermore, methane moving upwards from
that couple air, land, and sea can be developed or
hundreds of meters underground would most likely be
revised based on new and better understanding of the
oxidized before reaching the surface and thus reach the
fundamental factors involved. This in turn will allow a
atmosphere as carbon dioxide and water rather than as
more confident exploration of the relationships between
methane. Nonetheless, the fate of gas hydrates remains
climate change and carbon cycling in the Arctic.
13
Improving predictive capacity for the
Global surface warming, şC
Arctic region
6.0
Assessing the future course of climate change in the
Arctic requires understanding processes, feedbacks, and
5.0
2010-2040:
impacts at the regional scale. This scale is essential to
little, if any
bridging the gap between global studies and models and
di erence
4.0
between
local impacts and changes in the Arctic. This section
scenarios
A2
provides an introduction to several initiatives in this area,
A1B
which will be addressed in more detail in future reports.
3.0
Reliable regional-scale modeling is needed to
B1
support Arctic process and impact studies
2.0
Constant composition
commitment
A recent evaluation of global climate models was
conducted in preparation for the Climate Change and
1.0
20th century
B1
A1T
B2
A1B
A2
A1F1
the Cryosphere: Snow, Water, Ice, and Permafrost in
the Arctic (SWIPA) study. 25 models were evaluated for
0.0
2100: substantial
their ability to simulate 20th century climate parameters
divergence in
scenario estimates
such as surface air temperature, sea level atmospheric
-1.0
pressure, and summer sea ice extent. The models varied
greatly in their abilities, with some models performing
1900
2000
2100
well for some criteria but not for others. Simply put,
there is no single best model for all purposes. For the
reason. This means, however, that their outputs do not
Model projections of
short-term, model selection must be done carefully and
have sufficient resolution for many impact studies. Un-
global warming under
documented well to maintain the integrity of the overall
til sufficiently detailed regional models are developed,
different IPPC scenarios
projections of changes in the Arctic. In the longer term,
downscaling of climate model outputs offers additional
are fairly consistent for the
Arctic climate studies require reliable regional-scale
tools to support local-scale impact assessments. Projects
period up until around
2040, but beyond that the
models that can capture the various parameters of inter-
using this approach are underway in the Arctic and will
projected temperatures
est for different process and impact studies.
provide additional insight into the reliability and utility
vary widely. The predictive
The SWIPA project itself is intended to develop
of various downscaling methods.
capacity of the models
more detailed and thorough knowledge about ongoing
needs to be improved for
processes, supporting more accurate projections about
possible impacts by the
the Arctic cryosphere and allowing better assessment of
end of the century so that
impacts on local, regional, and global scales. The project
appropriate adaptation ac-
An Adaptation
builds on work done through the International Polar
tions can be taken.
Assessment Cascade
Year (IPY), the Intergovernmental Panel on Climate
Change, and the Arctic Council, as well as other na-
tional and international programs. Specifically, SWIPA
Craft and Implemen
Long-Range Adaptation Plan
will integrate scientific information on the impacts of
climate change on ice, snow, and permafrost in the Arc-
Control ing
Tease out Key Projections
tic, considering impacts within the Arctic and beyond.
Projections
with Multi-Stresses
It will update existing scientific information with results
of relevant new research and monitoring.
4 Quad
Key Tracking Indicators
Track
Develop the 4 Quad
and Evaluate Progress
Progress
The effects of short-lived climate forcers also require
Scenarios
Scenarios with Drivers
further study. Improving the quantitative estimates of
these effects and the potential benefits of reducing emis-
Downscale
Downscale Key
Parameters at needed Scale
sions of non-carbon dioxide forcers requires improved
Model downscaling provides
a means of improving model
climate modeling capability.
Set Time
Set the Time Scale visa
predictive capability for more
Finally, assessing social and economic impacts of
Scale
Climate Conditions
local situations. AMAP work
climate change typically requires detailed information
has defined a methodological
at local scales. Global climate models, though powerful
Frame the
Frame the Context and
approach that is now being
and complex, must operate on a coarse geographical
Problem
Scale (cities, water, etc.)
employed in different parts of
scale to keep their computation requirements within
the Arctic.
14
Summary
The Arctic carbon cycle is an important factor in
the global climate system. Considerable quantities of
The Arctic continues to warm. Since publication of
carbon and methane are stored in the Arctic. If re-
the Arctic Climate Impact Assessment in 2005, several
leased to the atmosphere, they could increase green-
indicators show further and extensive climate change.
house gas concentrations and thus drive further
Air temperatures are increasing in the Arctic. Sea ice
climate change. At present, the Arctic appears to be
has decreased sharply, reaching a record low in 2007.
a sink for carbon dioxide and a source for methane.
Surface waters in the Arctic Ocean are warming.
Climate change is likely to result in more carbon
Permafrost is warming and, at its margins, thaw-
dioxide being released to the air but also more be-
ing. Plants are growing more rapidly, with trees and
ing absorbed by growing plants on land and in the
shrubs appearing farther north. Snow cover in the
ocean. The balance between these two responses is
Northern Hemisphere is decreasing by 1-2% per year.
not clear, but it appears unlikely that changes in the
Glaciers are shrinking and the Greenland Ice Cap is
Arctic carbon cycle will have more than a mod-
melting. Most of the significant outlet glaciers of the
est influence on global climate in the next 50-100
Greenland Ice Cap have accelerated, retreated, and
years. There is, however, considerable uncertainty
thinned, leading to increased loss of ice from Green-
involved, especially over longer time periods.
land, especially since 2003.
Global climate models are limited in their ability
Even if there is still considerable uncertainty re-
to provide reliable, regional-scale projections of
garding the magnitude of their effects, black carbon,
various climate parameters. Current and planned
tropospheric ozone, and methane may contribute to
projects and programs aim to improve understand-
global and Arctic warming to a degree comparable
ing of regional processes, the role of short lived
to the impacts of carbon dioxide. Black carbon and
climate forcers, and local impacts of climate change.
ozone, in particular, have a strong seasonal pattern
Improved regional-scale models and projections will
that makes their impacts particularly important in
help improve evaluation of adaptive and mitigative
the Arctic, especially during the spring melt. These
actions, particularly concerning local impacts and
climate forcers are relatively short-lived and have the
reducing emissions of short lived climate forcers,
potential for relatively rapid reductions in emissions
which may be of comparable importance to carbon
and thus in atmospheric levels. There are various op-
dioxide in driving temperature increases.
tions for emissions reductions that can be enacted in
northern regions and globally.
The Greenland Ice Sheet
meets land at Russell Gla-
cier, 20 km east of Kanger-
lussuaq, Greenland.
enning Thing
H
15
Background scientific documentation for this report
Arctic Report Cards:
Report Card website www.arctic.noaa.gov/reportcard/
NOAA, 2006. State of the Arctic: October 2006. NOAA OAR Special
Report, NOAA/OAR/PMEL, Seattle, WA. 36 pp.
Short-lived climate forcers:
The Impact of Short-Lived Pol utants on Arctic Climate. P.K. Quinn,
T.S. Bates, E. Baum, T. Bond, J.F. Burkhart, A.M. Fiore, M. Flanner,
T.J. Garrett, D. Koch, J. McConnel , D. Shindel , and A. Stohl.
AMAP Technical Report No. 1 (2008)
Sources and Mitigation Opportunities to Reduce Emissions of Short-
term Arctic Climate Forcers. J. Bluestein, J. Rackley and E. Baum.
AMAP Technical Report No. 2 (2008)
Arctic Carbon Cycle:
McGuire, A.D., L. Anderson, T.R. Christensen, S. Dal imore, L. Guo,
D.J. Hayes, M. Heimann, T.D. Lorenson, R.W. Macdonald, and N.
Roulet. 2009. Sensitivity of the carbon cycle in the Arctic to climate
change. EcologicalMonographs. In press.
Improving predictive capacity for the Arctic region: Model down-
scaling
Final Report of the Workshop on Adaptation of Climate Scenarios to
Arctic Climate Impact Assessments, Oslo, May 14-16, 2007. AMAP
Report 2007:4
Benestad, R.E., I. Hanssen-Bauer and D. Chen, Empirical-Statistical
Downscaling. World Scientific Publishing, 2008. 300 pp
Sources of photography in this report
Photographers and suppliers of photographic material:
Bryan and Cherry Alexander (www.arcticphoto.com) pages 3 and 8
page 3: Polar Bear fal s through thin Autumn sea ice. Cape
Churchill, Canada.
page 8: Gas flares in the Vingoyarhinsky oil fields. Purovsky Region,
Yamal, Western Siberia.
Henning Thing (het@fi.dk) cover, pages 5, 6 and 14
page 5: The Zackenberg valley, with the Zackenberg research station
and Zackenberg mountain in the background.
page 6 (left): Russel Glacier at the edge of the Greenland Ice Sheet,
20 km east of Kangerlussuaq airport (June 24, 2007).
page 6 (right): Extensive summer melting at the edge of the Green-
land Ice Sheet, 25 km northeast of Kangerlussuaq airport (August 2,
2007).
page 14: Where the Greenland Ice Sheet meets land at Russell Gla-
cier, 20 km east of Kangerlussuaq airport (July 6, 2007).
John Smol (Queen's University, Kingston, Ontario Canada, smolj@
queensu.ca) page 5
Detailed caption:
Marianne Douglas (University of Alberta) conducts a final sam-
pling of Camp Pond (Cape Herschel, El esmere Island, Nunavut,
Canada) on July 15, 2007, the day before the pond desiccated
total y. Paleolimnological data showed that these were previously
permanent water bodies that have existed for millennia, but limno-
logical monitoring data (which began in 1983) indicated increased
evaporation that eventual y resulted in total desiccation of many
Cape Herschel ponds beginning in 2005.