
GEF
UNDP/GEF PROJECT ENTITLED "REDUCING ENVIRONMENTAL STRESS IN THE
YELLOW SEA LARGE MARINE ECOSYSTEM"
UNDP/GEF/YS/RSP.4/8
Date: 2 November 2007
English only
Fourth Meeting of the Regional Scientific and Technical Panel
for the UNDP/GEF Yellow Sea Project
Guangzhou, China, 26-28 November 2007
Progress of SAP Development
This Document describes the progress made during 2007 in developing the Strategic Action
Programme (SAP) and the National Strategic Action Plans (NSAPs) for the Yellow Sea. The
Document summarises activities that were conducted to prepare the SAP/NSAPs,
highlighting major outputs from those activities. Relevant meeting reports as well as other
key references are attached to this Document.
To prepare the SAP/NSAPs, the Project organised three brain storming meetings in 2007:
1. Consultation Meeting - (Jinghong, Xishuangbanna, Yunnan, China, 6-8 February
2007) prepared the "Conceptual Procedure" which describes the objective and
central theme of the Project's SAP, the procedure and mechanism of preparing the
SAP, and the timelines and responsible parties to prepare the SAP.
2. First Ad-hoc Working Group Meeting - (Hongchun, ROK, 10-12 April 2007) identified
"Regional Targets" also known as Ecosystem Quality Objectives, which is "the
ecological state that is aimed for by the year 2020" (Document
UNDP/GEF/YS/AWG.2/2, Annex 2).
3. Second Ad-hoc Working Group Meeting - (Hangzhou, China, 18-20 August 2007)
identified "Management Actions" which aim to achieve the regional targets.
A draft structure of the SAP which included some preliminary ideas on the Regional Targets
and Management Actions was presented to the First Ad-hoc Meeting. The Second Ad-hoc
Meeting prepared guidelines for demonstration activities and for two components of
feasibility studies (i.e. cost-benefit analysis [CBA], political and social acceptance analysis
[PSA]). The second Meeting also established an SAP drafting group consisting of five
members: three natural scientists, one social scientist, and the Project Manager.
The RWG meetings organised after the above three preparatory meetings, reviewed and
finalised the Regional Targets and Management Actions. The RWG meetings of natural
science components assessed the technical feasibility of the proposed actions, while the
RWG-I Component prepared implementation plans for the CBA and PSA. The RWG-I also
prepared guidelines for preparing NSAPs and for conducting CBA of Management Actions.
In summary, the Project produced the following outputs in 2007 to develop SAP and NSAPs:
UNDP/GEF/YS/RSP.4/8
Page 2
· Conceptual
Procedure*
finalised;
· Regional Targets* identified;
· Management Actions* identified;
· SAP Structure* drafted;
· Guidelines for demonstration activities prepared;
· SAP Drafting Group established;
· Call for Proposals for Demonstration Activities prepared;
· Technical Feasibility Study of Proposed Management Actions conducted;
· Implementation Plans of the CBA and PSA prepared;
· Guidelines for NSAPs development prepared; and
· Guidelines for CBA prepared.
For reference, the key outputs with an asterisk (*) above as well as the two Ad-hoc Meeting
reports are attached as Annexes to this Document.
It is suggested that: (i) three sessions of the SAP Drafting Group are scheduled 2008
(January, March, and May); (ii) a Special PSC Meeting will be convened in April 2008 to
review the final draft of the SAP; (iii) the expected time for obtaining endorsement of the SAP
from the governments of China and ROK would be middle of 2008.
DRAFT STRUCTURE OF SAP
List of Abbreviations
Acknowledgement
1. ENVIRONMENTAL CHALLENGES IN THE YELLOW SEA: ENVIRONMENT STATUS
·
Statement from the Project Document to find what was the knowledge
when the project document prepared;
· Environment
status
according
to the national reports and regional
synthesis on the improved knowledge of the environment problems and
causes;
·
There should be an attempt to link the environmental problems to the
Carrying Capacity of Ecosystem to provide a basis for SAP.
2. FINDINGS OF THE TDA: PROBLEMS, PRIORITIES, CAUSES AND POSSIBLE SOLUTIONS
Problems for Actions. With General information provided in the section 1, this
section will provide specific information on the Problem, Priorities, Causes and
possible solution.
The relevant parts of TDA should be summarised here with clear indication of
WHICH AGENCIES need to take WHAT actions. This is scientific and
environmental bases for the SAP.
3. EXISTING REGIONAL AND NATIONAL POLICIES AND LEGAL FRAMEWORK: GAPS FOR
PROTECTION OF MARINE ENVIRONMENT AND SUSTAINABLE USE OF MARINE AND
COASTAL ENVIRONMENT
Before identifying actions to address the problems, we need to find out why
current governance system would not appropriately solve the problem. in
another words, there is a need to identify the gaps in legislative, institutional and
participatory approaches.
3.1 National
Analysis
3.1.1 Governance analysis of China: legal, institutional and stakeholders
analyses
Concise summary of the governance analysis from China will
provide information on the governance status in China, with aims
at to identify better management actions to improve it.
Avoiding copying the text from the report, the summary should
have (i) proposed ideal management actions regarding
governance issues; (ii) analysis of existing governance; (iii) gaps;
e.g. enforcement and/or implementation; and (iv)
recommendations.
3.1.2 Governance analysis of R. Korea: legal, institutional and stakeholders
analyses
Concise summary of the governance analysis from ROK will
provide information on the governance status in China, with aims
at to identify better management actions to improve it.
Avoiding copying the text from the report, the summary should
have (i) proposed ideal management actions regarding
governance issues; (ii) analysis of existing governance; (iii) gaps;
e.g. enforcement and/or implementation; and (iv)
recommendations.
3.2 Regional
Analysis
The same consideration should be given at regional level, but emphasis should
focus on regional governance, focusing on a review of international and regional
conventions, what is the (i) better governance in the Yellow Sea, and (ii) what
are the gaps; and (iii) recommendations for regional governance.
Particular attention should be given to regional co-operation mechanisms, e.g
fishery agreement, some non-legal binding approaches, or some relevant
international conventions.
4. ENVIRONMENTAL AND SCIENTIFIC BASIS FOR THE MANAGEMENT STRATEGIES:
CARRYING CAPACITY OF ECOSYSTEM
This section is to establish scientific and environmental justifications to provide
sound basis for the management action, and to establish the concept of the
Ecosystem-based Approach to be taken in this SAP.
4.1 Carrying Capacity of Ecosystem
4.1.1 Definition of the Carrying Capacity of Ecosystem used in YSLME
The definition of the Carrying Capacity of the Ecosystem to be
used in this document should be clearly provided here. It should
clearly note that (i) the CCE of this project has slight different
definition with others; (ii) why CCE is needed for management
action; and (iii) how the CCE should be considered in preparing
the SAP.
4.1.2 Ecosystem
services
With reference to MA definition, this section will provide specific
definition of the following services with special reference to the
situation in the Yellow Sea. The management actions will focus on
the recovery, maintaining and improvement of these services.
Relevant elements from the Concept Paper of SAP consultation
should be included here with some more scientific explanations.
· Provisioning services
· Supporting/regulating services (Note the difference with MA's)
· Cultural services
4.2 Regional Ecosystem Quality Objectives (regional targets)
This is one of key parts of the SAP to provide the regional targets for the
management actions. This section is very much reliant on the discussion and
agreement of the ad-hoc working group.
Would it be possible to have more collective targets, instead of targets according
to the project component?
5. MANAGEMENT STRATEGIES: INTERVENTIONS AND ACTIONS TOWARDS 2020
This is the section to provide management actions according to the regional
targets established in the section 4.
Does the SAP need to provide both Strategies (overall plan) and Actions
(process to achieve the target)?
5.1 Protection of Coastal and Marine Environment in the Yellow Sea
This section mainly contributes to the Supporting/Regulating services of the
Ecosystem. It should cover Pollution, Biodiversity and Ecosystem components.
5.1.1 Identified areas requiring management actions: through the Causal
Chain Analysis
As the causal chain analysis was done according to the project
components, logically, the management actions should also be
prepared in each component. However, as the CCE will be the
linkage for ecosystem-based approach, there should be linkage
between the management actions, not just between action and
problem in each component.
Question: What kind of linkage should be established according to
the CCE?
5.1.2 Management actions to remove the stresses: Management options and
associated costs
This is the place to identify the management actions together with
estimated costs, which may covers following elements.
The second meeting of the ad-hoc working group discussed this
issue.
· Harmonisation of legislation
· Institutional reforms
· Technical actions
Question: how to group the actions is still a question that will
affect the identification of management actions. For instance, the
harmonisation of legislation and institutional reform will not need to
follow the project components. But the technical actions may have
specific actions to address specific problems.
5.1.3 Contributions to the ecosystem services: Scales of actions meeting the
regional targets
How the identified actions should address to the regional targets
for the management action?
5.1.4 Indicators of management actions (Process indicator, stress reduction
indicator and environmental status indicator)
The indicators include the Process Indicator, Stress Remove
Indicator and the Environment Status Indicator, as define by GEF.
For each management action, there is a need to identify the
success indicators that indicate how much success the
implementation of the management actions can get, against the
regional targets identified.
The meetings of the RWGs should also discuss this issue.
5.2 Sustainable Use of Coastal and Marine Resources in the Yellow Sea
This section mainly contributes to the Provisioning Services of the
Ecosystem. It should cover mainly the Fishery component and partially
Biodiversity. Ecosystem component has also roles in the provisioning
service, in particular the productivities.
5.2.1 Identified areas requiring management actions: through the Causal
Chain Analysis
Same as the section 5.1.1.
5.2.2 Management actions to remove the stresses: Management options and
associated costs
· Harmonisation of legislation
· Institutional reforms
· Technical actions
Same as the section 5.1.2.
5.2.3 Contributions to the ecosystem services: Scales of actions meeting the
regional targets
Same as the section 5.1.3.
5.2.4 Indicators of management actions (Process indicator, stress reduction
indicator and environmental status indicator)
Same as the section 5.1.4
5.3 Upgrading National Capacity in Protection of Marine Environment
This is mainly the tasks of the Investment component. The "national
capacity" does not mean the capacity within a country only, but also mean
the capacity to participate in regional and international activities, which
provide benefits to assist in addressing the protection of marine
environment and sustainable use of coastal and marine resources.
5.3.1 Enhancement of Regional Co-operation mechanism
· Data and information exchange and sharing
· Regional research and monitoring programme
· Regional agreement in co-operating efforts in marine environmental
protection and sustainable uses of coastal and marine resources
5.3.2 Enhancement of National Co-ordination
· Preparation of National SAP
· National co-ordinating mechanism in dealing with marine
environment
5.3.3 Upgrading capacities of National Institutions
· Capacities in Marine Environment management: Central and local
Governments
· Involvement of all stakeholders, including NGOs and local
communities
· Mechanism to exchange research and monitoring programmes and
outcomes
6. COST AND BENEFITS ANALYSIS OF THE MANAGEMENT ACTIONS: ECONOMIC
INCENTIVES
This section will help the understanding of all stakeholders, in particular the
national and local governments on the incentives created by the management
actions. It is important to give clear and concise information in the section. It
should not be too long, but enough for understanding of non economist.
· Environmental Valuation (as 6.1)
Economic value of goods & services
Negative
externalities
Valuation
techniques
· Cost-benefit analysis (CBA) of management actions (as 6.2)
Benefits and costs of actions
With-or-without action scenarios
CBA
procedure
· Case studies (as 6.3)
6.1 Regional guidelines: Brief introduction
Based on the regional guidelines for environmental valuation, a summary
of relevant parts of the guidelines should be prepared here, covering
following elements, for instance.
Question: What depth of technical detail should be provided remains the
question. Concise and informative are the requests, but they do not
always go together.
There is a need to have contributions from the Investment group, in
particular the economists involved in the project.
· Basic environment economics: theoretical part
· Practical valuation:
· Case studies
6.2 Costs and benefits analysis for management actions
How should the cost benefits should be done? To what level of details the
analysis should go for the management actions?
The management actions should be grouped together where possible, and
the impacts of the management actions should be estimated (the regional
targets). With the impacts, it is anticipated the cost and benefit analysis
could be carried out.
Question: Is there a need to have meeting of economists in this regards?
7. FINANCIAL MECHANISM FOR IMPLEMENTATION OF SAP:
Financial mechanism is an important element for GEF to consider for the next
phase: Implementation of SAP. GEF will cover incremental costs to address the
transboundary problems, and the national governments are responsible to
address the environmental problems in the countries.
7.1 Existing Financing Mechanisms at National Level
There is a need to identify the existing financial mechanism in the participating
countries to support the relevant action in protection of marine environment and
sustainable use of coastal and marine resources.
At this stage, we do not have detailed information on the existing mechanism the
participating countries deal with marine environmental issues.
7.2 Appraisal of Financial Requirements for the Implementation of YSLME SAP
In order to find appropriate financial mechanisms to support implementation of
YSLME SAP, there is a need to have appraisal of financial requirements. From
costed actions identified in the Section 5, it would be possible to come up with
idea, covering:
(i) Requirements
from
the governments of the participating countries;
(ii)
Requirements from GEF to cover the incremental costs in a short period,
e.g. 5 years;
(iii)
Requirements for a long-term perspectives
7.3 Concept and Proposed Actions in Financing SAP
Concept should cover the issues of:
(i) Requirements
(ii) Responsibilities
(iii) Financial
sustainability
(iv)
Review and monitoring
7.4 Development of Financing Mechanism
Financing mechanism is largely an implementing mechanism, which would
cover:
(i)
national funding and mechanism for national problems;
(ii)
regional funding and mechanism for transboundary problems;
(iii)
establishment and management of regional funding; and
(iv)
fund raising if necessary
8. REFERENCES
9. ANNEXES

UNDP/GEF PROJECT ENTITLED "REDUCING ENVIRONMENTAL STRESS IN THE
YELLOW SEA LARGE MARINE ECOSYSTEM"
UNDP/GEF/YS/AWG.1/1
Date: 28 March 2007
English only
First Meeting of the Strategic Action Programme Ad-hoc Working Group
for the UNDP/GEF Yellow Sea Project
Hongchun, ROK, 10-12 April 2007
Conceptual Procedure for SAP Preparation
UNDP/GEF/YS/AWG.1/1
Page 1
Conceptual Procedure for SAP Preparation
Having completed the Transboundary Diagnostic Analysis (TDA), the UNDP/GEF Yellow
Sea Project will develop a regional Strategic Action Programme (SAP) and the National
Strategic Action Plans from 2007 through 2008. The SAP is a document that identifies
policy, legal and institutional reforms, and environmental inventions to address
transboundary environmental issues in the Yellow Sea. The SAP describes actions to solve
major problems that the TDA identifies through its causal chain analysis.
For the SAP of the Yellow Sea Project, it is proposed to use the central theme of "Carrying
Capacity of Ecosystem (CCE)" to link all Project Components--Biodiversity, Ecosystem,
Fisheries, Investment, and Pollution The goal of the SAP for the Yellow Sea Project is to
prepare management interventions to maintain and/or improve the Carrying Capacity of the
Yellow Sea Ecosystem in order to ensure the continued provision of ecosystem services.
These interventions will address environmental problems identified by the causal chain
analysis of TDA. As the environmental problems are closely interlinked and interacted each
others, the interventions will tackle them in a comprehensive manner, but not individually, as
this will not achieve the primary objective, that of maintaining/improving the CCE.
As an initial step in the development of a Yellow Sea SAP, the Project convened an SAP
Consultation Meeting (Jinghong, China, 6-8 February 2007). The Meeting of regional
experts from relevant fields discussed in detail a process and a framework for preparing the
SAP, as well as formulating a set of guidelines for subsequent work.
This Paper was prepared for the discussion at the consultation meeting, and revised based
on the comments and recommendations of the Meeting. The document will be circulated for
the Project Steering Committee (PSC) to review and approve. This document will outline the
basic structure for the preparation of the SAP, specifically:
· Objectives of SAP for the Yellow Sea Project;
· Carrying Capacity of Ecosystem: Central Theme of the SAP;
· Ecosystem Services of the Yellow Sea;
· Framework of SAP Preparation;
· Procedure for SAP Preparation;
· SAP preparation mechanism; and
· SAP Preparation Schedule.
1. Objectives of SAP for the Yellow Sea Project
The SAP for the Yellow Sea Project aims to prepare management actions to maintain and/or
improve the Carrying Capacity of Ecosystem in the Yellow Sea to ensure continued
provision of Ecosystem Services; as a result, the Project would achieve the following
objectives comprehensively:
· Protection of marine and coastal environments in the Yellow Sea;
· Sustainable use of marine and coastal resources in the Yellow Sea; and
· Upgrading national capacity in protection of marine environment.
For the definitions of the Carrying Capacity of Ecosystem as well as the Ecosystem
Services, see Sections 2 and 3, respectively.
UNDP/GEF/YS/AWG.1/1
Page 2
2. Carrying Capacity of Ecosystem: Central Theme of the SAP
The TDA, conducted in 2005-2006, identified five major environmental problems in the
Yellow Sea:
· Marine environment pollution;
· Marine and coastal habitat modification;
· Change in ecosystem structures and functions;
· Unsustainable
fisheries;
and
· Unsustainable mariculture practices.
These problems adversely affect the "Carrying Capacity of Ecosystem" in the Yellow Sea
(Figure 1). We define "Carrying Capacity of Ecosystem" as the ability to sustain the
provisioning, regulating/supporting and cultural services in the Yellow Sea (adapted from
Olsen et al. 2006). We use the maintenance of CCE as a management concept to identify
management actions in the Yellow Sea based on the causes described in the causal chain
analysis prepared during the TDA process.
Figure 1. Central theme of the SAP for the Yellow Sea Project
The problems are often linked. For example, unsustainable mariculture practices might
result in pollution problems (through eutrophication and localised benthic enrichment) and
changes in ecosystem structure (as a result of habitat modification due to increased
sedimentation rates caused by changes in water movement). As a consequence of these
changes, fisheries yields will be impacted. Habitat modification through e.g., pollutants or
land reclamation might change the ecosystem structure by adversely affecting primary
production, spawning sites, nursing grounds, and/or nitrogen absorption capacity by the
ecosystem. All those negative impacts of the environmental problems could eventually
diminish the ability of the Yellow Sea ecosystem to provide its services.
Based on past experiences in managing marine environment and sustainable use of coastal
and marine resources, it is very difficult, if not impossible, to manage the marine
environment according to the Project Components individually, i.e., Biodiversity, Ecosystem,
Fisheries, and Pollution. Addressing all the impacts from these Components will be critical
for the success of management actions. For instance, protection of coastal wetlands will not
simply imply the protection of the habitats for migratory birds. It would not work if the
management actions only focus on wetlands themselves because the impacts from pollution,
fishing activities, changes in productivity, and development contribute to the degradation
and/or modification of coastal wetlands.
UNDP/GEF/YS/AWG.1/1
Page 3
Therefore, it is critical to identify an appropriate linkage between the Project Components,
which can provide effective central concept for preparing the SAP. We propose Carrying
Capacity of the Ecosystem to be used as the central linkage in the management structure.
Previously, the Regional Working Group (RWG) for Pollution Component discussed the
issue of regional targets for pollution management, and indicated that the level to control
nutrients in the marine environment will depend on the requirements of productivity in the
Yellow Sea ecosystem. Therefore, it would be reasonable to use Carrying Capacity of
Ecosystem as a linkage between the Ecosystem Component and the Pollution Component.
3. Ecosystem Services of the Yellow Sea
For the purposes of the Yellow Sea Project's SAP development, the services that the Yellow
Sea ecosystem provides, hereinafter called "Ecosystem Services," mainly consist of the
following (Figure 2):
· Provisioning
services;
· Supporting/regulating services; and
· Cultural
services.
Figure 2. Ecosystem services provided by the Yellow Sea
Provisioning services are the products obtained from ecosystems. Those services in the
Yellow Sea include food, biochemical, sand, salt, and genetic resources. Supporting and
regulating services in the Yellow Sea are those that are necessary for providing the two
categories of services--provisioning and cultural services--including inter alia primary
production, climate regulation, and nutrient and carbon cycling. Cultural services are the
ones that people obtain from ecosystems through spiritual enrichment, cognitive
development, and recreational and aesthetic experiences. The Yellow Sea provides
opportunities for tourism and education. The classification of Ecosystem Services is
adapted from the Millennium Ecosystem Assessment (2003).

UNDP/GEF/YS/AWG.1/1
Page 4
To address the environmental problems in the Yellow Sea, it is important to act
comprehensively, not individually due to the interlinkages between the environmental
problems as well as the Project Components as illustrated above in the previous section.
As a result of the intervention, the SAP is expected to contribute to the objectives described
in Section 1: protection of and sustainable use of marine and coastal resources in the Yellow
Sea, and upgraded national capacity in protecting the marine environment.
4. Framework of SAP Preparation
There are four main parts to the SAP development (Figure 3):
(1) Identification of the central linkage of protection and/or improvement of the
Carrying Capacity of Ecosystem in the Yellow Sea through securing and/or
improving its ability to provide Ecosystem Services;
(2) Identification and prioritisation of environmental problems in the Yellow Sea;
(3) Application of Causal Chain Analysis; and
(4) Creation, prioritisation, and implementation of management interventions.
Figure 3. Four main parts of the SAP development
These result in the SAP identifying options for intervention i.e. harmonisations of the policies
and legislations, institutional reforms, and environmental investments. The SAP should also
prioritise conservation activities or interventions to protect and improve the Carrying
Capacity of Ecosystem in the Yellow Sea.
Note that the TDA process has already completed part 2 and provided the causal chain
analysis for part 3. Having conducted the Causal Chain Analysis, the TDA as well as other
national and regional studies identified environmental problems in order of priority. Those
priority problems are, as mentioned above, marine environment pollution, marine and
coastal habitats modification, changes in ecosystem structures and functions, unsustainable
fisheries, and unsustainable mariculture. The TDA then assessed the causes of the

UNDP/GEF/YS/AWG.1/1
Page 5
problems hierarchically "from the immediate to the proximal causes as high a level of
hierarchy as possible, extending up to the policy level wherever feasible" (TDA 2006, p. 4).
The impacts of the management interventions may take time to take effect and there may be
a need to review and adjust the levels of those interventions, based on the required
outcomes. It is therefore suggested that the duration of SAP should be until 2020.
5. Procedure for SAP Preparation
In order to identify the appropriate levels of management interventions (Part 4 of the SAP
Framework) it is necessary to:
(1) Identify the procedure to determine the regional Ecosystem Quality Objectives
(EcoQOs)
Given the central linkage of CCE and the need to set the extent of management
interventions, the next important step for the SAP preparation is to identify the regional
EcoQOs. Note that EcoQOs are referred to as "regional targets" for management in some
documents. This document uses EcoQOs and regional targets interchangeably.
Early on in the SAP development, there is a need to work out a procedure to identify the
EcoQOs for the SAP.
Figure 4 shows the nitrogen enrichment problem as an example (for details of this example,
see Box 1). In this example, the regional target for nitrogen concentration is established so
that the level allows the Yellow Sea ecosystem to continue to provide its supporting and
regulating services. However, it is necessary to have a clear understanding of how
interlinking problems in the Yellow Sea will affect the level at which the EcoQOs are set.
Figure 4. EcoQO identification process
UNDP/GEF/YS/AWG.1/1
Page 6
Box 1. SAP Process Illustrated with an Example of a Pollution Problem
The SAP will list a set of management interventions according to priority in order to address major
environmental problems identified by the TDA. For example, suppose that there are four
hierarchically-organised causes of a pollution problem--nitrogen enrichment--as shown in Table 1.
Table 1. Causes of pollution problem Nitrogen enrichment
Level of causes
Causes
Primary cause
Sewage discharge
Secondary cause
No tertiary treatment
Tertiary cause
No knowledge of Nitrogen absorption capacity
by ecosystem
Root cause
Inadequate government policies
Suppose also that the sewage discharge, the primary cause, contributes to the pollution problems in
the Yellow Sea, adversely affecting its supporting and regulating services. To mitigate those
problems, the SAP would establish Ecosystem Quality Objectives (EcoQOs) on the nitrogen level in
the concerned ecosystem so that it could provide the necessary supporting and regulating services.
Subsequently, the SAP would create possible options for intervention to lessen the nitrogen
enrichment. Table 2 shows examples of such options.
Table 2. Possible options for intervention
Causes Interventions
Sewage discharge
Quantification of allowable discharge
No tertiary treatment
Increase treatment facilities
No knowledge of nitrogen absorption
Enhancement of relevant research and
monitoring activities
Inadequate government policies
Harmonisation of relevant national regulations
Table 3 shows potential EcoQOs according to the three categories of the Ecosystem Services that the
Yellow Sea ecosystem provides.
Table 3. Possible EcoQOs for Ecosystem Services in the Yellow Sea
Ecosystem Services
EcoQOs
Provisioning services
Maximum sustainable fisheries yield (MSY),
sustainable production of mariculture, genetic
resources
Supporting/regulating services
Allowable pollutant levels, productivity
(diagnoses of changes), maintaining marine
and coastal habitats
Cultural services
Sustained recreation and tourism
The SAP should define each EcoQC as specifically as possible to be used as the regional target.
There are three possible steps to identify the EcoQOs: (i) retrospective approach, (ii)
theoretical approach, and (iii) comparative analysis approach. Each approach, shown in
Table 4, contains a series of tasks to identify the EcoQOs.
UNDP/GEF/YS/AWG.1/1
Page 7
Table 4. Methodologies for EcoQOs identification
Methodology Task
Retrospective approach
Review historical data
Check historical trends
Identify current situation
Review current political situation
Identify critical habitats
Theoretical approach
Modelling
Best Management Practices
Maximum sustainable fisheries yield (MSY)
Comparative analysis approach
Comparative analysis with other LME's,
international projects
Consideration of different requirements
between central and local govt.
(2) Identify the mechanisms to determine the EcoQOs
Having identified a methodology to determine the EcoQOs, it is also important to find an
appropriate mechanism to discuss and agree on the EcoQOs. Currently, the Project is
structured according to the "Components." This structure was useful and effective for the
TDA process. However, as we are facing the issue of cross components, the current project
structure may not be as effective as for the TDA process. So now we need to agree on
EcoQOs based on the central linkage of "Carrying Capacity of Ecosystem" that incorporates
the cross component issues. It might be necessary to modify both the roles of the RWGs
and the way RWG meetings are organised. For further discussion on this issue, see Section
6 "SAP Preparation Mechanism" in this document.
(3) Calculate the Carrying Capacity of Ecosystem
There is a need to identify how the Carrying Capacity of Ecosystem should be calculated.
Currently most Carrying Capacity models use primary productivity as the central theme,
however we need to consider how to quantitatively describe the provisioning,
supporting/regulating, and cultural services that the Yellow Sea provides.
(4) Identify management interventions
With clearly defined regional targets for management, the necessary management
interventions need to be identified based on the Causal Chain Analysis, and on geographic,
social, and political conditions. Management actions should include harmonisation of
legislation, institutional reforms, financial sustainability, human resource development, and
regional co-operation. Technical interventions should also be considered to address specific
problems identified in the TDA.
(5) Perform feasibility studies on the various options of management interventions
Studies will be conducted to test the feasibility of possible management interventions from
the perspective of:
· Technical
feasibility;
· Cost-benefit analysis; and
· Political and social acceptance.
UNDP/GEF/YS/AWG.1/1
Page 8
The feasibility studies would then prioritise the interventions. Demonstration projects would
be implemented to show the effectiveness of the proposed management actions before they
are adopted on a widespread basis.
(6) Identify regional and national mechanisms to implement the management interventions
The mechanism to implement the agreed management actions will be very critical in
ensuring success of the SAP. The SAP should:
· Clearly define the period of management actions;
· Clearly define regional targets for management;
· Describe management interventions to address the identified environmental
problems and associated causes; and
· Clearly define feasibilities and benefits of the management interventions.
(7) Endorse the SAP
The SAP will describe a mechanism for SAP endorsement, specifying not only how and
when the draft SAP should be presented for the participating governments to review and
endorse, but also who should be involved in that endorsement process. An explicit
consultation process with the government entities as well as other relevant stakeholders
should be established in the SAP.
Figure 5 summarises the above procedure as well as other relevant work for preparing the
SAP. Other preparatory work includes the following:
· Cost-benefit
analysis;
· Regional governance analysis;
· Analysis on relationship between local and national governments; and
· Critical habitat verification.
Figure 5. SAP preparation process
6. SAP Preparation Mechanism
UNDP/GEF/YS/AWG.1/1
Page 9
An Ad-hoc Working Group that is responsible for the SAP preparation will be established
under the Regional Scientific and Technical Panel (RSTP). According to the Terms of
Reference (TOR), the RSTP has a role to "prepare scientifically and environmentally sound
TDA and SAP." The Ad-hoc Working Group will consist of 11 members with expertise in
both natural science and social science. Table 5 shows the expertise required for the Group
activities with the number of experts.
Table 5. Personnel composition of Ad-hoc Working Group
Expert
Number of experts
Natural scientists:
Biodiversity 2
Ecosystem 2
Fisheries 2
Pollution 2
Economist 1
Legal expert
1
Project Manager
1
Total
11
The Ad-hoc Working Group will be guided by the Project Manager from the Project
Management Office (PMO).
The first Ad-hoc Working Group meeting will be organised in the first half of April, 2007. The
objective of this meeting is to identify the EcoQOs. The participants will use the
retrospective approach as described in Section 5 (Table 4) in this document, reviewing
historical data and trends, identifying the current situation of the Yellow Sea ecosystem, and
reviewing the current political situation. The participants will also discuss whether alternative
and/or supplementary approaches, i.e., the theoretical approach and the comparative
analysis approach, are necessary for the EcoQO identification.
Prior to the first meeting, the Project will contract experts who may also be members of the
Ad-hoc Group to provide the first Ad-hoc Working Group meeting with information to identify
the EcoQOs. The contracted work, requiring approximately five person-days, should be
carried out in March, 2007. A possible TOR for the work might include the following:
· Review historical data and trends of the Yellow Sea ecosystem;
· Identify the current situation of the Yellow Sea ecosystem;
· Review the current political situation in the countries bordering the Yellow Sea;
· Present the results of the above analyses which should include various options
for EcoQOs for each variable (as highlighted by the HAB example in the SAP
consultation meeting where an experts suggested that a 30% cut in N
concentration in seawater would virtually eliminate HAB events, whereas a 50%
cut in N concentration would restore the original diatom/dinoflagellate ratio) to the
first Ad-hoc Working Group meeting; and
· Conduct further analysis, if necessary, and provide the Ad-hoc Working Group
with the results based on the comments and suggestions provided during the first
meeting.
The second Ad-hoc Working Group meeting will be organised in August, 2007. The
objective of this second meeting is to:
· Review additional data and information collected after the first meeting;
· Finalise and agree on the EcoQOs;
· Discuss and agree on how to calculate the Carrying Capacity of Ecosystem; and
UNDP/GEF/YS/AWG.1/1
Page 10
· Identify management actions to achieve the EcoQOs.
Participants in the second meeting will be determined after the first meeting according to
needs. Inviting those who have expertise in local governments and NGOs--both are
important stakeholders--might be necessary to incorporate their views and opinions in the
SAP development.
It is preferable to organise several Regional Working Groups (RWG) meetings at the same
time, which are currently scheduled separately, for the effective and efficient preparation of
the SAP. The RWG meetings might be organised in conjunction with the Ad-hoc Working
Group. The necessity as well as the timing of the RWG meetings will be considered after
the first Ad-hoc Working Group meeting.
An SAP drafting group will consist of three/four members. The specific number of members
will be decided through consultation at the Ad-hoc Working Group meetings. The drafting
team might be drawn from within the Ad-hoc Working Group.
7. SAP Preparation Schedule
Task Deadline
Responsibility
Finalise the Concept Paper
February, 2007
PMO
Contract with experts for
March, 2007
Regional experts/PMO
basic data preparation (e.g.,
historical data review)
Start other relevant
March July, 2007
Consultants/PMO
preparatory work (e.g., cost-
benefit analysis, regional
governance analysis, critical
habitat verification)
First Ad-hoc Working Group
April, 2007
Ad-hoc Working Group/PMO
meeting
Second Ad-hoc Working
August, 2007
Ad-hoc Working Group/PMO
Group meeting
Feasibility studies (technical, August December, 2007
Consultants/PMO
socio-economic, political)
Start drafting Regional SAP
December, 2007 Middle of SAP Drafting Group
2008
Final Regional SAP
Middle of 2008
SAP Drafting Group
Endorse Regional
End of 2008
RSTP/PSC
SAP/National Yellow Sea
Action Plans (NYSAP)
UNDP/GEF/YS/AWG.1/1
Page 11
References
Millennium Ecosystem Assessment. (2003). Ecosystems and human well-being: A
framework for assessment. Washington, DC: Island Press.
UNDP/GEF Project "Reducing Environmental Stress in the Yellow Sea Large Marine
Ecosystem." (2006). Transboundary Diagnostic Analysis.
Appendix
Productivity Module "focuses on oceanic variability and its effect on the production of
phytoplankton and zooplankton that are at the base of the ocean food chain; it is concerned
with the carrying capacity of ecosystems and their ability to sustain fishery and other living
resources" (Olsen, et al., 2006).
Source: Olsen, S.B., J.G. Sutinen, Juda, L., Hennessey, T.M., & Grigalunas, T.A., 2006. A
Handbook on Governance and Socioeconomics of Large Marine Ecosystems. Univ. of
Rhodes Island, 94 p.

GEF
UNDP/GEF PROJECT ENTITLED "REDUCING ENVIRONMENTAL STRESS IN THE
YELLOW SEA LARGE MARINE ECOSYSTEM"
UNDP/GEF/YS/AWG.1/3
Date: 12 April 2007
English only
First Meeting of the Strategic Action Programme Ad-hoc Working Group
for the UNDP/GEF Yellow Sea Project
Hongchun, Republic of Korea, 10-12 April 2007
Meeting Report
TABLE OF CONTENTS
UNDP/GEF/YS/AWG.1/3........................................................................................................ 1
1
OPENING OF THE MEETING ........................................................................................ 1
2
BRIEF INTRODUCTION OF THE BACKGROUND AND THE DOCUMENT,
"CONCEPTUAL PROCEDURE FOR SAP PREPARATION"........................................ 1
3
EXPECTED OUTPUTS FROM THE 1ST AD-HOC WORKING GROUP MEETING...... 1
4
PRESENTATION BY REGIONAL EXPERTS ON PRELIMINARY REGIONAL
TARGETS WITH RESPECT TO THE PROJECT'S OBJECTIVES (BIODIVERSITY,
ECOSYSTEM, FISHERIES, AND POLLUTION) ............................................................ 2
5
BRAINSTORMING SESSION: IDENTIFICATION OF REGIONAL TARGETS ............. 4
6
DISCUSSION ON THE NEEDS OF ALTERNATIVE AND/OR SUPPLEMENTARY
APPROACHES (THE THEORETICAL AND COMPARATIVE ANALYSIS
APPROACHES) FOR THE REGIONAL TARGETS IDENTIFICATION ......................... 7
7
DISCUSSION ON NECESSARY EXPERTISE AND WORK FOR AND DURING THE
2ND AD-HOC WORKING GROUP MEETING SCHEDULED TENTATIVELY FOR
AUGUST, 2007 ............................................................................................................... 7
8
OTHER BUSINESS ........................................................................................................ 7
9
DATE AND PLACE FOR THE 2ND AD-HOC WORKING GROUP MEETING.............. 8
10 ADOPTION OF THE MEETING REPORT...................................................................... 8
11 CLOSURE OF THE MEETING ....................................................................................... 9
ANNEXES
Annex I
List of Participants
Annex II
List of Documents
Annex III
Agenda
Annex IV
Report on Preliminary Regional Targets with Respect to the Project's
Objectives
Annex V
SAP Reference Conditions and Regional Targets for Management Actions
Annex VI
Programme for First Yellow Sea Regional Science Conference
UNDP/GEF/YS/AWG.1/3
Page 1
1
OPENING OF THE MEETING
1.1
Welcome addresses
1.1.1 On behalf of the UNDP/GEF Yellow Sea project, Mr. Yihang JIANG, Project
Manager, opened the meeting and welcomed the participants to the first meeting of
the Strategic Action Programme (SAP) Ad-hoc Working Group. He informed the
meeting that the ad hoc Working Group was established within the Regional
Scientific and Technical Panel (RSTP) for preparation of SAP. Mr. Jiang briefly
stated that the objective of this meeting is to define "Ecosystem Quality Objectives
(EcoQOs)" or "regional targets" for future environmental management actions. Mr.
Jiang then explained the documents prepared for the meeting, consisting of "working
documents" and "information documents".
1.2
Introduction of members
1.2.1 Members and other participants were invited to introduce themselves and gave a
brief introduction on their background and roles in the Project. The list of participants
is attached to this report as Annex I.
1.2.2 The list of documents and the meeting agenda are attached to this report as Annex II
and Annex III, respectively.
1.2.3 Mr. Jiang served as Chairperson of the meeting, while Project Management Office
(PMO) served as Secretariat.
2
BRIEF INTRODUCTION OF THE BACKGROUND AND THE DOCUMENT,
"CONCEPTUAL PROCEDURE FOR SAP PREPARATION"
2.1
The Chairperson introduced the background of the meeting, explaining the procedure
for the SAP preparation (Document UNDP/GEF/YS/AWG.1/1). He explained the
basic components of SAP consisting of identified environmental problems, regional
targets, management actions to achieve the targets; also, he clarified the difference
between regional targets and management actions. Mr. Jiang then explained the
SAP process specifically, citing food, nutrients, habitats, and primary production as
examples.
2.2
Asked for clarification on the definition of the "optimal conditions" and that of the
"regional targets," the meeting discussed and agreed to use the term, "reference
conditions," to specify ideal environmental conditions in the Yellow Sea as a
reference for the regional targets which are the feasible conditions for the
management actions may be expected to achieve.
3
EXPECTED OUTPUTS FROM THE 1ST AD-HOC WORKING GROUP MEETING
3.1
The Chairperson explained expected outputs from the meeting, emphasising that the
meeting should identify and agree on the regional targets for environmental
management actions in the Yellow Sea. The participants are expected to set the
regional targets by reviewing historical data and trends, identifying the current
situation of the Yellow Sea ecosystem, and reviewing the current political situation.
3.2
Mr. Jiang also mentioned that in addition to the retrospective approach (i.e.,
reviewing historical data and trends), the participants are also expected to discuss
UNDP/GEF/YS/AWG.1/3
Page 2
whether alternative and/or supplementary approaches (i.e., the theoretical approach
and the comparative analysis approach) are necessary for the identification of
regional targets.
3.3
Additionally, the meeting is expected to review and provide comments on the First
Yellow Sea Regional Science Conference to be organised 14th to 16th August, 2007,
Hangzhou, China. The meeting will review a draft programme for the Conference,
prepared by the Co-Chairpersons of the Organising Committee for the Conference.
4
PRESENTATION BY REGIONAL EXPERTS ON PRELIMINARY REGIONAL
TARGETS WITH RESPECT TO THE PROJECT'S OBJECTIVES (BIODIVERSITY,
ECOSYSTEM, FISHERIES, AND POLLUTION)
4.1
The meeting reviewed the conceptual procedure for preparation of the SAP, and
reiterated that the carrying capacity of ecosystem will serve as the central linkage for
SAP to identify integrated management actions to address environmental problems
in the Yellow Sea. It was well understood by all participants that the management
actions to be included in the SAP should aim at improving the ecosystem service
functions in the Yellow Sea:
· Provisioning
service
·
Supporting & regulation services; and
· Cultural
service
4.2
Eight regional experts presented preliminary regional targets with respect to the
Project's objectives of Biodiversity, Ecosystem, Fisheries, and Pollution, with special
reference to the ecosystem services identified. The expert reports are attached to
this report as Annex IV.
4.3
To identify the current situation of the biodiversity in the Yellow Sea, Ms. Young Shil
KANG reviewed the historical data mainly on habitats, exotic species, indigenous
species, and vulnerable species. Based on those data and trends, Ms. Kang
proposed the following four items as regional targets: the diversity of species, the
number of vulnerable species, the number of exotic species, and the area of
reclamation. Ms. Kang further specified the issues to address regarding Biodiversity,
including tidal flat reclamation, ballast water, and introduced species to aquaculture.
4.4
Mr. Xuelei Zhang suggested there were four major concerns for biodiversity; habitat,
species, and genetics and management. Habitats were lost as part of coastal
reclamation and converted for aquaculture and salt pans or degraded due to
environmental change. Species diversity was at risk through the loss of vulnerable
species, introduced species from ballasted water and aquaculture and loss of
endemic species. Genetic diversity is threatened from species loss and gene flow.
Management needed to be strengthened and new regulations enforced. To preserve
vulnerable and endemic species, conserve local biodiversity, maintain critical habitats
and preserve genetic resources we need to; construct a well linked network of
conservation areas, minimize new reclamation, minimize introduction of alien
species, build a gene pool library and partially recover some converted habitats.
4.5
Mr. Sinjae YOO presented the results of his preliminary consideration about the
regional targets with respect to Ecosystem. Mr. Yoo explained potential indices,
including nutrients, diatom/dinoflagellate ratio, species diversity, abundance and
biomass of phytoplankton, and HAB. Having reviewed the historical data and trends
UNDP/GEF/YS/AWG.1/3
Page 3
of those possible indices, Mr. Yoo found that there are long-term changes
established in nutrients (N, P, Si, N:P) and in macrobenthos (biomass and
abundance ); meanwhile, there are no such changes established in the
diatom/dinoflagellate ratio, the phytoplankton biomass and productivity, and the
zooplankton biomass. Mr. Yoo then emphasised the need to establish a coherent
picture from nutrients, phytoplankton community and primary productivity to
zooplankton community and biomass and eventually to fish community and
productivity.
4.6
Having reviewed the historical data and trends as well as the environmental
problems, Mr. Mingyuan ZHU suggested the following two regional targets for
management actions with respect to Ecosystem: (i) to reduce the change of biomass
and abundance of plankton and benthos, and (ii) to reduce HAB events. To achieve
those regional targets, Mr. Zhu then suggested possible management actions: to
reduce the eutrophication, to strengthen monitoring by harmonising survey methods
and by introducing new technologies and monitoring approaches, to improve
assessment of eutrophication as well as carrying capacity.
4.7
Mr. Xianshi JIN reviewed historical data and identified overexploitation, over-capacity
of fishing fleets, ineffectiveness in fisheries management and climate change as the
major problems. Maximum sustainable yield (MSY) or rather a level set at less than
MSY, as the MSY of the ecosystem was likely to be less than the sum of the MSY of
individual species. He also suggested that the yield from a capture fishery should be
less than that the growth of the fish stock to conserve the spawning stock. He
warned that care was needed to avoid seriously affecting the Yellow Sea fishermen's
livelihoods. According to the China State Council, by 2010 the number of motorized
fishing boats and the marine fisheries catch in China will be cut by 10% and 15%,
respectively. Moreover, mariculture development will be controlled and techniques
improved to reduce environmental impact. By 2020 the number of motorized fishing
boats and marine fisheries catch in China will be reduced by 1/3, and harvesting
levels will meet the "surplus yield", implying that the stock levels are sufficient for
reproduction to maintain healthy fisheries resources. Meanwhile billions of fry will be
released into the sea for enhancement and sustainable mariculture will be reached.
4.8
Mr. Jang-Uk LEE also reviewed historical data, and found there was heavy
exploitation of fish stocks in the Yellow Sea, both the fishing effort and catch per unit
effort (CPUE) had increased since the 1980's and there appeared to be little scientific
basis for fisheries management actions. He also noted that China and Republic of
Korea (ROK) had differences in growth and reproductive parameters for individual
species. Acceptable Biological Catch (ABC) models were suggested as a method of
estimating sustainable yields. When ABC estimates of catch were compared with
actual catch data from the period 1998-2004 a 25% reduction in catch was required
to achieve this ABC. For mariculture there was an increase in both production and
cultured area. However, there was a decrease in production per unit area and no
expectation of increase in production with further increases in area.
4.9 Having employed three methodologies (retrospective, theoretical, comparative
analysis approaches), Mr. Quan WEN proposed several indices as potential regional
targets with respect to Pollution. Those indices included the international treaties
and conventions such as the Stockholm Convention and the MARPOL Convention;
the function-based environmental standard approach; and the maximum residue
limits (MRLs) for pollutants in foodstuffs. Mr. Wen further suggested management
actions to achieve those regional targets based on the Transboundary Diagnostic
Analysis (TDA). Those actions include the following:
UNDP/GEF/YS/AWG.1/3
Page 4
· Control of pollutants discharge from land-based sources;
· Management on ocean and coastal engineering;
· Control of pollution from sea-based sources; and
· Management on ocean dumping.
4.10 Mr. Dong Beom YANG presented his preliminary analysis of the historical data and
trends in terms of Pollution, reviewing the information about nutrients, heavy metals,
POPs, and HAB. Mr. Yang then proposed several options as management actions
as follows.
Nutrients
· Tertiary
treatment
· Management through TMDL approach (control by total maximum daily loads)
· Establishment of monitoring network for atmospheric input of nutrients
(control the emission of N if necessary)
HAB
· Reduction of the nutrients level
· Management of coastal bottom sediments to avoid growth-stimulating
substances (dredging if necessary)
· Control of ballast water against invasive species
5
BRAINSTORMING SESSION: IDENTIFICATION OF REGIONAL TARGETS
Initial consideration on regional targets with "enrichment of nitrite" and "decline in fisheries"
as examples
5.1
Having taken the regional environmental problems of "enrichment of nitrite" and
"decline in fisheries stocks" as examples, the participants brainstormed the reference
conditions as well as the regional targets.
5.2
Mr. Wen mentioned that according to the national policy, China has a plan to reduce
the total nutrient loading from point sources by 10 % every 5 years.
5.3
Mr. Yang stated that although there is an equivalent national policy in ROK, Ministry
of Environment has a regulation to reduce nutrient at point sources. The regulation,
though it does not specify a numerical target for the nutrient discharge to the marine
environment.
5.4
The Chairperson suggested having a sessional meeting with Mr. Wen and Mr. Yang
to prepare both the reference conditions and the regional targets. The meeting
agreed on the Chairperson's suggestion and to review the outputs from the sessional
meeting.
5.5
After the discussion, the sessional working group on Pollution presented the
following:
· It is difficult at this moment to suggest the optimal levels of nutrient
concentration and control of nutrient load, as well as the reference year. It is
necessary to recheck the historical data carefully before suggesting the
reference conditions and the regional targets. The Pollution working group
would like to suggest those at the 2nd Ad-hoc Working Group meeting.
UNDP/GEF/YS/AWG.1/3
Page 5
· Possible management actions might be to (i) develop a strategy for
monitoring pollutants, including those from atmosphere, ground water, and
resuspension; (ii) consider pollution loading; and (ii) control N emissions from
industries to the atmosphere.
5.6
The meeting thanked the efforts of the sessional working group to prepare the
suggestions. After further discussing this matter, the meeting agreed to use the
"historical reference year" as the reference conditions (the Pollution working
group will define the specific reference year by the 2nd Ad-hoc Working Group
meeting), and the "control of total loading to meet the reference year" as the
regional targets.
5.7
Referring to the presentations made by Mr. Jin and Mr. Lee, the meeting discussed
and agreed on setting "Maximum Sustainable Fisheries Yield (MSY)" and
"Allowable Biological Catch (ABC)" as the reference conditions for Fisheries.
The meeting also agreed to set the regional targets as the "25-30% reduction by
2020 in catch and fishing effort with respect to the average level of 1998-2004."
Consideration of regional targets of other identified regional priority problems
5.8
Following the successful identification of the reference conditions and regional
targets for Pollution and Fisheries, the Chairperson invited the participants to
consider how to proceed with other issues such as those relevant to Biodiversity and
Ecosystem. The meeting then decided to organise sessional meetings according to
the Project's Components, i.e., Biodiversity, Ecosystem, Fisheries, and Pollution;
have those meetings to prepare suggestions for the plenary session; and convene
sesssional meetings again, if necessary, when specific issues are raised, that require
technical considerations by a small group(s) of experts.
5.9
The sessional working group on Biodiversity, followed by that on Ecosystem,
presented discussion results, suggesting possible reference conditions and regional
targets.
5.10 The participants raised various questions and issues relevant to the suggested
reference conditions and regional targets, such as the clarification on the definition of
the "reference conditions," the legal status of the regional targets, the availability of
the data and information about genetic diversity, and the inclusion of species that are
engaged and not endangered. The participants agreed to use current
populations/distributions of endangered and endemic species as a reference
conditions for Biodiversity. Improvements on the current conditions were agreed as
the regional targets. Concerns were raised regarding the classification of
endangered species and data availability and list of endangered species. Current
area of habitats was accepted as reference condition and after some discussion on
the current position of both countries governments on coastal habitats it was agreed
that the maintenance of the current area of habitats (except approved
projects) according to standards and regulations of 2007 would be the
regional target.
5.11 Regarding Ecosystem, a diatom dominated community as the basis for a healthy
ecosystem was proposed as the reference condition. The participants suggested that
phytoplankton communities were always diatom dominated so this was not specific
enough. However, more recent data, that included picoplankton, suggested diatoms
formed approximately 20% of the community. A reference year of 1980's was
UNDP/GEF/YS/AWG.1/3
Page 6
agreed. It was agreed that the plankton communities cannot be influenced through
management actions within the Ecosystem component, and only by the relevant
management actions to control the N: P: Si ratio and by the fisheries management
actions to control the abundance of planktivorous fish. Therefore, provision of
better scientific understanding of the role of nutrient control on plankton
communities for adaptive management was proposed as the regional target
through monitoring and assessment. It was accepted that as zooplankton was
directly controlled by phytoplankton community structure then only a single category
of plankton was needed. High species diversity in the benthic community (1992
reference year) was proposed as the reference condition for benthic
abundance/biomass and diversity. Benthic diversity is very susceptible to changes in
nutrient/pollution concentrations in the sediment reflecting the historical record and
as such appropriate monitoring is warranted.
5.12 After clarifying the questions and issues raised and discussing further the
suggestions proposed by the sessional working groups, the meeting agreed on the
reference conditions and regional targets for Biodiversity and Ecosystem.
5.13 The meeting revisited the Fisheries and Pollution issues to refine the relevant
reference conditions and management targets.
5.14 The reference conditions for fisheries remained as MSY/ABC while Ecosystem
Based Fisheries Management (EBFM) was included to reflect the ecosystem
concerns of fisheries management. Regional targets for 2020 were set according to
the provisional estimated ABC calculated by Dr Lee Jang-Uk, which estimated a 25%
reduction in catch and fishing effort were needed to reach the ABC for the Yellow
Sea and the 30% reduction in fishing vessels agreed by China. Mariculture
reference conditions were slightly changed to optimal growth and survival of culture
organism and insignificant environmental impact. After some discussion, the regional
targets were changed to sustainable practices, polyculture and optimisation of the
cultured species and their distribution. Improvement in culture techniques was also
added as one of the regional targets.
5.15 For Pollution the international guidelines or directives of Codex/Stockholm
Convention/MARPOL were adopted, where appropriate, as both the reference
conditions and regional targets for respective pollutants. A historical reference of
circa 1990 was used a reference condition for nitrogen enrichment as this coincided
with both an ideal diatom-based community and low frequency of HABs. Control of
total loading of nutrients to meet the reference point was accepted as the regional
target. The silicate concentration was considered ideal in the 1980's in accordance
with the diatom-based community existing at the time; a regional target of an
improvement in the freshwater seasonal fluxes was set. Marine litter was introduced
as a new problem identified in the TDA, a historical reference condition of 1960's was
accepted after some discussion on an era when synthetic/plastic/nylon waste was
negligible. A regional target of reduced standing stock of litter was proposed. For
contaminants that affected the cultural and tourism services a "Blue Flag" system
was adopted as the reference condition and reduction of pollutants to nationally
acceptable levels for bathing beaches was accepted as the regional targets.
5.16 After having an extensive discussion, the meeting agreed on the relevant reference
conditions and management targets on Fisheries and Pollutions. Annex V
summarises the agreed reference conditions and regional targets with respect
to all the Project's objectives with respect to Biodiversity, Ecosystem,
Fisheries, and Pollution.
UNDP/GEF/YS/AWG.1/3
Page 7
6
DISCUSSION ON THE NEEDS OF ALTERNATIVE AND/OR SUPPLEMENTARY
APPROACHES (THE THEORETICAL AND COMPARATIVE ANALYSIS
APPROACHES) FOR THE REGIONAL TARGETS IDENTIFICATION
6.1
Following the successful identification of the regional targets based on the historical
data review and analysis, the Chairperson mentioned that it might not be necessary
for this meeting to introduce alternative and/or supplementary approaches (i.e., the
theoretical approach and the comparative analysis approach). The meeting agreed
with the Chairperson and agreed to consider the use of the alternative and/or
supplementary approaches, if necessary, to refine the regional targets along
with the identification of management actions.
7
DISCUSSION ON NECESSARY EXPERTISE AND WORK FOR AND DURING THE
2ND AD-HOC WORKING GROUP MEETING SCHEDULED TENTATIVELY FOR
AUGUST, 2007
7.1
The suggested management actions should result in the reaching of the regional
targets that agreed during this meeting. These actions would address any level of
the causes identified in the causal chain analysis during the TDA process, with most
emphasis on the root causes. The need to diversify the participants at the second
SAP Ad-hoc Working Group meeting was discussed. The inclusion of more socio-
economists, policy experts, and both national and local government was raised.
Finally it was agreed that the PMO will make a checklist for the preparation of
the 2nd ad hoc Working Group meeting to identified necessary management
actions. This list will be circulated to the participants for comments. The draft will be
revised based on those received comments and returned to participants for a final
check.
8 OTHER
BUSINESS
Law and policy consideration for SAP regional targets
8.1
The Chairperson invited Mr. Xiangmin XU to present the preliminary considerations
about regional target identification from the perspective of law and policy.
8.2
Mr. Xu summarised the review result of existing data and information, including not
only the root causes of environmental problems in the Yellow Sea, that were
identified in the TDA; but also the recommendations suggested in the national
governance analysis reports for China and ROK. Mr. Xu then proposed seven policy
targets with sets of possible management actions. The suggested policy targets
consist of:
· Regional co-operation established;
· Comprehensive legal framework established;
· Capacity in environmental decision-making enhanced;
· Education and research activities on the Yellow Sea strengthened;
· Public awareness about the environmental problems raised;
· Transparency in decision-making secured and improved; and
· Cultural value or services of the Yellow Sea secured.
UNDP/GEF/YS/AWG.1/3
Page 8
8.3
The meeting thanked Mr. Xu for his presentation that was comprehensive and
informative. The meeting expressed its willingness to consider during the SAP
preparation the proposed suggestions and actions, including the establishment of the
"Yellow Sea Commission" to strengthen the regional co-operation.
Regional Science Conference
8.4
As the Chairperson of the Organising Committee, Mr. Yoo chaired the session to
discuss the First Yellow Sea Regional Science Conference. Mr. Yoo, Co-
Chairperson of the Conference, introduced its background briefly, mentioning not
only the objective of the Conference but also the relationship between the
Conference and the other Project's activities, particularly the SAP development and
the Ad-hoc Working Group meeting. Mr. Yoo then invited the participants to consider
a draft programme of the Conference.
8.5
The meeting reviewed the draft programme and suggested speech topics and
speakers. Presented papers will consist of "invited papers" and "contributed papers."
The meeting agreed to invite 19 speakers to present the invited papers and 10
speakers to present the contributed papers. The call for abstracts will be
advertised for the contributed papers. A poster session might be organised,
depending on the number of abstracts submitted. The meeting noted that the
Organising Committee will review the abstracts and select the contributed
papers. The agreed programme is attached to this report as Annex VI. An agreed
workplan for the Conference preparation is as follows.
Task Responsibility
Deadline
Start inviting contributed Committee/PMO April,
2007
papers
Finalise the topics and Committee 30th April, 2007
speakers for invited papers
Evaluate/select contributed Committee 30th Jun, 2007
papers
Organise the Conference
Committee/PMO
14th-16th August, 2007
9
DATE AND PLACE FOR THE 2ND AD-HOC WORKING GROUP MEETING
9.1
The Chairperson informed the meeting that tentative dates and venue for the 2nd
SAP Ad-hoc Working Group meeting are 7th 9th August, 2007 in China. The
meeting agreed with this original plan and acknowledged that the detailed venue
will be decided after the discussion between the National Project Co-ordinator for
China and the PMO.
10
ADOPTION OF THE MEETING REPORT
10.1 The Chairperson invited the meeting to consider how to prepare and adopt the
meeting report. The participants suggested for the Secretariat, to prepare a draft
report, and circulate it after the meeting to the participants to review. The meeting
agreed with this suggestion: The PMO will send the draft report after the meeting
to the participants for their review. With comments from the participants given,
the report will be amended and adopted by the meeting.
UNDP/GEF/YS/AWG.1/3
Page 9
11
CLOSURE OF THE MEETING
11.1 The Chairperson thanked all the participants for their hard work, applauding the
meeting produced a number of substantial outputs, including the regional targets for
management actions.
11.2 The meeting closed at 15:30 hours on 12th April 2007.
UNDP/GEF/YS/AWG.1/3
Annex I
Page 1
Annex I
List of Participants
Surname in alphabetical order
PARTICIPANTS OF THE MEETING
Mr. JIN Xianshi
Ms. KANG Young Shil
Fishery Biologist
Chief, Fisheries Resources and Marine
Director of Fishable Resources & Ecosystem
Environment Team
Management Division
West Sea Fisheries Research Institute
Yellow Sea Fisheries Research Institute
(NFRDI)
106 Nanjing Road
707, Eulwang-dong, Jung-gu
Qingdao, Shandong, 266071
Incheon, 400-420
China
Republic of Korea
Tel: 86-532-584-9430/583-6344
Tel : 82-32-745-0550
Fax: 86-532-581-1514
Fax : 82-32-745-0549
Email: jin@ysfri.ac.cn
E-mail : yskang@nfrdi.re.kr
Mr. KWON Sukjae
Mr. LEE Jang-Uk
Senior Researcher
President of Korean Fisheries Society
Policy Research Department
Professor, Pukyong National University
Korea Ocean Research and Development
#599-1 Daeyeon 3-Dong, Namgu,
Institute
Busan, 608-737
1270 Sa-dong, Sangnok
Republic of Korea
Ansan City, Gyeonggi Province, 426-744
Tel. 82-51-343-3898
Republic of Korea
Fax: 82-51-622-3306
Tel: 82-31-400-6502
E-mail: julee0922@korea.com
Fax: 82-31-400-6505
Email: sjkwon@kordi.re.kr
Mr. WEN Quan
Mr. XU Xiangmin
Chief Scientist
Dean
SOA Key Lab of Coastal Ecosystem and
Law School of Ocean University of China
Environment Research
No. 23 Hong Kong Dong Road,
National Marine Environmental Monitoring
Qingdao, Shandong Province, 266071
Center
China
42 Linghe Street
Tel. 86-532-8590-1857
Dalian, Liaoning 116023
Fax. 86-532-8590-1851
China
Email: xuxiangmin58@hotmail.com
Tel: 86-411-8478-2522
Fax: 86-411-8478-2522
Email: qwen@nmemc.gov.cn
Mr. YANG Dong Beom
Mr. YOO Sinjae
Principal Research Scientist
Senior Research Scientist
Korean Ocean Research and Development
Marine Living Resources Research Division
Institute
Korean Ocean Research and Development
1270 Sa-dong Sangnok-gu Ansan-si
Institute
Gyeonggi-do 426-744
1270 Sa-dong Sangnok-gu Ansan-si
Republic of Korea
Gyeonggi-do 426-744
Tel: 82-31-400-6157
Republic of Korea
Fax: 82-31-408-4493
Tel: 82-31-400-6221
UNDP/GEF/YS/AWG.1/3
Annex I
Page 2
Email: dbyang@kordi.re.kr
Fax: 82-31-408-5934
Email: sjyoo@kordi.re.kr
Mr. ZHANG Xuelei
Mr. ZHU Mingyuan
First Institute of Oceanography
Professor
6 Xianxialing Road Hi-Tech Industrial Park
First Institute of Oceanography, SOA
Qingdao, Shandong 266001
6 Xianxialing Road Hi-Tech Industrial Park
China
Qingdao, Shandong 266001
Tel: 86-532-8896-7476
China
Fax: 86-532-8896-7548
Tel: 86-532-8896-7548
Email: zhangxl@fio.org.cn
Fax: 86-532-8896-7447
Mobile: 86-136-0898-3422
Email: myzhu@public.qd.sd.cn
PROJECT MANAGEMENT OFFICE (PMO)
Mr. Yihang JIANG
Mr. Isao ENDO
Project Manager
Environmental Economics Officer
UNDP/GEF Yellow Sea Project
UNDP/GEF Yellow Sea Project
Korea Ocean Research and Development
Korea Ocean Research and Development
Institute
Institute
1270 Sa-dong Sangnok-gu Ansan-si
1270 Sa-dong Sangnok-gu Ansan-si
Gyeonggi-do 426-744
Gyeonggi-do 426-744
Republic of Korea
Republic of Korea
Tel: 82-31-400-7825
Tel: 82-31-400-7793
Fax: 82-31-400-7826
Fax: 82-31-400-7826
email: yihang@yslme.org
Email: isao@yslme.org
Mr. Mark WALTON
Mr. Sungjun PARK
Environmental Specialist
Finance & Administrative Officer
UNDP/GEF Yellow Sea Project
UNDP/GEF Yellow Sea Project
Korea Ocean Research and Development
Korea Ocean Research and Development
Institute
Institute
1270 Sa-dong Sangnok-gu Ansan-si
1270 Sa-dong Sangnok-gu Ansan-si
Gyeonggi-do 426-744
Gyeonggi-do 426-744
Republic of Korea
Republic of Korea
Tel: 82-31-400-7832
Tel: 82-31-400-7828
Fax: 82-31-400-7826
Fax: 82-31-400-7826
Email: mark@yslme.org
Email: sungjun@yslme.org
Mr. Kap-Sung SONG
Driver
UNDP/GEF Yellow Sea Project
Korea Ocean Research and Development
Institute
1270 Sa-dong Sangnok-gu Ansan-si
Gyeonggi-do 426-744
Republic of Korea
Tel: 82-31-400-7826
Fax: 82-31-400-7826
email: kapsung@yslme.org
UNDP/GEF/YS/AWG.1/3
Annex I
Page 3
OBSERVER
Mr. HUH Hyung-Tack
Mr. TOBAI Sadayosi
Sr. Scientist Emeritus, KORDI
Yellow Sea Ecoregion Planning Programme
Fellow, Korean Academy Of Science &
Ecoregion Coordinator
Technology
WWF Japan
Chairman, IOC/WESTPAC
Nihonseimei Akabanebashi Bldg., 6Fl.
Korea Ocean Research and Development
3-1-14 Shiba Minto-ku
Institute
Tokyo, 105-0014
1270 Sa-dong Sangnok-gu Ansan-si
Japan
Gyeonggi-do 426-744
Tel: 81-3-3769-1783
Republic of Korea
Fax: 81-3-3769-1717
Tel: 82-31-400-6201
Email: tobai@wwf.or.jp
Fax: 82-31-408-5934
Email: hthuh@kordi.re.kr
Mr. Suh-Yong CHUNG
Professor
/Member of International Committee
College of Law
Myongji University
50-3 Namgajwadong, Seodaemongu,
Seoul, 120-728
Republic of Korea
Tel: 82-2-300-0818
Fax: 82-2-300-0804
Email: mahlerchung@yahoo.com
UNDP/GEF/YS/AWG.1/3
Annex II
Page 1
Annex II
List of Documents
Working Documents
UNDP/GEF/YS/AWG.1/1
Conceptual Procedure for SAP Preparation
UNDP/GEF/YS/AWG.1/2
Report on Preliminary Regional Targets with Respect to
the Project's Objectives of:
Biodiversity China (1/2a-prc), R. Korea (1/2a-rok)
Ecosystem China (1/2b-prc), R. Korea (1/2b-rok)
Fisheries China (1/2c-prc), R. Korea (1/2c-rok)
Pollution China (1/2d-prc), R. Korea (1/2d-rok)
UNDP/GEF/YS/AWG.1/3
Report of the Meeting (to be prepared at the meeting)
UNDP/GEF/YS/AWG.1/4
Draft Structure of SAP for the Yellow Sea
UNDP/GEF/YS/AWG.1/5
Provisional Agenda
Information Documents
UNDP/GEF/YS/AWG.1/inf.1 ver.1
Provisional List of Documents
UNDP/GEF/YS/AWG.1/inf.2 ver.1
Provisional List of Participants
UNDP/GEF/YS/AWG.1/3
Annex III
Page 1
Annex III
Agenda
1.
Opening of the meeting
2.
Brief introduction of the background and the Document, "Conceptual Procedure
for SAP Preparation"
3.
Expected outputs from the 1st Ad-hoc Working Group Meeting
4.
Presentation by regional experts on preliminary regional targets with respect to
the Project's objectives (Biodiversity, Ecosystem, Fisheries, and Pollution)
5.
Brainstorming session: Identification of regional targets
6.
Discussion on the needs of alternative and/or supplementary approaches (the
theoretical and comparative analysis approaches) for the regional targets
identification
7.
Discussion on necessary expertise and work for and during the 2nd Ad-hoc
Working Group Meeting scheduled tentatively for August, 2007
8. Other
business
9.
Date and place for the 2nd Ad-hoc Working Group Meeting
10.
Adoption of the meeting report
11.
Closure of the meeting
UNDP/GEF/YS/AWG.1/3
Annex IV
Page 1
Annex IV
Report on Preliminary Regional Targets with Respect to the Project's
Objectives of:
Biodiversity China, R. Korea
Ecosystem China, R. Korea
Fisheries China, R. Korea
Pollution China, R. Korea
Biodiversity China
Report
On Preliminary Regional Targets
With Respect to the Project's Objectives
Of Biodiversity
by
ZHANG Xuelei
First Institute of Oceanography
Preliminary Identification of EcoQOs for Regional SAP in the YSLME:
Biodiversity
Xuelei Zhang
(First Institute of Oceanography, SOA, CHINA)
1. Trends and Status
The major issues of biodiversity, identified by the working group of biodiversity,
include the issues of habitat, species, genetics and management. Among these issues,
habitat degradation ranks top and is identified in TDA as one of the major five problems
affecting carrying capacity of the Yellow Sea.
There are two sources of habitat degradation: loss and conversion, of which
conversion is regarded more significant. Environmental change due to pollution and
reduced freshwater discharge degrade some habitats. Salt pans and inappropriate
aquaculture may also convert critical coastal habitats. Such conversion of habitat has
been expanded at large scale and more or less stabilized now in coastal areas with
shallow waters and wide tidal flats. Habitats loss mainly occurs as a result of coastal
reclamation, which has widely happened from the north to the south, with a smaller but
still significant development now due to requirement from the coastal urbanization and
industrialization.
There are more than thirty vulnerable species, either endangered or declined
seriously. These species are critical to sustain the provisioning and cultural services of the
YSLME. Apart from the species that are major components in fisheries (capture or
culture), there is limited information on the status or trends of vulnerable species.
It is estimated that about 200 marine species have been introduced, of which around
thirty species now successfully inhabit either in aquaculture systems or in the wild. As
economic globalization develops and marine transportation increases, risk of introducing
alien species from ship ballast water will continue to grow. With the increasing market
demand, more species might also be introduced for aquaculture.
There are not many species identified as endemic, but most of them are at less
favored status if not endangered. This is mainly because their habitats are located in
coastal waters where impacts from anthropogenic activities are easily to reach.
Genetic diversity is an important issue; nonetheless lack of information makes it
difficult to assess the status and trend. From the available information, however, it could
be inferred that, decline of wild populations, isolation or motivation of gene flows
through practice of artificial breeding/culture, are posing critical threatens to genetic
diversity.
Biodiversity management is also facing problems. The existing regulations needs to
be strengthened, and implementation requires facilitation. A typical case is that there are
some existing reserves/protected areas at different governmental levels and under
different governance sectors, but there is little communication between these reserves and
they are largely isolated rather than joined as a network, even though the existing
conserved area is so small compared to the proposed area to protect (Fig. 1). Furthermore,
some of these reserves are not properly operated due to lack of public involvement.
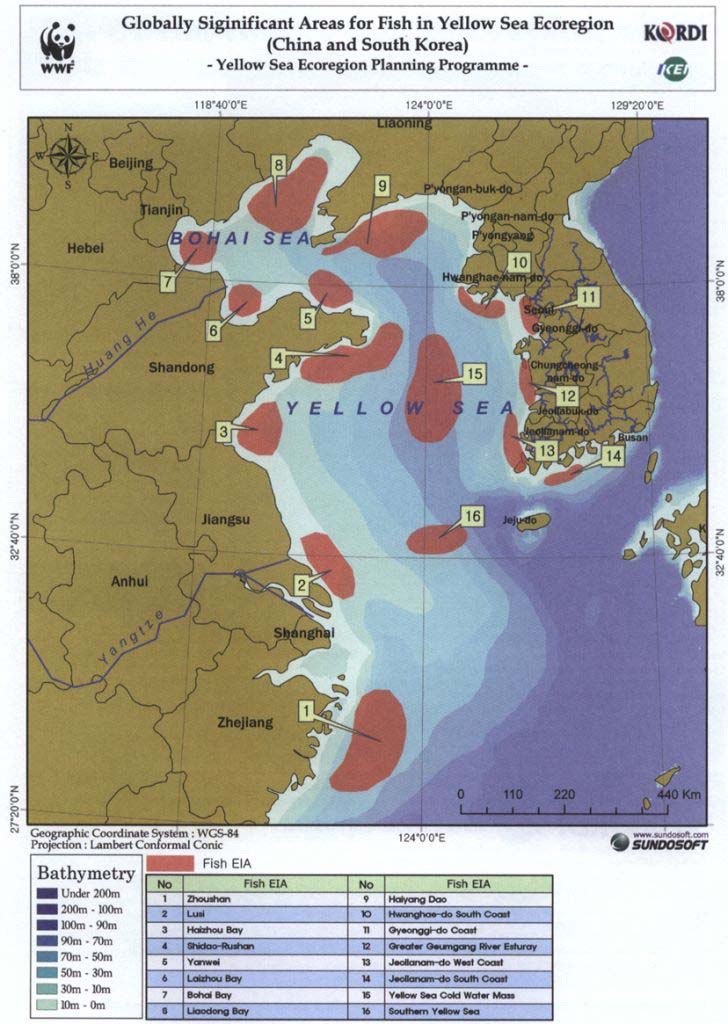
Figure 1. Important habitats with potential to conserve (WWF, Yellow Sea Ecoregion Planning
Programme, 2006).
2. Suggested Options of EcoQOs
The suggested overall EcoQO is to minimize, stop or even reverse the trend of
biodiversity degradation, so that the YSLME sustain its ability to provide provisioning,
supporting and cultural services. Specific options are listed in the following table:
Ecosystem Services
EcoQO
Provisioning services
Build a well linked network of conservation, in order
To protect the most vulnerable species.
Build a gene pool library, in order
To conserve the most valuable and endangered
genetic resources.
Supporting
Strictly minimize new reclamation in order
To maintain critical habitats of biotic resources.
Partially recover some converted habitats, in order
To maintain critical habitats of biotic resources.
Build a well linked network of conservation, in order
To protect the most vulnerable species;
To protect the endemic species; and
To maintain critical habitats of biotic resources.
Minimize introduction of alien species in order
To conserve local biodiversity.
Cultural services
Build a well linked network of conservation, in order
To protect the most vulnerable species;
To protect the endemic species;
To maintain critical genuine habitats; and
To attract public awareness and involvement.
Biodiversity Republic Of Korea
Report
On Preliminary Regional Targets
With Respect to the Project's Objectives
Of Biodiversity
By
Kang, Young Shil
West Sea Fisheries Research Institute, NFRDI, MOMAF
Report
On Preliminary Regional Targets with Respect to the
Project's Objectives of Biodiversity
Prepared by Kang, Young Shil
April , 2007
PROJECT TITLE: Reducing Environmental Stress in the Yellow Sea
Large Marine Ecosystem
CONTRACT No.: SAP-7-ECOQO-1220-kang
OFFICE: West Sea Fisheries Research Institute, NFRDI, MOMAF, Korea
CONTRACTOR: Young-Shil KANG
PROJECT PERIOD: 13 March, 2007 30 April, 2007
TABLE OF CONTENTS
I. Introduction
II. Trends and the Current Situation of Biodiversity in the Yellow Sea
III. Suggestion of Region Target
I. Introduction
The goal of this report is to give some ideas for making the regional Ecosystem
Quality Objectives in Biodiversity Component. It is written according to the Conceptual
procedure for Strategic Action Program (SAP), and consists of three parts, Inroduction,
Trends and the Current Situation of Biodiversity in the Yellow Sea and Suggestion of
Regional Target.
The data and information collected were analyzed and summarized to figure out
trends and the current situation of biodiversity. Based on the trends and current situation,
regional targets are suggested in here.
II. Trends and the current situations of biodiversity in the Yellow Sea
Biodiversity issues focused on five important categories, such as habitat status,
species introduced for aquaculture, exotic species, endemic species and vulnerable
species. It is very difficult to define an endemic species because there is no long-term
historical data of each species. Thus, the species recorded in the Yellow Sea and the
other Seas is referred as a general species (cosmopolitan species). The data and
information of major marine organism groups are analyzed.
Habitat Status
Habitat is covered by three parts, estuaries, bays and tidal flats in the Yellow Sea.
Habitat loss in the YS is mainly due to the reclamation of tidal flat and construction.
The tidal flat of west coast of Korea is occupied more than 80% of all tidal flats around
Korean peninsula. However, it has been dramatically developed after the first
reclamation in the Gangwha Island about 800 years ago. Since the 1970s, tidal flat
reclamation were accelerated and spread across the entire tidal flats. Approximately
30% of the total tidal flats were lost by reclamation in Korea. From the late 1980's, the
government shifted its wetland policy from development to conservation. A new
Wetland Conservation Act and related laws/regulation have been enacted.
Species introduced for aquaculture
A total of 11 species are introduced to Korea as aquaculture species. It is consist of
seven species of fishes, three species shellfish and one species of shrimp. Of these
eleven species, five are exotic (non-indigenous) with three species of finfish, one
species of shellfish and one species of shrimp. The other seven species are indigenous in
Korean and were reported from Korean waters. Among them, only two species of fishes
and one species of shrimp are currently cultured on commercial scales.
General species (Cosmopolitan species)
It is defined as the species reported in the Korean waters and the other area.
Seaweed was identified to 199 species (28 Chlorophyta, 50 Phaeophyta and 121
Rhodophyta). Seaweed flora tends to become tropical with time because of global
warming.
A total of 587 phytoplankton species (11 Cyanobacteria, 5 Cryptophyta, 153 Dinophyta,
383 Heterokontophyta, 7 Haptophyta, 6 Euglenophyta, 22 Chlorophyta) were listed up
in the west coast of Korea. The major occurring specie was diatoms in the 1930s and
dinoflagellates, crysophytes and diatoms in the 1960s. Diatoms were the major
occurring species, followed by dinoflagellates and flagellates during 1980's to 2000's.
Zooplankton was identified to 18 taxonomical groups and larvae. Of these groups,
copepods were the most diversity in species composition, followed by chaetognaths and
mysids. 101 species of copepods were recorded in the west sea of Korea. On the other
hand, 34 species of jellyfish were listed up even though the research has been stared
since the early 2000s. Aurelia aurita and Nemopilema nomurai are common species.
A total 206 molluscan species were listed. They were included to two major groups,
such as gastropod species (top shells and whelks etc., 182 spp.) and cephalopod species
(squids and cuttlefishes etc., 24 spp.). 20 echinoderm species were identified. Of these,
bat seastar, Asterias pectinifera and a few brittle star, Myophiurida species
predominated in the coastal area. Decapod species were identified to 148 species (94
species of crab and 54 species of shrimp. There are problems in identification for
echinoderms and decapods because of very limited expert pool. However, in recent,
species diversity of decapods tends to increase due to increasing of taxonomic efforts.
A total 101 fish species were identified as a general species with regarding their specific
habitat and stocks.
Exotic species
So far, the exotic species has been recorded one species of echinodermats, seven
species of fishes and two species benthos in the Yellow Sea. Asterias ammurensis is an
exotic echinoderm species regarded transferred from Japan. The seven exotic fish
species are introduced through aquaculture farming and resources enhancement.
Although it is difficult to define the exotic benthos, Polychaete and bivalve species, the
potential exotic species are suggested in here. Perinere sp. is being imported from China,
so there is possibility that this species is different from the species produced in the
Korean coastal area of Yellow Sea. Mytilus edulis could be considered as potential
exotic species. Because no data about when, where and how this species could be
installed in the Korean coastal are of Yellow Sea.
Endemic species
In zooplankton, some copepods (zooplankton), Acartia hongi and Acartia bifilosa,
are recently recorded as a new species in the Korean coast of Yellow Sea. However,
there is no information whether they are exotic species or not. However, A. hongi is a
possible endemic species because its record is limited to Yellow Sea, so far.
A total 15 polychaetes species were reported as endemic species living near coastal area
in the Yellow Sea, Korea.
Vulnerable species
A total 28 fish species were suggested as the vulnerable species, of which
commercially landings decreased or largely fluctuated, or the stock sizes would be small
to get damage easily by the changes of habitat environments, threatened and/or
protected species. The vulnerable fish species were mainly affected by overexploit and
habitat deterioration.
Birds have recently become vulnerable in the Yellow Sea ecosystem due to not only loss
and deterioration of habitat but also disturbance by human activities. A total vulnerable
bird species is 19.
In benthos (Polychaetes and bivalves), three species were considered as a vulnerable
species by experts even though there are no vulnerable species on the lists of IUCN and
Korean vulnerable species. They are Perinereis aibuhitensis (Polychaeta), and Meretrix
lusoria and M. petechialis (Bivalve).
Over 30 species of marine mammals historically appeared in the Yellow Sea according
to the marine mammal field guide book, FAO. However, a total of 9 species of marine
mammals are recently listed in the Yellow Sea.
III. Suggestion of Region Target
Based on the trends and current situation of biodiversity in the Yellow Sea, the
regional target is suggested in here.
A. Change in representative biodiversity index
Biodiversity indices are essential to figure out species composition, abundance and
dominant in the ecosystem. It is very useful to diagnose the trends and current situation
of biodiversity and to make policy for biodiversity conservation.
B. Loss of habitat
Habitat loss is very important issue to keep biodiversity. Because it directly affects the
species composition and abundance etc.
Ecosystem - China
Report
On Preliminary Regional Targets
With Respect to the Project's Objectives
Of Ecosystem
by
Mingyuan ZHU and Ruixiang LI
First Institute of Oceanography
Preliminary Regional Targets with respect
to the Ecosystem Component
Mingyuan ZHU and Ruixiang LI
March 27, 2007
1
I Historical data and trends
In the ecosystem component, main concern focuses on the phytoplankton,
zooplankton and benthos at lower trophic level and environmental problem of red tide
(HAB).
1. Phytoplankton
1.1 Species composition
In the Yellow Sea there are about 500 phytoplankton species (including variant
types). This umber is more than that in Bohai Sea and lee than that in east China Sea.
Table 1 Composition of phytoplankton in Yellow Sea.
Phylum
No. genus
No. species
Bacillariophyta 71
418
Pyrrophyta 13 65
Chrysophyta 1 2
Chlorophyta 2 2
Cyanophyta 1 1
Euglenophyta 1
1
Chromophyto 2
2
total 91
491
But, the species number in the sample from 4 seasonal cruises of a research
project are often only 200. Though there were only 63 species in samples from cruises
during 1998-2000, it could not be referred to there is a decrease trend in Yellow Sea.
In samples from one cruise in spring of 2006, there were 110 species.
Table 2 Number of phytoplankton species identified in Yellow Sea in different years
Season Spring
Summer
Autumn
Winter
Total
Year
1984 1998 2005 1984 1998 1984 1998 1984 1998 1959 1984 1998
Diatoms
78 22 99 89 44 85 42 109 42 168 160 55
Dinoflagellates
17 8 16 15 8 28 7 11 5 32 36 8
2
There is a seasonal pattern for the succession of dominant species of phytoplankton
The dominant species in spring include Bacteriastrum hyalinum Chaetoceros
densusCh. castracaneiNitzschia paradoxaand Ch.tortissimus
In summer, Chaetoceros affinisCh.s compressusCh. pseudocurvisetusCeratium
spp, Eucampia zoodiacus, Streptothece thamesis
in autumn, Chaetoceros pseudocurvisetusEucampia zoodiacus, Ch. affinisCh.
compressusRhizosolenia alata f. gracillimaNitzschia paradoxaNitzschia pungens
in winter, Nitzschia pungensBacteriastrum hyalinumThalassionema nitzschioides
Ch.debilisCh.castracanei Ch.s compressus Ch. densus
There is no clear change of this pattern from historical data.
1.2 Seasonal variation of phytoplankton abundance
There are two peaks in seasonal variation pattern of phytoplankton in Yellow Sea.
The high peak is in winter or early spring. The second peak in summer. The abundance after
the high peak is lowest in late spring (Fig. 1).
600
1959
)
500
1984
3 /m
1998-00
4
400
10
300
200
abundance(*
100
0 Spring Summer Autunm Winter
season
Fig. 1 The seasonal and interannual variation of phytoplankton abundance
Since 2001, the abundance of phytoplankton in spring became much higher than that in
earlier years. It may attribute to the acceleration of eutrophication process and global
warming.
3
Table 3. The cell abundance of phytoplankton in Yellow Sea (×104 cells/m3)
Year Spring
Summer
Autunm
Winter
Mean
Data
source
1959
77.29 354.90 20.40 441.53 223.53 [1]
1984-1985
27.6 254.0 109.4 577 242 [9,
11]
1998-2000
7.96 20.17 2.24 18.24 12.94 [18,
19,
25]
2000
9.54
FIO
2001
777.06
FIO
March
2005
1334.3
FIO
May
2005
2.59
FIO
April
2006
2027.66
FIO
1.3 The horizontal distribution of phytoplankton abundance
There is a clear patchiness distribution of phytoplankton. The location of high value
areas are coastal water of Liaoning Province in North Yellow Sea, coastal water near Qingdao
City and Dasha Fishing Ground in the north of Changjiang River Estuary. But the distribution
pattern also varies with seasons.
40
40
39
39
38
38
37
37
36
36
35
35
34
34
33
33
32
32
31
31
117 118 119 120 121 122 123 124 125 126 127 128 129 130 117 118 119 120 121 122 123 124 125 126 127 128 129 130
a) Summer b) Autumn
40
40
39
39
38
38
37
37
36
36
35
35
34
34
33
33
32
32
31
31
117 118 119 120 121 122 123 124 125 126 127 128 129 130 117 118 119 120 121 122 123 124 125 126 127 128 129 130
c) Winter d) Spring
Figure 2 Distribution of Phytoplankton in Yellow Sea in 1984 (104cell/m3)
4
In 1984, the high value in summer was in coastal water of Liaoning Province (Fig. 2a).
That in autumn was in middle of Yellow Sea (Fig. 2b). In winter, there were two high value
area, one was in North Yellow Sea, the other from coastal water of Qingdao to the north of
Jiangsu coastal water (Fig. 2c). It was quite even in spring (Fig. 2 d).
a) Spring b) Winter
c) Summer d) Autumn
Figure 3. The distribution of phytoplankton in Yellow Sea in 1998~2000 (cell/m3)[30]
5
The phytoplankton abundance in Yellow Sea during 1998~2000 (Fig. 3) was much lower
than that in 1959 and 1984. In spring, the high value area was in east of Bohai Strait, in
summer, high value area was in southern Yellow Sea. The most abundant area situated in
coastal water of Liangyungang City and south of Shidao City and low value area in middle of
Yellow Sea. In autumn, high value area was in Estuary of Yalu River in North Yellow Sea and
Bohai Strait. In winter, the abundance was high in deep water area in middle of Yellow Sea.
In 2005, there was a big difference between the phytoplankton abundance in early
spring (March) and late spring (May).The distribution pattern showed that the abundance in
North Yellow Sea was higher than that in South Yellow Sea and that in coastal water was
higher than in offshore water (Fig4, Fig. 5).
o N
o N
40
40
o
o
39
39
o
o
38
38
5000
o
5000
o
37
37
1000
1000
o
o
36
500
36
500
250
250
o
o
35
10
100
35
100
50
50
o
o
34
34
25
25
o
10
o
10
33
33
5
5
o
o
32
32
o
o
o
o
o
o
o
o
o
o
o
o
120
121
122
123
124
125 E
120
121
122
123
124
125 E
Figure 4. Phytoplankton abundance in Yellow Figure 5. Phytoplankton abundance in Yellow
Sea in March 2005 (104cell/m3).
Sea in May 2005 (104cell/m3).
6
In April, 2006, the abundance of phytoplankton ranged 3.04-26308.33×104 cells/m3 for
the whole survey area (Fig. 6). The high value was close to level of red tide. In both east of
Bohai Strait and Haizhou Bay, the abundance was over 2×10⁸ cells/m3. In east of Bohai Strait ,
the dominant species was Skeletonema costatum and in East of Haizhou Bay, Eucampia
zoodiacus.
oN
40
o
39
o
38
5000
o
37
1000
o
36
500
250
o
35
100
50
o
34
25
o
10
33
5
o
32
o
o
o
o
o
o
120
121
122
123
124
125 E
Figure 6. Phytoplankton abundance in Yellow Sea in April 2006 (104cell/m3).
2. Chlorophyll a (chl-a) and primary productivity
2.1 Chl-a
During 1998-2000, the mean content of chl-a in the water column of Yellow Sea was
0.57 mg/m3 within a range of 0.03-5.74 mg/m3 (Fig. 7). The chl-a level was highest in spring
and lowest in autumn, but the difference of 0.66mg/m3 to 0.44 mg/m3 was not very big.
0.7
0.6
)
0.5
3
g/m
0.4
0.3
hl-a(m
c
0.2
0.1
0
spring
summer
autumn
winter
Seasons
7
Figure 7 The seasonal chl-a in the Yellow Sea in 1998~2000.
The high value area of chl-a in summer and autumn was located in south part of
southern Yellow Sea and east of Bohai Strait of North Yellow Sea. In winter and
spring, it was in North West and North part of North Yellow Sea and East of Jiazhou
Bay and Haizhou Bay. It was coincided with the results of 1984~1985.
2.2 Primary productivity
The annual average primary productivity in Yellow Sea was 490 mgC·m-2·d-1.
during 1998-2000. Primary productivity was higher in spring and summer and lower
in winter (Fig. 8). The assimilation number was 3.45 mgC·mgchl-a·h-1, which was a
little lower than that of 3.7mgC·mgchl-a·h-1, mean value for world ocean This results
is consistent with the previous study.
60
700
mgC/m2/h
50
600
mgC/m2/d
500
40
2
/
h
400
2
/
d
/
m 30
/
m
C
C
300
mg
mg
20
200
10
100
0
0
spring summer
autumn
winter
season
Figure 8 The seasonal variation of primary productivity in Yellow Sea in 1998~2000.
Compared with adjacent waters, primary productivity in Yellow Sea was higher than that in
Bohai Sea and lower than that in East China Sea in 1984 -1985( Table 4).
8
Table 4 The comparison of primary productivity in Yellow Sea and its adjacent waters
(mgC·m-2·d-1)
Region spring
summer
autumn
winter
mean
Bohai
Sea
309 468 305 151 308
Yellow
Sea
625 596 369 111 425
North East China Sea
1248
1000
403
103
689
3. Zooplankton
3.1 Species compositions
There are 256 zooplankton species recorded, which belong to eleven groups and 123
genera (Table 5). Among the 11 groups, species number and biomass of Copepoda are the
highest, and it plays important role in food web.
Table 5 The species composition of zooplankton in Yellow Sea
Group
No. genus
No. species
Hydromedusa 49
65
Ctenophora 4
4
Cladocers 3
4
Copepoda 30
98
Mysidacea 18
30
Euphausiacea 2
14
Sergestinae 2
8
Amphipoda 1
1
Chaetognatha 1
11
Tunicata 14
21
Gastropoda 1
1
Total 123
256
From 1950's to 1990's, the species compositions of zooplankton had been changed (Table
6). The species number of zooplankton in the Yellow Sea was 88 in 1958-59, 133 in 1980's
and only 50 in 1998-2000.
9
Table 6. Zooplankton species numbers in the Yellow Sea in different years
Group 1950's
1980's
1990's
Hydromedusa 29
39
Ctenophora 3 2
Cladocers 4 3
Copepoda 28 69 27
Mysidacea 6 6
5
Euphausiacea 3
2
3
Sergestinae 2 4
2
Amphipoda 1 1
5
Chaetognatha 8
3
4
Tunicata 4
Decapoda
4
Gastropoda
1
Total
88
133 50
The species composition of zooplankton in the Yellow Sea was simpler compared to that
in the East China Sea, but was more complex than that in the Bohai Sea. The species
composition and distributions reflects the water masses and currents in the Yellow Sea. The
warm-temperature-zone neritic species are associated with the coastal currents. The
low-temperature and high-salinity species exist in the Yellow Sea Cold Water Mass in the
central Yellow Sea. Warm-water and tropical species are transported by the Yellow Sea Warm
Current. Euphausia pacifica and Themisto gracilipes are indicative species to the Yellow Sea
Cold Water Mass. Sagitta enflata, Acrocalanus gibber and Eucalanus attenuatus are
indicative species to the Yellow Sea Warm Current. There is no clear change trend of
dominant species composition from historical data.
3.2 Seasonal variation of zooplankton biomass
Seasonal variation of zooplankton biomass shows a double peak type. In general, the peaks
occur in spring and autumn. But there is a winter peak in 1984-85. The seasonal variation of
zooplankton biomass in Yellow Sea is shown in Fig. 9. In 1958-59, zooplankton biomass is
highest in spring and lowest in summer. However, zooplankton biomass is highest in winter of
1984-85. The average zooplankton biomass is highest in 1958-59, being 115 mg/m3.
Zooplankton biomass decreased to 65.95 in 1984-85 and is only 42.45 in 1998-2000.
Zooplankton biomass in 1984-85 and 1998-2000 was only 57% and 37% of the average
biomass in 1958-1959. From the results of these 3 surveys, there was clearly a decreasing
trend for the zooplankton biomass in the Yellow Sea. However, the results from a joint survey
conducted by Marine Science and Technology Institute, Inha University of Korea and
Institute of Oceanology, Chinese Academy of Sciences showed that Zooplankton biomass in
10
spring and summer were 280.5 mg/m3 and 216.7 mg/m3 respectively in Yellow Sea in 1992,
which is much higher than previous results. The reason of this difference needs further
studies.
180
1958~1959
160
)
1984~1985
3
140
g
/
m 120
1998~2000
100
a
s
s
(
m
80
o
m
60
Bi
40
20
0
Spr i ng
Summer
Aut umn
Wint er
Season
Figure 9. Seasonal variation of zooplankton in different years in Yellow Sea.
3.4 Spatial distribution of zooplankton biomass
In the Yellow Sea, spatial distribution of zooplankton biomass had a downward trend from
south to north (Table 7). Zooplankton biomass was higher in the south area than in the
middle area and in the middle area than in the north.
Table 7 Biomass of zooplankton (mg/m3) in Yellow Sea
Region Year
Spring
Summer
Autumn
Winter
Mean
North
1958~1959
117 50 110 103 95
(north to 37°N) 1998~2000
12.9 50.1 16.8 30.0 28.8
Middle
1998~2000
14.3 45.4 33.7 24.4 31.7
(34°~37°N)
South
1998~2000
134.7 27.1 84.9 35.1 74.3
(south to 34°N)
(south to 37°N)
1958~1959
185 125 61 75 112
1992
280.5
216.7
11
4. Macrobenthos
4.1 Species composition
One thousand and sixty-nine species from fourteen phyla (excluding macroalgae) have
been recorded as benthos in the Yellow Sea , among which most species (412) are molluscs,
less species (339) are polychaetes, 197 are crustaceans, 49 are echinoderms and the rest 72
species belong to the phyla Coelenterata, Platyhelminthes, Nematinea, Nematoda, Sipuncula,
Brachiopoda, Hemichordata and Chordota (Table 8). The number of identified species ranged
from 200 to 400 during year round benthic sampling, and the number of benthic species was
higher in Spring and Summer than that in Autumn and Winter (Table 9). Polychaetes were
most dominant in terms of density, whereas mollusks and crustaceans weighed out in terms of
biomass.
Table 8. The species grouping of benthos in the Yellow Sea[1~20, 22].
Group Polychaetes
Molluscs
Crustaceans Echinoderms
Others Total
Species 339
412
197
49
72
1069
Table 9. Seasonal species numbers of benthos in the Yellow Sea during 1998~2000[22~24].
Season Polychaetes
Molluscs
Crustaceans
Echinoderms
Others Total
Spring 125
47
52
13
10
247
Summer 103
46
41
9
7
206
Autumn 88
19
54
9
11
181
Winter 92
30
34
13
9
178
Total 194 86 90
21
23 414
4.2 Biomass composition and its seasonal variation
The average biomass of macrobenthos was 37.17g/m2 in the Yellow Sea during
1998~2000, of which echinoderms and polychaetes biomass was higher (>10g/m2) and
biomass of each other groups was below 5 g/m2 (Table 10). The order of seasonal average
biomass of macrobenthos was spring 50.75 g/m2 >autumn 35.35g/m2 >summer 32.64g/m2
>winter 29.94 g/m2.
12
Table 10. The biomass (g/m2) of benthos in Yellow Sea [17, 21-24]
Year/season Polychaetes
Mollus
Crustacean Echinoder
Others Total
spring 11.07
8.54 3.81
18.99
8.6
50.75
summer 10.49
3.19
6.50
6.41
6.07
32.64
1998~00 autumn 10.75
1.78
2.56
11.56
8.69
35.35
winter 7.89
3.69 1.56
9.48
7.33 29.94
mean 10.05
4.30 3.61
11.61
7.67 37.17
spring 3.33
6.85 1.5
12.59
4.93 29.2
1992
autumn 4.33
4.44
1.6
3.42
1.46
15.25
1984~85 mean 5.79
5.64
<1
3.63
<16.1
4.3 Density composition and its seasonal variation
The average density of macrobenthos was 250 ind./m2 in the Yellow Sea during
1998~2000, of which polychaetes (143 ind./m2) accounting for 57% of the total density while
crustaceans (44 ind./m2) and molluscs (38 ind./m2) ranked the next and echinoderms density
(13 ind./m2) was the lowest (Table 11). The density was highest in spring for the whole
benthos (359 ind./m2) and for the different groups except for molluscs and others that peaked
in winter. Comparing with the data from the year of 1984~85 and 1992, the polychaete
density and total density of macrobenthos has both increased by more than 20%.
Table 11. The density (ind./m2) of benthos in Yellow Sea [17, 21-24]
Year/season Polychaetes
Molluscs Crustaceans Echinoderms Others Total
spring 202
57
70
24
5
359
summer 108 16 55
5
2
186
1998~00 autumn 130
7
13
11
3
165
winter 131
72
37
11
38
290
mean 143
38
44
13
12 250
1992 spring
94
73
55
28
5
254
autumn
67 32 42 16
20
177
1984~85 mean
90
31
64
15
200
13
4.4 Comparison with adjacent seas
The number of benthos species in the Yellow Sea is higher than the adjacent Bohai Sea,
but lower than the East China Seas (Table 12). Polychaetes form the most dominant group in
terms of species number, making 50% of the total number of benthic species in the Yellow
Sea. Of the Yellow Sea benthic species, 104 species also inhabit Bohai Sea, 209 also inhabit
the East China Sea, and 128 species (e.g. Ophelia acuminata, Thyasira tokunagai, Raetellops
pulchella, Natita janthostomoides, Eudorella pacifica, and Ophiura sarsii, etc.) do not occur
in China coastal waters other than Yellow Sea.
The benthos biomass in Yellow Sea averages 37.17 g/m2, higher than the adjacent Bohai
Sea and East China Sea (Table 12). Echinoderms is the groups with highest biomass in the
benthos and biomass of the echinoderm Ophiura sarsii affects total benthos biomass, which is
distinct from the two adjacent seas.
The benthos density averages 250ind/m2 in the Yellow Sea and it is at intermediate level
between the adjacent Bohai Sea and East China Sea. In the macrobenthos of Yellow Sea,
polychaete density makes the largest proportion (52%), higher than its contribution in the
Bohai Sea and East China Sea.
Both the biomass and density of macrobenthos tends to increase considerably in the
Yellow Sea, but the biomass of major groups (polychaetes, crustaceans and echinoderms)
increased by larger extents such that the average individual weight tends to increase in these
groups and thus the benthos as a whole.
Table 12. Species number, biomass and density of benthos in the Yellow Sea and adjacent seas.
Yellow Sea
Bohai Sea
East China Sea
Species number 414
119
855
Biomass (g/m2)
37.09 15.88 20.84
Density (ind./m2)
250 177 280
14
5. Information on red tide (HABs)
5.1 HAB frequency
Fig. 10 shows the HAB events in Yellow Sea over the period 1980-2006. As will be
readily seen, occurrence of HAB events is gradually increasing. During 2000-2005 the HAB
events accounted for about 50% of total records. Although there were only two HAB events
in 2006, this does not suggest that the environmental quality of Yellow Sea is being improved.
The last six years of records indicate that a little more HAB events in the west of middle
Yellow Sea than in the north and south of Yellow Sea (Table 5.1).
14
12
10
8
B
A 6
f
H
o 4
er
2
u
mb
N 0
1981 1983 1985 1987 1989 1991 1993 1995 1997 1999 2001 2003 2005
year
Figure 10 The events of HABs in Yellow Sea since 1981.
Table 13 HAB events in the coastal waters of Yellow Sea during 2001-2006.
Year Liaoning
coast Shandong coast
Jiangsu coast
Total
2001
2
2 4 8
2002 0
2
2
4
2003 3
2
0
5
2004 5
5 2 13
2005 4
5 4 13
2006 0
1
1 2
15
5.2 The hot spots of HAB events
HAB events occurr more frequently in waters of high eutrophication and poor water
exchange such as estuaries, semi-enclosed bays, sheltered harbours and mariculture area, etc.
HAB events are less frequent in the middle of Yellow Sea (Table 14).
Table 14 The regions of HABs occurrence in Yellow Sea.
Waters City
Province
Donggang
Dandong
Liaoning
Yalujiang Estuary
Liaoning
Dalian Bay
Dalian city
Liaoning
Zhangzidao
Dalian city
Liaoning
Sishili Bay
Yantai city
Shandong
Rushan Bay
Yantai city
Shandong
Jiaozhou Bay
Qingdao city
Shandong
Rizhao costal water
Rizhao city
Shandong
Haizhou Bay
Lianyunguang
Jiangsu
North of Changjiang Rudong, Jiangsu
Estuary
5.3 HAB event species
Although more than 30 HAB species have been suggested in Yellow Sea, only 17 species
did formed HABs in Yellow Sea (Table 15). Noctiluca scintillans, a dinoflagellate, is one with
highest frequency of HAB connection, accounting for 50% of HAB events in Yellow Sea.
Skeletonema costatum ranks next making 20%~30% of HAB records. In general HAB species
occur regionally, but HABs of Noctiluca scintillans and Skeletonema costatum are recorded in
the whole Yellow Sea. Alexandrium catenetum and Heterosiama akashiwa only occurred in
seawaters adjacent to Dalian. Many HABs of Gymnodinium sanguinieus were only recorded
in Sishili Bay, Yantai. A Gymnodinium catenatum red tide took palce in Lianyungang.
Mesodinium rubrum red tide out broke more in Qingdao and sometimes in Dalian. The first
HAB of Phaeocystis globosa was found in the coastal water of Yantai in 2004. In 2005 the
first HAB of Chattonella marina was recorded in the coastal water of Jiaonan (Qingdao).
Furthermore, diarrhetic shellfish poison (DSP) has been detected in shellfishes from Weihai,
Qingdao and Lianyungang, but we are not clear about the causal algae species. Great
importance must be paid on this issue.
16
Table 15 The species caused HABs in Yellow Sea
Group Species
Dinoflagellates:
Noctiluca scintillans
Gymnodinium sanguinieus
Alexandrium catenella
Gymnodinium catenatum
Gonyaulax polygramme
Gonyaulax spinifera
Ceratium furca
Diatoms:
Skeletonema costatum
Eucampia zoodiacus
Leptocilindrus danicus
Thalasiosira sp.
Chaetoceros affinis
Cheatoceros socialis
Raphidophytes
Chattonella marina
Heterosiama akashiwa
Prymnesiophyceae
Phaeocistis globosa
Protozea:
Mesodinium rubrum
II. Environmental problems
During transboudary diagnostic analysis of Yellow Sea LME projects, 4
environmental issues in ecosystem components were identified (Table16).
Table 16
Types and Nature of Environmental Problems Relating to the Ecosystem Component
Environmental Issue
Nature of Issue
Priority
Change in biomass or abundance
Environmental Problem
3
Change in species composition
Environmental Problem
2
Increased frequency of harmful algal
Environmental Problem
1
blooms (HABs)
Loss of benthic habitat in coastal areas
Environmental Problem
Referred to
RWG-B
Under the heading "change in biomass or abundance" the RWG-E has first listed "Increase
in zooplankton > 330m zooplankton in the Korean area of the Yellow Sea" and "Decrease in
zooplankton > 505m and phytoplankton > 77m in the Chinese area of the Yellow Sea".
17
The concern here is that these changes, although incoherent, are evidence of changes in the
composition of both phytoplankton and zooplankton communities in the Yellow Sea. The
consequences of such changes in community composition are changes in the food web and
threats to the food supplies for living marine resources at higher trophic levels. The decreases
in phytoplankton >77m in the Chinese area of the Yellow Sea could also result in a reduced
capacity for carbon fixation in the region and a change in carbon fluxes over a large area.
Similarly, such reductions could also result in reduced production of dimethyl sulphide that
plays a significant role in cloud formation, thus having an influence on both regional and
global climatic conditions. Under the same category the RWG-E has also defined a "Shift in
peak in seasonal pattern of zooplankton biomass abundance in the Korean area of the Yellow
Sea". This reflects similar evidence of zooplanktonic community changes that could have an
adverse effect on the food supplies for higher trophic level organisms. It must be remembered
that phytoplankton and zooplankton constitute the foundation for the entire marine food web
that ultimately provides the basis for the sustenance of all marine species, including
commercial wildfish and other exploited species. Changes in primary and secondary
production, both in terms of the rates of production and species diversity, will inevitably have
consequences at higher levels in the marine organism community but contemporary
knowledge of food web dynamics does not allow for reliable prediction of the consequences
at higher trophic levels.
Under the heading "Change in species composition" the RWG-E has listed "Change in
dominant groups of zooplankton (Korea)", "Changed ratio of diatoms to dinoflagellates
(China)", "Jellyfish blooms" and "Change in benthic species composition and dominant
species". The first two of these issues are of concern because they reflect changes in food
web dynamics that can affect organisms at higher trophic levels. The change in
phytoplankton species from diatoms to dinoflagellates could either be a corresponding
response to changes in predation or, more likely, a response to an abundance of dissolved
nitrogen and phosphorus accompanied by dissolved silicate impoverishment. The concern
here is that the majority of toxic algae and those that cause adverse effects on other marine
organisms are in the dinoflagellate class of phytoplankton. Thus, it is likely that the shift
from diatoms to flagellates is a response to much reduced silicate concentrations in relation
to the other nutrients. This has occurred elsewhere, in the eastern North Sea for example, and
has occasionally given rise to a preponderance of foaming algae that caused aesthetic
problems for beach users. There has been a significant increase in the abundance of jellyfish
within the Yellow Sea in recent years. Jellyfish cause interference with fishing activities, the
clogging of sea water intakes and pose threats of stinging to sea bathers. The increased
presence of jellyfish is also a reflection of changes in primary and secondary productivity in
the system and alterations to the food web of the Yellow Sea. The change in benthic species
composition and the dominant benthos in parts of the Yellow Sea signify a reduction in
benthic biodiversity. Such changes will be a response both to changes in the food web
dynamics and the composition of bottom sediments. The concern here is that such changes
will reduce the availability of both benthic and demersal fishing resources in the Yellow Sea
but currently there exist insufficient data to quantify such losses.
Under the heading of the increased frequency of harmful algal blooms, the RWG-E has noted
that there has been a significant increase in the annual incidence of intense algal blooms (see
18
Figure 81). Such blooms can cause increased mortality of mariculture stocks, kills of wild fish
thereby reducing fishery yields, and increased risks to seafood consumers through the
incorporation of natural toxins into exploited marine organisms.
III. Preliminary consideration for Regional EcoQO's Target
There are 4 environmental issues in TDA.
1. Change in biomass or abundance
The trend in phytoplankton and benthos is not very clear. There is a trend of
decrease in zooplankton biomass, but for Korea, the trend is increase. Furthermore,
the technology to regulate zooplankton biomass is not available. It is very difficult
to set a EcoQO for biomass or abundance. However, suggestion is to strengthen
monitoring activities and to improve assessment of the biomass or abundance
status, especially regional joint efforts.
2. Change in species composition
This is a similar problem to change of biomass or abundance.
3. Increased frequency of harmful algal blooms (HABs)
This problem is referred as Priority 1 in ecosystem component. But, knowledge
on the ecology and oceanography of HAB in Yellow Sea is not enough to prevent
and control HAB. If the eutrophication in Yellow Sea could be reduced, then HAB
events will be reduced. Eutrophication will be concerned by Pollution Component.
4. Loss of benthic habitat in coastal areas
This issue will be considered by biodiversity component
19
Ecosystem Republic Of Korea
Report
On Preliminary Regional Targets
With Respect to the Project's Objectives
Of Ecosystem
by
YOO Sinjae
Korean Ocean Research and Development Institute
Preliminary Analysis for Identification of the Ecosystem Quality Objectives of the
Carrying Capacity in the Yellow Sea: Ecosystem change
Sinjae Yoo
KORDI
Ansan Sa-dong 1270, South Korea
sjyoo@kordi.re.kr
1. Introduction
The purpose of this analysis is to identify targets for intervention to sustain ecosystem
services under deteriorating ecosystem quality during the past decades. Such targets are
preferably of quantitative nature so that costs and benefits of intervention can be
optimized.
Possible approaches would be 1) to select potential indices that indicate ecosystem
changes/trends, 2) to check whether good time series data for each index are available,
3) if yes, to check whether any discernable trend can be established, 4) to ask what that
trend means, and 5) to set a reference value for selected indices.
The nature of the analysis at this preliminary stage is unavoidably exploratory. Here I
will examine potential indices of ecosystem changes for their validity and consistency. I
will also suggest directions for further analysis.
2. Requirements for indices
As candidates for EQ targets in ecosystem, some indicators of the structure and function
of ecosystem are reviewed based on TDA as well as the national reports from China and
Korea. For these indices to be useful there are certain requirements. First of all, there
should be more than one data set ranging decades' period. Preferably, a time series will
be the best data, but even two data sets can be used. Second, the data should be
comparable in terms of spatial coverage, taxonomic representation, sampling methods,
temporal variability, etc. Third, there should be inherent consistency within datasets. If
the data show very high fluctuation that cannot be explained, the data can not be used to
detect trends.
1
3. Potential indices
A. Nutrients
Lin et al. (2005) provide valuable data of T, S, nutrients (N, P, Si) and DO for the
periods of 1976-2000. Periodic surveys were made seasonally every year on a
monitoring line located at 36°N, 120.5-124.5°E. Their data clearly show an increase in
DIN, decrease in DIP, and Silicates. As a result, the N:P ratio has steadily increased.
They attributed this to the decrease in the freshwater input from the Yellow River. They
tried to match the trends with lower trophic as well as higher trophic components. They
resorted to the second hand data from literature. They argued that the trend in the N:P
ratio was accompanied by decreases in chlorophyll, primary production, phytoplankton
abundance, diatom abundance, and relative proportion of diatom. However, at least part
of this observation is not consistent with other observation. Son et al. (2005) show that
chlorophyll might have increased from 1979 to 2000 from satellite data. Kang et al.
(2007) argued using Korean side data that Calanus sinicus increased from 1980s to
1990s but chlorophyll did not show much change. They attributed the change to the
decrease of Japanese anchovy, a major predator of Calanus. Thus a further analysis is
required to assemble a coherent picture of the subsequent changes in the ecosystem
structure. Although nutrients have clear meaning and implication for both ecosystem
productivity and functioning, setting N, P, Si, or N:P, N:Si as management targets has
problems in practicability. If this decreases of phosphorus and silicates are caused by
decrease in freshwater input as Lin et al. (2005) infers, whether the freshwater input to
the Yellow Sea basin is manageable is not clear.
B. Diatom/dinoflagellate ratio
In relation with N:P ratio change, one of the important property of the ecosystem is
change in the phytoplankton community. Particularly, diatoms and dinoflagellates are
important as dominant phytoplankton groups linking primary production to grazing
chain. Given the long-term change in the nutrients, it is worthwhile to ask what kind of
changes happened in the lower trophic components to begin with. Chinese report show
the species number of phytoplankton surveyed in 1984, 1998, and 2005 (spring only for
2005). Although the exact nature of the data is not clearly specified, the overall
distribution of each year's surveys seems comparable. Original data from the report
include the species number of diatoms and dinoflagellates. Since these two groups
2
represent more than 98% of the net phytoplankton, the change of these two groups can
be a very effective indicator of structural change in the phytoplankton community of the
Yellow Sea. Identification and counting of phytoplankton species are simple and robust
methodology, so that as long as the areal coverage is similar among different years, the
data can be used as an indicator for ecosystem change. Temporal variability is a problem
particularly in spring and fall when the seasonal changes in the community structure are
rapid so the variability is compounded by temporal, spatial, and interannual variation.
Understandably, Table 1.2 of the Chinese report shows quite variable number of species
for diatoms and dinoflagellates. Using a ratio of diatoms/(diatoms+dinoflagellates)
rather than species number of each group can remove compounded variability. Figure 1.
shows the change in the ratio among 1984, 1998, and 2005 sampling periods.
Diatom/(Diatom+Dino), Sp. number
1
0.9
0.8
0.7
0.6
r
1984
0.5
1998
Yea
0.4
2005
0.3
0.2
0.1
0
spring
summer
fall
winter
Season
Figure 1. Ratio of diatoms/(diatoms+dinoflagellates) species number from Chinese
surveys. Redrawn using the data from the Chinese report.
While the species number of each group varied by five folds, the ratio of diatom species
number to the total species number remains rather constant, between 0.73~0.90. Also
there seems no particular trend in the ratio between 1984 and 1998. Unfortunately,
Korean report does not include diatoms/dinoflagellates data covering at least a decade's
interval. The data of Lin et al. (2005) show a decrease in the diatom/dinoflagellates ratio
but do not show actual increase in the dinoflagellates abundance. Their data only
indicated a decrease in the diatom abundance. Therefore, the consequences of
3
decreasing N:P ratio are not clear yet. Further rigorous analyses are necessary.
C. Species diversity (phytoplankton, zooplankton, benthos)
There are no time series of species diversity from the reports by China or Korea.
D. Abundance/biomass of phytoplankton
Although Chinese report includes cell abundance data ranging from 1959 to 2006, the
data do show an incredible fluctuation within a season. For example, spring abundance
of phytoplankton cells was 77.29 x 10⁴ cells m-3 in 1959, then decreased to 7.96 x 10⁴
cells m-3 in 1998-2000 but increased to 2027.6 x 104 cells m-3 in 2006, about 254 fold
increases. The data also indicate summer and winter abundance were much higher than
spring and autumn. This pattern is contradictory to what we know about the general
pattern from temperate seas where seasonal stratification is a driving factor (Sverdrup,
1953; Longhurst, 1998) or from the pattern observed by satellites. Some of the
inconsistency can be explained by sampling methods. The abundance data were
collected from net samples with 77 m mesh size. With this mesh size, only larger cells
are collected and net samples have very high errors. Korea report does not include long
enough time series for the analysis.
E. Primary productivity
Chinese data of primary productivity cover 1998-2000, while Korean data cover 1992,
1996, 1997. The temporal coverage is too short even if spatial variation and other
comparison issues are resolved. Son et al. (2005) compared CZCS (1979) and SeaWiFS
(2002) data and found the average chlorophyll concentration increased by 15-60% in the
offshore deep waters. Bimonthly in-situ measurements from 61 stations in the western
coast of Korea from 1978 and 2002 were compared with the trends found in satellite
data. The results show that there were increasing trends in temperature and zooplankton
biomass, and decreasing trends in salinity and Secchi depth. However, according to Lin
et al. (2005), primary productivity decreased from 1980s to 1990s. Their conclusion was
based on values from literature and inconsistent with their own data of steady increase
in nitrogen. Further scrutiny is necessay.
F. Abundance/biomass of zooplankton
Chinese data show the zooplankton biomass decreased consistently from 1950s to 1980s
and 1998~2000 periods. The pattern is consistent throughout all seasons. However,
Korean data ranging from 1965 to 2000 with bimonthly sampling show quite different
4
yet consistent pattern of increase after late 1980's. The contradiction is significant and it
cannot be explained solely by sampling differences. Although the patterns are
interesting and may have important information, they do not represent basin-wise
consistent trend at a glance. Zooplankton abundance increased in the fraction > 330 m
(Korea), but decreased in the fraction > 505 m (China). At face values, this means the
fraction between 330 m and 505 m increased while larger fraction decreased. If the
data are comparable and reliable, this indicates a change in the structure of zooplankton
community. Further analysis is necessary to check this possibility.
G. Abundance/biomass of benthos
Chinese benthos data cover about 15 years' range. The biomass seems to increase sfrom
less than 16 g m-2 (1984~1985), to 22.2 g m-2 (1992), and 37 g m-2 (1998~2000).
Although direct comparison may be difficult, but at least the differences among the
periods are greater than seasonal variation. Density data show similar pattern of
increases from 200 ind. m-2 (1984-1985), to 215 ind. m-2 (1992), and to 250 ind. m-2
(1998~2000). Korean data include only 1992 survey and do not provide information of
temporal change.
H. HAB
There is no evidence that HABs are increasing in both Chinese and Korean coasts. My
arguments rested on the facts that the criteria of a HAB event in both Korea and China
are based on the phytoplankton density regardless of harmfulness. For example, NFRDI
adopt the criterion of cell density 1,000 cells ml-1 for HAB. Except for the small
Cochlodinium blooms in 1998 and 2000, and Chatonella blooms in 2006, all the bloom
incidents reported from Korea were by harmless diatoms. And in fact, no economic or
social damage even from the Cochlodinium and Chatonella blooms has been reported
from the Korean coast of the Yellow Sea. Thus the data at best indicate a trend of
eutrophication in near-shore region at least in Korea. The increasing trend of the algal
blooms may also reflect increasing monitoring during the late 90's not only in Korea but
also in China. There seems even a slight decrease in the frequency of algal blooms after
1998 in Korea (Figure 2). Therefore, there is no ground that HAB is a standing
transboundary issue in the Yellow Sea.
5
Frequency of phytoplankton blooms in the YS (Korean side)
12
10
8
y
c
n
ue
6
q
Fre
4
2
0
1984
1985
1986
1987
1988
1989
1990
1991
1992
1993
1994
1995
1996
1997
1998
1999
2000
2001
2002
2003
2004
2005
Year
Figure 2. The trend in the purported HAB incidences from Korean side of the Yellow
Sea. Here, identification of HABs was based on cell density (1,000 cells ml-1).
I. Jellyfish
Although recent jellyfish blooms in the Yellow Sea are well known and even mentioned
in the TDA, no description is given either in the Chinese or Korean reports. Some
hypothesize that recent global surge of jellyfish blooms might be related to change in
the phytoplankton community (Parsons and Lalli, 2002). However, the causes of
jellyfish blooms are not clear yet and using this as quantitative measure of
environmental quality by itself is not feasible at the moment.
4. Conclusions
As I have shown it is difficult to establish meaningful trends in the ecosystem change
from the national reports. The collected data are mostly not good enough in spatial and
temporal coverage to indicate consistent changes beyond possible spatial and temporal
variance or noises. Among the indices examined, only the two groups of properties
seem established to show meaningful trends: Nutrients and the biomass/abundance of
macrobenthos. Nutrients data by Lin et al. (2005) show consistent trends. Nitrate
increased but phosphates and silicates decreased. As a result, N:P ratio increased.
However, the subsequent changes accompanying the nutrient changes are not clear yet.
6
Conflicting data are reported by different authors. The change in the phytoplankton
community, represented by diatom/dinoflagellates, is not clear. One source argues the
diatom abundance decreased, while other data indicate no significant change in the
diatom/dinoflagellate ratio. Regarding phytoplankton biomass and productivity, data are
again conflicting. Some show an increase, but some show a decrease. Regarding
zooplankton biomass, we are in a similar situation. Chinese data indicate a steady
decrease while Korean data show an increase.
Where do we go from here? First all, the inconsistency in information about ecosystem
changes have to be resolved and we have to establish a coherent picture from nutrients,
phytoplankton community and primary productivity to zooplankton community and
biomass and eventually to fish community and productivity. Therefore, the next step
would be further data mining with specific questions mentioned above. Once we
establish the ecosystem changes in the past decades beyond reasonable doubts, we
would understand the forcing and mechanisms involved. This understanding will help
us to differentiate the human-induced local change from global change in the Yellow
Sea ecosystem.
References
Kang, J.-H., Kim, W.-S., Jeong H.J., Shin, K., Chang, M. 2007. Why did the copepod
Calanus sinicus increase during the 1990s in the Yellow Sea? Marine
Environmental Research 63, 82-90.
Lin, C., Ning, X., Su, J., Lin, Y., Xu, B. 2005. Environmental changes and the responses
of the ecosystems of the Yellow Sea during 1976-2000. Journal of Marine
Systems 55, 223-234.
Longhurst, A. R. 1998, Ecological Geography of the Sea, 398 pp., Elsevier, New York.
Lukas, R., and E. Lindstrom.
Parsons, T.R., Lalli, C.M. 2002. Jellyfish population explosions: Revisiting a hypothesis
of possible causes. La mer 40, 111-121.
Son, S., Campbell, J.W., Dowell, M, and Yoo, S., 2005. Decadal variability in the
Yellow and East China Seas as revealed by satellite ocean color data (1979
2003). Indian Journal of Marine Sciences, 34, 418-429.
Sverdrup, H. U. 1953. On conditions for the vernal blooming of phytoplankton. J.
Cons. Perm. Int. Explor. Mer., 18, 287-295.
7
Fisheries China
Report
On Preliminary Regional Targets
With Respect to the Project's Objectives
Of Fisheries
by
Xianshi JIN
Yellow Sea Fisheries Research Institute
Strategic Action Programme for Fisheries of Yellow Sea LME
Project
1. Introduction
This mission is to prepare preliminary Ecosystem Quality Objectives (EcoQOs) for
management actions of the Strategic Action Programme (SAP) with respect to the
Project's Fisheries objectives, analyzing the data and information collected
through the Project's data collection and regional syntheses contracts and other
available data:
(1) Review historical data and trends of the Yellow Sea ecosystem collected
through the national data and information collection and the regional
syntheses;
(2) Identify the current situation of the Yellow Sea ecosystem;
(3) Based on the review, present the results of the above analyses to the 1st
Ad-hoc Working Group meeting (tentatively scheduled from 10 to 12 April
2007), which should include various options for EcoQOs for each variable
(as highlighted by the HAB example in the SAP consultation meeting
where an expert suggested that a 30% cut in nutrients concentration in
seawater would virtually eliminate HAB events, whereas a 50% cut in N
concentration would restore the original diatom/dinoflagellate ratio);
(4) Based on the comments and suggestions provided during the 1st Ad-hoc
Working Group Meeting, conduct further analysis, if necessary, and
provide the Ad-hoc Working Group, at its second meeting, with the
additional results;
(5) Provide draft report to PMO no less than 2 weeks before the 1st Ad-hoc
Working Group Meeting; and
(6) Expected outputs include a list of optional EcoQOs with respect to
"Fisheries" in the Yellow Sea.
2. Trends and the current situation of fisheries in the Yellow Sea LME
The China and Korea national and regional data and information provided the
basic information and analysis of fisheries to the Yellow Sea Large Marine
Ecosystem (LME) (Jin et al., 2006, Lee, 2006; West Sea Fisheries Research
Institute, 2006). By reviewing the historical data and information, the working
group for fisheries component has indicated the first issue was that
1
overexploitation of target species through over-capacity of fishing fleets and
ineffectiveness in fisheries management and climate changes caused changes in
dominant species in landings resulting in decline of many traditional
commercially-important species and increased landing of low value species.
In the 1950's, the economically important species in the Yellow Sea were the
Small Yellow Croaker (Larimichthys polyactis), Largehead Hairtail (Trichiurus
lepturus) and Fleshy Prawn (Fenneropenaeus chinensis) etc. With the increase in
fishing effort, the abundance of these species has declined. In the early 1970s,
the main target of the pelagic fisheries was Pacific herring (Clupea pallasi) with
the peak catch of 180,000 tonnes in 1972 from China. The catch has decreased
continuously since then and overfishing of this species has undoubtedly
contributed to the decline in this fishery with climatic change also playing a role. In
the 1980's, the stocks of some other pelagic fish like half-fin anchovy (Setipinna
taty), Japanese anchovy (Engraulis japonicus), chub mackerel (Scomber
japonicus) and Spanish mackerel (Scomberomorus niphonius) appeared to have
increased to some extent (Fig. 1).
Annual landings of anchovy increased due to the increased abundance of this
species and the expanded fishing effort (Jin, 1996, Jin et al., 2006). Since the
mid-1980's, Japanese anchovy became the most abundant pelagic species in the
Yellow Sea (Jin, 1996b). According to a series acoustic survey carried out by R/V
"Bei Dou" from the Yellow Sea Fisheries Research Institute, the biomass of
Japanese anchovy in the Yellow Sea varied annually from 2.5 to 4.3 million tons.
The annual landing of anchovy increased from 20,000 tons in 1989 to 640,000
tons in 1996, and more than 1 million tons in 1997 and 1998, becoming the largest
landing of any single species fishery in China. Meanwhile, the catch in Korea
ranged from 20,000 tons to 30,000 tons during 1986~1992, and after that the
mean catch was increased gradually to 46,000 tons during 2000~2004, also
accounted for the largest proportion of total landings from the Yellow Sea (West
Sea Fisheries Research Institute, 2006). These catches were far above a half
million tons of maximum sustainable yield (MSY) estimated by Iversen et al
(1993) , and recent acoustic surveys indicated a fall in biomass of Japanese
anchovy to about 0.2-0.3 million tons (Fig. 2, Jin, 2003; Zhao et al. 2003).
Although there is evidence of changes in catch species in the Yellow Sea LME,
the overall yield from capture fisheries in the region as a whole appears to be
2
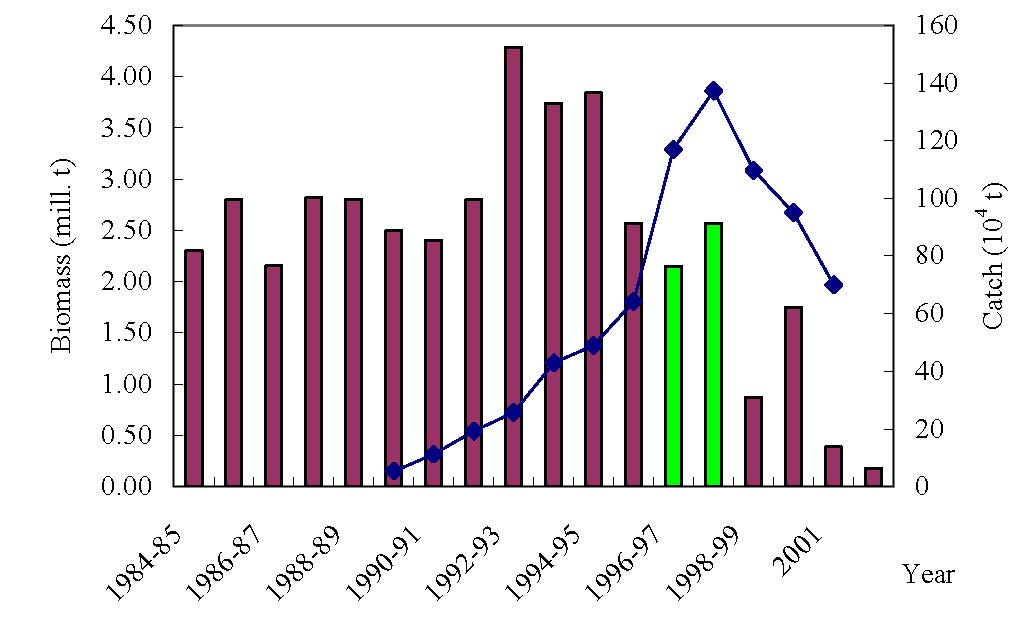
fairly constant in recent years (Fig. 3).
Fig. 1. Landings composition from coastal areas of China around Yellow and Bohai Seas
(Jin, 2003, Jin et al. 2006)
Fig. 2. Annual Japanese anchovy biomass (bars) and landings (line) from China (Jin,
2003; Zhao et al. 2003)
3
Fig. 3. Temporal Trend for the Catch from the Yellow Sea of 10 Commercially-Important
Species, 1986-2004 (Anno, 2006)
For the mariculture, the important issue is the unsustainable maricultural
practices by rapid expansion of mariculture and over-intensive mariculture in
coastal zones. The growth in culturing of aquatic organisms for food production in
the region is reflected in the scale of combined mariculture and inland
aquaculture in China and Korea as an increasing and largest proportion in global
production as shown in Fig. 4.
Fig. 4. Growth of Combined Mariculture and Aquaculture Production in China and Korea
in Comparison with Global (Millions of tonnes) (Anno. 2006)
4
Over the period 1995 to 1997, maricultural production around the Yellow Sea LME
increased rapidly from 400 thousand tonnes/year to just less than 4 million
tonnes/per year. Subsequently there has been continued, but less spectacular,
growth to over 6 million tonnes in 2004. The gross annual Yellow Sea mariculture
production for the years 1995 to 2004 and the annual breakdown among finfish,
crustaceans, molluscs and seaweeds is shown in Table 1 (Anno., 2006; Lee,
2006). As seen from the table, the shellfish represent the dominant proportion
(75% in average) of the total production and also contributed the most growth of
mariculture, although the production of others has continuously increased.
The total maricultural area in the Yellow Sea by the two countries showed a
continuous increase from 359,000 ha in 1986 to 760,000 ha in 2004. Both the
total production of shellfish and the associated farmed area for shellfish
production have increased gradually, although the production per unit area
reveals a decreasing trend from 14.1 MT/ha in 2000 to 10.5 MT/ha in 2004. For
seaweed, annual production per area also showed a downward trend from 22.0
MT/ha in 2000 to 17.1 MT/ha in 2004. This suggests that production per unit area
could not be expected to increase even if farmed area in this region was
expanded in the future(Lee, 2006).
Table 1. Yellow Sea Mariculture Production 1995 to 2004 (tonnes) (Lee, 2006)
Year
Species
1995 1996 1997 1998 1999 2000 2001 2002 2003 2004
Finfish
975 33,942 37,931 49,364
51,759
70,752
98,755
155,310 135,725
159,041
Crustacea
7,443 38,618 57,000 61,178
72,997
85,403
110,426
131,293 135,202
151,340
Shellfish
199,128 2,019,783 3,032,230 3,037,281
3,547,837
3,845,123
4,171,174
4,495,842 4,610,421
4,807,310
Seaweeds
193,469 788,494 803,037 817,778
885,521
914,710
900,857
964,693
1,001,017
1,077,019
Other
858 1,213 2,717 5,001
9,156
15,170
17,339
34,467 92,452
51,923
Total
401,872 2,882,050 3,932,915 3,970,601
4,567,270
4,931,158
5,298,550
5,781,804 5,974,817
6,246,633
The fisheries problems by causal chain analysis from regional fisheries working
group of the project has been indicated as shown in Table 2.
5
Table 2. Causal Chain Analysis Fisheries Problems
Issue/Concern
Fundamental
Primary Cause(s)
Secondary
Tertiary
Quaternary
Root
Problem/
Cause(s)
Cause(s)
Cause(s)
Cause(s)
Driver
Decline in landings
Lack of alternative livelihood
Deficiencies in
Lack of comprehensive and
of many traditional Unsustainable
Over-capacity of fishing Unchecked increase in demand management and control effective system of fisheries
commercially-impo
natural
Overexploitation of target fleets
for capture fish as the result of of fisheries activities
stock management
rtant species and resource
fish species
changing lifestyle
Insufficient monitoring Lack of compliance assurance
increased landings exploitation
and enforcement
procedures
of low value species practices
Weak scientific-based
Insufficient support for, Poor recognition of the limits to
(including changes
Deficiencies in fisheries knowledge of ecosystem
and guidance of, sustainable natural resource
in dominant
stock management
processes
education and research
exploitation
species)
Climatic change
See Ecosystem causal chain
Unguided/unchecked
Lack of scientific and technical Inadequate controls and Coastal development undertaken
Over-intensive mariculture
increased in demand for guidelines for maricultural regulations for
with limited comprehensive and
seafood as the result of practices
maricultural
coherent legislation that
changing lifestyle
development
provides adequate environmental
protection
Variation of
Insufficient knowledge of Limited application of Deficiencies in the application of
Limited and variable environmental
carrying capacity
science to regulation of science to environmental
natural food supply
conditions (e.g., primary
maricultural activities
protection and coastal zone
productivity) combined
development
with overintensive
maricultural activities
Inappropriate
Insufficient strategies for Inadequacies in the Lack of comprehensive and
Unsustainable
Unsustainable
Over-exploitation of
management plan based preparing and approving coastal control and regulation coherent framework for coastal
maricultural
development
natural habitats
on zoning of
zone development plans based of developmental
and marine resource
practices
of coastal zone
mariculture areas
on the maintenance of ecosystem activities in coastal development
services
areas
Environmental
Overfeeding, inadequate Insufficient application of Inadequacies in the Lack of comprehensive and
consequences of releases effluent treatment, poor environmental friendly
control and regulation coherent framework for coastal
of nutrients, bacterial, viral quality of feed
techniques and considerations of of developmental
and marine resource
and faecal matter and food
carrying capacity
activities in coastal development
residues from mariculture
areas
Potential impacts on
Inappropriate use of chemicals Insufficient application Lack of coordination between
human health
Chemical and
in mariculture and frequent algal of environmental
public health sector, government
pharmaceutical residues blooms
friendly techniques and agencies and the private sector
in farmed organisms
environmental changes
Effects of natural toxins
generated by harmful Eutrophication
See Pollution causal chain
algal blooms (HABs)
6
3. Suggestion of Preliminary Ecosystem Quality Objectives for Fisheries
From the Conceptual Procedure for SAP Preparation (YSLME. 2007), it is
proposed to use the central theme of "Carrying Capacity of Ecosystem (CCE)"
to link all Project Components--Biodiversity, Ecosystem, Fisheries, Investment,
and Pollution.
The goal of the SAP for the Yellow Sea Project is to prepare management
interventions to maintain and/or improve the Carrying Capacity of the Yellow Sea
Ecosystem in order to ensure the continued provision of ecosystem services.
The objectives are:
protection of marine and coastal environments in the Yellow Sea;
Sustainable use of marine and coastal resources in the Yellow Sea; and
Upgrading national capacity in protection of marine environment.
The 1982 Convention specifies one technical reference point, MSY as the highest
point of the harvesting for fisheries consideration. At the current situation, to reach
the MSY and even below MSY level need to cut the fishing effort and yield, but
should carefully plan in order to avoid seriously influencing the fishermen's life
along the coastal waters of the Yellow Sea Large Marine Ecosystem.
Therefore, the Ecosystem Quality Objectives for Fisheries is regarded as MSY as
a reference point for management. The yield of capture fisheries should be less
than that the growth of population. Based on the current situation of
overexploitation of the wild stocks and over-fishing capacity in the Yellow Sea,
China State Council has issued "Compendium of Conservation Action Plan of
Aquatic Living Resources of China" in Feb., 2006. The conservation action of
aquatic living resources was brought into national general deployment in related
to the resource and environment. One of three action plans related to this project
is protection of fisheries resources and enhancement.
By 2010, over capacity of fishing effort and fishing intensity will be reduced.
Concerning the marine fisheries, the number of motorized fishing boats and
marine catch in China will be cut by 10% and 15%, respectively. The fishing
efficiency and economic benefit will be increased and the over-fishing will be
relaxed.
7
The development of mariculture will continue with more rational overall
arrangement and improved methods, as a result of increasing production and
quality.
By 2020, the number of motorized fishing boats and marine catch in China will be
reduced by 1/3, and a harvesting level will meets the "surplus yield", implying that
the stock levels are kept adequately high for reproduction to have the fisheries
resources in a healthy condition. Meanwhile billions of fry will be released into the
sea for enhancement. Sustainable mariculture will be reached.
Reference:
1 Anno. 2006. Transboundary diagnostic analysis. Document of UNDP/GEF PROJECT
"REDUCING ENVIRONMENTAL STRESS IN THE YELLOW SEA LARGE MARINE
ECOSYSTEM".
2 Iversen, S.A., D. Zhu, A. Johannessen and Toresen, R. 1993. Stock size, distribution
and biology of anchovy in the Yellow Sea and East China Sea. Fish. Res., 16:
147-163.
3 Jin, X. 1996. Variations in Fish Community Structure and Ecology of Major Species in
the Yellow/Bohai Sea. University of Bergen Publishing. Norway. ISBN
82-7744-025-1.
4 Jin, Xianshi, Hamre, Johannes, Zhao, Xianyong, and Li, Fuguo. 2001. Study on the
quota management of anchovy (Engraulis japonicus) in the Yellow Sea. Journal of
Fisheries Science of China, 8(3):27-30
5 JinX. 2003. Fishery biodiversity and community structure in the Yellow and Bohai Seas.
American Fisheries Society Symposium. 38: 643-650.
6 Jin, Xianshi, Jianguang Fang, Jun Wang, Naihao Ye, Xianyong Zhao and Jihong Zhang.
2006. Report of Data and information collection from China. Document of
UNDP/GEF Project Entitled "REDUCING ENVIRONMENTAL STRESS IN THE
YELLOW SEA LARGE MARINE ECOSYSTEM"
7 Lee, Jang-uk. 2006. Report on fisheries component's regional data and information
sythesis.
Document of UNDP/GEF Project Entitled "REDUCING
ENVIRONMENTAL STRESS IN THE YELLOW SEA LARGE MARINE
ECOSYSTEM".
8 West Sea Fisheries Research Institute, 2006. 2006. Report of Data and
information collection from Korea. Document of UNDP/GEF Project
Entitled "REDUCING ENVIRONMENTAL STRESS IN THE YELLOW
SEA LARGE MARINE ECOSYSTEM"
8
9 YSLME. 2007. Conceptual Procedure for SAP Preparation.
UNDP/GEF/YS/SAP.1/2 rev3.
10 Zhao, X., Hamre, J., Li, F., Jin, X. & Tang, Q. (2003). Recruitment, sustainable yield
and possible ecological consequences of the sharp decline of the anchovy
(Engraulis japonicus) stock in the Yellow Sea in the 1990s. Fisheries
Oceanography 12 (4-5), 495-501
9
Fisheries Republic Of Korea
Report
On Preliminary Regional Targets
With Respect to the Project's Objectives
Of Fisheries
by
LEE Jang-Uk
Pukyong National University
Report
On
Regional Targets for Management
In Fisheries Component's Data and Information
Lee, Jang-Uk
Korean Fisheries Society
March 2007
1
Contents
1. Introduction--------------------------------------------------------------------------------4
2. Methods--------------------------------------------------------------------------------------4
2.1 Description of fisheries-------------------------------------------------------------4
2.2 Biological and ecological data---------------------------------------------------5
2.3 Status of mariculture----------------------------------------------------------------5
2.4 Socio-economic data and policy------------------------------------------------6
3. Retrospective approach----------------------------------------------------------------6
3.1 Review of historical data on fisheries and its trend----------------------6
3.1.1 Description of fisheries----------------------------------------------------- 6
3.1.2 Biological and ecological data-------------------------------------------11
3.1.3 Bottom trawl survey---------------------------------------------------------12
3.1.4 Status and trends of mariculture----------------------------------------12
3.1.5 Socio-economics-------------------------------------------------------------14
3.2 Identification of current situation----------------------------------------------16
3.2.1 China------------------------------------------------------------------------------16
3.2.2 Korea------------------------------------------------------------------------------16
3.2.3 Lack of data and information from two nations--------------------16
3.3 Review of current political situation------------------------------------------17
3.3.1 National law and regulation on fisheries------------------------------17
3.3.2 National law and regulation on mariculture -------------------------19
3.4 Identification of critical habitats------------------------------------------------20
3.4.1 Regional issues---------------------------------------------------------------20
3.4.2 Major issues from regional data and information------------------21
3.4.3 Establishing regional fisheries database-----------------------------24
4. Theoretical approach---------------------------------------------------------------------24
4.1 Modeling--------------------------------------------------------------------------------24
4.1.1 Estimation of population size--------------------------------------------24
4.1.2 Population dynamics--------------------------------------------------------25
4.1.3 Ecosystem-based management-----------------------------------------25
4.2 Best management practices-----------------------------------------------------25
4.3 Maximum sustainable fisheries yield (MSY) -------------------------------26
2
5. Comparative analysis approach------------------------------------------------------28
5.1 Comparative analysis with other LME's international projects------28
5.2 Consideration of different requirements between central and
local governments-----------------------------------------------------------------31
REFERENCES
3
1. Introduction
In accordance with the statement of the Conceptual procedure for Strategic
Action Programme (SAP) for the Yellow Sea Project, this paper provides a
preliminary guideline to identify methodologies for the regional Ecosystem
Quality Objectives (EcoQOs) in the fisheries component. The methodologies for
EcoQOs contain three major parts including 1) retrospective approach, 2)
theoretical approach and 3) comparative analysis approach.
Having completed the regional data and information synthesis of fisheries
component of UNDP/GEF Yellow Sea project (the 3rd regional working group
meeting for the fisheries component of YSLME held in Weihai, China, October
25-28, 2006), tasks of approaches in this paper were based on the regional
fisheries data and information synthesis. The fisheries component consists of
five parts such as description of fisheries, biological/ecological data, bottom
trawl survey and socio-economics. These data and information are summarized,
provided for the Ad-hoc Working Group Meeting, together with additional
information if available.
2. Methods
The basic goal of this chapter is to create a long-term database using both
national fisheries data, mainly fishery-dependent and auxiliary data submitted
from China and Korea in the Yellow Sea. Then, this database can be used for
evaluation of commercially and/or economically important trans-boundary
stocks. Furthermore, the combined data and information will be very useful for
the ecosystem-based fisheries management in this region (Pauly et al., 2000).
Fishery-independent information, especially both biological and ecological
data on the some commercial species studied from respective national institutes
is compared to figure out scientific data/information gaps and/or discrepancies.
It is quite clear that if different values on population parameters of the same
species in a habitat would be used for stock assessment, the results could
cause significant bias and also advise wrong recommendation to decision-
makers (Gulland, 1983).
2.1 Description of fisheries
The main idea is to evaluate the historical trends in both quantitative
fluctuations and relative abundance (ex, CPUE: catch per unit of effort) from
landing and fishing effort exerted to catch marine animals moving or distributing
in between the two nations in the Yellow Sea.
4
) Quantitative analysis in landings (or catches)
- Comparison of long-term fluctuations of total annual landings
- Temporal variations of commercially important species
) Fishing effort analysis
- Type of fishing gear operating and amount of fishing effort (boats, tonnage
and Kilowatt-horse power etc.)
- Long-term trends on fishing effort
) Estimation of relative abundance by species
- Catch per unit of effort (CPUE) for boat, tonnage and Kilowatt (KW)
- CPUE from synthesis data between the two nations
) Experimental survey data
- Seasonal biomass trend for each species
- Early life history analysis
2.2 Biological and ecological studies
Population characteristic estimates for commercial fish species (or more
species if available) studied between China and Korea are compared to find out
whether or not there are any significant differences in scientific findings between
the same species in the Yellow Sea ecosystem.
Available data and information were used to estimate fisheries reproduction
potential as ecosystem indicators (Gislason et al., 2000).
) Growth pattern: growth equation, size at capture, maximum age,
Length-weight relationship
) Reproduction biology: fecundity, spawning time, size at spawning,
sex ratio, life span etc.
) Migration patterns: spawning, nursery and wintering migration routes
2.3 Status of mariculture
Both capture fisheries and mariculture in the Yellow Sea and its adjacent area
has developed remarkably in recent years. Therefore, the general features to
understand the current aspects in this region are described on the basis of data
and information collected from the two countries.
) Historical production trends by cultured animals and by habitats
- Fishes, shrimp, shellfish and seaweeds etc.
) Culturing area trends for species groups
- Fishes, shrimp, shellfish and seaweeds etc
) Interaction between marine farmed production and farmed area
5
- Relationship between production and area, and production per unit area
2.4 Socio-economic data and policy
The YSLME project should be focused on socio-economic benefits as they
are related to resource sustainability options (Elsevier science, 2003). In this
section, however, some data and information currently available from the two
countries are only tabulated because of lack of data and information to analyze.
The long-term data and information are included in the tables:
) Number of fishing vessels and fishermen involved in fisheries
) Fisheries incomes and consumption per capita
) Fisheries export and import trends
Fisheries policies, on the other hand, will be reported with summary of main
important fisheries management laws and regulations of the two nations.
3. Retrospective approach
3.1 Review of historical data on fisheries and its trends
Fisheries data and information were collected from both China (Yellow Sea
Fisheries Research Institute, YSFRI of CAS, 2006) and Korea (West Sea
Fisheries Research Institute, WSFRI of NFRDI, 2006), following four major
sectors: fisheries data, mariculture data, socio-economic data and legislation
information.
Table 1 summarized as a retrospective archives on historical fisheries data for
each section.
3.1.1 Description of fisheries
Most of marine living resources in the Yellow Sea including the west coast of
Korea and the East China Sea have their own migration patterns seasonally for
spawning, hibernating, and feeding. In this region, there are over 300 fish
species, 41 crustaceans and 20 cephalopods.
Warm-temperate animals are more dominant than warm-water species
among the fisheries resources. Migratory fish species mainly consist of both the
warm-temperate and warm-water animals, showing a wide range of migration
and distribution. Main target species in the Yellow Sea covering the northern
part of the East China Sea are listed in Table 2 together with common name and
scientific name.
3.1.1.1 Landings (or catches)
The historical trend of total landings combined from Chinese and Korean
6
fisheries data, and those of each nation for the 10 commercial species in the
Yellow Sea from 1986 to 2004 are given in Table 3 and in Figs. 1 and 2. The
total landing has shown a rapid increasing trend every year from about 425,000
MT in 1986 to 1.9 million MT in 1997. It remained at a level of 2.08 million MT
during 1998-2002, and then increased to 2.40 million MT in 2003 and 2.36
million MT in 2004, maintaining a slow upward trend. The annual landings in this
region are very much dependent on China's figures, with an average value of
92.6% of the total during the study period (Fig. 1).
Trends of 10 commercially important species are summarized below:
Small yellow croaker (Larimichthys polyactis): Yearly catch of this species was
increased from 16,000 MT in 1986 to about 85,000 MT in 1994. Since 1995, the
catch level varied between about 100,000 MT and 110,000 MT until 1998. The
catch showed a trend of increase from 146,000 MT in 1999 to 193,000 MT in
2004 as a whole (Table 3). The total annual catch of China accounted for 92.4%
per annum (Fig. 2).
Spanish mackerel (Scomberomorus niphonius): This species was caught at
56,700 MT in 1986 and increased to 178,500 MT in 1997. The catch was
292,000 MT in 1998 which was the highest level through the whole period. It
showed a slightly downward trend, recorded at about 275,000 MT in 2004
(Table 3). The Chinese catch of this species has a proportion of 99.4% of the
total per year (Fig. 2).
Anchovy (Engraulis japonicus): In 1997, its catch reached nearly at 1.04 million
MT, which is about 37 times as compared to the 1986 catch. Afterwards, the
species catch remained at a level of 1.02 and 1.10 million MT till 2003, but the
catches in 1999, 2000 and 2004 were less than 1.0 million MT, respectively
(Table 3). The catch proportion of China averaged at 93.4% during the period
(Fig. 2).
Chub mackerel (Scomber japonicus): The catch peaked at 171,000 MT in
1995, indicating a continuously increase trend from 43,000 MT in 1986 even
though the 1991 catch was decreased to about 40,000 MT. From 1996, it
showed a slight decrease with a fluctuation between 133,000 MT and 161,000
MT (Table 3). The Chinese proportion of this species was 96.2% on average
through the whole period (Fig. 2).
Largehead hairtail (Trichiurus lepturus): The steady upward trend was
maintained until 1995, reaching at 226,000 MT. In 1996 and 1997, there was a
little decrease in the catches. The annual catch showed a slowly increasing
7
trend with a level of 222,000 MT and 240,000 MT from 1999 to 2003. The 2004
catch peaked at 312,500 MT (Table 3). The catch proportion was 86.2% from
China and 13.8% from Korea (Fig, 2).
Pacific herring (Clupea pallasii): This fish is not a target species of both
nations (Fig. 2). The catch peaked at 3,360 MT in 1987 and at 4,600 MT in 1991.
Then it decreased significantly to less than 600 MT until 2004 (Table 3). During
1986-1990, the annual catch was mainly from China with over 99.5 % of the
total, but in 1991 about 76% of the total was from Korea.
Sandlance (Ammodytes personatus): This species was not utilized until 2002
by China. In 2003, however, the catch was 197,000 MT and 177,000 MT in
2004. Korean catch was recorded sporadically but not at a commercial level
(Table 3, Fig. 2).
Acetes (Acetes chinensis) and (A. japonicus): The catch trend showed an
increase from 82,000 MT in 1986 to 304,000 MT in 1998, with a decrease to
79,000 MT in 1992. Since 1999, it decreased 244,000 MT in 2003, but
increased to 299,000 MT in 2004 (Table 3). The catch portion was 93.2% from
China and 6.8% from Korea on the average during the period (Fig. 2).
Fleshy prawn (Fenneropenaeus chinensis): Yearly total catch varied between
10,000 MT and 18,500 MT during 1986-1992, showed a decreasing trend as a
while. From 1993 till 2004, it remained at less than 10,000 MT (Table 3, Fig. 2).
Squids (Todarodes pacificus), Loligo spp. etc: The annual catch has shown a
steady decrease from 52,600 MT in 1986 to 25,000 MT in1994. From 1995, its
catch showed a slight increase until 2000, peaking at 76,400 MT through the
whole period. Then, it decreased again at a level of 33,000-38,000 MT in 2003
and 2004 (Table 3, Fig. 2).
3.1.1.2 Catch composition by commercial species
10 species compositions of total catch for China and Korea in the Yellow Sea
are given in Tables 4 and 5.
China: Percentage composition of 10 species in this region increased from
about 20% in the 1980s to 37% in 1995. In the 2000s, it occupied over 40%
every year (Table 4). Main target species in the yearly catch composition were
largehead hairtail, acetes and Spanish mackerel with a proportion of total catch
ranging from 3.0%-6.0%. Anchovy showed a higher portion between species
compositions in the years of 1994-1997 and 2001-2004 with a value of more
than 13.0% and 17.0%, respectively. Small yellow croaker as commercially
valuable species has a low proportion every year with a trend of increase.
8
Korea: The 10 species percentage compositions every year remained between
28% and 36% (Table 5). Largehead hairtail showed the highest percentage
portion during the first half of the 1980s, with values of 10.0-12.0% and then
decreased significantly. Anchovy had a gradually increasing trend until 2003,
showing the highest percentage of 25%. Acetes occupied a higher portion
during the first half of the 1990s, with values of 4.0-6.0% (Table 5).
3.1.1.3 Fishing effort
Total powered and non-powered vessel effort: Total boats from China and
Korea showed an increasing trend for 7 years from about 100,000 vessels in
1986 to 153,000 vessels in 1992, and then it remained constant at 140,000-
150,000 vessels until 2004. This trend mainly followed Chinese fishing effort,
while Korean effort remained unchanged at about 30,000 vessels throughout
the whole period (Table 6, Fig. 3). In contrary to this, gross tonnage showed a
slow increasing trend according to Chinese yearly number of vessels, but
Korean vessels showed no fluctuation across the years (Fig. 3).
Powered vessel effort: The trend showed an increasing pattern from 72,500
vessels in 1986 to 140,000 in 2000, then a bit of a downward trend to 2004 (Fig.
4). Gross tonnage of powered vessels showed the same picture with that of the
total effort, which implies that total effort was entirely depended upon by
powered vessels (Table 6, Fig. 4).
Non-powered vessel effort: Both number of vessels and gross tonnage from
China and Korea have shown a continuous decreasing trend from year to year
(Fig. 5). In 2004, the numbers of boats were about 10,000 vessels and gross
tonnage was about 15,000 tons (Table 6).
KW of powered effort: Total Kilowatt has kept up a steady increasing trend
from 1.9 million KW in 1986 to 7.1 million KW in 2002 and then leveled off at
this value in 2003 and 2004 (Fig. 6). It should be pointed out that KW from
Korea showed much higher values than that of China from 2001 up to 2004.
3.1.1.4 Tonnage per vessel and KW (kilowatt) per vessel
Total powered plus non-powered vessels: Tons per vessels from powered
and non-powered vessels data combined from the two nations' data showed
nearly unchanged values, 8.3-9.5 tons/vessels during 1986-1996 (Fig. 7).
From 1997, its value jumped to about 10.0 tons/vessels and remained at this
level until 2004. Chinese values each year were much higher than those of
Korean values. This figure indicated that tonnage per vessels from China had
9
an increasing trend but Korea data remained nearly unchanged level during the
study period (Table 6).
Powered vessels vs. non-powered vessels: Each year's tons/vessels value
showed a parallel level at a value of 10.0 to 11.5 tons/vessels, but non-powered
vessels decreased as a whole (Fig. 8).
KW per boats: The combined KW/boats values from the two nations showed a
trend of increase slowly every year (Fig. 9). Chinese figure has kept an upward
trend although the values during 1998-2000 were lower than the previous year,
and also the 2004 value decreased. Korea's value was unchanged throughout
the entire period (Fig. 9).
3.1.1.5 Catch per unit of effort trends
Data combined from China and Korea: The CPUE values for total number of
powered and non-powered vessels, and the total gross tonnages and KW of
powered vessels are shown in Tables 7, 8, 9 and Figs. 10, 11, 12. These data
sets can be used for quantitative evaluations based on synthetic models
(Schaefer, 1954; Fox, 1970) after sophisticated data handling.
The CPUEs of total boats including both fishing efforts from total number of
powered and non-powered vessels were significantly increased from 3.9 MT in
1986 to 17.2 MT in 2004 (Table 7 and Fig. 10). The CPUE from total gross
tonnage also has kept the same trend with that of total number of boats (Table 8
and Fig. 11). When fishing efforts of powered vessels were taken as a unit effort,
the CPUE for number of boats, the CPUE trends for tonnage and CPUE for KW
are given in Fig. 12 and Table 9. Those three CPUEs showed the same patterns
with an upward trend from 1992 to 1998. Recent values from 2001 to 2004
remained nearly unchanged.
Data from China: The values of CPUE from total catch for 10 fish species
(Table 3) and total number of vessel, tonnage and KW of China (Table 6) are
given in Table 10 and its long term trends in Fig. 13. The CPUEs from the three
unit efforts have shown a significant upward trend: the CPUE of total number of
boats increased from 3.95 MT in 1986 and 3.64 MT in 1987 to 22.18 MT in 2003
and 22.13 MT in 2004, for the value from tonnage, 0.38 MT in 1986 to 1.83 MT
in 2003 and 1.63 MT in 2004, and for the value from KW, 0.24 MT in 1986 to
0.76 MT in 2003 and 0.73 MT in 2004 (Table 10).
Data from Korea: Based on the data on total catch in Table 3 and fishing efforts
in Table 6, the calculated CPUE from Korea generally has kept a decreasing
trend (Fig. 14): the value from total number of boats recorded from 3.87 MT in
10
1986 and 4.19 MT in 1987 to 1.82 MT in 2003 and 2.22 MT in 2004, for the
value of tonnage ranged from 0.76 MT in 1986 and 0.83 MT in 1987 to 0.46 MT
in 2003 and 0.57 MT in 2004, and for the value of KW decreased to 0.02 MT in
2004 from 0.20 MT in 1986 (Table 11).
3.1.2 Biological and ecological data
3.1.2.1 Growth parameters
Growth patterns, length-weight relationship and spawning seasons for the 10
commercial species estimated from both nations' research institutes are briefed
in Table 12. The growth figures of small yellow croaker (Larimichthys polyactis)
from the two nations differed tremendously, especially its life span of which
estimate from China was 23 yr and 10 yr from Korea. Based on the growth
equations, calculated lengths at age are given in Table 13.
These two different figures may seriously cause inaccurate estimations of
such population parameters as instantaneous natural mortality rate (M) and total
mortality (Z) as well as in analytical stock assessments including VPA (virtual
population analysis or cohort analysis) (Pope, 1972).
Asymptotic length of Spanish mackerel (Scomberomous niphonius) showed a
large difference between the two nations' estimates, 71 from China and
123.3 from Korea. This phenomenon will also give a serious bias when
performing stock evaluation study for this species, especially for analytical stock
assessment (Beverton and Holt, 1957).
Other species are also available with information gaps (Table 13).
3.1.2.2 Reproduction and spawning characteristics
Reproductive and spawning biology for 10 species studied from the two
national reports are compared in Table 14. Fecundity of the same species from
the two institutes showed a wide range of values but not much different. The
minimum sizes at maturity for both small yellow croaker and Spanish mackerel
differed from the two nations. That of yellow croaker was 13.5 from China
and 19.1 from Korea. Spanish mackerel was 34/42 from China and 78
from Korea. These figures will give different recruitment patterns to the
stocks (Ricker 1948).
3.1.2.3 Season migration and movement of commercial species
General patterns of migration routes and distribution for the 10 commercial
fish species are presented in the national reports of China (YSFRI, 2006) and
Korea (WSFRI, 2006). For more detailed information related to movements of
11
these species, it will be of help to have data on statistical area by seasonally
rectangular distribution, that is, 0.5 x 0.5 square miles. Tagging is known as very
useful tools to estimate migration route and range of distribution.
Available information on migration from both nations is small yellow croaker
(Larimichthys polyactis), Spanish mackerel (Scomberomorus niphonius),
anchovy (Engraulis japonicus), chub mackerel (Scomber japonicus), largehead
hairtail (Trichiurus lepturus) and rear data for other species such as Pacific
herring (Clupea pallasii) from China, and fleshy prawn (Fenneropenaeus
chinensis) and Pacific squid (Todarodes pacificus) from Korea, respectively.
3.1.3 Bottom trawl survey
Available data and information on results of bottom trawl survey are only from
every month of June 2000-2004 from China and spring and winter, 2003-2005
from Korea. The reports represent very few scientific findings including mainly
species composition, seasonal density distribution of species and seasonal
number of fish larvae and eggs by ichthyoplankton survey etc. Therefore, the
survey data may not make any contribution to fisheries resources analysis and
management intervention so far.
3.1.4 Status and trends of mariculture
3.1.4.1 Farmed production trends
Yearly farmed production figures from China and Korea are given in Table15
and the trends in Figs. 15 and 16. The production jumped to about 17.5 million
MT in 1996 from 2.1million MT in 1995. Then, it showed a continuous trend of
increase year after year, reaching at over 33.0 million MT in 2004 (Table 15, Fig.
15). This upward trend resulted from China's production, accounting for an
average of 96.4% of the total during the whole period. Korea contributed a
proportion of 3.6% between the two nations. By species groups, finfish,
crustacean, shellfish and seaweed have revealed the same pattern as in the
total production (Fig. 16). Proportion of species groups between two nations
was: 99.7% from China and 0.3% from Korea for finfish, 99.8% and 0.2% for
crustacean, 96.5% and 3.5% for shellfish and 68.1% from China and 31.9%
from Korea for seaweed (Table 15). By species groups figure combined from
the two nations' data, finfish has the highest portion with a value of 55.8% on
average, followed by shellfish 33.2%, seaweed 6.9%, crustacean 3.5% and
others 0.6%.
Percentage composition for species groups for China and Korea differed
12
considerably (Table 16). In China, finfish showed the highest proportion with a
decreasing trend from year to year. Shellfish consisted more than 30% of the
total. In Korea, seaweed accounted for about 60% per year on average
throughout the study period, and followed by shellfish with more than 30% every
year.
Marine farmed production trend: Total production pooled from the two nations
in the Yellow Sea and the nation's whole figures during 1995-2004 are
presented in Table 17 and Fig. 17 for each species.
Seawater farmed production indicted a swift year to year increase from 1.23
million MT in 1986 to 14.1 million MT in 2004. This was attributed mainly to
increase of shellfish from China, an average of 75% of the total. Freshwater
production maintained the highest portion with a slightly increasing trend.
The proportions of the farmed production in the Yellow Sea to those of total
seawater and total aquatic farmed production by species groups showed that
high proportions of the Yellow Sea were from both shellfish and seaweed with
values between 40% and 50% of the seawater and freshwater totals,
respectively (Table 17). The proportion of the Yellow Sea to the seawater
remained constant, having an estimate of 45% through the years from 1997 to
2004, and the proportion from freshwater was about 35% every year (Fig. 17).
In the Yellow Sea, the total production showed a trend of increase from 400,000
MT in 1986 to 6.25 million MT in 2004.
Major farmed species: Yearly production of economically important cultured
species from China and Korea are given in Table 18. In the finfish species group,
the major species in China were sea bass (Lateolabrax latus), flounder
(Paralichthys olivaceus), black sea bream (Acanthopagru sschlegelii), and red
drum (Sciaenops ocellatus). In Korea, flounder (Paralichthys olivaceus) was the
dominant species showing an increasing trend in the yearly production. In
crustaceans, Fenneropenaeus chinensis was a common species in both nations.
For the shellfish species groups, Crassostrea gigas showed much higher
production than other species in both nations. This species' production rate in
China has kept an increase year after year at a level of 3.75 million MT in 2004,
but in Korea less than about 240,000 MT in 2004 as a peak production. The
yearly production of this species from China was about 15 times that of Korea.
Cyclina sinensis from China showed a high level of production at 2.8 million TM
in 2004, keeping a steady upward trend. In seaweed, China's dominant species
of Laminaria japonica produced more than 800,000 MT in the years of 2002-
13
2004. In Korea, Undaria pinnatifida and Porphyra spp were the main cultured
species with a decrease to about 200,000 MT in recent years (Table 18).
3.1.4.2 Aquaculture area
Total aquaculture area: Aquaculture area used every year in China and Korea
increased significantly from 461,500 ha in 1995 to 1,106,000 ha in 2004 (Table
19 and Fig. 18). The area in China rapidly climbed at a level of 1.05 million ha in
2004 from 416,000 ha in 1986 which was nearly doubled. Korea increased from
46,000 ha in 1995 to 56,000 ha in 2004. By species groups, shellfish area from
both countries occupied more than 65% every year, followed by crustacean
area, seaweed and finfish areas. The aquaculture area from China was about
95% of the total figure. Fig. 19 gives a trend of aquaculture area of species
groups for 10 years. In China, finfish area showed a downward trend from 1995
to 1999 and then it increased again from 2000 onward. The three species of
crustacean, shellfish and seaweed kept an increasing trend. Korea's trends
showed nearly unchanged patterns all the four species groups. The area of
collective farms was available only from Korea, keeping an increasing trend in
recent years (Fig. 19).
Marine farmed species area: The areas of marine farmed species based on
the data combined from China and Korea for 10 years are presented in Table 20.
The total area has indicated a trend of increase from 359,000 ha in 1995 to
760,000 ha in 2004 (Fig. 20). Percentage portion of species groups to the total
was: shellfish area 60.5%, crustacean 22.0%, seaweed 8.4% and finfish 3.5%
on an average throughout the whole period.
Interaction between marine farmed production and farmed area: Total
production per area increased from 7.2 MT/ha in 1996 to 10.4 Mt/ha in 2000
and it decreased to 8.2 MT/ha in 2004 (Table 21, Fig. 21). For shellfish, its
production/area peaked at 14.7 MT/ha in 1997 and revealed a decreasing trend
from 14.1 MT/ha in 2000 to 10.5 MT/ha in 2004 (Table 22, Fig. 22). Annual
production per area of seaweed showed a nearly constant value of 21 MT/ha
during 1996-1999. Its value decreased from 22.0 MT/ha in 2000 to 17.1 MT/ha
in 2004 (Table 23, Fig. 23). This might suggest that production per unit area
could not be expected to increase even if farmed area in this region would
expand in future.
3.1.5 Socio-economics
3.1.5.1 Vessels by fishery
14
The total number of vessels and gross tonnage including powered and non-
powered vessels by offshore and coastal fishery as well as distant waters
fishery are tabulated for each nation during 2000-2004 (Table 24).
Total number of vessels: China showed a trend of steady decrease from about
294,100 boats in 2000 to 241,300 boats in 2004. This was caused by decrease
of powered vessels throughout the period and the proportion of powered
vessels took over 91.0% every year. The number of non-powered vessels
stayed in between 20,400 and 24,300 vessels.
Korea has maintained a much lower number of vessels in both total powered
and non-powered boats than those of China. The numbers have remained
between about 91,600 and 95,900 vessels with a slowly decreasing trend, but
showed the proportion of more than 92.0% by powered vessels (Table 24).
Gross tonnage: China's gross tonnage decreased from 5.42 million tons in
2000 to 5.10-5.16 million tons in 2001-2002, but increased to 5.66 million tons
in 2003 and 5.60 million tons in 2004. The trend was also similar with the
powered vessels (Table 24). Korea showed a trend of continuous decrease from
923,000 tons in 2000 to 725,000 tons in 2004. This was totally depended on the
trend of powered vessels.
Vessel composition by fishery: Coastal vessels of both nations every year
took the proportion of over 99.0% of the total. There are about 2,000 distant
waters vessels in China and about 500 boats in Korea in recent years (Table
24).
3.1.5.2 Fisheries income
Both nations' fisheries incomes generally kept an upward trend and the 2004
incomes were higher than in other years (Table 25).
3.1.5.3 Exports and imports of fishery products
China's exports increased from 1,534,000 MT in 2000 to 2,421,000 MT in
2004, but Korea showed a trend of decrease (Table 26). Imports of China slowly
decreased, but increased in 2004, and Korea showed a year after year
increasing trend.
3.1.5.4 Economic importance of fisheries (GDP contribution)
Two countries maintained a steady increase in GDP but in the fisheries sector,
China increased and Korea decreased instead (Table 27). Fisheries contribution
to GDP in China was much higher than that of Korea.
15
3.1.5.5 Fishery consumption per capita
Per capita consumption of fishery in Korea was about 3.2-4.8 times higher
than that of China for certain years (Table 28).
3.2 Identification of current situation
3.2.1 China
The current situation in data and information mentioned through the national
report of China are described below:
) No available data on catch statistics by area and species.
) Lack of English-written publications and information.
) Most mariculture data and information are based on the provincial level.
So, it would be useful to access the data easily if they could be managed
under an independent government level
) No detailed data on habitat as mariculture methods.
) No available statistical data on mariculture licenses by habitat so far.
3.2.2 Korea
) No available data on catch statistics by area and species
) Little data available on area of collective farms during 1995-2000 but
available data from 2001 to 2004.
) Data on area for culture method of shellfish only available in 2004.
) The number of farm area from legally permitted farms does not include
illegal farms (when added, about 10% increase in total area).
3.2.3 Lack of data and information from two nations
It was pointed out that the following types of data and information are
essential to understand the current status of commercially exploited stocks in
the Yellow Sea as well as to carry out future research works.
) A need for basic statistics and effort data by different fishing methods for
standardization of fishing effort that should be used for quantitative
assessment to understand current exploitation level of marine resources.
- Recording on logbook for landings or catches with information on amount
of dumping and/or discards at sea.
) Estimations of relative abundance index (ex. CPUE, density etc.) from
fishery independent research.
) Distribution area and range of commercial species that migrate or
cross the boundary between two nations for TDA analysis.
16
- Statistical area distribution by rectangular method (0.5x0.5 miles) for each
species
- Establishment of long-term database available for retrieval use
) Size composition data or if possible age-length key data for cohort
analysis
) Submission of all data from both nations according to agreed data
formats, especially for mariculture data.
) Research works of joint cruises from China and Korea in the Yellow Sea.
3.3 Review of current political situation
3.3.1 Major laws and regulations related to fisheries
3.3.1.1 China
Fishery act: This Act was promulgated, enforced in 1986 as a legal provision.
Based on the Act, the central and provincial governments have issued various
laws and regulations consisting of more than 500 documents. On December 1,
2000, a revised Chinese Fishery Act went into effect, imposing strong
punishment for illegal fishing and establishing a legal foundation for a quota
management system.
There were about 30,000 fisheries inspectors and 1,500 enforcement vessels
including marine enforcement vessels in 2003.
Marine Environmental Protection Act: The Act went into effect in April 2000
for protection and improvement of environment, marine resources, pollution
damage, ecological balance, human health, and sustainable development in
economic and society. The chapter of marine ecological protection is highly
related to fishery resources.
Breeding and Protection Act of Fishery Resources: In 1957, a draft Act was
promulgated as a regulation and first trial to identify fishery resources for
protection. In 1979, this Act was issued in which 26 marine fishes, 7 shrimps
and crabs, 14 mollusks, 6 algae and 10 mammals were listed as protected
species. More detailed protection rules went into forces by each province.
Conservation regulation of living resources in the Bohai Sea: On May 1,
2004, this law went into effect to protect, enhance and rationally use living
marine resources, as well as to protect the ecological environment in the Bohai
Sea. In 1991, it was replaced with the regulation of fisheries resources breeding
and conservation, which set down the minimum landing size, minimum mesh
size and closing season for each fishing gear.
17
Regulation on administration/management of aquatic seedling
production: In December, 1996, the regulation was issued, and amended and
reissued on December 8, 2000. The main aspects are: ) regulation on the
examination and approval of native and excellent breeds, ) standard on the
examination and approval of native and excellent breeds, ) brief introduction
of species approved by the examination and approval committee of the nation,
) regulation on checking and accepting of the breeding factory, ) regulation
on the administration of producing procedure and regulation on the
administration of the project of breeding factory construction.
Fishing effort control: In 1981, identification of fishery problems and
overcapacity; In 1983, measures to stop increased catches, and strict control
over increase of fishing boats; In 1987, control effort limiting aggregate
horsepower by fishing zone; In 1997, fishing permits reissued in all coastal
provinces and cities; In 1999, new fishery structural adjustment guidelines for
strict control of fishing effort and catch reduction.
Measures designed to reduce effort include: ) stop on permission to build
new fishing vessels except for distant fishing purposes, ) comprehensive
clear up of illegal boats, ) prohibition on the introduction of foreign boats to
fish in the Chinese EEZ, ) gradual establishment of a mandated vessel
retirement system and, ) strict prohibition for non-fishing laborers to take jobs
in marine fisheries.
Currently three official documents are required for engaging in fishing
activities along the Chinese coast: ) fishing vessel inspection document, )
fishing vessel registration document and, ) fishing permit.
A fishing ban in the Yellow Sea, Bohai Sea and East China Sea has been
implemented for 2-3 months in summer since 1995 and similar measures along
the continental shelf of the South China Sea are used.
Output control: The government on the basis of the catch level in 1999 as the
maximum production imposed a zero growth policy in total marine catches. This
policy continued in the year 2000 and thereafter.
3.3.1.2 Korea
Off-shore, coastal fishery structure control: The main contents of off-shore
and coastal fishery structure reorganization policy are as follows: )
reorganizing type of off-shore and coastal fishery, ) control of off-shore and
coastal fishing waters, ) maintenance of continual usable fishing intensity, )
maintenance of proper vessel number, ) building of fishery management
18
system scientifically and, ) development and diffusion of fishing implements
and systematic support to fishermen.
Rebuilding of fishery resources: A newly management system has been
taking by government to enhance commercially important fish resources with
participation of fishermen since February 2001. At present, there are a total of
122 nationwide self-management fishery communities along the coastal area.
Output control: In 1999, the total allowable catch (TAC) system was started
with some commercial species such as chub mackerel, horse mackerel, sardine
in the west sea of Korea, Now, it has expanded to 10 species around Korean
waters.
Revision of fisheries sub-ordinate laws: Details of the preservation
ordinance of fisheries resources (Presidential decree 18095, on August 27,
2000) include: ) limit the use of double gillnet in Ulleung Island and Dokdo
island waters in the East Sea of Korea, ) standards of net-knot size in coastal
fishery and inland waters, ) capturing and picking Chinese mitten crab and
lenok during the forbidden period and, ) TAC resources management through
systematic selling and reporting.
Other revisions are: enforcement of ordinance of fisheries law Presidential
decree No. 18121, on November 4, 2003, and Rule of fisheries license and
declaration Marine Affairs and Fisheries (MOMAF) decree No. 247, on May 29,
2003.
3.3.2 Major laws and regulations related to mariculture
3.3.2.1 China
Firstly, current legislation and regulations are: standards for aquaculture
production, the code for aquaculture operations, quality standards for fish
products, environmental standards for fisheries including water quality
standards and standards for rearing techniques.
Secondly, aquaculture system and technologies should be developed in
accordance with accepted ecological standards.
Thirdly, a licensing system for the discharge of sewage drain into fishery
environments should be implemented where sewage could only be released
after approval by the fishery environment-monitoring department. Financial
charges would be collected from the sources of discharging sewage and be
used as a management fee to assist in: production management, technical
renovation, treatment of wastes and drainage waters, and cleaning of pollution
19
to protect or recover fishery environments.
3.3.2.1 Korea
Status of raising fishery-cultivating law: Enforcement ordinance of raising
fishery-cultivating law (Presidential decree No. 18052) was promulgated on July
15, 2003, where the minister of MOMAF and provincial governors can decide
the methods and contents of basic investigation for Raising Fisheries
Development Plan.
The rule of raising fishery-cultivating law (MOMAF decree No. 251, on July 15,
2003) was enacted to decide methods and procedures of fishery developing
areas.
3.4 Identification of critical habitats
Critical elements causing natural environment changes in the Yellow Sea,
based on the national reports as well as the data and information in this report,
are summarized.
3.4.1 Regional issues
3.4.1.1 China
) Over-exploitation of target species and climate change has caused a
shifting in dominant species with the food-web shifting downwards.
) Insufficient monitoring and lack of scientific-based knowledge on status of
stocks.
) Insufficient management and control of fisheries activities
) Intensive use of natural coastal habitats and ecosystems for mariculture,
exceeding the carrying capacity and causing environmental degradation,
disease outbreaks and reduced growth rates.
) Poor regional coordination, communication and collaboration between
fishermen and government.
) Insufficient information and environmental impact assessments for
ecosystem-based management.
3.4.1.2 Korea
) Local production of farmed animals and seaweeds is not included in total
farmed figure when they are sold directly. It is estimated that such
production comprises an additional 10-30% to the total, depending upon
the species.
) Data on aquaculture area only include licensed farms until 1997, but from
20
1998 the annual aquaculture areas include all from the licensed, permitted
and notified farms.
) Data on area of culture method include only licensed farms before 1998
and during the period 1998-2004 the data on culture method include all
from licensed, permitted or notified farms.
3.4.2 Major issues from regional data and information
3.4.2.1 Fisheries
Heavy exploitation of capture fisheries: Most of the commercial fisheries
resources seem to be heavily exploited due to intense Chinese fishing activities,
showing a significant increase in catch since the late 1990s despite of a zero
growth policy in marine total catch referenced to the 1999 catch level. It is
anticipated, therefore, that sustainable yield can not be achieved in the future at
the current level of catch from capture fisheries in this region. It is not possible,
however, to arrive at any conclusions on the status of commercial important
stocks on the basis of the currently available data. Such information is
required to perform fish stock assessments by the two nations' institutes for a
reasonable level of managements to be achieved.
Fishing effort: The total registered number of powered fishing vessels has
been kept on a somewhat constant level since the 1990s, but trends in gross
tonnages and KW (kilowatt) showed increases during the study period. This
implies that the fishing power and/or fishing efficiency have significantly
improved taking into account recent catch levels. It is assumed, on the other
hand, that fishing pressures on marine living resources have increased since
the1980s.
Catch per unit of effort (CPUE): CPUE values as a relative abundance index
were calculated for 10 commercial species using fishing effort information
including the total number of vessels, gross tonnages and KW. It is clear that
the estimated values do not reflect the real abundances of each fish stock. The
fishing effort data used for calculating the CPUE values was not the actual
fishing efforts, but the total number of registered boats, tonnages and KW. The
relative abundance index obtained from the total catch and fishing effort could
not be used for quantitative assessments. This makes it difficult to understand
how the aquatic population reacts to a given level of fishing effort. In fact, the
long-term CPUE trends from China showed a continuously increasing figure,
but the CPUE of Korea decreased every year. Accordingly, it identifies the
21
important data requirements for stock evaluation that can provide reliable CPUE
values for fish stocks and enable the formulation of rational fisheries
management advice on the basis of synthetic models.
3.4.2.2 Biological and ecological data
Growth parameters: The comparison of the biological aspects of commercial
species, based on the two nations' research, reveals that the estimated growth
figures showed considerable differences: for small yellow croaker, longevity (or
maximum age) were disparate, being 23 years for China and 10 years for Korea,
and for Spanish mackerel, asymptotic lengths were 71 for China and 123.3
for Korea. Some differences also existed in the growth parameters of other
species. This situation causes discrepancies in such population characteristics
as instantaneous natural mortality (M) and instantaneous total mortality (Z) as
well as in analytical stock assessments including VPA (virtual population
analysis) and yield-per-recruit study. It is recommended that a study group or
working group be established to perform a cooperative research effort to
improve the age estimation techniques used by the two nations' institutes.
Reproduction and spawning characteristics: The fecundity of commercial
species showed a wide range of values, but did not result in markedly different
outcomes for the same species from the two nations. However, the minimum
sizes at maturity of small yellow croaker and Spanish mackerel have large
differences between the two nations. These will result in the prediction of
differing recruitment pattern in the same stocks. There is no information on
recruitment patterns, so a study is needed for developing an index of
recruitment for commercially important fish species.
Migration and distribution of commercial species: General patterns of
migration routes and distributions of commercial species are described using
only the data from the two nations' institutes. More detailed descriptions would
require data on statistical fishing locations by season and rectangular sea
blocks distribution (e.g., 0.5x0.5 square miles). It is well known, in general, that
tagging experiments will be of help in understanding actual migration routes and
ranges in the seasonal distributions of marine animals.
Bottom trawls survey: Research cruise surveys were conducted every June in
the years 2000-2004 in China and spring and winter in the years 2003-2005 in
Korea. The data and information from these research activities are very limited
and cannot be well correlated with syntheses because of spatial-temporal
differences among the various surveys. It is recommended that research
22
investigations based on joint cruises between the two national institutes be used
in the future.
3.4.2.3 Mariculture
Aquaculture farmed production: Farmed aquaculture production showed a
continuously increasing trend and reached 33 million MT in 2004. This resulted
mainly from Chinese production that accounted for 96.4% of the total during the
period 1995-2004. Based on these figures, there was a substantial change in
the production of China between 1995 and 1996, from about 1.1 million MT in
1995 to 16.6 million MT in 1996 (by about 16 times compared to the previous
year). This period explains a turning point in Chinese aquaculture farmed
production.
Marine farmed production: Seawater farmed production in the Yellow Sea
maintained an increasing trend similar to that of aquaculture production,
recording a production of 6.2 million MT in 2004. Significant increases in
production from 402,000 MT in 1995 to 2.9 million MT in 1996 (i.e., by a factor
of 7) occurred mainly as a result of increased Chinese mariculture. This rapid
growth in mariculture warrants explanation.
Aquaculture area: The total aquaculture area in the Yellow Sea used by the
two countries increased significantly from 462,000 ha in 1986 to 1.1 million ha in
2004, with China accounting for approximately 95% of the total increase. In
terms of the marine farmed area, the total area showed a continuous increase
from 359,000 ha in 1986 to 760,000 ha in 2004. This would appear to imply that
there has been significantly increased impact on marine environments as a
result of the growth in mariculture facilities in the coastal areas of the region.
Interaction between marine farmed production and marine farmed area: In
the Yellow Sea, yearly production depended heavily on the shellfish production,
which accounted for an average of 75% of the total during the entire period.
Both the total production of shellfish and the associated farmed area for
shellfish production have increased gradually, although the production per unit
area reveals a decreasing trend from 14.1 MT/ha in 2000 to 10.5 MT/ha in 2004.
For seaweed, annual production per area also showed a downward trend from
22.0 MT/ha in 2000 to 17.1 MT/ha in 2004. This suggests that production per
unit area could not be expected to increase even if farmed area in this region
was expanded in the future.
3.4.2.4 Socio-economics
23
Some data and information related to the fisheries socio-economic aspects of
fisheries made available by the two nations are contained in this report.
However, only general descriptions have been provided without the detailed
analyses required for long-term data interpretation. There is a need, on the one
hand, to collect long-term data on fisheries economics. On the other hand, there
is a need to include expertise on economic data analysis in future studies.
3.4.3 Establishing a regional fisheries database
It is recommended that a database be established, not only for historical
fisheries data and information but also for future cooperative research studies in
the Yellow Sea between the two nation's institutes, which can be expanded to
include other nations in this area. Such a database would be of great assistance
to scientific activities for collecting and retrieving research data and for
monitoring the status of fisheries resources.
4. Theoretical approach
4.1 Modeling
Most of aquatic animals in the Yellow Sea have utilized at commercial level
and some of important fisheries resources have shown a continuous downward
trend in annual total catch (see section 3.1 in this report). Once natural
resources is to be exploited from external causes it is necessary to be managed
by appropriate measures, so that the animals should be kept at proper level for
future uses from protecting over-fishing and/or overexploitation.
4.1.1 Estimation of population size
Many kinds of theoretical models for estimating population size (or biomass)
have been developed according to available fisheries data and information.
Some useful models that have been used mainly by researchers are only
introduced below.
Direct methods: Trawl survey by using research vessels/chartered vessels
Ichthyoplankton survey
Hydroacoustic survey
Indirect methods: Cohort analysis -Gulland (1965)
Pope (1972)
Deriso et al. (1985)
Zhang and Sullivan (1988)
Catch per unit of effort -Leslie and Davis (1939)
DeLury (1947)
24
Pertesen' tagging method
Capture and release
4.1.2 Population dynamics
In general, two types of methods are being used for stock assessments and
management purposes in order to evaluate impacts by fishing efforts forced into
fisheries resources, that is, synthetic models called surplus production models
or global models, and analytical models called structural models. In addition,
reproduction models obtained from stock size-recruit relation offers very
important information for recruitment and/or growth over-fishing.
Synthetic models: Schaefer (1954, 1957)
Pel a and Tomlison (969)
Fox (1970)
Schnute (1977)
Csirke and Caddy (1983)
Analytical models: Thompson and Bell (1934)
Beverton and Holt (1957)'s yield per recruit
Reproduction models: Ricker (1954)
Beverton and Holt (1957)
4.1.3 Ecosystem-based management
Fisheries management based on ecosystem components has been simulated
since late 1970s. Most representative models are (Zhang et al., 2002):
Andersen and Ursin (1977)
DYNUMES and PROBUB models (Laevastu and Favorite, 1978a, 1978b;
Laevastu and Larkins 1981)
Ecopath (Polovina, 1984)
Ecopath (Christensen and Pauly, 1992)
Ecosim (Walters et al., 1997)
4.2 Best management practices
Utmost purposes of fisheries management are to maximize the resources, to
maintain rational conservation and sustainable uses. To achieve this goal,
several measures have been imposed through government-based controls. The
management measures are summarized below:
Technical measures: Size limit in taking
Prohibition during spawning seasons
Prohibit of fishing in spawning/nursery seasons
Input control: License and permit system for fishing activity
25
Allocation of individual fishing activity
Control of number of fishing vessels and gear
Illegal fishing with or without licenses
Output control: Total allowable catch (TAC) -Total catch quota system
Individual fishing quota system
Individual quota (IQ)
Individual transferable quota (ITQ)
Fisherman-oriented management from government-led control:
Voluntary fisherman's participation for fisheries management
Sharing responsibilities on illegal fishing and conservation
Cooperation between fishermen and government from conflicts
Joint users of resources as managers
4.3 Maximum sustainable fisheries yield (MSY)
Even though Larkin (1977) pointed out that there are some unreasonable
validities in adapting surplus production models as management reference point,
the models are still survival, widely used in stock assessment sector. On the
other hand, its estimated value is based on TAC management system to
calculate biological acceptable catch (ABC) together with biological reference
points. The ABC estimation methods of TAC-based management differ
according to tier of data available for demersal and pelagic resources,
respectively (Zhang et. al., 2000).
(1) The ABC models for demersal resources are detailed following:
_______________________________________________________________
Tier 1 Information available: Reliable estimates of B, F, BMSY, fMSY, Fx% and M
1.1 Stock state: B/ BMSY 1
FABC low value out of fMSY or F35%
1.2 Stock state: < B/ BMSY 1
FABC low value out of either fMSY X (B/ BMSY- )/(1- ) or f35%
1.3 Stock state: B/ BMSY < : FABC = 0
Tier 2 Information available: Current B, Bx%, Fx%, M
2.1 Stock state: B/B35% 1
FABC F35%
2.2 Stock state: < B/ B35% 1
FABC F35% X < B/ B35% 1
2.3 Stock state: B/B35% : FABC = 0
Tier 3 Information available: Current B, F0.1, M
26
FABC F0.1
Tier 4 Information available: Time-series catch (Y) and effort (or CPUE) data
4.1 Stock state: CPUE/CPUEMSY 1
ABC MSY
4.2 Stock state: < CPUE/CPUEMSY 1
ABC MSY X (CPUE/CPUEMSY - )/(1- )
4.3 Stock state: CPUE/CPUEMSY ; ABC = 0
Tier 5 Information available: Reliable catch history (Y)
ABC 0.75 X YAM (average catch over an appropriate time period)
Determination of ABC in tiers 1 3:
ABC = (BF
)
ABC / M + FABC) X (1 e-(M+FABC )
Where B: biomass, M: instantaneous coefficient of natural mortality,
FABC: instantaneous coefficient of fishing mortality determined
by the data available and stock status
In tiers 1, 2 and 4, = 0.05.
(2) The ABC models for pelagic resources are described following:
_____________________________________________________________
Tier 1 Information available: Reliable estimates of annual B and F, BMSY, fMSY,
Fx%, M and environmental factor
1.1 Stock state: B/ BMSY1
FABC low value out of fMSY or F30%
1.2 Stock state: < B/ BMSY 1
FABC low value out of either fMSY X (B/ BMSY- )/(1- ) or f30%
1.3 Stock state: B/ BMSY < : FABC = 0
Tier 2 Information available: Current B at age, Bx%, Fx%, M and environmental
factor
2.1 Stock state: B/B30% 1
FABC F30%
2.2 Stock state: < B/ B30% 1
FABC F30% X < B/ B30% 1
2.3 Stock state: B/B30% : FABC = 0
Tier 3 Information available: Current B, F0.1, M
FABC F0.1
Tier 4 Information available: Time-series catch (Y) and effort (or CPUE) data
4.1 Stock state: CPUE/CPUEMSY 1
27
ABC MSY
4.2 Stock state: < CPUE/CPUEMSY 1
ABC MSY X (CPUE/CPUEMSY - )/(1- )
4.3 Stock state: CPUE/CPUEMSY ; ABC = 0
Tier 5 Information available: Reliable catch history (Y)
ABC 0.75 X YAM (average catch over an appropriate time period)
Determination of ABC in tiers1 3:
ABC = ABC
)
r + t (Bi FABC/M + FABC) X (1 e-(M+FABC )
i=r+1
ABC
)
r = (R Fr/M +Fr) X (1 e-(M+Fr , R = f (SB, Ei)
Where Bi: biomass at age iI, M: instantaneous coefficient of natural
mortality, Fr: instantaneous coefficient of fishing mortality determined by
the data available and stock status, r: recruit age, t: maximum fishing
age.
Without data of environmental factor in tiers 1-3, the equation for
demersal stocks would be applied to determine ABC.
In tiers 1, 2 and 4, = 0.05.
5. Comparative analysis approach
5.1 Comparative analysis with other LME's international projects
It is known that there are about 63 Large Marine Ecosystems (LME) of the
world (www.edc.uri.edu/lme). In this report, the LMEs with a semi-enclosed sea
were selected for comparative purposes in terms of brief description, states of
fisheries, socio-economic conditions and governance. If necessary, some
important LMEs are also described.
Eastern Bering Sea LME
Description: This LME is characterized by its Sub-Arctic climate. The growing
impacts of pollution, overexploitation and environmental changes on sustained
biomass yield are under investigation.
Fish and fisheries: Catches of all major species groups decrease recent, but
supporting the world's largest pollock fishery. Other commercially valuable
species include halibut, herring, capelin, Pacific cod and plaice etc. There is
evidence of overexploitation, excessive by-catch and destructive fishing
practices. There is strong evidence of effective ecosystem-based management
planning for this LME and the management regime annually updates fishing
28
quotas based on biomass estimates.
Socio-economic conditions: Native Americans in this region depend on its
resources for their subsistence in food, Alaska natives benefit from individual
fishing quota or IFQs, and community development quotas (CDQs).
Governance: The North Pacific Fishery Management Council manages with
the goal of maintaining stable yields by shifting harvest allocation species.
Gulf of Mexico LME
Description: The LME characterized by its tropic climate and bordered by USA,
Cuba and Mexico. The growing impacts of pollution, overexploitation, and
environmental changes on sustained biomass yields are under investigation for
the LME. Intensive fishing is the primary force driving the LME with climate as
the secondary driving force.
Fish and fisheries: Main target species from fishing are mackerel, shrimp, blue
crab. Red grouper is the most important commercial species of reef fish off the
west Florida coast. Red snapper is apparently the most over fished species in
the Gulf of Mexico. The management of king mackerel has been successful in
increasing the biomass
Socio-economic conditions: Major assets are fisheries, tourism, agriculture,
oil and infrastructure, trade and shipping. Commercial fishing is an important
component of the LME's economy.
Governance: Marine resources experts from Mexico, Cuba and USA have
developed a project for the LME. The result will be a Trans-boundary Diagnosis
Analysis and Strategic Acton Programme. There is no current institutional
arrangement for cooperation between the three countries.
East China Sea LME
Description: This LME is a vast, semi-enclosed LME bordered by China, South
Korea and Japan. The LME is influenced by the warm Tsushima Current and
the Kuroshio Current. It is a productive LME with shallow coastal waters that
provide spawning and nursery grounds for many pelagic species. Intensive
fishing is the primary force driving the LME with climate as the secondary
driving force.
Fish and fisheries: The LME is intensively exploited for fisheries and algae.
Due to an overexploitation, significant changes in fisheries biomass have
occurred in the past few years. The key species are hairtail, large yellow croaker,
small yellow croaker, filefish, mackerel and shrimp etc. Heavy fishing mortality
has resulted in a shift from an older to faster growing smaller such as shrimp
29
and cephalopods. There are changes occurring in catch composition and
ecological diversity.
Socio-economic conditions: The LME region is an important economic area
that is experiencing rapid economic development. Mariculture is a growing
economic activity in the region.
Governance: An important governance initiative will be to take measures to
recover depleted fisheries resources and improve ecological and environmental
conditions. Reducing fishing efforts are strongly required from the current high
levels including number of fishing vessels.
Sea of Japan/East Sea LME
Description: This LME is a semi-enclosed sea with entering the Tsushima
Current, a small branch of the warm Kuroshio Current. Climate is the primary
force driving the LME, with intensive fishing as the secondary driving force.
Fish and fisheries: The Japanese sardine is an abundant pelagic fish
consisting more than 70% of the total catch. Others are scad, mackerel,
yellowtail, common squid and anchovy etc.
Socio-economic conditions: This LME coastal region is highly developed with
commercial ports and fishery harbors. It is very reliant on the sea for its supply
of fish, seaweed and other marine resources.
Governance: The five nations sharing the governance of the LME are Russia,
China, South Korea, North Korea and Japan. There are conflicts arising from
name of the sea (Sea of Japan and called the East Sea by South Korea). In
terms of environmental protection, bilateral agreements have been concluded
between China, South Korea, Japan and Russia.
Sea of Okhotsk LME
Description: The LME is a semi-enclosed sea at the edge of Russia and
Northern Japan. There are marked differences in climate, hydro-graphy and
biology. Climate is the primary force driving the LME with the intensive fishing
as the secondary driving force.
Fish and fisheries: Commercial important species are walleye Pollock,
flounder, herring Pacific salmon cod and capelin. Walleye Pollock abundance
appears to depend on climatic or oceanographic factors. Over fishing affects
most of the major fish stocks. Nowadays stocks of Pacific salmon stocks are at
low levels.
Socio-economic conditions: Fisheries in the region and fish processing
provide an economic basis for the lucrative Sakhalin fishing industry.
30
Overexploitation is depleting some of the fish stocks. The Kamchatka peninsula
is also rich in deposits of gold, silver, copper and coal.
Governance: The LME comes under the government of Russia. The issue of
who has sovereignty over the Kuril Islands involves Japan.
Arabian Sea LME
Brief description: The LME is characterized by its tropical climate. There is
interchange of surface waters in the Indian Ocean between the Arabian Sea
LME and Somalia Current and the Bay of Bengal LME.
Fish and fisheries: This LME is one of only 6 LMEs identified in which trends
are not decreasing and for which a precautionary approach to management
might lead to sustainability. There is a high catch percentage for coastal region
and for pelagic fishes.
Socio-economic conditions: A high catch are from artisanal fisheries. Most
important export is prawn. Overexploitation of prawn, sardines, mackerels and
promfrets has been caused by the introduction of large fishing vessels that fish
illegally near the coast.
Governance: The countries of Somalia, Oman, Iran, Iraq, Kuwait, India and
Pakistan, share in the governance of the LME. There is urgency in the need for
a long-term management plan. The multiplicity of national boundaries and EEZ
make governance complex. The coastal nations of the region need to develop a
regional framework that would encompass jurisdictional issues.
5.2 Consideration of different requirements between central and local
governments
There have been arguments and requirements between central and local
governments. Core things that need to take considerations are listed below:
) Multi-species fisheries management
) Multi-gear fisheries management
) Trans-boundary fishing between large and local areas (between nations)
- Migratory species
) Trans-boundary fishing between local areas (or between provinces)
) Illegal and ghost fishing, especially at spawning and nursery seasons.
) Conflicts between fishing vessels.
) Demolish and reclamations of coastal areas.
31
REFERENCES
Andersen, K. P. and E. Ursin. 1977. A multi-species extension to the Beverton
and Holt theory of fishing with accounts of phosphorus circulation and
primary production. Medd. Danm. Fisk.-og Havunders, N. S., 7:319-435.
Beverton, R. J. H. and S. J. Holt. 1957. On the dynamics of exploited fish
population. Fishery investigation. Series II. Marine Fisheries. Great Britain
Ministry of Agriculture. Fisheries and Food, 19, 533p.
Christensen, V. and D. Pauly. 1992. ECOPATH II, a software for
balancing steady ecosystem models and calculating network
characteristics. Ecol. Modeling, 61: 169-185.
Csirke, J. and J. F. Caddy. 1983. Production modeling using mortality estimates.
Can. J. Fish. Aquat. Sci. 40: 43-51 (with errata in Can. J. Fish. Aquat. Sci..
40: 255-256).
DeLury, D. B. 1947. On the estimation of biological population. Biometrics, 3:
145-167.
Deriso, R. B., T. J. Quinn and P. R. Neal. 1985.Catch-age analysis with auxiliary
information. Can. J. Fish. Aquat. Sci. 42: 818-824.
Elsevier science. 2003. Large marine ecosystem of the world - Trends in the
exploitation, protection and research, LME 48-Yellow Sea, edited by
Hempel, G. and K. Sherman, 423p.
Fox, W. W. Jr. 1970. An experimental surplus yield model for optimizing
exploited fish populations. Trans. Amer. Fish. Soc., 90: 80-88.
Gislason, K., M. Sinclair and K. Sainsbury. 2000. Symposium
overview: Incorporating
ecosystem objectives within fisheries
management. ICES Journal of Marine Science, 57: 468-475.
Gulland, J. A. 1965. Estimation of mortality rate. Annex to arctic fisheries
workshop group report. International Council for the Exploitation of the Sea,
C. M. 1965/3, Copenhagen.
Gulland, J.A. 1983. Stock assessment: Why? FAO, FIRM/C 759, Rome, Italy.
Laevastu, T. and F. Favorite, 1978a, Numerical evaluation of marine
ecosystems, Part I. Deterministic Bulk Biomasss Model (BBM). Northwest
& Alaska Fish.Cen, Seattle, Wash., Pro. Rep.
Laevastu, T. and F. Favorite, 1978b. Numerical evaluation of marine
ecosystems, Part II. Dynamical Numirical Marine Ecoststem Model
(DYNUMES III) for evaluation of fishery resources. Northwest & Alaska
Fish.Cen, Seattle, Wash., Pro. Rep.
32
Laevastu, T. and H. A. Larkins. 1981. Marine fish Ecosystem Fishing News
Books, Oxford.
Larkin, P. A.1977. An epitaph for the concept of maximum sustainable yield.
Trans. Am. Fish. Soc., 106(1): 1-11.
Leslie, P. H. and D. H. S. Davis. 1939. An attempt to determine the absolute
number of rats on a given area. J. Anim. Ecol., 8: 94-113.
Pauly, D., V. Christensen and C. Walters. 2000. Ecopath, ecosim
and ecospace as tools for evaluating ecosystem impact of fisheries.
ICES Journal of Marine Science, 57: 697-706.
Pellar, J.J. and P.K. Tomlinson. 1968. A generalized stock production model.
Inter. Am. Trop. Tuna comm. Bull. 13: 419-496.
Polovina, J. J. 1984. Model of a coral reef ecosystem, I. The ECOPATH model
and its application to French Shoals. Coral Reefs, 3(1): 1-11.
Pope, J. C. 1972. An investigation of the accuracy of virtual population analysis
using cohort analysis. Int. Comm. Northwest Atl. Fish. Res. Bull., 9: 65-74.
Ricker, W. E. 1948. Production and utilization of fish population. Ecol. Monogr.,
16:379-391.
Ricker, W. E. 1954. Stock and recruitment. J. Fish. Bd. Can., 11: 559-623.
Schaefer, R. B. 1954. Some aspects of the dynamics of populations important
to management of commercial marine fisheries. Inter. Am. Trop. Tuna
Comm. Bull., 1: 25-56.
Schaefer. R. B. 1957. A study of the dynamics of the fishery for yellowfin tuna in
the eastern tropical Pacific Ocean. Inter. Am. Trop. Tuna Comm. Bull.,
2:245-285.
Schnute, J. 1977. Improved estimates from the Schaefer production model:
theoretical considerations. J. Fish. Res. Bd. Can., 34:583-603.
Thompson, W. F. and W.H. Bell. 1934. Biological statistics of the Pacific
halibut dynamics. J. Amer. Stat. Assoc. 64: 111-130.
Walters, C., V. Christensen and D. Pauly.1997. Structuring dynamics
models of exploited ecosystems from trophic mass-balance
assessments. Review in Fish Biology and Fisheries, 7: 139-172.
West Sea Fisheries Research Institute (WSFRI). 2006. Reducing environmental
stress in the YSLME: Data/information collection fisheries component,
96p.
Yellow Sea Fisheries Research Institute (YSFRI). 2006. Report of data and
information collection from China, National report of China, 56p.
33
Zhang, C. I., J. B. Lee, S. Kim and J. H. Oh, 2002. Climate regime shift and
their impacts on marine ecosystem and fisheries resources in the Korean
waters. Oceanography, 47: 171-190.
Zhang, C.I., J.. B. Lee and C.I. Baik. 2000. A study on the stock assessment
methods incorporating ocean environment factors. J. Korean Soc. Fish.
Res., 3: 16-28 (in Korean)
Zhang, C. I. and P. J. Sullivan.1988. Biomass-based cohort analysis that
incorporates growth. Tran. Amer. Fish. Soc., 117(2):180-189.
34
Pollution China
Report
On Preliminary Regional Targets
With Respect to the Project's Objectives
Of Pollution
by
WEN Quan
National Marine Environmental Monitoring Center
Proposed EcoQOs for Pollution Management Actions of SAP for YSLME Project
WEN Quan
SOA Key Laboratory of Coastal Ecosystem and Environmental Research
National Marine Environmental Monitoring Center of China
1. Reviewing historical data and trends
1.1 Pollution issues identified in TDA Report
The Regional Working Group on Pollution first established the nature and priorities among
the environmental concerns within its sphere of reference. These issues, their nature and their
relative priorities are shown in Table 1(YSLME TDA Report).
Table 1.Types and Nature of Environmental Problems Relating to Pollution
Environmental Issue
Nature of Issue
Priority of Issue 1
1. Eutrophication
Category of Environmental Problems
1
Nitrogen (N) enrichment
Immediate Cause
1/1
Phosphorus (P) enrichment
Immediate Cause
Low
Silicate (Si) depletion
Immediate Cause
1/2
Changed Si:N:P ratios
Immediate Cause
1/2
Oxygen depletion
Consequence N/A
Phytoplankton blooms including red tides
Consequence N/A
2. Contaminants and their Effects
Category of Environmental Problems
2
Faecal contamination
Environmental Problem
2/1
Heavy metal contamination
Environmental Problem
2/5
POPs2 contamination
Environmental Problem
2/4
PAH3 contamination
Environmental Problem
2/2
Marine litter
Environmental Problem
2/3
3. Increased risks to human health
Category of Environmental Problems
3
- through seafood contamination
Environmental Problem
3/2
- through exposures to contaminated water
Environmental Problem
3/1
1.2 Historical trends
Temporal trends in dissolved nitrogen, phosphate and silicate in the Yellow Sea are depicted
in Figure 1. This figure shows a trend of increasing dissolved inorganic nitrogen (DIN) and
1 "1" signifies the highest priority; "1/1" signifies the highest priority in category 1; N/A = not
applicable
2 Persistent Organic Pollutants as defined by the Stockholm Convention 2001
3 Polyaromatic hydrocarbons
1


corresponding declines in the concentrations of phosphate and silicate in the Yellow Sea
resulting in an increasing N/P ratio and reduced silicate that would be consonant with
conditions under which blooms of dinoflagellates would be expected to become more
frequent.
Figure 1. Temporal Trends in Annual Mean Nutrient Concentrations
and N/P Ratio in the Yellow Sea
Based on the Bulletins of Marine Environmental Quality in China (2001-2005), it can
be seen that the environmental quality in Yellow Sea on China side shows a trend of
deterioration, showing in Figure 2.
2001
2003
2002
2004
2005
Figure 2 Environmental status and trends in Yellow Sea (2001-2005)
Dissolved Oxygen (DO) is an important indicator for ecosystem quality. The contents of DO
in seawater in southern Yellow Sea fluctuated in last decades. The average content of
dissolved oxygen (DO) was about 6.75mg/Land fluctuated from 5.8mg/L to 7.75 mg/L in the
Southern Yellow Sea (see Figure 3), which shows that the ecosystem in southern Yellow Sea
has not been stable.
2
8
7.5
7
g/L
m
6.5
6
5.5
5
1985 1986 1987 1988 1989 1990 1991 1992 1993 1994 1995 1996 1997 1998 2000 2001 2002 2003 2004 2005
Figure 3 The trends of average DO contents in southern Yellow Sea
Figure 4 and Figure 5 show that the contents of P and N in seawater of southern
Yellow Sea has the same trends of fluctuation.
0.025
L
0.020
/
g
m
0.015
0.010
0.005
0.000
1985 1986 1987 1988 1989 1990 1991 1992 1993 1994 1995 1996 1997 1998 2000 2001 2002 2003 2004 2005
Figure 4 Trends of PO4-P in seawater of southern Yellow Sea
0.600
0.500
L
/
0.400
g
0.300
m
0.200
0.100
0.000
1985 1986 1987 1988 1989 1990 1991 1992 1993 1994 1995 1996 1997 1998 2000 2001 2002 2003 2004 2005
Figure 5 Trends of DIN in southern Yellow Sea
The RWG-E has noted that there has been a significant increase in the annual incidence of
intense algal blooms (see Figure 64, YSLME TDA Report). Such blooms can cause increased
mortality of mariculture stocks, kills of wild fish thereby reducing fishery yields, and
increased risks to seafood consumers through the incorporation of natural toxins into
exploited marine organisms. Compared with the temporal trends in annual mean nutrient and
4 This figure depicts intense algal blooms defined as exceeding a minimum cell density (cells/cm3) or
causing discoloration of water (i.e., red tides). The Korean data may partially reflect increased
monitoring since 1995.
3
concentrations and N/P ratio in the Yellow Sea the ecosystem quality objectives for N, P and
Si could be determined, after discussing with RWG-E.
Figure 6. Frequency of Intense Algal Blooms
The target proposed from Ecosystem Group of China for control of red-tides in
Yellow Sea is that the occurrence of red tides in Yellow Sea is kept at the level in the
end of s, i.e. times per year, less than of the highest.
2. Identifying the current situation
Based on the Bulletin of Marine Environmental Quality in China 2006, the
environmental quality in Yellow Sea is still deteriorating. The heavy pollution area,
9000km2, is increasing more than that in 2005, showing in Figure 7.
Figure 7. Status of environmental quality in Yellow Sea of 2006
The heavy pollution area is located in coastal waters in Jiangsu Province and the
major pollutants are DIN, PO4-P and Oil.
The mussel watch program in China gives the trends of pollutants in bivalves in
4
marine environment. The assessment results and trends in coastal waters of Yellow
Sea show in Table 2.
Table 2. Trends of pollutant contents in bivalves
in coastal waters of Yellow Sea (19972006)
Coastal Area
Oil
THg
Cd
Pb
As
DDT
PCBs
Water near Dalian
Water near Yantai
Water near Qingdao
Water in north Jiangsu
Water near Nantong
Changjiang Estuary
significantly
slightly
increasing
no change
increasing
increasing
slightly
significantly
decreasing
no enough data
decreasing
decreasing
The atmospheric monitoring results show increasing trends of pollutants of
atmospheric deposit (Table 3)
Table 3 Atmospheric deposit trends of pollutants in area of Yellow Sea
Fluxes of atmospheric deposit Contents of pollutant in aerosol significantly
Areas
increasing
TSP*
Cu
Pb
Cd
TSP*
Cu
Pb
Cd
increasing
near Dalian
slightly
increasing
near Qingdao
no
change
Changjiang
slightly
Estuary
decreasing
All seas
significantly
decreasing
* TSP: Total suspended particles in atmosphere.
3. Proposed EcoQOs
3.1 Methodologies
The methodologies for EcoQOs identification on pollution component of YSLME are
listed in Table 4 (revised from SAP Concept Report).
5
Table 4. Methodologies for EcoQOs identification on pollution component
Methodology Task
Retrospective approach
Review historical data
Check historical trends
Identify current situation
Review current political situation
Identify critical habitats
Theoretical approach
Best Management Practices(BMP)
Comparative analysis approach
Comparative analysis with other LME's,
international projects
Consideration of different requirements
between central and local govt.
3.2 Identifying Environmental Targets in RWG-P Meeting
There was extensive discussion on the proposed procedure to identify the
management issues, the regional "targets" ( Table 5) for the Pollution Component,
and associated activities necessary for developing the SAP, during the 3rd RWG-P
Meeting.
Table 5 Proposed Regional "Targets"
3.3 Identifying environmental Targets from BMP
6
In China, marine environmental management has been developed from marine
pollution monitoring and assessment to pollution management. And right now the
novel technologies are adopted and the management approach changes from
environmental standards approach to medically-based approach, even to the
ecosystem-based approach. Recently the management depends upon the
environmental planning and the environmental quality standards in marine function
zones, which is called as the function-based environmental standard approach.
Different function zones have different environmental quality requirements according
to the national marine environmental quality standards (e.g. seawater quality
standards, marine organism quality standards, marine sediment quality standards, etc.).
This can be used for the zonation of environmental targets, when the function has
been defined for the zones. The function zones are divided in general as follows:
----zone for utilization and conservation of fishery resources
----zone for port and transportation
----zone for tourism
----zone for seawater utilization
----zone for MPAs
----zone for marine and coastal engineering
----zone for development of energy
----zone for development of minerals
----zone for specific utilization (scientific research, etc)
----reserved zones
Seawater Quality Standard(1997) involves the major pollutants as: floating materials,
suspended substances, coliform, pathogen, DO, COD, BOD, inorg-N , non-ion-NH3,
inorg-P, Hg, Cd, Pb, Cr, As, Cu, Zn, Sn, Ni, cyanide, sulfide, oil, phenol, 666, DDT,
etc. And 4 grades are classified as:
1st grade----fishery, natural reserves, endangered animals MPAs
2nd grade----mariculture, bathing waters, waters related to human health and food
production
3rd grade----general industry, tourism waters
4th grade----port and ocean exploration
Marine Sediment Quality Standard (2002) involves the major pollutants as: wastes,
coliform, pathogens, Hg, Cd, Pb, Zn, Cu, Cr, As, org-C, sulfide, oil, 666, DDT, PCBs,
etc. And 3 grades are classified as:
1st grade----fishery, natural reserves, MPAs for endangered widelifes, mariculture,
waters related to human health and food, etc.
2nd grade----general industry, coastal tourism
3rd grade----port and ocean exploration with special purposes
Marine Organism Quality Standard(2001) involves the major pollutants as: sensory,
7
coliform, PSP, Hg, Cd, Pb, Cr, As, Cu, Zn, Oil, 666, DDT, etc. And 3 grades are
classified except for PSP (only one grade) as:
1st grade----fishery, mariculture, natural reserves, MPAs, waters related to human
health
2nd grade----general industry, coastal tourism
3rd grade----port and exploration activities
3.4 Comparative analysis approach
For marine organism quality, the international, regional and national criteria and
standards are considered and compared. The maximum residue limits (MRLs) for
major pollutants in seafoods are listed in Table 6.
Table 6 MRLs in seafoods
Values of MRL in seafoods
Chemicals
FAO/WHO
(codex alimentarius)
EU(mg/kg)
China (mg/kg)
(mg/kg)
1.0 (mollusc)
Cd( mg/kg)
1.0 (Fish meat)
0.1 (Fish)
0.5 (crustacean)
0.5 (crustacean)
0.1 (Fish)
Hg( mg/kg)
1.0 (Fish)
1.0 (Fish)
1.0 (shellfish and fishes)
0.5 (other seafood)
0.5 (crustacean)
Pb( mg/kg)
0.2(fish)
41.0 (mollusc)
1.0 (meat)
0.4 (fish)
0.5 (other seafood)
1.0 (bivalves)
131I
4.7X10²Bq/kg(fish/shrimp)
137Cs
8X10²Bq/kg(fish/shrimp)
147Pm
2.4X10⁴Bq/kg(fish/shrimp)
210Po
1.5X10Bq/kg(fish/shrimp)
223Ra
2.1X10Bq/kg
fish/shrimp)
226Ra
3.8X10Bq/kg(fish/shrimp)
239Pu
10Bq/kg(fish/shrimp)
3H
6.5X10⁵Bq/kg(fish/shrimp)
89Sr
2.9X10³Bq/kg(fish/shrimp)
90Sr
2.9X10²Bq/kg(fish/shrimp
0.5 (marine fishes, shellfishes,
PCB138
shrimps and algae(edible
parts))
0.5 (marine fishes, shellfishes,
PCB153
shrimps and algae(edible
parts))
0.2 (scallop/prawn/fresh kelp/
PCBs
2 (Fish meat)
2 (Fish meat)
Wakame-Undaria pinnatifida
/nori)
2 (fish meat)
Cu(mg/kg)
50(all seafoods)
Se(mg/kg)
1.0 (fish)
F(mg/kg)
2.0 (freshwater fish)
Cr(mg/kg)
2.0 (fishes and shellfishes)
BHC(mg/kg)
2 (all seafoods)
DDT(mg/kg)
1(all seafoods)
As(mg/kg)
40.5(freshwater fish)
1.0(shellfishes/crustacean/ot
inorg-As(mg/kg)
her seafoods)
0.5 (marine fishes)
4pg
4pg
Dioxins
WHO-PCDD/F-TEQ/
WHO-PCDD/F-TEQ/g
g (fish meat and
(fish meat and
8
seafoods) seafoods)
Azinphos-methyl
Heptachlor
0.2 (fish meat)
Lindane
0.1 (fish meat)
METHOMYL
0.02 (fish meat)
Aldrin
0.3 (fishes)
0.2 (fishes)
Chlordane
0.5 (fish meat)
DDT
5 (fish meat)
Dieldrin
0.2 (fish meat)
Endrin
0.01 (fish meat)
Hexachlorobenzene
0.01
Mirex
0.1 (fishes)
Toxaphene
0.1 (fishes)
0.1 (fish meat)
4. Proposed management options related to proposed EcoQOs
4.1 Further research on the causal-chain analysis and the root causes
With clearly defined regional targets for management, the necessary management
interventions need to be identified based on the Causal Chain Analysis, and on
geographic, social, and political conditions. Management actions should include
harmonisation of legislation, institutional reforms, financial sustainability, human
resource development, and regional co-operation. Technical interventions should also
be considered to address specific problems identified in the TDA.
Perform feasibility studies on the various options of management interventions
Studies will be conducted to test the feasibility of possible management interventions
from the perspective of:
· Technical feasibility;
· Cost-benefit analysis; and
· Political and social acceptance.
4.2 Major management actions proposed based on TDA
4.2.1 Control of pollutants discharge from land-based sources
The management options may be concerned of the total-quantity-control of pollutant
discharge, the ratio of wastewater treatment, the treatment of wastesolids and marine
litter, the control of non-point pollution sources, the recover of wetlands, etc.
4.2.2 Management on ocean and coastal engineering
The management actions may be concerned of the implementation of EIA regulation,
the control of reclamation in critical habitats and valuable areas, the discharge of
pollutants from engineering and installation, the control of pollution from mariculture
activities, etc.
4.2.3 Control of pollution from sea-based sources
The management actions may be concerned of the environment management in
seaport, the control of pollution from ships, the contingency plan for oil spillage, etc.
9
4.2.4 Management on ocean dumping
The emphasis should be put on the dumping site zonation, the monitoring and
evaluation, the reasonable utilization of carrying capacity for dredged materials, the
promotion of new technologies for reuse of waste solids, etc.
4.2.5 Environmental engineering measures
The activities related to environmental engineering are concerned of the mitigation of
pollution in critical areas, the restoration of the important habitats, the recovery of
important functions, especially Dalian Bay and Jiaozhou Bay, ect.
4.2.6 Capacity building
It is emphasized on the marine environmental monitoring capacity for Yellow Sea.
Based on the current monitoring system and capacity, the integrated marine
environmental monitoring system should be built in the manner of
network-distributed, 3-dimensioned base, which is composed of satellite, vessel,
databuoy, land-based stations, underwater stations and other monitoring technics. The
building of information system for Yellow Sea is also needed to provide a platform for
publics and for early warning and prediction/forecasting.
4.2.7 Scientific research
The scientific research on environmental protection in Yellow Sea should be enhanced
in fields of the marine environmental protection tools, the monitoring, assessment and
prediction, the technologies for ecosystem restoration, the ecosystem-based
approaches, the biodiversity conservation and management, etc.
4.2.8 Publicity
The public awareness and participation should be promoted in different manners of
the activities and actions. The new approaches for promoting public awareness should
be developed.
10
References
1. Bulletin of Marine Environmental Quality in China 2001, SOA
2. Bulletin of Marine Environmental Quality in China 2002, SOA
3. Bulletin of Marine Environmental Quality in China 2003, SOA
4. Bulletin of Marine Environmental Quality in China 2004, SOA
5. Bulletin of Marine Environmental Quality in China 2005, SOA
6. Bulletin of Marine Environmental Quality in China 2006, SOA
7. UNDP/GEF YSLME TDA Report, 2006, PMO
8. Meeting Report for 3rd RWG-P for YSLME Project, PMO
9. Ocean future and human health--practical management and policy issues in coastal
marine ecosystem, M.H.Depledge, Plymouth Marine Laboratory, EAS Congress 2006, Haikou
City, Hainan Province, China
11
Annex 1. National Marine Environmental Quality Standards
--Seawater Quality Standard (GB3097-1997)
Code Items
1st class
2nd class
3rd class
4th class
1
Float materials
No oil film and other floating materials on No significant oil film
the sea
and other floating
materials on the sea
2
Color, smell
No abnormal
No detested
3 Suspended
increment10 increment100 increment150
substances
4 coliform(ind/L) 10000
Water for mariculture of shellfish700
5 Fecal
2000, Water for mariculture of
coliform(ind/L) shellfish140
6
pathogen
No pathogen in water for edible shellfish culture
7 Temperature() Less
than1 in summer by Less than4 in summer by
anthropogenic activities at anthropogenic activities
local level, 2 for other
seasons
8 pH
7.88.5 Meanwhile not
6.88.8Meanwhile not changed
changed over 0.2pH in
over 0.5pH in normal fluctuation
normal fluctuation
9 DO(>)
6
5
4
3
10 COD 2 3 4
5
11 BOD5 1 3 4 5
12 Inorg-N 0.20 0.30 0.40
0.50
13 Non-ionic
N 0.020
14 PO4-P 0.015 0.030
0.045
15 Hg 0.00005
0.0002
0.0005
16 Cd 0.001
0.005
0.010
17 Pb 0.001
0.005
0.010
0.050
18 Cr(VI)
0.005 0.010 0.020
0.050
19 tCr 0.05
0.10
0.20
0.50
20 As 0.020
0.030
0.050
21 Cu 0.005
0.010
0.050
22 Zn 0.020
0.050
0.10
0.50
23 Se 0.010
0.020
0.050
12
24 Ni 0.005
0.010
0.020
0.050
25 Cyanide 0.005
0.10
0.20
26 Sulphide 0.02 0.05 0.10
0.25
27 Volatile
phenol 0.005
0.010
0.050
28 Oil 0.05
0.30
0.50
29
Chlordane
0.001 0.002 0.003
0.005
30 DDT 0.00005
0.0001
etc
13
Annex 2. National Marine Environmental Quality Standards
--Sediment Quality Standard
Code Items
1st class
2nd class
3rd class
1
Wastes and other solids
No industrial and domestic No significant
wastes, no macro-plant debris
industrial and
domestic wastes, no
macro-plant debris
2
Color, smell, structure
No abnormal, in natural structure
3 Coliform(ind/g-wetweight) 2001
4 Fecal
coliform
402
(ind/g-wetweight)
5
pathogen
No pathogen in sediment for
shellfish cutlture
6 Hg×10-6 0.20 0.50 1.00
7 Cd×10-6 0.50 1.50 5.00
8 Pb×10-6 60.0
130.0 250.0
9 Zn×10-6 150.0
350.0 600.0
10 Cu×10-6 35.0
100.0 200.0
11 Cr×10-6 80.0
150.0 270.0
12 As×10-6 20.0 65.0 93.0
13 Organic
C×10-2 2.0
3.0
4.0
14 Sulphide×10-6 300.0 500.0
600.0
15 Oil×10-6 500.0
1000.0 1500.0
16
Chlordane×10-6
0.50 1.00 1.50
17 DDT×10-6 0.02 0.05 0.10
18 PCBs×10-6 0.02 0.20
0.60
1the values for items except for coliform, fecal coliform and pathogen are countered in dry
weight.
2coliform for sediment of edible shellfish culture is less than 14 ind/g-wetweight.
3fecal coliform for sediment of edible shellfish culture is less than 3 ind/g-wetweight.
14
Annex3. National Marine Environmental Quality Standards
--Organism Quality Standard (GB18421--2001)
Marine Shellfish Quality Standards (fresh weight, mg/kg)
Code Item
1st class
2nd class
3rd class
1
Sensory requirements
Shellfishes in normal growth and Shellfish survival
activities, without abnormal oil and without
and smell.
significant abnormal
smell.
2 Fecal
coliform(ind//kg) 3000
5000
--
3 PSP
0.8
4 tHg
0.05
0.10
0.30
5 Cd
0.2
2.0
5.0
6 Pb
0.1
2.0
6.0
7 Cr
0.5
2.0
6.0
8 As
1.0
5.0
8.0
9 Cu
10
25
50(100 for oyster)
10 Zn
20
50
100(500
for
oyster)
11 Oil
15
50
80
12
Chlordane
0.02 0.15 0.50
13
DDT 0.01
0.10
0.50
Note:
--Countering in fresh weight without shell;
--Chlordane involves four isomers(-, -, -, -666);
--DDT contains four isomers('-DDE, `-DDT, '-DDD, '-DDT).
15
Pollution Republic Of Korea
Report
On Preliminary Regional Targets
With Respect to the Project's Objectives
Of Pollution
by
YANG Dong Beom
Korean Ocean Research and Development Institute
Preliminary EcoQOs for management actions of the SAP
1st Ad-hoc Working Group meeting (10-12 April 2007)
Pollution
- Dong Beom YANG (Korea)
-----------------------------------------------------
Historical data and trends
The overall trend was that the rapid spread of marine pollution was controlled to a certain extent.
1) Nutrients
Nutrients and organic compounds seemed to be the major components of pollutants in the coastal waters
of Korea and China. The variation of nitrate concentration in coastal waters of Korea over 1982 to 2004
period showed a decreasing pattern with a maximum value of about 60ug/L in recent years. According to
the regional synthesis report the concentrations of inorganic nitrogen in coastal waters of China decreased
year after year.
Relatively high concentrations of inorganic nitrogen were found in some coastal waters.
The variation of phosphate concentration in coastal waters of Korea did not show the clear decreasing
tendency over 1982 to 2004 periods. The maximum concentration of phosphates was over 50ug/L in recent
years.
According to the Chinese monitoring data of the Yellow Sea in the past years, the concentrations of
phosphate in the coastal waters decreased year after year. The maximum concentration of reactive
phosphate in the Yellow Sea was about 0.024mg/L, found in 1995. The minimum concentration of active
phosphate in the Yellow Sea was about 0.003 mg/L, found in 1996 and 2003.
Atmospheric input (dry and wet deposition) of nutrients to the Yellow Sea cannot be quantified with
existing data.
----------------------------------------------
2) Heavy metals
There are not enough data on heavy metals.
The monitoring results of marine sediment in China indicated that the marine sediment quality in the
coastal areas of China was at good condition in 2005, and the potential ecological risk of integrated
sediment pollution was low. The statistical analysis of the historical data of 1997 and 1990 collected in
China showed that the concentration of Hg in the shellfishes increased, the concentrations of Cd in the
shellfishes reduced and the concentrations of Pb and As in the shellfishes reduced significantly in the
Yellow Sea.
According to the Korean national report The average concentration of Cr and Cu in the fish muscle tissues
are relatively higher than those of other metals and the order of average concentration of metals is
Zn>Cr>Cu>Ni>Hg>Pb>Cd. The concentration of heavy metals fish were not contaminated compared to
the other coastal areas and other regions of the world. The heavy metal concentration in fish tissue from the
Yellow Sea is relatively low and below the criteria set by Europe and Korea.
Heavy metals are heterogeneously distributed and there is a need for more data along some coasts.
-------------------------------------------------------------------------------
3) POPs
There is a need for more data along some coasts, and there are not enough data on POPs. It is not clear
what are the origins and pathways of theses pollutants.
In the coastal waters of Korea, more than 1 ppm of PAH was determined in Incheon area followed by Lake
Shihwa. Phenolic compounds are the next highest, with the highest concentrations in Lake Shihwa and
Mokpo. TBTs are prevalent in all provincial waters, but PCBs are determined only in some areas. The total
PCBs concentrations in the sediments collected from the southeastern part of the Yellow Sea in 2000
ranged from 0.17ng/g to 1.37ng/g. Except Endrin, all the other POPs are measurable in Yellow Sea biota.
Along the Korean coast, most of the determined POPs are highest in Incheon province. PAHs
concentrations are rather uniform in all provinces. DDTs, CHLs, HCHs, HCB are present in all provinces.
Dioxins and Furans are detected only in some provinces. Most of the Yellow Sea fish samples had very
low concentrations of total PCBs and chlorinated pesticides.
Persistent organic pollutants (POPs) in the fishes, shellfishes and algae collected from the Chinese coasts
mainly include organochlorine pesticides, PCBs, PAHs and DDT. The statistical analysis of the historical
data of 1997 and 1990 collected in China showed the decrease of PCBs and DDTs concentrations in the
organisms of the Yellow Sea
--------------------------------------------------
4) HAB
According to the regional synthesis report there is an increase in eutrophication in the Yellow Sea. There
appears to be four ""hot spots"" of eutrophication - Bohai Sea, Yalu River, Yangtze River and Han River.
HABs are becoming more frequent and widespread, with causative species shift from diatoms to
dinoflagellates, and negative impacts of food poisoning in humans and fish mortality. High nutrients levels
cause increase in biomass, resulting in HAB and increased fish mortality, which also result in an overall
decrease in biodiversity.
In coastal waters of Korea, the red tides became widespread encompassing entire coast since 1990s. The
bloom has been occurred from May to October with the peak of June to August. . Diatoms were major
phytoplankton species responsible for the blooms until 1980s. Recently dinoflagellates (Prorocentrum
micans and Heterosigma akashiwo in recent coastal waters. The occurrence of HABs in coastal waters of
China has been increased all the time, with a sharp increase after 2000. . It was found that the magnitude,
frequency, and geographic extent of these occurrences have increased significantly over the last several
decades.
-------------------------------------------------------
Various options for EcoQOs for each variable
1) Nutrients
option 1 - tertiary treatment
option 2 - management through TMDL approach
(control by total maximum daily loads)
option 3 - establish monitoring network for atmospheric input of nutrients
(control the emission of N if necessary)
2) Heavy metals
- needs more data
3) POPs
- needs more data
(distribution, input and pathways uncertain)
4) HAB
option 1 - reduce the nutrients level
option 2 - management of coastal bottom sediments to avoid growth-stimulating substances
(dredging if necessary)
option 3 - control ballast water against invasive species
----------------------------------------
UNDP/GEF/YS/AWG.1/3
Annex V
Page 1
Annex V
SAP Reference Conditions and Regional Targets for Management Actions
Comments
s high biomass algal bloom
China will reduce total loading from point
sources 10% every 5 years
Increae public awareness Periodic clean
ups
monitoring/assessment/prediction
monitoring/assessment/prediction
HAB inlcude
Reduce human impact , reduce bycatch
of endangered spp
According to Chinese and Korean
functional zoning plans
Regional target (2020)
Codex / Stockholm Convention /
MARPOL
Control of total loading to meet reference
point
Improve FW seasonal fluxes
Reduced standing stock of litter
Reduced to nationally acceptable levels
25-30% reduction in catch and fishing
effort (2004)
Sustainable/Polyculture/optimization of
the distribution and the cultured spp
Improvement culture techniques.
Provision of better scientific
understanding for Adaptive Management
Provision of better scientific
understanding for Adaptive Management
< 5 events on each coast
Maintain and improve current
populations/distributions and genetic
diversity of endangered and endemic
spp.
Maintain current habitats according to
standards and regulations of 2007
Management target)
Reference Conditions (Ideal
Codex / Stockholm Convention /
MARPOL
Historical reference year of around
1990's in the coastal waters
Silicate concentration (1980's)
(1960's?)
Blue flag standards
MSY / ABC/ EBFM
Optimal growth and survival of culture
organism / Insignificant environmental
impact
Diatom dominated community (1980's)
that will drive a healthy ecosystem
High species diversity in benthos (1992)
Historical reference year of 1990's
(covered by biodiversity)
Current populations/distributions of
endangered and endemic spp.
Maintain current habitat area of tidal flats
(excluding current approved projects)
Problems identified in CCA
Contaminants and their effects (1)
Nitrogen enrichment and eutrophication
Silicon depletion
Marine Litter
Contaminants and their effects (2)
Decline in landings of many
commercially-important species
Unsustainable maricultural practices
Changes in abundance/biomass and
species diversity of plankton
Change in abundance/biomass and
species diversity of benthic community
Increased frequency of HABs
Loss of benthic habitat in coastal areas.
Changes in abundance and diversity of
endemic and endangered spp.
Habitat loss and degradation (1)
Habitat loss and degradation (2)
Habitat loss and degradation (3)
Component
Pollution
Pollution
Pollution
Pollution
Pollution
Fisheries
Fisheries
Ecosystem
Ecosystem
Ecosystem
Ecosystem
Biodiversity
Biodiversity
Biodiversity
Biodiversity
SERVICES
Supporting/regulating
Supporting/regulating
Supporting/regulating
Supporting/regulating
Cultural
Provisioning
Provisioning
Provisioning
Supporting/regulating
Supporting/regulating
Provisioning
Provisioning
Provisioning
Supporting/regulating
Cultural
UNDP/GEF/YS/AWG.1/3
Annex VI
Page 1
Annex VI
Programme for First Yellow Sea Regional Science Conference

GEF
UNDP/GEF PROJECT ENTITLED "REDUCING ENVIRONMENTAL STRESS IN THE
YELLOW SEA LARGE MARINE ECOSYSTEM"
First Yellow Sea Regional Science Conference
Ecosystem Carrying Capacity of the Yellow Sea:
Scientific Approaches for Marine Environment Management
Hangzhou, China, 14th-16th August 2007
PROVISIONAL PROGRAMME
Call for Abstracts
The Conference Organising Committee is now looking for speakers to present
papers during the First Yellow Sea Regional Science Conference. For more details
on the Conference, please see the website at: http://www.yslme.org/. If interested,
please submit a one-page abstract in MS Word format (maximum 300 words),
describing topics and contents of the paper with contact information (e.g., Author's
name, title and organisation). The abstract submission format is available at:
http://www.yslme.org/.
Approximately 10 speakers will be invited to present their papers at the
Conference, in addition to other existing 19 speakers who are already invited
already. Contributions from young scientists are welcomed. Funds are available,
though they are limited, to cover the costs of travel and/or accommodation for the
invited speakers. For those participants not selected give a presentation, a poster
session may be organised if required..
The abstract should be submitted to the UNDP/GEF Yellow Sea Project by email:
info@yslme.org. Please title the email "Regional Science Conference: Abstracts for
Contributing Paper Presentation." The deadline for the abstract submission is 15th
June, 2007.
DAY 1 14TH AUGUST 2007
09:00 09:30
Opening of the Regional Science Conference
Welcome address of the Government of China
Opening remark of the Government of Republic of Korea
Welcome Speech of Local Government
YSLME Project Manager's Address
Group
Photo
09:30 10:50
Keynote Speeches
9:30 10:00
Scientific Implication of Carrying Capacity of Ecosystem
Shinjae Yoo, ROK
in the Management
10:00 10:30
Physical Environment Supporting Carrying Capacity of
Fangli Qiao, PRC
Ecosystem in the Yellow Sea
10:30 10:50
Lessons learned from Benguela LME
TBD
10:50 18:00
Session 1: Yellow Sea Ecosystem's Provisioning
Services
10:50 11:15
Variations of Commercially Important Fishery Resources
Xianshi Jin, PRC
in the Yellow Sea
11:15 11:40
Status and management issues of fisheries in the Yellow
Jang-Uk Lee, ROK
Sea
11:40 12:05
Disease control and prevention in mariculture
Soogil Park, ROK
12:05 12:30
Case Study of Sustainable Mariculture in Sanggou Bay
Jianguang Fang,
ROK
12:30 14:00
Lunch
14:00 14:25
Contributed paper (20 mins.)
14:25 14:50
Contributed paper (20 mins.)
14:50 15:15
Contributed paper (20 mins.)
15:15 15:35
Coffee Break
15:35 16:00
Contributed paper (20 mins.)
16:00 16:25
Contributed paper (20 mins.)
16:25 16:50
Contributed paper (20 mins.)
16:50 18:00
Session Discussion
DAY 2 15TH AUGUST 2007
09:00 16:00
Session 2: Supporting & Regulating Services of
Ecosystem in the Yellow Sea
09:00 09:25
Variation of community structure at lower trophic levels in Mingyuan Zhu, PRC
the Yellow Sea
09:25 09:50
Jellyfish Bloom in the Northwest Pacific: Current Status
Shin-ichi Uye, JPN
and Environmental Impacts
09:50 10:15
Regional Status of Nutrient Inputs and Distribution in the
Quan Wen, PRC
Yellow Sea
10:15 10:35
Coffee Break
10:35 11:00
Implications of eutrophication for the Yellow Sea
Hak-kyun Kim, ROK
11:00 11:25
Trends of Productivity in the Yellow Sea and Its
Daeseok Kang, ROK
Implication to Carrying Capacity of Ecosystem
11:25 11:50
Contributed paper (20 mins.)
11:50 12:15
Contributed paper (20 mins.)
12:30 14:00
Lunch
14:00 14:25
Contributed paper (20 mins.)
14:25 14:50
Contributed paper (20 mins.)
14:50 15:40
Session Discussion
2
15:40 16:00
Coffee Break
16:00 18:00
Session 3: Cultural Service of Ecosystem in the
Yellow Sea
16:00 16:25
Critical Coastal habitats in the Yellow Sea and Its
Sadayosi Tobai, JPN
Contributions to the Ecosystem
16:25 16:50
Ecosystem and Education: Educational opportunities of
TBD
coastal habitats
16:50 17:15
Integration of eco-tourism and nature conservancy
Sung-Gui Kim, ROK
17:15 18:00
Session Discussion
DAY 3 16TH AUGUST 2007
09:00 11:00
Session 4: Good Management
09:00 09:25
Governance analysis for the LMEs
TBD
09:25 09:50
Regional Governance of the Yellow Sea: Analysis and
Suh-Yong Chung,
Recommendations
ROK
09:50 10:15
Cost and Benefit Analysis of Management Actions
Jingmei Li, PRC
(mariculture as an example)
10:15 10:35
Coffee Break
10:35 11:00
Economic analysis of coastal development: How to
Sukjae Kwon, ROK
incorporate negative externality into management
decisions
11:00 11:30
Session Discussion
11:30 12:30
Session 5: Summary
12:30 14:00
Lunch
14:00 18:00
Session 6: Field Trip
14:00 18:00
Field Trip
3

GEF
UNDP/GEF PROJECT ENTITLED "REDUCING ENVIRONMENTAL STRESS IN THE
YELLOW SEA LARGE MARINE ECOSYSTEM"
UNDP/GEF/YS/AWG.2/3
Date: 20 August 2007
English only
Second Meeting of the Strategic Action Programme Ad-hoc Working Group
For the UNDP/GEF Yellow Sea Project
Hangzhou, China, 18-20 August 2007
Meeting Report
TABLE OF CONTENTS
1
OPENING OF THE MEETING ........................................................................................ 1
2
REVIEW OF OUTCOMES FROM THE 1ST AD-HOC WORKING GROUP MEETING
ON THE REGIONAL TARGETS ..................................................................................... 1
3
EXPECTED OUTPUTS FROM THE 2ND AD-HOC WORKING GROUP MEETING ..... 1
4
INTRODUCTION OF DOCUMENT, "GUIDELINES FOR PREPARING MANAGEMENT
ACTIONS FOR SAP" ...................................................................................................... 2
5
PRESENTATION BY REGIONAL EXPERTS ON PRELIMINARY MANAGEMENT
ACTIONS WITH RESPECT TO THE PROJECT'S OBJECTIVES (BIODIVERSITY,
ECOSYSTEM, FISHERIES, POLLUTION, AND SOCIO-ECONOMY) ........................... 2
6
BRAINSTORMING SESSION: IDENTIFICATION OF MANAGEMENT ACTIONS......... 3
7
CONSIDERATION ON DEMONSTRATION PROJECTS (E.G., IDENTIFICATION OF
RELEVANT MANAGEMENT ACTIONS TO BE DEMONSTRATED, DEMONSTRATION
SITES, AND IMPLEMENTATION MECHANISM) ........................................................... 5
8
INTRODUCTION OF DOCUMENT "DRAFT GUIDELINE FOR FEASIBILITY STUDY,"
AND DISCUSSION ON FEASIBILITY STUDIES (E.G., REQUIREMENTS FOR
FEASIBILITY STUDIES: NECESSARY EXPERTISE, PERSONNEL, AND
WORKPLAN) .................................................................................................................. 6
9
CONSIDERATION AND AGREEMENT ON THE ESTABLISHMENT AND WORKPLAN
OF A DRAFTING GROUP FOR PREPARING SAP ....................................................... 6
10 PREPARATION OF THE NATIONAL YELLOW SEA ACTION PLANS.......................... 7
11 OTHER BUSINESS ........................................................................................................ 7
12 ADOPTION OF THE MEETING REPORT ...................................................................... 7
13 CLOSURE OF THE MEETING ....................................................................................... 8
ANNEXES
Annex I
List of Participants
Annex II
List of Documents
Annex III
Agenda
Annex IV
Agreed Management Actions for SAP Regional Targets with Respect to the
Project's Objectives
Annex V
Agreed Guidelines for Demonstration Project and Site Selection
Annex VI
Agreed Guidelines for Feasibility Studies of SAP
UNDP/GEF/YS/AWG.1/3
Page 1
1
OPENING OF THE MEETING
1.1
Welcome addresses
1.1.1 On behalf of the UNDP/GEF Yellow Sea project, Mr. Yihang JIANG, Project Manager
and Chairperson of the Ad-hoc Working Group, opened the meeting and welcomed
the participants to the second meeting of the Strategic Action Programme (SAP) Ad-
hoc Working Group. He briefly introduced the background of this second meeting,
explaining the results of the first SAP Ad-hoc meeting which was organised in
Hongchun, Republic of Korea, 10-12 April 2007. Mr. Jiang then stated that the
second meeting focuses mainly on identifying the environmental management
actions to meet regional targets that were agreed during the first Ad-hoc meeting.
1.1.2 On behalf of the delegation from China, Mr. Fengkui LIANG welcomed the
participants to Hangzhou. Mr. Liang pointed out the importance of this meeting. He
emphasised that the fruitful discussion during the meeting would be crucial for a
successful preparation of the SAP. Mr. Liang hoped that all the participants would try
to do their best to produce significant outputs in this meeting.
1.1.3 On behalf of the delegation from Republic of Korea (ROK), Ms. Young Shil KANG
joined Mr. Liang to reemphasise the importance of the meeting. Ms. Kang mentioned
that the tasks for this meeting are not easy; therefore, she hoped, the participating
members should make their efforts to contribute to the meeting.
1.2
Introduction of members
1.2.1 Members and other participants were invited to introduce themselves, and they gave
a brief introduction on their background and roles in the Project. The list of
participants is attached to this report as Annex I.
1.2.2 The list of documents and the meeting agenda are attached to this report as Annex II
and Annex III, respectively.
2
REVIEW OF OUTCOMES FROM THE 1ST AD-HOC WORKING GROUP MEETING
ON THE REGIONAL TARGETS
2.1
The Chairperson introduced the background of the meeting, explaining the "SAP
Reference Conditions and Regional Targets for Management Actions by 2020"
(Document UNDP/GEF/YS/AWG.1/3).
2.2 There was an opinion from the participants that the new findings and
recommendations that were presented in the Regional Science Conference (RSC;
Hangzhou, China, 14-16 August 2007) should be incorporated into the consideration
of management actions to be discussed in this Ad-hoc Working Group meeting.
2.3
The Meeting agreed on this suggestion and decided to include the results of
the RSC as much as possible in the management actions.
3
EXPECTED OUTPUTS FROM THE 2ND AD-HOC WORKING GROUP MEETING
3.1
The Chairperson explained expected outputs from this meeting. Mr. Jiang stated that
the meeting should discuss and agree on the following five major issues:
UNDP/GEF/YS/AWG.2/3
Page 2
· Management
actions;
· Demonstration activities and sites;
· Feasibility
studies;
· Regional SAP drafting group; and
· National Strategic Action Plans.
3.2
Mr. Jiang mentioned that the meeting is expected to prepare the management
actions to meet agreed regional targets, the guidelines to choose appropriate
demonstration projects and their sites, and the guidelines to conduct feasibility
studies of the proposed management actions. Mr. Jiang also mentioned that the
meeting is expected to form a drafting group of the regional SAP and give guidance
on how to prepare national SAPs in line with the regional SAP.
3.3
The participants took note of the expected outputs, explained by the Chairperson, to
be produced in this meeting.
4
INTRODUCTION OF DOCUMENT, "GUIDELINES FOR PREPARING
MANAGEMENT ACTIONS FOR SAP"
4.1 The Chairperson introduced this agenda item, referring to Document
UNDP/GEF/YS/AWG.2/2. Mr. Jiang stated that the participants are expected to
propose all possible necessary management actions to meet the regional targets.
He explained the four components that form management actions: (i) ideal
management actions, (ii) analysis of planned and on-going management actions, (iii)
feasible management actions by 2020, and (iv) potential demonstration activities.
Each component consists of three subcomponents: technical, institutional, and
legislative actions.
4.2
The participants noted all the requirements introduced by the Chairperson to prepare
the management actions.
5
PRESENTATION BY REGIONAL EXPERTS ON PRELIMINARY MANAGEMENT
ACTIONS WITH RESPECT TO THE PROJECT'S OBJECTIVES (BIODIVERSITY,
ECOSYSTEM, FISHERIES, POLLUTION, AND SOCIO-ECONOMY)
5.1
The Chairperson invited Mr. Jang-Uk LEE and Mr. Sadayosi TOBAI to present their
preliminary management actions.
5.2
Mr. Lee explained his ideas on Fisheries management. For example, Mr. Lee
proposed to increase "biomass with a reduction of catch by 30-40% or reducing
fishing effort by more than 25% taking into account the 2004 catch and fishing effort"
as a technical action to the regional target of "25-30% reduction in catch and fishing
effort (2004)." Mr. Lee thought there is a need to prepare, as an institutional action, a
plan on how to co-ordinate relevant organisations to implement the technical action.
He thought that a legislative action should be taken to legalise the management
action.
5.3
Mr. Tobai addressed a wide range of issues, including supporting/regulation and
cultural services. Mr. Tobai proposed, for example, the following as feasible
management actions to address the regional target of "loss of benthic habitat in
coastal areas:"
UNDP/GEF/YS/AWG.2/3
Page 3
· To develop a trans-boundary plan for representative network of Marine
Protected Areas (MPAs);
· To designate new MPAs to fill gaps in representation;
· To improve capacity of MPA management offices through regional
information exchange and cooperation;
· To develop a coordination mechanism across national government agencies
and at a transboundary level;
· To develop stakeholder participation mechanisms in MPA management
nationally; and
· To showcase well-managed MPAs by designating demonstration MPA sites.
5.4
Having thanked the efforts made by Mr. Lee and Mr. Tobai, the Chairperson
mentioned that their ideas serve as good examples to check the logic of the
framework for preparing management actions. Mr. Jiang then invited the participants
to consider whether this framework is rational, functional, and appropriate for
discussing management action in this meeting.
5.5
Having agreed the framework in general, the participants expressed difficulty to
separate actions into the three subcomponents because some actions might be
categorized into several subcomponents. Given that concern, the meeting
discussed and agreed to add one column, "General Action," to overarch and
guide relevant technical, institutional, and legislative actions. Each proposed
technical, institutional, or legislative action should be relevant to a specific general
action.
5.6
The meeting also agreed to keep using three subcomponents--technical,
institutional, and legislative--because those categories would help the
participants examine the actions from various angles.
5.7
With a clear understanding of the framework shared among the participants, the
Chairperson suggested to form four sessional working groups according to
Biodiversity, Ecosystem, Fisheries, and Pollution. He also suggested forming
another group with social scientists, which prepares a procedure of feasibility studies,
i.e., the cost-benefit analysis and the political and social acceptability analysis,
according to the draft guidelines prepared by PMO.
5.8
The meeting accepted the Chairperson's suggestion and agreed to form
sessional working groups to prepare management actions. The groups were
requested to present the result of the discussion to the plenary session.
6
BRAINSTORMING SESSION: IDENTIFICATION OF MANAGEMENT ACTIONS
6.1
The Chairperson invited the representatives of the small groups to provide the results
of their discussion. Mr. Xianshi JIN, Ms. Young Shil KANG, Mr. Sinjae YOO, and Mr.
Quan WEN presented their ideas on management actions for Fisheries, Biodiversity,
Ecosystem, and Pollution, respectively. After the presentations, the participants
provide their comments on each component. Major comments are summarised
below.
UNDP/GEF/YS/AWG.2/3
Page 4
Fisheries
6.2
About the Fisheries component, Mr. Dong-Oh CHO mentioned that incentive
programme, in addition to command-and-control programme, should be included as
management actions.
6.3
The Chairperson asked Mr. Cho to provide the Fisheries group with specific incentive
activities.
6.4
Having discussed about incentive-based actions, the Fisheries group, Mr. Cho, and
Mr. Sang-Go LEE who is familiar with those economic tools agreed not to include the
incentive programme as the management actions because the programme is not
feasible.
Biodiversity
6.5
Regarding the Biodiversity component's presentation made by Ms. Kang, Mr. Tobai
added that the following three points were considered to develop management
actions: to conserve species population, to protect habitats, and to increase the
effectiveness of existing MPA management.
6.6
Having noticed that China's on-going conservation activities were not included in the
Biodiversity's analysis of the planned and on-going management actions, Mr. Jin
suggested considering the information provided in the RSC by Mr. Yamin Wang.
6.7
Mr. Mark WALTON mentioned that management actions addressing invasive species
should be considered in the Biodiversity component.
6.8
Mr. Jin stated that the concept of MPA is not clearly defined; in other words, MPA
might be defined differently depending on country. It is necessary to clarify what
MPA means in developing management actions.
Ecosystem
6.9
A comment was made to revise the wording of the regional target of the Ecosystem
component to emphasise the management aspect of actions rather than the
scientific-work aspect. The comment was accepted, and the target was reworded
accordingly, i.e., "provide relevant information to understand and predict ecosystem
status."
Pollution
6.10 Following Mr. Wen's presentation on the Pollution component, Mr. Dong Beom
YANG added that nutrient inputs from groundwater account for approximately 20-
30% of the total nutrient inputs in the Yellow Sea; therefore, he expressed his
willingness to include management actions that address the nutrient inputs attributing
to groundwater.
6.11 Mr. Sang-Go LEE suggested market-based input reduction programme, such as eco-
labelling programme, as a management actions to reduce pollution.
6.12 Mr. Yoo mentioned Si fertilization would be too costly as Si is a macro nutrient and
dredging to remove polluted sediments may cause other ecosystem problems;
therefore, they are not appropriate as management actions.
UNDP/GEF/YS/AWG.2/3
Page 5
6.13 Accepting Mr. Yoo's opinion, the Pollution group decided to delete the both items
from management actions. Dr. Wen also mentioned that the pollution component
would like to work closely with the Ecosystem component to co-ordinate activities
and seek synergy between both components' management actions.
6.14 Mr. Suh-Yong Chung offered to review, with Ms. Ming YU, the institutional and
legislative actions of each component from the perspectives of legislation and
political science.
6.15 The meeting appreciated Mr. Chung's offer and asked the legal experts to review
relevant parts of the management actions prepared by the four natural science
components.
6.16 The final version of the agreed management actions is attached as Annex IV to
this report.
7
CONSIDERATION ON DEMONSTRATION PROJECTS (E.G., IDENTIFICATION
OF RELEVANT MANAGEMENT ACTIONS TO BE DEMONSTRATED,
DEMONSTRATION SITES, AND IMPLEMENTATION MECHANISM)
7.1
The Chairperson invited the participants to discuss how to determine demonstration
projects and sites. He emphasised that the meeting should focus on the criteria and
procedure to select appropriate demonstration activities to show the usefulness and
effectiveness of management actions to be included in the SAP.
7.2
The participants proposed possible criteria to choose demonstration projects,
mentioning that sites should be decided after the projects are specified.
7.3
The Chairperson suggested organising a small group to discuss the selection criteria
on demonstration activities and sites. The meeting agreed on the Chairperson's
suggestion. The small group was required to provide discussion results to the
plenary session.
7.4
On behalf of the group, Mr. Walton reported the results of the expert group. He
introduced eight criteria in order of importance for selecting demonstration projects
and four criteria for selecting demonstration sites. Mr. Walton also explained the
timing of implementing demonstration projects as well as the procedure of the project
and site selections.
7.5
After comments and questions were raised and duly answered, the meeting agreed
on, as guidelines, the criteria and procedure of project and site selection and
the timing of implementing selected demonstration projects. The final version
of the guidelines for determining demonstration projects and sites is attached
as Annex V to this report. All the comments raised from the participants during the
meeting were reflected in this document.
7.6
The meeting also agreed that the PMO prepare a proposal format. The
advertisement for proposal submission will be made on the Project website with the
format.
7.7
As invited by the Chairperson, Mr. Jianguang FANG presented his proposal on the
demonstration project for sustainable mariculture, as an example. Mr. Fang
proposed to conduct a project in Sanggou Bay, China to demonstrate how the
UNDP/GEF/YS/AWG.2/3
Page 6
polyculture and the Integrated Multi Trophic Aquaculture (IMTA) would contribute to
producing ecological as well as economic benefits.
7.8
The meeting expressed its gratitude to Mr. Fang for his presentation, and felt that his
proposal should be duly considered by the next RWG Fisheries Meeting to identify
appropriate projects and sites to demonstrate sustainable mariculture activities.
8
INTRODUCTION OF DOCUMENT "DRAFT GUIDELINE FOR FEASIBILITY
STUDY," AND DISCUSSION ON FEASIBILITY STUDIES (E.G., REQUIREMENTS
FOR FEASIBILITY STUDIES: NECESSARY EXPERTISE, PERSONNEL, AND
WORKPLAN)
8.1
The Chairperson explained the Document UNDP/GEF/YS/AWG.2/4 to introduce the
guidelines for feasibility studies. He mentioned that three kinds of feasibility
studies--technical, economical, and political and social acceptance analyses--
should be conducted to show the applicability, effectiveness, efficiency, and
appropriateness of the proposed management actions.
8.2
Mr. Chung presented the results of the sessional group organised to prepare
procedures for the cost-benefit analysis (CBA) and the political and social
acceptance analysis. He informed the meeting that the sessional group agreed on
the target, scale, and methods of the CBA study. Mr. Chung also described that the
group thought it was important for economists to work closely with natural scientists
to incorporate relevant scientific knowledge. About the political and social
acceptance analysis, Mr. Chung explained a methodology to be employed, which
includes the public hearings and the summary and analysis of the collected opinions
from the hearings. Mr. Chung mentioned that the group agreed to propose that the
two feasibility studies should be completed before the submission of the draft SAP to
the governments for their considerations.
8.3
Mr. Jiang commented that the CBA is important not only for securing the
endorsement on the SAP from the governments, but also for informing the public of
the effectiveness and efficiency of the management actions. Mr. Jiang thought that it
might be necessary to conduct the CBA in two stages. First, the CBA focuses on
selected targets in a relatively small scale; second, the CBA analyses other targets,
in a more complete manner, that would be implemented in the implementation of
SAP.
8.4
Having thanked the work of Mr. Chung and his group, the meeting agreed with the
proposed guidelines for the feasibility studies. The final version of the
guidelines, with all comments from the participants incorporated, is attached
to this report as Annex VI.
9
CONSIDERATION AND AGREEMENT ON THE ESTABLISHMENT AND
WORKPLAN OF A DRAFTING GROUP FOR PREPARING SAP
9.1
Having referred to Document UNDP/GEF/YS/AWG.2/7, the Chairperson explained
the idea of forming a drafting group to draft the regional SAP. The Chairperson then
invited the participants to provide their thoughts on the tasks of the drafting group,
the necessary expertise, and the number of group members.
9.2
After some clarifications on the Chairperson's presentation were made, the meeting
discussed and agreed that the drafting group should consist of five members
UNDP/GEF/YS/AWG.2/3
Page 7
with three natural scientists, one social scientist, and the Project Manager.
The meeting agreed to invite the following experts to the drafting group: Mr.
Chung, Mr. Jin, Mr. Wen, and Mr. Yoo. Those nominated four experts expressed
their willingness to join the drafting group, and will try their best to contribute to the
successful preparation of SAP.
9.3
The meeting agreed the tentative dates for the regional SAP Drafting Group
meetings are December 2007, February 2008, and May 2008. The special
Project Steering Committee (PSC) meeting will be organised in April 2008 to
review the draft regional SAP. The third meeting of the regional SAP Drafting
Group should prepare the final SAP, incorporating all the comments from the PSC.
The locations of the meetings will be agreed by the drafting group.
10
PREPARATION OF THE NATIONAL YELLOW SEA ACTION PLANS
10.1 Mr. Isao ENDO explained the preparation of National Strategic Action Plans
(NSAPs), describing the objectives of developing the NSAPs, the issues to be
addressed in NSAPs, and the formulation of NSAP drafting groups. Mr. Endo also
explained that drafting of the NSAP should be co-ordinated by NPCs of the relevant
efforts. He mentioned that ideally, the final version of NSAPs should be prepared by
May 2008 so that both the regional and national SAPs can be submitted at the same
time to the governments for their review.
10.2 The participants presented opinions about various issues, including the deadline for
NSAPs preparation and the structure of the report. After exchanging views and
comments, the meeting agreed to prepare the final draft of the NSAPs by June
2008 when the Project aims at securing the endorsement of the regional SAP by the
governments.
10.3 The meeting also discussed the necessity of the guidelines for NSAP preparation
and agreed that the PMO should prepare the guidelines by the end of year
2007, consulting with the NPCs and the members of the SAP Ad-hoc Working Group.
11 OTHER
BUSINESS
11.1 The Chairperson invited the members to raise any other issues that needed to be
considered at this meeting. There was no other issue raised by the participants of
the meeting.
12
ADOPTION OF THE MEETING REPORT
12.1 The Chairperson mentioned that in accordance with precedent, a draft report of this
meeting will be prepared by the Secretariat after the meeting and circulated to all the
participants for their review. The final version of the report will then be prepared by
the Secretariat with all the comments from the participants incorporated.
12.2 The meeting agreed with the Chairperson's suggestion and decided that the
participants should review the draft report carefully and provide their
comments to the Secretariat.
12.3 All the comments from the participants are incorporated in this meeting report
already.
UNDP/GEF/YS/AWG.2/3
Page 8
13
CLOSURE OF THE MEETING
13.1 The Chairperson thanked all the participants for their hard work to produce a number
of significant outputs, including the management actions for the SAP regional targets,
the guidelines for demonstration projects and sites selection, the guidelines for
feasibility studies, and the formulation of the regional SAP drafting group.
13.2 Mr. Liang stated that this meeting was conduced successfully and efficiently. He
believed that the participants strengthened the co-operative spirit and the friendship
between the two participating countries. Mr. Liang hoped to see the delegation from
ROK and other relevant organisations again to facilitate the SAP development and
implementation.
13.3 Ms. Kang thanked the participants, especially the delegation from China and the
Project Manager, for their dedication and contribution to the successful
implementation of this meeting. As a result, Ms. Kang thought that the meeting
produced more results than expected. She believed that those good results would
form a solid foundation for the preparation and endorsement of not only the regional
SAP but also the NYSAPs.
13.4 The meeting closed at 10:10 hours on 20th August 2007.
UNDP/GEF/YS/AWG.2/3
Annex I
Page 1
Annex I
List of Participants
Surname in alphabetical order
PARTICIPANTS OF THE MEETING
Mr. Dong-Oh CHO
Mr. Suh-Yong CHUNG
Research Fellow
Professor
Coastal & Ocean Policy Research Division
/Member of International Committee
Korea Maritime Institute (KMI)
College of Law
1027-4, Bangbae 3-dong, Seocho-gu
Myongji University
Seoul, 137-851, Republic of Korea
50-3 Namgajwadong, Seodaemongu,
Tel: 82-2-2105-2762
Seoul, 120-728
Fax: 82-2-2105-2779
Tel: 82-2-300-0818
Email: oceancho@kmi.re.kr
Fax: 82-2-300-0804
Email: mahlerchung@yahoo.com
Mr. Jianguang FANG
Mr. In Kwon JANG
Director, Mariculture Ecology and Carrying
Director
Capacity Division
West Sea Mariculture Research Center
Yellow Sea Fisheries Research Institute
National Fisheries Research &
106 Nanjing Road
Development Institute
Qingdao 266071
Sinjindo-ri 75, Geunheung-myeon, Taean-
Tel: 86-532-8582-2957
gun, Chungnam 357-945, Republic of Korea
Fax: 86-532-8581-1514
Tel: 82-41-675-3773
Email: fangjg@ysfri.ac.cn
Fax: 82-41-675-7077
Email: jangik@nfrdi.re.kr
Mr. Xianshi JIN
Ms. Young Shil KANG
Fishery Biologist
Senior Scientist
Director of Fishable Resources & Ecosystem
Marine Ecosystem Team
Management Division
NFRDI
Yellow Sea Fisheries Research Institute
408-1 Sirang-ri, Gijang-eup, Gijang-kun
106 Nanjing Road
Busan 619-705
Qingdao, Shandong, 266071
Republic of Korea
China
Tel: 82-51-720-2520
Tel: 86-532-584-9430/583-6344
Fax: 82-51-720-2266
Fax: 86-532-581-1514
Email: yskang@nfrdi.re.kr
Email: jin@ysfri.ac.cn
Mr. Jang-Uk LEE
Mr. Sang-Go LEE
Professor, Pukyong National University
Faculty of Marine Business and Economics
#599-1 Daeyeon 3-Dong, Namgu,
College of Fisheries Sciences
Busan, 608-737
Pukyung National University
Republic of Korea
599-1 Daeyeon 3-dong, Nam-gu
Tel. 82-51-343-3898
Busan 608-737
Fax: 82-51-622-3306
Republic of Korea
E-mail: julee0922@korea.com
Tel: 86-51-620-6636
Fax: 82-51-621-8168
Email: sglee@pknu.ac.kr
UNDP/GEF/YS/AWG.2/3
Annex I
Page 2
Ms. Jingmei LI
Mr. Fengkui LIANG
College of Economics
Director
Ocean University of China
Department of International Co-operation
23 Hong Kong East Road
State Oceanic Administration
Qingdao, Shandong 266077
1 Fuxingmenwai Avenue
Tel: 86-532-8590-1559(O)
Beijing 100860 China
86-532-8581-2346 (H)
Tel: 86-10-6801-9791
Mobile: 86-138-6395-0669
Fax: 86-10-6804-8051
Fax: 86-532-8590-1560
Email: fkliang@soa.gov.cn
Email: jingmeili66@yahoo.com
Mr. Hongbin LIU
Mr. Sadayosi TOBAI
Ocean University of China
Yellow Sea Ecoregion Planning Programme
5 Yushan Road, Qingdao, Shandong 266003 Ecoregion Coordinator
Tel: 86-532-8203-2533
WWF Japan
Fax: 86-532-8203-2833
Nihonseimei Akabanebashi Bldg., 6Fl.
Email: hliu@qingdaonews.com
3-1-14 Shiba Minto-ku
Tokyo, 105-0014
Japan
Tel: 81-3-3769-1783
Fax: 81-3-3769-1717
Email: tobai@wwf.or.jp
Mr. Dong Beom YANG
Mr. Sinjae YOO
Principal Research Scientist
Senior Research Scientist
Korea Ocean Research and Development
Marine Living Resources Research Division
Institute
Korea Ocean Research and Development
1270 Sa-dong Sangnok-gu Ansan-si
Institute
Gyeonggi-do 426-744
1270 Sa-dong Sangnok-gu Ansan-si
Republic of Korea
Gyeonggi-do 426-744
Tel: 82-31-400-6157
Republic of Korea
Fax: 82-31-408-4493
Tel: 82-31-400-6221
Email: sjyoo@kordi.re.kr
Fax: 82-31-408-5934
Email: sjyoo@kordi.re.kr
Ms. Ming YU
Mr. Zongling WANG
Law School of Ocean University of China
First Institute of Oceanography
No. 23 Hong Kong Dong Road,
6 Xianxialing Road Hi-Tech Industrial Park
Qingdao, Shandong Province, 266071, China Qingdao, Shandong 266001
Tel. 86-532-8598-1335
China
Fax: 86-532-8598-1335
Tel: 86-532-8896-7447
Mobile: 86- 13964259972
Fax: 86-532-8896-7447
Email: yumingnancy@hotmail.com
Emailwangzl@fio.org.cn
Mr. Quan WEN
Mr. Xuelei ZHANG
Chief Scientist
First Institute of Oceanography
SOA Key Lab of Coastal Ecosystem and
6 Xianxialing Road Hi-Tech Industrial Park
Environment Research
Qingdao, Shandong 266001
National Marine Environmental Monitoring
China
Center
Tel: 86-532-8896-7476
42 Linghe Street
Fax: 86-532-8896-7548
Dalian, Liaoning 116023
Email: zhangxl@fio.org.cn
China
UNDP/GEF/YS/AWG.2/3
Annex I
Page 3
Tel: 86-411-8478-2522
Fax: 86-411-8478-2522
Email: qwen@nmemc.gov.cn
Mr. Mingyuan ZHU
Professor
First Institute of Oceanography, SOA
6 Xianxialing Road Hi-Tech Industrial Park
Qingdao, Shandong 266001
China
Tel: 86-532-8896-7548
Fax: 86-532-8896-7447
Mobile: 86-136-0898-3422
Email: myzhu@public.qd.sd.cn
PROJECT MANAGEMENT OFFICE (PMO)
Mr. Yihang JIANG
Mr. Isao ENDO
Project Manager
Environmental Economics Officer
UNDP/GEF Yellow Sea Project
UNDP/GEF Yellow Sea Project
Korea Ocean Research and Development
Korea Ocean Research and Development
Institute
Institute
1270 Sa-dong Sangnok-gu Ansan-si
1270 Sa-dong Sangnok-gu Ansan-si
Gyeonggi-do 426-744
Gyeonggi-do 426-744
Republic of Korea
Republic of Korea
Tel: 82-31-400-7825
Tel: 82-31-400-7793
Fax: 82-31-400-7826
Fax: 82-31-400-7826
email: yihang@yslme.org
Email: isao@yslme.org
Mr. Mark WALTON
Ms. Euidea YUN
Environmental Specialist
IT Specialist
UNDP/GEF Yellow Sea Project
UNDP/GEF Yellow Sea Project
Korea Ocean Research and Development
Korea Ocean Research and Development
Institute
Institute
1270 Sa-dong Sangnok-gu Ansan-si
1270 Sa-dong, Sangnok
Gyeonggi-do 426-744
Ansan City, Gyeonggi Province 426-744
Republic of Korea
Republic of Korea
Tel: 82-31-400-7832
Tel: 82-31-400-7825
Fax: 82-31-400-7826
Fax: 82-31-400-7826
Email: mark@yslme.org
Email: euidea@yslme.org
OBSERVER
Mr. Hyung-Tack HUH
Mr. Songlin WANG
Sr. Scientist Emeritus, KORDI
Marine Programme Officer
Fellow, Korean Academy Of Science &
WWF China
Technology
Room 1609, Wen Hua Gong
Chairman, IOC/WESTPAC
Beijing Working People's Culture Palace
Korea Ocean Research and Development
Beijing, 100006
Institute
China
1270 Sa-dong Sangnok-gu Ansan-si
Tel: 86-10 6522 7100 Ext. 3809; 86-139-
Gyeonggi-do 426-744
1067-0753
Republic of Korea
Fax: 86-10-6522-7300
Tel: 82-31-400-6201
E-mail: slwang@wwfchina.org
UNDP/GEF/YS/AWG.2/3
Annex I
Page 4
Fax: 82-31-408-5934
Email: hthuh@kordi.re.kr
Ms. Wei ZHENG
Ph.D candidate, Environmental Economics
First Institute of Oceanography, SOA
6 Xianxialing Road, Hi-Tech Industrial Park
Qingdao 266061
China
Tel: 86-10-6801-9791
Fax: 86-138-6394-8740
Email: susan0537@163.com
CHINA OCEAN NEWS (LOCAL CONFERENCE SECRETARIAT)
Mr. Guangsheng GAI
Ms. Wenhui GE
President
China Ocean News
China Ocean News
1 Fuxingmenwai Avenue
No. 1 Fuxingmenwai
Beijing, 100860 China
Beijing, China 100860
Tel: 86-10-6804-7741
Tel: 86-10-6804-7740
Fax: 86-10-6803-3233
Fax: 86-10-6803-3233
Email: gewenhui@163.com
Email: gsgai@263.net
Ms. Chenmeng ZHAI
China Ocean News
1 Fuxingmenwai Avenue
Beijing, 100860
China
Tel: 86-10-6804-7741
Fax: 86-10-6803-3233
Email: chinaoceannews@hotmail.com
UNDP/GEF/YS/AWG.2/3
Annex II
Page 1
Annex II
List of Documents
Working Documents
UNDP/GEF/YS/AWG.2/1
Provisional Agenda
UNDP/GEF/YS/AWG.2/2
Guidelines for Preparing Management Actions for SAP
UNDP/GEF/YS/AWG.2/3
Report of the Meeting
UNDP/GEF/YS/AWG.2/4
Draft Guideline for Feasibility Study
UNDP/GEF/YS/AWG.2/5
Preliminary Management Actions with respect to the
Project's objectives
UNDP/GEF/YS/AWG.2/6 Guidelines
for
Identifying Demonstration Projects
UNDP/GEF/YS/AWG.2/7
Proposal on establishment and workplan of a Draft
Group for Preparing SAP
Information Documents
UNDP/GEF/YS/AWG.2/inf.1
Provisional List of Documents
UNDP/GEF/YS/AWG.2/inf.2
Provisional List of Participants
UNDP/GEF/YS/AWG.1/3
Report of the "First Strategic Action Programme Ad-hoc
Working Group"
UNDP/GEF/YS/AWG.1/4
Draft Structure of SAP for the Yellow Sea
UNDP/GEF/YS/AWG.2/inf.3
Draft Environmental Valuation Guidelines
UNDP/GEF/YS/AWG.2/3
Annex III
Page 1
Annex III
Agenda
1.
Opening of the Meeting
2.
Review of outcomes from the 1st Ad-hoc Working Group meeting on the Regional
Targets
3.
Expected outputs from the Meeting
4.
Introduction of Document, "Guidelines for Preparing Management Actions for
SAP"
5.
Presentation by regional experts on preliminary management actions with respect
to the Project's objectives (Biodiversity, Ecosystem, Fisheries, Pollution, and
Socio-economy)
6.
Brainstorming session: Identification of management actions
7.
Consideration on demonstration projects (e.g., identification of relevant
management actions to be demonstrated, demonstration sites, and
implementation mechanism)
8.
Introduction of Document "Draft Guideline for Feasibility Study," and discussion
on feasibility studies (e.g., requirements for feasibility studies: necessary
expertise, personnel, and workplan)
9.
Consideration and agreement on the establishment and workplan of a drafting
group for preparing SAP
10.
Preparation of the National Strategic Action Plans
11. Other
business
12.
Adoption of the Meeting Report
13.
Closure of the Meeting
UNDP/GEF/YS/AWG.2/3
Annex IV
Page 1
Annex IV
Agreed Management Actions for SAP Regional Targets with Respect to the
Project's Objectives of:
Biodiversity IV-1
Ecosystem IV-2
Fisheries IV-3
Pollution IV-4
Biodiversity Management Action
Analysis of Planned &
Problems identified in
Ideal Management Action
Feasible Management Actions by 2020
Technical
"Problem Issue" Regional target (2020)
General action
On-going Management Actions
Remark
CCA
Feasibility
Technical
Institutional
Legislative
Technical
Institutional
Legislative
Technical
Feasibility
Institutional
Feasibility
Legislative
Feasibility
Changes in abundance
Maintain and improve
Regional Conservation Act. 1) Establish Create regional Regional
PRC: ? PRC: ? PRC: ? Act. 1) Establish
M
Create regional
M
Regional
M
and diversity of endemic
current
Plan for endemic and
regional
mechanism for
conservation
ROK: regular
ROK: National
ROK: National
regional
mechanism for
conservation
and endangered spp.
populations/distributions endangered (E&E)
converstion plan coorperation and plan and National monitoring on
mechanism to co- law and
converstion plan
coorperation and
plan and National
and genetic diversity of species.
national
laws
marine
ordinate between enforcement
national
laws
endangered and
mechanism for
organisms
governments and
mechanism for
endemic spp.(Reduce
coordition
including some
Institute for
coordition
human impact , reduce
mammals
mammals
bycatch of endangered
spp)
Act.2) Establish
Create regional
Regional
Some on birds,
PRC: SOA &
PRC: National
Establishing
M: once
Create regional M
Regional
M
regular regional
mechanism for
conservation
PRC: limited
r
scattered in othe legislation exists regular regional
minimum
mechanism for
conservation
monitoring of
coorperation and plan and National monitoring, ROK: agencies, ROK: ROK: National
monitoring of
coorperation and
plan and National
populations/distrib national
laws
regular monitoring National
law and
populations/distrib
national
laws
utions and genecit mechanism for
on marine
mechanism to co- enforcement
utions and genecit
mechanism for
diversities of E&E coordition
organisms
ordinate between
diversities of E&E
coordition
spp.
including some
government and
spp.
mammals
Institute for
mammals
Act. 3) Periodically Create regional Regional
Some on birds,
PRC: SOA &
PRC: National
Periodically
M: once Create regional
M
Regional
M
evaluating the
mechanism for
conservation
PRC: N/A, ROK: scattered in other legislation exists evaluating the
minimum mechanism for
conservation
effectiveness of
coorperation and plan and National regular
agencies, ROK: ROK: National law effectiveness of
coorperation and
plan and National
the Regional
national
laws
evaluating the
National
and enforcement the Regional
national
laws
Conservation Plan. mechanism for
wet land
mechanism to co- in some cases
Conservation Plan.
mechanism for
coordition
including
ordinate between
coordition
mammals
government and
Institute for wet
land and
mammals
Act. 4) Habitat
Creat national
develop any new PRC: preliminary PRC: N/A PRC: legislations Habitat restoration
L
Creat national
L
develop any new
L
restoration
mechanisms to co- regulation and
cases, ROK: National
on marine
(physically,
mechanisms to co-
regulation and
(physically,
ordinate between enforcement
ROK: preliminary mechanism to co- envrionment
chemically,
ordinate between
enforcement
chemically,
government
based on existing cases (Research ordinate among
issues biologically)
government
based on existing
biologically)
agencies and
laws or newly
project for
governments,
ROK: legislations
agencies and
laws or newly
stakeholders
developed
establishing algae Institute and
on marine
stakeholders
developed
standards
ground)
stakeholders for ecosystem
standards
algae ground
conservation and
management
issues
Act. 5)
Creat national
develop any new PRC:
PRC: SOA &
PRC: national
Establishment of
H
Creat national
H
develop any new
H
Establishment of mechanisms to co- regulation and
comprehensive
r
scattered in othe laws, ROK:
new nature
mechanisms to co-
regulation and
new nature
ordinate between enforcement
plan for new
agencies, ROK: national laws
reserve and
ordinate between
enforcement
reserve and
government
based on existing MPAs, ROK:
National
MPAs.
government
based on existing
MPAs. (based on agencies and
laws or newly
comprehensive
-
mechanism to co
agencies and
laws or newly
what? It is based stakeholders
developed
plan for new MPAs ordinate among
stakeholders
developed
on institutional
standards
governments,
standards
action etc))
Institute and
stakeholders
including NGOs
Act. 6) Encourage Establish
Develop any
PRC: very limited, Environmental
ROK:
Encourage and
H
Establish
H
Develop any
H
and strengthen
regional and
enforce ment to
ROK: some
awareness and
Comprehensive strengthen public
regional and
enforce ment to
public involvement national
enhance public
involvement of
educational
guidlines
involvement in the
national
enhance public
in the action plans: mechanism for involvement
NGOs with limited programms exist
action plans: all
mechanism for
involvement
all secters,
environmental
extent
sectors, including
environmental
including NGOs
awareness and
NGOs
awareness and
educational
educational
programms
programms
Habitat loss and
Maintain current
Regional Guidelines Act. 1) Integrated Create regional
Agreement on
PRC: marine
limited national co- PRC: several
Integrated
H
Create regional
H
Agreement on
H
degradation
habitats according to for Coastal Habitat
management for mechanism for
regional coastal
function zoning,
ordination
comprehensive,
management for
mechanism for
regional coastal
standards and
Management
critical habitats
coorperation
habitat guideline
ROK: only in
ROK: several
critical habitats
coorperation
habitat guideline
regulations of 2007
specific areas
comprehensive
(According to Chinese
Act. 2) Strictly
Create national
national laws on
PRC: a national
PRC: SOA
(ROK - Has
Strictly limiting of
H
Create national
H
national laws on
H
and Korean functional
limiting of new
mechanisms to
coastal habitat
plan in
legislation
new coastal
mechanisms to
coastal habitat
zoning plans)
coastal
corrdinate
management
consideration,
prevent new land reclamations
corrdinate
management
reclamations
between
ROK: a national
reclamation?)
between
government
plan in
PRC: "Sea Area
government
agencies
consideration (I
use
agencies
though ROK had
Administration
agreed not to
Law" ROK:
relclaim any
Law of coastal
more land-
area
Serveral relevant
management and
laws to minimize,
serveral relevant
but no legislation
laws
prevent ....)
Act. 3) Encourage Establish
New policies to PRC: very limited, Environmental
ROK:
Encourage and
H
Establish
H
New policies to
M
and strengthen
regional and
promote
ROK: some
awareness and
Comprehensive strengthen public
regional and
promote
public involvement national
involvement of
educational
guidelines
involvement in the
national
in the action plans: mechanisms for
NGOs with limited programms exist
action plans:
mechanisms for
all secters,
strengthen
extent
all secters,
strengthen
including NGOs
awareness and
including NGOs
awareness and
compiliance by
compiliance by
local government
local government
to the regional
to the regional
guideline
guideline
Act. 4) Assess
Strengthen
Clear national and PRC: preliminary Limited national co-ROK: Law on the Assess
M
Strengthen
M
Clear national and
M
ecosystem
national
regional guidelines cases, ROK:
ordination between prevention of
ecosystem
national
regional guidelines
services of well
mechanisms to co- on assessment
preliminary cases government
marine pollution services of well
mechanisms to co-
on assessment
managed critical ordinate between
agencies and
and several
managed critical
ordinate between
habitat, including government
stakeholders
relevant laws
habitat, including
government
economy losses
agencies and
economy losses
agencies and
and gains
stakeholders
and gains
stakeholders
Act. 5) Integrated Establish
Agreement on
PRC: plan in
ROK: Sharing
ROK: Guidelines Integrated
H
Establish
H
Agreement on
H
management of
mechanism to
sharing data
consiteration,
data in limited
for sharing data management of
mechanism to
sharing data
different
integrate and
among
ROK: plan in
components
different
integrate and
among
components to
sharing of data components
consideration
components to
sharing of data
components
sustain social-
among
sustain social-
among
economic
components,
economic
components,
development:
demonstration
development:
demonstration
demonstration
project(s)
demonstration
project(s)
Regional Plan for
Act. 1)
Create regional
National law
PRC:
PRC: SOA &
PRC: national
Establishment of
H
Create regional
H
Agreement on
H
MPAs
Establishment of mechanism for
comprehensive
r
scattered in othe laws, ROK:
new nature
mechanism for
regional plan for
new nature
coorperation
plan for new
agencies National laws
reserves [at the
coorperation
MPAs
reserves at
MPAs, ROK:
ROK: National
regional level?]
national level
comprehensive
-
mechanism to co
plan for new MPAs ordinate among
governments,
Institute and
stakeholders
including NGOs
Act. 2) Better
Create national
national laws on
PRC: UNDP
ROK: National
PRC: national
Better
H
Create national
H
national laws on
H
management of
mechanisms to
nature reserves
Yancheng Project,
-
mechanism to co laws on nature
management of
mechanisms to
MPAs
existing nature
corrdinate
ROK: UNDP
ordinate among reserves existing nature
corrdinate
reserves(incl.
between
Korea Wetland
governments,
ROK: National
reserves
between
capacity building, government
Project
Institute and
laws
government
sustained
agencies
stakeholders
agencies
funding)
including NGOs
in the limited
area
Act. 3) Reduce
Create
Refer to Pollution Refer to Pollution Refer to Pollution Refer to Pollution Reduce pollution in
H
Create
L
Internationally
L
pollution in and
mechanism for
Group
Group
Group
Group
and around critical
mechanism for
accepted
around critical
transboundary
habitats (Refer to
transboundary
regulation(s) on
habitats (Refer to MPAs
Pollution Group)
MPAs
transboundary
Pollution Group)
management
management
MPAs [note: are
you suggesting
to introduce
globally
accepted
regulations???]
Act. 4) Encourage Create
New policies to PRC: very limited, Environmental
ROK:
Encourage and
H
Create
H
[don't need
and strengthen
mechanism on
promote
ROK: some
awareness and
Comprehensive strengthen public
mechanism on
anything?]
public involvement sustainable
involvement of
educational
guidlines
involvement in the
sustainable
in the action plans: finacing for MPAs
NGOs with limited programms exist
action plans: all
finacing for MPAs
all secters,
extent
sectors, including
including NGOs
NGOs
Act. 5) Identify
Establish regional Clear regional
PRC: N/A PRC: N/A PRC: N/A Identify priority
H
Establish regional
H
Clear regional
H
priority habitats for and national co-
guidelines on
ROK:
ROK: National
ROK:
habitats for MPAs
co-operative
guidelines on
MPAs
operative
identification
Comprehensive
-
mechanism to co Comprehensive
mechanism to
identification
mechanism to
plan for
ordinate among guidelines
share information
share information
identification
governments,
& data
& data
Institute and
stakeholders for
algae ground
Act. 6) Assess
Establish regional Clear regional
PRC: N/A PRC: N/A PRC: N/A Assess
M
Establish regional
M
Clear regional
M
effectiveness of
and national co-
guidelines on
ROK: N/A
ROK: N/A
ROK: N/A
effectiveness of
co-operative
guidelines on
MPAs on habitats operative
assessement
MPAs on habitats
mechanism to
assessement
and populations
mechanism to
and populations
share information
share information
& data
& data
Reduce risk from
Ballast water control Control and
Regional
International/regi PRC: yes,
PRC: yes,
International/regi Control and
M
Regional
H
invasive spp.
monitoring of
mechanism for
onal agreement ROK:Yes
ROK:Yes
onal agreement monitoring of
mechanism for
ballast water
coorperation and and national
and national
ballast water
coorperation and
treatment and
national
legislations
legislations
treatment and
national
discharge
mechanism for
discharge
mechanism for
coordination
coordination
New spp.
Precautionary
Mechanism to
Strengthen
PRC: yes,
PRC: in
legislation on
Precautionary
H
Mechanism to
H
Legislation on
H
introduction Control introduction and conduct risk
legislation on
ROK:Yes
consideration,
species
introduction and
conduct risk
invasive spp.
strict control of assessment
invasive spp.
ROK: established introduction &
strict control of
assessment
Controls
alien spp.
Issues
quarantine
alien spp.
Ecosystem Management Action
Analysis of Planned &
Problems identified in
Ideal Management Action
Feasible Management Actions by 2020
Technical
"Problem Issue" Regional target (2020)
General action
On-going Management Actions
Remark
CCA
Feasibility
Technical
Institutional
Legislative
Technical
Institutional
Legislative
Technical
Institutional
Legislative
Ecosystem changes
Provide relevent
Assess and monitor the harmonized and
Establish cross-
[note: noting
countries have
no cross-basin
harmonized and
Establish cross-
[note: noting
(lower trophic level and
information to
impact of N/P/Si change coherent
basin monitoring needed???]
different sampling monitoring due to
coherent
basin monitoring needed???]
benthos)
understand and predict
monitoring
network
methods and
lack of co-
monitoring
network
regional
ecosystem status
methodologies
seasons; regular ordination among
methodologies
agreements for
survey only cover different
joint monitoring?
limited area; not
agencies;[note: is
designed to reveal this
basin-scale
institutional????]
changes
Assess and monitor the harmonized and
Establish cross-
[note: noting
ditto
lack of
harmonized and
Establish cross-
[note: noting
impact of climate
coherent
basin monitoring needed???]
taxonomists [note:
coherent
basin monitoring needed???]
change
monitoring
network
did not
monitoring
network
methodologies
understand]
methodologies
seems misplaced
for impact of
climate change;
move to
technical? Unless
it's a need for
more funding to
train taxonomists
Monitor the
develop
Establish
[note: noting
ditto
develop
Establish
[note: noting
tranboundary impact of monitoring
monitoring
needed???]
monitoring
monitoring
needed???]
jellyfish blooms
methodologies
network
methodologies
network
Predict ecosystem
develop models to establish regional incorporate the
no activities
no activities
develop models to establish regional incorporate the
change in the long run
predict ecosystem science
prediction into
[delete] keep, so [delete] keep, so
predict ecosystem science
prediction into
change and its
committee to do management
reader knows no reader knows no
change and its
committee to do management
impact on
what?
policy
current efforts
current efforts
impact on
what?
policy
fisheries
are in place
are in place
fisheries
Monitor the
develop nat'l and Establish
[note: noting
no co-ordinated
no international
develop nat'l and Establish
[note: noting
combine with Line
tranboundary impact of reg'l monitoring
international
needed???]
monitoring
monitoring
reg'l monitoring
international
needed???]
#22
jellyfish blooms
methodologies
monitoring
network
methodologies
monitoring
network
network
Monitor HAB
develop
[mechanism for] [note: noting
monitoring
conduct periodic
improve capability conduct periodic [note: noting
occurrences
regional?
capacity building needed???]
programmes only monitoring [is
in HAB
monitoring [Is
needed???]
monitoring
in HAB
at national level
this
monitoring,
this
methodologies
monitoring,
and scattered
Technical???]
prediction and
Technical???]
prediction and
among
mitigation
management
responsible
agencies
Increased frequency of See Nitrogen
< 5 events on each
See Nitrogen
control nutrients
[See; are you
establishing laws See Nitrogen
See Nitrogen
See Nitrogen
See Nitrogen
See Nitrogen
See Nitrogen
actions for N
HABs
enrichment and
coast (HAB inlcudes
enrichment and
loading;
saying
to meet the target enrichment and enrichment and enrichment and enrichment and enrichment and enrichment and
enrichment should
eutrophication
high biomass algal
eutrophication
environment
mechanism to
regulations on
eutrophication
eutrophication[n eutrophication[n eutrophication[n eutrophication[n eutrophication[n
lower HAB events.
bloom)
friendy
check?] Nitrogen HAB management [note: can
ote: can
ote: can
ote: can
ote: can
ote: can
Combine with
exploitation in
enrichment and
and mitigation
Technical,
Technical,
Technical,
Technical,
Technical,
Technical,
above monitoring
coastal waters
eutrophication
Institutional and Institutional and Institutional and Institutional and Institutional and Institutional and
to ensure target is
Legislative
Legislative
Legislative
Legislative
Legislative
Legislative
met.
same???]
same???]
same???]
same???]
same???]
same???]
Fisheries Management Action
Analysis of Planned &
Problems identified in
Ideal Management Action
Feasible Management Actions by 2020
Technical
"Problem Issue" Regional target (2020)
General action
On-going Management Actions
Remark
CCA
Feasibility
Technical
Institutional
Legislative
Technical
Institutional
Legislative
Technical
Institutional
Legislative
Decline in landings of
25-30% reduction in
Reduce no. of
Data linkage between
Creation of alternative Laws to reduce no of
Boat buy-back has
Creatation of
Laws to reduce no of
Boat buy-back and
Creatation of
Continued
many commercially-
catch and fishing effort boat/power
the reduction in fishing livelihoodsuntil all ex-
boats/power and
already been initiated alternative
boats/power and
control of new boat
alternative livelihoods strengthening of
important species
(2004)
effort and and the fish fishermen have new
h
licenses, combined wit as has control of new livelihoodshas already liscenses, combined
buildinguntil fishing
thelaws to reduce no of
biomass. Boat buy-
employment
policies to encourage boat building
been initiated
with policies to
effort is reduced to the
boats/power and
back and control of
other livelihoods.
encourage other
required level
liscenses, combined
new boat building.
Subsidies for
livelihoods have
with policies to
Reduction of fishing
alternative livelihoods
already been initiated.
encourage other
effort to optimum level
and boat buyback
Subsidies for
livelihoods. Subsidies
keep biomass at
alternative livelihoods
for alternative
biological safety
and boat buyback
livelihoods and boat
buyback
Stop fishing in certain
Identification of closed
Increase in general
Improvement of
Some closed areas
Mechanism for
Conservation acts to
More science based
Increased awareness of Conservation acts to
areas/ seasons
areas/seasons according public awareness of
regulations. Stop illegal during spawning season Increasing awareness protect fish stocks.
closure of areas and
regulations
protect fish stocks
to scientific knowledge of closed seasons and
fishing.
for selected spp. In
of regulations.
seasons. Summer
fish spp.
fishermens awareness of
China - summer fishing
fishing ban to be
Comprehenvise
regulations and future
ban. Insufficient
continued in China.
monitoring of illegal
benefits. Capacity
knowledge
Limitation of trawling to
fishing activities
building for
certain areas.
enforcement.Develop
Comprehensive
plan for monitoring
monitoring of illegal
illegal fishing
fishing)
Incr in mesh size
Identification of optimal Increase in public
Improvement of
Optimal size at capture is Public awareness of
Some regulation in place Improved selectivity of
Increase in Public
Improvement of
size at capture and
awareness of regulations regulations of size limits, only known for some
regulations and future
but need to improve
fishing gears.
awareness of regulations regulations. Regulations
reduction of by-catch
and future benefits.
monitoring and
commercial species
benefits is increasing
enforcement.
and future benefits
and enforcement to stop
Capacity building for
enforcement. Increase in
Illegal fishing
enforcement.
funding for the
enforcement. Stop Illegal
fishing
Improvement in Stock
Use of precautionary
Coordination between
Self-regulation system by ROK - TAC for limited
Need to improve
[Some discussion in
Introduction of ITQ &
Improved coordination
Self-regulation system
management
approach and ITQ &
scientists, managers,
fishermen themselves
number of spp. China-
coordination between
China for the
EBFM based on
between scientists,
by fishermen themselves
EBFM based on
fishermen, gov depts and and community-based
Negative growth in
scientists, managers,
introduction of
improved monitoring and managers, fishermen,
and community-based
improved monitoring.
regionally. Establish
management in the
landings and summer
fishermen, gov depts and community-based
assessment.
gov depts and regionally management in the
Establishment of
regional organisation.
coastal areas. Widen the fishing ban.
regionally Move to
fishing regulation. ->
coastal areas.
database and joint stock
no of species for which
legislative
needs to be deleted]
[Establish regional
analysis/ assessment
landings data is recorded
Widespread in ROK for
organisation.-> move to
with independent checks
self-regulation system
institutional ]
by fishermen. [No
Improvement in funding
regional organisation->
[delete] OK
move to Institutional?].
OK
Rebuilding of depleted
Rebuilding Stocks
Release of juveniles.
Coordination between
Improvement of policy
In China massive release Limited coordination
Limited environmental Contolled release of
Better coordination
Improvement of policy
fish stocks to normal
Habitat improvement
scientists, managers,
and funding for the
of juveniles of many
between scientists,
imput into the policy of juveniles based on sound between scientists,
and funding for the
levels
(artificial reef)
fishermen, gov depts and release of juveniles and species but some need managers, fishermen,
stock enahancement
scientific knowledge, with managers, fishermen,
juvenile release and
regionally
habitat improvement. Self for evalutation of effects. gov depts and regionally and habtiat
increase awareness of gov depts and regionally habitat improvement that
regulation system by
In ROK some species
improvement.
the genetic impacts.
take into account the
fishermen themselves
released. Habitat
Improvement of policy
Habitat improvement to
environmental impacts.
and community-based
improvement many
and funding for the
be continued through
Self-regulation system
management in the
artificial reefs deployed
release of juveniles and artificial reef.
by fishermen themselves
coastal areas.
habitat improvement .
and community-based
Self-regulation system
management in the
by fishermen themselves
coastal areas.
and community-based
management in the
coastal areas (in ROK
only).
Unsustainable
Sustainable/Polyculture/ Develop Environmental- Increase implementation Increase in Public
Use the licenses for the Integrated Multi-trophic Limited public
Need to introduce
Integrated Multi-trophic Training and capacity
Increase the
maricultural
optimization of the
friendly mariculture
of Integrated Multi-trophic awareness of the benefits control of farm area and Aquaculture (IMTA) is
awareness of the
licenses for IMTA
Aquaculture (IMTA) is
builiding
percentage of licenses
practices
distribution and the
models and technology Aquaculture (IMTA)
of IMTA [set up a
species cultured (based implemented in some
benefits of IMTA
practise [is this on-
implemented as the
issued for IMTA in
cultured spp
mechanism for public on carrying capacity
areas in China
[maybe deleted, sounds going matter???] (YES) major technology.
relation to monoculture
Improvement culture
awareness???]
models) [note: using
not an institutional
(Ongoing in open sea Increase the economic
[dounds like a
techniques.
the licenses ... will be
action] (I don't agree)
s
and land based culture benefit from IMTA
Technical](maybe
sufficient for an ideal
in Korea- Jang)
(combined with
rephrase - change of
legslative action?]
Carrying capacity
policy so that
(licenses is the most
MODELS)(I agree,
governement can
ideal tools at this time,
Jang)
stipulate the species
Jang)
composition and area
occupied)
Move the mariculture
[mechanism to
Legislating the
Need to develop (There Increase (Limited
Legislating the
Standard offshore
BAP (Best Aquaculture Standards system and
from inshore to offshore ]Increase in Public
reasonable and
are some) suitable
number of )
reasonable and
technologies to
Practice)
regulations for offshore
and innovating the new awareness of the benefits acceptable regulations for innovative offshore
demonstration sites in acceptable regulations different conditions are demonstration in
mariculture are well
technologies
of offshore aquaculture. encouraging the offshore aquaculture
commercial scale
for encouraging the
a
well developed [is this commercial scale
established
Coordination between
mariculture
technologies (adapted) [note: not sounds pn-
offshore mariculture
feasible action to be
[move to Technical?]
different ministries, local
to different
going](Yes)
[note: not sounds on-
proposed????] (YES)
goverment and private
conditions[note:
going] (limited
sectors
sounds not on-going]
legislation and
(yes, it is on-going in
regulations for
Korea)I
encouraging
sustainable offshore
mariculture )(Yes)
Reduce nutrient
Roll out of limited water [Increase: delete]
Laws to regulate nutrients (There is substantial
Increase demonstration Preparing laws or
(The rollout
BAP (Best Aquaculture Improved laws or
discharge
exchange aquaculture
[mechanism for] public discharge and Policies to development in)Limited sites in commercial
regulation to control
of...)Limited water
Practice)
regulations to control
land based systems
awareness of the
discourage use of trash water exchange
scalenote: not sounds nutrients discharge and exchange aquaculture demonstration in
nutrients discharge and
including recirculating
benefits of articial
fish
aquaculture systems, pn-going] (No sites to policies to discourage
systems and
commercial scale
Policies to discourage
systems. Improvement of feeds.
recirculating systems demonstate the
use of trash fish (in
improvement of articial [move to Technical?]
use of trash fish
articial diet
and improvement of
benefits of these
which country)(not in
diet is practised in
articial diet (. However systems)(Government both countries )
commercial scale
limited water exchange compensating expense
[note: didn't
systems and
for buying some
understand]
recirculation systems artificial diet in Korea)
are only used by very
limited numbers
farmers.)is being
implemented [note:
didn't understand!]
Effective diseases
Develop the diseases
[add improve?]
Regulation of notifiable
Diagnosis and control
Coordination between
f
More strict regulation o Diagnosis and control
Coordination between
Application of stricter
Control
diagnosis and control
Coordination between
diseases, and quarantine techniques for some
central government,
notifiable diseases, and techniques for all
central government,
regulation for controlling
techniques.Establish the central government,
procedures. Regulations diseases developed. The scientists and farmers is quarantine procedures diseases is established. scientists and farmers is diseases.
network for diseases
scientists and farmers.
for preventing infectious network for diseases
established. Pre-warning is needed. Regulations The network for diseases intensified. Pre-warning
monitoring system
Establishing the pre-
disease transmisson
monitoring system
system of diseases
for preventing
monitoring system is well system of diseases
warning system of
established
needs [to be improved infectious disease
operated
should be operated all
diseases
note: sounds not like
transmisson is needed
time
on-going]
[note: sounds not on-
going]
Changes in
Provision of better
abundance/biomass and
scientific understanding
species diversity of
for Adaptive
plankton
Management(monitoring/
assessment/prediction)
Loss of benthic habitat in
coastal areas.
Changes in abundance
Maintain and improve
and diversity of endemic
current
and endangered spp.
populations/distributions
and genetic diversity of
endangered and
endemic spp.(Reduce
human impact , reduce
bycatch of endangered
spp)
Habitat loss and
Maintain current habitats
degradation (1)
according to standards
and regulations of 2007
(According to Chinese
and Korean functional
zoning plans)
Pollution Management Action
Analysis of Planned &
Problems identified in
Ideal Management Action
Feasible Management Actions by 2020
Technical
"Problem Issue"
Regional target (2020)
General action
On-going Management Actions
Remark
CCA
Fefasibility
Technical
Institutional
Legislative
Technical
Institutional
Legislative
Technical
Institutional
Legislative
Contaminants and their land based
1.Meet regulations in Codex Action 1.1 Monitoring
regular monitoring of all
establish regional monitoring develop new regulation and monitoring programmes only management of input
national/regional review of
continue monitoring
[set up a mechanism for]
mandatory review of
effects (1)
sources
alimentarius/ Stockholm
and assessment
pollutant sources
network, and sharing of
strict enforcement based on at national level and scattered sources and sharing of
pollution-related conventions programmes nationally,
agreements and
environmental quality
Convention / MARPOL
monitoring data among all
existing laws or newly
among responsible agencies information not well co-
(reg'l GA)
implement regional
methodology to share data standards every 5 years
agencies
developed standards in each
ordinated
monitoring programme
country
non-point sources
identification and annual
regional forum for integrated
"hot spot" of river discharge
regional forum every 5years , improve national co-
harmonise existing regulation
review of "hot spots"
review on hot spots
identified in Poll. Regional
majoring monitoring
ordination of contaminant
(sources and sinks)
Synthesis
technology, parameters,
control through regular
assessment on status and
IMCC meetings [in the
trends, main problems, etc.
Regional forum?]
with the monitoring centers
and organisations.
atmospheric
[develop regional guidance establish coordination
harmonize regional standards [water, sediment, organism
National legislation exist but regional research on using
harmonise existing
sources
or guidelines for water,
mechanism for the
or guidelines/guidances
quality assessment ???
not harmonized
agreed quality assessment
guidances/guidelines
sediment, organism quality management of contaminants
Exist at national levels, but
criteria
assessment .
may differ from country to
country. No reg'l agreed
methods.
Action 1.2 Control of
install facilities/equipment
strict regulation
control with existing
national control standards
regional monitoring and
harmonize [better to use
contaminants discharge to control or reduce industrial
standards
exist
assessment of contaminant
"improve"???]exsiting
discharge
sources and fate
standards (improve
existing standards, and
harmonize with
regional/int'l stds)
reduce automobile
strict regulations
control with existing
standards and regulations
[monitoring and assessment ???] as above
harmonize [better to use
emission
standards
exist
"improve"???]exsiting
standards ??? as above
Nitrogen enrichment
point sources
2. Control of total loading to Action 2.1 Control of
routine monitoring of all input national ministries co-
establishing bylaws to meet China: marine environmental Need improvement of national National legislation exist.
data and information
Enhance national co-
harmonise existing
and eutrophication
meet reference point (China total loading
sources and loads
operate with each other
the target
monitoring program,
co-ordination [mechanism]
Need harmonisation [delete exchange
ordination [mechanism]
regulation among relevant
will reduce total N loading
and have regular
environmentalmonitoring
need harmonisation] but
national regulatory bodies
from point sources 10%
discussions [ministerial
program
legislation is disjointed, or
every 5 years) what is the
level cooperative
different agencies
baseline to start the
mechanism to have regular
responsible for similar
reduction?-input in 2005
discussions]
issues
non-point sources
Korea :marine environmental
monitoring program,
environmental monitoring
program, estuarine
monitoring program
atmospheric
Limited understanding of N
no data and information
expand research on
provide additional funding annual review that target will
deposition
transfer from atmosphere to exchange mechanism
atmospheric deposition
to expand atmospheric
be met for each current 5 yr
YS
input research [delete this period
item] why delete?
environmental capacity to
regional working group
need for? total-quantity-
limited understanding of
Need improvement of national requirement from law and calculation of loads in hot
Regional forum
putting [total quantity
absorb nutrients
(need for group to do
control regulation
environmental capacity of YS co-ordination mechanism
regulation [clarify the
spot area
control regulation?] in
what? Is this group
(to absorb nutrients?)
meaning]
national planning system
different from regional
forum?)
increase treatment ability to annual IMCC meetings and legalise annual check for
China: national plan to
no regular IMCC discussions China: regulation and plans Review the current waste
regular IMCC discussion or
[improve laws and
reduce discharge according toin planning system[not
targets being met
reduce N 10% in 5 years
for control of discharge,
treatment facilities; provide
regular inter-provincial
regulations] on clean
calculation
clear]
plan, Korea has strict
Korea has strict regulation to recommendation for facility's discussion
production, recycling use,
regulation to control N
control N discharge
future development every 5
etc.
discharge [China: may
years, promoting clean
reduce N by 10% in 5 years
production and recycling use,
plan; Korea, may reduce N
improving treatment system
by more than 5% in 5 years]
and capacity, new treatment
plant construction
Control of fertilizer use
[enact law or regulations]
monitoring and assessment,
[set up guidelines or enact
to encourage eco-
technical recommendations to
law/regulations to]
agriculture
do what?, eco-agriculture
encourage eco-agriculture
demonstration
reduce emission from
[mechanism for] data
implement total-quantity-
monitoring programmes only no mechanism for discussion scattered in law and
monitoring and assessment, regular IMCC discussion or
[regulation for] total-
many of these
automobiles
sharing and planning with control regulation
at national level and scattered from ocean management
regulation what is
technical recommendations regular inter-provincial
quantity-control planning
actions are
relevant agencies
among responsible agencies agency to other ministries
scattered? The law itself?
to do what?
discussion
[and regulation: delete]
applicable to Line
#9
reduce current concentrations [share: delete] monitoring initiate environmental-target- monitoring programmes only no sharing mechanism
scattered in law and
monitoring and assessment
regular IMCC discussion or
establish environmental-
in sea water
data exchange mechansim control regulation
at national level and scattered
regulation what is
regular inter-provincial
targets-control regulation
among responsible agencies
scattered? The law itself?
discussion
Action 2.2 New
use existing or construct
regular IMCC discussion
legislation for utilization of
[coastal wetlands lost due no discussion mechanism
Korea - no further coastal
engineering in suitable site
regular IMCC discussion or
regulation for what?
approach for treatment additional wetlands to serve
wetland
to land reclamation, demo among marine, wetland,
land reclamation allowed
what kind of engineering?, regular inter-provincial
of nutrients
as nutrient sink for
engineering: delete] why
wastewater treatment
monitoring and assessment discussion
watersheds
delete?
agencies
of the wetland protection
or use of wetland as
nutrient sink?
N:Si ratio -
3.Improve FW seasonal
Action 3.1 Adaptively
adaptively adjust FW fluxes
cooperative [mechanism
agreed regional regulations from rivers
no IMCC discussion
no laws and regulations
adaptively adjusting water
regular IMCC discussion or
implement regulations or
decrease N,
fluxes
adapt to? Adjust FW to the YS
among agencies for]
on adjusting FW fluxes
flushing sediments in into or regular inter-provincial
acts related to meet target
increase Si
according to?
planning flux schedules,
from? rivers according to
discussion
increasing Si
levels
required Si level in YS
concentrations
Action 3.2 Monitoring
regional monitoring and
[mechanism for] data and agreed regional monitoring national monitoring system
no integrated monitoring
no regional
implement regional
regular IMCC discussion or
need to agree on regional
and assessment on
assessment
information sharing
guidelines
[mechanism?] from
guidelines/guidance
monitoring program with
regular inter-provincial
guidelines/guidance (is this
N:P:Si ratios
different sources eg
agreed regional guidelines discussion
legislation?)
atmosperic, watershed,etc.
Action 4.1 Waste
Implement technologies for
more govt support for
Compliance with waste
Continuous execution of
implement industry policy
some regulation and policy implement national/regional continue env. awareness
more regular and stricter
reduction
waste reduction, re-use,
recycling enterprises
management laws and
ocean waste collection project and encourage and facilitate to support ocean waste reuse monitoring programme
and education programmes enforcement of marine litter
recovery, and disposal
regulations
adequate funding for control enterprises
[move to technical ??]
laws
of solid pollutants, including
litter in rivers
Marine Litter
land based
4. Reduced standing stock
develop regional indicators
Regional Forum
Clear national & regional
monitoring programmes only devise mechanism for
some regulations scattered in regional/national monitoring more govt support for
Development of
sources
of litter from current level
and monitoring programme
guidelines on marine litter
at national level
combining region-wide
law and regulation
program
recycling enterprises
national/regional guidelines
(Increase public awareness;
with nation-wide
[delete??? Or to be moved on integrated management of
periodic clean ups)
monitoring program
to technical]
marine litter with coastal
management plan
sea based sources
Action 4.2 Marine litter cleaning and treatment
operational mechanism
need to implement
youth awareness programs demostration
some regulations scattered in cleaning and treating (please data and information
[need to have ????]
cleaning
(please clarify)
(please clarify)
regulations and acts
(e.g. beach cleanup, envt'l [mechanism????]
law and regulation
clarify)
exchange at
regulations and acts
education) taking place in
regional/national/local levels
demo many sites
Need more environmental
national programs [delete] need to implement
scattered in different fields
expand env. awareness
scattered in law and
[[prepare national plannings national planning
improve regulations and
awareness and education
regulations and acts
and sites What is
and education programmes regulation
to implement different
[incorporate into the left
acts related to awareness
programs
scattered?
exist [delete] (move to
programs???]
Technical] plans for
and education]
technical?)
cleaning beach and
publicity
See Contaminants and
their effects (1), but based
on national standards
(goes in box below?)
Cultural
Contaminants
and bathing beach areas
Reduced to nationally
their effects (2)
acceptable levels
UNDP/GEF/YS/AWG.2/3
Annex V
Page 1
Annex V
Agreed Guidelines for Demonstration Project and Site Selection
· Timing of Demonstration Activities
Start September 2008 to December 2009
· Selection Criteria for Demonstration Projects and Sites
1. Selection of management actions to demonstrate (criteria are listed in order of
importance; actions should satisfy at least some criteria)
- Effectiveness easily obtainable results
- Ease of demonstratability of action - results are easily understood by general
public, ease of dissemination
- Results that help raise public awareness
- Combination of technical and institutional actions should both be
demonstrated
- Cross component action
- Transboundary nature of actions
- Opportunity to cooperate with other projects/organizations
- Co-financing
2. Site selection
- Appropriateness of site to demonstrate management actions
- Political
willingness
- Stakeholder willingness to participate
- Replicability in other areas around the region
· Procedure
1. Proposal to be submitted to the RWG
2. 2007 RWG - will propose candidate actions and sites considering the criteria above.
Justification should be provided.
3. RSTP will review and make recommendations
4. PSC - will decide.
5. PMO will draw up contracts in consultation with NPCs
UNDP/GEF/YS/AWG.2/3
Annex VI
Page 1
Annex VI
Agreed Guidelines for Feasibility Studies of SAP
· Deadline of the feasibility studies on costs and benefits analysis and political and
social acceptability
Two feasibility studies should be completed before the submission of the draft SAP to
the governments for their considerations.
· Cost Benefit Analysis
- Target(s) should be selected considering the political and social importance.
- The scale of the analysis may be small due to the constraints of time and budget.
- Specific methods (e.g. CVM, TCM) of cost benefit analysis will be decided
considering the characteristics of the targets to be selected.
- Cost effectiveness analysis may be used in addition to the cost benefit analysis, if
necessary.
- Appropriate cooperation with natural scientists needs to be sought to incorporate
relevant scientific knowledge into the analysis throughout the process.
- An expert group should be organized to facilitate the implementation of the const
benefit analysis.
· Political and Social Acceptance
- The draft SAP will be circulated to the relevant stakeholders for their reviews and
comments.
- Public hearings (one each in each participating country) will be organized for the
public. The formats of public hearings may include the forms of symposium, seminar
and etc. Efforts should be made to invite the relevant media.
- In the public hearings, the political and social acceptance feasibility for selected
management action(s), with which the cost benefit analysis will be carried out, need
to be addressed.
- A summary report of the results of the circulation of the draft SAP to the relevant
stakeholders as well as the public hearings will be provided.
- A professional assessment by expert(s) will be added on the results of the circulation
of the draft SAP to the relevant stakeholders as well as the public hearings.
- Political and Social acceptance feasibility study needs to be carried out after the
completion of the draft SAP, but before the submission to the participating
governments for their considerations.
- A personnel wished to inform the necessity of including the trend analysis in the
feasibility study to the RWG-Investment Meeting to be held in October, 2007.
- The meeting discussed and generally agreed the issues (UNDP/GEF/YS/AWG.2/4,
page 3) proposed by the PMO for the political and social acceptance feasibility study.
- A specific opinion was provided to revised the proposed issues as follows (Document
UNDP/GEF/YS/AWG.2/4, p. 3):
Have all relevant stakeholders been identified and fully consulted?
The national and regional governance analyses provide information and results on
the stakeholders' relationships to each management action. Based on the
information, there is a need to check whether [all, suggested to be deleted.] the
relevant stakeholders that would be affected by the management actions have been
UNDP/GEF/YS/RWG-I.3/3
Annex III
Page 2
identified, [and, suggested to be deleted] are fully aware, [and agreed, suggested to
be added] of the management actions [and their impacts, suggested to be deleted]. It
is expected that NGOs involved in the Project would assist in this respect.
· Procedure for the next steps
- The meeting agreed to discuss the detailed plans for cost benefit analysis and
political and social acceptance feasibility study in the next RWG-Investment Meeting
to be held in October, 2007.
- Items to be discussed include whether to hire independent expert(s).
Biodiversity Management Action
Analysis of Planned &
Problem
Ideal Management Action
Feasible Management Actions by 2020
Technic
Regional
On-going Management Actions
s
General
al
target
Feas
Feas
Remark
identifie
action
Feasibili
Feasibili
(2020)
Technical
Institutional
Legislative
Technical
Institutional
Legislative
Technical
Institutional
ibilit
Legislative
ibilit
d in CCA
ty
ty
y
y
Changes Maintain Regional Act. 1) Establish regional Create regional
Regional conservation
PRC: Sporadic monitoring PRC: National
National law and
Act. 1) Establish regional
M
Create regional
M Establish regional
M
3
There is al ready techincal
in
and
Conservat conservation plan
mechanism for
agreement and National
ROK: regular monitoring
conservation system for E enforcement both PRC
conservation plan
mechanism for
conservation plan and
studies and a willingnes
abundan improve
ion Plan
cooperation and national laws
on some marine
& E Spp. ROK: National and ROK
coorperation and national
better enforcement of
between countries
ce and current
for
mechanism for
organisms including some mechanism to co-ordinate
mechanism for coordition
National laws
diversity population endemic
coordination
mammals
between governments and
of
s/distributi and
Institute for mammals
endemic ons and
vulnerable
and
genetic
(E&V)
Act.2) Establish regular Create regional
Regional conservation
some on birds, PRC:
PRC: SOA & other
PRC: National legislation Establishing regular
M (once Create regional
M Establish regional
M
2
Genetic diversity data is
vulnerabl diversity
species.
regional monitoring of
mechanism for
plan and National laws
Sporadic monitoring ROK: agencies, ROK: National exists ROK:
regional monitoring of
minimu mechanism for
conservation plan and
limited and expensive to
e spp. of
populations/distributions cooperation and national
regular monitoring on
mechanism to co-ordinate National law and
populations/distributions
m)
coorperation and national
better enforcement of
gather. Similar case for
endangere
and genetic diversities of mechanism for
some marine organisms
between government and enforcement
and genetic diversities of
mechanism for coordition
National laws
Migratory bird flyways, RWG
d and
E&E spp.
coordination
including some mammals Institute for mammals
E&E spp.
established and document
endemic
used for reference
spp.(Redu
ce human
Act. 3) Periodic
Create regional
Regional conservation
Some on birds, PRC:
PRC: SOA & other
PRC: National legislation Periodic evaluation of the M (once Create regional
M Establish regional
M
2
Difficulties in regional
impact ,
evaluation of the
mechanism for
plan and National laws
irregular evaluation of
agencies, ROK: National exists ROK:
effectiveness of the
minimu mechanism for
conservation plan and
cooperation and uniformity of
reduce
effectiveness of the
cooperation and national
reserves ROK: regular
mechanism to co-ordinate National law and
Regional Conservation
m)
coorperation and national
better enforcement of
methodology. Need to sustain
bycatch of
Regional Conservation
mechanism for
evaluation of the wet land between government and enforcement in some
Plan.
mechanism for coordition
National laws
motivation
endangere
Plan.
coordination
and mammals
Institute for wet land and cases
d spp)
mammals
Act. 4) Habitat
Creat national
develop any new
PRC: preliminary cases, PRC: SOA and other
PRC: legislations on
Habitat
L
Creat national
L
Develop new regulation
L
2
Technology is available, but
restoration/improvement mechanisms to co-ordinate regulation and
ROK: preliminary cases
agencies ROK:
marine envrionment issues restoration/improvement
mechanisms to co-ordinate
and enforcement based
maybe limited in scope and
for E&V spp (physically, between government
enforcement based on
(Research project for
National mechanism to co- ROK: legislations on
for E&E spp (physically,
between government
on existing laws or newly
number. Not possible in areas
chemically, biologically)
agencies and stakeholders existing laws or newly
establishing algae ground) ordinate among
marine ecosystem
chemically, biologically)
agencies and stakeholders
developed standards
already reclaimed.
developed standards
governments, Institute
conservation and
and stakeholders for algae management issues
ground
Act. 5) Establishment of Creat national
develop new regulation
PRC: comprehensive plan PRC: SOA & other
PRC: national laws, ROK: Establishment of new
H
Creat national
H develop new regulation
H
4
Already existing plans for new
new nature reserve and mechanisms to co-ordinate and enforcement based on for new MPAs, ROK:
agencies, ROK: National national laws
nature reserve or MPAs.
mechanisms to co-ordinate
and enforcement based
MPAs
MPAs.
between government
existing laws or newly
comprehensive plan for
mechanism to co-ordinate
between government
on existing laws or newly
agencies and stakeholders developed standards
new MPAs
among governments,
agencies and stakeholders
developed standards
Institute and stakeholders
including NGOs
Act. 6) Encourage and
Establish regional and
Develop policies and
PRC: limited, ROK: some Environmental awareness Comprehensive guidelines Encourage and strengthen
H
Establish regional and
H Develop policies and
H
4
Some worry over public
strengthen public
national mechanism for
incentives to enhance
active involvement of
and educational
and regulations
public involvement in the
national mechanism for
incentives to enhance
acceptance of new MPAs -
involvement in the action environmental awareness public involvement
NGOs
programms exist
action plans: all sectors,
environmental awareness
public involvement
especially of stakeholders
plans: all sectors,
and educational
including NGOs
and educational
including NGOs
programms
programms
Habitat Maintain Regional (Initial Action) Identify
Establish regional and
Clear regional guidelines PRC: a knowledge base
PRC: N/A ROK: PRC: Guidelines for MPA Identify priority habitats for
H
Establish regional co-
M Clear regional guidelines
M
4
Knowledge and techniques in
regional priority habitats national co-operative
on identification
that can be used for
National mechanism to co- establishment include
MPAs
operative mechanism to
on identification
place
loss and current Guideline prior to establishment of mechanism to share
identification of critical
ordinate among
identification of critical
share information
degrada habitats
s for
MPAs
information
habitats ROK: governments, Institute
habitats ROK:
tion
accordin Coastal
Comprehensive plan for
and stakeholders for algae Comprehensive guidelines
g to
Habitat
identification
ground
standard Manage
Act. 1) Devlopment of
Inter-departmental
Agreement on regional
PRC: marine function
limited national co-
PRC: legislation that
Devlopment of
H
Create regional
H Agreement on regional
H
3
ROK- only general laws on
s and
ment
management plan for
government coordination. guideline for management zoning and sea area use ordination
addresses several aspects, management plan for
mechanism for
guideline for management
coastal habitat protection exist,
regulatio
critical habitats
Create regional
of critical coastal habitats plan. ROK: limited to
ROK: ongoing legislation critical habitats
coorperation
of critical coastal habitats
special committee are formed
ns of
mechanism for
specific areas
for MPAs but not critical
for critical issues. PRC - lack of
2007
coorperation
habitats
methodology for assessing
critical habitats
Act. 2) Strict limits on
Create national
national laws on coastal
PRC: a national plan in
Responsible agencies:
ROK - Several relevant
Restriction on new coastal ROK:H Create national
H national legislation on
H
3
PRC - national coastal
new coastal reclamation mechanisms to coordinate habitat management
consideration, ROK: a
PRC: SOA & Ministry of
laws to minimize further
reclamation according to
PRC: M mechanisms to corrdinate
coastal habitat
reclaimation plan in
between government
national plan in
Land resources. ROK -
reclaimation,
curent government plans
between government
management
consideration, increase
agencies
consideration.
MOMAF and others
PRC: Law on the
agencies
demand from coastal economy
Administration of the use
devlopment. ROK: increase in
of Sea Areas
land use
Habitat Maintain Regional Act. 3) Encourage and
Establish regional and
Develop policies and
PRC: limited, ROK: some Environmental awareness Comprehensive guidelines Encourage and strengthen
H
Establish regional and
H Develop policies and
H
4
As above
strengthen public
national mechanisms for
incentives to enhance
active involvement of
and educational
and regulations for the
public involvement in the
national mechanism for
incentives to enhance
loss and current Guideline involvement in the action strengthen awareness and public involvement
NGOs
programms exist. ROK:
public involvement
action plans: all sectors,
environmental awareness
public involvement
degrada habitats
s for
plans: all sectors,
compiliance by local
Govermental support for
including NGOs
and educational
tion
accordin Coastal including NGOs
government to the regional
educational programme
programms
g to
Habitat
guideline
development
standard Manage Act. 4) Assessment of Strengthen national
Clear national and regional PRC: preliminary cases,
Limited national co-
ROK: Law on the
Assessment of ecosystem PRC: M Strengthen national
M Clear national and regional M
3
Methodology is still being
s and
ment
ecosystem services from mechanisms to co-ordinate guidelines on assessment ROK: preliminary cases
ordination between
prevention of marine
services from well
ROK: H mechanisms to co-ordinate
guidelines on assessment
developed
regulatio
well managed critical
between government
government agencies and pollution and several
managed critical habitat.
between government
ns of
habitats
agencies and stakeholders
stakeholders
relevant laws. PRC:
agencies and stakeholders
2007
Legislation on EIA
Biodiversity Management Action
Analysis of Planned &
Problem
Ideal Management Action
Feasible Management Actions by 2020
Technic
Regional
On-going Management Actions
s
General
al
target
Feas
Feas
Remark
identifie
action
Feasibili
Feasibili
(2020)
Technical
Institutional
Legislative
Technical
Institutional
Legislative
Technical
Institutional
ibilit
Legislative
ibilit
d in CCA
ty
ty
y
y
Promote Act. 5) Integrate
Establish mechanism to
Agreement on sharing
plan in consideration
Project data are available
Integrated management of
H
Establish mechanism to
H
4
the use management actions of integrate and sharing of data among components
in National reports
different components to
integrate and sharing of
of MPAs different project
data among components,
sustain social-economic
data among components,
components to sustain
demonstration project(s)
development:
demonstration project(s)
social-economic
demonstration
development:
demonstration**
Act. 1) Establishment of Create regional
Strengthen National
PRC: comprehensive plan PRC: SOA & other
PRC: national legislation Establishment of new
H
Create regional
H Agreement on regional
H
4
Already plans for new MPAs
more nature reserves at mechanism for
legislation. Establish
for new MPAs, ROK:
agencies ROK:
on MPAs exist, nature reserves. Establish
mechanism for
guidelines for MPAs
national level. Establish a coorperation.
regional guidelines on
comprehensive plan for
National mechanism to co- ROK: National laws exist
a representative network
coorperation. Encourage
representative network of Establishment of MPA
MPAs.
new MPAs
ordinate among
of MPAs
information exchange with
MPAs
network for information
governments, Institute
in network.
exchange.
and stakeholders including
NGOs
Act. 2) Better
Create national
Strengthen enforcement of Several Reserves/MPAs
National mechanism to co- PRC: national regulations Better management of
H
Create national
H ROK: Strengthen national
H
4
Plans exist to strengthen
management of nature
mechanisms to corrdinate national regulations on
ordinate among
on nature reserves nature reserves
mechanisms to coordinate
laws on MPAs PRC:
laws/regulations on MPAs
reserves
between government
nature reserves
governments, Institute
ROK: National laws
between government
Strengthen National
agencies (incl. capacity
and stakeholders including
agencies
regulations on MPAs
building, sustained
NGOs.
funding).
Act. 3) Reduce pollution Refer to Pollution Group
Refer to Pollution Group
Refer to Pollution Group
Refer to Pollution Group
Refer to Pollution Group
Reduce pollution in and
H
See pollution component
See pollution component
3
Plans exist to reduce total
in and around critical
around critical habitats
pollution load, some worry on
habitats (Refer to
(Refer to Pollution Group)
the effectiveness of such
Pollution Group)
regulations (refer to Pollution
Component)
Act. 4) Encourage and
Establish regional and
Develop policies and
PRC: limited, ROK: some Environmental awareness Comprehensive guidelines Encourage and strengthen
H
Improve environmental
H Develop policies and
H
4
As above
strengthen public
national mechanism for
incentives to enhance
involvement of NGOs
and educational
and regulations for the
public involvement in the
awareness and
incentives to enhance
involvement in the action environmental awareness public involvement
programms exist. ROK:
public involvement
action plans: all sectors,
educational programms
public involvement
plans: all sectors,
and educational
Govermental support for
including NGOs
including NGOs
programms
educational programme
development
Act. 5) Assess
Establish regional and
Clear regional guidelines PRC: Plan in consideration PRC: SOA
PRC: Legislation under
Assess management
H
Establish regional co-
H Clear regional guidelines
H
4
Knowledge and techniques
management
national co-operative
on assessement
ROK: Some surveys in
ROK: Some Coordination consideration effectiveness of MPAs
operative mechanism to
on assessement
available (but under
effectiveness of MPAs
mechanism to share
MPAs
between Local and
ROK: Laws recommending
share information
development in PRC)
information
National Governments
assessment
Reduce Ballast
Control and monitoring of Regional mechanism for
International/regional
PRC: yes, ROK: Ongoing PRC: Bureau of Maritime International/regional
Control and monitoring of
H
Regional mechanism for
H Improved Enforcement of
H
3
At present only Canada has
risk from water
ballast water discharge
cooperation and national agreement and national
project to develop
Affairs, ROK: MOMAF
agreement and national
ballast water discharge
coorperation and national
International regulations
monitoring, control is easy.
introduce control
(including treatment)
mechanism for
legislations
treatment tech and
legislations
(Including treatment)
mechanism for
Treatment is difficult
d spp.
coordination
efficient monitoring
coordination
method
Control Precautionary
Mechanism to conduct risk Strengthen legislation on PRC: preliminary risk
PRC: MOA, Ministry of
legislation on species
Precautionary introduction
H
Mechanism to conduct risk H Strengthen legislation on
H
3
Difficulty in methodology and
of
introduction and strict
assessment
species introductions
assessment procedures
Commerce and Trade &
introduction & quarantine
and strict control once
assessment
species introduction
increased demand for more
introduce control once introduced
have been developed,
Ministry of Forestry. ROK:
introduced
species for culture
d spp.
ROK: ongoing project to
MOMAF& ME.
assess and control
introduced spp. (MOMAF).
Development of integrated
management plan to
assess ecosystem risk
from Introduced spp.
** Internal project guidline
Problems
"Problem
Regional
General action
Analysis of Planned &
Demo
Ideal Management Action
Feasible Management Actions by 2020
identified in CCA
Issue"
target (2020)
On-going Management Actions
acts
Technical
Remark
Feasibility
Technical
Institutional
Legislative
Technical
Institutional
Legislative
Technical
Institutional
Legislative
Ecosystem
better
Assess and
harmonise
Establish
develop a
countries have no cross-basin non-harmonised harmonise Establish cross- harmonise
4 existing
3
changes (lower
understandin monitor the
monitoring
cross-basin
regional
different
monitoring
existing national monitoring basin
national
national
trophic level and
g and
impact of
methodologie monitoring
protocol for
sampling
network due to protocol
methodolo monitoring
protocol for
monitoring
benthos)
prediction of N/P/Si ratio
s and assess network &
marine
methods and
lack of co-
between
gies and
network &
marine survey &
networks
ecosystem
change
imapcts
implement
survey &
timing; regular ordination
countries for
assessme implement
monitoring;
changes for
monitoring
monitoring;
surveys only
among different marine survey & nt of
monitoring
develop
adaptive
activities
develop
cover limited
agencies
monitoring
impacts
activities
regional
management
regional
area; not
framework to
framework to designed to
incorporate the
incorporate
reveal basin-
assessment into
the
scale changes;
management
assessment limited
policy
into
assessments
management
policy
Assess and
develop and/ Establish
develop a
ditto
no basin-scale non-harmonised develop
Establish basin- harmonise
3 national
2
monitor the
or harmonise basin-scale
regional
monitoring
existing national and/ or
scale
national
monitoring
impact of
monitoring
monitoring
protocol for
network due to protocol
harmonise monitoring
protocol for
network
climate
methodologie network &
marine
lack of co-
between
monitoring network &
marine survey &
exists, but
change
s and assess implement
survey &
ordination
countries for
methodolo implement
monitoring;
limited
impacts
monitoring
monitoring;
among different marine survey & gies and
monitoring
develop
geographical
activities
develop
agencies;
monitoring; no
assessme activities;
regional
scope &
regional
insufficient
regional protocol nt of
convince
framework to
variables
framework to
national
exists
impacts
relevant
incorporate the
incorporate
programmes to
government
assessment into
the
train and
agencies to
management
assessment
support
increase
policy
into
taxonomists
investment on
management
taxonomical
policy
research
Predict
develop
establish
develop
no
no regional body no existing
develop
establish
develop
4 basic
ecosystem
comprehensi regional
framework to comprehensive, to co-ordinate
framework to
comprehen regional
framework to
modelling
change in the ve models to science
incorporate
co-ordinated
modelling
incorporate
sive
science
incorporate the
technology
long run
predict
committee to the prediction modelling
activities
prediction into
models to committee to
prediction into
exist
ecosystem
co-ordinate
into
management
predict
co-ordinate
management
change and modelling
management
policy
ecosystem modelling
policy
its impact on activities
policy;
change
activities
fisheries
develop
and its
regional
impact on
framework to
fisheries
incorporate
the
assessment
into
management
policy
Problems
"Problem
Regional
General action
Analysis of Planned &
Demo
Ideal Management Action
Feasible Management Actions by 2020
identified in CCA
Issue"
target (2020)
On-going Management Actions
acts
Technical
Remark
Feasibility
Technical
Institutional
Legislative
Technical
Institutional
Legislative
Technical
Institutional
Legislative
Monitor the
develop nat'l Establish
not relevant
no common
no international not relevant
develop
Establish
not relevant
4 Kor - has
1
tranboundary and reg'l
international
monitoring
monitoring
nat'l and
international
monitoring
impact of
monitoring
monitoring
methodologies network
reg'l
monitoring
programmes;
jellyfish
methodologie network
monitoring network
CHN -
blooms
s
methodolo
increasing
gies
damage; int'l
interest is high
Monitor HAB improve
establish
develop
monitoring
no regional HAB no existing
improve
establish
develop
4 on-going
occurrences
capability in regional HAB regional
programmes
committee
regional
capability regional HAB regional
monitoring
HAB
committee to framework to only at national
framework to
in HAB
committee to
framework to
network;
monitoring,
co-ordinate
incorporate
level and
incorporate
monitoring co-ordinate
incorporate the
serious
prediction
assessment the
scattered
assessment into and
assessment
assessment into
transboundary
and
activities
assessment among
management
mitigation activities
management
issue
mitigation
into
responsible
policy
policy
management agencies
policy
establish
Refer to
Refer to
Refer to
Refer to RWG-I Refer to RWG-I Refer to RWG-I Refer to
Refer to RWG- Refer to RWG-I
4 DB under
Yellow Sea
RWG-I
RWG-I
RWG-I
RWG-I
I
construction
ecosystem
database
Increased
See Nitrogen < 5 events
See Nitrogen See Nitrogen See Nitrogen See Nitrogen See Nitrogen
See Nitrogen
See Nitrogen
See
See Nitrogen See Nitrogen
Refer
Refer RWG-P
frequency of
enrichment (late 1980s
enrichment
enrichment
enrichment
enrichment
enrichment and enrichment and enrichment and Nitrogen
enrichment and enrichment and RWG-P
HABs
and
condition)
and
and
and
and
eutrophication
eutrophication
eutrophication
enrichment eutrophication eutrophication
eutrophicatio (HAB
eutrophication eutrophicatio eutrophicatio eutrophicatio
and
n
inlcudes high
n
n
n
eutrophicat
biomass
ion
algal bloom)
"Problem
Regional
Ideal Management Action
Analysis of Planned &
Feasible Management Actions by 2020
Technical
General action
Remark
Issue"
target (2020)
Technical
Institutional
Legislative
Technical
Institutional
Legislative
Technical
Institutional
Legislative
Feasibility
regular monitoring of
establish regional
develop new
monitoring
management of input
national/regional
continue monitoring
set up a mechanism
mandatory review of
4 nat'l monitoring
major pollutant sources, monitoring network,
regulation and strict
programmes only at
sources and sharing of
review of pollution-
programmes nationally,
for agreements and
environmental quality
programmes already
including atmospheric
and sharing of
enforcement based on national level and
information not well co-
related conventions
implement regional
methodology to share standards every 5 years
exist; both countries
deposition; establish
monitoring data
existing laws or newly scattered among
ordinated
(reg'l GA)
monitoring programme;
monitoring results
already signatories to
regional QA/QC
among all agencies
developed standards responsible agencies
regional workshop every
int'l conventions listed
guidelines for monitoring
in each country
5years, majoring in
monitoring technology,
parameters, assessment on
status and trends, main
problems, etc. with the
monitoring centers and
organisations
identification and annual improved co-operation develop new
"hot spot" of river
CH - total quantity-based regulations exist, but establish diagnostic strategy regional forum for
harmonise existing
3 necessary, but
review of "hot spots"
among agencies for
regulation for pollutant discharge identified in watershed management are limited
for sources and sinks
integrated review on
regulation
capacity to do so is
Action 1.1 Monitoring (sources and sinks)
the intensive
loading from hot spots Poll. Regional
plans; KOR has co-
hot spots; improve
currently limited
and assessment
monitoring of hotspots
Synthesis
operation among
national co-ordination
agencies dealing with
of contaminant control
1.Meet
hotspots
through regular IMCC
requirements
meetings
in Codex
develop regional
establish coordination harmonise regional
national
assessments exist, but
National legislation
develop regional
establish coordination not relevant
3 necessary, but
alimentarius /
methodologies for
mechanism for the
protocol
methodologies exist
not well co-ordinated
exist but not
methodologies for
mechanism for the
capacity to do so is
Stockholm
assessment of status &
assessment of
for marine pollution
among different agencies harmonised
assessment of status &
assessment of
currently limited
Convention /
trends of contaminants in contaminants and
assessment. No
trends of contaminants in
contaminants and
MARPOL
water, sediment and
sharing of
regional agreed
water, sediment and
sharing of
organisms; introduce
ecotoxicological data
methods.
organisms; introduce
ecotoxicological data
assessment using agreed
assessment using agreed
methodologies to ensure
methodologies to ensure
agreed pollution targets
agreed pollution targets are
are met
met
Action 1.2 Control of install facilities/equipment establish intensive
improve enforcement control with existing
CH - pollutant discharge national control
update facilities/equipment establish intensive
harmonise national with
3 need more funding,
contaminants
to control or reduce
monitoring and
& legislation
standards
limits don't include all toxic standards exist
to control or reduce
monitoring and
international requirements
technology, policy
discharge
discharge from industrial inspection system for
contaminants; incentives
discharge from industrial
inspection system for of discharge
and municipal sources
all agencies; establish
given for self control of
and municipal sources;
all agencies; establish
mechanism to
pollutant loading; KOR -
regional monitoring and
mechanism to
promote best available
incentives given for self
assessment of contaminant promote best available
techniques and best
control of pollutant loading
sources and fate
techniques and best
environmental
environmental
practices for related
practices for related
land and sea-based
land and sea-based
industries
industries
routine monitoring of
national ministries co- establishing bylaws to marine environmental Weak national co-
National legislation
routine monitoring of major Enhance national co- harmonise existing
4 scientific research
major input sources and operate with each
meet the target
monitoring
ordination mechanism; no exist, but is disjointed input sources and loads;
ordination mechanism regulation among relevant
already initiated
loads
other and have
programmes exist
data and information
data and information
national regulatory bodies;
regular discussions;
nationally, but limited exchange mechanism
exchange; expand research
annual review that target
ministerial level
understanding of N
on atmospheric deposition
will be met for each current
regional cooperative
transfer from
5 yr period
mechanism to have
atmosphere to YS
regular discussions
implement research on
establish regional
establish total-quantity- limited understanding weak national co-
CH - insufficiently
calculation of loads in hot
establish regional
incorporate total loading
3 scientists have
environmental capacity
workshop to discuss
control regulation
of environmental
ordination mechanism
detailed laws
spot area
workshop to discuss
control programme in
different opinion on
for nutrient assimilation
and improve
capacity of YS for
addressing total
and improve
national development
how to calculate loads
understanding of envtl
nutrient assimilation
loading control; KOR -
understanding of envtl plans
capacity
total loading control
capacity
law & regulation exist
for major rivers
increase treatment
establish co-ordination legalise annual check China: national plan to weak co-ordinating
China: regulation and Review the current waste
establish co-ordination improve laws and
4 already happening in
capacity to reduce
between government for targets being met
reduce N 10% in 5
mechanism in place
plans for control of
treatment facilities; provide between government regulations on clean
many places
discharge according to
agencies
years plan, Korea has
discharge, Korea has recommendation for
agencies
production, recycling use,
environmental capacity
strict regulation to
strict regulation to
facility's future development
etc
Action 2.1 Control of
control N discharge
control N discharge
every 5 years, promoting
total loading
clean production and
2. Reduction
recycling use, improving
of total
treatment system and
loading from
capacity, new treatment
point sources
plant construction
from 2006
"Problem
Regional
Ideal Management Action
Analysis of Planned &
Feasible Management Actions by 2020
Technical
General action
Remark
Issue"
target (2020)
Technical
Institutional
Legislative
Technical
Institutional
Legislative
Technical
Institutional
Legislative
Feasibility
from 2006
implement best practice promote mechansim enact law and
some monitoring on weak mechansim to
weak law and
monitoring and
implement
strengthen
4 some monitoring
levels (China
use of fertiliser
to implement eco-
regulations to
fertiliser use
implement eco-friendly regulations to
assessment; technical
mechanism to
law/regulations to
already in place
will reduce
total N loading
friendly agriculture
encourage eco-
agriculture
encourage eco-
recommendations on
encourage use of
encourage eco-
from point
agriculture
agriculture
better fertiliser use
organic fertilisers
agriculture and organic
sources 10%
fertiliser use
from 2006-
reduce loading from sea establish co-
initiate
KOR - current efforts monitoring programmes weakly co-ordinated monitoring and
establish co-
initiate environmental-
3 necessary, but
2010)
based source
ordination between environmental-target- in dredging to
weakly co-ordinated
laws and regulation assessment of sea based ordination between target-control regulation
contribution from sea-
government
control regulation
remove polluted
among responsible
sources; practice of
government
based sources is
agencies on
sediments; CH -
agencies; no data
sustainable mariculture; agencies on
lower than land-
monitoring and
limited action in this sharing mechanism
dredge to remove polluted monitoring and
based sources,
information
area
sediments
information
difficult to monitor
exchange
exchange
and assess
Action 2.2 New
use existing or construct establish co-
legislation to
CH - wetlands used limited co-ordinating
Korea - no further
use existing or construct establish co-
legislation to promote
3 need funding and
approach for
additional wetlands to ordination between promote sustainable as N sink
mechanism among
coastal land
additional wetlands to
ordination between sustainable utilization of
technology to
treatment of nutrients serve as nutrient sink
government
utilization of wetland demonstration; KOR -marine, wetland,
reclamation allowed; serve as nutrient sink
government
wetland
maintain wetland
agencies on
many artificial
wastewater treatment
weakly co-ordinated
agencies on
monitoring and
wetlands constructed agencies
laws and regulation
monitoring and
information
for use as nutrient
information
exchange
sink
exchange
N:Si.
Action 2.3 Monitoring
4 existing national
Decrease
and assessment on
monitoring networks
N,
N:P:Si (refer N
Increase
loading actions above
Si
and RWG-E actions
on this issue)
Action 3.1 Waste
Implement technologies provide more funding complete compliance Continuous
implement industry
weak regulation and Implement technologies provide more funding more regular and stricter
3 technology exists,
reduction
for waste reduction, re- opportunities for
with waste
execution of ocean policy and encourage
policy to support
for waste reduction, re-
opportunities for
enforcement of marine
but needs higher
use, recovery, and
recycling enterprises management laws
waste collection
and facilitate adequate ocean waste reuse use, recovery, and
recycling enterprises litter laws; improved
level of stakeholder
disposal
and regulations;
project
funding for control of
enterprises
disposal
compliance with waste
environmental
harmonise with int'l
solid pollutants,
management laws and
awareness
conventions
including litter in rivers
regulations; harmonise
with int'l conventions
develop regional
establish co-
establish clear
monitoring
weak co-ordination at
some regulations,
develop and implement
establish co-
establish clear national &
4 NOWPAP's regional
3. Reduced
monitoring programme operative
national & regional programmes only at national level for
but not well co-
regional monitoring
operative
regional guidelines on
programme includes
standing
mechanism to share guidelines on marine national level
monitoring; NOWPAP
ordinated
programme
mechanism to share marine litter monitoring
YS region
stock of litter
data on marine litter litter monitoring and
has established regional
data on marine litter and assessment
from current
assessment
programme on marine
level
litter
(Increase
cleaning of marine litter develop operational establish relevant
youth awareness
limited approaches for some regulations,
cleaning of marine litter in develop operational establish relevant
3 difficult to clean from
public
in YS
approach for litter
regulations and acts programs (e.g.
litter removal
but not well co-
YS coastal waters
approach for litter
regulations and acts
waters, but easy on
awareness;
removal
beach cleanup, envt'l
ordinated
removal
land
periodic clean Action 3.2 Marine
ups)
education) taking
litter cleaning
place in some areas
Develop & implement
formalise
establish relevant
limited envt.
KOR - NGOs have
some regulations
Develop & implement
mainstream
establish relevant
4 already happening in
regular environmental environmental
regulations and acts awareness and
strong awareness
exist
regular environmental
environmental
regulations and acts
KOR elementary
awareness and
awareness and
education
programmes,
awareness and education awareness and
schools, other
education programmes education
programmes
elementary schools
programmes
education
activites already
programmes into
have environment
programmes into
happening in the
national plans
education classes; CH -
national plans
region
some programmes
bathing
4. Reduce
4.1 Reduce to
regular monitoring of
government-issued enforce monitoring of national monitoring CH - local government- guidelines exist for regular monitoring of
government-issued enforce monitoring of
4 some programmes
beaches & contaminants, nationally acceptable recreational waters;
announcement to
recreational waters; programmes exist
issued advisories to
bathing beach water recreational waters;
announcement to
recreational waters;
already happening in
other
particularly in
& WHO levels
information
public about beach legalisation of
public about beach
quality
information dissemination public about beach legalisation of closure of
the region
recreation bathing
dissemination of
closures; co-share
closure of sub-
closures in some areas;
of monitoring results
closures; co-share
sub-standard
al waters
beaches and
monitoring results
monitoring
standard
KOR - central govt
monitoring
recreational waters
other marine
programmes among recreational waters
advisories issued in
programmes among
recreational
agencies
bathing beaches
agencies
waters, to
nationally
acceptable
levels