
Mekong River Commission Secretariat
Flood situation report
August, 2008
MRC Technical Paper
No. 21
September 2008
Meeting the Needs, Keeping the Balance
Mekong River Commission Secretariat
Flood situation report, August 2008
MRC Technical Paper
No. 21
1st September 2008
Published in Vientiane, Lao PDR, in September 2008 by the Mekong River Commission
Cite this document as: MRC (2008) Flood situation report, August 2008. MRC Technical
Paper No 21, Mekong River Commission, Vientiane. 20 pp.
The opinions and interpretation expressed within are those of the authors and do not necessarily
reflect the views of the Mekong River Commission.
Author: Peter Adamson
Contributors: Tien Truong Hong, Janejira Tospornsampan, Chusit Apirumanekul, and Christoph Mor
Graphic design: Tim Burnhill
Photographs: Stanislas Fradelizi, www.laophoto.com
© Mekong River Commission
184 Fa Ngoum Road, Unit 18, Ban Sithane Neua, Sikhottabong District,
Vientiane 01000, Lao PDR
Telephone: (856-21) 263 263 Facsimile: (856-21) 263 264
E-mail: mrcs@mrcmekong.org
Website: www.mrcmekong.org
ii
Contents
1.
Summary
1
2.
Meteorological conditions
3
3.
Water levels
5
4.
Flood discharges
6
5.
Flood volumes
7
6.
The role of the mainstream dams in China on the events of August 2008
8
7.
Risk of occurrence
10
8.
Prospects for the rest of the 2008 flood season
10
9.
Damage
13
10. Performance of the RFMMC flood forecasting
15
11. Lessons learnt and recommendations
16
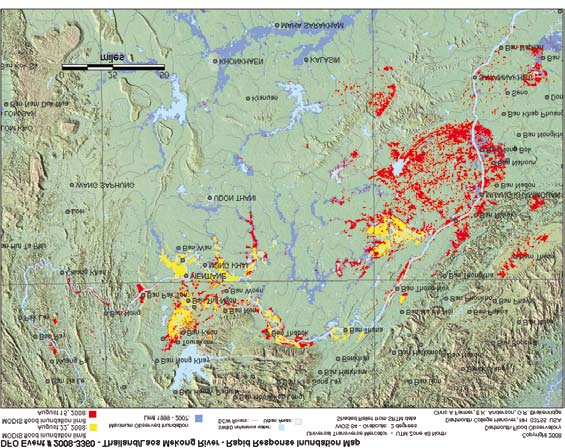
MODIS ood inundation limit August 22. 2008
Maximum observed inundation 1999 - 2007
MODIS ood inundation limit August 15. 2008
SWBD reference water
Figure 1.
Flood extent maps in the Vientiane to Savannaketh reach for 15th and 22nd August 2008.
(Source: G. Robert Brakenridge, Dartmouth Flood Observatory, Dartmouth College,
USA.)
iii
Upper Mekong Basin
China
Lower Mekong Basin
Manwan
Operational mainstream dams
Dachaoshan
Hydrological station
Jinghong
Myanmar
Man An
Viet Nam
Chiang Saen
Lao PDR
Luang Prabang
Chiang Khan
Vientiane
Nakhon Phanom
Nong Khai
Mukdahan
Savannakhet
Thailand
Khong Chiam
Pakse
Cambodia
Stung Treng
Kratie
Prek Kdam
Kampong Cham
Phnom Penh Port
Bassac Chaktomouk
Neak Luong
Koh Khel
Chau Doc
Tan Chau
0
200 kilometres
Figure 2.
Locations referred to in the text.
iv
1. Summary
During the second week of August 2008, flood water levels in the Mekong Basin reached
extreme levels, particularly at Luang Prabang, Vientiane and Nong Khai. The flood resulted
from tropical storm Kammuri that tracked westwards across northern Lao PDR and southern
Yunnan on the 8th, 9th and 10th of the month. Generally this produced 100 150 mm of rainfall,
though locally figures were as high as 250 mm. Catchments were already saturated as a result of
strong monsoonal conditions during May, June, and July, with the consequence that flood runoff
was maximised.
Flood water levels at Chiang Saen and Luang Prabang were such that large areas were
inundated, and it was only as a result of effective action by the authorities that the city centres
of Vientiane and Nong Khai were generally protected from inundation. Although water levels at
Vientiane (specifically at the stream gauge at Kilometre 4) were 1 m higher than in 1966, when
the city centre was flooded, the peak discharges were of the same order. These higher water
levels for similar discharge conditions are explained by the raising of flood protection levees
on both banks of the river after the 1966 event, and the resulting containment of the flood flow
within the channel.
At most locations along the mainstream, levels reached at least the alarm stage, and in the
Delta water levels remained above the alarm stage on 2nd September1. The flood runoff was
almost entirely generated in the area between Jinghong and Luang Prabang, and as a result the
most critical flood conditions occurred in the upstream reaches. Nevertheless, the continuing
strong SW Monsoon and significantly above-average seasonal rainfalls resulted in water levels
remaining very high in the middle reaches of the basin. With at least six to eight weeks of the
flood season remaining, and the peak of the cyclone season still to come, the flood situation
remains critical. Though water levels have decreased somewhat, continuing storms have not
seen them decrease to levels that provide acceptable factors of safety. The region remains
highly vulnerable to the impacts of additional tropical storms tracking across the basin during
the remainder of the season.
Analysis of the available storage behind the three dams currently operational on the Mekong
mainstream in Yunnan reveals this to be insignificant compared to the volumes of runoff that
occurred during the course of the flood. Any releases from these dams would have played
no role in the conditions that developed, which were the result of natural meteorological and
hydrological circumstances.
The August 2008 event was the first regional flood episode for which the RFMMC provided
forecasting services, on the whole results were encouraging. However, lessons to be learnt
include:
1 Alarm levels are always reached at Chao Doc and Tan Chao.
Page 1
Flood situation report August 2008
· Forecast rainfall data and resulting predicted tributary runoff tend to cause substantial
oscillations in the forecasted water levels from day to day. `Learning algorithms'
incorporated within the model could refine and dampen flood forecasts as the event
evolves.
· The performance of the forecasting underscored data deficiencies and the poor
understanding of the flood hydrology of the major tributaries in the Lao PDR north of
Luang Prabang. Here, calibration of the hydrological component of the overall model
needs to be addressed.
· However, even given these limitations regarding the data, the forecast given on 10th
August for Vientiane correctly indicated that the flood level would be exceeded.
Furthermore, the maximum flood level in Vientiane was forecast on the 13th August to
within 20 cm of that actually observed two days later on the 15th.
· Hydrometric data supplied by China under the agreement with the MRC proved to be
extremely important, as it provides a solid starting point for the flood routing on the
mainstream. However, this information is not yet used to its full potential. Respective
parts of the forecasting model require review and improvement.
· At least three-hourly updates of water levels from the AHNIP (Appropriate Hydrological
Improvement Project) and HYCOS (Hydrological Cycle Observation System) stations
are required. Data loggers can be placed in an automatic one- to three-hourly automatic
transmission mode during the critical flood season.
· Following the event a systematic review of the performance of the flood forecasting
technology in the Mekong Basin, both hydrologically and statistically, will be conducted.
· In the short term, institutional arrangements to disseminate MRC forecasts and early
warning need to be reviewed, in terms of their usefulness for counterpart agencies, their
distribution channels and comprehensive coverage of recipients.
Page 2
Flood situation report August 2008
2. Meteorological conditions
Tropical storm Kammuri struck southern China on the 6th August and moved west into northern
Viet Nam and on into northern Lao PDR and southern Yunnan over the following days (Figure 3).
Upper Mekong Basin
Lower Mekong Basin
Manwan
Operational mainstream dams
Dachaoshan
Hydrological station
Jinghong
Path of Tropical Storm Kam
Viet Nam
muri
Chiang Saen
Lao PDR
Luang Prabang
Vientiane
Mukdahan
Thailand
Pakse
Bangkok
Cambodia
Kratie
Phnom Penh
Ho Chi Minh City
Chau Doc
Tan Chau
0
200 kilometres
Figure 3.
Track of tropical storm Kammuri -- first week of August, 2008. (Map based upon data
obtained from the Hong Kong Meteorological Bureau http://weather.gov.hk )
As it moved into the Mekong Basin, the major areas of associated storm rainfall lay in northern
Lao PDR and southern Yunnan (Figure 4):
· In the Lao PDR most rainfall occurred upstream of Luang Prabang. Accumulated rainfall
over the nine days between the 6th and 14th August was generally between 100 and
150 mm, though locally these recorded figures were as high as 200 250 mm.
Page 3
Flood situation report August 2008
· In Yunnan the cumulative rainfall was similar and generally confined to the extreme
south, downstream of Jinghong.
Upper Mekong Basin
Lower Mekong Basin
Mekong mainstream
Hanoi
Vientiane
Cumulative rainfall (mm)
0-5
5-10
Bangkok
10-20
20-40
40-60
60-80
Phnom Penh
80-100
100-150
Ho Chi Minh City
150-200
200-250
250-300
300-350
350-400
> 400
0
200 kilometres
Figure 4.
Accumulated rainfall over the Mekong Region: 6th 14th August 2008 (based on data
provided on a daily basis by the United States National Oceanic and Atmospheric
Administration to the MRC).
Page 4
Flood situation report August 2008
These areas therefore generated virtually all of the consequent flood runoff. Elsewhere in the
lower basin the rainfall was much more scattered and not directly linked to Kammuri. However,
some central and southern areas did receive up to 150 mm over the same period. The 2008
monsoon has so far produced considerable amounts of rainfall over the basin as a whole since
its onset in early May. These conditions have led to saturated catchments throughout the basin
(Figure 5) and therefore flood runoff from tropical storms such as Kammuri was at a maximum.
1-10 August 2008
Percent soil moisture (%)
90 - 100
80 - 90
70 - 80
60 - 70
50 - 60
40 - 50
30 - 40
20 - 30
10 - 20
0 - 10
no data
Figure 5.
Regional soil moisture conditions during early August 2008, indicating that catchments
were saturated. This would have maximised the flood runoff that resulted from tropical
storm Kammuri. (Source: USDA, http://gcmd.nasa.gov/records/GCMD_USDA_FAS_
Percent_Soil _Moisture.html.)
This year, 2008, is a strong La Nińa year, during which there is the probability of a more
intense SW Monsoon over SE Asia. The above-average regional rainfall thus far in 2008 tends
to confirm this link. La Nińa conditions are also associated with a higher frequency of tropical
storm formation in the Western Pacific.
3. Water levels
The water level at reached Vientiane on the 15th of August was the highest recorded since
records began in 1913. At 13.7 m above the gauge datum, it was 1 m more than the maximum
levels achieved in 1966, 1971 and 2002 (Table 1).
Page 5
Flood situation report August 2008
Table 1. Comparative maximum historical flood water levels at Chiang Saen,
Vientiane and Mukdahan.
Year
Maximum water level achieved above gauge datum (m)
Chiang Saen
Vientiane2
Mukdahan
1924
No data
12.7
No data
1929
..
12.4
..
1942
..
12.2
..
1966
13.8
12.7
13.6
1970
9.8
12.2
13.2
1971
11.0
12.5
12.5
2002
10.4
12.6
12.3
2008
10.6
13.7
12.7
2 Levels recorded at the river gauge at Kilometre 4.
Upstream at Chiang Saen and downstream at Mukdahan, the August 2008 maximum water
levels were lower than those experienced in 1966, being over 3 m lower at Chiang Saen. This
reveals that the situation in 1966 was somewhat different to that in 2008. In September 1966
tropical storm Phyllis tracked further north than did Kammuri in 2008. So while most of the
floodwater in 1966 originated in Yunnan, in 2008, the origin of the floodwater was more or less
evenly split between China below Jinghong and the large left-bank tributaries in northern Lao
PDR.
It is worth noting that the rapid water level rise at Luang Prabang occurred one day before
water levels rose at Man An tributary station in China. This also strongly suggests that the flood
event was primarily caused by heavy rainfall in the basins of the Mekong tributaries in the north
of the Lao PDR.
At Mukdahan, the 2008 water levels were lower than in 1966 and 1970, indicating a
modest contribution from the central Lao tributaries and some attenuation of the August peak
downstream of Vientiane.
Water levels within the Cambodian floodplain and the Delta continued to increase and on the
25th August were 0.47 m above the alarm stage at Tan Chau and 0.26 m above it at Chau Doc.1
4. Flood discharges
The relationship between maximum water level and discharge achieved at Vientiane on the 15th
August is revealing when compared to those of 1966. Although the water level reached in 2008
was 1m higher than that of 1966, the discharge was slightly less. In 1966 peak flood discharge
was 26,000 cumecs, while that in 2008 was 23,500 cumecs. The explanation may lie with the
1 Alarm levels for Tan Chao and Chao Doc are always reached during the flood season.
Page 6
Flood situation report August 2008
flood protection works that were undertaken after 1966 on both the Thai and Lao banks of the
river, subsequent to the inundation of Vientiane, Si Chiang Mai and Nong Khai. These works
involved raising flood protection levees that contain the river within its channel up to
14 m above the gauge datum. This may explain why for a given discharge, water levels are now
higher while the river did not overtop the embankment as it did in 1966.
At Chiang Saen the maximum discharge reached on the 12th August was 13,300 cumecs,
which has only been exceeded three times (in 1966, 1970 and 1971) since records began in
1960.
Further downstream at Pakse and Kratie the peak discharges observed so far in 2008 have
been average. This confirms the fact that peak inflows from the large left-bank tributaries in the
Lao PDR downstream of Vientiane were not excessive, and that the Mekong flood of August
2008 was very much the result of meteorological and hydrological conditions in the northern
regions of the basin, upstream of Vientiane.
30000
1966
25000
2008
20000
cumecs)
ge (
15000
10000
Daily dischar
5000
0
J
F
M
A
M
J
J
A
S
O
N
D
Figure 6.
Comparative discharge hydrographs for the Vientiane Nong Khai reach of the
Mekong, for 1966 and 2008.
5. Flood volumes
Although the peak discharges downstream of Vientiane have so far in 2008 been average, the
flood volumes were, and remain, considerably above normal. This situation indicates that flood
runoff remains high, though to date there have been no individual storm events in the central
and southern areas of the basin that have generated excessive peak discharges. The importance
of assessing the flood volumes is that they are the best indicator of the potential duration of
inundation and the severity of flooding in the Cambodian floodplain and the Delta. In 2008
Page 7
Flood situation report August 2008
the flood season in the Lower Mekong Basin began during the first week of July, which is the
expected time of onset.1
· At Chiang Saen the volume of floodwater over the flood season from then to the
19th of August was 29 km3, which is average and indicates that flows out of China were
relatively low until the commencement of the August flood event.
· At Vientiane the equivalent figure is 64 km3, which is virtually the same as those during
the recent flood years of 2000 and 2001 in the Cambodian floodplain and the Delta. This
figure is much higher figure than that at Chiang Saen and indicates substantial early
season flood runoff from the left bank tributaries in northern Lao PDR. A volumetric
comparison with conditions in 1966 is not possible as that event did not occur until later
in the flood season, in the first week of September.
· By the 25th of August the total flood volume at Pakse and Kratie had tailed off to figures
significantly below those of 2000 and 2001.
· At Kratie the figure on the 25th of August was 150 km3, compared to 290 km3 in 2000
and 260 km3 in 2001. These figures confirm that flood runoff from the large tributaries
downstream of Vientiane has, so far in 2008, been modest and representative of that in an
average year.
Nonetheless water levels in the Cambodian floodplain and the Delta, specifically at Chau
Doc and Tan Chau, are such that the area remains vulnerable to flooding given the
oncoming peak of the cyclone season.
6. The role of the mainstream dams in China on the events of August 2008
The potential role of the three existing mainstream reservoir storages in Yunnan on the volume
and peak discharge of major floods in the northern areas of the Lower Mekong Basin is
insignificant. In other words, they do not have the capacity to materially modify natural flood
conditions.
Their combined active storage is less than 1 km3 (Table 2) and only a small portion of this
could be released practically. The effective drawdown releases would be very small compared
to the volumes of mainstream flood flow, and would be controlled by those from Jinghong, the
downstream dam in the cascade. The rates of release would also be minor compared to the peak
flood discharges.
1 The flood season is defined as the period of the year in which flows exceed the long-term mean annual discharge. This definition
permits the timing of the onset and end of the flood season to be compared from year to year.
Page 8
Flood situation report August 2008
Table 2. Active and gross storage volumes of the Mekong mainstream dams in Yunnan.
(Source: http://adb.org/Documents/Studies/Cumulative-Impact-Analysis/A3-Reservoir-
Hydropower-Data.pdf )
Dam
Gross Storage
Active Storage
km3
km3
Manwan
0.92
0.25
Dachaoshan
0.96
0.37
Jinghong
1.04
0.25
Total
2.92
0.87
In relation to the volumes of flood water that actually occurred during August 2008, any
releases from the reservoirs could not have been a significant factor in this natural flood event.
At Chiang Saen the flood peaked on the 12th, by which time the accumulated flood runoff for
the month had reached 8.5 km3, an order of magnitude greater than anything that could be
realistically released through reservoir drawdown. At Vientiane the flood peaked several days
later on the 15th, by which time the accumulated flood volume there from the beginning of the
month had reached 23 km3.
30
Peak level observed
Mekong at Vientiane
at Vientiane
)3
25
m
Mekong at Chiang Saen
Mekong at Jinghong
20
olume (k
ugust 2008 15
In ows from Lao and Thai
A
tributaries upstream of Vientiane
th
e ood runo v
t
o 19
st
10
1
In ows from tributaries in China and
C
umulativ
5
Myanmar downstream of Chinese dams
Contribution from catchment upstream of Chinese dams
0
Active storage volume of China dams(= 0.87 km3)
1
2
3
4
5
6
7
8
9 10 11 12 13 14 15 16 17 18 19
Date
(August 2008)
Figure 7.
Cumulative Mekong flood runoff volume (km3) between the 1st and 19th of August, 2008
at Chiang Saen and Vientiane, compared to the combined active storage of Manwan,
Dachaoshan and Jinghong reservoirs on the mainstream in Yunnan.
Page 9
Flood situation report August 2008
The flood was the result of natural meteorological and hydrological processes, with
approximately 50% of the overall volumes of floodwater entering the lower basin as flood
runoff from Yunnan (Figure 7). The rest of the floodwater that reached Vientiane and Nong
Khai was mainly contributed by the large left-bank tributaries in northern Lao PDR, such as the
Nam Tha, Nam Ou and Nam Khan.
7. Risk of occurrence
The statistical analysis of water levels to determine the annual risk of flood occurrence is
constrained by the fact that flood protection works have influenced historical levels, and
therefore do not a represent a consistent statistical sample. In terms of discharge, the flood of
August 2008 is estimated to have the following risk of occurrence:
Table 3. Estimated annual recurrence interval of the maximum discharge of
August 2008 (MRCS).
Station
Peak discharge
Annual recurrence interval
(cumecs)
Chiang Saen
13,300
1:5 years
Luang Prabang
23,100
1:30 years
Vientiane/Nong Khai
23,500
1:25 years
Pakse
35,000
1:2 years
Kratie
40,000
1:2 years
These figures confirm that the combination of the flood runoff from China with that from
the tributaries upstream of Luang Prabang, combined to produce a relatively extreme peak
discharge at Luang Prabang and at Vientiane. The peak discharge at Chiang Saen indicates that
the peak discharge from China was not significantly above average, while those downstream of
Vientiane were average due to the fact that flood runoff from the large tributaries in the central
and southern areas of the basin were not affected by tropical storm Kammuri.
8. Prospects for the rest of the 2008 flood season
Since basin-wide water levels remain high, rainfall conditions remain above normal, and the
peak of the cyclone and tropical storm season will not arrive until September and October,
the prospect of the onset of potential further critical flood conditions remains significant.
Regionally, tropical storm development is active.
Two intense systems were identified on the 27th August (Figure 8) to the NW and SE of the
Philippines. These were forecast to move north west and make landfall over southern China,
and significantly affected Hong Kong.
Page 10

Flood situation report August 2008
MTSAT-1R 2008 08 27 00:30 UTC
Image produced by Meteorological Services Division, NEA, Singapore
Figure 8.
Tropical storm activity over the Western Pacific on the 27th of August 2008.
(Source. Singapore Weather Information Portal www.weathe.gov.sg/wip/
web/ASMC/Satellite- imagary/Southeast_Asia /MTSAT-1r )
The development of further tropical storms is inevitable as the season progresses. The peak
seasonal incidence of tropical storms in the south of Viet Nam occurs in October (Figure 9).
35
30
June
y
ms
or 25
equenc
Viet Nam
opical st 20
Lao PDR
15
centage seasonal fr
yphoons and tr 10
Vientiane
P
er
of t
Thailand
5
0
J
F
M
A
M
J
J
A
S
O
N
D
Bangkok
Cambodia
Month
Phnom Penh
Ho Chi Minh City
Upper Mekong Basin
Lower Mekong Basin
December
Figure 9.
The seasonal percentage frequency and average seasonal tracks of typhoons and
tropical storms.
As the season progresses the storm systems moving westwards from the
South China Sea tend to make landfall progressively further south along
the coast of Viet Nam (based on data in Giang, L.T., 2005.)
Page 11
Flood situation report August 2008
As the season progresses their path westwards from the South China Sea and the Gulf of
Tonkin tends to move from north to south, though there are common exceptions to this general
pattern, as Kammuri proved. The average annual number of such events is five, though the
number can be as high as eighteen, as in 1964. The basin, particularly towards the south,
therefore remains vulnerable to the incursion of further storm systems, all the more so if water
levels remain as they currently are.
Although the flood levels at Vientiane and Nong Khai have fallen, history suggests that there
remains a significant probability that they will increase again before the end of the flood season.
By way of example, in Figure 10 water level trajectories are set out for the Vientinae Nong
Khai reach from the 19th August onwards for those years prior to 2008, during which water
levels in mid-August stood at 11 m or more above the gauge datum. Although water levels
can fall by as much as three metres by late August early September, history indicates that in
many years levels rise once again close to or in excess of the August flood level, and that these
conditions can occur as late as the last week of September.
Flood plain storage and the water levels of the Great Lake are slightly above average and
rising in response to the arrival of the floodwater from upstream (Figure 11). Since September
and October are likely to see the occurrence of tropical storms in these southern areas of the
basin, vigilance needs to be maintained. This vigilance is particularly important with regard to
tropical storm development in the Western Pacific, which, as Figure 6 shows, remains active.
15
14
Average levee level
13
Flood level
12
Alarm level
11
10
9
8
2008
v
el
7
Historic
er le
at
6
W ve gauge datum)
5
(m abo
4
3
2
1
0
J
F
M
A
M
J
J
A
S
O
N
D
Figure 10. Mekong at the Vientiane Nong Khai reach.
Daily water level trajectories from the 19th August onwards for those years prior to 2008
during which water levels in mid August were > 11 m above the gauge datum.
Page 12
Flood situation report August 2008
10
Tonle Sap at Prek Kdam
9
average, 1960-2004
8
2008 (to 25th August)
7
6
v
el
5
er le
at
W ve gauge datum) 4
3
(m abo
2
1
0
J
F
M
A
M
J
J
A
S
O
N
D
Figure 11.
Water levels in the Tonle Sap system in 2008 compared to their long term average.
9. Damage
It is very early to assess the damage caused by the event, but already the scale of losses is
apparent. Comprehensive damage assessments are being carried out, but preliminary accounts
indicate that the major impact of tropical storm Kammuri occurred in the northern provinces of
Viet Nam. News reports suggest that 120 people died and that 20,000 houses were damaged or
destroyed by floods, landslides and high winds.
According to the Interior Ministry in Thailand (reported by Reuters on the 18th August),
the flood was the worst in 100 years, claiming six lives, and causing damage estimated at
223 million baht (US$66.5 million) thus far in the country. Initial estimates suggest 92,000
households and 200,000 ha of agricultural land were directly affected.
In Lao PDR, on the 22nd of August the Vientiane Times published initial damage assessment.
The paper reports that damage in Luang Prabang province alone could be as high as 100
billion kip (US$12 million). Reported losses in Vientiane province are close to 148 billion
kip (US$17.5 million). Six deaths have since been reported. In Khammuan province alone,
the flood damage is initially assessed to be at least 31 billion kip (US$3.6 million). The floods
destroyed rice fields, irrigation systems, roads, and schools in the province. Almost 6,000
hectares of rice fields were damaged along with 167 hectares of other crops, 48 irrigation
systems, and 41 schools. In Borikhamxay province authorities estimate damage to the
agriculture sector is worth at least 90 billion kip (US$ 10 million). Road Number 13 South was
Page 13
Flood situation report August 2008
damaged, as were unpaved roads which had linked villages. It should be stressed that these are
preliminary assessments and the responsible authorities will release more detailed reports in due
course.
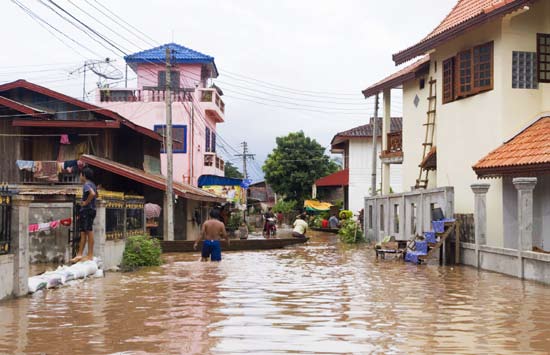
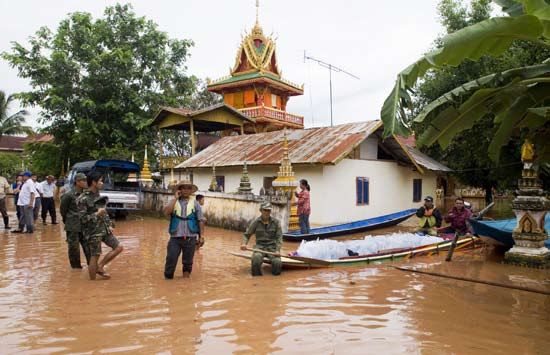
Figure 12. Flooding in Ban Kao Liao, Vientiane, 13th August 2008.
Page 14
Flood situation report August 2008
10. Performance of the RFMMC flood forecasting
The flood of August 2008 was centred within the upstream regions of the lower basin, with
significant further contributions of flood water from the far south of Yunnan. The major scrutiny
of the performance of the flood forecasting technology therefore lies with its ability to predict
water levels to an acceptable degree of accuracy in these areas of primary impact, and the
subsequent consequences further south as the floodwater moved downstream. The outputs
required are:
· The timing of water level increases and decreases and the potential duration of critical
periods above flood and warning levels, and;
· The water levels that are estimated to occur over time.
These temporal and quantitative aspects are combined by attempting to forecast the levels
over one to five day lead times using information on storm rainfall and catchment condition,
and then routing the estimated flood runoff downstream. Obviously, as lead time increases
accuracy reduces. Figure 13 shows the forecast accuracy of the predicted levels between Chiang
Saen and Chau Doc as the mean absolute error in metres between observed and predicted water
levels, over the period 19th July 22nd August 2008.
1.8
Forecast accuracy for one-day to ve-day lead times
1.6
between 19 July - 22 August 2008
1.4
1.2
r
or (m)
e er 1.0
0.8
ean absolut
M 0.6
5 day
0.4
4 day
3 day
0.2
2 day
1 day
0.0
t
han
hai
hek
het
or
hel
oc
rabang
dahan
Treng Kratie
uong dam
T
hanomhak
Vientiane
enh P
omouk
Koh K
T
Nong K
Muk vannak
Chau D
an Chau
Prek K
Chiang Saen Chiang K
hon P
Sa
Stung
Neak L
Luang P
Nak
K
Phnom P
ompong Chiam
Bassac Chakt
Figure 13. Forecast accuracy of the predicted levels between Chiang Saen and Chau Doc
over the period 19th July 22nd August, 2008.
The general picture that emerges is of significant more accurate forecasting for stations
downstream of Kompong Cham. This coincides with the fact that upstream of this station,
Page 15
Flood situation report August 2008
the errors and unknowns associated with the contributions of flood water to the mainstream
from the large left bank tributaries in the Lao PDR reduce accuracy. Downstream the tributary
contributions are small, so that prediction is almost entirely based on flood routing and therefore
much more precise.
Reduced accuracy is observed at the stations upstream of Vientiane and Nong Khai. This is
exclusively the result of limited data on the mainstream contributions of the major tributaries
in this reach, principally the Nam Ou, Nam Khan and Nam Tha. Rainfall data are particularly
deficient, with the exception of those for the right bank Thai tributaries, though in the main
these are smaller.
It is also evident that the current information received from China allows a one day forecast
at Chiang Saen of flood levels within an order of +/- 0.30 m, and a five-day forecast within an
order of +/- 1 m.
The performance of the flood forecasts increased significantly between the 10th and 13th of
August, with the peak water level at Vientiane predicted to within 20 cm over a lead time of two
days (Figure 14).
11. Lessons learnt and recommendations
The August 2008 event was the first regional flood episode for which active forecasting
was instigated by the RFMMC, and on the whole results were encouraging. Clearly, certain
questions have arisen and there are lessons to be learnt. These fall into three categories: (i) those
with regard to the data, (ii) those with respect to the modelling and accuracy of the forecasts,
and (iii) those concerning the dissemination and communication of the outputs.
Data and information
· The role of the rainfall data in forecasting water levels needs to be reviewed. As the lead
times increase, rainfall data assumes a greater role over the routing in determining overall
accuracy. However, the fall off in precision suggests that more rainfall data are needed
in many areas of the basin, particularly where the major volumes of flood runoff are
generated.
· Improvements in data coverage are particularly needed within the major tributaries in
the Lao PDR north of Luang Prabang, where at least half of the August flood runoff was
generated. Here data for calibrating the hydrological component of the overall model
are limited. A start could be made by considering the historical role that these tributaries
played in past events, with that of 1966 providing the benchmark.
Page 16
Flood situation report August 2008
Water level forecast on the 10th August
14.0
13.5
Forecast
1.
The forecast on the 10th accurately predicted that
Observed
13.0
water levels would exceed the ood level of 12.5 m
within 24 hours. However, the forecast was for this
12.5
v
el
exceedance to last for only one day, after which
12.0
er le
levels would decrease steadily. In fact they
at
11.5
continued to increase until the 15th when the
W ve gauge datum)
maximum of 13.67 m was reached, more than 1.5
11.0
m greater than the forecast peak water level. This
(m abo 10.5
shows the decrease in accuracy beyond the
10.0
two-day forecast.
10th
11th
12th
13th
14th
15th
August
Water level forecast on the 11th of August
14.0
13.5
2.
One day later, on the 11th, the forecast of the
13.0
maximum water level was much better, with only a
20 cm error in the predicted peak water level.
12.5
v
el
However, while this was expected to occur on the
12.0
er le
13th, it actually happened on the 15th.
at
11.5
W ve gauge datum) 11.0
Forecast
(m abo 10.5
Observed
10.0 11th 12th 13th 14th 15th 16th
August
Water level forecast on the 13th of August
14.0
13.5
3.
The forecast of the 13th predicted peak water
13.0
levels to occur on 14th. However, the peak
occurred one day later, on the 15th. The forecast of
12.5
v
el
the height of the peak was good, being only 15
12.0
er le
cm in error. However, the water level fell more
at
11.5
slowly than forecast.
W ve gauge datum) 11.0
Forecast
(m abo 10.5
Observed
10.0 13th 14th 15th 16th 17th 18th
August
Water level forecast on the 15th of August
14.0
13.5
4.
By the 15th, the day on which the peak water level
13.0
occurred, the rate of ood recession was predicted
accurately.
12.5
v
el
12.0
er le
at
11.5
W ve gauge datum) 11.0
Forecast
(m abo 10.5
Observed
10.0 15th 16th 17th 18th 19th 20th
August
Figure 14. Performance of the one- to five-day forecast of water levels at Vientiane on the 10th,
11th, 13th, and 15th of August.
Page 17
Flood situation report August 2008
· Satellite imagery of flooded areas is most valuable. The MRC has already contracted
a specialised agency to provide images, so that flood situation reporting can be
complemented by near real-time visuals.
· Inundation maps should be made available for the whole basin, and risk maps should be
prepared for those areas under significant threat of flooding. Some exist for certain areas,
and this activity should be expanded prior to the next flood season.
· During the course of the event, it also became apparent that along with the daily
provision of water levels from the AHNIP (Appropriate Hydrological Improvement
Project) and HYCOS (Hydrological Cycle Observation System) stations, at a minimum
of three-hourly updates is required. Data loggers should be placed in an automatic one- to
three-hourly automatic transmission mode during the flood season.
· Even though the role of the three existing mainstream reservoir storages in Yunnan on the
volume and peak discharge of major floods in the northern areas of the Lower Mekong
Basin remained insignificant, the flood event clearly demonstrated the usefulness of
early notifications of planned reservoir releases during flood events. Information with (if
possible) a lead time of five days would be most useful with regard to the three existing
mainstream reservoir storages, as well as from larger tributary reservoirs and construction
sites in the Lower Mekong Basin countries. The MRC is well placed to provide advice
on the sequencing and timing of potential releases from a regional flood management
perspective, particularly for larger schemes currently under construction.
Flood modelling capability and forecast accuracy
· The weight given to the rainfall data, and therefore to the tributary runoff, tends to cause
fairly substantial oscillations in the predicted water levels from day to day, particularly
for the longer lead times. This is not reassuring for the end user, and the day-to-day
variance of the forecasts needs to be reduced. Attention is required with regard to the
implementation of `learning algorithms' and feedback methods which the flood forecasts
allow to be refined and `damped' as the event evolves. In the short term a knowledge base
should be built up of major regional storm events. This could can be used develop flood
modelling capability.
· Hydrometric data provided by China proved to be extremely important, as it provides a
solid starting point for the flood routing on the mainstream. However, this information
is not yet used to its full potential. The relevant parts of the forecasting model require
review and improvement.
· All in all this recent flood has provided an excellent opportunity to build on
improvements being implemented, and to continue to review the performance of the
flood forecasting technology in the Mekong Basin, both hydrologically and statistically. A
formal report on the review is planned.
Page 18
Flood situation report August 2008
Dissemination of flood forecasts and early warning
· Institutional arrangements to disseminate MRC forecasts and early warning need to be
reviewed, in terms of their usefulness for counterpart agencies, their distribution channels
and selection of recipients. For instance, in addition to the web based dissemination of
forecasts, the RFMMC communicates forecasts and early warnings via daily emails to
some 50 subscribers. A pro-active and more strategic approach to identify and target
additional interested parties could be warranted.
· This is the first year that flood forecasts have been featured through the MRC's home
webpage. Feedback on further improvement in presentation and communication with
the media will be actively considered.
Flood preparedness
· The recent event may also provide practical lessons to improve and further focus flood
preparedness activities in selected provinces in Cambodia, the Lao PDR and Viet Nam,
which are carried out under FMMP Component 4.
The MRC's Flood Management and Mitigation Programme (FMMP) has developed a
preliminary plan of action to address these points and this will be discussed at a forthcoming
Steering Committee Meeting on 12th September 2008 in Hanoi.
Page 19
Mekong River Commission
P.O.Box 6101,Vientiane 01000,
Lao PDR.Telephone: (856) 21 263 263 Facsimile: (856) 21 263 264
E-mail: mrcs@mrcmekong.org
Website: www.mrcmekong.org
Document Outline
- 1. Summary
- 2. Meteorological conditions
- 3. Water levels
- 4. Flood discharges
- 5. Flood volumes
- 6. The role of the mainstream dams in China on the events of August 2008
- 7. Risk of occurrence
- 8. Prospects for the rest of the 2008 flood season
- 9. Damage
- 10. Performance of the RFMMC flood forecasting
- 11. Lessons learnt and recommendations
- Data and information
- Flood modelling capability and forecast accuracy
- Dissemination of flood forecasts and early warning
- Flood preparedness