
ISSN: 1683-1489
Mekong River Commission
Biomonitoring of the lower Mekong
River and selected tributaries,
2004 2007
MRC Technical Paper
No. 20
December 2008
Meeting the Needs, Keeping the Balance
Mekong River Commission
Biomonitoring of the lower Mekong
River and selected tributaries
2004 2007
MRC Technical Paper
No. 20
December 2008
Published in Vientiane, Lao PDR in December 2008 by the Mekong River Commission
Cite this document as:
MRC (2008) Biomonitoring of the lower Mekong River and selected tributaries, 2004 2007,
MRC Technical Paper No 20, Mekong River Commission, Vientiane. 77 pp.
ISSN: 1683-1489
The opinions and interpretation expressed within are those of the authors and do not necessarily
reflect the views of the Mekong River Commission.
Editors: B.C. Chessman, V.H. Resh and T.J. Burnhill
Graphic design: T.J. Burnhill
© Mekong River Commission
184 Fa Ngoum Road, Unit 18, Ban Sithane Neua, Sikhottabong District,
Vientiane 01000, Lao PDR
Telephone: (856-21) 263 263 Facsimile: (856-21) 263 264
E-mail: mrcs@mrcmekong.org
Website: www.mrcmekong.org
ii
Table of Contents
Summary
xvii
1. Introduction
1
1.1. The need for river monitoring
1
1.2. The value of biological monitoring
1
1.3. The types of organisms included in biological monitoring
2
1.4. Biological monitoring in Asia
4
1.5. Development of the MRC biomonitoring programme
8
2. Sampling sites
11
2.1. Rationale for site selection
11
2.2. Designation of reference sites
15
3. Environmental variables
21
3.1. Introduction
21
3.2. Methods
21
3.3. Results
21
3.4. Discussion
27
4. Benthic diatoms
29
4.1. Introduction
29
4.2. Methods
29
4.3. Results
31
4.4. Discussion
32
5. Zooplankton
35
5.1. Introduction
35
5.2. Methods
35
5.3. Results
37
5.4. Discussion
40
6. Littoral macroinvertebrates
41
6.1. Introduction
41
6.2. Methods
41
6.3. Results
43
7. Benthic macroinvertebrates
47
7.1. Introduction
47
7.2. Methods
47
7.3. Results
49
iii
7.4. Discussion
50
8. The use of biological indicators to classify and rate sites
53
9. Future directions
59
10.References
61
Appendix 1. Physical and chemical variables and site disturbance
67
Appendix 2. Species lists and counts per site and sampling occasion
71
Appendix 3. Summary of biological indicator values
73
iv
Table of figures
Figure 2.1 Maps of sites surveyed in 2004, 2005, 2006, and 2007.
14
Figure 2.2 Plates illustrating sites with anthropogenic impacts
17
Figure 3.1 Relationship between river width and altitude.
22
Figure 3.2 Relationship between average water temperature and altitude.
22
Figure 3.3 Relationship between average water temperature and average dissolved oxygen
concentration.
23
Figure 3.4 Relationship between average electrical conductivity and average pH.
23
Figure 3.5 Relationship between average turbidity and average transparency.
24
Figure 3.6 Relationship between average transparency (Secchi depth) and average
chlorophyll-a concentration (plotted on a logarithmic scale).
24
Figure 3.7 Relationships between electrical conductivity values measured at the
same site in different years.
25
Figure 3.8 Relationships between dissolved oxygen values measured at the same
site in different years.
26
Figure 4.1 Statistically significant relationships of average richness of diatoms to
environmental variables.
31
Figure 4.2 Statistically significant relationship of average abundance of diatoms
to Secchi depth.
32
Figure 4.3 Statistically significant relationships of average ATSPT of diatoms to
environmental variables.
33
Figure 5.1 Statistically significant relationships of average richness of zooplankton to
environmental variables.
37
Figure 5.2 Statistically significant relationships of average abundance of zooplankton to
environmental variables.
38
Figure 5.3 Statistically significant relationships of ATSPT of zooplankton to
environmental variables.
39
Figure 6.1 Statistically significant relationships of average richness of littoral
macroinvertebrates (sweep samples) to environmental variables.
43
Figure 6.2 Statistically significant relationships of average richness of littoral
macroinvertebrates (sweep samples) to environmental variables.
44
Figure 6.3 Statistically significant relationships of average ATSPT of littoral
macroinvertebrates (sweep samples) to environmental variables.
45
Figure 7.1 Statistically significant relationships of average richness of benthic
macroinvertebrates to environmental variables.
49
v
Figure 7.2 Statistically significant relationship of average abundance of benthic
macroinvertebrates to electrical conductivity.
50
Figure 7.3 Statistically significant relationships of average ATSPT of benthic
macroinvertebrates to environmental variables.
51
Figure 8.1 Ratings of sites in the Lower Mekong Basin.
55
vi
Table of tables
Table 1.1 Percentage of sources describing an attribute as an advantage of a group of
organisms for biomonitoring.
3
Table 1.2 Percentage of sources describing an attribute as a disadvantage of a group of
organisms for biomonitoring.
4
Table 1.3 Examples of freshwater biomonitoring in Asia.
5
Table 2.1 List of sites sampled in 2004 2007.
11
Table 2.2 Evaluation of all sites against reference site criteria.
18
Table 3.1 Probability and R2 values resulting from linear regression analyses of selected
environmental variables on the Site Disturbance Score.
27
Table 8.1 Interim guidelines for biological indicators of harm to the ecosystem.
53
Table 8.2 Definition and characteristics of the classification system.
54
Table 8.3 Assessment of all sites against suggested guidelines.
56
vii
viii
Acknowledgements
This paper is the result collaborative work between international and riparian biologists
and ecologists over a number of years. The principal contributing authors are: Yuwadee
Peerapornpisal, Tatporn Kunpradid, Sutthawan Suphan, (benthic diatoms); Chanda
Vongsambath, Niane Sivongxay (littoral macroinvertebrates); Pham Anh Duc (benthic
macroinvertebrates); Nguyen Thi Mai Linh (zooplankton); Supatra Parnrong Davidson, Sok
Khom, and Monyrak Meng (environmental variables).
Monyrak Meng of the MRC's Environment Programme coordinated the sampling
programme, analysis, and write up of 2004 2007 field seasons. Representatives from the
National Mekong Committees of Cambodia, Lao PDR, Thailand, and Viet Nam, provided
invaluable help in the organisation of the field campaigns, and provided support for the
monitoring programme as a whole.
Vince Resh and Bruce Chessman, provided expertise and guidance from the inception of
the project to its completion. They also made major contributions to the writing, drafting, and
editing the paper.
ix
x
Abbreviations and acronyms
ATSPI
Average Tolerance Score Per Individual
ATSPT
Average Tolerance Score Per Taxon
BDP
Basin Development Programme of the MRC
DO
Dissolved Oxygen
EC
Electrical Conductivity
MRC
Mekong River Commission
MRCS
Mekong River Commission Secretariat
NTU
Nephelometric Turbidity Units
SDS
Site Disturbance Score
xi
xii
Glossary of biomonitoring terms
Abundance: This is a measurement of the number of individual plants or animals belonging
to a particular biological indicator group counted in a sample. Low species abundance is
sometimes a sign that the ecosystem has been harmed.
Benthic macroinvertebrates: In this report, the use of this term refers to animals that live in
the deeper parts of the riverbed and its sediments, well away from the shoreline. Because many
of these species are not mobile, benthic macroinvertebrates respond to local conditions and,
because some species are long living, they may be indicative of environmental conditions that
are long standing.
Biological indicator group: These are groups of animals or plants that can be used to
indicate changes to aquatic environments. Members of the group may or may not be related
in an evolutionary sense. So while diatoms are a taxon that is related through evolution,
macroinvertebrates are a disparate group of unrelated taxa that share the character of not having
a vertebral column, or backbone. Different biological indicator groups are suitable for different
environments. Diatoms, zooplankton, littoral and benthic macroinvertebrates, and fish are the
most commonly used biological indicator groups used in aquatic freshwater environments. In
addition, although not strictly a biological group, planktonic primary productivity can also be
used as an indicator. However, for a number of logistical reasons fish and planktonic primary
production are not suitable for use in the Mekong.
Diatom: Single celled microscopic algae (plants) with a cell wall made of silica. They drift
or float in the river water (planktic/planktonic) or are attached to substrate such as rocks on
the riverbed and aquatic plants growing in the river (benthic/benthonic). They are important
primary producers in the aquatic food chain and are an important source of food for many
invertebrate animals. Diatoms are a diverse group that respond in many ways to physical and
chemical changes to the riverine environment. Because, they have a short generation time
diatom populations respond rapidly to changes in the environment.
Environmental variables: These are chemical and physical parameters that were recorded at
each sampling site at the same time as samples for biological indicator groups were collected.
The parameters include, altitude, water transparency and turbidity, water temperature,
concentration of dissolved oxygen (DO), electrical conductivity (EC), acidity (pH), and
concentrations of chlorophyll-a, as well as the physical dimensions of the river at the site.
xiii
Littoral macroinvertebrates: In this report, the use of this term refers to animals that live on,
or close to, the shoreline of rivers and lakes. They are the group of animals that are most widely
used in biomonitoring exercises worldwide. They are often abundant and diverse and are found
in a variety of environmental conditions. For these reasons littoral macroinvertebrates are good
biological indicators of environmental changes.
Littoral organisms: Those organisms that live near the shores of rivers, lakes, and the sea.
Macroinvertebrate: An informal name applied to animals that do not have a vertebral column,
including snails, insects, spiders, and worms, which are large enough to be visible to the naked
eye. Biomonitoring programmes often use both benthic and littoral macroinvertebrates as
biological indicators of the ecological health of water bodies.
Primary producer: Organisms at the bottom of the food chain, such as most plants and some
bacteria and blue-green algae, which can make organic material from inorganic matter.
Primary production: The organic material made by primary producers. Therefore, planktonic
primary production is the primary production generated by plants (including diatoms), bacteria
and blue-green algae that live close to the surface of rivers lakes and the sea.
Primary productivity: The total organic material made by primary producers over a given
period of time.
Reference sites: These are sampling sites that are in almost a natural state with little
disturbance from human activity. To be selected as a reference site in the MRC biomonitoring
programme, a site must meet a number of requirements including pH (between 6.5 and 8.5),
electrical conductivity (less than 70 mS/m), dissolved oxygen concentration (greater than 5
mg/L) and average SDS (between 1 and 1.67). Reference sites provide a baseline from which to
measure environmental changes.
Richness: This is a measurement of the number of taxa (types) of plants or animals belonging
to a particular biological indicator group counted in a sample. Low species richness is often a
sign that the ecosystem has been harmed.
Sampling sites: Sites chosen for single or repeated biological and environmental sampling.
Although locations of the sites are geo-referenced, individual samples may be taken from the
different habitats at the site that are suitable for particular biological indicator groups. Sites
xiv
were chosen to provide broad geographical coverage of the basin and to sample a wide range
of river settings along the mainstream of the Mekong and its tributaries. There are 51 sampling
sites from which 14 reference sites were selected.
Site Disturbance Score (SDS): This is a comparative measure of the degree to which the site
being monitored has been disturbed by human activities, such as urban development, water
resource developments, mining, and agriculture. In the MRC biomonitoring programme, the
SDS is determined by a group of ecologists who attribute a score of 1 (little or no disturbance)
to 3 (substantial disturbance) to each of the sampling sites in the programme after discussion of
possible impacts in and near the river.
Richness: This is a measurement of the number of taxa (types) of plants or animals belonging
to a particular biological indicator group counted in a sample. Low species richness is often a
sign that the ecosystem has been harmed.
Taxon/taxa (plural): This is a group or groups of animals or plants that are related through
evolution. Examples include species, genera, or families.
Tolerance, or Average Tolerance Score per Taxon (ATSPT): Each taxon of a biological
indicator group is assigned a score that relates to its tolerance to pollution. ATSPT is a measure
of the average tolerance score of the taxa recorded in a sample. A high ATSPT may indicate
harm to the ecosystem, as only tolerant taxa survive under these disturbed conditions.
Zooplankton: Small or microscopic animals that drift or float near the surface of rivers, lakes,
and the sea. They can be single celled or multi-cellular. They are often secondary producers that
live off phytoplankton (including diatoms) or other zooplankton. Zooplankton can be useful
biological indicators of the ecological health of water bodies because they are a diverse group
that have a variety of responses to environmental changes. Because they have a short generation
time, zooplankton populations tend to respond more rapidly to changes in the environment.
xv
xvi
Summary
A biological monitoring programme was established for the lower Mekong River and its major
tributaries by the MRC and its member nations in response to article 7 of the 1995 Agreement
that established the Commission. The biomonitoring programme complements the previously
established monitoring programmes on physical-chemical water quality, and helps to determine
whether harmful effects on aquatic ecosystems are resulting from the development and use of
the water resources of the Lower Mekong Basin.
The groups of organisms to be monitored in the programme were nominated in 2003 for
their relevance to the interests of the general public, practicality of measurement in a broad-
scale, routine monitoring programme, and likely sensitivity to water resources development
and waste discharge, as indicated by international experience in biomonitoring over the past
century. A pilot study in 2003 tested and refined the groups to be measured. As a result, diatoms,
zooplankton, littoral macroinvertebrates and benthic macroinvertebrates were retained in the
programme. Unfortunately, fish could not be retained for reasons of cost and logistics, but this
could be re-considered in the future. Selected environmental measurements were also included
in the programme to assist in interpretation of the biological data and testing of biological
indicators.
Full-scale data collection with standardized methods began in 2004, when 20 sites were
sampled. In 2005, 16 sites were sampled, in 2006, 21 sites, and in 2007, 20 sites. In total, 51
sites were sampled, with some sites being sampled in two or more years. All sampling was done
in the dry season (March) because high water levels and rapid currents made sampling in the
wet season impossible or dangerous.
Specific indicators of ecological harm were calculated for each sample of diatoms,
zooplankton, littoral macroinvertebrates and benthic macroinvertebrates collected during the
programme. These were richness (number of types of organisms in the sample), abundance
(number of individual organisms in the sample) and average tolerance (a measure of how
resistant the species in the sample are to stresses caused by humans). Because biological
indicators can vary naturally as well because of human activities, data from reference sites
were used to define thresholds of harm. Reference sites with low levels of development were
selected from the total set of sites sampled after consideration of chemical water quality data,
human activity at the site, and human activity upstream. Data from 14 reference sites were used
to generate 12 interim biological guidelines, similar to the physical and chemical guidelines
proposed for the MRC water quality assessment programme. Data from all sites were then
compared with guideline values.
Potentially harmful effects at a sampling site were inferred if the average richness or
abundance of a group of organisms was below the applicable guideline, because reduced
richness or abundance can be construed as harm. For tolerance, potential harm was inferred
xvii
Biomonitoring of the lower Mekong River and selected tributaries, 2004 2007
if the average value calculated for a site was above the applicable guideline, because a more
tolerant fauna indicates a loss of sensitive species. In order to produce an overall assessment ,
each site was classified for each sampling occasion according to the number of guidelines met:
Class A (excellent): 10 12 guidelines met
Class B (good): 7 9 guidelines met
Class C (moderate): 4 6 guidelines met
Class D (poor): 0 3 guidelines met.
Of the 77 sampling events conducted over four years, 28 were in Class A, 32 in Class B, and
17 in Class C. None was in Class D. This rating suggests that the principal rivers of the Lower
Mekong Basin have not yet suffered severe harm from the development of water resources or
waste disposal. However, some rivers are showing signs of stress.
The data collected in this programme provide a basis for actions to avoid, minimise and
mitigate harm to the river's ecosystems, as required by the 1995 Agreement. They also provide
a sound baseline from which to monitor future change.
Page xviii
1. Introduction
1.1 The need for river monitoring
The people of the Lower Mekong Basin and their governments are naturally concerned about
the ecological well being of the river, its major tributaries, and their associated floodplains,
lakes and wetland habitats. This is because the river system supports plant and animal life on
which the livelihoods and food supply of the great majority of the population of 60 million
people have traditionally depended. These concerns are embedded in the 1995 Agreement that
established the MRC. In particular, Article 7 of the agreement states that `harmful effects on
aquatic ecosystems resulting from the development and use of the water resources of the lower
Mekong Basin, or the discharge of wastes and return flows, are to be avoided, minimised or
mitigated.'
However, the governments of the four riparian countries (Cambodia, Lao PDR, Thailand,
and Viet Nam) also want to alleviate poverty in their countries and to raise the standard of
living of their people using the revenue gained from developing other uses of the river, such
as hydropower generation, irrigated agriculture, improved navigation, and tourism. Although
these new developments will inevitably change the natural state of the river system, predictions
about how these modifications will affect people's livelihoods is made difficult by the complex
ecological relationships among the river system, its plant and animal life, and the people who
make a living from the river's resources. Therefore, governments and their line agencies need
monitoring systems that will give them early warning of changes in the ecology of the river, so
that they can take remedial action if it is necessary.
The MRC, acting on behalf of its member states, already has routine monitoring systems in
place for hydrology and climate (water level, flow, and rainfall) and water quality (the chemical
and physical properties of the river water, including natural and man-made pollutants). These
systems are designed for regional-scale monitoring reflecting the MRC's remit to address issues
that cross the national borders of its member states. However, there was no routine biological
monitoring of the Mekong River system prior to the programme described in this paper.
1.2 The value of biological monitoring
Biological monitoring, or biomonitoring, of fresh waters began in Germany at the start of the
20th century (Rosenberg and Resh, 1993). Routine, broad-scale biomonitoring has been well
established in Australia, Europe, Japan and North America for 20 30 years (Bonada et al.,
2006; Carter et al., 2006 a, b; Ziglio et al., 2006). More recently, biomonitoring has expanded
into developing countries, where it has been advocated because its relatively low cost and the
ability of biomonitoring to involve local populations in decision making (Resh, 1995, 2007).
Page 1
Biomonitoring of the lower Mekong River and selected tributaries, 2004 2007
Biomonitoring provides a third type of monitoring that complements physical and chemical
monitoring (Campbell, 2007). Biomonitoring provides important additional information
because plants and animals are sensitive to a wide range of environmental factors, including
many that are not practical to measure routinely in physical and chemical monitoring
programmes. Biomonitoring can therefore provide an indication of environmental problems that
are not detected by physical and chemical monitoring.
In addition, plants and animals are affected by episodic or intermittent pollution that may
not be present at the times when physical and chemical sampling takes place. Populations of
animals and plants that are sensitive to pollution take time to recover after pollutants have
dispersed, and so are indicative of water quality in the recent past as well as quality at the time
of sampling. For this reason, biomonitoring has been likened to a `video replay' of conditions
that existed in the recent past, rather than a `snapshot' of conditions at a single moment in time
(Carter et al., 2006a).
Equally importantly, biomonitoring records the condition of living things that are very
important to people's way of life, and to which they can relate. For example, people will notice
declines in fish populations, changes in vegetation, and the disappearance of certain types of
animals. These sorts of changes cannot be predicted accurately from physical and chemical
monitoring because of the complexity of ecological relationships and the huge variety of
physical and chemical variables that can affect animals and plants.
1.3 The types of organisms included in biological monitoring
Early biomonitoring of fresh waters in Germany focused on bacteria because of concerns
about public health (Hynes, 1960). However, as other management issues emerged, additional
organisms, and eventually entire aquatic communities, were included (Cairns and Pratt, 1993;
Bonada et al., 2006; De Pauw et al., 2006). When Hellawell (1986) reviewed the scientific
literature to determine which biological groups were most popular for monitoring, he found that
benthic macroinvertebrates were recommended in 27% of studies, and followed by algae (25%),
protozoa (17%), bacteria (10%), and fish (6%). Other biotic groups such as macrophytes, fungi,
yeasts, and viruses were seldom recommended.
More recently, most attention has been paid to three groups: benthic macroinvertebrates,
algae (especially diatoms), and fish (De Pauw et al., 2006). In the USA, all states monitor
benthic macroinvertebrates except Hawaii, where a programme is under development; two-
thirds of the states monitor fish and one-third monitor algae (Carter et al., 2006b). Resh (2007)
examined 50 recent biomonitoring studies conducted in developing countries and found that 34
of these used benthic macroinvertebrates, 9 involved fish, 3 algae, and 2 aquatic macrophytes.
Gallacher (2001) reported that benthic macroinvertebrates are the most widely used organisms
in biomonitoring in Asia (in 10 of 12 countries examined), followed by bacteria (8), algae and
fish (7), and protozoans.
Page 2
Introduction
Resh (2008) reviewed 65 journal articles, websites, and books that listed attributes as
advantages and disadvantages of different groups of organisms for biomonitoring. His
results are summarized in Tables 1.1 and 1.2. The number of sources listing advantages and
disadvantages of the different groups follows the pattern of frequency of use in biomonitoring
programmes.
Table 1.1 Percentage of sources describing an attribute as an advantage of a group of organisms for
biomonitoring (after Resh, 2008).
Attribute
Benthic
Algae (periphyton) Fish
Zooplankton
macroinvertebrates (22 sources)
(15 sources)
(9 sources)
(42 sources)
Widespread: Group is abundant,
common, ubiquitous, etc.
60%
36%
17%
33%
Diverse: Group has many species,
varying in responses to environmental
81%
45%
26%
67%
change
Important to ecosystem: Group has
important trophic positions or ecological
29%
23%
63%
56%
roles
Limited mobility: Group is sedentary
and therefore useful for inferring local
69%
14%
0%
0%
conditions
Longer generation time: Group is
useful for tracking over time, long-term
55%
5%
63%
0%
integrators, bioaccumulate toxins
Shorter generation time: Groups
has rapid responses to change, quick
14%
45%
0%
33%
recovery
Economic: Group is inexpensive to
conduct research with, has good benefit-
21%
9%
11%
0%
cost ratio
Easy taxonomy: Group has easily
identified specimens, good taxonomic
36%
23%
58%
0%
keys are available
Easy sampling: Group requires low field
effort
60%
50%
22%
22%
Pre-existing information: Group with
good background information, existing
19%
18%
53%
0%
expertise
Easy transport/storage: Group is easily
taken back from the field, moved, stored
2%
14%
0%
0%
for future use
Field examination: Group could be at
least partly processed/identified while
2%
0%
21%
0%
in the field
Low impact of sampling: Group for
which sampling has a low impact on its
7%
14%
5%
0%
own population and of other fauna
Stable/persistent populations: Group
with populations that are predictable,
and remain in the environment over
0%
5%
16%
0%
time and through various conditions
Use by agencies/volunteers: Group
has been used for biomonitoring by an
7%/7%
0%/0%
11%/0%
0%/0%
agency/volunteer group
Page 3
Biomonitoring of the lower Mekong River and selected tributaries, 2004 2007
Table 1.2 Percentage of sources describing an attribute as a disadvantage of a group of organisms
for biomonitoring (after Resh, 2008).
Attribute
Benthic
Algae (periphyton) Fish
Zooplankton
macroinvertebrates (9 sources)
(14 sources)
(6 sources)
(19 sources)
Sampling difficulties: Group requires
high effort, or has seasonal/daily
fluctuations, patchy spatial distributions,
68%
33%
36%
67%
equipment needs, variable populations
Identification: Group requires expertise
for identification, fewer taxonomic keys
58%
67%
7%
17%
available
Undesirable response levels: Group has
low sensitivity, with tolerances
42%
11%
4%
0%
Lack of social recognition by public:
Public does not consider group
5%
11%
0%
0%
important
Affected by natural conditions: Group
affected by predators, changes in
21%
22%
7%
50%
physical conditions
Mobile: Group swims, drifts, not useful
as a local indicator, affected elsewhere
21%
0%
64%
0%
(e.g. spawning grounds)
Problems with methods/use: Group has
poor metrics/indices available, poor
documentation, laboratory difficulties,
21%
78%
21%
67%
requires expertise
Not found/abundant in certain habitats:
Group does not regularly inhabit area
11%
0%
14%
33%
Short generation time: Poor integrators,
do not show bioaccumulation
0%
33%
0%
33%
Signs of stress hard to trace to source:
Changes in population/community
structure of group does not necessarily
21%
11%
7%
0%
point to cause of change
1.4 Biological monitoring in Asia
Table 1.3 provides examples of freshwater biomonitoring in Asian countries. Some countries
not included in the table, such as India and Indonesia, also have biomonitoring in place (e.g.
Sivaramakrishnan et al., 1996; Sudaryanti et al., 2001). Asian countries have made varying
levels of progress in the establishment of biomonitoring, with Japan being most advanced and
Thailand having made excellent progress, particularly within the Ping River system. Several
studies (e.g. Mustow, 2002) have applied methods developed outside of Asia to examine their
applicability to Asian water bodies (e.g. Thailand). This is a common approach in water quality
monitoring in developing countries.
Page 4
Introduction
Table 1.3 Examples of freshwater biomonitoring in Asia (based on information in Resh, 1995;
Gallacher, 2001; Resh, 2007; Morse et al., 2007)
et
.,
ang
., 1982;
W
Vshivkova
et al
.,; 1992, ., 1994;
., 2005.
et al
et al
et al
., 2003,
et al
Y
ang, 2004;
., 2000,
ang, 2002;
ang
References
Vshivkova and Nikulina, 1998,Vshivkova al et al Vshivkova 2005
Hwang Yang Morse W and W
Future needs and issues
T
axonomic and applied research needed. Development of university courses and mentors. Investment in modern, ecological and taxonomical literature. Environmental monitoring by government agencies based on obsolete methods, with very little use of macroinvertebrates. General public uninformed and uninterested in ecology and nature conservation. Little or no ecological monitoring carried out by private consultants.
Biological monitoring is lagging behind chemical monitoring.
Requirements exist for faunal inventories, establishment of tolerance values, University training programs, training programs for government agencies and specific protocols.
ater Center (CWC) aim to
ater Project (RCWP)
W
geon implemented.
W
and Clean
ganizes regular freshwater clean-ups.
Current practices
Russian Clean developing policies to protect freshwater resources.
RCWP develop rapid bioassessment technology using macroinvertebrates.
Network of public ecological agencies provides extensive monitoring.
Bioassessment data and conclusions passed through CWC to federal and regional nature protection departments, who then investigate sources of pollution.
Rapid bioassessment protocols adapted from those used in the USA.
CWC or
Ecological monitoring by remote sensing implemented.
Conservation programs for Chinese alligator and Chinese stur
Legislation on chemical effluents implemented.
40 NGOs active in China, but biological monitoring by them is rare.
ater
W
issued in 1993.
, Zhujiang and other rivers in late
iener Diversity Index used by
Y
ellow
ater Quality Biomonitoring'
W
Y
angtze,
published in 1994.
orkshops held at several universities and volunteer
Previous studies
Hydrobiologists at Institute of Biology and Soil Sciences began using macroinvertebrates for water quality monitoring in 2001.
National survey of hydrobiological measures and environmental variables for major aquatic resources began in late 1950s.
Point-source, pollution studies began in 1963.
Biotic indices and species diversity indices used to evaluate 1970s.
Modified Shannon-W government agencies in 1982.
`Manual for
`Aquatic Insects of China Useful for Monitoring Quality'
W monitoring groups established.
T
olerance values in east China developed in 2004.
Benthic index of biotic integrity developed in 2005.
Country
Asian Russia
China
Page 5
Biomonitoring of the lower Mekong River and selected tributaries, 2004 2007
T
suda,
Y
ule
Y
ap,
T
anida,
Azrina
Abu-
Y
ong, 2004;
., 2005; Che-
References
T
suda, 1962; 1964; Kawai, 1985; Kawai and 2005.
Bishop, 1973; and Chin, 2003; et al Salmah and Hassan, 2005; 2005.
f required.
ater pollution management requires
Future needs and issues
National and public institutions rarely involved in surveys.
No standardization of sampling or analysis methods.
Some taxonomic problems with databases.
Macroinvertebrates poorly known and relatively few species have been described.
More intensive monitoring of rivers using macroinvertebrates needed.
Increased protection and rehabilitation of aquatic ecosystems required.
T
raining programs for taxonomists and aquatic biologists needed. Educational programs required for the general public and government officials. Laws and regulations must keep pace with accelerating degradation of water resources. W prioritisation. Biomonitoring data need to form a resource for management decisions. Data on species responses to defined toxicant levels need to be made available to monitoring agencies. Adequate training and equipment for biomonitoring staf
The
ganic
status.
ganisms
pollution
.
.
determines
and
Academy of Sciences (supported
orld Bank and US National Science
W
estern Lakes Survey Project focuses on
Current practices
National biomonitoring programme for or pollution.
Nationwide survey of aquatic or (macroinvertebrates) has 800,000 participants.
30 species of macroinvertebrates used as indicators.
National census of river environments (109 rivers) describes macroinvertebrates, fish and riparian plants.
Huge volunteer programs, with participation by 23% of NGOs and 74% of public schools.
Biomonitoring uncommon; most studies focus on biodiversity
National monitoring network (902 stations, 462 rivers) measures various abiotic water quality parameters only biological data collected are for microbial analysis.
72% of rivers considered polluted or slightly polluted.
Biomonitoring carried out through National Institute of Meteorology and Hydrology to investigate biodiversity and evaluate water quality and ecology
Aquatic insect research carried out at National Institute of Meteorology and Hydrology and Mongolian by Foundation).
W diatoms, ostracods and Chironomidae.
Selenge River Basin insect survey project provides inventory of entomofauna.
Selenge River Basin insect survey project provides inventory of entomofauna.
The two projects above aim to establish baseline data on biota for use in biomonitoring programmes and to develop indigenous expertise and infrastructure.
ganic pollution since
.
gely unpublished.
Previous studies
Biomonitoring with macroinvertebrates adapted from German practices in late 1950s.
Comprehensive species lists compiled in 1962.
Introduction of saprobic system and biotic index in 1962.
T
esting of indices to measure or 1980s. Identification guides produced in 1985 and 2005.
One of the first studies of the macroinvertebrate fauna of a tropical river in 1973.
Guide to macroinvertebrates published in 2004.
Impact of a variety of disturbances on macroinvertebrate distribution studied by university research groups, but lar
Comparative study of macroinvertebrate fauna in urban and pristine streams in 2005.
Several macroinvertebrate species identified as potential bioindicators in 2005 study
Hydrobiological studies carried out by Russian and Mongolian scientists since late 1800s.
Interest in aquatic insects as bioindicators began in late 1990s with the introduction of university courses.
Country
Japan
Malaysia
Mongolia
Page 6
Introduction
.,
.;
et
et al
illiams,
et al
., 2002; W
., 2005; Bae,
et al
et al
Thorne and
illiams, 1997;
., 2005; PCD, 2005.
References
Bae and Lee, 2001; Bae 2005a; Bae, 2005b; Yoon, 2005.
Sangpradub 1996 W Kanjanavanit and Moonchinda, 1999; Luadee Thorne and 2002; Inmuong 2003, Boonsoong al
Thai macroinvertebrates.
Future needs and issues
Insufficient taxonomic knowledge.
Educational programs and materials for public participation required.
Research is needed on the taxonomy and biology of
Calibration of bioassessment procedures is required.
to
.
.
Thailand.
protocols are in progress in northern
A
ater quality of inland surface waters is
Current practices
Ministry of Environment of Korea (MEK) requires macroinvertebrate studies in environmental impact assessments.
Long-term `Eco-technopia 21 project' develop technology
Protocols using macroinvertebrates, fish and algae are being investigated in order to establish regular biomonitoring at check points throughout the country
MEK supports long-term biomonitoring in major freshwater systems.
Biomonitoring popular in schools.
Governmental and NGO public education programs include biomonitoring subjects.
W monitored with physical and chemical analysis. Total coliforms and fecal coliforms are the only biological parameters included.
Preliminary rapid bioassessment studies using USEP and north-eastern
orld Foundation started river and stream
Thailand to detect environment disturbance.
W
Previous studies
Community indices introduced in 1970s.
Nature conservation and restoration promoted in 1990s.
Korean biotic index introduced and modified in 1995.
Neural network methods introduced in 1996.
Dominant species index created in 2005.
Physiological measures and molecular biomarkers introduced in 2002.
Green investigation project for youth in 1997 (58 schools participated).
Report on water quality in 48 major rivers published by Pollution Control Department in 2005 (51% moderately polluted).
Studies on adult stages of aquatic insects carried out in northern
Pollution surveillance system using macroinvertebrates initiated along Ping River after 1996.
Country
South Korea
Thailand
Page 7
Biomonitoring of the lower Mekong River and selected tributaries, 2004 2007
Various short-term or issue-specific studies of freshwater organisms have been done in the
Mekong River basin. Fish have been the best studied organisms but this has mainly been from
the perspective of fish taxonomy and fishery productivity. Lists of invertebrates and algae have
also been prepared but vary greatly in their completeness and accuracy. Perhaps the best studied
organism that occurs in the river is the snail Neotricula aperta, which is the intermediate host of
Schistosoma mekongi, the vector of schistosomiasis in the Mekong region.
Grimĺs (1988) examined 28 sites for benthic macroinvertebrates in Lao PDR, Thailand
and Viet Nam, specifically to consider water quality issues. Concurrently, the Ministry of
Fisheries of Viet Nam conducted a series of studies on the Cambodian section of the Mekong
and included zooplankton, phytoplankton, and benthic invertebrates in their analysis. However,
neither study was detailed, and the results are best considered as preliminary to the programme
described here.
1.5 Development of the MRC biomonitoring programme
In 2003, the MRC undertook a pilot survey in the four riparian countries to test the potential
of five biological groups, and one ecological process, for routine monitoring of the Mekong
River and its major tributaries. These groups and process, selected in consideration of prior
international experience in freshwater biomonitoring, were as follows:
1. Planktonic primary production (a process critical to the well being of the Mekong's
fisheries);
2. Benthic algae, including microscopic diatoms and macro-algae such as the `river weed'
that is processed and sold or eaten by local people;
3. Zooplankton, which are microscopic animals floating and drifting in open water;
4. Littoral macroinvertebrates (invertebrate animals visible to the naked eye), living in the
shallow water at the river's edge;
5. Benthic macroinvertebrates, living in or on the sediments at the bottom of the river;
6. Fish.
The pilot study confirmed that diatoms, zooplankton, littoral macroinvertebrates and benthic
macroinvertebrates were practical and cost-effective for routine sampling and identification
with standard protocols. However, the pilot study showed that planktonic primary production,
macro-algae, and fish were not practical for immediate adoption in the Mekong River system.
The measurement of planktonic primary production required mooring a boat on site for several
hours through the middle part of the day, and transporting a large amount of equipment,
including chemicals, from site to site. These logistical requirements meant that measuring
Page 8
Introduction
primary production was a costly exercise relative to other components. Macro-algae were
not present in sufficient quantities to allow representative sampling at most sites. And pilot
sampling of fish showed that not enough specimens for reliable assessment could be collected
with nets, even when most of the day was spent in sampling one site.
A routine biomonitoring programme began in 2004, based on the four groups of organisms
and associated sampling protocols that proved most successful in the pilot, and continued
annually through to 2007. The overall objectives of this programme were to:
1. Survey the priority biological groups at a set of sites of interest for management
purposes, across all of the sub-areas of the Lower Mekong Basin;
2. Choose a set of reference sites to create a biological benchmark against which data from
any site in the Lower Mekong Basin can be compared;
3. Specify characteristics of the biological groups that indicate harm to the aquatic
ecosystem (biological indicators);
4. Use values of the biological indicators measured at the reference sites to develop a set of
guidelines to rate and classify the sites;
5. Prepare a `report card' that provides non-specialists and the general public with
information on the purpose and methods of biomonitoring, and indicates the current
condition of the river's ecosystems.
The programme was undertaken by biologists and ecologists from the member states,
supported by the MRC secretariat and international experts in the field of biomonitoring. All
sampling was confined to the dry season (March) because sampling in the wet season would be
too logistically difficult and dangerous. However, because of the long life span of many of the
organisms collected, the data reflect prior conditions as well as conditions during the time of
sampling.
This paper summarises and interprets the results of the four years of monitoring. It describes
the sampling locations and dates, the sampling protocols, the environmental variables measured
at each site, and the types and numbers of plants and animals recorded at each site. It analyses
the statistical significance of relationships among these factors and describes the rating and
classification of all the sites sampled.
Page 9
Biomonitoring of the lower Mekong River and selected tributaries, 2004 2007
Page 10
2. Sampling sites
2.1 Rationale for site selection
Biomonitoring sites were chosen to provide broad geographical coverage of the basin,
to include each of the sub-basins defined by the MRC's Basin Development Plan (BDP),
and to sample the mainstream of the Mekong River and each of its major tributaries. Sites
were selected each year by the MRC secretariat in consultation with the National Mekong
Committees.
The four years of sampling covered 51 sites spread across the Lower Mekong Basin (Table
2.1, Figure 2.1). Some sites were visited more than once, and so the study included 77 sampling
occasions. The sites covered a wide range of river settings, including rocky channels in northern
Lao PDR and northeast Thailand, the alluvial channels and floodplains of southern Lao PDR
and Cambodia, and the distributary system of the Mekong Delta in Cambodia and Viet Nam.
The sites also had a range of disturbances from human activity. Some were located in or close
by villages or cities, some were next to fields where crops are grown and livestock graze, some
were upstream or downstream of dams and weirs, and at some there was heavy river traffic.
Table 2.1 List of sites sampled in 2004 2007.
Site
River
Location
Year sampled
Coordinates (UTM)
code
CKL
Bassac
Koh Khel
2006
48P E0503327
N1246641
CKM Se Kong
River mouth
2005
48P E0615596
N1500691
2006
48P E0615508
N1500632
2007
48P E0615573
N1500696
CKT
Mekong
Kampi pool
2004
48P E0610951
N1393569
2006
48P E0609207
N1393544
CMR Mekong
Stung Treng Ramsar site
2005
48P E0607964
N1537129
2006
48P E0604976
N1539456
2007
48P E0605696
N1539736
CNL
Mekong
Nak Loeung
2006
48P E0528321
N1250852
CPP
Tonle Sap
Phnom Penh Port
2004
48P E0492492
N1279903
2006
48P E0491666
N1280205
CPS
Pursat
4 km upstream of Prek Thot
2004
48P E0381258
N1382944
CPT
Prek Te
2006
48P E0613899
N1374811
CSJ
Se San
Downstream of confluence with
2005
48P E0621005
N1499145
Sre Pok
2006
48P E0620973
N1499412
2007
48P E0615573
N1500688
Page 11
Biomonitoring of the lower Mekong River and selected tributaries, 2004 2007
Site
River
Location
Year sampled
Coordinates (UTM)
code
CSK
Stoeng Sangke
Battambang
2006
48P E0348375
N1465699
CSN
Stoeng Sen
Kapongthom
2006
48P E0490998
N1401845
CSP
Sre Pok
Kampong Saila, Lumpat
2004
48P E0716971
N1490691
2005
48P E0716971
N1490691
2006
48P E0717424
N1490804
2007
48P E0717104
N1490800
CSS
Se San
Veunsai District, Rattanakiri
2004
48P E0696445
N1545480
Province
2005
48P E0695488
N1546145
CSU
Se San
Pum Pi village, Rattakiri Province
2005
48P E0764687
N1526041
2006
48P E0764506
N1526065
2007
48P E0764707
N1526063
CTU
Tonle Sap
Prek Kdam ferry
2004
48P E0477884
N1309367
2006
48P E0478364
N1307071
LBF
Se Bang Fai
2007
48Q E0498437
N1888075
LBH
Se Bang Hieng
2007
48Q E0540315
N1779816
LDN Mekong
Done Ngieu island
2007
48P E0596621
N1650516
LKD Nam Ka Ding
Haad Sai Kam
2004
48Q E0398871
N2023713
2007
48Q E0398583
N2023903
LKL
Se Kong
Ban Xou Touat, Attapeu Province
2005
48P E0673642
N1622904
2007
48P E0670721
N1623450
LKU Se Kong
Ban Xakhe, Attapeu Province
2005
48P E0701679
N1653515
2007
48P E0702400
N1653117
LMH Mekong
Near Houa Khong water quality
2005
47Q E0723733
N2383320
station
LMX Mekong
Near Ban Xieng Kok, Muang
2005
47Q E0670860
N2311778
Luang
LNG Nam Ngum
Upstream of confluence with Nam
2004
48Q E0240744
N2050118
Lik
2007
48Q E0237411
N2049992
LNK Nam Khan
Between Hat Hian and Ban Houay
2005
48Q E0203428
N2200953
Ung
LNM Nam Mo
Upstream of bridge near mine
2007
48Q E0280667
N2088210
LNO Nam Ou
About 5 km from river mouth
2004
48Q E0212495
N2222855
LNT
Nam Ton
50 km from Vientiane
2007
48Q E0208083
N2016581
LOU Nam Ou
Between Ban Pak Ou and Ban
2005
48Q E0219345
N2229380
Hat Mat
LPB
Mekong
Above Luang Prabang, upstream
2004
48Q E0201739
N2203028
of Pak Nam Karn
2005
48Q E0206113
N2206957
LPS
Mekong
Pakse, upstream of Se Done mouth
2004
48P E0587623
N1671756
LSD
Se Done
Ban He, upstream of Pakse
2007
48P E0586345
N1673985
Page 12
Sampling sites
Site
River
Location
Year sampled
Coordinates (UTM)
code
LVT
Mekong
Upstream of Vientiane
2004
48Q E0239871
N1988731
2007
48Q E0229378
N1990015
TCH
Nam Chi
Wat Sritharararm, Yasothon
2004
48P E0407724
N1745362
TKO Nam Mae Kok
About 15 km upstream of Chieng
2004
47Q E0576165
N2205993
Rai Weir
2005
47Q E0576410
N2205793
TMC Mekong
Wiangkhain, between Sop Ing Tai
2005
47Q E0655974
N2231281
and Ban Huai Ian, near Cham Pong
TMI
Nam Mae Ing
Near Ban Ten
2005
47Q E0640355
N2213637
TMM Nam Mun Chi
Mekong (Mun - Kong Chiam)
2007
48P E0552854
N1692378
TMU Nam Mun
Ban Tha Phae, Ubon Ratchathani
2004
48P E0553283
N1692193
TNK Nam Kham
Na Kae
2007
48Q E0450473
N1874626
TSK
Nam Songkhram About 8 km from river mouth
2004
48Q E0438501
N1946480
2007
48Q E0440989
N1948666
TSM Nam Songkhram Mekong
2007
48Q E0444135
N1951422
VCD Bassac
Chau Doc
2004
48P E0515263
N1187502
2006
48P E0510969
N1188413
VCL
Cao Lanh
2006
48P E0563807
N1153868
VCT
Bassac
Can Tho
2006
48P E0588365
N1110673
VLX Long Xuyen
2006
48P E0551878
N1143546
VSP
Sre Pok
Ban Don hydrographic station
2004
48P E0802270
N1426825
VSR
Sre Pok
Upper Sre Pok
2006
48P E0817329
N1396950
VSS
Se San
Kon Tum hydrographic station
2004
49P E0180575
N1587838
2006
48P E0180527
N1588158
VTC
Mekong
Tan Chau
2004
48P E0528931
N1194535
2006
48P E0524259
N1195808
VTR
Vinh Long
Vinh Long
2006
48P E0603976
N1135759
2004 survey
The sites surveyed in 2004 were chosen to provide a broad geographic coverage across the
Lower Mekong Basin. They included localities on the Mekong and its major tributaries, in each
of the BDP sub-areas and MRC member states.
2005 survey
The geographic coverage was more focused for the 2005 survey. The sites fell into two groups:
(i) northern Lao PDR and the northern provinces of Thailand (mainly Chiang Rai), which lie
in BDP sub-areas 1 (Northern Lao PDR) and 2 (Chiang Rai), and (ii) southern Lao PDR and
eastern Cambodia, which lie largely in sub-area 7 (Se San/Sre Pok/Se Kong).
Page 13
Biomonitoring of the lower Mekong River and selected tributaries, 2004 2007
Viet Nam
LMH
Viet Nam
LMX
TMC
LOU
LNO
LPB
TKO
LPB
TKO
TMI
LNK
Lao PDR
Lao PDR
LNG
LKD
LVT
TSK
Thailand
TCH
Thailand
TMU
LKU
LPS
LKL
VSS
CSS
CSS
CMR
CSP
CKM
CSU
Cambodia
CSJ
CSP
Cambodia
VSP
CPS
CKT
CTU
CPP
Viet Nam
Viet Nam
VCD
VTC
Biomonitoring Survey 2004
Biomonitoring Survey 2005
Sampling locality
0
100
200 kilometres
Sampling locality
0
100
200 kilometres
Viet Nam
Viet Nam
Lao PDR
Lao PDR
LNM
LNG
LNT
LKD
LVT
TSM
TSK
LBF
TNK
LBH
Thailand
Thailand
TMM
LSD LKU
LDN
LKL
VSS
CMR
CSU
CMR
CSU
CKM
CKM
CSK
Cambodia
CSJ CSP
Cambodia
CSJ CSP
CSN
CKT
VSR
CPT
CTU
CPP
CKL
CNL
Viet Nam
Viet Nam
VCD
VTC
VCLVTR
VLX
VCT
Biomonitoring Survey 2006
Biomonitoring Survey 2007
Sampling locality
0
100
200 kilometres
Sampling locality
0
100
200 kilometres
BDP Sub-area
1. Northern Laos
4. Central Laos
7. Se San/Sre Pok/Se Kong
2. Chiang Rai
5. Mun/Chi
8. Kratie
3. Nong Khai/Songkhram
6. Southern Laos
9. Tonle Sap
10. Delta
Figure 2.1 Maps of sites surveyed in 2004, 2005, 2006, and 2007.
Page 14
Sampling sites
2006 survey
The 2006 survey focused on the mainstream and its major tributaries downstream of the
Ramsar site at Stung Treng in northern Cambodia. The survey included localities in sub-areas 6
(Southern Lao), 7 (Se San/Sre Pok/Se Kong), 8 (Kratie), 9 (Tonle Sap), and 10 (Delta).
2007 survey
The 2007 survey covered a large area of the lower Mekong Basin in central Lao PDR, and
along the border of Lao PDR and Thailand. Sites from previous years were re-sampled in the
Se Kong river in Lao PDR and Cambodia, and the Se San and Sre Pok rivers in Cambodia. The
sites included fell in sub-areas 3 (Nong Khai/Songkhram), 4 (central Lao PDR), 5 (Mun Chi),
6 (southern Lao PDR), and 7 (Se San/Se Kong/Sre Pok).
2.2 Designation of reference sites
Reference sites are used in both physical-chemical monitoring (e.g. to set water-quality criteria)
and biological monitoring programmes worldwide. In biomonitoring, the sites chosen to be
reference sites are usually selected on the basis of water quality and the degree of disturbance
caused by human activities. They are commonly those sites that are in a most natural, or
pristine, state. Reference sites for the Mekong provide benchmark data against which all sites in
the system can be compared. They are located where anthropogenic impacts, such as from water
resource development or waste disposal, are minimal.
Accordingly, reference sites were selected from those sampled in the biomonitoring
programme by the application of six criteria related to water quality, human disturbance in the
vicinity of the site, and human disturbance upstream. The water quality criteria were based on
those proposed for the MRC's Environment Programme Water Quality Index (MRC 2008).
Site disturbance was scored by the national and international experts present on each sampling
occasion, having regard to site-scale activities such as the following (Figure 2.2):
1. Sand and gravel extraction;
2. Dredging and mining;
3. Removal of natural riparian vegetation for agriculture or housing;
4. Agricultural cultivation;
5. In-stream aquaculture;
6. Fishing intensity;
Page 15
Biomonitoring of the lower Mekong River and selected tributaries, 2004 2007
7. Road building;
8. Unnatural bank erosion;
9. Cattle and buffalo grazing;
10. Boat traffic;
11. Waste disposal from villages, farms, towns etc.;
12. Village activities such as bathing and washing of clothes;
13. Unnatural fluctuations in water level.
A Site Disturbance Score (SDS) ranging from 1 (little or none of any of these types of
disturbance) to 3 (substantial disturbance of one or more types) was assigned independently by
each of the participants following group discussion about potential anthropogenic impacts (on
average there were eight participants, with a range of between five and nine). The individual
scores were then averaged to determine a measure of human disturbance at a site. Visual
assessment was used because it was not possible to make quantitative measurements of all of
these types of disturbance. Visual scoring systems are widely used in stream assessments for
features that are not amenable to quantitative measurement. Averaging of the scores of several
observers evens out the influence of individual differences, in the same way that scores are
averaged among judges of sporting and artistic competitions.
To be selected as a reference site, a site had to meet all of the following requirements:
1. The pH of the site at the time of biological sampling was between 6.5 and than 8.5.
2. The electrical conductivity at the time of biological sampling was less than
70 mS/m.
3. The dissolved oxygen concentration at the time of biological sampling was greater than
5 mg/L.
4. The average SDS was between 1 and 1.67 on a scale of 1 to 3, that is, in the lowest
one-third of possible scores. A typical site with a score between 1 and 1.67 might
have low-level rural development, such as low-density village activities, but not major
urbanization, intensive agriculture or waste disposal.
5. There was no major dam or city within 20 km upstream of the site, and flow at the site
was not affected by inter-basin water transfers. Downstream development was also
considered where a site has upstream flow because of tidal influence.
Page 16


Sampling sites
i
ix
ii
viii
iii
vii
iv
vi
v
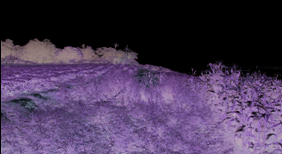
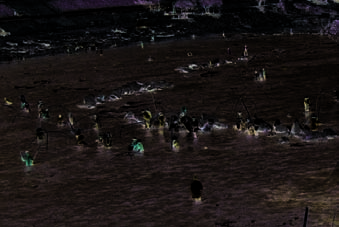
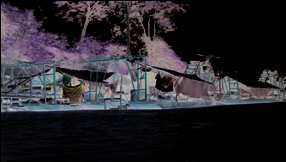
Figure 2.2 Clockwise from top left (i) reference site; examples of disturbance caused by human
activity (ii) bank erosion, (iii) over-fishing, (iv) mining, (v) waste disposal,
(vi) agricultural discharge, (vii) urban development, (viii) aquaculture, and (ix)
agricultural cultivation.
Page 17
Biomonitoring of the lower Mekong River and selected tributaries, 2004 2007
Fourteen of the 51 sites sampled in the programme met all criteria and were selected as
reference sites (Table 2.2).
Table 2.2 Evaluation of all sites against reference site criteria.
Site
Number of pH
Maximum EC Minimum DO
Site
Upstream and downstream
Reference site
sampling (range if
(mS/m)
(mg/L)
disturbance disturbance
(yes or no)
occasions applicable)
score
CKL
1
7.17
12.32
7.56
2.19
Phnom Penh City
N
CKM
3
5.16 7.77
7.30
6.32
1.33
N
CKT
2
7.69 8.40
19.62
6.89
1.19
Y
CMR
3
7.74 8.41
23.02
8.15
1.59
Y
CNL
1
7.54
19.35
7.02
1.97
N
CPP
2
7.18 7.94
10.47
3.94
2.88
Phnom Penh City
N
CPS
1
7.30
8.40
5.07
2.22
N
CPT
1
7.13
11.03
4.56
2.33
N
CSJ
3
7.22 7.48
4.93
6.00
1.34
Dam 200 km upstream
Y
CSK
1
6.99
18.18
3.76
2.00
Battambang City and
N
agriculture
CSN
1
7.22
8.10
7.13
2.00
N
CSP
4
7.32 7.63
6.85
5.91
1.22
Y
CSS
2
7.24 7.52
4.23
6.19
1.75
N
CSU
3
7.05 7.32
4.30
6.98
1.95
N
CTU
2
7.00 7.01
9.08
3.79
2.08
N
LBF
1
8.05
32.88
7.54
1.72
N
LBH
1
7.86
15.25
7.70
1.63
Interbasin transfer
N
LDN
1
8.27
22.87
8.51
1.53
Y
LKD
2
7.71 7.97
10.70
7.67
1.50
Dam 100 km upstream with
N
interbasin transfer
LKL
2
7.18 7.24
7.07
5.56
1.59
Dam next year
Y
LKU
2
6.98 7.18
5.14
5.99
1.33
Dam next year
Y
LMH
1
8.19
34.80
9.34
1.94
N
LMX
1
8.10
33.00
8.25
1.94
N
LNG
2
6.87 7.45
7.51
6.93
1.67
Dam 3 km upstream
N
LNK
1
8.27
25.10
7.47
1.38
Y
LNM
1
7.95
9.65
8.87
2.31
Gold mine
N
LNO
1
8.46
24.72
8.59
1.00
Y
LNT
1
7.43
14.67
8.69
1.69
Town
N
LOU
1
8.15
21.27
8.16
1.00
Y
LPB
2
8.17 8.47
27.40
7.87
1.48
Y
LPS
1
8.38
22.86
7.17
1.57
Y
LSD
1
7.80
11.90
7.42
1.97
Rubber plantation
N
Page 18
Sampling sites
Site
Number of pH
Maximum EC Minimum DO
Site
Upstream and downstream
Reference site
sampling (range if
(mS/m)
(mg/L)
disturbance disturbance
(yes or no)
occasions applicable)
score
LVT
2
7.79 8.63
28.80
8.61
1.78
N
TCH
1
7.83
18.38
7.71
1.86
N
TKO
2
6.62 7.95
11.75
6.22
1.87
N
TMC
1
6.80
22.68
7.60
1.64
Y
TMI
1
6.80
10.18
6.40
2.25
N
TMM
1
7.52
20.94
7.25
2.17
Dam 10 km upstream
N
TMU
1
7.30
9.59
7.44
1.71
Ubon City
N
TNK
1
7.15
16.92
7.11
2.44
Series of weirs
N
TSK
2
7.47 8.01
76.66
7.15
2.05
N
TSM
1
8.12
24.95
8.65
1.86
N
VCD
2
7.10 7.68
18.05
3.91
2.50
Town downstream and tidal
N
movement; agriculture;
shipping
VCL
1
7.58
18.87
8.01
1.91
Town upstream; agriculture;
N
shipping
VCT
1
7.18
18.60
5.20
2.64
City upstream and
N
downstream; agriculture;
shipping
VLX
1
7.13
18.57
6.59
2.69
City upstream; agriculture;
N
shipping
VSP
1
7.77
6.26
5.87
1.29
Y
VSR
1
7.14
5.15
7.31
2.00
Dam 7 km upstream
N
VSS
2
6.62 7.66
3.97
7.28
2.14
N
VTC
2
7.64 8.33
18.28
5.70
2.39
Town downstream and tidal
N
movement; agriculture;
shipping
VTR
1
7.33
18.11
6.70
2.44
Town downstream and tidal
N
movement; agriculture;
shipping
Page 19
Biomonitoring of the lower Mekong River and selected tributaries, 2004 2007
Page 20
3. Environmental variables
3.1 Introduction
In the past, physical and chemical information was often the sole basis for monitoring the
environmental quality of rivers and lakes. Today, with the widespread implementation of
biological monitoring programmes, physical and chemical information is complemented by
biological data. Physical and chemical data can assist in the interpretation of information
obtained from biological monitoring programmes by revealing potential causes of biological
changes. For this reason, physical and chemical measurements were included in the
biomonitoring programme.
This chapter describes the physical and chemical environment of the sites sampled in the
biomonitoring programme from 2004 to 2007. Information is provided on site locations and
dimensions, water transparency and turbidity, water temperature, the concentration of dissolved
oxygen (DO), electrical conductivity (EC), pH, and concentrations of chlorophyll-a. Later
chapters relate these physical and chemical measurements to biological indicators.
3.2 Methods
The map coordinates and altitudes of the sampling sites were determined with a Garmin GPS
12xL device, and river width was measured with a Newcon Optik LRB 7x50 laser rangefinder.
All water quality measurements were taken in three sections of the river at each site, near the
left bank, near the right bank, and in the centre of the river, and averaged. Temperature, DO,
EC, and pH were measured with Enviroquip TPS meters and later with a YSI 556MP5 meter,
calibrated according to the manufacturer's instructions. Readings were taken at the surface and
at a depth of 3.5 m, or the maximum of the river, whichever was less. A Secchi disc was used
to determine water transparency. The disc was slowly lowered into the water, and the depth
at which it could no longer be seen was recorded. The disc was then lowered another metre
and slowly pulled up until it reappeared. If it reappeared at a depth more than 0.05 m different
from the depth at which it disappeared, the procedure was repeated. Water turbidity and the
concentration of chlorophyll-a were measured at the water surface in 2006 and 2007 only, with
a Hach 2100P turbidity meter and Aquaflour handheld fluorimeter respectively.
3.3 Results
Overall variability and relationships among variables
Site averages of the environmental variables had a broad range across the 51 study sites over 77
visits during the four years (Appendix 1). Altitude varied from 3 to 565 m above sea level, with
Page 21
Biomonitoring of the lower Mekong River and selected tributaries, 2004 2007
most of the lowland sites being in Cambodia and Viet Nam and the high-altitude sites in Lao
PDR, Thailand, and Viet Nam. Water width in the rivers varied from 11 to 2660 m, and tended
to be greater as the altitude decreased (Figure 3.1).
3000
2500
2000
1500
er width (m)
R
iv
1000
500
00
100
200
300
400
500
600
Altitude (m)
Figure 3.1 Relationship between river width and altitude.
Water temperature ranged from 16.7 şC in a small, high-altitude river in Lao PDR to
31.4 şC at a site in Cambodia, with an overall average of 27.7 şC. As would be expected,
temperature tended to be lower at the higher altitudes, although there was considerable variation
(Figure 3.2).
35
30
C
)
o e (
a
tur
25
T
emper
20
150
100
200
300
400
500
600
Altitude (m)
Figure 3.2 Relationship between average water temperature and altitude.
Page 22
Environmental variables
The concentration of dissolved oxygen was generally high, ranging from 2.7 to 10.5 mg/L
with an average of 7.1 mg/L. DO was generally lower where temperature was higher, usually
in low-elevation sites, which was expected because the solubility of oxygen is lower in warmer
water (Figure 3.3).
11
10
9
8
7
x
y
gen (mg/L)
6
ed o
5
Dissolv
4
3
215
20
25
30
35
Temperature (oC)
Figure 3.3 Relationship between average water temperature and average dissolved oxygen
concentration.
The water was slightly alkaline at most of the sites, with pH varying between 5.2 and 8.6,
with an overall average of 7.5. EC was generally low, varying from 3.9 to 76.7 mS/m with an
average of 15.3 mS/m. Lower conductivity was found in tributary sites, whereas higher values
were found at the sites in the main channel and those with human disturbance or in limestone
catchments. Higher pH values tended to be associated higher EC (Figure 3.4).
9
8
pH
7
6
50
20
40
60
80
Electrical conductivity (mS/m)
Figure 3.4 Relationship between average electrical conductivity and average pH.
Page 23
Biomonitoring of the lower Mekong River and selected tributaries, 2004 2007
Water transparency (Secchi depth) was variable, and ranged from 0.2 m to 3.4 m with an
overall average of 1.0 m. Turbidity ranged from 2.4 to 71.1 NTU with an average of 15.3 NTU,
and as expected was inversely related to transparency (Figure 3.5).
3.5
3.0
2.5
y (m)
2.0
enc
1.5
T
r
anspar
1.0
0.5
0.00
20
40
60
80
Turbidity (NTU)
Figure 3.5 Relationship between average turbidity and average transparency. Turbidity was not
measured in 2004 or 2005.
Chlorophyll-a concentrations were generally low, ranging between 0.2 and 4.0 µg/L, except
for a value of 33.6 µg/L in Tonle Sap at Phnom Penh Port. Chlorophyll-a concentration was
negatively related to transparency, suggesting that phytoplankton levels were limited by light
availability (Figure 3.6).
100
10
yll-a (ug/L)
oph
Chlor
1
0.1 0
0.5
1.0
1.5
2.0
2.5
3.0
3.5
Secchi depth (m)
Figure 3.6
Relationship between average transparency (Secchi depth) and average chlorophyl -a
concentration (plotted on a logarithmic scale). Chlorophyll a was not measured in 2004 or 2005.
Page 24
Environmental variables
Inter-annual changes
Twenty of the 55 sites were sampled in two or more years. Often, values of environmental
variables were similar at the same site in different years, for example EC (Figure 3.7). Other
variables such as DO varied more at a site between years (Fig. 3.8). However, DO typically
fluctuates even within the same day, because of variations in sunlight and temperature and
consequent differences in oxygen exchange with the atmosphere, the release of oxygen by
aquatic organisms via photosynthesis, and uptake for respiration. The most notable inter-annual
difference in pH was a low value of 5.2 at site CKM in 2006 compared to 7.5 and 7.8 in 2005
and 2007 respectively.
80
80
60
60
y 2005 (mS/m)
y 2006 (mS/m)
tivit 40
tivit 40
onduc
onduc
ical c 20
ical c 20
tr
tr
Elec
Elec
0
0
0
20
40
60
80
0
20
40
60
80
Electrical conductivity 2004 (mS/m)
Electrical conductivity 2004 (mS/m)
80
80
60
60
y 2007 (mS/m)
y 2006 (mS/m)
tivit 40
tivit 40
onduc
onduc
ical c 20
ical c 20
tr
tr
Elec
Elec
0
0
0
20
40
60
80
0
20
40
60
80
Electrical conductivity 2004 (mS/m)
Electrical conductivity 2005 (mS/m)
80
80
60
60
y 2007 (mS/m)
y 2007 (mS/m)
tivit 40
tivit 40
onduc
onduc
ical c 20
ical c 20
tr
tr
Elec
Elec
0
0
0
20
40
60
80
0
20
40
60
80
Electrical conductivity 2005 (mS/m)
Electrical conductivity 2006 (mS/m)
Figure 3.7 Relationships between electrical conductivity values measured at the same site in
different years.
Page 25
Biomonitoring of the lower Mekong River and selected tributaries, 2004 2007
11
11
10
10
9
9
8
8
7
7
x
y
gen 2005 (mg/L)
6
x
y
gen 2006 (mg/L)
6
ed o
5
ed o
5
4
4
Dissolv
Dissolv
3
3
2
2
2
3
4
5
6
7
8
9 10 11
2
3
4
5
6
7
8
9 10 11
Dissolved oxygen 2004 (mg/L)
Dissolved oxygen 2004 (mg/L)
11
11
10
10
9
9
8
8
7
7
x
y
gen 2007 (mg/L)
6
x
y
gen 2006 (mg/L)
6
ed o
5
ed o
5
4
4
Dissolv
Dissolv
3
3
2
2
2
3
4
5
6
7
8
9 10 11
2
3
4
5
6
7
8
9 10 11
Dissolved oxygen 2004 (mg/L)
Dissolved oxygen 2005 (mg/L)
11
11
10
10
9
9
8
8
7
7
x
y
gen 2007 (mg/L)
6
x
y
gen 2007 (mg/L)
6
ed o
5
ed o
5
4
4
Dissolv
Dissolv
3
3
2
2
2
3
4
5
6
7
8
9 10 11
2
3
4
5
6
7
8
9 10 11
Dissolved oxygen 2005 (mg/L)
Dissolved oxygen 2006 (mg/L)
Figure 3.8 Relationships between dissolved oxygen values measured at the same site in
different years.
Relationships with the site disturbance score
The average SDS did not exhibit any significant relationship with some of the environmental
variables measured in this survey (Table 3.1). This would be expected for altitude, which is not
affected by human activity. Other variables, such as pH and temperature, although potentially
affected by human activities, are also subject to wide natural variations which may mask any
human impact. However, water transparency and dissolved oxygen concentration both showed
significant negative relationships with the SDS. Human disturbance often increases the rate
of bank and catchment erosion, resulting in greater concentrations of suspended particles that
Page 26
Environmental variables
reduce transparency. It also frequently increases the loading of organic matter, which consumes
dissolved oxygen as it decays.
It should be remembered that the SDS is a visual assessment by the survey team at a single
point in time, and should not be expected to precisely reflect all human factors impacting on a
site in the long term.
Table 3.1 Probability and R2 values resulting from linear regression analyses of selected
environmental variables on the Site Disturbance Score (n=77).
Variable
p value
R2
Altitude
0.46
0.007
River width
0.35
0.012
Secchi depth
<0.001
0.212
Temperature
0.24
0.019
Dissolved oxygen
<0.001
0.141
pH
0.18
0.024
Electrical conductivity
0.45
0.008
3.4 Discussion
The environmental variables were mostly within the natural ranges expected for surface waters
in the region. The temperature, DO, pH and EC values were generally within the acceptable
ranges for protection of aquatic ecosystems according to the standards for surface water quality
set by Cambodia, Thailand and Viet Nam (PCD, 2004; MRC, 2005).
DO values were mostly high, even at some sites showing evidence of human disturbance
from villages, agriculture or dam construction. Out of 77 visits at 51 sites over the four years,
there were only six occasions when DO was lower than the minimum concentration considered
suitable for aquatic life by MRC (5 mg/L). However, it should be noted that DO was measured
in daytime and concentrations are likely to be lower at night. The distinctly low pH value of
5.2 at site CKM may have been caused by recent activities upstream, and a high EC at site TSK
(76.7 mS/m) may have been a result of contamination from saline land upstream.
High turbidity at some sites may have been a natural phenomenon related to the soil type
and storms prior to sampling. However, high values at site VSR were apparently caused by
sediments released from a dam construction site, located 6 km upstream.
Page 27
Biomonitoring of the lower Mekong River and selected tributaries, 2004 2007
Page 28
4. Benthic diatoms
4.1 Introduction
Benthic diatoms are microscopic plants that are an important base for the pathway by which
energy and nutrients enter the invertebrate and vertebrate food web in the Mekong River
and other fresh waters. In the biomonitoring programme, the diatoms represent the primary
producer trophic level; all of the other groups examined represent consumer levels. Primary
consumers include the invertebrates that graze on the diatoms that are attached to hard surfaces;
secondary consumers include the invertebrate and vertebrate predators that feed on the primary
consumers. As a result of this connection, the diatoms provide an important link between the
chemical and physical settings that ultimately determine primary productivity in the system and
the secondary productivity of the invertebrates described in later chapters.
There are numerous scientific papers and publications that document the advantages of
using diatoms in biomonitoring programmes (Table 1.1). In particular, diatoms are easy to
sample, they are very diverse, and they respond in many ways to physical and chemical change.
Because they have a short generation time, they respond quickly to environmental changes and
recovery rapidly from most disturbances. They have more rapid responses to nutrient inputs
than the other biological groups sampled in this project. As with all groups, there are some
reported disadvantages in their use (Table 1.2). Identification requires specialist taxonomic
skills that may require years of training to develop and analytical metrics for diatoms are not as
firmly based in ecological theory or empirical studies as those for macroinvertebrates and fish.
Diatoms have been well studied in Southeast Asia, most recently through the extensive
studies of the Algal Research Laboratory at Chiang Mai University and their collaborators.
Broader application of diatoms in biomonitoring likely would result if an identification manual
specific to Southeast Asia, including information on ecological tolerances and preferences, were
available.
This chapter describes the diatom assemblages recorded in the biomonitoring programme
from 2004 to 2007, and their relationships with environmental variables.
4.2 Methods
Sampling and sample processing
Locations for sampling of benthic diatoms were chosen where the water depth was less than
1 m and suitable substrata extended over a distance of 100 m. The most appropriate substrata
were cobbles and other grades of stones with a surface area greater than 10 cm2, but that were
still small enough to fit in a sampling bowl of 20 30 cm diameter. At sites where the river bed
was predominantly muddy or sandy and lacked suitable sized stones, samples were taken from
Page 29
Biomonitoring of the lower Mekong River and selected tributaries, 2004 2007
bamboo sticks, aquatic plants, and artificial materials. At each site, ten samples were taken at
intervals of about 10 m. Samples were removed from stones chosen because they were coated
with a thin brownish film or had a slippery feel. These characteristics are often indicative of the
presence of an abundance of benthic diatoms. Where there were no suitable stones, the nearest
hard substratum was sampled instead. To sample the diatoms, a plastic sheet with a square,
10 cm2 `cutout' was placed on the upper surface of the stone or other substratum, and benthic
diatoms were brushed and washed off into a plastic bowl until the cut-out area was completely
clear. Each sample was transferred to a plastic container labelled with the site location code,
date of sampling, and replicate number. The collector's name and the type of substratum were
also recorded. Samples were preserved with Lugol's solution.
In the laboratory, the samples were cleaned by digestion in concentrated acid, and then
centrifuged at 3500 rpm for 15 minutes. The diatom cells (the brown layer between the
supernatant and solid particles) were siphoned into an 18 cm core tube. Strong acid (H SO ,
2
4
HCl or HNO ) was added and the tubes were heated in a boiler (70-80 şC) for 30 45 minutes.
3
The samples were then rinsed with de-ionized water 4 5 times and adjusted to a volume
of 1 mL. A sub-sample of each sample (a drop with a volume of 0.02 ml) was placed on a
microscope slide and dried. A mounting agent such as Naphrax or Durax was added to make
a permanent slide for diatom identification and counting, which were done under a compound
microscope. Identification was based on frustule type, size, special characteristics, and structure,
as described and illustrated in textbooks, monographs and other publications on tropical and
temperate diatoms (Foged, 1971, 1975, 1976; Krammer & Lange-Bertalot, 1986, 1988, 1991a,
1991b; Pfister, 1992). In many cases identification to described species was not possible and
presumptive species were designated by numbers. The total count of cells on the slide can
be used to estimate density, i.e. the number of cells counted multiplied by five is the number
per cm2 sampled. The permanent slides are kept in the Applied Algal Research Laboratory
Collection at Chiang Mai University.
Derivation of biological indicators
Three biological indicators were calculated for all diatom samples: richness (the number of taxa
of diatoms identified from each sub-sample), abundance (the number of individual diatoms per
sub-sample), and the average tolerance score per taxon (ATSPT).
Harm to the ecosystem is indicated by unnaturally low richness (low biodiversity),
unnaturally low abundance (few organisms present), or an unnaturally high ATSPT. Taxa that
are sensitive to stress, and tend to be absent at stressed sites, have low tolerance scores. Stress-
tolerant species, which are hardy and survive at stressed sites, have high tolerance scores.
Consequently, the average score is higher at sites with environmental stress.
Tolerance scores for individual taxa were derived from the relationship between the presence
and absence of taxa in samples from each study site and the value of the Site Disturbance
Score for that site (see Chapter 2). The tolerance of each species or variety was calculated as
the average Site Disturbance Score for all sites at which that taxon occurred, weighted by the
number of samples per site in which the taxon was recorded. The tolerance values were then
Page 30
Benthic diatoms
re-scaled so that their possible range was from 0 to 100, where 0 represents low tolerance and
100 represents high tolerance to human-generated stress, such as water pollution. The Average
Tolerance Score per Taxon (ATSPT) was then calculated for each sample collected. ATSPT
is simply the average tolerance of all taxa recorded in a sample. A higher value of ATSPT
indicates a more tolerant biota, and hence a more stressed environment.
Linear regression analysis was used to test for statistically significant relationships between
the environmental variables that were measured on all 77 sampling occasions and the average
richness, abundance and ATSPT of the diatom flora. Abundance data were highly skewed and
were therefore converted to logarithms before analysis.
4.3 Results
Biota collected
In total, 218,324 diatoms comprising 177 species and varieties were identified from 770 algal
samples collected (Appendix 2 and 3).
Richness
Average richness per sub-sample ranged from 3.9 to 20.6 taxa (Appendix 2 and 3), and was
significantly positively-related to site altitude and negatively related to water temperature
(Figure 4.1).
25
25
R2 = 0.237
R2 = 0.127
P < 0.001
P = 0.002
20
20
15
ichness
15
ichness
age r
age r
10
10
A
v
er
A
v
er
5
5
0
0
0
100 200 300 400 500 600
15
20
25
30
35
Altitude (m)
Temperature (oC)
Figure 4.1 Statistically significant relationships of average richness of diatoms to environmental
variables.
Page 31
Biomonitoring of the lower Mekong River and selected tributaries, 2004 2007
Abundance
The average number of diatoms per sub-sample ranged from 46 to 1 338 (Appendix 2 and 3), and
the logarithm of average abundance was significantly positively-related to water transparency
(Secchi depth) (Figure 4.2).
3.5
R2 = 0.052
e)
P = 0.047
3.0
2.5
age abundanc
v
er
(a 10 2.0
L
og
1.5
0.0 0.5 1.0 1.5 2.0 2.5 3.0 3.5
Secchi depth (m)
Figure 4.2 Statistically significant relationship of average abundance of diatoms to Secchi depth.
Average Tolerance Score Per Taxon
The tolerance scores for individual taxa of benthic diatoms varied from 4 to 81 (Appendix 2 and 3).
The average ATSPT per sub-sample ranged from 30 to 51, and was significantly positively-
related to the Site Disturbance Score, and significantly negatively-related to Secchi depth,
dissolved oxygen concentration and pH (Figure 4.3).
4.4 Discussion
The significant positive relationship of diatom species richness with altitude and the significant
negative relationship with temperature indicates that higher-elevation, and hence cooler sites,
had a richer diatom flora. This might have been a result of greater human disturbance at lower
altitudes, but since the Site Disturbance Score did not correlate significantly with altitude
(Chapter 3), a more likely explanation is that richness was influenced by habitat suitability.
The sites at higher altitude often had an abundance of stony substrata, which support a wide
variety of diatom species, whereas less suitable sandy and muddy substrata predominated at
lower elevations. A similar explanation may apply to the significant relationships for diatom
abundance, whereby density was greater at cooler sites with greater water clarity, which tended
to be upland sites with abundant stony substrata.
Page 32
Benthic diatoms
55
55
R2 = 0.675
R2 = 0.292
50 P < 0.001
50
P < 0.001
45
45
T
SPT
T
SPT
40
40
age A
age A
A
v
er 35
A
v
er
35
30
30
25
25
1.0
1.5
2.0
2.5
3.0
0
1
2
3
4
Site disturbance score
Secchi depth (m)
55
55
50
50
45
45
T
SPT
T
SPT
40
age A
40
age A
A
v
er
35
A
v
er
35
30
R2 = 0.094
30
R2 = 0.063
P = 0.007
P = 0.027
25
25
2
3
4
5
6
7
8
9 10 11
5
6
7
8
9
Dissolved oxygen (mg/L)
pH
Figure 4.3 Statistically significant relationships of average ATSPT of diatoms to environmental
variables.
The ATSPT for diatoms showed obvious relationships with human activity. Its strong
relationship with the Site Disturbance Score was to be expected since the SDS was used to
derive the tolerance values for individual diatom taxa. However, the strong relationships of
ATSPT with Secchi depth and dissolved oxygen, which are well known to be affected by human
disturbances such as wastewater disposal and removal of bank vegetation, provide independent
corroboration of the sensitivity of ATSPT as an indicator of human impact. The negative
association between ATSPT and pH suggests that this indicator will also reflect acidification,
e.g. from acid sulphate soils.
Page 33
Biomonitoring of the lower Mekong River and selected tributaries, 2004 2007
Page 34
5. Zooplankton
5.1 Introduction
Zooplankton are tiny, swimming, animals, that are represented mostly by crustaceans, rotifers,
and protozoans. They include both primary consumers that feed on phytoplankton and
secondary consumers that feed on other zooplankton. They are a major component of the diet
of fishes, especially small fish and the larvae of larger fish, and are therefore essential to the
productivity of the Mekong fishery.
Relative to diatoms and macroinvertebrates, zooplankton have not been widely used
in biological monitoring studies. According to the scientific literature (Table 1.1), they do
offer specific advantages for biomonitoring in that they are a diverse group with a variety
of species having a range of responses to environmental changes. Like diatoms, they have
a short generation time and thus a rapid response to environmental changes and recovery
from disturbance. There are reported disadvantages associated with the use of zooplankton in
biological monitoring programs as well (Table 1.2). There are sampling issues associated with
their daily fluctuations in abundance and composition, and patchy spatial distributions related to
current and depth. As with diatoms, there are few metrics or indices that have been proved to be
consistently effective in biomonitoring programs.
Most research on zooplankton in the region has been on taxonomy and species distributions,
and importance as fish food. An taxonomic key (which is currently unavailable) to assist
the identification of zooplankton species, would help facilitate the use of these animals for
biomonitoring on a regional scale.
This chapter describes the zooplankton assemblages recorded from 77 sampling events at 51
sites in 2004 07 and their relationships with environmental variables.
5.2 Methods
Sampling and sample processing
Three samples were collected at each site. One was taken near the left bank of the river, at
a distance of about 4 5 m from the water's edge. A separate sample was taken at a similar
distance from the right bank, and another in the middle of the river. The samples were taken at
least 1 m from potentially contaminating substances such as debris and aquatic plants, and at
least 2 m from vertical banks. At sites where the water current was too fast to sample exactly in
the mid-stream, samples were collected closer to the left or the right bank, but not as close to
the bank as where the `side samples' were taken.
Page 35
Biomonitoring of the lower Mekong River and selected tributaries, 2004 2007
Before sampling at each site, the sampling equipment (a net, bucket, and plastic jar) was
washed to remove any organisms and other matter left from the previous site. Quantitative
samples were collected at a depth of 0 to 0.5 m in a bucket having a volume of 10 L. The
10 L of river water collected was filtered slowly through a plankton net (mesh size of 20 m) to
avoid any overflow. When the water volume remaining in the net was about 150 mL, the water
was transferred to a plastic jar (250 mL volume). The samples were immediately fixed in the
field with 4% formaldehyde. The sample jars were labelled with the site code, sampling date,
and sampling position.
In the laboratory, large particles of debris were removed from the samples with forceps.
Each sample was filtered via a net with a mesh size of 10 m and rinsed with distilled water,
and then settled in a graduated cylinder. Excess water was discarded until about 50 mL of
water and settled material remained. This was transferred into a petri dish and examined under
a stereomicroscope at a magnification of 40x to identify the large species of zooplankton
(> 50 m in diameter). The smaller species and details of larger species were examined
on a microscope slide under a compound microscope at a magnification of 100 400x. All
individuals collected were counted and identified to lowest level of taxonomy possible,
generally species. Identification was based on morphology as described in Vietnamese and
international references (e.g. Dang et al., 1980; Eiji, 1993) After analysis, samples were
returned to the bottles and preserved. All specimens are kept at Ton Duc Thang University, Ho
Chi Minh City, Viet Nam.
Derivation of biological indicators
Three biological indicators were calculated for all zooplankton samples: richness (the number
of taxa of zooplankton identified from each sample), abundance (the number of individual
zooplankton per sample), and the average tolerance score per taxon (ATSPT).
Harm to the ecosystem is indicated by unnaturally low richness (low biodiversity),
unnaturally low abundance (few organisms present) or an unnaturally high ATSPT. Taxa that
are sensitive to stress, and tend to be absent at stressed sites, have low tolerance scores. Stress-
tolerant species, which are hardy and survive at stressed sites, have high tolerance scores.
Consequently, the average score is higher at sites with environmental stress.
Tolerance scores for individual taxa were derived from the relationship between the presence
and absence of taxa in samples from each study site and the value of the Site Disturbance Score
for that site (see Chapter 2). The tolerance of each taxon was calculated as the average Site
Disturbance Score for all sites at which that taxon occurred, weighted by the number of samples
per site in which the taxon was recorded. The tolerance values were then re-scaled so that their
possible range was from 0 to 100, where 0 represents low tolerance and 100 represents high
tolerance to human-generated stress such as water pollution. The Average Tolerance Score per
Taxon (ATSPT) was then calculated for each sample collected. ATSPT is simply the average
tolerance of all taxa recorded in a sample. A higher value of ATSPT indicates a more tolerant
biota, and hence a more stressed environment.
Page 36
Zooplankton
Linear regression analysis was used to test for statistically significant relationships between
the environmental variables that were measured on all 77 sampling occasions and the average
richness, abundance and ATSPT of the zooplankton fauna. Abundance data were highly skewed
and were therefore converted to logarithms before analysis.
5.3 Results
Biota collected
A total of 86,076 individuals was recorded from 231 samples collected in 2004 2007,
comprising 207 taxa (Appendix 2 and 3).
Richness
Average richness per sample ranged from 6.3 to 40.0 taxa (Appendix 2 and 3), and was
significantly negatively-related to dissolved oxygen concentration and pH (Figure 5.1).
40
40
R2 = 0.142
R2 = 0.052
P < 0.001
P = 0.046
30
30
ichness 20
20
age r
A
v
er
A
v
e
r
a
g
e
r
i
c
h
n
e
s
s
10
10
0
0
2
3
4
5
6
7
8
9 10 11
5
6
7
8
9
Dissolved oxygen (mg/L)
PH
Figure 5.1 Statistically significant relationships of average richness of zooplankton to
environmental variables.
Abundance
The average number of zooplankters per sample ranged from 8 to 8 394 (Appendix 2 and 3), and
the logarithm of average abundance was significantly positively-related to the Site Disturbance
Score and electrical conductivity, and significantly negatively-related to the concentration of
dissolved oxygen (Figure 5.2).
Page 37
Biomonitoring of the lower Mekong River and selected tributaries, 2004 2007
4
4
R2 = 0.089
P = 0.009
3
3
b
u
n
d
a
n
c
e
)
b
u
n
d
a
n
c
e
)
2
2
(
a
v
e
r
a
g
e a
(
a
v
e
r
a
g
e a
1
1
L
o
g 10
L
o
g 10
R2 = 0.126
P = 0.002
0
0
1.0
1.5
2.0
2.5
3.0
0
10 20 30 40 50 60 70 80
Site disturbance score
Electrical conductivity (mSm)
4
e)
3
2
age abundanc
v
er
(a 10 1
L
og
R2 = 0.072
P = 0.019
0
2
3
4
5
6
7
8
9 10 11
Dissolved oxygen (mg/L)
Figure 5.2 Statistically significant relationships of average abundance of zooplankton to
environmental variables.
Average Tolerance Score Per Taxon
The tolerance scores for individual taxa of zooplankton varied from 0 to 94 (Appendix 2 and 3).
The average ATSPT per sample ranged from 23 to 48, and was significantly positively-related
to the Site Disturbance Score, river width and water temperature, and significantly negatively-
related to altitude, Secchi depth and dissolved oxygen concentration (Figure 5.3).
Page 38
Zooplankton
50
50
45
45
40
40
T
S
P
T
T
S
P
T
35
35
A
v
e
r
a
g
e A
30
A
v
e
r
a
g
e A
30
25
R2 = 0.423
25
R2 = 0.081
P < 0.001
P = 0.012
20
20
1.0
1.5
2.0
2.5
3.0
0
1000
2000
3000
Site disturbance score
River width (m)
50
50
45
45
40
40
T
SPT
T
S
P
T
35
35
age A
A
v
er
30
A
v
e
r
a
g
e A
30
25
R2 = 0.186
25
R2 = 0.133
P < 0.001
P < 0.001
20
20
15
20
25
30
35
0
100 200 300 400 500 600
Temperature (oC)
Altitude (m)
50
50
45
45
40
40
T
SPT
T
SPT
35
age A
35
age A
A
v
er
30
A
v
er
30
25 R2 = 0.213
25 R2 = 0.195
P < 0.001
P < 0.001
20
20
0.0 0.5 1.0 1.5 2.0 2.5 3.0 3.5
0
5
10
15
Secchi depth (m)
Dissolved oxygen (mg/L)
Figure 5.3 Statistically significant relationships of ATSPT of zooplankton to environmental
variables.
Page 39
Biomonitoring of the lower Mekong River and selected tributaries, 2004 2007
5.4 Discussion
The tendency for zooplankton taxon richness and abundance to be lower at sites with high
dissolved oxygen concentrations may seem surprising because higher oxygen levels are often
associated with an absence of organic pollution. However, the relationship may be indirect.
Dissolved oxygen concentrations are also often high at sites of higher elevation because of the
increased solubility of oxygen in cooler water. The high-elevation sites were often on smaller
streams (Chapter 3) with faster current velocities, which are habitat conditions that are not
favoured by many zooplankton species.
Zooplankton abundance also tended to be higher at sites with higher Site Disturbance
Scores. Some human-generated disturbances such as mild to moderate organic and nutrient
enrichment may act as a stimulus to zooplankton by increasing the availability of food in the
form of planktonic algae and small, non-living organic particles. Similar processes may underlie
the positive relationship between zooplankton abundance and electrical conductivity.
The ATSPT for zooplankton had several significant relationships with environmental
variables: the zooplankton fauna tended to be more tolerant of human-generated stress at sites
with a high level of human disturbance (as expected from the use of the Site Disturbance Score
to derive the tolerance values for individual zooplankton taxa), but also at wide, warmer, low-
altitude sites with lower water clarity and lower dissolved oxygen concentrations. Sites with the
latter two characteristics, in particular, are often those with a higher level of human influence.
Page 40
6. Littoral macroinvertebrates
6.1 Introduction
Littoral macroinvertebrates occur in the near-shore areas of rivers and are mainly insects,
crustaceans, molluscs, and worms. Some animals occupying this habitat live in or on the river
bed while others swim in the water column. The littoral fauna comprises both primary and
secondary consumers and includes grazers that scrape diatoms and other material from hard
surfaces, shredders that break down leaves and other coarse organic materials, filterers that trap
small organic particles moving through the water column, deposit feeders that ingest settled
organic particles, and predators. These organisms are an important component of the food web.
Macroinvertebrates in general are the organisms that are most widely used in biomonitoring
programs. The scientific literature indicates that macroinvertebrates offer many advantages in
biomonitoring (Table 1.1), such as being abundant and widespread in littoral and other habitats,
and highly diverse with many species that exhibit a variety of responses to environmental
change. They have limited mobility and hence can be used to infer local conditions, and
are easily sampled with little specialized training or effort. Because some species have long
generation times, they can indicate transient stressors (e.g. periodic spills) that may not be
chronic problems. Some disadvantages in their use have been reported, such as seasonal
fluctuations in abundance and composition, and the training required for precise identifications
(Table 1.2). However, an identification key to the macroinvertebrates of the Lower Mekong
River has recently been prepared (Sangpradub and Boonsoong, 2004).
This chapter describes the littoral macroinvertebrate assemblages recorded from 77 sampling
events at 51 sites in 2004 07 and their relationships with environmental variables.
6.2 Methods
Sampling and sample processing
Littoral macroinvertebrate samples usually were taken on only one side of the river at each
site. In most instances this was the depositional side where sampling was easier because of
the gradual shelving of the bottom that occurs in this setting in contrast to the steeper bottom
that is characteristic of the erosional side. In addition, the depositional side tends to support
more aquatic vegetation, which also provides more habitat suitable for invertebrates. Because
the study area was large, a wide range of littoral habitat types was sampled. As far as possible,
similar habitats were selected at each site to facilitate comparisons among sites.
A D-frame net with 30 cm x 20 cm opening and mesh size of 475 m was used to take
two types of samples: sweep and kick samples. Sweep samples were taken along the shore at
intervals of about 20 m. To obtain each sweep sample, the collector stood in the river about
Page 41
Biomonitoring of the lower Mekong River and selected tributaries, 2004 2007
1.5 m from the water's edge and swept the net 10 times along the substrate toward the bank, in
positions that did not overlap. Kick sampling was done off-riverbank in areas of rapid current,
and involved kicking the substrate in an area of 30 x 30 cm, or using fingers to disturb this area,
for about 20 seconds, with the net held downstream to catch dislodged animals. A range of
substrates was sampled, including cobbles, gravel, sand, silt, mud, and aquatic plants.
Between five and ten sweep samples were taken per site for all 77 sampling events. Five
kick samples per site were taken at those sites where suitable habitat was present, except in
2004 when no kick samples were collected.
After sample collection, the net contents were washed to the bottom of the net. The net was
inverted and its contents were emptied into a metal sorting tray, with any material adhering to
the net being washed off with clean water. Invertebrates were picked from the tray with forceps
and placed in a jar of 70% ethanol. Small samples were kept in 30 mL jars and large samples
were kept in 150 mL jars. During the picking process, the tray was shaken from time to time
to redistribute the contents, and tilted occasionally to look for animals adhering to it. Sorting
proceeded by working back and forth across the tray until no more animals were found. The
sample jars were labelled with the site location code, date, and sample replicate number. The
collector's name, the sampling site, and replicate characteristics (including substratum types
sampled) were recorded in a field notebook.
In the laboratory, the samples were identified under a stereomicroscope with a 2-4x objective
lens and a 10x eyepiece. Identification was done to the lowest taxonomic level that could be
applied accurately, which was usually to genus. The references used for identification included
Sangpradub and Boonsoong (2004), Nguyen et al. (2000), and Merritt and Cummins (1996).
Specimens were divided into orders, kept in separate jars. All specimens were stored in the
Department of Biology at the National University of Laos.
Derivation of biological indicators
Three biological indicators were calculated for all littoral macroinvertebrate samples: richness
(the number of taxa of macroinvertebrates identified from each sample), abundance (the
number of individual macroinvertebrates per sample), and the average tolerance score per taxon
(ATSPT).
Harm to the ecosystem is indicated by unnaturally low richness (low biodiversity),
unnaturally low abundance (few organisms present) or an unnaturally high ATSPT. Taxa that
are sensitive to stress, and tend to be absent at stressed sites, have low tolerance scores. Stress-
tolerant species, which are hardy and survive at stressed sites, have high tolerance scores.
Consequently, the average score is higher at sites with environmental stress.
Tolerance scores for individual taxa were derived from the relationship between the presence
and absence of taxa in samples from each study site and the value of the Site Disturbance Score
for that site (see Chapter 2). The tolerance of each taxon was calculated as the average Site
Page 42
Littoral macroinvertebrates
Disturbance Score for all sites at which that taxon occurred, weighted by the number of samples
per site in which the taxon was recorded. The tolerance values were then re-scaled so that their
possible range was from 0 to 100, where 0 represents low tolerance and 100 represents high
tolerance to human-generated stress such as water pollution. The Average Tolerance Score per
Taxon (ATSPT) was then calculated for each sample collected. ATSPT is simply the average
tolerance of all taxa recorded in a sample. A higher value of ATSPT indicates a more tolerant
biota, and hence a more stressed environment.
Linear regression analysis was used to test for statistically significant relationships between
the environmental variables that were measured on all 77 sampling occasions and the average
richness, abundance and ATSPT of the littoral macroinvertebrate fauna. Abundance data were
highly skewed and were therefore converted to logarithms before analysis.
6.3 Results
Biota collected
In total, 81,186 individuals and 361 taxa of littoral macroinvertebrates were collected in 2004-
07 (Appendix 2 and 3).
Richness
Average richness per sweep sample ranged from 1.8 to 20.4 taxa (Appendix 2 and 3), and
was significantly positively-related to water transparency (Secchi depth) and significantly
negatively-related to the Site Disturbance Score (Figure 6.1). Average richness per kick sample
was higher, ranging from 5.0 to 39.4 taxa.
25
25
R2 = 0.161
R2 = 0.315
P < 0.001
P = < 0.001
20
20
15
ichness
15
ichness
age r
age r
10
10
A
v
er
A
v
er
5
5
0
0
0
1
2
3
4
1.0
1.5
2.0
2.5
3.0
Secchi depth (m)
Site disturbance score
Figure 6.1 Statistically significant relationships of average richness of littoral macroinvertebrates
(sweep samples) to environmental variables.
Page 43
Biomonitoring of the lower Mekong River and selected tributaries, 2004 2007
Abundance
The average number of littoral invertebrates per sweep sample ranged from 4 to 1627
(Appendix 2 and 3). The logarithm of abundance in sweep samples was significantly positively-
related to water transparency (Secchi depth), dissolved oxygen concentration and pH, and
significantly negatively-related to the Site Disturbance Score (Figure 6.2). The average number
of individuals per kick sample had a narrower range from 13 to 466.
4
4
R2 = 0.185
R2 = 0.082
e)
P < 0.001
P = 0.012
e)
3
3
2
2
age abundanc
age abundanc
v
er
v
er
(a
(a
10
1
10
1
L
og
L
og
0
0
0.0 0.5 1.0 1.5 2.0 2.5 3.0 3.5
2
3
4
5
6
7
8
9 10 11
Secchi depth (m)
Dissolved oxygen (mg/L)
4
4
R2 = 0.101
R2 = 0.179
P = 0.005
P < 0.001
e)
e)
3
3
2
2
age abundanc
age abundanc
v
er
v
er
(a
(a
10
1
10
1
L
og
L
og
0
0
5
6
7
8
9
0.0
0.5
1.0
1.5
2.0
2.5
3.0
pH
Secchi depth (m)
Figure 6.2 Statistically significant relationships of average richness of littoral macroinvertebrates
(sweep samples) to environmental variables.
Average Tolerance Score per Taxon
The tolerance scores for individual taxa of lit oral macroinvertebrates ranged from 0 to 84 (Appendix
2 and 3). The average ATSPT for sweep samples ranged from 24 to 46, and was significantly
Page 44
Littoral macroinvertebrates
positively correlated with the Site Disturbance Score and water temperature, and negatively
correlated with altitude, water transparency (Secchi Depth) and dissolved oxygen concentration.
(Figure 6.3).
50
50 R2 = 0.082
45
45 P = 0.012
40
40
T
S
P
T
T
S
P
T
35
35
A
v
e
r
a
g
e A
30
A
v
e
r
a
g
e A
30
25
R2 = 0.695
25
P < 0.001
20
20
1.0
1.5
2.0
2.5
3.0
15
20
25
30
35
Site disturbance score
Temperature (oC)
50
50
R2 = 0.116
R2 = 0.133
45
P = 0.012
45
P < 0.001
40
40
T
SPT
T
S
P
T
35
35
age A
A
v
er
30
A
v
e
r
a
g
e A
30
25
25
20
20
0
100 200 300 400 500 600
0.0 0.5 1.0 1.5 2.0 2.5 3.0 3.5
Altitude (m)
Secchi depth (m)
50
R2 = 0.190
45
P < 0.001
40
T
SPT
35
age A
A
v
er
30
25
20
0
5
10
15
Dissolved oxygen (mg/L)
Figure 6.3 Statistically significant relationships of average ATSPT of littoral macroinvertebrates
(sweep samples) to environmental variables.
Page 45
Biomonitoring of the lower Mekong River and selected tributaries, 2004 2007
6.4 Discussion
The negative relationships between the richness and abundance of littoral macroinvertebrates
and the Site Disturbance Score suggest that the littoral fauna is particularly susceptible to the
impact of local human activities. Richness and abundance also tended to be higher in clearer
rivers, which may be partly a natural phenomenon but probably also reflects the tendency of
human activities to increase soil erosion and therefore reduce water clarity. Reduced water
clarity and associated higher levels of suspended particles can adversely affect the littoral
fauna by clogging of the gills of sensitive species and by decreasing light penetration and
hence reducing algal food sources. As reported in Chapter 4, the density of benthic diatoms, a
common food source for macroinvertebrates, tended to be greater at sites with clearer waters.
The positive relationship of abundance of littoral macroinvertebrates with dissolved oxygen
concentration was expected, because many littoral species are sensitive to low dissolved-
oxygen concentrations resulting from organic pollution. The positive correlation between
abundance and pH may have been related to food availability, since high algal production is
typically associated with a higher pH.
As expected, the ATSPT was strongly correlated with the Site Disturbance Score that
was used in the derivation of tolerance values for individual taxa, but it was also correlated
with water transparency (Secchi depth) and dissolved oxygen, indicating that sensitive
macroinvertebrate taxa favour clear, well oxygenated waters.
Page 46
7. Benthic macroinvertebrates
7.1 Introduction
The benthic macroinvertebrates are those organisms that occur in or on the bed of rivers,
including those parts in deep water away from the littoral zone. The deepwater benthos includes
the same major groups as that of the littoral zone, but is usually less diverse. Most deepwater
species are deposit feeders that consume small particles of organic matter or filter feeders that
remove particles from the water column.
Of the biomonitoring advantages reported in the scientific literature, the ones that
specifically apply to benthic macroinvertebrates are that they have limited mobility and reflect
local conditions, and that because some species are long lived they may reflect conditions that
are not chronic problems (Table 1.1). The disadvantage of benthic macroinvertebrates is that
some of the species may be very difficult to identify to precise taxonomic levels, even more so
than for the littoral macroinvertebrates (Table 1.2).
This chapter describes the benthic macroinvertebrate assemblages recorded from 77
sampling events at 51 sites in 2004 07 and their relationships with environmental variables.
7.2 Methods
Sampling and sample processing
Sample locations at each site were selected in each of the right, middle, and left parts of the
river. Five locations were sampled at each of these parts of the river. At some sites, the middle
of river could not be sampled because of the presence of hard beds or fast currents. Also, sites
narrower than 30 m were sometimes not sampled in the middle portion. Prior to sampling, all
the equipment to be used was thoroughly cleaned to remove any material left from the previous
sampling site.
At each sampling location, a composite of four grabs was taken with a Petersen grab
sampler, covering a total area of 0.1 m2. If the sampler did not close properly because material
such as wood, bamboo, large water-plants, or stones jammed its jaws, its contents were
discarded and another grab was taken. The composite sample was washed through a sieve
(0.3 mm) with care taken to ensure that macroinvertebrates did not escape. The contents of the
sieve were then placed in a white sorting tray and dispersed in water. All the animals in the tray
were picked out with forceps and pipettes, placed in jars, and fixed with formaldehyde. Samples
of less experienced sorters were checked by an experienced sorter. The sample jar was labelled
with the site location code, date, position within the river, and replicate number. The sampling
location conditions, collector's name and sorter's name were recorded on a field sheet.
Page 47
Biomonitoring of the lower Mekong River and selected tributaries, 2004 2007
Sometimes, samples could not be sorted on site because the boat was poorly balanced,
because a very large number of animals was collected, because there was insufficient time at a
site, or because the presence of lumps of clay caused the samples to cloud continually. In these
cases, samples were sorted in the laboratory.
All individuals collected were identified and counted under a compound microscope (with
magnifications of 40 1200x) or a dissecting microscope (16 56x). Oligochaeta, Gastropoda,
Bivalvia, and Crustacea were generally identified to species level. Insecta and Insecta larvae
were classified only to genus level. The results were recorded on data sheets and specimens are
kept at the Ton Duc Thang University, HCMC, Viet Nam.
Derivation of biological indicators
Three biological indicators were calculated for all benthic macroinvertebrate samples: richness
(the number of taxa of macroinvertebrates identified from each sample), abundance (the
number of individual macroinvertebrates per sample), and the average tolerance score per taxon
(ATSPT).
Harm to the ecosystem is indicated by unnaturally low richness (low biodiversity),
unnaturally low abundance (few organisms present) or an unnaturally high ATSPT. Taxa that
are sensitive to stress, and tend to be absent at stressed sites, have low tolerance scores. Stress-
tolerant species, which are hardy and survive at stressed sites, have high tolerance scores.
Consequently, the average score is higher at sites with environmental stress.
Tolerance scores for individual taxa were derived from the relationship between the presence
and absence of taxa in samples from each study site and the value of the Site Disturbance Score
for that site (see Chapter 2). The tolerance of each taxon was calculated as the average Site
Disturbance Score for all sites at which that taxon occurred, weighted by the number of samples
per site in which the taxon was recorded. The tolerance values were then re-scaled so that their
possible range was from 0 to 100, where 0 represents low tolerance and 100 represents high
tolerance to human-generated stress such as water pollution. The Average Tolerance Score per
Taxon (ATSPT) was then calculated for each sample collected. ATSPT is simply the average
tolerance of all taxa recorded in a sample. A higher value of ATSPT indicates a more tolerant
biota, and hence a more stressed environment.
Linear regression analysis was used to test for statistically significant relationships between
the environmental variables that were measured on all 77 sampling occasions and the average
richness, abundance and ATSPT of the benthic macroinvertebrate fauna. Abundance data were
highly skewed and were therefore converted to logarithms before analysis.
Page 48
Benthic macroinvertebrates
7.3 Results
Biota collected
In total, 23,470 benthic macroinvertebrates belonging to 177 taxa were collected in 2004 2007
(Appendix 2).
Richness
Average richness per sample ranged from 0.3 to 12.0 taxa (Appendix 2), and was significantly
positively correlated with water transparency (Secchi depth) and pH (Figure 7.1).
12
12 R2 = 0.060
10
10 P = 0.032
8
8
ichness
ichness
6
6
age r
age r
A
v
er 4
A
v
er 4
2
R2 = 0.086
2
P = 0.010
0
0
0.0 0.5 1.0 1.5 2.0 2.5 3.0 3.5
5
6
7
8
9
Secchi depth (m)
pH
Figure 7.1 Statistically significant relationships of average richness of benthic macroinvertebrates
to environmental variables.
Abundance
The average number of individual macroinvertebrates per benthic sample ranged from 1 to 219.
The logarithm of abundance had a significant positive correlation with electrical conductivity
(Figure 7.2).
Page 49
Biomonitoring of the lower Mekong River and selected tributaries, 2004 2007
3
R2 = 0.076
e)
P < 0.001
2
1
age abundanc
v
er
(a 10 0
L
og
-10
20
40
60
80
Electrical conductivity (ms/m)
Figure 7.2 Statistically significant relationship of average abundance of benthic macroinvertebrates
to electrical conductivity.
Average Tolerance Score Per Taxon
The tolerance scores for individual taxa of benthic macroinvertebrates varied from 0 to 94 (Appendix 2).
The average ATSPT per sample ranged from 23 to 63 and had statistically significant positive
correlations with the Site Disturbance Score, river width and water temperature, as well as
statistically significant negative correlations with altitude, water transparency (Secchi depth)
and dissolved oxygen (Figure 7.3).
7.4 Discussion
As for the littoral fauna, the positive relationships of benthic richness with water transparency
and pH may represent a response to greater algal productivity. Reasons for the positive
relationship between benthic abundance and electrical conductivity are not clear, but may have
been an indirect consequence of relationships between EC and other factors, such as substratum
suitability. The associations between the ATSPT of the benthic fauna and environmental
variables were also very similar to those for the littoral fauna, and indicated that the most
tolerant fauna tended to be found in large, warm, turbid, lowland rivers with low dissolved
oxygen concentrations. This is a typical finding for benthic macroinvertebrates worldwide.
Page 50
Benthic macroinvertebrates
65
65
60
60
55
55
50
50
T
S
P
T
T
S
P
T
45
45
40
40
A
v
e
r
a
g
e A
35
A
v
e
r
a
g
e A
35
30
30
R2 = 0.574
R2 = 0.130
25
25
P < 0.001
P < 0.001
20
20
1.0
1.5
2.0
2.5
3.0
0
1000
2000
3000
Site disturbance score
River width (m)
65
65
R2 = 0.192
R2 = 0.201
60 P < 0.001
60
P < 0.001
55
55
50
50
T
SPT
T
S
P
T
45
45
age A 40
40
A
v
er
35
A
v
e
r
a
g
e A
35
30
30
25
25
20
20
15
20
25
30
35
0
100 200 300 400 500 600
Temperature (oC)
Altitude (m)
65
65
R2 = 0.094
R2 = 0.193
60
P = 0.007
60
P < 0.001
55
55
50
50
T
SPT
T
SPT
45
45
age A 40
age A 40
A
v
er
35
A
v
er
35
30
30
25
25
20
20
0.0 0.5 1.0 1.5 2.0 2.5 3.0 3.5
2
3
4
5
6
7
8
9 10 11
Secchi depth (m)
Dissolved oxygen (mg/L)
Figure 7.3 Statistically significant relationships of average ATSPT of benthic macroinvertebrates
to environmental variables.
Page 51
Biomonitoring of the lower Mekong River and selected tributaries, 2004 2007
Page 52
8. The use of biological indicators of harm to classify
and rate sites
As described in previous chapters, three types of indicators of harm to the aquatic ecosystem
were calculated for each of four groups of organisms included in the biomonitoring programme
(diatoms, zooplankton, littoral macroinvertebrates and benthic macroinvertebrates). These
indicators were richness (the number of taxa per standard sample), abundance (the number
of individual organisms per sample), and tolerance (the average tolerance score per taxon
calculated for each sample). Harm to the ecosystem is indicated by low richness (low
biodiversity), low abundance (few organisms present) or a high average tolerance score
(signifying a scarcity of pollution-sensitive species and a predominance of hardy species that
are able to withstand pollution).
Each indicator was calculated for the individual samples of each group of organisms that
were collected when a site was visited. The collection of multiple samples per site enables
assessment of within-site variability of the indicators and also statistical testing of the
significance of differences among sites and within the same site over multiple years. For overall
assessment of a site, the values of each indicator from individual samples were averaged.
Interim guidelines for site-average values of each indicator were set according to the range
of site-average values obtained at the reference sites. For indicators where low values indicate
harm to the ecosystem (richness and abundance) the guideline was set at the 10th percentile of
reference site values (the value that is lower than 90 percent of all reference values). For the
indicator where a high value indicates harm to the ecosystem (tolerance) the guideline was set
at the 90th percentile of reference site values (the value than is higher than 90 percent of all
reference values). These percentiles are commonly used in biomonitoring programmes in other
parts of the world. Interim guidelines are listed in Table 8.1.
Table 8.1 Interim guidelines for biological indicators of harm to the ecosystem.
Indicator
Indication of Biological group
Reference site values
Interim guideline
harm to the
10th
50th
90th
ecosystem
percentile percentile percentile
(median)
Richness (average
Low value
Diatoms
6.54
9.30
11.78
Greater than 6.54
number of taxa per
Zooplankton
9.80
12.67
20.20
Greater than 9.80
standard sample or
sub-sample).
Littoral macroinvertebrates
5.37
11.40
18.48
Greater than 5.37
Benthic macroinvertebrates
1.84
3.87
7.85
Greater than 1.84
Abundance (average Low value
Diatoms
136.22
257.30
376.34
Greater than 136.22
number of individual
Zooplankton
22.33
52.33
174.07
Greater than 22.33
organisms per
standard sample).
Littoral macroinvertebrates
46.68
124.80
328.56
Greater than 46.68
Benthic macroinvertebrates
4.13
18.33
56.34
Greater than 4.13
Tolerance (average
High value
Diatoms
30.85
35.58
38.38
Less than 38.38
of average tolerance
Zooplankton
34.83
38.58
41.80
Less than 41.80
score per taxon per
standard sample).
Littoral macroinvertebrates
27.80
30.72
33.58
Less than 33.58
Benthic macroinvertebrates
31.57
35.36
37.74
Less than 37.74
Page 53
Biomonitoring of the lower Mekong River and selected tributaries, 2004 2007
The sites were classified and grouped according to the number of the 12 indicators that met
the guidelines. Table 8.2 gives definitions of the classification and some characteristics to be
expected for sites in each class. Figure 8.1 and Table 8.3 give the assessment of all sites for
each sampling occasion. Of the 77 sampling events over four years, 28 were in Class A, 32 in
Class B, and 17 in Class C. None was in Class D. This rating suggests that the principal rivers
of Lower Mekong Basin have not yet suffered severe harm from the development of water
resources or waste disposal. However, some rivers are showing signs of stress.
Table 8.2 Definition and characteristics of the classification system.
Class
Rating criterion
Characteristic features
A: Excellent 10 12 of 12 indicators meet Level of biodiversity is the same as reference site conditions.
guidelines
Species composition is dominated by taxa that are sensitive to
pollution.
Ecological capacity of the river to support production of fish and
other biological products within the range of capacity of reference
sites*
Minimal disturbance from human activities.
B: Good
7 9 of 12 indicators meet
Level of biodiversity slightly reduced from reference site
guidelines
conditions.
Species composition has many taxa that are sensitive to pollution.
Ecological capacity of the river to support production of fish and
other biological products slightly below the range of capacity of
reference sites*
Some disturbance from human activities.
C: Moderate 4 6 of 12 indicators meet
Level of biodiversity is notably less than under reference site
guidelines
conditions.
Species composition is a mixture of taxa that are sensitive to
pollution and taxa that are tolerant to pollution.
Ecological capacity of the river to support production of fish and
other biological products moderately below the range of capacity
of reference sites*
Some impacts from human activities.
D: Poor
0 3 of 12 indicators meet
Level of biodiversity significantly altered from reference site
guidelines
conditions.
Species composition dominated by taxa that are tolerant to
pollution.
Ecological capacity of the river to support production of fish
and other biological products far below the range of capacity of
reference sites*
Several negative to extensive adverse impacts from human
activities.
* Ecological capacity to support production of fish means that the riverine food web that fish depend on (including algae,
zooplankton, and macroinvertebrates) is maintained. However, even if ecological capacity is maintained, actual fish
production may be detrimentally affected by other factors such as excessive harvesting, fish diseases, migration barriers
such as dams, and loss of floodplain habitat during the wet season. These factors were not assessed in the biomonitoring
programme.
Page 54
The use of biolological indicators of harm to classify and rate the sites
Viet Nam
LMH
LMX
LOU
TMC
LNO
TKO
TMI
LPB
LNK
Lao PDR
LNM
LNG
LNT
LKD
LVT
TSKTSM
LBF
TNK
Thailand
LBH
TCH
TMM
LSD
LPS
TMU
LKU
LDN
LKL
VSS
CSS
CMR
CKM
CSU
CSJ
CSP
CSK
Cambodia
VSP
CSN
CKT
VSR
CPS
CPT
CTU
CPP
CKL
CNL
Viet Nam
VCD
VTCVCL VTR
Biomonitoring Surveys 2004-2007
VLX
Site Ratings
VCT
Class A: Excellent
Class B: Good
Class C: Moderate
0
100
200 kilometres
Class D: Poor
Figure 8.1 Ratings of sites in the Lower Mekong Basin sampled during 2004 2007. If a site was
sampled more than once and had varying ratings, the most recent is shown.
Page 55
Biomonitoring of the lower Mekong River and selected tributaries, 2004 2007
Table 8.3 Assessment of all sites against suggested guidelines. Y = meets guideline; N = does not
meet guideline.
abundance
ertebrate
macroinv
Site
Sampling date
Diatom richness
Diatom abundance
Diatom tolerance
Zooplankton richness
Zooplankton abundance
Zooplankton tolerance
Littoral macroinvertebrate richness
Littoral macroinvertebrate abundance
Littoral macroinvertebrate tolerance
Benthic macroinvertebrate richness
Benthic
Benthic macroinvertebrate tolerance
Number meeting guidelines
Class
CKL 07-March-2006
Y
Y
N
Y
Y
N
Y
Y
N
Y
Y
N
8
B
CKM 26-March-2005
Y
Y
Y
Y
Y
Y
Y
Y
Y
Y
N
Y
11
A
CKM 16-March-2006
Y
Y
Y
Y
N
Y
Y
N
Y
N
N
Y
8
B
CKM 18-March-2007
Y
N
Y
Y
Y
Y
Y
N
N
Y
N
Y
8
B
CKT 23-March-2004
Y
Y
Y
Y
Y
Y
Y
Y
Y
N
Y
Y
11
A
CKT 14-March-2006
Y
N
N
Y
Y
Y
Y
Y
Y
Y
Y
Y
10
A
CMR 24-March-2005
N
Y
Y
Y
Y
Y
N
Y
N
Y
Y
Y
9
B
CMR 15-March-2006
Y
Y
Y
N
Y
Y
Y
Y
Y
Y
Y
N
10
A
CMR 17-March-2007
N
N
Y
Y
Y
Y
Y
Y
N
Y
Y
Y
9
B
CNL 08-March-2006
Y
Y
N
Y
Y
N
Y
Y
N
Y
Y
N
8
B
CPP
17-March-2004
N
Y
N
Y
Y
N
N
N
N
Y
Y
N
5
C
CPP
06-March-2006
Y
Y
N
N
Y
N
N
N
N
Y
Y
N
5
C
CPS
18-March-2004
Y
Y
N
Y
Y
N
Y
Y
N
Y
Y
N
8
B
CPT
13-March-2006
Y
Y
N
Y
Y
N
Y
N
N
Y
Y
N
7
B
CSJ
25-March-2005
Y
Y
Y
Y
Y
Y
Y
Y
Y
N
N
Y
10
A
CSJ
16-March-2006
Y
Y
Y
Y
Y
Y
Y
N
Y
N
N
Y
9
B
CSJ
19-March-2007
N
Y
Y
Y
Y
Y
Y
Y
Y
Y
Y
Y
11
A
CSK 11-March-2006
N
N
N
Y
Y
N
N
Y
N
Y
Y
N
5
C
CSN 10-March-2006
Y
Y
N
Y
Y
N
Y
Y
N
Y
Y
N
8
B
CSP
21-March-2004
Y
Y
Y
Y
N
N
Y
Y
Y
Y
Y
Y
10
A
CSP
29-March-2005
Y
Y
Y
Y
Y
Y
Y
Y
Y
Y
Y
Y
12
A
CSP
18-March-2006
Y
Y
Y
Y
Y
Y
Y
Y
Y
Y
Y
Y
12
A
CSP
21-March-2007
Y
Y
Y
Y
Y
Y
Y
Y
Y
Y
Y
Y
12
A
CSS
20-March-2004
Y
Y
Y
Y
Y
Y
Y
Y
Y
N
N
N
9
B
CSS
28-March-2005
Y
Y
Y
Y
Y
Y
Y
Y
Y
Y
Y
Y
12
A
CSU 27-March-2005
Y
Y
Y
Y
N
Y
Y
Y
N
Y
Y
Y
10
A
CSU 19-March-2006
N
Y
N
Y
Y
Y
Y
Y
Y
Y
Y
N
9
B
CSU 20-March-2007
N
Y
Y
Y
Y
Y
N
N
N
Y
Y
Y
8
B
CTU 17-March-2004
Y
Y
N
Y
Y
N
N
N
N
Y
Y
N
6
C
CTU 09-March-2006
N
Y
N
N
Y
N
N
N
N
Y
Y
N
4
C
LBF
10-March-2007
N
N
Y
Y
Y
Y
Y
Y
N
Y
Y
Y
9
B
LBH 11-March-2007
Y
Y
Y
Y
Y
Y
Y
Y
N
Y
Y
Y
11
A
LDN 16-March-2007
Y
Y
Y
Y
Y
Y
Y
Y
Y
Y
Y
Y
12
A
LKD 10-March-2004
Y
Y
Y
N
N
N
Y
Y
Y
Y
Y
N
8
B
LKD 09-March-2007
Y
Y
Y
N
N
Y
Y
Y
N
Y
Y
Y
9
B
LKL 21-March-2005
Y
Y
Y
Y
N
Y
Y
Y
Y
Y
Y
Y
11
A
LKL 14-March-2007
Y
N
N
N
N
Y
Y
N
Y
Y
N
Y
6
C
LKU 20-March-2005
Y
Y
Y
Y
Y
Y
Y
N
Y
Y
Y
Y
11
A
Page 56
The use of biolological indicators of harm to classify and rate the sites
abundance
ertebrate
macroinv
Site
Sampling date
Diatom richness
Diatom abundance
Diatom tolerance
Zooplankton richness
Zooplankton abundance
Zooplankton tolerance
Littoral macroinvertebrate richness
Littoral macroinvertebrate abundance
Littoral macroinvertebrate tolerance
Benthic macroinvertebrate richness
Benthic
Benthic macroinvertebrate tolerance
Number meeting guidelines
Class
LKU 15-March-2007
Y
Y
Y
Y
Y
Y
Y
Y
N
Y
Y
N
10
A
LMH 12-March-2005
Y
Y
N
Y
Y
N
N
N
N
Y
Y
Y
7
B
LMX 13-March-2005
Y
N
N
Y
Y
Y
N
N
N
Y
N
Y
6
C
LNG 09-March-2004
Y
Y
Y
Y
Y
Y
Y
Y
N
Y
Y
Y
11
A
LNG 07-March-2007
Y
Y
N
Y
Y
Y
Y
Y
N
Y
Y
Y
10
A
LNK 10-March-2005
Y
Y
Y
Y
Y
Y
Y
Y
Y
Y
Y
Y
12
A
LNM 08-March-2007
Y
Y
N
N
Y
Y
Y
Y
N
Y
Y
N
8
B
LNO 07-March-2004
Y
Y
Y
N
Y
Y
Y
Y
Y
Y
Y
Y
11
A
LNT 05-March-2007
Y
N
Y
N
Y
Y
Y
Y
Y
Y
Y
N
9
B
LOU 09-March-2005
Y
Y
Y
Y
N
Y
Y
Y
Y
Y
Y
Y
11
A
LPB
07-March-2004
Y
Y
Y
Y
Y
Y
N
Y
Y
Y
Y
Y
11
A
LPB
10-March-2005
Y
Y
Y
Y
Y
N
N
Y
Y
Y
Y
Y
10
A
LPS
11-March-2004
Y
Y
Y
Y
Y
Y
Y
Y
Y
Y
Y
Y
12
A
LSD 12-March-2007
Y
N
Y
Y
Y
N
Y
Y
N
Y
Y
N
8
B
LVT 08-March-2004
Y
Y
N
N
Y
Y
Y
N
N
N
N
Y
6
C
LVT 06-March-2007
Y
Y
N
Y
Y
Y
Y
Y
N
Y
Y
N
9
B
TCH 13-March-2004
Y
Y
N
Y
Y
Y
Y
N
N
Y
Y
N
8
B
TKO 15-March-2004
Y
Y
N
Y
Y
Y
N
N
Y
Y
Y
Y
9
B
TKO 17-March-2005
Y
Y
N
Y
Y
Y
Y
Y
N
Y
Y
Y
10
A
TMC 16-March-2005
Y
Y
N
Y
Y
N
Y
Y
Y
Y
Y
Y
10
A
TMI
16-March-2005
Y
Y
N
Y
Y
N
N
N
N
Y
Y
Y
7
B
TMM 23-March-2007
Y
Y
N
Y
Y
N
Y
N
N
Y
Y
N
7
B
TMU 12-March-2004
Y
Y
N
Y
Y
N
Y
Y
N
Y
Y
N
8
B
TNK 24-March-2007
Y
N
N
Y
Y
N
Y
N
N
Y
N
N
5
C
TSK 14-March-2004
Y
Y
N
Y
Y
N
Y
Y
N
Y
Y
N
8
B
TSK 25-March-2007
N
Y
N
Y
Y
N
Y
Y
N
Y
Y
N
7
B
TSM 26-March-2007
N
N
N
Y
Y
N
Y
N
N
Y
Y
Y
6
C
VCD 26-March-2004
Y
Y
N
Y
Y
N
Y
Y
N
Y
Y
N
8
B
VCD 28-March-2006
Y
Y
N
Y
Y
N
N
N
N
Y
Y
N
6
C
VCL 26-March-2006
N
Y
N
Y
Y
N
Y
N
N
Y
Y
N
6
C
VCT 24-March-2006
N
N
N
Y
Y
N
N
N
N
Y
Y
N
4
C
VLX 25-March-2006
N
Y
N
Y
Y
N
N
N
N
Y
Y
N
5
C
VSP
29-March-2004
Y
Y
Y
Y
Y
Y
Y
Y
Y
Y
Y
N
11
A
VSR 21-March-2006
Y
Y
N
N
N
Y
Y
Y
N
Y
Y
N
7
B
VSS
28-March-2004
Y
Y
N
Y
Y
N
Y
N
N
N
N
N
5
C
VSS
20-March-2006
Y
Y
N
Y
Y
Y
Y
Y
N
N
N
Y
8
B
VTC 25-March-2004
Y
Y
N
Y
Y
N
Y
Y
N
Y
Y
N
8
B
VTC 27-March-2006
Y
Y
N
Y
Y
N
N
N
N
Y
Y
N
6
C
VTR 23-March-2006
Y
N
N
N
N
N
Y
Y
N
Y
Y
N
5
C
Page 57
Biomonitoring of the lower Mekong River and selected tributaries, 2004 2007
Page 58
9. Future directions
The biomonitoring programme to date has defined suitable biological groups and indicators
for monitoring the aquatic ecosystems of the Mekong river system and developed a workable
preliminary methodology for comparing, classifying and rating sites across the Lower Mekong
Basin. This has allowed biomonitoring to be adopted by the member states of the MRC as a
routine activity complementing physical and chemical monitoring, commencing in 2008.
The current biological groups, indicators, guidelines and rating scheme should be seen as
a starting point for ongoing biomonitoring. All of these aspects should be subject to further
testing and evaluation over time, so that they can be improved, refined and added to as required.
The absence of fish from the programme is a significant limitation because fish are clearly
very important to the people of the Lower Mekong Basin. The most cost-effective method for
sampling fish in large-scale biomonitoring is electric fishing, which temporarily stuns fish,
allowing them to be easily captured, identified and released unharmed. This method might be
included in future monitoring programmes in the Mekong, but to achieve this, the following
matters would need to be resolved:
· Electric fishing in deep water requires a large boat specially built and equipped for the
purpose. This boat would have to be either bought or rented and transported to each site.
This is an expensive option when compared to other biological sampling that can be done
from small boats hired locally.
· Electric fishing is hazardous to sampling personnel, and consequently requires a high
level of training and rigorous safety measures.
· Other people, including local villagers, must to be excluded from the vicinity of sampling
operations to avoid the risk of electric shock and electrocution.
· Local fishers may attempt to copy the method. This practice may be illegal and can lead
to over-exploitation. Furthermore, electric fishing has caused serious injury to, and even
the death of, fishers who use the gear carelessly.
At present, only 14 reference sites have been identified and data from each monitoring
site are compared against guidelines based on the variation of indicators among all 14 sites.
It is common in biomonitoring programmes worldwide to develop separate reference data for
individual sites or types of sites, in order to take more account of natural variation in reference
conditions. Such an approach would be a valuable future addition to the Mekong programme,
but would require the identification and sampling of a large number of reference sites, and
further studies to understand the causes of natural variation in indicators among reference sites.
For example, natural variations in substratum types may account for some of the biological
variability among reference sites. A particular need is to try to locate suitable reference sites
in the delta region, to check whether the current interim guidelines are appropriate to this
Page 59
Biomonitoring of the lower Mekong River and selected tributaries, 2004 2007
distinctive part of the Lower Mekong Basin. Future monitoring data will also allow the further
development and refinement of tolerance scores for individual taxa, especially those that have
been seldom collected as yet.
Page 60
10. References
Azrina, M.Z., Yap, C.K., Rahim-Ismail, A. et al. (2005) Anthropogenic impacts on the
distribution and biodiversity of benthic macroinvertebrates and water quality of the
Langat River, Peninsular Malaysia. Ecotoxicology and Environmental Safety, 64,
337 347.
Bae, Y.J. (2005a) Freshwater health assessment techniques. In: Y. Kim, Y.J. Bae, D.H. Yum
et al. (eds.). Assessment techniques for environmental pollutants using invertebrate
biomarkers. Jeonghaengsa, Seoul, South Korea. (In Korean.)
Bae, Y.J. (2005b) Biodiversity of freshwater invertebrates and its application to freshwater
ecosystem health assessment. In: Y. Kim, Y.J. Bae, K.S. Ryoo et al. (eds.). Invertebrate
biomarkers and environmental risk assessment. Jeonghaengsa, Seoul, South Korea. (In
Korean.)
Bae, Y.J., Kil, H.K. & K.S. Bae (2005) Benthic macroinvertebrates for uses in stream
biomonitoring and restoration. KSCE Journal of Civil Engineering, 9, 55 63.
Bae, Y.J. & B.H. Lee (2001) Human impacts on stream ecosystems and freshwater arthropods
in Korea. Korean Journal of Entomology, 31, 63 76. (In Korean.)
Bishop, J.E. (1973) Limnology of a small Malayan river, Sungai Gombak. Junk Publishers, The
Hague, Netherlands.
Bonada, N., Prat, N., Resh, V.H. & B. Statzner (2006) Developments in aquatic insect
biomonitoring: a comparative analysis of recent approaches. Annual Review of
Entomology, 51, 495 523.
Boonsoong, B., Sangpradub, N. & M. Barbour (2005) Preliminary study on rapid bioassessment
with benthic macroinvertebrates in the head-water streams of the Loei River and adjacent
catchments, Thailand. American Geophysicists Union Spring Meeting, 23 27 May 2005,
New Orleans, LA. American Geophysicists Union, Washington, DC.
Cairns, J. Jr. & J. R. Pratt (1993) A history of biological monitoring using benthic
macroinvertebrates. pp. 10 27 in: V.H. Resh & D.M. Rosenberg (eds.). Freshwater
biomonitoring and benthic macroinvertebrates. Chapman & Hall, New York.
Campbell, I.C. 2007. Perceptions, data, and river management: Lessons from the Mekong
River. Water Resources Research 43, 13 pp.
Carter, J.M., Resh, V.H., Myers, M.J. and M. Hannaford (2006a). Macroinvertebrates as biotic
indicators of environmental quality. 2nd edition. Pages 647 667 in F. R. Hauer and G. A.
Lamberti (eds.) Methods in Stream Ecology. Academic Press, San Diego.
Page 61
Biomonitoring of the lower Mekong River and selected tributaries, 2004 2007
Carter, J.L., Resh, V.H., Rosenberg, D.M. & T.B. Reynoldson (2006b) Biomonitoring in North
American rivers: a comparison of methods used for benthic macroinvertebrates in
Canada and the United States. pp. 203 228 in: G. Ziglio, M. Siligardi & G. Flaim (eds.).
Biological monitoring of rivers. John Wiley & Sons Ltd., Chichester.
Che-Salmah, M.R. & A. Abu-Hassan. (2005) Aquatic insects of a peat swamp river, Sungai
Bebar, Pahang. In: A. Latiff, K.A. Hamzah, N. Ahmad et al. (eds.). Biodiversity
expedition Sungai Bebar, Pecan, Pahang. Forest Research Institute of Malaysia, Selangor,
Malaysia.
Chin M (2003) Ecology of a tropical peat swamp: a study of the influence of pH on the
macroinvertebrate fauna and trophic dynamics in the Tanjung Karang irrigation project
district. Ph.D. dissertation, Monash University Malaysia, Kuala Lumpur, Malaysia.
Dang, N.T., Thai, T.B. & V.M. Pham (1980) Classification of freshwater invertebrate zoology in
North Viet Nam. Science and Technology Publisher.
De Pauw, N., Gabriels, W. & P.L.M. Goethals (2006) River monitoring and assessment methods
based on macroinvertebrates. pp. 113 134 in: G. Ziglio, M. Siligardi & G. Flaim (eds.).
Biological monitoring of rivers. John Wiley & Sons Ltd., Chichester.
Eiji, T. (1993) An illustrated guide to fresh water zooplankton. Togai University Publisher.
Foged, N. (1971) Freshwater diatoms in Thailand. Odense Publisher, Lehre.
Foged, N. (1975) Some littoral diatoms from the coast of Tanzania. Odense Publisher, Lehre.
Foged, N. (1976) Freshwater diatoms in Sri Lanka (Ceylon). Odense Publisher, Lehre.
Gallacher, D. (2001) The application of rapid bioassessment techniques based on benthic
macroinvertebrates in East Asian rivers (a review). Verhandlungen der Internationale
Vereinigung für Theoretische und Angewandte Limnologie, 27, 3503 3509.
Grimĺs, U. (1988) Water quality investigations in the Lower Mekong Basin. Biological
monitoring -- an evaluation. Report to the Interim Mekong Committee 37 p.
Hellawell, J.M. (1986) Biological indicators of freshwater pollution and environmental
management. Elsevier, New York.
Hwang, Y.Y., Teng, D.X. & Z.X. Zhao (1982) Monitoring Jiyunhe estuary pollution by use
of macroinvertebrate community and diversity index. Sinozoologia, 2, 133 146. (In
Chinese.)
Hynes, H.B.N. (1960) The biology of polluted waters. Liverpool University Press, Liverpool.
Page 62
References
Inmuong, Y., Sangpradub, N. & V. Tanusilp (2003) Community-based actions on sustainable
environmental management: Kudnamsai water-quality monitoring. Mahasarakham
University Journal, 22, 47 58.
Kanjanavanit, O. & N. Moonchinda (1999) Handbook for stream detectives. Amarin Printing &
Publishing Public Co., Bangkok, Thailand.
Kawai, T. & K. Tanida (eds.) (2005) Aquatic insects of Japan: keys to families, genera and
species. Tokai University Press, Hadano, Kanagawa, Japan. (In Japanese.)
Kawai, T. (ed.) (1985) An illustrated book of aquatic insects of Japan. Tokai University Press,
Tokyo, Japan. (In Japanese.)
Krammer, K. & H. Lange-Bertalot (1986) Bacillariophyceae. Teil 1. Naviculaceae.
Süßwasserflora von Mitteleuropa, Bd. 2. Gustav Fisher Verlag, Stuttgart.
Krammer, K. & H. Lange-Bertalot (1988) Bacillariophyceae. Teil 2. Epithemiaceae,
Surirellaceae. Süßwasserflora von Mitteleuropa, Bd.2. Gustav Fisher Verlag, Stuttgart.
Krammer, K. & H. Lange-Bertalot (1991a) Bacillariophyceae. Teil 3. Centrales,
Fragilariaceae, Eunotiaceae. Süßwasserflora von Mitteleuropa, Bd.2. Gustav Fisher
Verlag, Stuttgart.
Krammer, K. & H. Lange-Bertalot (1991b) Bacillariophyceae. Teil 4. Achnanthaceae. Kritische
Ergänzungen zu Navicula. Süßwasserflora von Mitteleuropa, Bd.2. Gustav Fisher Verlag,
Stuttgart.
Luadee. P., Nuntakwang, A., Prommi, T. et al. (2002) Aquatic insects and their application
to environmental bioassessment in lotic water of Northern Thailand. ASEAN Regional
Center for Biodiversity Conservation, Laguna, Phillippines.
Merritt, R.W. & K.W. Cummins (1996) An introduction to the aquatic insects of North America.
3rd edn. Kendall Hunt, Dubuque.
Morse, J.C., Yang, L.F. & L.X. Tian (eds.) (1994) Aquatic insects of China useful for
monitoring water quality. HoHai University Press, Nanjing, China.
Morse, J.C., Bae, Y.J., Munkhjargal, G., Sangpradub, N., Tanida, K., Vshivkova, T.S., Wang, B.,
Yang, L. & C.M. Yule (2007) Freshwater biomonitoring with macroinvertebrates in East
Asia. Frontiers in Ecology, 5, 33 42.
MRC (2005) Integrated water quality management report No. 1. Mekong River Commission,
Vientiane.
Page 63
Biomonitoring of the lower Mekong River and selected tributaries, 2004 2007
MRC (2008) An assessment of water quality in the Lower Mekong Basin. MRC Technical
Paper No. 19. Mekong River Commission, Vientiane, 70 pp.
Mustow, S.E. 2002. Biological monitoring of rivers in Thailand: use and adaptation of the
BMWP score. Hydrobiologia. 479. 191 229.
Nguyen, X.Q., Mai, D.Y., Pinder, C. & S. Tilling (2000) Biological surveillance of freshwaters
using macroinvertebrates. A practical manual and identification key for use in Viet Nam.
Field Studies Council.
PCD (2004) Standard surface water quality for Thailand. Pollution Control Department,
Ministry of Natural Resources and Environment, Thailand, Bangkok. (Available at http://
www.pcd.go.th/info_serv/en_reg_std_water05.html#s3).
PCD (2005) Summary of the state of Thailand's pollution in the year 2004. Pollution Control
Department, Ministry of Natural Resources and Environment, Thailand, Bangkok.
Pfister, V. P. (1992) Phytobenthos communities from 2 Tyrolean mountain streams.
Arbeitsgemeinschaft Limnologie, Telfs, Österreich.
Resh, V.H. (1995) Freshwater benthic macroinvertebrates and rapid assessment procedures for
water quality monitoring in developing and newly industrialized countries. pp. 165 175
in: W. S. Davis & T. Simon (eds.). Biological assessment and criteria. Lewis Publishers,
Chelsea, Michigan.
Resh, V.H. (2007) Multinational, freshwater biomonitoring programs in the developing
world: lessons learned from African and southeast Asian river surveys. Environmental
Management, 39, 737 748.
Resh, V.H. (2008) Which group is best? Attributes of different biological assemblages used in
freshwater biomonitoring programs. Environmental Monitoring and Assessment, 138,
131 138.
Rosenberg, D.M. & V.H. Resh (1993) Introduction to freshwater biomonitoring using benthic
macroinvertebrates. pp. 1 9 in: D.M. Rosenberg & V.H. Resh (eds.). Freshwater
biomonitoring and benthic macroinvertebrates. Chapman & Hall, New York.
Sangpradub, N. & B. Boonsoong. (2006) Identification of freshwater invertebrates of the
Mekong River and its tributaries. Mekong River Commission, Vientiane, Lao P.D.R.
Sangpradub, N., Inmuong, Y., Hanjavanit, C. & U. Inmuong (1996) A correlation study between
freshwater benthic macroinvertebrate fauna and environmental quality factors in Nam
Pong Basin Thailand. Part I. A research report to the Thailand research fund. Khon Kaen
University, Khon Kaen, Thailand.
Page 64
References
Sivaramakrishnan, K.G., Hannaford, M.J. & V.H. Resh (1996) Biological assessment of the
Kaveri River catchment, South India, using benthic macroinvertebrates: applicability of
water quality monitoring approaches developed in other countries. International Journal
of Ecology and Environmental Sciences, 22, 113 132.
Sudaryanti, S., Trihadiningrum, Y., Hart, B.T., Davies, P.E., Humphrey, C., Norris, R.,
Simpson, J. & L. Thurtell (2001) Assessment of the biological health of the Brantas
River, East Java, Indonesia using the Australian River Assessment System (AUSRIVAS)
methodology. Aquatic Ecology, 35, 135 136.
Thorne, R. St. J. & W.P. Williams (1997) The response of benthic macroinvertebrates to
pollution on developing countries: a multimetric system of bioassessment. Freshwater
Biology, 37, 671 686.
Tsuda, M. (ed.) (1962) Aquatic entomology. Hokuryukan Press, Tokyo, Japan. (In Japanese.)
Tsuda, M. (1964) Biology of polluted waters. Hokuryukan Press, Tokyo, Japan. (In Japanese.)
Vshivkova, T.S,, Morse J.C., Makarchenko, E.A. & T.V. Nikulina (2000) Water quality
monitoring in Russia and North America: comparison and perspectives. Abstracts of
the 48th Annual Meeting of the North American Benthological Society, 29 May 1 June
2000, Keystone, CO. North American Benthological Society, Lawrence, KS.
Vshivkova, T.S. & T.V. Nikulina (1998) Monitoring of water quality of Razdolnaya River basin
(South Primorye). Materials of the First International Conference on Russia and China:
integration in sphere of economy, science and education, May 1998, Birobidzhan, Russia.
Vshivkova, T.S., Morse, J.C. & J.B. Glover (2003) Russian clean water project. www.
cleanwater.fegi.ru
Vshivkova, T.S., Omelchenko, M.V., Burukhina, E.V. et al. (2005) Estimation of Partizanskaya
power station influence at ecological state of Partizanskaya River and Lozovyi stream.
pp. 139 55 in: V. Ya (ed.). Levanidov's Biennial Memorial Meetings 3.
Wang, B.X. & L.F. Yang (2004) A study on tolerance values of benthic macroinvertebrate taxa
in eastern China. Acta Ecologica Sinica, 24, 2768 2775. (In Chinese.)
Wang, B.X. (2002) Water quality biomonitoring using benthic macroinvertebrates in China.
Ph.D. dissertation, Nanjing Agricultural University, Nanjing, China. (In Chinese.)
Wang, B.X., Yang, L.F., Hu, B.J., & L.N. Shan (2005) A preliminary study on the assessment
of stream ecosystem health in south of Anhui Province using benthic-index of biotic
integrity. Acta Ecologica Sinica, 25, 1481 1490. (In Chinese.)
Page 65
Biomonitoring of the lower Mekong River and selected tributaries, 2004 2007
Yang, L.F., Li, Y.W., Qi, D.G. et al. (1992) Community structure of aquatic insects and
biomonitoring of water quality in Jiuhuahe River. Acta Ecologica Sinica, 12, 9 15. (In
Chinese.)
Yap, S.Y. (2005) A comparison of the macroinvertebrate communities in two Malaysian
streams. Journal of Aquatic Sciences, 20, 13 26.
Yoon, I.B. (1995) Aquatic insects of Korea, Seoul, Jeonghaengsa, South Korea. (In Korean.)
Yule, C.M. & H.S. Yong (2004) Freshwater invertebrates of the Malaysian region. Academy of
Sciences, Kuala Lumpur, Malaysia.
Ziglio, G., Siligardi, M. & G. Flaim (2006) Biological monitoring of rivers. John Wiley & Sons,
Chichester.
Page 66
Appendix 1. Physical and chemical variables and site
disturbance
1
score
2.19
1.50
1.19
1.31
1.25
1.14
1.75
1.42
1.61
1.97
2.88
2.89
2.22
2.33
1.50
1.25
1.28
2.00
2.00
1.25
1.13
1.1
1.39
1.75
1.75
Site disturbance
-
6.05
7.24
-
5.87
-
5.89
4.42
-
-
-
5.67
5.40
-
-
6.77
7.94
-
-
T
urbidity (NTU)
14.37
21.53
25.87
55.50
37.50
12.93
-
-
-
-
-
-
-
-
-
-
(µg/L)
2.13
0.57
0.43
0.27
0.42
0.39
0.72
33.59
3.99
0.61
0.59
3.45
2.04
0.61
0.51
Chlorophyll-a
EC
6.54
6.50
7.30
9.54
8.40
4.41
4.93
4.90
8.10
5.30
6.26
6.85
6.78
3.88
4.23
(mS/m)
12.32
19.72
19.62
19.20
23.02
22.53
19.35
10.47
1
1.03
18.18
pH
7.17
7.54
5.16
7.77
8.40
7.69
8.13
7.74
8.41
7.54
7.18
7.94
7.30
7.13
7.42
7.22
7.48
6.99
7.22
7.58
7.63
7.32
7.45
7.52
7.24
DO (mg/L) 7.56 6.32 8.21 7.33 6.89 8.49 8.15 10.52 8.34 7.02 3.94 4.70 5.07 4.56 6.00 7.26 7.41 3.76 7.13 6.41 5.91 6.95 7.19 7.50 6.19
(şC)
30.21
28.37
31.23
30.96
29.92
29.68
28.60
29.00
30.47
30.06
28.86
30.06
29.53
29.95
29.20
30.05
30.29
31.38
28.49
29.48
30.87
29.93
29.79
27.13
28.83
T
emperature
(m)
0.72
1.13
1.18
1.13
0.62
1.30
1.70
1.50
1.58
0.78
0.60
0.54
0.20
0.26
1.50
1.10
1.47
0.33
0.20
1.50
2.00
1.07
1.15
1.60
1.10
Secchi depth
-
-
-
-
-
Depth (m)
7.0
1.7
2.0
1.7
8.0
3.6
8.0
4.4
15.0
12.0
1.6
2.4
3.0
2.5
2.0
10.0
2.1
2.8
2.4
1.1
50
39
66
(m)
298
363
386
373
1
10
2
000
1
300
450
870
1
629
490
460
630
622
652
127
215
294
200
190
335
180
River width
3
6
5
6
(m)
50
50
45
20
13
50
58
45
14
10
15
13
37
52
40
85
85
80
Altitude
108
102
100
Y
ear
2006
2005
2006
2007
2004
2006
2005
2006
2007
2006
2004
2006
2004
2006
2005
2006
2007
2006
2006
2004
2005
2006
2007
2004
2005
Sampled
Site Number
CBS
CKM
CKM
CKM
CKT
CKT
CMR
CMR
CMR
CNL
CPP
CPP
CPS
CPT
CSJ
CSJ
CSJ
CSK
CSN
CSP
CSP
CSP
CSP
CSS
CSS
Page 67
Biomonitoring of the lower Mekong River and selected tributaries, 2004 2007
score
2.13
1.75
1.97
2.13
2.04
1.72
1.63
1.53
1.43
1.56
1.50
1.69
1.13
1.53
1.94
1.94
1.50
1.84
1.38
2.31
1.00
1.69
1.00
1.28
1.69
1.57
Site disturbance
-
7.51
5.48
-
9.69
8.81
4.47
-
3.24
1.33
3.49
-
2.38
-
3.55
-
-
-
T
urbidity (NTU)
29.97
45.70
22.93
55.73
55.06
12.47
64.50
54.17
-
-
-
-
-
-
-
-
-
-
-
-
-
-
(µg/L)
0.39
0.45
1.12
0.34
0.48
0.51
0.35
0.37
0.25
0.27
0.17
0.67
Chlorophyll-a
EC
4.19
4.00
4.30
7.27
9.08
9.80
5.86
7.07
5.14
4.75
7.51
8.60
9.65
(mS/m)
32.88
15.25
22.87
10.70
34.80
33.00
25.10
24.72
14.77
21.27
30.67
27.40
22.86
pH
7.17
7.05
7.32
7.01
7.00
8.05
7.86
8.27
7.97
7.71
7.18
7.24
7.18
6.98
8.19
8.10
7.45
6.87
8.27
7.95
8.46
7.43
8.15
8.47
8.17
8.38
DO (mg/L) 7.07 8.38 6.98 3.79 5.84 7.54 7.70 8.51 7.67 7.80 5.56 7.26 5.99 7.34 9.34 8.25 8.82 6.93 7.47 8.87 8.59 8.69 8.16 9.37 7.87 7.17
(şC)
26.23
26.55
26.14
29.99
29.65
27.06
28.28
28.65
24.53
26.69
28.93
29.29
28.53
28.61
16.67
18.10
23.53
23.35
24.13
20.88
22.90
26.79
21.10
21.30
20.43
26.90
T
emperature
(m)
1.60
1.17
1.40
0.60
0.52
0.78
1.06
1.83
2.00
2.05
1.10
0.36
1.27
1.98
0.25
0.25
3.40
2.57
1.30
0.70
2.80
0.50
1.43
0.90
0.48
1.30
Secchi depth
-
-
-
-
-
-
Depth (m)
2.0
15.0
2.9
10.0
3.8
1.2
4.8
5.8
2.5
2.4
1.7
2.6
2.9
3.3
2.7
0.9
0.7
0.5
2.4
1.4
80
68
65
11
12
92
(m)
174
173
170
533
522
150
1
240
173
290
120
200
200
138
260
196
140
214
295
212
1
324
River width
5
3
(m)
1
17
111
82
90
72
90
93
Altitude
129
134
134
160
146
454
410
161
175
190
420
280
176
290
276
270
100
Y
ear
2005
2006
2007
2004
2006
2007
2007
2007
2004
2007
2005
2007
2005
2007
2005
2005
2004
2007
2005
2007
2004
2007
2005
2004
2005
2004
Sampled
Site Number
CSU
CSU
CSU
CTU
CTU
LBF
LBH
LDN
LKD
LKD
LKL
LKL
LKU
LKU
LMH
LMX
LNG
LNG
LNK
LNM
LNO
LNT
LOU
LPB
LPB
LPS
Page 68
Appendix 1
score
1.97
1.78
1.78
1.86
1.88
1.86
1.64
2.25
1.71
2.44
2.13
1.97
1.86
2.69
2.31
1.91
2.64
2.69
1.29
2.00
2.29
2.00
2.50
2.28
2.44
Site disturbance
-
-
-
-
-
-
-
-
-
-
9.14
-
8.26
T
urbidity (NTU)
17.03
20.46
128.30
25.61
12.60
24.31
19.32
14.27
15.93
12.55
71.08
13.17
-
-
-
-
-
-
-
-
-
-
-
-
(µg/L)
0.84
0.44
0.45
0.60
0.63
0.63
0.97
1.20
0.97
0.98
0.40
0.73
0.82
Chlorophyll-a
1
1
EC
9.59
6.26
5.15
3.93
3.97
(mS/m)
1
1.90
28.80
28.25
18.38
10.1
1
1.75
22.68
10.18
16.92
76.66
49.20
24.95
17.48
18.05
18.87
18.60
18.57
16.68
18.28
18.1
pH
7.80
8.63
7.79
7.83
7.95
6.62
6.80
6.80
7.30
7.15
8.01
7.47
8.12
7.68
7.10
7.58
7.18
7.13
7.77
7.14
7.66
6.62
8.33
7.64
7.33
1
DO (mg/L) 7.42 8.61 8.73 7.71 7.61 6.22 7.60 6.40 2.73 7.1 9.03 7.15 8.65 5.61 3.91 8.01 5.20 6.59 5.87 7.31 7.28 7.47 5.70 7.63 6.70
(şC)
28.68
23.33
23.92
29.07
25.43
24.60
28.00
30.00
28.07
28.37
26.95
28.99
28.08
29.08
30.47
30.40
30.05
30.15
29.42
27.47
29.00
26.12
29.45
30.21
29.85
T
emperature
(m)
0.70
0.98
0.70
0.33
0.70
0.20
0.30
0.25
0.90
0.43
2.50
0.82
0.58
0.60
0.55
0.59
0.63
0.67
1.25
0.18
0.60
0.98
0.70
0.97
0.68
Secchi depth
-
-
-
-
-
-
-
-
-
Depth (m)
1.7
2.6
1.0
1.6
0.4
0.8
3.9
1.6
7.4
15.0
6.9
7.7
5.0
0.5
12.0
5.2
70
12
95
(m)
130
480
790
185
270
105
386
248
125
1
137
1000
255
872
662
1
10
106
207
167
1,090
2600
1,180
1,070
River width
3
5
7
7
3
6
9
(m)
98
10
Altitude
101
159
178
127
390
400
340
350
133
137
120
131
178
312
565
527
Y
ear
2007
2004
2007
2004
2004
2005
2005
2005
2004
2007
2004
2007
2007
2004
2006
2006
2006
2006
2004
2006
2004
2006
2004
2006
2006
Sampled
Site Number
LSD
L
VT
L
VT
TCH
TKO
TKO
TMC
TMI
TMU
TNK
TSK
TSK
TSM
VCD
VCD
VCL
VCT
VLX
VSP
VSR
VSS
VSS
VTC
VTC
VTR
Page 69
Biomonitoring of the lower Mekong River and selected tributaries, 2004 2007
Page 70
Appendix 2. Species lists and counts per site and
sampling occasion
This appendix gives a full listing of the number of each taxa of each of the four biological
indicator groups recorded at each site and sampling occasion. Most sites were sampled on
more than one occasion, and at many sites samples were recovered at different locations or
river settings at the site. As a result the full listing is too large to be presented in this paper and
instead is available on the CD that is included in the back of this document.
Page 71
Biomonitoring of the lower Mekong River and selected tributaries, 2004 2007
Page 72
Appendix 3. Summary of biological indicator values
Diatom
Zooplankton
A
TSPT
A
TSPT
ater body
Site code
W
Sampling date
Reference site
No. of samples
Mean No. taxa
Mean No. individuals
Mean
No. of samples
Mean No. taxa
Mean No. individuals
Mean
CBS Bassac
07-March-2006 N
10
8
311
44
3
22
844
48
CKM Se Kong
26-March-2005 N
10
9
191
33
3
14
78
39
CKM Se Kong
16-March-2006 N
10
11
250
37
3
11
21
37
CKM Se Kong
18-March-2007 N
10
7
71
34
3
14
35
39
CKT Mekong
23-March-2004 Y
10
12
318
34
3
15
36
44
CKT Mekong
14-March-2006 Y
10
8
134
39
3
12
27
37
CMR Mekong
24-March-2005 Y
10
6
206
33
3
11
39
38
CMR Mekong
15-March-2006 Y
10
10
217
36
3
9
24
39
CMR Mekong
17-March-2007 Y
10
7
58
37
3
12
35
38
CNL Mekong
08-March-2006 N
10
10
314
40
3
17
265
45
CPP
Tonle Sap
17-March-2004 N
10
6
197
44
3
23
318
48
CPP
Tonle Sap
06-March-2006 N
10
8
377
50
3
7
92
46
CPS
Por Sat
18-March-2004 N
10
9
231
43
3
22
192
42
CPT
Prek Te
13-March-2006 N
10
7
268
45
3
40 2965
45
CSJ
Se San
25-March-2005 Y
10
7
214
33
3
14
119
37
CSJ
Se San
16-March-2006 Y
10
11
314
36
3
20
62
38
CSJ
Se San
19-March-2007 Y
10
6
655
34
3
17
52
38
CSK Stoeng Sangke 11-March-2006 N
10
5
107
44
3
34 1431
46
CSN Stoeng Sen
10-March-2006 N
10
8
221
44
3
20
297
45
CSP
Sre Pok
21-March-2004 Y
10
8
144
36
3
12
22
41
CSP
Sre Pok
29-March-2005 Y
10
10
232
30
3
13
86
36
CSP
Sre Pok
18-March-2006 Y
10
9
308
36
3
12
70
37
CSP
Sre Pok
21-March-2007 Y
10
8
532
35
3
15
62
42
CSS
Se San
20-March-2004 N
10
7
214
37
3
16
50
42
CSS
Se San
28-March-2005 N
10
10
232
35
3
14
34
34
CSU Se San
27-March-2005 N
10
9
269
36
3
11
14
37
CSU Se San
19-March-2006 N
10
6
140
39
3
32
176
40
CSU Se San
20-March-2007 N
10
5
287
38
3
28
113
39
CTU Tonle Sap
17-March-2004 N
10
8
227
42
3
16
745
43
CTU Tonle Sap
09-March-2006 N
10
6
219
48
3
8
66
45
LBF
Se Bang Fai
10-March-2007 N
10
6
46
36
3
17
222
39
LBH Se Bang Hieng 11-March-2007 N
10
8
257
36
3
16
473
41
LDN Mekong
16-March-2007 Y
10
9
266
34
3
21
194
40
LKD Nam Ka Ding
10-March-2004 N
10
12
372
33
3
6
18
41
LKD Nam Ka Ding
09-March-2007 N
10
8
309
33
3
7
8
35
LKL Se Kong
21-March-2005 Y
10
7
219
35
3
14
22
35
Page 73
Biomonitoring of the lower Mekong River and selected tributaries, 2004 2007
Littoral Macro. sweep
Littoral Macro. kick
Benthic Macro
A
TSPT
A
TSPT
A
TSPT
Site code
No. of samples
Mean No. taxa
Mean No. individuals
Mean
No. of samples
Mean No. taxa
Mean No. individuals
Mean
No. of samples
Mean No. taxa
Mean No. individuals
Mean
CBS
5
11
163
39
0
15
5
17
52
CKM
5
10
104
32
5
20
115
30
15
2
4
35
CKM
5
9
26
29
5
14
67
28
15
2
3
36
CKM
5
9
33
34
5
14
72
27
15
3
4
37
CKT
6
12
165
32
0
15
2
7
35
CKT
5
11
97
30
5
12
62
30
15
2
8
31
CMR
5
5
112
34
5
7
219
33
15
4
20
37
CMR
5
10
311
30
5
8
102
28
15
3
24
43
CMR
5
8
311
34
5
8
57
31
15
3
11
37
CNL
5
12
166
35
0
15
3
8
51
CPP
6
4
6
39
0
10
7
51
53
CPP
5
3
11
40
0
15
3
6
49
CPS
6
9
62
40
0
10
2
8
40
CPT
5
11
46
43
0
15
5
17
44
CSJ
5
13
83
32
5
18
173
29
15
2
3
37
CSJ
5
11
46
30
5
18
95
28
15
2
3
33
CSJ
5
14
88
32
5
25
301
29
15
3
5
36
CSK
5
4
92
43
0
15
3
11
47
CSN
5
7
125
43
0
15
4
24
45
CSP
6
19
301
30
0
15
3
8
35
CSP
5
20
229
28
5
24
235
25
15
6
25
38
CSP
5
16
54
27
5
20
177
26
15
3
6
31
CSP
5
17
136
31
5
24
352
29
15
3
7
33
CSS
6
16
116
34
0
15
2
3
39
CSS
5
17
55
33
5
15
71
31
15
4
7
37
CSU
5
15
121
34
5
19
58
33
15
5
23
36
CSU
5
5
179
33
5
8
51
32
15
3
8
39
CSU
5
3
10
34
5
6
13
34
15
3
5
37
CTU
6
4
7
40
0
15
7
46
51
CTU
5
4
10
43
0
15
5
48
51
LBF
10
16
254
35
0
15
6
38
38
LBH
5
8
73
36
5
11
42
30
15
3
7
38
LDN
10
14
340
33
0
15
8
51
36
LKD
6
12
74
33
0
10
5
37
39
LKD
10
14
63
34
0
15
7
36
37
LKL
5
9
48
31
5
28
269
28
15
6
25
35
Page 74
Appendix 3
Diatom
Zooplankton
A
TSPT
A
TSPT
ater body
Site code
W
Sampling date
Reference site
No. of samples
Mean No. taxa
Mean No. individuals
Mean
No. of samples
Mean No. taxa
Mean No. individuals
Mean
LKL Se Kong
14-March-2007 Y
10
7
63
40
3
10
17
39
LKU Se Kong
20-March-2005 Y
10
9
209
35
3
12
51
38
LKU Se Kong
15-March-2007 Y
10
9
139
36
3
21
142
38
LMH Mekong
12-March-2005 N
10
12
155
39
3
17
111
39
LMX Mekong
13-March-2005 N
10
10
133
39
3
15
76
40
LNG Nam Ngum
09-March-2004 N
10
11
354
34
3
20
398
40
LNG Nam Ngum
07-March-2007 N
10
8
544
40
3
16
83
39
LNK Nam Khan
10-March-2005 Y
10
10
276
34
3
20
56
38
LNM Nam Mo
08-March-2007 N
10
11 1019
50
3
9
30
35
LNO Nam Ou
07-March-2004 Y
10
8
326
30
3
9
57
23
LNT Nam Ton
05-March-2007 N
10
10
70
37
3
9
35
37
LOU Nam Ou
09-March-2005 Y
10
12
257
29
3
10
21
25
LPB
Mekong
07-March-2004 Y
10
11
388
37
3
10
182
36
LPB
Mekong
10-March-2005 Y
10
12
305
38
3
13
26
42
LPS
Mekong
11-March-2004 Y
10
10
343
37
3
17
227
40
LSD Se Done
12-March-2007 N
10
8
108
38
3
26 1408
44
LVT Mekong
08-March-2004 N
10
13
563
41
3
9
24
37
LVT Mekong
06-March-2007 N
10
8 1338
39
3
10
160
40
TCH Nam Chi
13-March-2004 N
10
14
306
43
3
18
751
40
TKO Nam Kok
15-March-2004 N
10
21
372
41
3
14
53
40
TKO Nam Kok
17-March-2005 N
10
10
229
40
3
29
145
42
TMC Mekong
16-March-2005 Y
10
10
229
40
3
16
162
41
TMI
Nam Mae Ing 16-March-2005 N
10
12
199
42
3
19
180
43
TMM Nam Mun Chi 23-March-2007 N
10
7
720
44
3
19
114
41
TMU Nam Mun
12-March-2004 N
10
9
346
40
3
40 1327
43
TNK Nam Kham
24-March-2007 N
10
7
101
48
3
25
473
43
TSK Songkhram
14-March-2004 N
10
13
318
42
3
13
580
42
TSK Songkhram
25-March-2007 N
10
4
451
44
3
21 8394
45
TSM Songkhram
26-March-2007 N
10
5
128
39
3
19 2586
43
VCD Bassac
26-March-2004 N
10
11
326
44
3
16
363
44
VCD Bassac
28-March-2006 N
10
8
280
49
3
12
97
45
VCL Cao Lanh
26-March-2006 N
10
6
180
49
3
15
127
46
VCT Bassac
24-March-2006 N
10
5
72
48
3
11
55
46
VLX Long Xuyen
25-March-2006 N
10
6
317
51
3
16
148
45
VSP
Sre Pok
29-March-2004 Y
10
15
359
37
3
13
27
42
VSR Sre Pok
21-March-2006 N
10
10
161
41
3
7
15
36
Page 75
Biomonitoring of the lower Mekong River and selected tributaries, 2004 2007
Littoral Macro. sweep
Littoral Macro. kick
Benthic Macro
A
TSPT
A
TSPT
A
TSPT
Site code
No. of samples
Mean No. taxa
Mean No. individuals
Mean
No. of samples
Mean No. taxa
Mean No. individuals
Mean
No. of samples
Mean No. taxa
Mean No. individuals
Mean
LKL
5
13
35
33
5
24
139
31
15
2
4
37
LKU
5
10
41
30
5
24
287
28
15
5
16
36
LKU
5
11
62
34
5
22
137
31
15
5
30
40
LMH
5
2
4
34
5
5
18
35
15
3
13
35
LMX
5
5
30
36
5
6
13
37
15
2
4
35
LNG
6
13
329
34
0
10
6
42
36
LNG
5
6
101
37
5
8
39
34
15
4
10
36
LNK
5
10 1056
29
5
19
466
27
15
8
102
33
LNM
5
13
56
37
5
39
204
37
10
4
11
39
LNO
6
15
398
28
0
5
12
55
23
LNT
5
18
132
33
5
16
90
33
10
5
11
38
LOU
5
17
128
24
5
14
107
27
15
6
20
33
LPB
6
5
112
28
0
5
7
25
32
LPB
5
5
76
34
5
11
86
32
15
2
6
33
LPS
6
6
147
32
0
10
8
58
37
LSD
10
11
50
37
0
15
5
13
40
LVT
6
6
25
34
0
10
1
1
31
LVT
5
8
122
34
5
7
81
34
15
3
6
39
TCH
6
9
28
35
0
15
5
20
43
TKO
6
5
20
31
0
10
6
31
36
TKO
5
7
52
34
5
9
90
33
15
4
12
34
TMC
5
7
125
33
5
5
46
33
15
4
18
35
TMI
5
5
17
35
5
11
313
38
10
4
26
36
TMM
10
10
39
40
0
15
3
10
45
TMU
6
7
50
38
0
10
3
8
46
TNK
10
6
23
38
0
15
2
3
42
TSK
6
9
184
37
0
10
6
122
50
TSK
10
11
63
38
0
15
3
27
47
TSM
10
6
24
38
0
15
3
9
37
VCD
6
7
76
41
0
15
7
43
55
VCD
5
5
15
46
0
15
6
23
55
VCL
5
7
39
42
0
15
3
9
53
VCT
5
4
24
43
0
15
3
8
63
VLX
5
5
30
44
0
15
5
24
57
VSP
6
20
149
28
0
10
7
77
38
VSR
5
12
95
34
5
10
43
34
15
3
15
40
Page 76
Appendix 3
Diatom
Zooplankton
A
TSPT
A
TSPT
ater body
Site code
W
Sampling date
Reference site
No. of samples
Mean No. taxa
Mean No. individuals
Mean
No. of samples
Mean No. taxa
Mean No. individuals
Mean
VSS
Se San
28-March-2004 N
10
10
318
42
3
15
65
42
VSS
Se San
20-March-2006 N
10
12
334
41
3
17
60
39
VTC Mekong
25-March-2004 N
10
11
239
40
3
20
459
46
VTC Mekong
27-March-2006 N
10
7
234
47
3
14
79
45
VTR Vinh Long
23-March-2006 N
10
7
100
44
3
7
21
43
Littoral Macro. sweep
Littoral Macro. kick
Benthic Macro
A
TSPT
A
TSPT
A
TSPT
Site code
No. of samples
Mean No. taxa
Mean No. individuals
Mean
No. of samples
Mean No. taxa
Mean No. individuals
Mean
No. of samples
Mean No. taxa
Mean No. individuals
Mean
VSS
6
6
20
36
0
10
0
0
46
VSS
5
7
47
35
5
19
66
32
15
2
3
35
VTC
6
7 1627
45
0
15
10
219
61
VTC
5
2
23
41
0
15
4
18
56
VTR
5
6
54
43
0
15
4
14
57
Page 77
Other papers in the MRC Technical Paper series:
MRC Technical Paper No.1
Status of the Mekong Pangasianodon hypophthalmus resources
with special reference to the stock shared between Cambodia and Viet Nam.
MRC Technical Paper No.2
Status of Pangasiid aquaculture in Viet Nam.
MRC Technical Paper No. 3
Mekong giant fish species: on their biology and management.
MRC Technical Paper No. 4
Deep pools as dry season fish habitats in the Mekong Basin.
MRC Technical Paper No. 5
Financial analysis and risk assessment of selected aquaculture
and fishery activities in the Mekong Basin.
MRC Technical Paper No. 6
Fisheries in the Lower Mekong Basin: status and perspectives.
MRC Technical Paper No. 7
Freshwater aquaculture in the Lower Mekong Basin.
MRC Technical Paper No. 8
Fish migrations of the Lower Mekong Basin: implications for
development, planning and environmental management.
MRC Technical Paper No. 9
The impacts of introductions and stocking of exotic species in
the Mekong Basin and polices for their control.
MRC Technical Paper No. 10 Distribution and ecology of some important riverine fish
species of the Mekong River Basin.
MRC Technical Paper No. 11 Hydro-acoustic survey of deep pools in the Mekong River of
southern Lao PDR and northern Cambodia.
MRC Technical Paper No. 12 Tagging Fish - a case study from the Tonle Sap, Cambodia.
MRC Technical Paper No. 13 Biomonitoring of the lower Mekong River and selected
tributaries.
MRC Technical Paper No. 14 Fish Migration Triggers in the Mekong River and other
freshwater tropical systems.
MRC Technical Paper No. 15 Diagnostic study of water quality in the Lower Mekong Basin.
MRC Technical Paper No. 16 Fish Consumption and the Yield of Fish and Other Aquatic
Animals from the Lower Mekong River Basin.
MRC Technical Paper No. 17 Socio-economics of the fisheries of the lower Songkhram
River Baisn, northeast Thailand.
MRC Technical Paper No. 18 Yield and value of the wild fishery of rice fields in Battambang
Province, near Tonle Sap Lake, Cambodia.
MRC Technical Paper No. 19 An Assessment of water quality in the Lower Mekong Basin
Mekong River Commission
P.O.Box 6101,Vientiane 01000,
Lao PDR.Telephone: (856) 21 263 263 Facsimile: (856) 21 263 264
E-mail: mrcs@mrcmekong.org
Website: www.mrcmekong.org
Document Outline
- Summary
- 1. Introduction
- 1.1 The need for river monitoring
- 1.2 The value of biological monitoring
- 1.3 The types of organisms included in biological monitoring
- 1.4 Biological monitoring in Asia
- 2. Sampling sites
- 2.1 Rationale for site selection
- 3. Environmental variables
- 3.1 Introduction
- 3.2 Methods
- 3.3 Results
- 4. Benthic diatoms
- 4.1 Introduction
- 4.2 Methods
- 4.3 Results
- 4.4 Discussion
- 5. Zooplankton
- 5.1 Introduction
- 5.2 Methods
- 5.3 Results
- 5.4 Discussion
- 6.1 Introduction
- 6.2 Methods
- 6.3 Results
- 6.4 Discussion
- 7. Benthic macroinvertebrates
- 7.1 Introduction
- 7.2 Methods
- 7.3 Results
- 7.4 Discussion
- 8. The use of biological indicators of harm to classifyand rate sites
- 9. Future directions
- 10. References
- Appendix 1. Physical and chemical variables and sitedisturbance
- Appendix 2. Species lists and counts per site andsampling occasion
- Appendix 3. Summary of biological indicator values