Mekong River Commission
Yield and value of the wild fishery of
rice fields in Battambang Province,
near the Tonle Sap Lake, Cambodia
MRC Technical Paper
No. 18
July 2008
Meeting the Needs, Keeping the Balance
Mekong River Commission
Yield and value of the wild fi shery of
rice fi elds in Battambang Province,
near the Tonle Sap Lake, Cambodia
MRC Technical Paper
No. 18
July 2008
Published in Vientiane, Lao PDR in July 2008 by the Mekong River Commission
Cite this document as:
Hortle K.G., Troeung R., and S. Lieng (2008) Yield and value of the wild fi shery of rice fi elds
in Battambang Province, near the Tonle Sap Lake, Cambodia. MRC Technical Paper No.18.
Mekong River Commission, Vientiane. 62 pp.
The opinions and interpretation expressed within are those of the authors and do not necessarily
refl ect the views of the Mekong River Commission.
Editor: T.J. Burnhill
Graphic design: T.J. Burnhill
Photographs: K.G. Hortle, S. Chan, R. Troueng, and J.G. Garrison
© Mekong River Commission
184 Fa Ngoum Road, Unit 18, Ban Sithane Neua, Sikhottabong District,
Vientiane 01000, Lao PDR
Telephone: (856-21) 263 263 Facsimile: (856-21) 263 264
E-mail: mrcs@mrcmekong.org
Website: www.mrcmekong.org
ii
Table of Contents
Summary
xi
1. Introduction
1
2. Methods
3
2.1 Study
area
3
2.2 General features of the fi shery
4
2.3 Study
sites
5
2.4 Rainfall
8
2.5 Inundation of rice fi elds and rice growing
8
2.6 Catch
assessment
9
2.7 Standing
crop
10
2.8 Socio-economic information on fi shers
11
2.9 Statistics
11
3. Results
13
3.1 General socioeconomic observations
13
3.2 Fishing gears, effort and total catch
14
3.3 Yield and composition of the catch
19
3.4 Composition and catch by gear
22
3.5 Value of the catch
22
3.6 Disposal of the catch
24
3.7 Comparison between sites
24
3.8 Relationship to habitat variables
26
3.9 Standing
Crop
27
3.10 Catches as a proportion of standing crop
30
3.11 Length-frequency data
31
4. Discussion
37
4.1 Comparison with rice-fi eld fi sheries elsewhere
37
4.2 Signifi cance to livelihoods and food security
40
4.3 Implications
for
fi shery yield estimates
40
4.4 Integration
of
fi sheries and agriculture
43
5. References
45
Appendix 1. Effort, total catches and CPUE for all gears and sites combined
49
Appendix 2. Total effort, catch and CUPE for all gear types
51
iii
Appendix 3. List of species of fi sh and taxa of OAAs recorded, with proportions of total weight
in catches and standing crop estimation, and categorisation by diet and as black or white/
grey fi shes
53
Appendix 4. Total catch of each species by each type of gear
55
Appendix 5. Taxa recorded in this study with total catch quantities and value
59
Appendix 6. Length frequency distributions for the fi ve most abundant species of fi shes
61
iv
Table of Figures
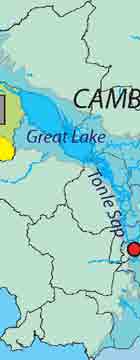
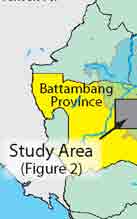
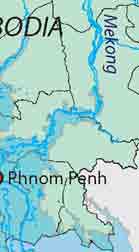
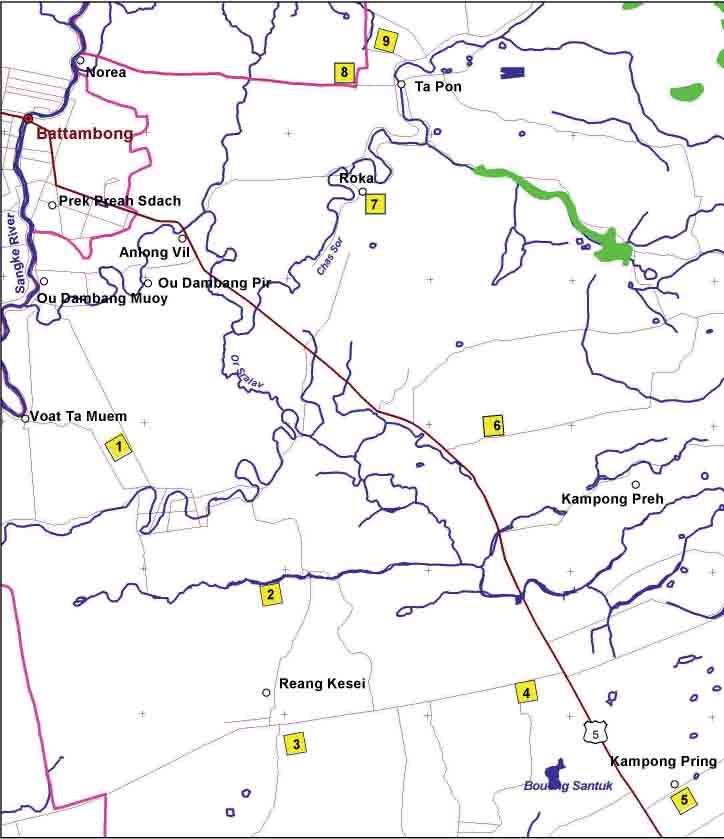
Figure 1. Location of study area.
3
Figure 2. Map of the study sites.
6
Figure 3. Rainfall in Battambang in 2003 and 2004, compared with the long-term mean
from1920 2004.
8
Figure 4. Total catches by each of 26 kinds of gear versus total effort for that gear.
18
Figure 5. Total catches of fi sh and OAAs at each site each month.
18
Figure 6. Composition of the total catch of 26,730 kg.
20
Figure 7. Proportions of the total weight and total value of fi sh of different trophic
guilds in the catches.
21
Figure 8. Composition of the total catch of fi sh each month, showing the six species
comprising most of the weight in catches, nine sites combined.
21
Figure 9. Total catch and weighted average price of all fi sh and OAAs each month.
23
Figure 10. Monthly prices of the six fi sh species which contributed the most to total
catches by weight.
23
Figure 11. Dendrograms of site similarity based on total catches.
26
Figure 12. Proportional composition by weight of the dominant fauna in catches
compared with the fauna recorded by pumping rice fi elds to estimate
standing crop.
29
Figure 13. Ordination of sites based on multi-dimensional scaling of faunal composition.
29
Figure 14. Length-frequency for catches of Channa striata at Site 1.
32
Figure 15. Apparent changes in length, as exemplifi ed by Anabas testudineus at Site 5.
33
v
vi
Table of Tables
Table 1. The area of agricultural land in Cambodia in 1992 and 2004.
1
Table 2. Selected features of the study sites as determined from dry-season aerial
photographs and ground-truthing.
7
Table 3. General pattern of rice growing for wet season rain-fed rice in Battambang.
9
Table 4. The dates of the two occasions when sites were pumped for standing crop
estimation. 10
Table 5. Summary of age and gender data from fi sher interviews.
13
Table 6. The main income-earning activities of fi shers interviewed during the study
period. 14
Table 7. Types of gear used by fi shers in this study.
15
Table 8. Fishing effort as total fi sher-days, summed for all nine sites, total area 225 ha.
16
Table 9. Total catch of fi sh & OAAs (kg) by each gear, summed for all nine sites.
16
Table 10. CPUE as mean catch by each category of gear (kg/fi sher-day), summed for
all sites.
17
Table 11. Summary statistics for catches, value, no. of taxa and effort at each site.
25
Table 12. Summary statistics for standing crop on the fi rst and second occasions of
pumping 1-ha plots in rice fi elds.
28
Table 13. Comparison of the proportions of the main taxa in catches and pump samples
at each site.
30
Table 14. Correlation matrix for comparison of total catches with total standing crop
from pumping.
31
Table 15. Summary of fi sh measured from sub-samples of fi sher catches and from
pumping on two occasions for standing crop estimation.
33
Table 16. Increase in total length of identifi able cohorts of three common species
between pumping occasions.
34
Table 17. Estimates of yields from rain-fed rice fi elds and fl oodplain habitat.
39
Table 18. Estimated wetland areas in the LMB and Cambodia.
40
Table 19. Estimated annual inland catches for Cambodia, based on information from
1994 1997.
41
vii
viii
Acknowledgements
The following provincial fi sheries offi cials are thanked for assisting with fi eld data collection:
Mr Heng Piseth, Mr Chhea Hav, Mr Kheng Makkhen, Mr Sam Mardy, Mr Yim Hour, Mr Uy
Sarun, Mr Chan Tey, Mr Chhem Sophea, and Mr Ouch Chham. Drs Matthias Halwart and
Andrew Noble are thanked for their helpful comments on a draft manuscript. The senior author
acknowledges the support of the Water Studies Centre, Monash University, Australia, for
providing offi ce space and computer support during the preparation of this report.
ix
x
Summary
For most rural people in Cambodia, rice fi elds and associated habitats are important sources
of fi sh and other aquatic animals (OAAs), which provide both nutrition and income. A lack of
quantitative information contributes to a general neglect of rice fi eld fi sheries in development
planning, which usually favours intensifi cation of rice production that may negatively impact
the fi shery. The main objective of this study was to quantify the yield and value of the rice
fi eld fi shery in an area typical of the rain-fed, lowland, wet-season rice fi elds that surround the
fl oodplain of the Tonle Sap-Great Lake system.
At nine sites, each 25 ha in area, the fi shing effort and catches of fi sh and OAAs by local
fi shers were monitored for one season (July 2003 February 2004), and standing crop was
measured twice by pumping and sieving water from one-hectare plots adjacent to each site in
the late wet season.
Fishing activity was greatest during October and November, when paddy water levels were
highest, rice was in the vegetative stage and other work opportunities were limited. Fisher
numbers peaked at about 2 persons/ha; most fi shers (82%) were male and most (79%) were
aged 16 50 years. Ten main types of gear were used. Traditional traps and hook and line were
the most used and most productive (accounting for 72% of the total catch), because they can be
used around rice fi elds without disturbing the crop.
Catches included 35 species of fi sh, which made up 77% of the total catch weight, with
air-breathing `black fi sh' accounting for about 88% of the fi sh catch by weight. Most of the
fi sh catch consisted of carnivores, which were more valuable than omnivores (based on market
values); no herbivores were recorded. About 80% of the total fi sh catch by weight comprised six
species: Channa striata (chevron snakehead), Macrognathus siamensis (peacock eel), Anabas
testudineus (climbing perch), Clarias batrachus (walking catfi sh), Trichogaster trichopterus
(three-spot gourami), and Monopterus albus (swamp eel). Six taxa of OAAs comprised 23% of
the total catch, and crabs, frogs and shrimps were the most abundant OAAs.
Catches at each site appeared to refl ect hydrology; in general sites that were deeper and
inundated for longer periods attracted greater total fi shing effort and produced larger total
catches. Catches were also infl uenced by proximity to permanent waters, as the two sites with
the most fi sh species were close to a permanent river. The mean yield (fi sh plus OAAs) was
119 kg/ha/season (±25 as 95% confi dence limits) with a mean value of US$102/ha (±$23/ha),
based on market prices. This study underestimates the yield and value of the fi shery, because
additional catches are made by fi shers using unmonitored illegal gears, and unmonitored
catches are also made during the dry season.
Mean standing crop in the one-hectare rice fi eld plots was 64.7 kg/ha (±4.9), of which
about 70% was fi sh. Carnivorous black fi shes, and crabs and snails were proportionately more
xi
Yield and value of the wild fi shery of rice fi elds in Battambang Province, near the Tonle Sap Lake, Cambodia
abundant than in catches, and fewer species were recorded than in catches, which refl ect a
diversity of habitats targeted by fi shers. The biomass of fi sh in standing-crop samples increased
signifi cantly between sampling occasions, but the biomass of OAAs declined, a fi nding
consistent with growth of fi sh and predation on OAAs. The composition of the fauna was
similar in all of the standing crop samples, refl ecting general homogeneity of rice fi elds as a
habitat. The composition of catches was more variable between sites, refl ecting the response of
the fauna to small and heterogeneous areas of non-rice fi eld habitats.
Most of the fi sh in catches were small; among fi ve common species all individuals were
less than 32 cm and half were less than 10 cm in length. Analyses of length-frequency data
suggested growth rates of 1 4 cm/month, which indicates that virtually all fi sh were caught in
their fi rst or second year of life.
The gross income from rice production at the time of the study was about $150 /hectare/
year with a single crop, so with some level of management (for example development of trap-
ponds), the capture fi shery could become more valuable than rice farming. The indigenous
carnivorous fi sh species may be signifi cant agents for controlling the pests of rice, and fi sh feed
upon organisms, including insects, crabs and snails, which would otherwise be inaccessible as
food for people. Research and development of rice-fi sh culture should include these indigenous
fi sh species that are hardy, adaptable, preferred as food and generally more valuable than the
introduced herbivorous/omnivorous species that are usually promoted in rice-fi sh culture.
The rice-fi eld fi shery is accessed by most rural people for some part of the year; it is a
common-property resource, which limits the incentive for farmers to invest in its conservation.
Land holdings are generally small, often fragmented, and distant from their owners' houses.
Farmers are usually not present to prevent others fi shing on their land or to prevent theft of
aquacultured fi sh. Increasing the yield from the fi shery is a technically feasible way to improve
output from rice fi elds, but the management problems which arise from current ownership
patterns and small fragmented landholdings need to be addressed if the full potential of rice-
fi eld fi sheries is to be realised.
The yield fi gure found in this study is consistent with the values that have been found in
other studies in the Lower Mekong Basin and elsewhere in Asia. Previously published estimates
for the total fi shery yield from Cambodian rice fi elds are based on unrealistically low values for
yield per unit area and under-estimates of the area of rice fi eld habitat, leading to a signifi cant
under-estimate for the total national yield from rice fi elds. Moreover, rice fi elds probably
produce a much larger share of the total yield of inland fi sheries in Cambodia than is generally
recognised. Elsewhere in the Lower Mekong Basin, rice fi eld habitats' contribution to fi sheries
is also under-recognised; in each country rice fi elds are the most extensive aquatic habitat and
there are general similarities in fi shing methods, target species and high participation rates.
Rice-fi eld habitats should be given appropriate emphasis in research to quantify inland fi sheries
yield in each country and to improve management for fi sheries, especially given their particular
importance in supporting livelihoods and nutrition for the rural poor.
xii
1. Introduction
Wild capture fi sheries are important sources of food and income for rural people throughout
Asia. Assessment of fi sheries should take into account the contribution from the large areas
of agricultural land that are typically used for rice farming, an industry that is based on vast
areas of anthropogenic wetlands, which can be referred to as `rice-based ecosystems' because
they support a wide biodiversity. In the four countries of the Lower Mekong Basin (LMB)
up to 100 species of wild fi sh, other aquatic animals and plants are harvested by rural people
in any particular location, supporting their livelihoods and providing essential protein and
micronutrients (Balzer et al. 2005; Halwart 2006). A recognition that rice-farming landscapes
produce much more than rice led the International Rice Commission to recommend that
member countries should promote the sustainable development of aquatic biodiversity in rice-
based ecosystems, that management measures should enhance the living aquatic resource base,
and that attention should be given to the nutritional contribution of aquatic organisms to the
diet of rural people (IRC, 2002). To support this recommendation, quantitative data are required
which show the actual yield and economic value of the fi shery and how best to optimise the
value of all forms of production from rice-based ecosystems.
Table 1. The area of agricultural land in Cambodia in 1992 and 2004.
Based on offi cial national data summarised by ACI and CamConsult (2006, Table 284).
Year
Area (ha) of land used for:
Percentage of Area
Rice
Other Crops
Total
Rice
Other Crops
Total
1992
1,844,100
187,000
2,031,100
90.8%
9.2%
100.0%
2004
2,374,175
440,348
2,814,523
84.4%
15.6%
100.0%
In Cambodia, rice is the most important crop by area farmed, production tonnage and value
(ACI and CamConsult, 2006), and the estimated area of planted to rice increased by about 29%
between 1992 and 2004 to about 2.4 million ha (Table 1). This increase can be attributed to
intensifi cation of land use (i.e. on fallow or un-worked land) and to clearing of forest or scrub,
both in the fl ood recession zone and on the surrounding terraces where rain-fed rice is grown.
According to ACI and CamConsult (2006, Table 294) 81.3% of Cambodia's rice farming land is
terraces, i.e. land surrounding fl oodplains where `rain-fed' rice is grown during the wet season.
Only 11.1% of the rice-fi eld area is within fl oodplains and comprises recession rice (8.1%) and
fl oating rice (3.0%); the remaining area is riverbank rice (5.4%) and others (2.1%). Irrigation is
relatively undeveloped, as only 22% of the rice-fi eld area in Cambodia receives supplemental
irrigation. However, only one percent is fully irrigated and able to produce more than one crop
per year.
Most of Cambodia's rice-farming land is within the Lower Mekong Basin, which includes
the Tonle Sap system, other lowland tributaries, and distributaries in south-east Cambodia. It
should be noted that `rice fi elds' as a land-use class in GIS data covers a much larger area than
Page 1
Yield and value of the wild fi shery of rice fi elds in Battambang Province, near the Tonle Sap Lake, Cambodia
the planted areas as indicated in Table 1, e.g. about 26,097 km2 in 1992 3 (MRCS, 1994).
Associated habitats include small water bodies (ponds and canals), other wetland crops, such as
lotus, and small patches of brush.
Cambodian's main sources of animal protein are inland fi sh and OAAs; which are estimated
to provide about 80% of the average intake of animal-derived protein (Hortle, 2007). About
84% of Cambodians are rural (Anonymous, 1999), and virtually all rural households would
directly access rice fi elds for food and seasonal income from the fi shery The large and
seasonally spectacular river-fl oodplain fi sheries along the Tonle Sap and Mekong River have
been relatively well-studied, but rice-fi eld fi sheries are relatively innocuous, being often
referred to as `the invisible fi shery' (Halwart, 2006), so they are poorly researched.
This study was carried out to provide a quantitative estimate of fi sheries yield (kg/ha/season)
and value (fi rst-sale prices in Battambang) from accurately defi ned areas in typical lowland
rain-fed rice-fi eld habitat in Cambodia. In addition, we estimated standing crop (kg/ha of fi sh
and OAAs) in rice-fi elds to complement the estimate of yield. The study also aimed to provide
information on the usage of gears and the composition of the catch.
The data obtained in this study represent a baseline for the yield that is currently being
obtained in the absence of any management from a wild fi shery in typical lowland rain-fed
Cambodian rice-fi elds. The results provide the basis for a valuation of the fi shery and illustrate a
methodology to use for assessing yield prior to enhancements or changes to management.
In a wider context, because of the vast extent of rice-fi eld habitat, the yield and composition
of this part of the fi shery needs to be quantifi ed throughout the lower Mekong Basin generally,
if the yield of the system as a whole is to be understood and if fi sheries are to be managed
effectively.
Page 2
2. Methods
2.1 Study area
Battambang is a large province in Cambodia which borders the north-western edge of the Tonle
Sap (or Great) Lake, which is the largest lake in South-East Asia and is the centre of inland
fi sh production in the Mekong River system (Figure 1). Population density in the province is
about 68 persons per km2, and 83% of the population is rural (Anonymous, 1999), with most
households still employed directly or indirectly in agriculture or related activities. The mean
household size is 5.3 persons, and most people live in small villages or communes which are
spread fairly evenly through the province along unclassifi ed roads in proximity to the farms.
Single-crop rain-fed rice farming is the dominant land use, as is usual in Cambodia. Formerly,
fl oating rice was cultivated in the zone around the Great Lake that fl oods each year as a result of
backing-up of the Mekong and Tonle Sap fl oodwaters, but recession rice farming is now more
common in this zone. In many respects the pattern of rice-farming and fi sheries resembles that
described in detail by Balzer et al. (2005) in Kampong Thom Province, which lies along the
north-east edge of the Tonle Sap.
Lao PDR
Thailand
Battambang
Mek
Province
CAMBODIA
ong
Great Lake
Study Area
(Figure 2)
Tonle Sa
p
Phnom Penh
Viet Nam
Gulf of Thailand
Mekong Delta
0
100 Kilometres
Figure 1. Location of study area
This study was carried out in Sangke District, which extends from the provincial capital,
Battambang, to the dry-season shoreline of the Tonle Sap Lake. The landscape is generally
Page 3
Yield and value of the wild fi shery of rice fi elds in Battambang Province, near the Tonle Sap Lake, Cambodia
fl at alluvial plains; although the study area is about 500 km inland (i.e. from the mouth of the
Mekong) the elevation is less than 20 mASL, with a general slope towards the Tonle Sap or
its tributaries (Figure 1). The main rivers that drain to the lake are incised several metres into
the plain. The Tonle Sap Great Lake system fl oods regularly each year, peaking around late
September, mainly because of the infl ow and backing up of water from the Mekong. In the
wettest years, Tonle Sap fl oodwaters extend to the main highway, which runs from Phnom Penh
in the south-east to Battambang town. In most years, including during the years of this study,
the sites on the eastern side of the highway are not reached by Tonle Sap fl oodwaters, but are
inundated by local rainfall.
Rice farming is the main land use in the Sangke district. About two-thirds of the rice
cultivation area is rain-fed rice and about one third is fl oating/recession rice, according to data
from the provincial Department of Agriculture. Most houses, with their associated fruit and
vegetable gardens, are sited along roads (usually unsurfaced), which are built on natural levees
or spoil beside rivers and canals. Families typically own one to two parcels of land that are
usually at some distance from their houses; in Cambodia land ownership averages one hectare
per family (ACI and CamConsult, 2006), as is probably also the case in Battambang.
Agriculture has long been practised in this part of Cambodia, so most natural vegetation
has been cleared and the land surface extensively modifi ed to trap rainwater in paddies and to
control drainage. Some remnant `fl ooded forest' to the east of the study area is important wet-
season habitat for fi sh which migrate seasonally from the Great Lake. Paddy walls are typically
about 0.5 m high, and larger levees have been formed from spoil from the main drainage
canals; such levees support the roads used by tractors, buffaloes and motorcycles. Drainage is
controlled via canals and along the remnants of modifi ed stream courses.
Rice cultivation in this area, as is usual in Cambodia, is not highly intensive. One crop
is grown each year, relying mainly on natural rainfall, with limited use of canal water for
irrigation of seedlings or some low-lying fi elds. Yield of wet-season rice averages about 2.2 t/
ha in Battambang, higher than the national average of 1.7 t/ha, but less than half of what can be
achieved under intensive cultivation (ACI and CamConsult, 2006).
2.2 General features of the fi shery
In the study area, the fi shery is entirely based upon naturally occurring fi sh and other aquatic
animals (OAAs), with little evidence of stocking or any kind of management for the rice-fi eld
fi shery. Most people live at some distance from their rice fi elds so they cannot control fi shing
activity on their land. Fishing is apparently open-access, but in this province most fi shers are
local people, so farmers generally know who fi shes in their fi elds and are often given some of
the catch, as well as fi shing themselves.
The fi shery is highly seasonal, because most of the landscape is dry for about half of the
year (Dec. Jan. to May June). Fish and other aquatic animals (OAAs) that have survived the
Page 4
Methods
dry season locally in remnant water bodies or by aestivating in mud, breed at the onset of and
during the wet season and their fry or larvae rapidly colonise newly-fl ooded rice fi elds. The
common `black fi sh' are hardy and fecund species that are widespread in the lowlands because
they can tolerate anoxia -- all gulp air at the water surface and have accessory respiratory
structures.1
Fish and OAAs disperse by moving along the small channels connecting paddies and many
species at times may also move overland. The fry of fi sh from the Tonle Sap Great Lake
and its tributary rivers -- `white' or `grey' fi sh -- are intolerant of anoxia but also colonise
rice-fi eld habitats by swimming up drainage canals and streams. The paddies and associated
canals and ponds are fi shed throughout the wet season, using a wide range of gears, but fi shing
activity peaks during the vegetative phase of the rice crop, when other seasonal employment
opportunities are limited.
2.3 Study sites
Nine sites were selected east and southeast of Battambang Town, the capital of the province
as shown in Figure 2. The sites were selected to be representative of the dominant rice-fi eld
habitats in the surrounding areas and the district generally. Sites were chosen to be accessible
from motorbike paths and to be in reasonably well-frequented areas, because in this part of
Cambodia lawlessness is still a problem. The fi shing gears were a mixture of small-scale
artisanal gears; i.e. there were no medium or large-scale commercial gears, because the sites
were not close to any very large canals or rivers where such licensed gears operate. The sites
were also selected only where the owners allowed access for surveyors and for pumping of a
part of the site in their rice fi elds for standing crop assessment.
The study sites were all 500 metres square, i.e. 25 ha in area. The position of the corners
of each site was recorded by GPS to provide data that was used to locate the sites accurately
on a district map and on dry-season aerial photographs which were linked to GIS data. The
photographs had a resolution of about 0.5 m. From the aerial photographs the area of brush
(scrub and trees) was estimated by planimetry, the number of paddy fi elds was counted, and
the areas of the smallest and largest paddy fi elds were also measured by planimetry. Ground-
truthing was carried out during the wet season, and in the following dry season to identify
remnant water bodies. The aerial photographs and GIS images were examined to confi rm the
location of larger temporary and permanent watercourses and ponds. Table 2 shows that the
sites varied in elevation from 12 to 17 mASL, and on most sites brush occupied less than 2%
of the area, with only three sites having signifi cant remnant vegetation. The number of paddy
fi elds varied from 40 to 123 in each 25 ha site, with sites having mean paddy fi eld areas of 0.2
to 0.6 ha. Overall, paddy fi elds varied from 0.04 to 1.97 ha in size. In general, paddy fi elds
1 Black fi sh are air-breathing fi sh that can spend their entire lives on fl oodplain habitats and are well-defi ned morphologically and
behaviourally. Grey and white fi sh migrate short and long distances respectively from rivers and streams onto fl ood plains to
feed; they are intolerant of anoxia and generally require dry-season refuges in well-oxygenated water, typically deep pools. There
are insuffi cient data to classify many Mekong system fi shes as grey or white, so they are combined in one group here.
Page 5
Yield and value of the wild fi shery of rice fi elds in Battambang Province, near the Tonle Sap Lake, Cambodia
are smaller (and hence more numerous in a given area) where slopes are steeper. The sites had
varying degrees of exposure to seasonal and permanent watercourses and farm ponds.
103°14'
103°16'
103°18'
103°20'
9
Norea
8
Ta Pon
BATTAMBONG
13°06'
Roka
Prek Preah Sdach
7
Anlong Vil
Ou Dambang Pir
13°04'
Ou Dambang Muoy
6
Voat Ta Muem
13°02'
1
Kampong Preh
5
13°00' LEGEND
13°00'
2
Provincial centre
Commune centre
District boundary
Reang Kesei
4
Road
12°58'
12°58'
River
3
Swampy area
Kampong Pring
0
2
4 kilometres
Study site
5
103°14'
103°16'
103°18'
103°20'
Figure 2. Map of the study sites
Page 6
Methods
Table 2. Selected features of the study sites as determined from dry-season aerial photographs and
ground-truthing.
Site
Elev.
Trees/scrub
Paddy Fields
No. of farm ponds Distance to Watercourses
(mASL)
in the 25-ha plot
permanent
and state in
Area/fi eld (ha)
watercourse
dry season
(April)
Area
% cover Number
Mean
Min.
Max.
Perm.
Seas.
(ha)
1
13
0.23
0.90%
57
0.44
0.09
0.87
2
200
Large
canal
along east
edge, some
residual water
2
15
0.34
1.40%
85
0.29
0.05
1.31
50
Large
stream
parallel to
north edge,
some residual
water
3
17
4.89
19.60%
71
0.35
0.08
1.33
2
>200
No
major
watercourses
near site
4
12
0.07
0.30%
40
0.63
0.17
1.97
2
>200
No
major
watercourses
near site
5
14
0.04
0.20%
67
0.37
0.06
1.41
3
>200
Large
canal
along south
edge, some
residual pools
6
13
0.23
0.90%
66
0.38
0.06
1.14
2
>200
Small
canals
connecting to
ponds hold
some water
7
12
0.05
0.20%
111
0.23
0.05
0.84
100
Large
river
(S. Chas) to
the west
8
12
0.00
0.00%
50
0.5
0.05
1.38
2
0
Canals
along
south and
east edges,
residual pools
9
12
0.19
0.80%
123
0.2
0.04
0.72
>200
No
major
watercourses
near site
Page 7
Yield and value of the wild fi shery of rice fi elds in Battambang Province, near the Tonle Sap Lake, Cambodia
2.4 Rainfall
Battambang receives most of its rainfall during the Southwest Monsoon from about May to
November, as is usual for most of Cambodia. Long-term rainfall between 1920 and 2004, with
60 years of complete data, averaged 1318 mm/year. Typically, there is very little rainfall from
December to March (on average 5.6% of the annual total), and because of high temperatures
and evaporation rates through May there is usually little standing water in most paddy fi elds
until June. Over the period April 2003 March 2004, encompassing the study period, rainfall
was 1,221 mm, or 93% of the annual average. (Figure 3).
300
mean
250
study
200
150
ainfall (mm)
R
100
50
0
Apr
May
Jun
Jul
Aug
Sep
Oct
Nov
Dec
Jan
Feb
Mar
Month
Figure 3. Rainfall in Battambang in 2003 and 2004, compared with the long-term mean
from1920-2004. Based on daily rainfall records from the Cambodian Department of Water
Resources and Meteorology.
2.5 Inundation of rice fi elds and rice growing
The general pattern of inundation and of rice-growing is as follows. Seeds are planted (to grow
seedlings) from May through to July in nursery areas where the seedlings can be watered from
canals. Transplanting of seedlings starts in June and continues through to September, when
most of the paddy fi elds are fully inundated. In this area, most strains of rice are traditional
slow-growing varieties that are harvested after about fi ve to seven months, so the earliest-
planted paddies are harvested during November while the latest are harvested during February.
Page 8
Methods
Table 3. General pattern of rice growing for wet season rain-fed rice in Battambang.
Activity
Apr May Jun Jul Aug Sep Oct Nov Dec Jan Feb Mar
Land
preparation
Seedbed
Transplanting
Harvesting
Through October and most of November 2003, 100% of the area of the study sites was
under water. On the western side of the highway the paddies were typically 0.4 0.6 m deep,
and held signifi cant water through to December, as drainage was constrained by having to pass
through a limited number of culverts under the highway. On the eastern side of the highway, the
paddies were generally shallower, 0.3 0.5 m deep, and drained earlier (through canals to the
east) so that at least half the area was dry by November. In terms of apparent depth and duration
of fl ooding, Sites 5, 6 and 7 were the driest and shallowest, Sites 8 and 9 were intermediate, and
sites 1 to 4 were the wettest.
2.6 Catch assessment
The plots were visited four times each month for seven months (August 2003 February 2004);
a total of 28 times. During the other fi ve months there was relatively limited fi shing in the study
sites, although some catches were made in residual water bodies and in fi elds where fi shers dig
and rake through mud to catch aestivating fi sh, crabs, molluscs and frogs.
On each survey occasion, two surveyors visited each plot to interview fi shers and to measure
their catches. The local surveyors generally knew the villagers who fi shed in each area, so they
could organise the interviews in advance. The total numbers of fi shers and the gears used by
each fi sher in each plot were recorded based on direct observation and by interviewing fi shers.
About 30 50% of people fi shing on a surveyed day were interviewed regarding their use of
gear and their catches and the results. They were also asked to estimate their effort (number
of days fi shing) over the period since the previous interview (about one week). The exact time
each gear was being used during each day was not recorded, so effort was expressed as `fi shing
days' only. The catch per gear and the effort data were used to estimate the catches of those who
were not interviewed in detail, based on their reported gear and effort.
Interviews were based on a standard format that included basic information on the people
fi shing, effort and gears. Identifi cations were based on a chart of photos of about 150 species
found in the area, as well as by reference to drawings and keys in Rainboth (1996), and names
were updated from FishBase (Froese and Pauly, 2007). Fishers kept their catches for the
surveyors to identify and weigh. Animals were weighed using calibrated pan balances accurate
to fi ve grams. Representative sub-samples of the fi ve most common fi sh species were selected
Page 9
Yield and value of the wild fi shery of rice fi elds in Battambang Province, near the Tonle Sap Lake, Cambodia
from all gears at each site on all occasions, and the total lengths of fi sh were measured to the
nearest centimetre using fi sh measuring boards. The price of each taxon was determined from
interviews as the sale price in the nearby Battambang market in Riel/kg for each species.
2.7 Standing crop
Standing crop was estimated for plots one hectare in area that were adjacent to, and considered
representative of, each 25 ha plot. Standing crop estimation followed a pumping procedure.
Each one-hectare plot was already enclosed by the walls of paddy fi elds; inlet and outlet
channels were blocked and the walls were repaired where necessary to fully isolate each fi eld.
Water was pumped from each plot using an agricultural diesel-powered pump with the intake
in the deepest corner of the plot. A fence of 2 mm nylon mesh around the intake prevented
animals from passing through the pump. While the water level was falling, collectors walked
through the plot and collected fi sh and OAAs by hand and by using dip-nets of 5 mm mesh.
Complete removal of water took up to two days in each plot as the depth varied from 0.1 0.6
m. After most of the water had been pumped from a plot, animals were collected using dipnets
from the remaining small pool of water. The total weight of each taxon was recorded and then
the lengths of representative sub-samples of animals were measured to the nearest millimetre.
Representative sub-samples of the fi ve most common fi sh species were selected and the total
lengths of fi sh were measured to the nearest centimetre using fi sh measuring boards.
The plots were pumped twice, in September and November 2003, as shown in Table 4.
After pumping, the plots rapidly re-fi lled with water from adjacent paddies. During the period
between sampling it was assumed that fi sh and OAAs could readily colonise the plots, directly
via connecting channels and through locally overtopped paddy walls, or by moving overland, a
common behaviour of many species of fi sh and OAAs in this area.
Table 4. The dates of the two occasions when sites were pumped for standing crop estimation.
Site
Occasion
Elapsed Days
1
2
1
13 Sep 03
02 Nov 03
50
2
14 Sep 03
07 Nov 03
54
3
27 Sep 03
12 Nov 03
46
4
28 Sep 03
13 Nov 03
46
5
25 Oct 03
22 Nov 03
28
6
24 Oct 03
23 Nov 03
30
7
23 Oct 03
21 Nov 03
29
8
16 Oct 03
25 Nov 03
40
9
17 Oct 03
26 Nov 03
40
Page 10
Methods
2.8 Socio-economic information on fi shers
During interviews, data were also recorded on the age and gender of fi shers and their usual
income-earning occupations at the time of the survey. Fishers were asked to estimate the
proportion of their catch that was eaten by themselves or their families and the proportion sold.
2.9 Statistics
To estimate the similarity of the fauna at each site two indexes were used (Hellawell, 1978),
calculated for pair-wise comparisons of the fauna at each site with every other site. Sorensen's
index (S) takes account only of the presence of each taxon at each site; these included all taxa
of OAAs and all species of fi sh. The index is defi ned as:
S=
2c/(a+b)
where: a = no. of species at Site a,
b = no. of species at site b and
c = no. of species present at both sites.
Spearman's non-parametric correlation coeffi cient (Rho) takes account of the relative
abundance of each species at each site, in terms of rank. This coeffi cient was calculated using
the six taxa of OAAs and the ten fi sh species at each station which contributed most of the
weight of catches. Rho is defi ned as:
= 1 6d2/(n3-n)
where d is the difference in the magnitude of the rank of each species for the pair of stations and
n is the total number of species in the comparison.
For each index, dendrograms were constructed by single linkage clustering, i.e. by joining
site pairs with the highest values fi rst, then joining site pairs with the next highest values, and so
on, until all sites were connected.
Page 11
Yield and value of the wild fi shery of rice fi elds in Battambang Province, near the Tonle Sap Lake, Cambodia
Page 12
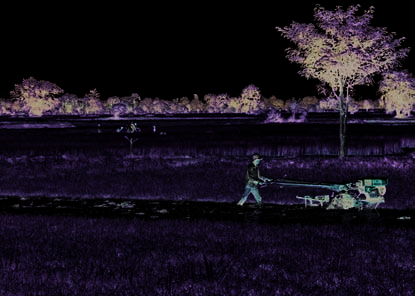

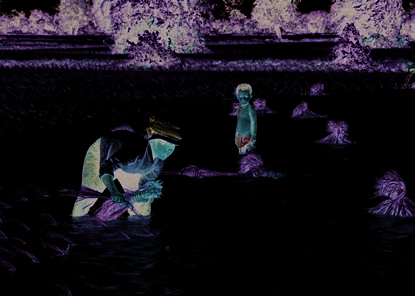
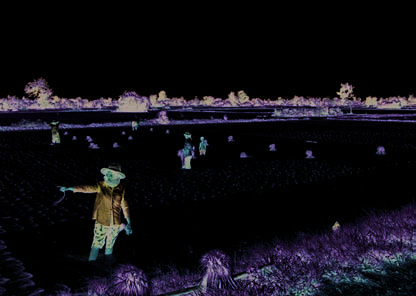
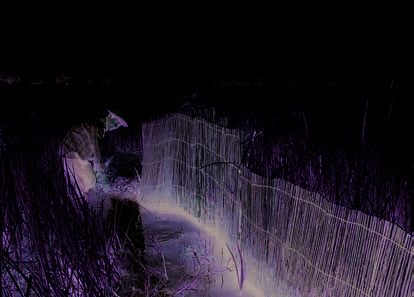
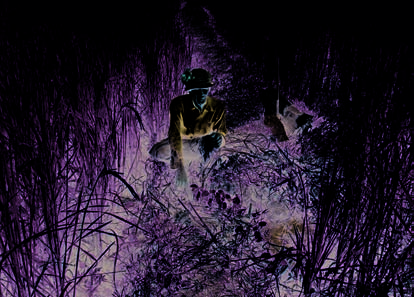
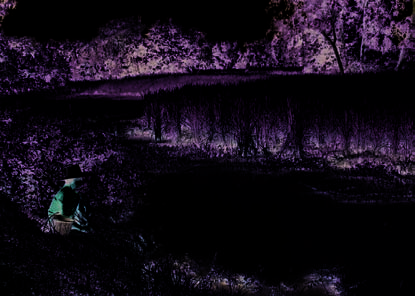
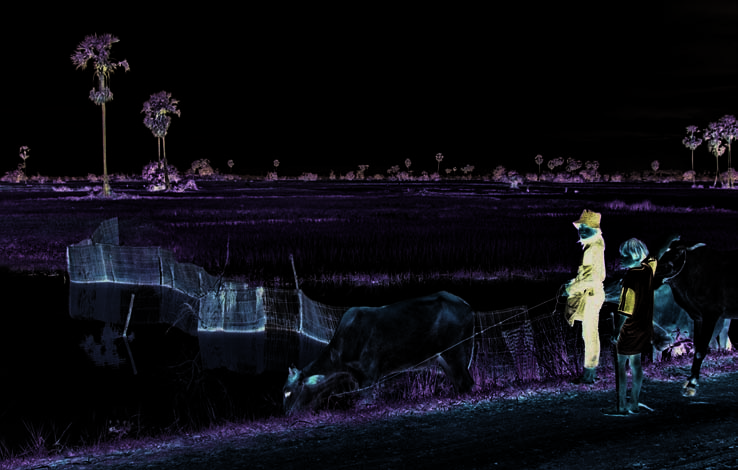
Plate 1. Ploughing fields prior to planting in July creating a temporary but fertile aquatic environment in
which plankton grows rapidly. There is little fishing at this time.
Plate 2. Planting rice seedlings in late July. Vast expanses of dry land become wetlands.
Plate 3. Fishing activity is most intense in October November, when the rice is growing and ripening and
there is less labour needed in farming or other occupations.


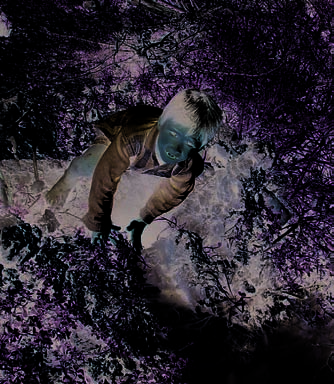
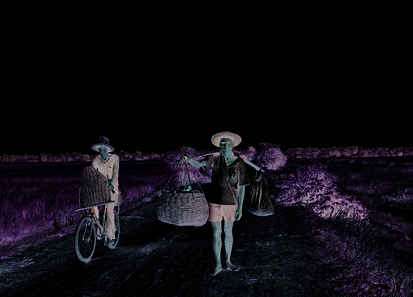
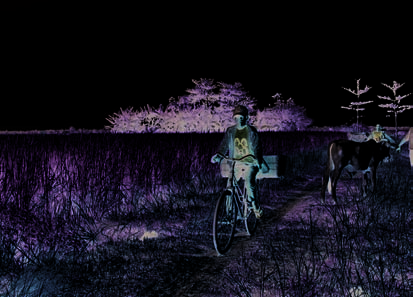


Plate 4. Small holes (anlung) are made to trap fish that exit rice fields, a simple but effective method that
requires little or no equipment.
Plate 5. Access for most fishers is by foot, cycle, or motorcycle along levee roads.
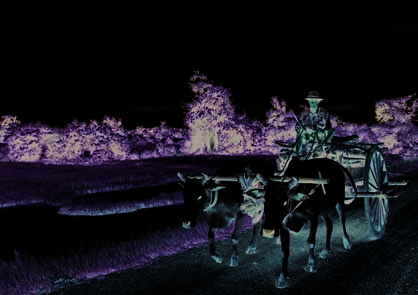
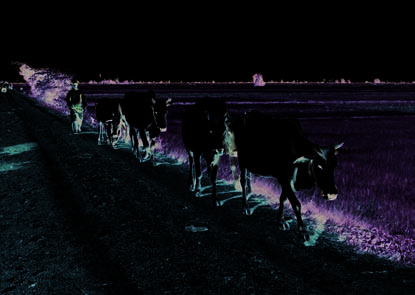
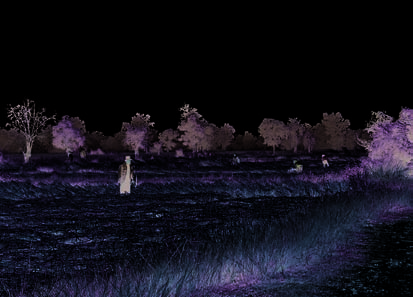
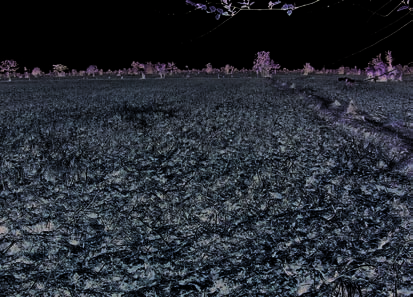
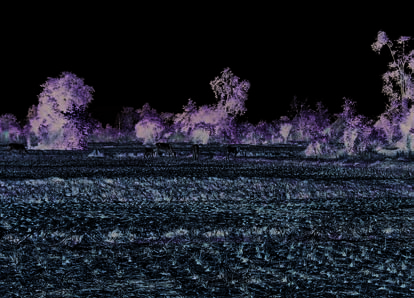
Plate 6. Bullocks are still commonly used as draught animals by farmers, and manure is the most-used
fertiliser in a farming system that continues to support production of other common-property
resources, including the wild capture fishery.
Plate 7. Harvesting rice by hand in December. Most water has gone.
Plate 8. Most of the landscape is very dry from February to May, but some fish and OAAs are still present
in deep cracks and in a few residual water bodies.
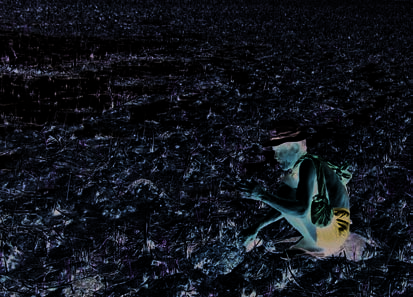
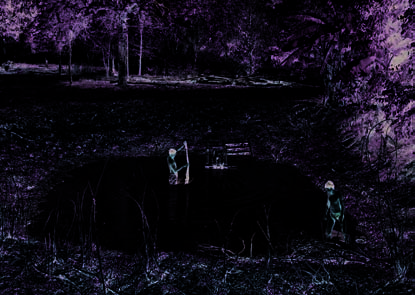

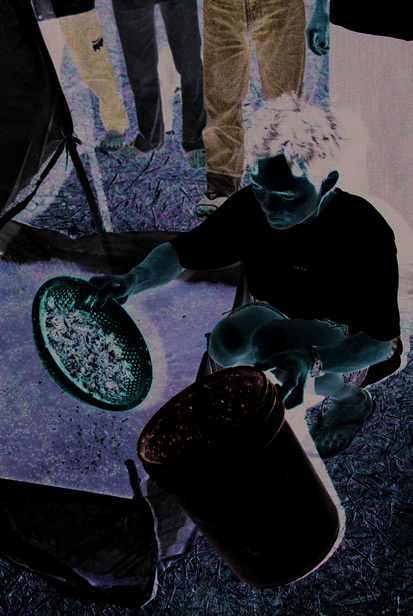
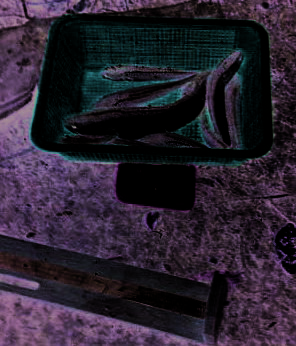

Plate 9. During the dry season, people continue to catch fish and OAAs from drying mud or ponds, but
catches from March to July were not included in this study, so the study underestimates total catches
and value of the wild fishery.
Plate 10. Many people make large catches of aquatic insects by light-trapping at night. Insects are attracted
to the light, hit the plastic sheet and fall into the pool of water. The yield and value of this `aerial
fishery' is not known, but would add to the unaccounted economic value of the wild fishery.
Plate 11. Weighing and measuring snakeheads (Channa striata) and large snails.
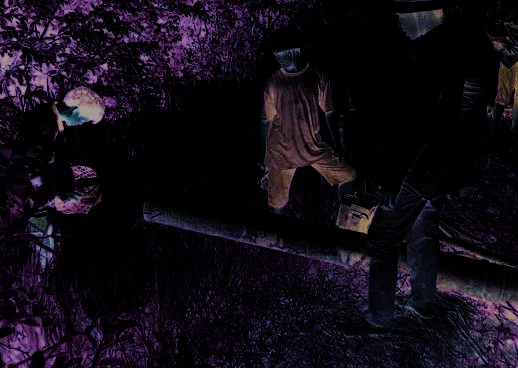
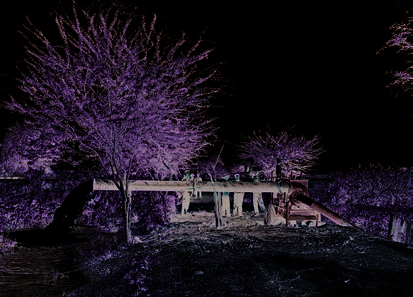
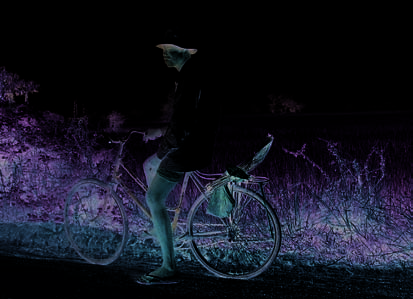


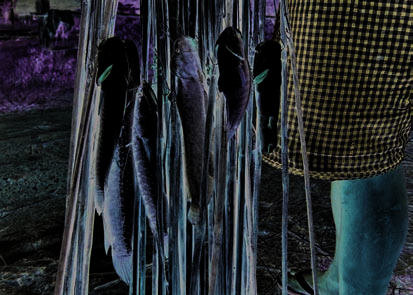
Plate 12. Pumping to estimate standing crop.
Plate 13. Single-hook set pole and line (santuch bangkai) was the most commonly used and productive
gear, accounting for about 23% of the weight of all fish caught, and 19% of all fisher-days. It is
particularly effective for snakeheads and other carnivorous fish.
Plate 14. Typical catches from single-hook set pole and line. Left: snakeheads (Channa striata), climbing
perch (Anabas testudineus) and walking catfish (Clarias macrocephalus). Right: peacock eel (Macrognathus
siamensis), climbing perch (Anabas testudineus) and silver catfish (Mystus atrifasciatus).
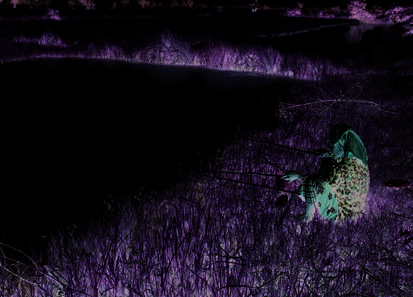

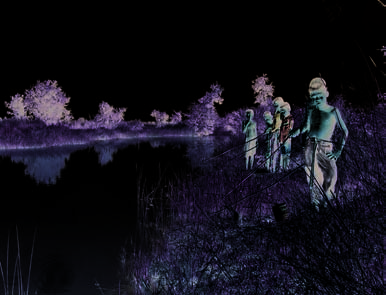


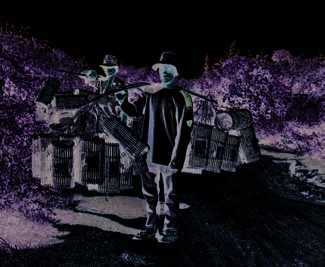


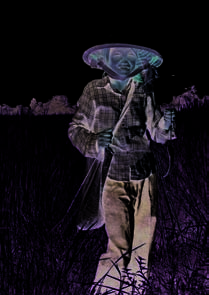
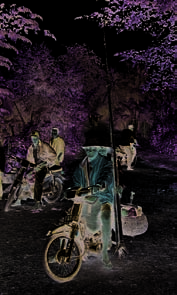
Plate 15. Single hand-held hook and line (santuch ple muoy) -- simple, commonly used and
productive, accounting for about 7% of all fish caught and 9% of all fisher-days.
Plate 16. Among traditional traps, horizontal cylinder traps (tru) are the most commonly used (about 14% of
all fisher-days) and most productive (about 14% of all catches).
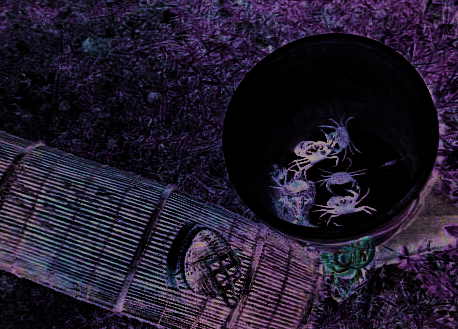
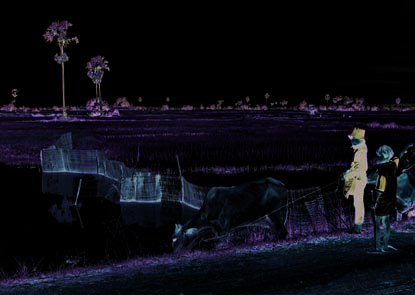
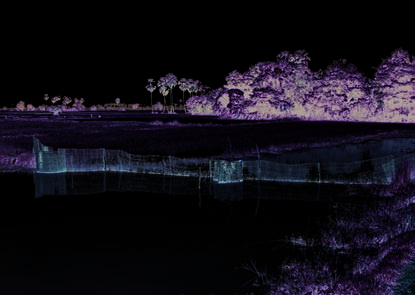

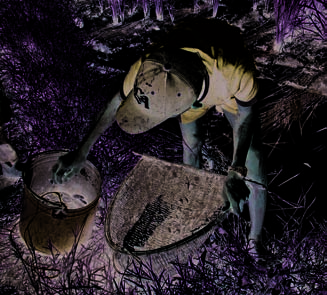
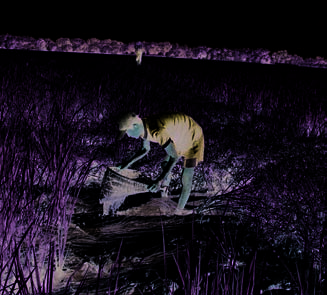
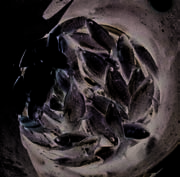
Plate 17. One kind of horizontal cylinder trap, specially designed for catching crabs.
Plate 18. Horizontal cylinder traps with bamboo fences (lop phsom pruol) are the second most productive trap,
accounting for about 12% of the total catch and 8% of fisher-days.
Plate 19. Traps are widely used in a range of habitats, here deploying vertical rice field cylinder
traps (lop nheuk).
Plate 20. Active collecting with a wedge-shaped scoop basket (Chhnieng chunhchot) -- commonly used by the
end of the fishing season in February, with a catch of climbing perch, Anabas testudineus.


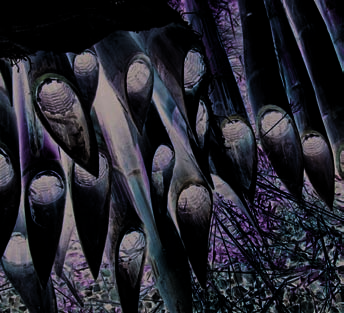
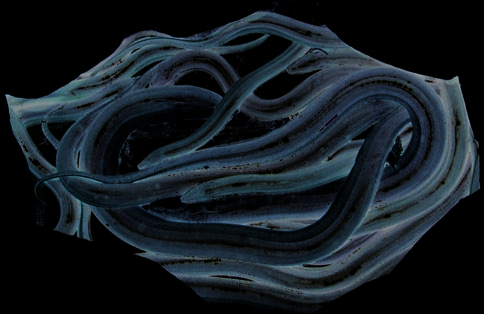
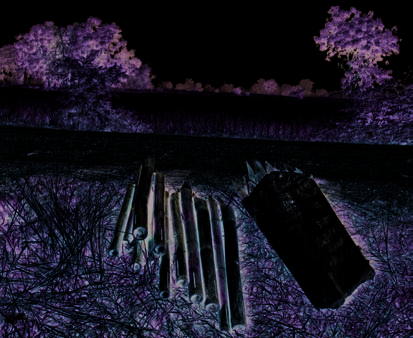

Plate 21. A specialised gear, bamboo tube trap (loan) for eels, with the catch of swamp eels, Monopoterus albus,
one of the most commonly caught species. These traps accounted for 4% of all fish and 3% of
fisher-days.
Plate 22. Vertical bamboo vase traps (tom) are specialised gears that accounted for only 1% of fisher-days
and catches.
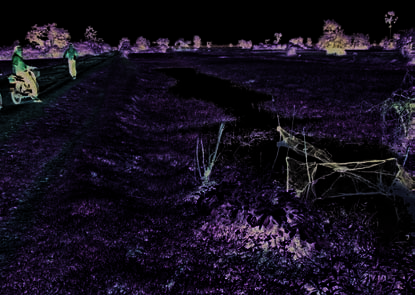
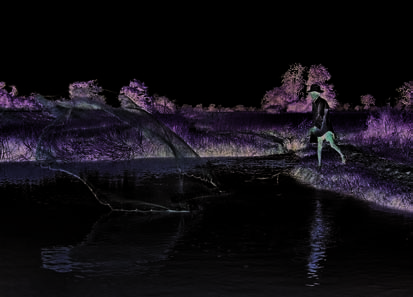
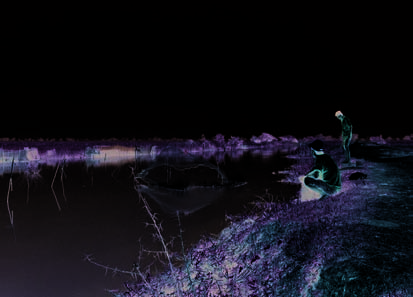


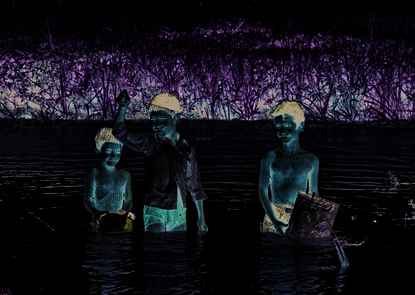
Plate 23. Despite policing efforts by fisheries inspectors, fine-mesh fyke nets are commonly seen -- here in
the early wet season. These illegal gears block migration routes and catch all kinds of fish and their
fry before they access inundated areas where they would feed and grow through the wet season.
Plate 24. Cast nets (samnanh) are commonly used in all open-water areas, accounting for about 10% of
all catches by weight and about 9% of the total fisher-days. Sometimes they are used in pairs to
increase efficiency.
Plate 25. Gillnets (mong reay sre) are less popular in the rice field environment than in larger rivers or lakes
where they may be the dominant gear. In this study they accounted for only 6% of fisher days and
5% of catches.

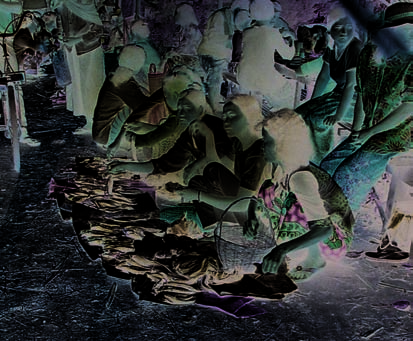
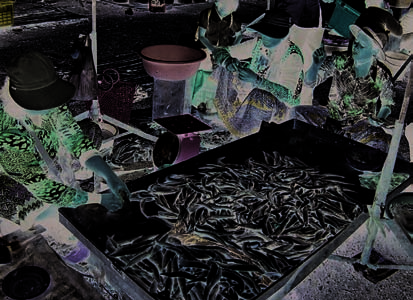
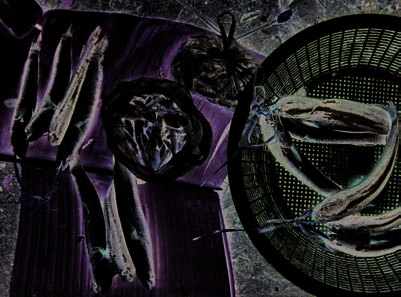
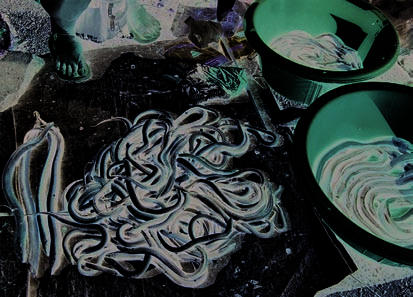
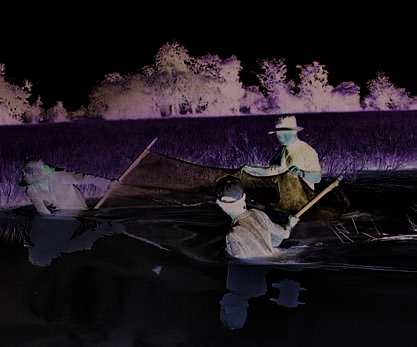
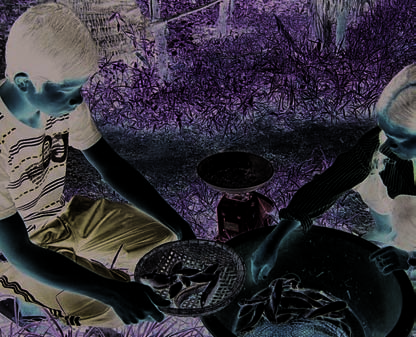
Plate 26. Small-handle seine net (anchorng), a relatively uncommon gear accounting for 2% of catches and
fisher-days. In this example it is technically illegal because of the fine mesh.
Plate 27. Larger fish, especially snakeheads and walking catfish are sold on roadsides or in local markets.
Plate 28. Peacock eels (Macrognathus siamensis) and swamp eels (Monopterus albus) on sale in Battambang market.
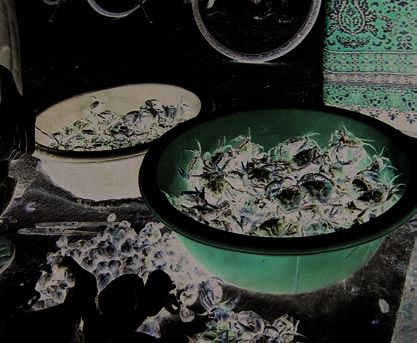
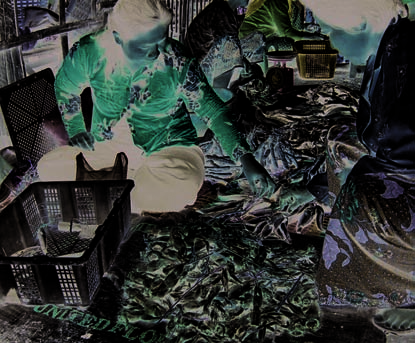
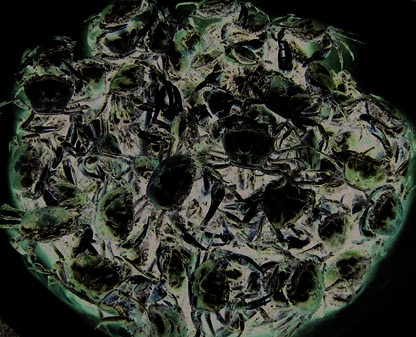
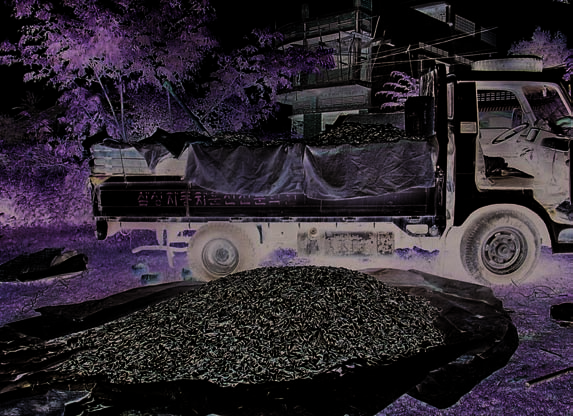
Plate 29. The forgotten animals of the `invisible fishery' on sale in Battambang -- common other aquatic
animals include frogs, crabs, snails and shrimps. OAAs accounted for about 23% of the weight and
11% of the value of all catches.
Plate 30. Trey riel and other fish from the commercial catches in the Tonle Sap Great Lake tributaries begin
to arrive in Battambang in December, so fish prices tend to remain stable despite the declining
supply of rice-field fish.
3. Results
3.1 General socioeconomic observations
Over the period of the study a total of 1217 fi sher interviews were made, with the number of
interviews being approximately proportional to the number of people fi shing at a site each
month, so that interviews varied from a high of 428 people in November 2003, when fi shing
activity was most intense, to only 27 people in February 2004, when most fi shing had ceased.
Some people were interviewed more than once, so the total does not refl ect the actual number
of interviewees, but because interviewees were randomly selected the results should accurately
refl ect the characteristics of the fi shers. Table 5 shows that most fi shers (about 82%) were male,
and most fi shers (79%) were aged 16 50 years, with fairly similar proportions at each site.
There were more children at Sites 5, 6 and 7, probably refl ecting proximity to settlements and
better access from the highway.
At the study sites there were at least 463 fi shers, the number estimated to be fi shing in the
peak month, which was October 2003 at Sites 5, 6 and 7, and November 2003 at the other sites.
Therefore, at the peak of the season there were about 2 fi shers per hectare.
Table 5. Summary of age and gender data from fi sher interviews.
Based on interviewees in each category over the seven-month period of the study.
Location
Total interviewees
Age Group (years)
All
Male
Female
% male % female
<15
16 30
31 50
>50
Site1
151
119
32
78.8%
21.2%
7.3%
38.4%
43.7%
10.6%
Site2
168
138
30
82.1%
17.9%
5.4%
38.1%
45.2%
11.3%
Site3
167
134
33
80.2%
19.8%
4.8%
38.3%
44.9%
12.0%
Site4
170
135
35
79.4%
20.6%
4.1%
38.2%
47.1%
10.6%
Site5
124
100
24
80.6%
19.4%
18.5%
36.3%
39.5%
5.6%
Site6
98
70
28
71.4%
28.6%
24.5%
36.7%
26.5%
12.2%
Site7
125
107
18
85.6%
14.4%
20.0%
34.4%
35.2%
10.4%
Site8
113
100
13
88.5%
11.5%
8.0%
34.5%
46.9%
10.6%
Site9
101
92
9
91.1%
8.9%
8.9%
38.6%
41.6%
10.9%
Total
1217
995
222
81.8%
18.2%
10.3%
37.2%
42.0%
10.5%
Rice growing is the main economic activity in the study area, but people with small holdings
or who own no rice-growing land usually gain seasonal income as wage labourers, either in
cultivation (e.g. harrowing using buffalos or small tractors), rice planting, or rice harvesting
(Table 6). Rice fi elds also support other important industries: large-scale harvesting of insects,
based on light-trapping (Hortle et al., 2005), capture and sale of rats, which are sold as food
Page 13
Yield and value of the wild fi shery of rice fi elds in Battambang Province, near the Tonle Sap Lake, Cambodia
for people or farmed crocodiles, and capture and sale of waterbirds. These wild products are
typically sold in Battambang town and some are exported to Thailand. Their harvest is seasonal,
based on rainfall and abundance of food, including rice. Fishers also earn other income from
labouring and from selling vegetables and fruits.
Table 6. The main income-earning activities of fi shers interviewed during the study period.
The table is a summary of the activities reported by fi shers.
Activity
Aug-03 Sep-03
Oct-03
Nov-03 Dec-03
Jan-04
Feb-04
Wage labour cultivation of rice-fi
elds
Wage labour rice planting
Wage labour rice harvesting
Vegetable selling
Vegetable selling corn and beans
Fruit
selling
Insect (especially crickets) selling
Rat
selling
Water bird selling
Wage labour house building
Wage labour brick factory
Transport motor taxi fee
3.2 Fishing gears, effort and total catch
Fishers used 26 types of gear in ten main categories, classed by mode of action, as shown in
Table 7. Four kinds of gears were observed to be usually lined with nylon mosquito-netting
mesh of 2 mm aperture, illegal under Cambodian fi sheries law1, which specifi es the minimum
mesh for all gears as 15 mm aperture. Other `illegal' methods, including electro-fi shing and
poisoning, were also being practised, but no data could be collected on catches from these
gears.
The usual number of gears per fi sher was estimated and is shown in Table 7, but could
not be recorded on each occasion, so effort is expressed as fi sher-days for each gear; i.e. the
number of days per month each fi sher was estimated to be using a gear at a site. The exact time
spent fi shing during a fi sher-day could not be determined, but would usually be several hours
each day. Most fi shers specialised in one type of gear on any occasion; about 90% of all fi sher
records were for only one kind of gear on one day, but fi shers change their gears during the
season to adjust to changing environmental conditions and target species. Seasonal changes in
effort and catch are tabulated in the summary tables in Appendix 1, which were simplifi ed by
combining effort and catches by gear category to produce Tables 8 10.
1 The Fisheries Law 2004 is open to interpretation on private land.
Page 14
Results
Table 7. Types of gear used by fi shers in this study. Page numbers and codes follow Deap et al. (2003)
yes
yes
yes
yes
Often used with mosquito net mesh
fi
shers
fi
shers
fi
shers
1
1
1
1
1
1
1
5
5
7
6
5
6
1
1
1
fi
sher
3
several
1 5
, 2
, 2
20 100
10 50
20 30
10 40
1 5
1 gear
1 gear
Approximate number used by a typical
usually
x
x3
x3
x3
x3
x3
x5
x1
x
day + night
x
x
x
night
Fishing Period
day
x
x
x
x
x
x
x
x
x
x
x
x
x
x
e
e
r
ey Chhlonh
ob
m
u
Khmer Name
Bach Bat Pralay
Chap Dai
Chhnieng Chunhchoat
Thnorng Moul
Kangva Kongkaep
Chamr
Kangva T
Santuch Bobok Kongkaep
Santuch Phlay Muoy
Santuch Bongkai
To
Chongnoum
Lop Nhek Sr
Tr
Lawn Antong
Lop Kongkaep
Lop Rungvel
Lop Phsom Pruol
Anlung Ungkoup
Mong Reay Sr
Uon Hum
Anchorng
Chheub
Kantrup Kongkaep
Samnanh
Lu Sbai Mong
fi
eld cylinder trap
mesh)
fi
eld cylinder trap
f
fi
ne
edge-shaped scoop basket
Name
Capture by hand in dried ditch or canal
Capture by hand in water
W
Long-handled circular scoop bag
Frog gaf
T
wo-pronged eel fork
Eel clamp
Pole and line for catching frogs
Hand-held single hook and line
Single-hook set pole and line
V
ertical bamboo vase trap
Bamboo funnel basket trap
V
ertical rice
Horizontal rice
Bamboo tube trap for eel
Horizontal cylinder trap for frogs
Big horizontal cylinder trap
Horizontal cylinder trap with bamboo fences
Hole trap
Gill net
Small hand-dragged seine net
Small-handle seine net
Hand-held scissors push net
Frog trap net
Cast net
Fyke net (
ounding gear
ounding gear
ounding gear
Category
Capture by hand
Capture by hand
Scoop nets
Scoop nets
W
W
W
Hook & line
Hook & line
Hook & line
T
raps
T
raps
T
raps
T
raps
T
raps
T
raps
T
raps
T
raps
T
raps
Gill nets
Seine nets
Seine nets
Pushed Gear
Covering nets
Covering nets
Bag nets
Cat. No.
1
1
2
2
3
3
3
4
4
4
5
5
5
5
5
5
5
5
5
6
7
7
9
1
1
1
1
12
Code
1.1
1.1
2.1.1
2.2.1
3.1.1
3.2.1
3.3.1&2
4.1.3
4.1.4
4.2.1
5.1.1.2
5.1.1.2
5.1.1.6
5.1.2.1
5.1.2.2
5.2.3
5.1.2.6
5.1.2.8
5.4.1
6.1.1
7.1.1
7.3.1
9.1.2
1
1.1.2
1
1.2.1
12.1.1
Page No.
14
14
16
22
32
34
38-40
70
72
76
93
95
102
104
108
1
10
1
19
131
147
165
175
182
202
214
216
224
Page 15
Yield and value of the wild fi shery of rice fi elds in Battambang Province, near the Tonle Sap Lake, Cambodia
During the period when rice is growing in inundated paddies, fi shers may not move through
rice fi elds, so are restricted to using hook and line and small traps around the edges of paddies,
and using other gears such as gillnets, cast nets, small seines, traps and fyke nets in adjacent
canals and ponds. Some specialised gears for frogs and eels are used only after rice fi elds have
been wet for several months and the population of these target species has increased. After
water levels fall and where rice has been harvested, fi shers can move through the fi elds using
active methods, including capture by hand and, using wounding gears such as clamps and
gaffs. Pumping water out of fenced-off parts of canals is a common (but illegal practice) when
water levels are low, and capture by hand, sometimes aided with wedge-shaped scoop baskets
is practised in shallow residual water through rice fi elds. Tabulations of the number of fi shers
using each category of gear each month, and for the number of sites at which the gear was being
used, showed similar patterns to Table 10 so are not presented here.
Table 8. Fishing effort as total fi sher-days, summed for all nine sites, total area 225 ha
Category
Aug 03 Sep 03 Oct 03 Nov 03 Dec 03 Jan 04 Feb 04 Total
%
Traps (9 types)
696
1148 1963 3964 2104
72
9947 43.3%
Hook & line (includes hand-held & set single hooks) 912
904
2413 2189
208
80
6706 29.2%
Covering nets (cast nets & frog trap nets)
751
1228
80
2059 9.0%
Gill nets (one type)
712
732
1444 6.3%
Bag nets (one type fyke nets)
50
560
610
2.7%
Wounding gear (eel clamps, eel forks & frog gaffs)
48
148
396
307
899
3.9%
Pushed gear (hand-held scissors net)
112
132
244
1.1%
Seine nets (2 types of small hand-pulled seines)
160
144
216
32
552
2.4%
Capture by hand (in water or in canals pumped dry)
164
168
80
412
1.8%
Scoop nets (2 types of small hand-held nets)
12
80
92
0.4%
Total
1608 2052 6061 8865 3032
880
467 22,965 100.0%
Table 9. Total catch of fi sh & OAAs (kg) by each gear, summed for all nine sites.
Category
Aug 03 Sep 03 Oct 03 Nov 03 Dec 03 Jan 04 Feb 04 Total
%
Traps (9 types)
1070
976
3130 4582 2819
63
12,641 47.3%
Hook & line (includes hand-held & set single hooks) 382
791
1752 3431
87
93
6537 24.5%
Covering nets (cast nets & frog trap nets)
1021 1595
56
2672 10.0%
Gill nets (one type)
808
643
1451 5.4%
Bag nets (one type - fyke nets)
173
847
1020 3.8%
Wounding gear (eel clamps, eel forks & frog gaffs)
6
160
315
382
863
3.2%
Pushed Gear (hand-held scissors net)
96
432
529
2.0%
Seine nets (2 types of small hand-pulled seines)
158
203
150
14
525
2.0%
Capture by hand (in water or in canals pumped dry)
131
97
57
285
1.1%
Scoop nets (2 types of small hand-held nets)
30
178
208
0.8%
Total
1452 1767 7073 11,307 3500 1015
617 26,730 100.0%
Note: Totals may not sum due to rounding.
Page 16
Results
Table 10. CPUE as mean catch by each category of gear (kg/fi sher-day), summed for all sites.
Category
Aug 03 Sep 03 Oct 03 Nov 03 Dec 03 Jan 04 Feb 04 Mean
Traps (9 types)
1.54
0.85
1.59
1.16
1.34
0.88
1.27
Hook & line (includes hand-held & set single hooks)
0.42
0.88
0.73
1.57
0.42
1.16
0.97
Covering nets (cast nets & frog trap nets)
1.36
1.30
0.70
1.30
Gill nets (one type)
1.13
0.88
1.00
Bag nets (one type - fyke nets)
3.46
1.51
1.67
Wounding gear (eel clamps, eel forks & frog gaffs)
0.13
1.08
0.80
1.24
0.96
Pushed gear (hand-held scissors net)
0.86
3.27
2.17
Seine nets (2 types of small hand-pulled seines)
0.99
1.41
0.70
0.43
0.95
Capture by hand (in water or in canals pumped dry)
0.80
0.58
0.71
0.69
Scoop nets (2 types of small hand-held nets)
2.50
2.23
2.26
Total
0.90
0.86
1.17
1.28
1.15
1.15
1.32
1.16
Note: Totals may not sum due to rounding.
Tables 8 and 9 show that the largest total catches were made with the most-used gears, with
catch rates varying between 0.1 and 3.5 kg/fi sher-day for any type of gear (Appendix 1). The
highest catch rate was recorded for fi ne-mesh fyke nets, which could explain why they are
widespread and popular, despite efforts by fi sheries inspectors to destroy these illegal gears.
Overall, mean CPUE (catch per unit effort) was 1.16 kg/fi sher-day, averaged across all gears.
Allowing for the use by some fi shers of two kinds of gear (approximately 10% of fi sher-days)
the mean catch per fi sher was about 1 kg/day, averaged across all gears, sites and months.
Traps accounted for about 43% of the effort and 47% of the weight of catches, and three
categories of gear (traps, hook and line, and covering nets) accounted for about 82% of the total
effort and the total weight of catches (Tables 8 and 9). Some types of gear that are commonly
used in other environments, such as gill nets, bag nets and seines were relatively unimportant
in the fi shery, as dense vegetation in and near rice fi elds tends to limit the effectiveness of such
gears.
As shown in Figure 4, total catches depend largely upon total effort. The data for this graph
are shown in Appendix 2. The gears which are apparently more effective, in terms of catch per
fi sher-day, correspond with points above the line in Figure 4; including for example horizontal
cylinder traps with fences (HTF) and vertical rice-fi eld cylinder traps (VRT), whereas less
apparently effi cient gears correspond with points below the line in the centre of the graph, such
as hole traps (HT) and hand-held single hook and line (HSH). If the graph were to take into
account the total investment in terms of actual effort per gear or method, and the time and cost
of preparation and materials, the relationship might be improved, because points above the
line (such as HTF and VRT) would be moved to the right, whereas points below the line (such
as HT and HSH) would be moved to the left. Combining gears within the ten main categories
results in an even better correlation (r2=0.98), because within each group lower CPUE by less
effi cient gears tends to be balanced by higher CPUE by more effi cient gears.
Page 17
Yield and value of the wild fi shery of rice fi elds in Battambang Province, near the Tonle Sap Lake, Cambodia
6000
5000
4000
HTF
3000
y = 1.16x
ch by each gear
VRT
R2 = 0.92
2000
T
otal cat
HSH
1000
HT
0 0
500
1000 1500 2000 2500 3000 3500 4000 4500 5000
Effort (fisher - days)
Figure 4.
Total catches by each of 26 kinds of gear versus total effort for that gear.
Labelled points are HTF horizontal cylinder trap with bamboo fences; VRT vertical rice-fi eld
cylinder trap; HT hole trap and HSH hand-held single hook and line; refer to text for discussion.
3000
Site 1
Site 2
2500
Site 3
Site 4
g) 2000
Site 8
Site 9
ch (k 1500
T
otal cat 1000
500
0 Aug 03 Sep 03 Oct 03 Nov 03 Dec 03 Jan 04 Feb 04
Month
3000
Site 5
Site 6
2500
Site 7
g) 2000
ch (k 1500
T
otal cat 1000
500
0 Aug 03 Sep 03 Oct 03 Nov 03 Dec 03 Jan 04 Feb 04
Month
Figure 5.
Total catches of fi sh and OAAs at each site each month
Page 18
Results
Total effort, total catches and mean CPUE were all highest in October and November.
Figure 5 shows that the seasonal pattern of catches varied between two groups of sites: at Sites
5, 6 and 7 catches were highest in October, whereas at the other sites catches were highest in
November; similarly the second-highest catches were in November at Sites 5, 6 and 7, and
during December at the other sites. Peak catches were approximately one month early at Sites
5, 6 and 7 because these sites were shallower and drained faster than the other sites. The months
of peak catches coincided for fi sh and for OAAs at all sites, except at Site 1, where highest
catch of OAAs was in August 2003.
Of the total weight of all fi sh and OAAs, 57% was caught during the peak month, with
between 44% and 78% of the total at any site being caught in the peak month. During the two
peak months (i.e. the months of the largest and second largest catch at a site) about 74% of the
total catch was made, with 62 95% being caught at any site. Therefore, a very large proportion
of the catch is made in the period of about two months between the last transplanting of rice
seedlings and the fi rst harvest, when labour is not needed for other work and when inundation
of most of the landscape prevents many other activities. For a family in which three people
fi shed most days, catches of about 100 kg/month could readily be achieved over the two-month
peak period, providing a signifi cant boost for household consumption and supplementary
income.
3.3 Yield and composition of the catch
Fishers caught 35 species of fi sh, as well as six taxa of OAAs which were not identifi ed
to species (Appendix 3). Of the total catch of 26.7 tonnes (from the nine sites), about 77%
comprised fi sh and 23% comprised OAAs. As shown in Figure 6, most of the total catch of
fi sh (about 88% by weight) was made up of 12 species of `black fi shes', species that gulp air
and have modifi ed respiratory structures, features that allow them to tolerate anoxic conditions
in wetland habitats; black fi shes typically do not migrate far when water levels fall. The other
fi shes (i.e. the 24 species making up 7% of the weight of fi sh) are relatively intolerant of
anoxia and migrate to dry-season refuge habitats in permanent water bodies, such as canals,
streams and the Great Lake Tonle Sap system; those that migrate to local refuges are termed
`grey' fi shes whereas species that migrate long-distances are termed `white' fi shes, as noted in
Appendix 3.
Most of the catch of OAAs consisted of crabs, frogs and shrimps in approximately equal
proportions (Figure 6), and it is interesting to note that the total catch of each of these taxa was
greater than the catch of most of the individual species of fi sh. All OAAs are eaten, but some
are fed to animals; for example crabs are commonly fed to pigs and shrimps are fed to ducks.
As shown in Figure 7, the fi sh catch was dominated by carnivores, including snakeheads,
peacock eels, gouramies and walking catfi sh; a full list is presented in Appendix 3. The
omnivores mainly comprised species which eat only small proportions of plant material,
Page 19
Yield and value of the wild fi shery of rice fi elds in Battambang Province, near the Tonle Sap Lake, Cambodia
and there were no purely herbivorous fi sh. Carnivores were generally more valuable than
omnivores, which increased their proportional contribution to total value, as discussed below.
Figure 8 (top) shows that the same species of fi sh tended to dominate catches each month,
whereas Figure 8 (bottom) shows that among OAAs, crabs were more abundant early in the
season while frogs became relatively more abundant later in the season, as might be expected
based on their life cycles. Large numbers of crabs survive the dry season deep in rice-fi eld mud
and are caught early in the season soon after they emerge, whereas tadpoles require time to
grow and metamorphose into frogs, which are mostly caught later in the wet season and in the
early dry.
Other fish (24 species)
Other black fish (6 species)
Channa striata
12.3%
Chevron snakehead
28.0%
7.3%
Monopterus albus
Swamp eel
6.2%
Trichogaster trichopterus
6.3%
Three-spot gourami
17.9%
9.2%
Clarias batrachus
Macrognathus siamensis
17.7%
Walking catfish
Peakcock eel
Anabas testudineus
Climbing perch
Snakes
Small water snails
Large water snails
2.9%2.4%
Crabs
7.1%
35.5%
Shrimps
22.5%
29.6%
Frogs
Figure 6.
Composition of the total catch of 26,730 kg. Fish 20,469 kg (top), OAAs 6,261 kg,
(bottom). For fi sh, only species comprising more than 5% of the total weight are shown.
Page 20
Results
Omnivores
Carnivores
36.6%
32.3%
63.4%
67.7%
Proportion of
Proportion of the
total fish catch
total value of fish
Figure 7.
Proportions of the total weight and total value of fi sh of different trophic guilds in the
catches. Appendix 3 shows the composition by species. Value was derived from Appendix 5.
10000
9000
Monopterus albus
Trichogaster trichopterus
8000
Clarias batrachus
7000
Anabas testudineus
g) 6000
Macrognathus siamensis
ch (k 5000
Channa striata
Other Species
4000
T
otal cat
3000
2000
1000
0
Aug 03
Sep 03
Oct 03
Nov 03
Dec 03
Jan 04
Feb 04
Month
2500
Snakes
Small water snails
2000
Big water snails
Shrimps
g) 1500
Frogs
ch (k
Crabs
1000
T
otal cat
500
0
Aug 03
Sep 03
Oct 03
Nov 03
Dec 03
Jan 04
Feb 04
Month
Figure 8.
Composition of the total catch of fi sh each month, showing the six species comprising
most of the weight in catches, nine sites combined (Top). Composition of the total catch
of OAAs each month, nine sites combined (Bottom).
Page 21
Yield and value of the wild fi shery of rice fi elds in Battambang Province, near the Tonle Sap Lake, Cambodia
3.4 Composition and catch by gear
The catch of each species by each type of gear is shown in Appendix 4. Gears tended to be
selective for certain species. For example, the larger carnivores including Channa striata,
Clarias spp. and Ompok bimaculatus were caught disproportionately by hook and line, whereas
several smaller fi sh species were caught disproportionately by traps. For OAAs, shrimps were
caught disproportionately by bag nets, but the other fi ve taxa were all caught mainly by traps.
Three main groups of gears caught about 82% of the total catch weight; traps accounted for
about 47% of the catch, about 25% was taken with hook and line, and about 10% was caught
using cast nets. Gill nets caught about 5% of the catch and the other seven main types of gears
each caught less than 5% of the total catch.
3.5 Value of the catch
Over the period of the study fi shers caught about 26,730 kg of fi sh and OAAs with a total
value of about US$22,912, calculated as a weighted average based on 647 individual site-date
price records (Appendix 5). Mean prices varied between US$0.05/kg and $1.36/kg; snails and
crabs were the lowest-value animals (US$0.05 0.07/kg) and were predominantly used to feed
animals; the most valuable fi sh (all worth more than US$1.20/kg on average) were the larger
good-eating fi sh, which were carnivorous or primarily carnivorous, these included Channa
striata, Monopterus albus, Macrognathus siamensis, Clarias macrocephalus, Clarias batrachus
and Ophisternon bengalense. The value of carnivorous fi sh averaged US$1.06/kg and the value
of omnivorous fi sh averaged US$0.88/kg, as weighted means across all catches. Similarly,
carnivorous OAAs (frogs and snakes) were far more valuable than omnivorous or herbivorous
OAAs (Appendix 5). Over the entire area of 225 ha that was surveyed, the mean value of the
catch was approximately US$101 per hectare.
The price of fi sh and OAAs overall appears to be insensitive to the quantity caught from
rice fi elds and associated habitats, as shown in Figure 9, because prices in markets also depend
upon the supply from other sources. For example, markets also receive fi sh and OAAs from
large catches which are made in the Tonle Sap Great Lake system during the fl ood recession
from December to February. This supply would tend to offset the effect of lower rice fi eld
catches in those months. The prices of individual species or taxa varied to some extent between
months, which might refl ect short-term changes in supply (Figure 10). However, there was
no evident relationship between quantity and price for all taxa combined (r2 = 0.36, p > 0.05,
n = 7 months), nor for 11 of 12 individual taxa tested for such a relationship. For one fi sh,
Trichogaster trichopterus, quantity and price were positively correlated (r2 = 0.77, p = 0.01),
perhaps a spurious correlation related to catches for this species peaking in October, prior to
catches of most other species peaking (i.e. the price might refl ect lower availability of fi sh
overall).
Page 22
Results
12000
4500
Catch
4000
10000
Price
3500
8000
3000
g)
g)
ch (k
2500
iel/k
6000
2000
r
ice (R
T
otal cat
P
4000
1500
1000
2000
500
0
0
Aug 03
Sep 03
Oct 03
Nov 03
Dec 03
Jan 04
Feb 04
Figure 9.
Total catch and weighted average price of all fi sh and OAAs each month.
US$ = Riel 4000.
10000
Channa striata
9000
Macrognathus siamensis
Anabas testudineus
8000
Clarias batrachus
7000
Trichogaster trichopterus
Monopterus albus
g)
6000
iel/k
5000
r
ice (R
P
4000
3000
2000
1000
0
Aug 03
Sep 03
Oct 03
Nov 03
Dec 03
Jan 04
Feb 04
Month
Figure 10. Monthly prices of the six fi sh species which contributed the most to total catches by
weight. Prices are weighted averages from all sites and gears combined. Clarias batrachus was
uncommon in Feb-04 and no price was recorded.
Page 23
Yield and value of the wild fi shery of rice fi elds in Battambang Province, near the Tonle Sap Lake, Cambodia
3.6 Disposal of the catch
Most fi shers catch what is needed for household consumption and sell the excess, but also tend
to sell larger higher-value fi sh and eat smaller fi sh. Larger specimens of the air-breathing black
fi shes (including Clarias, Channa, and Anabas) can be kept alive for extended periods out of
water, so are easy to transport and sell. Data on catch disposal were incomplete, either because
fi shers did not supply the information or it was not accurately recorded by data collectors,
so a detailed analysis could not be undertaken. Up to about 70% of catches at any time were
reported to be sold by fi shers, with generally higher proportions sold at times of higher catches.
Fishers at Sites 1 4 appeared to be mainly fi shing for income, and sold 50 70% of their
catches, fi shers at Sites 5 7 (close to houses and with more children fi shing) sold only about
10 15% of their catches, and at Sites 8 and 9 fi shers sold 15 60% of their catches, with higher
percentages at times of larger catches. From these data it would be reasonable to estimate
that about half of the weight of all the catches was sold. Thus the value of sales may also be
estimated as about half of the total value of the catch, or about US$11,456 -- or about US$51
per hectare as actual sales. Allowing for the fact that larger and higher-value fi sh tend to be
sold preferentially, the value of sales is probably higher than this fi gure. Catches which are not
sold are either eaten in the fi shers' households, preserved, or given away or bartered with other
households.
3.7 Comparison between sites
Total catches at each site varied between about 67 and 162 kg/ha, with a mean value of
119 kg/ha, and the value of catches ranged from about $61/ha to $148/ha, with a mean value of
$102/ha, as shown in Table 11.
The variation between sites was not large, so the relative error for the estimate of mean
catches was only +21%. Fish made up about 77% of the total catch, but about 89% of the total
value, because fi sh were generally more valuable than OAAs. The variation in catches between
sites may be a consequence of the differences in extent and duration of inundation, which
were greatest at Sites 1 to 4, corresponding to the highest catches. In addition, catches were
correlated with fi shing pressure, but this could be simply a consequence of the fact that people
fi shed more on those sites that were inundated for a longer period.
The number of species recorded was greatest at Sites 8 and 9, which appeared to be a
result of the capture (in relatively small quantities) of several species of grey or white fi sh that
probably swam into the sites from their dry-season refuge areas in the nearby Sangke River,
which is close to these sites (see Figure 2).
Page 24
Results
Table 11. Summary statistics for catches, value, no. of taxa and effort at each site. Weight and value
converted to kg/ha. Value converted from Riel, US$1 = R4000. CLs denotes 95% confi dence limits.
RE (relative error) = CLs/mean.
Statistic
Site1 Site2 Site3 Site4 Site5 Site6 Site7 Site8 Site9 Mean
CLs
RE
Total catch (kg/ha)
132.4 140.5 162.0 161.0 121.0
66.6
91.0
98.6
96.0
118.8
25.4 21.4%
Catch of fi sh (kg/ha)
105.8 115.7 133.4 114.4
97.6
54.3
62.6
69.0
65.9
91.0
21.9 24.1%
Catch of OAAs (kg/ha)
26.6
24.8
28.6
46.6
23.4
12.3
28.4
29.6
30.1
27.8
6.8
24.6%
Fish as percent of catch
79.9% 82.3% 82.3% 71.1% 80.7% 81.5% 68.8% 70.0% 68.6% 76.6% 18.4% 24.1%
OAAs as percent of catch 20.1% 17.6% 17.7% 28.9% 19.3% 18.5% 31.2% 30.0% 31.4% 23.4% 5.8% 24.6%
Total value (US$/ha)
109.40 127.18 148.13 126.86 119.41 70.37 82.25 72.30 60.62 101.84 23.88 23.5%
Value of fi sh (US$/ha)
99.02 120.19 135.80 111.27 111.39 63.82 73.78 54.17 45.12 90.51 24.68 27.3%
Value of OAAs (US$/ha) 10.38
6.99
12.33 15.59
8.02
6.55
8.47
18.13 15.50 11.33
3.27 28.8%
Fish as percent of value
90.5% 94.5% 91.7% 87.7% 93.3% 90.7% 89.7% 74.9% 74.4% 88.9% 24.2% 27.3%
OAAs as percent of value 9.5% 5.5% 8.3% 12.3% 6.7% 9.3% 10.3% 25.1% 25.6% 11.1% 3.2% 28.8%
No. of taxa recorded
19
21
21
22
17
17
19
36
32
22.7
5.2
22.8%
Species of Fish
14
16
16
17
12
11
13
30
26
17.2
5.0
29.0%
Taxa of OAAs
5
5
5
5
5
6
6
6
6
5.4
0.4
7.4%
Fisher days per site
13,480 16,532 15,100 20,012 14,392 9666 12,940 10,120 11,693 13,771 2443 17.7%
The composition of catches was rather similar at each site; for example the six most-
abundant fi sh species overall were also among the most abundant species at each site, making
up 67 97% of the fauna at a site (see also Figure 12 below). Most species were present at
all sites; Sorensen's index varied from 0.58 to 0.98. There was a signifi cant rank correlation
between the abundance at each site with every other site (Rho = 0.40-0.95 for all site
comparisons, p<0.05) with one exception; Site 3 compared with Site 5 (Rho = 0.36, p>0.05).
Based on the composition of catches, despite general similarities, the sites appeared to fall into
three main groups, as is evident in Figure 11. These are also the three site groups that could
be readily identifi ed in the fi eld as differing in gross hydrological characteristics. Sites 1 to 4
were inundated to the greatest depth and for the greatest duration; Sites 5 to 7 were shallow
and inundated for the shortest period, while Sites 8 and 9 were intermediate and were located
close to the Sangke River. The proximity of each site to others in its group, as well as the partial
separation of each group by physical barriers, would also lead to relatively greater interchange
of fauna between the sites within each group, which would tend to result in a similar fauna
within each group.
Page 25
Yield and value of the wild fi shery of rice fi elds in Battambang Province, near the Tonle Sap Lake, Cambodia
1
2
3
4
8
9
5
6
7
0.6
0.7
0.8
0.9
1.0
1.1
Sorensen's Index
1
2
3
4
5
6
7
8
9
0.6
0.7
0.8
0.9
1.0
1.1
Spearman's Rho
Figure 11.
Dendrograms of site similarity based on total catches. Sorensen's index is based on
presence/absence of taxa, Spearman's Rho on relative ranking of taxa.
3.8 Relationship to habitat variables
There was no correlation between the total catch or total taxa recorded at the nine sites with
any of the general features of the habitat listed in Table 2 -- altitude, brush cover, size or mean
area of paddy fi elds, number of temporary or permanent ponds or both, and distance to a river
(Spearman's Rho, p>0.18 for all comparisons). The lack of relationships does not mean that
these variables are not important, but probably refl ects the generally narrow range of variation
between the sites and the limited extent of any features that might affect yield. For example, six
of the nine plots had ponds. Of these, fi ve plots had two ponds and one had three ponds and the
mean density of ponds was 0.06 ponds/ha. By comparison, in other regions, where trap-ponds
Page 26
Results
are used to enhance fi sh production, there may be one or more ponds per hectare. Another
possible reason for the lack of any apparent relationship with habitat variables is the ability
of animals to move freely into the plots from other areas, so that the effects of brush (which
might provide spawning habitat), or refuge aquatic habitats (ponds and watercourses) might
be apparent, but only at a landscape scale. For example, only plot 3 had signifi cant coverage
of brush, and although the catch at that site was the highest, the catch at the nearby plot 4 was
almost identical, despite an almost complete absence of brush at that site. If brush does increase
fi shery production, the effects may extend some distance from the immediate area. More fi sh
species were caught at Sites 8 and 9 than at the other sites, which is thought to be a result of
better access of white/grey fi sh to this plot from nearby rivers. However, in the absence of a
detailed assessment of the hydrology at each site this interpretation is speculative.
3.9 Standing Crop
On the fi rst occasion that fi elds were pumped, mean standing crop was 58 kg/ha, and on
the second occasion mean standing crop was about 72 kg/ha (Table 12). This increase was
signifi cant (paired t-test, t=3.97, df=8, 0.001<p<0.01) and at all sites, except Site 1, the standing
crop increased. The standing crop of fi sh increased signifi cantly between occasions (and also
at all sites except 1), but the mean standing crop of OAAs fell signifi cantly, and fell at all sites.
These changes would be consistent with growth of fi sh during this period and cropping of
invertebrate biomass by the fi sh. There was no relationship between the standing crop at a site
on the fi rst pumping occasion and on the second occasion (r2=0.094, p>0.05). In general, the
overall density between pumping occasions was increasing to be within the relatively narrow
range shown for Occasion 2 in Table 12, with also a lower relative error of the mean (+5.6%)
on the second occasion (Table 12).
The composition of the fauna from pump samples was generally similar to the fauna of
catches in terms of ranking of dominant taxa, but Channa striata made up over half of the
biomass of fi sh in standing crop samples, compared with about 28% in fi sher catches and
Clarias meladerma which was relatively rare in catches, was among the more common species
(Figure 12, see also Figure 6 and Table 13). There were also fewer species recorded at every
site; of the 35 species of fi sh recorded from catches, only 19 were recorded from the rice fi elds
pumped for standing crop estimation.
Page 27
Yield and value of the wild fi shery of rice fi elds in Battambang Province, near the Tonle Sap Lake, Cambodia
Table 12. Summary statistics for standing crop on the fi rst and second occasions of pumping 1-ha
plots in rice fi elds.
CLs denotes the 95% confi dence limits. RE (relative error) = CLs/mean.
Site
Total Wt (kg/ha)
Fish (kg/ha)
OAAs (kg/ha)
Mean Standing Crop (kg/ha)
Occ. 1
Occ. 2
Occ. 1
Occ. 2
Occ. 1
Occ. 2
Total
Fish
OAA
1
86
69.4
66.7
56.1
19.4
13.4
77.7
61.4
16.4
2
64.8
66.8
31.6
49.7
33.3
17.1
65.8
40.7
25.2
3
51.2
69.1
26.4
52.2
24.8
16.9
60.2
39.3
20.9
4
39.7
78.1
21.3
60.4
18.5
17.6
58.9
40.9
18.1
5
54
80.7
32
59.7
22
20.9
67.4
45.9
21.5
6
67.4
74
40.7
52
26.7
22.1
70.7
46.4
24.4
7
47.8
66.7
31.4
53.9
16.4
12.8
57.3
42.7
14.6
8
50.8
71.7
31.1
60.9
19.6
10.8
61.3
46
15.2
9
60.5
66.6
34
53.6
26.5
13.1
63.6
43.8
19.8
Mean
58.0
71.5
35.0
55.4
23.0
16.1
64.8
45.2
19.6
Min
39.7
66.6
21.3
49.7
16.4
10.8
57.3
39.3
14.6
Max
86.0
80.7
66.7
60.9
33.3
22.1
77.7
61.4
25.2
CLs
10.4
4.0
10.0
3.1
4.1
3.0
5.0
5.1
2.9
RE
18.0%
5.6%
28.5%
5.7%
17.7%
18.4%
7.7%
11.2%
15.0%
The composition of the fauna from pumping at each site was very similar; Sorensen's index
varied from 0.73 to 0.97 for all site comparisons, and the rank order of the fauna at each site
was very similar to that at every other site (Spearman's Rho for all site comparisons: range
0.68-0.92, all p<0.001). Hence there is no basis for separating the site groups based on variation
in faunal composition. Figure 12 illustrates the relative similarity of the composition of the
standing crop at each pumping site, showing for example the similar level of importance of
Channa striata and the other common fi sh species, in contrast to the more variable proportions
in catches.
To compare the fauna of the 25-ha catch assessment sites with the fauna of the adjacent 1-ha
sites pumped for standing crop estimation, multi-dimensional scaling (MDS) was used as a
technique to reduce the data to two dimensions1. In Figure 13, the standing crop sites are clearly
clumped together and consistent with the general similarity of their fauna, with the exception
of Site 1 which had a much higher proportion of Channa striata and a lower proportion of
crabs than the other sites. The catch assessment sites are relatively separate from each other and
generally distant from the standing crop sites.
1 The Proxscal scaling procedure in SPSS was used based on Euclidean distances. Stress-1=0.15, Stress-2=0.33. S-stress=0.05; the
procedure accounted for 98% of dispersion in the data.
Page 28
Results
Proportion in catches
Proportion in standing crop
100%
Other
Snakes
90%
Small snails
80%
Large Snails
Shrimps
70%
Frogs
Crabs
60%
Monopterus albus
50%
Trichogaster trichopterus
Clarias batrachus
40%
Anabas testudineus
Macrognathus siamensis
30%
Channa striata
20%
10%
0%
1
2
3
4
5
6
7
8
9
1
2
3
4
5
6
7
8
9
Site No.
Site No.
Figure 12. Proportional composition by weight of the dominant fauna in catches compared with
the fauna recorded by pumping rice fi elds to estimate standing crop. The fi gures include
all six taxa of OAAs and the six most abundant species of fi sh.
0.8
0.6
6
7
5
4
0.4
6
9
0.2
7
3
0.0
4
5
1
-0.2
9
2
8
3
Dimension 2
-0.4
Standing
8
crop sites
2
-0.6
1
-0.8
-1.0
-1.0
-0.5
0.0
0.5
1.0
1.5
Dimension1
Figure 13. Ordination of sites based on multi-dimensional scaling of faunal composition. Sites with
square symbols inside the ellipse are 1-ha standing crop sites, others are 25-ha catch assessment
sites.
Table 13 shows that four taxa (Anabas testudineus, Macrognathus siamensis, frogs
and shrimps) were present in signifi cantly higher proportions in catches, whereas fi ve taxa
(Channa striata, Clarias meladerma, crabs, large snails and small snails) were relatively more
abundant in pump samples as a proportion of the entire assemblage (i.e. fi sh plus OAAs).
These differences in composition are a consequence of the pump samples being taken from
Page 29
Yield and value of the wild fi shery of rice fi elds in Battambang Province, near the Tonle Sap Lake, Cambodia
1-ha plots of rice fi elds, whereas catches were made from all habitats within each 25-ha study
plot: including rice fi elds and adjacent canals, ponds and seasonal watercourses. In the pump
samples, black fi sh made up virtually all (97%) of the biomass of fi sh, and purely carnivorous
fi sh made up 75% of the biomass; the comparable proportions from fi sher catches were 88%
black fi sh and 63% carnivores; therefore rice fi elds per se are characterised by a very high
proportion of carnivores and black fi sh.
Table 13. Comparison of the proportions of the main taxa in catches and pump samples at each site.
Paired t-tests for the six most abundant fi sh (by weight) in catches and in pump samples, and the six
taxa of OAAs. * p<0.05, ** .01<p<0.05, *** P<0.001>.
Taxon
Mean percentage
Mean percentage of
t
Signifi cance
of fauna in catches fauna in pump samples
Anabas testudineus
14.0%
8.6%
3.826
**
Channa striata
21.3%
36.5%
-4.505
**
Clarias batrachus
8.0%
5.8%
1.275
Clarias meladerma
1.6%
4.9%
-2.694
*
Macrognathus siamensis
12.8%
4.3%
4.294
**
Monopterus albus
4.1%
2.5%
1.180
Trichogaster trichopterus
5.2%
3.2%
2.136
Crabs
8.7%
15.5%
-2.770
*
Frogs
7.3%
2.4%
3.018
*
Large Snails
1.7%
7.2%
-7.229
***
Shrimps
4.9%
0.8%
2.932
*
Small snails
0.6%
3.6%
-7.663
***
Snakes
0.6%
0.7%
-0.272
3.10 Catches as a proportion of standing crop
Standing crop estimates were compared with those for fi sher catch at each site by testing for
correlations as shown in Table 14. Fisher catches from the same month as the fi rst and second
pumping occasions were included as well as total catches and total (average) standing crop
estimates. There were no signifi cant relationships between standing crop and fi sher catches in
any of the comparisons, a somewhat surprising result which could be attributable to several
causes. Firstly, as noted above, fi shers catch fi sh and OAAs from all habitats, not just rice fi elds.
Secondly, a high standing crop in any area might lead to more fi shing effort, which would
tend to reduce the standing crop, so reducing any correlation. Finally, the 1-ha sites pumped
for standing crop assessment might not be entirely representative of the adjacent 25-ha sites
assessed for fi sher catch.
Page 30
Results
Table 14. Correlation matrix for comparison of total catches with total standing crop from pumping.
N=9 sites. SP = mean standing crop estimate from two occasions. Catch-catch and pump-pump
comparisons not shown.
Variable
C1
P2
C2
SC
SP
P1 (pumping 1st occasion)
Rho
0.15
-0.20
-0.18
Sig.
(2-tailed)
0.70
0.61
0.64
C1 (catch 1st occasion)
Correlation Coeffi cient
0.03
0.23
Sig.
(2-tailed)
0.93
0.55
P2 (pumping 2nd occasion)
Correlation Coeffi cient
-0.03
0.15
Sig.
(2-tailed)
0.93
0.70
C2 (catch 2nd occasion)
Correlation Coeffi
cient
-0.25
Sig.
(2-tailed)
0.52
SC (sum of all catches, Aug -Feb) Correlation Coeffi
cient
-0.17
Sig.
(2-tailed)
0.67
Mean standing crop estimates overall varied from about 57-78 kg/ha (Table 12) and mean
standing crop varied from about 37% to 106% of catches at a location.
3.11 Length-frequency data
Fisher catches
From the fi sher catches across the nine the sites, a total of 11,309 specimens of the fi ve most
abundant fi sh were measured as summarised in Table 15. The maximum lengths for each of
these species were less than recorded in literature, and the majority of fi sh were small; about
half of all the fi sh were less than 10 cm in length and the overall range across the fi ve species
was 2 32 cm. The data were cross-tabulated by week and length to determine whether length
modes indicative of cohorts could be used to estimate growth rates. Appendix 6 shows the
tabulations for the sites at which the greatest numbers of each species were measured. Fish
in the smaller size classes were present throughout the fi shing season, suggesting continuous
breeding and recruitment, with fi shers continually cropping excess fi sh.
For four species (Anabas testudineus, Clarias batrachus, Macrognathus siamensis and
Trichogaster trichopterus) it was not possible to interpret length frequency data, because
length modes did not appear to coincide in any meaningful way between sampling occasions.
Possibly, distinct cohorts were present in the populations of fi sh, but were obscured because the
fi shers did not use the same types of gear throughout the sampling period, thereby introducing
artefacts. Fishers also focus on different habitats at different times, which would also obscure
evidence of cohorts if, as is likely, fi sh select different habitats at different sizes. For Channa
Page 31
Yield and value of the wild fi shery of rice fi elds in Battambang Province, near the Tonle Sap Lake, Cambodia
striata, the length-frequency data at some sites suggested distinct cohorts, as shown in Figure
14 for Site 1. One cohort appears to have grown 2 cm (from 18 to 20 cm) in 9 weeks, and
smaller fi sh appear to have grown 1 cm (from 17 to 18 cm) in 2 weeks. The data therefore
suggest that growth for Channa striata within the measured length range was in the range of
1 2 cm per month. More than half of the Channa caught were 18 cm or less, and the maximum
length recorded was 32 cm, so most Channa are probably caught in their fi rst or second year of
life.
35
30
Week 42
25
20
15
10
5
0
35
30
Week 46
25
20
15
10
5
0
35
30
Week 50
25
20
15
10
5
0
Number of fish
35
30
Week 51
25
20
15
10
5
0
35
30
Week 53
25
20
15
10
5
0
15
16
17
18
19
20
21
22
23
24
25
26
27
28
Length class
(Total length in cm)
Figure 14. Length-frequency for catches of Channa striata at Site 1.
Length classes on horizontal axes are total length in cm. The modes of two probable cohorts are
highlighted in yellow and blue. Week 42 is 12th to 18th October 2003; Week 53 is 28th December
2003 to 3rd January 2004.
Page 32
Results
Pumping data
Data from pumping are more likely to be useful for size frequency analysis because the same
sampling method was used in the same location each of the two times that pumping was carried
out. A total of 4858 fi sh in fi ve common species was measured across the nine sites
(Table 15).
Table 15. Summary of fi sh measured from sub-samples of fi sher catches and from pumping on two
occasions for standing crop estimation.
Lengths are all cm total length; Maximum length recorded in world literature is from Appendix 3.
Species
Fisher Catches
Pumping
Max
length
in world
N
Min Lth
Max Lth
N
Min Lth
Max Lth literature
Anabas testudineus
3526
3
14
1462
3
12
25
Channa striata
2060
6
32
1128
9
29
115
Clarias batrachus
856
5
26
305
13
25
47
Macrognathus siamensis
2247
6
27
861
12
23
35
Trichogaster trichopterus
2620
2
11
1102
3
11
17
Total
11,309
2
32
4858
3
29
50
Site 5
40
25 October 2003
30
20
10
0
50
Number of fish
Site 5
40
22 Novemeber 2003
30
20
10
0
3
4
5
6
7
8
9
10
11
12
Total length (cm)
Figure 15. Apparent changes in length, as exemplifi ed by Anabas testudineus at Site 5. Pump
samples, occasions 28 days apart.
For each of these species the length range was less than in fi sher catches, as would be
expected when fewer fi sh are measured during a more restricted time period in only one habitat.
Page 33
Yield and value of the wild fi shery of rice fi elds in Battambang Province, near the Tonle Sap Lake, Cambodia
Well-defi ned modes which appeared to represent one or two cohorts and which show growth
between the sampling occasions were evident for three species, as exemplifi ed in
Figure 15.
For these three species (Table 16), the mean length of fi sh within an apparent cohort was
calculated and used to estimate daily change in length for that cohort based on the number of
days which had elapsed between occasions.
Table 16. Increase in total length of identifi able cohorts of three common species between pumping
occasions Lengths are cm total length.
At most sites that are not shown too few fi sh were measured on at least one occasion. For Anabas at
Site 1 modes were present but could not be clearly related.
Anabas testudineus
Site
No. of fi sh on occasion
Mean length (cm) of main
Increase in
Elapsed days
Increase
cohort on occasion
length (cm)
(cm/month)
1
2
1
2
2
88
80
5.41
8.08
2.67
54
1.50
3
58
74
5.41
8.14
2.72
46
1.80
4
48
106
6.04
8.23
2.18
46
1.44
5
85
107
4.79
8.41
3.62
28
3.94
6
84
79
5.60
8.10
2.51
30
2.54
7
109
52
4.96
7.48
2.52
29
2.64
8
107
41
4.17
7.54
3.37
40
2.56
9
54
24
4.29
6.75
2.46
40
1.87
Mean increase (rounded)
2
Maximum length recorded in this study
14
Trichogaster trichopterus
Site
No. of fi sh on occasion
Mean length (cm) of main
Increase in
Elapsed days
Increase
cohort on occasion
length (cm)
(cm/month)
1
2
1
2
5
48
94
4.81
7.16
2.35
28
2.55
6
45
84
4.93
6.77
1.84
30
1.87
7
45
84
4.36
6.20
1.85
29
1.94
8
57
31
4.23
6.58
2.35
40
1.79
9
82
45
4.96
6.60
1.64
40
1.24
Mean increase (rounded)
2
Maximum length recorded in this study
11
Clarias batrachus
Site
No. of fi sh on occasion
Mean length (cm) of main
Increase in
Elapsed days
Increase
cohort on occasion
length (cm)
(cm/month)
1
2
1
2
5
7
22
15.43
20.86
5.44
28
5.90
6
7
38
15.14
18.63
3.49
30
3.54
7
3
50
15.50
17.78
2.28
29
2.39
Mean increase (rounded)
4
Maximum length recorded in this study
26
Page 34
Results
Table 16 summarises the estimated change in mean length of apparent cohorts; when
rounded to the nearest cm (the unit of the original measurements) the increase in length was
about 2 cm per month for Anabas testudineus and Trichogaster trichopterus and about 4 cm
per month for Clarias batrachus. For these three species it is apparent that the growth rates and
maximum recorded lengths are consistent with most fi sh being caught within their fi rst year of
life.
For Channa striata and Macrognathus siamensis (as exemplifi ed in Figure 16) there were no
clear patterns that would enable identifi cation of particular cohorts. Possible explanations for
the lack of a pattern include the following.
· Some size classes within these two species could be quite mobile, actively moving within
rice fi elds and between rice fi elds and canals and channels. This would explain, for
example, the appearance of larger fi sh (>20 cm) in Figure 15.
· Fishers could be selectively removing certain size classes in these two species; which
would explain the apparent loss of the strong mode at 13 cm on the fi rst sampling
occasion.
· The distribution of cohorts of these fi sh may be patchy, with samples refl ecting the
presence of single broods of fi sh spawned in the sampled area. This explanation is
particularly likely to apply to Channa, in which both parents protect their young in one
locality until they are fi ngerlings. Such an explanation would also explain the mode at 13
cm on the fi rst sampling occasion in Figure 15, but the absence of this size class on the
second.
Page 35
Yield and value of the wild fi shery of rice fi elds in Battambang Province, near the Tonle Sap Lake, Cambodia
Page 36
4. Discussion
4.1 Comparison with rice-fi eld fi sheries elsewhere
The general features of the Battambang rice fi elds fi shery resemble those reported for a similar
rain-fed rice fi eld environment in Kampong Thom, north-east of the Tonle Sap system by
Balzer et al. (2005). There, 25 fi sh species were abundant and 12 more were commonly seen;
a total of 37 species compared with 35 in this study. In Kampong Thom, four fi sh species were
abundant and favoured; these were all carnivorous black fi shes, which were also among the
top fi ve species recorded in catches in Battambang Channa striata, Clarias macrocephalus,
Clarias batrachus and Monopterus albus. Other aquatic animals such as snakes, crabs, shrimps,
amphibians, molluscs and insects were also important, as in this study. In Svay Rieng south-
east Cambodia, Gregory et al. (1996), found a similar proportion (18%) of OAAs in the
catch as found in this study (24%) and also found that carnivorous or primarily carnivorous
blackfi shes Channa striata, Anabas testudineus and Clarias macrocephalus were also caught
most frequently. In another study of rain-fed rice fi eld habitat in Svay Rieng, Shams et al.
(2001) found that Channa striata, Clarias spp. and Anabas testudineus comprised 89% of
the total catch of 12 farmers who were monitored. In north-east Thailand these same three
taxa comprised about 79% (C. striata comprised 60%) of the total catch of 123 farmers' trap
ponds in the Chi valley (Saengrut, 1998). Middendorp (1992) found these three black fi sh taxa
comprised on average 91% of the wild fi sh catch (43% was Channa striata), and wild fi sh
dominated the yield from stocked trap-pond culture systems. Angporn et al. (1998) similarly
found that the same three black fi sh taxa produced 95% of the yield from the trap-pond systems
of 35 farmers. In a coastal poldered system in southern Cambodia, 31 fi sh species were caught;
the most important taxa were also Channa striata, Clarias spp., Anabas testudineus and the
featherback, Notopterus notopterus, a grey fi sh which depends upon large permanent water
bodies as dry-season refuges (Lim et al., 2005).
Balzer et al. (2005) recorded 26 techniques of catching fi sh; Gregory et al. (1996) recorded
23 techniques and in this study in Battambang 26 techniques were recorded. The seasonal
pattern of fi shing activity, peaking in the period when rice is in the vegetative stage (October-
November in this study), is probably the general pattern in much of Cambodia, as described
in Svay Rieng by Gregory et al. (1996). In Kampong Thom, Balzer et al. (2005) estimated
mean consumption would be about 1 kg/family during the fi shing season; in this study catches
averaged about 1 kg/fi sher/day. Allowing for two fi shers per family (typically of 5 or 6 people),
and sale of about half of the fi sh caught, the two estimates are quite similar. In Svay Rieng,
Shams et al. (2001) found over a nine-month period, mean catches of about 585 kg/household,
or about 2 kg/household/day/year and Gregory et al. (1996) found a similar mean catch rate
of 681 kg/household over ten months; in both studies these higher catch rates were apparently
associated with the use of household trap ponds (not present in Battambang), which increased
yield by providing dry-season refuges and increasing capture effi ciency. In Svay Rieng, lower
Page 37
Yield of the wild fi shery of rice fi elds in Battambang Province, near the Tonle Sap Lake, Cambodia
rainfalls, poorer soils and below-average rice production, coupled with an expanding population
and reduction of the wild fi shery, have made investment in and management of trap ponds
attractive for farmers looking to supplement their livelihoods. Similarly, in north-east Thailand,
trap ponds are widespread and their production appears to compensate for losses of wild fi sh,
and perhaps leads to higher yields than were obtainable without management. Saengrut (1998)
found that in rain fed rice farming areas in the lower Chi Valley in northeast Thailand, 54%
of catches were from trap ponds; the yield per fi sher was similar to that of the more natural
fl oodplain-rice fi eld fi sheries of the lower Songkhram River Basin (Hortle and Suntornratana,
2008). Catches of fi sh from typical trap-pond systems in rain-fed wet-season rice fi elds in
north-east Thailand averaged 209 kg/ha, more than double the fi sh yield (91 kg/ha) found in
this study in Battambang (Middendorp, 1992). Further intensifi cation to a double-cropping rice
system can be expected to create conditions which are much less favourable for many aquatic
organisms; for example only seven fi sh species were present in an intensive rice-growing area
in Malaysia, nevertheless trap ponds produced a mean yield of fi sh of 129 kg/ha/season and a
maximum yield of 202 kg/ha/season (Ali, 1990).
The highest yield reported for a wild fi shery in rice fi elds is about 630 kg/ha/year1, in a
coastal area of Cambodia where levees (polders) have been built to raise and stabilise seasonal
water levels and prevent seawater intrusion (Lim et al. 2005). This high yield is likely a result
of the high water levels in the wet season (average 2 m depth), the presence of permanent water
bodies within the polders, and immigration of fi sh from rivers and streams, which run through
the poldered area. Achieving such a high yield shows the potential for fi sheries to be the
primary output from agricultural land with improved environmental management.
The mean yield estimate for fi sh and OAAs of 119 kg/ha/year reported here is consistent
with ranges previously reported for lowland rice fi eld habitats, as shown in Table 17. The yield
is within the range reported by de Graaf and Chinh (2000) for a non-acid fl oodplain site in the
Mekong Delta, and the yield of fi sh of 91 kg/ha/year is within the range reported by Little et
al. (1996) for wild fi sh yield in rain-fed rice-fi eld habitat in northeast Thailand. The yield of
50 100 kg/ha/year estimated by Guttman (1999) for a rice fi eld fi shery in Prey Veng province,
southeast Cambodia, is less than that that found in this study, as might be expected because
Prey Veng is drier and less productive than Battambang. An estimate of 125 kg/ha by Gregory
et al. (1996) in Svay Rieng, also a dry province, was based on only three villages which might
not have been representative. It is interesting to note that the rice fi eld fi shery in Battambang
appears to be more productive on an areal basis than the notable fi shery of the lower Songkhram
River Basin in Thailand. Probably the yield from the highly productive fl oodplain-based portion
of the fi shery of the Songkhram is diluted by the yield from relatively unproductive but spatially
extensive rice fi elds, which in the lower Songkhram River Basin are shallower and inundated
for shorter periods than those in Battambang.
1 The yield reported was based on a fl ooded area of 5500 ha, but fl ooded area may have reached 10,000 ha or more, so the yield
per unit area may be overestimated.
Page 38
Discussion
Table 17. Estimates of yields from rain-fed rice fi elds and fl oodplain habitat.
Ali (1990)
33
. (1996)
. (2003)
. (2000)
. (1996)
T
ables 31
. (2001)
et al
et al
. (1999)
et al
. (2005)
et al
T
able 3 and
et al
et al
et al
Source
This study
Guttman (1999)
Gregory
Little
Middendorp (1992) 20 farmers
and 16 farmers over 2 years
T
an et al. (1973), cited in Fernando
(1993)
Hortle and Suntornratana (2007)
de Graaf and Chinh (2000)
de Graaf and Chinh (2000)
T
roeung
Dubeau
Lim
Ali (1997)
Halls
Baran
Lieng and van Zalinge (2001)
fi
shery
fi
sh only
ge and middle-scale catches
fl
ooded area 6732 ha. Based
fi
sh migrating in from rivers
fi
shed
fi
shed
total
of
fi
shing lots, does not include artisanal catch
fi
sher logbooks plus commercial catches which were
Comment
ields from 10 plots of 25 ha each, monitoring of all
Y
catches
Estimates based on catches, villages may not be
representative, approximate area
Estimates from 3 villages only and approximate areas
Range from one study in Khu Khat
Mean with trap ponds, wild
Double rice cropping, artisanal
Based on catches, consistent with consumption estimates
Intensive monitoring at one site
Intensive monitoring at one site
Includes only commercial ar
in
Study area 8252 ha, max
on
4 9%
May include
Intensively
Intensively
Crude estimate
Crude estimate
1%
only
fi
sh
ild
Composition
Fish 76% OAAs 24%
Fish
Fish 82% OAAs 18%
Fish
Fish
Fish
Fish and OAAs
Fish 47%, OAAs 53%
Fish 89%, OAAs 1
Fish
Fish
Fish
Fish and OAAs
Fish
W
Fish
Fish?
Fish?
202)
532
130
190
ield
100
125
574
Y
(kg/ha/year)
1
19
50
125
25
209
129 (57
79
63
1
19
55
92
95
243
630
24
104
230
139
and
acid
forest
fi
elds
fl
oodplain,
fl
oodplain,
single-crop,
fl
ooded
fi
elds, single crop
forest
fi
elds,
fl
oodplains behind polders
fl
ooded
fi
elds, permanent water
deep
fl
oodplain with recession rice,
fi
elds, single crop rain-fed
fi
elds, single crop rain-fed, low
fi
elds, single crop rain-fed, low
fi
elds, single crop rain-fed
fi
elds, single crop rain-fed
fi
elds, double-cropping irrigated
fi
elds, deep water
fi
elds, deep water
fi
cial
Habitats
Rice
Rice
yield
Rice
yield
Rice
Rice
Rice
Rain-fed and recession rice
fl
oodplain
Rice
soils
Rice
non-acid
Floodplain - rice
former forest
Floodplain - degraded
31% cover and rice
Floodplain -
Mostly
rain-fed rice
bodies about 5% of area
Arti
Unregulated Floodplains 8 studies
Floodplain Natural
Floodplain, total
Floodplain, total for 1995-99
iet Nam
iet Nam
Thailand
Thailand
Thailand
V
V
Cambodia
eng,
V
eng, Cambodia
V
eng, Cambodia
Location
Battambang, this study
Prey V
Svay Rieng
Mekong system, northeast
Mekong system, northeast
Malaysia - nr Penang
Mekong system, northeast
Mekong Delta Floodplain,
Mekong Delta Floodplain,
Prey
Prey
Battambang, Cambodia
T
onle Sap, Cambodia
Prey Nup, Cambodia (coastal)
Floodplains, Bangladesh
Floodplains, Bangladesh
T
onle Sap System
T
onle Sap Floodplain
Page 39
Yield of the wild fi shery of rice fi elds in Battambang Province, near the Tonle Sap Lake, Cambodia
4.2 Signifi cance to livelihoods and food security
The peak fi sher density of 2 persons per hectare, if representative for Cambodian rice fi elds,
suggests that about 7.2 million people (or about half of the current population of 13.4
million) could be active in the rain-fed wet-season rice-fi eld fi shery at its peak each year. The
signifi cance of rice-fi eld fi sheries for Cambodia's population lies not only in their yield and
contribution to nutrition, but also the dispersal of benefi ts through the population, particularly
to the rural poor, many of whom are landless and have limited opportunities for employment.
Evaluation of the merits of changes to farming systems should include assessments of their
overall socio-economic effects, particularly on the more vulnerable segments of the population.
It should also be noted that if wild capture fi sheries are affected by agricultural intensifi cation,
attempts to compensate by developing aquaculture face not only impediments related to land-
holding size and location as discussed below, but may tend to shift the workload onto women
and children (Hatha et al., 1995; So et al., 1998).
4.3 Implications for fi shery yield estimates
Fisheries yield depends largely upon the extent of seasonally inundated land, which in the lower
Mekong Basin includes both fl oodplains and a much larger area of wetlands, most of which are
`rain-fed' rice fi eld habitats that are inundated by rain directly or by diversion of small local
watercourses. The lower Mekong Basin covers an area of about 639,000 km2, of which about
30% is classed as wetlands (permanently or seasonally inundated areas), and of this about 86%
is classed as rice fi elds, based on MRC land-use databases (Table 18). In Cambodia (i.e. the
whole country) there are about 47,000 km2 of wetlands of which about 34,000 km2 are classed
as rice fi eld habitats. About 41,000 km2 of Cambodia's wetland area is within the LMB, and
comprises about 70% rice fi eld habitats (Table 18).
Table 18. Estimated wetland areas in the LMB and Cambodia.
Based on MRC land-use databases post 2000, which are more comprehensive and accurate than
wetland databases used to estimate similar areas by Hortle (2007).
Wetland type
Cambodia
Total LMB
Area
% of total
Area
% of total
(1000 km2)
(1000 km2)
Ricefi eld habitats
28.5
69.4%
159.2
86.1%
Flooded forest/grassland/shrub
7.3
17.7%
7.3
3.9%
Natural swamp
0.3
0.8%
2.2
1.2%
Aquaculture
0.0
0.0%
2.4
1.3%
Permanent water bodies
5.0
12.1%
13.8
7.5%
Total wetlands
41.0
100.0%
184.9
100.0%
Page 40
Discussion
The annual catch fi gures produced by the Department of Fisheries in Cambodia include an
estimate for rice fi eld fi sheries of 50 100,000 tonnes/year (or 17 23% of the total catch) based
on a rice fi eld area of 1.8 million hectares (the 1992 planted area estimate) and a literature-
based yield estimate of 25 62 kg/ha (Table 19)1. These catch estimates have been subsequently
quoted by many authors, but are subject to great uncertainty, as stressed by Sensereivorth et al.
(1999). Moreover, the fi gures are out-of-date, as increasing fi shing pressure and a greater area
under rice cultivation would certainly have led to an increased rice fi eld catch since the 1990s
Table 19. Estimated annual inland catches for Cambodia, based on information from 1994 1997.
From van Zalinge et al. (2000).
Type of fi shery
Annual Catch
(tonnes/year)
Large scale fi shery
Fishing lots
25,000 75,000
Dais (large bag nets)
14,000 16,000
Middle scale fi sheries
85,000 100,000
Family fi sheries
115,000 140,000
Rice-fi eld fi sheries
50,000 100,000
Total
289,000 431,000
The discrepancy in rice fi eld areas between Table 1 (planted area of about 24,000 km2 in
2004) and the area estimated from land-use mapping of 34,000 km2 arises because `rice fi eld
habitats' includes many smaller areas of other kinds of habitat (such as small swamps, ponds,
canals and remnant forest) that are not discriminated from actual rice fi elds. Moreover the area
actually planted each year (Table 1) is less than the total area. The `rice fi eld habitat' area is a
more appropriate measure to use to estimate total yield, because areal yield estimates (as in this
report) are based upon large blocks of habitat, rather than just rice fi elds per se.
The national estimates for yield from rice fi eld habitats should be revised based on the
more accurate estimates of area and an improved areal yield estimate. The estimate from this
study of 119+25 kg/ha/year under-estimates the areal yield from Battambang rice fi eld habitat,
because dry-season catches and some illegal gear catches were not recorded. On the other hand,
rice fi eld habitats in Battambang might be more productive than in Cambodia generally, so a
conservative assumption for mean rice fi eld yield in Cambodia is about 100 kg/ha, of which
about 24% is OAAs. A fi gure of 100 kg/ha for rain-fed rice fi elds is within the lower range
of yields for fl oodplains (discussed below) and appears reasonable, because the effect of the
relatively short duration and shallow inundation of rain-fed rice fi elds may be offset by their
greater fertility, high biological productivity (Heckman, 1974; 1979) and high fi shing pressure.
Multiplying the areal yield of 100 kg/ha/year by the area of rice fi eld habitats provides an
estimate of 285,000 tonnes per year for rain-fed rice fi eld habitats in the LMB in Cambodia, or
about 340,000 tonnes per year from such habitats in the whole of Cambodia. The catches from
1 Based on the stated area and yields, the range is 45,00-112,000 tonnes/year, which was apparently rounded to a very approximate
range
Page 41
Yield of the wild fi shery of rice fi elds in Battambang Province, near the Tonle Sap Lake, Cambodia
middle-scale and family fi sheries may also derive partly from rice fi elds, but can be separately
accounted as the areal yield estimate is based only on the small-scale or household catch
Substituting the rice fi eld yield fi gure of 285,000 tonnes in Table 19 increases the fi shery
yield from the Cambodian part of the LMB to 524,000 616,000 tonnes/year, a range consistent
with the fi gure of 587,004 tonnes/year estimated for Cambodia by Hortle (2007) based on
consumption surveys. The apparently large contribution from the `invisible' rice fi eld fi shery
may allay concerns over the credibility of the consumption-based estimates that have been
expressed by Baran and Myschowoda (2008, p. 59).
Floodplains are often cited as the driver of fi shery productivity in the lower Mekong basin.
Based on MRC GIS data, the maximum extent of annually fl ooded area in the LMB is about
28% of the total wetland area; the remainder is mainly rice fi elds or associated habitats. In
Cambodia, about 30% of the wetland area is above the maximum annually fl ooded area. Wet
season, rain-fed rice farming extends into the periphery of the fl oodplain, where rice that has
been growing for 2 3 months may be exposed to fl oodwaters for days to weeks during large
fl oods. Therefore about half of the wetland area in Cambodia is outside what might be defi ned
as the average `active fl oodplain' and most of this area is rain-fed rice fi elds.
Comparing fi sheries yield from rain-fed rice fi elds (as estimated in this study) with yield
from fl oodplains is constrained by the paucity of accurate data, especially for yields from
defi ned areas of fl oodplains. Available data are summarised in Table 17. Cambodian fi shing lots
had commercial-fi shing yields of 55 95 kg/ha/year of fi sh, but unmeasured subsistence catches
could greatly increase these values (Troeung et al., 2003). An estimate of 245 532 kg/ha (mid-
value 388 kg/ha) (Dubeau et al., 2001) from `fl oodplain' near the Tonle Sap showed that small-
scale catches made up 91-96% of the total, but much of the study area was actually rain-fed rice
fi elds. The estimates of 139 190 kg/ha/year and 230 kg/ha/year for the entire Tonle Sap system
(Lieng and van Zalinge, 2001; Baran et al. (2001) suffer from imprecise defi nition of the area of
fl oodplains, possible inaccuracies in the underlying catch or consumption data, and the incorrect
assumption that the catch was entirely from fl oodplains and none was from the surrounding area
of rain-fed rice fi eld habitat. An estimate of 630 kg/ha/year from a coastal system (Lim
et al., 2005) probably refl ects deep-water fl ooding and the presence of large permanent shallow
water bodies. Floodplains of Bangladesh, which have a similar fauna and hydrology to those in
Cambodia, yield 2 574 kg/ha/year (Table 17); low yields derive from enclosed, relatively dry
fl oodplains, whereas the highest yields derive from open, natural fl oodplains that have large
permanent water bodies. Based on these data, Cambodian fl oodplains are likely to produce areal
yields that are much higher than areal rice fi eld yields, as they are inundated for longer and to a
greater depth, are generally open, have many water bodies, and are subject to moderate-to-high
fi shing pressure.
A yield fi gure of about 100 kg/ha/year was used as a medium-level to estimate total yield
based on the area of all Cambodian wetlands by Hortle (2007). In the LMB generally, rice fi eld
habitat dominates land-use classes within wetlands, so that rice fi eld yield estimates are critical
to estimating the yield of the basin; research on areal yields basinwide would greatly aid efforts
to improve the overall LMB estimate.
Page 42
Discussion
4.4 Integration of fi sheries and agriculture
Rice farming throughout most of Cambodia is relatively non-intensive and unproductive; about
86% of wet-season rice land is still farmed using traditional varieties which are relatively
slow-growing, producing only one crop per year (ACI and CamConsult, 2006). The traditional
farming system uses comparatively low inputs of chemical fertilisers and pesticides and entails
prolonged inundation of fi elds. This also allows a diverse native aquatic fauna to persist and this
forms the basis of an important fi shery. This fi shery is, however, based on common property;
the fi sh and OAAs. Based on surveys in 2004, farmers who own the land earned about $150/
ha on average as a gross income1 from wet-season rain-fed rice farming (ACI and CamConsult,
2006). The fi shery in its current undeveloped state is worth about US$102/ha as a gross value,
based on this study. But farmers do not directly benefi t from this output from their land so they
have no direct incentive to conserve the fi shery, and may also be dissuaded from investing in
simple measures such as trap ponds that would greatly increase fi sh production and capture
effi ciency. Even if ownership of the fi shery were to be changed so that farmers owned the wild
fi sh and OAAs on their land, security is a further constraint to better management of the fi shery.
Farm holdings are generally small - about 1 ha/household on average -- and many households
own two or more plots (ACI and CamConsult, 2006), which are usually not close to the owners'
houses. The lack of security for fi shery production (rather than the technical issues commonly
considered) could be a very most signifi cant factor constraining fi shery conservation and
aquaculture development.
Unfortunately, agriculture has been managed as a separate sector to fi sheries, so for example,
in a major review, ACI and CamConsult (2006) made no reference to the importance of the
rice-fi eld fi shery or the possibilities it offers for improving livelihoods. Rather, following
general practice, to improve farm incomes they recommended an increase in dry-season
irrigation to increase rice production, as well as crop diversifi cation. Dry-season irrigation
potentially affects fi sheries on fl oodplains (Shankar et al., 2004), but may have little or no
effect on fi shery production in rain-fed habitats (Khoa et al., 2005), depending on the actual
management practices. However, intensifi cation of rice cultivation typically involves increased
use of pesticides, which may reduce the food supply for fi sh, and may kill fi sh and amphibians
that could be signifi cant agents in controlling the pests of rice. Research on management of
insect pests of rice has focused on invertebrates as control agents (as reviewed by Way and
Heong, 1994 and Matteson, 2000), but some research using introduced omnivorous fi sh has
confi rmed their potential for controlling important pests (Xiao, 1992), as reviewed in Frei and
Becker (2005). In one study in the Mekong Delta, fi sh reduced rice caseworm populations in
rice by 93% (Vromant et al., 1998). Rural people may also perceive the importance of wild
fi sh in this context. For example, in one study villagers believed that fi sh controlled harmful
insects (Shams et al., 2001). Gregory (1997) cautions that some rice pests may be unpalatable
to fi sh and suggests the main benefi t of fi sh is to raise the economic threshold at which farmers
must spray; under IPM the yield of fi sh is posited to compensate for the loss of income from
pests. However, the value for pest control of indigenous carnivorous air-breathing black fi sh
1 Nett of costs but prior to taxes.
Page 43
Yield of the wild fi shery of rice fi elds in Battambang Province, near the Tonle Sap Lake, Cambodia
and predators such as frogs and toads has never been scientifi cally evaluated. Unlike the
introduced species (common carp, Nile tilapia and silver barb), which are commonly used in
rice-fi sh culture, the native species can all move freely through rice fi elds as they are essentially
amphibious and do not require oxygenated water to survive. These indigenous fi sh do not
require the same level of management as the commonly used introduced fi sh, which cannot
tolerate deoxygenation and usually require that some rice-growing area is sacrifi ced to make
refuges. Food supply may also be limiting; when rice plants are actively growing, shading
virtually eliminates other macrophytes and plankton, forcing fi sh to feed on poor-quality
detritus, leading Vromant et al. (2004) to conclude that `from an aquaculture point of view, the
rice fi eld is not an ideal place for fi sh production'. Of course, this conclusion does not apply to
the indigenous fi sh that are abundant in traditionally managed rice fi elds.
A focus on introducing exotic herbivorous or omnivorous species in `rice-fi sh' systems
(reviewed in Halwart and Gupta, 2004) stems perhaps from a belief that carnivorous fi sh should
not be aquacultured because of the loss of yield which results from their position higher in the
food chain. However, in the rice fi eld environment it may be more relevant to consider that
carnivorous fi sh and amphibians harvest and concentrate a range of other organisms, including
insects, crabs and snails which would otherwise be inaccessible for human consumption, and
in the process may control many pests of rice. It should also be noted that carnivorous fi sh are
generally better food fi sh, preferred by villagers, and they fetch a higher price than omnivorous
or herbivorous fi sh. Overall, the comparative economics of using indigenous carnivorous fi sh in
rice-fi sh systems should be given more consideration, and integrating the rice fi eld fi shery with
agricultural development should be thoroughly researched and developed as a high priority, as
the benefi ts are now well known (Frei and Becker, 2005).
Page 44
5. References
ACI and CamConsult (2006) Cambodia Agriculture Sector Diagnostic Report. A report
prepared for AusAID by Agrifood Consulting International and CamConsult. 214 pages +
Annexes.
Ali, A.B. (1990) Some ecological aspects of fi sh production in ricefi elds. Hydrobiologia 190:
215 222.
Ali, Y. (1997) Fish, Water and People. Refl ections on Inland Openwater Fisheries Resources of
Bangladesh. The University Press Ltd., Dhaka, Bangladesh. 126 pages.
Angporn, P,, Guttman, H., Turongruang, D., Mingkano, P, and H. Demaine (1998) Survey
of Trap Pond Owners in Sisaket and Roi Et Provinces, Thailand. AIT Aqua Outreach,
Working Paper T 6. 45 pages. Asian Institute of Technology, Bangkok, Thailand.
Anonymous (1999) General Population Census of Cambodia 1998. Final Census Results.
National Institute of Statistics, Ministry of Planning, Phnom Penh, Cambodia. 299 pages.
Balzer, P,, Balzer, T. and S. Pon (2005) Traditional use and availability of aquatic biodiversity
in rice-based ecosystems. 1. Kampong Thom Province, Kingdom of Cambodia. pp. 1-16
in: Halwart, M. and Bartley, D. (Eds) Recent Initiatives on the Availability and Use of
Aquatic Organisms in Rice-based Farming. CD-ROM, FAO, Rome. ftp://ftp.fao.org/FI/
CDrom/AqBiodCD20Jul2005/Start.pdf
Baran, E. and Myschowoda, C. (2008) Have fi sh catches been declining in the Mekong River
Basin? Pages 55-64 in: Modern Myths of the Mekong (eds M. Kummu, M. Keskinen and
O. Varis) Helsinki University of Technology, Helsinki, Finland. 187 pages.
Baran, E., van Zalinge, N., Ngor, P.B., Baird, I. and D. Coates (2001) Fish Resources and
Hydro-biological Modelling Approaches in the Mekong Basin. ICLARM, Penang,
Malaysia, and the Mekong River Commission, Phnom Penh, Cambodia. 61 pages.
de Graaf, G. J. and N. D. Chinh (2000) Floodplain Fisheries in the Southern Provinces of
Vietnam. www.nefi sco.org. 9 pages.
Deap, L., Degen, P, and N.P. van Zalinge (2003) Fishing gears of the Cambodian Mekong.
Inland Fisheries Research and Development Institute of Cambodia (IFReDI), Technical
Paper Series 4: 1 269.
Dubeau, P., Ouch, P. and J. G. Sjorslev (2001) Estimating fi sh and aquatic animal productivity/
yield per area in Kampong Tralach: an integrated approach. Cambodia Fisheries
Technical Paper Series 3: 143 164.
Page 45
Yield and value f the wild fi shery of rice fi elds in Battambang Province, near the Tonle Sap Lake, Cambodia
Fernando, C.H. (1993) Rice-fi eld ecology and fi sh culture - an overview. Hydrobiologia 259:
91 113.
Frei, M. and K. Becker (2005) Integrated rice-fi sh culture: coupled production saves resources.
Natural Resources Forum 29: 135 143.
Froese, R. and D. Pauly (2007) (Eds) FishBase. World Wide Web Electronic Publication. www.
fi shbase.org, version (08/2007).
Gregory, R., Guttman, H., and T. Kekputherith, (1996) Poor in All But Fish. A Study of the
Collection of Ricefi eld Foods from Three Villages in Svay Theap District, Svay Rieng.
Working Paper No. 5. 1 27. AIT Aqua-Outreach Programme, Phnom Penh, Cambodia.
Gregory, R.S. (1997) Ricefi eld Fisheries Handbook. Cambodia-IRRI-Australia Project,
Cambodia. 38 pages.
Guttman, H. (1999) Rice Field Fisheries -- A Resource for Cambodia. AIT Aqua Outreach,
Bangkok, Thailand. 4 pages.
Halls, A.S, Hoggarth, D.D, & Debnath, K. (1999) Impacts of hydraulic engineering on the
dynamics and production potential of fl oodplain fi sh populations in Bangladesh. Fisheries
Management and Ecology 6: 261 285.
Halwart, M. and M.V. Gupta (2004) Culture of fi sh in rice fi elds. FAO and the WorldFish
Center, Rome, Italy and Penang, Malaysia. 77 pages.
Halwart, M. (2006) Biodiversity and nutrition in rice-based aquatic ecosystems. Journal of
Food Composition and Analysis 19: 747 751.
Hatha, P., Narath, S. and R. Gregory (1995) A study of the roles and responsibilities of
Cambodian women and children in small-scale aquaculture. Working Paper C-2 in
Regional Workshop on the Role of Women in Fisheries Development, 17-21 July 1995,
Iloilo City, Philippines. 6 pages.
Hellawell, J.M. (1978) Biological Surveillance of Rivers. Water Research Centre. Stevenage,
UK. 332 pages.
Heckman,W.C. (1974) The seasonal succession of species in a rice paddy in Vientiane, Laos.
Internationale Revue der Gesamten Hydrobiologie 59: 489 507.
Heckman, W. C. (1979) Rice fi eld ecology in Northeastern Thailand. Monographiae Biologicae
34: 1 227.
Hortle, K.G,, Roth, T., Garrison, J. and G. Cans (2005) Harvesting insects -- a growing industry
in Cambodia. Catch and Culture 11: 9 10.
Page 46
References
Hortle, K.G. (2007) Consumption and the yield of fi sh and other aquatic animals from the
Lower Mekong Basin. MRC Technical Paper No. 16. Mekong River Commission,
Vientiane. 88 pp.
Hortle, K.G and U. Suntornratana (2008) Fisheries of the lower Songkhram River Basin
northeast Thailand: report on a baseline survey. MRC Technical Paper No. 17. Mekong
River Commission, Vientiane. 85 pp.
IRC (2002) Twentieth Session of the Commission, 23-26 July Bangkok, Thailand. Major
Recommendations. International Rice Commission website. www.fao.org/ag/agp/agpc/
doc/fi eld/commrice/pages/sessions.html#01
Khoa, S.N, Lorenzen, K., Garaway, C., Cahmshing, B., Siebert, D, and M. Randone (2005)
Impacts of irrigation in rain-fed rice-farming landscapes. Journal of Applied Ecology 42:
892 900.
Lieng, S. & N.P. van Zalinge (2001) Fish yield estimation by habitat in the fl oodplains of the
Great Lake, Cambodia. Cambodia Fisheries Technical Paper Series No 3 18 26.
Lim, P., Villavueva, M.C., Chhouk, B., Chay, K.K., Brun, J.M. and J. Moreau (2005) Fish
assessment in the rehabilitated polders of Prey Nup (Cambodia). Asian Fisheries Science;
18; 241 253.
Little, D.C, Surintaraseree, P, and N. Innes-Taylor, (1996) Fish culture in rainfed rice fi elds of
northeast Thailand. Aquaculture 140: 295 321.
Matteson, P.C. (2000) Insect pest management in tropical Asian irrigated rice. Annual Review of
Ecology and Systematics 45: 549 574.
Middendorp, H.A.J. (1992) Contribution of stocked and wild fi sh in ricefi elds to fi sh production
and farmer nutrition in northeast Thailand. Asian Fisheries Science 5: 145 161.
MRCS (1994) Cambodia: Agricultural Development Options Review. Land Cover Mapping
Component (1973/76, 1985/87 and 1992/93). Technical Report Volume 1 and 2. Report to
the Food and Agriculture Organisation of the United Nations. 17 page + annexes
Poulsen, A.F., Hortle, K.G, Valbo-Jorgensen, J, and S. Chan (2004) Distribution and ecology of
some important riverine fi sh species of the Mekong River Basin. MRC Technical Paper
10: 1 116.
Rainboth, W.J. (1996) Fishes of the Cambodian Mekong. FAO, Rome. 265 pages + plates.
Saengrut, T. (1998) Role of Wild fi sh in Aquatic Resource Development in the Lower Chi Valley
of Thailand. MSc Thesis. Asian Institute of Technology. Bangkok, Thailand. 100 pages.
Page 47
Yield and value f the wild fi shery of rice fi elds in Battambang Province, near the Tonle Sap Lake, Cambodia
Sensereivorth, T., Diep, L, and T. Nao (1999) Freshwater capture fi sheries data collection in
1998. pp. 40 53 in van Zalinge, N. P, Nao, T, and Deap, L. (Eds) Present Status of
Cambodia's Freshwater Capture Fisheries and Management Implications. Department
of Fisheries & MRC/Danida Program for Fisheries Management and Development
Cooperation, Phnom Penh, Cambodia.
Shams, N., Tuy, S., and D. Gutierrez (2001) Much More Than Rice: Rice Field Biodiversity and
Food Security in Southeastern Cambodia. Catholic Relief Services (CRS). Phnom Penh,
Cambodia. 18 pages.
Shankar, B., Halls, A., and J. Barr (2004) Rice versus fi sh revisited: on the integrated
management of fl oodplain resources in Bangladesh. Natural Resources Forum 28:
91 101.
So, N., Ouch, V., Hao, V. and M.C. Nandeesha (1998) Women in small-scale aquaculture
development in Cambodia. Aquaculture Asia 3: 20 22.
Troeung, R., Aun, S., Lieng, S., Deap, L. and N. van Zalinge (2003) A comparison of fi sh yields
and species composition between one fi shing lot in Battambang province and two fi shing
lots in Prey Veng Province. MRC Conference Series 4: 9 16.
van Zalinge, N.P., Nao, T., Touch, S.T. and L. Deap (2000) Where There is Water, There is
Fish? Cambodian Fisheries Issues in a Mekong River Basin Perspective. ICLARM
Studies Review 26: 37 48.
Vromant, C., Nam, C.Q., Chau, N.T.H., and F. Ollevier (2004) Survival rate and growth
performance of Cyprinus carpio L. in intensively cultivated rice fi elds. Aquaculture
Research 35: 171 177.
Vromant, N., Rothuis, A.J., Cuc, N.T.T. and F. Ollevier (1998) The effect of fi sh on the
abundance of the rice caseworm Nymphula depunctalis (Guenée) (Lepidoptera:
Pyralidae) in direct-seeded, concurrent rice-fi sh yields. Biocontrol Science and
Technology 8: 539 546.
Way, M.J. and K.L. Heong (1994) The role of biodiversity in the dynamics and management of
insect pests of tropical irrigated rice -- a review. Bulletin of Entomological Research 84:
567 587.
Welcomme, R.L. (1985) River fi sheries. FAO Fisheries Technical Paper 262: 1 330.
Xiao, Q.Y. (1992) Role of fi sh in pest control in rice farming. ICLARM Conference Proceedings
24: 235 243.
Page 48
Appendix 1. Effort, total catches and CPUE for all gears
and sites combined
Sum of fi sher-gear days all sites
Percent
18.8%
14.0%
8.1%
7.1%
8.6%
6.3%
8.8%
2.4%
2.4%
1.0%
2.7%
4.9%
3.3%
2.5%
1.9%
1.6%
1.5%
1.5%
1.1%
0.8%
0.3%
0.3%
0.2%
0.1%
0.1%
0.03%
100.0%
80
64
40
12
16
8
T
otal
4307
3217
1860
1622
1971
1444
2019
544
544
224
610
1
124
756
584
428
356
348
348
244
195
22965
80
32
128
99
80
48
467
Feb 04
24
24
24
24
80
80
8
152
220
132
96
16
880
Jan 04
556
652
168
208
80
216
72
228
428
148
164
1
12
Dec 03
3032
544
884
336
816
732
144
392
80
560
528
132
348
48
16
Nov 03
1025
1228
1052
8865
1
785
240
642
947
712
71
160
152
144
50
40
12
Oct 03
1466
6061
904
684
12
452
Sep 03
2052
912
648
48
Aug 03
1608
fi
eld cylinder trap
mesh)
fi
eld cylinder trap
fi
ne
f
edge-shaped scoop basket
Gear
Single-hook set pole and line
Horizontal rice
Horizontal cylinder trap with bamboo fences
V
ertical rice
Hand-held single hook and line
Gill net
Cast net
Small-handle seine net
Bamboo funnel basket trap
V
ertical bamboo vase trap
Fyke net (
Hole trap
Bamboo tube trap for eels
Horizontal cylinder trap for frogs
Pole and line for catching frogs
Eel clamp
Capture by hand by pumping out canal
Frog gaf
Hand-held scissors push net
T
wo-pronged eel fork
W
Capture by hand in water
Frog trap net
Long-handled circular scoop bag
Big horizontal cylinder trap
Small hand-dragged seine net
e
e
r
ey Chhlonh
ob
u
m
Khmer Name
Santuch Bongkai
Tr
Lop Phsom Pruol
Lop Nhek Sr
Santuch Phlay Muoy
Mong Reay Sr
Samnanh
Anchorng
Chongnoum
To
Lu Sbai Mong
Anlung Ungkoup
Lawn Antong
Lop Kongkaep
Santuch Bobok Kongkaep
Kangva T
Bach Bat Pralay
Kangva Kongkaep
Chheub
Chamr
Chhnieng Chunhchoat
Chap Dai
Kantrup Kongkaep
Thnorng Moul
Lop Rungvel
Uon Hum
T
otal
Page 49
Yield and value of the wild fi shery of rice fi elds in Battambang Province, near the Tonle Sap Lake, Cambodia
Sum of catches (kg) by gear, all sites
Percent
17.5%
14.3%
12.4%
9.2%
5.4%
5.4%
9.8%
1.9%
1.9%
1.1%
3.8%
2.3%
2.9%
3.1%
1.5%
1.1%
0.9%
1.6%
2.0%
0.6%
0.7%
0.1%
0.2%
0.1%
0.1%
0.0%
100.0%
35
49
30
38
7
T
otal
4678
3831
3308
2468
1452
1451
2623
518
509
291
1020
603
770
823
407
300
250
415
529
148
178
26730
72
30
196
1
14
178
27
617
Feb 04
45
7
7
1
1
93
62
89
8
7
219
432
34
Jan 04
1015
771
993
244
87
56
150
121
170
520
160
131
96
Dec 03
3500
30
6
38
2103
427
1958
350
1015
643
1595
203
404
847
482
600
292
314
Nov 03
1
1307
263
351
808
972
158
105
261
173
49
30
Oct 03
1402
1
126
1375
7073
791
465
20
492
Sep 03
1767
382
29
Aug 03
1041
1452
fi
eld cylinder trap
mesh)
fi
eld cylinder trap
fi
ne
f
edge-shaped scoop basket
Gear
Single-hook set pole and line
Horizontal rice
Horizontal cylinder trap with bamboo fences
V
ertical rice
Hand-held single hook and line
Gill net
Cast net
Small-handle seine net
Bamboo funnel basket trap
V
ertical bamboo vase trap
Fyke net (
Hole trap
Bamboo tube trap for eels
Horizontal cylinder trap for frogs
Pole and line for catching frogs
Eel clamp
Capture by hand by pumping out canal
Frog gaf
Hand-held scissors push net
T
wo-pronged eel fork
W
Capture by hand in water
Frog trap net
Long-handled circular scoop bag
Big horizontal cylinder trap
Small hand-dragged seine net
e
e
r
ey Chhlonh
ob
u
m
Khmer Name
Santuch Bongkai
Tr
Lop Phsom Pruol
Lop Nhek Sr
Santuch Phlay Muoy
Mong Reay Sr
Samnanh
Anchorng
Chongnoum
To
Lu Sbai Mong
Anlung Ungkoup
Lawn Antong
Lop Kongkaep
Santuch Bobok Kongkaep
Kangva T
Bach Bat Pralay
Kangva Kongkaep
Chheub
Chamr
Chhnieng Chunhchoat
Chap Dai
Kantrup Kongkaep
Thnorng Moul
Lop Rungvel
Uon Hum
T
otal
Page 50
Appendix
Appendix 2. Total effort, catch and CUPE for all gear
types
Gear
Total fi sher-days
Total catch (kg)
CPUE (kg/fi sher/day)
Small-handle seine net
544
518
0.95
Hole trap
1124
603
0.54
Capture by hand in dried ditch or canal
348
250
0.72
Two-pronged eel fork
195
148
0.76
Capture by hand in water
64
35
0.54
Hand-held scissors push net
244
529
2.17
Wedge-shaped scoop basket
80
178
2.23
Bamboo funnel basket trap
544
509
0.93
Frog gaff
348
415
1.19
Eel clamp
356
300
0.84
Frog trap net
40
49
1.23
Bamboo tube trap for eel
756
770
1.02
Horizontal cylinder trap for frogs
584
823
1.41
Vertical rice fi eld cylinder trap
1622
2468
1.52
Horizontal cylinder trap with bamboo fences
1860
3308
1.78
Big horizontal cylinder trap
16
38
2.38
Fyke net (fi ne mesh)
610
1020
1.67
Gillnet
1444
1451
1.00
Cast net
2019
2623
1.30
Pole and line for catching frogs
428
407
0.95
Single-hook set pole and line
4307
4678
1.09
Hand-held single hook and line
1971
1452
0.74
Long-handled circular scoop bag
12
30
2.50
Vertical bamboo vase trap
224
291
1.30
Horizontal rice fi eld cylinder trap
3217
3831
1.19
Small hand-dragged seine net
8
7
0.86
Total
22,965
26,730
1.16
Page 51
Yield and value of the wild fi shery of rice fi elds in Battambang Province, near the Tonle Sap Lake, Cambodia
Page 52
Appendix 3. List of species of fi sh and taxa of OAAs
recorded, with proportions of total weight in catches
and standing crop estimation, and categorisation by
diet and as black or white/grey fi shes
and
fi
sh
crop
8.7%
0.0%
0.3%
0.3%
36.9%
5.8%
0.5%
4.9%
0.4%
0.0%
1.0%
0.4%
% of all OAAs in standing
in
fi
sh
12.5%
0.0%
0.4%
0.5%
52.9%
8.2%
0.6%
6.9%
0.6%
0.1%
1.4%
0.6%
% of standing crop
and
1%
fi
sh
13.56%
0.00%
0.01%
1.33%
0.03%
0.22%
0.03%
1.06%
21.45%
7.08%
1.77%
1.42%
0.31%
0.1
0.08%
0.09%
0.00%
0.01%
0.74%
0.20%
0.00%
0.00%
0.14%
0.02%
0.48%
% of all OAAs in catches
fi
sh
1%
% of
0.01%
0.01%
1.74%
0.03%
0.29%
0.04%
1.38%
9.24%
2.30%
1.86%
0.40%
0.14%
0.10%
0.1
0.01%
0.01%
0.97%
0.26%
0.00%
0.00%
0.19%
0.03%
0.62%
in catches
17.71%
28.01%
25
65
24
15
30
20
40
7
100
47
120
35
8
25
15
28
8
40
22
40?
12
15
10
Max total Lth (cm) in literature
Dietary category
Omnivorous
Carnivorous
Carnivorous
Omnivorous
Omnivorous
Carnivorous
Carnivorous
Carnivorous
Carnivorous
Omnivorous
Carnivorous
Carnivorous
Carnivorous
Omnivorous
Omnivorous
Carnivorous
Omnivorous
Omnivorous
Carnivorous
Omnivorous
Omnivorous
Omnivorous
Omnivorous
Carnivorous
Omnivorous
Black or
Black
Black
Black
Black
Black
Black
Grey/White
Grey/White
Grey/White
Grey/White
Grey/White
Grey/White
Grey/White
Grey/White
Grey/White
Grey/White
Grey/White
Grey/White
Grey/White
Grey/White
Grey/White
Grey/White
Grey/White
Grey/White
Grey/White
Grey/White
oueng
oem kdah
Khmer name
Kranh srai
Chhlang
Kanchos kdaung
Kanchos chhnoht
Kanchos
Kanchos
Phtoung
Kr
Raws
Andaing r
Andaing toun
Andaing toun
Bawndol ampou kontoi
khmao
Changwa
Srawka kdam och
Srawka kdam
Srawka kdam khmao
Khnawng veng
Changwa phlieng
Chhpin kbal touch
Ach kok
Chrakaing kontoi veng
Angkat prak
Changwa chhnot
Changwa
fi
sh
fi
sh
fi
sh
fi
sh
fi
sh
fi
sh
fi
sh
barb
fi
sh
fi
sh
fl
ying
f's mystus cat
olf
alking cat
English name
Climbing perch
White-whiskered river cat
Bocourt's cat
Silver mystus cat
Grey mystus cat
W
Freshwater gar
T
alking gourami
Chevron snakehead
W
Broad-headed walking cat
Blackskin walking cat
River sprat
Beardless barb
Lagler's silver barb
River barb
Cuvier's barb
Mekong
Lagler's barb
Black spot barb
Slender rasbora
Myer's rasbora
fi
*
.
sp
ocephalus
. cf. wolf
. cf. cuvieri*
evis
sp
sp
obagrus bocourti
ossocheilus
Species
Anabas testudineus
Hemibagrus nemurus
Heter
Mystus atrifasciatus
Mystus singaringan
Mystus
Xenentodon cancila
T
richopsis vittata
Channa striata
Clarias batrachus
Clarias macr
Clarias meladerma
Clupeoides borneensis
Cr
Cyclocheilichthys apogon
Cyclocheilichthys lagleri
Cyclocheilichthys
r
epasson
Dangila
Esomus longimanus
Hypsibarbus lagleri
Labiobarbus siamensis
Puntioplites falcifer
Puntius br
Rasbora daniconius
Rasbora myersi
Family
Anabantidae
Bagridae
Bagridae
Bagridae
Bagridae
Bagridae
Belonidae
Belontiidae
Channidae
Clariidae
Clariidae
Clariidae
Clupeidae
Cyprinidae
Cyprinidae
Cyprinidae
Cyprinidae
Cyprinidae
Cyprinidae
Cyprinidae
Cyprinidae
Cyprinidae
Cyprinidae
Cyprinidae
Cyprinidae
Page 53
Yield and value of the wild fi shery of rice fi elds in Battambang Province, near the Tonle Sap Lake, Cambodia
and
and
fi
sh
sh
fi
crop
0.1%
0.0%
4.2%
0.2%
3.2%
2.5%
0.4%
69.8%
crop
15.5%
0.8%
2.3%
7.2%
3.6%
0.7%
30.2%
100.0%
% of all OAAs in standing
% of all OAAs in standing
in
fi
sh
0.2%
0.0%
6.1%
0.3%
4.6%
3.5%
0.6%
100.0%
22.2%
1.2%
3.4%
10.4%
5.1%
1.0%
43.3%
143.3%
% of standing crop
% of OAAs in standing crop
and
and
fi
sh
0.10%
1.62%
13.75%
0.30%
0.60%
4.84%
0.08%
0.01%
4.72%
0.41%
76.58%
fi
sh
8.31%
6.93%
5.27%
1.67%
0.68%
0.56%
23.42%
100.00%
% of all OAAs in catches
% of all OAAs in catches
fi
sh
% of
% of
0.13%
2.12%
0.39%
0.79%
6.32%
0.10%
0.01%
6.17%
0.54%
7.15%
2.91%
2.39%
in catches
17.95%
100.00%
OAAs in catches
35.49%
29.58%
22.49%
100.00%
100.00%
7
17
30
20
13
15
24
45
100
100
Max total Lth (cm) in literature
Dietary category
ature include some standard lengths that were converted to total lengths by multiplying by 1.15.
Dietary category
Carnivorous
Carnivorous
Carnivorous
Omnivorous
Carnivorous
Carnivorous
Carnivorous
Carnivorous
Omnivorous
Carnivorous
Omnivorous
Omnivorous
Carnivorous
Herbivorous
Herbivorous
Carnivorous
Black or
Black
Black
Black
Black
Black
Black
Grey/White
Grey/White
Grey/White
Grey/White
Grey/White
.
Khmer name
Changwa
Changwa mool
Chhlonh chhnoht
Kantrawb
Kawmphleanh phluk
Kawmphleanh sor
Kamplieu
T
a aun
Antung
Antung
Khmer name
fi
sh
fi
sh
fi
sh
English name
Redstripe rasbora
Y
ellowtail rasbora
Peacock eel
Malayan leaf
Moonlight gourami
Three spot gourami
White sheat
Butter cat
Swamp eel
Onegilled eel
English name
Crabs
Shrimps
Frogs
Big water snails
Small water snails
Snakes
fi
cation as black or grey/white and for dietary category
spp.
olepis
spp.
ognathus siamensis
obrachium
Species
Rasbora pauciperforata
Rasbora tornieri
Macr
Pristolepis fasciata
T
richogaster micr
T
richogaster trichopterus
Kryptopterus hexapterus
Ompok bimaculatus
Monopterus albus
Ophisternon bengalense
Species
Sommaniathelphusa
Macr
FISH
Fish names and most details follow Froese and Pauly (2007), except * after Rainboth (1996). Maximum recorded lengths in liter
OAAs
FISH and OAAs
AL
AL
AL
Family
Cyprinidae
Cyprinidae
Mastacembelidae
Nandidae
Osphronemidae
Osphronemidae
Siluridae
Siluridae
Synbranchidae
Synbranchidae
T
OT
Notes:
MRC (2003) and other sources also used for classi
Family
Parathelphusidae
Palaeomonidae
T
OT
T
OT
Page 54
Appendix 4. Total catch of each species by each type of
gear
Cat No.
1
1
2
2
3
3
3
Category
Capture by hand
Scoop nets
Wounding gear
Gear
Capture by
Capture by
Long-
Wedge-
Eel clamp
Frog gaff
Two-
hand
hand by
handled
shaped
pronged eel
pumping out
circular
scoop basket
fork
canal
scoop bag
Channa striata
9.0
98.5
2.0
Macrognathus siamensis
1.0
13.6
300.3
Anabas testudineus
20.8
40.1
3.0
49.0
Clarias batrachus
22.3
Trichogaster trichopterus
3.6
3.0
50.2
Monopterus albus
148.3
Clarias macrocephalus
Rasbora tornieri
1.0
5.2
4.9
Clarias meladerma
Mystus atrifasciatus
2.5
Trichopsis vittata
22.0
8.1
Esomus longimanus
Trichogaster microlepis
0.3
Rasbora myersi
0.5
4.0
Ophisternon bengalense
Clupeoides borneensis
Pristolepis fasciata
0.6
Mystus sp. cf. wolffi
0.7
Hypsibarbus lagleri
0.4
Puntius brevis
1.6
0.2
Crossocheilus sp.
Rasbora pauciperforata
Cyclocheilichthys lagleri
0.2
2.4
16.1
Cyclocheilichthys apogon
Kryptopterus hexapterus
2.0
Xenentodon cancila
1.0
Mystus singaringan
Rasbora daniconius
Dangila sp. cf. cuvieri
0.0
Heterobagrus bocourti
Ompok bimaculatus
Cyclocheilichthys repasson
Mystus nemurus
Dangila spilopleura
Puntioplites falcifer
Fish Total
32.6
198.6
30.0
128.5
300.3
148.3
Crab
1.0
26.6
42.6
28.8
Shrimp
3.0
1.7
Frog
1.0
2.0
385.8
Big water snail
14.2
3.1
Small water snail
1.6
2.3
Snake
4.3
OAA Total
2.0
51.6
49.8
414.6
TOTAL
34.6
250.3
30.0
178.2
300.3
414.6
148.3
Page 55
Yield and value of the wild fi shery of rice fi elds in Battambang Province, near the Tonle Sap Lake, Cambodia
Cat No.
4
4
4
5
5
5
5
Category
Hook & line
Traps
Gear
Hand-held Pole and line Single-hook
Bamboo
Bamboo
Big
Hole trap
hook and
for catching set pole and
funnel
tube trap for horizontal
line
frogs
line
basket trap
eel
cylinder trap
Channa striata
85.0
2781.7
12.0
258.0
Macrognathus siamensis
425.4
Anabas testudineus
860.3
594.1
60.0
4.0
105.4
Clarias batrachus
676.9
4.0
139.0
Trichogaster trichopterus
60.0
Monopterus albus
14.1
741.2
Clarias macrocephalus
311.2
43.0
38.0
Rasbora tornieri
128.4
Clarias meladerma
7.0
231.9
3.0
27.0
Mystus atrifasciatus
45.1
19.3
Trichopsis vittata
76.2
Esomus longimanus
Trichogaster microlepis
Rasbora myersi
31.0
Ophisternon bengalense
46.8
29.1
Clupeoides borneensis
Pristolepis fasciata
Mystus sp. cf. wolffi
22.0
0.5
Hypsibarbus lagleri
Puntius brevis
Crossocheilus sp.
Rasbora pauciperforata
Cyclocheilichthys lagleri
Cyclocheilichthys apogon
Kryptopterus hexapterus
Xenentodon cancila
7.0
Mystus singaringan
Rasbora daniconius
Dangila sp. cf. cuvieri
Heterobagrus bocourti
Ompok bimaculatus
1.3
Cyclocheilichthys repasson
Mystus nemurus
Dangila spilopleura
Puntioplites falcifer
Fish Total
1451.8
4677.8
367.6
770.3
23.0
598.4
Crab
11.0
5.0
Shrimp
140.9
Frog
407.0
Big water snail
4.0
Small water snail
Snake
OAA Total
407.0
140.9
15.0
5.0
TOTAL
1451.8
407.0
4677.8
508.6
770.3
38.0
603.4
Page 56
Appendix
Cat No.
5
5
5
5
5
6
Category
Traps
Gill nets
Gear
Horizontal
Horizontal
Horizontal
Vertical
Vertical rice
Gill net
cylinder for
rice fi eld
cylinder trap bamboo vase fi eld cylinder
frogs
cylinder trap with bamboo
trap
trap
fences
Channa striata
666.1
823.5
47.0
320.4
310.4
Macrognathus siamensis
231.5
701.1
36.0
214.8
147.6
Anabas testudineus
348.8
334.3
97.0
344.5
354.5
Clarias batrachus
282.0
193.0
254.2
258.6
Trichogaster trichopterus
219.1
75.9
72.0
171.4
133.9
Monopterus albus
199.8
141.5
4.4
Clarias macrocephalus
9.6
42.0
28.0
Rasbora tornieri
8.5
11.9
Clarias meladerma
10.6
51.0
12.0
11.0
Mystus atrifasciatus
100.8
54.0
7.8
Trichopsis vittata
20.1
2.2
9.8
Esomus longimanus
128.9
11.3
22.7
Trichogaster microlepis
39.2
7.2
28.4
70.0
Rasbora myersi
63.0
26.0
Ophisternon bengalense
33.7
0.7
Clupeoides borneensis
Pristolepis fasciata
6.8
57.0
Mystus sp. cf. wolffi
0.4
Hypsibarbus lagleri
1.0
11.3
26.3
Puntius brevis
35.1
1.1
Crossocheilus sp.
29.4
Rasbora pauciperforata
4.4
22.7
Cyclocheilichthys lagleri
1.9
1.3
Cyclocheilichthys apogon
18.1
2.0
Kryptopterus hexapterus
1.0
6.1
5.9
2.0
Xenentodon cancila
Mystus singaringan
1.2
5.5
Rasbora daniconius
3.6
Dangila sp. cf. cuvieri
0.5
0.6
Heterobagrus bocourti
Ompok bimaculatus
Cyclocheilichthys repasson
1.3
Mystus nemurus
Dangila spilopleura
Puntioplites falcifer
Fish Total
2403.0
2592.5
252.0
1468.8
1323.7
Crab
887.2
453.8
4.0
613.2
103.0
Shrimp
207.1
20.0
22.0
134.7
Frog
823.0
84.3
6.0
12.0
80.6
Big water snail
183.1
139.0
1.0
67.2
Small water snail
61.8
59.3
24.0
Snake
4.0
37.1
80.0
24.0
OAA Total
823.0
1427.6
715.2
39.0
999.6
127.0
TOTAL
823.0
3830.5
3307.7
291.0
2468.4
1450.7
Page 57
Yield and value of the wild fi shery of rice fi elds in Battambang Province, near the Tonle Sap Lake, Cambodia
Cat No.
7
7
9
11
11
12
Total
Category
Seine nets
Covering nets
Bagnets
Gear
Gill net
Small hand- Small-handle Hand-held
Cast net
Frog trap net
dragged
seine net
scissors push
seine net
net
Channa striata
310.4
4.0
5.0
1.0
287.5
23.0
5734.0
Macrognathus siamensis
147.6
1.0
1.0
1598.7
2.0
3674.1
Anabas testudineus
354.5
0.3
2.9
6.0
281.5
119.0
3625.3
Clarias batrachus
258.6
61.9
1891.8
Trichogaster trichopterus
133.9
0.3
80.9
132.0
196.4
94.0
1292.6
Monopterus albus
13.6
1262.8
Clarias macrocephalus
28.0
471.8
Rasbora tornieri
29.0
136.4
108.0
433.4
Clarias meladerma
11.0
1.7
25.0
380.1
Mystus atrifasciatus
7.8
5.3
121.9
356.8
Trichopsis vittata
76.7
67.5
282.6
Esomus longimanus
1.2
34.2
198.4
Trichogaster microlepis
70.0
1.2
2.9
11.6
160.8
Rasbora myersi
3.4
127.9
Ophisternon bengalense
110.3
Clupeoides borneensis
82.8
82.8
Pristolepis fasciata
0.3
0.1
16.0
80.8
Mystus sp. cf. wolffi
22.0
0.4
13.1
59.1
Hypsibarbus lagleri
0.3
13.9
53.2
Puntius brevis
37.9
Crossocheilus sp.
29.4
Rasbora pauciperforata
27.1
Cyclocheilichthys lagleri
1.3
23.2
Cyclocheilichthys apogon
0.8
0.5
21.4
Kryptopterus hexapterus
2.0
4.0
21.0
Xenentodon cancila
1.0
9.0
Mystus singaringan
0.1
6.7
Rasbora daniconius
1.8
5.4
Dangila sp. cf. cuvieri
1.4
2.5
Heterobagrus bocourti
1.3
1.3
Ompok bimaculatus
1.3
Cyclocheilichthys repasson
1.3
Mystus nemurus
1.3
1.3
Dangila spilopleura
0.8
0.8
Puntioplites falcifer
0.6
0.6
Fish Total
1323.7
6.9
216.8
299.0
2611.9
567.1
20468.9
Crab
103.0
14.0
2.0
30.0
2222.1
Shrimp
286.0
229.6
363.0
1408.1
Frog
1.2
1851.8
Big water snail
3.0
33.0
447.6
Small water snail
6.0
27.0
182.0
Snake
24.0
149.4
OAA Total
127.0
301.2
229.6
11.0
453.0
6261.1
TOTAL
1450.7
6.9
518.0
528.6
2622.9
1020.1
26730.0
Page 58
Appendix 5. Taxa recorded in this study with total catch
quantities and value
32
36
48
8
43
36
48
46
36
6
16
3
1
4
7
1
5
24
1
1
9
4
1
40
25
22
5
7
1
7
10
No. of site-
month values
1
Max.
$0.1
$0.07
$0.08
$0.49
$0.80
$1.17
$0.89
$1.37
$1.58
$1.29
$1.41
$0.35
$0.12
$0.39
$0.48
$0.08
$0.49
$0.42
$0.19
$0.38
$0.63
$0.46
$0.31
$1.41
$1.50
$0.48
$0.76
$0.97
$0.57
$1.50
$1.21
eighted
Mean
$0.05
$0.06
$0.07
$0.43
$0.48
$0.87
$0.61
$1.23
$1.33
$1.24
$0.87
$0.35
$0.12
$0.26
$0.23
$0.08
$0.29
$0.36
$0.19
$0.38
$0.59
$0.45
$0.31
$1.23
$1.23
$0.41
$0.74
$0.34
$0.57
$1.36
$0.26
W
Price (US$/kg)
Min.
$0.03
$0.04
$0.05
$0.27
$0.24
$0.55
$0.37
$0.84
$1.15
$1.05
$0.78
$0.35
$0.12
$0.06
$0.08
$0.08
$0.07
$0.26
$0.19
$0.38
$0.37
$0.39
$0.31
$0.96
$0.58
$0.36
$0.65
$0.09
$0.57
$1.25
$0.25
1
1
US$
$9.50
$27.78
$3.47
$5.58
$5.33
$0.1
$0.75
$0.26
$0.51
$9.39
$0.26
$4.96
$0.76
$154.47
$63.82
$675.74
$28.89
$71.26
$31.43
$20.19
$20.95
$1617.38
$2206.49
$7031.92
$2514.1
$585.87
$332.47
$4516.05
$1550.99
$144.92
$150.43
V
alue
T
otal
13
433
2996
1028
2021
1026
3032
Riel
38017
1
1
1,1
617,873
255,276
1
15,573
13,880
22,305
21,321
285,037
125,728
37,545
579,675
19,844
80,744
601,705
83,793
2,702,968
6,469,512
8,825,956
28,127,666
10,056,433
2,343,495
1,329,871
18,064,194
6,203,947
83
29
21
23
1
3
1
1
53
21
1
7
59
1
81
eight
182
448
2222
149
1408
1852
3625
5734
1892
472
380
198
3674
1263
357
1
10
(kg)
T
otal W
epasson
fi
.
sp
ocephalus
.cuvieri
. wolf
.
cf
sp
.
cf
sp
obagrus bocourti
ognathus siamensis
ossocheilus
T
axon
Small water snail
Big water snail
Crab
Snake
Shrimp
Frog
Anabas testudineus
Channa striata
Clarias batrachus
Clarias macr
Clarias meladerma
Clupeoides borneensis
Cr
Cyclocheilichthys apogon
Cyclocheilichthys lagleri
Cyclocheilichthys r
Dangila
Esomus longimanus
Hemibagrus nemurus
Heter
Hypsibarbus lagleri
Kryptopterus hexapterus
Labiobarbus siamensis
Macr
Monopterus albus
Mystus atrifasciatus
Mystus singaringan
Mystus
Ompok bimaculatus
Ophisternon bengalense
Pristolepis fasciata
Dietary
category
Herbivorous
Herbivorous
Omnivorous
Carnivorous
Omnivorous
Carnivorous
Omnivorous
Carnivorous
Omnivorous
Carnivorous
Carnivorous
Carnivorous
Omnivorous
Omnivorous
Carnivorous
Omnivorous
Omnivorous
Carnivorous
Carnivorous
Carnivorous
Omnivorous
Carnivorous
Omnivorous
Carnivorous
Omnivorous
Omnivorous
Omnivorous
Carnivorous
Carnivorous
Carnivorous
Omnivorous
Black or
Grey/White
Black
Black
Black
Black
Black
Grey/White
Grey/White
Grey/White
Grey/White
Grey/White
Grey/White
Grey/White
Grey/White
Grey/White
Grey/White
Grey/White
Grey/White
Black
Black
Grey/White
Grey/White
Grey/White
Grey/White
Black
Black
Page 59
Yield and value of the wild fi shery of rice fi elds in Battambang Province, near the Tonle Sap Lake, Cambodia
1
5
1
6
6
18
13
40
22
2
647
No. of site-
month values
Max.
$0.42
$0.35
$0.29
$0.74
$0.40
$0.40
$0.62
$0.70
$0.42
$0.79
$1.58
eighted
Mean
$0.42
$0.25
$0.28
$0.72
$0.38
$0.35
$0.32
$0.55
$0.32
$0.65
$0.86
W
Price (US$/kg)
1
Min.
$0.42
$0.08
$0.28
$0.06
$0.08
$0.28
$0.1
$0.35
$0.16
$0.16
$0.03
US$
$0.26
$9.42
$1.52
$92.35
$10.41
$5.87
$149.53
$51.51
$716.48
$89.36
V
alue
$22,912.71
T
otal
10
1026
Riel
37,699
41,644
23492
6,082.39
369,403
598,1
206,053
357,423
2,865,914
91,650,857
1
38
5
27
9
eight
128
433
161
1293
283
(kg)
T
otal W
olepis
evis
26,730
AL
T
axon
Puntioplites falcifer
Puntius br
Rasbora daniconius
Rasbora myersi
Rasbora pauciperforata
Rasbora tornieri
T
richogaster micr
T
richogaster trichopterus
T
richopsis vittata
Xenentodon cancila
T
OT
Dietary
category
Omnivorous
Omnivorous
Carnivorous
Omnivorous
Carnivorous
Carnivorous
Carnivorous
Carnivorous
Carnivorous
Carnivorous
Black or
Grey/White
Grey/White
Grey/White
Grey/White
Grey/White
Grey/White
Grey/White
Black
Black
Black
Grey/White
Page 60
Appendix 6. Length frequency distributions for the fi ve
most abundant species of fi shes
Data includes the catches at those sites at which the most measurements were made for each of
the species.
Channa striata
Site 1
Week
Total Length (cm)
Total
15
16
17
18
19
20
21
22
23
24
25
26
27
28
42
4
7
16
5
1
1
1
2
37
46
1
12
21
32
2
5
6
2
1
1
1
84
50
2
6
21
16
18
17
12
14
9
7
6
128
51
3
11
17
11
17
23
10
8
17
18
5
4
6
1
151
53
6
9
16
9
7
3
50
Total
3
22
47
70
84
49
37
31
31
33
14
13
12
4
450
Clarias batrachus
Site 7
Week
Total Length (cm)
Total
10
12
13
14
15
16
17
18
19
20
21
23
36
1
1
2
1
1
1
7
41
1
6
1
5
3
4
20
42
1
5
9
16
4
35
44
2
3
7
11
9
7
39
45
1
2
11
7
5
8
4
1
39
47
5
5
6
2
1
2
1
22
48
1
2
2
1
6
49
5
10
2
3
1
21
51
1
3
1
1
1
7
52
3
7
1
11
53
1
3
1
5
54
2
3
2
7
Total
1
2
1
18
39
38
37
45
22
14
1
1
219
Macrognathus siamensis
Site 8
Week
Total Length (cm)
Total
12
13
14
15
16
17
18
19
20
21
39
2
2
1
5
41
1
2
3
6
43
2
2
1
2
3
2
1
13
45
4
22
27
33
35
13
5
2
4
145
47
9
28
52
89
52
24
32
56
55
3
4
21
2
30
56
4
3
7
58
6
11
6
2
3
1
29
Total
12
72
92
92
40
39
16
8
4
5
380
Page 61
Yield and value of the wild fi shery of rice fi elds in Battambang Province, near the Tonle Sap Lake, Cambodia
Trichogaster trichopterus
Site 5
Week
Total Length (cm)
Total
6
7
8
9
10
11
39
25
31
43
35
134
41
10
80
111
85
18
6
310
42
31
37
26
94
45
11
35
19
10
75
47
4
6
2
1
13
48
7
12
2
21
51
2
3
1
6
53
2
6
3
11
55
3
2
5
Total
81
206
223
134
19
6
669
Anabas testudineus
Site 7
Week
Total Length (cm)
Total
5
6
7
8
9
10
11
12
13
14
36
5
9
2
10
11
5
42
41
4
22
21
15
11
1
74
42
42
47
36
24
16
6
171
44
7
16
16
13
12
4
3
1
72
45
6
6
42
31
22
8
115
47
22
26
11
1
60
48
2
4
2
1
9
49
4
11
10
3
28
51
5
7
2
14
52
4
6
10
53
3
9
6
7
4
29
54
9
5
14
55
2
3
5
57
2
5
3
10
Total
6
60
155
190
122
70
29
14
5
2
653
Page 62
Other papers in the MRC Technical Paper series:
MRC Technical Paper No.1
Status of the Mekong Pangasianodon hypophthalmus resources
with special reference to the stock shared between Cambodia and Viet Nam.
MRC Technical Paper No.2
Status of Pangasiid aquaculture in Viet Nam.
MRC Technical Paper No. 3
Mekong giant fish species: on their biology and management.
MRC Technical Paper No. 4
Deep pools as dry season fish habitats in the Mekong Basin.
MRC Technical Paper No. 5
Financial analysis and risk assessment of selected aquaculture
and fishery activities in the Mekong Basin.
MRC Technical Paper No. 6
Fisheries in the Lower Mekong Basin: status and perspectives.
MRC Technical Paper No. 7
Freshwater aquaculture in the Lower Mekong Basin.
MRC Technical Paper No. 8
Fish migrations of the Lower Mekong Basin: implications for
development, planning and environmental management.
MRC Technical Paper No. 9
The impacts of introductions and stocking of exotic species in
the Mekong Basin and polices for their control.
MRC Technical Paper No. 10 Distribution and ecology of some important riverine fish
species of the Mekong River Basin.
MRC Technical Paper No. 11 Hydro-acoustic survey of deep pools in the Mekong River of
southern Lao PDR and northern Cambodia.
MRC Technical Paper No. 12 Tagging Fish - a case study from the Tonle Sap, Cambodia.
MRC Technical Paper No. 13 Biomonitoring of the lower Mekong River and selected
tributaries.
MRC Technical Paper No. 14 Fish Migration Triggers in the Mekong River and other
freshwater tropical systems.
MRC Technical Paper No. 15 Diagnostic study of water quality in the Lower Mekong Basin.
MRC Technical Paper No. 16 Fish Consumption and the Yield of Fish and Other Aquatic
Animals from the Lower Mekong River Basin.
MRC Technical Paper No. 17 Socio-economics of the fisheries of the lower Songkhram
River Baisn, northeast Thailand.
Mekong River Commission
P.O.Box 6101,Vientiane 01000,
Lao PDR.Telephone: (856) 21 263 263 Facsimile: (856) 21 263 264
E-mail: mrcs@mrcmekong.org
Website: www.mrcmekong.org
Document Outline
- Summary
- 1. Introduction
- 2. Methods
- 2.1 Study area
- 2.2 General features of the fishery
- 2.3 Study sites
- 2.4 Rainfall
- 2.5 Inundation of rice fields and rice growing
- 2.6 Catch assessment
- 2.7 Standing crop
- 2.8 Socio-economic information on fishers
- 2.9 Statistics
- 3. Results
- 3.1 General socioeconomic observations
- 3.2 Fishing gears, effort and total catch
- 3.3 Yield and composition of the catch
- 3.4 Composition and catch by gear
- 3.5 Value of the catch
- 3.6 Disposal of the catch
- 3.7 Comparison between sites
- 3.8 Relationship to habitat variables
- 3.9 Standing Crop
- 3.10 Catches as a proportion of standing crop
- 3.11 Length-frequency data
- 4. Discussion
- 4.1 Comparison with rice-field fisheries elsewhere
- 4.2 Significance to livelihoods and food security
- 4.3 Implications for fishery yield estimates
- 4.4 Integration of fisheries and agriculture
- 5. References
- Appendix 1. Effort, total catches and CPUE for all gearsand sites combined
- Appendix 2. Total effort, catch and CUPE for all geartypes
- Appendix 3. List of species of fi sh and taxa of OAAsrecorded, with proportions of total weight in catchesand standing crop estimation, and categorisation bydiet and as black or white/grey fi shes
- Appendix 4. Total catch of each species by each type ofgear
- Appendix 5. Taxa recorded in this study with total catchquantities and value
- Appendix 6. Length frequency distributions for the fi vemost abundant species of fi shes