

Mekong River Commission
Annual Mekong Flood
Report 2008
September 2009
ISBN : 1728 3248
Mekong River Commission
Annual Mekong Flood Report 2008
September 2009
Published in Vientiane in September 2009 by the Mekong River Commission
Cite this document as:
MRC (2009) Annual Mekong Flood Report 2008, Mekong River Commission, Vientiane. 84 pp.
The opinions and interpretation expressed within are those of the authors and do not necessarily
reflect the views of the Mekong River Commission.
Editor: T.J. Burnhill
Graphic design: T.J. Burnhill
Contributing author: P.T. Adamson
© Mekong River Commission
184 Fa Ngoum Road, Unit 18, Ban Sithane Neua, Sikhottabong District,
Vientiane 01000, Lao PDR
Telephone: (856 21) 263 263 Facsimile: (856 21) 263 264
E-mail: mrcs@mrcmekong.org
Website: www.mrcmekong.org
ii
Table of contents
Acknowledgements ...................................................................................................................... xi
Summary .................................................................................................................................... xiii
1. Introduction ...............................................................................................................................1
2. Flood benefits ............................................................................................................................3
2.1 Introduction and historical context ..................................................................................3
2.2 Flood benefits -- agriculture ............................................................................................6
2.3 Flood benefits -- the Mekong fishery ............................................................................11
2.4 Flood benefits the creation and maintenance of natural wetlands ...............................14
3. Flood costs ..............................................................................................................................21
3.1 Introduction ....................................................................................................................21
3.2 Flood damage assessment in the Lower Mekong region ...............................................22
3.3 The regional history and pattern of flood damage .........................................................26
3.4 The composition of flood losses ....................................................................................32
4. Comparing the costs and benefits of the annual flood ............................................................35
4.1 General observations......................................................................................................35
4.2 Incremental figures ........................................................................................................36
5. The 2008 flood season.............................................................................................................37
5.1 General observations......................................................................................................37
5.2 Meteorological conditions .............................................................................................39
5.3 Temporal aspects of the 2008 Mekong flood season .....................................................43
5.4 Water levels ....................................................................................................................44
5.5 Flood discharges and flood volumes ..............................................................................46
5.6 Aspects of probability and risk ......................................................................................49
5.7 Conditions on the Cambodian floodplain and in the Delta ............................................51
6. Summary of the 2008 country reports ....................................................................................53
6.1 Cambodia .......................................................................................................................53
6.2 Lao PDR ........................................................................................................................55
6.3 Thailand .........................................................................................................................59
6.4 Viet Nam ........................................................................................................................63
7. Summary conclusions and recommendations .........................................................................67
7.1 Summary conclusions. ...................................................................................................67
7.2 Recommendations. .........................................................................................................67
iii
8. References ...............................................................................................................................69
Appendix 1. Mekong mainstream: summary hydrological statistics for the 2008 food season ..73
Appendix 2. Cambodia. 2008 flood damages compared to those of recent years .......................74
Appendix 3. Lao PDR: August 2008 flood damages ...................................................................75
Appendix 4. Thailand: 2008 flood damages compared to those of recent years .........................76
Appendix 5. Viet Nam: 2008 flood damages compared to those of recent years ........................77
Appendix 6. Photograph archive of the September 1966 flood in Vientiane ...............................78
iv
Table of figures
Figure 2.1 The distribution of flood recession rice cultivation areas and pre-Khmer
archaeological sites in Cambodia. ...................................................................4
Figure 2.2 This bas relief at Angkor Wat is indicative of the importance of fish in the
socioeconomics and culture of the Khmer Empire (800 1300 AD) ..............4
Figure 2.3 The value of agricultural production in the Mekong Delta (1995 2004)
in Viet Nam. ....................................................................................................8
Figure 2.4 Flood recession rice cultivation on the Cambodian floodplain. ......................9
Figure 2.5 An example of the `Tham Nop' flood diversion system from
North East Thailand. .....................................................................................10
Figure 2.6 The dai, or bagnet fishery, on the Tonle Sap, Cambodia. ..............................13
Figure 2.7 Estimates of fish biomass arriving at the dai fishery and the annual flood
index proposed by Halls et al. (2008). ..........................................................13
Figure 2.8 Mekong wetlands at Sipandone, Lao PDR. ...................................................14
Figure 2.9 Distribution of `wetlands' in the Lower Mekong Basin ...............................16
Figure 3.1 Flooded rice fields near Pakse, September 2008. ..........................................22
Figure 3.2 Growth in agricultural losses in the Mekong delta in Viet Nam as a
function of flood frequency ...........................................................................24
Figure 3.3 Sectoral flood damage curves for the Mekong Delta ....................................25
Figure 3.4 Frequency distribution of annual flood damage in the Mekong Delta .........26
Figure 3.5 Lao PDR, annual flood damage 1966 2008. .................................................27
Figure 3.6 Thai Mekong region, annual flood damage 1989 2008 ...............................27
Figure 3.7 Cambodia, annual flood damage 1996 2008 ...............................................28
Figure 3.8 Mekong Delta, Viet Nam, annual flood damage 1995 2008. ......................28
Figure 3.9 Indicative distribution of average annual regional flood costs
of US$76 million. ..........................................................................................29
v
Figure 3.10 Mekong floods in 2000 and 2008 proportional and total damage. ..............30
Figure 3.11 Scatter plot of the `relationship' between annual maximum discharge on
the Mekong at Vientiane and the reported annual flood damage in
Lao PDR over the years from 1990 to 2008. .................................................31
Figure 3.12 Urban flooding Vientiane, Lao PDR, August 2008. ....................................31
Figure 3.13 Total annual flood damage (1996 2008) in Cambodia and the delta in
Viet Nam in relation to the peak and volume of the annual flood
hydrograph recorded at Kratie. ......................................................................32
Figure 3.14 Proportion (%) of total flood damage by sector during 2000. .......................33
Figure 3.15 Primary and secondary flood losses as a proportion of total damage for
business enterprises. ......................................................................................34
Figure 5.1 The `historical geography' of the annual flood on the Mekong mainstream
(1960 2008) between Chaing Saen and Kratie. ...........................................38
Figure 5.2 Cumulative annual rainfall during 2008 at selected sites in the
Lower Mekong Basin ....................................................................................41
Figure 5.3 Track of tropical storm Kammuri first week of August, 2008. ..................42
Figure 5.4 Accumulated rainfall over the Mekong Region: 6th to 14th August 2008. ..42
Figure 5.5 Regional soil moisture conditions during early August 2008. ......................43
Figure 5.6 The extent of flooding across Vientiane on the 1st September 1966. ...........45
Figure 5.7 August 2008 water levels on the Mekong mainstream between Chiang
Saen and Nakhon Phanom compared to flood alarm levels. .........................45
Figure 5.8 Mekong at Chiang Saen, Luang Prabang and Vientiane comparative
1966 and 2008 daily discharge hydrographs. ................................................46
Figure 5.9 The 2008 daily discharge hydrograph at selected sites on the Mekong
mainstream, compared to the long term average. ..........................................47
Figure 5.10 Scatter plots of the joint distribution of the annual maximum flood
discharge (cumecs) and the volume of the annual flood hydrograph (km3)
at selected sites on the Mekong mainstream. ...............................................48
vi
Figure 5.11 Bivariate probabilities of the joint distribution of flood peak and volume
at selected mainstream sites.. ........................................................................50
Figure 5.12 Mean daily water levels in Cambodia and the Mekong Delta for 2008
compared to their long term daily average. ...................................................51
Figure 6.1 Cambodian flood situation in 2000, the most extreme conditions of
recent decades. .............................................................................................54
Figure 6.2 Lao PDR provinces affected by flooding and local storms during 2008. ....56
Figure 6.3 Central and southern Lao PDR annual maximum 1, 2, 3, 5, and 10 day
rainfalls observed at 29 sites with a combined total of 680 station-years
of data. ...........................................................................................................57
Figure 6.4 Flooding in the Vang Vieng district of Vientiane province after the storms
of mid July, with maximum observed rainfalls of more than 300 mm
over two days. ...............................................................................................57
Figure 6.5 Flooding in Luang Prabang Province as a consequence of the passage of
tropical storm Kammuri in early August. ......................................................58
Figure 6.6 Flooding in Nakhon Phanom Province in mid August. .................................60
Figure 6.7 Khon Kaen: The sample distribution of September rainfall over the
55 years from 1950 to 2004 compared to the reported 2008 monthly
figure of 1,990 mm. .......................................................................................61
Figure 6.8 Flooding in Khon Kaen Province as a result of unprecedented September
rainfall. ..........................................................................................................62
Figure 6.9 Emergency medical provision Lop Buri Province. September 2008. .........63
Figure 6.10 A component of the flash flood and landslide monitoring network. .............63
Figure 6.11 Typical flash flood conditions in the Central Highlands, indicating high
flow velocities and considerable erosive power ............................................65
Figure 6.12 Structural flood mitigation measures implemented in the delta schools
and houses raised on piles. ............................................................................66
vii
List of tables
Table 2.1 Cambodia comparative seasonal rice yields. ...........................................................5
Table 2.2 Summary value of regional agricultural output which benefits directly from the
annual Mekong flood. ..............................................................................................11
Table 2.3 Estimated value of fish production in the Lower Mekong Basin. ...........................12
Table 2.4 Estimated value of other aquatic animals in the Lower Mekong Basin. .................12
Table 2.5 Functions and services provided by natural wetlands. ............................................15
Table 2.6 Summary of the annual value of wetland economic benefits from the
That Luang marsh, Vientiane municipality. ............................................................17
Table 2.7 Estimated wetland and floodplain areas in the Lower Mekong Basin (LMB)
contiguous with the Mekong drainage system. .......................................................19
Table 2.8 Estimated minimum and maximum value of the services provided by the flood
plain/wetland area in the Lower Mekong Basin. .....................................................19
Table 3.1 Average annual flood damage occurring within the Mekong region as a
proportion of national GDP. ....................................................................................30
Table 4.1 Relative costs and benefits of the annual Mekong flood .........................................36
Table 5.1 The onset and end of the SW Monsoon at selected sites in the Lower Mekong
Basin. .......................................................................................................................39
Table 5.2 Start and end dates of the 2008 flood season compared to their historical mean
and standard deviation at selected mainstream locations. .......................................43
Table 5.3 Comparative annual maximum historical flood water levels at Chiang Saen,
Luang Prabang, and Vientiane. ...............................................................................44
Table 5.4 Annual maximum discharge (cumecs) at sites on the Mekong mainstream
primarily affected by the 2008 flood. ......................................................................49
Table 5.5 Estimated annual recurrence interval of the 2008 maximum flood discharge. .......49
Table 5.6 Cambodian floodplain and Mekong Delta onset and end dates of the 2008
flood season compared to their historical mean and standard deviation. ................52
viii
Table 5.7 Maximum water levels reached during 2008 in Cambodia and the Mekong
Delta compared to their long term average. ............................................................52
Table 6.1 Cambodia total national flood damage in recent years (NDCM data). .................53
Table 6.2 Daily rainfalls observed at Paksane over the 10 days between 11th and 20th
June, 2008. ...............................................................................................................56
Table 6.3 Storm rainfall observed in the upper Se San Basin between the 2nd and 8th of
August, 2008. ..........................................................................................................64
Table 6.4 Rainfall observed in the upper Sre Pok: 14 6th November. ..................................65
ix
x
Acknowledgements
This report was prepared by the Regional Flood Management and Mitigation Centre (RFMMC)
of the Mekong River Commission (MRC).
The authors wish to thank the National Flood Experts, National Data Collection Experts and
National FMMP Coordinators at the National Mekong Committee Secretariats of Cambodia,
Lao PDR, Thailand, and Viet Nam for their support and contribution that led to the successful
completion of this report. Particular acknowledgements also go to the staff of the RFMMC for
their coordination of national inputs, overall assistance and guidance provided to the authors.
xi
xii
Summary
Conventionally, floods and flooding are perceived as geophysical hazards within a common
framework of natural disasters that also covers storms and hurricanes, earthquakes, volcanic
eruptions, landslides and tsunami. In each case, socioeconomic losses and damage increase
exponentially with event magnitude and as a function of civil exposure and vulnerability. Such
hazards are perceived as random events that have entirely negative impacts, ignoring the fact
that floods also have a positive ecological and socioeconomic function. Great civilizations
have developed within flood plains where, on the face of it, exposure and vulnerability have
been high. Such societies have included Sumerian Mesopotamia along the Lower Tigris and
Euphrates Rivers, ancient Egypt along the Nile, the Harappan culture of the Indus valley in
Pakisan and India, the founding cultures of China in the Yellow River Valley and the Angkor
civilization of the Lower Mekong Basin itself. Exploiting the benefits and avoiding the
risks brought by the annual flood stimulated such societies to put greater efforts into social
organization and water management systems, which endorsed them as landmark civilizations.
The use of the term `flood' in large tropical rivers and others such as the Nile refers to
a highly predictable seasonal hydrological response to rainfall. The regime comprises two
basic seasons, the `flood' season and the `low flow' season. Issues of scale mean that `flood'
conditions, when flows are considerably above the average for the year as a whole, last for
several months. On much smaller rivers a `flood' lasts only for several days, a duration that is
more consistent with definitions of a `flood' as a short duration geophysical hazard. The annual
Mekong flood, in response to the SW Monsoon, does in some years reach peak discharges
which cause considerable losses and damage. In other years the `flood' is benign and benefits
accrue. Here the term `flood' is used to refer to the several months of increased discharge
conditions, which may or may not in any given year result in large scale economic loss. The
annual Mekong flood has been pivotal to the cultural and socioeconomic evolution of the region
and despite the fact that some loss and damage occurs in most years, those that are significant
at the regional and national scales have a frequency that is low enough to ensure that over time
flood benefits exceed the flood costs by a very considerable margin.
Flood damage arises from a combination of direct losses due to the fact of inundation and
secondary losses as a result of the suspension of normal economic activities in the commercial
and service sectors which can accumulate long after the end of the event itself and until such
time as damage is repaired and stocks and inventory replaced. Assessing these figures in dollar
terms reasonably accurately requires detailed surveys of pilot areas the results of which are
then applied to the flood affected region on a loss per unit area basis. This is the methodology
adopted in each country in the basin and from data available from the relevant National Disaster
Management Agencies the losses that are estimated to arise in an average year amount to a
regional total of US$ 76 million. The most destructive regional flood conditions of recent
decades occurred in 2000 in the south of the basin and in 2008 in the northern parts. By far the
xiii
Annual Mekong flood report 2008
larger overall damages occurred in 2000 and amounted to US$811 million, those of 2008 being
much less at US$135 million.
The major economic flood benefits arise in the agricultural and fisheries sectors, though
by maintaining wetlands the annual flood also ensures that the products and services that such
areas provide are maintained from year to year, though these are difficult to value in financial
terms. On the basis of the value of production the main agricultural region in the basin is the
delta in Viet Nam which contributes 30% of national GDP and is the major source of export
rice, Viet Nam being the second largest contributor to the international rice trade.
In Cambodia flood inundated areas of the Delta are also amongst the most fertile regions
for agricultural production, with extensive double cropping. Rice occupies 90% of the total
cultivated land of which 32% lies in flood prone areas. Because of the fact that only 7% of the
land is irrigated it is only in these naturally flooded areas that a second crop is possible on any
large scale using receding water around lakes and rivers. In Lao PDR and Thailand the link
between agriculture, rice cultivation in particular, and the benefits of the annual flood on the
Mekong is less evident since most crops are rain fed or irrigated.
The link between the regional fisheries production and the annual flood is now well
established. Current estimates regarding the annual value of the regional aquatic resources
exceed US$2.8 billion, though not all of this figure is directly attributable to flood induced
processes.
Other flood benefits accrue but they are much more difficult to value in financial terms. This
applies in particular to wetlands which provide `goods', such as fish and aquatic products, and
`services' such as flood attenuation and the retention, recovery and removal of excess nutrients
and pollutants.
The theme of the AFR 2008 is not to set out a detailed economic analysis of the benefits
and costs of the annual Mekong flood but to compare the two in financial terms based upon the
generally available macro-data. These data, such as those with respect to the annual value of
the Mekong fishery, are widely accepted not least by the MRC's Fisheries Programme itself. In
addition, the annual value figure for the fishery of US$2.85 billion refers only to that at the first
point of sale. In comparison, the estimated average annual costs of flood damage only amount
to US$76 million or just 2.5% of the fisheries benefit alone.
The additional figures for the agricultural benefits are harder to assess since the linkage
between the annual flood is not as clear as it is with the fishery. Flood recession rice production
in Cambodia is reported to account for 32% of national production, valued at US$3.1 billion
in 2006 (based a February 2009 international price of US$500/tonnes). The value of the
agricultural benefit accruing directly from the flood in Cambodia is therefore US$3.1 billion x
0.32 = US$1 billion.
In the Mekong Delta in Viet Nam agricultural production in 2004 had a reported market
value of US$3.5 billion. That this is a benefit of the flood is based on the argument that the
Page xiv
Summary
9 to 13 millions tonnes of sediment deposited annually across the delta, most of it during the
flood season, has over millennia resulted in some of the most productive agricultural land in
Southeast Asia, thus establishing the link.
Separating the proportion of the total benefits in any of the sectors that accrue directly from
the annual flood is simply not possible, but even if they are half of the figures quoted here
with regard the value of the annual Mekong fishery alone, the `benefits' still far outweigh the
`costs'. The major conclusion to be drawn is that in large tropical monsoonal rivers the annual
flood cannot be perceived exclusively in terms of being a geophysical hazard. The comparative
benefit and cost figures presented here should not be seen in any way as a direct economic
comparison but interpreted as broadly indicative measures of the potential socioeconomic value
of flood induced processes.
The 2008 flood season across the Lower Mekong Basin illustrated a common feature of the
regional flood hydrology, that is extreme flooding in one part of the basin and average to below
average conditions elsewhere. In 2008 it was the northern parts between the Chinese border and
Vientiane that witnessed flood levels not seen for almost 50 years, while further downstream in
Cambodia and Viet Nam discharges and water levels were average at best.
Volumes of flood runoff, discharges and water levels in the northern part of the region up
until mid July had been average but an intensification of the SW Monsoon saw repeated tropical
storms and higher flood runoff. The storm situation then intensified dramatically during the first
week of August with the passage of tropical storm Kammuri across the northern provinces of
Lao PDR. Only satellite indications of the associated 3 to 5 day rainfalls are available (the rain
gauge network here being very sparse) but cumulative rainfalls considerably in excess of 500
mm are indicted. Volumes of flood runoff in the large northern Lao tributaries such as the Nam
Ou and Nam Khan increased to extreme levels.
Maximum discharges at Luang Prabang and Vientiane/Nong Khai occurred on the 14th and
15th of the month and were in the region of 23,000 cumecs or 50% above the annual average.
The associated water levels were comparable to those of 1966, when both city centres were
flooded. Some urban flooding again occurred at Luang Prabang since water levels were elevated
due to backwater effects on the Nam Khan upstream of the Mekong confluence. At Vientiane
large scale urban flooding was avoided principally due to the sandbagging of the river bank
adjacent to the central business district, but large areas of suburbs and peri-urban area were
flooded to depths locally exceeding 1.5 m.
These conditions soon dissipated downstream of Vientiane/Nong Khai since flood flows into
the mainstream from the large left-bank tributaries in Lao PDR, starting with the Nam Ngum,
were quite average. This becomes quite clear from the flows at Pakse and Kratie which come
close to those for an average flood season overall, while water levels in the Delta at Tan Chau
and Chau Doc were below average throughout most of the season.
Apart from these events on the mainstream local, and often seriously damaging, flash floods
occurred as they do in most years. In Lao PDR such conditions occurred in Bolikhamxay
Page xv
Annual Mekong flood report 2008
province during June with over 800 mm in 10 days and as much a 200 mm in 1 day. In the Thai
Mekong region during September in the Khon Kaen area heavy rainfall of almost 160 mm. on
the 17th caused of flood inundation and damage to property and crops and the deaths of two
people. In Cambodia no significant flood damage was reported for the year while in Viet Nam
the only events to cause any significant damage occurred in the Upper Sre Prok during May
and in the upper Se San Basin during the first week of August. The former saw two lives lost
and the latter resulted in some bridges being damaged and about 100 ha of rice paddy lost or
seriously damaged. Overall damage from flash floods for the year in Viet Nam amounted to
US$1 million. Regionally, however, the number and severity of flash flood episodes was well
below average.
The events of August 2008 provided the first real opportunity to assess the performance of
the RFMMC's flood forecasting models and expertise and in general they performed reasonably
well, though obviously room for improvement is recognised. The major constraint to accuracy
over lead times in excess of two to three days is the emerging conclusion that the storm rainfalls
indicated by satellite images are probably too low and that the network available for `ground
truthing' needs to be improved in key areas of Lao PDR in particular.
Otherwise the lessons and recommendations put forward in the four country reports
generally repeat those of earlier years and focus up such issues as strengthening community
based flood risk management and self reliance and building capacity within local communities
with regard to flood preparedness and emergency response. A need is also recognized to
improve the channels of communication between the local communities and the relevant flood
forecasting, mitigation and response agencies. In Viet Nam once again attention is drawn to
diverting more financial support for dealing with flash floods in the Central Highlands. Finally,
a call is once more made to consider translating the Annual Flood Report into each of the four
riparian languages.
Page xvi
1. Introduction
Consistent with the format established in the Annual Flood Reports for 2006 and 2007, this
2008 document comprises the following major sections:
Chapters 2, 3, and 4 present the annual theme, which this year considers the benefits and
costs of the annual Mekong flood. The aim is not in any way to provide an in depth economic
assessment but rather to establish the fact that the regional benefits that accrue from the flood
far exceed the losses and damage, which in the past have been the almost exclusive focus of
attention.
Chapter 5 reviews the hydrological aspects of the flood season, which in 2008 witnessed
extreme discharges and water levels in the northern areas of the Lower Mekong Basin between
Vientiane/Nong Khai and the Chinese border.
Chapter 6 gives a brief summary of each of the four annual country reports, for Cambodia, Lao
PDR, Thailand, and Viet Nam.
Chapter 7 details the major lessons learnt over the year, and provides recommendations for
improving the RFMMC's flood forecasting system.
Page 1
Annual Mekong flood report 2008
Page 2
2. Flood benefits
2.1 Introduction and historical context
Conventionally, floods and flooding are perceived as geophysical hazards within a common
framework of natural disasters that also covers storms and hurricanes, earthquakes, volcanic
eruptions, landslides and tsunami. In each case, socio-economic losses and damage increase
exponentially with event magnitude and as a function of civil exposure and vulnerability. Such
hazards are perceived as random events that have entirely negative impacts, ignoring the fact
that floods also have a positive ecological and socio-economic function. Great civilizations
have developed within flood plains where, on the face of it, exposure and vulnerability have
been high. Such societies have included Sumerian Mesopotamia along the Lower Tigris and
Euphrates Rivers, ancient Egypt along the Nile, the Harappan culture of the Indus valley in
Pakisan and India, the founding cultures of China in the Yellow River Valley and the Angkor
civilization of the Lower Mekong Basin itself. Exploiting the benefits and avoiding the
risks brought by the annual flood stimulated such societies to put greater efforts into social
organization and water management systems, which endorsed them as landmark civilizations.
Historically cultures that exploited the benefits of floodplains and contemporary societies
which continue to do so, such as those in the Lower Mekong, have to face a two-tailed flood
hazard (Webby et al., 2007). Either the annual flood is too small, leading to reduced agricultural
output or too large, resulting in inundation, crop losses and general socio-economic damage.
The dis-benefits arising from the `failure' of the flood season must not therefore be ignored or
even made light of. As will be seen, historically some of these deficiencies in the flood season
hydrology of the Mekong have been quite spectacular.
The Mekong Delta and Cambodian floodplain are the site of one of the earliest civilizations
in mainland Southeast Asia. Called Funan by visiting Chinese dignitaries, by the 3rd Century AD
it was centred around two major urban centres, namely Oc Eo in Viet Nam and Angkor Borei
in Cambodia (Jacques, 1979). It has been argued that dry season flood recession rice cultivation
formed the agricultural basis of Angkor Borei and may have dictated the location of the city
itself (Fox and Wood, 1999). The link between the rich agricultural possibilities provided by the
annual Mekong flood and the genesis of such pre-Angkor civilizations is clear from
(Figure 2.1) which compares the location of 2nd and 3rd Century archaeological sites with the
flood recession rice growing areas (see Fox and Wood, 1999). It is entirely likely that this
farming system became the future basis for later Lower Mekong civilizations such as that of
Angkor itself which has its classic period between 800 and 1300 AD. Angkor eventually evolved
into a true `hydraulic civilization' organised around the need to manage water through a vast
system of irrigation canals.
Page 3

Annual Mekong flood report 2008
The ability to maintain soil fertility over time has been a major challenge to Asian
civilizations. The Chinese, for example, developed a sustainable agricultural system based on
meticulous schemes for recycling organic waste; agriculture in Japan, Java and the Philippines
was based on rich volcanic ash soils (Ng, 1979). In Cambodia most soils are not naturally fertile
(Delvert, 1961) but farmers recognised over 1800 years ago that, being located within a flood
plain and deltaic system that allowed rising floodwater to spread out across the landscape and
deposit millions of tonnes of fertile sediment annually, they could develop a highly productive
and sustainable system of agriculture. The enhanced crop yields achievable from flood
recession agriculture are clear from the figures in (Table 2.1).
Lao PDR
Thailand
Siem Reap
Kampong Thom
Kratie
Kampong Chhnang
Kampong Cham
Phnom Penh
Viet Nam
Gulf of Thailand
Prey Veng
Angkor Borei
Dry season rice
Takeo
0
100 Kilometres
South China Sea
Figure 2.1 The distribution of flood recession rice cultivation areas and pre-Khmer archaeological
sites in Cambodia. (Source: Fox and Wood, 1999)
Figure 2.2 This bas relief at Angkor Wat is indicative of the importance of fish in the
socioeconomics and culture of the Khmer Empire (800 1300 AD)
Page 4
Flood benefits
Table 2.1 Cambodia comparative seasonal rice yields.
Land use system
Yield
(tonnes per hectare)
Rain-fed paddy rice wet season
1.6
Flood recession rice cultivation dry season
3.0
These benign effects of the annual Mekong flood with their attendant benefits extend to the
regional fishery which is an imperative component of the basin's economy. The first records
of the importance of fish and fishing is provided by the Bas Reliefs in the temples of Angkor,
dating from the 11th Century (Fox and Wood, 1999). Fish are represented in daily activities in
markets and also appear in agricultural scenes pointing perhaps to early aquaculture. Accounts
provided by Chinese travellers over 700 years ago indicate that fishing practises and the
economic importance of the Mekong fishery have changed little. The next accounts of capture
fisheries come from French and English travellers in Indo China and Thailand during the
late 1800s. They identified the important areas as the Great Lake in Cambodia, the Mekong
mainstream to Khone Falls, and the surrounds of Vientiane and Luang Prabang.
Over this period, the Mekong fishery developed to take advantage of annual fish migrations
at the beginning and end of the flood season. The annual mono-modal flood pulse of large
tropical rivers such as the Amazon, Congo and Mekong is the dominant `trigger' in the annual
cycle of ecological processes within the fluvial system, bringing about a distinct seasonality in
the annual hydro-biological cycle between an aquatic phase and a terrestrial phase (Junk et al.
1989). As a consequence there are highly seasonal bio-geochemical cycles, growth rhythms and
life cycles amongst the many species of ecosystem system biota such as algae, macrophytes,
trees, fish and invertebrates (Junk, 1997; Junk et al., 2000; Junk and Wantzen, 2004) and these
have been exploited much to the benefit of the riparian societies.
This pivotal role that the annual Mekong flood has played in the evolution of the cultures
and economy of the basin therefore negates the concept of a flood exclusively as a (usually)
disastrous overflowing of water onto previously dry areas. In a hydrological, ecological,
economic and social environment such as that which prevails in the Lower Mekong Basin the
annual flood only becomes a hazard if certain hydrological benchmarks are exceeded. Although
important, it would be incorrect to define these thresholds simply in terms of water level or the
associated discharge since these variables only describe one aspect of what is a multivariate
random process. The annual flood in the Mekong arises from the complex interaction between
meteorological conditions and the basin response which generates a seasonal hydrograph which
needs to be defined in much wider terms.
The weight of the evidence, both historical and contemporary, suggests that the benefits of
the annual Mekong flood far outweigh the costs in most years. The balance between the two
is not static, however. When critical hydrological thresholds are exceeded the value at risk
is increasing annually since there is rapidly accelerating development within the flood plain,
its population is increasing and the crops, property and inventory at risk are becoming more
valuable. Such circumstances are in common with those world wide where there appears to
Page 5
Annual Mekong flood report 2008
be a systematic growth in the exposure and vulnerability of society to flooding, particularly in
developing countries, such that annual costs and losses are growing even though there is little
evidence (so far) to suggest that the incidence and severity of the events themselves is on the
increase.
The economic dimension as to whether there is an overall regional cost or benefit accruing
to the annual flood in any given year is complex and fuzzy. The very size of the Lower Mekong
Basin is such that the synoptic events which cause extreme runoff have an area of impact that
can only cover a part of the region, such are the consequences of scale. While the strength of the
SW Monsoon defines the overall character of the flood season it is typhoons and tropical storms
that typically generate the extremes and most damaging events. Historically, there have been
no flood seasons during which the whole basin has been affected by critical conditions. Hence
there can be considerable geographical variation across the region in the annual flood situation,
a fact emphasised during the events of 2008 (details in Chapter 6).
The picture that clearly emerges is that the annual flood has been pivotal to the cultural and
socioeconomic evolution of the Mekong region and that despite the fact that some loss and
damage occurs in most years, those that are significant at the regional and national scales have
a frequency that is low enough to ensure that over time flood benefits exceed the flood costs by
a considerable margin. Arguably therefore, the logical approach is to set out the benefits first
and then consider the losses, which helps to moderate the perspective of floods as an entirely
negative process. This is not to underplay the importance of the need to develop strategies to
manage and mitigate flood losses and damage. In some years they can be catastrophic to the
extent of causing a significant fall in GDP.
2.2 Flood benefits -- agriculture
A key feature of the annual Mekong flood is that in terms of its timing it is highly predictable,
particularly in terms of its onset in early July. This feature it shares with the Nile flood, for
example, which enabled Egyptian society to develop a planned and highly seasonal form of
agriculture with a relatively high level of crop security leading to food surplus in most years.
This said, however, the periodic failure of the annual flood over consecutive years led to
famines of which several are chronicled in the annals of Ancient Egypt. There is little doubt
that droughts would also have occurred and caused food shortages at the time of the ancient
Mekong civilizations, but such events are unrecorded. In Cambodia these societies were largely
rural, supporting ceremonial centres with rice and labour. It has been argued that the later states
and kingdoms that evolved there and in Thailand and Lao PDR took the form of social systems
based on cooperative villages which had a common form of agricultural production based on
monsoon rainfall and to some degree on various forms of flood irrigation. They are referred to
as `agro-cultural complexes'.
This type of rural balance between a subsistence form of agriculture and the provision of
food to political and religious centres largely prevailed in the Mekong region until the colonial
Page 6
Flood benefits
era and the beginning of large scale commercial resource development. French statistics (Van
Liere, 1980) suggest rapid agricultural growth and environmental change during this period.
From 1880 to 1930, the total volume of earth dredged in the Mekong Delta totalled 165 million
cubic metres which compares with 210 million for the Panama Canal and 260 million for the
Suez. These new canals drained large areas and complemented the demands from an increasing
population of ethnic Vietnamese farmers migrating from the north. Cultivated land area rose
from 200,000 hectares in 1879 to 2.4 million in 1929. This represented an increase from
roughly 5% to 60% of the total surface area in the Vietnamese portion of the Mekong Delta.
The aim was, through public works, to drain the delta's swamps, marshes and forests to
exploit the fertile alluvial soils that were the legacy of thousands of years of the flood regime of
the Mekong and transform the landscape into one dominated by highly productive rice paddies.
This impressive rate of growth meant that by the 1930s the delta has already become one of the
world's major rice exporting regions. It was still, however, largely uncontrolled in hydraulic
terms, particularly with regard to flooding and salinity intrusion, which were seen as major
obstacles to the development of intensive farming and multi-cropping systems (Kakonen, 2008).
It was not until the 1980s that the necessary intake and outflow structures were constructed
on a large scale to regulate flows to and from the fields and not until the 1990s that hydraulic
infrastructure was completed that reduced dependence on natural hydrological conditions and
which enabled the control of floods, salinity and the cropping limitations imposed in some areas
by acid sulphate soils. Consequently, by 1997 Viet Nam had become the world's second largest
rice exporter, shipping some 3.5 million tonnes to the global market. A statistical summary
of the contribution that the agricultural outputs of the delta currently make to the Vietnamese
economy (General Statistics Office, 2004) is set out below. It produces:
· About half of the national food output;
· 51% of the total rice paddy production;
· 55% of the national inland fisheries and fruit output;
· 60% of the country's exported aquaculture products;
· 61% of the total national export value.
Of course it would be quite wrong to suggest that these contributions to the national
economy are entirely the result of the Mekong flood regime -- they are the outcome of
converting the natural floodplain into a highly controlled and intensive agricultural landscape.
But the nature of the landscape that provided the opportunity to do so is the result of the
hydrology of the river and the benefits that have accrued from the annual flood over thousands
of years.
Page 7
Annual Mekong flood report 2008
3.5
3.0
alue (US$billion) 2.5
al v
Economic impact of the
2000, 2001, and 2002 floods
A
g
r
icultur
2.0
1.5
1994
1996
1998
2000
2002
2004
2006
Year
Figure 2.3 The value of agricultural production in the Mekong Delta (1995 2004) in Viet Nam.
The chart shows significant annual growth over period, but also that this growth can be
disrupted during years of extreme flood conditions.
Figure 2.3 shows the significant rates of annual growth in agricultural production in the
Mekong Delta to 2004, when its total value reached US$3.3 billion. The figures also illustrate,
however, that this systematic increase in monetary value can be interrupted in years when flood
discharges and water levels exceed critical thresholds, as they did between 2000 and 2002.
These figures refer only to that part of the delta in Viet Nam, though it is generally
regarded as beginning at Phnom Penh in Cambodia, where the Mekong divides into its two
main distributaries, the Bassac and the Mekong (Tien). It comprises a vast triangular plain of
approximately 5.5 million ha of which 1.6 million are in Cambodia and mostly lies below 5 masl.
The 9 to 13 millions tonnes of sediment deposited annually, most of it during the flood season, has
resulted in some of the most productive agricultural land in Southeast Asia.
Unsurprisingly therefore the flood inundated areas of the delta are amongst the most fertile
regions for agricultural production in Cambodia, with extensive double cropping. Rice occupies
90% of the total cultivated land of which 32% lies in flood prone areas. Because of the fact that
only 7% of the land is irrigated it is only in these naturally flooded areas that a second crop
is possible on any large scale using receding water around lakes and rivers. Interestingly this
second dry season flood recession crop usually gives higher yields than the wet season crop due
to more controllable water management, the lower risk of crop losses due to excessive water
depth and the benefits obtained from the deposition of fertile sediment during the flood itself.
Cambodia harvested more than 6,264,000 million tonnes of rice in 2006. Taking current
2008 price of US$ 500/million tonnes and the fact that of the 2006 figure 32% was harvested
from the floodplain areas then the flood benefit value is US$1 billion.
Page 8
Flood benefits
In Lao PDR 80% of the cropped area is planted to rice, of which 75% is rain fed lowland
paddy in areas of low flood risk. The balance is made up of rain-fed upland rice which has quite
low yields. Only about 10% of the planted area is irrigated contributing about 14% to national
production. Although overall, rice production accounts for 20 to 25% of GDP there isn't the
strong linkage between the annual flood in the Mekong Basin and agricultural production
that there is in Cambodia and the Delta in Viet Nam. FAO figures indicate that in 2005 rice
production in Lao PDR totalled 2,600,000 tonnes, of which only 5% is marketed commercially.
The planted area was 736,000 ha giving a yield of 3.5 tonnes/ha.
Figure 2.4 Flood recession rice cultivation on the Cambodian floodplain.
There are local areas of rice paddy close to the Mekong mainstream and in the lower reaches
of the large tributaries in Lao PDR that are inundated during most years and which are exploited
for agricultural production, including the growing of vegetables and maize as well as rice. Most
of the islands in the mainstream are used in this way. Although in total the area is probably
substantial and the economic benefit significant, this sector of the agricultural economy is not
identified separately in the compilation of agricultural statistics since it is generally informal,
with outputs traded locally, if at all. The wider commercial benefits of agriculture in Lao PDR
may therefore be considered to be independent of the Mekong flood.
In the Thai Mekong region traditional forms of agriculture that exploit seasonal floodplain
and wetland inundation are now increasingly scarce, as more intensive forms oriented towards
external markets have taken over from subsistence and small scale farming. According to Fukui
and Hoshikawa (2003) the shift towards large-scale rain-fed production in Isaan only began
during the 1950s, prior to which a flood dispersion system known as Tham Nop, was generally
used, an example of which is illustrated in Figure 2.5. Earthen bunds were constructed across
small tributaries to divert early season floodwater onto pre-prepared paddy fields typically
covering a 300 500 ha area on the flood plain and low lying riparian lands. According to the
Page 9

Annual Mekong flood report 2008
first village economic survey in Thailand in 1930 31 (Zimmerman,1931), the average yield
of rice in the northeast of the country, based on this limited system, was most probably higher
than in the central region, which had become Thailand's rice-bowl for export production (Fukui
and Hoshikawa, 2003). The report goes on to describe the very low density of population in
the northeast and its concentration along rivers where the local economy centred around the
exploitation of aquatic resources.
Figure 2.5 An example of the `Tham Nop' flood diversion system from North East Thailand.
(Fukui and Hoshikawa, 2003). A bund is constructed across the river and early season
flood water diverted onto riparian rice paddy. Water levels are controlled by simple
timber gates. Typically these tradition water control schemes provided flood irrigation to
200 to 500 ha.
Post 1950 rural development policies in the Thai Mekong region, particularly in the
Mun Chi basin, focused on agriculture and the provision of reservoir storage for direct gravity
fed and pumped irrigation from regulated rivers. The population grew five fold in 50 years from
5 to 25 million, of which 70% remains rural and involved to some degree in agriculture. Rain
fed rice production dominates the rural landscape, covering 75% of the agricultural land. In
2006 total rice production in the Thai provinces that lie within the Mekong Basin totalled 10.5
million metric tonnes (FAO Figures), with a current (February 2009) value of US$5.25 billion.
With less than 1% of the regional land classified as flood plain the role of the annual flood
in generating this agricultural benefit in the Thai Mekong region is minimal. Small scale
rice growing systems using flood recession trap ponds do still exist along with instances of
traditional mixed crop farming using flood recession terraces on riverbanks, for example in the
Nam Songkhram river basin. Such activities are, however, usually uncommercial and generate
benefits only at the household or village level.
Summarizing the annual agricultural flood benefit gives a total regional figure of US$4.5
billion, which is generated in Cambodia and Viet Nam alone. In relative terms the outputs of
floodplain agriculture in Lao PDR and Thailand are considered to be insignificant compared
to rain fed and irrigated production (Table 2.2). The overall figure is probably conservative
Page 10
Flood benefits
since, although it is based on a rice price of US$/500 a tonne, which represents a significant
recent increase, the value of other crops has not been included. To do so would be complex
since production and market value figures are not generally available in a form that permits a
breakdown in a way suitable for the present purposes. It is also true to say that fruit, vegetables
and other crops that are grown on a commercial scale are produced in areas not directly at risk
from flood inundation except under the most extreme hydrological conditions. Rice on the other
hand is the archetypical flood plain crop and production clearly benefits from the annual flood
in most years.
Table 2.2 Summary value of regional agricultural output which benefits directly from the annual
Mekong flood.
Country
Estimated annual agricultural value Comments
accruing from the annual Mekong
flood (US$ billion)
Cambodia
1.0
2006 figures. Based on rice occupying 90% of
agricultural area of which 32% lies in flood prone areas.
Only local flood recession agriculture most
Lao PDR
Not significant
production combines rain fed summer and irrigated
winter crops.
Thailand
Not significant
Viet Nam
3.5
2004 figures for production in the delta, which is itself
a long term product of the annual flood.
Total
4.5
Note: The estimates are based on rice production valued at US$500 per tonne (February, 2009 prices).
2.3 Flood benefits -- the Mekong fishery
The annual mono-modal flood-pulse of large tropical rivers such as the Amazon, Congo and
Mekong is the dominant `trigger' in the annual cycle of ecological processes within the fluvial
system, bringing about a distinct seasonality in the annual hydro-biological cycle between an
aquatic phase and a terrestrial phase (Junk et al., 1989). As a consequence there are highly
seasonal biogeochemical cycles, growth rhythms and life cycles amongst the many species
of ecosystem system biota such as algae, macrophytes, trees, fish and invertebrates (Junk,
1997; Junk et al., 2000). The annual inundation of the floodplain, particularly in Cambodia
and specifically around the Tonle Sap and Great Lake, makes available a huge biomass to the
aquatic food web which boosts aquatic productivity and results in a prolific ecosystem.
The major manifestation of this virtually unrivalled level of aquatic productivity is the
Mekong fishery, amongst the largest of its type in the world. Hortle (2007) estimated that
in 2000 the yield of fresh water fish in the basin, minus the aquaculture component, was
approximately 1,860,000 tonnes. Combining this figure with an estimate of the size and first
sale vale of the fish of between US$1.0 and US$1.8/kg, the total value of the fishery is indicated
to be US$2,600 million if a median figure of US$1.4/kg is adopted. Using a proportional
Page 11
Annual Mekong flood report 2008
breakdown of estimated fish yield by country given in (Hortle, 2007), the following national
estimates are obtained:1
Table 2.3 Estimated value of fish production in the Lower Mekong Basin.
Country
Value of national inland fishery
based on 2000 estimates
(US$ million)
Cambodia
608
Lao PDR
212
Thailand
900
Viet Nam
880
Total Lower Mekong Basin
2 600
Note: Base on figures in Hortle (2007).
The figure for Viet Nam reflects the role of aquaculture production, which in effect is
independent of the annual flood pulse. Elsewhere, it is clear that the flood regime plays a
pivotal role, most particularly with regard to migrant fish capture which accounts for 71% of
the total fish yield (Barlow et al., 2008), no more so than in Cambodia. In Thailand the major
basin fishery lies in the Mun/Chi Basin and in tributaries such as the Nam Songkhram while
in Lao PDR it is a significant element in socioeconomics throughout the country, both on the
mainstream and within the tributary systems.
Other aquatic animals (OAAs) such as frogs, crabs and molluscs are also very important in
terms of their contribution to regional diet and livelihoods and their breeding cycle and yield is
closely allied to the seasonal flood cycle. Hortle (2007) provides annual yield estimates which
can be converted to a US$ value by assuming an average sale price, a figure of US$0.50 kg
being a reasonable one according to the MRC Fisheries Programme. As the figures in Table 2.4
indicate their annual regional value could be close to US$250 million.
Table 2.4 Estimated value of other aquatic animals (for example, frogs, crabs and molluscs) in the
Lower Mekong Basin.
Country
Estimated annual yield of other Value based on an average sale price
aquatic resources
of US$0.50 kg
(tonnes)
(US$ million)
Cambodia
105 500
52.75
Lao PDR
40 500
20.25
Thailand
191 000
95.50
Viet Nam
161 000
80.50
Total Lower Mekong Basin
498 000
249.00
Note; Based on figures in Hortle (2007).
1 Though these national yields figures are derived from fish consumption data and therefore ignore cross-border trading they are
nonetheless broadly indicative of production value.
Page 12

Flood benefits
That there is a very strong link between the annual fish catch and the extent and duration of
flooding is intuitively clear. The most researched component of the overall Mekong fishery is
the so called dai, or bagnet, fishery that exploits the annual migration of fish out of the Great
Lake in Cambodia towards the Mekong via the Tonle Sap towards the end of the flood season
(Figure 2.6).
Figure 2.6 The dai, or bagnet fishery, on the Tonle Sap, Cambodia.
Halls et al. (2008) propose a flood index based upon the sum of the number of days that
a given area is flooded during around the Great Lake each flood season, which provides an
indicator in units of km2 days. Figure 2.7 shows the relationship between this statistic and the
annual dai catch in terms of fish biomass.
45000
1200000
40000
1000000
35000
30000
800000
t
o
n
n
e
s
)
25000
d
a
y
s
)
600000
2
a
s
s ( 20000
k
m
F
l (
15000
400000
B
i
o
m
10000
Biomass
200000
5000
Flood Index
0
0
98-99 99-00 00-01 01-02 02-03 03-04 04-05 05-06 06-07 07-08
Season
Figure 2.7 Estimates of fish biomass arriving at the dai fishery and the annual flood index proposed
by Halls et al. (2008).
Page 13

Annual Mekong flood report 2008
The higher fish biomass during years of extensive and longer duration flood inundation, as in
2000, 2001 and 2002, reflects that under such conditions the fish caught are bigger on average
which in turn indicates the longer that they have to breed and feed amongst the rich organic
resources of the flooded areas the larger they grow and the more mature they are once they
begin to migrate.
These huge figures regarding the estimated value of the Mekong aquatic resources,
particularly fish, are regarded as conservative as they do not take account of the economic
benefits that flow from the trade, processing and preservation of fish products. Nor do they
include the very considerable indirect values of the fishery such as its contribution to the
nutrition, employment and well being of millions of rural people who generally have few other
income earning and livelihood options (Barlow et al., 2008).
2.4 Flood benefits the creation and maintenance of natural wetlands
Floodplain and wetland areas which are flooded part of the year or which expand greatly in area
during the flood season can produce much far more aquatic resources than permanent water
bodies of the same size, such as lakes and reservoirs (Figure 2.8). In fact, according to Ringler
and Xai (2006) natural wetlands are amongst the most productive ecosystems in existence and
the benefits from wetland products are often considerably higher per unit area than from other
land uses. The benefits in terms of the regional fishery and other aquatic resources have already
been considered and identified as huge, but wetlands also provide a wide range of additional
ecological goods and natural services as specified in Table 2.5. These include physical benefits
such as natural flood storage and flood attenuation, improved water quality through pollution
control and waste dilution, habitat provision for resident and migratory species and the
maintenance of important biochemical equilibria.
Figure 2.8 Mekong wetlands at Sipandone, Lao PDR.
Page 14
Flood benefits
Table 2.5 Functions and services provided by natural wetlands.
Services
Comments and examples
Provisioning
Food
Production of fish, wild game, fruits, grains.
Fresh water
Storage and retention of water, provision of water for
irrigation and drinking.
Fibre and fuel
Production of timber, fuel wood, peat, fodder, aggregates.
Biochemical products
Extraction of materials from biota.
Genetic materials
Medicine, genes for resistance to plant pathogens,
ornamental species etc.
Regulating
Climate regulation
Regulation of greenhouse gases, temperature, precipitation
and other climatic processes.
Hydrological regime
Groundwater recharge/discharge, water storage.
Pollution control
Retention, recovery and removal of excess nutrients/
pollutants. Waste dilution.
Erosion protection
Retention of soils and prevention of channel erosion
Natural hazards
Flood storage, retention and attenuation
Cultural
Recreational
Opportunities for recreational activities.
Aesthetic
Appreciation of the natural environment.
Educational
Opportunities for formal and informal education and training
Supporting
Biodiversity
Habitats for resident and migratory species.
Soil formation
Sediment retention and accumulation of organic matter.
Nutrient cycling
Storage, recycling, processing and acquisition of nutrients.
Pollination
Support for pollinators.
Note: Based on Mekong Wetlands Conservation and Sustainable Use Programme. (www.mekongwetlands.org)
Wetland goods and services are particularly difficult to value, because:
· Many goods are not marketed but traded or consumed directly:
· Wetland services, such as water quality or groundwater recharge often occur in areas
away from the physical location of the wetland and may not be easily attributable to the
wetland itself;
· Many wetlands are trans-boundary resources and data on the use and consumption of
goods and services are difficult to obtain, and;
· Many wetlands are public property.
Page 15
Annual Mekong flood report 2008
100oE
105oE
Viet Nam
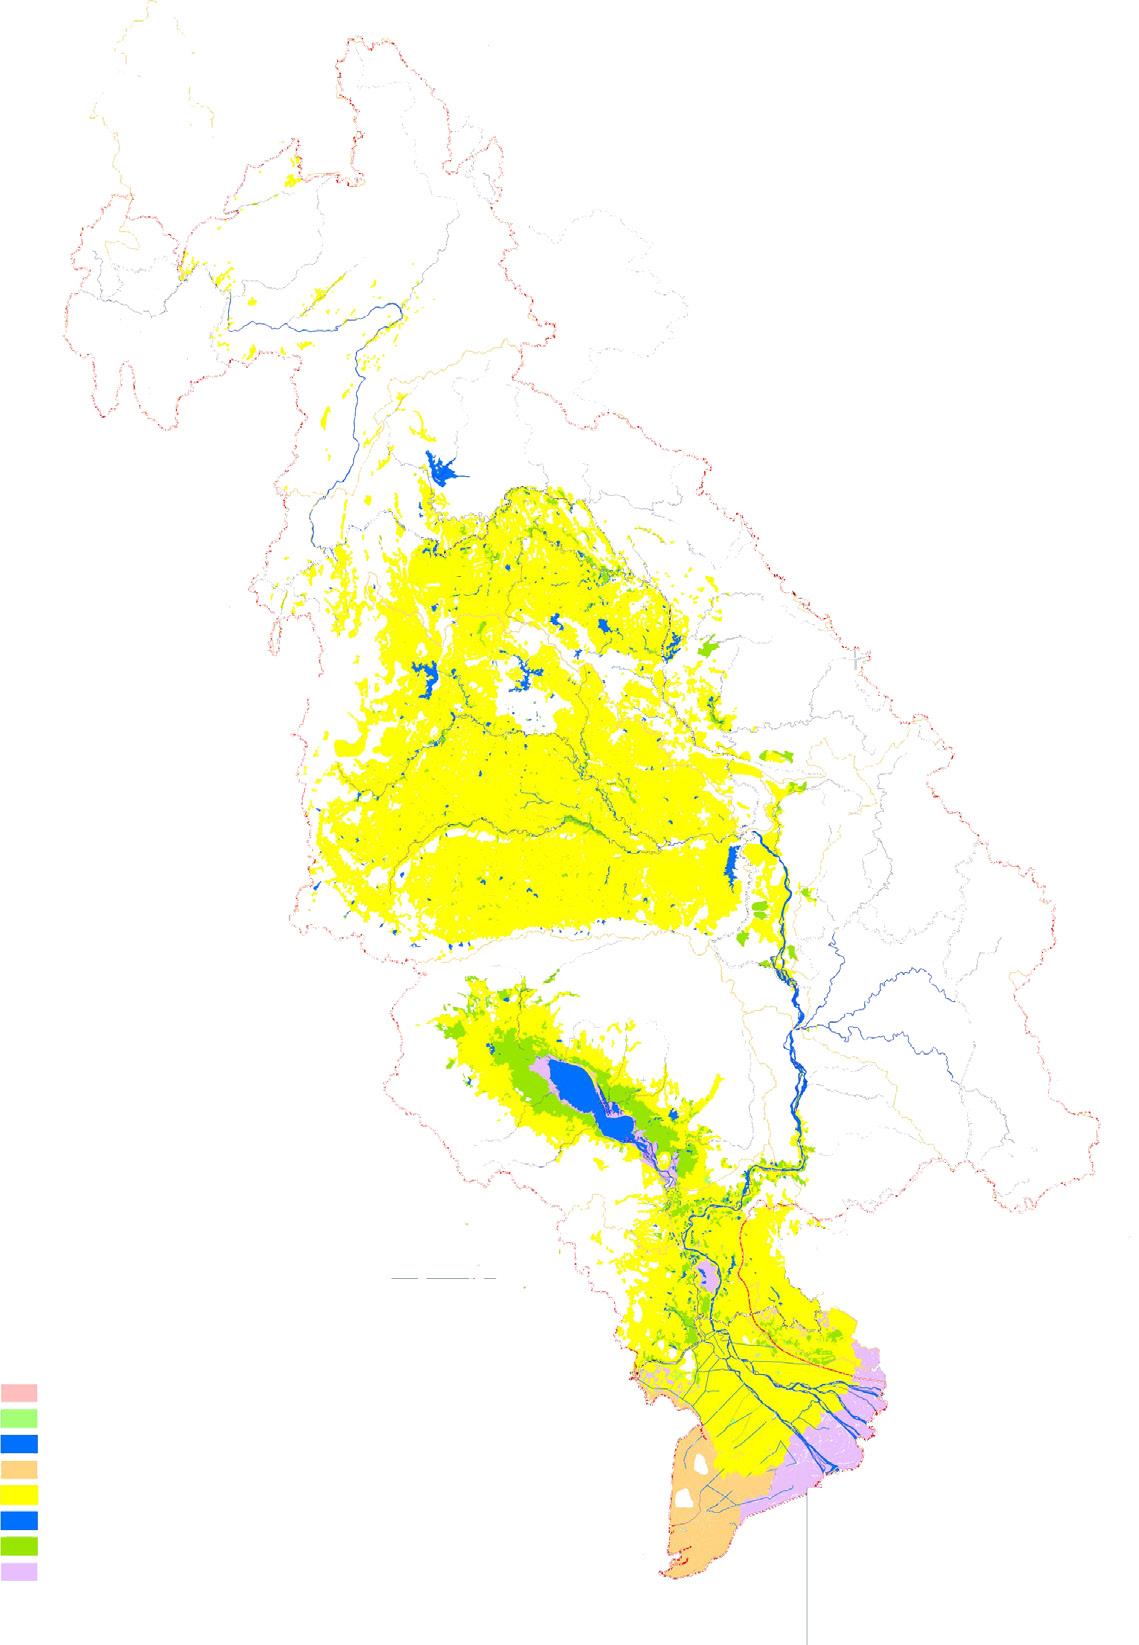
WETLANDS OF THE LOWER MEKONG BASIN
Lao PDR
Thailand
Cambodia
20oN
20oN
Gulf of Tonkin
15oN
15oN
KEY
Bank/beach/bar/esturine
Flooded forest or plantation
Natural or man-made lakes and ponds
10oN
10oN
South China Sea
Marine/costal mangrove or aquaculture
Rice wet/recession and other crops
Rivers and channels
Swamp, backswamp, grassland, marsh
0
100
200
300 kilometres
Other
100oE
105oE
Figure 2.9 Distribution of `wetlands' in the Lower Mekong Basin though here no distinction is
made between natural flood inundated wetlands and rain fed rice paddy. The latter would
account for most of the area specified in the Mun Chi Basin in Thailand.
For these and other related reasons, the economic benefits generated by wetlands and
the economic costs associated their degradation or loss are usually unknown and omitted in
project and policy analysis. As a result, the potential of wetlands to be used as contributors to
economic growth, income generating activities and as sources of goods and services has been
underestimated in many parts of the world resulting in the loss of valuable species, services, and
livelihoods.
Page 16
Flood benefits
The only detailed economic assessment of the value of the goods and services provided
by natural wetlands within the Mekong region is that undertaken of the That Luang marsh in
Vientiane municipality, Lao PDR by Gerrard (2004). Although it collects urban storm water
runoff and some wastewater from the city, has a major flood control role and is not directly
connected to the Mekong in terms of seasonal flood inflow, the results for That Luang provide
an important pointer towards the potential wider regional economic value of natural wetlands.
The total value of the goods and services provided by the 2000 ha marsh on an annual basis is
summarised in terms of direct and indirect use values in Table 2.6:
Table 2.6 Summary of the annual value of wetland economic benefits from the That Luang marsh,
Vientiane municipality.
That Luang Wetland Uses and Services
Annual value (US$)
Wetland Resources Direct use
Rice cultivation
350 000
Garden cultivation
55 000
Aquaculture production
180 000
Capture fisheries.
1 100 000
Other aquatic products
354 000
Sub total
2 040 000
Wetland services Indirect use.
Flood protection
2 850 000
Wastewater purification
70 000
Sub total
2 920 000
Total
4 960 000
Note: figures are rounded from Gerrard (2004).
Gerrard based the monetary value of the flood protection service provided by the marsh on
figures available from the JICA feasibility study on the improvement of the drainage systems in
Vientiane which was undertaken in 1990. This involved the assessment of inundation damage
that would occur as a result of a 10 year storm without an improved drainage system for the city
using unit cost values of damage to property, services and inventory based on surveys and land
use. JICA recommended the construction of urban drainage canals (now completed) into the
marsh as part of the overall plan and calculated the benefit of doing so in terms of the damage
avoided within those areas of the city that would be drained of storm water in this way. Gerrard
updated the cost benefit figures on the basis of the growth in the Gross Regional Domestic
Product of the city over the years since 1990 and obtained the estimate for the flood protection
services provided by That Luang given in Table 2.6.
Since the value of direct wetland uses has already been included in the analysis of
regional agriculture and fisheries the focus here lies with wetland services. For That Luang
the annual monetary benefit of flood protection and wastewater purification is estimated to
be US$2,920,000, giving an annual unit area benefit of US$1,460/ha over the 2,000 ha of
the marshland. In a study of one hundred and ninety wetland valuation studies worldwide
Brander et al. (2006) observed that socioeconomic variables such as income and population
Page 17
Annual Mekong flood report 2008
density are important factors in explaining wetland value. Since in effect That Luang is
providing municipal services directly to a large population its service value is estimated in
terms of replacement costs, for example the construction of sewage treatment facilities and
alternative flood protection and drainage infrastructure. Consequently the service value figure of
US$1,460/ha would be higher than the average for regional wetlands as a whole.
Even so the average value of wetland services at this regional scale is not likely to be
insignificant particularly with regard to their role in mitigating floods. It may seem to be a
circular argument that, since the mainstream and tributary wetlands are by and large a product
of the annual Mekong flood pulse, that one of their key benefits lies with flood attenuation.
This, however, could be seen as positive feedback and simply as one sub-component of the
hydrological dynamics of the system.
Other than the problem of placing a meaningful financial benefit on the services provided
by regional wetlands another complication arises since it is difficult to derive the total area in
the Lower Mekong Basin classified as such. Estimates vary. MacAlister and Mahaxay (2008)
report that 40 million ha are mapped but that the thematic accuracy is poor, which precipitated
their much more detailed mapping though no final figures were quoted for the Basin as a whole.
The figure of 40 million ha is quite clearly unrealistic since it represents more than 60% of the
Lower Basin area. Keskinen et al. (2008) quote a figure of five million hectares for the basin
between Kratie and the South China Sea, which is consistent with estimates available from the
Asean Regional Centre for Biodiversity and those quoted in Do and Bennet (2008). Of this total
area the Cambodian floodplain comprises almost three million hectares.
Determining figures for Lao PDR and Thailand is more problematical. As MacAlister and
Mahaxay (2008) found the categorization of wetlands and floodplain is complex upstream of
Cambodia. Taking a wider view of the available data for the two countries then, excluding
`closed' wetland systems that are not directly connected to the Mekong drainage system, a
figure of 250,000 ha seems reasonable. On this basis the overall regional figures can be broken
down as shown in Table 2.7.
As a working assumption, if a minimum unit area value of the services provided by this area
of floodplain and wetland is set at US$100/ha and a maximum figure of US$500 selected then
the total regional benefit that accrues each year is as reported in Table 2.8.
The natural regulation of floodwater and reduction in peak discharges and water levels is
the major service benefit. Floodwater is in effect stored on the flood plain and in the wetlands
and released once the peak flow has occurred with the effect that flood recession is slower and
therefore longer. This is of advantage particularly in the delta since the period of the year during
which tidal influences dominate the diurnal pattern of water levels and therefore the risk of
extensive saline intrusion is significant becomes shorter.
Page 18
Flood benefits
Table 2.7 Estimated wetland and floodplain areas in the Lower Mekong Basin (LMB) contiguous
with the Mekong drainage system.
Sub area of LMB
Key wetlands
Area (ha)
Lao PDR and Thailand
Nam Songkhram
100 000
Se Champone
24 000
Siphandone
6 000
Se Kong
35 000
Se Pian
30 000
Other
55 000
Cambodia and Viet Nam
Cambodian floodplain
3 000 000
Delta floodplain
2 000 000
Regional Total
5 250 000
Note: Compiled from figures in Keskinen et al, (2005) and the Mekong Wetlands Biodiversity
and Sustainable Use Programme statistics.
Table 2.8 Estimated minimum and maximum value of the services provided by the flood plain/
wetland area in the Lower Mekong Basin.
Flood plain/wetland area
Annual value of services (US$ million)
(million ha)
Minimum based on a unit area
Maximum based on a unit area
service value of US$100/ha
service value of US$500/ha
5.25
525
2 625
Other service benefits include the retention of sediment and organic matter within the
floodplain and wetlands to the obvious advantage of agriculture and the aquatic ecosystem,
pollution control and groundwater recharge and storage.
Page 19
Annual Mekong flood report 2008
Page 20
3. Flood costs
3.1 Introduction
The major challenge to any systematic review of the financial costs of flood damage in the
Mekong region is that national guidelines and methodologies vary, such that building up a
consistent regional database is difficult. The accuracy of the estimates is effectively unknown
since they depend upon the valuation of private property, public infrastructure, crops and
livestock which can vary in line with the economic climate prevailing at the time, though in
general the total value at risk increases from year to year as repair and replacement costs rise.
In addition the property and inventory exposed to flood inundation is growing year on year as
areas at risk are developed.
Primary flood damage arising from the fact of inundation is probably easier to assess. Less
straightforward to evaluate are secondary losses, principally those that accumulate during the
time that normal economic activity is suspended and production and services are suspended.
These secondary losses can accumulate over a very long period after the flood has receded,
usually months and sometimes a year or more depending on the time it takes to fully repair the
damage and for normal services to be resumed.
Issues of scale dictate that in the Lower Mekong Basin flood damage and the associated
financial costs are best considered at the macro level since extreme flooding tends to be regional
in extent. So much so that the impact of the losses can often be measured in terms of reduced
GDP. The major component of total economic damage varies. In rural Lao PDR, for example
the agricultural sector usually suffers the major losses, though the consequences for structural
economic assets such as houses, schools, roads and bridges can also be significant. In the more
densely populated and urbanised delta damage to infrastructure typically exceeds that to crops.
The economics of flood damage are complex since there are a number of damage categories
that have to be valued differently:
· Residential includes physical damage to the structure, clean-up, and damage to the
contents of the house.
· Commercial includes structural damage to shops and industrial premises and the losses
in terms of stock and equipment.
· Agricultural refers not only to crop damage and losses but also to livestock losses and
damage to irrigation infrastructure and on farm property. Also included is the fish farming
sector which in parts of the Mekong region is extensive and a key local economic
activity.
Page 21

Annual Mekong flood report 2008
· Communications and transport covers structural damage to roads, railways and bridges.
· Service facilities encompasses damage to power supply and telecommunications, for
example.
Figure 3.1 Flooded rice fields near Pakse, September 2008.
To these potential sectoral costs and losses must be added the additional costs incurred
during flood emergencies for evacuation, temporary housing, medical supplies, food and
clothing, A significant diversion of resources from other activities during the emergency
response also carries a cost with it. Finally, the secondary losses in terms of ongoing post flood
disruptions to economic activity and reduced agricultural, commercial and industrial production
can in the case of extreme regional events accumulate over time to become a significant
proportion of total damage (Anderson et al., 1993).
3.2 Flood damage assessment in the Lower Mekong region
In the Mekong region flood damage data are collected by the national disaster management
organisations that have been established in each of the four countries. The data are obtained
on the basis of surveys, interviews and questionnaires and are therefore not available for some
time after the event, though early rapid assessments are undertaken to inform governments of
the expected scale of economic loss and damage. For most structural damage categories, the
financial loss increases as a function the depth of inundation though the duration of flooding
also plays an important role, for example damage to building foundations in expansive clay
soils rises exponentially with increasing duration of saturation. Earth flood protection levees
fail not only as a result of overtopping but also because of extreme durations of high water level
causing saturation and collapse.
Page 22
Flood costs
Crop damage is related to both the depth and duration of flooding as are livestock losses.
Costs in the communications sector are also related to both with erosion of embankments an
additional factor which is linked to flow velocity. Throughout all damage sectors sediment
deposition is a major factor.
At the broadest level flood losses are measured in financial terms though there are important
intangible social consequences including distress, health issues and ultimately loss of life.
The nature and severity of the flood conditions provide one set of variables that determine
overall damage while the land use makes up the balance. The depth of inundation, its duration
above critical thresholds, the velocity of overland flow and the amount of sediment deposited
comprise the major hydrological and hydraulic factors. These, however, exert varying types of
impact depending on land use factors. Flood depth is often used exclusively to define damage in
the residential sector on the basis of damage depth curves. The relationship between depth and
damage in the industrial and commercial sectors is more complex and can only be meaningfully
established on the basis of detailed surveys. In the agricultural sector the relationship between
depth and damage is related to the time of the year, the stage of development of the crop, the
type of crop and the length of time that critical water levels are exceeded.
Depth damage relationships can be extended to encompass frequency aspects such that
the overall value at risk can be expressed within an annual probability framework. However,
drawing indirect and secondary damages into such a model is extremely difficult while the
depth of inundation is simply just one aspect of the nature of the flood event that requires
consideration in the evaluation of overall costs. Some authors, for example Smith (2004),
argue that the other components of the flood hydrograph, such as duration, flow velocity
and turbulence are so highly correlated with inundation depth that they can be ignored. This
may be so for floods smaller river systems but as scale increases the argument becomes less
tenable. The 2000 flood in the Lower Mekong, which caused the most damage in decades was
characterised not by its peak discharge and maximum water levels, which were not extreme, but
by huge volumes of flood runoff throughout the flood season which resulted in unprecedented
durations of flooding which determined by far the greater proportion of the total losses.
Depth damage curves have not been applied to the assessment of flood costs and losses in
the Mekong region by the relevant national agencies who provide data based on surveys and
a loss per unit area approach. Meanwhile, research and pilot studies have been limited. Das
Gupta et al. (2004) estimated curves for flood damage assessment in the delta in Viet Nam
based on modelling the annual flood hydrograph on the Mekong mainstream at Kratie for
various recurrence intervals and then predicting the area inundated. Land use was classified
into four groups, namely residential, commercial, agriculture and infrastructure. Losses were
based on field surveys and included secondary costs such as those arising from the suspension
and reduction of commercial and industrial production. Potential agricultural losses were
determined using yield and average market crop value figures.
Despite what appeared to be a sound experimental design the damage figures obtained by
Gupta et al for flood conditions of various risks of occurrence are huge and bear no relationship
at all to those provided by the Vietnamese disaster management agencies. For example, they
Page 23
Annual Mekong flood report 2008
indicate that a 1:10 year event would generate damages to a total of US$54 billion, which is
indefensible. This figure compares to the official estimate of losses during the extreme flood
conditions of 2000 of US$50 million. The research results contend that 97% of these huge
potential losses lie in the commercial sector and it is here that the major errors appear to mainly
lie. For example, the authors propose that the economic value of commercial output losses after
the event amount to over 50% of annual production, which seems extreme.
Even the rate at which damage increases as an inverse function of flood frequency appears
to be unrealistic. Figure 3.2 shows the growth in agricultural flood damage in relation to flood
magnitude expressed in annual risk terms. The authors suggest that damage arising from a 100
year flood is just 15% higher than that for a 10 year event. Australian data on the other hand
indicate that flood damage in the agricultural sector arising from a 1:100 year event is at least
15 times larger than that for a 10 year event (Agricultural and Resource Management Council
of Australia and New Zealand).
1.7
1.6
1.5
a
tio 1.4
T=100 years
L
oss r 1.3
T=50 years
1.2
T=20 years
T=10 years
1.1
T=5 years
T=2 years
1.0
0
10
20
30
40
50
60
Annual exceedance probability
Figure 3.2 Growth in agricultural losses in the Mekong delta in Viet Nam as a function of flood
frequency, according to Das Gupta et al. (2004). These results imply that the losses
during a 100 year event are only 15% higher than those during a 10 year event, which
seems too low. Comparable results in Australia indicate a difference of the order of 15
times.
Haskoning (2008) undertook pilot socioeconomic surveys in nine focal districts in
Cambodia, Lao PDR and Viet Nam in order to establish depth damage data and provide a
basis upon which the potential cost benefits of flood management and mitigation measures
could be assessed. The Vietnamese provinces of Dong Thap and An Giang provide data for
the perennially flooded areas of the delta bordering Cambodia for which the depth damage
relationships are shown in Figure 3.3.
Page 24
Flood costs
An Giang: Direct and indirect damages and relief
Dong Thap: Direct and indirect damages and relief
damage
damage
100
t
50
t
40
80
30
40
20
Damage (US$ million)
20
Damage (US$ million)
10
2.5
3.0
3.5
4.0
4.5
5.0
Max water level at Chau Doc (m+mol)
Max water level at Tan Chau (m+mol)
An Giang: Direct and indirect damages housing
Dong Thap: Direct and indirect damages and housing
12
damage
damage
t
t
10
30
8
20
4
3
10
Damage (US$ million)
Damage (US$ million)
2
3.5
4.0
4.5
4.5
5.0
Max water level at Chau Doc (m+mol)
Max water level at Tan Chau (m+mol)
An Giang: Damages agriculture
Dong Thap: Damages agriculture
damage
damage
t
24
t
2
20
16
12
4
8
Damage (US$ million)
Damage (US$ million)
4
1.5
2.0
2.5
3.0
3.5
2.5
3.0
3.5
4.0
Max water level at Chau Doc (m+mol)
Max water level at Tan Chau (m+mol)
Figure 3.3 Sectoral flood damage curves for the Mekong Delta. (Source: Haskoning, 2008.)
· In each sector there is a threshold water level at which damage begins to accumulate,
which for infrastructure and residential properties is when levels observed at Tan Chau
and Chau Doc exceed 4 to 4.5 masl.
· Damage to agriculture begins at water levels that are 2 to 2.5 m lower indicating that
in these areas where the annual flood risk is high, property and service facilities are
generally elevated either on columns or more widely on embankments.
· The major component by far of overall damage is that caused within the infrastructure
sector.
· These damage curves were used to develop annual time series of flood costs back to 1910
using historical water levels observed in the delta, which in turn permitted an estimate of
the frequency distribution of annual flood damage to be derived (Figure 3.4) for the two
delta provinces.
Page 25
Annual Mekong flood report 2008
Province damage probability curve
160
An Giang province
140
Dong Thap province
120
i
l
i
o
n
)
100
S
$ m
U 80
g
e (
60
a
ma
D 40
20
0
0%
10%
20%
30%
40%
50%
60%
70%
80%
90%
100%
Probability exceedance
Figure 3.4 Frequency distribution of annual flood damage in the Mekong Delta.
(Source: Haskoning, 2008)
Similar results are available for the pilot study areas in Cambodia and Lao PDR. Such is
the spatial complexity of flood conditions in the Mekong region and the geographical variation
in land use that these results cannot realistically be generalised. They do, however, provide far
reaching insights into the nature and structure of flood damage within key areas such as the
delta in Viet Nam, the Cambodian flood plain and those extensive areas in Lao PDR that are
vulnerable to backwater flood effects between the large tributaries and the Mekong mainstream.
Not least they enable the cost benefits of flood mitigation measures within these vulnerable
areas to be established with a considerable degree of confidence.
3.3 The regional history and pattern of flood damage
For the Lower Mekong Basin as a whole history reveals that some order of flood damage occurs
in almost every year on a scale which varies between that caused by local flash flooding to
that arising from large scale regional events, often classified as natural disasters, such as the
flood of 2000 and to a lesser extent that of 2008. Even though annual damage data have been
systematically collected for quite a number of years assembling them into a coherent series
on the basis of which, for example, trends in regional flood losses could be reliably evaluated
is difficult. The historical figures have to be adjusted to net present value, damage and loss
surveys are improving constantly, the value of the property and inventory at risk is increasing,
the improved levels and therefore the financial costs of emergency response are growing and as
the regional socio-economy and services provision develops the order of secondary damage is
increasing year by year as a proportion of total damage.
Page 26
Flood costs
Figure 3.5 to Figure 3.8 show the annual flood damage for each of the four riparian countries
over the years for which data are available.
60
o
n
) 50
i
lli
S
$ m 40
U
a
g
e (
30
a
m
o
o
d d 20
a
l
n
nu 10
A
0
1970
1980
1990
2000
Figure 3.5 Lao PDR, annual flood damage 1966 2008. (Sources: www.internationalfloodnetwork.org
and Lao National Flood Report, 2008.)
400
o
n
)
i
lli 300
S
$ m
U
a
g
e (
a
m 200
o
o
d d
a
l 100
n
nu
A
0
1990
1995
2000
2005
Figure 3.6 Thai Mekong region, annual flood damage 1989 2008. (Sources: Thai Disaster
Mitigation Centre, Department of Disaster Prevention and Mitigation and Ministry
of Interior.)
Page 27
Annual Mekong flood report 2008
175
150
o
n
)
i
lli
125
S
$ m
U
100
a
g
e (
a
m
75
o
o
d d
50
a
l
n
nu
A 25
0
1996
1998
2000
2002
2004
2006
2008
Figure 3.7 Cambodia, annual flood damage 1996 2008. (Source: Cambodian National
Committee for Disaster Management.)
250
o
n
)
i
lli 200
S
$ m
U 150
a
g
e (
a
m
100
o
o
d d
a
l
50
n
nu
A
0
1995
2000
2005
Figure 3.8 Mekong Delta, Viet Nam, annual flood damage 1995 2008. (Sources CCFSC,
MARD and MONRE)
· Although data for Lao PDR are available since 1966 it is unlikely that those prior to
1990 are particularly reliable. There is certainly a break in their pattern and magnitude
at this point. Since 1990 the average annual flood costs have been of the order of US$10
million. The cost of the 2008 event are estimated to be US$55 million, by far the largest
over the period and far larger than those of 1966 when the central business districts of
Vientiane were flooded. If these 1966 figures were adjusted to contemporary values they
would probably be at least comparable to or possibly exceed those of 2008.
Page 28
Flood costs
· The data for the Thai Mekong region from 1989 onwards indicate an average annual
flood damage figure of US$16 million. The fact that significant flood damage occurs
almost every year reflects the perennial incidence of flash floods in the northern provinces
around Chiang Rai and the fact that considerable areas of the low lying Mun Chi Basin
are inundated annually to some extent.
· In Cambodia and the delta in Viet Nam the financial losses related to the 2000 event is
the dominant feature in the recent history of flood damage. Though average annual losses
are difficult to assess from the available data, as a tentative estimate a figure of US$25
million is adopted for both.
These figures translate into an annual average total figure for regional flood damage of
US$76 million, close to the figure for 2004 which may be considered to be an average flood
year. The figure is distributed as indicated in Figure 3.9.
Cambodia
US$25 mil ion
US$25 mil ion
Lao PDR
Thailand
Viet Nam
US$10 mil ion
US$16 mil ion
Figure 3.9 Indicative distribution of average annual regional flood costs of US$76 million.
The picture changes if the figures are expressed as a proportion of regional GDP (the total
annual value of all goods and services produced) in that part of each country that lies within the
Lower Mekong Basin (Table 3.1).
On this basis the average annual flood damage inflicted on the national economies is highest
in Cambodia and Lao PDR, the least developed countries. This would appear to confirm the
widely held view that the proportional economic losses to natural hazards such as floods is
greater in poorer societies which are more vulnerable.
Page 29
Annual Mekong flood report 2008
Table 3.1 Average annual flood damage occurring within the Mekong region as a proportion of
national GDP.
Country
National GDP
Lower Mekong Basin GDP Average annual flood damage as
(US$ billion)
(US$ billion)
a proportion of National GDP
generated in the Lower Mekong
Basin
Cambodia
8.7
8.0
0.29%
Lao PDR
4.0
4.0
0.25%
Thailand
246.0
22.0
0.07%
Viet Nam
85.0
25.5
0.09%
Total LMB
60.2
Notes: (i) National GDP is based on World Bank figures for 2007. (ii) GDP for Lower Mekong Basin were computed as
follows. Since they lie almost entirely within the LMB it can be assumed that the national figures for Cambodia and Lao
PDR apply. For Viet Nam 30% of national GDP is generated in the Delta (General Statistics Office, Viet Nam). In the
case of Thailand the figure is based upon statistics given in Huang and Bocchi (2008) that show that in NE Thailand per
capita GDP is 30% of the national average of US$2,500. Given a population of 25 million in the NE provinces within
the Mekong Basin plus a further US$1.5 million in the area of northern Thailand within the basin then the estimate Thai
Mekong GDP becomes US$22 billion, less than 10% of the national figure.
Losses as a proportion of GDP under extreme flood conditions obviously cause even greater
economic damage, the benchmark measure for which in recent times were the events of 2000
which were centred on the southern areas of the basin in Thailand, Cambodia and Viet Nam.
Total damage was estimated to be US$695.5 million, or 1.34% of regional GDP. The flood
of 2008 was less extensive, confined to the northern parts of the basin and generated far less
damage in value terms. Never the less the costs to Lao PDR of US$56 million amounted to
1.4% of GDP.
Cambodia
US$161 mil ion
Lao PDR
Thailand
US$242 mil ion
US$1 mil ion US$6 mil ion
Viet Nam
US$12.5 mil ion
US$72 mil ion
US$56 mil ion
US$280 mil ion
2000
2008
US$695.5 million
US$135 million
Figure 3.10 Mekong floods in 2000 and 2008 proportional and total damage.
Although the major flood events of recent history and the associated losses are linked
to extreme flows on the Mekong mainstream it would be wrong to suggest that they have
Page 30

Flood costs
exclusively determined the historical pattern of annual flood damage. Throughout the region
annual damage is linked to a diversity of flood conditions and cannot be related to a single
regional hydrological or meteorological index as Figure 3.11 confirms. The annual cost of flood
damage in Lao PDR is clearly not simply a function of the magnitude of the Mekong flood
expressed in terms of peak discharge, though the exceptional mainstream peak flows and water
levels of 2002 and 2008 did account for the largest losses in recent decades. During other years,
however, the national costs of flood damage are independent of hydrological conditions in the
Mekong mainstream and might arise from local tributary floods, upland flash flooding or simply
an accumulation of damage during a strong SW Monsoon when a larger than average number of
severe tropical storms might occur.
25000
2002
2008
i
e
n
t
i
a
n
e
t V
20000
i
s
c
h
a
r
g
e a
e
c
s
)
15000
e
a
k d (cum
n
n
u
a
l p
10000
e
k
o
n
g a
M
5000
0
10
20
30
40
50
60
Lao PDR annual ood damage
(US$ mil ion)
Figure 3.11 Scatter plot of the `relationship' between annual maximum discharge on the Mekong at
Vientiane and the reported annual flood damage in Lao PDR over the years from 1990 to
2008.
Figure 3.12 Urban flooding Vientiane, Lao PDR, August 2008.
Even in Cambodia and the Delta where annual flood damage would be expected to be more
directly linked to flow conditions on the mainstream there is no single hydrological measure
Page 31
Annual Mekong flood report 2008
that can be systematically linked to the losses (Figure 3.13). Factors other than peak and volume
play an important role such as the duration of water levels above critical thresholds and the time
of the year that crops are submerged.
60000
2001
1996
2000
e
c
s
)
50000
c
u
m
e
a
k (
40000
F
l
o
o
d p
30000
0
100
200
300
400
500
Flood damage (US$ mil ion)
500
2000
2001
)3
K
m
400
e (
1996
o
l
u
m
300
F
l
o
o
d v
200
0
100
200
300
400
500
Flood damage (US$ mil ion)
Figure 3.13 Total annual flood damage (1996 2008) in Cambodia and the delta in Viet Nam in
relation to the peak and volume of the annual flood hydrograph recorded at Kratie.
3.4 The composition of flood losses
It is standard practice to breakdown total flood damage into that occurring within the
various economic sectors, usually domestic, commercial and agricultural:
· The domestic category includes private housing and small commercial businesses carried
out from home such as family shops.
Page 32
Flood costs
· Commercial/services covers industrial premises, schools, hospitals, roads, bridges and
services such as power and telecommunications facilities.
· Agriculture covers crops, livestock, aquaculture losses and damage to irrigation
infrastructure.
Although based on local but detailed surveys, the results available in Haskoning (2008)
clearly indicate that there are significant regional distinctions in the composition of overall
damage which reflect differences in population density, the degree of urbanisation and the
structure of local socioeconomics(Figure 3.14).
Infrastructure
Housing
Agriculture
Lao PDR
Cambodia
Mekong Delta
Nongbok district
Takeo, Kandal and Pray Veng
An Giap and Dong Tha
provinces
provinces
Figure 3.14 Proportion (%) of total flood damage by sector during 2000. Source: local survey data
given in Haskoning (2008).
· In Lao PDR the result refers to Nongbok district at the confluence of the Se Bang Fai
River and the Mekong. The data therefore represent the composition of overall flood
damage in rural areas where `backwater flooding' of riparian lands is a major hazard and
which is a major cause of annual flood losses in the country in most years. Damage to
agriculture accounts for over 90% of the total in these less well developed rural areas
where commercial and service infrastructure is limited. The result is probably indicative
of the composition of flood damage costs over the greater part of Lao PDR with the
exception of the larger towns and cities adjacent to the Mekong such as Vientiane and
Luang Prabang. The distribution of losses during the August 2008 event would not
therefore follow this pattern since the major impacts were felt in these large urban
centres.
· In Cambodia the data were aggregated from surveys undertaken in three provinces and
again the pattern of the overall loss is arguably indicative for the country as a whole
outside of major urban centres. Since the surveyed districts have a higher population than
Nongbok in Lao PDR the proportional losses to infrastructure and housing are that much
higher but damage to the agricultural sector (63%) still dominates.
Page 33
Annual Mekong flood report 2008
· In the Mekong Delta in Viet Nam the picture changes completely. Here the population
density is extremely high with a large proportion living in urban centres at risk
from regular flood inundation. Commercial and service infrastructure losses (62%)
predominate with agricultural damage falling to just 16% of the total. One major
contributory factor is that the secondary commercial and industrial losses, that is the
financial costs due to the suspension of economic activity and reduced levels of service
provision, are high and continue for a considerable period after the floodwaters recede.
Another factor that contributes to the lower relative agricultural losses is that drought
and salinity are now considered to be a greater threat to rice yields and production than
floods in the delta due to the adoption of hybrids that can withstand longer periods of
submergence (Buu and Thi Lang, 2003).
A survey of businesses in the same sample districts sought to estimate the relative levels
primary and secondary losses, the results for which are shown in Figure 3.15. The higher to
replace it and repair any structural secondary losses in Cambodia possibly reflect the fact
that stock and inventory values are lower than in Viet Nam and once stock is lost the ability
to replace it takes much longer given greater financial constraints. Consequently ongoing
secondary damage accumulates over a longer period of time and therefore comprises a higher
proportion of the total loss.
100
Primary losses as % of total
75
Seconadry losses as % of total
50
25
0
Delta
Cambodia
Lao PDR
Figure 3.15 Primary and secondary flood losses as a proportion of total damage for business
enterprises. Source: district survey data available in Haskoning (2008).
Page 34
4. Comparing the costs and benefits of the annual flood
4.1 General observations
Comparing the costs and benefits of the annual Mekong flood is difficult. Some level of benefit
accrues in all years but significant costs do not. For costs to arise the flood, in terms of peak
discharge and water levels, has to exceed a certain threshold. The costs are then a function of
the magnitude of the exceedance and the consequent depth of inundation, its duration and areal
extent and the value at risk in the flooded areas. The latter is highest over the Cambodian flood
plain and the delta. Average annual regional flood costs do not therefore provide a statistic that
is directly comparable to the financial benefits, which in any case are systematically increasing,
particularly in the agricultural sector.
However, a generalized comparative assessment is useful in that it reveals just how much
larger the benefits are compared to the much more often quoted figures regarding costs. For
example, the annual value figure for the regional fishery of US$2.85 billion refers only to that at
the first point of sale. In comparison, the estimated annual costs of flood damage in an average
year such as 2004 only amount to US$76 million or just 2.5% of the fisheries benefit alone.
The additional benefit figures for the agricultural benefits are harder to assess since the
linkage between the annual flood is not as clear as it is with the fishery. Flood recession rice
production in Cambodia is reported to account for 32% of national production, valued at US$
3.1 billion in 2006, based on a February 2009 international price of US$ 500/tonne The value of
the agricultural benefit accruing directly from the flood in Cambodia is therefore US$3.1 billion
x 0.32 = US$1 billion. Even if the value figure is reduced to a farm gate price of (say) US$100/
tonne the benefit still amounts to US$200 million
In the delta in Viet Nam agricultural production in 2004 had a reported market value
of US$3.5 billion. That this is a benefit of the flood is based on the argument that the 9 to
13 millions tonnes of sediment deposited annually across the delta, most of it during the
flood season, has over millennia resulted in some of the most productive agricultural land in
Southeast Asia, thus establishing the link.
Table 4.1 summarises the relative benefits and costs of the annual flood on this simple basis.
Costs in terms of loss and damage are quoted both for an average year (2004) and for 2000,
which witnessed the most extreme regional flood losses of recent decades.
Page 35
Annual Mekong flood report 2008
Table 4.1 Relative costs and benefits of the annual Mekong flood
Annual flood
Annual flood costs
Costs as % benefit
benefit
(US$ million)
(US$ billion)
Average year
Extreme year
Average year
Extreme year
(2000)
(2000)
7.35
76
811
1%
11%
Note: he benefits refer only to the sum of the value capture fishery and other aquatic products and the annual value of flood
linked agricultural output in Cambodia and Viet Nam).
4.2 Incremental figures
The comparative assessment undertaken here does not pretend to be an economic study of
the costs and benefits of the annual Mekong flood. It is simply a statement of the degree to
which the benefits exceed the costs by a very large margin, a fact not widely recognised. Many
working assumptions have had to be made, so the figures should not be taken as definitive.
Rather they should be seen in comparative rather than absolute terms.
To take these results any further would require a data base that is simply not available.
Although a reasonable estimate of the total regional flood damage and losses over the
last decade can be achieved this is not the case with regard to the benefit data. The major
component of the overall financial benefit of the flood is the annual value of the Mekong
fishery. The linkage to the annual flood is clear since the seasonal inundation of the flood plain
in Cambodia provides a huge biomass for fish reproduction and growth. However, accurate year
on year catch value figures for the fishery are not available. Only the annual dai fishery catch
is monitored and this refers to just one element of the regional fishery and in fact to just one
fishing gear type, namely the `bag net'. This lack of data prescribes any incremental assessment
of the benefits and losses of the flood.
Page 36
5. The 2008 flood season
5.1 General observations
Flood conditions in the Lower Mekong Basin during 2008 were amongst the most extreme since
records began and will be viewed along with those of 1966, 1971, 1978, 2000, 2001 and 2002
as defining the character and magnitude of severe flood conditions on the mainstream. Like the
extreme events that have been observed in the past, conditions in 2008 were geographically
confined to just a part of the Basin, in this case the areas upstream of Vientiane and Nong Khai.
Only in 2001 were exceptional flood conditions basin-wide in any sense. The more typical
pattern is for exceptionally high flows to be confined to either the reach upstream or that
downstream of Vientiane, which represents a `hydrological discontinuity' between the two. To
the north the flood hydrology is determined by flows out of China and the contributions of the
large tributaries systems such as the Nam Tha, Nam Ou and Nam Khan. The significance of
these inflows then diminishes further downstream as the large left bank tributaries, specifically
those in Lao PDR, begin to exert their dominant influence.
This hydrological discontinuity is readily apparent in Figure 5.1 which presents a
classification of the annual flood at 10 sites between Chiang Saen and Kratie for the years
from 1960 to 2008. The pattern comes about since factors of scale generally preclude weather
generating mechanisms, even those at the synoptic scale1 such as tropical cyclones and other
intense low pressure systems, from influencing flood runoff over the Basin as a whole. The area
of the Basin is many orders of magnitude greater than the area of influence of such weather
systems as they pass over it from east to west. Those associated with the large flood events have
historically tracked across the region either to the north or south thus bringing about the distinct
geographical pattern evident in Figure 5.1.2
The flood of 2008 centred around events during the first half of August when Tropical
Storm Kammuri moved across the northern regions of the Lower Basin and the extreme south
of Yunnan. In common with most other notable flood seasons there was really only one such
weather system which turned what were up to that date fairly average hydrological conditions
into those that were exceptional. The point should also be made that 2008 was a strong La Nińa
year generally associated with enhanced tropical cyclone activity in the western Pacific.
Conditions further south in the Basin were very much below average, with peak water levels
and discharges at Kratie and further downstream pointing to a relatively weak SW Monsoon.
1 Synoptic scale refers to migratory weather systems with a horizontal dimension greater than 1,000 km, such as tropical cyclones.
2This geographical pattern is discussed in further detail in the Annual Mekong flood report 2006 on pages 11 to 13
Page 37
Annual Mekong flood report 2008
Station
Chiang
Luang
Chiang
Saen
Prabang
Khan
Vientiane
Nakhon
Phanom Mukdahan
Khong
Chiam
Pakse
Stung
Treng
Kratie
1960
1961
1962
1963
1964
1965
1966
1967
1968
1969
1970
1971
1972
1973
1974
1975
1976
1977
1978
1979
1980
1981
1982
1983
1984
1985
1986
1987
1988
1989
1990
1991
1992
1993
1994
1995
1996
1997
1998
1999
2000
2001
2002
2003
2004
2005
2006
2007
2008
Key
Below average
Above average
flood
Mean
flood
Extreme
Significant
Normal
Normal
Significant
Extreme
Figure 5.1 The `historical geography' of the annual flood on the Mekong mainstream (1960 2008)
between Chaing Saen and Kratie.
Page 38
The 2008 flood season
5.2 Meteorological conditions
From a meteorological perspective, conditions within the annual Mekong flood season should
be assessed with respect to two aspects:
· The intensity of the SW monsoon in terms of cumulative rainfall and the creation of
saturated soil moisture conditions which maximise flood runoff. In some years it is
this effect combined with a strong Monsoon which generates exceptional volumes of
floodwater and extremely damaging levels of flood inundation. This was the case in 2000,
particularly across the Cambodian flood plain and the Delta in Viet Nam.
· The incursion of tropical cyclones and tropical storms into the basin which historically,
given already saturated catchments, have produced most of the highest observed water
levels and flood discharges. The events of 2008 are a case in point.
The timing of the regional onset and end of the SW Monsoon is remarkably consistent
from year to year, with a typical standard deviation of only one to two weeks. The data for the
locations indicated in Table 5.1 are based upon criteria applied in India by Khademul et al.
(2006). The annual onset of the SW Monsoon may be defined as the week during which more
than 20 mm of rainfall occurs within 1 or 2 consecutive days, provided that the probability
of at least 10 mm of rainfall occurring in the subsequent week is more than 70%. The latter
component of the criterion screens out isolated storm events earlier in the year that do not fully
indicate the start of `true' monsoonal conditions. The date of monsoon withdrawal is defined as
the day up to which at least 30 mm of rainfall accumulates over a sequential seven day period,
with no subsequent rainfall for at least 3 consecutive weeks.
Table 5.1 The onset and end of the SW Monsoon at selected sites in the Lower Mekong Basin.
Site
Monsoon onset
Monsoon withdrawal
Average
Standard
2008
Average
Standard
2008
Date
Deviation
Date
Deviation
Chiang Saen
7th May
9 days
3rd May
7th Nov
25 days
24th Oct
Luang Prabang
7th May
9 days
28th April
24th Oct
33 days
3rd Nov
Vientiane
4th May
8 days
27th April
10th Oct
16 days
3rd Nov
Pakse
5th May
11 days
28th April
15th Oct
17 days
3rd Nov
Tan Chau
11th May
7 days
7th May
17th Nov
14 days
26th Nov
The onset of the Monsoon typically occurs within a remarkably narrow period of time
in May. It withdraws usually during October in the more central areas of the Basin and in
November in the north (Chiang Saen) and south (Tan Chau) where there tend to be wider
variability from year to year. During 2008 the onset and end dates were within the characteristic
range. The early withdrawal of the Monsoon, as happened in 2004 when the rains ceased a
month earlier than usual can precipitate serious drought conditions due to depleted soil moisture
for crops that rely on late seasonal rainfall.
Page 39
Annual Mekong flood report 2008
From a temporal perspective therefore, Monsoonal conditions during 2008 appear to have
been typical across the region. In terms of total seasonal rainfall the general picture is one of an
average year (Figure 5.2), though with the expected significant exceptions1. However, drawing
basin wide conclusions from such a small sample of data could be misleading, particularly when
the spatial variation of rainfall is high, even at the local scale. Nonetheless the indications are
that:
· Total annual rainfall at Chiang Saen, Luang Prabang, Chaing Khan and Tan Chau were
average and over the year as a whole accumulated according to a typical pattern;
· At Vientiane, the total rainfall for 2008 of 2,200 mm would define the year as extremely
wet, while;
· At Pakse the annual total was significantly below normal.
The definitive meteorological event of 2008 was the incursion into the northern regions of
the Basin of tropical cyclone Kammuri during the first week of August which produced extreme
water levels and volumes of runoff in the Mekong mainstream, particularly at Luang Prabang
and Vientiane. However, the rainfalls observed in August at those sites in the north for which
data are available, namely Chiang Saen, Luang Prabang, Chiang Khan and Vientiane do not
reflect the extreme levels of precipitation that must have occurred in the wider northern sub
region. This reflects the fact that the regional rain gauge network is most sparse in those remote
areas that receive the highest rainfall on average and which generate the major volumes of flood
runoff.
The track of cyclone Kamurri is shown in Figure 5.3 and the associated storm rainfall, based
upon satellite imagery, shown in Figure 5.4:
· In the Lao PDR most rainfall occurred upstream of Luang Prabang. Accumulated rainfall
over the nine days between the 6th and 14th of August was generally between 100 and
150 mm, though locally the figures were as high as 200 250 mm.
· In Yunnan the cumulative rainfall was similar and generally confined the extreme south,
downstream of Jinghong.
These areas therefore generated virtually all of the consequent flood runoff, while elsewhere
in the Basin the rainfall was much more scattered and not directly linked to Kammuri.
Although as expected regional catchments were all saturated at this stage of the flood season
(Figure 5.5) which would have enhanced the levels of storm runoff, the extend and magnitude
of the rainfalls indicated in Figure 5.4 appear to be modest compared to the volumes of flood
runoff that were subsequently generated. This observation may be seen as supporting the
1 Sufficient data for the year of interest, in this case 2008, in order to produce a basin-wide map of the seasonal rainfall were not
available in time for this report., while issues of data quality arose for those records that were received, such that only a few could
be used with confidence,
Page 40
The 2008 flood season
emerging view that the satellite data do indeed underestimate regional storm rainfall which
makes accurate flood forecasting more difficult. There is therefore a need for improved `ground
truthing' of satellite based estimates of storm rainfall and in particular the expansion of the
sparse rainfall observation network in northern and eastern Lao PDR.
Chiang Saen
Luang Prabang
2500
2000
Extremely wet
>2250 mm
Extremely wet
>1900 mm
Signi cantly wet >2000 mm
Signi cantly wet >1550 mm
)
Average
=1750 mm
)
Average
=1250 mm
m
m
2000
Signi cantly dry <1430 mm
1600
Signi cantly dry <900 mm
m
m
Extremely dry
<1150 mm
Extremely dry
<600 mm
2008
=1800 mm
2008
=1300 mm
a
i
n
f
a
l
l (
a
i
n
f
a
l
l (
1500
1200
a
i
l
y r
a
i
l
y r
1000
800
u
l
a
t
i
v
e d
u
l
a
t
i
v
e d
m
m
500
400
C
u
m
C
u
m
0
0
Jan Feb Mar Apr May Jun Jul Aug Sep Oct Nov Dec
Jan Feb Mar Apr May Jun Jul Aug Sep Oct Nov Dec
Chiang Khan
Vientiane
2000
2500
Extremely wet
>1700 mm
Extremely wet
>2200 mm
Signi cantly wet >1480 mm
Signi cantly wet >1930 mm
)
)
Average
=1250 mm
Average
=1650 mm
m
m
1600
Signi cantly dry <1020 mm
m
m 2000
Signi cantly dry <1400 mm
Extremely dry
<790 mm
Extremely dry
<1100 mm
2008
=1200 mm
2008
=2200 mm
a
i
n
f
a
l
l (
1200
a
i
n
f
a
l
l (
1500
a
i
l
y r
a
i
l
y r
800
1000
u
l
a
t
i
v
e d
u
l
a
t
i
v
e d
m
m
400
500
C
u
m
C
u
m
0
0
Jan Feb Mar Apr May Jun Jul Aug Sep Oct Nov Dec
Jan Feb Mar Apr May Jun Jul Aug Sep Oct Nov Dec
Pakse
Tan Chau
3000
2000
Extremely wet
>2800 mm
Extremely wet
>1450 mm
Signi cantly wet >2450 mm
Signi cantly wet >1350 mm
)
Average
=2100 mm
)
Average
=1250 mm
m 2500
m
Signi cantly dry <1700 mm
m
m 1600
Signi cantly dry <1150 mm
Extremely dry
<1350 mm
Extremely dry
<1050 mm
2008
=1750 mm
2008
=1250 mm
2000
a
i
n
f
a
l
l (
a
i
n
f
a
l
l (
1200
a
i
l
y r
a
i
l
y r
1500
800
u
l
a
t
i
v
e d
1000
u
l
a
t
i
v
e d
m
m
400
C
u
m
500
C
u
m
0
0
Jan Feb Mar Apr May Jun Jul Aug Sep Oct Nov Dec
Jan Feb Mar Apr May Jun Jul Aug Sep Oct Nov Dec
Figure 5.2 Cumulative annual rainfall during 2008 at selected sites in the Lower Mekong Basin.
(Extremely wet and dry conditions are defined as plus/minus 2 SD, and significantly wet
and dry as plus/minus 1 SD.)
Page 41

Annual Mekong flood report 2008
Upper Mekong Basin
Lower Mekong Basin
Manwan
Operational mainstream dams
Dachaoshan
Hydrological station
Jinghong
Path of Tropical Storm Kam
Viet Nam
muri
Chiang Saen
Lao PDR
Luang Prabang
Vientiane
Mukdahan
Thailand
Pakse
Bangkok
Cambodia
Kratie
Phnom Penh
Ho Chi Minh City
Chau Doc
Tan Chau
0
200 kilometres
Figure 5.3 Track of tropical storm Kammuri first week of August, 2008. (Map based upon data
obtained from the Hong Kong Meteorological Bureau http://weather.gov.hk.)
Upper Mekong Basin
Lower Mekong Basin
Mekong mainstream
Hanoi
Vientiane
Cumulative rainfall (mm)
0-5
5-10
Bangkok
10-20
20-40
40-60
60-80
Phnom Penh
80-100
100-150
Ho Chi Minh City
150-200
200-250
250-300
300-350
350-400
> 400
0
200 kilometres
Figure 5.4 Accumulated rainfall over the Mekong Region: 6th to 14th August 2008. (Based on
data provided on a daily basis by the United States National Oceanic and Atmospheric
Administration to the MRC).
Page 42
The 2008 flood season
1-10 August 2008
Percent soil moisture (%)
90 - 100
80 - 90
70 - 80
60 - 70
50 - 60
40 - 50
30 - 40
20 - 30
10 - 20
0 - 10
no data
Figure 5.5 Regional soil moisture conditions during early August 2008, indicating that catchments
were saturated. This would have maximised the flood runoff that resulted from tropical
storm Kammuri. (Source: USDA, http://gcmd. nasa.gov/records/ GCMD_USDA _FAS_
Percent_Soil _Moisture.html.)
5.3 Temporal aspects of the 2008 Mekong flood season
Defining as usual, the onset of the flood season as the first sustained `up-crossing' of the mean
annual discharge and its end as the last `down-crossing' the figures in Table 5.2 indicate that
in the middle reaches, at Vientiane and Pakse the 2008 seasonal onset was two to three weeks
early. Elsewhere, the timing of the start was `normal' while throughout the Basin the season
ended just two weeks later than average.
Table 5.2 Start and end dates of the 2008 flood season compared to their historical mean and
standard deviation at selected mainstream locations.
Site
Onset of flood season
End of flood season
Historical
Standard
2008
Historical
Standard
2008
average
deviation
average
deviation
Chiang Saen
28th June
13 days
27th June
14th Nov
14 days
22nd Nov
Vientiane
3rd July
14 days
15th June
11th Nov
15 days
21st Nov
Pakse
29th June
16 days
9th June
5th Nov
11 days
20th Nov
Kratie
1st July
16 days
5th July
7th Nov
12 days
20th Nov
Note: Levels for Vientiane were recorded at the river gauge at Kilometre 4.
Page 43
Annual Mekong flood report 2008
The importance of employing a meaningful definition of the onset and end dates of the flood
season was amply demonstrated in 2007. Then the onset of flood season conditions in the latter
part of July and the first week of August was the latest observed in the last 80 to 90 years. As
a consequence the low water levels observed during most of July were unprecedented and had
negative impacts upon the environment, fisheries, agriculture and navigation.
5.4 Water levels
The water level at reached Vientiane on the 15th of August was the highest recorded since
records began in 1913. At 171.7 masl it was 1 m more than the maximum levels achieved in
1966, 1971 and 2002 (Table 5.3). Conversely, upstream at Chiang Saen and Luang Prabang the
2008 maximum water levels were lower than those experienced in 1966 and by as much as 3 m
at Chiang Saen.
The much higher 1966 water levels at Chiang Saen point to the fact that in September 1966
tropical storm Phyllis tracked further north than did Kammuri in 2008. So while much of the
floodwater in 1966 originated in Yunnan, in 2008, by far the major contribution appears to have
come from the large left-bank tributaries in northern Lao PDR such as the Nam Tha, Nam Ou
and Nam Khan. It is also worth noting that the rapid water level rise at Luang Prabang occurred
one day before water levels rose at Man An tributary station in China. This also strongly
suggests that the flood event was primarily caused by heavy rainfall in the basins of the Mekong
tributaries in northern Lao PDR.
Table 5.3 Comparative annual maximum historical flood water levels at Chiang Saen, Luang
Prabang, and Vientiane.
Year
Maximum water level achieved (masl)
Chiang Saen
Luang Prabang
Vientiane
1924
No data
No data
170.7
1929
170.4
1942
170.2
1966
370.9
289.6
170.7
1970
366.9
285.0
170.2
1971
368.1
287.4
170.5
2002
367.5
285.1
170.6
2008
367.7
287.6
171.7
As further confirmation of this, Figure 5.7 indicates that water levels during August remained
below the flood warning and inundation levels at Chiang Saen but at Luang Prabang, Vientiane
and Nong Khai the flood inundation levels were exceeded for up to 10 days and by considerable
margins. Downstream of Nong Khai and towards Nakhon Phanom there were no significant
additional contributions to these floodwaters that largely originated in Northern Lao PDR such
Page 44

The 2008 flood season
that at Nakhon Phanom itself the maximum water levels reached in 2008 fell well short of the
alarm level.
Figure 5.6 The extent of flooding across Vientiane on the 1st September 1966, indicating the
potential disaster that was averted by the prompt actions taken during mid August, 2008.
Chiang Saen
Luang Prabang
369
288
Maximum ood level: 287.6 masl (13th August)
Maximum ood level: 367.7 masl (12th August)
287
368
Flood level: 368.9 masl
Flood alarm level: 368.9 masl
286
367
285
366
284
el (masl)
el (masl)
Flood level: 285.2 masl
283
Flood alarm level: 284.7 masl
365
a
t
er lev
a
t
er lev 282
W
W
364
281
363
280
0
5
10
15
20
25
30
0
5
10
15
20
25
30
August 2008
August 2008
Vientiane
Nong Khai
172
168
Maximum ood level: 171.7 masl
Maximum ood level: 167.2 masl (15th August)
(15th August)
171
167
170
166
el (masl)
el (masl)
169
Flood level: 170.5 masl
165
a
t
er lev
Flood alarm level: 169.5 masl
a
t
er lev
W
W
Flood level: 165.8 masl
168
164
Flood alarm level: 165.0 masl
167
163
0
5
10
15
20
25
30
0
5
10
15
20
25
30
August 2008
August 2008
Nakhon Phanom
146
145
144
Flood level: 145.4 masl
Maximum ood level: 143.7 masl (17th August)
el (masl)
Flood alarm level: 145.3 masl
143
a
t
er lev
W 142
141
0
5
10
15
20
25
30
August 2008
Figure 5.7 August 2008 water levels on the Mekong mainstream between Chiang Saen and Nakhon
Phanom compared to flood alarm levels.
Page 45
Annual Mekong flood report 2008
At Pakse the flood alarm level was reached for a few days following the 14th of August,
whereas at Kratie maximum flood levels peaked 1 m below the alarm level. In the Delta at Tan
Chau and Chau Doc the alarm stage was exceeded from early August to late November but such
conditions occur even in an average flood year, given the low lying nature of the landscape.1
5.5 Flood discharges and flood volumes
Following up the similarity between the floods of 1966 and 2008, Figure 5.8 shows the
comparative discharge hydrographs for the two years at Chiang Saen, Luang Prabang and
Vientiane:
Chiang Saen
Luang Prabang
30000
30000
25000
25000
1966
s
e
c
s
)
1966
s
e
c
s
)
2008
c
u
m 20000
c
u
m 20000
15000
15000
i
s
c
h
a
r
g
e (
2008
i
s
c
h
a
r
g
e (
a
i
l
y d
10000
a
i
l
y d
10000
e
a
n d
e
a
n d
M 5000
M 5000
Mean annual discharge
Mean annual discharge
3900 cumecs
2700 cumecs
0
0
Jan
Feb
Mar
Apr
May
Jun
Jul
Aug
Sep
Oct
Nov
Dec
Jan
Feb
Mar
Apr
May
Jun
Jul
Aug
Sep
Oct
Nov
Dec
Vientiane
30000
1966
25000
s
e
c
s
)
2008
c
u
m 20000
15000
i
s
c
h
a
r
g
e (
a
i
l
y d
10000
e
a
n d
M 5000
Mean annual discharge
4600 cumecs
0 Jan Feb Mar Apr May Jun Jul Aug Sep Oct Nov Dec
Figure 5.8 Mekong at Chiang Saen, Luang Prabang and Vientiane comparative 1966 and 2008 daily
discharge hydrographs.
· At Chiang Saen the 2008 event does not compare with that of 1966 either in terms of peak
discharge or flood volume, underscoring the fact that in 2008 outflows from China were
not a major contributory factor, but were in 1966. Never the less the maximum discharge
reached on the 12th of August 2008 of 13,300 cumecs has only been exceeded three times
in 1966, 1970 and 1971 since records began in 1960. As will be seen, the peak discharge
of 23,500 cumecs in 1966 was a huge outlier in the time series of annual maxima at
Chiang Saen.
1 Flood warning levels in the Delta were set before much of the flood protection infrastructure was completed. They are currently
recognised as too low and are under review.
Page 46
The 2008 flood season
· At Luang Prabang and Vientiane on the other hand the two events are similar both in
terms of peak and volume.
At Chiang Saen and Luang Prabang the relationship between peak water level and discharge
is consistent, both were higher in 1966. Conversely, at Vientiane although the water level
reached in 2008 was 1 m higher than that of 1966, the discharge was slightly less. In 1966 peak
flood discharge was 26,000 cumecs, while that in 2008 was 23,500 cumecs. The explanation lies
with the flood protection works that were undertaken after 1966 on both the Thai and Lao banks
of the river, subsequent to the inundation of Vientiane, Si Chiang Mai and Nong Khai. These
works involved raising flood protection levees that contain the river within its channel up to 14
m above the gauge datum or 172 masl. This explains why for a given discharge water levels are
now higher and why the river did not overtop its banks and inundate central Vientiane as it did
in 1966.
Further downstream the severity of the flood conditions of August 2008 dissipated since
the mainstream tributary inflows downstream of Vientiane were average or below. Figure 5.9
indicated that at Chiang Saen the peak discharge in August is more than twice the average
discharge for the month but with the exception of further higher periods of flow in September
and November daily flows over the rest of the year were close to average. At Vientiane
discharges were way above normal throughout the major part of the flood season but by the time
the river reached Kratie the annual flood hydrograph as a whole for 2008 was unexceptional,
with below normal flood volumes.
Chiang Saen
Vientiane/Nong Khai
15000
25000
2008
12000
2008
20000
s
e
c
s
)
s
e
c
s
)
c
u
m
c
u
m
9000
15000
i
s
c
h
a
r
g
e (
i
s
c
h
a
r
g
e (
6000
10000
a
i
l
y d
a
i
l
y d
e
a
n d
e
a
n d
M 3000
M 5000
Average (19602007)
Average (19132007)
0
0
Jan
Feb
Mar
Apr
May
Jun
Jul
Aug
Sep
Oct
Nov
Dec
Jan
Feb
Mar
Apr
May
Jun
Jul
Aug
Sep
Oct
Nov
Dec
Pakse
Kratie
40000
45000
35000
2008
40000
2008
s
e
c
s
)
30000
s
e
c
s
)
35000
c
u
m
c
u
m 30000
25000
25000
20000
i
s
c
h
a
r
g
e (
i
s
c
h
a
r
g
e (
20000
a
i
l
y d 15000
a
i
l
y d
15000
e
a
n d 10000
e
a
n d 10000
M
M
5000
Average (19232007)
5000
Average (19242007)
0 Jan Feb Mar Apr May Jun Jul Aug Sep Oct Nov Dec
0 Jan Feb Mar Apr May Jun Jul Aug Sep Oct Nov Dec
Figure 5.9 The 2008 daily discharge hydrograph at selected sites on the Mekong mainstream,
compared to the long term average.
Page 47
Annual Mekong flood report 2008
These observations are summarised in Figure 5.10 that shows the historical joint sample
distribution of annual flood peak and volume.
25000
30000
Mean flood volume
Chiang Saen
Mean flood volume
Luang Prabang
59 km3
1966
85.6 km3
1966
20000
25000
2008
15000
1971
1970
20000
2008
(cumecs)
Mean flood peak
(cumecs)
Mean flood peak
10000 10700 cumecs
nnual ood peak
15000 15100 cumecs
A
nnual ood peak
1975
A
1972
5000
2003
1957
1992
10000
1992
0
5000
0
20
40
60
80
100
120
0
20
40
60
80
100
120
140
160
Annual ood volume
Annual ood volume
(km3)
(km3)
30000
80000
Mean flood volume
Vientiane/Nong Khai
Mean flood volume
Kratie
102 km3
335 km3
1978
1924
1966
25000
70000
2002
2008
1991
1939
20000
60000
1938
Mean flood peak
2000
(cumecs)
Mean flood peak
16750 cumecs
(cumecs)
15000
52000 cumecs
nnual ood peak
50000
nnual ood peak
A
A
1997
1957
10000
40000
2008
1988
1998
1992
2004
1992
1955
5000
30000
0
20
40
60
80
100
120
140
160
180
100
150
200
250
300
350
400
450
500
Annual ood volume
Annual ood volume
(km3)
(km3)
Key
Normal year
Significant flood year
Extreme flood year
Significant drought year
Extreme drought year
2008
Figure 5.10 Scatter plots of the joint distribution of the annual maximum flood discharge (cumecs)
and the volume of the annual flood hydrograph (km3) at selected sites on the Mekong
mainstream. The `boxes' indicate one ( 1 ) and two ( 2 ) standard deviations for each
variable above and below their respective means. Events outside of the 1 box might
be defined as `significant' flood years and those outside of the 2 box as historically
`extreme' flood years.
Page 48
The 2008 flood season
· According to the criteria, 2008 at Chiang Sean would be defined as a significant flood
year in terms of peak discharge but `normal' with respect to flood volume. The fact that
1966 is a complete outlier in both respects is clear.
· At Luang Prabang and Vientiane the 2008 event was extreme in terms of both variables
and exceeded only in 1924 and 1966.
· Much further downstream at Kratie the 2008 event was significantly below normal in
terms of peak discharge. The annual flood volume was, however, only marginally less
than average.
5.6 Aspects of probability and risk
Extreme events such as that of 2008 in the northern reaches of the Lower Mekong Basin
prescribe a need to reassess the mainstream flood risk by including the event in the sample
for reanalysis. Appendix A1.2 of the 2006 Annual Flood Report provided estimates of the
distribution of flood risk along the mainstream at ten\ locations in terms of annual peak
discharge and the total seasonal flood volume. Annual maximum water levels were considered
at a further four sites in Cambodia and the Delta in Viet Nam.
For the reach of the mainstream primarily affected by the August 2008 event the annual
maximum flood peak data to 2008 were statistically re-evaluated with the following results:
Table 5.4 Annual maximum discharge (cumecs) at sites on the Mekong mainstream primarily
affected by the 2008 flood.
Mainstream site
Recurrence interval (years)
2
5
10
20
50
100
Chiang Saen
10 000
13 000
14 500
16 000
18 000
20 000
Luang Prabang
14 500
17 700
19 800
21 800
24 400
26 400
Chiang Khan
15 800
18 600
20 700
22 800
25 400
27 300
Vientiane
16 200
19 200
21 000
23 000
25 600
27 800
These results indicate that the annual risk of occurrence of the 2008 peak discharge at these
sites is:
Table 5.5 Estimated annual recurrence interval of the 2008 maximum flood discharge.
Mainstream site
Peak discharge (cumecs)
Recurrence interval (years)
Chiang Saen
13 300
1:7
Luang Prabang
23 100
1:30
Chiang Khan
23 200
1:25
Vientiane
23 500
1:25
Page 49
Annual Mekong flood report 2008
Further downstream at Pakse and Kratie the 2008 peaks were no more than average with
annual return periods of the order of 1:2 years.
On large rivers a more complete statistical assessment of flood risk is obtained if the peak
and volume of the event are considered jointly within a probabilistic context. This recognises
the fact that the duration of flows above critical thresholds and therefore the potential period of
inundation is often as important as the peak discharge, which is related to the maximum depth
of flooding. Adamson et al. (1999) developed a method for obtaining a bivariate extreme value
model of flood peak and volume which provides the type of result indicated in Figure 5.11. This
may be perceived as adding the dimension of probability to the simple scatter plots shown in
Figure 5.10.
25 000
30 000
Chiang Saen
Vientiane
1966
Contours of equal probability (%)
Contours of equal probability (%)
1924
1966
1
20 000
25 000
2
2008
5
1
10
2002
2
1971
15 000
20
5
20 000
ge (cumecs)
1970
10
50
1938
2008
ge (cumecs)
20
10 000
15 000
50
P
eak dischar
1972
1975
P
eak dischar
1958
1957
5 000
2003
1992
10 000
1987
1992
5000
10
30
50
70
90
110
0
20
40
60
80
100
120
140
160
180
200
Flood volume km3
Flood volume km3
Kratie
1978
75 000
Contours of equal probability
1
1991
2
1939
65 000
5
10
20
2000
55 000
50
ge (cumecs)
45 000
P
eak dischar
2008
1988
1998
35 000
2004
1992 1955
25 000
200
300
400
500
600
Flood volume km3
Figure 5.11 Bivariate probabilities of the joint distribution of flood peak and volume at selected
mainstream sites. For example, points lying outside of the 1% isoline would have a
recurrence interval in excess of 1:100 years, any outside of the 2% contour a recurrence
interval in excess of 1:50 years, and so on.
Page 50
The 2008 flood season
· At Chiang Saen the 2008 flood has a bivariate probability of occurrence of less than
20% or 1:5 years and was therefore unremarkable in both respects. The magnitude of the
outlier that is the 1966 flood is clear in terms of both peak and volume.
· At Vientiane the 2008 flood hydrograph an annual probability of occurrence in biforate
terms of between 10 and 5% or 1:10 to 1:20 years.
· At Kratie the 2008 hydrograph was below average in terms of both variables to an extent
that would be expected with an annual probability of 20% or once on the average every 5
years.
5.7 Conditions on the Cambodian floodplain and in the Delta
Consistent with the systematic diminishing of the magnitude 2008 flood downstream of
Vientiane, daily water levels in Cambodia and the Delta were unexceptional during the season
as can be seen from Figure 5.12.
Phnom Penh Port
Tonle Sap at Prek Kdam
10
10
9
9
2008
2008
a
s
l
)
8
a
s
l
)
8
m
7
m
7
e
v
e
l (
6
e
v
e
l (
6
a
t
e
r l
5
a
t
e
r l
5
a
i
l
y w
4
a
i
l
y w
4
3
3
e
a
n d
e
a
n d
M
2
M
2
1
Average (19602007)
1
Average (19602007)
0
0
Jan
Feb
Mar
Apr
May
Jun
Jul
Aug
Sep
Oct
Nov
Dec
Jan
Feb
Mar
Apr
May
Jun
Jul
Aug
Sep
Oct
Nov
Dec
Tan Chau
Tan Chau
4.5
4.5
4.0
4.0
a
s
l
) 3.5
a
s
l
) 3.5
m
2008
m
3.0
3.0
2008
e
v
e
l (
e
v
e
l (
2.5
2.5
a
t
e
r l
a
t
e
r l
2.0
2.0
a
i
l
y w
a
i
l
y w
1.5
1.5
e
a
n d
e
a
n d
M 1.0
M 1.0
0.5
Average (19802007)
0.5
Average (19802007)
0.0
0.0
Jan
Feb
Mar
Apr
May
Jun
Jul
Aug
Sep
Oct
Nov
Dec
Jan
Feb
Mar
Apr
May
Jun
Jul
Aug
Sep
Oct
Nov
Dec
Figure 5.12 Mean daily water levels in Cambodia and the Mekong Delta for 2008 compared to their
long term daily average.
Page 51
Annual Mekong flood report 2008
In 2008 the start and end of the flood season, defined as the period of the year when water
levels exceed their long term average, were typical, except at Prek Kdam where the season did
not end until the first week of 2009:
Table 5.6 Cambodian floodplain and Mekong Delta onset and end dates of the 2008 flood season
compared to their historical mean and standard deviation.
Site
Onset of flood season
End of flood season
Historical
Standard
2008
Historical
Standard
2008
average
deviation
average
deviation
Phnom Penh
10th July
14 days
9th July
14th Nov
14 days
15th Dec
Prek Kdam
11th July
16 days
8th July
20th Dec
17 days
3rd Jan
Tan Chau
19th July
20 days
18th July
17th Dec
12 days
16th Dec
Chau Doc
23rd July
17 days
22nd July
19th Dec
12 days
19th Dec
Meanwhile, the maximum water levels achieved in 2008 fell well below the annual average
figures:
Table 5.7 Maximum water levels reached during 2008 in Cambodia and the Mekong Delta
compared to their long term average.
Site
Period of Record
Annual maximum water level. (masl)
Historical average
Standard deviation
2008
(m)
Phnom Penh Port
1960 2008
9.02
0.67
8.49
Prek Kdam
1960 2008
9.08
0.73
8.63
Tan Chau
1980 2008
4.30
0.54
3.73
Chao Doc
1980 2008
3.82
0.58
3.14
Page 52
6. Summary of the 2008 country reports
6.1 Cambodia
General situation
The annual report of the National Committee for Disaster Management (NCDM) for 2008
indicates there was little or no flood damage in the country during the year that could be linked
to hydrological conditions along the Mekong mainstream, the Bassac and in the Tonle Sap
Basin. Flood warning levels were not exceeded at any time. The only flood losses arose from
flash flooding caused by a series of tropical storms during the latter part of September in Preah
Vihear, Kampong Thom and Bantay Meanchey Provinces which damaged about 10 500 hectares
of crops, mainly rice. The NCDM estimate of the cost of the associated damage is US$5.7
million, or about US$550 per hectare inundated. The figure for 2008 is below the average
annual financial loss and less than 4% of that arising from the most extreme event of recent
decades which took place in 2000:
Table 6.1 Cambodia total national flood damage in recent years (NDCM data).
Year
National flood damage
(US$ million)
2000
161.0
2001
36.0
2002
12.5
2003
no data
2004
55.0
2005
3.8
2006
11.8
2007
9.1
2008
5.7
Lessons learnt
Since minimal flood damage was reported for 2008 no direct lessons can be drawn specific
to the year's events. The general observations and recommendations made in previous years
continue to apply, however. In the main these emphasize the need for a stronger financial
commitment to national disaster management and improved inter-agency coordination.
Specifically it is recognized that:
Page 53


Annual Mekong flood report 2008
Figure 6.1 Cambodian flood situation in 2000, the most extreme conditions of recent decades.
Compared to this, the situation in 2008 was one of the least damaging of recent years
with water levels along the Mekong, Bassac and in the Tonle Sap system not reaching the
alarm stage at any time.
Page 54
Summary of the 2008 country reports
· There is a lack of systematic flood preparedness planning at the provincial, district and
commune levels.
· At the national level there is poor coordination between the institutions and agencies
concerned with disaster management.
· Hydrometric monitoring in general and during flood events in particular requires the
appropriate levels of funding. Financial support for the operation and maintenance of the
recording network is also inadequate.
· Effective disaster management should be based on a continuous process of data assembly
and analysis including mapping areas at risk and continuously developing and testing
mitigation measures. While of significant benefit the momentum and technical expertise
developed during the course of short term internationally funded projects is not often
sustained due to a lack of ongoing financial support. The design and implementation of
such projects also requires improved coordination such that repetition is avoided and
funds used in a more optimal manner.
6.2 Lao PDR
General situation
Events in Lao PDR during 2008 were obviously dominated by the August flood conditions on
the Mekong mainstream, particularly between Luang Prabang and Vientiane. Though these
extreme mainstream flood conditions dominated the picture at the national scale in terms of
damage and losses, there were a number of other events across the country which had significant
impacts at the local and provincial level. The geography of flooding in the country during 2008
is summarised in Figure 6.2. In this section the flood conditions that occurred across the country
other than those of mid August are briefly reviewed, the latter having been considered in detail
in Chapter 5.
Flooding in Bolikhamxay and Khammouane provinces caused by heavy monsoonal
rainfall 17th 20th June
The relatively strong SW Monsoon of 2008 saw the development of sequential periods of
intense and prolonged periods of storm rainfall, particularly over the central regions of the
country during June. As the figures in the Table 6.2 below show over 800 mm was recorded
over the 10 days between the 11th and 20th of the month at Paksane. Although extreme and is
amongst the highest that has been observed in the central and southern regions of Lao PDR, this
figure has been exceeded several times and by considerable margins as indicated in Figure 6.3.
On two occasions more than 1,000 mm has been observed over 10 days; 1,255 mm at Muong
Tchepon in 1927 and 1,020 mm at Attapeu in 1996.
Page 55
Annual Mekong flood report 2008
Viet Nam
Xiengkhounag province
Storms during March
with hailstones greater
than 2 cm diameter
Areas along the banks of the
Mekong mainstream in Luang
Lao PDR
Prabang and Vientiane
province suffer damage
Bolikhamxay Khammamouane
during the August event
provinces. Extensive flooding
during June, with over 800 mm
rainfall observed in 10 days
Flash floods along the
Nam Song and Man Lik
during July
Thailand
0
200 kilometres
Cambodia
Figure 6.2 Lao PDR provinces affected by flooding and local storms during 2008.
Table 6.2 Daily rainfalls observed at Paksane over the 10 days between 11th and 20th June, 2008.
June
Total
11th
12th
13th
14th
15th
16th
17th
18th
19th
20th
35
96
110
22
98
102
196
60
83
6
808
Other than extensive rural flooding the major impact of this period of exceptional rainfall
was the flooding of the major road link to the south to a depth of 0.5 m over a distance of 500
metres. This lasted for several days and caused severe disruption to inter-provincial traffic.
Flooding in the Nam Song and Nam Lik Rivers in July
Wide spread heavy rainfalls in mid July in the upper Nam Ngum basin, with a total of more
than 300 mm observed on the 18th and 19th at Vang Vieng, caused extensive flooding as the
Nam Ngum, Nam Lik and Nam Song rivers rose above critical levels. Flood depths widely
exceeded 1m, inundating over 2,000 households in the Kasy, Vang Vieng, Hinheup, Pheuang
and Thoulakhom districts. Landslides in the Kasy district caused four deaths.
Page 56
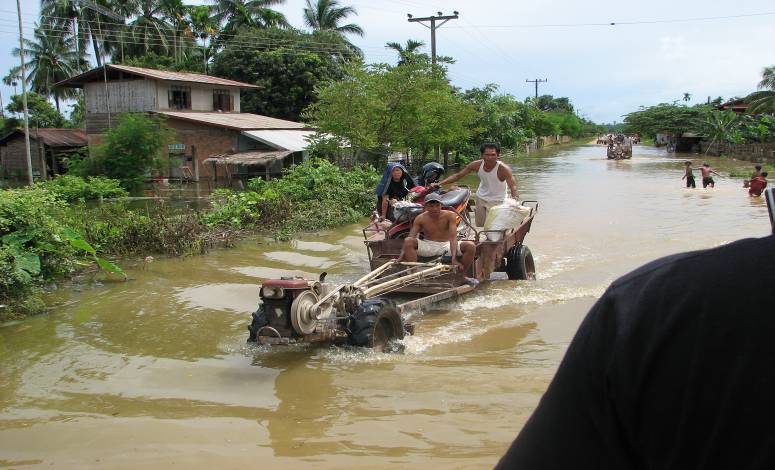
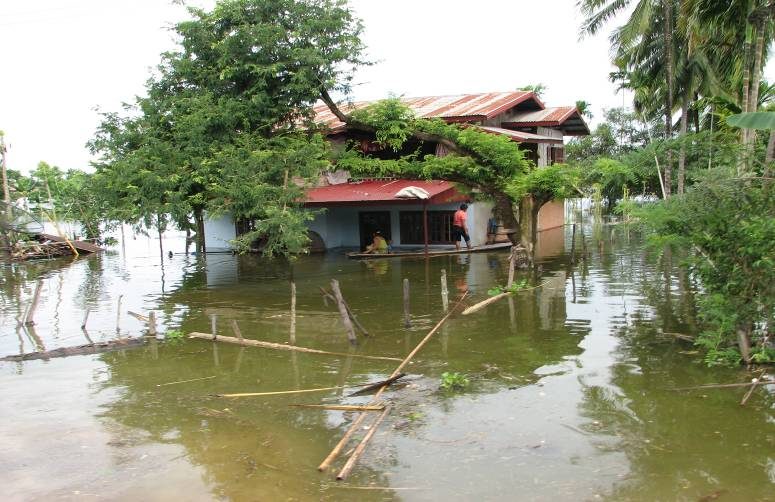
Summary of the 2008 country reports
1400
Maximum
1200
)
m
Upper quartile
m 1000
Median
a
i
n
f
a
l
l (
Lower quartile
800
u
m r
Minimum
600
a
x
i
m
N days rainfall at
Paksane between
11th and 20th June 2008
400
n
n
u
a
l m
A
10 day
200
3 day
5 day
2 day
1 day
0
Figure 6.3 Central and southern Lao PDR annual maximum 1, 2, 3, 5, and 10 day rainfalls observed
at 29 sites with a combined total of 680 station-years of data.
Figure 6.4 Flooding in the Vang Vieng district of Vientiane province after the storms of mid July,
with maximum observed rainfalls of more than 300 mm over two days.
Page 57
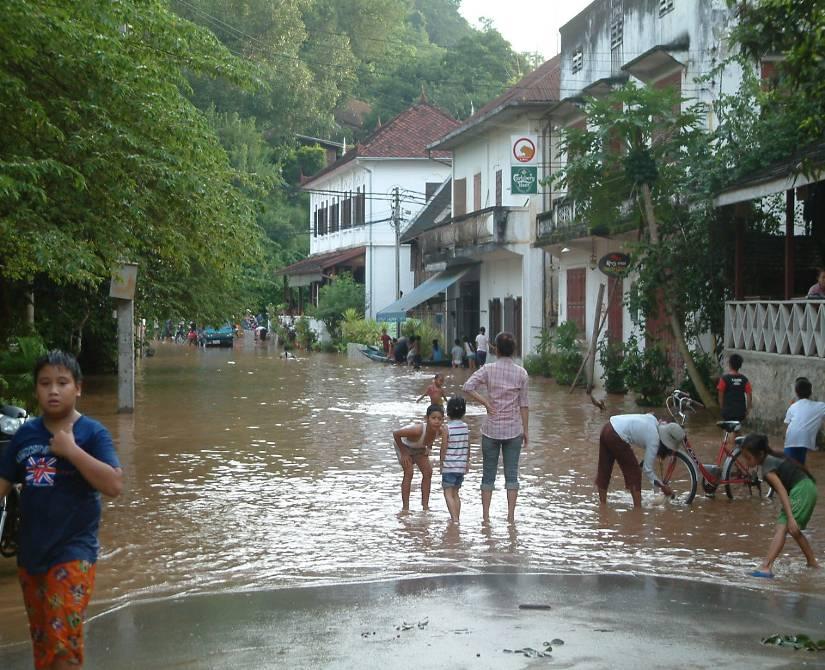
Annual Mekong flood report 2008
Figure 6.5 Flooding in Luang Prabang Province as a consequence of the passage of tropical storm
Kammuri in early August.
Flood damage and losses
The major damage and losses were linked to the events of mid August and the passage of
tropical storm Kammuri and were centred on Luang Prabang, Vientiane capital, Bolikhamxay
and Khammuane provinces. Some 664 villages and 32,610 households were affected, 3 people
were killed and 28,500 hectares of rice and other crops damaged. Livestock losses were
significant as was damage to national infrastructure, particularly roads, bridges and irrigation
systems.
Local flash flooding in the northern and central regions of the country during June, July and
September affected 11 districts, 90 villages and 2,500 households and 4 people were killed by
landslides. In the agricultural sector 2,250 hectares of crops were damaged and some livestock
lost.
The financial loss is currently estimated to be US$56 million, by far the highest figure since
systematic damage assessments began in the early 1990s.
Lessons learnt
Given that the August flooding in Vientiane capital and Luang Prabang was the most severe in
almost 50 years meant that much was learnt with regard to flood forecasting and emergency
response and how the impacts of comparative events in the future might be mitigated.
· Although the short term forecasting over 1 to 2 days was reasonably accurate and
provided sufficient time for the implementation of emergency measures such as
sandbagging, the accuracy of the medium and longer term forecasts could be improved
significantly. Improvements to hydrometric and in particular to the storm rainfall
observation network in the northern regions of the country are required in order to
Page 58
Summary of the 2008 country reports
provide the longer lead times warning of the development of critical conditions within the
large northern tributaries such as the Nam Ou. This is particularly relevant as it becomes
evident that the satellite images that indicate regional storm rainfall during the passage of
tropical storms appear to be providing underestimates and that more `ground truthing' of
extreme rainfall is needed.
· Unplanned urban development and the removal of natural flood storage will contribute to
increased damages and losses in the future and the issue needs to be addressed.
· The inventory of equipment available to the emergency response agencies needs
improvement, particularly with regard to boats and vehicles suitable for accessing and
evacuating stricken areas.
6.3 Thailand
General situation.
Two major events dominated the flood situation in the Mekong region of Thailand during 2008:
1. The consequences of cyclone Kammuri during August and the resultant extremely
high water levels in the Mekong mainstream which caused over bank flooding over
considerable areas in Nan, Chiang Rai, Nakhon Phanom, Sakon Nakhon, Nong Khai,
Mukdahan, and Phetchabun provinces.
2. Extreme storm rainfalls caused by tropical storm Mekkhala between September 30th and
1st October. Flooding was widespread nationally but the Mekong region was affected
particularly Khon Kaen and Loei provinces and the Mun Chi Basin. Earlier during the
first two weeks of September at Khon Kaen more than 50 mm was recorded on most
days, with more than 125 mm observed on the 13th, 16th, and 17th of the month causing
severe local disruption and damage.
Tropical storm Noul passes over the southern regions of Thailand during November and
caused significant losses and damage but not within the Mekong region.
Over the NE of the country the regional rainfall for the 2008 monsoon season is estimated
to have been 1,650 mm, about 20% above average largely explained by higher than normal
rainfall in between September and November. However, there was considerable geographical
variation caused by quite local synoptic conditions that resulted in exceptional storms over
several days or weeks, such as those that were confined to Khon Khaen Province during early
September. No instances of serious flash flooding were reported from the north of the country, in
Chiang Rai Province for example. The tends to confirm the observation made elsewhere that the
extreme rainfall associated with cyclone Kammuri that caused the Mekong flood conditions of
mid August were largely confined to within the northern regions of Lao PDR.
Page 59
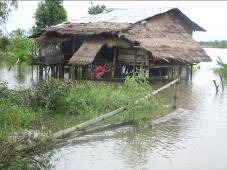
Annual Mekong flood report 2008
At the national level1 the total financial losses for 2008 flooding amounted to 75% of the
average figure over the six years from 2003 to 2008. Of the 2008 losses some 40% was ascribed
to the impacts of tropical storm Noul over the southern regions of the country outside of the
Mekong Basin.
The Mekong floods of August
As on the left bank of the Mekong in Lao PDR, flood inundation due to extreme mainstream
water levels in mid August on the right bank in Thailand was mainly in semi urban and rural
areas that did not have the benefit of flood protection levees. Where these were present, in
Nong Khai for example, the central urban districts suffered only minor flooding and disruption.
However, even here, as in Vientiane, sand bags were strategically placed to manage the risk.
In all 7 provinces and over 2,300 villages were affected in Thailand, not only those directly
adjacent to the Mekong mainstream but also those along the tributary rivers such as the Nam
Loei and Nam Songkhram. As in all years when water levels in the mainstream reach their peak
there are tributary backwater effects which can extend far upstream such that inundation extends
over wide areas beyond those immediately adjacent to the Mekong.
Intense local storms during early August intensified the impacts of the over bank Mekong
flooding. For example, at Nakhon Phanom on the 11th 270 mm was recorded and almost 150
mm at Nong Khai on the same day. This combination of events resulted in six deaths.
Figure 6.6 Flooding in Nakhon Phanom Province in mid August.
1 Flood damage data at the provincial level such that a figure could be obtained for the Thai Mekong region were not made
available.
Page 60
Summary of the 2008 country reports
Flooding in Khon Kaen province September
If the figures are correct the total rainfall for September 2008 at Khon Kaen was 1,990 mm,
which compared to the available historical records over the 55 years between 1950 and 2004:
· Is more than 1.5 times the mean annual rainfall of 1,250 mm;
· Is higher than the highest recorded annual rainfall of 1,850 mm observed in 2000;
· Is more than seven times the average September rainfall of 260 mm;
· Is more than three times the highest recorded September figure of 600 mm observed in
1982 (Figure 6.7).
700
September 2008
1990 mm
600
maximum: 600 mm
)
m 500
m
a
i
n
f
a
l
l (
400
b
e
r r
0
0
4
m
upper quartile: 320 mm
300
0 2
S
e
p
te
1
95
median: 260 mm
200
lower quartile:180 mm
100
minimum: 28 mm
Figure 6.7 Khon Kaen: The sample distribution of September rainfall over the 55 years from 1950 to
2004 compared to the reported 2008 monthly figure of 1,990 mm.
If this is indeed the case then rainfall conditions at Khon Kaen during September 2008 were
unprecedented by some considerable margin.
The consequent flooding extended over 23 provincial districts to a mean depth of 0.3 m. Two
people were reported to have died.
Page 61
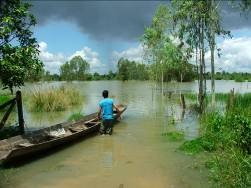

Annual Mekong flood report 2008
Flood damage and losses
The total national figure for flood losses in Thailand during 2008 has been estimated to be
US$72 million, of which US$28 million occurred in the far south of the country during the
passage of tropical storm Noul. This flooding in the south and that in the western provinces
during October would appear to account for the greater part of the national damage. Although
substantially higher than those of 2007, the 2008 figures are much less than the average over
recent years and less than half of those of 2005 and 2006.
The damage in the Thai Mekong region was generally confined to rural areas and the
agricultural sector and although the water levels in the Mekong were the highest for almost 50
years their impact in terms of monetary loss appears to have been modest compared to events
elsewhere in the country during 2008.
Figure 6.8 Flooding in Khon Kaen Province as a result of unprecedented September rainfall.
Lessons learnt
As in any emergency response activity coordination between the various agencies responsible
is key to effective implementation. In Thailand a comparatively wide range of organizations
provide aid such as the Rajaprajanugroh Foundation Under Royal Patronage, the Thai Red Cross
Society, the Department of Disaster Prevention and Mitigation, National, Provincial and District
Authorities, the Royal Irrigation Department, the army, the Department of Water Resources and
so on. A need is recognized for improved planning and coordination between these bodies at the
community, basin and national level.
The government's National Policy statement on Land, Natural Resources and the
Environment of December 2008 heeds the lessons of recent national disasters and calls for
a greater emphasis upon preventive measures, such as early warning systems and the use of
geo-informatics to identify and monitor areas at risk. Amongst the approved measures is the
installation of an early warning system for flash flood and landslide risk which will cover 2,300
Page 62
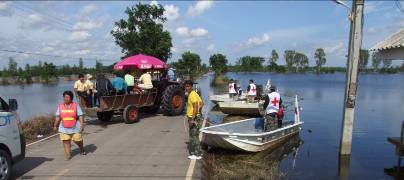
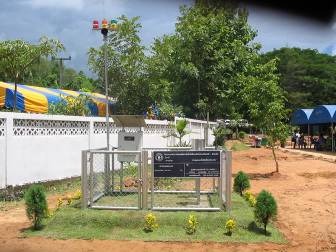
Summary of the 2008 country reports
villages by 2012, the establishment of the `Mekhala Centre' for water crisis management which
will exploit modern IT technology and Decision Support Tools and improved flood warning in
the Mun Chi Basin based on an expanded telemetry system.
Figure 6.9 Emergency medical provision Lop Buri Province. September 2008.
Figure 6.10 A component of the flash flood and landslide monitoring network.
6.4 Viet Nam
General situation
Although water levels in the Mekong Delta at Tan Chau and Chau Doc exceeded alarm levels
for considerable periods of the 2008 flood season1, flood damage in this part of the country was
1 It is recognised that the current flood alarm levels in the Delta are too low given the flood protection works that have been
completed over the last decade or so. It is planned to reassess them in the coming months
Page 63
Annual Mekong flood report 2008
limited and less than that for a typical year. In fact over the year less than 70 ha of rice paddy
was reported to have been damaged. The only significant inundation occurred in mid October as
a result of spring tide conditions causing widespread but brief flood inundation in a number of
delta provinces and Can Tho City, and in late November as a consequence of the intense rainfall
linked to the passage of tropical storm Noul over the southern regions of Viet Nam.
In the Central Highlands, specifically in the upper Se San and Sre Pok river basins, a number
of local flash floods occurred, with those of mid May, early August and late November being the
most damaging. Generally, however, as in the Delta, 2008 was a year that saw the lowest levels
of flood losses observed in recent years.
Flash flooding in the upper Se San basin
During the first half of August, at the same time that tropical storm Kammuri was passing over
the northern regions of the Lower Mekong Basin, heavy rainfall occurred over parts of the
Central Highlands, particularly in Kon Tum Province in the upper Se San basin, with as much as
355 mm observed in the 7 days between the 2nd and 8th of the month.
Table 6.3 Storm rainfall observed in the upper Se San Basin between the 2nd and 8th of August, 2008.
Station
River basin
Rainfall (mm)
Mang Canh
Dak Bla
175
Sa Thay
Dak Bla
190
Dak Lay
Dak Bla
185
Pleiku
Dak Bla
280
Dak Mot
Se San
155
Kon Plong
Se San
285
Dak To
Dak Takan
185
Kon Tum
Se San
355
On the 7th in Dak Bla village and Kon Tum town flash flooding caused considerable damage
to residential property, crops and infrastructure and included one death. Almost 100 ha of rice
paddy were lost completely and 150 ha damaged, 8 rural bridges were damaged and total costs
estimated to be VND 15.5 billion.
Flash flooding in the upper Sre Pok basin
During early May local monsoonal low pressure systems brought heavy rainfall to the upper
Sre Pok basin and flash floods to Dak Nong province on the 11th, which resulted in four deaths.
Later in the year in November tropical storm Noul caused further flash flooding and significant
damage to 60 houses along with two further two deaths.
Page 64
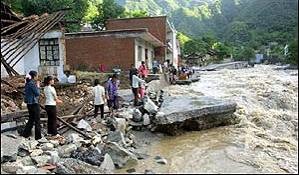
Summary of the 2008 country reports
Table 6.4 Rainfall observed in the upper Sre Pok: 14 6th November.
Station
River basin
Rainfall (mm)
Buon Ma Thuot
Sre Pok
135
Buon Ho
Sre Pok
160
Giang Son
Sre Pok
225
Duc Xuyen
Sre Pok
110
Bridge 14
Sre Pok
115
Krong Buk
Sre Pok
290
Figure 6.11 Typical flash flood conditions in the Central Highlands, indicating high flow velocities
and considerable erosive power. Landslides in the steep terrain add to the hazard
since they can block river channels. When they collapse or are overtopped, a wave of
floodwater is released containing huge amounts of sediment and debris.
Flood damage and losses
Flood damage in the delta during 2008 was insignificant. In the upper Se San and Sre Pok
though flash floods did occur with some loss of life, total damages were small compared to
previous years. For example, during 2008 costs were estimated to be US$1 million, compared to
US$51 million in 2007.
Lessons learnt
The benign flood conditions in 2008 in the delta served to emphasise the benefits of the
annual Mekong flood with regard to agriculture fisheries and the environment. Although
flood protection and mitigation measures both structural and non-structural continue to be
implemented in the Delta, it is recognised that more needs to be done in the Central Highlands
where flash flooding is a perennial hazard. By definition such events are extremely difficult to
forecast, though by monitoring levels of catchment saturation, improving the accuracy both
spatial and temporal of short term rainfall forecasts, mapping the most vulnerable areas and
Page 65
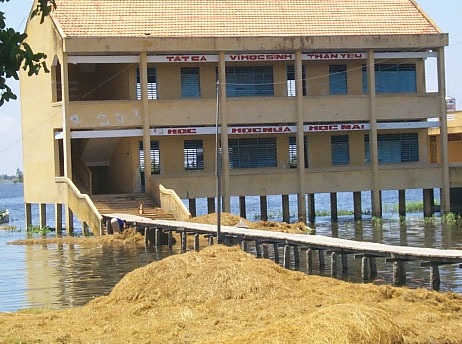
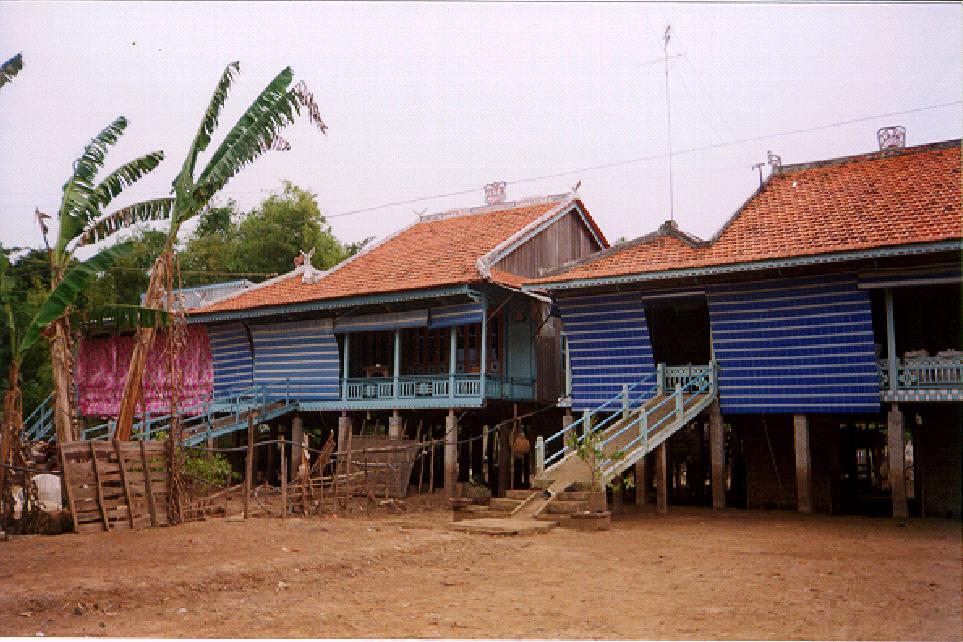
Annual Mekong flood report 2008
encouraging people not to live in them would serve to reduce the significant losses in terms
of both property and lives that occur year in, year out. It is acknowledged that mitigating the
impacts of flash floods in Viet Nam would be a considerable and very expensive challenge,
not with standing the significant social challenges that exist and the fact that such floods
occur throughout the country and are a major cause of loss of life. Although qualitatively the
conditions that cause them are well understood the quantitative meteorological and hydrological
thresholds that trigger them within various types of landscape are not and provide an area of
much needed research.
Figure 6.12 Structural flood mitigation measures implemented in the delta schools and
houses raised on piles.
The complex fluvial geomorphological consequences of `hard' flood control and mitigation
measures need to be better understood since bank erosion during the flood season is becoming a
serious issue in parts of the delta region.
Page 66
7. Summary conclusions and recommendations
7.1 Summary conclusions.
The Mekong flood of 2002 provided a classic illustration of the fact that in years when extreme
water levels and discharges occur, they tend not to do so throughout the Lower Basin. The
synoptic scale of the weather generating mechanisms such as typhoons and tropical storms that
cause such conditions are such that their direct impacts are limited to just a part of the basin.
Typically extreme annual events are confined either to the northern parts of the lower basin
upstream of Vientiane, as in 1966 and 2008 or to the southern parts as in 2000, 2001 and 2002.
The events of 2008 saw the highest water levels observed at Luang Prabang, Vientiane and
Nong Khai since 1966, with considerable inundation of peri urban and rural areas with flood
damages, particularly in Lao PDR, the highest incurred in many years. The conditions, which
peaked in mid August, were the result of the passage of cyclone Kamurri across northern Lao
PDR and Thailand during the first week of the month. Analyses revealed that almost all of the
floodwater originated within the Nam Tha, Nam Ou, Nam Soung and Nam Khan river basins,
with only a modest trans-boundary contribution from China.
Downstream of Vientiane and Nong Khai flood conditions rapidly moderated since the flood
contributions to the mainstream from the large left bank tributaries were not exceptional. As a
consequence discharges and water levels across the Cambodian flood plain were average at best.
Little or no damage was reported in these southern regions of the basin, though flash flooding
did occur in the upper Se San and Sre Pok river basins in Viet Nam during May and August,
though overall damage and losses were small compared to those of recent years
7.2 Recommendations.
The events of August 2008 provided the first real opportunity to apply and test the RFMMC's
flood forecasting system, which performed tolerably well when predicting the potential situation
over a one and two day lead time, but less well over the longer lead times. This suggests that
the flood routing component works well once the floodwater is in the major tributaries and the
mainstream. However, estimating several days in advance the volumes of flood runoff that will
be generated by the storm rainfall is recognized as needing improvement.
The major constraint to bringing this about appears to be the fact that the satellite imagery
used to estimate the storm rainfall depths is apparently leading to systematic underestimation.
Certainly the accumulated volumes of flood runoff during the first two weeks of August, which
amounted to 30 km3 in the Mekong at Vientiane, could not have been produced by the total
Page 67
Annual Mekong flood report 2008
rainfall for the period indicated from satellite imagery. The figures are far too low and the areal
coverage of maximum storm rainfall too small. There is a need therefore to extend the `ground
truthing' of the figures indicated from the satellite image.
In this context the major recommendation is the need to improve the rainfall recording
network in the key river basins in Northern Lao PDR, although this need has already been
recognized by the Department of Meteorology and Hydrology (DMH) in Vientiane. New gauges
have been installed at Phongsali, Oudomxai and Luang Namtha.
It was also recognized during the post flood evaluation that the clarity and coverage of the
flood forecasts as they are posted from day to day on the MRCS web site needs to be improved.
The issue has been addressed.
Turning to the observations made in the Annual National Flood Reports:
· The August damage in Vientiane emphasized the need for improved urban planning such
that residential development is controlled in flood prone areas, while the ongoing removal
of natural flood storage such as wetlands will only lead to increased future losses.
· The inventory of equipment available to the emergency response agencies is inadequate.
· In Thailand, the call for greater emphasis on preventative measures such as early warning
systems and the use of geo-informatics to identify and monitor areas at risk from flash
floods and landslides applies regionally. The installation of the monitoring network to
protect vulnerable villages provides a model that could be extended throughout the basin.
· The difficulty of mitigating the impacts of flash flooding has been long recognized in Viet
Nam and a call is made for increased investment in research regarding the quantitative
meteorological and hydrological thresh holds that trigger them in various kinds of
landscape.
· Flood induced erosion, particularly in the Delta, and its linkage with `hard' flood control
measures is also an area that needs better understanding since it is emerging as a serious
issue.
· As in previous years all four national reports recommend ongoing improvement towards
effective disaster management through better inter-agency coordination and the provision
of the appropriate levels of funding.
Page 68
8. References
Anderson, R.J., dos Santos, N. and H.F. Diaz. (1993) An analysis of flooding in the Parana/
Paraguay River Basin. Laten Dissemination Note 5. Latin America and Caribbean
Technical Dept. World Bank.Environment Division. Washington DC
Barlow, C., Baran. E., Halls, A., and M. Kshatriya (2008) How much of the Mekong fish catch
is at risk from mainstream dam development? Catch and Culture, 14(3), 16 21.
Biggs, D. (2003) Problematic Progress: Reading Environmental and Social Change in the
Mekong Delta. Journal of Southeast Asian Studies, 34, 77 96.
Brander, L.M., Raymond, J.G,M. and J. Vermati (2006) The Empirics of Wetland Valuation:
A Comprehensive Summary and a Meta-Analysis of the Literature. Environmental and
Resource Economics, 33, 223 250.
Bui Chi Buu and Nguyen Thi Lang. (2003) Improving rice productivity under water constraints
in the Mekong Delta. Viet Nam. Omonrice, 11, 1 9.
CSIRO (1999) Floodplain management in Australia: best practice principles and guidelines.
Agriculture and Resource Management Council of Australia and New Zealand. Standing
Committee on Agriculture and Resource Management, CSIRO Publishing
Das Gupta, A., Babel, M.S. and P. Ngoc, (2004) Flood damage assessment in the Mekong
Delta, Vietnam. In: Proceedings of 2nd Conference of the Asian Pacific Association of
Hydrology and Water Resources. Singapore.
Delvert, J. (1961) Le Paysan Cambodgien. Mouton. Paris.
Do T, N. and J. Bennett (2008) Estimating wetland biodiversity values: a choice modelling
application in Vietnam's Mekong River Delta. Environment and Development Economics.
Cambridge University Press.
Fox, J. and J.L. Wood. (1999) `Dry-season flood-recession rice in the Mekong Delta: Two
thousand years of sustainable agriculture'. Asian Perspectives, 38(1), 37 50.
Fukui, H. and K. Hoshikawa (2003) The Evolution of Rain Fed Rice Production in NE.
Thailand. In: Proceedings of the 1st International Conference on Hydrology and Water
Resources in the Asia Pacific Region. Kyoto. Japan. pp 179 184.
General Statistics Office (2004) Statistical yearbook, 2003. Statistical Publishing House, Hanoi.
Page 69
Annual Mekong flood report 2008
Gerrard, P. (2004) Integrating Wetland Ecosystem Values into Urban Planning: The Case of That
Luang Marsh, Vientiane,Lao PDR, IUCN The World Conservation Union Asia Regional
Environmental Economics Programme and WWF Lao Country Office, Vientiane
Halls, A.S., Lieng, S., Ngor, P. and P. Tun (2008) New research reveals ecological insights into
Dai fishery. Catch and Culture, 14(1). Mekong River Commission, Vientiane.
Haskoning (2008) Flood Damages and Flood Risks in the Focal Areas. Annex 2 to the Draft
Stage 1 Evaluation Report. The Flood Management and Mitigation Program Component
2: Structural Measures and Flood Proofing. MRC Flood Management and Mitigation
Programme. Phnom Penh. Cambodia
Hortle, K. (2007) Consumption and yield of fish and other aquatic animals from the Lower
Mekong Basin. Catch and Culture. MRC Technical Paper No. 16. Mekong River
Commission,Vientiane.
Huang, Y. and A.M. Bocchi. (2008) Reshaping economic geography in East Asia. World Bank
Publications. 369 pp.
Jacques, C. (1979) Funan Ancient Chinese views of Indo China. In: Early South East Asia
Essays in Archaeology, History and Historical Geography. 371 379. Eds. R.B. Smith
and W. Watson. Oxford University Press. New York
Jensen, J.G. (2005) Managing fish, flood plains and food security in the Lower Mekong Basin.
Water Science and Technology, 13(9) 157 164.
Junk, W.J., (1997). The Central Amazon Floodplain: Ecology of a Pulsing System. Springer,
Berlin, Heidelberg, New York.
Junk, W.J., Bayley, P.B. and R.E. Sparks (1989). The flood pulse concept in river-floodplain-
systems. In: Proceedings of the International Large River Symposium, Ed D.P. Dodge,
Canadian Special Publication of Fisheries and Aquatic Sciences, 106, pp. 110 127.
Junk, W.J. and K.M. Wantzen (2004). The flood pulse concept: new aspects, approaches and
applications an update. In:, Proceedings of the Second International Symposium on the
Management of Large Rivers for Fisheries, Volume II. R.L. Welcomme and T. Petr (eds)
FAO, RAP Publication 2004/16, Bangkok, p. 117 140.
Kakonen, M .(2008) Mekong Delta at the Crossroads More Control or Adaptation. Ambio,
37(3), 205 212.
Page 70
References
Keskinen, M., Kummu, M,, Noy Pok, I., Rath, H. and Y. Sambo. (2005) Analysing water-
livelihoods interconnections in the Mekong Floodplains of Cambodia. Paper prepared
for "Water in Mainland Southeast Asia". Workshop organized by the Centre for Khmer
Studies (CKS), Siem Reap, Cambodia, and the International Institute for Asian Studies
(IIAS), Leiden/Amsterdam., Siem Reap Cambodia.
MacAlister, C. and M. Mahaxay (2008) Mapping wetlands in the Lower Mekong Basin for
wetland resource and conservation management using Landsat ETM images and field
survey data, Journal of Environmental Management, 30, 1 8.
Mainuddin, M., Kirby, M. and Y. Chen (2008a) Spatial and Temporal Pattern of Land and Water
Productivity in the Lower Mekong River Basin. Basin Focal Project Working Paper No.
5. CGIAR Challenge Program on Water and Food.
Ng, R.C. (1979) The geographical habitat of historical settlements in South East Asia. In: Early
South East Asia Essays in Archaeology, History and Historical Geography. 262 272.
Eds. R.B. Smith and W. Watson. Oxford University Press. New York
O'Connor, R.A. (1995) `Agricultural change and ethnic succession in South East Asian States.
Journal of Asian Studies, 54(4), 968 988.
Ringler, C. and X. Cai (2006) Valuing Fisheries and Wetlands Using Integrated
Economic Hydrologic Modelling Mekong River Basin. Journal of Water Resources
Planning and Management ASCE, 132(6), 480 487.
Smith, K. (2004) Environmental Hazards, Assessing Risk and Reducing Disaster. Routledge,
London. 233 pp.
Takeuchi., K. (2001). Increasing vulnerability to extreme floods and the societal needs of
hydrological forecasting. Hydrological Sciences Journal. Special Issue 46(6) 869 881
Van Liere (1980) Traditional water management in the Lower Mekong Basin. World
Archaeology. 11(3) 265 280.
Webby R.B., Adamson, P.T., Boland, J., Howlett P.G., Metcalfe, A.V. and J. Piantadosi (2007)
The Mekong : Applications of value at risk (VaR) and conditional value at risk (CVaR)
simulation to the benefits, costs and consequences of water resources development in a
large river basin. Ecological Modelling 201(1) 89 96.
Zhou, D. (2002 [1902]). The Customs of Cambodia. M. Smithies. Bangkok, Siam Society, First
translated from Chinese into French by Pelliot and published in 1902.
Zimmerman, C. (1931) Siam, Rural Economic Survey 1930 31. Bangkok, Ministry of
Commerce and Communications, Bangok.
Page 71
Annual Mekong flood report 2008
Page 72
Appendix 1. Mekong mainstream: summary hydrological
statistics for the 2008 flood season
Location
Date of onset Date of end
Maximum
Maximum
Date of
2006 Flood
of flood
of flood
water level
discharge
maximum
volume
season
season
(masl)
(cumecs)
(km3)
Chiang Saen
27 June
14 Nov
13 300
13 Aug
66.5
Luang Prabang
29 June
14 Nov
23 100
14 Aug
107.2
Chiang Khan
13 June
23 Nov
(25 500)
15 Aug
134.5
Vientiane
15 June
21 Nov
23 500
15 Aug
148.0
Nong Khai
2 July
18 Nov
(21 100)
16 Aug
(125.3)
Nakhon Phanom
3 June
24 Nov
32 800
18 Aug
(288.0)
Mukdahan
6 June
18 Nov
34 000
18 Aug
260.4
Khong Chiam
8 June
21 Nov
(29 400)
18 Aug
256.3
Pakse
9 June
20 Nov
37 500
17 Aug
295.4
Stung Treng
10 June
24 Nov
48 000
10 Aug
393.0
Kratie
5 July
20 Nov
(40 000)
14 Aug
(304.0)
Phnom Penh Port
9 July
14 Dec
8.49
26 Sep
Prek Kdam
10 July
19 Dec
8.86
28 Sep
Tan Chao
18 July
16 Dec
3.73
30 Sep
Chao Doc
22 July
19 Dec
3.14
1 Oct
Page 73
Annual Mekong flood report 2008
Appendix 2. Cambodia. 2008 flood damages compared
to those of recent years
Year
Total Flood Damage Major area affected
Type of flood
Major components of loss
(US$)
1996
86,500,000
Along Mekong,
Mekong flood and
Crops (250,218 ha), Livestock
Bassac and around
flash flood
(327) Houses (3,768), Schools
Tonle Sap Lake
(173) Roads (802 km), Bridges
(290 sites) Culverts (2,499 sites),
Dams (65 sites) Dead (169
persons)
2000
161,000,000
Along Mekong,
Mekong flood and
Crop s(421,568 ha), Houses
Bassac and around
flash flood
(7,086) Schools (6,620), Roads
Tonle Sap Lake
(908,710 km) Bridges (1,856 km),
Culverts (17 sites) Dams (397
sites), Dead (347 persons)
2001
36,000,000
Along Mekong,
Mekong flood and
Crops (164,173 ha), Houses
Bassac and around
flash flood
(2,251) Schools (911), Roads
Tonle Sap Lake
(7,976 km) Bridge s(175 sites),
Culverts (44 sites) Dams (201
sites), Livestock (956) Dead (62
persons)
2002
12,450,000
Along Mekong,
Mekong flood and
Crops (45,003 ha), Houses (35)
Bassac and around
flash flood
Schools (2), Health centre (7)
Tonle Sap Lake
Roads (12 km), Dams (201 sites)
Livestock (956)
2004
55,000,000
Along Mekong,
Mekong flood and
Crop (247,393 ha)
Bassac and around
flash flood
Tonle Sap Lake
2005
3,810,000
Along Mekong,
Mekong flood and
Crops (1,500 ha), Houses (1,700
Bassac and around
flash flood
flooded, 32 collapse), Schools (30
Tonle Sap Lake
flooded), Dead (4 persons)
2006
11,800,000
Along Mekong,
Mekong flood and
Crops (13,787 ha), Roads (70 km)
Bassac and around
flash flood
Dams (41 sites), Bridges (24 sites)
Tonle Sap Lake
Dead (11 persons),
2007
9,000,000
Along Mekong,
Flash flood
Crops 18,786 ha, Houses 11 Roads
Bassac and around
34 km
Tonle Sap Lake
2008
5,750,000
Flash flood
Crop 18,907
Page 74
Appendix 3. Lao PDR: August 2008 flood damages
Description
Assessment methodology is based on data reporting
from: Provincial Agriculture and Forestry Office,
Ministry of Agriculture and Forestry ; Department of
Meteorology and Hydrology, Water Resources and
Environment Administration and the National Disaster
Management Organization
Provinces affected
Luangprabang, Vientiane Capital, Bolikhamxay and
Khammuane
Districts affected
26
Villages affected
664
Houses affected
32,610
People affected
95,158 persons in Bolikhamxy and Khammuane
provinces
People killed
3
Agriculture
Hectares of Rice and other Crop damaged
28.516,67
Hectares of Industry log damaged
53,54
Kilogram of seed bed / nursery
860
Livestock
Cattle
702 head ( buffalos, cows, pigs and goats ) lost
Poultry
995 head lost
Fish ponds, aquaculture and Mekong fish net
44 sites fish ponds 355,59 ha aquaculture and 71 sites of
Mekong fish net damaged
Infrastructure
Schools
63 sites affected
Health Center
3 health centre of Hinboun village affected and 50 sites
and medicine cabinets
Bridges damage
3 sites
Erosion along the Mekong river
18 sites destroyed 27 kilometres of length
Road damage
40 places damaged 314,38 kilometres of length
Canal systems damaged
48 sites
Drainage tubes affected
53 metres
Water wells damage
929 sites
Underground water well damage
812 sites
Natural water spring damage
1 site
Villagers toilets affected
4,954 sites
Page 75
Annual Mekong flood report 2008
Appendix 4. Thailand: 2008 flood damages compared to
those of recent years
Descriptions
2008
2007
2006
2005
2004
2003
Areas
Provinces
65
46
47
63
59
66
Districts
584
486
482
541
337
349
Villages
22,874
20,499
20,625
10,326
9,964
5,281
Human
People
4,494,187 3,640,978 5,198,814 2,874,673 2,324,441 1,882,017
Households
1,197,253
940,663
1,430,085
763,847
619,797
485,436
Casualties
97
62
340
88
31
54
Assets
House
18,258
7,369
49,611
6,040
5,947
10,329
Fish ponds
42,424
34,767
125,683
13,664
12,884
22,339
Live stock
504,737
38,079
142,211
696,123
71,889
301,343
Agriculture field (rai) 3,023,477 2,645,982 5,605,559 1,701,450 3,298,733 1,595,557
Infrastructures Roads
12,133
8,330
10,391
5,697
4,173
5,071
Bridges
573
309
671
667
173
393
Hydraulic structures
595
591
778
22,527
716
179
Institute buildings
197
271
1,425
2,123
827
174
Drains
561
163
1,085
1,482
594
282
US$ million
72
48
202
170
24
58
These figures are for the country as a whole. Of the US$72 million flood damage figure for 2008
about US$20 million occurred in the Thai Mekong region.
Page 76
Appendix 5. Viet Nam: 2008 flood damages compared to
those of recent years
Mekong Delta
Description
Flood impacts
Flood impacts
Flood impacts
2007
2008 *
2000
Number of affected provinces
5
5
13
Number of affected families
13 500
0
800 000
Number affected people
67,500
0
10 million
Number of people killed
30
7
453
Rice & upland crop damaged (ha)
14 688
68
2.0 million
Total estimated cost (US$ million)
1.50
*
250
Central Highlands
No.
1990 1994 1995 1996 1998 1999 2000
2002
2003
2006
2007
2008
People
Killed
22
2
3
4
13
>20
2
6
0
29
6
Missing
5
41
2
0
4
1
Injured
1
1
0
Houses
Lost
22
7
5
166 d
Inundated
1500
12,447
Agriculture
Lost
400
24
20,344
79
Inundated
9000
1000
126
24,393
Fish ponds damaged
593
Bridges
Destroyed
32
10
1
59
8
Damaged
14
Water containers
Damaged
4
37
Eroded
331,837
Number of provinces
4
4
4
4
4
4
4
4
4
4
4
4
effected
Total Cost
0.5
1.0
n/a
n/a
n/a
0.2
n/a
3.0 .
0.5.
n/a
50.8
1.0
(US$10 million)
Page 77
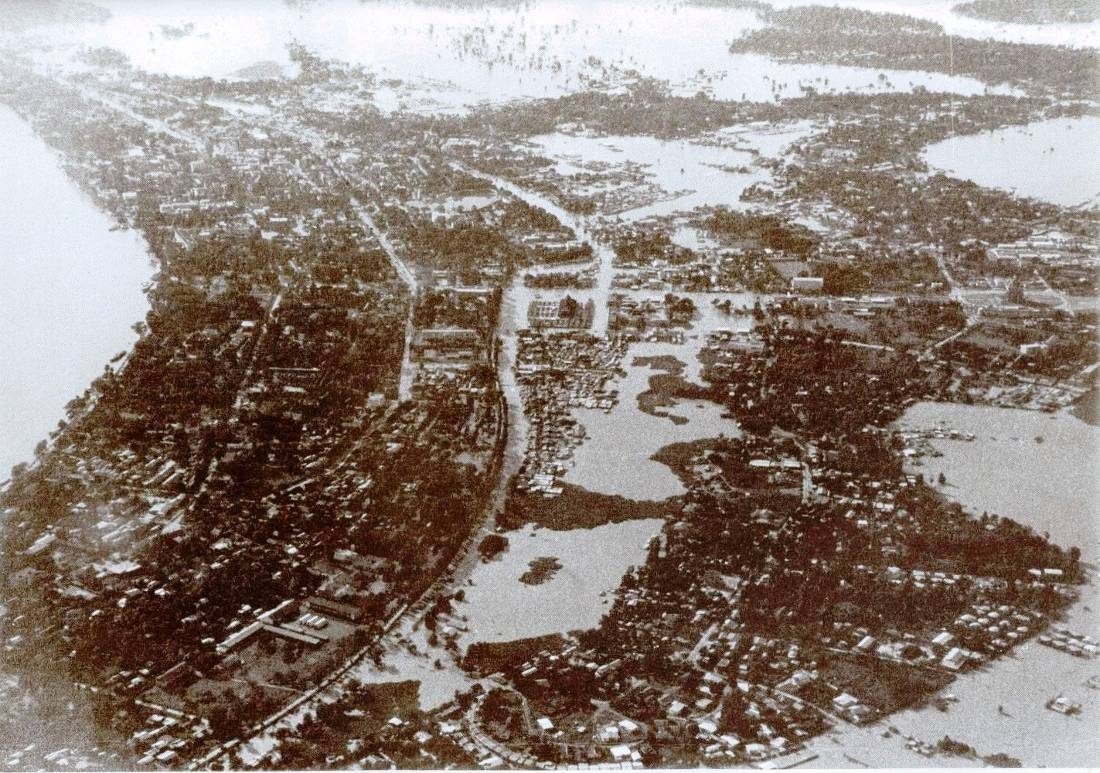
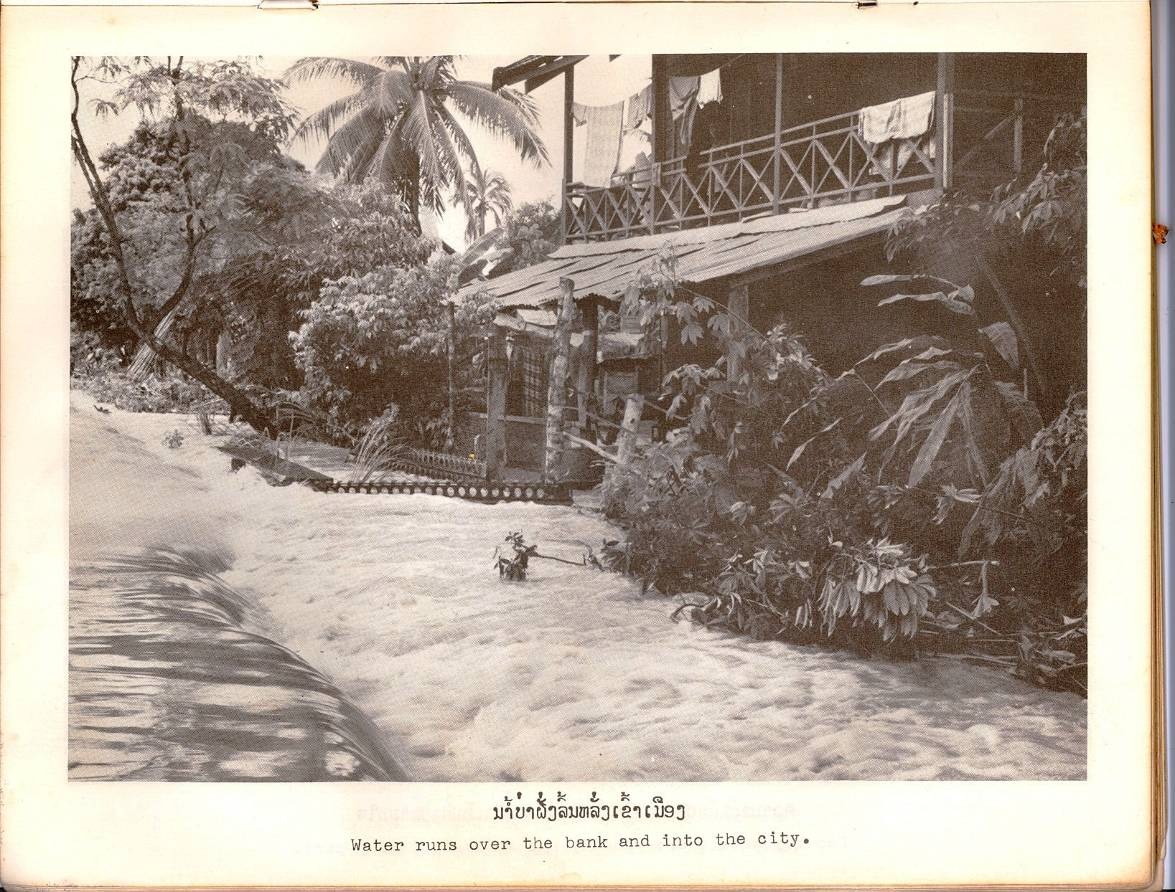
Annual Mekong flood report 2008
Appendix 6. Photograph archive of the September 1966
flood in Vientiane
Central Vientiane September 3rd, 1966.
Residential inundation
Page 78
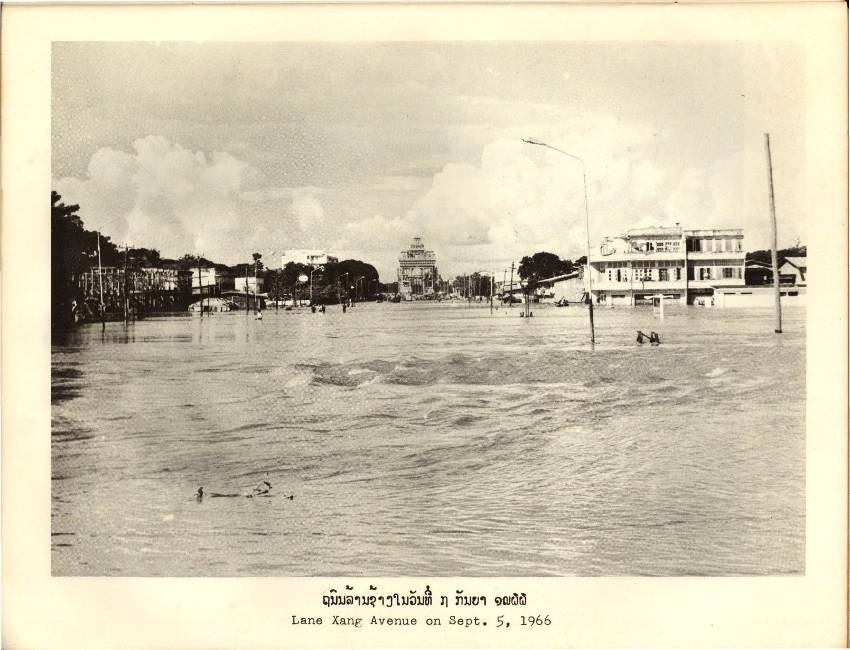
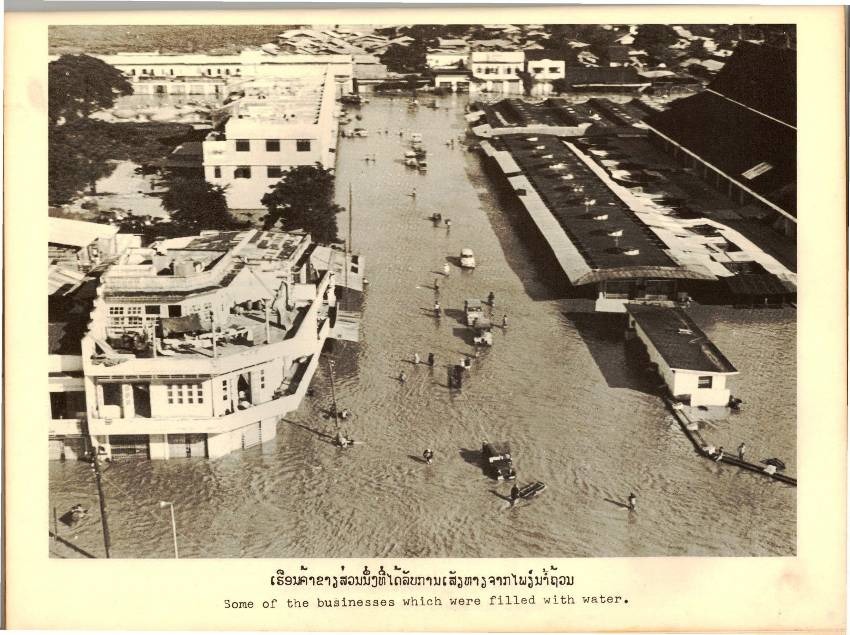
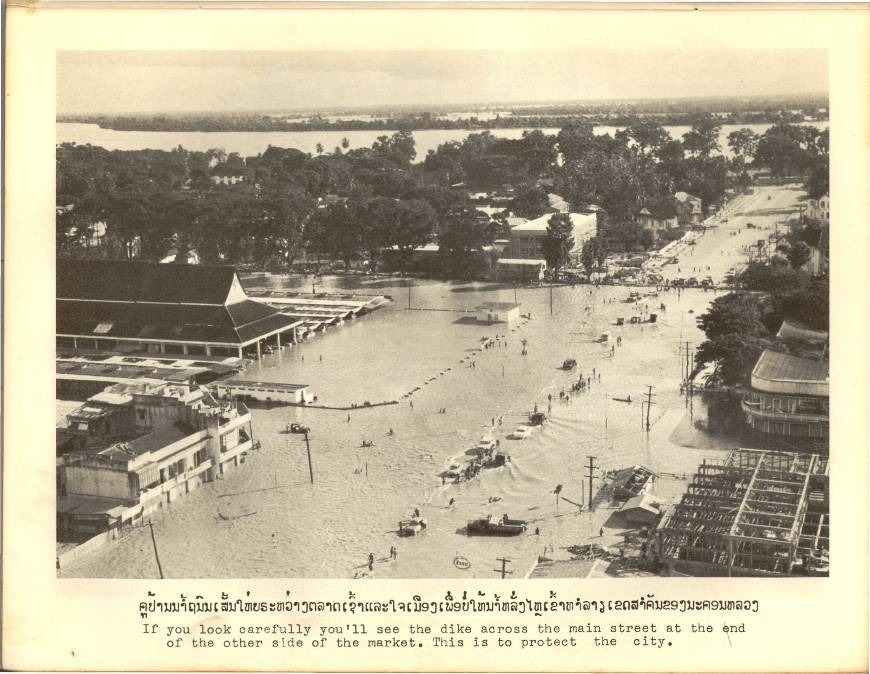
Appendices
Lang Xiang Avenue.
The Morning Market
Lang Xiang Avenue looking south towards the Mekong.
Page 79
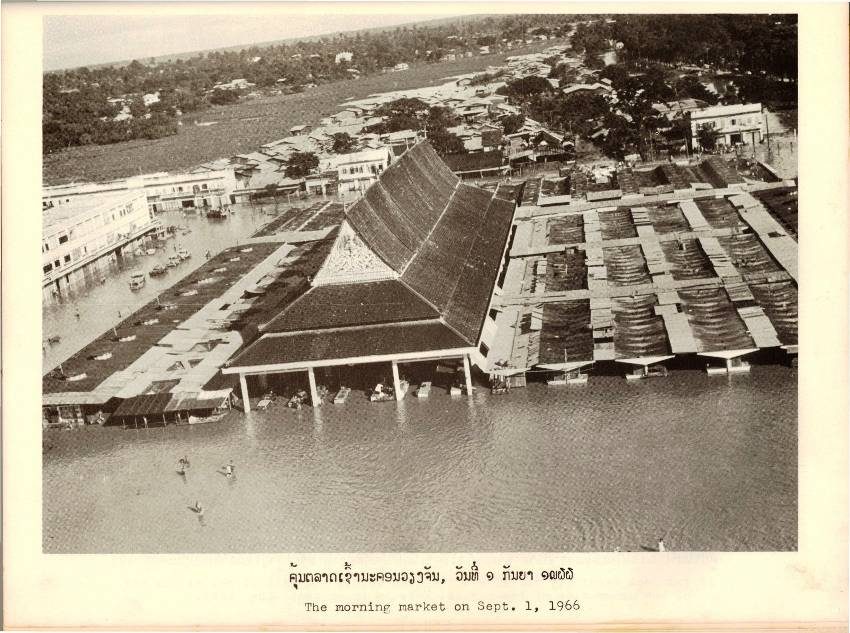
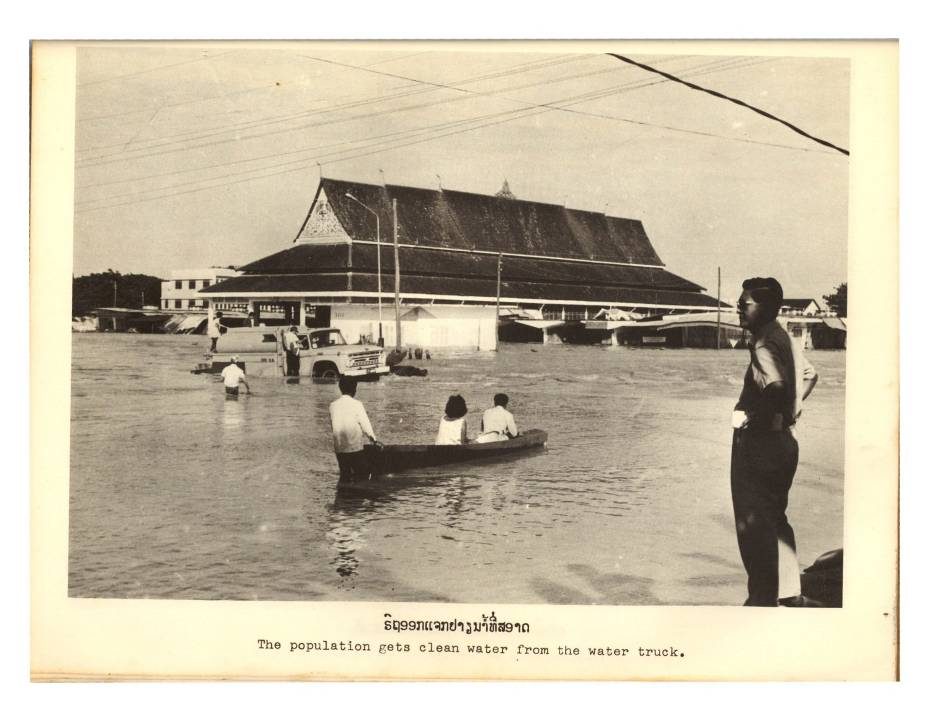
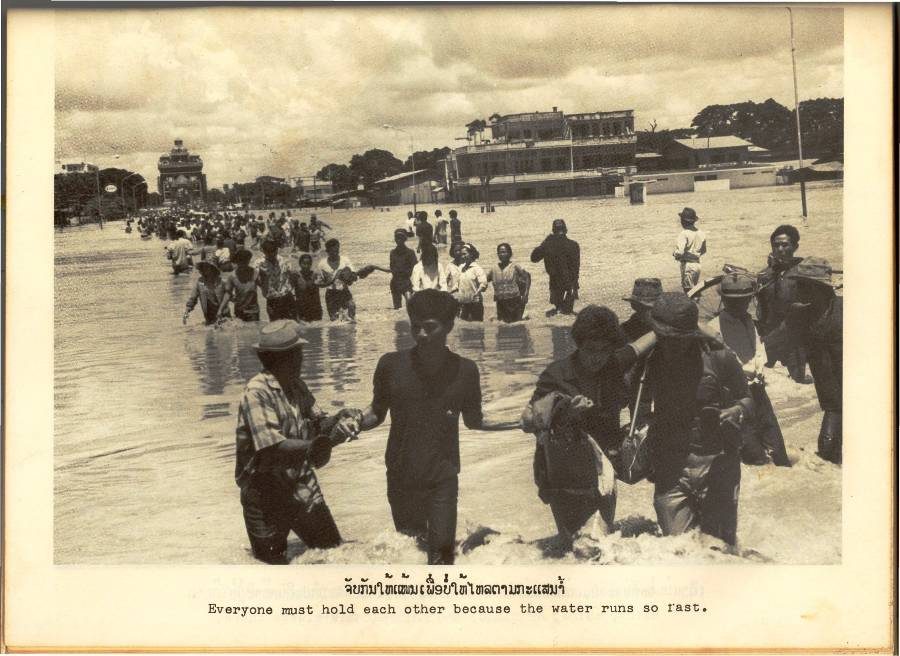
Annual Mekong flood report 2008
Morning Market.
Morning market obtaining water from a tanker.
Pedestrians are help to cross the flooded Lange Xiang Avenue.
Page 80
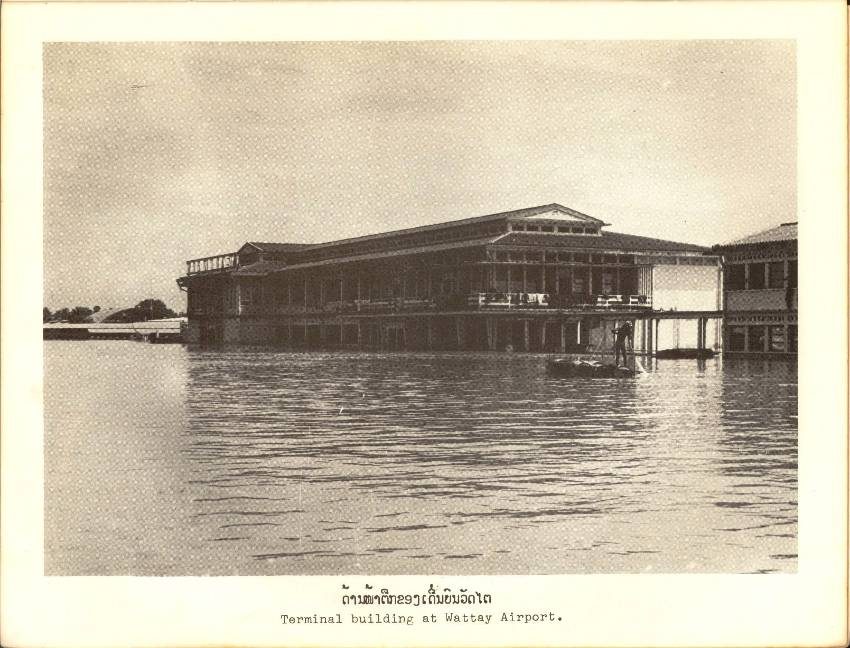
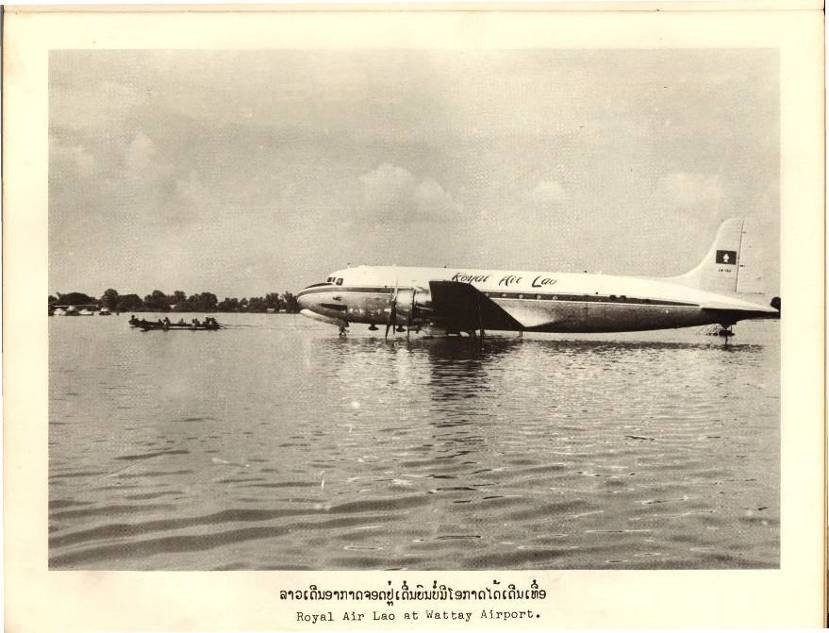
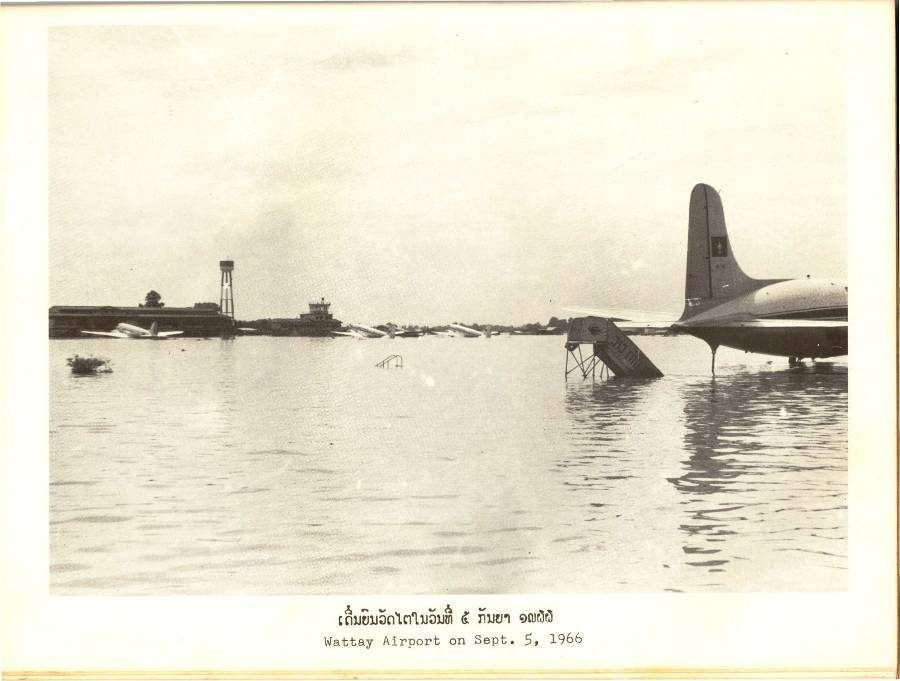
Appendices
The terminal building at Wattay Airport.
The runway at Wattay Airport with a stranded Dakota.
The flooded runway at Wattay Airport.
Page 81
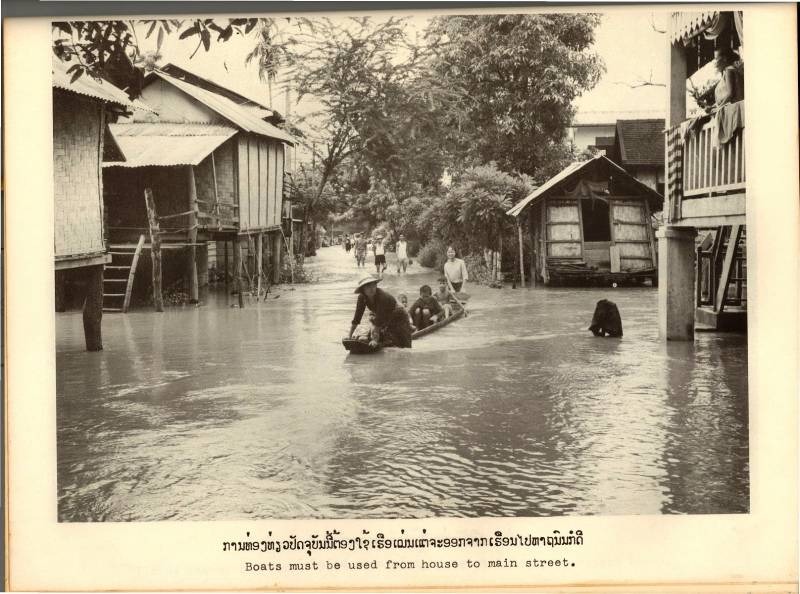
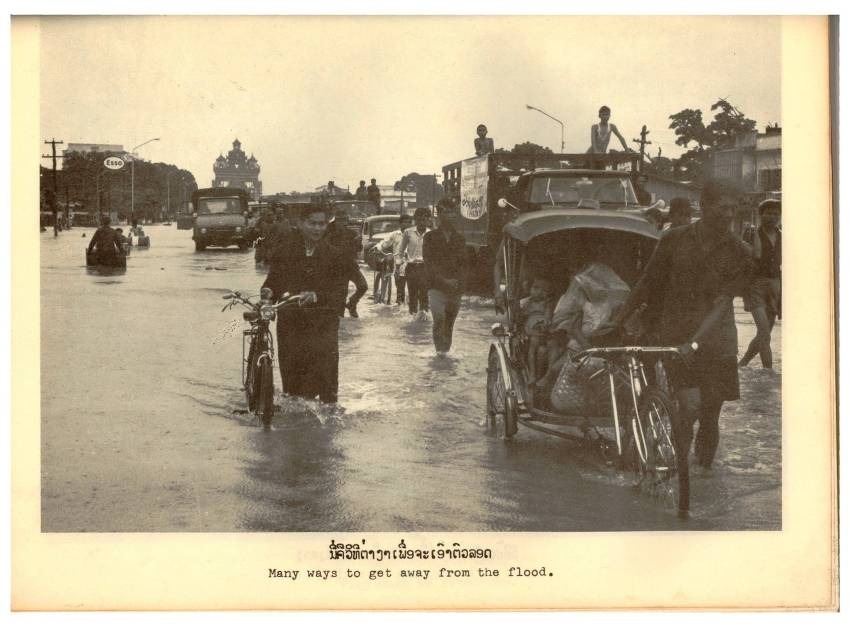
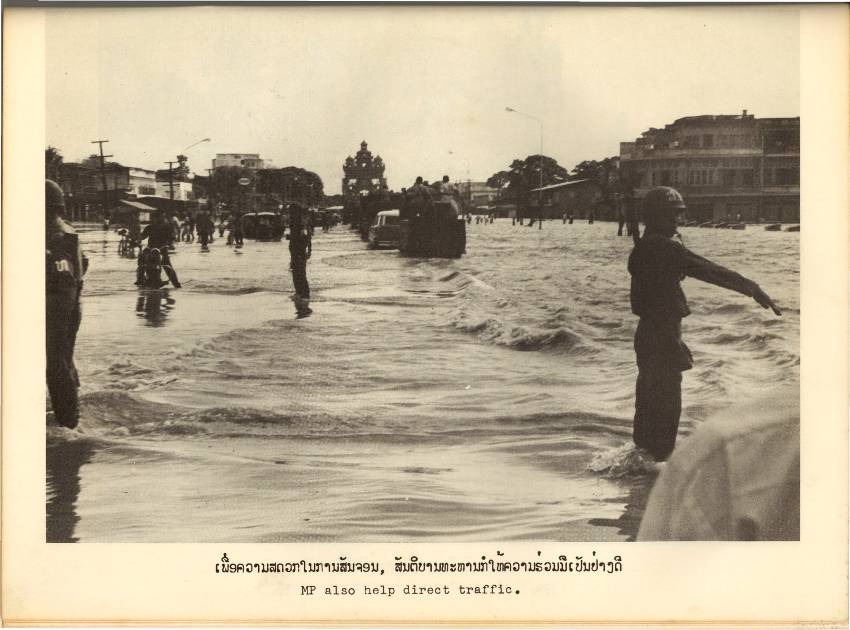
Annual Mekong flood report 2008
Flooded road.
Traffic struggles along the flooded Lang Xiang Avenue.
Soldiers direct traffic on Lang Xiang Avenue.
Page 82
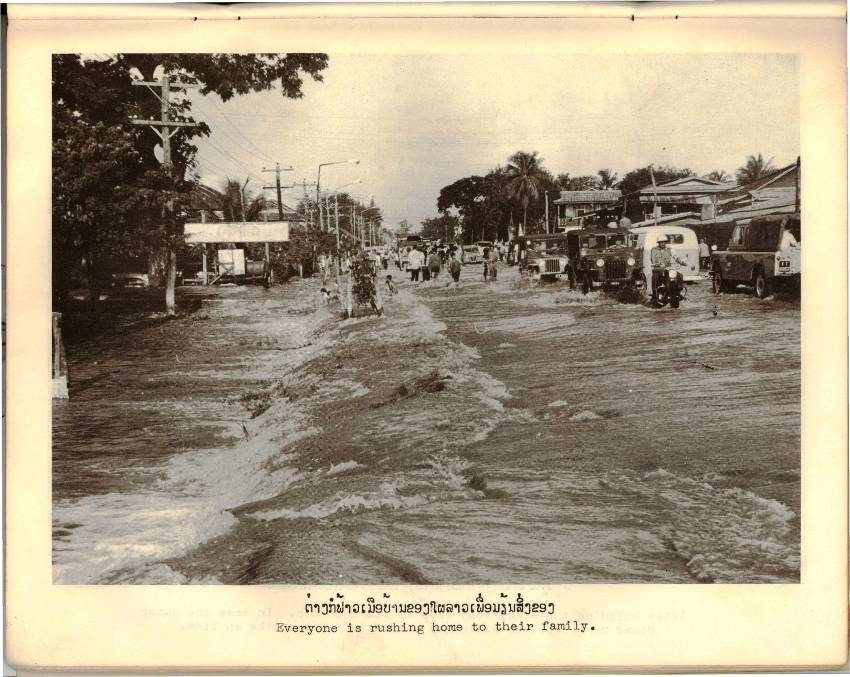
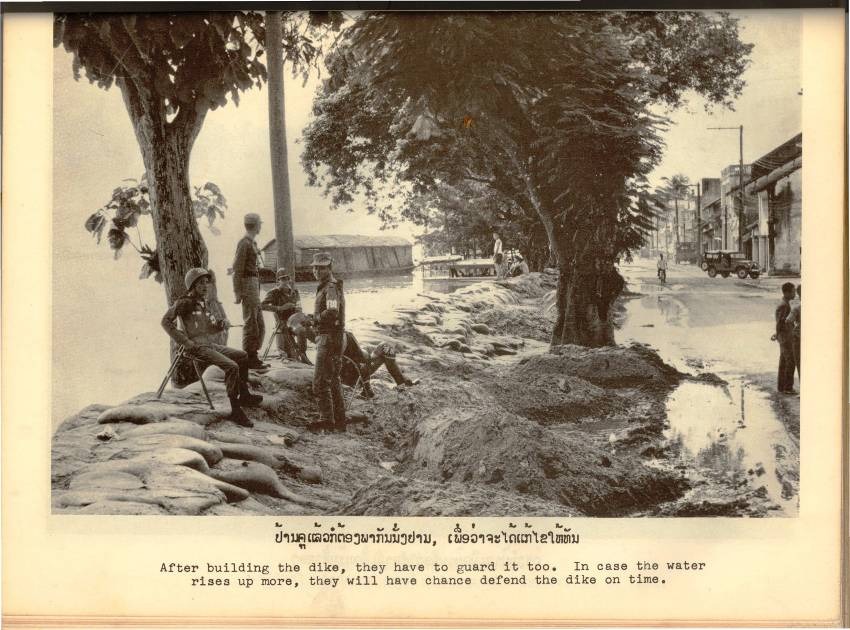
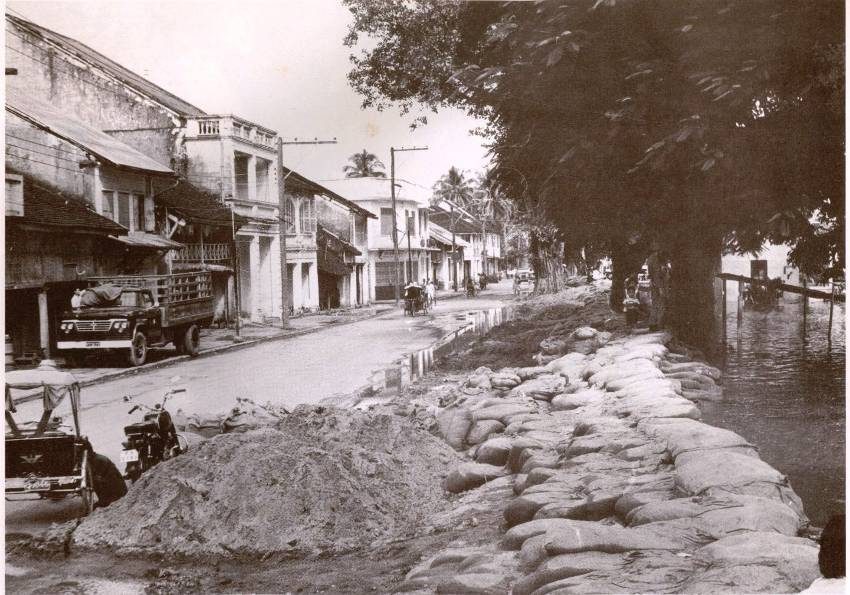
Appendices
High water velocities added considerably to the infrastructure damage.
Sandbags were laid to protect the river banks.
Sandbags were laid to protect the river banks.
Page 83
Annual Mekong flood report 2008
Page 84
Mekong River Commission
P.O.Box 6101, 184 Fa Ngoum Road, Unit 18, Ban Sithane Neua,
Sikhottabong District, Vientiane, Lao PDR
Telephone: (856 21) 263 263 Facsimile: (856 21) 263 264
E-mail: mrcs@mrcmekong.org Website: www.mrcmekong.org