

Global International
Waters Assessment
Regional assessments
Other reports in this series:
Russian Arctic ş GIWA Regional assessment 1a
Caribbean Sea/Small Islands ş GIWA Regional assessment 3a
Caribbean Islands ş GIWA Regional assessment 4
Barents Sea ş GIWA Regional assessment 11
Baltic Sea ş GIWA Regional assessment 17
Caspian Sea ş GIWA Regional assessment 23
Aral Sea ş GIWA Regional assessment 24
Gulf of California/Colorado River Basin ş GIWA Regional assessment 27
Sea of Okhotsk ş GIWA Regional assessment 30
Oyashio Current ş GIWA Regional assessment 31
Yellow Sea ş GIWA Regional assessment 34
East China Sea ş GIWA Regional assessment 36
Patagonian Shelf ş GIWA Regional assessment 38
Brazil Current ş GIWA Regional assessment 39
Amazon Basin ş GIWA Regional assessment 40b
Canary Current ş GIWA Regional assessment 41
Guinea Current ş GIWA Regional assessment 42
Lake Chad Basin ş GIWA Regional assessment 43
Benguela Current ş GIWA Regional assessment 44
Indian Ocean Islands ş GIWA Regional assessment 45b
East African Rift Valley Lakes ş GIWA Regional assessment 47
South China Sea ş GIWA Regional assessment 54
Mekong River ş GIWA Regional assessment 55
Sulu-Celebes (Sulawesi) Sea ş GIWA Regional assessment 56
Indonesian Seas ş GIWA Regional assessment 57
Pacifi c Islands ş GIWA Regional assessment 62

Global International
Waters Assessment
Regional assessment 64
Humboldt Current
GIWA report production
Series editor: Ulla Li Zweifel
Editorial assistance: Malin Karlsson,
Monique Stolte, Johanna Egerup
Maps & GIS: Rasmus G÷ransson
Design & graphics: Joakim Palmqvist
Global International Waters Assessment
Humboldt Current, GIWA Regional assessment 64
Published by the University of Kalmar on behalf of
United Nations Environment Programme
ę 2006 United Nations Environment Programme
ISSN 1651-940X
This report has been revised and updated since its fi rst publication 2005.
University of Kalmar
SE-391 82 Kalmar
Sweden
United Nations Environment Programme
PO Box 30552,
Nairobi, Kenya
This publication may be reproduced in whole or in part and in any form
for educational or non-profi t purposes without special permission
from the copyright holder, provided acknowledgement of the source is
made. No use of this publication may be made for resale or for any other
commercial purpose whatsoever without prior permission in writing from
the United Nations Environment Programme.
CITATIONS
When citing this report, please use:
UNEP, 2006. Permanent Commission for the South Pacifi c (CPPS).
Humboldt Current, GIWA Regional assessment 64. University of Kalmar,
Kalmar, Sweden.
DISCLAIMER
The views expressed in this publication are those of the authors and do
not necessarily refl ect those of UNEP. The designations employed and the
presentations do not imply the expressions of any opinion whatsoever
on the part of UNEP or cooperating agencies concerning the legal status
of any country, territory, city or areas or its authority, or concerning the
delimitation of its frontiers or boundaries.
This publication has been peer-reviewed and the information herein
is believed to be reliable, but the publisher does not warrant its
completeness or accuracy.
Publishing house: Kirjastusaktsiaselts MATS, Tallinn
Printed in Estonia by Tallinna RaamatutrŘkikoda, 2006
Contents
Executive summary
9
Abbreviations and acronyms
11
Regional defi nition
13
Boundaries of the region
13
Physical characteristics
13
Socio-economic characteristics
17
Assessment 22
Freshwater shortage
22
Pollution
24
Habitat and community modifi cation
30
Unsustainable exploitation of fi sh and other living resources
31
Global change
37
Priority concerns
39
Causal chain analysis
40
Pollution
40
Unsustainable exploitation of fi sh and other living resources
43
Policy options
47
Pollution
47
Unsustainable exploitation of fi sh and other living resources
50
Conclusions and recommendations
54
References 56
Annexes 65
Annex I List of contributing authors and organisations
65
Annex II Detailed scoring tables
66
Annex III List of conventions and specifi c laws that aff ect water use in the region
69
Annex IV Data on pollution
72
The Global International Waters Assessment
i
The GIWA methodology
vii
CONTENTS
Executive summary
The Humboldt Current region is located along western South America,
evident in areas of intensive agriculture throughout the region, whereas
stretching from the Ecuadorian-Colombian border (1░ N) to the south of
high concentrations of heavy metals are found in the south of Peru and
Chile (55░ S). A feature of the continental area is the Andean Mountain
north of Chile where mining is a major industry. To a lesser degree, the
range that extends along the entire region defi ning the catchment of
environment of the region is also aff ected by other sources of pollution
the Humboldt Current region. The countries in the region include parts
such as solid wastes, eutrophication and recurrent operational spills
of Ecuador, Peru, Bolivia, Argentina and the whole of Chile. The impacts
of hydrocarbons. Pollution is considered to aff ect the productivity of
of the areas in Bolivia and Argentina on the Humboldt Current region
coastal areas, causing signifi cant social and economic losses as well as
are negligible and therefore these countries are excluded from the
aff ecting the health of both humans and ecosystems.
report. The region contains a variety of coastal ecosystems, including
rainforests, reefs and mangroves within its tropical and subtropical
Overexploitation of fi shing resources in the Humboldt Current
zones, deserts along most of the coast of Peru and in the north of
ecosystem is the result of an over-dimensioned fi shing eff ort. Both
Chile, and extended coniferous woods, fj ords and glaciers in the
industrial and artisanal fl eets have increased in size and have put the
south of Chile. The marine area is characterised by a high productivity
sustainability of fi shing at risk. Most industrial fi shing is directed towards
(>300 gC/m2/year) and supports one of the most important fi sheries
small schooling fi sh such as anchovy, sardine and mackerel to supply
of the world.
fi shmeal and cannery plants. Some of these species are considered
highly or overexploited by the FAO. Although the fi shing of these
The total population in Chile, Ecuador and Peru reached 53.5 million in
species is a major source of employment, fi nal products are of low
2000, of which 74% is urban. In the Humboldt Current region the total
value. Other important fi sheries such as tuna and shrimp occur in the
population is estimated at 42 million (Landscan 2001). Drinking water
more tropical parts of Ecuador and the north of Peru. Around 150 000
and sanitation services vary from a moderate level of coverage in
artisanal fi shermen target mainly highly priced coastal resources
Ecuador and Peru to high levels in Chile. The most important socio-
such as shrimp, lobster, scallops, rock barnacle, and mussels. Some of
economic activities in the region are agriculture, fi shing, aquaculture
these fi sheries produce a high rate of by-catch and discards or cause
and mining, with the most industrialised areas located in Chile. An
habitat modifi cation as a result of using destructive fi shing practices.
important feature of the regional economy is petroleum extraction.
Aquaculture production has increased, although there are problems,
for example in the case of shrimp farms in Ecuador and Peru where
The GIWA regional Task team selected Pollution and Unsustainable
mortalities and low productivity have been results of pollution and
exploitation of fi sh and other living resources as the priority
poor management. Impacts of overfi shing include the reduction of
environmental concerns aff ecting the transboundary waters of the
income and/or employment, reduction of economic returns, loss of
region. This decision was justifi ed on account of their impacts on
fi sh resources, depletion of key species and changes in habitat and
economic, social and health issues both at present and in the future.
community structure.
Therefore, the Causal chain analysis focused on these two problems.
There is severe microbiological pollution of waters around the largest
The immediate causes of Pollution are microbiological and chemical
coastal cities of Ecuador and Peru. Chemical pollution from pesticides is
pollution from untreated municipal and industrial wastewater.
EXECUTIVE SUMMARY
9
Sectors associated with this pollution include urbanisation, industry
Governance: lack of incorporation of the regional ecosystem approach
and agriculture. The root causes identifi ed include: 1) Demographic:
in government strategies, confl ict among sectors, weak institutions
concentration of population in coastal areas, migration and the
responsible for enforcement of fi sheries regulations, and insuffi
cient
development of informal settlements; 2) Technological: inappropriate
adaptation to new criteria, concepts and trends in marine ecosystem
treatment of wastewater; 3) Economic: lack of resources to increase
management.
the sanitation coverage and to maintain treatment systems, lack of
mechanisms to promote private investments to reduce the pollution
To mitigate pollution problems in the Humboldt Current region,
charge, and lack of resources for supervision and control; 4) Legal and
two policy options were proposed: 1) Decentralise environmental
institutional: overlapping responsibilities in institutions in charge of
management; and 2) Harmonise criteria and environmental quality
supervision and control, and limited promotion of the implementation
standards and develop common indicator systems for environmental
of quality systems; and 5) Knowledge: inadequate understanding of the
management. These two options were assessed considering their
region's natural systems preventing an accurate determination of the
convenience, feasibility and acceptability. In the fi rst case, a change
carrying capacity of aquatic environments.
in the national strategies of each country to face pollution from a
centralised to a decentralised model is proposed, in which major
The most important immediate cause for Unsustainable exploitation
responsibilities are assigned to local governments (i.e. municipalities).
of fi sh and other living resources is overexploitation and the increase
This will simplify the identifi cation and selection of priorities at an early
in fi shing eff ort. To a lesser degree the reduction in recruitment levels,
stage in project development leading to an ecosystem approach that
changes in the distribution of the population and the reduction of
includes the participation of local stakeholders. In the second case, it
fi sheries habitat and nursery grounds are also of concern. Root causes
is intended that similar regulations and quality standards be set up at
include: 1) Economic: the increasing global demand for fi sheries products,
the regional level, taking advantage of existing regional cooperation
demand for key species to satisfy exigent markets, limited exigent
mechanisms such as the Plan of Action for the Protection of the Marine
markets for fi sheries employing environmentally friendly methods,
Environment and Coastal Areas of the South Pacifi c, through which
high profi tability, and politics to foment exportable products; 2) Socio-
several agreements and protocols have already been developed.
cultural: demand for fi sheries products to satisfy selective markets, and
Regarding the unsustainable exploitation of fi sh, three policy options
change in consumption habits; 3) Legal: insuffi
cient application of the
were considered: 1) Rationalisation of fi sheries; 2) Development of
responsible fi shing approach, lack of regional fi sheries management,
knowledge and indicators; and 3) Regulation of fi shing eff ort. The
and insuffi
cient application of modern management approaches; 4)
aim of these measures is to develop a fi sheries management system,
Technological: insuffi
cient use of technological advancements to assure
especially for the region's migratory species, implementing the
sustainable fi shing development; 5) Knowledge: limited application of
principles and practices of the "FAO Code of Conduct for Responsible
the ecosystem approach, low investment in research, training, education
Fisheries". For the sustainability of the fi sheries in the region it is vital
and the dissemination of information, lack of sustainability indicators
to develop research and indicators of regional change of the highly
at the regional level and dispersed and fragmented information at
dynamic fi sh populations that are currently exploited. This will allow a
the regional level concerning population characteristics; 6) Natural
better understanding of the ecological and physical variables driving
causes: increased eff ects of the El Ni˝o Southern Oscillation (ENSO); 7)
the Humboldt Current fi sheries.
10
GIWA REGIONAL ASSESSMENT 64 HUMBOLDT CURRENT
Abbreviations and acronyms
BCCL
Banco Central de Chile (Central Bank of Chile)
EMAP
Empresa Municipal de Agua Potable de Guayaquil, Ecuador
BCE
Banco Central de Ecuador (Central Bank of Ecuador)
(Municipal Freshwater Enterprise of Guayaquil)
BCRP
Banco Central de la Reserva de Per˙ (Central Bank of Peru)
ENSO
El Ni˝o Southern Oscillation
BOD Biological
Oxygen
Demand
ERFEN
Programme for the Regional Study of the El Ni˝o
CAAM
Comisiˇn Asesora Ambiental, Ecuador (Environmental
phenomenon in the South East Pacifi c
Advising
Commission)
ESPOL
Escuela PolitÚcnica del Litoral, Ecuador (Polytechnic School
CEPAL
Comisiˇn Econˇmica para Latinoamericana y el Caribe
of
the
Littoral)
(Economic Commission for Latin America and the Caribbean
FAO
Food and Agriculture Organization of the United Nations
ECLAC)
GEF
Global Environment Facility
CITES
Convention on International Trade in Endangered Species of
GIWA
Global International Waters Assessment
Wild Fauna and Flora
IATTC
Inter American Tropical Tuna Commission
CLIRSEN Centro de Levantamientos Integrados de Recursos Naturales
IFOP
Instituto de Fomento Pesquero, Chile (Institute for the
por
Sensores
Remotos
(Ecuadorian
Remote
Sensing
Centre)
Development of Fishing)
CNA
Cßmara Nacional de Acuacultura, Ecuador (National Chamber
IMARPE Instituto del Par de Per˙ (Peruvian Institute of Marine
of
Aquaculture
Research)
CONAMA Comisiˇn Nacional del Medio Ambiente, Chile INE
Instituto Nacional de EstadÝsticas, Chile (National Institute of
(National Commission of the Environment)
Statistics)
CONPACSE Coordinated Programme on Marine Pollution, Monitoring
INEI
Instituto de EstadÝstica e Informßtica, Per˙ (Peruvian Institute
and Control in the South-East Pacifi c
of Statistics and Information)
CPPS
Comisiˇn Permanente del PacÝfi
co Sur (Permanent
INOCAR Instituto Nacional Oceanogrßfi co de la Armada, Ecuador
Commission for the South Pacifi c)
(National Oceanographic Institute of the Navy)
DIGEIM
Direcciˇn General de Intereses MarÝtimos, Ecuador (General
INP
Instituto Nacional de Pesca, Ecuador (National Institute of
Division
of
Maritime
Aff airs, Ecuador)
Fisheries)
DDD Dichlorodiphenyldichloroethane
INRENA Instituto Nacional de Recursos Naturales, Per˙ (National
DDE Dichlorodiphenyldichloroethylene
Institute of Natural Resources)
DDT Dichlorodiphenyltrichloroethane
IOC
Intergovernmental Oceanographic Commission
DGA
Direcciˇn General de Aguas, Chile (General Division of Water)
ISO
International Standardization Organization
DIGMER Direcciˇn General de la Marina Mercante y del Litoral,
JICA Japan
International
Cooperation
Agency
Ecuador (General Division of Marine Aff airs, Ecuador)
LAC
Latin American Countries
DIRECTEMAR Direcciˇn General del territorio MarÝtimo y Marina
MPN Most
Probable
Number
Mercante, Chile (General Division of the Maritime Territory
NAFTA
North American Free Trade Agreement
and
Marine
Aff airs, Chile)
ONUDI United Nations Industrial Development Organization
UNIDO
ABBREVIATIONS AND ACRONYMS
11
OPS
Organizaciˇn Panamericana de la Salud (The Pan American
TED
Turtle Excluding Device
Health
Organization)
TSW Tropical
Subsurface
Waters
PCB
Polychlorinated biphenyls
TV
Taura viruses
PMRC
Programa Integrado de Manejo de Recursos Costeros, Ecuador
UNEP United
Nations
Environment
Programme
(Integrated Coastal Resources Management Programme)
UNICEF United
Nations
Children's
Fund
PNUMA Programa de las Naciones Unidas para el Medio Ambiente
WHO
World Health Organization
(United Nations Environment Programme)
WSSCC
Water Supply and Sanitation Collaborative Council
POP Persistent
Organic
Pollutant
WSSD World
Summit
on
Sustainable
Development
PROSET Regional Programme for the Protection of the South East
WSSV White
Spot
Syndrome
Virus
Pacifi c from Land-based Activities
WTO World
Tourism
Organization
SSW Subtropical
Surface
Waters
WWF World
Wildlife
Fund
List of figures
Figure 1
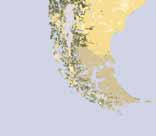
Boundaries and land use of the Humboldt Current. . . . . . . . . . . . . . . . . . . . . . . . . . . . . . . . . . . . . . . . . . . . . . . . . . . . . . . . . . . . . . . . . . . . . . . . . . . . . . . . . . . . . . . . . . . . . . . . . . . . . . . . . . . . . . 14
Figure 2
Marine currents in the Southeast Pacific. . . . . . . . . . . . . . . . . . . . . . . . . . . . . . . . . . . . . . . . . . . . . . . . . . . . . . . . . . . . . . . . . . . . . . . . . . . . . . . . . . . . . . . . . . . . . . . . . . . . . . . . . . . . . . . . . . . . . . . 16
Figure 3
Population density in the Humboldt Current region. . . . . . . . . . . . . . . . . . . . . . . . . . . . . . . . . . . . . . . . . . . . . . . . . . . . . . . . . . . . . . . . . . . . . . . . . . . . . . . . . . . . . . . . . . . . . . . . . . . . . . . . . . . . 18
Figure 4
Population growth in the Humboldt Current region 1980-2015.. . . . . . . . . . . . . . . . . . . . . . . . . . . . . . . . . . . . . . . . . . . . . . . . . . . . . . . . . . . . . . . . . . . . . . . . . . . . . . . . . . . . . . . . . . . . . . . . 18
Figure 5
Landings in the Southeast Pacific during the period 1995-1999.. . . . . . . . . . . . . . . . . . . . . . . . . . . . . . . . . . . . . . . . . . . . . . . . . . . . . . . . . . . . . . . . . . . . . . . . . . . . . . . . . . . . . . . . . . . . . . . . . 19
Figure 6
Families foraging a waste dump outside Guayaquil, Equador. . . . . . . . . . . . . . . . . . . . . . . . . . . . . . . . . . . . . . . . . . . . . . . . . . . . . . . . . . . . . . . . . . . . . . . . . . . . . . . . . . . . . . . . . . . . . . . . . . 27
Figure 7
Number of cholera cases in the Humboldt Current region between 1991 and 2001. . . . . . . . . . . . . . . . . . . . . . . . . . . . . . . . . . . . . . . . . . . . . . . . . . . . . . . . . . . . . . . . . . . . . . . . . . . . . 29
Figure 8
Peruvian catches of sardine and anchovy between 1950 and 2001. . . . . . . . . . . . . . . . . . . . . . . . . . . . . . . . . . . . . . . . . . . . . . . . . . . . . . . . . . . . . . . . . . . . . . . . . . . . . . . . . . . . . . . . . . . . . 32
Figure 9
Catches of the small pelagic fish in the Southeast Pacific between 1987 and 2001. . . . . . . . . . . . . . . . . . . . . . . . . . . . . . . . . . . . . . . . . . . . . . . . . . . . . . . . . . . . . . . . . . . . . . . . . . . . . . 32
Figure 10
Catches of tuna by the Ecuadorian purse-seine fleet. . . . . . . . . . . . . . . . . . . . . . . . . . . . . . . . . . . . . . . . . . . . . . . . . . . . . . . . . . . . . . . . . . . . . . . . . . . . . . . . . . . . . . . . . . . . . . . . . . . . . . . . . . . 33
Figure 11
Total shrimp production in Ecuador. . . . . . . . . . . . . . . . . . . . . . . . . . . . . . . . . . . . . . . . . . . . . . . . . . . . . . . . . . . . . . . . . . . . . . . . . . . . . . . . . . . . . . . . . . . . . . . . . . . . . . . . . . . . . . . . . . . . . . . . . . . . 33
Figure 12
Aquaculture production in Chile. . . . . . . . . . . . . . . . . . . . . . . . . . . . . . . . . . . . . . . . . . . . . . . . . . . . . . . . . . . . . . . . . . . . . . . . . . . . . . . . . . . . . . . . . . . . . . . . . . . . . . . . . . . . . . . . . . . . . . . . . . . . . . . 34
Figure 13
Decreased shrimp production as a result of pathogens.. . . . . . . . . . . . . . . . . . . . . . . . . . . . . . . . . . . . . . . . . . . . . . . . . . . . . . . . . . . . . . . . . . . . . . . . . . . . . . . . . . . . . . . . . . . . . . . . . . . . . . . . 35
Figure 14
Causal chain diagram illustrating the causal links for Pollution in the Humboldt Current region. . . . . . . . . . . . . . . . . . . . . . . . . . . . . . . . . . . . . . . . . . . . . . . . . . . . . . . . . . . . . . . 41
Figure 15
Causal chain diagram illustrating the causal links for Unsustainable exploitation of fish and other living resources. . . . . . . . . . . . . . . . . . . . . . . . . . . . . . . . . . . . . . . . . . . . 43
Figure 16
Fishermen pull their catch onto their boat off the coast of Peru . . . . . . . . . . . . . . . . . . . . . . . . . . . . . . . . . . . . . . . . . . . . . . . . . . . . . . . . . . . . . . . . . . . . . . . . . . . . . . . . . . . . . . . . . . . . . . . . 51
List of tables
Table 1
Population characteristics in the Humboldt Current region. . . . . . . . . . . . . . . . . . . . . . . . . . . . . . . . . . . . . . . . . . . . . . . . . . . . . . . . . . . . . . . . . . . . . . . . . . . . . . . . . . . . . . . . . . . . . . . . . . . . 18
Table 2
Water supply and sanitation coverage in the Humboldt Current region 2000.. . . . . . . . . . . . . . . . . . . . . . . . . . . . . . . . . . . . . . . . . . . . . . . . . . . . . . . . . . . . . . . . . . . . . . . . . . . . . . . . . . . 19
Table 3
Scoring table for the Humboldt Current region. . . . . . . . . . . . . . . . . . . . . . . . . . . . . . . . . . . . . . . . . . . . . . . . . . . . . . . . . . . . . . . . . . . . . . . . . . . . . . . . . . . . . . . . . . . . . . . . . . . . . . . . . . . . . . . . . 22
Table 4
Annual comsumption of pesticides in the Humboldt Current region during the 1990s. . . . . . . . . . . . . . . . . . . . . . . . . . . . . . . . . . . . . . . . . . . . . . . . . . . . . . . . . . . . . . . . . . . . . . . . . . 25
Table 5
Estimated monetary losses caused by the 1997-1998 El Ni˝o in Ecuador. . . . . . . . . . . . . . . . . . . . . . . . . . . . . . . . . . . . . . . . . . . . . . . . . . . . . . . . . . . . . . . . . . . . . . . . . . . . . . . . . . . . . . . . 38
Table 6
Estimated monetary losses caused by the 1997-1998 El Ni˝o in Peru. . . . . . . . . . . . . . . . . . . . . . . . . . . . . . . . . . . . . . . . . . . . . . . . . . . . . . . . . . . . . . . . . . . . . . . . . . . . . . . . . . . . . . . . . . . . 38
Table 7
The level of exploitation of the four most important schooling fishes in the South East Pacific.. . . . . . . . . . . . . . . . . . . . . . . . . . . . . . . . . . . . . . . . . . . . . . . . . . . . . . . . . . . . . . . . . 44
12
GIWA REGIONAL ASSESSMENT 64 HUMBOLDT CURRENT
Regional defi nition
This section describes the boundaries and the main physical and
Recurrent El Ni˝o Southern Oscillation (ENSO) events cause the
socio-economic characteristics of the region in order to defi ne the
collapse of the upwelling system, producing changes in abundance
area considered in the regional GIWA Assessment and to provide
and distribution of fi shery resources. The result is a domino eff ect
suffi
cient background information to establish the context within
with major social and economic impacts. These events also lead to
which the assessment was conducted.
sequential changes provoking an alternation in the abundance of
sardines and anchovies as the dominant species in the system. Such
changes may have negative consequences for the fi shing industry and
the economy of the countries in the region.
Boundaries of the region
The Humboldt Current region (GIWA region 64) includes marine
and terrestrial areas along the western coast of South America,
Physical characteristics
from Ecuador's border with Colombia in the north, through Peru
to the southern tip of Chile. The Galapagos archipelago, 1 000 km
Coastal area
off Ecuador, is also included (Figure 1). Parts of Bolivia and Argentina
Most of the regional geomorphology is determined by the Andean
fall within the boundaries of the Humboldt Current region but their
mountain range, which extends in a north-south direction through
impact is negligible on the region as a whole, and these countries are
the whole region. In Chile, the Andes Mountains constitute the eastern
therefore excluded from the report. The area constitutes a unique and
border of the territory and, in some places, reach over 6 800 m (e.g. Ojos
rich ecosystem with physical and ecological infl uences of the Humboldt
del Salado Mountain). The Andes Mountains run lengthways through
Current refl ected in its unique biota.
Peru and Ecuador where three naturally well-defi ned continental
regions are formed: the coastal or littoral region, the Andean or sierra
The Humboldt Current region's marine component is the world's largest
region, and the Amazonian or eastern region (CPPS 2001b).
upwelling area with a productivity of >300 gC/m2/year. The primary and
secondary productivity of this ecosystem supports some of the most
The Humboldt Current region covers a continental area of 2.3 million km2,
important fi sheries in the world. The upwelling is present all year around
equivalent to 17% of South America (CPPS 2001a). Peru covers an area of
on the Peruvian coast, but only during the spring and summer in Chile.
1.3 million km2 (55%), Chile 756 600 km2 (32%) and Ecuador 283 600 km2
Around 19% of the world's catches are from Peruvian and Chilean waters
(12%). The coastline extends 8 409 km and includes a great variety of
(FAO 2002a). The species are mainly pelagic schooling fi shes such as
ecosystems, from tropical rainforest at the Equator to the perpetually
sardines, anchovies and mackerel. There are other important fi shery
ice-covered lands in the south of Chile.
resources as well as species of conservation interest such as sea turtles,
birds and marine mammals.
The coast of Ecuador is 950 km long and is formed by a succession
of alternating bays and capes. The coast is predominantly cliff ed and
fronted by beaches. Cliff s extend southward to around 2░ S where the
REGIONAL DEFINITION
13


coast comprises a series of stepped marine
terraces. In the south, the dominant feature of
Quito
the coast is the Gulf of Guayaquil, an estuarine
Ecuador
system with a shoreline fringed by dense
Guayaquil
stands of mangroves and mudfl ats (EMAP/
DIGMER 1988, Arriaga & Vßsconez 1991, Cucalˇn
1996). Ecuador has
79 drainage
Landuse
rujillo
basins, 71
Quito
Developed
of which
Ecuador
Cropland
Peru
drain into
Guayaquil
Grassland
Callao
Lima
the Pacifi
c
Shrubland
Savanna
Ocean (Carrera
Ra
Forest
mis
de la Torre 1993,
Water
Trujillo
CAAM 1996). The insular
Wetland
Arequipa
Des
Peru
ag
Barren
ua
region of Ecuador includes the Galapagos
dero
Callao
Tundra
archipelago 1 000 km to the west off the
Lima
Snow or Ice
mainland. The archipelago is made up by 19
R
Bolivia
am
Ra
is
mi
islands between 1 and 4 500 km2 and 42 islands
s
Arequipa
Des
of less than 1 km2. The coastline of the 14 largest
agua
der
islands totals 1 400 km in length (Houvenaghel &
B o
o
Houvenaghel 1982).
livia
The coast of Peru is arid and extends for 3 080 km. It includes 53
major valleys running in an east-west direction. Deserts located
between these valleys comprise plains, hills and dry ravines. The
dry coastal forest in the north extends from the border of Ecuador
Santiago
to the south of the Lambayeque Department. A mangrove area,
small but unique in Peru, is located in the northern extremity
of the Tumbes Department, whereas the ecosystem of the
Santiago
Bio
Argentina
bÝo
hills extends along the coastal side of the Andes Mountains
(Jacinto & Cabrera 1998). Because of the hyper-aridity of the
BiobÝ
coast, the contribution of fl uvial sediments and the formation
o
Chile
of beaches are limited. Permanent rivers are few and most
Elevation/
rivers reach the sea only on a seasonal basis. The shoreline
Depth (m)
Chile
is rocky and interspersed with confi ned beaches fronting
4 000
river mouths. Between Chiclayo and Pisco there is a dense
2 000
1 000
network of rivers reaching the sea, favouring the formation of
500
100
coastal plains. However, south of Pisco there are few coastal
0
plains and the shoreline is formed primarily by towering
-50
-200
cliff s or small embayments with narrow beaches. Large sand
-1 000
dunes are found along the central coast of Peru. Shoreline
-2 000
displacement is evident in many locations of the Peruvian coast
500 Kilometres
with raised shore platforms and beaches (CPPS/UNEP/IOC 1988,
ę GIWA 2005
ę GIWA 2005
Soldi et al. 1988, Sßnchez & Zevallos 1987).
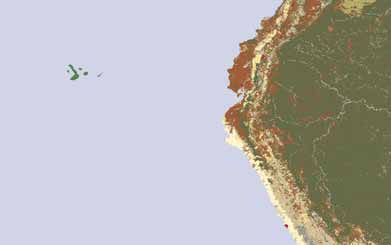
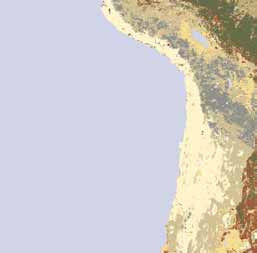
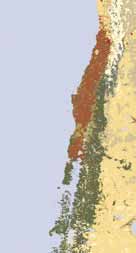
Figure 1
Boundaries (right) and land use (left) of the Humboldt Current.
(Source: based on USGS 2002)
14
GIWA REGIONAL ASSESSMENT 64 HUMBOLDT CURRENT
The northern two-thirds of the northern coast of Chile has characteristics
on the Amazon slope. Seventy-nine rivers drain into the Pacifi c, most
similar to the Peruvian coast. The Andean range comes to the sea and
on a permanent basis, but some of them dry up in summer. These
small confi ned beaches or alluvial embayments interrupt the cliff ed
rivers carry most water between January and April and transport a
coast where infrequent streams lead down to the shoreline. 700 km
high sediment load. In the north, the main rivers are Santiago and
of the northern zone correspond to a mega-cliff , where rocky coasts
Esmeraldas. The Esmeraldas River Basin extends over 21 420 km2 and
prevail for 580 km. Terraces appear along cliff ed headlands fronting the
around 2.5 million people (including the city of Quito) live and depend
foothills. From Arica to Coquimbo, the coast is narrow, open and cliff ed,
of its resources. The largest basin of Ecuador is the Guayas River in the
however, there are several shallow embayments suitable for ports (CPPS
central and southern part of the country with an area of 32 630 km2
2001b). In the central zone, coastal dunes develop in conjunction with
(Solorzano 1981, in CPPS 2001b). The total extraction of water resources
beaches, especially north of the river outlets. Confi ned beaches prevail
in Ecuador was estimated to be 17 km3 in 1997, of which 12.3% was for
from Valparaiso to Valdivia. The main dune fi elds are located between
domestic use, 5.6% for industry and 82% for agriculture. Due to the
29 and 42░ S (Morales 1995, Castro & Morales 1989 in CPPS 2001b). In
high availability of water resources there is no competition among
the south, the coastal range comes down to the sea and provides only
productive sectors (FAO 2000a). The potential of useable groundwater
modest embayments. South of Puerto Montt the coastal confi guration
in the Pacifi c slope has been estimated at 10.4 km3/ year. Groundwater
consists of broken glaciers, fj ords, islands and channels (CPPS/UNEP/IOC
exploitation in Ecuador is mainly for domestic and industrial uses (FAO
1988, Bore et al. 1988). The coastline has few infl exions, except in the
2000a).
southern part where it is separated into gulfs, islands, channels and
fj ords. Here the continental shelf is narrow, in places less than 10 km
Peru has three major hydrological systems that correspond to the slope
wide.
basins, Pacifi c, Amazon and Titicaca Lake. There are 106 drainage basins
carrying both surface and groundwater. In terms of total water resources,
In the Humboldt Current region, Dinerstein et al. (1995), distinguished
there is an abundance of available surface water and this constitutes a
11 ecoregions in two major ecosystems: the Northern Andean tropical
major potential. Nevertheless, water availability varies greatly over
rainforest in Ecuador and the southern South American temperate
time for climatic reasons. There is consequently a shortage of water
forest in Chile. Seven of these ecoregions are classifi ed as Biodiversity
resources on the Pacifi c and Titicaca Lake slopes and an abundance on
Priority I: Mountain forest (Ecuador); West Ecuador rainforest (Ecuador);
the Amazonian slope. An important feature of coastal Peruvian rivers is
Ecuadorian dry forest (Ecuador); Tumbes/Piura dry forest (Ecuador,
their temporary pattern with unstable fl ows. There is a short three- to
Peru); Chilean winter rainforest (Chile); Valdivia temperate forest (Chile,
fi ve-month period of abundance (December through to May) followed
Argentina) and Chilean brushwood (Chile).
by a long dry period with low water levels lasting seven to nine months
(May through to December). This has a negative eff ect on the country's
River basins
water requirements. Snowmelt and rainfall in the Andes Mountains also
Since the Andes Mountains run parallel to the west coast of South
produce river discharges on the Pacifi c slope with an average fl ow of
America, short and rapidly fl owing rivers are typical in coastal areas of
1 161 m3/s. Rivers with the greatest average fl ow are the Santa, Tumbes
the region. These rivers originate on the western slopes of the Andes
and Chira. The rivers running into the Titicaca have an average fl ow of
Mountains and fl ow westwards to the Pacifi c Ocean. Only a few rivers,
222 m3/s; the main rivers are the Ramis and Ilave. Only part of the basin
which fl ow across the northern and southern borders of Ecuador, are
belongs to Peru since it is shared with Bolivia.
considered transboundary.
Chile is characterised by a hydrological system of transverse valleys
Ecuador has 31 hydrological systems with 79 basins. These systems
running east-west. Rivers start both in the Andes Mountains and in
originate in two Andean springs; one drains into the Pacifi c Ocean
the coastal mountain range. In the north, rivers are short with low
through 24 basins over an area of 123 240 km2; the second, with seven
discharges; most of them do not reach the sea. The largest drainage
basins, drains into the Amazon region covering 131 800 km2. Ecuador
basin of Chile is the 440 km-long Loa River with a drainage basin
shares drainage basins with Colombia to the north with the San Miguel
covering 34 000 km2 (INE/CONAMA 2002). Due to convective rains in
Putumayo River Basin and with Peru in the south with the Catamayo-
the highlands during summer, some rivers acquire an alluvial character,
Chira and Puyango-Tumbes River Basins (CPPS 2001a). The total
with an estimated surface run-off of 30 400 m3/s (CPPS 2001b). The most
contribution of the Ecuadorian hydrological network, with a margin
important rivers in the transverse valleys are the Copiapˇ, Huasco, Elqui
of error of 30%, is 110 km3/year on the Pacifi c slope and 290 km3/year
and LimarÝ. They originate in the Andean sector and have permanent
REGIONAL DEFINITION
15
discharges due to the rains and snowmelt from the high mountains.
Maximum discharges are in December. In the central-southern region,
rivers have a seasonal pattern, with the highest discharges occurring
during the winter. The main rivers of this region are the Maule, Itata, Bio
Peru
Bio and Imperial. The Bio Bio River forms a drainage basin of 24 000 km2
Humboldt Ocea
along its 380 km waterway (INE/CONAMA 2002). Rivers in the south have
n Curr
larger discharges as a result of heavy rainfall and the regulatory action
ent
Bolivia
of temporary lakes formed by the rivers' discharges. The main rivers
are the ToltÚn, Valdivia, Bueno and MaullÝn. In the Patagonian region,
rivers run shorter courses which discharge to fj ords forming numerous
channels and transforming the western section into countless islands
at the southernmost part of Chile (CPPS 2001b). The main Patagonian
rivers include the Palaena, Cisnes, AisÚn, Baker and Pascua. The Baker
River forms another important basin covering 27 680 km2, of which
t
21 480 km2 are in Chile (INE/CONAMA 2002).
Marine area
Argentina
The South East Pacifi c Ocean is aff ected by the Equatorial current and
Humboldt Coastal Curren
Chile
its derivatives, the North and South Equatorial Currents, as well as the
Antarc
C
t
a
i
p
c
e H
Humboldt, Coastal Humboldt (or Coastal Peru) Current and the Colombia
Ci
o
rc
rn
um
Cu
p
r
Current. The Humboldt Current originates at 40 to 45║ S from the Antarctic
o
r
l
e
a
n
r
t
C
Circumpolar Current that meets the South American coast at about 50░ S
urren
(Figure 2). It is cold and rich in nutrients and characterised by numerous
t
gyres that create distinctive local counter-currents and upwellings.
ęęGIWAę2005
These waters support highly productive fi sheries off Peru and Chile. The
Figure 2
Marine currents in the Southeast Pacifi c.
Humboldt Current fl ows northward along the coast of Chile and Peru,
(Source: Redrawn from CPPS 2000b)
losing signifi cance at 5░ S where it meets the Equatorial Front and veers
off towards the west, becoming the westward South Equatorial Current
to 40 to 50 cm and a reduction in the availability of surface nutrients.
(Gallardo 1984, CPPS/UNEP/IOC 1988, Soldi et al. 1988).
Such changes have devastating consequences for pelagic fi sheries off
Chile, Peru and Ecuador, and for the marine fauna that relies on these
In the north of the region, Tropical Surface Waters (TSW) are predominant,
normally highly productive areas (Stevenson 1981, Cucalˇn 1986, Arcos
characterised by temperatures above 25░C and salinity below 33.5, as
1987). The El Ni˝o event has also been associated with coral bleaching,
a result of excessive rainfall over evaporation. South of 4░ S, Subtropical
mortality and changes in the abundance and distribution of seabirds,
Surface Waters (SSW) are found. These are characterised by having a
marine mammals and sea turtles (Stevenson 1981, Glynn & Wellington
salinity over 35, in response to the excess of evaporation over rainfall.
1983, Gallardo 1984, Robinson & Del Pino 1984, Cucalˇn 1986, 1996,
Towards the west, this water has temperatures up to 28░C due to a strong
Arcos 1987, CPPS/UNEP/IOC 1988, Soldi et al. 1988, f
insolation, whereas to the east in the sector of the Humboldt Current,
this water is modifi ed by the horizontal mixing of cold upwelling waters
Marine biodiversity
with temperatures between 15 and 19░C and a salinity of 35 or slightly
The marine area of the Humboldt Current falls within the following
lower (Wyrtki 1966, Stevenson & Taft 1971, Enfi eld 1975).
biogeographical categories: Western Inter-tropical (Ecuador-northern
Peru), Western Sub-tropical (northern Peru-central Chile), Western
Oceanographic conditions are dramatically altered during El Ni˝o
Temperate (southern Chile, 45░ S approximately), Sub-Polar and Polar
events. This is caused by large-scale changes in the ocean-atmosphere
Archipelagic (coastal). There are three coastal faunal provinces within
interaction. During the El Ni˝o, warm eastward-fl owing waters from
the Humboldt Current region: Panamanian (Ecuador), Peru-Chile
the Equator dominate the Humboldt Current causing changes such as
(southern Ecuador to Chile) and Magellan (southern Chile). The most
the increase of water temperature by up to 2 to 3oC, sea-level rises up
important coastal ecosystems are:
16
GIWA REGIONAL ASSESSMENT 64 HUMBOLDT CURRENT
Coral reefs
Mataje Mangrove Ecologic Reserve protects some small islands of the
Coral formations have their southern limit distribution in Ecuador
Mataje River Delta in the north of Ecuador. In Peru, there are 25 guano
around 1░ 30' S. They are present in the Galapagos Islands and Machalilla
islands protected by the Fishing Ministry (Acero et al. 1995, Jacinto &
National Park (mainland) (Glynn & Wellington 1983, CPPS/UNEP/IOC
Cabrera 1998). Important islands are Lobos de Tierra and Lobos de
1988). The presence of hermatypic (reef-building) corals has been
Afuera, Canape, Santa, San Lorenzo, Chincha, Sangalla and Isla Vieja
reported in areas around Pascua Island in Chile. There are 13 hermatypic
as well as hundreds of smaller islands (CPPS 2000a). In Chile, there
and 32 ahermatypic (non-reef-building) coral species in Galapagos, 30%
are hundreds of small islands and rocks in the southernmost part
of them endemic. The eastern Pacifi c coral reefs are neither extensive
forming several archipelagos (ChiloÚ, Guaitecas, Guayaneco, Alcalufes)
nor diverse, having an intermittent occurrence and little development
characterised by fj ords, channels and islands, many of which are
(Glynn & Wellington 1983).
included in the National System for Protected Areas (Benoit & Z˙˝iga
1995). The most important oceanic islands include Pascua Island, Sala
Mangroves
and Gomez Island and the Juan Fernandez archipelago.
Mangrove ecosystems are intermittent along the northern coast of
Ecuador (CayapasMataje estuary) and are the predominant community
Beaches, dunes and cliff s
in the Gulf of Guayaquil (Hurtado 1995a,b). The southern distribution
Ecuador has 423 km of cliff ed coast between 10 and 50 m in height and
limit is San Pedro, Peru (Acero et al. 1995). There are fi ve mangrove areas
1 256 km of open coast with more than 100 sandy beaches. In Peru more
in the region; three of them are included in the category "High Threat"
representative sandy beaches are located in the Paracas National Reserve,
(Dinerstein et al. 1995). The main mangrove species found in the region
Pisco and in several islands (Jacinto & Cabrera 1998). Chile has 7 000 km of
are: Rhizophora mangle (red); Rhizophora harrisonii (rusty), Conocarpus
coastline of which 700 km in the northern zone correspond to a mega-
erectus (button), Laguncularia racemosa (white); Avicennia nitida,
cliff . Between 21 and 33░ S, cliff s and shallow rocky coasts prevail. There are
Avicennia germinans and Pelliciera rhizophorae (black) (Schwartz 1982).
a few beaches, especially at Coquimbo-La Serena, Longotoma-Concˇn,
Chile Central, and Arauco-ChiloÚ. Most of them are embayments located
Wetlands
over shallow rocky platforms between promontories (CPPS 2000a).
Wetlands are found throughout the region. In Ecuador, 32 inland
wetlands have been inventoried. The most important are: the Ciudad
Estuaries and inlets
Laguna in the province of Esmeraldas (North Ecuador); La Segua in the
Estuaries are best represented in Ecuador. The Guayas River estuary
province of Manabi (central Ecuador); and 16 others in the southern
is the largest along the west coast of South America. The Ca˝ar and
provinces of Guayas and El Oro (South Ecuador) (Briones et al. 1997,
Jubones rivers also discharge to the Gulf of Guayaquil, whereas in the
2001a,b). There are also important wetlands in Peru such as the
north of Ecuador, the Santiago, Esmeraldas and Muisne rivers form their
Tumbes Mangrove National Sanctuary; Virrillß estuary, Piura; Balsar
own estuaries.
of Huanchaco, La Libertad; La Albufera of Playa Chica, Lima; Marshes
of Villa, Lima; Paracas National Reserve, Ica; MejÝa Lagoons National
Sanctuary, Arequipa; and Lagoons of Ite, Tacna (Jacinto & Cabrera 1998).
In Chile, coastal marshes are located around 40 to 43░ S within estuaries
Socio-economic characteristics
and behind sandy areas. There are salt marshes in the Gulf of Ancud,
where the presence of halophytes has been reported. It is estimated
Population
that 30% of the wetlands have been drained or otherwise disturbed,
In 2000 the three countries Chile, Ecuador and Peru had a total
although the degree of disturbance varies (CPPS 2000a).
population of 53.3 million, and it was estimated that 42 million of these
live within the boundaries of the Humboldt Current region (CEPAL
Islands
2001, Landscan 2001) (Table 1, Figure 3). It is estimated that there will
The Galapagos Archipelago is located 1 000 km off the coast of Ecuador
be 65.6 million people living in the three countries in 2015. Around 28%
and is one of the most important natural areas in the region. Other
of the region's population lives within 100 km of the coast. In 1999,
protected islands in mainland Ecuador are La Plata Island (Machalilla
74% of the coastal population lived in 56 urban centres, 22 of which
National Park) and Santa Clara Island in the Gulf of Guayaquil. The
are coastal cities with more than 100 000 inhabitants (CPPS 2001b).
Churute Mangrove Reserve embraces and protects several islands and
During the last two decades the population density in urban centres
small islands of the Guayas River Delta (Hurtado 1995b). The Cayapas-
has increased considerably.
REGIONAL DEFINITION
17
Table 1
Population characteristics in the Humboldt Current
100
region.
Urban
Rural
Population
Income
Illiteration
Overall
Infant
HDI
80
Country
below
<1 USD/day
rate
mortality
mortality
index**
t
ion
NPL* (%)
(%)
(%)
rate (%)
rate (%)
60
Chile
21
4.2
3
0.826
0.57
1.04
t of popula
40
r
c
en
e
Equador
35
20.2
4.8
0.722
0.58
4.48
P
20
Peru
49
15.5
5.4
0.737
0.62
4.30
0
Note: * National Poverty Line. ** Human Development Index.
1980
1990
2000
2005
2010
2015
(Source: CPPS 2001b, CEPAL 2001)
Year
Figure 4
Population growth in the Humboldt Current region
1980-2015.
(Source: CPPS 2000a)
Quito
Ecuador
In 1980, 65% of the population was urban, which in 2000 rose to 74% but
Guayaquil
with diff erences between the countries, with Chile having the highest
percentage of urban inhabitants at 86%. This tendency is not expected
to change substantially in the near future. Figure 4 shows the proportion
Trujillo
Peru
of urban and rural populations since 1980 and the projection up to
Callao
2015. Migration from rural areas has created large marginal settlements
Lima
around the cities without infrastructure and services. Most of these
Ram
Ram
is
is
new settlements are located in sites exposed to external dangers such
Arequipa
Desagua
as fl oods and landslides, as well as internal hazards such as health risks,
der
o
pollution and poor quality housing, aff ecting the quality of life and
Bolivia
increasing social gaps (CPPS 2001b).
The growth of marginal settlements is a major environmental problem
exacerbated by an unsustainable development model and a lack of
employment opportunities in rural areas. Consequently, almost 80%
of the poor population reside in slums, particularly in coastal cities. In
some cities, the marginal population is larger than the formal urban one.
Santiago
In Guayaquil, Ecuador, during the 1990s, marginal settlements housed
BiobÝ
one third of its urban population. In Peru, 1 045 new settlements
Argentina
o
(young towns) containing almost 67% of the total poor population
were established in coastal areas during the 1980s (CÚspedes 1990).
Chile
55% of the Peruvian population was considered poor in 2001 (INEI-
ENHIV 2004). Chile had 67 coastal communities with 12% of people
living below the level of extreme poverty in 1990 (Canales et al. 1990,
Population density
(persons/km▓)
CPPS 2000a, 2001b).
<1
1-2
The International Poverty Line Data shows that in 1996, Ecuador had
3-5
6-10
the highest number of inhabitants with incomes less than 1 USD/
11-100
0
500 Kilometres
>100
day (20.2%), Chile the lowest with 4.2% (1994), and Peru 15.5% (1996)
ę GIWA 2005
(CPPS 2001b). The statistics of illiteracy in 1998 were: Chile 3% of the
Figure 3
Population density in the Humboldt Current region.
(Source ORNL 2003)
population, Ecuador 4.8% and Peru 5.4% (CPPS 2001b). The Human
18
GIWA REGIONAL ASSESSMENT 64 HUMBOLDT CURRENT
Development Index (HDI) confi rms that Chile has a higher human
Economy
development standard than Peru and Ecuador (Table 1) (CPPS 2001b).
The economy of the region is primarily based on agriculture, fi sheries,
The infant mortality rate of Ecuador is the highest within the Humboldt
coastal industry, oil-related industry, ports and maritime transport
Current region and is above the Latin American average of 32 (Table 1).
(CPPS 2001b).
Infant mortality is closely linked to diarrhoeal diseases caused by
environmental pollution produced by untreated discharges of
Agriculture
municipal wastewater (CPPS 2001b).
Agricultural is one of the main economic activities in the region. In 1999
agriculture made up 12.9% of the GDP in Ecuador, 8.7% in Peru and 6.3%
Drinking water and sanitation service
in Chile. Ecuador and Peru are above the LAC average of 7.5% (CPPS
In the Humboldt Current region, only Chile has access to drinking
2001b). Arable land in 1998 totalled 7.2 million ha: 51.4% in Peru, 22.2%
water and sanitation services above the Latin American average
in Ecuador and 26.4% in Chile. Agricultural inputs are high, especially
of 91% coverage of drinking water and 81% coverage of sanitation
fertiliser and pesticides, required particularly for plantations of rice,
services, while Peru and Ecuador are below LAC standard (Table 2)
banana, cotton, sugar cane and potatoes. Data on fertilisers used for
(CPPS 2001b).
agriculture showed an incremental tendency during the period 1996-
1998. A total of 809 000 tonnes of fertilisers were used in 1998. Chile has
Around 30 million people have sanitation services in the three countries
the highest percentage of fertiliser consumption at 55.1%, Peru 23.6%
and 10 million have on-site solutions resulting in 13 million inhabitants
and Ecuador 21.3%.
lacking access to sanitation services (WHO/UNICEF/WSSCC 2001). The
lack of appropriate wastewater treatment and the low coverage of
Fisheries
drinking water service in Peru and Ecuador have been related with
FAO ranked the South East Pacifi c area as having the second highest
gastroenteric disorders such as gastroenteritis, typhoid, hepatitis A
fi shing production in the world, after the Northwest Pacifi c. The three
and a cholera epidemic during the early 1990s. Extreme environmental
countries included in the Humboldt Current region produce 99.5% of
conditions such as fl oods during El Ni˝o years contributed to the
the total catches of the South East Pacifi c. During the period 1988-1992,
problem carrying the pathogens agents with the water. The sanitation
catches averaged 14.2 million tonnes, 22% of the total world production.
service coverage improved during the 1990s, and most so in Peru where
FAO (1997) reported that 60% of demersal stocks and 70% of pelagic
coverage increased with 76%. The increases were more modest in Chile
species in the region were either fully exploited or overexploited.
with 12% and Ecuador 4% (WHO/UNICEF/WSSCC 2001).
However, the total production between 1995 and 1999 in the South
East Pacifi c averaged 14.5 million tonnes per year, practically the same
In Ecuador, 42% of the total population has sanitation services and
average as that between 1988-1992, despite a catch reduction of 42%
16% have on-site treatment and the situation in Peru is similar with 53
in 1998 due to the 1997-1998 El Ni˝o event (Figure 5).
and 21% respectively. In Chile the situation is far better with sanitation
services reaching 77% of the population while 16% rely on onsite
10ę0
00
treatment (WHO/UNICEF/WSSCC 2001). The situation varies between
Chile
Ecuador
Peru
9ę0
00
urban and rural populations in all three countries. The coverage of
8ę0
00
sanitation services are always much lower in rural than in urban areas
7ę0
00
nnes
(Table 2).
o 6ę000
5ę0
00
Table 2
Water supply and sanitation coverage in the Humboldt
housand t
T 4ę000
Current region 2000.
3ę0
00
Water supply coverage (%)
Sanitation coverage (%)
Country
2ę0
00
Urban
Rural
Total
Urban
Rural
Total
1ę0
00
Chile
99
66
94
98
93
97
0
1995
1996
1997
1998
1999
Equador
81
51
71
70
37
59
Year
Figure 5
Landings in the Southeast Pacifi c during the period
Peru
87
51
77
90
40
76
1995-1999.
(Source: WHO/UNICEF/WSSCC 2000)
(Source: GIWA Task Team)
REGIONAL DEFINITION
19
In Ecuador, fi shing and aquaculture products were the second largest
2001b). Other cultured resources include algae, crustaceans, molluscs,
export item in 1998 (1.2 billion USD), even higher than petroleum
fi sh and some invertebrates.
(920 million USD) (Hurtado et al. 2000). In 2001, the value of fi shing
products decreased to 660 million USD; 53% lower than in 1998 and
In Ecuador the shrimp industry constituted the third most important
22.7% lower than the average exported in the 1990s (820 million USD).
economic activity during the 1990s. In 1995, around 146 000 ha were
The decrease was mainly noticed in the shrimp production due to the
dedicated to this activity in the country (CLIRSEN 1996). In 1992, this
white spot disease, which aff ected aquaculture farms. Despite this
sector included 1 567 farms, 343 hatcheries, 95 packing plants, 26
dramatic decrease, fi shing and aquaculture products represented
factories for shrimp food, hundreds of enterprises providing supplies
21% of the total exportations during the 1990s and 14% in 2001
and services, and employed 68 000 people (Coello 1996). After 2000, the
(BCE 2002), indicating that they are still an important sector of the
productivity of this sector decreased, exports dropped from an average
Ecuadorian economy. In the period 1980-2001, 12.1% of the total export
of 720 million USD between 1994 and 1998, to 283 million USD in the
corresponded to shrimp (cultured and wild), 3.7% to industrialised
period 2000-2001 (BCE 2002).
fi shing products (fi sh meal, canned and others), 0.8% to tuna, and
0.6% to other fi shes. According to the National Institute of Fishing (INP
In Chile, aquaculture increased at a rate of 18.4% between 1994 and 1998.
1999) the fi shing sector plays an important social and economic role
Today it represents one of the most dynamic and important sectors of
in the country since thousands of people depend on it directly and
the country. The salmon fi shery is the most important (79%), but other
indirectly.
species including molluscs and algae are also harvested (FAO 2000c). In
1998 this sector produced 361 400 tonnes for human consumption or
In Peru, the statistics of the Central Reserve Bank (BCRP 2002) for the
raw material, generating until August a total of 535 million USD, 46.5%
period 1992-2001 show that fi shing exports are second only after
of the fi shing exports in that year (FAO 2000c). The aquaculture sector
mining, contributing more than agriculture, petroleum and industrial
generated more than 67 000 jobs in 1998, rising to 95 000 people if
products. Fishing exports represented 16.8% of the total, with an
indirect activities are considered (FAO 2000c). According to the National
annual average of 944 million USD, and contributing 0.57% to the GDP.
Service of Fishing, aquaculture production grew from 105 300 tonnes
During 2001, fi shing exports reached 1.1 billion USD or 16% of the total
in 1991 to 631 600 tonnes in 2001.
exportations, 19% more than the average recorded between 1991 and
2001, and contributing to 0.49% of the GDP. It is estimated that more
In Peru, aquaculture is just beginning and focuses on shrimps, trout and
than 80 000 people worked in fi shing and aquaculture during 1999 in
scallops. The activity has grown in recent years reaching a production of
both extraction and processing activities, which represents 0.9% of the
8 700 tonnes per year: 4 300 tonnes of shrimp, 2 600 tonnes of scallops,
urban working population in Peru (FAO 2002c).
1 600 tonnes of trout and 200 tonnes of other species (FAO 2000a).
In Chile, fi shing and aquaculture export, between 1996 and 2001,
Tourism
produced an income of 986 million USD per year, which represents
According to the World Tourism Organisation, 3.5 million tourists visit
5.6% of the total Chilean exports (BCCL 2002). Fishing products is the
the region every year and 48% stay on or near the coast (WTO 1997).
third most important item after fruits (7.5%) and cellulose, paper and
During the past decade tourism in Ecuador increased by 7% annually
others (6.3%). In 2001, landings reached 4.6 million tonnes: 4.2 million
(Ecuadorian Ministry of Tourism 2000). The Galapagos National Park
tonnes of fi sh (89%); 300 000 tonnes of algae (6.4%), 134 000 tonnes of
reported a total of 77 590 tourists in 2001, which represented one third
molluscs (3%), 26 000 tonnes of crustaceans (0.5%), and 48 000 tonnes
of the income generated by the receptive tourism sector in the country
of other species (1%) (National Board of Fisheries 2004). Fishing exports
(430 million USD) (NATURA/WWF 2002). This region possesses a high
in 2001 were 1 billion USD or 5.5% of the total exports, and 2.5% more
diversity of natural environments and ecotourism is a growing activity
than fi shing exports between 1996 and 2001. Fisheries contribute 1.4%
(CPPS 2001b).
to the GDP in Chile.
Mining
Aquaculture
Chile and Peru are among the largest producers of copper and silver in
Aquaculture provides employment in the coastal areas of the region
the world. Chile produces around 4.6 million tonnes of copper annually
and important socio-economic benefi ts. Shrimp farming represented
and accounts for 19% of global copper production and 11% of refi ned
almost 80% of the total value for regional aquaculture production (CPPS
copper. Chile has one of the largest copper reserves in the world with
20
GIWA REGIONAL ASSESSMENT 64 HUMBOLDT CURRENT
estimates surpassing 200 million tonnes, 34% of the global known
Oil
reserves (Astorga 2002). There were 427 mines and around 800 mining
Both Chile and Peru have off shore oil production. Pipelines are found
residual deposits in 1999 (UNEP 1999). Mining industries are located at
along the coast of the three countries. There are refi neries and a
Antofagasta, Santiago and Valparaiso. Mining in Chile contributed 9.6%
signifi cant amount of oil traffi
c in the region (CPPS 2001b). On the
to the GDP in 1990 and 11% in 2000 (INE/CONAMA 2002).
Ecuadorian coast, the oil infrastructure is concentrated in La Libertad,
where two refi neries process 6 400 m3 per day, and Esmeraldas with a
Peru contributes 3.1% to global copper and 1.7% of refi ned copper
capacity of 17 500 m3 per day. There is also an off shore platform for gas
production. Silver production totalled 1 820 tonnes in 1994 (CEPAL
extraction in the Gulf of Guayaquil. In Peru, oil production is carried out
1996). According to the Peruvian Ministry of Energy and Mining, 24
on the northwestern continental platform and oil is processed in two
companies with 30 mines were in operation in 1995 (UNEP 1999).
refi neries at La Pampilla and Conchan (UNEP 1999). In Chile, off shore
The contribution of mining to GDP was 2.4% in 1990 and 1.9% in 1994
platforms are located in the south (Punta Arenas) and in the Magellan
(CPPS 2001b). In Ecuador gold mining is concentrated in the south of the
Strait (CPPS 2000a).
country, in the provinces of Azuay and El Oro, with a total production
of around 10 tonnes. In Ecuador, mining has contributed 0.8% to GDP
Ports and maritime transport
since 1988 (CAAM 1996).
There are over 22 ports along the South East Pacifi c coastline with a
gross registered tonnage for cargo ships equivalent to 23.5% of the total
Industry
for the LAC (CPPS 2000a). Peru has 18 marine terminals with more than
The region is moving toward industrialisation. Chile ranks as the
10 000 tonnes of capacity; the most important are Callao, Chimbote and
most industrialised country in the South East Pacifi c; in 2002 industry
Salaverry (CPPS 2000a). Ecuador has four ports; the most important is at
accounted for approximately 19.3% of the GDP (INE/CONAMA 2002).
Guayaquil, which handled 3.9 million tonnes (67% of the total loading)
The food industry is the most important, followed by textile, chemical,
in 1993. It is expected the loading will increase to 6.5 million tonnes
wood pulp, paper, etc. In Chile there are around 311 industrial facilities,
by 2010 (JICA 1995). The Chilean ports of Valparaiso and Concepcion
with the highest concentration at Talcahuano. Wood pulp, paper and
receive almost 20% of the total loading (CPPS 2000a).
chemical sub-product industries are concentrated at Conception, and
the food industry is located at Antofagasta, Santiago and Valparaiso
Regional conventions
(CPPS 2000a). Chile exported 8.2 billion USD of industrial products
Countries of the region have developed regional mechanisms of
in 2000 (INE/CONAMA 2002). In Peru, most industries (65%) are
cooperation, including regulations and protocols to deal with pollution
concentrated in Lima (1 025 industrial facilities). In Ecuador, industries
from land-based sources, hydrocarbon spills and exploitation of fi shing
are concentrated along the coast, especially in the province of Guayas,
resources (CPPS 2003b). In 2002, countries of the region signed the
and include wheat fl our, fi sh canneries, vegetable oil, beer and soft
Galapagos Agreement for the management of marine resources on the
beverages, textile, paper, and steel. Packing plants comprise 33%,
high seas of the South East Pacifi c, which establishes a legal framework
canneries 29%, vegetable oil refi neries 6%, mills 4% and foundries 4%
for the exploitation and conservation of living resources beyond the
(CAMM 1996).
200 nautical miles of national jurisdiction. It is expected that these
regional instruments will facilitate the management of transboundary
issues such as those considered in this analysis. For more information on
regional conventions, protocols and projects see Annex III.
REGIONAL DEFINITION
21
Assessment
Table 3
Scoring table for the Humboldt Current region.
This section presents the results of the assessment of the impacts
Assessment of GIWA concerns and issues according to
The arrow indicates the likely
of each of the fi ve predefi ned GIWA concerns i.e. Freshwater
scoring criteria (see Methodology chapter)
direction of future changes.
T
T
shortage, Pollution, Habitat and community modifi cation,
C
C
Increased impact
A 0
No known impacts
A 2
Moderate impacts
IMP
IMP
T
T
No changes
C
C
Unsustainable exploitation of fi sh and other living resources,
A 1
Slight impacts
A 3
Severe impacts
IMP
IMP
Decreased impact
Global change, and their constituent issues and the priorities
ts
ts
identifi ed during this process. The evaluation of severity of each
core**
Humboldt Current
ts
ts
issue adheres to a set of predefi ned criteria as provided in the
vironmental
t
her community
v
erall S
chapter describing the GIWA methodology. In this section, the
En
impac
E
c
onomic impac
Health impac
O
impac
O
Priority***
Freshwater shortage
1.9*
2.5
1.9
2.0
2.2
1
scoring of GIWA concerns and issues is presented in Table 3.
Modification of stream flow
1
Pollution of existing supplies
2
Changes in the water table
2
T
C
A
Freshwater shortage
Pollution
1.9*
2.0
1.9
2.0
2.1
2
IMP
Microbiological pollution
2
Eutrophication
1
The Humboldt Current region has abundant freshwater reserves; most
Chemical
2
sources are linked to the Andes mountain range. Nevertheless, there
Suspended solids
2
are zones where water is scarce, e.g. the north of Chile and the central
Solid wastes
2
Thermal
1
and southern areas of Peru (CPPS 2001b).
Radionuclides
1
Spills
2
Environmental impacts
Habitat and community modification
2.0*
1.6
0
2.0
1.4
5
Modifi cation of stream fl ow
Loss of ecosystems
2
Modification of ecosystems
2
The fragmentary information available for the region does not provide
Unsustainable exploitation of fish
2.1*
2.8
0
2.0
1.8
4
evidence of modifi cations of stream fl ow. This issue was subsequently
Overexploitation
3
considered to have slight impacts. However, potential changes related
Excessive by-catch and discards
0
to upstream damming are expected in the future. Availability of water
Destructive fishing practices
1
Decreased viability of stock
0
resources was also considered. In general, climatic diversity and
Impact on biological and genetic diversity
1
geomorphologic distribution patterns are primary factors determining
Global change
1.6*
2.0
1.8
2.4
2.1
3
freshwater availability in the region.
Changes in hydrological cycle
2
Sea level change
1
Increased UV-B radiation
1
In Ecuador, there are signifi cant diff erences between estimations of
Changes in ocean CO source/sink function
0
2
water availability in the Pacifi c Andean slope, with 2 000 m3/inhabitant/
*
This value represents an average weighted score of the environmental issues associated to
the concern.
year, and the Amazon Andean slope, with 70 000 m3/inhabitant/year;
**
This value represents the overall score including environmental, socio-economic and likely
which explain water shortages in some specifi c locations in both coastal
future impacts.
*** Priority refers to the ranking of GIWA concerns.
and highland areas (Carrera de la Torre 1993).
22
GIWA REGIONAL ASSESSMENT 64 HUMBOLDT CURRENT
In Peru, the climate drives the distribution pattern and availability of
in the highlands estimated that the lagoons contain 3 028 million m3
water. Water resources are scarce in the coastal Pacifi c slope (2 885 m3/
of water (CPPS 2001b).
inhabitant/year), whereas the Amazon zone has an abundance of water
(800 000 m3/inhabitant/year). Additionally, the long dry spell lasting
In Chile, around 57% of the total water consumption comes from
seven to nine months (May to December), has a negative eff ect on the
surface waters and 33% from groundwater (CPPS 2001b). Despite this
water requirements of the country (CPPS 2001b).
large demand for groundwater, it is estimated that the drinking water
service in Chile is guaranteed despite serious droughts because the
In Chile, geographical and climatic characteristics have created
companies that provide the service have access to several water supply
independent basins between the Andes Mountains and the sea.
sources (CPPS 2001b).
Water resources are scarce in northern Chile but increase progressively
southward (CPPS 2001b). Dams have been constructed to regulate
Socio-economic impacts
surface water resources and the exploitation of groundwater resources
An estimated 15.7 million inhabitants in the region are exposed to
is expanding (CPPS 2001b). In Chile, water is abstracted predominantly
health risks due to a lack of access to safe drinking water. Most of
from surface resources and this is the reason why most of the rivers are
this population is from rural areas that migrated to marginal urban
"depleted" according to the authority responsible for regulating water
settlements causing an increased demand for freshwater and other
use (FAO 2000a).
services. Overpopulation is also causing the pollution of surface water
bodies since settlements are generally located along watercourses
Pollution of existing supplies
into which people discharge their untreated wastewater (CPPS 2001b).
Data from WHO/UNICEF/WSSCC (2001) show that 10.5 million inhabitants
Downstream communities, especially those located at the mouth of
(20.4%) in the region do not have access to drinking water services.
the rivers along the coast, are at great risk of contracting infectious
Another 5.2 million (10.2%) have "easy access" systems, which are
diseases, as a consequence of their exposure to these polluted waters.
considered a health risk especially for vulnerable populations. In total,
The problem is compounded by industries that dump either poorly
30.6% of the total population do not have access to safe water, either
treated or untreated effl
uents into natural water bodies.
by WHO or national drinking water standards. This issue was considered
to have a moderate impact in the region.
The deterioration in water quality is critical in some areas of Peru, due
mainly to pollution from effl
uents produced by industry, particularly
Changes in the water table
mining and metallurgy, which is aff ecting water supply sources and
Information about groundwater is fragmented and variable between
placing the health of the population at risk (CPPS 2001b). In addition to
the countries in the region. For example, in Ecuador, there is no available
diffi
culties in controlling and monitoring water quality, particularly in
information regarding changes in the water table, despite there having
the inland regions of the country, there is an indiscriminate use of raw
been increasing exploitation of aquifers. Since 2000, shrimp farmers
sewage due the lack of water in coastal cities and the seasonality of rain
of Ecuador have begun to construct farms inland using groundwater,
in the Andean region (CPPS 2001b).
as a strategy to avoid the white spot disease that aff ects the whole
coastal environment. However, there are no estimates of the volume
Conclusions and future outlook
of water used or the impact on the water table. Some confl icts have
Water shortages in the region can be attributed more to the lack
arisen between neighbouring farmers because of a risk that saline
of economic resources to increase the level of coverage than to a
groundwater will pollute land where rice, banana and other tropical
lack of water resources. The most vulnerable sectors are marginal
fruits are traditionally cultured.
settlements of large and median cities that are expanding at a higher
rate than municipal services coverage, as well as rural populations
In Peru, the exploitable reserves of groundwater are estimated to be
where infrastructure is expensive due to a low population density. This
2 740 million m3, and the current exploited volume on the Pacifi c slope
problem is particularly evident in Ecuador and Peru.
was estimated to be 1 508 million m3 for human, cattle, agriculture and
industrial consumption. This water is provided by 39 of 53 watersheds
by means of 8 009 open tubular and mixed wells. In both the Atlantic
and Titicaca Lake slopes underground reserves have not yet been
determined but are deemed not to be signifi cant. Studies carried out
ASSESSMENT
23
T
C
A
Pollution
IMP
the Humboldt Current region (UNEP 1999). Wastes are mainly discharged
into Maipo and Conception rivers (Cabrera 1994). CPPS (2001b) reported
In the Humboldt Current region, pollution is considered a serious threat
high concentrations of faecal coliforms at Antofagasta; historical data
for the health both of humans, and of coastal and marine ecosystems.
indicates that bacteria, viruses and parasites were associated with
Most of the pollution problems are related to the defi cient treatment
wastewater discharge (Table 3 in Annex IV). Diseases and mortality
of domestic and industrial wastewater, POPs used in agriculture and
caused by pathogenic bacteria include typhoid and paratyphoid
heavy metals from mine leachates (CPPS 2000a). Some countries in
fever, and diarrhoeal child diseases. In 1999, the volume of industrial
the region also suff er from endemic gastroenteric diseases related to
wastewater discharges was 49 million m3 (INE/CONAMA 2002).
poor quality drinking water and low sanitation standards. However,
the situation is not homogeneous within the region, with conditions
Eutrophication
in Chile exceeding those in Ecuador and Peru.
Nutrient enrichment of coastal waters stems mostly from enrichment
of rivers discharging into the coastal areas. It is estimated that around
Environmental impacts
81 000 tonnes per year of nitrogen and 7 100 tonnes per year of
Microbiological pollution
phosphorus enter the South East Pacifi c (Carrasco & Mu˝oz 1995).
In Ecuador, 95% of the domestic wastewater is discharged without
Agricultural run-off has a total input of 39 000 tonnes per year of
treatment (WHO/UNICEF/WSSCC 2001). The total discharge in Ecuador
nitrogen and 3 700 tonnes per year of phosphorus (CPPS 2000a). High
is estimated at 128 million m3/year, 10.4% of the total discharge in
values of nutrients have been found in areas with severe pollution
the Humboldt Current region. The Gulf of Guayaquil receives around
and continuous discharges such as the Gulf of Guayaquil in Ecuador
75% of the domestic discharges (UNEP 1999). The Guayas, Daule and
(GutiÚrrez 1989), Callao, Ilo and Ite in Peru, and Valparaiso, Concepciˇn,
Babahoyo rivers have the highest levels of faecal coliforms in the South
San Vicente and Bio Bio River in Chile (Z˙˝iga & Burgos 1996).
East Pacifi c and over 300 times the international water quality standards
(CPPS 2000a). Tourist beaches near Guayaquil City such as Posorja, Data/
Because of the importance of the fi shing sector in the region, residuals
El Arenal and Playas, the Santa Elena Peninsula and Bahia de Caraquez
from fi sh canneries and fi shmeal factories have been reported as one
in the province of Manabi, also show high concentrations of faecal
of the most signifi cant sources of nutrient enrichment in coastal areas,
coliforms (Monta˝o 1993, CPPS 2000a) (Table 1 in Annex IV).
especially in the north of Chile and in Chimbote, Paita and Pisco in Peru.
The lack of appropriate technology for wastewater treatment precludes
In Peru, 86% of domestic wastewater is untreated (Arauz & Campa˝a
the recovery of solids and oils from effl
uents, creating azoic zones and
1986 in CPPS/UNEP/IOC 1988). According to UNEP (1999), 435 million
eutrophication in closed areas such as El Ferrol, Chimbote, and Paracas,
m3/year of domestic wastewater is produced in Peru, 35.2% of the
in Peru, where the weak circulation enhances negative eff ects (CPPS
total discharge in the Humboldt Current region. Of this volume, 72.2%
2000a). High values of chlorophyll a and low levels of oxygen with
is discharged into the Callao and Mirafl ores bays, which explains the
a tendency to hypoxia are typically found surrounding these ports.
high values of coliforms reported in this area (Sßnchez 1996). High
The increase of organic wastes in the semi-enclosed bays of Peru
concentrations of faecal coliforms are also reported at Agua Dulce,
has produced red tides (IMARPE 2003). Red tides are more frequent
La Herradura, BahÝa de CarquÝn/Huacho, BahÝa Ferrol Chimbote, La Chira,
in spring and summer months and in several cases have caused the
Pampilla and Marbella (CPPS 2000a). Other coastal marine areas assessed
mortality of fi sh and invertebrates. In Chile, continental water bodies,
on an annual or semi-annual basis are Huarmey, SupeParamonga and
mainly lakes and rivers, show increasing levels of eutrophication. Lakes
Ca˝ete e Ilo; where levels of microbiological pollution moderately
such as Villarrica, Calafquen, Ri˝ihue and Llanquihue already present
exceed the permissible limits of the Peruvian General Law of Waters
mesotrophic states (Informe Pais 2002).
(Table 2 in Annex IV).
Aquaculture farms are another important source of nutrients in both
Chile has the largest sanitation coverage in the region and has an
continental and coastal waters. The organic matter from these farms
increasing number of treatment plants (CPPS 2001b). Furthermore,
creates favourable conditions for various pathogens and subsequently
there were almost 250 solid waste fi nal disposal facilities in 2000 (INE/
causes mass mortalities amongst the species being reared with
CONAMA 2002). However, WHO/UNICEF/WSSCC (2001) reported that
substantial economic losses. The production of cultured shrimp in
83.3% of the domestic wastewater is not treated. The total volume
Ecuador reached 160 000 tonnes in 1998 and the current production of
discharged in Chile is 627 million m3/year, 54.4% of the total discharge in
cultured salmon in Chile is 80 000 tonnes.
24
GIWA REGIONAL ASSESSMENT 64 HUMBOLDT CURRENT
Chemical pollution
In Peru, around 548 chemical products with a synthetic and biological
Major sources of chemical pollution aff ecting the marine environment
origin are used in pest and weed control, mainly phosphates and
in the region include (UNEP 1999, CPPS 2000a, 2001b):
chlorinates (UNEP 1999). Concentrations of pesticides in water and
Wastewater, which adds a variety of physical and chemical
sediments along the coast are shown in Table 5 in Annex IV. Residuals
substances produced by industrial activities located in urban areas.
of DDT and its metabolite DDE were also found in the River shrimp
Most of these wastes do not receive any treatment.
(Cryphiops caementarius) (DDTs < 5.8 ng/g). Fish such as Mullet (Mugil
Agriculture, which is the main source of pesticides through run-off
cephalus) and the Croaker (Menticirrhus elongates) had concentrations
and aerosols.
of Aroclor 1254 of 28.96 ng/g, and, in lower concentration, Aroclor 1260
Mine leachates and metallurgy.
(maximum 11.81 ng/g in M. elongatus); whereas DDTs were present in all
Oil spills, including maritime traffi
c and operational failures during
its forms in all tested species (Cabello and Sßnchez 2003).
loading and offl
oading.
Chile imported 243 types of pesticides with a total value of
Pesticides
67.7 million USD in 1993. In 1998, import of pesticides increased by
Between 1990 and 1998 the countries in the region used an average
almost 50% to 100 million USD and the types of pesticide increased
of 15 500 tonnes of pesticide annually, including 6 670 tonnes of
to 1 100, although decreased in 2001 to 437 (INE/CONAMA 2002). The
herbicides, 4 940 tonnes of insecticides and 3 900 tonnes of fungicides,
most used insecticides are organophosphates (64%) and chlorinated
bactericides and seed treatment pesticides (FAO 2002b) (Table 4).
hydrocarbons (32%) (UNEP 1999). The most used fungicides are
Highly toxic organophosphates and carbonates imported include
the carbonates (58%), and mercury compounds (11%). At Iquique,
Aldrin, Lindane, Mirex, and Heptachlor. Chile is the largest consumer of
organoclorines and phosphates such as Dipteryx, Malathion, Folidol,
pesticides in the region, using 69.5%, followed by Peru with 18% and
Afalon are used in agriculture. The presence of DDT, DDE and Lindane
Ecuador with 12.5%.
has been reported in Concepcion Bay, the Gulf of San Vicente and the
Gulf of Arauco and DDT traces were detected in samples from the Bio
Table 4
Annual comsumption of pesticides in the Humboldt
Bio River. The highest level of DDT has been found in the Gulf of Arauco,
Current region during the 1990s.
of DDE in the Gulf of San Vicente, and Lindane in Concepciˇn Bay (Table
Fungicides and
Insecticides
Herbicides
Total
Country
others
(tonnes/year)
(tonnes/year)
(tonnes/year)
6 in Annex IV) (CPPS/UNEP/IOC 1988). Pesticides recorded in southern
(tonnes/year)
and central Chile between 1980 and 1996 include DDT, DDE and variable
Ecuador
431.8
801
734.2
1 967
concentrations of Aldrin and Lindane (CPPS 2000a). Aldrin, Lindane,
Peru
1 504
848.7
409.4
2 762.1
DDT and DDE have been found in samples of molluscs (Perumytilus
Chile
3 007.3
5 023.4
2 756.1
10 786.8
(Source: FAO 2002b).
purpuratus and Aulacomya ater) in coastal areas of Burca, Lirquen and
Concepcion Bay between 1985 and 88 (Chuecas et al. 1989). Despite the
In Ecuador, most agricultural activity is concentrated in the Guayas
potential danger of POPs to the reproductive and immunology systems
River basin. Products include banana, rice, sugar cane, vegetables.
of marine fauna, no studies have been undertaken to assess the impact
This area used 70% (equivalent to 3 200 tonnes active ingredients) of
of these substances on local biota.
the total pesticides applied in the country (UNEP 1999). The banana
sector alone consumes around 2 400 tonnes of insecticide-nematicide
Heavy metals
annually, including some restricted chemical products. The presence
Regional assessments on heavy metals in coastal waters, sediment
of DDE, DDD, DDT, x-BHC, Mirex, Toxapheno and Aldrin pesticides in
and organisms of the region show that concentrations of copper
waters and sediments of major rivers and estuaries has been reported
(Cu), lead (Pb), cadmium (Cd), zinc (Zn), mercury (Hg) and chromium
(Table 4 in Annex IV). Concentrations of pesticides have also been found
(Cr) are related to municipal wastewater discharges and mining run-
in organisms; Lindane has been detected in shrimps at concentrations
off (CPPS/UNEP/IOC 1988, CPPS 2000a). The most widely distributed
of 4.17 Ág/kg, 0.4'DDE in crabs at 1.25 to 3.56 Ág/kg, Imazil in fi sh at
heavy metal in the region is copper (Tables 7-11 and 14-18 in Annex IV).
2.48 Ág/kg and Dieldrin in clams at 0.69 Ág/kg (INOCAR 2002b). Intriago
Concentrations between 3.1 and 4.8 ppb have been found in waters of
et al. (1994, in CAAM 1996) reported concentrations of Calixin and Tilt of
the region. In general terms, Chile has the widest distribution and the
0.018 Ág/l in water and 0.8 Ág/kg in sediments of shrimp ponds. These
highest concentrations of this heavy metal in its coastal environment.
fungicides are frequently used to control the "black sigatoka" fungus
In Peru, the contamination by copper is concentrated in the southern
disease aff ecting banana plantations.
part of the country (Rimac Basin and Callao Bay), and in the central zone
ASSESSMENT
25
(Chimbote area to the north). In Ecuador, the highest concentration of
Suspended solids
copper is found in the Gulf of Guayaquil. Regarding concentrations of
Sedimentation aff ects almost 60% of the region's coast. The lack of
copper in sediments, the highest have been reported in the Rimac River,
integrated basin management, deforestation, inadequate agricultural
Peru (109-3 200 mg/kg) and two Chilean cities Antofagasta (5 790 mg/
practices and overgrazing, are factors contributing to increasing
kg) and Coquimbo (4 520 mg/kg) (for ref. see Annex IV).
erosion, especially in the highlands. During the rainy season, large
quantities of suspended solids are deposited in coastal areas. This is
Concentrations of lead were reported near the main urban centres
especially evident in the Gulf of Guayaquil, where the Secchi depth in
throughout the region. The highest concentrations of lead in water
the inner estuary is 1-3 m and in the outer estuary 3-13 m. The annual
were found in the Gulf of Guayaquil (74.0 mg/l), the Rimac River
rate of sediment discharge from this area was estimated to be 2.5 million
(30.1 Ág/l), and Valparaiso Bay (9.5 mg/l). High concentrations of lead
tonnes. Critical areas identifi ed in the region include (Ayˇn 1981, Teves
in sediments were found in the Gulf of Guayaquil, Ecuador (12-218 mg/
1989, Morales and Castro 1989).
kg), Callao (388 mg/kg) and Paracas (269 mg/kg) (Table 12 in Annex
Ecuador: BahÝa de Carßquez, San Jacinto, San Clemente, Monta˝ita,
IV), Peru, and three sites in Chile: Antofagasta (2 718 mg/kg), Iquique
La Libertad, and Posorja.
(270 mg/kg) and Arica (269 mg/kg) (for ref. see Annex VI).
Peru: Lima Bay, El Ferrol Bay, Chimbote, Delicias Beach in Trujillo and
from Pisco to the Chilean border.
Cadmium is another heavy metal with high concentrations in the
Chile: developments in the dune zone, which are changing the
region. In the Gulf of Guayaquil, Ecuador, concentrations ranged
coastal morphology in the central-south coast of Chile (Loncura,
between 14.5 and <50 mg/l (Table 13 in Annex IV). Other areas with
Quintero Bay).
high concentrations were found in Chile between Valparaiso (0.32 ppb)
and Punta Arenas (10.1 mg/l).
In Peru from Pisco to Lima, there are high rates of coastal sedimentation,
except at Mirafl ores Bay where erosive processes occur.
High concentrations of zinc are present in several sites along the
northern and central coasts of Chile, from Iquique (91.0 mg/l) to
Solid wastes
Talcahuano (68.6 mg/l). The highest concentrations were found at Playa
A total of 2.3 million tonnes of solid wastes are produced every day
Ancha (139 mg/l). The maximum concentrations of zinc in sediments
in the Humboldt Current region. Between 0.5 and 1% of them are
were found in the Gulf of Guayaquil (556 mg/kg), Ecuador, the Rimac
discharged on beaches and a lower proportion goes directly into the
River, Peru (1 000 mg/kg) and Antofagasta in Chile (10 775 mg/kg) (for
ocean (Carrasco and Mu˝oz 1995, Sßnchez and Orozco 1997, Carrera de
ref. see Annex IV).
la Torre 1996, Delgado and Laguna 1995, Calero et al. 1996, Escobar 1996,
GutiÚrrez 1996, CPPS 2000a). The composition of solid wastes is organic
The highest concentrations of mercury were found in Peru and Chile.
matter (40-65%), paper and cardboard (10-20%), plastics (3-15%), metals
Paracas Bay in Peru had the highest concentration (1.4 Ág/l), while in
(1.5-3%), glass (2-3%) and others (2-8%) (CPPS 2000a).
Chile, the maximum concentrations were recorded at San Vicente (1.78
Ág/l) and in other specifi c localities: Burca, 1.1 Ág/l; Tome, 1.56 Ág/
The recollection of solid wastes is considered inadequate in Ecuador
l; Lirquen, 1.15 Ág/l; Andalien, 1.16 Ág/l. Chile also showed a wide
and Peru, where urban coverage is 70% and 75% respectively (Figure 6)
distribution of chromium from Arica (56.4 Ág/l) to Castro (59.5 Ág/l)
(CAAM 1996, Alegre et al. 2001). In contrast, the coverage in Chile is 99%
(for ref. see Annex IV).
(CONAMA 2002). Regarding the fi nal disposal of solid wastes, around
70% of the solid waste volume produced by the urban population
The presence of heavy metals in organisms (molluscs) was found in
in Ecuador is disposed in controlled dumping areas (Figure 6), 14% is
the north of Chile and south of Peru with a distribution pattern similar
discharged into gorges, open fi elds or rivers within urban perimeters or
to that of heavy metals in sediments. In general, these sites coincide
nearby areas, 2.8% burned and 4% buried (CAAM 1996). In Peru, 64.6%
with coastal areas that host mining activities that discharge washed
of the generated solid wastes in Lima are disposed appropriately; the
products into the sea. Other metals such as lead and cadmium show
rest is left in open areas and constitutes a source of disease. Industrial,
a wider distribution, and their highest concentrations in organisms are
hospital and other dangerous wastes are not disposed of separately
found in sites with mining-metallurgic activities. Studies of heavy metals
(Calderˇn 2001). In Chile, the fi nal disposal is in dumps and more than
in organisms have been carried out in 27 species of molluscs, 35 species
80% in sanitary landfi lls. In most of the region's cities, municipalities
of fi sh and seven species of crustaceans (CPPS 2000a).
directly carry out the solid waste collection and management, but in
26
GIWA REGIONAL ASSESSMENT 64 HUMBOLDT CURRENT
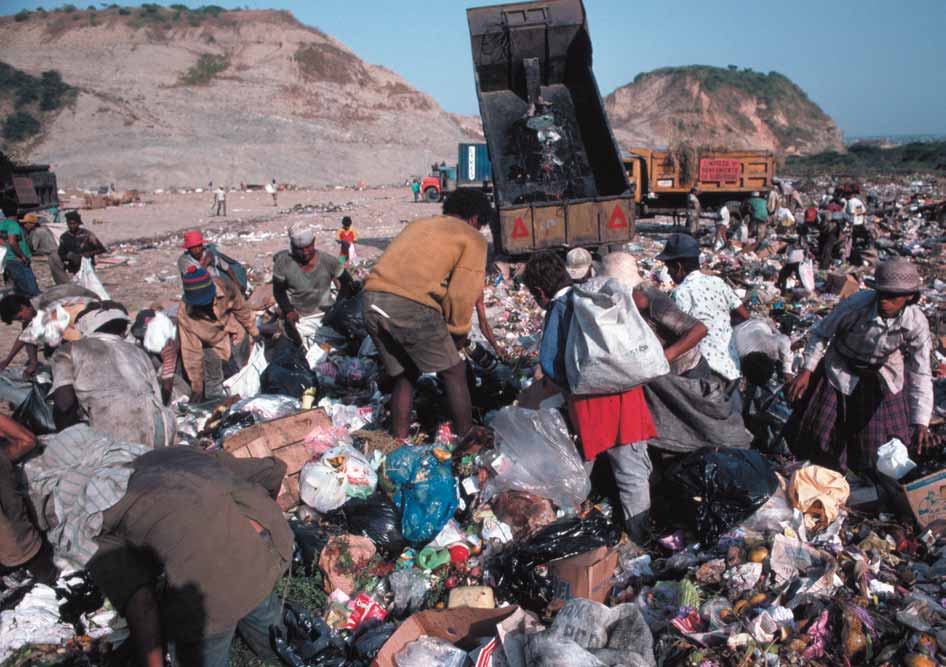
Figure 6
Families foraging a waste dump outside Guayaquil, Equador.
(Photo: CORBIS)
Chile the solid waste management is controlled by private enterprises.
mostly below the limit of detection and its presence in some samples
It is estimated that around 80% of the cities with over 50 000 habitants
is attributed to residuals from tropospheric and stratospheric fall-
have privatised garbage collection services (CONAMA 2000).
out following atmospheric nuclear tests carried out in past decades.
Radiological measurements in fi sh, crustaceans and molluscs between
Thermal pollution
1988 and 1995 in Chile demonstrated the absence of radioactive
There are several sources of land-based thermal pollution in the region
contamination. Similarly, values obtained for Cs-137 and K-40 between
but their environmental impact has not been documented. One case
1993 and 1996 by the Peruvian Institute of Nuclear Energy in samples
has been reported of sea turtles "trapped" in abnormally warm waters
of water and coastal sediments were below the minimal detectable
near thermoelectric plants in the north of Chile.
concentrations (CPPS 2000a).
Radionuclide pollution
Spills
The levels and distribution of radionuclides in coastal waters, organisms
Data from the 1980s indicates that 17 oil terminals and nine coastal
and at various diff erent sampling sites in the Humboldt Current region
refi neries were established in the region, which represents a potential
have been investigated by several scientists (CPPS 2000a, 2001c for
risk of spillage due to transport and operational failures. During a 15-
a review). From these studies it is concluded that levels of Cs-137 are
year period (before 1981), 448 accidental oil spills involving a total of
ASSESSMENT
27
1 430 m3 were reported (Vergara and Pizarro 1981). In general, low
in 1990 (CPPS 2000a). A high proportion of this wastewater, as well as
concentrations of hydrocarbons have been reported in the marine
industrial and commercial effl
uents, are collected in sewage systems,
waters of the Humboldt Current region; except where oil activity and
but most receive no sanitation treatment before being disposed of in
maritime traffi
c are concentrated.
water bodies. As a consequence, these water bodies contain a mixture
of chemical and biological pollutants that aff ect public health when
In Ecuador, spills related to operational failures were reported in several
the water is used for agriculture, aquaculture, recreation and human
ports, especially at Guayaquil City. Concentrations of hydrocarbons in
consumption. Untreated wastewater in the countries of the region is
surface waters are low, with the highest values reported during 1987-
more than 83% of the total wastewater produced, which is the cause of
1994 (0.2-5.15 Ág/l) (Table 1 in Annex VII). In January 2001 an accident
the high concentration of faecal coliforms found. In general, Chile is best
in the Galapagos Islands received worldwide attention due to the
prepared to face the problems associated with domestic wastewater
environmental sensitivity of the area. The tanker Jessica ran aground
management. Nevertheless, available information shows that waters
at Puerto Baquerizo, San Cristobal Island, carrying 360 m3 of bunker oil
receiving treatment are not equivalent to the level of coverage.
and 730 m3 of diesel.
Untreated domestic wastewater discharged into coastal waters is
In Peru, major spills have occurred in Lima, specifi cally at Conchan where
a primary source of contamination with pathogenic and chemical
there is a refi nery with the same name, and occasionally at Ventanilla
agents. It poses a major health risk, especially for immersion activities
where there is another refi nery called La Pampilla. There are 12 fuel
and for consumers of seafood products. Exposure to bacteria, viruses,
containers of various capacities; the largest are located at Eten, Salaverry,
parasites, fungi and a variety of other harmful substances can occur in
Chimbote, Supe, Callao, Pisco, Mollendo, San Nicolßs and Ilo. In these
the coastal environment through water intake, water inhalation as mist
areas there is a continual risk of oil spill. The largest spills occurred in
or dew, consumption of seafood, and dermal contact with waters and
1990 (22 300 m3 of kerosene) and in 1995 (more than 70 000 m3 of crude
sand. The inadequate sanitation conditions prevailing in the region
oil) (CPPS 2000a). Elevated concentrations of hydrocarbons in water and
are responsible for the high rates of child mortality and morbidity
sediments were reported in Talara, Callao, Ilo and Ite between 1985
in Ecuador and Peru, the countries with lowest sanitation coverage.
and 1996, the highest concentration was found at Chimbote with 0.55-
Infant mortality was estimated at 44 deaths per 1 000 live births in both
18.43 Ág/l (Tables 22 and 21 in Annex IV) (Jacinto and Cabello 1996).
countries (OPS 2001). In Peru, the main cause of death among infants
under the age of one was transmissible diseases, especially intestinal
In Chile, oil pollution is reported mainly in the coastal region at Puerto
diseases (25.1%). Diarrhoea is the main cause of morbidity, especially in
Quintero, San Vicente and Punta Arenas. Historically, Antofagasta and
children under fi ve years old in Ecuador.
Tocopilla are highly polluted due to the spillage of hydrocarbons (CPPS
2000a). INE/CONAMA (2002) reported 17 spills of hydrocarbons in Chile
The lack of basic sanitation, as well as poverty and poor diet, was
during 2000, including a large spill of 450 m3 of diesel at Caleta Cifuncho.
responsible for the 1991 cholera outbreak in the region. The fi rst cases
Concentrations of hydrocarbons of 0.25-2.08 Ág/l were reported in
were recorded in Chancay, a small fi shing village close to Lima, the
coastal waters during the period 1985-1988. Data for sediments in the
outbreak expanding rapidly along the coast from Ecuador to Chile.
period 1985-1995 showed that 83% of the samples had concentrations
An explanation for the simultaneous appearance of cholera in the
between 0.11 and 2.00 Ág/g (Tables 4 and 5 in Annex VII). The maximum
countries of the region is that zooplankton in the ballast water of oil
concentration was between 0.36 and 25 Ág/g (Ramorino 1994 in CPPS
carriers transported the vibrion. Cholera has a historic association with
2000a). Large spills occurred during the 1970s, but smaller spills,
the sea; the largest pandemics have occurred on the coastlines of the
particularly of diesel, occurred at a rate of 13 per year between 1990
world (Colwell 1996). Cholera vibrion can survive a long time in faecal
and 2002 (DIRECTEMAR 2003).
material and in the soil. In shellfi sh it may survive for up to two months
and on the surface of fi shes or in their intestines for 40 days. Contagion is
Socio-economic impacts
possible through bathing in seawater or consumption of contaminated
Pollution and its socio-economic consequences are matters of
shellfi sh (Piatkin & Krivoshein 1981).
increasing concern in the Humboldt Current region because of the
potential impacts on the quality of life of its inhabitants. Domestic
The OPS (2001) reported 797 929 cases of cholera in the region during
wastewater discharged in the region was estimated at 846 400 m3 and
the period 1991-2001; 88% of them during the fi rst two years. The most
the domestic contaminant charge at 222 400 tonnes of BOD per year
aff ected countries were Ecuador with 11.8% of reported cases and
5
28
GIWA REGIONAL ASSESSMENT 64 HUMBOLDT CURRENT
Peru with 88%. In Chile only 76 cases were reported during the 1990s
term impacts on health. Copper and cadmium are considered highly
crisis. Besides the better sanitation conditions in Chile, warmer waters
dangerous for marine ecosystems and pose risks for human health
in Peru and Ecuador provide more suitable ecological conditions for
when contaminated seafood is ingested (Z˙˝iga 1998).
microorganism development and transmission. Since 1993, the
incidence of cholera has steadily decreased, except for an increase of
Cadmium in the water originates from the manufacture and extraction
45 472 cases associated with the El Ni˝o event of 1997-1998 (Figure 7).
of zinc, soldering based on silver, metal baths, copper refi ning, lead
processing, fossil combustibles, municipal effl
uents, lubricants,
Other impacts of microbiological contamination reported in Peru
phosphate fertilisers, pigments, volcanic eruptions, etc. Copper is
include conjunctivitis, which is associated with polluted beaches
associated with mining, proximity to industrial zones, antifouling
(Echegaray 1986, in CPPS/UNEP/IOC 1988) and diarrhoea, intestinal
painting, non-ferric metal recycling, fertilisers, fungicides, wood
fevers, hepatitis and parasitism linked to the clandestine use of polluted
preservers etc. (OPS/OMS 1987, Zu˝iga 1998). In Chile there are 421
water for agricultural purposes (Sßnchez 1996). In Ecuador, Arauz and
processing plants for copper, of which 5% discharge directly into
Campa˝a (1986, in CPPS/UNEP/IOC 1998) reviewed historical data
coastal waters (Escobar 2002). Problems with eutrophication have been
about the presence of hepatitis A, intestinal infections and malaria and
reported only in salmon farms in the south of Chile, where harmful
identifi ed a possible link with faecal contamination.
algal blooms induced by agricultural run-off have resulted in severe
economic losses (Clement & Lambeye 1994 in CPPS 2001b).
400ę0
00
Conclusions and future outlook
350ę0
00
If the current population rate is maintained, it is estimated that, for the
300ę0
00
a
year 2020, discharges will increase by 95% and BOD by 80% (calculated
250ę0
00
5
from UNEP 1999, CEPAL 2001, WHO/UNICEF/WSSCC 2001). This will
200ę0
00
150ę0
00
necessitate signifi cant investment in sewage systems and treatment
ases of Choler
C
100ę0
00
plants to deal appropriately with such a volume of discharges. At the
50ę0
00
same time, it is necessary to obtain information concerning the amount
0
of organic matter entering the rivers and the sea, the natural depuration
1991
1992
1993
1994
1995
1996
1997
1998
1999
2000
2001
capacity of receptor bodies, the ecology of pathogen microorganisms
in wastewater and the eff ect of seawater on them. It is also important
Figure 7
Number of cholera cases in the Humboldt Current
region between 1991 and 2001.
to study the epidemiology of these pathogens, the possible vectors
(Source: OMS 2002)
and reservoirs, in order to determine whether or not they represent
a potential regional problem. The expected increase of wastewater
Pathogens are aff ecting activities that require high quality water such as
production will be a problem in the future because sanitary coverage
aquaculture. INOCAR (2001a) found concentrations of 1 000 MPN/100ml
is increasing at a slow rate in parts of the region.
total coliforms and 450 MPN/100ml faecal coliforms in the wastewater of
shrimp farms in the Gulf of Guayaquil, Ecuador. In Peru the presence in
Due to the lack of knowledge of the threshold limits of marine
2001 of hepatitis A at Paracas Bay resulted in the closure of the culture
ecosystems that are chronically aff ected by metals, it is important to
area of scallops because the European market stopped importation of
determine the tendencies of metal concentrations and their geographic
this product.
distribution. Elevated concentrations shown in this report are not
necessarily representative of the entire region since the monitoring
Data on heavy metal pollution presented in this report (Annex VI) show
eff ort was concentrated in known industrial and overpopulated areas.
that concentrations at some sites in the region exceeded international
The implementation of a systematic research eff ort is necessary in the
regulations by several times. The concentration of trace metals
region in order to assess the impact of heavy metals and persistent
increased due to the proliferation of industrial and domestic effl
uents,
organic pollutants on the biota and the ecosystem over the long-
endangering the coastal and estuarine ecosystems. However, the long-
term.
term eff ects of such chronic concentrations below the toxicity level
are unknown. Human exposure to even low concentrations of toxic
chemical pollutants in coastal waters would invoke serious long-
ASSESSMENT
29
T
C
A
Habitat and community
IMP
on the northern central coastline: Chone estuary (90% loss); Cojimies
modification
estuary (70% loss) and Muisne (79% loss) (Hurtado et al. 2000). These
mangrove areas are now considered critical and endangered (Dinerstein
Coastal biodiversity is being aff ected by contamination from municipal
et al. 1995). Mangroves in Peru, much less abundant than in Ecuador,
wastewater and other human activities that require land such as new
were lost at similar rates as a result of the construction of shrimp farms
towns, port facilities, aquaculture and agriculture. The increasing
and extraction of diff erent aquatic biological resources (INRENA 1995,
demand for natural resources to satisfy human needs such as housing,
Sßnchez & Orozco 1997).
wood, fi sh and shellfi sh, are stressing the ecosystems beyond their
capacity. Natural communities, especially those found close to large
In Chile some dune formations have been destabilised due to the
cities are more susceptible to eutrophication because of the discharge
elimination of vegetation cover, as a result of land reclamation
of high levels of nitrates and phosphates. In these areas changes in the
including marginal settlements (Castro & Morales 1989). Urbanisation
composition and spatial distribution of marine organisms have been
and agricultural activities were also factors in causing a loss of wetlands
reported over the last two decades; key species for both the fi shing
and coastal habitats in the region.
industry and for the ecosystem have disappeared from the Gulf of
Guayaquil, Ecuador (Solorzano 1981, in CPPS 2001b), the mouth of Rimac
Modifi cation of ecosystems
River in Lima-Callao, Peru (Guillen 1981) and at San Vicente, Conception
A moderate impact score was assigned to the issue because of the
Bay and the Bio Bio River mouth in Chile (Castilla 1983).
environmental impacts of mine discharges. On the Cha˝aral shore, in
the north of Chile, 150 million tonnes of mining run-off was discharged
During the 1980s and 1990s, aquaculture along the coast of Ecuador
into the bay in 1983-1984. This resulted in the reduction of the depth of
and northern Peru constituted a new anthropogenic incursion of an
the bay, a geomorphological deterioration and the total disappearance
important and fragile ecosystem, destroying important mangrove areas
of macrofauna on sandy shores and rocky benthos (Castilla 1983).
with devastating consequences. The governments of the countries
Copper concentrations of 16 630 ppm were recorded in soft ocean
have adopted and implemented stringent sanctions in order to halt
fl oor sediments (Castilla & Nealler 1978, Castilla 1983).
the destruction of mangrove areas for the rearing of penaeid shrimps.
In the south of Peru, Toquepala and Cuajone mines have been
Environmental impacts
discharging 90 000 tonnes per day of mining waste into the Locumba
Loss of ecosystems
River at Inglesa Beach, Ite, over 33 years. This material was distributed
Clearance of mangrove forests is probably the most evident example
along the beach, modifying the bottom and the habitat of marine
of ecosystem loss in the region. Mangroves are highly productive
organisms. The discharge of mining waste into the lowest 20 km of the
ecosystems with a high biodiversity. Located in tropical and sub-tropical
Locumba River has also been documented.
coastal regions, they play an important role in protecting the coast from
erosion and storms, and provide nourishment for the most important
In Ecuador, mollusc and crustacean habitats were lost in the Guayas and
commercial species. They also provide wood and food for coastal
Chone rivers due to the destruction of mangrove forests to construct
communities and have some capacity to cleanse wastewater produced
shrimp ponds. In the past decade closed seasons have been enforced
upstream. Due to the ecological and social importance of mangroves,
to protect depleted stocks of clams (Anadara tuberculosa and Anadara
loss of ecosystems was scored as having a moderate impact.
similis), shrimps (Litopenaeus sp.) and the Mangrove crab (Ucides
occidentalis) (GIWA Task team members pers. comm.).
Major losses of mangrove have been recorded in Ecuador, where
mangrove forests extended for over 193 000 ha in 1980 before the
Socio-economic impacts
shrimp farming boom. Facilities were built on low-lying saline lands
Economic impacts due to loss or modifi cation of ecosystems have
along estuaries, islands and river mouths, including mangrove areas.
not been well documented in the region. The sector most aff ected by
Between 1980 and 1990 the annual mangrove loss rate was 1.4% and
mangrove ecosystem loss is the artisanal fi shery, because the mangrove
during the 1990s, 1.1%. In 2000 mangrove areas totalled 147 000 ha,
is the habitat of commercial fi shes, molluscs and crustaceans. Shrimp
with a total loss of 24%. Almost one third of the 150 000 ha of shrimp
aquaculture has also been aff ected due to the reduction in the
ponds in the country were built in mangrove areas. The major losses
mangroves capacity to cleanse water, the increase of coastal erosion
of mangrove occurred during the period 1969-1995 in three estuaries
and the loss of nursery grounds for shrimps, among other factors. The
30
GIWA REGIONAL ASSESSMENT 64 HUMBOLDT CURRENT
T
C
A
economic cost of replacing the loss of the mangroves water treatment
Unsustainable exploitation of
IMP
function is estimated at 1 billion USD in Ecuador alone (Hurtado et al.
fish and other living resources
2000).
For more than 50 years the Humboldt Current region has been one
There are no available estimates for other habitat losses. Other
of the most important fi shing areas in the world. In 2000, catches
modifi cations to ecosystems associated with mining activities have
from Peru and Chile accounted for 15 million tonnes, around 19% of
been documented, but socio-economic information is not available.
global fi shing production (FAO 2002a). The most fi shed species are the
Health impacts associated with the loss or modifi cation of ecosystems
Peruvian anchovy Engraulis ringens, South American sardine (Sardinops
have not been identifi ed in the region. Social and community impacts
sagax), Chilean jack mackerel (Trachurus murphyi) and the Chub
include the reduction in the capacity of the region's ecosystems to meet
mackerel (Scomber japonicus). The Peruvian anchovy accounts for the
basic human needs, lost employment opportunities, confl icts between
largest proportion of fi sheries production by a large margin. However,
the users, and inter-generational inequity. The rural population is
changing environmental conditions are causing annual fl uctuations
aff ected directly but a chain of social impacts is expected.
and long-term changes in both fi sh abundance and distribution; and
subsequently the total production of commercial species. For example,
Conclusions and future outlook
in Peru, the most commercially important fi sh species in the 1960s was
Certain human activities have caused serious impacts on the fragile
the anchovy, a combination of the anchovy and sardine and, to a lesser
coastal ecosystems of the region. These may have been avoided if basic
extent, the Chilean jack mackerel and Chub mackerel in the 1980s, and
ecological studies had been undertaken to assess the vulnerability of
the anchovy again in the 1990s. During the past fi ve years the Peruvian
such communities to human activities. Besides pollution, already
fi shing industry has been sustained to 90% by anchovy and sardine for
reviewed in the preceding section, the environmental impacts of
the production of fi shmeal (IMARPE 2002a)
other activities such as the construction of dams, port facilities and
infrastructure on the coasts of the region were not considered.
Other important resources include several species of pelagic fi shes
Inadequately planned and constructed infrastructure has obstructed
such as tuna, shark and billfi shes as well as demersal species including
river courses, drained wetlands and increased beach erosion.
croakers and hake. Invertebrates include the Humboldt Current giant
squid (Dosidicus gigas) and a great variety of tropical and temperate
The destruction of mangrove forests in order to construct shrimp
molluscs, crustaceans and echinoderms.
ponds, was halted only following the outbreak of the white spot disease
in 1999, which caused mass mortalities and a collapse of the industry.
Environmental impacts
Although the virus was the etiological agent aff ecting the stocks, the
Overexploitation
most probable root cause was the poor management of soils and water
Small pelagic fi shery
during the previous two decades, which had caused disequilibrium in
Catches of the Peruvian anchovy peaked at 13.1 million tonnes in 1970
the ecosystem, allowing optimal conditions for the incubation of the
after which production declined from 1.7 million tonnes in 1973 to 94
virus and other pathogens. Today the industry is recovering and it is
000 tonnes in 1984 (Figure 8). Catches of other pelagic species such
unlikely that former mangrove destruction activities will be resumed
as the South American sardine, Chilean jack mackerel, and the Chub
after the damage caused by the disease.
mackerel increased after the collapse of the Peruvian anchovy in
1973. This increase occurred simultaneously in other countries of the
All of the countries in the region are now enforcing environmental
Humboldt Current region. The presence of other small pelagic fi shes
standards to minimise the impacts of human activities. The exigency
allowed the fi sh meal and oil industry to sustain production from the
of environmental impact assessments in the planning of public
mid-1970s to the mid-1980s, although a small proportion of the sardine
infrastructure developments, as well as an increase of the public
catches was canned. After this period, the stocks recovered, reaching
environmental conscience is favouring the adoption of environmentally
11.9 million tonnes in 1994, which decreased again to 1.7 million tonnes
friendly methods and technologies in order to limit the impacts of
in 1998 due to the eff ect of the El Ni˝o event of 1997-1998 (Figures 8
human activities on the region's ecosystems.
and 9).
The Peruvian anchovy is strongly dependant on environmental
conditions and it is now known that in the long-term the species pass
ASSESSMENT
31
1979. After the El Ni˝o of 1982-1983, landings continued increasing,
14
reaching more than 3.5 million tonnes per year. Part of the anchovy
Anchovy
Sardine
12
fl eet focused on the South American sardine to supply canning plants.
10
In 1991, catches began a steady decrease to a low of approximately
onnes
8
100 000 tonnes per year (Figures 8 and 9). A population analysis of this
species indicated that since 1986 there has been a steady reduction in
i
llion t
6
M
recruitment (Csirke et al. 1996). By 1994 the South American sardine
4
biomass (aged 3+ years) was around 2 million tonnes for the Peruvian
2
north-central stock, whereas it was more than 10 million tonnes in 1987.
0
An increase in the biomass of the South American sardine was observed
1950
1955
1960
1965
1970
1975
1980
1985
1990
1995
2000
during the El Ni˝o event of 1997-1998, especially of immature fi sh (1 and
Year
2 years) in 1998. However, the absence of anchovy made the fi shing
Figure 8
Peruvian catches of sardine and anchovy between 1950
and 2001.
eff ort focus on other available pelagic resources, the most important
(Source: GIWA Task team 2004)
being the South American sardine. After this period, its availability
14
decreased and a declining trend continues. The decline of this species
Anchovy
12
occurred in all the countries of the region. Peru has implemented
Sardine
Chileanę
mackerel
10
quotas and similar closed seasons as for the anchovy.
Chubę
mackerel
8
onnes
The Chilean jack mackerel is another species with notorious changes in
6
i
llion t
abundance and distribution. It is the main species of the Chilean fi shing
M
4
industry (SubsecretarÝa de Pesca de Chile 1998). There are no data on
2
landings before 1970 since annual catches were barely over 30 000
0
tonnes per year. However, in the early 1970s this species began to appear
1987
1988
1989
1990
1991
1992
1993
1994
1995
1996
1997
1998
1999
2000
2001
consistently as by-catch in local artisanal and industrial fi sheries. Chilean,
Year
Figure 9
Catches of the small pelagic fi sh in the Southeast
Peruvian and the former Soviet fi shing fl eets began targeting it by the
Pacifi c between 1987 and 2001.
mid-1970s and 1980s. Catches increased to almost 5 million tonnes in
(Source: GIWA Task team 2004)
1995 (Figure 9). Because of its transboundary regime and the possible
existence of subpopulation units, it has not been possible to make an
through diff erent stages of "equilibrium" and "population regimes".
assessment of its real level of exploitation. FAO (1997) characterised this
Because of its natural variability and poor resilience to intensive fi shing
resource as moderately and strongly exploited in the South East Pacifi c,
eff ort, the FAO (1997) recommended adopting specifi c monitoring
which indicates that the fi shery is operating at, or close to, its optimal yield
and control measures to prevent overfi shing. Peru set a limited fi shing
level. From 1996, catches continued to decrease to 1.5 million tonnes in
quota during the second half of 1997 to maintain the biomass above 4
2000. It is expected that this tendency will continue in the near future.
to 5 million tonnes in order to withstand the consequences of El Ni˝o.
Since 1999 landings of the Peruvian anchovy have increased again,
Catches in the region of Chub Mackerel before 1970 were between 10 000
reaching 10.8 million tonnes in 2000 and remaining constant through
and 30 000 tonnes per year. They rapidly increased to 836 000 tonnes in
2002. Several management measures are being taken by Peruvian
1978. Between 1988 and 1994 the maximum catch was 402 000 tonnes
authorities for this fi shery, including quotas and closed seasons during
in 1990 and then decreased to 79 000 tonnes in 1994 (Figure 9). Landings
the reproduction periods in February-March and August-September.
increased again by the end of the 1990s. Mackerel species have been
used for human consumption, fi shmeal and oil production. However,
The South American sardine is the second largest contributor to small
in 2002, the Peruvian government issued a decree declaring that these
pelagic production after the Peruvian anchovy. As previously mentioned,
species can be used only for direct human consumption.
the population of the South American sardine started to grow after
the El Ni˝o event of 1972-1973 and its consolidation in the system
Other important small pelagic resources in the region include the
was assisted by the collapse of anchovy stocks. Catches grew almost
Araucanian herring (Strongomera benticki), the Pacifi c thread herring
exponentially during the 1970s reaching 3.3 million tonnes per year in
(Opisthonema spp.) and the Eastern Pacifi c bonito (Sarda chilensis).
32
GIWA REGIONAL ASSESSMENT 64 HUMBOLDT CURRENT
Purse-seine tuna fi shery
exploited. Environmental conditions play an important role in giant
Ecuador has the largest tuna fl eet in the tropical Eastern Pacifi c.
squid availability. There is no national fl eet specialised in optimising
Statistics for the period 1990-2000 show an increasing trend in catch
catches. In the past years authorised foreign vessels in Peru and Ecuador
volumes (Figure 10). The most important species is the Oceanic
and part of the artisanal fl eet have been involved in its exploitation.
skipjack (Katsuwonus pelamis) accounting for 62% of the catches in
In 2002 the biomass of giant squid was estimated to be at least
2000, and also the Yellow fi n tuna (Thunnus albacares) (22%) and Big
800 000 tonnes.
eye (T. obesus) (16%) (CPPS 2003a). The health of the tuna purse-seine
fi shery is better than other fi sheries in Ecuador, and catches peaked
Shrimp trawling fi shery
in 1999 at 198 000 tonnes. This unique fi shery is under a regional
This is carried out only in Ecuador by a fl eet of 197 vessels (SubsecretarÝa
management framework and monitored for its sustainability through
de Pesca de Ecuador 1997). The shrimp production can be correlated
the Inter American Tropical Tuna Commission (IATTC).
with thermal anomalies; positive during El Ni˝o and negative during La
Ni˝a. During the El Ni˝o years of 1982-1983, and 1987, catches surpassed
Demersal fi shery
8 000 tonnes and in 1992 were over 13 500 tonnes (Figure 11). However,
The primary species in the demersal fi shing include the South Pacifi c
during the El Ni˝o of 1997-1998 catches were below the average of
hake (Merluccius gayi) and, more recently, the Patagonian grenadier
the 1990s and even the 1980s. In general, since 1992 there has been a
(Macruronus magellanicus) and the Patagonian hake (Merluccius
decreasing trend in wild shrimp catches. Coello (1996) characterised this
polylepis). Catches of these and other demersal fi sh such as sciaenids, eels
fi shery as overexploited by the mid-1990s, indicating that it surpassed
and several other coastal species peaked in 1988 with 550 000 tonnes.
the annual maximum production predicted and recommended eff ort,
Total catches then decreased, to 320 000 tonnes in 1993, and increased
estimated at 1 500-1 800 tonnes, by two to four times. This fi shery is also
to 415 000 tonnes in 1994. In Peru, a closure of the South Pacifi c hake
responsible for large amounts of discards (Little & Herrera 1991).
fi shery lasted until 1994. The fi shery was closed again in September
2002. In this case, overfi shing resulted from intensive fi shing eff ort and
Aquaculture
environmental conditions in combination (IMARPE 2002b). Demersal
The major aquacultures in the region are white shrimp farming in
resources show a variable degree of exploitation. However, there are
Ecuador and the north of Peru and the culture of salmonids, and
indications that the availability and abundance of some species are
to a lower degree the farming of molluscs and algae in open areas
decreasing compared to past decades.
in the south of Chile. The Ecuadorian shrimp culture started in the
1970s, reaching its highest production levels of 154 000 tonnes in
Giant squid fi shery
1998 (Figure 11). The activity extended over 180 000 ha of saline and
The most important fi shery of the Giant squid (Dosidicus gigas)
mangrove areas with land ponds. During the 1990s farms experienced
occurs along the coast of Peru. Catches increased signifi cantly from
several epidemics, but it was the white spot disease that led to the
10 000 tonnes in 1989 to at least 200 000 tonnes in 1994. Catches have
collapse of the industry in 2000 when production decreased to
fl uctuated in the past decade. Its wide distribution indicates that the
50 000 tonnes. In contrast, aquaculture production in Chile has been
population has two or three sub-populations available for exploitation.
steadily increasing since the 1980s. In 2001 the aquaculture production
The level of exploitation may be considered as under-exploited to fully
180ę0
00
ę
140ę
000
Aquaculture
160ę0
00
Bigęeye
Fishing
ę
120ę
000
140ę0
00
Skipjack
ę
100ę
000
Yellowęfin
120ę0
00
ę
80ę
000
100ę0
00
80ę0
00
ę
60ę
000
Tonnes
T
onnes
60ę0
00
ę
40ę
000
40ę0
00
ę
20ę
000
20ę0
00
0
0 1980 1982 1984 1986 1988 1990 1992 1994 1996 1998 2000 2002
1985
1986
1987
1988
1989
1990
1991
1992
1993
1994
1995
1996
1997
1998
1999
2000
Year
Year
Figure 10 Catches of tuna by the Ecuadorian purse-seine fl eet.
Figure 11 Total shrimp production in Ecuador.
(Source: GIWA Task team 2004)
(Source: GIWA TAsk team 2004)
ASSESSMENT
33
The shrimp-trawling fi shery has an extremely high rate of discards. Little
600ę0
00
and Herrera (1991) estimated that between March and November 1991
Molusk
Algae
the trawling catch in Ecuador was 15 700 tonnes, of which 11 700 tonnes
500ę0
00
Fish
(75%) were discards. Coello (1996) also referred to the underutilisation
of shrimp trawling by-catch and noted the impacts on other demersal
400ę0
00
resources. Kameya et al. (1991) reported that the high rate of discards in
nnes
T
o
300ę0
00
the shrimp-trawling fi shery in the north of Peru included 219 species:
124 of fi sh, 75 molluscs and 20 crustaceans. Sea turtles in particular
200ę0
00
(Lepidochelys olivacea) have been exploited and by-caught during the
last three decades. Little and Herrera (1991) estimated sea turtle by-
100ę0
00
catch between 8 178 tonnes and 11 064 tonnes per year. International
pressure obliged Ecuadorian authorities to enforce the use of Turtle
0
1991
1992
1993
1994
1995
1996
1997
1998
1999
2000
2001
Excluding Devices (TEDs) on shrimp trawlers by the end of the 1990s.
Year
Figure 12 Aquaculture production in Chile.
The mortality of thousands of small cetaceans every year in gill nets
(Source: GIWA Task team 2004)
and other artisanal gear has been documented in Ecuador (FÚlix and
reached 631 600 tonnes, an increase of 600% with respect to 1991, with
Samaniego 1994), Peru (Read et al. 1988, Van Waerebeek & Reyes 1994)
1 770 aquaculture facilities (CPPS 2003a) (Figure 12).
and Chile (Lescrauwaet & Gibbons 1994). The mortality of cetaceans
in the Peruvian purse-seine fi shery was estimated to be 0-0.13/task
Artisanal fi shing
(Bello 2001). The most aff ected species in Ecuador and Peru is the
Artisanal fi shing production is an important contributor to the region's
Common dolphin (Delphinus sp.). Some management measures
economy. There are 280 landing sites in Chile, 138 in Ecuador and 182
have been implemented in the region to reduce interactions of the
in Peru. It is estimated that there are around 150 000 artisanal fi shermen
South American sea lion (Otaria fl avescens) with fi sheries. Marine bird
and around 50 000 fi shing boats in the region (CPPS 1999). Artisanal
mortalities occur at a rate of one to two birds per 1 000 hooks in
fi shermen in Ecuador target large pelagic species such as shark, tuna,
Peruvian waters (Jahncke et al. 2001).
billfi sh and dolphin fi sh, as well as coastal, reef and estuarine fi sh
(sciaenids, gerrids, etc.) and invertebrates (shrimp, clams and crabs).
In Peru, there were also signifi cant discards from the hake fi shery by the
Peruvian fi shermen target mainly demersal fi shes such as hake, croakers,
mid-1990s, accounting for 20% of the total volume. Later, when a market
coastal fi shes and invertebrates (scallops, clams) and the Giant squid.
developed for small-sized species, discards decreased signifi cantly
Chilean artisanal fi sheries target hake and the Patagonian grenadier and
(IMARPE 2002a).
a great variety of coastal fi sh and invertebrates (scallops, sea urchin,
mussels, clams, oysters). Most of the artisanal catches are for local
Destructive fi shing practices
consumption.
The use of destructive fi shing practices in the region is under-reported.
In Ecuador the shrimp trawling fi shery operates 15-22 days every
Excessive by-catch and discards
month, 10 months of the year (Coello 1996), which implies a constant
The South East Pacifi c area was identifi ed as being fourth place in terms
mobilisation, suspension and mixing of marine sediment in areas where
of discards among the world's fi shing zones, with 2.6 million tonnes
such activity is conducted. There is no information, however, about
(Alverson et al. 1996). Although the Peruvian anchovy and the South
the impact of this fi shery on benthic communities. Another negative
American sardine fi sheries have very low by-catch rates (1-3%), the shear
aspect of the shrimp industry in Ecuador was the shrimp post-larvae
size of fi shing volume generates several hundred thousand tonnes of
fi shery carried out on beaches and in estuaries using fi ne-meshed
discards. There are no offi
cial reports in the region on discards in
nets that produce 80% by-catch: larvae and juvenile fi shes (8.3%),
industrial fi sheries since purse-seine vessels are not obligated to keep
non-commercial penaeids (10.5%), commercial penaeids (18.5%) and
records, except for the tuna fl eet, whose fi shery is under the control of
other crustaceans (62.7%) (Gaibor et al. 1992). The impact on the wild
the Inter American Tropical Tuna Commission (IATTC).
populations of both shrimps and non-target benthic species of fi sh,
crustaceans and molluscs is unknown in the region.
34
GIWA REGIONAL ASSESSMENT 64 HUMBOLDT CURRENT
In Peru a depletion of fi shing resources and changes in the composition
In Ecuador, the better-documented case is the Tilapia, an African
and abundance of species in coastal areas has been observed. This is
and Middle Eastern species, acquired in Brazil, and today a species
attributed to the deterioration of coastal ecosystems due to the trawling
commonly found in Ecuadorian rivers. Its presence in the Chone River
fi shery employing non-selective fi shing gear and the use of purse-seine
wetlands has provoked the displacement of the local species Chame
nets with a fi ne mesh that catch juveniles. Also, industrial vessels invade
(Dormitator latifrons) (Coello 1996). Another alien species is the Bullfrog
the fi shing areas assigned to the artisanal fi sheries and provoke confl icts.
(Rana catesbiana), a North American species brought to Ecuador from
Authorities in Peru have started to investigate the use of explosives in
Brazil. Alien species used for culture purposes in Ecuador include the
both industrial and artisanal fi sheries, since this practice is increasing
Bullfrog, the mollusc Argopecten circularis, Paloma pompano (Trachinotus
(IMARPE 2002a).
paitensis), Brine shrimp (Artemia salina), the zooplankton Brachionus
plicatilis and the diatom Dunaliella tertioleta (JimÚnez 2000). Although
Decreased viability of stock through pollution and disease
the magnitude of the impact on native populations is unknown, an
Diseases caused by bacteria, fungus and viruses in cultured shrimp
indirect aff ect could also occur due to the introduction of pathogens
(Litopenaeus vannamei) in Ecuador and Peru are periodically reported.
of diverse types such as intra-cellular bacteria, protozoan, bacteria and
Productivity has decreased as a result of mass mortalities and reduced
virus (JimÚnez 2000). It is estimated that at least 15 alien species have
growth rates. Figure 13 shows the reduction in the productivity of
been introduced in Ecuador.
shrimp ponds in Ecuador and its relationship with the presence of
pathogens. According to JimÚnez (1996), between 1989 and 2000 three
In Peru, alien species in the coastal marine environment have little
periods of low productivity occurred: in 1989, the seagull syndrome,
signifi cance in relation to alien species in continental waters. Cßnepa
associated with bacteria (Vibrio sp.); in 1992, Taura syndrome (associated
et al. (1998) reported 32 species, 14 in the coastal marine environment
with pollution by two fungicides used in banana agro-industry and a
(11 micro algae and three fi sh and molluscs) and 18 in the continental
virus (TV); and in 1999, the white spot disease (WSSV). Annual losses of
environment (16 fi shes and two crustaceans); seven of them failed to
600 million USD have been reported as a result of these diseases (CNA
adapt to the continental environment, and one fi sh species Prochilodus
2002). Moreover, the presence of the white spot virus in several marine
argenteus is maintained in quarantine. Three species were intentionally
organisms has been reported, indicating that wild shrimp populations
introduced for culture purposes, one accidentally and seven in other
are also at risk. This could explain the drop of wild shrimp catches in
ways. The alien oyster Crassostrea gigas, besides competing for space
Ecuador after 2000.
and food, could aff ect native species such as C. columbiensis and C.
corteziensis because of its larger size and high egg production (5
Impact on the biological and genetic diversity
070 million) with the risk of forming hybrids and causing negative
Introductions of alien species with culture purposes or through ballast
eff ects in the genetics of local populations (Canepa et al. 1998). The
waters has been a matter of concern in the region because of their
Argentine pejerrey (Basilichthys bonariensis), because of its feeding
ecological implications (CPPS 2003c). Around 400 species including fi sh,
habits, high fecundity (70 000 eggs) and ethology, is seriously aff ecting
reptiles, crustaceans, plankton, among others, have been introduced
local populations, putting several of them in danger. The Rainbow trout
either on purpose or accidentally in the countries of the region.
(Oncorhynchus mikiss), due to its carnivorous nature, has put the native
species Ictia suche (Trichomicterus rivulatus) at risk.
120ę000
ElęNi
oę1997-1998
In Chile, Bßez et al. (1998) reported 332 alien species for economic,
100ę000
ElęNi
oę1991-1992
recreational or ornamental purposes as well as for experiments and
80ę000
demonstrations: 14 micro algae, two macro algae, three cnidarians, six
nnes
T
o
ElęNi
oę1987-1988
60ę000
Tauraę
syndrome
molluscs, 11 crustaceans, four echinoderms, 287 fi sh, one amphibian,
Whyteę
spotędesease
and four reptiles. 43 of these species were introduced in the marine
40ę000
ElęNi
oę1982-1983
Seaęgullęsyndrome
environment. Alien species introduced include algae Porphyra spp.,
20ę000
Spirulina spp.; molluscs Pecten maximus, Crassostrea gigas, Haliotis
0
rufescens; crustaceans Litopenaeus vannamei; and several species of fi sh
1979
1981
1983
1985
1987
1989
1991
1993
1995
1997
1999
Coregonus sp., Salvelinus sp. and Salmo sp., among others.
Year
Figure 13 Decreased shrimp production as a result of pathogens.
(Source: CNA 2002)
ASSESSMENT
35
Socio-economic impacts
Losses from overfi shing have been identifi ed in some sectors. For
The fi shing sector plays an important social and economic role in
example, the white spot disease produced losses estimated at
the Humboldt Current region since thousands of people depend on
270 million USD in 2000, 59% less than the total export of 1999 (CNA
it directly or indirectly. For local economies, fi sheries are one of the
2002). There is no available information about the social impacts but it
most important export products, accounting for a major proportion
is evident that serious repercussions were derived from such a drastic
of the GDP.
reduction when more than 50% of the farms ceased operating, also
aff ecting many related activities.
In Ecuador, fi shing and aquaculture products were the second largest
export in 1998 (1 200 million USD), even higher than petroleum
For decades artisanal fi shermen have exploited marine resources
(920 million USD) (Hurtado et al. 2000). After 1999, these products
under a free access regime, which is known to have negative long-
decreased to 660 million USD in 2001; 53% lower than in 1998 and
term consequences for both resources and the associated economic
23% lower than the average exported in the 1990s (820 million USD).
activities (CPPS 1999). Such a regime would be the cause of alterations in
The reduction was mainly in shrimp production because of white spot
coastal resources and ecosystems. Overfi shing of coastal resources has
virus disease, which had previously been aff ecting the cultures. Despite
often ended through the establishment of closed seasons for formerly
this dramatic decrease, fi shing and aquaculture products represented
important products. However, the economic impacts of such a policy
21% of the total export during the 1990s and 14% in 2001 (BCE 2002),
are not always signifi cant because the artisanal fi shing sector is highly
indicating that they are still an important sector of the Ecuadorian
versatile and has found other alternative resources. Furthermore, the
economy. In the period 1980-2001, 12.1% of exports corresponded to
artisanal fi sheries products are mainly consumed locally and generally
shrimp (cultured and wild), 3.7% to industrialised fi shing products (fi sh
commercialised directly on the beach, making it diffi
cult to monitor
meal, canned and others), 0.8% to tuna, and 0.6% to other fi shes.
catches. In Ecuador the clams Anadara tuberculosa and A. similes and
the crab Ucides occidentalis are considered overexploited based upon
In Peru, the statistics of the Central Reserve Bank (BCRP 2002) for the
reductions in their market price, however their fi shing potential, fi shing
period 1992-2001 show that exports from fi shing are second after
eff ort and level of exploitation remains unknown (Coello 1996). In Chile
mining, but more than agriculture, petroleum and industry products.
the fi rst sign of crisis for the artisanal sector produced a long closed
Fishing represented 16.8% of the total exports with an annual average
season for the most important benthic resource of the coastal zone, the
of 944 million USD, contributing 0.57% to the GDP. During 2001 fi shing
Rock barnacle (named Loco) (Concholephas concholephas), in operation
exports reached 1 123 million USD or 16% of total exports, 19% more
for three years between 1989 and 1992. The establishment of a second
than the average recorded between 1991 and 2001, and contributing
closed season for the South Pacifi c hake in Peruvian waters is another
0.49% to the GDP. It is estimated that during 1999 more than 80 000
example of a response to the overexploitation of coastal resources.
people worked in fi shing and aquaculture in both extraction and
processing activities, which represents 0.9% of the urban working
Conclusions and future outlook
population in Peru (FAO 2000b).
Most of the pelagic and coastal fi sheries resources in the South East
Pacifi c are fully or overexploited (FAO 1997). The decline of some
In Chile, fi shing and aquaculture exports between 1996 and 2001
fi sheries is caused by several factors including: overdevelopment of the
produced an average annual income of 986 million USD, which
fi shing eff ort (fl eet, number of fi shermen); critical habitat modifi cation,
represents 5.6% of total Chilean exports (BCCL 2002). Fishing products
especially estuaries and mangroves in the coastal environment and
are the third most important export after fruits (7.5%) and cellulose,
the continental shelf in the oceanic environment; pollution from land-
paper and others (6.3%). In 2001, landings reached 4.66 million tonnes,
based sources; environmental forces; and the lack of integrated fi shing
of which 4.15 million tonnes were of fi sh (89%); 299 800 tonnes of algae
management policies with an ecosystem approach. It is evident that
(6.4%); 138 400 tonnes of molluscs (3%); 26 100 tonnes of crustaceans
the sustainability of fi sheries in the region is strongly dependent on
(0.5%); and 48 200 tonnes of other species (1%). Fishing exports in
future management measures to bring the fi sheries under appropriate
2001 totalled 1 010 million USD or 5.5% of the total, and 2.5% more
control.
than obtained in the period 1996-2001. Fisheries in Chile contribute
1.4% to the GDP.
The Peruvian anchovy, the South American sardine and the Chilean
mackerel provide striking examples of the relationship between
environmental conditions and resource availability. Overfi
shing
36
GIWA REGIONAL ASSESSMENT 64 HUMBOLDT CURRENT
produces a synergistic eff ect infl icting further damage to the
next 100 years, aff ecting most of the 4 000 km long coast. The sea-
ecosystem and causing important socio-economic impacts for the
level rise will exacerbate damage caused by fl oods and increase the
coastal populations of the region, especially during El Ni˝o events. The
height of waves. Changes in several coastal processes such as littoral
fragility of the Humboldt Current ecosystem to environmental forces
currents, wave breaking points and arrival direction, and the movement
has become increasingly evident as scientifi c knowledge of this highly
of sediments along beaches will change the sediment balance. Similar
complex ecosystem increases.
events could aff ect estuarine channels, causing variations in the water
volume exchange in each tidal cycle (CPPS 2000a).
Expected impacts on biological components of the region caused by
T
C
A
Global change
IMP
the rises in sea level and temperature, evaluated by the GIWA Task team
and coordinated by CPPS, include:
Environmental impacts
Changes in the composition of phytoplankton with lower values in
Changes in the hydrological cycle and ocean circulation
cell counts and the dominance of diatoms constrained in a narrow
It is expected that extreme natural events, such as El Ni˝o, will increase
coastal strip.
in frequency and intensity as a result of global change. The El Ni˝o
Changes in the abundance of oceanic species in the coastal
Southern Oscillation (ENSO) is a global ocean-atmospheric anomaly
plankton.
event responsible for signifi cant climate, oceanic, biological and
Presence of tropical species in the oceanic nekton.
ecological changes. The countries of the region particularly aff ected
by El Ni˝o are Ecuador and Peru.
These changes will seriously impact pelagic fi sheries in the region,
causing the disorganisation of schools, changes in abundance and
An example of the negative eff ects of fl ooding is the Daule River in
distribution patterns, and aff ect the reproduction and survival of
Ecuador, which increased its fl ow from 50 to 1 200 m3/s. Rain and
eggs and larvae. Furthermore they will result in a decreasing biomass
subsequent fl ooding covered and destroyed 185 000 ha of agricultural
and the creation of ecological gaps together with an alteration of the
land. The risk for human health increased, roads were destroyed and
prey/predator balance. Some species will experience an extension of
the life quality of both rural and urban populations deteriorated. In the
their distribution range, and the whole ecosystem will be subject to
ocean, environmental changes impacted the small pelagic fi sh fi sheries.
noticeable eutrophication.
In 1983, a 50% reduction of the total catch was recorded.
The warming of the equatorial areas might cause the movement of the
Sea-level change
benthic and pelagic fauna toward more temperate waters. In Chile, the
Since approximately 20% of the population in the region lives in cities
increase of upwelling and its southward expansion is expected, with a
next to the sea, the issue of sea-level change is of primary concern.
consequent increase of the pelagic fi shery, invasion of tropical species
There is evidence that the sea in at least one place in southern Chile
and probable changes in the food web (Aguilera et al. 1992). In Peru,
has been rising steadily for decades (CPPS/PNUMA 1997). Besides
global warming will produce similar eff ects as those produced during
fl ooding, the sea-level rise will compromise productive activities such
strong El Ni˝o events. The anchovy, the main fi shing resource, will move
as trading ports. In addition, agriculture, coastal springs and wetlands
southwards or downwards to colder waters. The sardine, although more
will be aff ected by saltwater intrusion and the disposal of domestic and
resilient, may do the same. The Chilean jack mackerel and the Chub
industrial wastes will be obstructed. Because the region is located on
mackerel would migrate nearer to the coast, becoming more accessible
a seismic area, vertical movements of tectonic plates may either mask
for fi shing. The eff ect on these species is in general negative, with a
or increase the problems.
tendency of reduction of size in the native species and an increase of
tropical ichthyofaunal diversity. The native benthic ichthyofauna will
An increase of the sea level by more than one centimetre could mean
also be negatively impacted.
a coastline retreat of between 50 cm and 1 m in low lands, especially
aff ecting estuaries and tourist beaches. The forecast increase by
2025 will erode the northern beaches of Chile (Teves et al. 1992).
Extrapolating the sea-level rise at a rate of 10 cm per each 0.5░C increase
will produce an average increase in Chile between 20 and 80 cm in the
ASSESSMENT
37
Increased UV-B radiation as a result of ozone depletion
fi shers. The same will occur in small coastal villages in the northwest
The increase of radiation may have serious eff ects on cattle farming and
such as Zorritos, Cabo Blanco, Matacaballo, Parachique and the village
human populations, especially in the southern areas of Chile where this
of San AndrÚs in the Pisco zone. Freshwater caption will be aff ected as
has been reported. There is no evidence of such impacts in Ecuador
well as the coastal recreational infrastructure. Losses of beach area at
or Peru.
Ventanilla are estimated at 7 million m3. Between Callao and La Punta,
basic infrastructure of both maritime transport and fi shing will be lost
Socio-economic impacts
(CPPS 2000a).
Extraordinary ENSO events are the only issues so far documented in
the region from a socio-economic perspective. In Ecuador, the ENSO
In the future, health and social and community impacts are expected
of 1982-1983 provoked an economic impact of 165 million USD (CEPAL
to increase due to sporadic extreme events that will cause damage
1983). The social sector (including houses destroyed or damaged,
to human life and property, increased costs of emergency response,
environmental damage, health, and education) was 13.1 million USD.
unemployment and income loss, and migration among others.
The transport sector lost 75.7 million USD, including destroyed and
damaged bridges, roads, urban infrastructure, and railroads. Agricultural,
Conclusions and future outlook
livestock and fi sheries sectors lost 41.9 million USD. Industry, including
Global change, as in other areas of the world, will have a strong eff ect
infrastructure, lost 25.2 million USD. Other sectors reported losses of
in the Humboldt Current region. Forecast impacts, especially those on
8.8 million USD.
coastal areas, suggest enormous economic losses to infrastructure and
the collapse of public services. A rise in sea level and UV-B radiation are
The ENSO event of 1997-1998 caused a loss of 533 million USD in
the main threatening features of the Global change concern because of
Ecuador and 3.5 billion USD in Peru. The
their direct eff ect on the population regarding health
Table 5
Estimated monetary losses
main sectors aff ected were agriculture
and economic aspects. Impacts on the biodiversity
caused by the 1997-1998
and transport in Ecuador and agriculture,
El Ni˝o in Ecuador.
and therefore on ecosystem stability could render
fi shing, mining, industry and commerce in
Monetary losses
Sector
the region more susceptible to overexploitation of
(million USD)
Peru (Tables 5 and 6).
marine resources. Consequently, poverty and general
Agriculture
167
social problems in the region will increase. There
Shrimp
68
The eff ects of climate change on the socio-
are few remaining alternatives for countries facing
Finfish fishery
6
economic system in Chile will be more
this problem since the majority of causes of global
Agro-industry
16
signifi cant in the more crowded districts
changes originate in the more industrialised regions
Transport infrastructure
204
located from the central toward the south-
of the world.
Energy
19
central areas, that will suff er fl ooding and
Tourism
88
the eff ect of waves. 50% of the artisanal
Urban infrastructure
3
fi shermen in the south-central regions
Housing
36
would be especially aff ected because of
Priority concerns
Sanitation
36
the change in distribution of targeted
Education
20
species, which will produce a migration
The ranking of concerns according to the GIWA overall
(Source: CPPS 2000a)
of the fi sher population and a change in
scores gave the following order of priority:
Table 6
Estimated monetary losses
the labour structure due to employment
caused by the 1997-1998
1. Freshwater
shortage
El Ni˝o in Peru.
substitution. In coastal areas the occlusion
2. Pollution
Monetary loss
of draining systems is expected, provoking
Sector
3. Global
change
(million USD)
sanitation problems in the future (CPPS
Housing, education and
4. Unsustainable exploitation of fi sh and other living
485
health
2000a).
resources
Water supply, sanitation and 955
transport
5. Habitat and community modifi cation
In Peru, global warming and the rise in the
Agriculture, fishing, mining,
1 600
industry and commerce
sea level will aff ect coastal settlements of
Public infrastructure,
The Task team did however consider that this ranking
prevention and emergency
433
Lima located between Punta Chorrillos, Villa
was not adequately describing the situation in the
activities
and Chimbote City, involving thousands of
(Source: CPPS 2000a)
Humboldt Current region and therefore changed
38
GIWA REGIONAL ASSESSMENT 64 HUMBOLDT CURRENT
priorities for the Causal chain and Policy option analyses. Pollution
biological and chemical contamination. Prevention and mitigation
and Unsustainable exploitation of fi sh and other living resources were
measures are necessary to implement in the short-term to reduce
prioritised because of impacts on socio-economic issues and other
the levels of microbiological pollution, their health impact and their
concerns.
economic cost. The lack of institutional capacity in local governments
to adopt stronger environmental standards and the scarcity of funds are
Among the Pollution issues, microbiological pollution was considered
the principal obstacles to implement remediation measures.
the most important because of the large amount of domestic
wastewater discharged without treatment. The potential health risk
Unsustainable exploitation of fi sh and other living resources was
is a matter of permanent concern. Chemical pollution was ranked
considered as the second priority concern. Overexploitation was
in second place for similar considerations; industrial effl
uents are
considered the most severe environmental issue with high economic
discharged without appropriate treatment. Suspended solids were
and social impacts because of the importance of the fi shing sector to
not considered as a major issue despite the low level of sanitation
the regional economy. The fi shing industry is a major source of direct
coverage in the region. Spills ranked low because the level of marine
and indirect employment for the coastal population. A collapse of the
contamination is negligible and because the impacts on sensitive areas
fi sheries would aff ect other related sectors producing a domino eff ect
have been minimal. Eutrophication received an underestimated score
in the economy of the Humboldt Current region. The vulnerability of
considering the amount of fertiliser imported to the region. Thermal
the Humboldt Current ecosystem to environmental forces, especially to
and radionuclides have no evident impacts at present. Both urban and
the El Ni˝o event, has obligated the adoption of management strategies
rural populations are aff ected by domestic and industrial pollution,
with regional approaches to avoid the collapse of the industry.
although marginal urban settlements are particularly vulnerable to
ASSESSMENT
39
Causal chain analysis
This section aims to identify the root causes of the environmental
untreated wastewater. In Ecuador, 95% of the domestic wastewater
and socio-economic impacts resulting from those issues and
is discharged without treatment; in Peru, 86%; and in Chile, 83%.
concerns that were prioritised during the assessment, so that
(WHO/UNICEF/WSSCC 2001, Arauz & Campa˝a 1986 in CPPS/UNEP/
appropriate policy interventions can be developed and focused
IOC 1988).
where they will yield the greatest benefi ts for the region. In order
to achieve this aim, the analysis involves a step-by-step process
Major sources of chemical pollution aff ecting aquatic environments in
that identifi es the most important causal links between the
the region include (UNEP 1999, CPPS 2000a, 2001b):
environmental and socio-economic impacts, their immediate
Wastewater, which adds a variety of physical and chemical
causes, the human activities and economic sectors responsible
substances produced by industrial activities located in urban areas,
and, fi nally, the root causes that determine the behaviour of those
most of these wastes do not receive any treatment.
sectors. The GIWA Causal chain analysis also recognises that,
Agriculture, which is the main source of pesticides through run-off
within each region, there is often enormous variation in capacity
and aerosols.
and great social, cultural, political and environmental diversity.
Mine leachates and metallurgy.
In order to ensure that the fi nal outcomes of the GIWA are viable
Oil spills, including maritime traffi
c and operational failures during
options for future remediation, the Causal chain analyses of the
loading and offl
oading.
GIWA adopt relatively simple and practical analytical models and
focus on specifi c sites within the region. For further details on the
Sectors
methodology, please refer to the GIWA methodology chapter.
Urbanisation
Untreated domestic wastewater has been identifi ed as the main
Pollution (i.e. microbiological and chemical pollution) and Unsustainable
cause of deterioration of the microbiological quality of water in the
exploitation of fi sh and other living resources (i.e. overexploitation)
Humboldt Current region. This statement is based on the analysis of the
constitute the priority concerns of the Humboldt Current region
level of coverage of the sanitation services and the diff erent structures
because of their present and future environmental, economic, social
deployed to discharge wastewater (including submerged pipes, shore
and health impacts. These two concerns are aff ecting the productivity
discharges etc.). It is estimated that around 1 360 million m3 per year
of coastal ecosystems and reduce the yield of the fi sheries in a region
of wastewater is discharged into the South East Pacifi c Ocean with a
that is highly dependant on its fi shing industry. In this section the
pollutant charge of 1.76 million tonnes per year of BOD and 818 900
5
analysis of sectors involved in pollution and unsustainable exploitation
tonnes per year of COD. The pollutant discharge also includes 414 900
of fi sh are analysed to evaluate the root causes of these problems.
tonnes per year of suspended solids, 55 300 tonnes per year of nitrogen
and 6 650 tonnes per year of phosphorus (Escobar 2002).
Pollution
Immediate causes
Major polluted areas of the region are located in coastal areas of Ecuador
The immediate causes of Pollution are microbiological and chemical
(Guayaquil, Santa Elena Peninsula, BahÝa de Carßquez) and Peru (Lima,
pollution (Figure 14). Microbiological pollution stems mainly from
Callao, Chimbote) and are characterised by having high levels of total
40
GIWA REGIONAL ASSESSMENT 64 HUMBOLDT CURRENT
Issues
Immediate causes
Sectors/Activities
Root causes
Microbiological
Directędischargeęofęeffluen
ts
Demographic
Urbanisation
-ęConc
entrationęofępopulationęinęc
oastalęareas
.
-ęMig
rationętoęur
banęcen
ters.
-ęDev
elopmentęofęin
formalęsettlements
.
Technological 1
Finalędisposalęofęwast
eęwa
teręwithoutę
Chemical
Diffuseęcon
tributions
appropriateętrea
tment.
Industry/Mining
Legal/Institutional
-ęLackęofęregula
tionęconcer
ningęconfuseęcon
tribution.
-ęOv
erlappingęr
esponsibilitiesęinętheęinstitutionsę
inęchargeęofętheęc
ontrolęofętheęenvir
onment.
Technological 2
Agriculture/Aquaculture
-ęUseęofęoldęt
echnologyęinęindustrialępr
ocesses.
-ęUntr
eatedęrun-offęfr
omęcultiva
tedęareas
.
Economic
-ęLackęofęresourc
esętoępr
ovideęandęmain
tainętrea
tmentę
systems.
-ęLackęofęec
onomicęmechanismsętoępr
omoteępr
ivateę
investmentęt
oęreduc
eęemissions
.
Portęactivity
-ęLackęofęresourc
esęforęsuper
visionęandęcon
trol.
Knowledge
-ęLimitedęk
nowledgeęo
nęnatur
alęcapacityęofę
theęwa
terębodies.
Figure 14 Causal chain diagram illustrating the causal links for Pollution in the Humboldt Current region.
and faecal coliforms and other pathogenic diseases of high risk for
Industry and mining
human health and the ecosystem, such as cholera, hepatitis, and several
Discharges through sewerage systems do not only contain domestic
other gastrointestinal disorders. Higher infant morbidity and mortality
wastewater and other similar wastes from human activities such as
rates found in these countries are related to the low coverage of both
commerce and services, but in many cases wastewater from industrial
drinking water and sanitation services. Pathogens disseminate through
processes (CPPS 2000a). In fact, most of the industrial wastewater is
water and, at least in the case of cholera, infl ict serious transboundary
discharged through municipal sewerage and transported by rivers to the
impacts. Around 800 000 cases of cholera were reported in the region
ocean. The composition of these wastes is quite variable and depends on
by OMS (2002) in the period 1991-2001. Cholera vibrion can survive a
other factors such as the nature of the industrial activity, the technology
long time in faecal material in the soil and for several months in shellfi sh
used and raw matter quality. Thus, residuals may vary from those with
and fi sh. In 2001, Peruvian environmental health authorities closed the
high content of bio-degrading organic matter such as those produced
entire Paracas Bay zone for the culture of scallops due to the presence
by slaughterhouses, fi shing plants or food industries to others with a
of the hepatitis A virus and established a surveillance system. The
higher proportion of chemicals such as tanneries and cellulose.
European Union prohibited the importation of scallops from Peru.
Mining activities constitute a source of chemical pollution due to
In Chile the issue of microbiological pollution is not as critical as
the use of outdated methods and equipment and the inappropriate
in Ecuador and Peru. Despite the fact that 82% of the municipal
disposal of leachates. For example, the presence of mercury is
wastewater discharged into the sea through rivers (Elqui, Aconcagua,
characteristic in zones of artisanal mining in areas such as Zaruma and
Maipo, Mapocho, Bio Bio and Valdivia, among others) the average
Portovelo in Ecuador and in the Peruvian Sierra. Furthermore, rivers
concentration reported in seawater during the period 1999-2003 did not
transport large amounts of suspended sediment from dredging and
surpass 2 500 faecal coliforms per 100 ml. The situation has improved in
monitors (water cannons) in gold mining to coastal areas (Escobar
the past decade mainly due to the implementation of environmental
2002). Variable concentrations of copper (Cu), lead (Pb), mercury (Hg),
management mechanisms and the installation of treatment systems by
zinc (Zn), cadmium (Cd) and chromium (Cr) are found in the water,
Chilean industries (Universidad de Chile 2002).
sediments and organisms of the region, with critical areas located in
CAUSAL CHAIN ANALYSIS
41
the mining regions of northern and central Chile and southern Peru.
assessment of the level of environmental pollution, and to a lesser
Smoke, vapour and sulphuric gases from melting plants and refi neries
degree the impact on the biota and human health, an analysis of the
are sources of air pollution, particularly in Chile (CPPS 2000a).
root causes shows that the problems originate from social, economic
and cultural aspects. Rectifying these problems will require not only
Agriculture and aquaculture
political measures, but also large economic resources from both the
Several farming activities including agriculture, livestock and
government and private sectors in the fi elds of sanitation infrastructure,
particularly aquaculture are responsible for the introduction of large
environmental education and health assistance.
amounts of organic matter to the water bodies, increasing the risk of
pathogen development, with subsequent aff ects on production. In
Demographic
2000, Chilean aquaculture produced 342 million tonnes of salmon and
Like the rest of South America, the Humboldt Current region shows a
trout, producing residuals equivalent to domestic wastes of around
strong trend towards urbanisation. Between 1990 and 2000, the urban
10 million people. Pollution of estuarine waters has favoured the
population of the region increased from 69% to 74% on average (WHO/
presence of several pathogens that aff ected shrimp farms in Ecuador
UNICEF/WSSCC 2001). The population growth rate in the region (1.2-
during the 1990s with considerable economic losses (CAN 2002). The
1.6%) has however decreased steadily during the past three decades.
use of polluted water for agriculture irrigation has been identifi ed as
The concentration of the poor population along the coastal margins
a problem in several areas and related to cases of hepatitis, intestinal
and the proliferation of settlements around urbanised centres are major
infections and malaria (Carrera de la Torre 1993).
root causes of pollution in the region. In the majority of the countries,
migration to urban centres is due to the decline in the agricultural sector,
Farming activities are also responsible for the introduction of fertilisers,
low rates of productivity, limited profi tability in production, violence and
pesticides, antibiotics and sediments into coastal waters through run-
insecurity and the indiscriminate access to urban lands (CPPS 2001b). In
off . Farming uses around 70% of the water resources of the region and
general, the coastal population grows at a higher rate than non-coastal
has been identifi ed as one of the main sources of diff use pollution
areas. These new and mainly informal settlements create a permanent
of freshwater, estuaries and coastal areas (Escobar 2002). Large-scale
demand for sanitation, healthcare and other services that countries in
pesticide use has introduced considerable amounts of chemicals in
the region have not been able to satisfy.
rivers and coastal waters in the centre of Chile, the south of Peru and the
Gulf of Guayaquil in Ecuador (CPPS 2000a). Between 1990 and 1998 an
Technological
annual average of 15 500 tonnes of pesticides were used in the region;
The lack of appropriate treatment or fi nal disposal management of
the majority of pesticides are organophosphates (64%) and chlorinated
wastewater and other residuals is considered the second most important
hydrocarbons (32%) (UNEP 1999). Besides introducing chemical
root cause of the Pollution concern. The municipalities provide most
contaminants to sediments, surface and groundwater resources,
of these services in the region but generally do not employ new
agricultural run-off causes erosion and soil loss (Escobar 2002).
technologies for waste management or recycling. In general, a low
coverage of both solid waste collection and wastewater treatment
Port activity
characterise the region, although the situation of Chile is much better
Activities developed by the maritime sector are a source of chemical
than Ecuador and Peru. Recycling of solid wastes is not customary but
pollution, such as hydrocarbons and heavy metals, around the major
is limited to a small number of municipalities. Hazardous wastes are not
ports in the region. Operational failures during the loading and
always disposed of properly. Operational defi ciencies in the drinking
unloading of diesel and the pumping of bunker and cesspool waters
water network produce losses as a result of wastage and unreported
release hydrocarbon residuals into the seawater. Chemical spills, such as
consumption.
sulphuric acid and phenol, have been reported in Chile (DIRECTEMAR
2003). Other sources of pollution include the maintenance of vessels in
Several industries use low-cost but ineffi
cient technologies for industrial
dry docks, dredging and waste reception facilities.
processes. For example, the industries of mining, petrochemicals and
even fi shmeal and canneries do not always install fi lters or treatment
Root causes
plants for their effl
uents. The agricultural sector uses around 70% of the
Pollution is a signifi cant problem for the Humboldt Current region
water resources and is one of main diff use sources of water pollution
as a consequence of the development of human activities in the
of coastal and estuarine waters through run-off , since effl
uents do not
coastal areas. Although important headway has been made in the
usually receive any treatment when leaving the farms (Escobar 2002).
42
GIWA REGIONAL ASSESSMENT 64 HUMBOLDT CURRENT
Hundreds of diff erent pesticides and other substances are applied to
regulations and weak sanctions are also common. There is a lack
increase crop production. As a consequence, POPs are found in the
of regulations concerning diff use contributions and therefore
water of rivers and estuaries and in sediments throughout the region,
no institution is responsible for their control. There is also limited
with severe impacts on marine biota (UNEP 1999).
promotion and support of the implementation of quality systems
acknowledged worldwide, for example, ISO clean production and
Economic
organic production.
Countries of the region do not have suffi
cient economic resources to
provide and maintain the treatment plants in order to improve the
Knowledge
current sanitation conditions because tariff rates are subsidised or the
There is limited knowledge on the natural capacity of the water bodies to
`polluter pays' principle is not taken into account. Neither do they have
deal eff ectively with the amount of organic and chemical charge, which
economic mechanisms to promote investment in clean technology
the countries of the region are introducing into coastal ecosystems.
by industries in order to reduce emissions into the environment.
Governments or municipalities do not provide suffi
cient resources to
establish effi
cient mechanisms of supervision and control of industrial
emissions, except in the case of Chile where industries operate under
Unsustainable exploitation of
a self-regulation regime.
fish and other living resources
Legal and institutional
Immediate causes
The obsolescence of laws is a common problem in the region.
Overexploitation of fi sh
Responsibilities are not always well defi ned among diff erent national
Overexploitation of fi sh is an important immediate cause since the
and local institutions in charge of the control of the environment
South East Pacifi c Ocean is one of the major fi shing zones of the world
and their assignments frequently overlap. Inappropriate municipal
(Figure 15). However, total catches in the Humboldt Current region
Impact
Issues
Immediate causes
Sectors/Activities
Root causes
Decreaseęinęfishęstocks
Overexploitation
Increaseęinęfishingęeff
ort
Industrialęfishing
Economic
-ęIncr
easingędemandęofętheęin
ternationalęmarketę
dueętoęt
heęincreaseęofętheępopula
tion
Destructiveęfishingęprac
tices
-ęDemandęofękeyęspeciesęt
oęsatisfyęlittleęexigen
tę
markets.
-ęEnvir
onmentęcostsęar
eęnotęin
ternationalizedę
Excessiveęb
y-catch
Artisanalęfisher
ies
-ęLittleęexigentęmar
ketęt
oęfishingęmethodsę
environmentallyęappropr
iatedęę
Habitat
-ęHighępr
ofitableęexploita
tionęofęfishingęresour
esc
modification
Destructionęofęnursingęar
eas,ę
Socio-cultural
Aquacultureęandę
-ęDemandęofępr
oductsęt
oęsatisfyęselec
tiveę
spawningęg
rounds
unorganisedęc
oastalę
marketsę
developmentę
-ęChangeęofęconsumptionęhabits
Disruptionęofęf
oodęweb
Legal
-ęInsufficien
tęapplica
tionęofętheęresponsibleę
fishingęapproach
-ęLackęofęfishingęmanagemen
tęonęaęsub-
regionalębasis
-ęInsufficien
tęapplica
tionęofętheęcurr
entę
normativeę
Technological
Insufficientęuseęofęt
echnologicalęadv
ancesę
(cleanętechnolog
ies)ętoęassur
eęaęsustainableę
fishingędevelopmen
t
Knowledge
-ęDirectedętoęt
heęmainętargetęspeciesęwithęaęlimit
edę
ecosystemęappr
oach
-ęScar
ceę
economicęresourc
esęforęin
vestmentęin
ę
research,ętr
aining,ęeduca
tionęandędiffusion
-ęLackęofęaęsyst
emęofęindicat
orsęofętheęsustainabilit
yę
andęrecr
uitmentęr
ateęofętheęfishingęresourc
esęandę
theiręcoor
dinationęatęr
egionalęlev
el.ę
-ęDisperseęandęa
tomisedęinfor
mationęatęr
egionalę
levelęaboutętheępopula
tionsęcharacteristicsęandę
recruimentęr
ate.
Environment
NaturalęEv
entsę(ElęN
i o)ęincreasedętheę
anthropogenicęeff
ectęonęsomeęfishingę
resourcesę
Figure 15 Causal chain diagram illustrating the causal links for Unsustainable exploitation of fi sh and other living resources.
CAUSAL CHAIN ANALYSIS
43
have decreased in the last decade since reaching their highest levels
benthic biota by disturbing the seabed (Little & Herrera 1991, Coello
during the 1970s and 1980s. This has been attributed to high levels of
1996). The overdevelopment of the fl eet, and recently the presence
exploitation and extreme environmental variations (Csirke et al. 1996).
of the white spot disease virus, is aff ecting the fi shery. Since discards
The regional economy is highly dependant on fi shing resources for
do not need to be reported to the authorities, the problem remains
food, labour and export revenue.
concealed in most fi sheries.
Loss of habitat and nursing sites
Fishing practices and non-selective gear for species or sizes are
Another form of overexploitation is the destruction of mangrove
responsible for the high by-catch rate. Management techniques
areas for aquaculture ponds and urban development in Ecuador and
to address this issue include the use of technical (improved fi shing
northern Peru. Such activities are destroying important nursing areas
selectivity), administrative (regulations) and economic measures.
for commercial species and decreasing the availability of resources
for other trophic levels, thus altering the whole food chain. This
Sectors
ecosystem disruption could produce changes in the distribution of
Industrial capture fi sheries
fi shing resources, cause a net loss in productivity, threaten local and
Small pelagic fi shes such as anchovy, sardine and mackerels, are
regional food security, reduce profi ts received from fi shing activities,
the focus of an over-dimensioned purse-seine fl eet composed of
provoke confl ict among fi shermen, increase unemployment and hinder
approximately 2 000 vessels (CPPS 2000b). Some of the species, such as
economic opportunities.
anchovy and sardine, have been targeted for around 50 years and stocks
have reached critical levels to which the fi shing eff ort responded by
Destructive fi shing practices
moving towards other, more abundant species to continue supplying
The use of non-selective fi shing gear is a problem that extends
the fi shmeal and cannery industries in the region (IMARPE 2002a). In
throughout the region and is more common in artisanal than in
some cases the industrial fi shery sector shows a disproportionate
industrial fi sheries. The use of fi ne-meshed nets for shrimp post-larvae
growth of its fi shing and processing infrastructure with respect to the
capture during the 1990s is a typical case of an unmanageable fi shery,
actual fi sheries resources. The most important species that support this
because it was widely spread along the coast of Ecuador and the north
large-scale fi shery are under severe pressure and at their limit in terms
of Peru (Gaibor et al. 1992). Small-meshed purse-seines in Peru are used
of exploitation, as shown in Table 7.
to catch sexually immature specimens. The impact of such fi shing
Table 7
The level of exploitation of the four most important
practices on coastal and estuarine resources is unknown, but they
schooling fi shes in the South East Pacifi c.
could be aff ecting the recruitment level of several commercial species.
Species
It is likely that the use of non-selective fi shing gear is responsible for the
Exploitation level
Common name
Scientific name
low catches of traditionally abundant species. To a lesser degree, the use
Full-exploited in its whole distribution
Anchovy
Engraulis ringens
of poisonous substances or explosives is an ancestral fi shing practice in
range
Ecuador and Peru but largely under-reported.
High-exploited in its whole distribution
Sardine
Sardinops sagax
range and absent of several areas
Between mid and highly exploited with the
Chilean jack mackerel
Trachurus murphyi
risk of overexploitation
The use of trawling nets to catch shrimps in Ecuador has altered the
Chub mackerel
Scomber japonicus
Moderately exploited
composition of benthic communities, produces large amounts of
(Source: FAO 1997)
discards, decreases the variety of habitats and reduces the biodiversity
of aquatic systems. The eff ect of this fi shery on other bio-resources,
The tuna purse-seine fi shery in the northern part of the region is another
apart from marine turtles, has not been assessed.
important oceanic fi shery that is being exploited to its limits. This fi shery
is under the international management regime of the Inter American
By-catch
Tropical Tuna Commission (IATTC) that has led to the establishment of
Marine mammals, turtles and birds are present in the by-catch of almost
several regulations such as dolphin mortality limits and has recently
every fi shery in the region. The impacts of other aspects of by-catch,
established closed seasons to maintain the sustainability of tuna stocks.
such as the capture of immature individuals or the partial use of the
Nowadays Ecuador has one of the largest tuna fl eets in the Eastern
catch as in the case of shark fi ns, are underestimated. The Ecuadorian
Tropical Pacifi c. Illegal tuna fi shing inside the Galapagos Marine reserve
shrimp trawling fl eet produce signifi cant amounts of discards that
(40 nautical miles around the archipelago) is a recurrent source of
surpass what is actually utilised in shrimp production and also alters
confl ict with the tourism and artisanal fi shing sector.
44
GIWA REGIONAL ASSESSMENT 64 HUMBOLDT CURRENT
The most important commercial species in the region are as follows:
Root causes
Chub mackerel, Pacifi c thread herring, sardine, Pacifi c anchovy, shrimp
The unsustainable exploitation of fi sh is a concern of extreme
and tuna in Ecuador; Chilean jack mackerel, anchovy, sardine, hakes,
importance for the region since fi sheries are one of the most important
swordfi sh and the Rock barnacle in Chile; anchovy, sardine, Chilean jack
economic activities and sources of employment. Unfortunately, fi shing
mackerel, Chub mackerel and scallops in Peru. Management measures
resources have not always been managed using a precautionary and
for these resources include access regulations, total allowable catch,
ecosystem approach, and this has resulted in the decline of the main
fl eet capacity, closed seasons, minimum size, zoning, fi shing techniques,
commercial stocks. The over-dimensioned eff ort is the direct cause of
equipment and fi shing systems (Zuzunaga 2002). In 1992, Peru and Chile
overfi shing, as well as other economic, environmental and institutional
established an agreement for joint research of sardine and anchovy
causes. An alternative management regime is necessary to reverse the
stocks whose results are evaluated in periodic workshops.
eff ects of the root causes of this concern in order to attain a sustainable
level of exploitation.
Artisanal capture fi sheries
Most of the coastal demersal species are under similar levels of pressure
Economic
in the Humboldt Current region. Over the decades, artisanal fi shermen
The increasing demand of fi shing products to satisfy local and
have exploited marine resources under a free access regime, with
international markets either for human consumption or to supply
associated economic activities (e.g. transportation, commercialisation)
livestock feed is a major cause of the unsustainable use of the Humboldt
(CPPS 1999). For this reason, these fi sheries are not as well monitored
Current region's fi sheries resources. The environmental costs of this
as the industrial fi sheries, but the reduction of landings is evident
exploitation are not fully understood and some species considered vital
throughout the entire region. The causes of this decline include
for the ecosystem are used as raw material of low industrial value. Except
depleted stocks, destruction of habitat by pollution and other human
for a few cases such as tuna and shrimps, the majority of industrialised
activities such as tourism, port facilities, urban development and
products do not have an exigent market demanding production or
aquaculture, among others. Artisanal fi sheries also have an over-
processes that are environmentally friendly. Another aspect of this root
dimensioned fi shing fl eet with around 45 000 boats and 150 000
cause is the profi tability of some export products, for example, of lobster,
people dedicated to the activity (CPPS 2000b). Closed seasons have
scallop, and sea cucumber, among others. Besides fetching high prices,
been implemented in the region to protect high valued coastal species
some additional pressure is generated through policies to encourage the
including shrimps, crabs and lobsters in Ecuador, the Rock barnacle in
export of these products.
Chile and the South Pacifi c hake in Peru.
Socio-cultural
Aquaculture
The increasing demand for some species, or parts of them, for example,
Aquaculture provides employment in the coastal areas of the region
sea cucumber, shark fi ns and even sea lion testes, to satisfy selective
and important socioeconomic benefi ts. Shrimp farming represented
markets is a cause of concern. Some of these species have restrictions
almost 80% of the total value of regional aquaculture production (CPPS
or trading is prohibited under the CITES Convention, creating an illegal
2001b). Other cultured resources include algae, crustaceans, molluscs,
market due to their high prices. There is also an increasing demand for
fi sh and some invertebrates.
low-fat products for health reasons and consequently an increase in fi sh
and shellfi sh consumption.
In Ecuador, the shrimp industry constituted the third most important
economic activity during the 1990s. After 2000, the productivity of this
Legal and institutional
sector decreased, exports dropped from an average of 720 million USD
Since most of the fi sheries in the region are under a free access
between 1994 and 1998, to 283 million USD in the period 2000-2001
regime, fi sheries management institutions are not fully aware of the
(BCE 2002). In Chile, aquaculture increased at a rate of 18.4% between
need to apply a responsible fi shing approach as recommended by
1994 and 1998. Today it represents one of the most dynamic and
the FAO (1995b). Fishers do not always adhere to the current national
important sectors of the country. The salmon fi shery is the most
regulations, disrespecting restricted areas, mesh size and even closed
important (79%), but other species such as molluscs and algae are
seasons. Furthermore, fi sheries management strategies are not
also harvested (FAO 2000c). In Peru, aquaculture is just beginning, and
adequately coordinated between the countries of the region despite
focuses on shrimps, trout and scallops.
an understanding of the shared nature of fi sh stocks.
CAUSAL CHAIN ANALYSIS
45
Technological
is not suffi
cient to allow predictions of the intensity and extent of the
Regional institutions have not suffi
ciently incorporated technological
impacts of such events on the highly dynamic populations exploited
advances to allow a more accurate assessment of fi shing resources and
in the South East Pacifi c Ocean. Therefore, a coordinated eff ort among
to assure their sustainable exploitation. There is also a low investment
science, government and industrial sectors is required during these
in research and technology for the development of new fi sheries.
periods to develop strategies that adopt a precautionary approach to
Furthermore, fl eets in the region are highly specialised in small pelagic
fi sheries in order to mitigate the impacts of El Ni˝o.
fi shes and it is unlikely that they will be willing to modify vessels or
acquire expensive technology to develop new fi sheries in the near
Conclusions
future.
The main root causes of the two priority concerns in the Humboldt
Current region are associated with demographic, economic and
Knowledge
socio-cultural aspects. The scarcity of economic resources limits the
The research eff ort in the region is directed mainly towards the more
ability of the counties in the region to improve the level of coverage of
profi table species or those that directly supply industrial plants but with
basic services such as sanitation, wastewater treatment and freshwater
a limited ecosystem approach. A common problem for the countries
supply in line with population growth. In the case of fi sheries, economic
in the region is the scarcity of economic resources for investment in
restrictions delay the development of research and technologies to
research, training, education and dissemination. Economic restrictions
exploit natural resources on a sustainable basis. These major problems
have limited regional coordination, thus impeding the development
will continue to aff ect the region as long as the countries are unable to
of sustainability indicator systems for fi sh resources (i.e. level of
fi nd alternatives for their current economic models.
recruitment). Although advances in the fi eld of oceanography and
climatic characterisation in the region have been achieved by regional
Other institutional and governance weaknesses complicate
programmes such as the Regional Study of El Ni˝o Phenomenon
coordination or impede private sector investment in public services
(ERFEN) (see Annex III) and the annual joint regional oceanographic
and delay solutions. They also impede the application of policies
cruises coordinated by the Permanent Commission of the South Pacifi c
and strategies for the exploitation of fi shing resources based on an
(CPPS), information on population characteristics of exploited species
ecosystem approach at the regional level. To date, each country has
on a regional basis is sparse and fragmented.
been managing fi shing stocks separately. The importance of regional
management of transboundary fi sh stocks such as Jack mackerel,
Governance
anchovy, sardine, Giant squid and swordfi sh has been demonstrated
Countries in the region have failed to adopt modern criteria, concepts
through modelling analyses (Zuzunaga 2002). However, in the region,
and trends regarding marine ecosystem management. There is a lack
there is a cooperative attitude that would facilitate the implementation
of regional policies and strategies. Confl icts of interest among diff erent
of fi shing management measures as well as favouring the exchange
fi shing sub-sectors also make it diffi
cult to integrate policies. Institutions
and joint evaluation of fi shing and oceanographic data. In this context
responsible for managing the fi sheries are often weak because they lack
it is important to note that the valuable collaboration of countries such
resources and institutional capacity.
as the United Kingdom, United States, and Germany, among others
which, through their specialised institutions, have maintained an
Natural causes
important presence in the South East Pacifi c Ocean. This collaboration
Extreme environmental events such as El Ni˝o have exacerbated
is complemented by the permanent support from FAO.
anthropogenic impacts on some fi shing resources. Current knowledge
46
GIWA REGIONAL ASSESSMENT 64 HUMBOLDT CURRENT
Policy options
This section aims to identify feasible policy options that target
discharged into natural water bodies without treatment (CPPS 2000a,
key components identifi ed in the Causal chain analysis in order to
WHO/UNICEF/WSSCC 2001). The region is characterised by low sanitation
minimise future impacts on the transboundary aquatic environ-
coverage with around 13 million people without access to this service
ment. Recommended policy options were identifi ed through
(WHO/UNICEF/WSSCC 2001). Concentrations of faecal coliforms in waters
a pragmatic process that evaluated a wide range of potential
around the major urban centres in Ecuador and Peru exceed current
policy options proposed by regional experts and key political
standards. These inadequate sanitation conditions favour the presence
actors according to a number of criteria that were appropriate
of endemic gastroenteric diseases such as typhoid, cholera and hepatitis.
for the institutional context, such as political and social accept-
Other sources of microbiological pollution include the effl
uents from
ability, costs and benefi ts and capacity for implementation. The
slaughterhouses and food processing plants, as well as the discharge
policy options presented in the report require additional detailed
of solid wastes. Extreme climatic events such as the El Ni˝o exacerbate
analysis that is beyond the scope of the GIWA and, as a conse-
sanitation problems by increasing rainfall and fl ooding and damaging
quence, they are not formal recommendations to governments but
the sanitation infrastructure.
rather contributions to broader policy processes in the region.
The root causes of microbiological pollution include:
Pollution and Unsustainable exploitation of fi sh have been identifi ed
Demographic ş Overpopulation, migration from rural areas, dynamic
as the major environmental concerns of the region. In the causal chain
and unplanned human settlements and intense use of land.
analysis the sectors/activities and the root causes of these problems
Technological ş Lack of appropriate technologies for wastewater
were identifi ed. In the case of pollution, microbiological and chemical
treatment.
pollution are the most severe issues causing a deterioration in the
Economic ş Subsidised tariff s, lack of resources for supervision and
environmental quality of the region, although their severity diff ers
control, insuffi
cient promotion of private investment, among others.
between the countries. Regarding the unsustainable exploitation of
Legal and institutional ş Overlapping responsibilities, lack of a basin
fi sh, overexploitation was considered the most relevant issue due to
approach to hydrological resource management.
the importance of the fi sheries for the regional economy and because
of the shared nature of the main fi sh stocks.
Chemical pollution was considered as the second most relevant issue.
The immediate causes are mainly related to industrial wastewater, the use
of pesticides and other agro-chemicals (FAO 2002b, UNEP 1999). POPs
such as DDT and its metabolites, Aldrin, and Lindane are present in water
Pollution
and sediments throughout the region (CPPS 2000a). Mining discharges
are another important source of chemical pollution since Chile and Peru
GIWA experts selected pollution as the fi rst priority environmental
are major copper and gold producers. Several heavy metals such as
concern of the region because its impact on economic, social and
copper, zinc, lead, cadmium, mercury and chromium have been found
health issues. Microbiological pollution was the most relevant immediate
in concentrations exceeding national regulations in coastal waters and
cause because a high proportion of domestic effl
uents (80-95%) are
sediments around mining areas and industrial centres.
POLICY OPTIONS
47
The root causes of chemical pollution include:
Surveillance and Control of Marine Pollution of the South East
Demographic ş Concentration of the population in coastal areas,
Pacifi c (CONPACSE).
migration and development of informal settlements.
Regional Programme for the Protection of the South East Pacifi c
Technological ş Obsolete technology, inappropriate wastewater
from Land-based Activities (PROSET).
and solid waste treatment.
Economic ş High cost of treatment systems, lack of promotion of
The Permanent Commission for the South Pacifi c (CPPS) has coordi-
private investment.
nated these agreements, protocols and programmes in the region
Legal and institutional ş Obsolete laws, inappropriate municipal
since 1981 through the Plan of Action for the Protection of the Marine
regulations, overlapping responsibilities of institutions in charge of
Environment and Coastal Areas of the South Pacifi c. The selection
the supervision and control, weak sanctions.
of policy options most appropriate in addressing pollution in the
Knowledge ş Unknown carrying capacity of the ecosystem,
region should take into consideration and strengthen these regional
ignorance about the eff ects of chemical pollution.
mechanisms.
Construction of options
Decentralise environmental management:
Environmental pollution in the Humboldt Current region is linked with
Policy option addressing the root causes Demographic, Legal
failures in public administration, a lack of education and poverty. It
and Institutional, and Knowledge.
is therefore necessary that the region adopts the principles estab-
In the countries of the region, the creation of policies and strategies
lished at international forums such as the World Summit on Sustain-
for pollution control has had a high degree of centralisation. Legal
able Development (United Nations 2002) which proposes "the shift
regulations and the sharing of responsibilities involve the participa-
towards sustainable consumption and production to promote social
tion of several authorities without legal or institutional mechanisms
and economic development within the carrying capacity of ecosys-
to assure an integral approach to the problem, and excluding the
tems by addressing and, where appropriate, linking economic growth
involvement of local stakeholders in the decision-making process
and environmental degradation through improving effi
ciency and
(CPPS 2000a, 2001b). Therefore, social problems caused by pollution
sustainability in the use of resources and production processes, and
and environmental degradation will continue until local stakeholders
reducing resource degradation, pollution and waste". Regarding pollu-
are able to participate actively in fi nding appropriate solutions. The
tion, the WSSD Plan of Implementation also proposes the adoption
WSSD declaration appeals to the participation of stakeholders and
and implementation of policies and measures to apply the `polluter
encourages partnerships to support the implementation of Agenda
pays' principle described in the Rio Declaration on Environment and
21 at the local and regional levels.
Development (United Nations 1992) and the "increase of investment
in cleaner production and eco-effi
ciency in all countries through, inter
Generally, regional governments have shown interest in the establish-
alia, incentives and support schemes and policies directed at estab-
ment of decentralised management strategies, policies and concep-
lishing appropriate regulatory, fi nancial and legal frameworks".
tual frameworks, as well as in defi ning specifi c projects to address
problems with an ecosystem management approach. However, the
The governments of the Humboldt Current region have adopted legal
implementation of these processes is still problematic. Operative
mechanisms and several programmes to address pollution issues such
mechanisms require coordination in order to evaluate policies and
as (see Annex III):
strategies at national and regional levels, and the creation of opera-
The Convention for the protection of the Marine Environment and
tive institutions to implement environmental management projects
Coastal Areas in the South East Pacifi c.
at local levels (i.e. municipalities). This policy requires the corrobora-
The Agreement on Regional Cooperation in Combating Pollu-
tion of local governments in order to delegate responsibilities, create
tion in the South East Pacifi c by Hydrocarbons and Other Harmful
policies and establish mechanisms of control according to specifi c
Substances in Cases of Emergency.
requirements. The participation of multiple stakeholders in this process
The Protocol for the Protection of the South East Pacifi c from
is fundamental. Local governments may also use the experiences of
Radioactive Pollution.
other municipalities or from neighbouring countries through well-
The Protocol to Prohibit Transboundary Movements of Hazardous
established regional mechanisms of cooperation, such as the Plan of
Wastes and their Disposal to the South East Pacifi c.
Action for the Protection of the Marine Environment and Coastal Areas
The Coordinated Regional Programme for Research.
of the South East Pacifi c (CPPS/UNEP 1983).
48
GIWA REGIONAL ASSESSMENT 64 HUMBOLDT CURRENT
Convenience
responsibilities as long as the national government assign the necessary
The creation of a unifi ed institutional mechanism, with defi ned national
funds. However, the main obstacle for decentralisation is opposition by
policies and strategies, and an additional mechanism at the local level,
the traditional bureaucracy, who fear a subsequent loss of power and
will allow the simple identifi cation and selection of themes and priority
infl uence. The creation of local institutions with suffi
cient operational
problems for environmental management. Furthermore, it will allow the
capacity to deal with pollution problems would require the reorganisa-
formation of projects, which include the participation of diff erent stake-
tion of the institutions currently in charge of pollution control leading
holders directly related to pollution problems. The integrated approach
to further opposition from the central bureaucracy.
and institutional cooperation will also provide better possibilities for
eff ective pollution management.
The majority of local stakeholders would be willing to adopt a new
approach to tackling pollution since they will be the benefi ciaries of a
A greater understanding of the pollution problem will promote a more
healthy environment. However, polluters, such as industries, could oppose
eff ective use of natural and human resources and the progressive
stronger regulations, and therefore local institutions should be strength-
improvement of the environmental situation. The ineffi
cient control of
ened and given greater legislative powers by the national Government
pollution through sectored actions has necessitated the implementation
and the Congress whose responsibility it would be to provide a new legal
of policies that assure institutional integration to reduce, and fi nally halt,
framework. This framework should take into consideration the necessity to
the growing pollution problems in the region.
improve the effi
ciency and level of coverage of sanitation and freshwater
services and to include modern concepts of management, such as the
Feasibility
privatisation and self-regulation approach for industrial wastewater.
Countries in the region have considerable national experience in
developing institutional mechanisms for regional cooperation. For
Harmonise criteria and environmental quality standards
example, the governments of the region established the Permanent
and develop common indicator systems for environmental
Commission for the South Pacifi c (CPPS) and its Plan of Action for the
management:
Protection of the Marine Environment and Coastal Areas of the South
Policy option addressing the root causes Technological,
East Pacifi c (CPPS/UNEP 1983). The Commission may be able to assist
Economic, and Knowledge.
in the design and implementation of regional policies, in collaboration
The countries of the Humboldt Current region have developed their
with their respective national components, to guarantee a system for
own criteria and environmental standards for the control of effl
uents
the mitigation and control of pollution in the region.
discharged into water bodies, air and soil. There is therefore no regional
coordination of national regulations. An important step towards reducing
The main objective of the Plan of Action is to protect the coastal and
pollution levels will be a study of the characteristics and effi
ciency of
marine areas to safeguard the health and well-being of current and
the current standards and actions taken in these countries, identifying
future generations through the active cooperation of its members.
opportunities to initiate a process of harmonisation of regulations and
For this purpose, the Plan of Action coordinates national institutions
to defi ne mechanisms of evaluation and control of the results obtained
that conform to an operative network for the benefi t of the South East
both at national and regional levels. It will be necessary to identify appro-
Pacifi c. The Major sources of pollution in the South East Pacifi c were
priate indicators to evaluate the achievements obtained as a result of the
identifi ed during the coordinated implementation of programmes
implementation of such regulations to adequately support the process
such as CONPACSE and PROSET (CPPS 2000a, 2001b). Through the
of control and mitigation of the more important pollution issues in the
same mechanism, countries of the Humboldt Current region should
region. This could be achieved through the organisation of regional
identify potential donors and international assistance programmes to
workshops coordinated by the Plan of Action of the South East Pacifi c
obtain economic resources in order to develop both the initial designing
under the auspices of the programmes CONPACSE and PROSET, which
phase and the execution of the proposed policy.
are concerned with the mitigation of the pollution concern. The govern-
ments of the region demonstrated their commitment to resolving the
Acceptability
pollution issues by ratifying the Convention for the Protection of the
For a long time, the local governments of the Humboldt Current region
Marine Environment and Coastal Areas of the South East Pacifi c also
have claimed that they should be given responsibility for addressing their
known as the Lima Convention (CPPS 1981) and also by adopting
own local social and environmental problems. Therefore, municipalities
international agreements such as the WSSD (United Nations 2002) and
and other forms of local administration would be willing to assume such
UNCED (United Nations 1992).
POLICY OPTIONS
49
Convenience
to devolve environmental management to local governments and to
This policy aims to establish regional regulations and standards, in order
promote the active participation of local stakeholders in the decision-
to mitigate and control pollution in the region. Particular importance
making process. This policy requires the strengthening of local govern-
should be given to sanitation criteria for wastewater discharges, both
ments through the creation of an appropriate legal framework in order
domestic and industrial, and their treatment, identifi ed as the major
that local governments assume such responsibilities. Decentralisation
cause of pollution and environmental degradation (CPPS 2000a). Chile
of environmental management is considered the most convenient way
has the highest standards in the region regarding the control of water
to address pollution problems, although it requires the political will of
pollution. This signifi cant achievement may be the result of the harmoni-
each country to adopt such administrative changes and to assign the
sation of environmental criteria and the establishment of guidelines
necessary economic resources for its implementation.
for appropriate legal frameworks that include the new principles of
wastewater management, such as the `polluter pays' principle.
The second policy demands the active participation of governments and
technical institutions to develop common standards and environmental
Feasibility
regulations for the Humboldt Current region. Countries of the region have
The experience and advances of the Plan of Action for the Protection
developed several regional mechanisms of cooperation to deal with pollu-
of the Marine Environment and Coastal Areas of the South East Pacifi c
tion problems such as the Plan of Action for the protection of the Marine
include institutional cooperative structures in each country of the region,
Environment and Coastal Areas of the South Pacifi c (CPPS/PNUMA 1983)
containing structural elements and operative facilities necessary for the
(see Annex III) and specifi c programmes to assess the impact of land-based
implementation of this policy. Unfortunately, countries of the region
sources of pollution (CONPACSE and PROSET). Unfortunately, countries
have not been able to take advantage of this regional mechanism to
have not been able to take full advantage of such mechanisms for the
promote a healthier environment. Countries have not taken the initiative
benefi t of their populations. Ecuador and Peru could benefi t from the
to establish environmental regulations at the regional level like countries
experience of Chile, a country with higher environmental standards and
that are members of economic blocks such as the European Community
lower levels of pollution.
(EC) or the North American Free Trade Agreement (NAFTA). The adoption
of such regional standards will be necessary in the short-term if the
Humboldt Current region is to progress.
Unsustainable exploitation of
Acceptability
fish and other living resources
As previously noted, the governments of the Humboldt Current region
have signed agreements and protocols that aim to foster cooperation in
The second priority environmental concern was the Unsustainable
combating pollution and develop regulations and operative mechanisms
exploitation of fi sh and other living resources. Overexploitation was
to reduce and control pollution in the South East Pacifi c (Annex III). These
considered to have a severe impact in the region due to the steady
mechanisms include a variety of issues related to pollution, from waste-
reduction in landings of small pelagic fi sh and changes in abundance
water to radioactive contamination. There is consequently a tendency
and the composition of species, most of which are considered highly
among the countries to accept regional compromises regarding
or fully exploited (i.e. Anchoveta (Engraulis ringens), South American
pollution. The next step is to implement practical actions in order to
pilchard (Sardinops sagax), Inca shad (Trachurus murphyi), Chub mackerel
harmonise criteria, create regional standards of environmental quality
(Scomber japonicus), Pacifi c thread herring (Opisthonema spp.), Arauca-
and establish a common system of indicators. The WSSD declaration
nian herring (Strangomera benticki) (FAO 1997). Demersal species (South
pledged to focus and give priority attention to conditions that threaten
Pacifi c hake (Merluccius gayi), Southern hake (M. polylepis), Patagonian
sustainable development, including environmental degradation.
grenaider (Macruronus magellanicus)) and several invertebrates are
similarly exploited and some are considered overexploited (including
Conclusions
sea urchin, clams, scallops, crabs and other crustaceans). The reduction in
Two policy options were selected to address the GIWA concern Pollu-
fi shing resources has caused serious economic and social consequences,
tion in the Humboldt Current region regarding convenience, feasibility
especially in artisanal communities that are highly dependent on marine
and acceptability: Decentralise environmental management and Harmo-
resources (CPPS 2003b). Destructive fi shing practices, excessive by-catch
nise criteria and environmental quality standards and develop common
and discards, which have an impact on the biological and genetic
indicator systems for environmental management. The fi rst policy attempts
diversity, were considered to have a slight impact.
50
GIWA REGIONAL ASSESSMENT 64 HUMBOLDT CURRENT
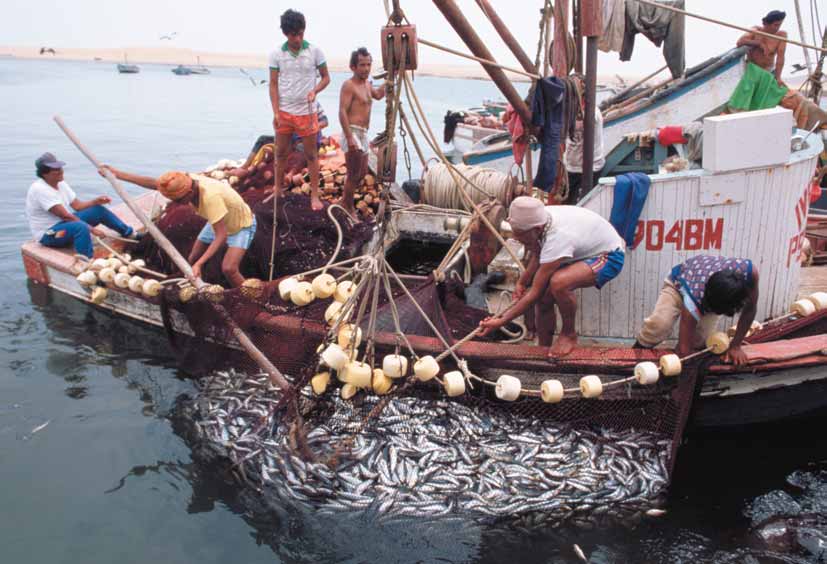
Figure 16 Fishermen pull their catch onto their boat off the coast of Peru.
(Photo: CORBIS)
The immediate causes of overexploitation include: an increase in fi shing
Knowledge ş Research focused mainly on the exploited species
eff ort by both artisanal and industrial fl eets; a decrease in the recruitment
rather than applying the ecosystem approach, insuffi
cient and
level of commercial species, particularly of small pelagic schooling fi sh;
fragmented information.
a change in the distribution of fi sh populations, either due to habitat
Governance ş Lack of policies and strategies with an ecosystem
destruction or natural climatic variability; and the use of non-selective
approach at the regional level, confl icts among stakeholders, weak
fi shing gear which produces high rates of by-catch and discards.
control and enforcement.
Natural processes ş Natural events have increased anthropogenic
The root causes of the unsustainable exploitation of fi sh include:
impacts on some fi shing resources.
Economic ş Increasing demand for fi sheries products, demand for
specifi c species of high value, inadequate evaluation of environ-
Construction of options
mental costs.
Based on the Causal chain analysis, three policy options were devel-
Socio-cultural ş Demand for products to satisfy selective markets,
oped according to the criteria of effi
ciency, equity, political feasibility
change in consumption patterns.
and capacity of implementation at the regional level:
Legal and institutional ş Weak application of the responsible
1. Rationalisation of fi shing production
approach to fi sheries, insuffi
cient application of the current manage-
2. Development of knowledge and indicators
ment normative, lack of regional management approach, confl icts
3. Regulation of fi shing eff ort
among sub-sectors, weakness of institutions responsible for fi sheries
management.
The chosen policies are in concordance with chapter 17 of Agenda 21
Technological ş Limited adoption of cleaner technologies.
and paragraph 31 of WSSD regarding the conservation and management
POLICY OPTIONS
51
of the oceans. These policies attempt to maintain the productivity and
policy makers to make informed decisions in the management of
biodiversity of the South East Pacifi c Ocean in the long-term through
the fi sheries. The policy requires the development of research, the
the sustainable management of its resources. The policies also help to
exchange of information and the implementation of measures at a
implement the ecosystem approach to fi sheries, eliminate destructive
regional level.
fi shing practices and facilitate the diff usion and exchange of knowledge
between the countries of the region.
Countries of the Humboldt Current region have been actively
cooperating in fi shing research under the coordination of the CPPS
The policies also promote the regional management of transboundary
through its Coordination Commission of Scientifi c Research. Scientifi c
fi shing resources as proposed by Zuzunaga (2002) through coordina-
programmes conducted jointly by countries of the region include the
tion and cooperation between the countries. These policies should be
following: the Regional Study of the El Ni˝o Phenomenon (ERFEN); the
implemented through well-established regional mechanisms such as
Joint Regional Cruises Programme; and the Integrated Management of
the Permanent Commission for the South Pacifi c (CPPS), which has been
the Large Marine Ecosystem of the Humboldt Current (see Annex III).
coordinating technical cooperation in the region regarding coastal and
Part of this cooperation includes training programmes in themes such
marine issues for the past 50 years. Progression in this direction by the
as hydro-acoustic assessments of resources, and marine biodiversity,
South East Pacifi c countries was demonstrated through the signing of
among others. Furthermore, countries should increase cooperation to
the Galapagos Agreement in 2000, which includes the conservation
develop baseline studies to establish indicators, especially for trans-
and management of living resources beyond the countries' jurisdiction
boundary resources, to develop regulations at the regional level to
(see Annex III).
ensure their conservation and management as stipulated in the FAO
Code of Conduct. The highly variable oceanographic conditions of the
Rationalise fi shing production
region and the presence of extreme events such as the El Ni˝o and La
Policy option addressing the root causes Economic, and Socio-
Ni˝a have important consequences for the fi sheries in the region (Csirke
cultural.
et al 1996), which demand highly dynamic management in which all
Since most of the fi shing production from the South East Pacifi c Ocean
the countries exploiting the same resources participate in the decision-
is used as raw material for fi shmeal, this policy attempts to promote the
making process. As mentioned earlier, the advantages of such a regional
rationalisation of fi shing production according to the following aspects:
approach for the main fi sheries of the South East Pacifi c have been
1) opportunities and market conditions; 2) possibilities of diversifying
demonstrated through modelling analysis (Zuzunaga 2002).
exploitation and producing added-value products; 3) necessity to
internationalise environmental protection costs; 4) maintain the base
Regulation of fi shing eff ort
of exploited resources; and 5) ensure equity and benefi ts for society.
Policy option addressing the root causes Legal, Governance,
and Technological.
These aspects demand that economic studies identify opportunities
The third priority was given to the regulation of fi shing eff ort. However,
and markets be developed both for new fi shing products and for new
caution should be taken when issuing measures to regulate fi shing eff ort
processed products. The key objective of this policy is to maintain fi shing
since environmental conditions also play an important role in the avail-
productivity in the South East Pacifi c and increase incomes through the
ability and distribution of fi shing resources. Csirke et al. (1996) stated that
sustainable management of fi shing production. This policy agrees with
due to the changes in abundance of the Peruvian anchovy as a result of
the Code of Conduct for Responsible Fisheries (FAO 1995) that estab-
natural variability, a dynamic management system should be adopted
lishes, in paragraph 11, the necessity that countries cooperate to facilitate
that takes into account the fl uctuations in its population regime.
the production of value-added products in developing countries. This
is also part of the identifi cation and selection of good management
Countries in the region are currently implementing measures aimed at
practices for the region.
reducing fi shing eff ort. For example, Ecuador imposes annual closed
seasons for shrimp trawling fi shing, as well as for some invertebrates,
Development of knowledge and indicators
such as clams and crabs. Peru has imposed closed seasons and quotas
Policy option addressing the root causes Knowledge, and
for anchovy, sardine, mackerel and hake, and Chile has closed seasons
Natural causes.
for some coastal invertebrates. However, no measures other than those
A second priority was given to the development of knowledge and
for the tuna fi shing fl eet in the Eastern Tropical Pacifi c by the Inter-
indicators of change that occur in the exploited populations to allow
American Tropical Tuna Commission (IATTC) have been taken with a
52
GIWA REGIONAL ASSESSMENT 64 HUMBOLDT CURRENT
regional approach. The industrial fi shing sector has shown in several
The fi rst option attempts to maximise the benefi ts for the counties by
cases a disproportionate increase in fi shing eff ort compared with the
taking into account market opportunities, diversifying products and
potential of the fi shing resource (IMARPE 2002a). The FAO Code of
internationalising environmental costs, but maintaining the current
Conduct also calls upon governments to prevent or eliminate excess
basis of exploitation. The second option requires the development of
fi shing capacity as a means of ensuring the eff ectiveness of conserva-
knowledge of the exploited population in order to adopt sustainable
tion and management measures. An alternative to reducing fi shing
fi shing management practices. For this purpose the region has devel-
eff ort is to change fi shing gear to exploit new fi sheries, especially in
oped regional mechanisms of cooperation such as the Regional Study of
deeper waters. Promoting investment in new technology capable of
the El Ni˝o Phenomenon (ERFEN), the Joint Regional Cruises Programme
catching under-exploited resources should be included in the strategy
and the Integrated Management of the Large Marine Ecosystem of the
to redistribute fi shing eff ort.
Humboldt Current (see Annex III). The ultimate aim is joint management
of shared fi sh stocks in the region. The third policy aims to regulate
The regulation of fi shing eff ort at the regional level could be imple-
fi shing eff ort to achieve sustainable fi shing management, but takes
mented based on advances in knowledge regarding the fi sheries. This
into account that some resources in the Humboldt Current ecosystem
process may be facilitated through the participation of CPPS as part of
show a high susceptibility to environmental fl uctuations. Countries are
the implementation of existing mechanisms of regional cooperation,
currently adopting restrictive measures such as closed seasons and
such as the Galapagos Agreement.
quotas for some stocks. However, an alternative to reducing fi shing
eff ort on depleted stocks is to develop new fi sheries and to promote
Conclusions
investment in new technology.
Three policy options were developed to address the issue of overexploi-
tation of fi shing resources according to the criteria of effi
ciency, equity,
political feasibility and capacity of implementation at the regional level:
Rationalisation of fi shing production, Development of knowledge and
indicators and Regulation of fi shing eff ort.
POLICY OPTIONS
53
Conclusions and recommendations
Pollution and Unsustainable exploitation of fi sh and other living
environmental management (WHO/UNICEF/WSSCC 2001). In this sense,
resources were selected as the two priority concerns in the Humboldt
the policy options proposed for the region must take into account
Current region. The environmental and socio-economic impacts have
these intra-regional diff erences. Chile has the highest environmental
common causes regarding social, cultural and economic issues such
standards, with legal mechanisms that have allowed the privatisation
as poverty, migration to urban centres, a lack of economic resources
of public services, and have incorporated the concept of self-regulation
to invest in technology and a lack of knowledge, which delay the
for industrial wastewater discharges. These mechanisms are not yet fully
adoption of integrated management policies that are based upon
implemented in Ecuador and Peru, resulting in signifi cantly higher rates
a regional approach. The region has legally binding mechanisms for
of gastroenteric diseases and infant morbidity in these countries.
regional cooperation. The most important is the Plan of Action for the
Protection of the Marine Environment and Coastal Areas of the South
The harmonisation of criteria and environmental standards between
Pacifi c, whose Executive Secretariat is the Permanent Commission
the countries of the region is a policy option proposed to improve
for the South Pacifi c (CPPS), as well as with several complementary
the environmental conditions of the region. The adoption by Ecuador
instruments such as protocols and agreements that have not been
and Peru of environmental standards similar to those used in Chile and
fully implemented at the regional level.
the modernisation of environmental regulations to encourage private
investment in sanitation and drinking water supply could be a mid-term
Pollution
objective. To facilitate this transition process the creation of decentralised
There is detailed information in the region about the level of
entities for environmental management has been proposed. The basic
microbiological and chemical aquatic pollution. This information
idea is to reduce the decision-making power of centralist governments
demonstrates that, although pollution has similar causes and levels
and assign responsibilities to municipalities or local governments, which
of intensity in the three countries and there are still local problems
will operate through a consultative process with local stakeholders, to
associated with the major urban and industrial centres, it is not a
identify local priority problems and provide integrated solutions.
transboundary issue. This is essentially due to the nature of rivers, the
However, in the case of water resources, integrated basin management
main carriers of pollution, which originate in the western slope of the
rather than a local or national approach must be adopted.
Andean mountain range. In general, rivers are short with low discharges
and in most cases seasonal. Unfortunately, there are few assessments
Unsustainable exploitation of fish
on the current impacts of pollution on the coastal and marine biota of
The management of fi sheries must be addressed with a regional
the South East Pacifi c Ocean. Studies need to determine the potential
approach, applying modern management criteria to promote their
changes in the communities and ecosystems of the region if the current
sustainability. As with pollution, the root causes of the overexploitation
levels of pollution continue.
of fi shing resources are the same in the three countries: over-
development of fi shing eff ort, weak mechanisms of control, and a lack of
Although the root causes of pollution identifi ed in this analysis are
knowledge of the exploited species. Although signifi cant achievements
present in all three countries, it is evident that there are diff erences
regarding regional cooperation have been realised, no regional
in the level of coverage of basic services and the eff ectiveness of
management mechanisms, such as fi shing quotas, mesh size or closed
54
GIWA REGIONAL ASSESSMENT 64 HUMBOLDT CURRENT
seasons, have been implemented. Each country is managing fi sheries
though the strengthening of existing regional mechanisms to address
according to their own criteria based on national research, knowledge
the environmental problems of the region. The most viable mechanism
and capabilities. It is widely agreed that, at least in the case of the small
is the Permanent Commission for the South Pacifi c (CPPS), which has
schooling fi sh, which form the basis of the industrial fi shery in the
been coordinating activities with the participation of institutions and
region, the three countries are exploiting the same populations.
groups of specialists from each country on a number of topics including
fi sheries, pollution, and integrated management of coastal resources,
It has been suggested that there should be a rationalisation of fi shing
over the last 50 years. Governments of the region confi rmed their will
production. The introduction of ecosystem and regional management
to continue this successful collaboration during the commemoration
approaches would not only allow the continuation of current industrial
of the 50th Anniversary of the Santiago Declaration, which established
fi sheries, but it would also promote the search for alternatives to diversify
the CPPS, in August 2002 in Santiago, Chile. The text of this declaration
fi shing products. This could involve the incorporation of added value to
is included in Annex III.
industrialised products and extensions to the market. The development
of fi shing indicators and the exchange of information between the
Addressing these and other environmental problems aff ecting
countries of the region may initiate a regional management approach
the South East Pacifi c Ocean is a major challenge for CPPS and the
to fi sheries in order to preserve the viability of the exploited stocks and
Humboldt Current region. Only through the responsible management
satisfy the socio-economic necessities of the region.
of environmental problems currently aff ecting the area will a future
healthy and productive environment be achieved.
The results of this assessment of the priority environmental concerns
have highlighted the necessity to increase the level of cooperation
CONCLUSIONS AND RECOMMENDATIONS
55
References
Acero, R., Sußrez de Freitas, G. and Pulido, V. (1995). Informaciˇn de Per˙
Andrade, V.H. and Alcßzar E. (1989). Efecto de los derrames de
y observaciones a la MonografÝa sobre ┴reas Marinas y Costeras
hidrocarburos de petrˇleo en la bahÝa de Quintero, Chile. Instituto
Protegidas del PacÝfi co Sudeste. En: Hurtado (1995). CPPS/PNUMA/
de OceanologÝa, Universidad de ValparaÝso, Chile. In: Escobar J.J.
FAO.
(ed.). Memorias del Seminario Internacional sobre Investigaciˇn y
Aguilera, R., Andrade, B., Avaria, S., Cabrera, N., Espinoza, F., Lorca, E.,
Vigilancia de la Contaminaciˇn Marina en el PacÝfi co Sudeste. Cali,
Ramorino, L., Retamal M.A. and Rivera, A. (1992). Efectos de los
Colombia, 6-8 de septiembre de 1989. CPPS, Santiago de Chile,
cambios climßticos en los ecosistemas costeros y marÝtimos de
octubre de 1991.
Chile. Documento General del Territorio MarÝtimo y de la Marina
Arauz, N. and Campa˝a N. (1986). Efectos de la contaminaciˇn por
Mercante de Chile, DIRECTEMAR/ SHOA, Chiule.
desechos domÚsticos sobre la salud en Guayaquil, Ecuador. In: Taller
Alcßzar, F., Lˇpez L. and Salinas, A. (1986). Contenido de hidrocarburos
de trabajo sobre la Evaluaciˇn de Impacto Ambiental producida
en aguas, sedimentos de fondo, arena de playa y organismos de la
por un Desarrollo Portuario. Caso de Estudio: Guayaquil. Noviembre
bahÝa de Concepciˇn, Chile. Programa de Investigaciˇn, Vigilancia
1986.
y Control de la Contaminaciˇn Marina por Hidrocarburos de
Arcos, C. (1985). Informe TÚcnico de ┴rea y Parßmetros asignados: Hierro,
Petrˇleo, CONPACSE. Fase 1. Plan de Acciˇn del PacÝfi co Sudeste.
Cobre y Zinc, incluyendo el Estero Salado. Informe a CPPS. Programa
Doc. IOUV/2.
de Caracterizaciˇn y Vigilancia de la Contaminaciˇn Marina a partir
Alcßzar, F., Leighton, G., Lˇpez L. and Ramorino, L. (1989). Presencia de
de fuentes domÚsticas, agrÝcolas, industriales y mineras en ßreas
hidrocarburos totales aromßticos de petrˇleo en agua, sedimentos,
ecolˇgicamente sensibles del PacÝfi co Sudeste.
arena de playa y organismos marinos de las regiones norte y central
Arcos, V. (1986). Evaluaciˇn de la presencia de Cobre, Hierro, Zinc en
de Chile. In: Escobar, J.J. (ed.). Memorias del Seminario Internacional
aguas costeras de las principales ciudades de la Costa Ecuatoriana,
sobre Investigaciˇn y Vigilancia de la Contaminaciˇn Marina en el
Universidad de Guayaquil, Ecuador, Informe de CONPACSE, CPPS.
PacÝfi co Sudeste. Cali, Colombia, 6-8 de septiembre de 1989. CPPS,
Arcos, F. (1987). Borrador de los antecedentes del conocimiento
Santiago de Chile, octubre de 1991.
cientÝfi co de los ambientes marinos-costeros con sus caracterÝsticas
Alegre, M, Bernex, N., Carrasco, A., Castro, H., Chirinos, C., Felipe, C.,
de su mantenimiento y variabilidad, asÝ como de los organismos
Iturregui, P., Kore, M., Masson, L., Portilla A. and RÝos, M. (2001). El
que en ellos viven, con miras a elaborar un Plan de Manejo de la
Medio Ambiente en el Peru, A˝o 2001. Instituto Cuanto/USAID,
Reserva Marina de Galßpagos.
Lima, Per˙.
Arriaga, L and Vßsconez J. (1991). El manejo costero del Ecuador.
Alverson, D., Freeberg, M., Pope, J. and Murawaski, S. (1996). A Global
Documento presentado. In: Reuniˇn de Expertos para el
Assessment Of Fisheries Bycatch And Discards. FAO Fisheries
Establecimiento la Red de ┴reas Costeras y Marinas Protegidas en
Technical Paper. No. 339. Rome, FAO.
el PacÝfi co Sudeste. Panamß 23-26 de Abril de 1991.
Astorga, T. (2002). The mining sector of Chile. Ministerio de MinerÝa de
Chile.
56
GIWA REGIONAL ASSESSMENT 64 HUMBOLDT CURRENT
Ayˇn, H. (1981). Clasifi caciˇn geolˇgica de los ambientes costeros
Briones, E., Gˇmez, J., Hidalgo, A., Tirira D. and Flachier, A. (2001b).
de la provincia del Guayas. Trabajo presentado en: Seminario de
Inventario de Humedales del Ecuador. Segunda Parte: Humedales
Ordenaciˇn y Desarrollo de las Zonas Costeras. Guayaquil, 18-27
Interiores de la Provincia del Guayas ş Tomo II. Convenciˇn de
de mayo.
Ramsar/INEFAN/EcoCiencia. Quito ş Ecuador.
Bßez, P., MelÚndez, R., RamÝrez, M., Letelier, S., Brown, A., Camos, M.,
CAAM (1996). Desarrollo y Problemßtica Ambiental del ┴rea del Golfo
Alday, C., Jelvez C. and Avial, A. (1998). Efectos Ecolˇgicos de la
de Guayaquil. Enero de 1996.
introducciˇn de especies exˇticas en el medio marino y costero
Cabello, R., and Jacinto, M.E. (2002). Estado de contaminaciˇn marina
chileno. Documento preparado para la Reuniˇn de Expertos para
por hidrocarburos de petrˇleo en ßreas costeras seleccionadas del
analizar los efectos ecolˇgicos de la introducciˇn de especies
Per˙. Informe Interno IMARPE.
exˇticas en el PacÝfi co Sudeste. Vi˝a de Mar-Chile. Septiembre 28-
Cabello, R. and Sßnchez, G. (2003). Contaminantes Orgßnicos Persistentes
30 de 1998.
en el ßrea costera de ca˝ete 2002. Informe interno UMGC-LÝnea de
BCCL (2002). EstadÝsticas de Producto Interno Bruto por Clase de
Monitoreo Ambiental-IMARPE.
Actividad Econˇmica y Exportaciones de Bienes por Trimestres.
Cabrera, (1994). Contaminaciˇn Marina en Chile Proveniente de
Banco Central de Chile.
Actividades en Tierra, Informe de ConsultorÝa a la Comisiˇn
BCE (2002). BoletÝn EstadÝstico Mensual. N║ 1809. Septiembre 30 del
Permanente del PacÝfi co Sur, CPPS, Plan de Acciˇn para la Protecciˇn
2002. Banco Central del Ecuador.
del Medio Marino y ┴reas Costeras del P/SE.
BCRP (2002). Datos estadÝsticos de Exportaciones por grupo de
Calero, L., Casanova, R. and Zambrano, M. (1996). Diagnˇstico de la
productos y Producto Bruto Interno por Sectores Productivos.
Contaminaciˇn Marina en el PacÝfi co Colombiano, Fase I y II, Informe
Anexo 10 y 32. Banco Central de Reserva del Per˙.
Centro de Control de Contaminaciˇn del PacÝfi co, CONPACSE, Plan
Bello, R. (2001). Captura incidental de cetßceos en la pesca industrial
DE Acciˇn del PacÝfi co Sudeste, CPPS.
de cerco entre enero y septiembre de 2001. Informe Anual 2001,
CAN (2002). Compendio Bßsico del Agua en MÚxico. Programa Nacional
Investigaciones de lobos marinos y cetßceos del mar peruano.
Hidrßulico. Comisiˇn Nacional del Agua. MÚxico D.F. MÚxico.
Instituto del Mar del Per˙. Informe Interno.
Canales, C, Hamuy, M.T. and Aguilera, R. (1990). Efectos ambientales de
Benoit, Y. and Z˙˝iga, M. (1995). Informe Nacional sobre las ┴reas
las poblaciones marginales en los ecosistemas costeros y marinos
MarÝtimas y Costeras Protegidas de Chile. Presentado en la reuniˇn
de Chile. In: Suplemento del Informe del Seminario Taller sobre los
de expertos para el establecimiento de una Red Regional de ┴reas
Efectos Ambientales de las Poblaciones Humanas Marginales sobre
Costeras y Marinas Protegidas en el PacÝfi co Sudeste. Panamß, 26 y
los Ecosistemas Costeros y Marinos del PacÝfi co Sudeste (Ocupaciˇn
28 de junio, 1995.
Territorial y Explotaciˇn), Guayaquil, Ecuador, 26-29 de junio de
Bore, D. (1987). Evaluaciˇn Rßpida de las Fuentes de Contaminaciˇn
1990, doc CPPS/PNUMA(OCA)-PSE/HABITAT WG 1/Supp 1.
Industrial Provenientes de la V y VIII Regiones, Chile, al medio
Cßnepa, J., Kameya, A. and Mogollˇn V. (1998). Efectos Ecolˇgicos de la
Marino, Informe Instituto de Fomento Pesquero de Chile, IFOP,
introducciˇn de especies exˇticas en el PacÝfi co Sudeste: El Caso
en: Versiones Reducidas de las Contribuciones Nacionales del
Per˙. Documento preparado para la Reuniˇn de Expertos para
Inventario de Fuentes de Contaminaciˇn Marina, doc. CPPS/
analizar los efectos ecolˇgicos de la introducciˇn de especies
PNUMA, agosto de 1987.
exˇticas en el PacÝfi co Sudeste. Vi˝a de Mar-Chile. Septiembre 28-
Bore, D., Pizarro., F. and Cabrera N. (1988). Diagnˇstico de la
30 de 1998.
Contaminaciˇn Marina en Chile. Procede de: Inventario de fuentes
Carrasco, S. and Mu˝oz, A. (1995). Contaminaciˇn Marina en el PacÝfi co
terrestres de contaminaciˇn del PacÝfi co Sudeste. Documento
Sudeste Generada por Fuentes Terrestres, Inventario Actualizado de
CPPS/UCR, Plan de Acciˇn del PacÝfi co Sudeste/ PNUMA. Bogotß.
Fuentes de Contaminaciˇn a 1995, Informe de ConsultorÝa a CPPS,
Briones, E., Flachier, A., Gˇmez, J., Tirira, D., Medina, H., Jaramillo., I. and
Plan de Acciˇn del PacÝfi co Sudeste, diciembre, 1995.
Chiriboga, C. (1997). Inventario de Humedales del Ecuador. Primera
Carrera De la Torre, L. (ed). (1993). La Gestiˇn Ambiental en el Ecuador.
Parte: Humedales LÚnticos de las Provincias de Esmeraldas y
Ministerio de Relaciones Exteriores del Ecuador.
ManabÝ. EcoCiencia/INEFAN/Convenciˇn de Ramsar.
Carrera de la Torre, L. (1996). Sistemas biofÝsicos del Golfo de Guayaquil,
Briones, E., Gˇmez, J., Hidalgo, A., Tirira, D. and Flachier, A. (2001a).
Ecuador. Documento de la Comisiˇn Asesora Ambiental de la
Inventario de Humedales del Ecuador. Segunda Parte: Humedales
<presidencia de la rep˙blica, CAAM, Ecuador, enero 1996.
Interiores de la Provincia del Guayas ş Tomo I. Convenciˇn de
Ramsar/INEFAN/EcoCiencia. Quito ş Ecuador.
REFERENCES
57
Casta˝eda, N. (1980). El Mercurio como indicador contaminante en
Choez, D. (1989). Anßlisis de Metales Pesados en Agua de Mar y
la BahÝa de Callao. Tesis Facultad de OceanografÝa, PesquerÝas y
Sedimentos de Fondo en ┴reas Costeras de Ecuador; ESPOL,
Ciencias Alimentarias. Universidad Nacional Federico Villareal,
en: Memorias del Seminario Internacional sobre Investigaciˇn y
Lima, Per˙.
Vigilancia de la Contaminaciˇn Marina en el PacÝfi co Sudeste, Cali,
Castilla, J.C. (1983). Environmental Impact and Sandy Beaches of Cooper
Colombia, 6-8 septiembre de 1989, J.J. Escobar (Ed). Pub. CPPS/
Mining Tailing at Cha˝aral, Chile. Mar. Poll. Bull, (12):459-64.
PNUMA, Santiago, Chile.
Castilla, J.C. and Nealler, E. (1978). Marine Impact due to Mining Activities
Chuecas, L., Chiang, J. and Bore., D. (1989). Evaluaciˇn de la presencia
of El Salvador Cooper Mining, Chile. Mar. Poll. Bull, 9(3):67-70.
de metales pesados en agua de mar proveniente del litoral de la
Castillo, S., Cabello, R. and DomÝnguez, N. (2000). Evaluaciˇn de la
costa Centro y Sur de Chile, en Memorias del Primer Seminario
calidad del ambiente marino costero y zonas estuarinas en Tumbes.
Internacional sobre Investigaciˇn y Vigilancia de la Contaminaciˇn
23 al 25 de noviembre 2000. Informe Interno IMARPE 2000.
MarÝtima en el PacÝfi co Sudeste, Cali, Colombia, 6-8 de septiembre
Castro, C and Morales, E. (1989). La Erosiˇn de la Zona Costera en Chile,
de 1989, J.J. Escobar (Ed.) pub. CPPS/PNUMA, Santiago, Chile.
en Suplemento al Informe del Seminario-Taller CPPS/PNUMA/COI
Csirke, J., Guevara-Carrasco, R., Cßrdenas, G., Điquen, M. and Chipollini,
sobre Erosiˇn de las Zonas Costeras del PacÝfi co Sudeste. Guayaquil,
A. (1996). Situaciˇn de los recursos anchoveta (Engraulis ringens) y
Ecuador. Noviembre 7-11 de 1989
sardina (Sardinops sagax) a principios de 1994 y perspectivas para
CEDEGE (1996). SÝntesis de resultados correspondientes al monitoreo en
la pesca en Per˙, con particular referencia a la regiˇn norte de la
el ßrea prototipo durante la campa˝a realizada en 1996. CEDEGE/
costa peruana. Bol. Inst. Mar. Per˙. Callao, 15(1):1-23.
BIRF.
Clement, A. and Lambeye, G. (1994). Manejo y perspectivas futuras
CEPAL (1983). Los desastres naturales de 1982.1983 en Bolivia, Ecuador
de las fl oraciones de algas nocivas en Chile. Taller Regional de
y Per˙, Comisiˇn Econˇmica para AmÚrica Latina-Naciones
Planifi caciˇn CientÝfi ca Sobre Afl oraciones de Algas Nocivas,
Unidas. Consejo Econˇmico Social. Documento E/CEPAL/G.1274.
Montevideo, Uruguay, 15-17 de junio de 1994. COI/UNESCO. Informe
27 Diciembre 1983.
de la Reuniˇn de Trabajo (101):27-29, Anexo III.
CEPAL (1996). La MinerÝa de AmÚrica Latina y el Caribe en el contexto
CLIRSEN (1996). Estudio Multitemporal de Manglares, Camaroneras y
mundial, Divisiˇn de Medio Ambiente y Desarrollo de la Comisiˇn
Salinas al a˝o 1995.
Econˇmica para AmÚrica Latina y el Caribe, Documento LC/R
CNA (2002). El impacto del virus de la Mancha Blanca en el sector
1702.
camaronero. Retrieved July 2003, from http://wwwcna.com.ec.
CEPAL. (2001). Anuario EstadÝstico para AmÚrica Latina y el Caribe.
Coello, S. (1996). Pesca y Acuacultura en el Golfo de Guayaquil. Informe
ECLAC. Retrieved from http://www.cepal.org.
de ConsultorÝa a la CAAM.
CÚspedes, P.L. (1990). Principales Poblaciones Humanas Marginales de la
Colwell, R. (1996). Global Climate and Infectious Disease: The Cholera
Cuenca del PacÝfi co Peruano, Instituto Nacional de Planifi caciˇn. In:
Paradigm. Science, 274:2025-2031.
Suplemento al Informe del Seminario Taller sobre los Efectos de las
CONAMA (2002). Antecedentes para la PolÝtica Nacional sobre Gestiˇn
Poblaciones Humanas Marginales en los Ecosistemas Marinos del
Integral de los Residuos.
PacÝfi co Sudeste (Ocupaciˇn Territorial y Explotaciˇn), Guayaquil,
CPPS - Comisiˇn Permanente del PacÝfi co Sur (1999). Evaluaciˇn de
Ecuador, 26-29 junio de 1990, documento CPPS/PNUMA (OCA)-
recursos y pesquerÝas artesanales en el PacÝfi co Sudeste. Informe
PSE/HABITAT WI/Supp. 1
Final. SÚptima reuniˇn del Grupo de Trabajo CPPS/FAO. Callao
Chiang, J. (1989). Estudio bßsico para Evaluar la Presencia de Metales
ş Per˙. Junio 21-25 de 1999.
Pesados en agua, sedimentos y organismos marinos en la V Regiˇn
CPPS - Comisiˇn Permanente del PacÝfi co Sur (2000a). Estado del Medio
de Chile, Escuela de QuÝmica y Farmacia, U. de ValparaÝso, Informe
Ambiente Marino y Costero del PacÝfi co Sudeste. Plan de Acciˇn
al Plan de Acciˇn del PacÝfi co Sudeste.
para la Protecciˇn del Medio Marino y ┴reas Costeras del PacÝfi co
Chiang, J. and N˙˝ez, C. (1983). Estudio comparativo sobre metales
Sudeste. Quito, Ecuador. Escobar, J.J. (ed.). CPPS/UNEP/IOC.
pesados a nivel de trazas en especies marinas, V Regiˇn, Chile,
CPPS - Comisiˇn Permanente del PacÝfi co Sur (2000b). Principales
Alimentos 12(34):7-15.
indicadores de la pesquerÝa en el PacÝfi co Sudeste con especial
referencia a la pesquerÝa artesanal e industrial. Quito, Ecuador.
CPPS - Comisiˇn Permanente del PacÝfi co Sur (2001a). Scaling and
Scoping Report, Sub-Region 64-Humboldt Current.
58
GIWA REGIONAL ASSESSMENT 64 HUMBOLDT CURRENT
CPPS - Comisiˇn Permanente del PacÝfi co Sur (2001b). Socio-
DIGMER (1987). Programa de caracterizaciˇn y vigilancia de la
economic aspects of the wastewater problem in the Southeast
contaminaciˇn marina por hidrocarburos de petrˇleo en el PacÝfi co
Pacifi c. Consultant report to CPPS. July 2001. Guayaquil, Ecuador.
Sudeste- Ecuador, informe del primer muestreo a CPPS, diciembre
(Unpublished).
de 1987.
CPPS - Comisiˇn Permanente del PacÝfi co Sur (2003a). BoletÝn de
DIGMER (1988). Caracterizaciˇn y Vigilancia de la Contaminaciˇn Marina
estadÝsticas pesqueras del PacÝfi co Sudeste 2000. N░ 13. Guayaquil,
por Metales Pesados en sedimentos y organismos vivos de las ┴reas
Ecuador.
Costeras de Esmeraldas, Manta, PenÝnsula de Sta. Elena, Pto. BolÝvar
CPPS - Comisiˇn Permanente del PacÝfi co Sur (2003b). Convenios,
y Guayaquil, Ecuador, Informe a CPPS, 25 pp. (en mßquina).
acuerdos, protocolos, declaraciones, estatuto y reglamento de la
DIGMER (1994). Informe de Avance de CONPACSE. Fase II. Programa
CPPS. Guayaquil, Ecuador.
de Control y Vigilancia de la Contaminaciˇn Marina Proveniente
CPPS - Comisiˇn Permanente del PacÝfi co Sur (2003c). Reuniˇn de
de Fuentes DomÚsticas, AgrÝcolas, Industriales y Mineras en las
Expertos sobre el Impacto de la Introducciˇn de Especies Exˇticas
Provincias del Guayas y El Oro, Informe a CPPS, Guayaquil, Ecuador
en el PacÝfi co Sudeste. Problema e las Aguas de Lastre de los
(inÚdito).
Buques. Panamß, Rep˙blica de Panamß, 9-11 de julio de 2003.
Dinerstein, E., Olson, D.M., Graham, D.J., Webster, A.L., Primm, S.A.,
CPPS/PNUMA. (1997). Evaluaciˇn de la vulnerabilidad de las ßreas
Bookbinder M.P. and Ledec, G. (1995). A conservation assessment
costeras a incrementos en el nivel del mar como consecuencia del
of the terrestrial ecoregions of Latin America and the Caribbean.
calentamiento global: caso de estudio- BahÝa de Concepciˇn, Chile.
The World Bank/ WWF.
CPPS/PNUMAPSE/IE (97)6.
DIRECTEMAR (2003). EstadÝstica de empresas; Departamento de
CPPS/UNEP (1983). Action Plan for the protecyion of the marine
Preservaciˇn del Medio Ambiente Acußtico (DPMAA Y CC).
environment and coastal ares of the South-East Pacifi c. UNEP
Direcciˇn de Intereses MarÝtimos y Medio Ambiente Acußtico
Regional Seas Reports and Studies, N░20.
(DIRINMAR). Chile.
CPPS/UNEP/IOC (1988). State of Marine Environment in the South-East
Dorion, R, and Bonnet, C. (1989). Concentrciˇn de hidrocarburos
Pacifi c region. Final Report CPPS/UNEP/IOC. Draft Document and in
aromÚticos policÝclicos dispersos/disueltos en agua superfi cial de
revision by CPPS and FAO, report of the Regional Task Force about
Isla de Pascua, zona sur de Chile, Estrecho de Magallanes y B de
the Health Status of the Oceans. Bogotß, Colombia. February,
ValparaÝso. In: Escobar, J.J. (ed.). Memorias del Primer Seminario
1989.
Internacional sobre Investigaciˇn y Vigilancia de la Contaminaciˇn
Cucalˇn, E. (1986). Sinopsis de la OceanografÝa de la Regiˇn Frente a
Marina en el PacÝfi co Sudeste, Cali, Coloombia, 6-8 septiembre de
las Costas de Ecuador. Bases biolˇgicas y marco conceptual para
1989. CPPS, Santiago, Chile.
el manejo de los recursos pelßgicos en el PacÝfi co Suroriental.
Echegaray, M. (1986). Contenido de Mercurio, Cobre y Cadmio en
Publicaciˇn sobre los resultados del Proyecto Regional de
moluscos Bivalvos y Sedimentos de la Costa Peruana, 1986
Evaluaciˇn de los Recursos Sardina, Jurel y Caballa en el PacÝfi co
ş Informe U. Nal. Federico Villareal a CPPS Lima, Per˙. 10 pp (en
Suroriental, ejecutado por Ecuador, Per˙ y Chile, con el apoyo
mßquina).
fi nanciero del BID. Ediciˇn coordinada por O.A. Mathisen e I.
Echegaray, M and GuerÝn, C. (1989). Contaminaciˇn con mercurio, cobre
Tsukayama. OLDEPESCA. Documento de Pesca 1:30-33.
y cadmio en el litoral peruano. U. Nac. Federico Villarreal, Lima, Per˙.
Cucalˇn, E. (1996). OceanografÝa y Sistemas BiofÝsicos del Golfo de
In: Escobar, J.J. (ed.). Memorias del Primer Seminario Internacional
Guayaquil. In: Sistemas BiofÝsicos en el Golfo de Guayaquil. Comisiˇn
sobre Investigaciˇn y Vigilancia de la Contaminaciˇn Marina en el
Asesora Ambiental de la Presidencia de la Rep˙blica.
PacÝfi co Sudeste. Cali, Colombia, 6-8 septiembre de 1989. CPPS,
De Gregori, I., Pinochet, I., Delgado, D. and DÝaz, J. (1983). Aplicaciones
Santiago, Chile
de la VoltametrÝa por Redisoluciˇn a la Determinaciˇn de Metales
Echegaray, M., Guerin, C., Hinojosa, I., Zambrano, W. and Taylor, L. (1987).
Pesados al estado de trazas en Aguas Naturales. En: Simposio sobre
Vigilancia de la contaminaciˇn marina por metales pesados en ßreas
contaminaciˇn Ambiental orientado al Agua. Santiago, INIA.
crÝticas peruanas (Moluscos bivalvos como bioindicadores). Informe
Delgado, D. and Laguna, A. (1995). Inventario Actualizado de Fuentes de
de CONPACSE al Plan de Acciˇn del PacÝfi co Sudeste. Universidad
Contaminaciˇn Marina en la BahÝa de Panamß, Informe CONAMA a
Nacional Federico Villarreal, Lima, Per˙.
CPPS, Panamß, Rep˙blica de Panamß (Unpublished)
Ecuadorian Ministry of Tourism (2000). Plan de Competitividad del
Ecuador. Ministerio de Turismo, Proyecto OMT- PNUD ECU-98-012.
Manuscrito. Archivos Ministerio de Turismo.
REFERENCES
59
EMAP/DIGMER (1988). Inventario de fuentes de contaminaciˇn marina
GuillÚn, O. and Aquino, R. (1978). Contaminaciˇn de los Puertos de Callao
en el Ecuador a partir de actividades terrestres. Procede de:
y chimbote y su efecto en la Productividad. Informe Instituto del
Inventario de fuentes terrestres de contaminaciˇn del PacÝfi co
Mar del Per˙ IMARPE 61.
Sudeste. Documento CPPS/UCR, Plan de Acciˇn del PacÝfi co
GuillÚn, O., Aquino, R. and Jacinto, M. (1986). Distribuciˇn de trazas de
Sudeste/ PNUMA. Bogotß.
metales rn rl puerto de Callao. Bol. Instituto del Mar (IMARPE), 10(8):
Enfi eld, D. (1975). OceanografÝa de la regiˇn norte del Frente Ecuatorial:
188-210.
aspectos fÝsicos. Instituto Oceanogrßfi co de la Armada del Ecuador
GutiÚrrez, F. (1989). Diagnˇstico de la contaminaciˇn marina en el
ş INOCAR. Guayaquil, Ecuador.
PacÝfi co Sudeste por metales pesados, pesticidas y eutrofi caciˇn
Escobar, R.J. (1996). Inventario de fuentes de contaminaciˇn marina en
Informe a la CPPS. In: Escobar, J.J. (ed.). Memorias del primer
Colombia, 1996. Informe Resumido para el Programa Global de
Seminario Internacional de Investigaciˇn y Vigilancia de la
Acciˇn PAG/LBA, Documento CCO para CPPS, Bogota, Colombia,
Contaminaciˇn Marina en el PacÝfi co Sudeste, Cali, Colombia, 6-8
agosto de 1996.
de septiembre de 1989. CPPS, Santiago, Chile.
Escobar, J. (2002). La contaminaciˇn de los rÝos y sus efectos en las ßreas
GutiÚrrez, F. (1996). Actualizaciˇn del Inventario de Fuentes Terrestres
costeras y el mar. CEPAL, ECLAC. Series N░50.
de Contaminaciˇn Marina en el PacÝfi co Colombiano, Informe de
ESPOL (1987). Evaluaciˇn de metales pesados en agua de mar y
consultorÝa de CCO, documento Comisiˇn Permanente del PacÝfi co
sedimentos en el ßrea costera de las provincias del Guayas, El Oro y
Sur, archivo CCO, Bogotß, Colombia.
Golfo de Guayaquil. Ecuador. Doc. CPPS/PNUMA.
Guzmßn, M. (1996). Trazas de metales en sedimentos superfi ciales en
FAO (1995). Cˇdigo de Conducta para la pesca responsable. FAO, Roma,
la bahÝa del Callao-Ventanilla durante 1994. Inf. Prog. Inst. Mar Per˙,
Italy.
37(1):01-20.
FAO (1997). Review of the state of World Marine Fisheries. Marine
Guzmßn, M. (2003). Contenido de metales pesados en sedimentos y
Resources Service. Fisheries Resources Division. Fisheries
organismos marinos en bahÝas seleccionadas de la costa peruana
Department. FAO Fisheries Circular No. 920 FIRM/C920(En). Rome.
durante el 2002. Informe interno IMARPE.
FAO (2000a). Food Balance Sheet, FAOSTAT.
Guzmßn, M., Chßvez, J., Morˇn, J., Sßnchez, O. and Flores, G. (1997).
FAO (2000b). El estado mundial de la pesca y la acuicultura. Rome.
Evaluaciˇn de la calidad del medio ambiente marino en la BhÝa de
Italy.
Pisco-Paracas, 22 a 24 de mayo 1996. Informe Progresivo 54.
FAO (2000c). Resumen Informativo sobre la pesca por paÝses. La
Guzmßn, M, Jacinto, M., Vazquez, L. and Castillo, S. (2000). Evaluaciˇn
Rep˙blica de Chile. FID/CO/CHI/Rev.4
de la calidad acußtica en el ßrea costera del Callao. Agosto 2000.
FAO (2002a). FISHBASE. Retrieved from http://www.fao.org.
Informe Interno IMARPE 2000.
FAO (2002b). Uso de pesticidas. FAOSTAT. Retrieved from http://
Hinojosa, B.I. and Hormeno, D.O. (1989). Estudio de la Contaminaciˇn por
www.fao.org.
Metales Pesados en la BahÝa de Paracas, U. Nac. Federico Villareal,
FAO (2002c). Perfi les Nacionales del Uso del Agua en la Agricultura.
Lima, Per˙. In: Escobar, J.J. (ed.). Memorias del Primer Seminario
AQUASTAT. Retrieved from http://www.fao.org.
Internacional de Investigaciˇn y Vigilancia de la Contaminaciˇn
FÚlix, F. and Samaniego, J. (1994). Incidental catches of small cetaceans
Marina en el PacÝfi co Sudeste, Cali, Colombia, 6-8 de septiembre
in the artisanal fi sheries of Ecuador. Rep. Int. Whal. Commn, Special
de 1989, CPPS, Santiago, Chile.
issue 15:475-480.
Houvenaghel, G.T. and Houvenaghel, N. (1982). Aspectos Ecolˇgicos
Gaibor, N., GarcÝa, N., de Cruz, M., Massay, S., Ortega, D., Villamar, F., Mora,
de la Zonifi caciˇn de Entremareas en las Costas Rocosas de las
E., Basantes, A. and Vicu˝a, H. (1992). Evaluaciˇn de la pesquerÝa de
Islas Galßpagos. In: Everhardt, U. (ed.). Compendio de Ciencia en
postlarvas de camarˇn Peneido y su fauna acompa˝ante. Informe
Galßpagos. Publicaciˇn de la Estaciˇn CientÝfi ca Charles Darwin.
Interno INP/PMRC/1992. Guayaquil, Ecuador.
Isla Santa Cruz, Galßpagos, Ecuador. 79-100 p.
Gallardo, (1984). Revisiˇn actualizada a 1983 de la contaminaciˇn marina
Hurtado, M. (1995a). Marine Region 17. Southeast Pacifi c. In: Kelleher,
proveniente de fuentes terrestres en la regiˇn del PacÝfi co Sudeste.
G., Barkley, C. and Wells, S. (eds.). A Global representative System of
Rev. Com. PacÝfi co Sur, (14):19-173.
Marine Protected Areas. Vol. IV, p. 131-151.
Glynn, P.W. and Wellington G.M. (1983). Corals and corals reef of the
Hurtado, M. (1995b). MonografÝa sobre las ┴reas Marinas y Costeras
Galßpagos Islands. University of Berkeley Press.
Protegidas del PacÝfi co Sudeste. Documento de consultorÝa para
GuillÚn, O. (1981). Fuentes, niveles y efectos de la contaminaciˇn marina
CPPS/PNUMA/FAO.
en Per˙, CPPS, Series, Seminarios y Estudios (2):51-116.
60
GIWA REGIONAL ASSESSMENT 64 HUMBOLDT CURRENT
Hurtado, M., Yturralde, G. and Sußrez, H. (2000). Biodiversidad Marina
Jacinto, M. and Cabrera, M. (1998). Visiˇn Ambiental de las Zonas
en el Ecuador Continental. Informe Final de ConsultorÝa preparado
Costeras y Marinas en el PacÝfi co Sudeste. Informe Per˙. pp 161-178.
para EcoCiencia. Convenio: Ministerio del Ambiente/UICN-sur/
En Taller de Trabajo Regional sobre Medio Ambiente, EconomÝa e
EcoCiencia.
Indicadores Ambientales para el Desarrollo Sostenible de las Zonas
IMARPE (2002a). Informe annual 2002 de la unidad de investigaciones
Costeras y Marinas del PacÝfi co Sudeste. Cali, Colombia, 3-5 de junio
de dinßmica poblacional de recursos pelßgicos UIDP 2002. Informe
de 1998. Informe del Taller de Trabajo CPPS/PNUMA.
Interno.
Jacinto, M. et al., (1991). Evaluaciˇn de los niveles de hidrocarburos de
IMARPE (2002b). Evaluaciˇn y diagnˇstico del recurso merluza
petrˇleo en ßreas sensibles del PacÝfi co Sudeste, costa peruana.
(Merluccius gayi peruanus) en el litoral peruano. Informe Interno,
Doc. IMARPE, Report of CONPACSE to CPPS. (Unpublished).
Nov. 2002.
Jacinto, M., MartÝnez, C., Velazco, I. and Pizarro, L. (2001). Condiciones
IMARPE (2003). Informe sobre contaminaciˇn en Per˙. Report of the
ambientales y biolˇgicas en la bahÝa de Huamey. Informe
Peruvian task team GIWA to CPPS. (Unpublished).
progresivo 148.
INE/CONAMA (2002). EstadÝsticas del Medio Ambiente 1996-2000.
Jahncke, J., Goya, E. and GuillÚn, A. (2001). Seabird by-catch in small-scale
Santiago, Chile.
long-line fi sheries in Northern Per˙. Waterbirds, 24(1):137-141.
INEI-ENHIV (2004). National Institute of Statistics and Information,
JICA (1995). Estudio para el Plan Maestro para el Puerto de Guayaquil en
National home survey, IV trimester 1997-2001. Retrieved January
la Republica del Ecuador.
2004, from http://www.inei.gob.pe.
JimÚnez, R. (1996). Aspectos Biolˇgicos y Ecolˇgicos del Golfo de
INOCAR (2001). Actualizaciˇn del estudio de impacto ambiental del
Guayaquil. En: Desarrollo y Problemßtica Ambiental del ┴rea del
dragado del canal de acceso al puerto marÝtimo de Guayaquil.
Golfo de Guayaquil. CAAM.
INOCAR (2002a). Informe tÚcnico del estudio de calidad de las aguas
JimÚnez, R. (2000). Algunas consideraciones sobre la introducciˇn de
del rÝo Atacames.
especies exˇticas y no exˇticas en la acuacultura en del Ecuador.
INOCAR (2002b). Estudio de impacto ambiental para el dragado del
Ponencia presentada durante el Taller de trabajo para revisar
canal de acceso al puerto marÝtimo de Puerto BolÝvar.
los procedimientos para la introducciˇn de especies exˇticas.
INP (1986). Determinaciˇn de Metales Pesados en Agua de Mar,
Secretaria de Recursos Pesqueros. Julio 12 del 2000.
sedimentos del ┴rea Costera de las Provincias de Guayas y El Oro,
Kameya, A., VÚlez, J. and Rivadeneira, V. (1991). Fauna acompa˝ante de
Golfo de Guayaquil, Ecuador, Doc, CPPS/PNUMA, Plan de Acciˇn del
los langostinos y su utilizaciˇn como recurso alimenticio. Revista de
P/SE, Quito, Ecuador, 7 pp. (en mßquina).
TecnologÝa de Alimentos Pesqueros No. 4 (OLDEPESCA).
INP (1999). EstadÝsticas de los desembarques pesqueros en Ecuador
Landscan (2001). Oakridge National Laboratory (ORNL). Retrived 2001
1985 - 1997. Eds. Cecilia MarÝn, Franklin Ormaza y Luis Arriaga.
from, http://www.ornl.gov/gist/landscan/index.html.
VECEP. ALA 92/43.
Lescrauwaet, A.C. and Ginbbons, J. (1994). Mortality of small cetaceans
INRENA (1995). Informe de estudios y actividades del INRENA
and the crab bait fi shery in the Magallanes area of Chile since 1980.
relacionadas con la problemßtica de contaminaciˇn del paÝs.
Rep.Int.Whal.Commn, Special issue, 15:485-494.
Direcciˇn General del Medio Ambiente Rural. Ministerio de
Lecaros, O., and Astorga, M. (1989). Metales Pesados en Mytilus chilensis
Agricultura de Peru.
en el sector Nororiental del Estrecho de Magallanes, Chile, Inst. de
Intriago, P. (1998). Dise˝o de un Plan de Monitoreo del Bacterioplancton,
la Patagonia, en: Memorias del Primer Seminario Internacional de
Bacteriobentos y Contaminaciˇn del Agua y Sedimentos del Golfo
Investigaciˇn y Vigilancia de la Contaminaciˇn Marina en el PacÝfi co
de Guayaquil. Diagnˇstico y Propuesta de soluciones Integrales
Sudeste, Cali, Colombia, 6-8 de septiembre de 1989, J.J. Escobar (Ed),
para el Golfo de Guayaquil. Proyecto PATRA, CAAM.
CPPS, Santiago, Chile.
Intriago, P., JimÚnez, R., Machuca, M., Varonil, R., Krauss, E. and Salvador,
Little, M. and Herrera, M. (1991). Checklist and Catalogue of Fish Recorded
X. (1994). Taura Syndrome in Ecuador: experimental evidence and
in the By- Catch of the Ecuadorian Shrimp Fleet. Agreement
general facts supporting a toxic etiology. Submmitted to the
Overseas Development Administration of the UK. Government
Journal of World Aquaculture.
(ODA)-Instituto Nacional de Pesca (INP), Guayaquil-Ecuador.
Jacinto, M. and Cabello, R. (1996). Niveles de hidrocarburos del petrˇleo
Lˇpez, T. (1982). Determinaciˇn de Metales Pesados en Aguas y
en el ecosistema marino costero del Per˙. bahÝas seleccionadas,
Sedimentos de la BahÝa de Ite (Per˙). Tesis de Grado para el titulo
periodo 1996. Inf. Prog. Inst. Mar Per˙ 110.
de Ingeniero Pesquero, Universidad Nacional de Callao (Per˙).
REFERENCES
61
Monta˝o, M. (1993). Estudio de la Calidad del Agua Costera Ecuatoriana.
Pin, G., GarcÝa, F. and Castello, M. (1998). Microfl ora bacteriana
Programa de Manejo de Recursos Costeros. Guayaquil, Marzo
de las aguas del estuario interior del Golfo de Guayaquil. En:
1993.
Comportamiento temporal y espacial de las caracterÝsticas fÝsicas,
Morales, E.G. and Castro, C. (1989). La Erosiˇn de la Zona Costera de Chile,
quÝmicas y biolˇgicas del Golfo de Guayaquil y sus afl uentes Daule
documento del Seminario-Taller CPPS/PNUMA/COI sobre la Erosiˇn
y Babahoyo entre 1994-1996. INP. Guayaquil ş Ecuador.
de la Zona Costera del PacÝfi co Sudeste, Guayaquil, Ecuador, 7-11
Pinochet, A., Delgado, D.L., and De Gregory, I. (1989). Niveles y
noviembre de 1989, CPPS/PNUMA (OCA) şPSE/COI/WG1/1.
Distribuciˇn de Algunos Metales Pesados y Nutrientes en Agua
Morales, E.G. (1995). Perfi l Costero de Chile, documento de la Facultad de
de Mar de la BahÝa de ValparaÝso, U. Catˇlica de ValparaÝso. In:
Recursos Naturales, Universidad Catˇlica de Chile, Informe a CPPS,
Escobar, J.J. (ed.). Memorias del Primer Seminario Internacional
Plan de Acciˇn del PacÝfi co Sudeste, ValparaÝso, Chile (inÚdito).
sobre Investigaciˇn y Vigilancia de la Contaminaciˇn Marina en el
Morßn, A and Valencia M. (2000). Estudio de la calidad de las aguas
PacÝfi co Sudeste, Cali, Colombia, 6-8 de septiembre de 1989, CPPS,
costeras insulares en la provincia de Galßpagos 1999. Acta
Santiago, Chile.
Oceanogrßfi ca del PacÝfi co 10(1).
PMRC (1993). Estudio de la Calidad de Agua Costera Ecuatoriana.
National Board of Fisheries (2004). Retrived March 2004, from http:
Grupo de Trabajo de Calidad de Agua Costera. SecretarÝa General
//sernapesca.cl.
de Administraciˇn P˙blica, Presidencia de la Rep˙blica del Ecuador/
NATURA/WWF (2002). Informe Galßpagos 2001-2002. Quito, Julio
Universidad de Rhode Island, Centro de Recursos Costeros/Agencia
2002.
para el Desarrollo Internacional de los Estados Unidos de AmÚrica.
OMS (2002). Casos de cˇlera en AmÚrica 1991-2001. Retrieved 2002, from
Read, A.J., Van Waerebeek, K., Reyes, J.C., McKinnon, J.C. and Lehman, L.C.
http://www.ops.org.
(1988). The exploitation of small cetaceans in coastal Peru. Biological
OPS/OMS (1987). GuÝas para la calidad del agua potable. Volumen 2.
Conservation, 46:53-70.
Publicaciˇn CientÝfi ca No. 506.
Robinson, G.E. and Del Pino, E. (1984). El Ni˝o en las Islas Galßpagos, El
OPS (2001). Reporte Regional de la Evaluaciˇn 2000 en la Regiˇn de las
Evento 1982-1983. Fundaciˇn Charles Darwin.
AmÚricas: Servicio de Agua Potable y Saneamiento, Estado Actual
Samaniego, M.G. (1986). Informe de Muestreo y Anßlisis de Metales en
y Perspectivas. OPS/PAHO.
Agua de Mar correspondiente al Golfo de Guayaquil. Informe de
Ormaza, F. (1994). Chemical description of infl ow and outfl ow waters
Avance de CONPACSE, periodo 1984-1986.
from shrimp farms located in the area of Taura (Ecuador) during a
Sßnchez, G. (1996). Estado de la Contaminaciˇn Marina en el Litoral
seasonal transition. Bordeaux Aquaculture 94, Spetial Publication of
Peruano, Informe Nacional a CPPS, Plan de Acciˇn del PacÝfi co
the European Aquaculture Society.
Sudeste, Lima, Per˙.
ORNL (2003). Landscan 2002. Oak Ridge National Laboratory. Retrieved
Sßnchez, R.G. and Orozco, R. (1997). Diagnˇstico regional sobre las
Nov. 2003 from http://www.ornl.gov/gist
actividades realizadas en tierra que afectan los ambientes marino,
Orozco, R. (2002). Informe de evaluaciˇn microbiˇlogica en la BahÝa de
costero y dulceacuÝcola asociados al PacÝfi co Sudeste. Informe de
CarquÝn y Guacho. Julio del 2002. Informe Interno IMARPE 2002.
ConsutorÝa a la Comisiˇn Permanente del PacÝfi co Sur CPPS- Plan
PÚrez, E. (1986). Trazas de Cobre, Cadmio, Hierro, en los RÝos Daule,
de Acciˇn para la protecciˇn del Medio Marino y ┴reas Costeras del
Babahoyo, Estero Salado y Golfo de Guayaquil, Informe INP.
PacÝfi co Sudeste, Lima, Per˙.
Documento DIGMER para CPPS, Plan de Acciˇn del PacÝfi co Sudeste
Sßnchez, B.G. and Zevallos, J. (1987). Inventario de fuentes terrestres de
(en mßquina).
contaminaciˇn marina de origen agrÝcola, industrial, domÚstico y
PÚrez, E. (1989). Traza de Metales Solubles en las Masas de Agua
minero en el Valle de Pisco,. Informe a CPPS, Lima, Per˙.
Adyacentes a la ciudad de Guayaquil, Ecuador, en: Memorias del
Sßnchez, G., Orozco, R. and Guzmßn, M. (2002). Evaluaciˇn del ambiente
Primer Seminario Internacional sobre Investigaciˇn y Vigilancia de
de la zona marino costera del litoral del Callao, Del 19 al 22 de marzo
la Contaminaciˇn Marina en el PacÝfi co Sudeste, Cali, Colombia, 6-8
2002. Informe interno IMARPE
de septiembre de 1989, J.J. Escobar (Ed)., CPPS, Santiago, Chile.
Sßnchez, B.G., Orozco, R. and Jacinto, M.E. (1996). Estado de la
Piatkin, K.D. and Krivoshein Y.S. (1981). MicrobiologÝa. Segunda Ediciˇn.
contaminaciˇn marina en el litoral peruano. Informe Nacional a
Editorial Mir. Mosc˙.
CPPS, Plan de Acciˇn del PacÝfi co Sudeste. Lima, Per˙.
Schwartz, M.L. (1982). The encyclopedia of beaches and coastal
environments. Hutchinson Ross Publishing Company. Stroudsburg,
Pennsylvania.
62
GIWA REGIONAL ASSESSMENT 64 HUMBOLDT CURRENT
SERPLAC (1980). Evaluaciˇn del grado de la contaminaciˇn del litoral de
United Nations (2002). Report of the World Summit on Sustainable
la VIII Regiˇn, Chile, informe Convenio U de Concepciˇn/SERPLAC,
Development. Johannesburg, South Africa, 26 August-4 September
VIII Regiˇn, Concepciˇn, Chile.
2002. Doc. A/CONF.199/20*. New York. 173 p.
Soldi, H., Conopuma, C., Huamßn, I. and Matos, F. (1988). Caracterizaciˇn
Universidad de Chile (2002). Estado del Medio Ambiente 2002. Informe
y vigilancia de la contaminaciˇn marina a partir de fuentes
PaÝs, Colecciˇn Sociedad Estado y PolÝticas P˙blicas. Centro de
domÚsticas, agrÝcolas, industriales y mineras en el ßrea de Lima
Anßlisis de PolÝticas P˙blicas. Universidad de Chile.
Metropolitana. Procede de: Inventario de fuentes terrestres de
Valcarzel, E., et al. (1975). Investigaciˇn de la Contaminaciˇn Marina en las
contaminaciˇn del PacÝfi co Sudeste. Documento CPPS/UCR, Plan
Aguas del Litoral Peruano, Direcciˇn de Investigaciˇn Tecnolˇgica,
de Acciˇn del PacÝfi co Sudeste/ PNUMA. Bogotß.
Ministerio de PesquerÝas, Per˙, No. 16.
Solˇrzano, L. (1985). Presencia de Metales Traza en el Estero Salado RÝo
Valencia, M. (1991). Anßlisis de la concentraciˇn de hidrocarburos
Babahoyo, Daule y Guayas, Documento del Instituto Nacional de
de petrˇleo disueltos/disperso en aguas costeras ecuatorianas.
Pescadle Ecuador, para el Informe del Plan de Acciˇn del PacÝfi co
Informe de avance del Plan de Acciˇn del PacÝfi co Sudeste, CPPS,
Sudeste (Archivo CPPS).
Bogotß, Colombia.
Stevenson, M. (1981). Variaciones estacionales en el Golfo de Guayaquil,
Valencia, M., Salcedo, C., Pesantes, F., Chang, J., Pesantes, W. and Hurtado,
un estuario tropical. BoletÝn CientÝfi co y TÚcnico, Instituto Nacional
M. (1996). Informe Nacional sobre el Estado de la Contaminaciˇn
de Pesca del Ecuador (INP), Vol IV, N░1.
Marina. Ecuador. Reuniˇn de Expertos para Revisar el Desarrollo
Stevenson, M. and Taft, V. (1971). New evidence of the equatorial
de CONPACSE, el Estado de Contaminaciˇn del Medio Marino
undercurrent eastern of the Galapagos Island. Jour. Mar. Res., 29(2):
del PacÝfi co Sudeste. Guayaquil, Ecuador, 22-25 de enero de 1996.
103-115.
(Unpublished).
SubsecretarÝa de Pesca de Chile (1998). Informe sobre el Estado de
Valencia, M., Palacios, C. and RodrÝguez, A. (2000). Calidad fi sicoquÝmica
las principales pesquerÝas industriales en Chile. Documento
y Bacteriolˇgica de las aguas alrededor de la ciudad de Guayaquil.
preparado para la segunda reuniˇn del grupo de trabajo de
1996-1998. Acta Oceanogrßfi ca del PacÝfi co, 10(1).
evaluaciˇn y ordenaciˇn pesquera en el PacÝfi co sudeste y de
Van Waerebeek, K. and Reyes, J.C. (1994). Interaction between small
especies transzonales y altamente migratorias. Callao-Per˙. Abril
cetaceans and Peruvian fi sheries in 1988-1898 and analysis of trends.
27-30 de 1998.
Rep .Int. Whal. Commn, Special issue 15:495-502.
SubsecretarÝa de Pesca de Ecuador (1997). Ecuador pesquero y acuÝcola,
Vergara, I. and Pizarro, F. (1981). Diagnˇstico de la Contaminaciˇn
anuario 1997. Guayaquil, Ecuador.
Marina en las Aguas del Litoral Peruano, Direcciˇn de Investigaciˇn
Teves, N.R. (1989). Anßlisis de los Problemas de Erosiˇn en la Costa
Tecnolˇgica, Ministerio de PesquerÝas, Per˙, No. 16.
PacÝfi ca Peruana, documento del Seminario şTaller CPPS/PNUMA/
WHO/UNICEF/WSSCC (2001). Global water supply and Sanitation
COI sobre la Erosiˇn de la Zona Costera del PacÝfi co Sudeste,
Assessment 2000 Report. World Health Organization and United
Guayaquil, Ecuador, 7-11 noviembre de 1989, documento CPPS/
Nations Children's Fund.
PNUMA/(OCA)/PSE/COI WG. 6 1/1.
WTO (World Tourism Organization) (1997). Yearbook of tourism and
Teves, N.R., Calienes, R., Zuzunaga, J., Guevara, R., del Carmen, C., Culqui,
trends, Vol. III.
E., Laos, G. and PÚrez, E. (1992). Efectos de los cambios climßticos en
Wyrtki, K. (1966). Oceanography of the Eastern Equatorial Pacifi c Ocean.
los ecosistemas costeros y marÝtimos del PSE. Informe del Grupo
Ocean. Mar. Biol. Ann. Rev., 4:33-68.
Nacional Peruano sobre los Cambios Climßticos a la CPPS, Plan de
Z˙˝iga, M. (1998). EcotoxicologÝa de metales en el ambiente acußtico.
Acciˇn del PacÝfi co Sudeste, Santiago de Chile, abril de 1992.
Una revisiˇn actualizada. En: D. Arcos (Ed.) MinerÝa del cobre,
UNEP (1999). Assessment of Land-Based Sources and Activities Aff ecting
ecologÝa y ambiente costero, Editora AnÝbal Pinto S.A., Concepciˇn,
the Marine, Coastal and Associated Freshwater Environment in the
p. 349 ş 376.
South-East Pacifi c. UNEP/GPA Coordination Offi
ce & CPPS (1999).
Z˙˝iga, M.A. and Burgos, M. (1996). Revisiˇn del Estado de CONPACSE
ISBN: 92-807-1830-4
y Contaminaciˇn Marina de Chile, documento presentado a la
United Nations. (1992). Report of the United Nations Conference on
Reuniˇn de Expertos del PacÝfi co Sudeste para revisar el Estado
Environment and Development. Rio de Janeiro 3-14 June 1992.
de la Contaminaciˇn del Medio Marino del PacÝfi co Sudeste y
Doc. A/CONF.151/26 (Vol 1).
COMPACSE, Guayaquil, Ecuador, 22-25 enero de 1996, CPPS.
REFERENCES
63
Zuzunaga, J. (2002). Some shared fi sh stocks of South Eastern Pacifi c.
Paper prepared for the Norway ş FAO Expert Consultation on the
Management of Shared Fish Stocks, Bergen, Norway 7-10 October
2002.
64
GIWA REGIONAL ASSESSMENT 64 HUMBOLDT CURRENT
Annexes
Annex I
List of contributing authors and organisations
Name
Institution
Country
Field of work
Ulises Munaylla
Plan of Action- CPPS
Peru
Focal Point of GIWA region 64 Humboldt Current
Mario Hurtado
Hurtado and Asociates
Ecuador
Environmental Consultant
Stella de la Torre
Universidad San Francisco de Quito
Ecuador
Environmental Consultant
Nora Cabrera
Sanitary Service Super- intendance
Chile
Wastewater
Mario Herrera Araya
DIRECTEMAR
Chile
Environmental impact assessment, oceanography, environmental politics
BetsabÚ Hurtado Castro
DIRECTEMER
Chile
Environmental politics, ecology
Hugo Salgado Cabrera
University of Conception
Chile
Environmental and natural resources economics, fishery economics and regulation
Claudio Dagach Contreras
DIRECTEMAR
Chile
Pollution control
Adolfo Acu˝a
University of Concepciˇn
Chile
Environmental sciences
Rosa Aguilera Vidal
University of Conception
Chile
Economy
Carla Falcˇn Simonelli
DIRINMAR
Chile
Fisheries
Susana Arciniegas
Military Geographic Institute
Ecuador
Geographic information system
Hernßn Moreano Andrade
PMRC
Ecuador
Integrated coastal zone management
Fernando Coello Navarro
Undersecretary of Fishing Resources
Ecuador
Fisheries
Miguel Fierro Samaniego
ESPOL
Ecuador
Socio-economic aspects of coastal management
Elizabeth Flores Abad
University of Guayaquil
Ecuador
Socio-economic aspects of coastal management
Manuel Valencia Touris
INOCAR
Ecuador
Industrial wastewater
Luis Arriaga Mosquera
National Institute of Fisheries
Ecuador
Fisheries, environmental politics
HÚctor Ayˇn
ESPOL
Ecuador
Environment and natural resources, pollution
Hernßn Moreano
DIGEIM (adviser)
Ecuador
Environmental politics
Godofredo Ca˝ote
IMARPE
Peru
Environmental politics, fisheries
Sulma Carrasco
IMARPE
Peru
Pollution
Jorge Ponce San Romßn
Ministry of Foreign Affairs
Peru
Environmental politics
Carmen Conopuma Rivera
Water and Sanitation enterprise of Lima
Peru
Wastewater
Elsa Galarza Contreras
IMARPE
Peru
Environment economy
Guadalupe Sßnchez Rivas
IMARPE
Peru
Marine and coastal environmental management
Renato Guevara Carrasco
IMARPE
Peru
Fisheries
Marcia Marques
GIWA
Brazil
Regional Coordinator for Latin-America and the Caribbean
Johnny ChavarrÝa
Hurtado and Asociates
Ecuador
Environmental Consultant
Gustavo Yturralde
Hurtado and Asociates
Ecuador
Environmental Consultant
Fernando FÚlix
Plan of Action-CPPS
Ecuador
Editor
ANNEXES
65
Annex II
Detailed scoring tables
I: Freshwater shortage
II: Pollution
Weight
Weight
Environmental
Environmental
Environmental issues
Score
Weight
averaged
Environmental issues
Score
Weight
averaged
concern
concern
score
score
1. Modification of stream flow
1
15
Freshwater shortage
1.9
4. Microbiological
2
35
Pollution
1.9
2. Pollution of existing supplies
2
60
5. Eutrophication
1
5
3. Changes in the water table
2
25
6. Chemical
2
30
7. Suspended solids
2
10
Criteria for Economics impacts
Raw score
Score
Weight %
8. Solid wastes
2
5
Very small
Very large
Size of economic or public sectors affected
2
30
0 1 2 3
9. Thermal
1
3
Minimum
Severe
Degree of impact (cost, output changes etc.)
3
60
10. Radionuclides
1
2
0 1 2 3
Occasion/Short
Continuous
Frequency/Duration
1
10
11. Spills
2
10
0 1 2 3
Weight average score for Economic impacts
2.5
Criteria for Economics impacts
Raw score
Score
Weight %
Criteria for Health impacts
Raw score
Score
Weight %
Very small
Very large
Very small
Very large
Size of economic or public sectors affected
2
30
Number of people affected
2
40
0 1 2 3
0 1 2 3
Minimum
Severe
Minimum
Severe
Degree of impact (cost, output changes etc.)
2
60
Degree of severity
2
60
0 1 2 3
0 1 2 3
Occasion/Short
Continuous
Occasion/Short
Continuous
Frequency/Duration
2
10
Frequency/Duration
1
10
0 1 2 3
0 1 2 3
Weight average score for Economic impacts
2.0
Weight average score for Health impacts
1.9
Criteria for Health impacts
Raw score
Score
Weight %
Criteria for Other social and
Raw score
Score
Weight %
community impacts
Very small
Very large
Number of people affected
2
40
Very small
Very large
0 1 2 3
Number and/or size of community affected
2
60
0 1 2 3
Minimum
Severe
Degree of severity
2
50
Minimum
Severe
0 1 2 3
Degree of severity
2
20
0 1 2 3
Occasion/Short
Continuous
Frequency/Duration
1
10
Occasion/Short
Continuous
0 1 2 3
Frequency/Duration
2
20
0 1 2 3
Weight average score for Health impacts
1.9
Weight average score for Other social and community impacts
2.0
Criteria for Other social and
Raw score
Score
Weight %
community impacts
Very small
Very large
Number and/or size of community affected
2
50
0 1 2 3
Minimum
Severe
Degree of severity
2
30
0 1 2 3
Occasion/Short
Continuous
Frequency/Duration
2
20
0 1 2 3
Weight average score for Other social and community impacts
2.0
66
GIWA REGIONAL ASSESSMENT 64 HUMBOLDT CURRENT
III: Habitat and community modification
IV: Unsustainable exploitation of fish
Weight
and other living resources
Environmental
Environmental issues
Score
Weight
averaged
concern
score
Weight
Environmental
Environmental issues
Score
Weight %
averaged
Habitat and community
concern
12. Loss of ecosystems
2
55
2.0
score
modification
13. Modification of ecosystems or
Unsustainable
14. Overexploitation
3
60
2.1
ecotones, including community
2
45
exploitation of fish
structure and/or species composition
15. Excessive by-catch and
0
5
discards
16. Destructive fishing practices
1
20
Criteria for Economics impacts
Raw score
Score
Weight %
Very small
Very large
17. Decreased viability of stock
Size of economic or public sectors affected
1
20
0
5
0 1 2 3
through pollution and disease
Minimum
Severe
18. Impact on biological and
Degree of impact (cost, output changes etc.)
1
20
1
10
0 1 2 3
genetic diversity
Occasion/Short
Continuous
Frequency/Duration
2
60
0 1 2 3
Criteria for Economics impacts
Raw score
Score
Weight %
Weight average score for Economic impacts
1.6
Very small
Very large
Size of economic or public sectors affected
3
25
Criteria for Health impacts
Raw score
Score
Weight %
0 1 2 3
Minimum
Severe
Very small
Very large
Degree of impact (cost, output changes etc.)
3
50
Number of people affected
0
-
0 1 2 3
0 1 2 3
Occasion/Short
Continuous
Minimum
Severe
Frequency/Duration
2
25
Degree of severity
0
-
0 1 2 3
0 1 2 3
Occasion/Short
Continuous
Weight average score for Economic impacts
2.8
Frequency/Duration
0
-
0 1 2 3
Criteria for Health impacts
Raw score
Score
Weight %
Weight average score for Health impacts
0
Very small
Very large
Criteria for Other social and
Number of people affected
0
-
Raw score
Score
Weight %
0 1 2 3
community impacts
Minimum
Severe
Very small
Very large
Degree of severity
0
-
Number and/or size of community affected
2
50
0 1 2 3
0 1 2 3
Occasion/Short
Continuous
Minimum
Severe
Frequency/Duration
0
-
Degree of severity
2
30
0 1 2 3
0 1 2 3
Occasion/Short
Continuous
Weight average score for Health impacts
0
Frequency/Duration
2
20
0 1 2 3
Criteria for Other social and
Raw score
Score
Weight %
Weight average score for Other social and community impacts
2.0
community impacts
Very small
Very large
Number and/or size of community affected
2
50
0 1 2 3
Minimum
Severe
Degree of severity
2
30
0 1 2 3
Occasion/Short
Continuous
Frequency/Duration
2
20
0 1 2 3
Weight average score for Other social and community impacts
2.0
ANNEXES
67
V: Global change
Weight
Environmental
Environmental issues
Score
Weight
averaged
concern
score
19. Changes in the hydrological cycle
2
60
Global change
1.6
20. Sea level change
1
15
21. Increased UV-B radiation as a
1
20
result of ozone depletion
22. Changes in ocean CO2
0
5
source/sink function
Criteria for Economics impacts
Raw score
Score
Weight %
Very small
Very large
Size of economic or public sectors affected
2
30
0 1 2 3
Minimum
Severe
Degree of impact (cost, output changes etc.)
2
50
0 1 2 3
Occasion/Short
Continuous
Frequency/Duration
2
20
0 1 2 3
Weight average score for Economic impacts
2.0
Criteria for Health impacts
Raw score
Score
Weight %
Very small
Very large
Number of people affected
2
40
0 1 2 3
Minimum
Severe
Degree of severity
2
40
0 1 2 3
Occasion/Short
Continuous
Frequency/Duration
1
20
0 1 2 3
Weight average score for Health impacts
1.8
Criteria for Other social and
Raw score
Score
Weight %
community impacts
Very small
Very large
Number and/or size of community affected
3
40
0 1 2 3
Minimum
Severe
Degree of severity
2
40
0 1 2 3
Occasion/Short
Continuous
Frequency/Duration
2
20
0 1 2 3
Weight average score for Other social and community impacts
2.4
Comparative environmental and socio-economic impacts of each GIWA concern
Types of impacts
Environmental score
Economic score
Human health score
Social and community score
Concern
Overall score
Rank
Pr
esent (a)
F
uture (b)
Pr
esent (a)
F
uture (b)
Pr
esent (a)
F
uture (b)
Pr
esent (a)
F
uture (b)
Freshwater shortage
1.9
2.1
2.5
2.7
1.9
2.1
2.0
2.2
2.2
1
Pollution
1.9
2.2
2.0
2.3
1.9
2.0
2.0
2.1
2.1
2
Habitat and community
2.0
2.2
1.6
1.6
0
0
2.0
2.1
1.4
5
modification
Unsustainable exploitation of fish
2.1
2.2
2.8
2.8
0
0
2.0
2.8
1.8
4
and other living resources
Global change
1.6
1.8
2.0
2.2
2.0
1.8
2.4
2.6
2.1
3
68
GIWA REGIONAL ASSESSMENT 64 HUMBOLDT CURRENT
Annex III
2. Convention for the Protection of the Marine Environment and
the Coastal Zone of the South East Pacifi c (1981)
List of conventions and
The Plenipotentiaries of Colombia, Chile, Ecuador, Panama and Peru
specific laws that affect water
signed the Convention for the Protection of the Marine Environment
use in the region
and Coastal Areas in the South East Pacifi c in Lima, Peru on November
12, 1981. The respective signatory Governments handed the ratifi cation
documents. The High Contracting Parties to this Convention manifested,
1. Plan of Action for the Protection of the Marine Environment
in the recitals and preamble thereof, the need to protect and preserve
and Coastal Areas of the South Pacifi c (1981)
the marine environment and coastal areas of the South East Pacifi c
This Plan, as adopted, has the same characteristics as other Regional
from all types of pollution and pollution sources; and emphasize the
Seas programmes promoted by UNEP. The main objective of this
economic, social and cultural signifi cance of the South East Pacifi c as a
regional cooperation mechanism is to protect the marine environment
means of interlinking the countries within the region.
and coastal areas to safeguard the heath and well-being of current and
future generations.
3. Agreement for the Regional Cooperation Against the
Pollution of the South East Pacifi c by Hydrocarbons and other
The general legal framework of the Plan of Action of the South East
Harmful Substances in Cases of Emergency (1981)
Pacifi c is the Convention for the Protection of the Marine Environment
This Agreement complements or is related to the previous Convention
and Coastal Areas of the South East Pacifi c, also known as the "Lima
and specifi cally refers to the pollution caused by hydrocarbon and
Convention" of 1981, which binds the High Contracting Parties to
other harmful substances and to the need for regional cooperation in
make an eff ort, whether individually or through bilateral or multilateral
cases of emergency. This Agreement was signed on November 12, 1981
cooperation, to adopt the appropriate measures to prevent, reduce and
by the fi ve member countries, which lodged their relevant ratifi cation
control the pollution of the marine environment and coastal areas in
instruments with the General Secretariat of the CPPS.
the South East Pacifi c and secure and adequate management of the
natural resources.
4. Complementary Protocol to the Agreement for the Regional
Cooperation Against the Pollution of the South East Pacifi c by
The Plan of Action for the South East Pacifi c has the following
Hydrocarbons and other Harmful Substances (1983)
components:
The complementary Protocol of the Agreement on Regional
Environmental assessment: This is the main component, which
Cooperation in Combating Pollution of the South East Pacifi c by
provides the scientifi c basis to implement the other components,
Hydrocarbons and other Harmful Substances was signed on July 22,
and comprises an assessment of the pollution caused by oil spills;
1983. This regional document elaborates on the regional principles
determination of the degree of pollution caused by industrial,
on regional cooperation against pollution caused by hydrocarbons
mining and agricultural wastes and their eff ect; pollution caused
and harmful substances in cases of emergency contained in the
by domestic wastes, radioactive pollution, pollution of the marine
aforementioned Agreement of 1981.
environment through the atmosphere, among others.
Environmental management: Formulation and application of
5. Protocol for the Protection of the South East Pacifi c Against
programmes to prevent, monitoring, reduce and eliminate
the Pollution from Land-based Sources (1983)
pollution.
This Protocol provides for the general obligations, practices and
Legal component: Development of regional instruments, which will
procedures; cooperation and consultation guidelines and procedures
be describes below, constitute a major achievement of the Plan of
between the Parties; surveillance programmes, exchange of
Action.
information, scientifi c and technical cooperation; and penalty measures,
Institutional and fi
nancial mechanisms: According to this
among others.
component, the General Authority of the Plan of Action remains
with the regular meeting of Government representatives
6. Protocol for the Conservation and Management of Marine
(Intergovernmental Meetings). They are mandated to assess the
and Coastal protected Areas of the South East Pacifi c (1989).
implementation progress of the Plan of Action and approve the
The Governments acknowledge, through this Convention, the need to
projects and activities.
adopt appropriate measures to protect and preserve ecosystems that
ANNEXES
69
are fragile, vulnerable or which have a unique natural value, as well
thousand kilometres of the west South American coasts. The project
as the fauna and fl ora on the verge of depletion or extinction. It also
has to address four main problems:
establishes a principle of common interest to pursue the management
The unsustainable exploitation of the fi shing resources.
of coastal areas attaching a rational value to the equilibrium that should
The
insuffi
cient knowledge of the variability of the system.
exist between conservation and development.
Threats to the ecosystem biodiversity and relevant to the fi shing
production.
This Convention also contains regulations regarding protected areas,
Features related to the coastal habitat.
common criteria to establish such areas, for regulation activities through
and integrated environmental management mechanism within the
The project was designed to contribute with solutions for the above
guidelines contained in Article 5, buff er areas, measures to prevent,
identifi ed transboundary issues and pretend to increase the national
reduce and control pollution in protected areas, environmental impact
capabilities including an integrated ecosystem approach.
assessment, establishing an integrated analysis procedure, scientifi c
and technical cooperation; promotion of community involvement and
10. Framework Agreement for the Conservation of Living
environmental education, among others.
Resources on the High Seas of the South East Pacifi c (Galßpagos
Agreement) (2000)
7. Protocol for the Protection of the South East Pacifi c Against
The countries of the South East Pacifi c belonging to the Permanent
Radioactive Pollution
Commission for the South Pacifi c (Chile, Colombia, Ecuador and Peru)
This Protocol was signed in Paipa, Colombia, on September 21, 1989
signed this agreement in 2000. The main objective of this Agreement
and entered into force in 1994 after submission of the ratifi cation
is to defi ne the legal framework for the conservation and management
instruments. It provides for regulations, principles, criteria and general
of living marine resources in the high seas zones of the South East
obligations prohibiting the dumping of radioactive waste and other
Pacifi c, with special reference to straddling and highly migratory fi sh
radioactive substances into the sea and/or seabed included within
populations. The Agreement is applicable to the high seas beyond
the scope of application of the Convention; i.e., the maritime area
the external limits of the EEZ of the countries to the 120░W meridian
of the South East Pacifi c under the sovereignty and jurisdiction of
between 5░N and 60░S.
Governments up to 200 nautical miles. This Protocol is also applicable
to the Continental Shelf when extended by the High Contracting Parties
11. Declaration of Ministers of Foreign Aff airs on occasion of
beyond their 200 nautical mile zones.
the 50th anniversary of the "Santiago Declaration" and the
establishment of the Permanent Commission for the South
8. Protocol on the Program for the Regional Study of the
Pacifi c CPPS (Santiago, Chile, 14 August, 2002 Santiago
"El Ni˝o" Phenomenon in the South East Pacifi c (ERFEN)
Declaration 2002)
The States Members of the Permanent Commission for the South Pacifi c
The Ministry of Foreign Aff airs of the Republic of Peru and Chile, the
şCPPS signed this protocol on 6th November 1992 in Callao, Peru. The
Vice-minister of Foreign Aff airs of Ecuador, and the Vice-minister of
aim of ERFEN is forecast the ocean-atmospheric changes with enough
Foreign Aff airs for Multilateral Issues of Colombia convened at Santiago,
anticipation to allow the issue of policies and emergency measures
Chile, within the framework of the celebration of the fi ftieth anniversary
facing the yield variations in productive activities such as fi shing,
of the "Santiago Declaration" of 1952, concerning the maritime zone and
agriculture, industry and hydro-biological resource management,
the establishment of the CPPS, deliver the following Declaration:
among others.
1. Express their satisfaction and pride upon celebrating the fi ftieth
anniversary of the Santiago Declaration which stipulated the
9. Project: Integrated Management of the Large Marine
principle of the two hundred nautical miles, practiced worldwide
Ecosystem of the Humboldt Current
by states, as an essential part of the law of the sea.
(GEF/ONUDI-IMARPE/PERU-IFOP/CHILE)
2. Render tribute to the developers of the principles contained in the
The large marine ecosystem of the Humboldt Current is one of the
"Santiago Declaration" of 1952, who fi rst declared the existence of
most productive systems of the world. It depends of upwelling that
a two hundred-mile jurisdictional maritime zone, on the basis of
provides a continuous supply of nutrients to surface waters where large
economic and conservation grounds, and who were tasked with
populations of planktonic organisms grow. These populations are the
defending the recognition of such zone in various international
basis of an ecosystem that infl uences the whole marine life along
forums until set forth in the new law of the sea.
70
GIWA REGIONAL ASSESSMENT 64 HUMBOLDT CURRENT
3. Renew the eff ectiveness and projection of the principles and
12. Agree that the organisation must mainly focus its activities toward
purposes contained in the above mentioned declaration, as
the regional political coordination of ocean related subject
well as the international instruments approved for their future
matters, the implementation and development of the "Galapagos
development.
Agreement", scientifi c research related to oceanic-atmospheric
4. Firmly support the successful task of the Permanent Commission
alterations, especially the "El Ni˝o" phenomenon; arrangement
for the South Pacifi c, which has coordinated the maritime policies
and conservation actions, the regional protection of the marine
of Chile, Colombia, Ecuador and Peru, and whose presence in
environment, overall management of coastal-marine zones, as
important international forums has produced a signifi cant impact
well as cooperating and promoting the effi
ciency of artisanal and
upon the evolution of the law of the sea, widely contributing to the
industrial fi shing operations.
establishment of a global oceanic policy.
13. Express their concern over the increase of illicit activities in the
5. Within this context, the states reaffi
rm their authority in the 200 mile
South East Pacifi c and decide to instruct their minstries of foreign
jurisdictional zone, the exercise of their sovereign rights therein,
aff airs and the general secretariat, to promote increased regional
and their right to issue those measures required for the exploration,
coordination and cooperation, at every level, with the support of
exploitation, conservation and administration of the resources
the pertinent international organizations, in order to eradicate such
existing therein, in accordance to globally accepted instruments
operations.
and practices, with special reference to the United Nations
14. Agree to promote and further the development of the regional
Convention on the Law of the Sea. Likewise, the states reiterate
fi sheries industry under sustainable criteria, transfer of technology,
their sovereign rights over their ports and their corresponding
the promotion of investments and the conduction of negotiation
preferential rights, where appropriate, in the high seas.
rounds.
6. Decide that the presence of the CPPS must extend its infl uence
15. Declare their fi rm disagreement with the application of unilateral
in the Pacifi c Ocean, given the organization's capacity as regional
and unjustifi ed restrictions aff ecting trade of fi sheries products and
maritime agreement and strategic, political and operational
toward granting of subsidies which encourage non-sustainable
strategy in the South East Pacifi c.
fi shing operations. in order to face such challenges, the states
7. Congratulate one another for the recent inauguration of the
instruct their ministries of foreign aff airs, with the support of the
permanent seat of the CPPS in the city of Guayaquil, Ecuador, as
general secretary, to strengthen the negotiation capacities and
well as for the completion of the organization's re-structuring and
ensure the design of a regional strategy.
modernization process.
16. Reiterate their full political support toward the Action Plan of the
8. Reiterate the convenience of continuing joint actions in
South East Pacifi c and their commitment to strengthen this regional
competent international forums, with the aim of strengthening
cooperation mechanism in its institutional, legal and fi nancial
and consolidating the organization's principles and objectives,
aspects, in order to ensure the eff ective compliance of the plan's
established as a regional maritime system.
objectives.
9. Highlight that the fi fty years during which the coastal states of
17. Express that the successful cooperation maintained during these
the South East Pacifi c have administered the two hundred-mile
fi fty years, has allowed for a close relationship and understanding
maritime zone, have allowed this area to become one of the less
between the states parties, which commits them to keep working
contaminated areas of the world, where marine resources are
jointly on the basis of the common destiny of their nations, the
exploited in a sustainable manner.
protection of their resources, and maritime development.
10. Celebrate the subscription, in August, 2000, of the "Framework
Agreement for the Conservation of Living Marine Resources in the
The Ministry of Foreign Aff airs of the Republic of Peru, the Vice-minister
High Seas of the South East Pacifi c" or "Galapagos Agreement", which,
of Foreign Aff airs of Ecuador, and the Vice-minister of Foreign Aff airs
once standing, shall be open to the accession of third states having
for Multilateral Issues of Colombia, express their gratitude toward the
an established interest in the area of application of the agreement.
people and the Government of Chile, for their warm hospitality and
11. Express that such agreement is a principle part of the regional
friendship, which renew the fraternal relationship and cooperation links
maritime system of the South East Pacifi c, directed toward
of the member states of the CPPS.
the establishment of a harmonic regime of conservation and
protection of living marine resources, in the benefi t of their coastal
populations.
ANNEXES
71
Annex IV
Data on pollution
Table 1
Total and faecal coliforms in water, Ecuador
Table 2
Total and faecal coliforms in water, Peru 1987-2002.
1987-2002.
Total coliforms
Faecal coliforms
Total coliforms
Faecal coliforms
Site
Year
(NMP/100 ml)
(NMP/100 ml)
Source
(NMP/100 ml)
(NMP/100 ml)
Site
Year
Source
Min
Max
Min
Max
Min
Max
Min
Max
Huarmey
2000
ND
ND
30
15 billion
Tam et al. 2000
1987
17
1 100
580
10 000
CPPS 2000a
1989
460 000
46 billion
ND
ND
CPPS 2000a
1989
4
2 400
300
5 000
CPPS 2000a
930
Rimac- Callao
1995
ND
ND
ND
Sßnchez et al. 1996
million
Gulf of Guayaquil
1994
8
1 600
320
9 060
CPPS 2000a
2000
ND
ND
30
2 300
Guzman et al. 2000
1994-
ND
ND
ND
1 000 000
Pin et al. 1998
1996
Tumbes
2000
ND
ND
30
43
Castillo et al. 2000
1986
43
2 000 billion
4
1 100 billion CPPS 2000a
Lima-
2001
ND
ND
30
93
Orozco 2002
Metropolitan
1988
90 000
93 billion
ND
ND
CPPS 2000a
Paita
2001
ND
ND
30
23
Sßnchez et al. 2002
1988
447
123 million
430
16 million
CPPS 2000a
Supe Paramonga
2001
ND
ND
30
23
Orozco 2002
1988
5
21 billion
4
1.1 billion
CPPS 2000a
1995
430
93 000
<3
93 000
Sßnchez et al. 1996
1989
ND
ND
350
6 400
CPPS 2000a
Huacho -Carquin
93 000
1989
ND
ND
78
147 000
CPPS 2000a
2001
ND
ND
30
Orozco 2002
23 000
Estero Salado
1990
ND
ND
93
160 000
CPPS 2000a
Callao
2001
ND
ND
30
230 000
Jacinto et al. 2001
1994
ND
ND
1 020
35 000
CPPS 2000a
Ca˝ete
2001
ND
ND
30
430
Orozco 2002
Valencia et al.
1996
11
220
11
75
Callao
2002
ND
ND
70 billion
2.3 million
Sßnchez et al. 2002
2000
Huarmey
2002
ND
ND
30
430
Cabello et al. 2002
Valencia et al.
1998
2
240
2
2
2000
1995
<3
43 000
ND
ND
Sßnchez et al. 1996
Paita
2001
<70
240
ND
ND
INOCAR 2001a
2002
ND
ND
90 billion
930
Jacinto et al. 2001
1988
20
1 800
2 300
4 300
CPPS 2000a
23
16 000
12
16 000
CPPS 2000a
1989
1988
93
1 025
550
5 600
CPPS 2000a
ND
4.3 billion
ND
ND
CPPS 2000a
Ferrol-Chimbote
1989
ND
ND
9 000
90 000
CPPS 2000a
930
2002
ND
ND
30
Sßnchez et al. 2002
23 000
1990
ND
ND
530
13 600
CPPS 2000a
Ca˝ete
2002
ND
ND
30
930
Sanchez et al. 2002
Guayas River
1991
30
1 790
100
9 300
CPPS 2000a
1988
43
2 400
4
2 400
CPPS 2000a
Valencia et al.
BahÝa Ancˇn
1996
240
93 000
ND
ND
2000
1989
17
1 100
9
1 000
CPPS 2000a
Valencia et al.
1988
23
2 400
4
2 400
CPPS 2000a
1997
2 400
1 1 00
ND
ND
2000
1989
8
1 600
3
1 600
CPPS 2000a
Pisco-Paracas
2000
4 600
11 000
2 400
11 000
INOCAR 2000
1995
ND
9 300
ND
9 300
Sßnchez et al. 1996
1984
88
11 000
900
46 000
CPPS 2000a
2002
ND
ND
30
90 billion
Jacinto et al. 2001
Guayas-Daule
1985
1 500
24 000
3 900
24 000
CPPS 2000a
Ilo-Ite
2002
ND
ND
30
230
Jacinto et al. 2001
1986
900
46 000
ND
ND
CPPS 2000a
Agua Dulce
1987
43
110 000
11
4 600
CPPS 2000a
1984
2 300
11 000
400
110 000
CPPS 2000a
La Pampilla
1987
39
110 000
9
110 000
CPPS 2000a
Babahoyo-Guayas
1986
2 300
11 000
400
124 000
CPPS 2000a
La Chira
1987
640
46 000
460
16 000
CPPS 2000a
Manta
1985
4
2 400
90
2 400
CPPS 2000a
La Herradura
1987
9
46 000
9
9 000
CPPS 2000a
Santa Elena
1985
43
2 400
43
2 300
CPPS 2000a
Marbella
1987
240
24 000
9
11 000
CPPS 2000¬
1985
23
93
9
43
CPPS 2000a
Talara
1995
ND
ND
<3
9 300
Sßnchez et al. 1996
Puerto BolÝvar
2002
ND
ND
ND
200
INOCAR 2002b
Huacho-Carquin
2002
ND
ND
30
230 000
Orozco 2002
1986
ND
8 757
ND
4 193
CPPS 2000a
Supe-Paramonga
2002
ND
ND
30
2 300
Sßnchez et al. 2002
Daule River
1986
ND
62 536
ND
25 946
CPPS 2000a
Note:: ND = No Data
1986
ND
7 242
ND
3 68
CPPS 2000a
San Lorenzo
2001
ND
<70
ND
ND
INOCAR 2001b
Atacames
2002
8 400
8 900
5 100
5 600
INOCAR 2002a
Santa Cruz Island
Morßn &
1999
ND
240
ND
15
(Galapagos Islands)
Valencia 2000
San Cristobal Island
Morßn &
1999
ND
16
ND
8.8
(Galapagos Islands)
Valencia 2000
Santa MarÝa, Isabela,
Morßn &
Darwin Islands
1999
ND
5
ND
2
Valencia 2000
(Galapagos Islands)
Note:: ND = No Data
72
GIWA REGIONAL ASSESSMENT 64 HUMBOLDT CURRENT
Table 3
Average values of total and faecal coliforms in coastal
Table 5
Concentrations of POPs in sediment and water, Peru
surface waters in Chile during 1994 (Z˙˝iga and
1994-1996.
Burgos, 1996).
Pesticide
Total coliforms
Faecal coliforms
Site
Site
Arochlor Arochlor
(NMP/100 ml)
(NMP/100 ml)
Lindane
DDT
DDE
DDD
Aldrin
1254
1260
Arica
7.8
2
Fertiza (ng/g)
ND
0.230-2.66
1.65
1.02
ND
ND
ND
Iquique
7.8
2
Chillˇn River (ng/g)
ND
ND
16.89
ND
ND
12.09
9.94
Tocopilla
ND
ND
Pisco (ng/g)
ND
ND
0.426
ND
ND
ND
ND
Antofagasta
2 400
1 600
Ite (ng/g)
9.23
ND
ND
0.21
3
7
2.14
Chanaral
ND
ND
Huacho (ng/g)
ND
4.45
ND
ND
ND
8
ND
Coquimbo
ND
ND
Ca˝ete River (water)
ND
2.8
ND
ND
ND
21.02
ND
(ng/g)
Quintero
23
2
Ca˝ete River (sediments)
Concon
13
4.5
ND
2.8
ND
ND
ND
ND
ND
(ng/g)
Valparaiso
130
33
Note: ND = No Data.
(Source:CPPS 2000a, Cabello & Sßnchez 2003)
Playa Ancha
ND
ND
San Antonio
1 600
33
Talcahuano
3.6
3.6
Table 6
Concentrations of POPs, Chile.
San Vicente
1 100
210
Pesticide
Site
Valdivia
210
130
Arochlor
Lindane
DDT
pp' DDE
pp'DDD
Aldrin
54
Puerto Montt
2
2
VIII Region (water)
0.001-
0-
ND
ND
ND
ND
Castro
240
130
(ppb)
0.015
0.013
VIII Region
0.02-
0.02-
0.015-
Punta Arenas
1 600
540
ND
ND
ND
(sediments) (ppb)
1.364
0.68
0.374
Note: ND = No Data.
Concepciˇn Bay
0.45-
(Source: Z˙˝iga & Burgos 1996)
ND
ND
ND
ND
ND
(ppb)
0.68
Concˇn/Acocagua
400-
100-
2 500-
1 200-
500
ND
River (pg/g)
9 800
5 700
6 100
45 100
Note: ND = No Data.
(Source: CPPS 2000a, based on Chuecas et al.1989 and SERPLAC 1980)
Table 4
Concentrations of POPs in water and sediments, Ecuador.
Pesticide
Site
an
a
ration
E
P
BCH
T
achlor
D
D
in
n
x
i
chlore
yl
a
BCH
T
in
a
t
h
i
o
n
z
alil
4
'
D
4
'
D
l
t
l
i
xi
x
a
p
h
e
n
o
BCH
Alf
Delta
Lindane
Hept
DD
4,
4,
4
,
4
'
DDD
Chlordane
Aldr
Dieldr
Endin
Malathion
Par
Ti
Ca
To
Endosulf
Meto
Ima
Chloratonil
Meth
Guayas River
0.05-
0.028
ND
ND
0.039
0.007
0.02
ND
ND
ND
0.056
ND
ND
ND
ND
ND
ND
ND
ND
ND
ND
ND
ND
(ppb) a
2.72
Guayas River
ND
ND
ND
ND
ND
ND
ND
ND
ND
ND
ND
ND
ND
10
23
ND
ND
ND
ND
ND
ND
ND
ND
(mg/l) b
Shrimp ponds
ND
ND
ND
ND
ND
ND
ND
ND
ND
ND
ND
ND
ND
ND
ND
0.018
0.018
ND
ND
ND
ND
ND
ND
(g/kg) c
Daule River
ND
ND
ND
ND
ND
0.05
ND
ND
ND
ND
ND
ND
ND
ND
ND
ND
ND
1
ND
ND
ND
ND
ND
(ug/l) d
Estero Salado
0.58-
0.2-
0.07-
0.32-
ND
ND
ND
ND
ND
0.065
ND
ND
ND
ND
ND
ND
ND
ND
ND
ND
ND
ND
ND
(g/kg) e
0.41
1.98
1.62
0.36
Guayaquil City
0.059-
0.13-
0.24-
ND
ND
ND
ND
ND
ND
ND
ND
ND
0.41
ND
ND
ND
ND
ND
ND
ND
ND
ND
ND
(g/kg) f
0.12
0.15
0.38
Atacames
1.48-
0.22-
0.36-
0.27-
0.56-
ND
ND
0.29
0.24
ND
0.03
5.86
ND
ND
ND
ND
ND
ND
ND
ND
ND
ND
ND
(g/kg) g
1.61
0.48
0.66
0.94
1.24
Santa Rosa
0.57-
0.17-
1.63-
ND
ND
ND
ND
ND
ND
ND
ND
ND
0.23
0.7
ND
ND
ND
ND
ND
ND
0.91
0.31
2.1
(g/kg) h
2.1
0.44
4.32
Note: ND = No Data.
(Source: a PMRC 1993, b Ormaza 1994, c Intriago et al. 1994, d CPPS 2000a, e INOCAR 2001a, f INOCAR 2001b, g INOCAR 2002a; h INOCAR 2002b)
ANNEXES
73
Table 7
Concentations of copper in water, Ecuador.
Table 8 Concentration
of Table 9 Concentration
copper in biota,
of lead in biota,
Copper in water (g/l)
Ecuador.
Ecuador.
Site
Source
1985
1986
1987
1988
1989
Site
Biota
Copper (g/g)
Site
Biota
Lead (g/g)
1.1-20
Arcos 1985
Santa Elena
Molluscs
4.75-31.25
Santa Elena
Molluscs
0.0-62.5
0.6-1.7
Santa Elena
Fish
2.75-37.5
Santa Elena
Fishes
0.25-27.5
1. 6
Arcos 1986
Esmeraldas
1.1-20.6
Puerto BolÝvar
Fish
7.5-20.0
Puerto BolÝvar
Fishes
0.0-12.5
0.615
Samaniego 1986
(Source: DIGMER 1988)
Puerto BolÝvar
Fish
10.0-11.3
0.1-7.2
(Source: CPPS 2000a)
3.2-8.2
CPPS 2000a
0.2-1.2
Arcos 1986
Manta
Table 9
Concentration of lead in water, Ecuador.
3.2-6.8
Choez 1989
2-4
Choez 1989
Lead in water (g/l)
B. Carßquez
Site
Source
2.4
CPPS 2000a
1984-
1984
1994
1996
1987
Monteverde
4.2-5.2
Choez 1989
0.0001-
La Libertad
4.7-7.2
Choez 1989
Santa Elena
ND
ND
ND
Samaniego 1986, Arcos 1985
0.0004
0.03-20
Choez 1989
Santa Elena
Daule River
ND
10
ND
ND
Solˇrzano 1985
3.9-7.7
CPPS 2000a
0.3-0.9
Arcos 1986
Babahoyo River
ND
10-52.8
ND
ND
Solˇrzano 1985
Salinas
7.28
Choez 1989
Guayas River
ND
10-74
ND
ND
Solˇrzano 1985
8.22
CPPS 2000a
Guayas River Basin
ND
ND
ND
5-15
CEDEGE 1996 in Intriago 1998
Anconcito
3.3-4.2
Choez 1989
Gulf of Guayaquil
ND
10-74
0.29
ND
PÚrez 1986, CAMM 1996, Intriago 1998
Ancˇn
5.8-6.8
Choez1989
Note: ND = No Data.
Chanduy
4.7-7.3
Arcos 1986
0.1-0.4
Arcos 1985
Playas
5.2-6.1
Choez 1989
Table 10
Concentration of copper in water, Peru.
42.3-81.8
Solˇrzano 1985
Copper in water (g/l)
42-104
Site
Source
INP 1986
1984-1987
1985
1999
2000
Daule River
37-126
53.3-104.7
PÚrez 1986
GuillÚn & Aquino 1978, Lˇpez 1982,
Ministerio de Salud de Peru 1986,
1.3-6.6
PÚrez 1989
Callao
71-196
71-196
ND
ND
Valcarcel et al. 1975, GuillÚn et al. 1986,
51.8-94.5
Solˇrzano 1985
Casta˝eda 1980
5-37
INP 1986
Ministerio de Salud de Peru 1986,
Babahoyo
53.33-104.7
PÚrez 1986
Chimbote
45-76
ND
ND
ND
Valcarcel et al. 1975,
River
GuillÚn et al. 1986, Casta˝eda 1980
24-36.2
ESPOL 1987
Laguna
4-11.3
PÚrez 1989
62-98
ND
ND
ND
Valcarcel et al. 1975
Verde
39.8-66.7
Solˇrzano 1985
107-857
Ministerio de Salud 1986,
Ite
ND
ND
ND
Guayas
15-95
INP 1986
65-220
Valcarcel et al. 1975, Lˇpez 1982
River
4.8
Samaniego 1986
Paracas
71-89
ND
ND
ND
Valcarcel et al. 1975, Lˇpez 1982
4.4-7.3
Choez 1989
75-650
Ministerio de Salud de Peru 1986,
Rimac
9-50
100-370
62-1,820
13.9-1.056 GuillÚn 1981, Casta˝eda 1980, CPPS
0-135
PÚrez 1986
River
38-100
2000a
0-30
INP 1986
Note: ND = No Data.
Estero
0-199
PÚrez 1986
Salado
2
Samaniego 1986
1.33-4
PÚrez 1989
3.32-18.8
Samaniego 1986
El Oro
3.9-7.7
ESPOL 1987
Puerto
0.2-0.9
Arcos 1986
BolÝvar
6.9
Chˇez 1989
JambelÝ
3.7-7.7
Chˇez 1989
Note: ND = No Data.
74
GIWA REGIONAL ASSESSMENT 64 HUMBOLDT CURRENT
Table 11
Concentration of copper in sediments, Ecuador.
Copper in sediments (mg/kg)
Site
Source
1985
1986
1987
1988
1989
1994
1998-1999
2001
2002
22.0-45.5
Esmeraldas
ND
ND
10-35
6.0-10.7
22.0-7
ND
ND
ND
ND
DIGMER 1988, Choez 1989
17.0-50.5
Manta
16.5-72.2
ND
ND
7.5-53.7
ND
ND
ND
ND
ND
DIGMER 1988
Guayas
ND
ND
ND
ND
40-113.0
ND
ND
ND
DIGMER 1988
La Libertad
ND
4.0-16.0
ND
9.5-15.5
ND
ND
ND
ND
ND
Choez 1989
Santa Elena
2.5-30
3.2-14.5
ND
ND
ND
ND
ND
ND
DIGMER 1988
Salinas
ND
ND
ND
9.0-10.0
ND
ND
ND
ND
ND
DIGMER 1988
Anconcito
ND
ND
ND
6.0-16.0
ND
ND
ND
ND
ND
Choez 1989
Chanduy
ND
ND
ND
7.2-10.5
ND
ND
ND
ND
ND
DIGMER 1988
Playas
ND
ND
6.0-19.2
5.5-14.0
ND
ND
ND
ND
ND
Choez 1989
Posorja
ND
ND
ND
8.7-31.5
ND
ND
ND
ND
ND
Choez 1989
Estero Salado
ND
ND
ND
ND
ND
ND
35-45.5
1-47.7
ND
Choez 1989, INOCAR 2001a
El Oro
ND
ND
ND
6.0-27.0
ND
ND
ND
ND
ND
Choez 1989
7.7-32.0
Puerto BolÝvar
2.5-45.7
6.0-27.0
4.8-18
ND
ND
ND
ND
ND
DIGMER 1988, Choez 1989:
13.7-27.5
Jubones River
ND
ND
ND
ND
ND
ND
ND
ND
28.66
INOCAR 2002b
Santa Rosa Estuary
ND
ND
ND
ND
ND
ND
ND
ND
6.0-27.5
INOCAR 2002b
Note: ND = No Data.
Table 12
Concentations of cadmium in water and sediments, Ecuador.
Cadmium in water (g/l)
Cadmium in sediments (g/l)
Site
Source
1984
1985
1986
1987
1989
1999
2001
Esmeraldas
ND
ND
ND
ND
0.5-0.7
ND
ND
Chˇez 1989
Manta
ND
ND
ND
ND
0.2-0.7
ND
N
D
Chˇez 1989
B. Carßquez
ND
ND
ND
ND
0.2
ND
ND
Chˇez 1989
La Libertad
ND
ND
ND
ND
0.73-0.87
ND
ND
Chˇez 1989
Salinas
ND
ND
ND
ND
0.2-3.59
ND
N
D
Chˇez 1989
Anconcito
ND
ND
ND
ND
0.85-1.21
ND
N
D
Chˇez 1989
Ancˇn
ND
ND
ND
ND
0.4
ND
N
D
Chˇez 1989
Posorja
ND
ND
ND
ND
0.73-0.85
ND
N
D
Chˇez 1989
Daule River
ND
14.48-<50
ND
ND
ND
ND
ND
Solˇrzano 1985
Solˇrzano 1985
Babahoyo River
ND
7.47-<50
ND
ND
ND
ND
0.1-3.45
CPPS 2000a
Guayas River
10.5-50
ND
ND
ND
ND
ND
ND
Solˇrzano 1985
Estero Salado
ND
ND
ND
ND
ND
0.97-1.94
0-3
INOCAR 2001a
Gulf of Guayaquil
ND
ND
7.5-10
ND
ND
ND
ND
INP 1986
El Oro
ND
ND
ND
0.73-3.45
ND
ND
ND
CPPS 2000a
Jubobes River
ND
ND
0.1
ND
ND
ND
ND
Chˇez 1986
JambelÝ
ND
ND
0-0.85
ND
ND
ND
N
D
Chˇez 1986
Note: ND = No Data.
ANNEXES
75
Table 13
Concentration of lead in sediments, Ecuador.
Lead in sediments (mg/kg)
Site
Source
1984
1986
1987
1988
1994
1998-1999
2001
2002
Esmeraldas
ND
ND
12.5-42.5
3.7-10
ND
ND
ND
ND
DIGMER 1988, Choez 1989
ManabÝ
ND
ND
ND
5-15
ND
ND
ND
ND
Choez 1989
Manta
ND
ND
4.5-9
5-12
ND
ND
ND
ND
DIGMER 1988
Santa Elena
ND
ND
2.5-11
17.5-157.5
ND
ND
ND
ND
DIGMER 1988
La Libertad
ND
ND
ND
4.6-14.1
ND
ND
ND
ND
Choez 1989
Santa Rosa
ND
ND
ND
11.2
ND
ND
ND
ND
Choez 1989
10-16.2
Salinas
ND
ND
ND
14-51.2
ND
ND
ND
ND
Choez 1989, DIGMER 1994
13.7-17.5
Anconcito
6.8-13
ND
ND
5.7-8
ND
ND
ND
ND
Solˇrzano 1985, Choez 1989
Chanduy
ND
ND
ND
7.5-17.5
ND
ND
ND
ND
Choez 1989
Playas
ND
6.7-8
ND
ND
ND
ND
ND
ND
Choez 1989
Posorja
ND
ND
ND
15-16.2
ND
ND
ND
ND
Choez 1989
Guayas
ND
ND
ND
ND
125-218
ND
ND
ND
DIGMER 1994
Estero Salado
ND
ND
ND
ND
ND
3.2-9.76
0-34
ND
INOCAR 2001a
Puerto BolÝvar
ND
ND
ND
4.8-21.2
ND
ND
ND
ND
DIGMER 1988;
Santa Rosa
ND
ND
ND
ND
ND
ND
ND
23.33
INOCAR 2002b
Jubones River
ND
ND
ND
ND
ND
ND
ND
21.34
INOCAR 2002b
Note: ND = No Data.
Table 14
Concentration of copper in sediments, Peru.
Copper in sediments (mg/kg)
Site
Source
1984-1987
1985
1987
1989
1996
2000*
2002
Chimbote
0.1-0.6
16.46-64.48
ND
ND
28.7-108
80-199
17.6-.23.4
Echegaray 1986, Jacinto et al. 1996, Guzmßn 2003
Santa River
ND
ND
ND
ND
ND
ND
13.4-17.
3
Sßnchez et al. 2002
Paramonga
ND
ND
ND
ND
ND
164-267
ND
Instituto Cuanto 2001
Fortaleza River
ND
ND
ND
ND
ND
ND
69.7-74.
7
Sßnchez et al. 2002
Supe
ND
ND
ND
ND
ND
67-220
52.1-142.2
Instituto Cuanto 2001, Sßnchez et al. 2002
Pativilca River
ND
ND
ND
ND
ND
ND
66.45
Sßnchez et al. 2002
Rimac River
ND
109
ND
ND
ND
ND
ND
Echegaray 1986
Echegaray 1986, Guzmßn et al. 2000, Sßnchez et
Callao
ND
0-135.4
18-160
ND
ND
28-43.7
7.7-74.7
al. 2002
Ca˝ete
ND
ND
ND
ND
ND
ND
14.8-28.7
Sßnchez et al. 2002
Ca˝ete River
ND
ND
ND
ND
ND
ND
23.2-24.
5
Sßnchez et al. 2002
Pisco
ND
0-46.8
0.12-50
ND
50.5-91.7
ND
17.8-71.6
Echegaray 1986, Guzmßn et al. 1997, Guzmßn 2003
Paracas
ND
ND
ND
73.71
ND
ND
ND
Hinojosa & Orme˝o 1989
Ite
ND
1 320
ND
65-220
31.2-826.3
ND
29.6-226.82
Echegaray 1986, Guzmßn 2003
Tacna
ND
11.9-135.8
0.15-0.3
ND
ND
ND
ND
Echegaray 1986
Note: ND = No Data. * Liofilised (freeze drying) sample
76
GIWA REGIONAL ASSESSMENT 64 HUMBOLDT CURRENT
Table 15
Concentration of copper in biota, Peru.
Copper in biota (g/g)
Site
Biota
Source
1972/1980
1981/1989
1986/1987
1989 1994
1995
1996
2001
2002
Molluscs
0.08-1.38
1.1-4.45
ND
ND
ND
ND
ND
ND
ND
Littoral
Fishes
0.03-0.43
ND
ND
ND
ND
ND
ND
ND
ND
Echegaray & GuerÝn 1989
Molluscs
ND
0.33-1.02
ND
ND
ND
ND
ND
ND
ND
Molluscs
ND
ND
0.7-2.8
ND
0.48-18.5
0.38-1.21
0.42-22.5
ND
14.8-17.3
Echegaray et al. 1987, Jacinto et al. 1996,
Chimbote
Crustaceans
ND
ND
ND
ND
8.1
ND
2.37-6.03
ND
12.9-14.2
1997, Guzmßn et al. 1997, Guzmßn 2003
Fishes
ND
ND
ND
ND
0.48-0.74
ND
ND
ND
1.21-3.73
Molluscs
ND
ND
ND
ND
ND
ND
ND
2.9-27.9
ND
Huarmey
Crustaceans
ND
ND
ND
ND
ND
ND
ND
19.54
ND
Jacinto et al. 2001
Fishes
ND
ND
ND
ND
ND
ND
ND
1.97
ND
Molluscs
ND
ND
ND
ND
0.49-29.6
0,92-33.2
0.32-14.9
9.5-17.5
1.96-40.9
Callao
Crustaceans
ND
ND
ND
ND
8.16-10.8
4.23-21.7
7.4-15.7
ND
ND
Guzmßn 1996, Guzmßn et al. 1997
Fishes
ND
ND
ND
ND
0.52-0.64
0.34-0.48
0.64
7.71
ND
Crustaceans
ND
ND
ND
ND
ND
ND
ND
0.2
12.4-43.7
Ca˝ete
Molluscs
ND
ND
ND
ND
ND
ND
ND
1.27
ND
Sßnchez & Orozco 1997
Fishes
ND
ND
ND
ND
ND
ND
ND
0.2
1.53-6.22
Molluscs
ND
ND
0.7-6.8
0.02-2.61
ND
1.42-1.97
9.38
ND
ND
Echegaray et al. 1987, Hinojosa &
Pisco
Crustaceans
ND
ND
ND
ND
ND
ND
4.08-7.58
ND
ND
Hormeno 1989, Guzmßn et al. 1997
Fishes
ND
ND
ND
ND
ND
0.44
ND
ND
ND
Paracas
Molluscs
ND
ND
ND
0.11-0.28
ND
ND
ND
ND
ND
Hinojosa & Hormeno 1989
Molluscs
ND
ND
ND
ND
ND
4.7-26.8
13.5-283
ND
ND
Ilo
Jacinto & Carbrera 1998
Crustaceans
ND
ND
ND
ND
ND
ND
16.4
ND
ND
Molluscs
ND
ND
ND
ND
ND
ND
1.7-153.1
ND
ND
Ite
IMARPE database
Crustaceans
ND
ND
ND
ND
ND
ND
13.5-21.1
ND
ND
Note: ND = No Data.
Table 16
Concentration of copper in water, Chile.
Copper in water
Site
Source
1984-1987
1981 (ug/l)
1982 (ug/l)
1983 (ug/l)
1987 (mg/l)
1989 (mg/l)
1994 (mg/l)
(ug/l)
R I Arica
ND
ND
ND
ND
ND
ND
3.05
Z˙˝iga & Burgos 1996
R I Iquique
ND
ND
ND
ND
ND
ND
8.17
Z˙˝iga & Burgos 1996
R II Tacopilla
ND
ND
ND
ND
ND
ND
66.99
Z˙˝iga & Burgos 1996
R II Antofagasta
ND
ND
ND
ND
ND
ND
11.39
Z˙˝iga & Burgos 1996
R III Chara˝al
ND
ND
ND
ND
ND
ND
21.89
Z˙˝iga & Burgos 1996
R IV Coquimbo
ND
ND
ND
ND
ND
ND
2.85
Z˙˝iga & Burgos 1996
R V Quintero
ND
ND
ND
ND
ND
ND
5.66
Z˙˝iga & Burgos 1996
R V Aconcagua River outlet
4.18
2.2
8.7
ND
ND
ND
ND
Pinochet et al. 1989
De Gregory et al. 1983, Universdad de Valparaiso 1987, Chiang
R V ValparaÝso
ND
ND
0.05-2.4
0.6-2.4
7.99-19.56
4.29-19.5
ND
1989
Universdad de Valparaiso 1987, Chiang 1989, Z˙˝iga & Burgos
R V Concon
ND
ND
ND
ND
3.43-20.58
3.43-26.8
5.22
1996
R V San Antonio
ND
ND
ND
ND
ND
ND
ND
Z˙˝iga & Burgos 1996
R VIII Talcahuano
ND
ND
ND
ND
ND
ND
2.4
Z˙˝iga & Burgos 1996
R VIII Concepciˇn
ND
ND
ND
0.6-0.7
ND
ND
ND
Universdad de Concepciˇn 1980, 1985, 1986
San Vicente
ND
ND
ND
0.56-0.58
ND
ND
4.54
Z˙˝iga & Burgos 1996
Arauco Gulf
ND
ND
ND
0.56- 0.65
ND
ND
ND
Universdad de Concepciˇn 1980
Valdivia
ND
ND
ND
ND
ND
ND
3.07
Z˙˝iga & Burgos 1996
R X Puerto Montt
ND
ND
ND
ND
ND
ND
5.35
Z˙˝iga & Burgos 1996
R X Castro
ND
ND
ND
ND
ND
ND
2.59
Z˙˝iga & Burgos 1996
R XII Punta Arenas
ND
ND
ND
ND
ND
ND
2.12 ?
Z˙˝iga & Burgos 1996
Playa Ancha
ND
ND
ND
ND
ND
ND
6.07
Universdad de Concepciˇn 1980, Z˙˝iga & Burgos 1996
Renanca
ND
ND
ND
ND
ND
ND
10.97
Pinochet et al. 1989, Z˙˝iga & Burgos 1996
Note: ND = No Data.
ANNEXES
77
Table 17
Concentration of copper in sediments, Chile.
Copper in sediments
Site
Source
1977- 1979 (ppb)
1984-1986 (ug/g)
1986 (mg/kg)
1988 (mg/kg)
1994 (mg/kg)
North Zone
ND
ND
ND
39.6-121.6*
ND
Z˙˝iga & Burgos 1996
R I Arica
ND
ND
ND
ND
130.1
Z˙˝iga & Burgos 1996
R I Iquique
ND
ND
12.3-26.4
ND
153.6
Bore 1987, Z˙˝iga & Burgos 1996
R II Antofagasta
ND
ND
ND
ND
5 789
Z˙˝iga & Burgos 1996
R III Chara˝al
16,628
ND
ND
ND
1 721
Z˙˝iga & Burgos 1996, Castilla & Nealer 1978, Castilla 1983
R IV Coquimbo
7-1,120a
ND
11.4-21.9
ND
4 518
Bore 1987, Chuecas et al. 1989, Z˙˝iga & Burgos 1996
R V Quintero
ND
ND
ND
ND
80.4
Z˙˝iga & Burgos 1996
R V ValparaÝso
ND
ND
35.1-125.9
ND
ND
Universdad de ValparaÝso 1987
R V Concon*
ND
ND
ND
ND
31.
9
Z˙˝iga & Burgos 1996
R V San Antonio
ND
ND
ND
ND
216
.5
Z˙˝iga & Burgos 1996
R VIII Talcahuano
ND
ND
ND
ND
60.3
Z˙˝iga & Burgos 1996
R VIII Concepciˇn
ND
40.8-40.
ND
ND
ND
Universdad de Concepciˇn 1980
San Vicente
ND
27.3-27.7
ND
ND
95.9
Universdad de Concepciˇn 1980, Z˙˝iga & Burgos 1996
Arauco Gulf
ND
23.61
ND
ND
ND
Z˙˝iga & Burgos 1996
Valdivia
ND
ND
ND
ND
24.6
Z˙˝iga & Burgos 1996
R X Puerto Montt
ND
ND
ND
ND
24
.6
Z˙˝iga & Burgos 1996
R X Castro
ND
ND
ND
ND
16.2
Z˙˝iga & Burgos 1996
R XII Punta Arenas
ND
ND
ND
ND
18.4
Z˙˝iga & Burgos 1996
Playa Ancha **
ND
ND
ND
ND
126.2
Z˙˝iga & Burgos 1996
Note: * Concentration in ppb.
Table 18
Concentration of copper in biota, Chile.
Copper in biota
Site
Biota
Source
1984/1987
1987
1987/1988
1994
(g/g)
(mg/kg)
(mg/kg)
(mg/kg)
R I Arica
Molluscs
ND
ND
ND
0.3-0.1 ?
Z˙˝iga & Burgos 1996
R I Iquique
Molluscs
ND
1.09-7.94
0.08-7.23
1.3
Bore 1987, Chuecas et al. 1989, Z˙˝iga & Burgos 1996
R II Antofagasta
Molluscs
ND
ND
ND
ND
Z˙˝iga & Burgos 1996
R III Caldera
Molluscs
ND
7.92-22.5
0.08-8.45
ND
Bore 1987, Chuecas et al. 1989
R III Chara˝al
Fishes
ND
0.47-0.51
0.08-8.45
ND
Bore 1987
Molluscs
ND
1.01-2.15
ND
ND
R IV Coquimbo
Bore 1987, Chuecas et al. 1989
Fishes
ND
0.33-3.85
ND
ND
R V Quintero
Molluscs
ND
ND
ND
80.9
Bore 1987, Z˙˝iga & Burgos 1996
Molluscs
0.9-5.97
ND
ND
51.4
Universdad de ValparaÝso 1987, Z˙˝iga & Burgos 1996, Chuecas et al. 1989, Chiang &
R V ValparaÝso
Nu˝ez 1983
Fishes
0.50-0.80
0.75-14.36
ND
ND
R V Concon
Molluscs
ND
ND
ND
88.4
Z˙˝iga & Burgos 1996
R V San Antonio
Molluscs
ND
ND
ND
30.2
Z˙˝iga & Burgos 1996
Molluscs
ND
ND
0.759
1416
Central Zone
Chuecas et al. 1989
Fishes
ND
ND
0.30-1343
ND
Central-South
Molluscs
ND
ND
4.36-14.36
ND
Chuecas et al. 1989
R VIII Talcahuano
Molluscs
ND
ND
ND
25.8
Chuecas et al. 1989
R VIII Concepciˇn
Molluscs
0.081-15
ND
ND
ND
Universdad de Concepciˇn 1980, 1987, 1988, Castilla 1983
San Vicente
Molluscs
0-6.1
ND
ND
28.8
Chuecas et al. 1989
Arauco Gulf
Molluscs
0-8.1
ND
ND
ND
Chuecas et al. 1989
Valdivia
Molluscs
ND
ND
ND
13.6
Chuecas et al. 1989
R X Puerto Montt
Molluscs
ND
ND
ND
14.3
Chuecas et al. 1989
R X Castro
Molluscs
ND
ND
ND
10.8
Chuecas et al. 1989
R XII Punta Arenas
Molluscs
ND
ND
ND
15.7
Chuecas et al. 1989
Magallanes
Molluscs
ND
ND
0.94-3.18
ND
Lecaros & Astorga 1989
Note: ND = No Data.
78
GIWA REGIONAL ASSESSMENT 64 HUMBOLDT CURRENT
Table 19
Concentration of hydrocarbon in water, Ecuador
Hydrocarbon in water (g/l)
Site
Source
1985
1986
1987
1988
1989
1990
1994
1998-2001
2001
2002
Esmeraldas
ND
ND
0.08-1.7
0.1-2.1
0.1-0.4
ND
ND
ND
ND
ND
INOCAR 1988 Valencia 1991
San Lorenzo
ND
ND
ND
ND
ND
ND
ND
ND
0.2-1.9
ND
INOCAR 2001b
Atacames
ND
ND
ND
ND
ND
ND
ND
ND
ND
0.7-2.5
INOCAR 2002a
Manta
ND
ND
0.9-2.8
1.3-2.3
0.2-0.5
ND
ND
ND
ND
ND
INOCAR 1988, Valencia 1991
Salinas
ND
0.6-1.4
0.06-1.06
0.08-0.31
0.1-0.3
ND
ND
ND
ND
ND
Valencia 1991
Guayaquil
0.09-5.15
ND
ND
0.24-1.1
0.06-1.12
0.03-1.08
ND
ND
5
ND
DIGMER 1987, CPPS 2000a, INOCAR 2001b
GuayasRiver
ND
ND
ND
ND
ND
ND
1.05-2.28
0.1-0.8
ND
ND
INOCAR 2001a, Valencia et al. 1996
Estero Salado
ND
ND
ND
ND
ND
ND
0.76-1.5
ND
ND
ND
Valencia 1991,
Puerto BolÝvar
60
10-25
45-70
ND
0.1-0.3
ND
ND
ND
ND
ND
DIGMER 1987, Valencia 1991
Santa Rosa
ND
ND
ND
ND
ND
ND
ND
ND
ND
0.15-0.35
INOCAR 2002b
Note: ND = No Data.
Table 20
Concentration of hydrocarbon in water, Peru.
Hydrocarbon in water (g/l)
Site
Source
1985
1986
1987
1988
1989
1995
1996
1999
2000
2001
2002
Talara
ND
ND
0.2-9.83
1.42-26.5
ND
ND
0.13-19.63
ND
ND
ND
ND
Jacinto 1991, Jacinto & Cabello 1996
Ferrol of
ND
ND
ND
ND
ND
ND
0.89-20.21
ND
0.88-1.8
ND
0.1-10.20
Jacinto & Cabello 1996, Cabello & Jacinto 2002
Chimbote
Paita
ND
ND
ND
ND
ND
ND
0.19-6.1
ND
<0.01-2.62
ND
0.1-1.63
Jacinto & Cabello 1996, Cabello & Jacinto 2002
Jacinto 1991, Sßnchez et al. 1996, Jacinto &
Callao
0.2-5.77
0.2-1.71
0.06-8.54
ND
0-4.5
0.05-1.87
0.27-6.22
30.12-53.12
0.21-11.20
30.12-53.12
0.34-4.02
Cabello 1996, Cabello & Jacinto 2002
La Pampilla
ND
ND
ND
ND
ND
0.62-1.46
ND
ND
ND
ND
ND
IMARPE 1996
Pisco Bay
ND
ND
ND
ND
ND
ND
0.1.-3.57
ND
ND
ND
0.33-19.6
Jacinto & Cabello 1996, Cabello & Jacinto 2002
Ilo-Ite
ND
ND
ND
1.58-5.7
ND
ND
ND
0.69-4
ND
ND
0.11-12.2
Jacinto & Cabello 1996, Cabello & Jacinto 2002
Note: ND = No Data.
Table 21
Concentration of hydrocarbon in sediments, Peru.
Hydrcarbon in sediments (g/l)
Site
Source
1987
1988
1992
1995
1996
1999
2000
2002
Talara
2-4.2
6.3-25
ND
ND
0.13-19.63
ND
ND
ND
Jacinto 1991, Jacinto & Cabello 1996
Ferrol of Chimbote
ND
ND
ND
ND
0.89-20.21
ND
ND
0.1-10.2
Jacinto & Cabello 1996, Cabello & Jacinto 2002
Paita
ND
ND
ND
ND
0.19-6.1
ND
ND
0.1-1.63
Jacinto & Cabello 1996, Cabello & Jacinto 2002
Callao
6..9-16
2.9-10.5
1.1-8.8
2.2-2.3
0.33-33.38
30.12-53.12
0.21-11.2
0.34-4.02
Jacinto 1991, Jacinto & Cabello 1996, Cabello & Jacinto 2002
Pisco Bay
0.6-2.3
ND
ND
ND
ND
ND
ND
ND
Jacinto 1991
Ilo-Ite
ND
ND
ND
ND
ND
ND
ND
0.23-2.27
Cabello & Jacinto 2002
Note: ND = No Data.
Table 22
Concentration of hydrocarbon in water, Chile
Table 23
Concentrations of hydrocarbons in sediments, Chile.
Hydrocarbon in water (g/l)
Hydrocarbon in sediments (g/l)
Site
Source
Site
Source
1985
1986
1987
1988
1986
1988
ValparaÝso
ND
0.1-0.36
Alcßzar et al. 1989
Quintero
ND
0.01-1.97
0.27-1.97
ND
Andrade & Alcßzar 1989
Concepciˇn
2.52-5.06
ND
Alcßzar et al. 1989
Alcßzar et al. 1986,
ValparaÝso
2-66
0.42-3.66
0.01-1.22
0.14-0.6
Magallanes Strait
ND
142-1860
Alcßzar et al. 1989
Dorion & Bonnet 1989
Iquique/ Antofagasta
ND
0.77-7.95
Alcßzar et al. 1989
Alcßzar et al. 1986,
Concepciˇn
ND
0.83-5
ND
44
Dorion & Bonnet 1989
Caldeera/ Coquimbo
ND
0.8-0.31
Alcßzar et al. 1989
Note: ND = No Data.
Magallanes
ND
ND
ND
2.08-8.92
Dorion & Bonnet 1989
Strait
Iquique/
ND
ND
ND
2.5-5
Alcßzar et al. 1989
Antofagasta
Caldeera/
ND
ND
ND
2.1-5
Alcßzar et al. 1989
Coquimbo
Note: ND = No Data.
ANNEXES
79
The Global International
Waters Assessment
This report presents the results of the Global International Waters
Adequately managing the world's aquatic resources for the benefi t of
Assessment (GIWA) of the transboundary waters of the Humboldt
all is, for a variety of reasons, a very complex task. The liquid state of
Current region. This and the subsequent chapter off er a background
the most of the world's water means that, without the construction
that describes the impetus behind the establishment of GIWA, its
of reservoirs, dams and canals it is free to fl ow wherever the laws of
objectives and how the GIWA was implemented.
nature dictate. Water is, therefore, a vector transporting not only a
wide variety of valuable resources but also problems from one area
to another. The effl
uents emanating from environmentally destructive
activities in upstream drainage areas are propagated downstream
The need for a global
and can aff ect other areas considerable distances away. In the case of
international waters
transboundary river basins, such as the Nile, Amazon and Niger, the
assessment
impacts are transported across national borders and can be observed
in the numerous countries situated within their catchments. In the case
of large oceanic currents, the impacts can even be propagated between
Globally, people are becoming increasingly aware of the degradation of
continents (AMAP 1998). Therefore, the inextricable linkages within
the world's water bodies. Disasters from fl oods and droughts, frequently
and between both freshwater and marine environments dictates that
reported in the media, are considered to be linked with ongoing global
management of aquatic resources ought to be implemented through
climate change (IPCC 2001), accidents involving large ships pollute public
a drainage basin approach.
beaches and threaten marine life and almost every commercial fi sh stock
is exploited beyond sustainable limits - it is estimated that the global
In addition, there is growing appreciation of the incongruence
stocks of large predatory fi sh have declined to less that 10% of pre-
between the transboundary nature of many aquatic resources and the
industrial fi shing levels (Myers & Worm 2003). Further, more than 1 billion
traditional introspective nationally focused approaches to managing
people worldwide lack access to safe drinking water and 2 billion people
those resources. Water, unlike laws and management plans, does not
lack proper sanitation which causes approximately 4 billion cases of
respect national borders and, as a consequence, if future management
diarrhoea each year and results in the death of 2.2 million people, mostly
of water and aquatic resources is to be successful, then a shift in focus
children younger than fi ve (WHO-UNICEF 2002). Moreover, freshwater
towards international cooperation and intergovernmental agreements
and marine habitats are destroyed by infrastructure developments,
is required (UN 1972). Furthermore, the complexity of managing the
dams, roads, ports and human settlements (Brinson & Malvßrez 2002,
world's water resources is exacerbated by the dependence of a great
Kennish 2002). As a consequence, there is growing public concern
variety of domestic and industrial activities on those resources. As a
regarding the declining quality and quantity of the world's aquatic
consequence, cross-sectoral multidisciplinary approaches that integrate
resources because of human activities, which has resulted in mounting
environmental, socio-economic and development aspects into
pressure on governments and decision makers to institute new and
management must be adopted. Unfortunately however, the scientifi c
innovative policies to manage those resources in a sustainable way
information or capacity within each discipline is often not available or
ensuring their availability for future generations.
is inadequately translated for use by managers, decision makers and
GLOBAL INTERNATIONAL WATERS ASSESSMENT
i
policy developers. These inadequacies constitute a serious impediment
The Global Environment Facility (GEF)
to the implementation of urgently needed innovative policies.
The Global Environment Facility forges international co-operation and fi nances actions to address
six critical threats to the global environment: biodiversity loss, climate change, degradation of
international waters, ozone depletion, land degradation, and persistent organic pollutants (POPs).
Continual assessment of the prevailing and future threats to aquatic
The overall strategic thrust of GEF-funded international waters activities is to meet the incremental
ecosystems and their implications for human populations is essential if
costs of: (a) assisting groups of countries to better understand the environmental concerns of
their international waters and work collaboratively to address them; (b) building the capacity
governments and decision makers are going to be able to make strategic
of existing institutions to utilise a more comprehensive approach for addressing transboundary
policy and management decisions that promote the sustainable use of
water-related environmental concerns; and (c) implementing measures that address the priority
transboundary environmental concerns. The goal is to assist countries to utilise the full range of
those resources and respond to the growing concerns of the general
technical, economic, fi nancial, regulatory, and institutional measures needed to operationalise
public. Although many assessments of aquatic resources are being
sustainable development strategies for international waters.
conducted by local, national, regional and international bodies, past
United Nations Environment Programme (UNEP)
assessments have often concentrated on specifi c themes, such as
United Nations Environment Programme, established in 1972, is the voice for the environment
biodiversity or persistent toxic substances, or have focused only on
within the United Nations system. The mission of UNEP is to provide leadership and encourage
partnership in caring for the environment by inspiring, informing, and enabling nations and
marine or freshwaters. A globally coherent, drainage basin based
peoples to improve their quality of life without compromising that of future generations.
assessment that embraces the inextricable links between transboundary
UNEP work encompasses:
freshwater and marine systems, and between environmental and
Assessing global, regional and national environmental conditions and trends;
Developing international and national environmental instruments;
societal issues, has never been conducted previously.
Strengthening institutions for the wise management of the environment;
Facilitating the transfer of knowledge and technology for sustainable development;
Encouraging new partnerships and mind-sets within civil society and the private sector.
International call for action
University of Kalmar
University of Kalmar hosts the GIWA Co-ordination Offi ce and provides scientifi c advice and
administrative and technical assistance to GIWA. University of Kalmar is situated on the coast of
The need for a holistic assessment of transboundary waters in order to
the Baltic Sea. The city has a long tradition of higher education; teachers and marine offi cers have
been educated in Kalmar since the middle of the 19th century. Today, natural science is a priority
respond to growing public concerns and provide advice to governments
area which gives Kalmar a unique educational and research profi le compared with other smaller
universities in Sweden. Of particular relevance for GIWA is the established research in aquatic and
and decision makers regarding the management of aquatic resources
environmental science. Issues linked to the concept of sustainable development are implemented
was recognised by several international bodies focusing on the global
by the research programme Natural Resources Management and Agenda 21 Research School.
environment. In particular, the Global Environment Facility (GEF)
Since its establishment GIWA has grown to become an integral part of University activities.
The GIWA Co-ordination offi ce and GIWA Core team are located at the Kalmarsund Laboratory, the
observed that the International Waters (IW) component of the GEF
university centre for water-related research. Senior scientists appointed by the University are actively
suff ered from the lack of a global assessment which made it diffi
cult
involved in the GIWA peer-review and steering groups. As a result of the cooperation the University
can off er courses and seminars related to GIWA objectives and international water issues.
to prioritise international water projects, particularly considering
the inadequate understanding of the nature and root causes of
environmental problems. In 1996, at its fourth meeting in Nairobi, the
causes of degradation of the transboundary aquatic environment and
GEF Scientifi c and Technical Advisory Panel (STAP), noted that: "Lack of
options for addressing them. These pro cesses led to the development
an International Waters Assessment comparable with that of the IPCC, the
of the Global International Waters Assessment (GIWA) that would be
Global Biodiversity Assessment, and the Stratospheric Ozone Assessment,
implemented by the United Nations Environment Programme (UNEP) in
was a unique and serious impediment to the implementation of the
conjunction with the University of Kalmar, Sweden, on behalf of the GEF.
International Waters Component of the GEF".
The GIWA was inaugurated in Kalmar in October 1999 by the Executive
Director of UNEP, Dr. Klaus T÷pfer, and the late Swedish Minister of the
The urgent need for an assessment of the causes of environmental
Environment, Kjell Larsson. On this occasion Dr. T÷pfer stated: "GIWA
degradation was also highlighted at the UN Special Session on
is the framework of UNEP┤s global water assessment strategy and will
the Environment (UNGASS) in 1997, where commitments were
enable us to record and report on critical water resources for the planet for
made regarding the work of the UN Commission on Sustainable
consideration of sustainable development management practices as part of
Development (UNCSD) on freshwater in 1998 and seas in 1999. Also in
our responsibilities under Agenda 21 agreements of the Rio conference".
1997, two international Declarations, the Potomac Declaration: Towards
enhanced ocean security into the third millennium, and the Stockholm
The importance of the GIWA has been further underpinned by the UN
Statement on inter action of land activities, freshwater and enclosed
Millennium Development Goals adopted by the UN General Assembly
seas, specifi cally emphasised the need for an investigation of the root
in 2000 and the Declaration from the World Summit on Sustainable
ii
REGIONAL ASSESSMENTS
Development in 2002. The development goals aimed to halve the
International waters and transboundary issues
proportion of people without access to safe drinking water and basic
The term "international waters", as used for the purposes of the GEF Operational Strategy,
sanitation by the year 2015 (United Nations Millennium Declaration
includes the oceans, large marine ecosystems, enclosed or semi-enclosed seas and estuaries, as
well as rivers, lakes, groundwater systems, and wetlands with transboundary drainage basins
2000). The WSSD also calls for integrated management of land, water and
or common borders. The water-related ecosystems associated with these waters are considered
living resources (WSSD 2002) and, by 2010, the Reykjavik Declaration on
integral parts of the systems.
The term "transboundary issues" is used to describe the threats to the aquatic environment
Responsible Fisheries in the Marine Ecosystem should be implemented
linked to globalisation, international trade, demographic changes and technological advancement,
by all countries that are party to the declaration (FAO 2001).
threats that are additional to those created through transboundary movement of water. Single
country policies and actions are inadequate in order to cope with these challenges and this makes
them transboundary in nature.
The international waters area includes numerous international conventions, treaties, and
agreements. The architecture of marine agreements is especially complex, and a large number
The conceptual framework
of bilateral and multilateral agreements exist for transboundary freshwater basins. Related
conventions and agreements in other areas increase the complexity. These initiatives provide
and objectives
a new opportunity for cooperating nations to link many diff erent programmes and instruments
into regional comprehensive approaches to address international waters.
Considering the general decline in the condition of the world's aquatic
the large-scale deforestation of mangroves for ponds (Primavera 1997).
resources and the internationally recognised need for a globally
Within the GIWA, these "non-hydrological" factors constitute as large
coherent assessment of transboundary waters, the primary objectives
a transboundary infl uence as more traditionally recognised problems,
of the GIWA are:
such as the construction of dams that regulate the fl ow of water into
To provide a prioritising mechanism that allows the GEF to focus
a neighbouring country, and are considered equally important. In
their resources so that they are used in the most cost eff ective
addition, the GIWA recognises the importance of hydrological units that
manner to achieve signifi cant environmental benefi ts, at national,
would not normally be considered transboundary but exert a signifi cant
regional and global levels; and
infl uence on transboundary waters, such as the Yangtze River in China
To highlight areas in which governments can develop and
which discharges into the East China Sea (Daoji & Daler 2004) and the
implement strategic policies to reduce environmental degradation
Volga River in Russia which is largely responsible for the condition of
and improve the management of aquatic resources.
the Caspian Sea (Barannik et al. 2004). Furthermore, the GIWA is a truly
regional assessment that has incorporated data from a wide range of
In order to meet these objectives and address some of the current
sources and included expert knowledge and information from a wide
inadequacies in international aquatic resources management, the GIWA
range of sectors and from each country in the region. Therefore, the
has incorporated four essential elements into its design:
transboundary concept adopted by the GIWA extends to include
A broad transboundary approach that generates a truly regional
impacts caused by globalisation, international trade, demographic
perspective through the incorporation of expertise and existing
changes and technological advances and recognises the need for
information from all nations in the region and the assessment of
international cooperation to address them.
all factors that infl uence the aquatic resources of the region;
A drainage basin approach integrating freshwater and marine
systems;
A multidisciplinary approach integrating environmental and socio-
The organisational structure and
economic information and expertise; and
implementation of the GIWA
A coherent assessment that enables global comparison of the
results.
The scale of the assessment
Initially, the scope of the GIWA was confi ned to transboundary waters
The GIWA builds on previous assessments implemented within the GEF
in areas that included countries eligible to receive funds from the GEF.
International Waters portfolio but has developed and adopted a broader
However, it was recognised that a truly global perspective would only
defi nition of transboundary waters to include factors that infl uence the
be achieved if industrialised, GEF-ineligible regions of the world were
quality and quantity of global aquatic resources. For example, due to
also assessed. Financial resources to assess the GEF-eligible countries
globalisation and international trade, the market for penaeid shrimps
were obtained primarily from the GEF (68%), the Swedish International
has widened and the prices soared. This, in turn, has encouraged
Development Cooperation Agency (Sida) (18%), and the Finnish
entrepreneurs in South East Asia to expand aquaculture resulting in
Department for International Development Cooperation (FINNIDA)
GLOBAL INTERNATIONAL WATERS ASSESSMENT
iii
1
15
11
16
14
12
28
10
13
17
25
29
9
18
30
19
23
22
8
7
31
6
20
24
26
35
33
2
34
27
5
21
50
32
51
36
37
41
52
4
49
53
43
65
55
48
54
3
42
56
46
62
47
40b
40a
57
62
45b
39
59
45a
58
60
64
44
61
38
63
66
1 Arctic
12 Norwegian
Sea
(LME)
24 Aral
Sea
36 East-China
Sea
(LME)
46
Somali Coastal Current (LME)
58
North Australian Shelf (LME)
2
Gulf of Mexico (LME)
13 Faroe
plateau
25
Gulf of Alaska (LME)
37
Hawaiian Archipelago (LME)
47
East African Rift Valley Lakes
59 Coral
Sea
Basin
3
Caribbean Sea (LME)
14
Iceland Shelf (LME)
26 California
Current
(LME)
38
Patagonian Shelf (LME)
48
Gulf of Aden
60 Great
Barrier
Reef
(LME)
4 Caribbean
Islands
15
East Greenland Shelf (LME)
27
Gulf of California (LME)
39
Brazil Current (LME)
49 Red
Sea
(LME)
61 Great
Australian
Bight
5
Southeast Shelf (LME)
16
West Greenland Shelf (LME)
28
East Bering Sea (LME)
40a Brazilian Northeast (LME)
50 The
Gulf
62 Small
Island
States
6
Northeast Shelf (LME)
17 Baltic
Sea
(LME)
29
West Bering Sea (LME)
40b Amazon
51 Jordan
63 Tasman
Sea
7
Scotian Shelf (LME)
18 North
Sea
(LME)
30
Sea of Okhotsk (LME)
41
Canary Current (LME)
52 Arabian
Sea
(LME)
64 Humboldt
Current
(LME)
8
Gulf of St Lawrence
19
Celtic-Biscay Shelf (LME)
31
Oyashio Current (LME)
42
Guinea Current (LME)
53
Bay of Bengal S.E.
65 Eastern
Equatorial
Pacific
9
Newfoundland Shelf (LME)
20 Iberian
Coastal
(LME)
32
Kuroshio Current (LME)
43 Lake
Chad
54 South
China
Sea
(LME)
66 Antarctic
(LME)
10
Baffin Bay, Labrador Sea,
21 Mediterranean
Sea
(LME)
33
Sea of Japan/East Sea (LME)
44
Benguela Current (LME)
55 Mekong
River
Canadian Archipelago
22 Black
Sea
(LME)
34 Yellow
Sea
(LME)
45a Agulhas Current (LME)
56 Sulu-Celebes
Sea
(LME)
11 Barents
Sea
(LME)
23 Caspian
Sea
35 Bohai
Sea
45b Indian
Ocean
Islands
57 Indonesian
Seas
(LME)
Figure 1
The 66 transboundary regions assessed within the GIWA project.
(10%). Other contributions were made by Kalmar Municipality, the
Considering the objectives of the GIWA and the elements incorporated
University of Kalmar and the Norwegian Government. The assessment of
into its design, a new methodology for the implementation of the
regions ineligible for GEF funds was conducted by various international
assessment was developed during the initial phase of the project. The
and national organisations as in-kind contributions to the GIWA.
methodology focuses on fi ve major environmental concerns which
constitute the foundation of the GIWA assessment; Freshwater shortage,
In order to be consistent with the transboundary nature of many of the
Pollution, Habitat and community modifi cation, Overexploitation of fi sh
world's aquatic resources and the focus of the GIWA, the geographical
and other living resources, and Global change. The GIWA methodology
units being assessed have been designed according to the watersheds
is outlined in the following chapter.
of discrete hydrographic systems rather than political borders (Figure 1).
The geographic units of the assessment were determined during the
The global network
preparatory phase of the project and resulted in the division of the
In each of the 66 regions, the assessment is conducted by a team of
world into 66 regions defi ned by the entire area of one or more
local experts that is headed by a Focal Point (Figure 2). The Focal Point
catchments areas that drains into a single designated marine system.
can be an individual, institution or organisation that has been selected
These marine systems often correspond to Large Marine Ecosystems
on the basis of their scientifi c reputation and experience implementing
(LMEs) (Sherman 1994, IOC 2002).
international assessment projects. The Focal Point is responsible
for assembling members of the team and ensuring that it has the
Large Marine Ecocsystems (LMEs)
necessary expertise and experience in a variety of environmental
Large Marine Ecosystems (LMEs) are regions of ocean space encompassing coastal areas from river
and socio-economic disciplines to successfully conduct the regional
basins and estuaries to the seaward boundaries of continental shelves and the outer margin of the
major current systems. They are relatively large regions on the order of 200 000 km2 or greater,
assessment. The selection of team members is one of the most critical
characterised by distinct: (1) bathymetry, (2) hydrography, (3) productivity, and (4) trophically
elements for the success of GIWA and, in order to ensure that the
dependent populations.
most relevant information is incorporated into the assessment, team
The Large Marine Ecosystems strategy is a global eff ort for the assessment and management
of international coastal waters. It developed in direct response to a declaration at the 1992
members were selected from a wide variety of institutions such as
Rio Summit. As part of the strategy, the World Conservation Union (IUCN) and National Oceanic
and Atmospheric Administration (NOAA) have joined in an action program to assist developing
universities, research institutes, government agencies, and the private
countries in planning and implementing an ecosystem-based strategy that is focused on LMEs as
sector. In addition, in order to ensure that the assessment produces a
the principal assessment and management units for coastal ocean resources. The LME concept is
also adopted by GEF that recommends the use of LMEs and their contributing freshwater basins
truly regional perspective, the teams should include representatives
as the geographic area for integrating changes in sectoral economic activities.
from each country that shares the region.
iv
REGIONAL ASSESSMENTS
The GIWA is comprised of a logical sequence of four integrated
Steering Group
components. The fi rst stage of the GIWA is called Scaling and is a
process by which the geographic area examined in the assessment is
defi ned and all the transboundary waters within that area are identifi ed.
GIWA Partners
IGOs, NGOs,
Core
Thematic
Once the geographic scale of the assessment has been defi ned, the
Scientific institutions,
Team
Task Teams
private sector, etc
assessment teams conduct a process known as Scoping in which the
66 Regional
magnitude of environmental and associated socio-economic impacts
Focal Points
of Freshwater shortage, Pollution, Habitat and community modifi cation,
and Teams
Unsustainable exploitation of fi sh and other living resources, and Global
Figure 2
The organisation of the GIWA project.
change is assessed in order to identify and prioritise the concerns
that require the most urgent intervention. The assessment of these
predefi ned concerns incorporates the best available information and
In total, more than 1 000 experts have contributed to the implementation
the knowledge and experience of the multidisciplinary, multi-national
of the GIWA illustrating that the GIWA is a participatory exercise that
assessment teams formed in each region. Once the priority concerns
relies on regional expertise. This participatory approach is essential
have been identifi ed, the root causes of these concerns are identifi ed
because it instils a sense of local ownership of the project, which
during the third component of the GIWA, Causal chain analysis. The root
ensures the credibility of the fi ndings and moreover, it has created a
causes are determined through a sequential process that identifi es, in
global network of experts and institutions that can collaborate and
turn, the most signifi cant immediate causes followed by the economic
exchange experiences and expertise to help mitigate the continued
sectors that are primarily responsible for the immediate causes and
degradation of the world's aquatic resources.
fi nally, the societal root causes. At each stage in the Causal chain
analysis, the most signifi cant contributors are identifi ed through an
analysis of the best available information which is augmented by the
expertise of the assessment team. The fi nal component of the GIWA is
GIWA Regional reports
the development of Policy options that focus on mitigating the impacts
of the root causes identifi ed by the Causal chain analysis.
The GIWA was established in response to growing concern among the
general public regarding the quality of the world's aquatic resources
The results of the GIWA assessment in each region are reported in
and the recognition of governments and the international community
regional reports that are published by UNEP. These reports are designed
concerning the absence of a globally coherent international waters
to provide a brief physical and socio-economic description of the
assessment. However, because a holistic, region-by-region, assessment
most important features of the region against which the results of the
of the condition of the world's transboundary water resources had never
assessment can be cast. The remaining sections of the report present
been undertaken, a methodology guiding the implementation of such
the results of each stage of the assessment in an easily digestible form.
an assessment did not exist. Therefore, in order to implement the GIWA,
Each regional report is reviewed by at least two independent external
a new methodology that adopted a multidisciplinary, multi-sectoral,
reviewers in order to ensure the scientifi c validity and applicability of
multi-national approach was developed and is now available for the
each report. The 66 regional assessments of the GIWA will serve UNEP
implementation of future international assessments of aquatic resources.
as an essential complement to the UNEP Water Policy and Strategy and
UNEP's activities in the hydrosphere.
UNEP Water Policy and Strategy
The primary goals of the UNEP water policy and strategy are:
(a) Achieving greater global understanding of freshwater, coastal and marine environments by
Global International Waters Assessment
conducting environmental assessments in priority areas;
(b) Raising awareness of the importance and consequences of unsustainable water use;
(c) Supporting the eff orts of Governments in the preparation and implementation of integrated
management of freshwater systems and their related coastal and marine environments;
(d) Providing support for the preparation of integrated management plans and programmes for
aquatic environmental hot spots, based on the assessment results;
(e) Promoting the application by stakeholders of precautionary, preventive and anticipatory
approaches.
GLOBAL INTERNATIONAL WATERS ASSESSMENT
v
References:
AMAP (1998). Assessment Report: Arctic Pollution Issues. Arctic
Monitoring and Assessment Programme (AMAP), Oslo, Norway.
Barannik, V., Borysova, O. and Stolberg, F. (2004). The Caspian Sea Region:
Environmental Change. Ambio, 33:45-51.
Brinson, M.M. and Malvßrez, A.I. (2002). Temperate freshwater wetlands:
types, status, and threats. Environmental Conservation, 29:115-133.
Daoji, L. and Daler, D. (2004). Ocean Pollution from Land-based Sources:
East China Sea, China. Ambio, 33:98-106.
FAO (2001). Reykjavik conference on responsible fi sheries in the marine
ecosystem. Iceland, 1-4 October 2001.
IOC (2002). IOC-IUCN-NOAA Consultative Meeting on Large Marine
Ecosystems (LMEs). Fourth Session, 8-9 January 2002, Paris,
France.
IPCC (2001). Climate Change 2001: The Scientifi c Basis. Contribution
of Working Group I to the Third Assessment Report of the
Intergovernmental Panel on Climate Change. In: Houghton,
J.T., Ding, Y., Griggs, D.J., Noguer, M., van der Linden, P.J., Dai, X.,
Maskell, K. and Johnson, C.A. (eds). Cambridge University Press,
Cambridge, United Kingdom and New York, NY, USA.
Kennish, M.J. (2002). Environmental threats and environmental future of
estuaries. Environmental Conservation, 29:78-107.
Myers, R.A. and Worm, B. (2003). Rapid worldwide depletion of predatory
fi sh communities. Nature, 423:280-283.
Primavera, J.H. (1997) Socio-economic impacts of shrimp culture.
Aquaculture Research, 28:815-827.
Sherman, K. (1994). Sustainability, biomass yields, and health of coastal
ecosystems: an ecological perspective. Marine Ecology Progress
Series, 112:277-301.
United Nations conference on the human environment (1972). Report
available on-line at http://www.unep.org
United Nations Millennium Declaration (2000). The Millennium
Assembly of the United Nations, New York.
WHO-UNICEF (2002). Global Water Supply and Sanitation Assessment:
2000 Report.
WSSD (2002). World Summit on Sustainable Development.
Johannesburg Summit 2002. Key Outcomes of the Summit,
UN Department of Public Information, New York.
vi
REGIONAL ASSESSMENTS
The GIWA methodology
The specifi c objectives of the GIWA were to conduct a holistic and globally
The assessment integrates environmental and socio-economic data
comparable assessment of the world's transboundary aquatic resources
from each country in the region to determine the severity of the
that incorporated both environmental and socio-economic factors
impacts of each of the fi ve concerns and their constituent issues on
and recognised the inextricable links between freshwater and marine
the entire region. The integration of this information was facilitated by
environments, in order to enable the GEF to focus their resources and to
implementing the assessment during two participatory workshops
provide guidance and advice to governments and decision makers. The
that typically involved 10 to 15 environmental and socio-economic
coalition of all these elements into a single coherent methodology that
experts from each country in the region. During these workshops, the
produces an assessment that achieves each of these objectives had not
regional teams performed preliminary analyses based on the collective
previously been done and posed a signifi cant challenge.
knowledge and experience of these local experts. The results of these
analyses were substantiated with the best available information to be
The integration of each of these elements into the GIWA methodology
presented in a regional report.
was achieved through an iterative process guided by a specially
Table 1 Pre-defi ned GIWA concerns and their constituent issues
convened Methods task team that was comprised of a number of
addressed within the assessment.
international assessment and water experts. Before the fi nal version
of the methodology was adopted, preliminary versions underwent
Environmental issues
Major concerns
an extensive external peer review and were subjected to preliminary
1. Modification of stream flow
testing in selected regions. Advice obtained from the Methods task
2. Pollution of existing supplies
I Freshwater shortage
3. Changes in the water table
team and other international experts and the lessons learnt from
preliminary testing were incorporated into the fi nal version that was
4. Microbiological
5. Eutrophication
used to conduct each of the GIWA regional assessments.
6. Chemical
7. Suspended
solids
II Pollution
8. Solid
wastes
Considering the enormous diff erences between regions in terms of the
9. Thermal
10. Radionuclide
quality, quantity and availability of data, socio-economic setting and
11. Spills
environmental conditions, the achievement of global comparability
12. Loss of ecosystems
required an innovative approach. This was facilitated by focusing
III Habitat and community
13. Modification of ecosystems or ecotones, including community
modification
structure and/or species composition
the assessment on the impacts of fi ve pre-defi ned concerns namely;
Freshwater shortage, Pollution, Habitat and community modifi cation,
14. Overexploitation
15. Excessive by-catch and discards
IV Unsustainable
Unsustainable exploitation of fi sh and other living resources and Global
16. Destructive fishing practices
exploitation of fish and
change, in transboundary waters. Considering the diverse range of
17. Decreased viability of stock through pollution and disease
other living resources
18. Impact on biological and genetic diversity
elements encompassed by each concern, assessing the magnitude of
19. Changes in hydrological cycle
the impacts caused by these concerns was facilitated by evaluating the
20. Sea level change
V Global change
impacts of 22 specifi c issues that were grouped within these concerns
21. Increased uv-b radiation as a result of ozone depletion
22. Changes in ocean CO2 source/sink function
(see Table 1).
THE GIWA METHODOLOGY
vii

political boundaries but were instead, generally defi ned by a large but
T
ransboundar
The GIWA approach
discrete drainage basin that also included the coastal marine waters into
which the basin discharges. In many cases, the marine areas examined
1
Scaling
st
W
o
D
e
during the assessment coincided with the Large Marine Ecosystems
rkshop
tailed
y
D
(LMEs) defi ned by the US National Atmospheric and Oceanographic
iagnostic
A
s
Scoping
sessment
Administration (NOAA). As a consequence, scaling should be a
relatively straight-forward task that involves the inspection of the
Analysis
boundaries that were proposed for the region during the preparatory
Causal Chain
2 nd
Analysis
phase of GIWA to ensure that they are appropriate and that there are
W
orkshop
no important overlaps or gaps with neighbouring regions. When the
Policy Option
proposed boundaries were found to be inadequate, the boundaries of
Analysis
the region were revised according to the recommendations of experts
from both within the region and from adjacent regions so as to ensure
that any changes did not result in the exclusion of areas from the GIWA.
Once the regional boundary was defi ned, regional teams identifi ed all
SAP
the transboundary elements of the aquatic environment within the
SAP
region and determined if these elements could be assessed as a single
Figure 1
Illustration of the relationship between the GIWA
coherent aquatic system or if there were two or more independent
approach and other projects implemented within the
systems that should be assessed separately.
GEF International Waters (IW) portfolio.
The GIWA is a logical contiguous process that defi nes the geographic
Scoping ş Assessing the GIWA concerns
region to be assessed, identifi es and prioritises particularly problems
Scoping is an assessment of the severity of environmental and socio-
based on the magnitude of their impacts on the environment and
economic impacts caused by each of the fi ve pre-defi ned GIWA concerns
human societies in the region, determines the root causes of those
and their constituent issues (Table 1). It is not designed to provide an
problems and, fi nally, assesses various policy options that addresses
exhaustive review of water-related problems that exist within each region,
those root causes in order to reverse negative trends in the condition
but rather it is a mechanism to identify the most urgent problems in the
of the aquatic environment. These four steps, referred to as Scaling,
region and prioritise those for remedial actions. The priorities determined
Scoping, Causal chain analysis and Policy options analysis, are
by Scoping are therefore one of the main outputs of the GIWA project.
summarised below and are described in their entirety in two volumes:
GIWA Methodology Stage 1: Scaling and Scoping; and GIWA Methodology:
Focusing the assessment on pre-defi ned concerns and issues ensured
Detailed Assessment, Causal Chain Analysis and Policy Options Analysis.
the comparability of the results between diff erent regions. In addition, to
Generally, the components of the GIWA methodology are aligned
ensure the long-term applicability of the options that are developed to
with the framework adopted by the GEF for Transboundary Diagnostic
mitigate these problems, Scoping not only assesses the current impacts
Analyses (TDAs) and Strategic Action Programmes (SAPs) (Figure 1) and
of these concerns and issues but also the probable future impacts
assume a broad spectrum of transboundary infl uences in addition to
according to the "most likely scenario" which considered demographic,
those associated with the physical movement of water across national
economic, technological and other relevant changes that will potentially
borders.
infl uence the aquatic environment within the region by 2020.
Scaling ş Defining the geographic extent
The magnitude of the impacts caused by each issue on the
of the region
environment and socio-economic indicators was assessed over the
Scaling is the fi rst stage of the assessment and is the process by which
entire region using the best available information from a wide range of
the geographic scale of the assessment is defi ned. In order to facilitate
sources and the knowledge and experience of the each of the experts
the implementation of the GIWA, the globe was divided during the
comprising the regional team. In order to enhance the comparability
design phase of the project into 66 contiguous regions. Considering the
of the assessment between diff erent regions and remove biases
transboundary nature of many aquatic resources and the transboundary
in the assessment caused by diff erent perceptions of and ways to
focus of the GIWA, the boundaries of the regions did not comply with
communicate the severity of impacts caused by particular issues, the
viii
REGIONAL ASSESSMENTS
results were distilled and reported as standardised scores according to
Table 2
Example of environmental impact assessment of
Freshwater shortage.
the following four point scale:
Weight
0 = no known impact
Environmental
Environmental issues
Score
Weight %
averaged
concerns
1 = slight impact
score
2
=
moderate
impact
1. Modification of stream flow
1
20
Freshwater shortage
1.50
3 = severe impact
2. Pollution of existing supplies
2
50
The attributes of each score for each issue were described by a detailed
3. Changes in the water table
1
30
set of pre-defi ned criteria that were used to guide experts in reporting
Table 3
Example of Health impacts assessment linked to one of
the results of the assessment. For example, the criterion for assigning
the GIWA concerns.
a score of 3 to the issue Loss of ecosystems or ecotones is: "Permanent
Criteria for Health impacts
Raw score
Score
Weight %
destruction of at least one habitat is occurring such as to have reduced their
Very small
Very large
surface area by >30% during the last 2-3 decades". The full list of criteria is
Number of people affected
2
50
0 1 2 3
presented at the end of the chapter, Table 5a-e. Although the scoring
Minimum
Severe
Degree of severity
2
30
0 1 2 3
inevitably includes an arbitrary component, the use of predefi ned
Occasion/Short
Continuous
Frequency/Duration
2
20
0 1 2 3
criteria facilitates comparison of impacts on a global scale and also
Weight average score for Health impacts
2
encouraged consensus of opinion among experts.
The trade-off associated with assessing the impacts of each concern
After all 22 issues and associated socio-economic impacts have
and their constituent issues at the scale of the entire region is that spatial
been scored, weighted and averaged, the magnitude of likely future
resolution was sometimes low. Although the assessment provides a
changes in the environmental and socio-economic impacts of each
score indicating the severity of impacts of a particular issue or concern
of the fi ve concerns on the entire region is assessed according to the
on the entire region, it does not mean that the entire region suff ers
most likely scenario which describes the demographic, economic,
the impacts of that problem. For example, eutrophication could be
technological and other relevant changes that might infl uence the
identifi ed as a severe problem in a region, but this does not imply that all
aquatic environment within the region by 2020.
waters in the region suff er from severe eutrophication. It simply means
that when the degree of eutrophication, the size of the area aff ected,
In order to prioritise among GIWA concerns within the region and
the socio-economic impacts and the number of people aff ected is
identify those that will be subjected to causal chain and policy options
considered, the magnitude of the overall impacts meets the criteria
analysis in the subsequent stages of the GIWA, the present and future
defi ning a severe problem and that a regional action should be initiated
scores of the environmental and socio-economic impacts of each
in order to mitigate the impacts of the problem.
concern are tabulated and an overall score calculated. In the example
presented in Table 4, the scoping assessment indicated that concern III,
When each issue has been scored, it was weighted according to the relative
Habitat and community modifi cation, was the priority concern in this
contribution it made to the overall environmental impacts of the concern
region. The outcome of this mathematic process was reconciled against
and a weighted average score for each of the fi ve concerns was calculated
the knowledge of experts and the best available information in order
(Table 2). Of course, if each issue was deemed to make equal contributions,
to ensure the validity of the conclusion.
then the score describing the overall impacts of the concern was simply the
arithmetic mean of the scores allocated to each issue within the concern.
In some cases however, this process and the subsequent participatory
In addition, the socio-economic impacts of each of the fi ve major
discussion did not yield consensus among the regional experts
concerns were assessed for the entire region. The socio-economic
regarding the ranking of priorities. As a consequence, further analysis
impacts were grouped into three categories; Economic impacts,
was required. In such cases, expert teams continued by assessing the
Health impacts and Other social and community impacts (Table 3). For
relative importance of present and potential future impacts and assign
each category, an evaluation of the size, degree and frequency of the
weights to each. Afterwards, the teams assign weights indicating the
impact was performed and, once completed, a weighted average score
relative contribution made by environmental and socio-economic
describing the overall socio-economic impacts of each concern was
factors to the overall impacts of the concern. The weighted average
calculated in the same manner as the overall environmental score.
score for each concern is then recalculated taking into account
THE GIWA METHODOLOGY
ix
Table 4
Example of comparative environmental and socio-economic impacts of each major concern, presently and likely in year 2020.
Types of impacts
Environmental score
Economic score
Human health score
Social and community score
Concern
Overall score
Present (a)
Future (b)
Present (c)
Future (d)
Present (e)
Future (f)
Present (g)
Future (h)
Freshwater shortage
1.3
2.3
2.7
2.8
2.6
3.0
1.8
2.2
2.3
Pollution
1.5
2.0
2.0
2.3
1.8
2.3
2.0
2.3
2.0
Habitat and community
2.0
3.0
2.4
3.0
2.4
2.8
2.3
2.7
2.6
modification
Unsustainable exploitation of fish
1.8
2.2
2.0
2.1
2.0
2.1
2.4
2.5
2.1
and other living resources
Global change
0.8
1.0
1.5
1.7
1.5
1.5
1.0
1.0
1.2
the relative contributions of both present and future impacts and
should be regarded as a framework to guide the analysis, rather than
environmental and socio-economic factors. The outcome of these
as a set of detailed instructions. Secondly, in an ideal setting, a causal
additional analyses was subjected to further discussion to identify
chain would be produced by a multidisciplinary group of specialists
overall priorities for the region.
that would statistically examine each successive cause and study its
links to the problem and to other causes. However, this approach (even
Finally, the assessment recognises that each of the fi ve GIWA concerns
if feasible) would use far more resources and time than those available
are not discrete but often interact. For example, pollution can destroy
to GIWA1. For this reason, it has been necessary to develop a relatively
aquatic habitats that are essential for fi sh reproduction which, in turn,
simple and practical analytical model for gathering information to
can cause declines in fi sh stocks and subsequent overexploitation. Once
assemble meaningful causal chains.
teams have ranked each of the concerns and determined the priorities
for the region, the links between the concerns are highlighted in order
Conceptual model
to identify places where strategic interventions could be applied to
A causal chain is a series of statements that link the causes of a problem
yield the greatest benefi ts for the environment and human societies
with its eff ects. Recognising the great diversity of local settings and the
in the region.
resulting diffi
culty in developing broadly applicable policy strategies,
the GIWA CCA focuses on a particular system and then only on those
Causal chain analysis
issues that were prioritised during the scoping assessment. The
Causal Chain Analysis (CCA) traces the cause-eff ect pathways from the
starting point of a particular causal chain is one of the issues selected
socio-economic and environmental impacts back to their root causes.
during the Scaling and Scoping stages and its related environmental
The GIWA CCA aims to identify the most important causes of each
and socio-economic impacts. The next element in the GIWA chain is
concern prioritised during the scoping assessment in order to direct
the immediate cause; defi ned as the physical, biological or chemical
policy measures at the most appropriate target in order to prevent
variable that produces the GIWA issue. For example, for the issue of
further degradation of the regional aquatic environment.
eutrophication the immediate causes may be, inter alia:
Enhanced nutrient inputs;
Root causes are not always easy to identify because they are often
Increased
recycling/mobilisation;
spatially or temporally separated from the actual problems they
Trapping of nutrients (e.g. in river impoundments);
cause. The GIWA CCA was developed to help identify and understand
Run-off and stormwaters
the root causes of environmental and socio-economic problems
in international waters and is conducted by identifying the human
Once the relevant immediate cause(s) for the particular system has
activities that cause the problem and then the factors that determine
(have) been identifi ed, the sectors of human activity that contribute
the ways in which these activities are undertaken. However, because
most signifi cantly to the immediate cause have to be determined.
there is no universal theory describing how root causes interact to
Assuming that the most important immediate cause in our example
create natural resource management problems and due to the great
had been increased nutrient concentrations, then it is logical that the
variation of local circumstances under which the methodology will
most likely sources of those nutrients would be the agricultural, urban
be applied, the GIWA CCA is not a rigidly structured assessment but
or industrial sectors. After identifying the sectors that are primarily
1 This does not mean that the methodology ignores statistical or quantitative studies; as has already been pointed out, the available evidence that justifies the assumption of causal links should
be provided in the assessment.
x
REGIONAL ASSESSMENTS
responsible for the immediate causes, the root causes acting on those
The policy options recommended by the GIWA are only contributions
sectors must be determined. For example, if agriculture was found to
to the larger policy process and, as such, the GIWA methodology
be primarily responsible for the increased nutrient concentrations, the
developed to test the performance of various options under the
root causes could potentially be:
diff erent circumstances has been kept simple and broadly applicable.
Economic (e.g. subsidies to fertilisers and agricultural products);
Legal (e.g. inadequate regulation);
Global International Waters Assessment
Failures in governance (e.g. poor enforcement); or
Technology or knowledge related (e.g. lack of aff ordable substitutes
for fertilisers or lack of knowledge as to their application).
Once the most relevant root causes have been identifi ed, an
explanation, which includes available data and information, of how
they are responsible for the primary environmental and socio-economic
problems in the region should be provided.
Policy option analysis
Despite considerable eff ort of many Governments and other
organisations to address transboundary water problems, the evidence
indicates that there is still much to be done in this endeavour. An
important characteristic of GIWA's Policy Option Analysis (POA) is that
its recommendations are fi rmly based on a better understanding of
the root causes of the problems. Freshwater scarcity, water pollution,
overexploitation of living resources and habitat destruction are very
complex phenomena. Policy options that are grounded on a better
understanding of these phenomena will contribute to create more
eff ective societal responses to the extremely complex water related
transboundary problems. The core of POA in the assessment consists
of two tasks:
Construct policy options
Policy options are simply diff erent courses of action, which are not
always mutually exclusive, to solve or mitigate environmental and
socio-economic problems in the region. Although a multitude of
diff erent policy options could be constructed to address each root
cause identifi ed in the CCA, only those few policy options that have
the greatest likelihood of success were analysed in the GIWA.
Select and apply the criteria on which the policy options will be
evaluated
Although there are many criteria that could be used to evaluate any
policy option, GIWA focuses on:
Eff ectiveness (certainty of result)
Effi
ciency (maximisation of net benefi ts)
Equity (fairness of distributional impacts)
Practical
criteria
(political
acceptability,
implementation
feasibility).
THE GIWA METHODOLOGY
xi
Table 5a: Scoring criteria for environmental impacts of Freshwater shortage
Issue
Score 0 = no known impact
Score 1 = slight impact
Score 2 = moderate impact
Score 3 = severe impact
Issue 1: Modification
No evidence of modification of stream
There is a measurably changing trend in
Significant downward or upward trend
Annual discharge of a river altered by more
of stream flow
flow.
annual river discharge at gauging stations
(more than 20% of the long term mean) in
than 50% of long term mean; or
"An increase or decrease
in a major river or tributary (basin >
annual discharges in a major river or tributary Loss of >50% of riparian or deltaic
in the discharge of
40 000 km2); or
draining a basin of >250 000 km2; or
wetlands over a period of not less than
streams and rivers
There is a measurable decrease in the area
Loss of >20% of flood plain or deltaic
40 years (through causes other than
as a result of human
of wetlands (other than as a consequence
wetlands through causes other than
conversion or artificial embankment); or
interventions on a local/
of conversion or embankment
conversion or artificial embankments; or
Significant increased siltation or erosion
regional scale (see Issue
construction); or
Significant loss of riparian vegetation (e.g.
due to changing in flow regime (other than
19 for flow alterations
There is a measurable change in the
trees, flood plain vegetation); or
normal fluctuations in flood plain rivers);
resulting from global
interannual mean salinity of estuaries or
Significant saline intrusion into previously
or
change) over the last 3-4
coastal lagoons and/or change in the mean
freshwater rivers or lagoons.
Loss of one or more anadromous or
decades."
position of estuarine salt wedge or mixing
catadromous fish species for reasons
zone; or
other than physical barriers to migration,
Change in the occurrence of exceptional
pollution or overfishing.
discharges (e.g. due to upstream
damming.
Issue 2: Pollution of
No evidence of pollution of surface and
Any monitored water in the region does
Water supplies does not meet WHO or
River draining more than 10% of the basin
existing supplies
ground waters.
not meet WHO or national drinking water
national drinking water standards in more
have suffered polysaprobic conditions, no
"Pollution of surface
criteria, other than for natural reasons; or
than 30% of the region; or
longer support fish, or have suffered severe
and ground fresh waters
There have been reports of one or more
There are one or more reports of fish kills
oxygen depletion
supplies as a result of
fish kills in the system due to pollution
due to pollution in any river draining a
Severe pollution of other sources of
point or diffuse sources"
within the past five years.
basin of >250 000 km2 .
freshwater (e.g. groundwater)
Issue 3: Changes in the No evidence that abstraction of water from Several wells have been deepened because Clear evidence of declining base flow in
Aquifers are suffering salinisation over
water table
aquifers exceeds natural replenishment.
of excessive aquifer draw-down; or
rivers in semi-arid areas; or
regional scale; or
"Changes in aquifers
Several springs have dried up; or
Loss of plant species in the past decade,
Perennial springs have dried up over
as a direct or indirect
Several wells show some salinisation.
that depend on the presence of ground
regionally significant areas; or
consequence of human
water; or
Some aquifers have become exhausted
activity"
Wells have been deepened over areas of
hundreds of km2;or
Salinisation over significant areas of the
region.
Table 5b: Scoring criteria for environmental impacts of Pollution
Issue
Score 0 = no known impact
Score 1 = slight impact
Score 2 = moderate impact
Score 3 = severe impact
Issue 4:
Normal incidence of bacterial related
There is minor increase in incidence of
Public health authorities aware of marked
There are large closure areas or very
Microbiological
gastroenteric disorders in fisheries product
bacterial related gastroenteric disorders
increase in the incidence of bacterial
restrictive advisories affecting the
pollution
consumers and no fisheries closures or
in fisheries product consumers but no
related gastroenteric disorders in fisheries
marketability of fisheries products; or
"The adverse effects of
advisories.
fisheries closures or advisories.
product consumers; or
There exists widespread public or tourist
microbial constituents of
There are limited area closures or
awareness of hazards resulting in
human sewage released
advisories reducing the exploitation or
major reductions in the exploitation or
to water bodies."
marketability of fisheries products.
marketability of fisheries products.
Issue 5:
No visible effects on the abundance and
Increased abundance of epiphytic algae; or
Increased filamentous algal production
High frequency (>1 event per year), or
Eutrophication
distributions of natural living resource
A statistically significant trend in
resulting in algal mats; or
intensity, or large areas of periodic hypoxic
"Artificially enhanced
distributions in the area; and
decreased water transparency associated
Medium frequency (up to once per year)
conditions, or high frequencies of fish and
primary productivity in
No increased frequency of hypoxia1 or
with algal production as compared with
of large-scale hypoxia and/or fish and
zoobenthos mortality events or harmful
receiving water basins
fish mortality events or harmful algal
long-term (>20 year) data sets; or
zoobenthos mortality events and/or
algal blooms; or
related to the increased
blooms associated with enhanced primary
Measurable shallowing of the depth range
harmful algal blooms.
Significant changes in the littoral
availability or supply
production; and
of macrophytes.
community; or
of nutrients, including
No evidence of periodically reduced
Presence of hydrogen sulphide in
cultural eutrophication
dissolved oxygen or fish and zoobenthos
historically well oxygenated areas.
in lakes."
mortality; and
No evident abnormality in the frequency of
algal blooms.
xii
REGIONAL ASSESSMENTS
Issue 6: Chemical
No known or historical levels of chemical
Some chemical contaminants are
Some chemical contaminants are above
Chemical contaminants are above
pollution
contaminants except background levels of
detectable but below threshold limits
threshold limits defined for the country or
threshold limits defined for the country or
"The adverse effects of
naturally occurring substances; and
defined for the country or region; or
region; or
region; and
chemical contaminants
No fisheries closures or advisories due to
Restricted area advisories regarding
Large area advisories by public health
Public health and public awareness of
released to standing or
chemical pollution; and
chemical contamination of fisheries
authorities concerning fisheries product
fisheries contamination problems with
marine water bodies
No incidence of fisheries product tainting;
products.
contamination but without associated
associated reductions in the marketability
as a result of human
and
catch restrictions or closures; or
of such products either through the
activities. Chemical
No unusual fish mortality events.
If there is no available data use the following
High mortalities of aquatic species near
imposition of limited advisories or by area
contaminants are
criteria:
outfalls.
closures of fisheries; or
here defined as
If there is no available data use the following
Some use of pesticides in small areas; or
Large-scale mortalities of aquatic species.
compounds that are
criteria:
Presence of small sources of dioxins or
If there is no available data use the following
toxic or persistent or
No use of pesticides; and
furans (e.g., small incineration plants or
criteria:
If there is no available data use the following
bioaccumulating."
No sources of dioxins and furans; and
bleached kraft/pulp mills using chlorine);
Large-scale use of pesticides in agriculture
criteria:
No regional use of PCBs; and
or
and forestry; or
Indications of health effects resulting
No bleached kraft pulp mills using chlorine Some previous and existing use of PCBs
Presence of major sources of dioxins or
from use of pesticides; or
bleaching; and
and limited amounts of PCB-containing
furans such as large municipal or industrial Known emissions of dioxins or furans from
No use or sources of other contaminants.
wastes but not in amounts invoking local
incinerators or large bleached kraft pulp
incinerators or chlorine bleaching of pulp;
concerns; or
mills; or
or
Presence of other contaminants.
Considerable quantities of waste PCBs in
Known contamination of the environment
the area with inadequate regulation or has
or foodstuffs by PCBs; or
invoked some public concerns; or
Known contamination of the environment
Presence of considerable quantities of
or foodstuffs by other contaminants.
other contaminants.
Issue 7: Suspended
No visible reduction in water transparency; Evidently increased or reduced turbidity
Markedly increased or reduced turbidity
Major changes in turbidity over wide or
solids
and
in streams and/or receiving riverine and
in small areas of streams and/or receiving
ecologically significant areas resulting
"The adverse effects of
No evidence of turbidity plumes or
marine environments but without major
riverine and marine environments; or
in markedly changed biodiversity or
modified rates of release
increased siltation; and
changes in associated sedimentation or
Extensive evidence of changes in
mortality in benthic species due to
of suspended particulate
No evidence of progressive riverbank,
erosion rates, mortality or diversity of flora
sedimentation or erosion rates; or
excessive sedimentation with or without
matter to water bodies
beach, other coastal or deltaic erosion.
and fauna; or
Changes in benthic or pelagic biodiversity
concomitant changes in the nature of
resulting from human
Some evidence of changes in benthic or
in areas due to sediment blanketing or
deposited sediments (i.e., grain-size
activities"
pelagic biodiversity in some areas due
increased turbidity.
composition/redox); or
to sediment blanketing or increased
Major change in pelagic biodiversity or
turbidity.
mortality due to excessive turbidity.
Issue 8: Solid wastes
No noticeable interference with trawling
Some evidence of marine-derived litter on
Widespread litter on beaches giving rise to Incidence of litter on beaches sufficient
"Adverse effects
activities; and
beaches; or
public concerns regarding the recreational
to deter the public from recreational
associated with the
No noticeable interference with the
Occasional recovery of solid wastes
use of beaches; or
activities; or
introduction of solid
recreational use of beaches due to litter;
through trawling activities; but
High frequencies of benthic litter recovery
Trawling activities untenable because of
waste materials into
and
Without noticeable interference with
and interference with trawling activities;
benthic litter and gear entanglement; or
water bodies or their
No reported entanglement of aquatic
trawling and recreational activities in
or
Widespread entanglement and/or
environs."
organisms with debris.
coastal areas.
Frequent reports of entanglement/
suffocation of aquatic species by litter.
suffocation of species by litter.
Issue 9: Thermal
No thermal discharges or evidence of
Presence of thermal discharges but
Presence of thermal discharges with large
Presence of thermal discharges with large
"The adverse effects
thermal effluent effects.
without noticeable effects beyond
mixing zones having reduced productivity
mixing zones with associated mortalities,
of the release of
the mixing zone and no significant
or altered biodiversity; or
substantially reduced productivity or
aqueous effluents at
interference with migration of species.
Evidence of reduced migration of species
noticeable changes in biodiversity; or
temperatures exceeding
due to thermal plume.
Marked reduction in the migration of
ambient temperature
species due to thermal plumes.
in the receiving water
body."
Issue 10: Radionuclide
No radionuclide discharges or nuclear
Minor releases or fallout of radionuclides
Minor releases or fallout of radionuclides
Substantial releases or fallout of
"The adverse effects of
activities in the region.
but with well regulated or well-managed
under poorly regulated conditions that do
radionuclides resulting in excessive
the release of radioactive
conditions complying with the Basic Safety
not provide an adequate basis for public
exposures to humans or animals in relation
contaminants and
Standards.
health assurance or the protection of
to those recommended under the Basic
wastes into the aquatic
aquatic organisms but without situations
Safety Standards; or
environment from
or levels likely to warrant large scale
Some indication of situations or exposures
human activities."
intervention by a national or international
warranting intervention by a national or
authority.
international authority.
Issue 11: Spills
No evidence of present or previous spills of
Some evidence of minor spills of hazardous Evidence of widespread contamination
Widespread contamination by hazardous
"The adverse effects
hazardous material; or
materials in small areas with insignificant
by hazardous or aesthetically displeasing
or aesthetically displeasing materials
of accidental episodic
No evidence of increased aquatic or avian
small-scale adverse effects one aquatic or
materials assumed to be from spillage
from frequent spills resulting in major
releases of contaminants
species mortality due to spills.
avian species.
(e.g. oil slicks) but with limited evidence of
interference with aquatic resource
and materials to the
widespread adverse effects on resources or
exploitation or coastal recreational
aquatic environment
amenities; or
amenities; or
as a result of human
Some evidence of aquatic or avian species
Significant mortality of aquatic or avian
activities."
mortality through increased presence of
species as evidenced by large numbers of
contaminated or poisoned carcasses on
contaminated carcasses on beaches.
beaches.
THE GIWA METHODOLOGY
xiii
Table 5c: Scoring criteria for environmental impacts of Habitat and community modification
Issue
Score 0 = no known impact
Score 1 = slight impact
Score 2 = moderate impact
Score 3 = severe impact
Issue 12: Loss of ecosystems or
There is no evidence of loss of
There are indications of fragmentation Permanent destruction of at least one
Permanent destruction of at least one
ecotones
ecosystems or habitats.
of at least one of the habitats.
habitat is occurring such as to have
habitat is occurring such as to have
"The complete destruction of aquatic
reduced their surface area by up to 30
reduced their surface area by >30%
habitats. For the purpose of GIWA
% during the last 2-3 decades.
during the last 2-3 decades.
methodology, recent loss will be
measured as a loss of pre-defined
habitats over the last 2-3 decades."
Issue 13: Modification of
No evidence of change in species
Evidence of change in species
Evidence of change in species
Evidence of change in species
ecosystems or ecotones, including
complement due to species extinction
complement due to species extinction
complement due to species extinction
complement due to species extinction
community structure and/or species
or introduction; and
or introduction
or introduction; and
or introduction; and
composition
No changing in ecosystem function
Evidence of change in population
Evidence of change in population
"Modification of pre-defined habitats
and services.
structure or change in functional group
structure or change in functional group
in terms of extinction of native species,
composition or structure
composition or structure; and
occurrence of introduced species and
Evidence of change in ecosystem
changing in ecosystem function and
services2.
services over the last 2-3 decades."
2 Constanza, R. et al. (1997). The value of the world ecosystem services and natural capital, Nature 387:253-260.
Table 5d: Scoring criteria for environmental impacts of Unsustainable exploitation of fish and other
living resources
Issue
Score 0 = no known impact
Score 1 = slight impact
Score 2 = moderate impact
Score 3 = severe impact
Issue 14: Overexploitation
No harvesting exists catching fish
Commercial harvesting exists but there One stock is exploited beyond MSY
More than one stock is exploited
"The capture of fish, shellfish or marine
(with commercial gear for sale or
is no evidence of over-exploitation.
(maximum sustainable yield) or is
beyond MSY or is outside safe
invertebrates at a level that exceeds the
subsistence).
outside safe biological limits.
biological limits.
maximum sustainable yield of the stock."
Issue 15: Excessive by-catch and
Current harvesting practices show no
Up to 30% of the fisheries yield (by
30-60% of the fisheries yield consists
Over 60% of the fisheries yield is
discards
evidence of excessive by-catch and/or
weight) consists of by-catch and/or
of by-catch and/or discards.
by-catch and/or discards; or
"By-catch refers to the incidental capture
discards.
discards.
Noticeable incidence of capture of
of fish or other animals that are not the
endangered species.
target of the fisheries. Discards refers
to dead fish or other animals that are
returned to the sea."
Issue 16: Destructive fishing
No evidence of habitat destruction due Habitat destruction resulting in
Habitat destruction resulting in
Habitat destruction resulting in
practices
to fisheries practices.
changes in distribution of fish or
moderate reduction of stocks or
complete collapse of a stock or far
"Fishing practices that are deemed to
shellfish stocks; or
moderate changes of the environment;
reaching changes in the environment;
produce significant harm to marine,
Trawling of any one area of the seabed
or
or
lacustrine or coastal habitats and
is occurring less than once per year.
Trawling of any one area of the seabed
Trawling of any one area of the seabed
communities."
is occurring 1-10 times per year; or
is occurring more than 10 times per
Incidental use of explosives or poisons
year; or
for fishing.
Widespread use of explosives or
poisons for fishing.
Issue 17: Decreased viability of
No evidence of increased incidence of
Increased reports of diseases without
Declining populations of one or more
Collapse of stocks as a result of
stocks through contamination and
fish or shellfish diseases.
major impacts on the stock.
species as a result of diseases or
diseases or contamination.
disease
contamination.
"Contamination or diseases of feral (wild)
stocks of fish or invertebrates that are a
direct or indirect consequence of human
action."
Issue 18: Impact on biological and
No evidence of deliberate or accidental Alien species introduced intentionally
Measurable decline in the population
Extinction of native species or local
genetic diversity
introductions of alien species; and
or accidentally without major changes
of native species or local stocks as a
stocks as a result of introductions
"Changes in genetic and species diversity No evidence of deliberate or accidental
in the community structure; or
result of introductions (intentional or
(intentional or accidental); or
of aquatic environments resulting from
introductions of alien stocks; and
Alien stocks introduced intentionally
accidental); or
Major changes (>20%) in the genetic
the introduction of alien or genetically
No evidence of deliberate or accidental
or accidentally without major changes
Some changes in the genetic
composition of stocks (e.g. as a result
modified species as an intentional or
introductions of genetically modified
in the community structure; or
composition of stocks (e.g. as a result
of escapes from aquaculture replacing
unintentional result of human activities
species.
Genetically modified species
of escapes from aquaculture replacing
the wild stock).
including aquaculture and restocking."
introduced intentionally or
the wild stock).
accidentally without major changes in
the community structure.
xiv
REGIONAL ASSESSMENTS
Table 5e: Scoring criteria for environmental impacts of Global change
Issue
Score 0 = no known impact
Score 1 = slight impact
Score 2 = moderate impact
Score 3 = severe impact
Issue 19: Changes in hydrological
No evidence of changes in hydrological Change in hydrological cycles due
Significant trend in changing
Loss of an entire habitat through
cycle and ocean circulation
cycle and ocean/coastal current due to
to global change causing changes
terrestrial or sea ice cover (by
desiccation or submergence as a result
"Changes in the local/regional water
global change.
in the distribution and density of
comparison with a long-term time
of global change; or
balance and changes in ocean and coastal
riparian terrestrial or aquatic plants
series) without major downstream
Change in the tree or lichen lines; or
circulation or current regime over the
without influencing overall levels of
effects on river/ocean circulation or
Major impacts on habitats or
last 2-3 decades arising from the wider
productivity; or
biological diversity; or
biodiversity as the result of increasing
problem of global change including
Some evidence of changes in ocean
Extreme events such as flood and
frequency of extreme events; or
ENSO."
or coastal currents due to global
drought are increasing; or
Changing in ocean or coastal currents
change but without a strong effect on
Aquatic productivity has been altered
or upwelling regimes such that plant
ecosystem diversity or productivity.
as a result of global phenomena such
or animal populations are unable to
as ENSO events.
recover to their historical or stable
levels; or
Significant changes in thermohaline
circulation.
Issue 20: Sea level change
No evidence of sea level change.
Some evidences of sea level change
Changed pattern of coastal erosion due Major loss of coastal land areas due to
"Changes in the last 2-3 decades in the
without major loss of populations of
to sea level rise has became evident; or
sea-level change or sea-level induced
annual/seasonal mean sea level as a
organisms.
Increase in coastal flooding events
erosion; or
result of global change."
partly attributed to sea-level rise
Major loss of coastal or intertidal
or changing prevailing atmospheric
populations due to sea-level change or
forcing such as atmospheric pressure
sea level induced erosion.
or wind field (other than storm
surges).
Issue 21: Increased UV-B radiation as No evidence of increasing effects
Some measurable effects of UV/B
Aquatic community structure is
Measured/assessed effects of UV/B
a result of ozone depletion
of UV/B radiation on marine or
radiation on behavior or appearance of
measurably altered as a consequence
irradiation are leading to massive loss
"Increased UV-B flux as a result polar
freshwater organisms.
some aquatic species without affecting
of UV/B radiation; or
of aquatic communities or a significant
ozone depletion over the last 2-3
the viability of the population.
One or more aquatic populations are
change in biological diversity.
decades."
declining.
Issue 22: Changes in ocean CO
No measurable or assessed changes
Some reasonable suspicions that
Some evidences that the impacts
Evidences that the changes in
2
source/sink function
in CO source/sink function of aquatic
current global change is impacting the
of global change have altered the
source/sink function of the aquatic
2
"Changes in the capacity of aquatic
system.
aquatic system sufficiently to alter its
source/sink function for CO of aquatic
systems in the region are sufficient to
2
systems, ocean as well as freshwater, to
source/sink function for CO .
systems in the region by at least 10%.
cause measurable change in global CO
2
2
generate or absorb atmospheric CO as a
balance.
2
direct or indirect consequence of global
change over the last 2-3 decades."
THE GIWA METHODOLOGY
xv