

Global International
Waters Assessment
Regional assessments
Other reports in this series:
Barents Sea ş GIWA Regional assessment 11
Caspian Sea ş GIWA Regional assessment 23
Gulf of California/Colorado River Basin ş GIWA Regional assessment 27
Patagonian Shelf ş GIWA Regional assessment 38
Brazil Current ş GIWA Regional assessment 39
Amazon Basin ş GIWA Regional assessment 40b
Guinea Current ş GIWA Regional assessment 42
Lake Chad Basin ş GIWA Regional assessment 43
Indian Ocean Islands ş GIWA Regional assessment 45b
East African Rift Valley Lakes ş GIWA Regional assessment 47
Global International
Waters Assessment
Regional assessment 62
Pacific Islands
GIWA report production
Series editor: Ulla Li Zweifel
Report editor: David Souter
Editorial assistance: Johanna Egerup
Maps & GIS: Niklas Holmgren
Design & graphics: Joakim Palmqvist
Global International Waters Assessment
Pacifi c Islands, GIWA Regional assessment 62
Published by the University of Kalmar on behalf of
United Nations Environment Programme
ę 2004 United Nations Environment Programme
ISSN 1651-940X
University of Kalmar
SE-391 82 Kalmar
Sweden
United Nations Environment Programme
PO Box 30552,
Nairobi, Kenya
This publication may be reproduced in whole or in part and
in any form for educational or non-profi t purposes without
special permission from the copyright holder, provided
acknowledgement of the source is made. No use of this
publication may be made for resale or for any other commercial
purpose whatsoever without prior permission in writing from the
United Nations Environment Programme.
CITATIONS
When citing this report, please use:
UNEP, 2004. South, G.R., Skelton, P., Veitayaki, J., Resture, A.,
Carpenter, C., Pratt, C. and A. Lawedrau. Pacifi c Islands, GIWA
Regional assessment 62. University of Kalmar, Kalmar, Sweden.
DISCLAIMER
The views expressed in this publication are those of the authors
and do not necessarily refl ect those of UNEP. The designations
employed and the presentations do not imply the expressions
of any opinion whatsoever on the part of UNEP or cooperating
agencies concerning the legal status of any country, territory,
city or areas or its authority, or concerning the delimitation of its
frontiers or boundaries.
This publication has been peer-reviewed and the information
herein is believed to be reliable, but the publisher does not
warrant its completeness or accuracy.
Printed and bound in Kalmar, Sweden, by Sunds Tryck Íland AB.
Contents
Executive summary
9
Abbreviations and acronyms
12
Regional defi nition
14
Boundaries of the Pacifi c Islands region
14
Physical characteristics
15
Socio-economic characteristics
17
Assessment 22
Freshwater shortage
22
Pollution
24
Habitat and community modifi cation
29
Unsustainable exploitation of fi sh and other living resources
32
Global change
36
Priority concerns for further analysis
40
Causal chain analysis
41
Modifi cation of stream fl ow ş Rewa and Ba river basins
42
Changes in water table ş Bonriki freshwater lens
45
Overexploitation of living resources
48
Destructive fi shing practices
52
Decreased viability of stocks due to pollution and disease
54
Policy options
58
Freshwater shortage
59
Unsustainable exploitation of living resources
62
Conclusion
65
Conclusions and recommendations
66
References 69
Annexes 75
Annex I List of contributing authors and organisations
75
Annex II Detailed scoring tables
76
Annex III List of important water-related programmes and assessments in the region
79
The Global International Waters Assessment
i
The GIWA methodology
vii
CONTENTS
7
Executive summary
The Pacifi c Islands GIWA region 62 includes all of the 23 island nations or
Population densities range from extremely low to numbers comparable
territories of the tropical Pacifi c Ocean that embrace the cultural areas
with some of the densest metropolitan areas in the world. The range
of Melanesia, Polynesia and Micronesia. The region covers about 12%
is from just over 8 persons per km2 for Pitcairn Island to 505 persons
of the world's ocean space. These island states and territories range
per km2 for Nauru. In the most populous islands, the densities rise to
from very large, high continental islands, to countless off shore large and
over 100 per km2 for four islands, over 200 for three islands, and 421 for
small islands that may be generally grouped as high islands, coral lime
Koror in Palau, 757 for Funafuti in Tuvalu, 1 179 for Majuro in the Marshall
stone islands and atolls. The total land areas vary from 12 to 26 km2 for
Islands, and 2 190 for Tarawa in Kiribati. The estimated population for
groups of low-lying coral-limestone islands like Tokelau and Tuvalu to
Betio Islet of Tarawa atoll was 40 000 in the year 2000, which will give it
over 400 000 km2 for the continental island areas of Irian Jaya and Papua
a population density rivalling those of Hong Kong and Singapore. On
New Guinea. Terrestrial, freshwater and marine ecosystems are highly
Ebeye, one of some 90 islets comprising Kwajalein Atoll in the Marshall
variable, and there is also a wide range of geographic, demographic and
Islands, and to which people have been relocated by the U.S. military
developmental diversity. Some, like Easter Island, Guam, Kosrae, Nauru and
to free the atoll's lagoon for intercontinental ballistic missile testing, the
Niue, consist of one single small island. Others like Fiji, Tonga and French
population density increases to over 25 000 per km2!
Polynesia are comprised of numerous large and small highly dispersed
islands. Papua New Guinea and West Papua (Irian Jaya) are parts of high
Although some of the larger island groups with signifi cant mineral,
continental islands. These geographic and topographic diff erences are
forestry, fi sheries and agricultural land resources have some potential
paralleled by diff erences in climate, geological resources, topographical
for development, most Pacifi c Island states and territories do not. Their
features, soil types, mineral and water availability, extent of coral reefs and
options for modern economic development are extremely limited
diversity of terrestrial, freshwater and marine fl ora and fauna.
because of their small size, geographic isolation and extremely limited
natural resources. Thus most island countries, territories and local
As the boundaries of the region are largely adjoining other large
communities will, for the foreseeable future, have to depend on the
oceanic spaces, transboundary eff ects are minimal on this scale. The
sustainable use of their local resources as a basis for their survival and
unpopulated Coral Sea situated to the west of the region minimises
development. The Pacifi c Island region is unique in that most of the
any transboundary eff ects from the continent of Australia, but to the
islands of the region are inhabited by indigenous peoples who have
northwest the region is infl uenced by land-based factors such as run-
close links with, and great cultural, economic and spiritual dependence
off from land-based activities (forestry, mining) and sedimentation
on their island terrestrial and marine environment. Generally speaking,
originating from Papua New Guinea, Irian Jaya, and the Philippine Sea.
these indigenous people are the owners and users of these resources
Given that there are large areas of deep ocean space separating the
and ultimately control decisions related to their conservation and
island states and territories, any transboundary eff ects are minimised.
sustainable use. This is a very diff erent situation compared with
Within the larger archipelagic states, however, local transboundary
that in other GIWA island regions, such as the Indian Ocean and the
eff ects are potentially signifi cant, as urban impacts, large watershed
Caribbean Sea, and continental areas where there is more private or
eff ects and other anthropogenic disturbances such as mining, forestry,
public land and governments can play a much greater role in resource
agriculture and coastal development may aff ect adjacent areas.
management.
EXECUTIVE SUMMARY
9
It was noted during the assessment of GIWA issues that there was a great
to a lack of appreciation of the long-term eff ects of current actions) is
disparity in the impacts of various issues across the region because of
a pervasive problem and capacity building needs to be given a high
the diverse range and varying characteristics of the islands comprising
priority now and for the foreseeable future. Integrated planning is rarely,
the region. For example, freshwater shortage may be ranked highly
if ever, practised throughout the region and there is a long timelag
in atoll states, but lower in the high island states. Important socio-
between signing and ratifying global conventions and agreements,
economic issues in the region include high population growth rates,
and then developing the national laws and regulations needed to
urban drift, breakdown of traditional lifestyles, a strong dependence on
regulate and enforce them. In some areas, such as land and resource
aid and the rapid adoption of the cash economy.
ownership issues, dispute resolution is an on-going need. In the area
of resource overexploitation, the same governance and regulatory
The Causal chain analysis concentrated on selected case studies:
issues are important. A lack of data describing the status of fi sheries is a
Freshwater shortage: Viti Levu, Fiji and South Tarawa, Kiribati;
major problem for stakeholders and regulators alike. Co-management
Unsustainable exploitation of fi sh: Fiji.
is seen as an important strategy to be adopted for the future. A lack of
MPAs gives the countries little protection against loss of resources and
Root causes for freshwater shortage include rapid economic
biodiversity.
development, increases in population density (and hence demands
for water) through migration and urban drift, lack of adequate policies
The recommendations are designed to address the root causes
on land and water use and the necessary capacity for their enforcement,
identifi ed in the GIWA assessment. They are not listed in any particular
and natural phenomena including changing weather patterns and other
order of priority. It is noteworthy that most of them are also refl ected in
aspects of climate change. Pollution of water supplies is potentially
the Pacifi c Islands Regional Ocean Forum, held in Suva, Fiji on February
region-wide, due to inadequate treatment of domestic waste water and
2-6, 2004.
inadequate solid waste disposal. Changes in the water table from over-
use and climate-related issues are widespread, but the most threatening
1. All Pacifi c Island countries urgently need to develop and implement
are in atoll countries. There are some signifi cant examples of habitat
laws and regulations necessary for their compliance with global
modifi cation leading to loss of ecosystems: some are attributable to
conventions and agreements to which they are signatory. Existing
unregulated coastal development, destruction of mangroves, forestry,
legislation should be properly enforced, and where new legislation
mining and poor wastewater discharge. Economic development and
is required, this will require substantial outside assistance, since
market demand (eg. logging, mining, tourism) are also root causes.
many countries lack the necessary legal expertise.
2. Capacity building in all areas of ocean, coastal and watershed
Unsustainable exploitation of fi sh is universal throughout the region,
management is a priority for the region. This will require a concerted
and most serious close to urban areas. A root cause is the need to
eff ort on the parts of national, regional and international education
generate income to support family needs, this causing a decline
and training institutions, and signifi cant funding. All future projects
in coastal resources. Destructive fi shing, overexploitation, lack of
should be required to include a capacity building component and
enforcement, lack of Marine Protected Areas (MPAs) and over-licensing
should engage local communities.
are all evident from the analysis, and the root causes include market
3. The raising of public awareness on all coastal and ocean-related
demand, lack of regulations and/or their enforcement, and economic
topics is badly needed, from the level of the village to that of
demand. Access to technology was also seen as a root cause. Pollution is
government, planners and decision-makers. Schools, NGOs and
aff ecting living resources in some heavily populated areas like Suva, Fiji.
the media should all play a part in this process. For the schools,
This includes heavy metals, human waste, solid waste and agricultural
this would require a signifi cant investment in the development of
run-off . A lack of regulation and increasing population pressure are
national school curricula that refl ect local needs.
among the most important root causes. There is often also a lack of
4. Integrated planning and decision-making is a necessity for all
political will.
governments. This requires a new paradigm in government,
and involvement of all parties in the process, especially the
With respect to policies, it is clear that stakeholders should be involved
stakeholders. For most countries, the development of an integrated
in their development and implementation. Where adequate policies do
coastal management plan should be a national priority.
exist, enforcement is rarely successful and governments are driven by
5. There is a great need for research on and monitoring of the
expedience or economics. Above all, lack of knowledge (which leads
coastal and ocean environments of the region. The strengthening
10
GIWA REGIONAL ASSESSMENT 62 PACIFIC ISLANDS
of research and monitoring capacity is an a priore need and,
where necessary, regional and international cooperation and
involvement of communities, NGOs and the private sector should
be encouraged. The need should be expressed in all future bi-
lateral and multi-lateral aid projects, and funding sought to support
it. The strengthening of the research and monitoring capacity of
national and regional universities should be encouraged, as well
as cooperation with developed country institutions through
partnership arrangements.
6. The regional and global lobbying of the Pacifi c Island countries is
commendable, well organised and eff ective. This now needs to be
brought down to the local community level, and proper feedback
mechanisms between researchers, managers, government and
communities need to be developed.
7. Environmental sustainability needs to be given greater emphasis by
governments, many of which lack a relevant ministry or department
for the environment. Implementation of sustainability policies will
require political will, cooperation, and the provision of appropriate
resources.
8. All Pacifi c Island countries developed National Environment
Management Strategies (NEMS) as a lead-up to UNCED. Yet, many of
the recommendations have yet to be implemented, and the NEMS
are a decade out of date. The NEMS should be dusted off , revised
if necessary, and translated into actions. The recommendations
contained within NEMS could be linked to economic development
plans, in the form of National Sustainable Development Plans.
9. Pacifi c Island countries must take greater ownership of projects
managed by regional organisations, as it is the countries themselves
who will have to implement sustainable practices. Countries must
strive and seek support to bring this about, because if they fail to
do so it could at their peril for the future.
EXECUTIVE SUMMARY
11
Abbreviations and acronyms
ACP
sub-Saharan Africa, Caribbean and Pacifi c states
NPA
National Plans of Action
ADB Asian
Development
Bank
ODS
Ozone Depleting Substances
ARGO
Array of Real-Time Global Observation
PACPOL Pacifi c Ocean Pollution Prevention Programme
ARM
United States Department of Energy's Atmospheric Radiation
PIDCs
Pacifi c Islands Developing Countries
Measurement
PIROF
Pacifi c Islands Regional Ocean Forum
ASEAN
Association of Southeast Asian Nation
PIROP
Pacifi c Islands Regional Ocean Policy
BOD Biological
Oxygen
Demand
PNG Papua
New
Guinea
CMT
Customary Marine Tenure
RMI
Republic of the Marshall Islands
CPUE
Catch Per Unite Eff ort
SAP
Strategic Action Programme
CROP
Council of Regional Organisations of the Pacifi c
SEREAD Scientifi c Educational Resources and Experience Associated
EDP
European Development Fund
with the Deployment of ARGO
EEZ
Exclusive Economic Zone
SOPAC
South Pacifi c Applied Geoscience Commission
ENSO
El Ni˝o Southern Oscillation
SPC
Secretariat for the Pacifi c Community
FLMMA Fiji's Locally Managed Marine Area
SPREP
South Pacifi c Regional Environment Programme
FSM
Federated States of Micronesia
TAC
Total Allowable Catch
GCRMN Global Coral Reef Monitoring Network
TAG
Technical Advisory Group
GDP Gross
Domestic
Product
TBT
Tributyl tin
GEF
Global Environment Facility
TWP
Tropical Western Pacifi c
GMA
Global Marine Assessment
UNCED United Nations Conference on Environment and
GPA
Global Programme of Action
Development
IMO
International Maritime Organization
UNEP
United Nations Environment Programme
IGOs Inter-Governmental
Organisations
WHO
World Health Organization
IPCC
Inter-governmental Panel on Climate Change
WSSD World
Summit
on
Sustainable
Development
ISA
Integrated Strategic Action
IUCN
International Union for Conservation of Nature
IW
International Waters
JPfA
Joint Caribbean Pacifi c Programme for Action on Water and
Climate
LMMA
Locally Managed Marine Areas
MPA
Marine Protected Areas
MSY
Maximum Sustainable Yield
NEMS
National Environment Management Strategies
NGOs Non-Governmental
Organisations
12
GIWA REGIONAL ASSESSMENT 62 PACIFIC ISLANDS
List of figures
Figure 1
Boundaries of the region. . . . . . . . . . . . . . . . . . . . . . . . . . . . . . . . . . . . . . . . . . . . . . . . . . . . . . . . . . . . . . . . . . . . . . . . . . . . . . . . . . . . . . . . . . . . . . . . . . . . . . . . . . . . . . . . . . . . . . . . . . . . . . . . . . . . . . . . 14
Figure 2
National and international protected areas in the Pacific Islands region with a marine component, categorised according to IUCN.. . . . . . . . . . . . . . . . . . . . . . . . . . . 26
Figure 4
Mushroom cloud from atomic bomb test, Bikini Atoll, 1946. . . . . . . . . . . . . . . . . . . . . . . . . . . . . . . . . . . . . . . . . . . . . . . . . . . . . . . . . . . . . . . . . . . . . . . . . . . . . . . . . . . . . . . . . . . . . . . . . . . . 27
Figure 5
Reefs at risk in the Pacific Islands region.. . . . . . . . . . . . . . . . . . . . . . . . . . . . . . . . . . . . . . . . . . . . . . . . . . . . . . . . . . . . . . . . . . . . . . . . . . . . . . . . . . . . . . . . . . . . . . . . . . . . . . . . . . . . . . . . . . . . . . . 29
Figure 6
Habitat and community modification ş moonscape in Nauru resulting from phosphate mining. . . . . . . . . . . . . . . . . . . . . . . . . . . . . . . . . . . . . . . . . . . . . . . . . . . . . . . . . . . . . . . 30
Figure 7
Bŕche-de-mer on sale at Suva market, Fiji.. . . . . . . . . . . . . . . . . . . . . . . . . . . . . . . . . . . . . . . . . . . . . . . . . . . . . . . . . . . . . . . . . . . . . . . . . . . . . . . . . . . . . . . . . . . . . . . . . . . . . . . . . . . . . . . . . . . . . 33
Figure 8
Reef fish on sale at the Suva market, Fiji. . . . . . . . . . . . . . . . . . . . . . . . . . . . . . . . . . . . . . . . . . . . . . . . . . . . . . . . . . . . . . . . . . . . . . . . . . . . . . . . . . . . . . . . . . . . . . . . . . . . . . . . . . . . . . . . . . . . . . . 34
Figure 9
Sale of Hypnea seaweed at Suva market, Fiji. . . . . . . . . . . . . . . . . . . . . . . . . . . . . . . . . . . . . . . . . . . . . . . . . . . . . . . . . . . . . . . . . . . . . . . . . . . . . . . . . . . . . . . . . . . . . . . . . . . . . . . . . . . . . . . . . . . 35
Figure 10
Mushroom corals, Ofu, American Samoa. . . . . . . . . . . . . . . . . . . . . . . . . . . . . . . . . . . . . . . . . . . . . . . . . . . . . . . . . . . . . . . . . . . . . . . . . . . . . . . . . . . . . . . . . . . . . . . . . . . . . . . . . . . . . . . . . . . . . . 38
Figure 11
Blue corals, Swains Islands, American Samoa. . . . . . . . . . . . . . . . . . . . . . . . . . . . . . . . . . . . . . . . . . . . . . . . . . . . . . . . . . . . . . . . . . . . . . . . . . . . . . . . . . . . . . . . . . . . . . . . . . . . . . . . . . . . . . . . . . 38
Figure 12
Location of the Rewa and Ba rivers, Viti Levu, Fiji. . . . . . . . . . . . . . . . . . . . . . . . . . . . . . . . . . . . . . . . . . . . . . . . . . . . . . . . . . . . . . . . . . . . . . . . . . . . . . . . . . . . . . . . . . . . . . . . . . . . . . . . . . . . . . 42
Figure 13
Satellite image of the Rewa River and delta. . . . . . . . . . . . . . . . . . . . . . . . . . . . . . . . . . . . . . . . . . . . . . . . . . . . . . . . . . . . . . . . . . . . . . . . . . . . . . . . . . . . . . . . . . . . . . . . . . . . . . . . . . . . . . . . . . . . 43
Figure 14
Satellite image of the Ba River and delta. . . . . . . . . . . . . . . . . . . . . . . . . . . . . . . . . . . . . . . . . . . . . . . . . . . . . . . . . . . . . . . . . . . . . . . . . . . . . . . . . . . . . . . . . . . . . . . . . . . . . . . . . . . . . . . . . . . . . . . 43
Figure 15
Causal chain diagram for the issue modification of stream flow in Rewa and Ba river basins. . . . . . . . . . . . . . . . . . . . . . . . . . . . . . . . . . . . . . . . . . . . . . . . . . . . . . . . . . . . . . . . . . . 44
Figure 16
Satellite image of part of Tarawa Atoll, Kiribati . . . . . . . . . . . . . . . . . . . . . . . . . . . . . . . . . . . . . . . . . . . . . . . . . . . . . . . . . . . . . . . . . . . . . . . . . . . . . . . . . . . . . . . . . . . . . . . . . . . . . . . . . . . . . . . . 45
Figure 17
Annual rainfall, Tarawa Atoll and hypothetical water demand, 1947-1998. . . . . . . . . . . . . . . . . . . . . . . . . . . . . . . . . . . . . . . . . . . . . . . . . . . . . . . . . . . . . . . . . . . . . . . . . . . . . . . . . . . . . 46
Figure 18
Causal chain diagram for the issue changes in water table in Bonriki freshwater lens. . . . . . . . . . . . . . . . . . . . . . . . . . . . . . . . . . . . . . . . . . . . . . . . . . . . . . . . . . . . . . . . . . . . . . . . . . 47
Figure 19
Fiji Islands. . . . . . . . . . . . . . . . . . . . . . . . . . . . . . . . . . . . . . . . . . . . . . . . . . . . . . . . . . . . . . . . . . . . . . . . . . . . . . . . . . . . . . . . . . . . . . . . . . . . . . . . . . . . . . . . . . . . . . . . . . . . . . . . . . . . . . . . . . . . . . . . . . . . . 48
Figure 20
Causal chain diagram for the issue overexploitation of living resources. . . . . . . . . . . . . . . . . . . . . . . . . . . . . . . . . . . . . . . . . . . . . . . . . . . . . . . . . . . . . . . . . . . . . . . . . . . . . . . . . . . . . . . . 49
Figure 21 Foreign fishing vessels at Suva Harbour, Fiji. . . . . . . . . . . . . . . . . . . . . . . . . . . . . . . . . . . . . . . . . . . . . . . . . . . . . . . . . . . . . . . . . . . . . . . . . . . . . . . . . . . . . . . . . . . . . . . . . . . . . . . . . . . . . . . . . . . . 50
Figure 22
Causal chain diagram for the issue destructuve fishing practices. . . . . . . . . . . . . . . . . . . . . . . . . . . . . . . . . . . . . . . . . . . . . . . . . . . . . . . . . . . . . . . . . . . . . . . . . . . . . . . . . . . . . . . . . . . . . . 52
Figure 23
Causal chain diagram for the issue decreased viability of stocks due to pollution and disease. . . . . . . . . . . . . . . . . . . . . . . . . . . . . . . . . . . . . . . . . . . . . . . . . . . . . . . . . . . . . . . . . . 54
List of tables
Table 1
Geographic and economic statistics for the countries and territories of the region. . . . . . . . . . . . . . . . . . . . . . . . . . . . . . . . . . . . . . . . . . . . . . . . . . . . . . . . . . . . . . . . . . . . . . . . . . . . . . 15
Table 2
Summary of results of analysis of fish bone and mollusc shell assemblages in Pacific Island archaeological sites. . . . . . . . . . . . . . . . . . . . . . . . . . . . . . . . . . . . . . . . . . . . . . 18
Table 3
Strategic Action Plan to address environmental concerns in Pacific Islands countries.. . . . . . . . . . . . . . . . . . . . . . . . . . . . . . . . . . . . . . . . . . . . . . . . . . . . . . . . . . . . . . . . . . . . . . . . . . . 21
Table 4
Scoring table for the Pacific Islands region. . . . . . . . . . . . . . . . . . . . . . . . . . . . . . . . . . . . . . . . . . . . . . . . . . . . . . . . . . . . . . . . . . . . . . . . . . . . . . . . . . . . . . . . . . . . . . . . . . . . . . . . . . . . . . . . . . . . . 22
Table 5
Summary of water resources and water supplies in selected countries.. . . . . . . . . . . . . . . . . . . . . . . . . . . . . . . . . . . . . . . . . . . . . . . . . . . . . . . . . . . . . . . . . . . . . . . . . . . . . . . . . . . . . . . . . 23
Table 6
Characteristics of solid waste in selected countries in the Pacific Islands region, 1990-1994. . . . . . . . . . . . . . . . . . . . . . . . . . . . . . . . . . . . . . . . . . . . . . . . . . . . . . . . . . . . . . . . . . . . 25
Table 7
Fish poisoning statistics for Pacific Island countries, 1992 (not segregated into ciguatera and other forms of poisoning). . . . . . . . . . . . . . . . . . . . . . . . . . . . . . . . . . . . . . . 28
Table 8
World War II wrecks known from Pacific Islands, by Exclusive Economic Zone. . . . . . . . . . . . . . . . . . . . . . . . . . . . . . . . . . . . . . . . . . . . . . . . . . . . . . . . . . . . . . . . . . . . . . . . . . . . . . . . . . . 31
Table 9
Number of licenses, middlemen, total crew and vessels in Fiji 1995 and 1996. . . . . . . . . . . . . . . . . . . . . . . . . . . . . . . . . . . . . . . . . . . . . . . . . . . . . . . . . . . . . . . . . . . . . . . . . . . . . . . . . . . 51
Table 10
Plants used as fish poisons in the Pacific Islands region. . . . . . . . . . . . . . . . . . . . . . . . . . . . . . . . . . . . . . . . . . . . . . . . . . . . . . . . . . . . . . . . . . . . . . . . . . . . . . . . . . . . . . . . . . . . . . . . . . . . . . . . 53
ABBREVIATIONS AND ACRONYMS
13
Regional defi nition
This section describes the boundaries and the main physical and
Boundaries of the Pacific
socio-economic characteristics of the region in order to defi ne the
Islands region
area considered in the regional GIWA assessment and to provide
suffi
cient background information to establish the context within
The geographical focus of GIWA region 62 the Pacifi c Islands
which the assessment was conducted.
region (Figure 1) includes all of the island nations or territories of
the tropical Pacifi c Ocean that are considered part of the "cultural
areas" of Melanesia, Polynesia and Micronesia (Table 1). The Pacifi c
Elevation/
GIWA region
Depth (m)
Disputed areas
1 000
Hawaii
500
Northern
100
Mariana
0
Islands
M i c r o n e s i a
-50
Guam
-200
Marshall Islands (US)
Kingman
-1 000
Palau
Federated states of Micronesia
Reef (US)
-2 000
Howland
Indonesia
Islands (US)
Jarvis
Kiribati
Nauru
Islands
(US)
Kiribati
Papua New Guinea
Kiribati
P o l y n e s i a
Tuvalu
Tokelau
Solomon Islands
Cook
M e l a n e s i a
Wallis
Islands
and SamoaAmerican
Futuna
Samoa
Vanuatu
Fiji
French Polynesia
Tonga Niue
New Caledonia
Australia
Pitcairn Islands
New Zealand
0
2 000 Kilometres
ę GIWA 2004
Figure 1
Boundaries of the region.
14
GIWA REGIONAL ASSESSMENT 62 PACIFIC ISLANDS
Table 1
Geographic and economic statistics for the countries
Physical characteristics
and territories of the region.
Land
Population
Annual
GDP per
Total GDP
Island types
Country
area
Population
density
growth
capita
(USD)
(km2)
(per km3)
rate (%)
(USD)
Within region 62, there is a great diversity of island types and
American
199
70 260
353
2.22
500 000
8 000
corresponding terrestrial, freshwater and marine ecosystem and
Samoa
habitat diversity:
Cook Islands
240
21008
88
1.1
105 000
5 000
Geologically-ancient continental islands composed of sedimentary,
Federated
States of
702
108 143
154
0.04
277 000
2 000
metamorphic, and igneous rocks of continental origin, such as
Micronesia
Papua New Guinea and New Caledonia;
Fiji
18 270
868 531
48
1.41
4 800 000
5 600
Older volcanic islands, such as most of the islands of Fiji, Vanuatu,
French
4 167
262 125
63
1.62
1 300 000
5 000
Solomon Islands, the eastern islands of Papua New Guinea (e.g.
Polynesia
Manus, New Britain, and Bougainville), Guam, and the Northern
Guam
549
163 941
299
1.89
3 200 000
21 000
Marianas;
Kiribati
811
98 549
122
2.26
79 000
800
Recent high basaltic volcanic "hot spot" islands, such as the
Marshall
181
56 429
311
2.3
115 000
1 600
Islands
Samoan archipelago, the Cook Islands, Tahiti in French Polynesia,
Nauru
21
12 570
599
1.9
60 000
5 000
and Pohnpei and Kosrae in the Federated States of Micronesia;
Niue
260
2 145
8
0.01
7 600
3 600
Raised limestone islands, such as Nauru, Niue, most of the Tonga
Northern
and Palau groups, and Aniwa in Vanuatu;
477
80 006
168
3.37
900 000
12 500
Mariana Is.
Low-lying coral-limestone islands, such as most of the true atolls
New
19 060
210 798
11
1.38
3 000 000
14 000
Caledonia
and islands that have no lagoons in the Marshall Islands, Kiribati,
Palau
458
19 717
43
1.54
174 000
9 000
Tuvalu, Tokelau and the Tuamotus in French Polynesia. Each has its
Papua New
own characteristic biota and ethno-biological traditions.
462 840
5 295 816
11
2.34
10 860 000
2 100
Guinea
Pitcairn
47
47
1
ND
ND
ND
There is also great geographic, demographic and developmental
Samoa
2 944
178 173
61
-0.27
1 000 000
5 600
diversity (Table 1). Some "groups" or countries like Guam, Nauru
Solomon
28 450
509 190
18
2.83
800 000
1 700
and Niue, consist of one single small island. Some like Fiji, Tonga
Islands
and French Polynesia are comprised of numerous large and small
Tokelau
10
1 418
142
0.01
1 500
1 000
highly dispersed islands. Others like Papua New Guinea (PNG) and
Tonga
748
108 141
145
1.9
236 000
2 200
West Papua (Irian Jaya) consist of parts of very large, high continental
Tuvalu
26
11 305
435
1.42
12 200
1 100
islands, plus countless off shore large and small islands. The total land
Vanuatu
12 200
199 414
16
1.61
563 000
2 900
areas vary from 12 to 26 km2 for groups of low-lying coral-limestone
Wallis and
274
15 734
57
1.3
30 000
2 000
islands like Tokelau and Tuvalu, to over 400 000 km2 for the continental
Futuna
Note: ND = No Data.
island areas of Irian Jaya and Papua New Guinea. Great diff erences
(Source: Dalzell et al. 1996, CIA World Factbook 2003)
in climate, geological resources, topographical features, soil types,
mineral and water availability, extent of coral reefs and diversity of
Islands region, as considered here, lies between 130░ E and 125░ W
terrestrial, freshwater and marine fl ora and fauna are also found in
and includes all associated off shore and ocean areas. The western
the area.
boundary of the region is West Papua (Irian Jaya) the western half of
the island of New Guinea, which is part of Indonesia, but geologically,
Climate
biogeographically and culturally related to Melanesia, and the off shore
The average annual rainfall in the region varies from just over 1 000 mm
islands of Papua New Guinea the northeastern half of New Guinea. The
in New Caledonia to 5 000 mm in Pohnpei and Kosrae States in the
eastern boundary is demarcated by Pitcairn Island and its Exclusive
Federated States of Micronesia (FSM). Rainfall can vary dramatically
Economic Zone (EEZ). Adjacent to the region are the Hawaiian
on large islands (such as on Viti Levu Island of Fiji, with 3 200 mm in
Archipelago , New Zealand, Australia, Torres Strait Islands and southern
the east, and 1 900 mm in the west), between diff erent islands in the
Papua New Guinea.
same archipelago, and annually (e.g. the atolls of Kiribati, which may
experience prolonged droughts). These variations in rainfall lead to
REGIONAL DEFINITION
15
445 797
variations in coastal productivity, with the highest being found in the
Nearly all of the Pacifi c Islands region falls within the tropics, and sea
lagoons and embayments of high islands (Dalzell et al. 1996).
surface temperatures rarely fall below 20░C, and may rise as high as 30░C
at times; shallow waters of lagoons and fringing reefs may reach higher
Climatic seasonality is more pronounced in the higher latitudes, but
temperatures, up to 38░C during low tides (South, pers. obs.).
even in the equatorial area seasonal diff erences occur, such as changes
in prevailing winds and rainfall. For most of the year, the region is
Coastal biota
infl uenced by the Southeast Trade winds, but for 4 to 5 months during
The coastal biota are characterised by coral reefs, seagrass meadows
the northern winter, by the Northwest Monsoon (Dalzell et al. 1996).
and mangrove forests. The biodiversity of these habitats diminishes
from west to east, since the centre of species biodiversity is in the Indo-
Large-scale climatic events such as cyclones occur regularly in
West Pacifi c region, which borders on the western and northwestern
the western tropical Pacifi c, and up to 18 per year may form in the
boundary of the Pacifi c Islands region. National and international
northwest Pacifi c. South of the Equator they occur from December to
protected areas in the Pacifi c Islands region are shown in Figure 2.
April, and average four per year (Wauthy 1986). The El Ni˝o Southern
Oscillation (ENSO) has a profound infl uence on the coastal and marine
Coral reefs
environments of the Pacifi c Islands (Dalzell et al. 1996). The southern
The corals and coral reefs of the Pacifi c Islands are described in Wells and
oscillation index is a measure of the atmospheric pressure diff erence
Jenkins (1988) and Spalding et al. (2001). The status of Pacifi c Island reefs
between Darwin (Australia) and Tahiti (French Polynesia), which
is reported in Wilkinson (1998, 2000, 2002). In Melanesia, biodiversity
is positive in normal years. During an ENSO episode this gradient
is high and diminishes towards the east. The reefs of New Caledonia
reverses, with a resulting shift in climatic and oceanic conditions.
and Fiji are the best studied, but there remain vast areas of unexplored
Important eff ects are unseasonable droughts in the western Pacifi c,
reefs (Spalding et al. 2001). The majority of Melanesian reefs are under
and unseasonable rains in the central and eastern Pacifi c. There is
traditional stewardship and the reefs serve as important sources of food
strong evidence that ENSO events can have both positive and negative
for subsistence fi shers. Attempts to establish marine protected areas
impacts on the pelagic fi shery, with stocks of migratory species such as
(MPAs) in Melanesia have had limited success, although the rights of
Skipjack and Yellow fi n tuna shifting eastwards during an ENSO episode.
villagers to manage their own near-shore resources are now widely
The increasing occurrence of cyclones and ENSO events in recent years
recognised, leading to co-management regimes.
may be evidence of the impact of global change on the Pacifi c Islands
region, although recent paleoclimatic analyses of corals indicate that
In Micronesia, reefs are well developed, except on coastlines aff ected
ENSO events have been more frequent in the past.
by active volcanism. Palau lies closest to the centre of reef diversity in
the Indo-Pacifi c region; as in Melanesia, species biodiversity declines
Hydrological characteristics
eastwards. According to Spalding et al. (2001), there are considerable
Wauthy (1986) has summarised the hydrological characteristics of South
diff erences in the state of Micronesian reefs and, for those under the
Pacifi c marine environments. The surface waters of the tropical west
control of the United States, the impacts of humans are most marked.
and central Pacifi c enter into the trans-Pacifi c inter-tropical circulation
A breakdown of traditional systems has occurred in most countries
from the eastern boundaries of two sub-tropical anticyclonic gyres. The
following the shift from traditional village life to an urban lifestyle,
surface waters are isolated from deeper layers by a well established
and the impact of military activities has been critical, especially in
thermocline and, as they move from east to west, they grow warmer
those areas of the Marshall Islands used for intensive nuclear testing
and more nutrient defi cient. This leads to very clear blue oceanic water,
in the 1940s and 1950s. Away from areas of human impact, however, a
where average primary production ranges from 20 to 50 gC/m2/year
large number of reefs remain in good to excellent condition. Polynesia
(FAO 1972). Upwelling can enrich these impoverished waters, and a
comprises an enormous region of widely scattered islands from Wallis
shallowing of the thermocline allows nutrients to reach the euphotic
and Futuna to Hawaii (not included in this report) to French Polynesia
zone at the edges of the equatorial counter-currents. Nutrient input
and, to the south, Tonga. According to Spalding et al. (2001), Polynesia
from precipitation and run-off is possible only in the waters surrounding
includes 11 000 km2 of coral reefs, with every kind of island and reef
the large island archipelagos of Melanesia. The highest primary
type represented.
production in the region ranges from 90 to 180 gC/m2/year on the
shelf area of the Gulf of Papua, which receives much of the drainage
Traditional utilisation and management of reefs has been lost in many
from the PNG highlands region (Dalzell et al. 1996).
of the islands, following the breakdown of traditional lifestyles and
16
GIWA REGIONAL ASSESSMENT 62 PACIFIC ISLANDS


Area (ha)
200 000
150 000
100 000
50 000
0
US Minor Islands
Tuvalu
Tonga
Northern
Solomon Islands
Mariana
Islands
Samoa
Papua New Guinea
Palau
Lake Ngardok, Ramsar
Northern
t
r
y
n
Mariana Islands
Guam
u
Marshall Islands (US)
Niue
Co
Kingman
New Caledonia
Federated states of Micronesia
Reef (US)
Palau
Kiribati
Howland
Islands (US)
Guam
Jarvis
French Polynesia
Indonesia
Kiribati
Nauru
Islands
Fiji
(US)
Kiribati
Papua New Guinea
Cook Islands
Kiribati
Tuvalu
American Samoa
Tokelau
Cook
Solomon Islands
Islands
Wallis
and Samoa
East Rennell, World
American
Fiji
Heritage Convention
Futuna
Samoa
Vanuatu
French Polynesia
Henderson Island, World
Tonga
International protected areas (4)
Niue
Heritage Convention
Atoll de Taiaro, UNESO-MAB
National protected areas (100)
New Caledonia
Biosphere Reserves
Pitcairn Islands
Area and IUCN categories
III Natural
Monument
VI Managed Resource Protected Area
II National
Park
V Protected
Landscape/Seascape
Ia Strict Nature Reserve
IV Habitat/Species Management Area
Number of protected areas
ę GIWA 2004
Figure 2
National and international protected areas in the Pacifi c Islands region with a marine component, categorised according to
IUCN. The diagram shows the area, the number and the category of the protected area within each country.
(Source: UNEP-WCMC 2003)
the controls previously imposed through traditional systems. This has
natural eastern-most limit in American Samoa. Mangroves are absent
led to problems of overexploitation and pollution, although these are
from Wallis and Futuna, Tokelau and the Phoenix and Line Islands
highly localised and there are vast areas of reefs that are in very good
(Kiribati).
condition. Marine protected areas are few, but the oldest in the Pacifi c,
Palolo Deep National Marine Reserve, was established in 1974 in Apia,
Seagrasses
Samoa (Skelton 2000).
Seagrasses are common throughout much of the Pacifi c Islands region
(Wells & Jenkins 1988). They stabilise sediments and contribute to the
Sulu et al. (2002) state that the coral reefs of the southwest Pacifi c are
detrital cycle of shallow lagoons. They are an important habitat for
generally in good condition, but continue to degrade as a result of
a number of commercially important species, and provide food for
human pressures, and because of two widespread coral bleaching
dugongs and turtles. The seagrass beds of Fiji are an important foraging
events in 2000 and 2002. In 2000, coral mortality in Fiji reached 40%
area for sea turtles.
(Sulu et al. 2002).
Mangroves
Mangrove forests are prevalent in estuarine areas of the high islands of
Socio-economic characteristics
the region, but poorly developed or scarce on atolls. Scott (1993) has
prepared a directory of Pacifi c Island wetlands, while their distribution
The Pacifi c Islands have been inhabited for approximately 3 500 years
and ecology are reported in Woodroff e (1987). Traditional cultures have
(Fiji) and for approximately 2 500 years or less in Polynesian countries
utilised mangroves for generations for fi rewood and construction, and
(e.g. Samoa). Colonisation extends back no more than 200 years.
have long recognised the importance of mangroves as nurseries for
Habitat and community modifi cation were signifi cant in pre-colonial
crustaceans and some lagoon fi shes. Mangrove species biodiversity
times, since Pacifi c cultures practiced agriculture and strongly modifi ed
declines from west to east and the most extensive mangrove habitats
their environment in order to establish their gardens. A percentage of
are found in Papua New Guinea, Solomon Islands and Fiji, with the
the environment was, therefore, already altered prior to the arrival of
REGIONAL DEFINITION
17
European colonists. There is evidence to suggest, however, that the
islands, over 200 for 3 islands, and 421 for Koror in Palau, 757 for Funafuti
relatively small populations had a lesser impact on coral reefs and
in Tuvalu, 1 179 for Majuro in the Marshall Islands, and 2 190 for Tarawa
lagoons, even though there is evidence that some of the stocks of
in Kiribati. The estimated population for Betio Islet of Tarawa Atoll was
fi shes and invertebrates had been overfi shed prior to European contact
40 000 in the year 2000, which gives it a population density rivalling
(Table 2). The present day situation with regard to habitat modifi cation
those of Hong Kong and Singapore. If we consider Ebeye, one of some
and destruction is a result of approximately 200 years of impact by
90 islets comprising Kwajalein Atoll in the Marshall Islands, to which
human populations, added to that already conducted by indigenous
people were relocated by the U.S. military to free the atoll's lagoon
peoples pre-contact. These impacts include deforestation, depletion
for intercontinental ballistic missile testing, the population density
of fi sh stocks, destruction of habitats (especially mangroves and other
increases to over 25 000 per km2!
vulnerable coastal ecosystems) through urbanisation, industry and
infrastructure development, waste disposal, pollution, mining, and
There are three racial and sub-cultural groupings, which are referred
agriculture. Freshwater catchments are almost completely impacted
to as Melanesia, Micronesia and Polynesia (Figure 1). The Melanesian
by human activities and are no longer in their natural state, and
islands are all relatively large archipelagos and include Papua New
areas of pristine forest and other habitats are becoming scarce.
Guinea, Solomon Islands, Vanuatu and New Caledonia, with Fiji lying
Government policies, whether those of the colonists or of the current
half way between Melanesia to the west and the Polynesian islands
regimes following independence, have played a key role leading to
of the central Pacifi c. Polynesia includes American Samoa, the Cook
the current situation.
Islands, French Polynesia, Niue, Pitcairn, Tokelau, Tonga, Tuvalu, Wallis
and Futuna and Samoa. Micronesia lies mainly close to or north of the
Population
equator, and includes the Federated States of Micronesia (Yap, Chuuk,
The current population of the region is approximately 8.3 million (CIA
Pohnpei and Kosrae), the Northern Mariana Islands, Guam, Marshall
World Factbook 2003), and Papua New Guinea accounts for more than
Islands, Nauru, Palau and Kiribati.
63%. Population densities range from just over 8 persons per km2 for
Niue to 599 persons per km2 for Nauru. If the "most populous islands"
The three cultural groups have distinctive traditions and lifestyles
are considered, the fi gures rise to over 100 persons per km2 for four
that have prevailed to varying degrees to modern times. They have
Table 2
Summary of results of analysis of fi sh bone and mollusc shell assemblages in Pacifi c Island archaeological sites.
Time period
Location
Comments
Source
(years ago)
Matenkupum
Earliest evidence of human capture of marine fish in world. Site contains bones and shell fragments of reef fish and molluscs. Capture
32 0000
Allen et al. 1989
(New Ireland, Papua New Guinea)
probably by reef gleaning, stone fish traps or weirs, and with spears.
Initial heavy exploitation of bivalve molluscs (Anadara spp. and Gafrarium spp.) by early colonisers, followed by decline in
Tongatapu
3 500-2 000
Anadara spp. due to a combination of fishing pressure and environmental effects. Mortality curves for Gafrarium reflect increasing
Spennemann 1987
(Tonga)
fishing pressure on population with decrease in average size (and age) in population.
Mangaia
Significant increase in frequency of molluscan remains at about 500 years ago. Average size of gastropod Turbo setosus decreased by
Kirch et al. 1995,
980-330
(Cook Islands)
50% between the earliest layers in the sequence and those in later years.
Butler 1993
Tikopia
Ark shells and other gastropods are major source of animal protein during initial period of colonisation. Mollusc populations reduced
2 900-200
Kirch & Yen 1982
(Solomon Islands)
through fishing and environmental change, followed by diversification of food base through agriculture.
Pari
Gastropod and bivalve molluscs in shell middens reflect exploitation pressure with shift through time, with decrease in average size
2 000-Present
Swadling 1977
(southeast Papua New Guinea)
(and age) in population.
Mussau
Composition of fish bone assemblages with time remains relatively constant, with landings dominated chiefly by lethrinids, scarids
3 500-350
Kirch et al. 1991
(northern Papua New Guinea)
and serranids.
Santa Cruz Islands
Gastropod and bivalve molluscs in shell middens reflect exploitation pressure with shift through time, with decrease in average size
3 200-2 600
Swadling 1986
(Solomon Islands)
(and age) in population.
Niutoputapu
Fish bone assemblages from excavations show long-term exploitation of reef and lagoon species, similar to contemporary fishing
Kirch & Dye 1979,
2 800-200
(Tonga)
patterns.
Kirch 1988
Kapingamarangi and Nukuoro
Fish bone assemblages reflect importance of reef and lagoon fish as staple animal protein, despite cultural importance of pelagic fish
1 050-500
Leach & Davidson 1988
(Caroline Islands)
such as rainbow runner (Elegatis bipinnulatis).
Change in shell hook manufacture from pearl oyster shell (Pinctada margaritifera) to turban shell (Turbo setosus) with time due to
Aitutaki
2 000-1 000
breakdown in inter-island communication and trade. Reliance on more fragile Turbo hooks reflected in greater exploitation of smaller Allen 1992
(Cook Islands)
lagoon fishes .
Palau
1 300-100
Fish bone assemblages suggest continuity in reef fish composition and fishing practices during pre-contact period.
Masse 1986
Mussau (Papua New Guinea) Main
Comparison of fish bone assemblages suggests greater reliance on line fishing for reef carnivores in West Pacific compared to net and
reef Is & Tikopia, (Solomon Islands)
3 500-350
spear fishing for reef herbivores/omnivores in East. Differences may possibly reflect greater fishing pressure in east with reduction of Butler 1994
Lakeba (Fiji) Niutoputapu (Tonga)
reef carnivore populations.
(Source: adopted from Dalzell & Adams 1996)
18
GIWA REGIONAL ASSESSMENT 62 PACIFIC ISLANDS
in common chiefl y systems (mostly patriarchal, but some matriarchal),
smallest nations, well below 500 USD per capita per year (Table 1).
customary ownership of land, coast and resources, and complex social
Those with the highest GDP are states still under colonial rule, such
structures within communities. In the post-colonial era, migration, rapid
as French Polynesia and Guam. The countries are also separated from
population growth, urbanisation and urban drift, the introduction of
one another by vast areas of deep ocean, resulting in isolation and high
western culture and religions, the adoption of westernised governance
transportation costs. In addition, natural disasters such as cyclones,
and legal systems, and the introduction of the cash economy, have
fl oods, tsunamis and droughts plague many of the countries, and these
substantially eroded many of these traditions. There has been a
problems are exacerbated by global problems of climate change and
substantial loss of traditional knowledge, and many of the customary
sea level rise. These phenomena threaten entire countries such as the
systems that were in place and resulted in conservation of resources
low-lying atolls countries of Kiribati and Tuvalu, and the largely coastal
have been severely compromised (South et al. 1994). There is, however,
populations of the high islands (South & Veitayaki 1999).
a growing recognition of the value of traditional systems and the
realisation that these are best used together with modern systems of
In terms of current level of development and potential for modern
resource management in a co-management environment (Veitayaki in
economic development, although some of the larger island groups
South et al. 1994).
with signifi cant mineral, forestry, fi sheries and agricultural land
resources have some potential, most Pacifi c Island states and territories
Economy
and smaller outer islands and isolated rural communities do not.
The Pacifi c Island states and territories are among the poorest nations,
Because of their small size, geographic isolation and extremely limited
and are strongly dependent on their renewable and non-renewable
natural resources the options for modern economic development are
resources for their economic survival. The cash economy has become
extremely limited. Consequently, most island countries, territories and
a major driving force: populations' desire living standards and lifestyles
local communities will, for the foreseeable future, have to depend on
comparable to those they learn about from developed nations, yet,
the sustainable use of their local resources as a basis for their survival
with the exception of a privileged few, they do not have the resources
and development. In this respect, it is stressed that the Pacifi c Island
to bring this about. Modern technology is brought into these countries
region is unique in that most of the islands of the region are inhabited
through many diff erent programmes, but oftentimes the technology is
by indigenous peoples that have close links with, and great cultural,
inappropriate for small islands. The island states are overwhelmed by the
economic and spiritual dependence on, their island terrestrial and
possibility that global change can result in a total loss of their territories
marine environment. In most cases, these indigenous people are the
(such as atoll states like Tuvalu and Kiribati); they have become eff ective
owners and users of these resources and ultimately control decisions
global advocates of the importance of mitigating against those factors
related to their conservation and sustainable use. This situation
that are causing climate change and sea-level rise.
contrasts with other archipelagic regions of the world, such as those in
the Indian Ocean and the Caribbean Sea, and continental areas where
Many Pacifi c Island cultures maintain much of their traditional lifestyles
there is more private or public land.
and value their traditions, yet they are affl
icted by many of the same
problems as other parts of the world, such as an alarming increase in
The South Pacifi c is one of the most heavily aid-assisted regions
the rate of HIV infections and sexually transmitted diseases, and by non-
in the world (Fairbairn 1994) with an estimated annual total of
communicable lifestyle diseases such as diabetes mellitus. Religion has
1 100 million USD, or 170 USD per capita per year (1990 estimate).
a major infl uence on the lives of Pacifi c peoples, and the church can
Approximately 90% of the aid is bi-lateral with Australia, France, Japan,
be very eff ective in helping to deal with community-driven concerns.
the European Community and the United States of America contributing
Yet religion and cultural traditions have also proved to be obstacles
the greatest proportion. With decolonisation and shifting allegiances
in areas such as birth control and awareness raising about HIV, since
of some of the newly independent states from their previous colonial
human sexual issues may not be discussed either within the family or
masters, links are being strengthened with Asia and increasing amounts
within the community, leading to ignorance, early pregnancies and
of aid is being provided from Japan, the People's Republic of China,
high birth rates.
Korea and Taiwan. In addition, private sector investments from the
Association of Southeast Asian Nation (ASEAN) countries, particularly
Apart from Papua New Guinea, the most far-reaching constraint on
Malaysia, are changing the face of the consumer and investments
development in the region is the small size of the countries, and their
markets in the region (South & Veitayaki 1999).
remoteness from the main trading centres. GDP is very low for the
REGIONAL DEFINITION
19
Environmental issues are now recognised as critical in the promotion
especially women and youth, and decision making and planning may
of sustainable growth and an improved quality of life. As stated by
take place without reference to those who are among the most
South and Veitayaki (1999): "Pacifi c Island environments are fragile
important providers of food for their families. Traditional marine tenure
and highly vulnerable. There is a need to incorporate integrated
has also been a factor in the potential for the development of Marine
environmental principles in planning at all levels, specifi cally related
Protected Areas (MPAs) in some countries, and was discussed in detail
to the forestry, mineral resources, agricultural and fi shery sectors, but
in South et al. (1994). Where the initiatives come from the communities
equally importantly in urban planning, waste disposal and the tourism
themselves, progress is likely to be made in this area. One trigger to
industry."
the realisation by communities of the need for MPAs is when fi sh and
invertebrate stocks are seriously depleted. Fiji's Locally Managed Marine
Government and policies
Area (FLMMA) project is an excellent example of how progress is likely
Economic issues often override environmental concerns in government
to be made (Tawake 2004).
planning and policies. There is a trend towards recognition of the need
for more integrated planning, to comply with global conventions and
Politically, the South Pacifi c Island countries and territories are all
agreements through the development of appropriate national laws and
members of the South Pacifi c Conference that was fi rst convened in
regulations, and a number of Pacifi c Island countries have drafted or
1947, and which includes the governments of New Zealand, Australia
have even enacted (e.g. in Cook Islands) new environmental laws and
and the United States (Dalzell et al. 1996, South & Veitayaki 1999).
policies which recognise these needs (e.g. the Fiji Government's draft
Fourteen independent states, with the addition of New Zealand and
Sustainable Development Bill).
Australia, are members of the South Pacifi c Forum, established in 1971
and headquartered in Suva, Fiji.
These are, however, the exceptions: the sustainability ethic is widely
spoken about, but in reality, it is an almost unachievable goal given the
Organisationally, the South Pacifi c region has been frequently used
fi nancial and socio-economic constraints under which governments
as a model within the Regional Seas programme. South and Veitayaki
have to work. Small populations, inadequate funding, lack of the
(1999) provided a detailed review of regional approaches to workable
necessary human resources and lack of political will are all contributing
arrangements in the context of global initiatives in the South Pacifi c. Inter-
to the current situation that is leading to more and more unregulated
governmental bodies oversee regional programmes on a sectoral basis:
destruction and modifi cation of habitats and ecosystems in the Pacifi c
Forum
Fisheries
Agency:
oceanic
fi
sheries;
Islands. There is also a long-standing dependency on donors (who are
Secretariat for the Pacifi c Community: coastal fi sheries and socio-
often the same countries that were once colonial governors), and donor
economic programmes;
policies have in themselves been strong external root causes. There has
South Pacifi
c Applied Geoscience Commission: non-living
also been, regrettably, a culture of corruption in some countries where
resources; boundary delimitation;
government or private sector leaders have compromised standards or
South Pacifi c Regional Environment Programme: environmental
ethics in return for under the table deals with outsiders willing to fund
issues;
major developments. In some cases, such as the enormous mahogany
Regional
Seas
Programme.
resources in Fiji, disagreements between land owners, government
and private industry have led to signifi cant unrest, and were one of the
These inter-governmental agencies use a consensus approach to
factors leading to the 2000 coup in Fiji.
decision making (often referred to as the "Pacifi c Way"). As a result of
colonisation, countries in the region have adopted legal systems based
At the community level, traditional systems are breaking down with
on those of the British, French or United States; as a result, there is a
the change to the cash economy, urbanisation and the desire of
lack of uniformity among legal systems within the region. Heathcote
the people to have a lifestyle comparable to that they witness daily
(1997) addresses the resulting problems experienced under Maritime
through the media. This desire percolates throughout society to the
Law in Forum countries, and has recommended ways of standardising
government level, where ministers of even the smallest countries
law in at least this sector. Traditional law also applies in some countries,
aspire to the trappings of ministers in developed countries. This has
and in Samoa, for example, a system of village rules governing fi sheries
led to a considerable degree of corruption in some countries, and the
management has been established (Fa'asili & King 1997). In Fiji, there
breakdown of society and the economy such as happened recently in
are moves to legally recognise the qoliqoli (fi shing area) owners and
the Solomon Islands. Some segments of society remain disenfranchised,
customary owners of foreshore areas (Aqorau 2003).
20
GIWA REGIONAL ASSESSMENT 62 PACIFIC ISLANDS
Legal framework and conventions
Table 3
Strategic Action Plan to address environmental
concerns in Pacifi c Islands countries.
International Waters Strategic Action Programme
To achieve global benefit by developing and implementing measures to conserve,
The Strategic Action Programme for the International Waters of the
Goal
sustainably manage and restore coastal and oceanic resources in the Pacific Region
(Integrated sustainable development and management of International Waters)
Pacifi c Small Island Developing States was developed through an
Degradation of water quality:
extensive consultative review (SPREP 2001a). This review comprised
Priority concerns - Degradation of associated critical habitats
- Unsustainable use of resources
national committees and formation of a regional task force, whose
Pollution from land-based activities:
ultimate task was to prepare documentation for SPREP's (South Pacifi c
Imminent
- Modification of critical habitats
threats
- Unsustainable exploitation of resources
Regional Environment Programme) International Waters Project,
Management deficiencies
which commenced in 2001. The International Waters (IW) Project is
Ultimate root
- Governance
- Understanding
tackling specifi c issues within the Strategic Action Plan, and a total of
- Integrated coastal and watershed management
14 demonstration projects are under development throughout the
Solutions
- Oceanic fisheries management
region. Policy issues are paramount in the International Waters Strategic
- Improved waste management
Activity areas
- Better water quality
Action Plan. Clearly, there would be little to be gained from a repeat of
(coastal)
- Sustainable fisheries
- Effective marine protected areas
this exercise, which is funded by the Global Environment Facility (GEF)
- Sustainable ocean fisheries
and the Australian Government for a total of 20 million USD over fi ve
Activity areas
- Improved national and regional management capability
(oceanic)
- Stock and by-catch monitoring and research
years, when the GIWA budget for the region was 50 000 USD.
- Enhanced national and regional management links
- Management/institutional strengthening
- Capacity building/institutional strengthening
The Strategic Action Plan identifi ed three priority transboundary concerns
Targeted actions
- Awareness/Education
related to international waters: (i) degradation of quality; (ii) degradation
- Research/information for decision making
- Investment
of critical habitats; and (iii) Unsustainable use of living and non-living
(Source: SPREP 2001a)
resources. These concerns closely relate to those identifi ed under GIWA.
SPREP summarised the principal issues needed to address priority
and agreements, such as Agenda 21, Chapter 17 which is concerned
environmental concerns among Pacifi c Island countries (Table 3).
with coastal issues. With respect to the Exclusive Economic Zones (EEZs)
of the Pacifi c Island nations, many agreements and regional initiatives
Pacifi c Islands Regional Ocean Policy
have been agreed to, facilitated by the Forum Fisheries Agency and the
In 2002, the South Pacifi c region approved a Pacifi c Islands Regional
Secretariat of the Pacifi c Community, under their oceanic programme.
Ocean Policy (PIROP). The Ocean Policy was developed on behalf of the
Their most recent and important achievement has been agreement
Forum Secretariat by the Council of Regional Organisations of the Pacifi c
to establish a new commission, charged with management and
(CROP) Marine Sector Working Group. Several members of the GIWA
conservation of highly migratory fi sh stocks such as tuna. In 2003,
Task team were instrumental in the development of PIROP. A Framework
Pacifi c Island representatives attended a meeting sponsored by
for Integrated Strategic Action (ISA) was drafted during the Pacifi c
Environment Australia, to discuss the management and conservation
Islands Regional Ocean Forum (PIROF) held in Suva, Fiji in February 2004,
of biodiversity on the high seas, i.e. those areas of ocean not included
by the more than 200 national, regional and international delegates
within EEZs. Pacifi c Island nations are represented in various ways within
attending the Forum. This is the most recent example of the success of
the United Nations, and through their advocacy have raised the profi le
the regional approach to ocean issues, and will lead to establishment
of issues aff ecting island states globally. Finally, regional universities and
of priorities and actions relating to ocean policy. The PIROP will also
international NGOs have played an increasingly important role in the
provide a general framework to assist national governments in the
Pacifi c Islands, especially at the community level.
development of their own policies.
World Summit on Sustainable Development
The UN framework
At the World Summit on Sustainable Development in Johannesburg
Within the framework of the various UN conventions and agreements
2002, the Pacifi c Islands region proposed a series of Type II Initiatives
to which many of the countries are signatory, many national activities
which address all of the policy issues referred to in this report. These
have been initiated as part of the reporting requirements of such
initiatives identifi ed many partners required for their implementation,
conventions and agreements. In addition, a number of countries
including donors and developed countries. It is to be hoped that these
have created new departments, divisions or ministries, charged with
initiatives will develop to the overall advantage of the region.
overseeing environmental issues, again in response to UN conventions
REGIONAL DEFINITION
21
Assessment
Table 4
Scoring table for the Pacifi c Islands region.
This section presents the results of the assessment of the impacts
Assessment of GIWA concerns and issues according
The arrow indicates the likely
of each of the fi ve predefi ned GIWA concerns i.e. Freshwater
to scoring criteria (see Methodology chapter)
direction of future changes.
T
T
C
C
Increased impact
A
A
shortage, Pollution, Habitat and community modifi cation,
0 No
known
impacts
2 Moderate
impacts
IMP
IMP
T
T
No changes
C
C
A
A
1 Slight
impacts
3 Severe
impacts
Overexploitation of fi sh and other living resources, Global
IMP
IMP
Decreased impact
change, and their constituent issues and the priorities identifi ed
a
c
t
s
i
t
y
n
t
a
l
p
*
*
a
c
t
s
u
during this process. The evaluation of severity of each issue
n
Pacific Islands
p
m
i
c
i
m
m
nme
Score
m
i
m
o
adheres to a set of predefi ned criteria as provided in the chapter
c
t
s
o
c
t
s
r
i
t
y
***
v
i
r
o
n
e
r c
o
a
l
t
h
t
h
erall
r
i
o
En
impa
Ec
He
O
impa
Ov
P
describing the GIWA methodology. In this section, the scoring of
Freshwater shortage
1.7*
2.0
2.0
1.0
1.7
5
GIWA concerns and issues is presented in Table 4. Detailed scoring
Modification of stream flow
1
information is provided in Annex II of this report.
Pollution of existing supplies
2
Changes in the water table
2
Pollution
2.2*
1.0
2.0
1.0
1.7 4
Microbiological pollution
2
T
C
A
Eutrophication
1
Freshwater shortage
IMP
Chemical
2
Suspended solids
2
Solid waste
3
Freshwater shortage is a problem in the Pacifi c Islands, especially among
Thermal 1
the atoll states, and is associated with changes in the hydrological cycle
Radionuclide
3
Spills
1
resulting from global change as well as reductions in stream fl ow,
Habitat and community modification
2.5*
2.0
2.0
2.0
1.9 3
pollution of existing supplies and changes in the water table as a result
Loss of ecosystems
2
of human activities (WHO/UNICEF 2000). A summary of water resources
Modification of ecosystems
3
and supplies in selected countries in provided in Table 5.
Unsustainable exploitation of fish
2.3*
2.0
2.0
2.0
2.2 2
Overexploitation
3
Excessive by-catch and discards
3
Access to potable water is very uneven across the region, ranging from
Destructive fishing practices
2
the lowest percentage in Papua New Guinea (24%) to 100% in Nauru,
Decreased viability of stock
1.5
Niue and Samoa (Table 5) (WHO/UNICEF 2000). Although access may
Impact on biological and genetic diversity
2
Global change
2.6*
3.0
2.0
2.0
2.7 1
be relatively high in some of the atoll countries (Kiribati 76%, Tuvalu
Changes in hydrological cycle
2
95%), the supplies are highly vulnerable to climate (annual and seasonal
Sea level change
3
fl uctuations in the amount of rainfall; El Ni˝o and La Ni˝a eff ects) and
Increased UV-B radiation
1.5
Changes in ocean CO source/sink function
1.5
changes in sea level, leading to salt incursion in freshwater lenses. Only
2
Increase in sea surface temperature
3
a few of the larger high islands (Papua New Guinea, Solomon Islands,
*
This value represents an average weighted score of the environmental issues associated
to the concern. For further details see Detailed scoring tables (Annex II).
Fiji) have signifi cant freshwater bodies (lakes and rivers), but catchments
** This value represents the overall score including environmental, socio-economic and
are poorly managed and subject to erosion because of human activities
likely future impacts. For further details see Detailed scoring tables (Annex II).
*** Priority refers to the ranking of GIWA concerns.
such as forestry, clear cutting, agriculture, horticulture, construction and
22
GIWA REGIONAL ASSESSMENT 62 PACIFIC ISLANDS
Table 5
Summary of water resources and water supplies in
However, the increased water-uptake that has occurred through the
selected countries.
replacement of 60 000 ha of natural grassland with rapidly growing pine
Water supply
Access to safe water
forests for timber has caused a decline in dry season fl ows by 50-60%
Country
Main water resources
coverage
(% of population)*
(% of population)**
which has jeopardised the operation of Monasavu hydroelectric dam
Cook Islands
SW, GW, RW
95
100
(FAO 1987) and resulted in signifi cant drinking water shortages during
Federated States
SW, GW, RW
44
ND
the dry season (Terry & Raj 1998). These declines have been exacerbated
of Micronesia
SW, GW, RW, D
by large-scale climatic fl uctuations, such as El Ni˝o, which, in 1997/1998
Fiji
77
47
(tourist resort only)
resulted in 20-50% less than average rainfall in Fiji causing a drought that
Kiribati
GW, RW, D (limited)
44*
47
aff ected the growth of forests, caused fi res, destroyed 25% of the sugar
RW (from airport catchment
Marshall Islands
and buildings),
82
ND
cane crop and 50% of the vegetable crop and aff ected 263 455 people
GW, D (emergency)
(Kaloumaira 2000). Conversely, in the Rewa River Basin conversion of
D (regular use),
Nauru
100
ND
RW, GW (limited)
natural vegetation for cultivation of cash crops such as vegetables and
Niue
GW, RW
100
100
ginger has resulted in considerable erosion, sedimentation and fl ooding
Palau
SW, GW, RW
86
79
(Anon. 2003). For additional details, see the Causal chain analysis of
Papua New
SW, GW, RW
10**
42
modifi cation of stream fl ow in the Rewa and Ba River basins below.
Guinea
Samoa
SW, GW, RW
50-70*
99
Pollution of existing supplies
Solomon Islands
SW, GW, RW
64
71
There is a notable lack of documentation on the issue of pollution
Tonga
GW, RW
95
100
of surface and groundwater supplies throughout the entire region.
Tuvalu
RW (primary) GW (limited)
85
100
Pollution of existing supplies of freshwater on large high islands with
Vanuatu
SW, GW, RW
87
88
Note: SW = Surface water; GW = Groundwater; RW = Rainwater; D = Desalination; ND = No Data.
relatively large human populations, such as PNG and Fiji, is moderate
(Source: WHO/UNICEF 2000, * Hoegh-Guldberg et al. 2000, ** Lauerman 1997)
but is off set by annual rainfalls that exceed 3 000 mm per year. On
smaller low-lying coral islands, natural supplies are very limited and
mining. Pollution of water supplies is a growing problem especially in
contamination of surface waters by human and animal waste, and by
urban areas or along narrow coastal plains which are impacted by run-
improper disposal of solid wastes, poses a greater threat, even when
off , high levels of sedimentation, mining (Papua New Guinea, Fiji, New
the size of human populations is much smaller. On atolls, where the
Caledonia), herbicides and fertilisers (e.g. sugar-cane growing areas of
main supply of water is from a shallow lens up to 30 m thick, there is a
Fiji), industry, and by a universal lack of proper sewage treatment. The
high risk of bacterial pollution from high-density populations, or from
socio-economic impacts are becoming critical, driven by increasing
salt intrusion during periods of overuse or excessive drawdown of the
population (and higher demand on water supplies), health risks from
supply, such as on Tarawa Atoll in Kiribati.
increasing bacterial levels, inadequate or out-dated water distribution,
treatment and drainage systems, and inadequate planning and
Changes in the water table
management of catchments.
Reduced rates of replenishment and salinisation of groundwater
over regionally signifi cant sub-areas exert moderate impacts on the
Environmental impacts
region. Subterranean lenses of freshwater are the primary sources
Modifi cation of stream fl ow
of drinking water for many inhabitants of small islands, particularly
Owing to the general absence of large catchment areas and major
atolls such as Tarawa in Kiribati. Burgeoning human populations are
freshwater bodies in the Pacifi c Islands region, modifi cation of stream
placing extreme pressure on these limited resources often leading to
fl ow exerts only a slight impact at a regional scale. However, changes in
shortages of drinking water. These problems are often exacerbated by
stream fl ow have occurred in some of the larger catchments, particularly
dysfunctional distribution systems and storage facilities or unreliable
on Fiji where natural changes in the amount of precipitation, coupled
natural replenishment from rainfall. For example, at Tarawa Atoll in
with changes in land use for forestry and agriculture, coastal and
Kiribati, the Bonriki lens supplies 75% of the freshwater available to
urban developments and the construction of dams to generate
35 000 inhabitants (Metai 2002). The lens is able to support a pumping
hydroelectricity have produced considerable fl uctuations in stream
capacity of 1 000 m3/day but if rainfall declines by 25% and the rate
fl ow. For example, the average stream fl ow in the Ba River varies
of water extraction is not adjusted, the thickness of the lens, which is
between 10 m3/s in the dry season and 60 m3/s in the wet season.
normally about 30 m (Falkland 1992), is reduced by 64% (Alan & Falkland,
ASSESSMENT
23
1997). In order to maintain supplies of freshwater to people living on the
Other social and community impacts
island during periods of reduced precipitation, authorities have been
The impacts resulting from the inability to engage in recreational
forced to impose restrictions on water use. In addition, the expansion
activities such as fi shing, and the decline in aesthetic value resulting
of coconut cultivation and excessive pumping by the agricultural sector
from the loss or destruction of coastal habitats such as mangrove forests
has contributed to changes in the level of the water table which has
were considered signifi cant. Migration from rural and coastal regions
allowed saltwater to contaminate groundwater resources in most atoll
to urban areas has changed the traditional patterns of subsistence
countries in the region and in some low-lying coastal areas of many of
fi shing and gardening to those of the cash economy and urban living,
the high islands in Melanesia. For additional details, see the Causal chain
putting pressure on already limited locally produced food supplies, and
analysis of changes in the Bonriki freshwater lens below.
leading to a greater dependence on imported foods. Migration due to
lack of drinking water and relocation of agriculture due to drought or
Socio-economic impacts
coastal salinisation are severe, especially on atolls. In Kiribati, the large
Economic impacts
majority of the residents on Tarawa Atoll (>25 000) have migrated from
The loss of potable water supplies was considered severe in atolls
outer islands.
because of overuse, and salinisation during droughts; and of
increasing severity in coastal areas of larger islands where coastal
Conclusions and future outlook
erosion is impacting the vulnerable coastal plains on which most of the
The fi niteness of water supplies, and their vulnerability to human
population live. The loss of agricultural use was seen as a major impact
impacts, are long-term and will need to be addressed by Pacifi c
in the region, since most Pacifi c Island agriculture occurs on the coastal
Island nations if their quality of life, health and food security are to be
plains, which are increasingly aff ected by seawater fl ooding and erosion
maintained. The prognosis is that the existing problems will continue
during exceptional high tides (Nunn 1990, Terry et al. 2001, 2002). In the
to worsen in the coming years unless appropriate actions are taken.
city of Suva, capital of Fiji, there are increasing disruptions to municipal
There is a need for continued and enhanced awareness-raising among
water supplies, which are, in part, due to failure of old piping systems,
stakeholders and decision-makers on the proper management and
but also because of rapidly increasing population and demand on the
conservation of water supplies and catchments, since bad decisions or
water supply. There is a need for better planning and for the upgrading
mismanagement will only exacerbate the underlying fact that potable
of water supply systems, which are very costly and require aid assistance
water and its availability have long governed, and will continue to
(Members of the GIWA Task team pers. comm.).
govern migration and settlement in the Pacifi c Islands region. Rapidly
increasing populations and urbanisation of the Pacifi c countries, in
Health impacts
combination with global change, will have increasing impacts on
The loss of potable water supplies has caused health impacts in the
water supplies for the indefi nite future. The region's recognition of the
region demonstrated by increasing rates of intestinal and water-borne
challenges facing them in sustainable water management through
disorders such as cholera, dysentery and hepatitis, especially in, but not
their adoption of the Pacifi c Regional Action Plan on Sustainable Water
restricted to, the atoll countries (Tebano 1984, 1992). Most segments of
Management (SOPAC 2002), together with the WSSD Type II Initiative
society are vulnerable, but especially children and elderly people. The
on Sustainable Water Management, off er the region's best chance of
Secretariat for the Pacifi c Community (SPC) maintains a database on
dealing with the immediate and future challenges, but signifi cant
health and related issues (SPC 2003).
resources will be needed to address this and it is not yet clear whether
these resources will be available in the necessary time-frame.
The impacts of long-term nuclear testing in Marshall Islands continue, with
enhanced levels of cancer in those exposed to the radiation; unsafe water
supplies and residual radiation continue to prevent return of residents
T
C
A
to these islands. A chronology of events since the fi rst evacuation from
Pollution
IMP
Bikini Atoll in March 1946 until 1996 is provided in the Republic of the
Marshall Islands (RMI) website (RMI 1996), which also includes a selected
Most forms of pollution are localised and not regional or transboundary
bibliography. In December 1995, the Nuclear Claims Tribunal awarded
in nature. Health risks from microbiological pollution are moderate to
43.2 million USD, nearly its entire fund, to 1 196 claimants for 1 311 illnesses.
severe close to urban and industrial areas, but are low or negligible in
The following year the Tribunal estimated that a further100 million USD in
more remote or unpopulated areas. Eutrophication of lagoonal and
personal injury claims would be needed by 2001.
near-shore habitats is widespread close to all populated areas, as a
24
GIWA REGIONAL ASSESSMENT 62 PACIFIC ISLANDS
result of urban (especially sewage), agricultural and industrial run-off ,
Environmental impacts
or discharges from sugar cane crushing mills (Fiji), and fi sh processing
Microbiological
plants (Fiji, Solomon Islands, American Samoa). Chemical pollution is
In the Suva area (Fiji) coliform bacteria counts well above World Health
largely unregulated and is at extreme levels at some sites (e.g. tri-butyl
Organization (WHO) limits have been recorded over the years and are
tin in the Suva Lagoon, Fiji). Other heavy metals and toxic discharges
likely to have also occurred in other urbanised areas throughout the
are associated with mining (Papua New Guinea, New Caledonia, Fiji)
region, although data are lacking in many instances. It is interesting
and industries such as paint or battery manufacturing (Fiji). Suspended
that in Suva, at least, no public warnings are posted in swimming areas
solids are increasingly aff ecting the health and biodiversity of coral
with known high coliform counts and, as a consequence, many people,
reefs, and are linked to poor land use practices including deforestation
especially children, are exposed to risk. Since the Suva Lagoon is an
(Solomon Islands, Fiji, Papua New Guinea), mining (New Caledonia,
area of high fi shing intensity, authorities would be faced with a diffi
cult
Papua New Guinea, Fiji), road construction, causeway construction
decision regarding banning of water activities.
(Kiribati) and tourism infrastructure development.
Eutrophication
Solid waste disposal is a universal problem, and litter is a prevalent eyesore
Localised eutrophication resulting from agricultural/urban run-off and
in most populated areas; it is a serious problem for human health and
untreated sewage exerts only a slight impact on the regional scale,
the environment, and discarded plastic items are, for example, a major
although the increases in abundance of epiphytic algae and macro-
hazard for sea turtles and seabirds. Approximately 25% of the waste is
algae along the coasts of most islands is often obscured by natural
non-biodegradable and thus poses a serious long-term threat.
seasonal increases in the abundance of Entermorpha, Chaetomorpha
and Cladophora during the wet season.
A regionally signifi cant problem is the long-term pollution risk from
discarded military waste. The 857 sunken World War II wrecks present
Chemical
in the region (mostly in Papua New Guinea, Solomon Islands and
High concentrations of chemical contaminants, such as tri-butyl tin
Micronesia) are a lingering source of petrochemical and other toxic
(TBT) and heavy metals at sites like the Suva Lagoon (Gangaiya et al.
compounds that can leak onto vulnerable coral reefs (see also Habitat
2001), large-scale use of pesticides in agriculture and forestry, oil from
and community modifi cation). Their disposal will be a costly problem
machinery and increased logging and mining activities near waterways
that will have to be dealt with on a case-by-case basis. The eff ects
(e.g. Solomon Islands, New Caledonia and PNG) and effl
uents from
of extensive nuclear testing in the region represent a long-term
sugar cane mills (as in Lautoka, Fiji) exert moderate impacts on the
radionuclide pollution problem (Marshall Islands, Kiribati and French
region. Notable examples of environmental impacts are: imposex in
Polynesia). Major oil spills have not been a serious threat so far, but small,
molluscs caused by elevated levels of TBT (Rilov et al. 2000), leakages
localised spills or leakages are common in ports and harbours, and close
to urban centres. Shipping-related oil and ballast discharges are poorly
Table 6
Characteristics of solid waste in selected countries in
documented and are probably prevalent, although visible impacts of
the Pacifi c Islands region, 1990-1994.
oil on reefs or beaches are negligible.
Honiara
Lautoka
Nuku'alofa
Port Vila
(Solomon
(Fiji
Average
(Tonga)
(Vanuatu)
Islands)
Islands)
The consequences of pollution have a signifi cant impact on the health
Average bulk density (kg/m3)
209
159
169
158
174
of the people. They also aff ect the health of inshore ecosystems,
Generation rate (kg/capita/day)
0.62
0.82
0.94
0.65
0.76
especially coral reefs, mangroves and lagoons. Ciguatera fi sh poisoning
Waste classification (% by wet weight)
is widespread in all the atoll countries, and its incidence is exacerbated
Plastic 16.8
5.2
8.1
7.7
9.5
in those areas impacted by pollution (including eutrophication
Glass 4.5
3.3
2.7
3.3
3.5
and increased sedimentation). Nuclear testing and the subsequent
Metals
6.1
8
3.2
3.6
5.2
radionuclide pollution have caused major disruptions and relocation
Biodegradable 64.6
47.2
67.8
71
62.7
of entire communities, and escalating costs of compensation for health-
Textiles 1.8
3.7
3
1.6
2.5
related problems. The community and social impacts from pollution are
Potentially hazardous
0.1
<1
0.2
0.7
0.5
hard to measure, and there is a need for awareness-raising at all levels
Construction and demolition
0.1
1
0
0.7
0.5
on how changes in life-style and ethics can raise consciousness about
Other 0
0.3
0.2
0
0.1
the eff ects of pollution on people's lives.
(Source: Raj 2000)
ASSESSMENT
25

local people who continue to fi sh nearby. The problem of solid waste
is further exemplifi ed by the shoreline of Nauru which appears `blue-
green' as a result of the accumulation of Foster's and Victoria Bitter beer
cans. Littering of the coastal area is an eyesore in all of the countries,
which is a pity given that proper recycling is not that complicated to
solve. Discarded military waste is also a problem in some countries
(Figure 3). Entanglement of turtles and marine birds in discarded fi shing
nets, and death of turtles and birds caused by ingestion of plastic waste,
is also an added factor.
Thermal
Figure 3
Example of solid waste disposal problem.
The presence of thermal discharges was noted in some areas, such as
(Photo: G.R. South)
Savusavu Bay from a gold mine, and Levuka, Ovalau Island, Fiji Islands
from e.g. mine tailings leading to fi sh death, and impacts on marine life
from a tuna processing plant where an outbreak of Ulva lactuca, a green
from oil leakages from ships.
bladed alga that had not been recorded from Fiji, was observed (the
Ulva outbreak might be equally attributable to enhanced nutrients).
Suspended solids
At Savusavu, a reduction in coral cover attributable to heavy sediment
There are localised and moderate impacts on water bodies due to
loading, and an increase in benthic macroalgae, was observed during
increased turbidity, and there is extensive evidence of changes in
unpublished surveys. Although the altered biodiversity, especially
sedimentation and/or erosion rates as well as changes in biodiversity
reduction in the numbers of scleractinian coral species is moderate
due to suspended solids (Members of the GIWA Task team pers. comm.).
(Lovell pers. comm.), it does not occur at the region-wide scale.
For example, deforestation in PNG, Solomon Islands and Fiji has
promoted heavy run-off during major rainfall events and, in turn, has
Radionuclide
caused increased turbidity. Modifi cation of coastal areas, such as the
Past and recent nuclear testings undertaken by France and the United
Denarau Island development in Fiji and the construction of causeways
States on islands such as Moruroa and the Marshall Islands (Bikini and
in Kiribati, have caused changes in erosion rates and patterns in these
Kwajalein atolls) have caused severe impacts on the region (Figure 4).
areas. In addition, coral reefs near Savusavu (Vanua Levu Island, Fiji)
The more than 180 atmospheric and underwater tests at Moruroa and
have been smothered by deposits from gold mine tailings, leading
Fangataufa atolls have dispersed into the environment or have created
to a signifi cant deterioration in coral health (Schlńppy, pers. comm.)
crude underground nuclear waste dumps of hundreds of kilograms of
and by urban run-off in Majuro (Marshall Islands) (South unpublished)
plutonium and other highly radioactive fi ssion products (Greenpeace
and Honiara, Solomon Islands. Further, wastewater run-off from tuna
1995). There are reports that some of the coral framework of reefs
processing plant has caused eutrophication eff ects on reefs near
at Mururoa may have cracked following nuclear tests, although the
Ovalau, Fiji (Lovell pers. comm.) and Pago Pago, American Samoa
signifi cance of this in biological or ecological terms needs further
(Skelton unpublished). The general decline and transformation of some
documentation. Cousteau concluded in a 1987 Mission Report (as cited
reefs to algal reefs along the Coral Coast of Viti Levu Island, Fiji has been
in Greenpeace 1995) that nuclear testing had caused accelerated and
attributed to the impacts of hotel development along that coast, and
premature aging of the atoll: "The tests conducted under the lagoon
this currently under investigation by the University of the South Pacifi c's
still produce fi ssures and subsidences that aff ect the external slope of
Institute of Applied Science.
the atoll. The risk of collapse in the southern zone is not excluded: in
fact, very wide (one to two metres) longitudinal faults penetrate the
Solid wastes
upper part of the outer fl ank over some tens of metres. .". Cousteau also
Litter is a universal problem amongst all the islands (Table 6), especially
concluded that "it is clear that the permeability of the volcanic layer
in urban areas, which have resulted in some areas, such as the shoreline
is locally increased by fractures caused by underground tests." "The
surrounding the Lami Dump in Fiji, being condemned for safety
premature and accelerated aging of the atoll certainly explains, to a
reasons. The Lami Dump, which is situated close to the city of Suva, is a
large degree, the imminent transfer of the large yield nuclear tests to the
notorious source of many toxic chemicals, including heavy metals that
atoll of Fangataufa." The scientifi c missions that have been permitted
are constantly leaching into the lagoon, presenting a health hazard to
access to Moruroa, despite being allowed to take only a handful of
26
GIWA REGIONAL ASSESSMENT 62 PACIFIC ISLANDS
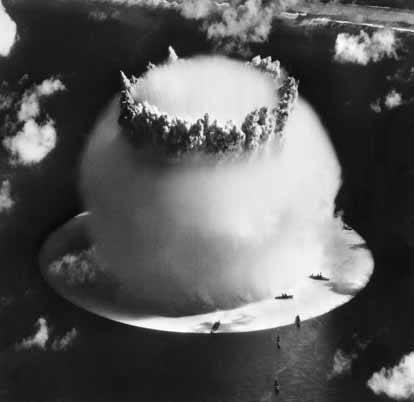
1998 to address shipping-related marine pollution; the Pacifi c Ocean
Pollution Prevention Programme (PACPOL) (Nawadra 2004). PACPOL
has been implemented since 1999 and has developed a regional
policy for dealing with oil spills, but any large oil spill in the region
would be a major disaster because of lack of clean-up facilities and
the extreme isolation of the region for clean-up technology and
assistance.
Socio-economic impacts
Economic impacts
Economic impacts of pollution result from increased medical costs, loss
of tourism or recreational values, and costs of reduced fi sh marketability
due to aesthetic perceptions.
Health impacts
Figure 4
Mushroom cloud from atomic bomb test,
The consequences of pollution on the health of the people from solid
Bikini Atoll, 1946.
(Photo: Corbis)
wastes, reduced nutrient intake and outbreaks of food poisoning
from fi sh toxins, such as ciguatera, exerted a considerable impact on
samples, have all detected the presence of artifi cial radioactivity either
the population of the region. It is known, for example, that enhanced
in or around the test site. This includes radioactive iodine, cesium 134,
nutrient levels in lagoons result in more growth of macroalgae. The
and plutonium in the lagoon and outside the 12 nautical mile exclusion
macroalgae are the substratum on which the dinofl agellates responsible
zone (Greenpeace 1995). The Cousteau mission also found cesium
for causing ciguatera live epiphytically: they are grazed by herbivorous
134, an artifi cial radionuclide not present in atmospheric fallout, and
fi sh, which are, in turn, eaten by carnivorous fi sh and, ultimately, people.
suggested it might "be necessary to attribute the origin of the Cs-134 to
By the time people consume the top predators, the ciguatoxins have
the underground tests". US scientist Norm Buske detected cesium 134 in
reached dangerous concentrations (Temakei pers. comm.). Statistics
plankton samples taken outside the 12 mile zone during a Greenpeace
describing the incidence of ciguatera poisoning in Fiji collected during
mission in 1990 (Greenpeace 1995).
the early 1990s showed the following increases in cases: 1989 (683);
1990 (787) and 1991 (1 012) (Singh 1992). Reporting of ciguatera cases is
Atmospheric nuclear tests were carried out on Christmas Island in
compounded by the fact that the symptoms are comparable to those of
1957; subsequent reports have demonstrated that little contamination
gastrointestinal problems (diarrhoea, pain, nausea). Ciguatera poisoning
occurred.
occurs in most Pacifi c Island countries, including Kiribati, Tuvalu,
Solomon Islands, Samoa, Cook Islands, and French Polynesia. A 1992
The use of the Pacifi c Islands' waters as a shipping route or dumping
summary of fi sh-poisoning incidence (however, not segregated into
ground for nuclear material was also seen as a big threat to Pacifi c
ciguatera and other) is provided below (Table 7). A study of 500 people
Island states, in the event of a possible accident and spillage of
in New Caledonia conducted in 1992 showed that 124 (almost 25%) had
radioactive materials. Pacifi c countries have strongly protested over
been intoxicated at least once (Amade 1993). These fi gures indicate that
the transhipment of waste plutonium through the region.
a signifi cant proportion of ciguatera cases go unreported.
Spills
Atomic bomb testing began in 1948 in the Marshall Islands, with tests
At the regional level, spills exert slight impacts, although in some
conducted on a number of atolls. The tests resulted in substantial
places the infl uence of spills is moderate. There are many areas such
movement and relocation of entire populations. In a detailed fi ve-year
as Suva harbour where small oil spills are a regular problem, but these
study of 432 islands in the Marshall Islands which concluded in 1995, it
have so far not led to visible oil deposits on reefs, or oil on beaches,
was revealed that 15 atolls and single islands, almost half of the nation,
with the impacts being much localised. The South Pacifi c Regional
were dusted by radioactive fallout from the tests carried out in the 1950s
Environment Programme (SPREP) and the International Maritime
(Members of the GIWA Task team pers. comm.). See further comments
Organization (IMO) formulated and approved a joint programme in
under radionuclide pollution above.
ASSESSMENT
27
Table 7
Fish poisoning statistics for Pacifi c Island countries,
The displacement of entire populations in the Pacifi c region has had far-
1992 (not segregated into ciguatera and other forms of
reaching social and community impacts. The most well-known cases
poisoning).
involve the displacement of the population of Bikini Atoll in the Marshall
Cumulative total for 1992
Islands following nuclear testing ş after many years the people are still
Country
Rate (occurrences per 1 000
Cases
people in the population)
unable to return to their island because of nuclear contamination. The
American Samoa
0
0.0
people of Banaba Island (Kiribati) were relocated because their island
Cook Islands
148
8.7
was extensively mined for phosphates (from bird guano), rendering the
Fiji
1 159
1.6
island uninhabitable: many of these people now live on Rabi Island in
French Polynesia
773
4.4
Fiji, were they continue to be disadvantaged.
Federated States of Micronesia
6
0.1
Guam
2
0.0
Conclusions and future outlook
Kiribati
1 172
17.3
Microbial, eutrophication, chemical and solid waste pollution is entirely
related to human settlements and activities, and is likely to worsen as
Marshall Islands
216
5.7
populations grow, become more urbanised and adopt westernised,
Nauru
0
0.0
disposal-oriented life-styles. Installation of proper sewage treatment
New Caledonia
148
0.9
plants in the main urban centres would do a lot to decrease levels of
Niue
1
0.4
microbial pollution, and might also lead to ways of recycling scarce
Northern Marianas
29
1.4
water resources. Solid waste disposal is a universal problem: it is a
Palau
0
0.0
tragedy that some of the most beautiful places in the world are, on
Pitcairn
0
0.0
closer scrutiny, marred by garbage. It is often argued that the lack of
Papua New Guinea
0
0.0
fi nancial resources is a hindrance to improving the situation, but much
Samoa
122
0.8
can be done by simple changes in awareness and shifts in attitudes,
Solomon Islands
0
0.0
and by encouraging more environmentally friendly strategies for waste
Tokelau
13
8.1
disposal. As long as the population tolerates or ignores accumulations
Tonga
7
0.1
of rubbish along the shoreline, and in creeks and rivers close to towns
Tuvalu
168
19.8
and cities, then the problem will persist. Civil society has an important
Vanuatu
1 009
7.0
role to play, and should exercise it and encourage the use, for example,
Wallis and Futuna
0
0.0
of biodegradable wrapping materials.
(Source: SPEHIS 1993)
Environmental impact assessment regulations or guidelines, if
Other social and community impacts
properly applied, would help to alleviate some of the worst examples
The endangerment of many species from pollution, and avoidance
of pollution in the region, and would engender a "polluter pays" ethic.
of areas due to increased degradation (resulting, for example, from
Non-governmental organisations can (and do) play an important role
inappropriate disposal of solid wastes) has a signifi cant impact in the
in changing attitudes, but they need more help and support. Regional
region. A short walk along any coastline close to human habitation in
organisations and the international community are very active in their
the Pacifi c Islands will reveal many examples of inappropriate waste
eff orts to deal with the serious pollution issues relating to oil spills,
disposal, even in areas where there is a municipal collection system
ballast water disposal, and radionuclide pollution, these eff orts are
such as in the city of Suva. Creeks running into Apia Harbour in Samoa
sometimes strong on policy, but weak on resources: it is likely that
are heavily choked with domestic rubbish, adjacent to people's homes
any major oil spill would create clean-up requirements of enormous
and the roadway. The social and community impacts of this behaviour
proportions, and for which the region has practically no facilities
are not clear; annual clean-ups of some public areas are now common,
to deal with. It will take many decades to deal with the potentially
but the fact that the same amount of litter has accumulated the next
dangerous leakages that are lurking in World War II wrecks (and
year indicates there has been little change of habits in the interim. The
which have the potential to ruin important tourists destinations),
inappropriate solid waste disposal places a burden on the availability of
and yet more decades to deal with the health and environmental
land which is acute in small islands.
results of nuclear testing. The large-scale application of poor land use
practices is showing few signs of abatement: apart from the massive
28
GIWA REGIONAL ASSESSMENT 62 PACIFIC ISLANDS
increases in sediment loading on fragile and ecologically important
The Pacifi c Islands region contains some of the most extensive and
coral reef ecosystems that this causes, there are other risks associated
biologically important coral reef ecosystems in the world, and in
with loss of human life and infrastructure during cataclysmic events
general, the reefs are in good condition (Figure 5). Their status was most
such as torrential rainfall during cyclones, or from land-slides caused
recently assessed in 2002, when it was observed that they had been
by earthquakes. The amelioration of all impacts of pollution on the
severely impacted by major coral bleaching events in 2000 and 2002
region will take a great deal of commitment in the coming years. Most
(Wilkinson 2002). The economic and biological consequences of these
importantly, every eff ort should be made to protect areas that are
events are still poorly understood. Near-shore seagrass communities are
still pristine, since they will act as a reservoir of biological diversity for
also vulnerable, particularly to eutrophication. Major socio-economic
future generations.
impacts include a reduced capacity to meet basic human needs, such
as food and fuel. Other negative impacts occur in the tourism sector.
Pacifi c Island communities have long utilised traditional medicines,
a number of which are obtained from mangrove species: the loss
T
C
A
Habitat and community
IMP
of mangrove habitats reduces the availability of these medicines to
modification
indigenous peoples.
Loss of ecosystems and habitat modifi cation are universal issues in
Among the most important habitats subject to modifi cation are coral
the Pacifi c Islands region, with deforestation of catchment areas,
reefs, mangroves, and seagrass beds, as described in the Regional
mangrove "reclamation", urban development, sand mining, land-based
defi nition.
mining and agriculture being the most devastating causal agents. The
complete destruction of three islands by phosphate mining (Nauru,
Environmental impacts
Banaba and Makatea) has led to fi nancial ruin (Nauru) and displacement
Loss of ecosystem
of entire populations (Banaba). More than 50% of some habitats (e.g.
The Pacifi c Islands region has suff ered moderate impacts because of
mangroves) has been lost or severely modifi ed. Invasive species have
the loss of habitats. For example, up to 40% of Fiji's mangrove forests
caused considerable terrestrial ecosystem modifi cation on some islands
have been destroyed, or reclaimed as it is termed, during the past 30
(e.g. Guam), but have been less of a problem in the marine environment,
to 40 years. Two examples include destruction and land-fi lling during
although knowledge is limited to studies of a few sites (e.g. Pago Pago
the early 1990s of a large area of mangroves adjacent to the Lami
Harbour, American Samoa).
dump, outside of Suva, Fiji, to make way for a large container storage
Northern
Reefs at risk
Mariana
Islands
High
Medium
Guam
Low
Marshall Islands (US)
Kingman
Reef (US)
Palau
Federated states of Micronesia
Howland
Islands (US)
Jarvis
Indonesia
Kiribati
Nauru
Islands
(US)
Papua New Guinea
Kiribati
Kiribati
Tuvalu
Tokelau
Cook
Solomon Islands
Islands
Wallis
and SamoaAmerican
Fiji
Futuna
Samoa
Vanuatu
Tonga Niue
French Polynesia
New Caledonia
Pitcairn Islands
0
2 000 Kilometres
ę GIWA 2004
Figure 5
Reefs at risk in the Pacifi c Islands region.
(Source: Bryant et al. 1998)
ASSESSMENT
29
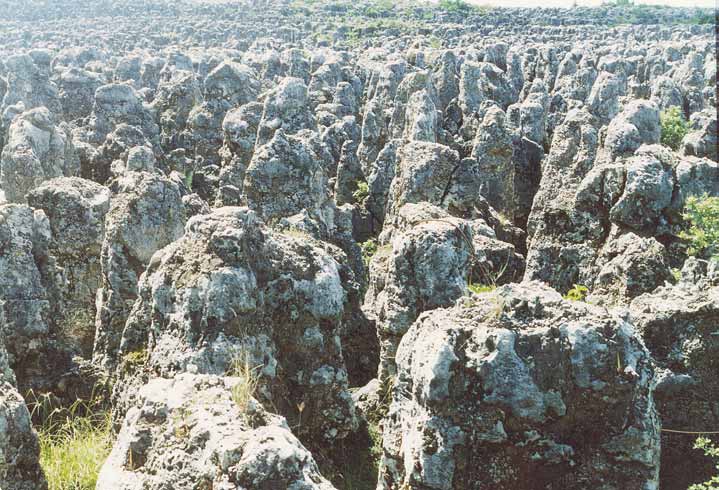
Figure 6
Habitat and community modifi cation ş moonscape in Nauru resulting from phosphate mining.
(Photo: G.R. South)
area, and the "reclamation" of about 3 000 ha of coastal wetlands and
Some islands have been almost completely destroyed by phosphate
mangroves close to Nadi, Fiji for the development of the Denarau Island
mining, such as Nauru and Banaba (Kiribati) and Makatea (French
tourism facilities. The status of mangroves in 11 Pacifi c Island countries
Polynesia) (Figure 6). The tricalcium phosphate deposits occur in
is reported in SPREP (2001b). According to Jenkins (in SPREP 2001b), the
crumbly surface or subsurface "nests" which are separated by walls
Pacifi c Island region has 848 735 ha (or 2.4%) of the world's mangroves,
and pinnacles of very hard dolomitic limestone; the mining results in
with the largest areas occurring in PNG, Solomon Islands, Fiji and New
a destruction of the plant cover and the environment. The deposits
Caledonia. It is estimated (Jenkins, in SPREP 2001b) that approximately
originally covered 80% of Nauru and Banaba, rendering the islands
1.0% of mangroves in the Asia-Pacifi c region are lost annually.
virtually uninhabitable in areas fully mined out (Dupon 1983). Other
The threats to mangroves in the region include:
islands have been severely altered by nuclear testing, such as Bikini Atoll
Conversion for agricultural or industrial use;
(Marshall Islands) and Moruroa Atoll (French Polynesia).
Conversion for urban and tourism infrastructure;
Disruption of hydrology due to roads and transport;
Sunken World War II shipwrecks remain a serious hazard to reefs and
Catchment degradation through impacts on freshwater fl ows;
ecosystems of Pacifi c Islands, and as the wrecks age and rust out they
Overharvesting of fi sh and crustaceans;
are causing serious ecological threats through the leakage of oil and
Potential conversion for aquaculture ponds;
other hazardous materials (Monfi ls & Nawadra 2003, Nawadra 2004,
Potentially unsustainable forestry operations;
Spennemann 1992). A summary of the number of known wrecks is
Sea level rise and global warming.
provided in Table 8; the greatest numbers occur in Federated State of
Micronesia, Papua New Guinea and Solomon Islands.
30
GIWA REGIONAL ASSESSMENT 62 PACIFIC ISLANDS
Table 8
World War II wrecks known from Pacifi c Islands, by
causing signifi cant damage to back-reef areas, and undocumented
Exclusive Economic Zone.
modifi cation of ecosystems (Lovell unpublished). The extensive
Country
Tankers and oilers
Total number of wrecks
harvesting of coral sand for the manufacture of cement and for building
Australia
3
49
purposes in atoll countries causes signifi cant habitat modifi cation.
Fiji
-
3
Federated States of Micronesia
16
150
The status of coral reefs in the Pacifi c region has been summarised
Kiribati
-
6
by Wilkinson (1998, 2000, 2002). Monitoring of reefs in the region has
Nauru
-
4
improved during the past few years, although information is lacking
New Caledonia
-
10
for large areas. Coral reefs are generally reported as being in good
New Zealand
-
2
condition throughout the region, but severe bleaching events during
Northern Marianas
1
64
the past decade have resulted in considerable coral mortality in those
Palau
9
77
areas most aff ected. Up to 40% of coral colonies were bleached in
Papua New Guinea
3
279
March-April 2000 on Fiji's reefs, and considerable mortality resulted
Republic of the Marshall Islands
1
49
(Sulu et al. 2002). Considerable losses to reefs in New Caledonia in 1998
Solomon Islands
2
158
and 2001 were attributed to Crown-of-thorns starfi sh, coral bleaching
Vanuatu
-
6
or coral disease (Sulu et al. 2002). Pollution from sewage and sediments
Total
35
857
are mostly restricted to reefs adjacent to urban areas in the southeast
(Source: Nawadra 2004)
and central Pacifi c (Salvat 2002). Wilkinson (2002) notes that the majority
of the world's reefs, including those in the Pacifi c region, are outside
The controversial construction of causeways in Tarawa (Kiribati) resulted
of protected areas. Approximately 16% of the world's coral reefs were
in signifi cant habitat modifi cation and ecosystem loss including
eff ectively destroyed during the major El Ni˝o and La Ni˝a events of
changes in water circulation in the Tarawa Lagoon, and changes to
1997-1998, and although the Pacifi c Islands were largely spared then,
and losses in fi sh populations. Movements of fi sh into and out of the
they were severely aff ected in 2000 and 2002. The overall impact of this
lagoon have been modifi ed, and spawning areas for some species have
kind of habitat modifi cation is still poorly recorded, but the eff ects on
been aff ected.
the fi shery and biodiversity are likely to be considerable.
Modifi cation of ecosystems
Green and Short's (2003) World Atlas of Seagrasses includes a report
More than 50% of some habitats, particularly mangroves and coastal
on the Pacifi c Islands region (Coles et al. 2003a). They report potentially
wetlands, in most countries in the Pacifi c Island region have been
signifi cant impacts on seagrass communities adjacent to urban areas
modifi ed causing severe losses of biodiversity; especially on atolls and
through the enhanced nutrient loads and sedimentation resulting
highly populated small islands. The extensive practice of seaweed
from sewage disposal; they also refer to the diffi
culty of developing
mariculture in some countries has the potential to modify ecosystems
sustainable management strategies for seagrasses, because of
if "escaped" plants become prevalent away from areas where they are
customary ownership of land and near shore regions. Monitoring
cultivated. This has begun to happen in Fiji (South unpublished), where
programmes established in the region under the SEAGRASSNET Global
Kappaphycus plants are now found on reefs far from seaweed farms. There
Monitoring Programme will improve our understanding of the status of
is little evidence yet, however, whether invasive species are a problem in
seagrass communities in future years (Coles et al. 2003a).
any of the Pacifi c Islands, although they are known to occur in ports and
harbours. In a recent report (Coles et al. 2003b) a total of 26 non-indigenous
Socio-economic impacts
or cryptogenic species was detected in a survey of Pago Pago Harbour,
Economic impacts
American Samoa. This is relatively few introduced species compared
Major economic impacts include reduced capacity to meet basic human
with other Pacifi c sites examined (Guam, Hawaii and North Queensland,
needs (e.g. food, fuel). The changes may have a negative impact on
Australia) and the introductions are mostly restricted to the inner portions
employment opportunities and associated changes in social structure.
of the harbour and have not spread to adjacent coral reefs.
The loss of existing income and foreign exchange from fi sheries, tourism,
etc. is another major economic impact. It is extremely diffi
cult to separate
The harvesting of corals for the live-rock trade, and for use in the
losses resulting from environmental impacts from those resulting from
construction of septic distribution fi elds and building purposes is
social upheaval, such as the military coups in Fiji and the breakdown of
ASSESSMENT
31
law and order and the economy in Solomon Islands because of ethnic
continue at an accelerated pace ş this is an encouraging development.
unrest. There has been little evidence, for example, that coral bleaching
Monitoring of marine habitats and communities is important and likely
has had much impact on dive tourism income in Fiji, but a serious impact
to increase, with active regional and global programmes, as well as local
on tourism occurred during the May 2000 failed military coup. Events
communities, engaged. The move towards a Global Marine Assessment
elsewhere in the world, however, have resulted in a rapid recovery of
(GMA) programme, which is now in the planning stage, is a logical
Fiji's tourism industry, as the country is now considered a safer place
progression from the GIWA and should be implemented in the next
than other destinations. The potential costs of controlling invasive and
few years. Maintaining the health of the region's ecosystems is one of
alien species are another impact but no data are available; as mentioned
the guiding principals of the Pacifi c Islands Regional Ocean Policy, and
above, they are not yet considered to be a serious concern.
is critical, not only for health, food security and aesthetic reasons, but
also for tourism, which is the world's fastest growing industry. Tourists
Health impacts
are unlikely to want to visit places that are degraded or polluted; instead
The loss of traditional food and medicines, most of which were
they will travel any distance to see pristine marine environments.
obtained from mangroves and native forests that have now been
destroyed, traditional habitat protection as practised in pre-European
contact times, as well as increases in non-communicable illnesses (e.g.
T
C
A
diabetes, strokes and heart-diseases) caused by signifi cant changes in
Unsustainable exploitation of
IMP
lifestyle and diet resulting from overexploitation of resources are seen as
fish and other living resources
serious impacts to the health and well-being of Pacifi c islanders. Climate
change and habitat modifi cations are also aff ecting water exchange in
The exploitation of fi sh and other living resources drove much of the
coastal areas, giving rise to potentially increased populations of insect
early development of the Pacifi c Islands during the more than two
disease vectors such as mosquitoes.
centuries since the fi rst European contact, with whaling, bŕche-de-mer
(sea cucumbers) (Figure 7), and sandalwood being among the most
Other social and community impacts
important. Nowadays, other niche markets have taken on importance,
Social and community impacts identifi ed in the region were: loss
including trades in aquarium fi sh (Tonga, Fiji, Solomon Islands), live coral
of food security because of the breakdown in traditional systems
(Fiji) and live fi sh (Papua New Guinea, Solomon Islands); the region's
resulting from urban drift and the cash economy, and because of
tuna fi shery is the largest in the world, supplying some 50% of the
overexploitation of resources; loss of ecosystem functions because
world market.
of habitat destruction and modifi cation (as described above); cultural
degradation through the erosion of traditional systems and the loss of
The subsistence fi sheries remain the mainstay of livelihoods and food
traditional knowledge; increasing economic dependency because of
security throughout the Pacifi c Islands. Per capita fi sh consumption in
increasing aid-dependency and on remissions from family members
the Pacifi c Islands ranges from 55 kg/person/year in Fiji, to as high as
who have migrated overseas, and inter-generational inequity brought
200 kg/person/year in Kiribati.
about by improved education opportunities and improved incomes of
the new generation compared with the past.
There is clear evidence of overexploitation of the inshore and reef fi shery
in most Pacifi c Islands: this is being driven by population increases
Conclusions and future outlook
and consequently greater demands for fi sh, by a lack of regulation
Habitat loss and community modifi cation will continue to be issues
of the subsistence fi shery, by the use of illegal fi shing methods, by
for all Pacifi c Island nations for the indefi nite future. There is an urgent
improvements in technology (and thus ability to catch fi sh) and by a
need to increase the knowledge base about the region's ecosystems:
lack of suffi
cient protected areas for the inshore fi shery. Western-style
understanding of the way that the ecosystems work is still rudimentary,
fi sheries management methods have not led to sustainable inshore
and the biodiversity (species composition) of the majority of the many
fi sheries in the Pacifi c Islands context, and there is now a realisation on
islands in the region has yet to be catalogued. Species extinctions have
the part of many fi shing communities of the need to combine traditional
probably already occurred, and are continuing. Replanting of mangroves
conservation and modern strategies in the management of their fi shing
is occurring on a small-scale, and should be encouraged. The current
areas. The establishment of fi sh reserves or locally managed marine
trend towards locally managed marine protected areas is engaging
protected areas is now becoming a trend in a number of countries,
increasing numbers of communities in the region and is likely to
including Fiji, Samoa, Cook Islands and Papua New Guinea.
32
GIWA REGIONAL ASSESSMENT 62 PACIFIC ISLANDS
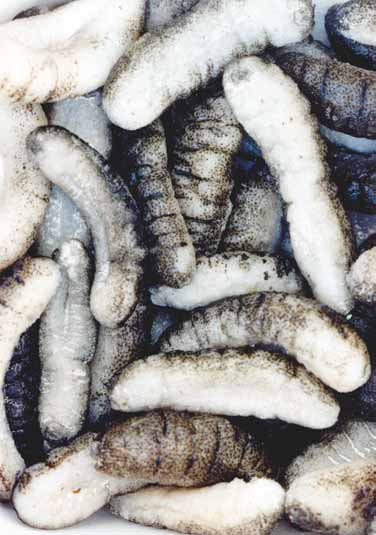
in previous estimates. The ADB also noted that fi shery trade data for the
Pacifi c Islands region underestimate the value of fi sheries exports.
Invertebrates are the most valuable inshore resources, and include
bŕche-de-mer (sea cucumbers) (Figure 7), trochus and pearl oysters.
Mariculture of shrimps, as well as seaweeds (Figure 9) and some
fi nfi sh, is increasing in popularity. Dalzell et al. (1996) point out that the
greatest future infl uence on coastal fi sheries in the Pacifi c is likely to
come from Southeast and East Asia, where the demand for high value
coastal fi shes and invertebrates has led to large-scale depletion and
has motivated entrepreneurs to seek stocks in the neighbouring Pacifi c
Islands. Examples of this include the live fi sh trade in Solomon Islands
and Papua New Guinea.
Preston (1993) provided a detailed account of bŕche-de-mer biology
and the fi shery in the Pacifi c Islands. This fi shery has been important
since the early days of European contact. European or American trading
vessels conducted collecting expeditions in New Caledonia and PNG,
and the fi rst trade in Fiji began in 1813. The fi shery had an enormous
infl uence on the lives of Pacifi c Islanders, especially during the fi rst
half of the 19th century, and ultimately led to major demographic and
political changes in some parts of the region (Ward 1972). The fi shery
has continued to be an important although variable source of revenue
for Pacifi c Islands, and has followed a "boom and bust" pattern for a wide
range of reasons (Ward 1972). The bŕche-de-mer trade has had signifi cant
(and probably irreversible) environmental consequences, the most
obvious being deforestation of coastal areas for fi rewood, with 10 tonnes
required to smoke each tonne of bŕche-de-mer (Preston 1993).
Figure 7
Bŕche-de-mer on sale at Suva market, Fiji.
(Photo: G.R. South)
It was agreed that there is clear evidence of fi sh overexploitation in
almost all of the countries and territories in the region, involving a
Environmental impacts
wide range of species (such as giant clams) being exploited beyond
Overexploitation
their Maximum Sustainable Yield (MSY), or even to local extinction.
Total coastal fi sheries production in the Pacifi c Islands amounts to more
MSY is diffi
cult to apply to the multi-species fi sheries of the Pacifi c
than 100 000 tonnes per year, worth a nominal value of 262 million USD
Islands (apart from pelagic, highly migratory species such as tuna). In
per year (Dalzell et al. 1996). About 80% is from subsistence fi shing,
part because of a lack of biological and stock data for most species,
and about half of the production comes from fi shing on coral reefs
but also due to a lack of capacity within the small fi sheries jurisdictions
(Figure 8). The Asian Development Bank (ADB 2001) notes that the
of the Pacifi c Islands who could carry out such work and there are few
offi
cial data on the percentage contribution of fi sheries to the GDP in
examples where MSY has been calculated. As pointed out by Dalzell
1999 ranged from 0.6% (PNG) to 12.0% (Kiribati). New estimates from
et al. (1996), most of the research on Pacifi c Island species has been
their study, however, showed that the estimates of contributions to
carried out by scientists from outside of the region, and much of the
GDP are almost double in Kiribati, Palau and the Federated States of
data have been obtained from neighbouring countries such as Australia
Micronesia, but are lower in Marshall Islands, Samoa and Cook Islands,
and those of Southeast Asia.
compared with the 1999 estimates. The average contribution across all
Pacifi c Island countries is now estimated as 7.0% of GDP. The reasons for
An example of overfi shing is from Samoa (Skelton et al. 2002) where
the diff erences are largely because subsistence fi shing was not included
inshore fi sh landings declined dramatically from 250 million tonnes in
ASSESSMENT
33
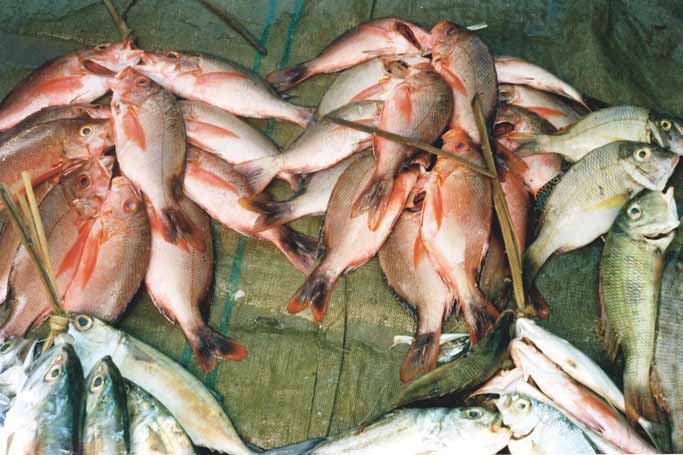
1986, to just over 50 million tonnes in 1994. Bottom fi sh were overfi shed
Oceanic Fisheries Programme has devoted considerable attention to
by an estimated 30% of the MSY in 1992, which ultimately led to the
the by-catch issue. Williams (1996) provided a detailed case study for
collapse of that fi shery. Species that are fi shed unsustainably include
the region, and SPREP (2001c) has reviewed the turtle by-catch for the
mullets (Mugilidae), sharks (for the Asian shark fi n trade and through
western and central Pacifi c Ocean tuna fi shery, and have estimated that
by-catch), hump-head Maori wrasse (Cheilinus undulatus), large groupers
more than 2 100 turtles are accidentally caught each year, of which
(Serranidae) for the live fi sh trade, and other bottom fi shes, eels, giant
about 25% might be expected to survive (principally those caught by
clams (Tridacna spp., Hippopus hippopus), bŕche-de-mer (Holothuroidea),
purse seines). A considerable number of species of sharks and other
Coconut crabs (Birgus latro) and other targeted crab species, and sea
fi shes feature in the by-catch.
turtles. The overfi shing is particularly acute for valuable species and
species found around the main urban centres where there is very high
Data on by-catch obtained from ship's log sheets has been shown to
demand for fi sh from urban communities, but is less of a problem for
be much lower than estimates obtained by observers (Williams 1996).
non-targeted species and those found outside urban areas.
This suggests a reluctance to report the full extent of by-catch, or even
the suppression of information. For large sections of the tuna fi shery,
Excessive by-catch and discards
observer data are absent, and it is likely that this situation will prevail
In the Pacifi c Islands by-catch is defi ned as "any catch of species (fi sh,
because of the high cost of observer programmes and the fact that
sharks, marine mammals, turtles, seabirds, etc.) other than the target
observers are not always allowed on tuna fi shing vessels from some
species. `Incidental catch' can be regarded as synonymous" (Bailey
countries. Rather less is known about by-catch of seabirds in the region,
et al. 1996). By-catch and discards occur in the off shore tuna fi shery,
although indications of the likely extent of the problem may be gleaned
principally from purse seine and long-line fi shing, but it is diffi
cult to
from Rivera (2002). WWF (2003) has stated that over 300 000 whales,
obtain accurate estimates on the levels and species caught. The SPCs
dolphins and porpoises are killed each year as a result of by-catch in
Figure 8
Reef fi sh on sale at the Suva market, Fiji.
(Source: G.R. South)
34
GIWA REGIONAL ASSESSMENT 62 PACIFIC ISLANDS
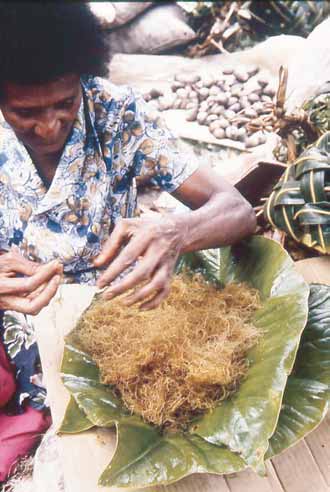
fi sheries and entanglement in drifting fi shing gear; how many of these
Poison fi shing is more insidious than other fi shing techniques because
are in the South Pacifi c region is not stated.
the more remote reefs that generally escape land based threats such
as pollution, sedimentation and coastal development are the reefs
Destructive fi shing practices
that prime targets for this method of fi shing (Bryant et al. 1998).
Although destructive fi shing practices exert a moderate impact at the
Cyanide fi shing also causes damages the corals themselves. At high
regional scale, in some countries, the impacts are more severe. The use
concentrations cyanide kills corals outright (Jones & Steven 1997) and
of a variety of destructive fi shing techniques, particularly explosives
at lower concentrations it impedes the photosynthetic function of
including dynamite, fi sh poisons, pesticides and chemical poisons,
the symbiotic zooxanthellae and causes bleaching in corals (Jones &
as well as the use of overeffi
cient fi shing gear (e.g. small-meshed gill
Hoegh-Guldberg, 1999) which, in turn, slows the growth of the coral
nets, night spear fi shing with spear guns and torches, purse seining,
and renders it more vulnerable to other disturbances (Wilkinson et al.
SCUBA, etc.) has led to widespread reef and habitat destruction and
1999). In addition, the harvesting of corals for the live rock trade is
the collapse of stocks of a number of species, and this has led to a
exacerbating the problem since it results in modifi cation of back-reef
banning of such fi shing, for example, in American Samoa. Blast fi shing
areas where the harvesting is carried out. For additional details, see the
is highly destructive. A blast at close range shatters the skeletons of
Causal chain analysis of destructive fi shing below.
all corals destroying the complex substrate that attracts many of the
fi sh in the fi rst place and at increasing distances from the blast all fi sh
Decreased viability of stock through pollution and disease
and invertebrates are killed irrespective of whether they are desirable
Pollution exerts slight to moderate impacts on the viability of stocks.
(Jennings & Polunin 1996, Cesar et al. 1997, McManus 1997).
For example, concentrations of tributyl tin (TBT), which is a major
component of antifouling fi lms that are applied to the hulls of boats
to prevent the settlement and growth of marine organisms, exceeding
2 Ág/l have been detected near slipways and have accumulated to
hazardous levels (Bryan et al. 1986). The accumulation of TBT in marine
organisms produces a variety of problems, particularly sex modifi cation
(imposex) in oysters and other bivalves in Suva Harbour (Tamata et al.
1993) and changes in the immunological responses of fi sh and other
aquatic organisms (Weeks et al. 1990, Burton et al. 2002). In addition,
in harbours and other areas where there is heavy maritime traffi
c
concentrations of creosote, which is a polyaromatic hydrocarbon
based treatment commonly used on pylons, wharves and netting
to protect against fouling with marine organisms, 10 times greater
than that required to cause the development of eye cataracts and gill
necrosis in fi sh, and carcinogenesis and changes in immune responses
in humans and other animals (Rose et al. 2000) have been recorded.
Other pollutants, such as polychlorinated biphenyls (PCBs) from military
installations in Guam and DDT are present and can be concentrated
through the food chain and accumulate in the tissues of large predatory
and commercially valuable fi sh such as swordfi sh (Xiphias gladius).
There is also serious concern over the potential impacts of sewerage
and domestic waste and sediment on fi sheries stocks. In Samoa, Skelton
et al. (2002) note that inshore pollution and increasing sediment loading
have resulted in a steady replacement of corals with seagrasses and
algae, and this has resulted in a collapse of some reef fi sheries. A
problem throughout the region is the lack of capacity to measure the
impacts of pollution on fl ora and fauna. An example quoted in Skelton
Figure 9
Sale of Hypnea seaweed at Suva market, Fiji.
(Photo: G.R. South)
et al. (2002) is of a solvent spill from a fuel tanker docked at Apia Wharf in
ASSESSMENT
35
Samoa in 1999, where clean-up measures were minimal and the impact
suffi
cient to arrest the continued overexploitation of fi sh resources. The
on the marine environment could not be measured because of lack of
establishment of locally managed marine protected areas is proceeding
equipment and expertise.
apace in the region, and is being strongly supported by governments,
NGOs, donors and communities. There are serious problems, however,
Impact on biological and genetic diversity
in that the subsistence fi shery remains unregulated and generally
The biological and genetic diversity of the region has suff ered moderate
unmanaged, destructive fi shing continues unabated in some countries,
impacts. For example, the introduction of the Nile tilapia (Oreochromis
and the increasing demand for fi sh and fi sh products continues. Most
mossambicus) in Kiribati has resulted in the displacement of some of the
importantly, there is a very weak database of information on the biology,
local fauna and the occupation of new habitats. Nile tilapia has been
reproduction and ecology of even the most important target species
introduced to most of the islands in the region. In Fiji, this species has
of the subsistence and artisanal fi sheries, which means that there are
escaped into many natural waterways, where it has replaced native
inadequate data on which to base sound management decisions.
species.
Aquaculture is one possible way of supplementing dwindling fi shery
Socio-economic impacts
resources, but it has largely been unsuccessful in the Pacifi c Islands, is
Economic impacts
unregulated and has the potential to cause environmental problems.
The deterioration of health leading to increased cost of health care was
Governments have diffi
culties in enforcing fi shery regulations because
considered an important impact. Many of the impacts are localised,
of shortage of staff and other resources: strategies to combine
and the most serious are concentrated in the urban centres (Crosby
traditional law with national laws may be one way of dealing with this
et al. 2002). With a few exceptions, however, it is unlikely that these
problem; the Village by-laws employed in Samoa are a good example
impacts have had a measurable impact on income from tourism or
of this. Pollution, habitat destruction and environmental degradation
sale of fi sheries products. Overexploitation is the most serious problem,
are contributing to a reduction of fi shery resources and biodiversity,
with examples like the live-fi sh trade most threatening. Measurement
and will have long-term eff ects on the fi shery if they are not dealt with.
of increases in health-care costs relevant to environmental impacts is
Overexploitation of fi sh is likely to continue for the indefi nite future in
problematical, since these have to be considered in the light of changes
the Pacifi c Islands region, and will continue to impact the livelihoods
in health care systems themselves.
and food security of the people. Health issues associated with an
increased dependence on imported foods are likely to grow over the
Health impacts
coming years, as they are replacing the healthier diets of local fi sh and
Loss of traditional food sources resulting in the use of alternative
vegetables. The lucrative tuna fi shery may continue to off set some of
foods, usually cheap and of low nutritional value (e.g. mutton fl aps,
these impacts, but it too will need to be properly managed, and the
turkey tails, tinned-fi sh, corned beef, etc.), results in deterioration of
Pacifi c Island countries should continue to press for a greater return on
health and increases in non-communicable diseases. This situation is
the tuna resource, since most of it is accrued by other nations.
prevalent throughout the entire region, and includes rural as well as
urban populations.
T
C
A
Other social and community impacts
Global change
IMP
Changes in lifestyle, which may include the disintegration of traditional
systems, increasing dependence on the cash economy and increased
Global change is the most important crosscutting concern for the
dependence on aid, are important social and community impacts
Pacifi c Islands region, impacting almost all of the issues reviewed in
throughout most of the Pacifi c Island states. These are issues that are
the Assessment. The most signifi cant overall impacts of global change
addressed in various parts of this analysis (Members of the GIWA Task
include:
team pers. comm.).
Freshwater
availability;
Food security and availability;
Conclusions and future outlook
Changes in productivity of agriculture, fi sheries and forestry;
Management of inshore and subsistence fi sheries is undergoing a
Human
migration;
paradigm shift towards co-management in recognition of the need for
Increased costs of human health care.
sustainable use of resources. It remains to be seen whether this will be
36
GIWA REGIONAL ASSESSMENT 62 PACIFIC ISLANDS
An examination of paleoclimatic and geological events shows that
Prime Minister, who stated that three islets in his country have been
factors associated with global change, such as changes in sea level and
submerged due to sea level rise. The team noted that although the
sea surface temperature have been integral to the evolutionary history
IPCC (Mitchell et al. 2003) reported a 1-2 mm sea level rise on a global
of the Pacifi c Islands. Their largely volcanic origin also means that the
average per year, the fi gure for some of the Pacifi c Islands is much
geological history of the Pacifi c Islands is at best indirectly linked to that of
higher, approximately by 10 times (e.g. Tonga 20 mm per year, Solomon
adjacent continental plates and the tectonic events associated with them.
Islands 22 mm per year), whereas in others it may be close to the IPCC
The diffi
culty of dealing with global change is that data are imprecise
predictions, or lower (e.g. Samoa). The South Pacifi c Sea Level and
and are the subject of a variety of predictions and scenarios that are not
Climate Monitoring Project (Flinders University, Australia) monitors sea
always agreed upon by the scientifi c community and that are not easily
level rise in selected Pacifi c Island locations through the deployment
understood by the non-scientist. Furthermore, global change is largely
of a series of tide gauges. Data from long-term (more than 50 years
the result of human-related activities far away from the Pacifi c Islands
records) sites show a mean annual increase in sea level of 1.07 mm.
region: the people feel vulnerable, and cannot do much to change the
When more stations are included in the records (those with more than
course of events. Predictions of the disappearance of some of the islands
25 years records), the mean is lowered to 0.8 mm/year (i.e. lower than
in the atoll countries, for example, are already proving to be correct.
the IPCC estimates). It is thus not clear whether there is an acceleration
in rate of sea level rise (Mitchell et al. 2003). As there are many factors
The diff erence between the past and the present, however, is in the
that infl uence the measurement (and prediction) of sea level changes
rate and scope of global change: there seems little disagreement that
over time, it is likely that the jury will remain out for some time on this
sea levels are rising and that sea surface temperature is increasing at
complex issue.
much faster rates than in the past. These changes are going to have a
major impact on the health of coral reefs, which are the life-blood of
Increased UV-B radiation
the Pacifi c Islands. They are also going to signifi cantly aff ect the socio-
The United States Department of Energy's Atmospheric Radiation
economics of the Pacifi c Islands countries, which depend on their marine
Measurement (ARM) Programme collects data from its Tropical Western
environment for their income and well-being. Corals in the Pacifi c Islands
Pacifi c (TWP) locale, which lies roughly between 10░ S to 10░ N, and
are growing close to their maximum survival temperature, and sustained
135░ E to 150░ W (Clements et al. 2000). The data shows that UV radiation
elevated temperatures of even 1-1.5░C above average can result in coral
in the Pacifi c Islands regoion is not excessively high (compared with
bleaching and/or coral mortality. Increases in the incidence of coral
Australia for example).
bleaching in the region are strong evidence of the kinds of changes
that are occurring, but their impact on biodiversity and the fi sheries is still
Ozone plays an important role in absorbing harmful ultra-violet
poorly understood. At the same time, increases in UV-B radiation caused
radiation (UV-B). Increased exposure to UV-B results in increased levels
by the ozone "hole" over the South Pole, and changes in the ocean's CO
of skin cancers in humans. Increased levels of UV-B are also known to
2
source and sink functions will have signifi cant negative eff ects on human
be harmful to living, aquatic organisms. The Montreal Protocol, which
health, and on the future health of coral reefs, respectively.
came into force in 1989, is a landmark agreement designed to protect
the atmospheric ozone layer, and Pacifi c Island countries are parties to
Environmental impacts
the agreement. The Montreal Protocol's Multilateral Fund supports the
Changes in hydrological cycle
Pacifi c's Regional Strategy to comply with the protocol (covering eight
A moderate impact is noted for the region. This is evident in the
core countries: Fiji, Federated State of Micronesia, Marshall Islands, Palau,
increasing frequency of extreme events such as fl oods and drought.
Solomon Islands, Tonga, Tuvalu and Vanuatu). These governments have
Better documentation of this phenomenon is however required
committed themselves to a total CFC phase-out by 2005 (SPREP 2003).
(Members of the GIWA Task team pers. comm.). The Intergovernmental
Panel on Climate Change (IPCC) reports prepared by Pacifi c Island
Participating countries are party to the Pacifi c Islands National
countries are one useful reference source on this topic.
Compliance Action Plan which requires:
Establishment of national ozone unit offi
ce and committee;
Sea level change
Public awareness and education;
Due to the vulnerability of many islands and atolls to encroachment
Establishment of licensing and monitoring systems;
by the sea, the issue was considered to have a severe impact. The
Training of trainers, and subsequent training of refrigeration
seriousness of sea level changes was recently raised by the Tuvaluan
technicians, on good practice refrigeration;
ASSESSMENT
37
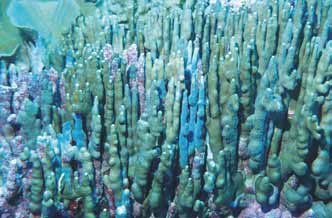
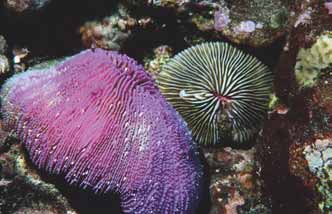
Figure 10 Mushroom corals, Ofu, American Samoa.
Figure 11 Blue corals, Swains Islands, American Samoa.
(Photo: A. Cronish, Reefbase)
(Photo: A. Cronish, Reefbase)
Training
of
customs
offi
cials on monitoring and control of Ozone
(Wilkinson & Buddemeier 1994) and, in a worst case scenario for a low-
Depleting Substances (ODS) imports;
lying country like Tuvalu, loss of entire nations. Thus, a threat such as
Consideration of tax incentives to promote use of substitutes and
increases in atmospheric CO could have a signifi cant impact on the
2
alternative technology;
region. In a less dire prediction, Hughes et al. (2003) comment that
Ban on new installations and equipment using controlled ODS;
reefs will change rather than disappear entirely, as changes in species
Ban on imports of CFCs and other ODS (except hydrochlorofl uoro
tolerance and species composition occur (Figures 10 and 11).
carbons) with exemptions for essential uses.
Increase in sea surface temperature
Changes in ocean CO sources/sink function
The increase in coral bleaching events in the Pacifi c Islands region e.g.
2
At present, there is a large defi ciency of knowledge as well as data for
Palau bleaching in 1998, southwest Pacifi c bleaching aff ecting Solomon
the region, although the high percentage of coral reefs found within the
Islands, Fiji and Tonga in 2000 and 2001, as a result of increased sea
Pacifi c Islands (no accurate measures of the area of coral reefs exist for
surface temperature exerted severe impacts on the region. Cumming
most countries in the Pacifi c), should be considered if there are changes
et al. (2002) reported in detail on the mass coral bleaching in the Fiji
to ocean CO concentrations. Hughes et al. (2003) state that projected
Islands in 2000. 64% of all scleractinian corals surveyed were bleached
2
increases in CO and temperature over the next 50 years exceed the
(partially or fully), in all regions except the far north of Vanua Levu Island.
2
conditions under which coral reefs have fl ourished over the past half-
At southern sites, more than 80% of colonies were bleached. It was
million years. As noted elsewhere in this report, healthy coral reefs are
estimated that 10-40% of coral colonies had died from bleaching within
fundamental to the food security and protection of the Pacifi c Islands.
4 months of the onset of the bleaching. Post-bleaching surveys of the
However, if concentrations of atmospheric CO continue to increase,
Suva Barrier Reef and Beqa Lagoon in Fiji did not, however, detect any
2
they will cause a concomitant increase in the acidity of the sea water
immediate changes in fi sh stocks, although longer-term changes are
which will, in turn, cause a decline in the available carbonate for the
still being monitored (Carlson unpublished). The impact of the 2001
skeletons of corals and other calcareous marine organisms (Wilkinson
bleaching was less marked in Fiji. Recovery is occurring in most sites,
& Buddemeier 1994, Hoegh-Guldberg 1999, Souter & Linden 2000).
although changes in coral species biodiversity have occurred. At Palolo
Although the available published evidence and predictions do not
Deep Marine Reserve in Samoa, bleaching of shallow-water corals is a
relate directly to the Pacifi c Islands, Hoegh-Guldberg (1999) predicts
result of extreme low tides; recovery of these communities (dominated
that, at the present rates of increase of atmospheric CO concentrations,
by Acropora spp.) is rapid (Skelton unpublished). A number of Array of
2
the rate of calcifi cation of corals will decrease by between 14% and 30%
Real-Time Global Observation (ARGO) fl oats were being deployed in the
by the year 2050 and a net loss of calcium from the system through
Pacifi c Islands region, including those under the Scientifi c Educational
physical and bioerosion will weaken the framework of reefs. Once the
Resources and Experience Associated with the Deployment of Argo
structural integrity of the reefs is compromised, the reef itself can be
(SEREAD) project, to monitor environmental parameters such as
rapidly eroded resulting in the destruction of coastlines, loss of housing,
temperature, salinity and current movement. The University of the
tourism and coastal ecosystems such as mangroves and seagrass beds
South Pacifi c has recently established a Pacifi c Centre for Environment
38
GIWA REGIONAL ASSESSMENT 62 PACIFIC ISLANDS
and Sustainable Development to serve as a focal point for integrated
where all sectors of the community are vulnerable and deaths have
study of environment and sustainable development issues. The Global
occurred, especially among children.
Coral Reef Monitoring Network (GCRMN) operates in the Pacifi c Islands
region through various nodes (Wilkinson 1998, 2000, 2002).
Other social and community impacts
The most important impacts were identifi ed as employment security;
Socio-economic impacts
changes in resources distribution and political jurisdiction over them;
Economic impacts
human migration due to inundation of coastal areas; salination of
Global change will have far-reaching economic impacts on the region,
groundwater; and damage to human life and property from storm
as already outlined under this concern. An analysis of the economic
surges, increased cyclonic events (Members of the GIWA Task team pers.
impacts would be a major undertaking in itself, far beyond the scope
comm.). For example, on the Carteret Islands (Papua New Guinea), low-
of this report, since all aspects of life will be aff ected, most importantly
lying islands some 200 km from Bougainville, serious increases in sea level
those associated with freshwater availability; food security; changes in
rise and increases in storm surges in the past few years have rendered
productivity of agriculture, fi sheries and forestry; human migration; and
some of the islands uninhabitable. The people who inhabit these islands
increased costs of human health care (Members of the GIWA Task team
were relocated there during the Bougainville civil war. These people
pers. comm.).
have extensively dynamited the reefs around the Carteret Islands. There
is some disagreement among experts as to whether the changes are
Economic issues often override environmental concerns in government
the result of reef destruction, or sea level rise, or a combination of both.
planning and policies. There is a trend towards recognition of the need
The situation there does, however, characterise events likely to occur
for more integrated planning, to comply with global conventions
more frequently in the Pacifi c Islands in the future.
and agreements through the development of appropriate national
laws and regulations, and a number of Pacifi c Island countries have
Conclusions and future outlook
drafted or have even enacted new environmental laws and policies
Global change will continue to have a major infl uence on all aspects
which recognise these needs. These are, however, the exceptions: the
of the lives and economies of Pacifi c Island peoples for the indefi nite
sustainability ethic is widely spoken about, but in reality is an almost
future. Much will depend on the rate and extent of changes, which are
unachievable goal given the fi nancial and socio-economic constraints
unevenly distributed in the region, and on how numerous strategies on
under which governments have to work. Small populations, inadequate
the part of the international community will ameliorate the impacts. It
funding, lack of the necessary human resources and lack of political will
is clear that even in the most modest scenarios, changes will continue
are all contributing to the current situation that is leading to more and
well into the present century; if the more extreme predictions occur,
more destruction and modifi cation of habitats and ecosystems in the
then most of the atoll nations will disappear beneath the ocean,
Pacifi c Islands. There is also a long-standing dependency on donors
and coastlines and communities around most of the high islands
(who are often the same countries that were once colonial governors),
will be inundated within the next 50 years. Serious socio-economic
and donor policies have in themselves been strong external driving
consequences are inevitable in such situations. In the end, it will be
forces. There has also been, regrettably, a culture of corruption in
merely academic to argue about the actual levels of change; some
some countries where government or private sector leaders have
islands are already disappearing in Tuvalu, and discussions are on-
compromised standards or ethics in return for under the table deals
going with the New Zealand Government who has off ered to accept
with outsiders willing to fund major developments.
the Tuvaluan people when they become environmental refugees. The
impacts will occur at every level of society and in every sector, and will
Health impacts
require substantial changes in all public and private institutions. Regular
The health impacts are related to changes in diet because of depletion
monitoring of marine and coastal ecosystems, improved prediction of
of local fi sh stocks and the use of imported and inferior foods such
cyclones, tsunamis and ENSO events will be required to assist Pacifi c
as tinned fi sh, resulting in increases in non-communicable diseases;
Island countries prepare for the impacts of global change. Many of
reduced availability of potable water supplies which is becoming
these systems are in place, but what is needed are improved ways of
prevalent throughout the region and increasing the risk of water-borne
distilling the results into language that is understandable by civil society.
diseases such as hepatitis, increased incidence of vector-borne diseases
Amelioration of the eff ects of global change at the country or local
such as malaria and dengue fever (Members of the GIWA Task team pers.
level will require a much greater understanding of the issue, and how
comm.). Dengue fever outbreaks have been serious in Fiji, for example,
it impacts on almost every aspect of daily life.
ASSESSMENT
39
Priority concerns for further
in the assessment section above, Global change diff ers from each of
analysis
the other major concerns because its root causes tend to originate
beyond the borders of the region, making them extremely diffi
cult to
On the basis of information incorporated into the assessment and the
manage or mitigate. The root causes of Overexploitation of fi sh and
most likely future scenario, it was concluded that all issues, apart from
other living resources, Habitat and community modifi cation, Pollution
those relating to improved control of fi sheries, were going to deteriorate
and Freshwater shortage, on the other hand, tend to be local and are
during the next 20 years, and that the most important cross-cutting
therefore, more amenable to policy interventions. As a consequence,
concern was Global change, since the magnitude of the impacts of
the Causal chain analysis focused on a number of case studies that
many of the issues assessed is infl uenced directly or indirectly by climate
covered several of the major concerns and were representative of some
change.
of the more severe problems that are aff ecting the Pacifi c Islands region
identifi ed in the assessment namely, Freshwater shortages caused
Considering the likely impacts of each of the major concerns on the
unsustainable use of groundwater resources, modifi cation of stream
Pacifi c Islands region during the next two decades, the following order
fl ows caused by alterations of land-use patterns and variation in climatic
of priority was established among the major concerns for the allocation
patterns, overexploitation of living resources through overfi shing and
of eff ort for environmental and socio-economic remediation:
the use of destructive fi shing techniques and the decreased viability of
1. Global
change
fi sh stocks caused by pollution and disease.
2. Overexploitation of fi sh and other living resources
3. Habitat and community modifi cation
4. Pollution
5. Freshwater
shortage
Although the Pacifi c Island states have become important advocates
regarding the impacts of climate change because of their vulnerability,
initiating remedial eff orts to adequately address Global change in the
immediate future will be diffi
cult. In a precious few cases the infl uence
of Global change is obvious, for example, the prevalence of extreme
droughts caused by the increasing magnitude and frequency of
El Ni˝o events or the decline in live coral cover caused by bleaching
that is induced by elevated sea surface temperatures. For the most
part, however, environmental and socio-economic impacts that are
directly attributable to Global change are, at present, obscured by the
consequences of other, more demonstrably deleterious anthropogenic
activities such as the use of destructive fi shing techniques or the
discharge of toxic effl
uents. In addition, there is a lack of precise data,
a variety of diff erent scenarios looking into the future and a lack of
agreement of details by diff erent scientists. Moreover, the impacts of
Global change are highly complex, and are likely to vary among the
diff erent island types of the Pacifi c and be exacerbated by a number of
social and economic issues, particularly high population growth rates
in some countries, migration from rural or high land to urban (coastal)
areas, continued breakdown of traditional lifestyles, shortage of land
and loss of soil quality, deterioration of health, increased dependency
on aid, and evolution to the cash economy.
While the current and potential future impacts of Global change and
its infl uence of each of the other major concerns have been described
40
GIWA REGIONAL ASSESSMENT 62 PACIFIC ISLANDS
Causal chain analysis
This section aims to identify the root causes of the environmental and socio-economic impacts resulting from those issues and concerns
that were prioritised during the assessment, so that appropriate policy interventions can be developed and focused where they will
yield the greatest benefi ts for the region. In order to achieve this aim, the analysis involves a step-by-step process that identifi es the
most important causal links between the environmental and socio-economic impacts, their immediate causes, the human activities
and economic sectors responsible and, fi nally, the root causes that determine the behaviour of those sectors. The GIWA Causal chain
analysis also recognises that, within each region, there is often enormous variation in capacity and great social, cultural, political and
environmental diversity. In order to ensure that the fi nal outcomes of the GIWA are viable options for future remediation, the Causal
chain analyses of the GIWA adopt relatively simple and practical analytical models and focus on specifi c sites within the region. For
further details on the methodology, please refer to the GIWA methodology chapter.
Freshwater shortage
There is a general lack of data on freshwater supply issues in the Pacifi c
Inadequate
eff ort to promote and raise awareness of sustainable
Islands region. The issue of water management has been thoroughly
use of water;
discussed in the region in various forums. In one of the recent forums
Legislation needs to be applicable and enforced to address water
held in June-July 2002 in Sigatoka, Fiji, various country representatives
abuse and wastage;
voiced the issues that they faced in their homelands.
In small atolls, bore holes are situated too close to the sea and
become contaminated by saltwater;
There is a common element on the various issues, which is applicable
Increasing
populations
continue
to
place
pressure
on
water
throughout the region. Some of the issues include:
supply;
Need for freshwater management through improved monitoring
Land use and ownership confl icts between communities and
regimes;
governments;
Infrastructure to address water quality and contamination,
Lack of community participation in the development of government
especially in periods of droughts or heavy rains;
policies, especially on issues that aff ect the communities (such as
More transparent government policies that are applicable to the
water metres);
local scenario;
The lack of a code of practice on the use of chemicals in industries
Lack of funds to upgrade facilities;
(e.g. pesticides in agriculture), having the potential to pollute the
Lack of capacity in water management, which is exacerbated by
water supply.
the lack of opportunities for local staff to undergo appropriate
training;
CAUSAL CHAIN ANALYSIS
41
Burns (2002) has written a detailed review on water resources and
The Ba River drainage basin (Figures 12 and 14) is located on the
the impacts of climate change on Pacifi c Island countries, stating that
northwestern side of Viti Levu, and is the third largest fl uvial system in
freshwater is "an imperilled, extremely limited resource in most PIDCs".
Fiji, draining an area of 937 km2. A diff erence between the Ba and Rewa
According to a World Bank study, only 50-70% of the residents of Samoa
drainage basins is that the latter is a centre of sugar cane growing. The
and 44% of the residents of Kiribati have access to safe water (Hoegh-
average fl ow rates are 10 m3/s in dry seasons and 60 m3/s in wet seasons.
Guldberg et al. 2000), and this is reduced to 10% in Papua New Guinea
During the 1994 sugar cane crushing season, dissolved oxygen fell to
(Lauerman 1997) (see also Table 5). Current and future water shortages
near zero along at least 7.5 km of river length, due to the presence of
are attributed to rapid population growth, lack of infrastructure and
mill wastes, which have a high BOD. Faecal coliform bacterial levels
natural and anthropogenic factors. Other threats identifi ed by Burns
are elevated both during crushing and post-crushing seasons, and the
(2002) include sea level rise, pollution, and ENSO-related droughts.
sugar mill causes most of the oxygen depletion. The major reference
for the Ba catchment is by Anderson (1997).
Two of the three issues included within Freshwater shortage are
addressed below. Although modifi cation of stream fl ow exerts only a
The causal chain diagram for the issue modifi cation of stream fl ow in
slight impact at the regional scale, this issue is of signifi cant importance
Rewa and Ba river basins is presented in Figure 15.
to some of the high islands in the region (e.g. Fiji).
Environmental impacts
The environmental impacts are the change in river characteristics,
which include:
Modification of stream flow ş
Changes in fl ow;
Rewa and Ba river basins
Changes in sediment load;
Changes in chemistry;
The Rewa River drainage basin is located in eastern Viti Levu, Fiji
Changes in microbiology.
(Figures 12 and 13), and is the largest fl uvial system both in Fiji and
the tropical South Pacifi c Islands in general. The Rewa Basin spans
Immediate causes
2 900 km2, or approximately 1/3 of the island of Viti Levu. It has a
Increased sediment loads
recorded history of major fl oods, and its major tributary the Wainimala
Until the middle of 1991, no measurements had been made on the
River gives rise to high sediment yields. Much of the suspended load is
amounts and composition of the suspended solids in the Rewa River
from bank erosion. The 3.2 cm/year accretion rate in Fiji exceeds rates
(Togamana 1995). Hasan (1986) used a range of formulas to calculate
reported from other fl uvial systems in the region. The catchment is
the relationship between the discharge and the sediment load for
subject to very high use from agriculture and forestry; it is likely that
the Rewa River, and he estimated that the average sediment load
very little if any of the catchment has been unaff ected by humans, and
was approximately 10 million tonnes per year. Morrison (1981), Hasan
most of the forest areas are of secondary growth. The major references
(1986) and Nunn (1990) estimated that soil loss in the Rewa catchment
for the catchment are those of Terry et al. (2001, 2002).
was 34 to 36 tonnes/ha/year and stated that the losses in the four main
tributaries of the Rewa stood at: Wainimala 30 tonnes/ha/year, Waidina
Elevation/
Depth (m)
69 tonnes/ha/year, Wainibuka 24 tonnes/ha/year and Waimanu
1 000
79 tonnes/ha/year. The Fiji Government, since 1983, has spent about
500
200
Ba
6 million USD annually on dredging in order to alleviate the problem
100
Ba
0
of fl ooding in the Rewa and other rivers (Togamana 1995).
-100
Wain
-200
ibuka
-1 000
Wainimala
Viti Levu
Decreased water fl ow
Rewa
The decrease in the low water fl ow is attributed to two main factors: (i)
Waidina
New Guinea
decrease in rainfall, and (ii) increase in water-uptake through commercial
Waimanu
Fiji
Suva
aff orestation. In the Ba River, average fl ows are aff ected during the dry
Australia
months due to changes in the rainfall patterns and average river fl ows
0
50 Kilometres
New Zealand
ę GIWA 2004
are 10 m3/s in dry seasons and 60 m3/s when wet (Anderson 1997).
Figure 12 Location of the Rewa and Ba rivers, Viti Levu, Fiji.
Rainfall seasonality is more pronounced in the northwest region,
42
GIWA REGIONAL ASSESSMENT 62 PACIFIC ISLANDS
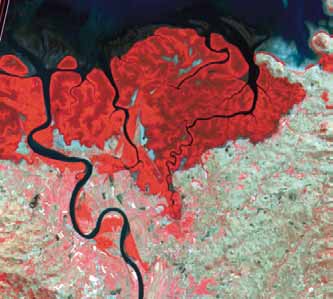
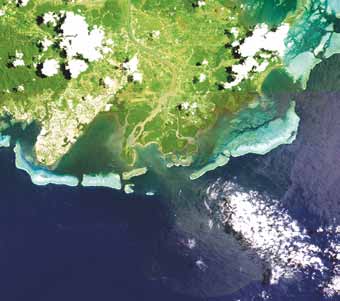
Figure 13 Satellite image of the Rewa River and delta.
Figure 14 Satellite image of the Ba River and delta.
(Photo: SOPAC)
(Photo: SOPAC)
which receives only 20% of the annual rainfall total of approximately
forestry industry is a big money earner for the Government, raking in
1 900 mm in the dry months (Terry & Raj 1998). This results in rivers
over 38 million USD in 1995 (Hasni 2003).
in the northwest experiencing very low stream base fl ows causing a
severe depletion of available water resources (Terry & Raj 1998). Capital
Agriculture
developments have encouraged the planting of fast growing and
The promotion of economically important cash crops such as ginger,
economically important timber trees since the 1950s. In Fiji, 60 000 ha
which was cultivated in the Rewa river catchment, led to severe erosion,
of pine were planted in areas that were once covered by grassland. This
siltation and massive fl ooding of cropping land in the lower reaches of
may have led to excessive uptake of water and a reduction in the dry
the River (Anon 2003).
season water fl ow by 50-60%, putting the operation of a hydroelectric
plant and drinking water supply at risk (FAO 1987).
Urban
There are growing problems in major urban areas (e.g. Suva, Fiji) with
Industrial point source discharges
respect to supply of potable water and to supply of water to industry.
In addition to this, Ba Town is home to a sugar mill and a number of
Part of the problem lies in increasing population pressure and is due,
light industries, which produce signifi cant volumes of pollutants and
in part, to inadequate reticulation and sewage disposal infrastructure.
have some potential for accidental spills (Fagan et al. 1995). Also, the
In the Ba River, the presence of a sugar cane mill adds to problems of
construction of dams and mining contribute to low stream base fl ows,
water supply, and in Suva most industries are concentrated in the peri-
but dams are not that common in the Pacifi c and the mining areas in Fiji
urban area, including the Rewa catchment area.
are not in the vicinity of the chosen areas for this particular case study.
Root causes
Sectors
Knowledge ş Poor public awareness
Forestry
There is a major need to increase public awareness of issues relating to
Approximately 44% (835 000 ha) of Fiji's landmass is composed of
water shortage and associated problems. This need has been expressed
natural forest, concentrated in the wetter parts of the country. About
in many reports relating to water use in Fiji (see for example Kaloumaira
84% of the forests belong to the traditional owners, with the State
2000). The impacts and implications of inappropriate land use are well
owning 7% and the remaining being 9% freehold. Extensive areas of
understood by government, but poorly understood by stakeholders;
Viti Levu and Vanua Levu as well as other smaller islands have suff ered
regulations are also poorly enforced. The impacts of natural phenomena,
severe deforestation; and aff orestation and reforestation have been
such as droughts induced by ENSO, for example, have been investigated
actively pursued since to ease pressure on virgin forest resources. The
in detail and the resulting socio-economic eff ects have been analysed
CAUSAL CHAIN ANALYSIS
43
Issues
Immediate causes
Sectors/Activities
Root causes
Legal ş Regulations and property rights
Knowledge ş Poor public awareness
Modification of
Agriculture
Increased sediment load
streamflow
Governance ş Lack of policy integration
and enforcement of regulations
Socio-cultural ş Disintegration of
Decreased water flow
Forestry
traditions and changes in lifestyles
Economic ş Promotion of industrial
development
Industrial point source
discharges
Urban
Technology ş Access to technology
Natural phenomena ş Droughts
associated with El Ni˝o
Decreased precipitation
Global warming ş Anthropogenic factors
Figure 15 Causal chain diagram for the issue modifi cation of stream fl ow in Rewa and Ba river basins.
(Kaloumaira 2000). Intensive vegetable growing in the Rewa catchment
hydroelectric power generation (dams), small-scale agriculture, forestry
has resulted in increasing incidences of fl oods and soil erosion; this is
practices and subsistence farming.
mostly carried out by Chinese-Fijians, who totally depend on their crops
for income and security. The apparent abundance of water in Fiji needs
Governance ş Policy integration and enforcement
to be understood in the context of the growing pressures on supplies,
There is a National Code of Logging Practice, and there is a move towards
and the need to develop appropriate conservation and use strategies.
sustainable forest management, but this is inadequately enforced. A
None of these will work without the full participation of stakeholders
multi-disciplinary approach involving a number of diff erent government
who must, in turn, understand the immediate and longer-term impacts
departments (e.g. Lands, Mining, Agriculture, Forestry, Native Land Trust
of inappropriate water use practices.
Board, etc.) is needed for water management. The establishment of
appropriate bodies relating to policy and enforcement is recognised
Economic ş Promotion of industrial development
in Fiji, and it will be important for this to be eff ective over the coming
The government continues to promote industrial developments to
years. In a broader context, Fiji is currently developing a national Land
ensure a viable economy leading to improving the livelihood of the
Use Policy, which is inter-sectoral in nature. In recognition of catchment
people. In pursuing these aspirations, compromises are made to allow
management problems, the Fiji Government is now putting more
investors and industries to operate. Some of the great money earning
resources into land use issues and there is a section devoted to land
industries for the State includes the agriculture, forestry and tourism
and water usage. Fiji has also convened its fi rst inter-sectoral, high level
sectors. These important sectors have contributed to a high demand
National Water Committee. At the regional level, the GEF-funded and
on natural resources such as timber and water.
SPREP-implemented International Waters (IW) project includes important
strategies addressing freshwater. The establishment of case study sites
Legal ş Regulations and property rights
in selected countries will enable progress towards implementation of
The majority of the Rewa and Ba basins fall under native title: property
the SOPAC Action Plan. It will be important to ensure sustainability of
rights are proving to be an important issue in Fiji and require a close
these initiatives once the IW project has been completed, and for other
working relationship between the owners and the government.
demonstration sites to be identifi ed in those countries where they are not
Regulations relating to water catchments and land use developed
included under the IW programme. Wherever possible, linkages between
by the government will have little eff ect unless the stakeholders
IW and the SOPAC Action Plan should be developed and strengthened.
(traditional owners) are party to their enforcement and are part to their
development. A consultative process is in place between government
Socio-cultural ş Traditions and life styles
and stakeholders, and this must be an on-going and constructive
The Fijian people have long-standing traditional lifestyles centred
one if sustainable water use is to occur. The important issues include
on their villages, closely related communities (tikina) and the chiefl y
44
GIWA REGIONAL ASSESSMENT 62 PACIFIC ISLANDS
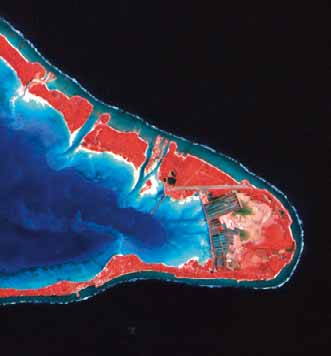
system. As mentioned elsewhere in this report, traditional systems
Technology ş Access to technology and technological trends
are breaking down, and the largely sustainable lifestyle associated
Access to appropriate technology and technological trends will
with these systems is also in disarray. This has been brought about by
be important for managers of catchments and water supplies. The
the cash economy and urban drift, as well as by population increases.
delivery of piped domestic water is limited to urban areas, and many
A revitalisation of traditional values and lifestyles could go some way
of the systems in place are old and unreliable (leading to the many
towards sustainable use of water resources, but the impact is likely to be
water shortages, and water wastage, experienced by residents of Suva,
localised and insuffi
cient in terms of the nation as a whole. The use of
Fiji). Water treatment and recycling is inadequate because of costs of
traditional values will, however, be an invaluable part of the awareness
the necessary technology; this is causing serious pollution of inshore
raising aspects of water use.
waters and damage to fragile coral reef ecosystems (and hence the reef
and lagoonal fi shery). There is limited use of groundwater for irrigation
Natural phenomena ş Droughts associated with El Ni˝o
of crops (e.g. in the Sigatoka Valley, where some shallow bores are in
Much has been written about recent El Ni˝o events and their impacts
use). Water monitoring technology is available but costly. Warning
on Fiji (Kaloumaira 2000). The 1997-1998 El Ni˝o event had an
systems for events such as cyclones and El Ni˝o are good, with up-
unprecedented impact on Fiji, including severe drought. According
to-date technology available to meteorologists. Disaster management
to Kaloumaira (2000) there have been frequent occurrences of ENSO
strategies and response mechanisms are in place.
events in the last three decades (e.g. 1957, 1965, 1969, 1977, 1982, 1987,
1991-1995, 1997), with a negative eff ect on rainfall (contrasting with a
positive eff ect on rainfall in the intervening La Ni˝a events; 1971, 1973,
1975, 1989, 1996). For example, the 1982-1983 El Ni˝o in Fiji caused
Changes in water table ş
the country's worst drought in more than 100 years. This record was
Bonriki freshwater lens
surpassed by the drought resulting from the 1997-1998 El Ni˝o, when
most parts of Fiji experienced 20 to 50 % below normal rainfall. The
The site chosen for the case study is the Bonriki freshwater lens, South
impact was especially severe in western Viti Levu, where it aff ected
Tarawa, Kiribati (Figure 16). There is a strong database on this site, which
the sugar cane crop with approximately 25% of the crop destroyed.
has been intensively studied by a number of agencies, although many
In addition, it was estimated that losses in the vegetable crop harvest
of these studies are in limited distribution consulting reports. Bonriki is
were in the range of 50% during the 1997-1998 drought. According to
the Fiji Natural Disaster Profi le (n.d.), a total of 263 455 people (i.e. more
than 25% of the population) were aff ected by the 1998 drought. The
drought also aff ected forests growing on thin, poor soils, and increased
the incidence of fi res. By contrast, access to forests was easier during
the drought, thus improving access to trees for logging. Shortages of
domestic water supplies were evident in most urban communities,
but many of these were more related to delivery systems than actual
water availability. In other areas of the western Pacifi c, there have been
up to 87% reductions in rainfall during the past two decades, and
40 atolls in Micronesia have run out of water during an ENSO event
(Tutangata 1996).
Global warming ş Anthropogenic factors
Global warming has impacts across all sectors in the Pacifi c Islands.
Measurement of its impact on water supplies per se is diffi
cult, but with
forecast increases in the incidences of El Ni˝o, ENSO and sea surface
temperatures, there will be long-term follow-on eff ects on the small
and vulnerable land masses of the Pacifi c Islands and, ultimately, on
water supplies.
Figure 16 Satellite image of part of Tarawa Atoll, Kiribati.
(Photo: SOPAC)
CAUSAL CHAIN ANALYSIS
45
Environmental impacts
5 000
The environmental impacts include:
Hypothetical demand
4 000
Saline
intrusion;
Up coning and deterioration in groundwater quality;
3 000
l
l
(mm)
f
a
Intermittent
water
supply.
i
n 2 000
Ra
1 000
Immediate causes
0
Excessive pumping
1947
1952
1957
1962
1967
1972
1977
1982
1987
1992
1997
Year
The freshwater lenses on the islands of Tarawa Atoll are up to 30 m thick
Figure 17 Annual rainfall, Tarawa Atoll and hypothetical water
and the current total pumping capacity of the Bonriki freshwater lens is
demand, 1947-1998.
(Source: White et al. 1999b)
approximately 1 000 m3/day (Falkland 1992). The increased demand for
water from the Bonriki and Buota lenses has led to excessive pumping
located at the southeastern corner of Tarawa Atoll, with a population of
which, in turn, reduces the capacity of the lens and puts extra strain on
35 000. About 35 km in length, the atoll is not more than 1 230 m wide.
the resources. As a consequence, the authorities had placed restrictions
Rainfall is highly variable on a year-by-year basis, with the most recent
on water use.
fi gures shown in Figure 17.
Reduced recharge from decreased precipitation
This rainfall variation means that periods of drought are not uncommon.
Extended low rainfall periods in 1998 and the early part of 1999,
Freshwater use per capita per day is 50 l. Bonriki supplies about 75% of
particularly in South Tarawa may have contributed to the dramatic
the public water for the people of South Tarawa, with a pumping rate
increases in salinity in domestic wells, the death of some trees, die-
(1992) of 1 000 m3/day (Metai 2002). A reduction of 25% in rainfall causes
back in others, rainwater tanks running dry and an increasing demand
a 64% reduction in the freshwater lens thickness if pumping rates are
on potable, reticulated water (White et al. 1999a, b).
maintained at 1 000 m3/day. The eff ect of vegetation recharge is such
that 80% tree cover would reduce recharge to 35% (Alam & Falkland
Sectors
1997). It was noted that a single coconut tree disperses approximately
Agriculture
150 l per day.
Excessive pumping by the agricultural sector contributes to
changes in the water table. Copra continues to be an important
The main water sources are groundwater, rainwater, and desalination.
money earner for the national economy accounting for up to 62% of
The water supply coverage is 47%, and access to safe water is 76%,
exports (Falkland 2001), which means the growing of coconut trees is
with a total of 25 000 people supplied. The Bonriki freshwater lens is
encouraged. Moreover, subsistence farming through the planting of
managed by the government (75% of water supply for South Tarawa).
other food crops such as breadfruits, pandanus, pawpaws, bananas
There are two other lenses, but these are contaminated by oil (possibly
and swamp taros all contribute to the consumption of water. As
from industrial and/or poorly maintained storage facilities), and this
stated previously a coconut tree is capable of consuming up to
has led to restricted water usage. A diffi
culty with the desalination
150 litres of water per day, which is as much as a household of fi ve
plant was that it was built inland, and took some of its water supply
people (White et al. 2000).
from the lens.
Urban
The data collected for the Bonriki lens simplify the linkages between
The high population growth rate in urbanised South Tarawa is
the immediate causes and sectors, but the root causes, as elsewhere,
attributed to both increased births and immigration of outer islanders.
are diffi
cult to link. The increased coconut production is leading to
Furthermore, illegal occupation of water reserve areas is exacerbating
increased water use, which in turn leads to saline intrusion. The main
the declines in the quality of the water supply with early indication
concern identifi ed for policy consideration was saline intrusion.
of water pollution attributed to on-site developments. This factor,
together with the inadequate facilities and infrastructure (e.g. poor
The causal chain diagram for the issue changes in water table in the
utilisation of rainwater tanks) available, all place demands on the water
Bonriki freshwater lens is presented in Figure 18.
supply system that exceed the system design specifi cations (Tebano
1996, Crennan 1998). Moreover, illegal connections, reticulation
46
GIWA REGIONAL ASSESSMENT 62 PACIFIC ISLANDS
Issues
Immediate causes
Sectors/Activities
Root causes
Economic ş Subsidies and
economic development
Legal ş Resouce
Changes in
Agriculture
ownership
Excessive pumping
water table
Governance ş Lack of
Reduced recharge from
management capacity
Infrastructure
decreased precipitation
provision
Demographic ş
Population growth,
immigration
Urban
Natural phenomena ş
Changing weather
patterns
Figure 18 Causal chain diagram for the issue changes in water table in Bonriki freshwater lens.
leakages and water wastage have resulted in the intermittent supply
0.80 USD/m3. This unsustainable level of operation, despite government
from the reticulated water system (Falkland 1992).
subsidy, will continue to plague water availability to the people unless
serious actions are adopted to curtail this practice. It would seem that
Infrastructure provision
the subsidy might create a sense of security to users, and lessen any
The current infrastructure that is employed at the two water lenses
tendencies to economise.
(Bonriki and Buota) consists of 24 galleries (18 at Boniriki and 6 at Buota).
These galleries consists of 300 m long slotted PVC pipe laid below
The planting of food crops and economically marketable crops will
the water table and pumping approximately 55 m3/day. Continuous
no doubt be encouraged as part of the government's development
pumping is maintained to minimise the impact of the pumping on the
initiatives. These necessary developments and initiatives come at the
water lens (Metai 2002). The public water supply has been unable to
expense of available potable water to the people.
meet the demand due to high losses (50% leakage) in the distribution
pipelines (SOPAC, in Metai 2002).
Governance ş Lack of management capacity
The capacity to manage water supply needs to be addressed as the
Root causes
current scenario has failed to curb illegal connections, leakages and
Legal ş Resource ownership
water wastage.
Issues concerning the ownership of the land in which the water lens
exists must be addressed. Parts of Bonriki have been reserved for the
Natural phenomena ş Changing weather patterns
airport and to supply water for the public. Confl icts have arisen as
The severe weather pattern experienced in 1998 and 1999 has impacted
traditional owners become suspicious of the Government on the use
signifi cantly on the water availability to the community. The World Bank
and compensation of their land (Crennan 1998).
estimated that the climate change impacts on the groundwater are
costing 1.4 to 2.7 million USD per year (Metai 2002). Alam and Falkland's
Demographic ş Population growth and immigration
(1997) computer simulation model indicated that any changes in the
The inundation of urban areas through immigration from outer areas
rainfall would have a signifi cant impact on the freshwater lens. The
in search of better opportunities is a signifi cant root cause that has a
combination of factors such as decreased rainfall and rising sea levels
cascading eff ect on the natural resources. This needs to be addressed
will have a catastrophic eff ect on the freshwater lens and consequently
immediately by the government and traditional leaders.
the people.
Economic ş Subsidies and economic development
The cost for operation and maintenance of water supply is
approximately 1.44 USD/m3, whereas the current water tariff stands at
CAUSAL CHAIN ANALYSIS
47
Unsustainable exploitation of living resources
The case study on the unsustainable exploitation of living resources
commitments, or for income to support family and church activities).
focused on Fiji, specifi cally in Lau, Kaba, Lami, Denarau and the Suva
Market forces are making people desire more thus providing incentives
Lagoon areas (Figure 19), where relevant studies have been made and
to fi sh more using newer and more effi
cient fi shing equipment. This is
some data are available. The issues identifi ed for these sites in Fiji have a
evidenced in major urban centres such as Suva, Lautoka and Labasa
wider application in the region, especially in areas where similar fi shing
and surrounding areas, where mullets and reef fi shes are depleted
activities are undertaken.
(Johannes pers. comm.). The unsustainable exploitation of living
resources is a concern in the Pacifi c Islands, and the impacts are both
The causal chain analysis was carried out on the following priority
socio-economic and environmental.
issues:
Overexploitation of living resources;
Destructive
fi
shing
practices;
Decreased viability of stocks.
Overexploitation of living
resources
The unsustainable exploitation of fi sh and other living resources is
increasingly becoming a negative feature of fi sheries development
The causal chain diagram for the issue overexploitation of living
where there is now a characteristic boom and bust pattern. This
resources is presented in Figure 20.
feature is the result of factors such as the need to maximise income
and involvement in fi sheries activities. There is increased eff ort by fi shers
Environmental and socio-economic impacts
to fi sh rapidly declining resources with undesirable consequences. In
The following environmental and socio-economic impacts were
addition, destructive fi shing methods are frequently used as people
identifi ed:
attempt to meet their own commitments. Regrettably, fi sh populations
Loss of employment/income (Veitayaki et al. 1995);
are declining due to overharvesting and the modifi cation of their
Loss of income capacity (Dalzell et al. 1996);
ecosystems (Pauly et al. 2001).
Changes in food web (Jennings & Polunin 1997);
Depletion of key species (Fiji Fisheries Division 1995, 1996);
Coastal communities that have relied on their coastal fi sheries
Reduction in size of fi shes sold at markets (Lal pers. comm., Fiji
resources for centuries are fi nding their catches dwindling. More often
Fisheries Division 1995, 1996).
their catch is now for people other than themselves (such as for family
Immediate causes
New Guinea
180░
Increased eff ort
Fiji
The Fiji Fisheries Division Annual Reports (1995, 1996) highlighted a
decrease in catch per unit eff ort as well as a steady decline of fi sh sales
Australia
at municipal markets (11% in 1996 compared to 40% in 1981), with the
New Zealand
central division (Suva) being considerably impacted. A recent trend
Vanua Levu
shows that the Suva and Lautoka markets are increasingly selling fi sh
shipped from remote places such as Labasa and Ba.
La
Denarau
u g
Rural migration to urban centres by indigenous Fijians searching for
r
Viti Levu
oup
better opportunities leads to a high demand for fi sh in urban areas
Lau
(Jennings & Polunin 1997). Consequently, the price of fi sh increases
Kaba, Lami and Suva Lagoon
due to the demand providing more incentives to increase fi shing
0
50 Kilometres
ę GIWA 2004
eff ort (Fiji Fisheries Division 1992). Such increases in fi shing eff ort can
Figure 19 Fiji
Islands.
be demonstrated by a study of the Astrolabe reef where giant clams
48
GIWA REGIONAL ASSESSMENT 62 PACIFIC ISLANDS
Issues
Immediate causes
Sectors/Activities
Root causes
Overexploitation of living
Increased effort
Governance ş
resources
Lack of enforcement
Licensing procedures
Fisheries ş
Number of licences
Infrastructure development
Knowledge ş
Access to technology
Destructive fishing
Lack of monitiring
Lack of information
Lack of capacity
Legal ş
Lack of MPAs
Licensing procedures
Technology ş
Efficiency of gears
Demographic ş
Changes in income sources
Increases in household
consumption
Economic ş
Market demand and prices
Government subsidies and
incentives
Figure 20 Causal chain diagram for the issue overexploitation of living resources.
and trochus declined rapidly. The reef fi sheries in accessible sites have
Sectors
been exploited to meet existing subsistence needs and to supply the
Fisheries ş High number of licenses issued
demand from urban markets (Rawlinson et al. 1995). This has led to
Licenses are put in place to control the entry into the fi sheries.
an increase in the artisanal fi sheries sector fi shing in remote places as
Unfortunately, licensing has not been as eff ective as it was hoped. The
traditional fi shing sites become decimated (Figure 21). The scenario is
number and condition of licenses off ered lack scientifi c input and is off ered
widespread throughout Fiji and is documented by the Fiji Fisheries
to all those who can pay. This is a serious problem in the inshore fi sheries
Division's annual reports.
where there is little knowledge of the stocks. The increase in the number
of licenses within the inshore fi sheries relates to the number of people
Destructive fi shing
using the fi sheries. Government policy has promoted the development
Overexploitation of fi sh is also attributed to the use of destructive
of fi sheries (of commercial nature) outside demarcated areas, to allow the
fi shing methods, such as explosives, modern poisons (cyanide, bleach,
subsistence fi shery to harvest inshore resources. The international live
pesticides), physically destructive practices (fi sh drives, manual breaking
coral reef fi shery, which usually fetches higher prices than local markets, is
of corals), traditional poisons (plant and animal compounds that stun
providing extra pressure, as local communities are enticed to participate.
or kill fi sh), and other methods that lead to the overharvesting of
In the area of off shore fi sheries, the debate on the number of licenses has
one or more species (Veitayaki 1990). Gill nets are blamed for the
also featured in local media in recent times. The fi shing industry and the
overexploitation of fi sh in many parts of Fiji (Veitayaki et al. 1995). Of
Fisheries Division have disagreed on the number of fi shing licenses that
concern is that many of these methods are not only destroying the
should be issued. The industry feels that the 80 licenses that have been
environment and the fi sheries but they are also a danger to the user. The
issued are excessive. The Fiji Government continues to issue licenses in the
availability of dynamite to fi shers in Votua, Ba worsens the situation (the
hope of stimulating economic growth (Bolatiki 2002).
dynamite is stolen from the local mining operations), and is coupled
with the fallacy that dynamite fi shing is less destructive than gill nets.
Fisheries ş Access to technology
Newer industries such as the ornamental and aquarium trades being
Technological change has been evident within the inshore and
undertaken along the Coral Coast are enticing some fi shers to earn
off shore fi sheries throughout the world. With the desire for more
`quick cash' (Sykes pers. comm).
catch, people are investing in more effi
cient fi shing gear that allows
them to access fi shing grounds further afi eld. Outboard motors and
CAUSAL CHAIN ANALYSIS
49
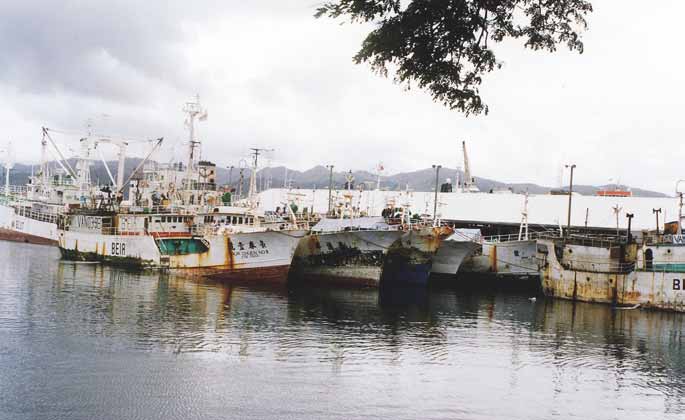
motorised vessels are a case in point, where fi shers are able to travel
were used during cultural celebration. These items are more or less
far in a considerably smaller amount of time. The availability of ice
substituted for cash, cloth, tin goods and other dry goods (e.g. rice, fl our,
and storage facilities prolonging the freshness of the catch is another
sugar). This consumerism may provide incentives to sell more fi shes in
milestone in the technological development of the fi shing sector. The
order to provide electrical goods.
use of underwater breathing apparatus (SCUBA and Hookah) has made
fi shing so effi
cient that it threatens the survival of the fi sh stock. Night
Root causes
fi shing using underwater torches is another technology that is most
Governance ş Lack of enforcement
probably aff ecting the fi sh stocks.
Enforcement is an essential element of fi sheries management,
which is inadequately executed in Fiji. The use of destructive fi shing
Fisheries ş Infrastructure development
methods and unsustainable fi shing practices such as the harvesting of
With the emphasis on rural development and decentralisation,
undersized fi sh will continue unabated attributed to poor enforcement.
infrastructure development has been rigorously pursued. New roads,
Moreover, the undersized catch is freely sold at the market where again
jetties, airstrips and processing facilities have been provided in rural
poor enforcement may be encouraging this practice. Coupled with the
areas and outer islands. These new developments have not only
lack of enforcement is the serious need to address the adequacy of
stimulated intensive utilisation of fi sheries resources, they have also
current legislation. Furthermore, public education and awareness must
introduced market economy and consumerism to remote places.
be part of such a legislative campaign to thwart illegal and destructive
There is also increasing pressure to access lucrative export markets
fi shing activities.
for high-value species. The availability of electricity is associated with
the introduction of electrical goods such as television, refrigerators,
Governance ş Licensing procedures
CD players and stereos. Changes within communities are inevitable
The licensing system in Fiji is far from adequate. In the inshore
as modern goods replace `traditional' wares when cultural activities
fi sheries, all commercial operators are licensed (Table 9), however,
are pursued. For example, fi shes, pigs, taro and other natural resources
traditional owners are excluded, and an open access system prevails.
Figure 21 Foreign fi shing vessels at Suva Harbour, Fiji.
(Photo: G.R. South)
50
GIWA REGIONAL ASSESSMENT 62 PACIFIC ISLANDS
Table 9
Number of licenses, middlemen, total crew and vessels
maximum sustainable yield (MSY) and total allowable catch (TAC) are
in Fiji 1995 and 1996.
used but these are based on estimates that may have little bearing
Division
IDA*
ODA**
Middle men***
Total crew
Vessels
on the way the fi sheries were utilised. Monitoring is now being used
1995
to demonstrate the recovery of the fi sheries resources as a result of
Central
246
55
84
741
351
management intervention.
Western
572
18
18
1 628
586
Northern
688
83
42
1 272
540
Knowledge ş Lack of information and capacity
Eastern
43
19
9
185
68
Knowledge of fi sheries resources is still inadequate. Managers need
Total
1 549
175
153
3 826
1 545
more information on the resource status and the impact of fi shing
1996
activities to the stock. In the Pacifi c Islands, the mandated government
Central
232
97
80
768
448
agencies for managing fi sh stocks such as the Fisheries Divisions are
Western
514
13
-
1 241
513
implementing strategies to manage fi sh stocks that they do not know
Northern
605
83
71
1 197
539
enough about. This is a serious situation, which can only be addressed
Eastern
46
40
5
226
96
with better research and capacity building. In the areas of tuna
Total
1 397
233
156
3 432
1 596
fi sheries, the belief at the regional level is that the stock in the region is
Note: Vessel number = inboard, outboards, punts and half-cabins, excluding un-powered.
still under-utilised but at the national level, the fi shers are arguing that
* IDA = Inside Demarcated Area (customary fishing right); **ODA = Outside Demarcated Area;
***Middlemen = People involved in marketing only. Also note, Lau province, which has relatively
overexploitation is already a problem.
rich fishery resource, has stopped issuing commercial fishing licenses as requested by the Tui
Nayau including bait fishing.
(Source: Fiji Fisheries Division Annual Report 1995,1996, 1997)
Legal ş Lack of MPAs
Marine protected areas (MPAs) are being used as a fi sheries resource
The licensing procedure operates on a who-can-pay system. Once
management tool. Often when and where the science is unable to
the license is issued, fi sh catch becomes dependent on labour and
provide the information required for management decisions, MPAs
the carrying capacity of the fi shing vessel. Rarely is the fi sheries
have been used as a precautionary method to reduce fi shing eff ort
legislation enforced due to inadequate resources. These open systems
in an area. The goal of such action is to allow for the recovery of the
(commercial after obtaining a license and traditional clan access) can
fi sheries. There is little documented evidence that MPAs have worked
lead to overexploitation and it may take a while before the endangered
in the Pacifi c. In most cases, MPAs have not worked, probably because
stock is detected by the authority. Thus, it becomes paramount that a
the concept is foreign to some local communities. In general, MPAs
mechanism is identifi ed where the authority is alerted on overexploited
require people to protect the resources over a period of time, and in
stocks as soon as it can be detected. In coastal communities, fi shing
some cases, permanently. The area included within MPAs, coupled with
is permitted provided they do not sell their catch. In the commercial
closure periods, which could infringe on traditional fi shing grounds,
sector, the licensing issue remains contentious between those who
may be part of the problem in accepting and implementing MPAs. In
want to regulate the number of licenses issued and those who want
some cases, donor driven MPAs and interference from outside factors
more licenses issued.
(e.g. government, NGOs) may make the approach diffi
cult to implement
despite the close relation to the customary practice of periodically
Knowledge ş Lack of surveys/monitoring
declaring tabu areas (Veitayaki 2001).
Surveys and monitoring are vital to complement fi
sheries
management measures (Veitayaki 2001). There is a need for
Technology ş Effi
ciency of gears
monitoring and survey methods to be simple and relatively
Fishing technology has changed dramatically over the last 20 years. In
cheap, to allow developing countries to participate fully. Currently,
spite of all the attempts to foster sustainable fi sheries, the effi
ciency of
some surveys and monitoring methods require certain scientifi c
gear and the capacity and aspirations of the fi shers to catch more, is
knowledge, which may be beyond the capacity and capability of
proving to be an obstacle that needs to be addressed.
countries such as Fiji. The knowledge of Fiji's subsistence fi sheries is
currently based on a household study conducted in the early 1990s.
Demographic ş Changes in income source and increases in
Prior to this survey, the contribution of the subsistence fi sheries to the
household consumption
local economy was based on an annual increase of 200 tonnes that is
Fishing is not a diffi
cult pastime and with open access, everybody
added on to a fi gure that was formulated in 1978. In the tuna fi sheries,
can fi sh. The availability of fi shes and shellfi shes to communities
CAUSAL CHAIN ANALYSIS
51
makes it their main source of protein (Veitayaki 1990). In 1996, the
Economic ş Market demand and prices
fi sh consumption per capita was around 55 kg (Fiji Fisheries Division
The demand for fi sh and fi sheries products in any urban area is immense.
1996). Consumption levels are even higher in some other Pacifi c Island
Fishers are encouraged to take advantage of the opportunity to earn a
countries, perhaps as high as 200 kg/person/year in Kiribati (Dalzell &
good income and tend to use eff ective fi shing methods regardless of
Adams 1996). The increased demand for fi sh is creating competition
their impact to the fi sh stock. The Suva municipal market today is fi lled
for limited resources, and increases in the sales of undersized fi sh. The
with assorted reef fi sh of variable sizes. The laxity in enforcement, the
easy access to the ocean and often the promises of return from selling
high demand for fi sh, coupled with very attractive prices, are driving
the catch make fi shing an attractive source of income and livelihood
fi shers to overexploit the precarious resources. Gone are the days when
(Veitayaki 2001). Moreover, stories of people becoming rich due to
a string of good-sized mullets was only 2.5 USD. Today, a string of fi sh
fi shing businesses are enticing more people to the industry.
(5 fi shes per string) is often more than 5 USD, yet consumers buy it.
Restaurants around Suva demand a high quantity of seafood with very
Economic ş Subsidies and incentives
lucrative prices, thus driving more fi shers to catch as many fi sh as they
The Fiji Government sees in fi sheries the opportunity to improve the
possibly can.
economic position of its people and to stimulate growth within the
country. This is why fi sheries development is pursued at various levels,
such as the diff erent licenses issued to commercial, recreational and
industrial fi shers, coral harvesters, and aquaculturists. Furthermore,
Destructive fishing practices
policies on the development of rural communities and islands are often
associated with incentives such as free or subsidised outboard motors,
The causal chain diagram for the issue destructive practises is presented
fi shing nets and punts, without considering the consequences of these
in Figure 22.
policies. In the foreseeable future, the government will continue its push
to assist rural communities. This may include improving infrastructures
Environmental impacts
such as road and building facilities to enhance the fi sheries sector (e.g.
The environmental and socio-economic impacts identifi ed were:
ice-machines). Unwittingly, this may lead to the overexploitation of fi sh,
Damaged fi sh sold at market;
as rural fi shers succumb to urban market demands.
Absence of targeted fi shes such as mullet (Mugil spp.);
Habitat
destruction;
Subsidies and taxes are part and parcel of the national attempts to
Injuries
to
fi
shers.
maximise the production and return from the use of the country's fi sh
resources. Incentives to entice investors to Fiji include attractive terms
Immediate causes
and conditions. Subsidies are also available for the inshore fi sheries
Blast fi shing
sector. Special loans from the Fiji Development Bank have been
Although dynamite or blast fi shing is illegal in most Pacifi c Islands, it
formulated and subsidised petrol provides further incentive to invest
remains a commonly used method for catching fi sh. It has been used
in the fi sheries industry. It must be acknowledged that the push for
in American Samoa, Chuuk, Fiji, Marshall Islands, Micronesia, Palau, PNG,
fast investment projects, especially those along the coast, may result
Solomon Islands and Samoa (Veitayaki et al. 1995). In Fiji, dynamite is
in negative impacts on the marine environment.
used to catch Salala (Short mackerel, Rastrelliger brachysoma) for sale or
Issues
Immediate causes
Sectors/Activities
Root causes
Destructive fishing
Fisheries
Economic ş
Blast fishing
practices
Unregulated fishing
Income
Market demand
Governance ş
Poison fishing
Capacity to enforce
compliance
Use of overefficient gear
Technology ş
Access to and illegal use of
technology
Figure 22 Causal chain diagram for the issue destructuve fi shing practices.
52
GIWA REGIONAL ASSESSMENT 62 PACIFIC ISLANDS
for bait. Blast fi shing is very destructive to the fi sheries and the marine
Sectors
environment. Demersal plankton production is decreased in blasted
Fisheries ş Unregulated fi shing
areas leading to reduced food supply to fi sh. The number of people
There are three main issues that need to be regulated in order to
who have lost their lives or parts of their bodies to dynamite fi shing
contribute meaningfully to the management of the fi sheries resources,
demonstrates the seriousness of the problem.
including:
Fishers: permitting too many fi shers to fi sh in a given area will lead
Poison fi shing (duva, chlorine, cyanide)
to resource depletion;
The use of traditional poisons is common in Fiji and the Pacifi c, especially
Fishing method: destructive and overly effi
cient fi shing methods
chlorine, cyanide and duva (this is the poison root that makes for an easy
must be banned;
harvest, but kills all small fi sh and corals as well as the larger target fi sh).
Fish catch: ensure that fi sh catches (especially those off ered for sale)
A number of plants are used by villagers to poison and stupefy fi sh at
conform to set standards. Gravid crustaceans and undersized fi shes
nearby reefs (Table 10). In addition, chlorine and other similar chemicals
must not be harvested let alone off ered for sale.
are used in rivers, whereas cyanide is commonly being used to catch
specimens for the aquarium and live fi sh trades. The use of poison is
It is recognised and understandable that the subsistence fi shery is
destructive, as it not only aff ects the target fi sh species; it also impacts
not regulated, as often families harvest suffi
cient quantity for their
negatively on the fi shing area and the fi shers.
sustenance. In the commercial sector, it is acknowledged that the higher
the catch, the higher the return; hence operators are driven to catch
Use of overeffi
cient fi shing gear
more. It is in this sector that regulations must be enacted. Illegal fi shers
Fishing is becoming more effi
cient with the use of sophisticated gear.
will capitalise on low enforcement and inadequate laws; this must be
In the inshore area the widespread use of gill nets is blamed for the
addressed. Encouraging local coastal communities to participate in the
depletion of fi sh stocks (Veitayaki et al. 1995). People are using modern
management of their resources, for example by harvesting just what
technology to be free of the vagaries of nature and the uncertainty in
they need, and by reporting instances of illegal fi shing to the authorities
fi shing.
must be pursued.
In the off shore areas, walls of death (drift-nets) were fi rst banned from
Root causes
the Pacifi c Ocean under the Wellington Convention (1989), which has
Economic ş Income
become the basis of the current UN moratorium on driftnet fi shing. The
The need to generate income to support family needs has prompted
involvement of factory vessels and sophisticated fi shing vessels such as
many fi shers to drive the coastal/near-shore fi sheries to depletion. While
purse seiners are indicative of the sophistication that is associated with
other sources may provide a steady income, fi shing appears to be more
fi shing and the depletion of fi sh stocks.
lucrative and with little preparation and investment. For example, a
farmer left farming for fi shing because his income from farming could
Table 10
Plants used as fi sh poisons in the Pacifi c Islands region.
not cater for his children's school needs (Veitayaki et al. 1995). People
Parts
who lose their jobs often take up fi shing because of its open-access
Scientific name
Description/Notes
Areas used
used
and the lack of control.
A. Samoa, Fiji, Futuna,
Barringtonia asiatica,
Seed
Tree; active compound is saponin.
French Polynesia, Guam,
B. speciosa
Vanuatu
Economic ş Market demand
High-climbing woody liana. Roots
In Pacifi c Island urban areas, the market demand for fi sh and fi sheries
contain rotenoids, the most potent
A. Samoa, Fiji, Kosrae,
Root,
of which are rotenone and tephrosin.
New Caledonia, Tahiti,
products is high. Fishers sell their catches directly to consumers,
Derris elliptica
bark,
It was introduced from Asia to the
Tonga, Guam, PNG, Palau,
stems
middlemen, wholesalers, retailers, restaurants and hoteliers. Such
Pacific and is commonly cultivated for Vanuatu, Samoa
rotenone production.
demands have led to excessive exploitation in areas that were once
Euphorbia cotinifolia,
Stems,
Fiji, New Caledonia
considered productive. The exploitation of other commodities such as
E. canadensis, E. tannensis leaves
fi sh for the live food and aquarium trades, adds to the pressure on the
Neubergia collina
Fruit
Steamed fruit is mixed with water.
Fiji
vulnerable stocks. People are moving from one commodity to another
Pittosporum arborenscens
Fruit
Cooked first.
Fiji, Tonga
and in the process leaving behind barren areas.
Cook Islands, Hawaii, Fiji,
Tephrosia piscatoria
Leaves
Perennial herb.
Tahiti, Moorea
(Source: GIWA Task team 2004)
CAUSAL CHAIN ANALYSIS
53
Governance ş Government capacity to enforce compliance
outboard motors, for example, has allowed people overcome the forces
The Fiji Fisheries Division is charged with the responsibility to manage
of nature that used to be a limiting factor in past fi shing expeditions.
Fiji's fi sheries resources according to the mandate stipulated in the
The introduction of rural development initiatives through provision
Marine Spaces Act (Fiji Government 1985) and the Fisheries Act (Fiji
of boats, outboard motors and new fi shing technology to improve
Government 1978). The vastness of the Fiji Islands coupled with low
peoples living conditions is allowing them to increase production.
capacity makes it diffi
cult for the Fisheries Division to manage the
The availability of depth sounders, fi sh fi nders, monofi lament nets and
fi sheries resources (Veitayaki 2001). This has lead to continuing illegal
hydraulic winches has increased the potential of catching fi shes and at
and unregulated fi shing in many parts of the country. Moreover, the
the great expense and unfairness to the fi sh stocks.
costs of enforcement are overwhelming and the requirements in terms
of technology are beyond reach. Although Australia has provided
Pacifi c Class Patrol Boats, their high costs of operation has meant that
surveillance by the patrol boats is rarely carried out. For these reasons,
Decreased viability of stocks
the country needs to formulate better and more eff ective ways of
due to pollution and disease
enforcing its regulations. The vessel monitoring system used in the
EEZ using GPS and observers is an example of a cheaper alternative.
The causal chain diagram for the issue decreased viability of stocks due
to pollution and disease is presented in Figure 23.
Technology ş Access to technology
In Fiji, the continued availability of explosives is the subject of much
Environmental impacts
debate. People associate the availability and use of dynamite with
The environmental impacts identifi ed were:
the operation at the gold mine in Vatukoula (Veitayaki et al. 1995).
Imposex - sex modifi cation in gastropods (Tamata et al. 1993);
This position is disputed by the Emperor Goldmine, which argues
Change
in
water
quality;
that its security system is fool-proof and that the company cannot be
Presence of unnatural substances and pollutants;
solely blamed for the availability of explosives to fi shers. Incidentally,
Fish
diseases.
dynamite is also used in the construction industry and these likely
sources should be more tightly scrutinised. The use of explosives in
Immediate causes
places such as American Samoa where there are no mining activities
Increased concentrations of Tri-butyl tin, copper and creosote
should support the need to look closely at the supply of dynamite and
Studies have demonstrated that sub-lethal contamination by common
other illegal technology.
estuarine pollutants can signifi cantly alter innate immunological
reactions in tunicates (Rice 2001). The three compounds, Tri-butyl tin
The use of technology has enhanced people's fi shing capability. People
(TBT), copper, and creosote are major components of antifouling fi lms
are now able to fi sh at greater distances over a longer period. The use of
that are used to prevent the growth of sessile invertebrates and other
Issues
Immediate causes
Sectors/Activities
Root causes
Increased domestic
Urban/Infrastructure ş
Decreased viability of
Legal/Governance ş
pollution
Inadequate sewage treatment
stocks
Lack or poor enforcement
Inadequate disposal of solid
of regulations
waste
Diseases in pearl oysters
Aquaculture ş
Knowledge ş
Increased concentrations
Overstocking
Lack of knowledge
of copper, creosote and TBT
Transport/Fisheries ş
Increased industrial
Primary sources of TBT, Cu
effluents
Economic ş
and Creosote
Industrial and economic
Oil from derelict boats
development
Infrastructure provision
Industry ş
Industrial dischargees
Demographic ş
Population growth
Figure 23 Causal chain diagram for the issue decreased viability of stocks due to pollution and disease.
54
GIWA REGIONAL ASSESSMENT 62 PACIFIC ISLANDS
organisms. TBT concentrations of more than 2 Ág/l have been detected
inhibit lysozyme activity, wound healing, phagocytosis, rosette
in marine areas and can leach from marine paints and accumulate to
formation, and tissue transplantation rejection at concentrations that
hazardous levels in harbours and marinas (Bryan et al. 1986). Studies
are not acutely lethal (Weeks et al. 1990).
conducted in Suva have indicated the contamination of sediments
and shellfi sh from trace metals. There were claims that elevated levels
Increased domestic pollution
of TBT were already causing imposex in female neogastropods around
The release of effl
uents into Laucala Bay from the greater Suva area is
Suva (Tamata et al. 1993). The highest concentrations of TBT were from
blamed for the high nutrient levels and organic enrichment (Naidu et al.
sites nearest to the slipways. Increased levels of TBT are correlated with
1991). Both the Raiwaqa sewage treatment plant which discharges into
gradual population decline and increased imposex in gastropods
the Vatuwaqa River and the Kinoya sewage treatment plant discharging
(Rilov et al. 2000). In addition, it is known to inhibit chemiluminescence
via an 800 m pipe into the Laucala Bay are known sources of faecal
responses, chemotactic activity, phagocytic oxidative bursts and
coliform in the area. There are also leachates coming from the municipal
phagocytosis by fi sh leukocytes (Weeks & Warinner 1984, Weeks et al.
rubbish dump in Lami.
1990, Burton et al. 2002).
Naidu et al. (1991) found high faecal coliform levels, high nutrients
Like TBT, copper is known to have substantial immunological eff ects on
(nitrate and phosphorous), and trace amounts of cadmium in Suva
aquatic organisms at sub-acute doses.
Lagoon. Shellfi sh sample analysis indicates a potentially hazardous
situation with only 5% of the results falling within recognised safety
Creosote is a hydrocarbon-based protective coating that is frequently
limits. Infaunal brittle stars increased somatic and gonadal growth in
used on pylons, wharves, and netting. Polycyclic aromatic hydrocarbons
response to organic enrichment. Negative eff ects were observed on
(PAHs) in particular have been associated with a variety of physiological
the survival of mysids (Mysidopsis bahia) when essential ions such as
eff ects including carcinogenesis and the alteration of immune reactivity
calcium, magnesium, and potassium were present in either low or high
in humans and other animals (Rose et al. 2000). In fi sh, PAHs are
concentrations relative to natural levels in seawater. Tolerance ranges for
responsible for the development of eye lens cataracts, gill necrosis,
calcium, magnesium and potassium shifted signifi cantly with changes
degeneration of renal epithelia, and neoplasia. They can also inhibit
in salinity.
macrophage function, cellular cytotoxicity and cellular proliferation.
PAH levels greater than 10 times the maximum dose are reportedly
Infrastructure provision
common for harbour waters, and levels of copper up to 2.5 Ág/ml have
The Port of Suva serves as the main port of entry for overseas cargo and
been detected in heavily utilised environments.
passenger vessels coming into Fiji. The Port of Suva also serves as a trade
link between Australia, New Zealand, North America and the countries
Diseases in pearl oysters
of the South West Pacifi c. The port of Suva in 2001 handled a total of
In 2001, there was an emergency scenario from Manihiki Atoll in the
1 301 356 tonnes of cargo of the total amount of 2 703 403 tonnes for
Cook Islands when oyster mortality from a disease was unprecedented
the country. This domination refl ects the importance of the port to the
and attributed to overstocking oysters (Sharma et al. 2001, Solomon
national economy. In 2002 and 2003, major development works were
1997).
been undertaken in the ports of Suva and Lautoka. Port developments
often involve coastal developments, which are expected to aff ect
Increased industrial effl
uent
coastal habitats and the resources within the area. The anticipation
The concentration of oil in the effl
uents from some of the industries
of the Suva Port to cater for larger vessels means more coastal
in Walu Bay was found to exceed the maximum permissible level.
developments including coastal reclamation to cater for such plans.
Concentrations of dissolved solid and suspended solids were very high
whereas the levels of zinc and lead were extremely high. Reproduction
Sectors
in the polychaete Neanthes arenaceodentata was aff ected by the
Aquaculture
presence of PCBs (Poly-Chlorinated-Biphenyls) and DDT (Dichloro-
With increased overstocking and decreased levels of oxygen, pearl
Diphenyl-Trichloroethane). In addition, biomagnifi cation results in the
oysters are faced with a dilemma. Sharma et al. (2001) concluded
accumulation of large concentrations of heavy metals such as mercury
their water quality study with recommendations that: a) a limit on the
in carnivorous fi sh such as swordfi sh (Xiphias gladius). Heavy metal or
black-lip pearl-oyster population needs to be determined to safeguard
polychlorinated biphenyl contamination in worms can signifi cantly
the lagoon's carrying capacity; and b) continuous monitoring of
CAUSAL CHAIN ANALYSIS
55
the lagoon's water quality needs to be implemented to protect the
and industries pollute their surrounding because the system does not
industry from outbreaks of disease in cultured oysters. This problem
enforce the regulations or because there are no regulations to protect
is expected to become increasingly important given the interest in
these ecosystems. Coral reefs and other habitats such as mangrove
aquaculture activities.
forests and seagrass beds are increasingly degraded by the unregulated
development and the utilisation of coastal resources.
Industry
Apart from sedimentation, the major sources of pollution in the Port
The major sources of elevated nutrients to coastal waters are typically
of Suva are sewage and industrial effl
uents. These sources are directly
from human waste and chemicals. Immediate action is required at the
related to the growth of the urban economy and the impacts that
community, regional and governmental levels to reduce the nutrient
growth has on the surrounding areas. In a study conducted in 1992,
inputs into the marine environment where an integrated management
14 industries in the Walu Bay area were found to be discharging their
approach is needed to manage and control land-based sources of
effl
uents either directly into port waters or into a river or into stormwater
pollution before they enter the sea.
systems, ending up in the bay.
Knowledge ş Lack of knowledge
Transport/Fisheries
Lack of knowledge has been a limiting factor. With research and long-
Old and unused ships and yachts have been a cause of concern in
term monitoring now undertaken, people are beginning to understand
the Bay of Islands, which has become the graveyard for vessels. These
the natural system and how it functions. The use of the precautionary
vessels are a threat to marine life around the area because oil leaks are
approach is seen as an alternative to humans' lack of knowledge of the
a likely eventuality.
natural world and how it works. Human knowledge has to improve if
better environmental management is to take place.
Although the use of TBT on pleasure craft is now prohibited and is being
replaced with copper-based antifouling products, it is still applied to
Demographic ş Population growth
larger vessels. It remains a common harbour contaminant
Suva is a major commercial centre and is a rapidly expanding city
in terms of population and industrialisation. The increase in Suva's
Urban/Infrastructure
population from 80 000 in 1966 to 160 000 in 1986 (Naidu & Morrison
The primary source of sewage effl
uent into Suva lagoon is the outfall
1994) and about 168 000 in 1996 (Seniloli pers. comm.) with the
from the Kinoya sewage treatment plant. The plant, which serves the
associated industrial development, port activity and waste generation
entire city, is badly overextended. It discharges through a pipeline into
has resulted in considerable environmental changes within the coastal
Laucala Bay where poor circulation in the shallow bay is aff ecting the
area of Suva. The developments of the industries, infrastructure and
dilution of the sewage. The result is the highest concentration of faecal
amenities have aff ected the adjacent harbour (Naidu & Morrison 1994).
coliforms in Laucala Bay and Suva Lagoon.
Sediments and shellfi sh are contaminated with metals with the zone
next to a battery factory having sediments metal concentration levels
The use of septic tanks in parts of Suva Peninsular adds to the problem
that were high enough to be considered a hazardous waste site. Results
as sewage leaks into creeks and rivers that end up in the bay. The
of study around the dump in Lami indicate the movement of metals
problem is serious because of the location of the city on calcareous
away from the dump into the surrounding marine environment.
marl that limits percolation into the ground. The present dump in
Lami is a mountain of rubbish that continues to increase. The smell
Economic ş Industrial and economic development
is intolerable whereas the contamination of the site and surrounding
The state of the environment in Suva is largely dictated by economic
areas is a serious concern. Attempts to relocate the dump have
developments. In attempting to reduce their costs, industries have
not been successful resulting in the continued use of the present
channelled their waste into pristine areas. In instances where the
facilities.
regulations are in place, lack of enforcement has resulted in the
continued abuse of the environment. For example, the outfall from
Root causes
the Kinoya sewage treatment plant, although the pipe is 800 m long,
Legal/Governance ş Lack or poor enforcement of regulations
the sewage is released at 300 m where the pipe is broken. This fault
The use and management of environmental resources around Suva is
has been known for some time but no action has been taken due to
exacerbated by the lack of information and lack of regulations. People
the costs of fi xing it.
56
GIWA REGIONAL ASSESSMENT 62 PACIFIC ISLANDS
Recent experiences have demonstrated that investments in a good
environment make economic sense, as human activities are dependent
on the functioning of the natural system.
The Suva harbour has two major industrial zones comprising shipyards,
manufacturing plants, oil storage depots, food processing industries
and other outlets that release effl
uents into the harbour. A battery
factory near the harbour disposes its old batteries by tossing them over
the fence into the surrounding intertidal sediments. The unsightly scene
is obvious as plastic electrical cases were strewn over the area. The city
dump is located on a reclaimed mangrove area. There are no linings
so leachates fl ow directly into the harbour. Along the Coral Coast, a
popular tourist destination with several large resorts, high levels of algal
growth have been noted in recent years. The villagers are concerned
about the impacts on the coral reefs and the fi sh stocks.
CAUSAL CHAIN ANALYSIS
57
Policy options
This section aims to identify feasible policy options that target
Pacifi c Islands region are addressed by consensus, and major regional
key components identifi ed in the Causal chain analysis in order
programmes are implemented by inter-governmental organisations or
to minimise future impacts on the transboundary aquatic
other bodies following a sometimes exhaustive consultative process.
environment. Recommended policy options were identifi ed through
South and Veitayaki (1999) provided a detailed analysis of how these
a pragmatic process that evaluated a wide range of potential policy
various regional approaches have led to workable arrangements in
options proposed by regional experts and key political actors
response to global initiatives. In the post-UNCED, Barbados and WSSD
according to a number of criteria that were appropriate for the
era the regional approach has continued and strengthened. In the
institutional context, such as political and social acceptability,
early 1990s, in preparation for UNCED, most of the Pacifi c Island nations
costs and benefi ts and capacity for implementation. The policy
developed detailed National Environment Management Strategies
options presented in the report require additional detailed analysis
(NEMS) for dealing with environmental issues, and these have laid the
that is beyond the scope of the GIWA and, as a consequence,
foundation for subsequent regional programmes and activities, such as
they are not formal recommendations to governments but rather
the GEF-funded International Waters (IW) Programme currently being
contributions to broader policy processes in the region.
implemented by the South Pacifi c Regional Environment Programme
(SPREP), as well as national programmes. The IW project was developed
In this analysis, two broad areas of policy are discussed, relating to
through an exhaustive national and regional consultation process
the main concerns addressed in this report: (i) Freshwater shortage
which led to the Strategic Action Plan for the International Waters of
and (ii) Unsustainable exploitation of fi sh and other living resources,
the Pacifi c Small Island Developing States (SPREP 2001a).
through integrated coastal area planning and resource management
and conservation. These policy areas have been addressed at the
On the surface, therefore, it would appear that the Pacifi c Island
regional and, to varying degrees, the national level throughout the
countries have the right mechanisms in place to develop policies
Pacifi c Islands. The Pacifi c Islands Regional Ocean Forum (PIROF), held
needed to address GIWA concerns, either collectively, or at the
in Suva, Fiji in February 2004, resulted in draft Framework for Integrated
national level. Unfortunately, however, this is not the case since there
Strategic Action, the elements of which are in agreement with the policy
is great variation among them in terms of capacity. Whereas some
options proposed in this study. The diffi
culty, however, is fi nding ways
governments have established Environment or Fisheries sections or
and means of translating these well-conceived regional and national
have developed Sustainable Development Acts, many others have not.
policies into action. Capacity building, awareness-raising, involvement
Most of the governments inherited colonial systems of government
of all stakeholders in planning and decision-making, paradigm shifts
that remain largely intact, with Westminster-style, French or U.S. forms
in governance and the law, and political will are all important if these
of government. This means that for many, hierarchical departments
policies are to be implemented. They cut across the GIWA concerns and
remain fi efdoms that compete for scarce resources, and integrated
issues addressed in this report.
decision-making is the exception, not the rule. Scientifi c capacity is
well below what is needed, school education systems often remain
The region has for almost 60 years adopted a regional approach to
tied to those of far-off countries, and public awareness of issues is often
the similar concerns identifi ed under GIWA. Policy issues within the
uneven or lacking.
58
GIWA REGIONAL ASSESSMENT 62 PACIFIC ISLANDS
Freshwater shortage
Freshwater resources in the Pacifi c Islands are limited on the larger
Regional Action Plan on Sustainable Water Management (SOPAC 2002).
islands since, with the exception of a few nations (Papua New Guinea,
A number of Pacifi c Island countries are also preparing their National
Solomon Islands, Fiji) large river catchments are lacking. Great variations
Plans of Action (NPAs) under the Global Program of Action for the
in fl ow rate are caused by catastrophic phenomena such as cyclones,
Protection of the Marine Environment from Land-based Activities
and many watersheds are subject to high levels of run-off because of
(UNEP/GPA), through the assistance of the South Pacifi c Regional
poor land use, clearing of native forest, mining and other activities.
Environment Programme. These NPAs will include important strategies
Water resources are fi nite on all atoll countries, and are subject to
on waste management.
increasing depletion or contamination. Rainfall is highly variable by
location, season and year, with many countries experiencing drought
The Pacifi c Islands region has also developed a regional partnership,
or fl oods. Many of the small atolls of Kiribati are uninhabitable because
known as the Pacifi c Type II Partnership on Sustainable Water
of a lack of potable water. Human habitation in the Pacifi c Islands has
Management, and an inter-regional Small Island Developing States
been governed by the availability of freshwater since the islands were
partnership with the Caribbean, known as the Joint Caribbean Pacifi c
fi rst colonised around 3 500 years ago. Contamination of freshwater
Programme for Action on Water and Climate (JPfA) designed to
supplies by pollution from industry is common in urban areas, and
implement this strategic approach.
standards in water use, treatment and protection of supplies are
weakly applied. Rapidly increasing urban populations are placing
Without additional resources, national and regional activities in this
unprecedented pressures on water supplies, as demonstrated by the
sector cannot continue. The priorities that have been identifi ed through
city of Suva, where water cuts are frequent and distribution systems are
the national and regional consultations are contained in the Pacifi c
old and inadequate. These problems have been widely recognised in
Regional Action Plan for Sustainable Water Management, 20 actions of
the Pacifi c Islands, and have resulted in the development of a Regional
which form the JPfA, common to the Caribbean and Pacifi c.
Action Plan for use and conservation of freshwater.
While many Pacifi c Island countries have regulations for the use,
treatment and conservation of catchments and water supplies, these
Policy options
are diffi
cult to enforce because of traditional ownership of the land and
resources, and inadequate consultation with traditional owners in the
In July 2002, 18 Pacifi c Island countries formally endorsed the Pacifi c
development of policies.
Regional Action Plan on Sustainable Water Management, 12 countries
at Ministerial level. This Action Plan (SOPAC 2002) identifi ed specifi c
The United Nations has a long-standing regional commitment to
actions to address priority issues and constraints to achieving sustainable
water, and this responsibility now rests with the South Pacifi c Applied
water management. The Pacifi c Wastewater Policy Statement and the
Geoscience Commission (SOPAC), through their Secretariat based in
Pacifi c Wastewater Framework for Action (Bower et al. 2002) are the
Suva, Fiji. SOPAC, like other IGOs in the Pacifi c Islands region, develops its
two regional policy and action documents that provide a structure to
annual workplan through a regional process of consultation, addressing
regional and national interventions on wastewater management. Most of
concerns raised by their member countries through the development of
the policies are directly linked to the root causes identifi ed in the causal
national and regional projects which are carried out with support from
chain analysis, and the Task team strongly endorse, and recommende
donor countries and various agencies. There is also a Technical Advisory
that they will be implemented by Pacifi c Island countries.
Group (TAG) to SOPAC which supports in-depth discussions on matters
of regional and national importance.
Short-term options
Short-term actions recommended under the Framework for Action are:
The Pacifi c, perhaps more than any other region, has clearly articulated
Identify water pollution sources and undertake preventative and
the challenges it has to address to achieve sustainable water
corrective steps, including fi nancial penalties for environmental
management. The region has developed a strategic and holistic
and water degradation (Key Message 3: Action # 3: Point 6) (SOPAC
approach to overcoming these challenges, as articulated in the Pacifi c
2002);
POLICY OPTIONS
59
Conduct environmental impact assessments as an integral part of
Governments will develop national wastewater and sanitation
planning for development projects to ensure environmental values
policies and regulations that are consistent with international and
and objectives are properly considered (Key Message 3: Action # 3:
national laws, regulations, technical standards, and obligations
Point 7) (SOPAC 2002);
(Guiding Principle 1: Policy 1.2) (Bower et al. 2002);
Implement strategies to utilise appropriate methods and
Governments will develop and implement appropriate
technologies for water supply and sanitation systems and
wastewater and associated regulatory frameworks, compliance
approaches for rural and peri-urban communities in small islands
and enforcement requirements that benefi t the specifi c cultures,
(Key Message 2) (SOPAC 2002);
customs, economies and environment of the people of the Pacifi c
Further pilot projects in diff erent island environments to determine
(Guiding Principle 1: Policy 1.3) (Bower et al. 2002);
appropriate low-cost on-site sanitation technologies (e.g. compost
Governments will ensure that wastewater technologies and related
toilets, gravel bed hydroponics or constructed wetlands) (Key
infrastructure are appropriate to meet national and local priorities and
Message 2: Action # 10: Point 1) (SOPAC 2002);
needs, within the constraints of available fi nance and other resources,
Further applied research to establish guidelines for `safe distances'
while recognising the need for protection of human health and the
(buff er zones) for existing sanitation options in diff erent island
environment (Guiding Principle 2: Policy 2.2) (Bower et al. 2002);
environments (e.g. septic tanks, pit toilets) (Key Message 2: Action
Planning of wastewater facilities will ensure acceptable access for
# 10: Point 2) (SOPAC 2002);
all, with special regard to women, the disadvantaged, the disabled
Increase government, donor and community awareness of poor
and those in rural and remote communities (Guiding Principle 4:
sanitation impacts on water resources and public health (Key
Policy 4.5) (Bower et al. 2002);
Message 2: Action # 10: Point 3) (SOPAC 2002);
Governments and regional organisations, the private sector
Progress
and NGOs will actively cooperate to ensure that wastewater
In Fiji, the need to address important water and land-use policy issues has
management policies and plans are integrated into the national
been recognised through the establishment of a variety of recent initiatives.
development policies and plans and other cross-sectoral initiatives
For example, Fiji is currently developing an inter-sectoral National Land Use
(Guiding Principle 1: Policy 1.7) (Bower et al. 2002);
Policy and a National Code of Logging Practice has been developed to
Governments, service providers and NGOs will ensure rural and urban
strengthen moves towards sustainable forest management. In addition,
communities will be given opportunities for active participation in
the Fiji Government has convened its fi rst inter-sectoral, high-level
the choice, development and implementation of wastewater and
National Water Committee and is addressing catchment management
sanitation projects and on-going operation and maintenance of its
problems by establishing and allocating additional resources to a new
facilities (Guiding Principle 4: Policy 4.4) (Bower et al. 2002);
section dedicated to solving land and water usage issues.
Service providers will take into account traditional knowledge
and practices complemented by new approaches to wastewater
At the regional level, the GEF-funded and SPREP-implemented
management (Guiding Principle 4: Policy 4.6) (Bower et al. 2002).
International Waters Project includes important strategies addressing
freshwater. The implementation of the SOPAC Action Plan is being
Medium to longer-term options
facilitated through the establishment of case study sites in a number of
Medium to longer-term strategies under the plan are:
diff erent countries in the Pacifi c Islands region. The establishment of these
Develop catchment management plans for the rational allocation,
sites is critical for the sustainability of these initiatives once IW project
use and protection of water resources. This may include the
has concluded. In addition, links between the IW project and the SOPAC
establishment of catchment management, protection and buff er
Action Plan should be developed and strengthened wherever possible.
zones (Key Message 3: Action # 3: Point 3) (SOPAC 2002);
Apply best management practices to minimise impacts from
Barriers to implementation
activities such as logging, cultivation and mining (Key Message 3:
Many of the actions proposed under the SOPAC (2002) plan will require
Action # 3: Point 4) (SOPAC 2002);
diffi
cult and sometimes socially unpopular decisions by governments.
Implement strategies to improve the management of water
Using the example of Fiji, for policies to work, there is a need to
resources, and surface and groundwater catchments (watersheds) for
identify the key stakeholders and to involve them in the processes,
the benefi t of all sectors including local communities, development
like for example, the land-owning units "mataqali", who own the land
interests and the environment (Key Message 3) (SOPAC 2002);
and whose activities such as logging, agricultural cultivation and
60
GIWA REGIONAL ASSESSMENT 62 PACIFIC ISLANDS
other land-based activities are of their own choice. As seen in the
On most of the Pacifi c Islands, climate and water resource conditions
causal chain analysis for Rewa and Ba river catchments, the traditional
vary considerably due to their locations, their topography, and their
landowners have every right to access their land and so policies will
sizes and geology. Water supply for local communities is the most
have to be made with their agreement. It is noteworthy that much of
important water use, and approaches to provision of water supplies
the market gardening that takes place in the Rewa catchment is carried
vary according to availability and sustainability of water resources.
out by Chinese, a disenfranchised group who would be completely
The implementation of the SOPAC (2002) plan will take much longer
marginalised if stringent land use policies were introduced.
in some countries than in others. For example, in the causal chain
analysis focused on the freshwater lens at Bonriki on the atoll of
The importance of traditional ownership of land and resources in Fiji
Tarawa in Kiribati, it was seen that governance and awareness were
has taken on increased prominence since the 2000 coup, and the
the main policy options and that there were water problems faced by
"blueprint" developed by the Fiji Government has many elements
the islanders due to the absence of water legislation and enforcement
that favour Fijian development over other ethnic groups. In a country
capacity to safeguard the use of the freshwater lens as their source
where approximately half of the population is Indo-Fijian, the potential
of water. There is an urgent need for water resources legislation and
problems of this policy are obvious.
policies put in place to monitor the use of water being pumped from
the lens and the careful disposal of used water so that it does not enter
The private sector has to be conscious of potential medium-term
the groundwater system again as recharge. At present, there are no
changes that will result from policies that will work towards sustainable
policies in place to reduce water use, or to recycle water, and with
use of water supplies. Policies will need to be built into National
increasing awareness of global changes occurring (these atolls being
Development Plans, and policies that favour the development of
at the forefront of this plight), this has led to more funding being made
integrated water management strategies could have some negative
available for training and preparedness initiatives. There is also a need
impacts, and these would have to be anticipated and dealt with. For
for adequate water resource management and salinity monitoring of
example, sustainable forestry or agriculture policies could create some
the water levels within the infi ltration galleries so that no excessive
reductions in employment opportunities in those sectors and so
pumping occurs.
alternative employment or opportunities would need to be developed
to counteract these losses. On the other hand, unless appropriate
Implementation
policies are put in place and implemented, the continued degradation
SOPAC has laid the foundation for countries to build upon in their
of catchments and disruption of water supplies to rapidly growing
future water management strategies. The steps required for their
populations will have long-term negative eff ects.
implementation at the national level will include:
Consultation with all stakeholders and awareness raising on the
A common theme that was seen throughout the Pacifi c was the need
importance of sustainable use of water supplies, and a detailed
for capacity building, and for awareness raising at all levels of society, on
review of the SOPAC regional policy to see where it applies, and
matters relating to proper wastewater treatment and sewage disposal
where it does not, in the national context. This consultation process
practices.
should be facilitated by the national and local governments, in
cooperation with the private sector.
Human factors such as population density, land use and sanitation
Development of appropriate legislation on water (where this
methods have a large impact on the availability of water, the
does not exist) or modifi cation of existing legislation in order to
microbiological and chemical quality of water supplies and impacts on
meet the requirements agreed to in the SOPAC Action Plan. These
the freshwater resource. In addition, modern technologies are brought
should provide for appropriate penalties where regulations are
into these countries through many diff erent programmes, but oftentimes
contravened. There will be a need for input from Environmental
these technologies are inappropriate for small islands due to the fact
Legal offi
cers in the drafting of legislation.
that many Pacifi c Island cultures still maintain much of their traditional
Development of necessary strategies for enforcement, and sourcing
lifestyles and value their traditions highly (e.g. the compost toilet still
of the necessary funds required for enforcement, and for upgrading
has not gained much popularity amongst the islanders). In some atoll
of systems. NGOs as well as government could play a role in this
countries, people traditionally use the beach as a toilet. When numbers
process, and local communities should be involved.
are small, this is not a serious problem, but in areas with high population
densities it becomes a serious pollution and health risk.
POLICY OPTIONS
61
Unsustainable exploitation of living resources
The call for integrated coastal area planning and management is a
It was agreed in the causal chain analysis that most of the problems
recurrent theme in global conventions and agreements to which the
relating to unsustainable exploitation of other living resources relate to
majority of Pacifi c nations are party, and in Action Plans and policy
lack of capacity to enforce regulations, the licensing system, inadequate
guidelines adopted by regional inter-governmental organisations
fi sheries data (especially for the subsistence fi shery) and a lack of
and NGOs. Traditionally, the ethic of viewing the coastal area and
awareness among stakeholders and consumers of the consequences
adjacent waters as a whole is embedded in the traditions of all Pacifi c
of overexploitation. For Fiji, it was agreed that overpopulation was not
Island peoples; the concept of the vanua (Fiji) or fenua (Samoa) has
the main root cause, rather that the economy, government policies, lack
governed traditional use of land and sea for thousands of years and
of data and awareness were the most critical.
does not separate one from the other. It would seem, then, that the
translation of this important tradition into modern planning and
Recent community level studies have greatly enhanced awareness
management strategies would be a simple process, but this is not so.
of the value of self-regulation of the inshore fi shery: the International
The hierarchical structure of governments, the sectoral approach even
Ocean Institute, in partnership with government, the private sector, and
at the regional level (where inter-governmental bodies have specifi c
NGOs ran a total of seven awareness-raising workshops throughout
sectoral mandates), and the largely top-down planning and decision-
Fiji, attended by a more than 750 villagers. Many villages in Fiji are now
making process in governments, are all hindrances.
requesting assistance on how to increase their capabilities in this area.
Regulation is hampered, however, by the lack of data on most stocks
Furthermore, there is a serious lack of the capacity in most countries
fi shed in the subsistence sector, and hence lack of any regulation of the
required to implement integrated planning and management of the
fi shery. The Fiji's Locally Managed Marine Area (FLMMA) project referred
coastal area, and a lack of political will to deal with diffi
cult issues
to earlier (Tawake 2004), is an excellent example of the cooperation of
that might impede short-term gain in some sectors. Economics drive
local communities, government and NGOs in the establishment and
decisions in the resources and tourism sectors, for example, and issues
monitoring of Marine Protected Areas (MPAs). There are 410 gazetted
such as environmental damage, or overexploitation, are sometimes
fi shing areas (qoliqoli) in Fiji, and all of these could self-regulate given
swept aside or given low priority. It is instructive that, in most
the necessary know-how and capacity. The Fisheries Division is unable
governments if not all, no position is identifi ed as a Coastal Planner.
to meet the demand for assistance because of shortage of staff , so
One reason is that such a job would require a very broad background
this is being carried by the University of the South Pacifi c and NGOs,
in many areas, and one rarely provided through existing tertiary
who are also stretched. Community regulated fi sheries would enable
educational systems, although this is now changing. The international
resource owners to use appropriate social pressures for compliance,
community has itself had great diffi
culty in defi ning what exactly is
but at the moment there is no legal recognition of traditional "law", and
required of a coastal planner (see Call to Action 1995).
this needs to be changed. Furthermore, government priorities in the
fi shery are driven much more by economics than by any conservation
Within the Pacifi c Islands region very few governments have
or sustainable ethics.
developed national Integrated Coastal Management Plans. In the
absence of such plans, mechanisms for cross-sectoral planning for
The fi sheries licensing system needs to be reviewed and improved so
the coastal area are poorly developed, and may involve many diff erent
that more sustainable and integrated management of stocks can be
government departments. As mentioned above, the elements for
carried out. This would have to go hand-in-hand with the development
such planning have been proposed almost ad infi nitum at the global
of a much improved scientifi c basis for the fi shery, focusing on stock
and regional level. When asking why such plans have not been
estimates that would allow the implementation of realistic size and
developed, it has been advised that this process is not attractive
catch limits on subsistence fi sheries. At the same time, there is a need
to donors (whose help would be needed). In the ocean and coastal
for much greater feedback between government and the stakeholders.
sectors, responsibilities fall under many government departments in
Illegal fi shing such as the use of explosives, poisons and illegal nets is a
some Pacifi c Island countries ş for example, 14 diff erent departments
signifi cant problem in Fiji, and is poorly enforced because of the lack of
are involved in Fiji.
human resources and funds in the Fisheries Division.
62
GIWA REGIONAL ASSESSMENT 62 PACIFIC ISLANDS
Aquaculture has serious implications in Fiji and elsewhere in the region.
Community-based management
In Fiji, it is largely unregulated and there is no government legislation
Alternative management regimes for coastal fi sheries have been
in place, although the government is bound by various agreements
proposed to recognise the traditional role of village communities in
and conventions to which it is signatory, such as CITES. The industry is
the allocation and management of fi sh stocks. A great deal has been
almost entirely involved with introduced species, such as Tilapia, two
written on this topic, and SPREP has addressed the issue in some detail.
species of prawns, grass carp, pearl oysters, seaweeds (Kappaphycus)
Many researchers have extolled the virtues of Customary Marine Tenure
and, most recently, goatfi sh. Policies need to be put in place for the
(CMT), but others doubt the social equity of CMT regimes, and whether
prevention of alien introductions. The seaweed Kappaphycus has now
they are eff ective for fi sheries management (Anderson et al. 1999).
"escaped" from some of the many seaweed farms in Fiji, and is invading
coral reefs in Vanua Levu and Viti Levu. The same species has become a
Important factors that aff ect the integrity of CMT, and also impact on
serious nuisance in Hawaii, and is heading in that direction in Fiji. More
governance issues at the national and local level can be identifi ed as:
attention should be paid to the potential of local species as candidates
Demography change and urbanisation: 35 % of Pacifi c Island
for aquaculture.
people now live and work in towns, and this is expected to increase
to 50 % by 2020. Fisheries close to urban centres face the greatest
threats and require the most management. Urbanisation has led to
a breakdown in community-based management.
Problems faced by existing
Modernisation and economic development: The introduction
management regimes
of new fi shing technologies and the increasing incidence of
destructive fi shing practices have had a major impact on the
Centrally-based management
depletion of coastal fi sh stocks in the Pacifi c Islands. Increasing
In most Pacifi c Island countries government agencies responsible
demand for fi sh in urban centres has led to the exploitation of
for managing coastal fi sheries are also responsible for promoting
resources further and further away as traditional fi shing stocks
their economic development. The latter cause is often given higher
become depleted.
priority, even though it is recognised by most fi shing agencies and
Equity considerations: CMT systems are not necessary egalitarian
coastal communities that the catch rates of fi sh and invertebrates
in nature, and the control of some fi shing stocks by a few chiefs has
from lagoons and inshore reefs have been declining for a number of
often resulted in inequitable distribution of resources. CMT systems
years (King & Lambeth 2000). Changes in village lifestyle are bringing
may continue to prevent equitable treatment of participants in
economic pressures on fi shers to earn more income in order to satisfy
fi sheries. Competition for cash has contributed to the erosion
higher material aspirations.
of traditional principles of reciprocity and redistribution in
communities. CMT systems may also reinforce gender inequalities
Most Pacifi c Island authorities have adopted the Western models of
existing in traditional power structures. There is a growing need
fi sheries management, even though in temperate water countries
among communities for increased accountability and transparency
such policies have repeatedly proved to be expensive and ineff ective.
in decision-making.
These management regimes also require a sophisticated regulatory
Transboundary concerns: Within coastal systems it is questions
regime and extensive information on stocks, neither of which are
whether traditional boundaries represent appropriate fi sheries
possible given the limited resources and capacities of Pacifi c Island
management units. CMT is usually represented by a patchwork of
countries. The highly complex nature of tropical ecosystems places
CMT areas along a given coastline, each with diff erent sets of rules
further constraints on implementation and enforcement of western-
and access control. This makes the development of large-scale
style fi sheries management. There is a lack of understanding of these
fi sheries diffi
cult.
complex ecosystems, and the long-term impacts of management
Legal and policy issues: A signifi cant post-independence issue
decisions made in ignorance of these ecosystems. Essentially, Pacifi c
in most Pacifi c Island countries is not the fact that few give any
Islands fi shery management regimes consist of a proliferation of
formal statutory recognition of authority to CMT, nor are there any
regulations that government fi sheries departments do not have the
national policies that defi ne the role of CMT in national fi sheries
resources to enforce (Johannes 1994a, b).
administration. The possibility of codifi cation of traditional law
has been discussed by Fong (1994), although this has not yet
happened. In Samoa, village by-laws have a legal status, and
POLICY OPTIONS
63
allow village councils to manage marine protected areas with
undertook to support and enforce government laws banning the use
some authority (Fa'asili & King 1997). Eff orts to provide a legal
of chemicals and explosives. Traditional destructive fi shing methods
foundation for CMT systems and community-based management
such as the use of plant-derived fi sh poisons (ava niukini) and smashing
involve political issues far beyond the restricted fi eld of fi sheries
of corals to catch sheltering fi sh were also banned. Most villages made
legislation. Some fi sheries administrators argue that CMT systems
their own rules to enforce national laws regarding catch and size limits,
hamper the development of modern, effi
cient, national coastal
and some villages introduced controls on the use of nets, torches
fi sheries. Others argue that the complexity of CMT systems may
and spear fi shing. Other measures included killing crown-of-thorns
hamper the systematic and scientifi c planning and implementation
starfi sh, banning the removal of beach sand and dumping of rubbish
of eff ective resource management regimes.
in lagoons. The majority of the villages (38) elected to establish their
own small fi sh reserves, closed to all fi shing. The strongly traditional
Towards co-management
set-up in Samoan villages greatly facilitated the success of the project,
SPREP suggests that in many areas CMT might eventually benefi t by
and involved consultation with the village Fono, the holding of various
becoming embedded in the framework of co-management, essentially
village group meetings (including women's groups) leading to the
the mutual sharing of management responsibilities between local and
ultimate development of the Village Fisheries Management Plan and
national systems. There is a need to identify clear institutional roles for
the establishment of a Fisheries Management Committee (King &
each partner that builds on their respective strengths.
Fa'asili 1999). An important step was the recognition of village by-laws
used for the enforcement of regulations. This programme illustrates the
According to Anderson et al. (1999) the respective roles of government
steps required in the establishment of a successful co-management
and communities would be:
programme in the Pacifi c. The trigger for the programme in Samoa
Government:
was substantial funding from AusAID. Aid funds were also critical in
Provide
legislative
framework;
the establishment of the LMMA in Fiji. It will be important to see where
Identify sites under potential threat;
these programmes will be sustainable once aid funds dry up.
Assist management to plan development;
Provide
technical
assistance;
Confl
ict
resolution;
Provide training and extension.
Policy options
Communities:
The following policy options need to be developed:
Identify management objectives;
Promotion of community-based marine resources management
Implement the management plan;
of the fi sheries with cooperation between the resources owners,
Develop
mechanisms
for
eff ective communication.
custodians, the government, NGOs and the fi shing industry; the
focus would be on sustainable development of marine resources
Steps for establishment of co-management regimes
and integrated coastal management;
A number of recent examples demonstrate how co-management
Changes to the current licensing system to improve feed-back
regimes can be established. One of the most publicised is the Village
between government and all the stakeholders and to encourage
Fisheries Management Plan project developed in Samoa (Fa'asili &
and promote sustainable fi sheries using both scientifi c and
King 1997, King & Fa'asili 1999), and a more recent example from Fiji
customary practices;
was the Locally Managed Marine Areas (LMMA) project, internationally
Development of appropriate research policies to enhance the
recognised through the award of a Millennium Prize during WSSD in
gathering of data on inshore stocks, these to be used in the
Johannesburg in 2002. King & Lambeth (2000) produced a manual for
development of size and catch limits for the subsistence fi shery;
promoting the co-management of subsistence fi sheries by Pacifi c Island
Formulation of better waste management strategies together with
communities.
the implementation of acceptable environmental standards and
practices;
The process adopted in Samoa (King & Fa'asili 1999) took two years to
Identifi cation and utilisation of better resource-use methods that
set up in an initial total of 44 villages, and was overseen by fi sheries
are appropriate and cost eff ective;
extension staff . As described by King and Fa'asili (1999) communities
64
GIWA REGIONAL ASSESSMENT 62 PACIFIC ISLANDS
Development of legislation and regulations for the aquaculture and
are also major barriers to eff ective implementation of new policy options.
mariculture industries;
The root causes identifi ed work against successful implementation of
Recognition and formulation of local by-laws that would allow
co-management. Given the enormity of what is involved, it would be
greater monitoring and enforcement of fi shery regulations at the
a brave person who would try and indicate the costs of such policies.
community level.
The benefi ts are clear (sustainable fi sheries, recovery of fi sh stocks,
involvement of all stakeholders in co-management, etc.) but the cost
Effectiveness of policy options
of achieving these could be substantial.
The eff ectiveness or otherwise of the promotion and adoption of
community-based management regimes has been summarised above.
More and more Pacifi c Island countries are moving towards adopting
a co-management approach, and some innovative solutions have
Conclusion
emerged. In Samoa, the Fisheries Act of 1988 was specifi cally designed
to include provisions dealing with procedures whereby a village could
In conclusion, Pacifi c Island nations should be encouraged to:
declare its own fi sheries rules as by-laws. There a strong link between
1. Develop national Integrated Coastal Management Plans;
communities and government that has evolved over the past 10 years
2. Establish inter-sectoral planning and decision-making bodies
(King & Fa'asili 1999). In Fiji, a linkage between communities and
charged with the responsibility of implementing Integrated Coastal
government has been assisted by a statute that prohibits government
Management Plans. These bodies should include all stakeholders
fi sheries offi
cers from issuing a fi shing license to any person who has
as well as government, the private sector and NGOs.
not already obtained the written permission of the representative of
3. Promote the development of co-management of resources, and
the customary fi shing rights area concerned. The Native Lands and
the established of marine protected areas.
Fisheries Commission in Fiji has identifi ed, surveyed and registered
over 400 customary fi shing rights areas (Waqairatu 1994).
Obstacles to policy options
The eff ectiveness of any fi sheries policies introduced by Pacifi c Island
governments is likely to be hampered by lack of funds, human capacity
and knowledge. Co-management programmes will take a long time
for communities to absorb and process the information provided by
external partners such as government, a regional organisation or an
NGO. Many months will be required to facilitate discussions at the
community level before any plan can be developed and adopted.
Steps towards implementation
Governments need to develop a new paradigm in coastal fi sheries,
where some of the revenues are fed back to local communities to
assist with co-management. In addition, alternative lifestyles, and
extensive awareness-raising programmes need to be implemented,
to accommodate for lost income under new management regimes,
and to inculcate the necessary community will to actively pursue
co-management strategies that will lead to more sustainable use of
coastal resources. Political will of national governments will be a further
requirement: unfortunately co-management results in fewer revenues
for government, and sustainable practices if properly enforced would
lead to a reduction in fi sh catch while stocks are allowed to recoup from
many years of overfi shing. Governments might, as a result, give only lip
service to co-management. Lack of funds and trained human resources
POLICY OPTIONS
65
Conclusions and recommendations
Conclusions
migration and greater pressures on those countries that will need to
GIWA region 62 Pacifi c Islands is a vast oceanic expanse that is
accommodate these "eco-refugees". These global change patterns have
interspersed with many islands, which occupy only a small proportion
an overarching impact on all the GIWA concerns and issues discussed
of the area of the region. Transboundary eff ects on the oceanic scale are
in this assessment.
minimal, since the boundaries of the region are largely adjoining other
large oceanic spaces. Any eff ects of the Australian continent to the west
The most important concerns for the Pacifi c Islands region (not in order
are nullifi ed by the unpopulated Coral Sea, but to the northwest the
of importance) include freshwater shortage, habitat destruction and
region is infl uenced by land-based factors originating from Papua New
resource overutilisation. These are all having increasingly severe impacts
Guinea, Irian Jaya, and the Philippine Sea. Transboundary eff ects are
on the quality of life of Pacifi c Islanders. The root causes behind these
also minimal between the diff erent island states, since they are largely
concerns include increasing population, market and economic trends
separated by deep ocean. Within the countries, however, especially the
and poorly coordinated government planning and regulation. Whereas
larger archipelagic states, urban impacts, large watershed eff ects and
signifi cant progress in government and community reactions to these
other anthropogenic disturbances such as mining, forestry, agriculture
issues are evident, they are slow and fraught with many pitfalls. These are
and coastal development are considerable and often impinge on
frequently because of a lack of proper management tools such as data,
neighbouring islands or adjacent areas. Signifi cant impacts are,
proper understanding of the issues, and capacity within government
however, generally localised and diff er widely between high, low and
and the stakeholder communities to manage, regulate and enforce.
atoll countries. It is thus impossible to generalise for the entire region.
These diffi
culties are exacerbated by burgeoning population growth
in many of the countries, by a lack of funds, and by political expediency
On a region-wide scale several global impacts are becoming highly
under pressure from developers, industry and communities. Essentially
signifi cant. These include climate change, sea level rise and sea surface
the region looks good on paper, with so many of the countries having
temperature rise. Increasing frequency of the El Ni˝o is resulting
signed and ratifi ed post-UNCED Conventions and Agreements. In reality,
in severe changes to rainfall patterns and drought throughout the
few or none have the capacity to follow through with the enactment of
region. In addition, ENSO events, such as El Ni˝o, also contribute
laws and regulations required for compliance, or with the capacity (or
to sea level changes and hence coastal erosion. The increase in sea
political will) to enforce them.
surface temperature has been identifi ed as of great importance,
leading to increasing frequency and severity of coral bleaching. Many
Freshwater shortage is a serious problem now and in the future for
other ecological impacts are likely associated with this phenomenon,
most Pacifi c Island countries, and the problems diff er between atolls
but remain poorly understood. There is also evidence to suggest
and the high islands. Drought and water shortages are characteristic
that catastrophic climate events such as cyclones are increasing in
of atolls, and these are greatly magnifi ed when large populations
frequency and severity. Sea level rise, if even at the most modest
take up residence and tap in on a limited and highly vulnerable water
predictions over the next 50 years, will see the disappearance of many
source. In other countries, potable water may be readily available, but
atolls, and increasing inundation and salination of coastal areas of
is poorly distributed, especially in rural areas. Signifi cant changes in
high islands. These changes will lead to major population upheavals,
rainfall patterns will have long-term impacts on agriculture, forestry
66
GIWA REGIONAL ASSESSMENT 62 PACIFIC ISLANDS
and, indirectly, on the health of populations such as through increases
partners and the Pacifi c Island countries will work together towards
in the occurrence of vector-borne diseases like malaria and dengue
the important goals and milestones identifi ed in these initiatives. On
fever.
the high seas, the region has shown that agreement can be reached
by most stakeholders on the management and conservation of highly
The vast majority of Pacifi c Island countries have a high proportion of
migratory and transboundary fi sh stocks. Region-wide projects on
subsistence fi shers and farmers who depend on the living resources
coastal fi sheries, oceanic fi sheries, marine biodiversity and climate
from lagoons, coral reefs and near-shore fi shing grounds for their food
change continue to be pursued with vigour.
security. Yet the reefs and lagoons are under increasing threat from
rises in sea surface temperature (leading to coral bleaching), destruction
Over the next 20 years it is suggested that relatively few changes for
of mangroves, tourism, urban development, extractive industries and
worse or better are likely to occur in the region compared with the
other activities. The Pacifi c Island reefs are among the most extensive in
present-day situation. Increasing population, and global phenomena,
the world, they are less threatened than, for example, those in regions
however, may change the situation and cannot be accurately predicted
such as the Sulu Celebes (Sulawesi) Seas, the South China Sea and the
here.
Indonesian Seas GIWA regions. On a local scale, however, there are
many reefs that are certainly stressed. Dependence of some states on
Recommendations
agriculture largely practiced on narrow coastal plains (or in the very
The recommendations are designed to address the root causes
marginal soils of atolls) means that changes in these ecosystems will
identifi ed in the causal chain analysis. They are not listed in any
result in a decreasing resilience and food security among subsistence
particular order of priority. It is noteworthy that most of them are also
communities.
refl ected in the Pacifi c Islands Regional Ocean Forum (PIROF), held in
Suva, Fiji on February 2-6, 2004.
The loss of traditional lifestyles, urban drift and the region-wide
adoption of the cash economy are major socio-economic root causes.
1. All Pacifi c Island countries urgently need to develop and implement
Another common theme throughout the region is the lack of capacity
laws and regulations necessary for their compliance with global
and expertise, and the lack of knowledge (awareness) to deal with
conventions and agreements to which they are signatory. Existing
issues that are impacting society. These shortcomings, in turn, lead to
legislation should be properly enforced, and where new legislation
a lack of political will in governments. The governments are, in turn,
is required, this will require substantial outside assistance, since
largely vertically structured, which makes integrated planning and
many countries lack the necessary legal expertise.
decision making very diffi
cult. Furthermore, there is often inadequate
2. Capacity building in all areas of ocean, coastal and watershed
consultation with stakeholder communities in all aspects of planning
management is a priority for the region. This will require a concerted
and development. But there are encouraging changes, in that island
eff ort on the parts of national, regional and international education
societies are becoming more pro-active and there is an increasingly
and training institutions, and signifi cant funding. All future projects
mutual realisation that co-management of resources is crucial if
should be required to include a capacity-building component and
there is to be any chance of sustainability in the future. At present,
should engage local communities.
the indications are that sustainable development is a diffi
cult, if not
3. The raising of public awareness on all coastal and ocean-related
impossible goal, in the Pacifi c Islands.
topics is badly needed, from the level of the village to that of
government, planners and decision-makers. Schools, NGOs and
Some of the answers to the future lie in regional initiatives and
the media should all play a part in this process. For the schools,
cooperation. The Pacifi c Islands region has, since the establishment
this would require a signifi cant investment in the development of
of the South Pacifi c Commission in 1947, been a model of regional
national school curricula that refl ect local needs.
cooperation. The current inter-governmental regional organisations
4. Integrated planning and decision-making is a necessity for all
are the means whereby the Pacifi c Island countries can work together
governments. This requires a new paradigm in government, and
to address many of the problems identifi ed in this assessment. Their
involvement of all parties in the process, especially the stakeholders.
collective performances at UNCED, Barbados and at the WSSD in
For most countries, the development of an integrated coastal
Johannesburg are commendable. Some of the post-WSSD Type II
management plan should be a national priority. (This concept was
initiatives proposed by the Pacifi c Islands certainly seek to address
strongly endorsed during PIROF: perhaps this endorsement will
important issues of sustainability, and it is to be hoped that donors,
provide the impetus that has been lacking in the past).
CONCLUSIONS AND RECOMMENDATIONS
67
5. There is a great need for research on and monitoring of the
coastal and ocean environments of the region. The strengthening
of research and monitoring capacity is an a priore need and,
where necessary, regional and international cooperation and
involvement of communities, NGOs and the private sector should
be encouraged. The need should be expressed in all future bi-
lateral and multi-lateral aid projects, and funding sought to support
it. The strengthening of the research and monitoring capacity of
national and regional universities should be encouraged, as well
as cooperation with developed country institutions through
partnership arrangements.
6. The regional and global lobbying of the Pacifi c Island countries is
commendable, well organised and eff ective. This now needs to be
brought down to the local community level, and proper feedback
mechanisms between researchers, managers, government and
communities need to be developed.
7. Environmental sustainability needs to be given greater emphasis by
governments, many of which lack a relevant ministry or department
for the environment. Implementation of sustainability policies will
require political will, cooperation, and the provision of appropriate
resources.
8. All Pacifi c Island countries developed National Environment
Management Strategies (NEMS) as a lead-up to UNCED. Yet, many of
the recommendations have yet to be implemented, and the NEMS
are a decade out of date. The NEMS should be dusted off , revised
if necessary, and translated into actions. The recommendations
contained within NEMS could be linked to economic development
plans, in the form of National Sustainable Development Plans.
9. Pacifi c Island countries must take greater ownership of projects
managed by regional organisations, as it is the countries themselves
who will have to implement sustainable practices. Countries must
strive and seek support to bring this about, because if they fail to
do so it could at their peril for the future.
68
GIWA REGIONAL ASSESSMENT 62 PACIFIC ISLANDS
References
Alam, K. and Falkland, A.C. (1997). Vulnerability to Climate Change of the
Asian Development Bank (2001). Executive Summary, In: The
Bonriki Freshwater Lens, Tarawa. ECOWISE Environmental, ACTEW
Contribution of Fisheries to the Economies of Pacifi c Island
Corporation, prepared for Ministry of Environment and Social
Countries.
Development, Republic of Kiribati, September 1997.
Bailey, K.N., Williams, P.G. and Itano, D.G. (1996). By-catch and discards
Allen, J., Gosden, C. and White, J.P. (1989). Human Pleistocene adaptations
in the western Pacifi c tuna fi sheries: A review of SPC data holdings
in the tropical island Pacifi c: recent evidence from New Ireland, a
and literature. Oceanic Fisheries Programme Technical Report 34.
Greater Australian outlier. Antiquity 63: 548-561.
South Pacifi c Commission, Noumea, New Caledonia.
Allen, M. S. (1992). Temporal variation in Polynesian fi shing strategies: the
Bolatiki, M. (2002). Fishing industry investors use indigenous Fijians, The
Southern Cook Islands in regional perspective. Asian Perspectives
Daily Post Tues, March 26.
31(2): 183-204.
Bower, R., Carpenter, C., and Overmars, M. (2002). Regional meeting
Amade, P. (1993). Ciguatera fi sh poisoning: the situation in New
of stakeholders in wastewater management, 10-15 October 2001,
Caledonia. SPC Ciguatera Information Bulletin 3.
Majuro, Marshall Islands. SOPAC Miscellaneous Report 451: 1 v.; 1
Anon. (2003). Consultation for the Pacifi c region on the proposed
CD ş ROM.
International Assessment of the Role of Agricultural Science and
Bryan, G.W., Gibbs, P.E., Hummerstone, L.G. and Burt, G. (1986). The
technology in Reducing Hunger, Improving Rural Livelihoods and
decline of the gastropod Nucella lapillus around south-west
Stimulating Environmentally and Socially Sustainable Economic
England: evidence for the eff ect of tributyltin from antifouling
Growth. Southern Cross Hotel, Suva, Fiji. May 23-24, 2003 (report
paints. Journal of the Marine Biological Association of the UK 66:
available on internet).
611-640.
Anderson, E. (1997). Water quality in the Ba River, Fiji: Separating the
Bryant, D., Burke, L. McManus, J.W. and Spalding, M. (1998). Reefs at Risk:
eff ects of Multiple Resource uses. In: Islands in the Pacifi c Century.
A map-based indicator of treats to the world's coral reefs. World
Abstracts. VIII Pacifi c Science Inter-Congress, 13-19 July 1997. The
Resource Institute. Retrieved June, 2003 from: http://wri.igc.org/
University of the South Pacifi c, Suva, Fiji Islands: S7.5.5.
reefsatrisk
Anderson, J. A., Mees, C.C., and Cowan, V. (1999). Guidelines towards
Burns, W.C.G. (2002). Pacifi c Island Developing Country Water Resources
eff ective co-management of coral reef fi sheries in the Pacifi c
and Climate Change. Chapter 5 in World's Water 2002.
Region, Volume 5. In Anderson, J.A. and Meeds, C.C. (eds.) The
Burton, J.E. Doriciak, I.R., Schwedler, T.E. and Rice, C.D. (2002). Plasma
Performance of Customary Marine Tenure in the Management of
lysosome and hepatic CYPIA activities during a chronic dietary
Community Fishery Resources in Melanesia. Final Technical Report
exposure to tributlytin (TBT) and 3,3', 4,4'5-pentochlorobiphenyl
to the UK Department for International Development, MRAG Ltd,
(PCB 126) in channel catfi sh, Ictalurus punctatus. Journal of
London.
Toxicology and Environmental Health 65: 589-602.
Aqorau, T. (2003) Customary rights and the law. Pacifi c Islands Ocean
Butler, V.L. (1993). Measuring eff ects of prehistoric predation and habitat
Forum 1(8): 1-3.
alteration on fi shes, Mangaia, Cook Islands. Paper presented at the
Society for American Archaeology Meeting, St Louis, Missouri.
REFERENCES
69
Butler, V.L. (1994). Fish feeding behaviour and fi sh capture: the case for
Dupon, J.F. (1983). Pacifi c phosphate island environments versus the
variation in Lapita fi shing strategies. Archaeology in Oceania 29:
mining industry: an unequal struggle. Environmental Case Studies
81-90.
4. South Pacifi c Commission, Noumea.
Call to Action (1995). Educating Coastal Managers. Rhode Island
Fa'asili, U. and King, M. (1997) Community-based marine protected
Workshop, March 9, 1995. University of Rhode Island, W. Alton
areas. 6th South Pacifi c Conference on Nature Conservation
Jones Campus. University of Rhode Island Coastal Resources Centre
and Protected Areas, 29 September ş 3 October, 1997. Pohnpei,
Technical Report 2085.
Federated States of Micronesia.
Cesar, H.S.J., Lundin, C.G., Bettencourt, S. and Dixon, J. (1997). Indonesian
Fagan, L.L., Cakausese, N. and Anderson, E. (1995). Water quality in the
coral reefs: an economic analysis of a precious but threatened
Ba River and Estuary: Environmental eff ects of Multiple Resource
resource. Ambio: 26: 345-350.
Use. Institute of Applied Sciences Environmental Report 81. The
CIA World Factbook. (2003). Retrieved May 2004 from: www.cia.gov/
University of the South Pacifi c, Suva, Fiji Islands.
cia/publication/factbook
Fairbairn, T.I.J. (1994). Pacifi c Island economies. Structure, current
Clements, W.E., Jones, L.A., Barnes, F.J. and Ivey, M.D. (2000). The ARM
developments and prospects. In: Douglas, N. and Douglas, N. (eds.)
Program in the tropical Western Pacifi c. Earth and Environmental
Pacifi c Islands Yearbook. 17th Edition. Fiji Times, Suva. p 11-24.
Sciences Progress Report, 1998-2000: 60-63.
Falkland, A.C. (1992). Review of Tarawa Freshwater Lenses, Republic of
Coles, R., McKenzie, L., Campbell, S., Fortes, M. and Short, F. (2003a).
Kiribati. Australian International Development Assistance Bureau.
The Seagrasses of the Western Pacifi c Islands. Pp. 161-170 In: Green,
Report HWR 92/682. Canberra, Australia.
E.P. and Short, F.T. (eds) World Atlas of Seagrasses. University of
Falkland, A. C. (2001). Synopsis of information on Freshwater and
California Press, Berkeley, Los Angeles & London.
Watershed Management Issues in the Pacifi c Islands region.
Coles, S.L., Reath, P.R., Skelton, P.A. and Bonito, V. (2003b). Introduced
South Pacifi c Regional Environment Programme, Strategic Action
marine species in Pago Pago Harbor, Fagatele Bay and the
Programme for International Waters, August 2001.
National Park Coast, American Samoa. Preliminary draft report
FAO (1972). Atlas of the Living Resources of the Seas. FAO Fisheries
prepared for the U.S. Fish and Wildlife Service, Fagatele Bay Marine
Circular No, 126. Food and Agriculture Organisation, Rome.
Sanctuary, National Park of American Samoa and American Samoa
FAO (1987). Guidelines for economic appraisal of watershed
Department of Marine and Natural Resources. Bernice P. Bishop
management projects. Written by Gregersen, H.M., Brooks, K.N.,
Museum Pacifi c Biological Survey. Honolulu, Hawai'i.
Dixon, J.A. and Hamilton, L.S. FAO Conservation Guide No. 16.
Crennan, L. (1998). Water Resource Confl icts in Tarawa. Environment
Fiji Fisheries Division (1992). Annual Report 1991. Government Printers,
and development in coastal regions and in small islands. UNESCO.
Suva.
Available at: http://www.unesco.org/csi/act/pacifi c/tarawa.htm
Fiji Fisheries Division (1995). Annual Report 1994. Government Printers,
Crosby, M.P., Brighouse, G. and Pichon, M. (2002). Priorities and
Suva.
strategies for addressing natural and anthropogenic threats to
Fiji Fisheries Division (1996). Annual Report 1995. Government Printers,
coral reefs in Pacifi c Island Nations. In: Institut de Recherche pour
Suva.
le dÚveloppement, Centre Noumea (ed.) Coral Reefs in the Pacifi c:
Fiji Fisheries Division (1997). Annual Report 1996. Government Printers,
Status and Monitoring, Resources and Management. p 25-35.
Suva.
Cumming, R.L., Toscano, M.A., Lovell, E.R., Carlson, B.A., Dulvy, N.K.,
Fiji Government (1978). Laws of Fiji. Chapter 158A. Marine Spaces.
Hughes, A., Koven, J.F., Quinn, N.J., Sykes, H.R., Taylor, O.J.S. and
Fiji Government (1985). (revised) Laws of Fiji. Chapter 158. Fisheries.
Vaughan, D. (2002). Mass coral bleaching in the Fiji Islands, 2000.
Fiji Natural Disaster Profi le (n.d.). The EM-DAT: OFDA/CRED International
Proc. 9th Interantional Coral Reef Symposium, Bali, Indonesia.
Disaster Database. UniversitÚ catholique de Louvain, Brussells,
Dalzell, P. and Adams, T.J.H. (1996). Sustainability and management
Belgium.
of reef fi sheries in the Pacifi c Islands. Paper presented at the 8th
Fong, G.M. (1994). Case Study of Traditional Marine Management
International Coral Reef Symposium, Panama City, Panama. 24-29
Systems: Sasa Village, Macuata Province, Fiji. Field Report 94/
June, 1996.
1, Project RAS/92/TO5, Case Studies on Traditional Marine
Dalzell, P., Adams, T.J.H. and Polunin, N.V.C. (1996). Coastal fi sheries in
Management Systems in the South Pacifi c. FFA, Honiara; FAO,
the Pacifi c Islands. Oceanography and Marine Biology: an Annual
Rome.
Review. 34: 395-531.
70
GIWA REGIONAL ASSESSMENT 62 PACIFIC ISLANDS
Gangaiya, P., Tabudravu, J., South, G.R. and Sotheeswaran, S. (2001).
Jones, R.J. and Steven, A.L. (1997). Eff ects of cyanide on corals in relation
Heavy metal contamination of the Lami coastal environment, Fiji.
to cyanide fi shing on reefs. Marine and Freshwater Research 48:
South Pacifi c Journal of Natural Sciences 19: 24-29.
517-522.
Green, E.P. and Short, F.T. (eds.) (2003). World Atlas of Seagrasses.
Kaloumaira, A. (2000). United Nations University report on the impacts
University of California Press, Berkeley, Los Angeles, London.
of El Ni˝o on Fiji. UNU, Tokyo.
Greenpeace (1995). The environmental impacts of nuclear testing at
King, M. and Fa'asili, U. (1999). A network of small, community-owned
Moruroa Atoll. Press Release, 24 July 1995.
village fi sh reserves in Samoa. SPC Traditional Marine Resource
Hasan, M.R. (1986). Hydrology of Rewa and Ba watersheds: Unpublished
Management and Knowledge Information Bulletin 11: 1-6.
report, UNDP/FAO for Ministry of Primary Industries, Suva, Fiji.
King, M. and Lambeth, L. (2000). Fisheries management by communities.
Hasni, S. (2003). Country Profi le - Fiji. ITTO Newsletter. Retrieved Nov.
A manual on promoting the management of subsistence fi sheries
2003 from: http://www.itto.or.jp/newsletter/v7n2/23country.html
by Pacifi c Island communities. Secretariat of the Pacifi c Community,
Heathcote, P. (1997). Maritime Law in the South Pacifi c ş Towards
Noumea, New Caledonia.
Harmonisation. PhD Thesis, The University of the South Pacifi c,
Kirch, P.V. (1988). Niuatoputapu: the prehistory of a Polynesian chiefdom.
Suva.
Thomas Burke Memorial Washington State Museum Monograph
Hoegh-Guldberg, O. (1999). Climate change, coral bleaching and the
5. Seattle.
future of the world's coral reefs. Marine and Freshwater Research
Kirch, P.V., and Dye, T.S. (1979). Ethno-archaeology and the development
50: 839-866.
of Polynesian fi shing strategies. Journal of the Polynesian Society
Hoegh-Gulberg, O., Hoegh-Gulberg, H., Stout, D.K., Cesar, H. and
88 (1): 53-76.
Timmerman, A. (2000). Pacifi c in Peril. Greenpeace, Sydney,
Kirch, P.V. and Yen, D.E. (1982). Tikopia: the prehistory of a Polynesian
Australia.
outlier. Bernice P. Bishop Museum, Bulletin No. 238, Hawaii.
Hughes, T.P., Baird, A.H., Bellwood, D.R., Card, M., Connolly, S.R., Folke, C.,
Kirch, P.V., Hunt, T.L., Weisler, M., Butler, V. and Allen, M.S. (1991). Mussau
Grosberg, R., Hoegh-Guldberg, O., Jackson, J.B.C., Kleypas, J., Lough,
Islands prehistory, results of the 1985-86 excavations. Occasional
J.M., Marshall, P., Nystrom, M., Palumbi, S.R., Pandolfi , J.M., Rosen, B.
Papers in Prehistory 20. Department of Prehistory, Australian
and Roughgarden, J. (2003). Climate change, human impacts, and
National University, Canberra, Australia: 144-163.
the resilience of coral reefs. Science 301: 929-931.
Kirch, P.V., Steadman, D.W., Butler, V.L., Hather, J. and Weisler, M.I. (1995).
Jennings, S. and Polunin, N.V.C. (1997). Impacts of predator depletion
Prehistory and human ecology in Eastern Polynesia: excavations
by fi shing on the biomass and diversity of non-target reef fi sh
at Tangatatu rockshelter, Mangaia, Cook Islands. Archaeology in
communities. Coral Reefs 16:71ş82.
Oceania 30: 47-65
Jennings, S. and Polunin, N.V.C. (1996). Impacts of fi shing on tropical reef
Lauerman, J.F. (1997). Trouble in Paradise. Environmental Health
ecosystems. Ambio 25: 44-49.
Perspectives 105(9).
Johannes, R.E. (1994a). Pacifi c Island peoples' science and marine
Leach, B.F. and Davidson, J.M. (1988). The quest for the Rainbow
resource management. In: Morrison, J., Geraghty, P. and Crowl, L.
Runner: prehistoric fi shing on Kapingamarangi and Nukuoro Atolls,
(eds.) Ocean and Coastal Studies. Science of Pacifi c Peoples. Vol. 1.
Micronesia. Micronesica 21: 1-22.
Suva: Institute of Pacifi c Studies.
Masse, W. B. (1986). A millennium of fi shing in the Palau Islands,
Johannes, R. (1994b). Design of tropical nearshore fi sheries extension
Micronesia. In: Anderson, A. (ed.) Traditional Fishing in the Pacifi c:
work beyond the 1990s. In: South, G.R., Goulet, D., Tuqiri, S. and
Ethnographical and Archaeological Papers from the 15th Science
Church, M. (eds.) Traditional Marine Tenure and Sustainable
Congress. Pacifi c Anthropological Records No. 37, Bernice P. Bishop
Management of Marine Resources in Asia and the Pacifi c.
Museum, Hawai'i. p 85-117.
Proceedings of the International Workshop. 4th ş 8th July, 1994.
McManus, J.W. (1997). Tropical marine fi sheries and the future of coral
IOI-South Pacifi c, Western Pacifi c Consultative Committee, the
reefs: A brief overview with emphasis on South-east Asia. Proc. 8th
Government of France & the University of the South Pacifi c, Marine
Int. Coral Reef Symp. 1:129-134.
Studies Programme. p 162-174.
Metai, E. (2002). Vulnerability of freshwater lens on Tarawa ş the role
Jones, R.J. and Hoegh-Guldberg, O. (1999). The eff ect of cyanide on
of hydrological monitoring in determining sustainable yield.
the photosynthesis of zooxanthellae in reef-building corals Marine
Presented at Pacifi c Regional Consultation on Water in Small Island
Ecology Progress Series, 177: 83-91.
Countries, 29 July-3 August, 2002. Sigatoka, Fiji.
REFERENCES
71
Mitchell, W., Chittleborough, J., Ronai, B. and Lennon, G.W. (2003).
Rivera, K. (2002). Incidental catch of seabirds in longline fi sheries.
Sea level rise in Australia and the Pacifi c. South Pacifi c Sea Level
Waterbirds for the Americas. Managers Toolbox Series.
and Climate Monitoring Project. Flinders University, Adelaide,
RMI (1996). Nuclear Testing in the Marshall Islands: A Brief History.
Australia.
Majuro: Micronitor News and Printing Company. 1996. Available at:
Monfi ls, R.C. and Nawadra, S. (2003). Sunken World War II shipwrecks
http://www.rmiembassyus.org/nuclear/chronology.html
of the Pacifi c and East Asian region ş the need for regional
Rose, W.L., French, B.L., Reichelt, W. and Faisal, M. (2000). DNA adducts
collaboration to address the potential marine pollution threat.
in hematopoietic tissues and blood of the mummichog (Fundulus
Abstract: East Asian Seas Congress, Putrajaya, Malaysia. December
heteroclitus) from a creosote-contaminated site in the Elizabeth
1-12, 2003. p. 38-39.
River, Virginia. Marine Environmental Research 50: 581-589.
Morrison, R.J. (1981). Factors determining the extent of soil erosion in
Salvat, B. (2002). Status of Southeast and Central Pacifi c coral reefs
Fiji. Environmental Studies Report 7. Institute of Natural Resources,
`Polynesia mana node' Cook Islands, French Polynesia, Kiribati,
The University of the South Pacifi c, Suva, Fiji.
Niue, Tokelau, Tonga, Wallis and Futuna. In: Wilkinson, C. (ed.)
Naidu, S., Aalbersberg, W.G., Brodie, J.E., Fuavao, V.A., Maata, M.
Status of Coral Reefs of the World: 2002. Australian Institute of
Naqasima, M.,Whippy, P. and Morrison, R.J. (1991). Water quality
Marine Science, Townsville. p 203-215.
studies on selected South Pacifi c lagoons. UNEP Regional Seas
Scott, D.A. (1993). A Directory of Wetlands of Oceania. Slimbridge:
Reports and Studies No. 136, UNEP 1991.
International Waterfowl and Wetlands Research Bureau, and Kuala
Naidu, S.D. and Morrison, R.J. (1994). Contamination of Suva Harbour,
Lumpur: Asian Wetland Bureau.
Fiji. Marine Pollution Bulletin: 29: 126-130.
Sharma, S., Smithy, R. and Frost, G. (2001). Water-quality analysis Manihiki
Nawadra, S. (2004). Addressing shipping related marine pollution in
Lagoon, Cook Islands. SOPAC Technical Report 331.
the Pacifi c Islands region. Discussion Paper. Pacifi c Islands Regional
Singh, P. (1992). Status of ciguatera in Fiji. Ciguatera Information Bulletin
Oceans Forum, Suva, Fiji. February 2-6. 2004.
2. South Pacifi c Commission, Noumea: 11-12.
Nunn, P.D. (1990). Recent environmental changes along south-west
Skelton, P.A. (2000). A Floristic Survey of the Benthic Marine Algae of
Pacifi c coasts and the prehistory of Oceania: developments of the
the Palolo Deep National Marine Reserve of Samoa. M.Sc. Thesis,
work of the late John Gibbons. Journal of Pacifi c Studies 14: 42-58.
the University of the South Pacifi c, Suva, Fiji.
Pauly, D., Palomares, M.L., Froese, R., Saa, P., Vakily, M., Preikshot, D. and
Skelton, P.A., Bell, L.J., Mulipola, A. and Trevor, A. (2002). The status of coral
Wallace, S. (2001). Fishing down Canadian foodwebs. Canadian
reefs and marine resources of Samoa. In: Institut de Recherche pour
Journal of Fisheries and Aquatic Sciences 58: 51-62.
le dÚveloppement, Centre Noumea (ed.) Coral Reefs in the Pacifi c:
Preston, G.L. (1993). Bŕche-de-mer. In :Wright, A. and Hill, L. (eds.)
Status and Monitoring, Resources and Management. p 219-247.
Nearshore Marine Resources of the South Pacifi c. Institute for Pacifi c
Solomon, S. (1997). Circulation studies in Manihiki Lagoon, Cook Islands.
Studies, Suva; Forum Fisheries Agency, Honiara & International
SOPAC Technical Report 246.
Centre for Ocean Development, Canada. Chapter 11, p 370-407.
SOPAC (2002). The Pacifi c Regional Action Plan on Sustainable Water
Raj, S.C. (2000). Solid waste education and awareness in Pacifi c Island
Management. Note: In Preparation for the 3rd World Water Forum,
Countries. Pacifi c Regional Waste Awareness and Education
Kyoto, Japan 2003. 32 pp.
Programme, SPREP, Apia, Samoa.
Souter, D.W. and Linden, O. (2000). The health and future of coral reef
Rawlinson, N.J.F., Milton, D.A., Blaber, S.J.M., Sesewa, A. and Sharma, S.P.
systems. Ocean & Coastal Management 43: 657-688.
(1995). A Survey of the Subsistence and Artisanal Fisheries in Rural
South, G.R., Goulet, D., Tuqiri, S. and Church, M. (eds.) (1994). Traditional
Areas of Viti Levu, Fiji. Rome: FAO.
Marine Tenure and Sustainable Management of Marine Resources
Rice, C.D. (2001). Fish toxicology. Understanding mechanisms of action.
in Asia and the Pacifi c. Proceedings of the International Workshop,
pp. 96-138 In: Schlenk, D. and Benson, W.H. (eds.) Target Organ
4th ş 8th July, 1994. International Ocean Institute Operational
Toxicity in Marine and Freshwater Teleosts. Vol. 2. Systems. Taylor
Centre for the South Pacifi c, Suva.
and Francis Publishers, London.
South, G.R. and Veitayaki, J. (1999). Global initiatives in the South Pacifi c:
Rilov, G., Gasith, A., Evans, S.M. and Benayahu, Y. (2000). Unregulated use
regional approaches to workable arrangements. Asia Pacifi c School
of TBT-based antifouling paints in Israel (eastern Mediterranean):
of Economics and Management Studies Online. Asia Pacifi c Press,
high contamination and imposex levels in two species of marine
Australian national University. 1-52.
gastropod. Marine Ecology Progress Series 192: 229-238.
Spalding, M.D., Ravilious, C. and Green, E.P. (2001). World Atlas of Coral
Reefs. Berkeley, University of California Press.
72
GIWA REGIONAL ASSESSMENT 62 PACIFIC ISLANDS
SPC (2003). Socio-economic, demographic and reproductive health
Tebano, T. (1984). Population density study on a toxic dinofl agellate
profi les of Pacifi c Island countries. Secretariat for the Pacifi c
responsible for ciguatera fi sh poisoning on South Tarawa Atoll,
Community. Database available at http://www.spc.org.nc
Republic of Kiribati. Atoll Research and Development Unit, Tarawa.
Spennenman, D.H.R. (1992.). Apocalypse, now? The fate of World War II
Tebano, T. (1992). Ciguatera poisoning and reef disturbance in South
sites on the Central Pacifi c Islands. http://Marshall.csu.ed.au/PDF_
Tarawa, Kiribati. Atoll Research Programme. SPC Ciguatera
Articles_DRS/Apocalypse.pdf.
Information Bulletin. Fisheries Information Project. SPC.
Spennenman, D.H.R. (1987). Availability of shelollfi sh resources on
Tebano, T. (1996). Integrated urban plans and programme study for
prehistoric Tongatapu, Tonga: eff ects of human predation and
South Tarawa, Kiribati. Results of a survey conducted in 3 villages
changing environment. Archaeology in Oceania 22: 81-96.
of South Tarawa, Betio, Bairiki, Bikenbeu. Report prepared by Atoll
SPEHIS (1993). Fish poisoning cases (1991-1992). Ciguatera Information
Research Programme for MHARD. Asian Development Bank.
Bulletin 3. Marine Resources Programme, Information section.
Terry, J.P. and Raj, R. (1998).Hydrological drought in western Fiji and the
SPREP (2001a). Strategic Action Programme for the International Waters
Contribution of tropical cyclones. In: Terry, J.P. (ed.) Climate and
of the Pacifi c Small Island Developing States. South Pacifi c Regional
Environmental Change in the Pacifi c. School of Social and Economic
Environment Programme, Apia.
Development, University of the South Pacifi c, Suva, Fiji. p 73-85.
SPREP (2001b). Proceedings of the Pacifi c Regional Workshop on
Terry, J.P., Raj, R. and Kostaschuk, R.A. (2001). Links between the Southern
Mangrove Wetland Protection and Sustainable Use. The University
Oscillation Index and Hydrological Hazards on a Tropical Pacifi c
of the South Pacifi c Marine Studies Facility, Suva, Fiji. June 12-16,
Island. Pacifi c Science 55(3): 275-283.
2001.
Terry, J.P., S. Garimella, S. and Kostaschuk, R.A. (2002). Rates of fl oodplain
SPREP (2001c). A review of turtle by-catch in the Western and Central
accretion in a tropical island river system impacted by cyclones and
Pacifi c Ocean tuna fi sheries. Prepared by the Oceanic Fisheries
large fl oods. Geomorphology 42:171-182.
Programme.
Togamana, C. (1995). Nutrient transport via Sedimentary Processes in
SPREP (2003). Annual Report, 2002. Apia, Samoa.
the Rewa Catchment. The University of the South Pacifi c, Suva,
SPREP, SOPAC, UNEP, PWA (2001). Pacifi c Wastewater Policy Statement,
Fiji. 123 pp.
Majuro, Marshall Islands, 15 October 2001.
Tutangata, T.I. (1996). Vanishing Islands. Our Planet Magazine. Available
Sulu, R.J., Cumming, R., Wantiez, L., Kumar, L., Mulipola, A., Lober, M.
at http://www.ourplanet.com/imgversn/103/06_van.htm
Sauni, S., Poulasi, T. and Pakoa, K. (2002). Status of coral reefs in
UNEP-WCMC (2003). World Database on Protected Areas. Retrieved
the Southwest Pacifi c region to 2002: Fiji, Nauru, New Caledonia,
Nov., 2003, from http://sea.unep-wcmc.org/wdbpa/index.htm
Samoa, Solomon Islands, Tuvalu and Vanuatu. In Wilkinson, C. (ed.)
Veitayaki, J. (1990). Village Level Fishing in Fiji: a Case Study of Qoma
Status of Coral Reefs of the World: 2002. Australian Institute of
Island. MA Thesis, The University of the South Pacifi c, Suva, Fiji.
Marine Science, Townsville. p 181-201.
Veitayaki, J. (2001). Realities in Rural Development: Fisheries Development
Swadling, P. (1977). Central Province shellfi sh resources and their
in Fiji. PhD Thesis, Australian National University, Canberra.
utilisation in the prehistoric past of Papua New Guinea. The Veliger,
Veitayaki, J. Ram-Bidesi, V., Matthews, E., Gibson, L., and Vuki, V. (1995).
19 (3), 293-302.
Overview of destructive fi shing practices in the Pacifi c Islands
Swadling, P. 1986. Lapita shellfi shing: evidence from sites in the Reef/
Region. South Pacifi c Regional Environment Programme. SPREP
Santa Cruz Group, Southeast Solomons. In Anderson, A. (ed).
Reports and Studies no. 93.
Traditional Fishing in the Pacifi c: Ethnographical and Archaeological
Waqairatu, S. (1994). The delimitation of traditional fi shing grounds the
Papers from the 15th Science Congress. Pacifi c Anthropological
Fiji experience. In: South, G.R., Goulet, D., Tuqiri, S. and Church, M.
Records 37: 137-148. Bernice P. Bishop Museum, Hawaii.
(eds.) Traditional Marine Tenure and Sustainable Management
Tamata, B., Lloyd, C.R. and Green, D. (1993). Water quality in the ports
of Marine Resources in Asia and the Pacifi c. Proceedings of the
of Fiji. 1992 Monitoring Programme. Institute of Applied Sciences
International Workshop. 4th ş 8th July, 1994. IOI-South Pacifi c,
Environmental Report 67. The University of the South Pacifi c,
Western Pacifi c Consultative Committee, the Government of France
Suva.
& the University of the South Pacifi c, Marine Studies Programme.
Tawake, A. (2004). The Fiji Locally Managed Marine Area (FLMMA)
p 79-94.
Network Experiences. Pacifi c Islands Regional Ocean Forum. Suva,
Fiji, Feb. 2-6, 2004. Power Point Presentation, PIROF documents
CD.
REFERENCES
73
Ward, R.G. (1972). The Pacifi c bŕche-de-mer trade, with special reference
Wilkinson, C.R. and Buddemeier, R.W. (1994). Global climate change and
to Fiji. In: Ward, R.G. (ed.) Man in the Pacifi c Islands: Essays on
coral reefs: implications for people and reefs. Report to the UNEP-
Geographical Changes in the Pacifi c. Oxford University Press.
IOC-ASPEI-IUCN Global Task Team on the Implications of Climate
p 91-123.
Change on Coral Reefs. IUCN, Gland, Switzerland.
Wauthy, B. (1986). Physical ocean environment in the South Pacifi c
Wilkinson, C.R., Linden, O., Cesar, H.S.J., Hodgson, G., Rubens, J. and
Commission area. Nairobi: United Nations Environmental
Strong, A.E. (1999). Ecological and socio-economic impacts of the
Programme (UNEP) Regional Seas Reports and Studies. 83.
1998 coral mortality in the Indian Ocean: An Enso impact and a
Weeks, B.A. and Warinner, J.E. (1984). Eff ects of toxic chemicals
warning of future change? Ambio 28:188-196.
on macrophage phagocytosis in two estuarine fi shes. Marine
Williams, P.G. (1996). An update of by-catch issues in the western and
Environmental Research 14: 327-335.
central Pacifi c Ocean tuna fi sheries. Paper presented at the Asia-
Weeks, B.A., Huggett, R.J., Warinner, J.E. and Mathews, E.S. (1990).
Pacifi c Fisheries Commission (APFIC) Symposium on Environmental
Macrophage responses of estuarine fi sh as bioindicators of toxic
Aspects of Responsible Fisheries. Seoul, Korea. 15th ş 18th October,
contamination. In: McCarthy, J.F. and Shugert, L.R. (eds.) Biomarkers
1996.
of Environmental Contamination. Lewis Publishers, Inc., Chilsee, MI.
Woodroff e, C.D. (1987). Pacifi c Island mangroves: distribution and
p 193-201.
environmental settings. Pacifi c Science 41: 166-184.
Wells, S.M. and Jenkins, M.D. (1988). Coral Reefs of the World. Vol. 3:
WWF (2003). South Pacifi c ş Gift to the Earth for whale conservation.
Central and Western Pacifi c. Nairobi: United Nations Environment
Gift 89, 13 August 2003.
Programme, and Gland: International Union for the Conservation
of Nature.
Personal communications
White, I., Falkland, A., Crennan, L., Jones, P., Etuati, B., Metai, E. and
Lal, Mr Satya Nand. Secretariat for the Pacifi c Community, Noumea, New
Metutera, T. (1999a). Issues, Traditions and Confl icts in Groundwater
Caledonia. Aquaculture expert.
Use and Management. UNESCO-International Hydrological
Lovell, Mr Ed. Biological Consultant, Fiji. Expert on coral reefs and
Programme, Humid Tropics Programme. IHP-V Theme 6. Technical
tropical marine ecosystems.
Documents in Hydrology 25. UNESCO, Paris.
Schlńppy, Ms Marie-Lise. Student, Center for Tropical Marine Ecology,
White, I., Falkland, A. and Scott, D. (1999b). Droughts in Small Coral
University of Bremen, Germany and previously marine biologist, the
Islands: Case Study, South Tarawa, Kiribati. UNESCO IHP-V, Technical
Cousteau Resort, Savu Savu, Fiji. Specialist in coral reef biology.
Documents in Hydrology. 26. UNESCO, Paris.
Seniloli, Ms Kesaia. Lecturer, The University of the South Pacifi c, Suva,
White, I., Overmars, M. and Thulstrup, H. (2000). Priority Issues in Water
Fiji. Socio-economist; population specialist.
Resources, Pacifi c Focal Group for Water Resources Meeting
Sykes, Ms Helen. Consultant, Suva, Fiji. Expert on coral reefs and coral
Canterbury University, New Zealand. Draft report, International
reef monitoring.
Hydrological Programme, Water Resource Foundation of Australia,
Temakei, Mr Tebano, Marine Studies Programme, University of South
ANU, Canberra.
Pacifi c, Kiribati.
WHO/UNICEF (2000). Global Water Supply and Sanitation Assessment
2000 Report. World Health Organization, Geneva, Switzerland.
Wilkinson, C.R. (1998). Status of coral reefs of the world: 1998. Global
Coral Reef Monitoring Network and Australian Institute of Marine
Science, Townsville, Australia.
Wilkinson, C.R. (2000). Status of coral reefs of the world: 2000. Global
Coral Reef Monitoring Network and Australian Institute of Marine
Science, Townsville, Australia.
Wilkinson, C.R. (2002). Status of coral reefs of the world: 2002. Global
Coral Reef Monitoring Network and Australian Institute of Marine
Science, Townsville, Australia.
74
GIWA REGIONAL ASSESSMENT 62 PACIFIC ISLANDS
Annexes
Annex I
List of contributing authors and organisations
Name
Institutional affiliation
Country
Field of work
Mr. Alan Resture
Lecturer in Marine Affairs, University of South Pacific
Fiji
Fisheries, Socio-economics
Ms. Alena Lawedrau
South Pacific Applied Geoscience Commission (SOPAC)
Fiji
Marine science
Dr. Clive Carpenter
South Pacific Applied Geoscience Commission (SOPAC)
UK/Fiji
Geology, Hydrology
Dr. Joeli Veitayaki
Marine Affairs & IOI-Pacific Islands, University of South Pacific
Fiji
Fisheries biology, Socio-economics
Dr. Kesaia Seniloli
School of Social and Economic Development (SSED)
Fiji
Socio-economics; population
Dr. Peter Heathcote
Regional Maritime Programme, Secretariat for the Pacific Community (SPC)
Fiji/Canada
Maritime law; Ports and shipping
Dr. Susanne Pohler
Earth Science Lecturer, Marine Studies Programme (MSP), University of South Pacific
Fiji
Marine geology
Dr. Than Aung
Physics Department, The School of Pure and Applied Sciences (SPAS), University of South Pacific
Fiji
Physical oceanography
Mr. Iliapi Tuwai
International Marinelife Alliance; University of the South Pacific, Suva.
Fiji
Fisheries biology
Mr. Isoa Korovulavula
Institute of Applied Science, University of South Pacific
Fiji
Environmental biology
Mr. Aaron Jenkins
Wetlands International/PNG
Fiji
Wetlands specialist
Mr. Aisake Batibasaga
Fisheries Division, Fiji
Fiji
Fisheries biology
Mr. Craig Pratt
Vulnerability Impact Officer, South Pacific Applied Geoscience Commission (SOPAC)
Fiji
Earth sciences
Mr. Filimone Mate
Fisheries Division
Fiji
Fisheries
Mr. Francis Areki
WWF-Fiji
Fiji
Environmental studies
Mr. Ganeshan Rao
Coordinator, Pacific Islands Marine Resources Information System (PIMRIS), University of South Pacific
Fiji
Information systems
Mr. Johnson Seeto
Marine Studies Programme, University of South Pacific, Suva
Fiji
Marine biology
Mr. Manasa Sovaki
Director, Department of Environment, Government of Fiji
Fiji
Fisheries, Environmental biology
Systematics, Curator of the South Pacific Regional
Mr. Marika Tuiwawa
Curator, South Pacific Regional Herbarium, University of South Pacific, Suva
Fiji
Herbarium
Mr. Posa Skelton
Marine Studies Programme, University of South Pacific
Samoa
Fisheries biology; Systematics of tropical marine algae
Mr. Reuben Sulu
Institute of Marine Resources, University of South Pacific
Solomon Islands
Fisheries biology; Seaweed aquaculture
Mr. Samasoni Sauni
Marine Studies Programme, University of South Pacific; SPC, Noumea, New Caledonia
Tuvalu
Fisheries biology
Mr. Satya Nandlal
Fisheries Division; SPC, Noumea, New Caledonia
Fiji
Aquaculture
Mr. Seremaia Tuqiri
Marine Affairs Programme (MSP), University of South Pacific; WWF Pacific, Suva
Fiji
Marine policy
Mr. Temakei Tebano
Marine Studies Programme, University of South Pacific
Kiribati
Fisheries biologist
Mr. Tevita Vuibau
Lands and Mineral Resources Department, Government of Fiji, Suva
Fiji
Earth sciences
Ms. Aliti Susau
WWF-Fiji, Suva
Fiji
Environment
Ms. Batiri Thaman
Institute of Applied Science, University of South Pacific, Suva
Fiji
Environmental science
Ms. Jese Verebalavu
Marine Affairs Programme, University of South Pacific, Suva
Fiji
Socio-economics; Ecotourism
Ms. Leigh-Anne
Pacific Centre for Environmental and Sustainable Development, University of South Pacific, Suva
Fiji
Marine affairs
Ms. Tracy Berno
Tourism Studies Programme, School of Social and Economic Development (SSED), University of South Pacific, Suva Fiji
Tourism
Mr. Owen White
South Pacific Applied Geoscience Commission (SOPAC), Suva
Fiji
Earth sciences
Prof. Bill Aalbersberg
Institute of Applied Science, University of South Pacific
Fiji
Marine chemistry; Marine conservation
Prof. Randolph Thaman
Geography Department, University of South Pacific, Suva
Fiji
Geography; Biogeography
Coordinator, Marine Studies Programme & Director, IOI-Pacific Islands; Director, IOI (Australia), Townsville, Qld,
Fiji/Australia/
Ocean policy; Systematics and ecology of benthic
Prof. Robin South
Australia
Canada
marine algae
ANNEXES
75
Annex II
Detailed scoring tables
I: Freshwater shortage
II: Pollution
Weight
Weight
Environmental
Environmental
Environmental issues
Score
Weight %
averaged
Environmental issues
Score
Weight %
averaged
concern
concern
score
score
1. Modification of stream flow
1
30
Freshwater shortage
1.7
4. Microbiological
2
10
Pollution
2.2
2. Pollution of existing supplies
2
30
5. Eutrophication
1
5
3. Changes in the water table
2
40
6. Chemical
2
20
7. Suspended solids
2
10
Criteria for Economic impacts
Raw score
Score
Weight %
8. Solid wastes
3
20
Size of economic or public sectors
Very small
Very large
2
40
9. Thermal
1
5
affected
0 1 2 3
Degree of impact (cost, output changes
Minimum
Severe
2
30
etc.)
0 1 2 3
10. Radionuclide
3
20
Occasion/Short
Continuous
Frequency/Duration
2
30
0 1 2 3
11. Spills
1
10
Weight average score for Economic impacts
2.0
Criteria for Health impacts
Raw score
Score
Weight %
Criteria for Economic impacts
Raw score
Score
Weight %
Very small
Very large
Number of people affected
2
30
Size of economic or public sectors
Very small
Very large
0 1 2 3
1
40
affected
0 1 2 3
Minimum
Severe
Degree of severity
2
30
Degree of impact (cost, output changes
Minimum
Severe
0 1 2 3
1
30
etc.)
0 1 2 3
Occasion/Short
Continuous
Frequency/Duration
2
40
Occasion/Short
Continuous
0 1 2 3
Frequency/Duration
1
30
0 1 2 3
Weight average score for Health impacts
2.0
Weight average score for Economic impacts
1.0
Criteria for Other social and
Raw score
Score
Weight %
community impacts
Criteria for Health impacts
Raw score
Score
Weight %
Number and/or size of community
Very small
Very large
1
30
Very small
Very large
affected
0 1 2 3
Number of people affected
2
30
0 1 2 3
Minimum
Severe
Degree of severity
1
30
Minimum
Severe
0 1 2 3
Degree of severity
2
40
0 1 2 3
Occasion/Short
Continuous
Frequency/Duration
1
40
Occasion/Short
Continuous
0 1 2 3
Frequency/Duration
2
30
0 1 2 3
Weight average score for Other social and community impacts
1.0
Weight average score for Health impacts
2.0
Criteria for Other social and
Raw score
Score
Weight %
community impacts
Number and/or size of community
Very small
Very large
1
30
affected
0 1 2 3
Minimum
Severe
Degree of severity
1
30
0 1 2 3
Occasion/Short
Continuous
Frequency/Duration
1
40
0 1 2 3
Weight average score for Other social and community impacts
1.0
76
GIWA REGIONAL ASSESSMENT 62 PACIFIC ISLANDS
III: Habitat and community modification
IV: Unsustainable exploitation of fish and other
living resources
Weight
Weight
Environmental
Environmental
Environmental issues
Score
Weight %
averaged
Environmental issues
Score
Weight %
averaged
concern
concern
score
score
Habitat and community
Unsustainable
12. Loss of ecosystems
2
50
2.5
14. Overexploitation
3
20
2.3
modification
exploitation of fish
13.Modification of ecosystems or
15. Excessive by-catch and
3
20
ecotones, including community
discards
3
50
structure and/or species
composition
16. Destructive fishing practices
2
20
17. Decreased viability of stock
1.5
20
through pollution and disease
Criteria for Economic impacts
Raw score
Score
Weight %
18. Impact on biological and
2
20
genetic diversity
Size of economic or public sectors
Very small
Very large
2
30
affected
0 1 2 3
Degree of impact (cost, output changes
Minimum
Severe
2
40
etc.)
0 1 2 3
Criteria for Economic impacts
Raw score
Score
Weight %
Occasion/Short
Continuous
Frequency/Duration
2
30
0 1 2 3
Size of economic or public sectors
Very small
Very large
2
30
affected
0 1 2 3
Weight average score for Economic impacts
2.0
Degree of impact (cost, output changes
Minimum
Severe
2
40
etc.)
0 1 2 3
Criteria for Health impacts
Raw score
Score
Weight %
Occasion/Short
Continuous
Frequency/Duration
2
30
0 1 2 3
Very small
Very large
Number of people affected
2
30
Weight average score for Economic impacts
2.0
0 1 2 3
Minimum
Severe
Degree of severity
2
40
0 1 2 3
Criteria for Health impacts
Raw score
Score
Weight %
Occasion/Short
Continuous
Frequency/Duration
2
30
0 1 2 3
Very small
Very large
Number of people affected
2
40
0 1 2 3
Weight average score for Health impacts
2.0
Minimum
Severe
Degree of severity
2
30
0 1 2 3
Criteria for Other social and
Raw score
Score
Weight %
Occasion/Short
Continuous
community impacts
Frequency/Duration
2
30
0 1 2 3
Number and/or size of community
Very small
Very large
2
30
Weight average score for Health impacts
2.0
affected
0 1 2 3
Minimum
Severe
Degree of severity
2
30
Criteria for Other social and
0 1 2 3
Raw score
Score
Weight %
community impacts
Occasion/Short
Continuous
Frequency/Duration
2
40
0 1 2 3
Number and/or size of community
Very small
Very large
2
30
affected
0 1 2 3
Weight average score for Other social and community impacts
2.0
Minimum
Severe
Degree of severity
2
30
0 1 2 3
Occasion/Short
Continuous
Frequency/Duration
2
40
0 1 2 3
Weight average score for Other social and community impacts
2.0
ANNEXES
77
V: Global change
Weight
Environmental
Environmental issues
Score
Weight %
averaged
concern
score
19. Changes in the hydrological
2
10
Global change
2.6
cycle
20. Sea level change
3
40
21. Increased UV-B radiation as a
1.5
10
result of ozone depletion
22. Changes in ocean CO 2
1.5
10
source/sink function
23. Increase in sea surface
3
30
temperature
Criteria for Economic impacts
Raw score
Score
Weight %
Size of economic or public sectors
Very small
Very large
3
30
affected
0 1 2 3
Degree of impact (cost, output changes
Minimum
Severe
3
30
etc.)
0 1 2 3
Occasion/Short
Continuous
Frequency/Duration
3
40
0 1 2 3
Weight average score for Economic impacts
3.0
Criteria for Health impacts
Raw score
Score
Weight %
Very small
Very large
Number of people affected
2
30
0 1 2 3
Minimum
Severe
Degree of severity
2
40
0 1 2 3
Occasion/Short
Continuous
Frequency/Duration
2
30
0 1 2 3
Weight average score for Health impacts
2.0
Criteria for Other social and
Raw score
Score
Weight %
community impacts
Number and/or size of community
Very small
Very large
2
30
affected
0 1 2 3
Minimum
Severe
Degree of severity
2
40
0 1 2 3
Occasion/Short
Continuous
Frequency/Duration
2
30
0 1 2 3
Weight average score for Other social and community impacts
2.0
Comparative environmental and socio-economic impacts of each GIWA concern
Types of impacts
Environmental score
Economic score
Human health score
Social and community score
Concern
Overall score
Priority
Present (a)
Future (b)
Present (c)
Future (d)
Present (e)
Future (f)
Present (g)
Future (h)
Freshwater shortage
1.7
2.0
2.0
2.0
2.0
2.0
1.0
1.0
1.7
5
Pollution
2.2
2.0
1.0
2.0
2.0
2.0
1.0
1.0
1.7
4
Habitat and community
2.5
3.0
1.0
2.0
2.0
2.0
2.0
1.0
1.9
3
modification
Unsustainable exploitation of fish
2.3
3.0
2.0
2.0
2.0
2.0
2.0
2.0
2.2
2
and other living resources
Global change
2.7
3.0
3.0
3.0
2.0
3.0
2.0
3.0
2.7
1
78
GIWA REGIONAL ASSESSMENT 62 PACIFIC ISLANDS
Annex III
14 participating States, will be responsible for the implementation of
the demonstration projects.
List of important water-related
programmes and assessments
For more information contact SPREP.
in the region
Small Island Water Information Network
The Small Island Water Information Network (SIWIN) aims to improve
The Strategic Action Programme (SAP) for the
the quality of life and costs of water projects through an eff ective
International Waters of the Pacific Small Island
collaboration aiming to provide an up-to-date and timely information
Developing States
on the water sector for isolated small island states. This is a cooperative
The 5-year programme, which commenced in July 2000, is implemented
network of institutions and individuals that provide and exchange
by the United Nations Development Programme (UNDP), and executed
water related information relevant to small islands all over the world.
by the South Pacifi c Regional Environment Programme (SPREP).
The initiative was initiated by the Commonwealth Science Council,
the British Geological Survey and the UK Department for International
The Global Environment Facility (GEF) has agreed to provide up to
Development.
12 million USD to support the programme. In addition, SPREP, together
with other partner agencies, the Secretariat for the Pacifi c Community
This network serves water professionals, institutions and the populations
(SPC) and the Forum Fisheries Agency (FFA), will contribute an
of small islands. Sources of information generally range from published
additional 8 million USD.
or unpublished reports, textbooks, manuals, journals, case histories and
accumulated experience. Due to the isolation of professionals and civil
Fourteen small island developing States are participating in the SAP.
societies in Small Island Developing States (SIDS), SIWIN endeavours
They are: Cook Islands, Federated States of Micronesia, Fiji, Kiribati,
to provide as much detail as possible. SIWIN is a physical (institutions,
Marshall Islands, Nauru, Niue, Palau, Papua New Guinea, Samoa,
professionals and society) and an electronic (website, e-mail) form of
Solomon Islands, Tonga, Tuvalu and Vanuatu.
linking people and institutions across the globe.
The oceanic component of the SAP, executed by SPC and FFA, will support
For more information on this programme in the Pacifi c region contact:
the work of participating countries in developing management and
SOPAC Secretariat
conservation arrangements for their oceanic fi sheries resources. It will be
Private Mail Bag, GPO
used to build the capacity of Pacifi c Island States to responsibly manage
Suva, Fiji Islands
their tuna resources for sustainable economic benefi t and to assist Island
Tel: +679 338 1377, Fax: +679 337 0040
States fully participate in a new tuna management organisation that is
director@sopac.org
currently being established for the western central Pacifi c region. The
ocean fi sheries management component will target the western central
SOPAC/EDF Island Systems Management
Pacifi c ecosystem whose boundaries correspond almost precisely with
The goal of the Project is to address vulnerability reduction in the Pacifi c
the commercial tuna fi shery operating in that area.
ACP States through the development of an integrated planning and
management system, Island Systems Management initially focusing on
The integrated coastal watershed component of the SAP will focus
eight Pacifi c States: Fiji, Kiribati, Papua New Guinea, Samoa, Solomon
actions on freshwater supplies, including groundwater, marine
Islands, Tonga, Tuvalu and Vanuatu. The objective is to strengthen
protected areas, sustainable coastal fi sheries, integrated coastal
integrated development in Pacifi c ACP States by concentrating on
management planning, including tourism development and activities
three key focal areas in the island system: hazard mitigation and
to promote waste reduction in local communities. Activities will
risk assessment; aggregates for construction; and water resources
concentrate on implementing 14 demonstration projects that
supply and sanitation. The project will address problems such as:
demonstrate best practices and provide lessons for community-
unavailability of accurate and timely data; weak human resource base;
based management of threatened habitats and promote options
limited resources (money and infrastructure); and lack of appropriate
for the sustainable use of natural resources. The Project Coordination
management plans, policies and regulatory frameworks to deal with
Unit based at SPREP, in collaboration with the governments of the
these three focal areas.
ANNEXES
79
For more information on this programme in the Pacifi c region contact:
institutions. The multiple uses of the Ocean require collaboration and
SOPAC Secretariat
partnerships between the users. Integration of traditional knowledge
Private Mail Bag, GPO
with contemporary scientifi c information is critical if the decision-
Suva, Fiji Islands
makers of the region are to have a better understanding of ocean
Tel: +679 338 1377, Fax: +679 337 0040
processes and ecosystems. This critical knowledge is "dependent on
director@sopac.org
access to science and technology, to enable research, exploration and
development of both living and non-living marine resources, and of
Pacific Regional Ocean Policy
long-term monitoring and observation".
The goal of the policy is to "ensure the future sustainable use of our
Ocean and its resources by Pacifi c Islands communities and external
To provide eff ective solutions, Pacifi c Island countries need to
partners". The goal emphasises the wise use of the Ocean and its
understand the threat of pollution from all sources and the best ways
resources. At present and in the future, the most pressing threat to
of addressing them. With increased human activities, pollution is likely
Pacifi c Island countries will be from outsiders who ship oil and nuclear
to worsen. This poses threats to the long-term health of coastal systems
materials or fi sh in the Pacifi c Ocean. In addition, as marine resources
and ecological processes, public health and the social and commercial
in many parts of the world are fully utilised or are no longer available,
use of Ocean resources.
Pacifi c Islanders and their partners will need to formulate eff ective
policy and strategies for ensuring the future sustainability of their own
Principle 2 ş Sustainably developing and managing the use of
resources.1
Ocean resources
Pacifi c Island communities are heavily reliant on their marine resources
The guiding principles to the policy refl ect the most important features
and the services that the Ocean provides. The resources include the
of the Ocean and its use. These principles are purposely kept at a high
extractive uses of living and non-living resources as well as the non-
level with general and encompassing statements that highlight the
extractive uses such as transport and communication, waste disposal,
importance of the Ocean to Pacifi c Islanders and emphasise why it
recreation, cultural activities and life support systems. Research and
must be properly managed. It was determined early in the policy
modern technology are expected to create new opportunities for
development process to elevate the Policy in this way to maximise the
developing Ocean resources and managing the impacts of natural and
likelihood of reaching concurrence on its content. Moreover, there is
human activities in the Ocean. The future of Pacifi c Island communities
now a period of refl ection for the countries and people to consider the
is dependent on how the people maintain the health of the Ocean.
types of actions that can be pursued to deliver on the Policy's vision.
It is therefore imperative that principles such as the precautionary
These general statements therefore serve as the basis for all types of
approach, integrated development and adaptive management are
activities that are undertaken in the Ocean, coasts and islands in the
articulated and implemented to ensure the sustainable use of the
future.
Ocean and its resources.
Principle 1- Improving our understanding of the Ocean
Pacifi c Island countries are responsible for the sustainable management
Understanding the Ocean is a huge call for humanity let alone the
of the world's largest tuna resources. These resources now supply an
developing Pacifi c Island countries. However, Pacifi c Islanders need
estimated one-third of all landed tuna, 40-60% of total supply to tuna
knowledge of the Ocean, how it functions and how its is aff ected by
canneries, and 30% of tuna to the valuable Japanese sashimi market.2.
the changes caused by human activities. This knowledge will provide
Yet Pacifi c Islands countries are receiving less than 10% of the value of
the basis for planning "sustainable uses of the Ocean and its resources,
the tuna that is fi shed from their waters. In addition, Ocean resources
for the amelioration of pollution and harmful practices and for the
management is based on to the maximum sustainable yield, which
prediction of weather, climate and ocean variability".
risks overexploitation if harvests are beyond this level (either due to
poor enforcement of regulations or a lack of information on what the
Eff ective resource management principles should be applied at
maximum sustainable yield is). Pacifi c Island countries need to explore
all levels using all available methods. While the local communities
new and suitable ways of getting a better return from the use of their
should be involved in these management exercises, there also are
tuna fi sheries. For instance, it has been argued that the maximum
specifi c roles for the district, national and regional stakeholders and
economic yield (the harvest rate that maximises economic returns
1T he experience of another developing part of the world (the Caribbean) and its quest for sustainable oceans use is described in Miller, M. (2000)."Third world states and fluid sovereignty: development
options and the politics of sustainable ocean management" Ocean and Coastal Management 42, 235-253.
2 Gillet, R. M.McCoy, L.Rodwell and J.Tamate (2001). Tuna: A key economic resource in the Pacific, Asian Development Bank, Manila.
80
GIWA REGIONAL ASSESSMENT 62 PACIFIC ISLANDS
from the fi shery) is almost always less than the maximum sustainable
Principle 5 ş Creating partnerships and promoting cooperation
yield (the most that can be harvested without reducing long-term stock
Pacifi c Island countries have demonstrated eff ective partnerships and
size) and therefore should used in the management of the region's
cooperation in the sustainable management of the Ocean. This should
fi sheries.3 According to these experts, economic returns to the countries
be strengthened and extended to include new and emerging partners
will increase and its sustainability better protected if the resources are
from outside the region. Partnership and cooperation are emphasised
managed according to their maximum economic yield.
in UNCLOS and Agenda 21 but need to be specifi cally articulated in
the Policies, Strategies and Action Plans of Pacifi c Island countries.
Principle 3 - maintaining the health of the Ocean
Joint development and joint ventures are examples of partnerships
The health and productivity of the Ocean is dependent upon the
that have been attempted in the past and can be the basis for future
preservation of its ecosystem and the minimisation of the impact of
collaboration.
human activities. The health and integrity of the marine ecosystem
should be maintained so that it continues to provide the life support
Pacifi c Island countries need to "maintain sovereign rights and
services it performs. In addition, the Ocean is the fi nal repository of all
responsibilities in managing, protecting and developing the Ocean".
the substances that enter the environment. In trying to maintain the
This is complex and requires innovative and creative ideas that should
health of the Ocean, Pacifi c Island countries need to have policies and
be transformed into policies and strategies. The countries must work
strategies that address the threats from all their activities whether these
with reputable international organisations to assist in capacity building
are land-based, air-borne or in the high seas.
and creating fundamental databases.
Ocean and coastal systems must be protected from degraded water
Strategic Actions
quality caused by "accidental and deliberate dumping of fuels,
The policy lists the strategic actions that Pacifi c Island countries can
chemicals and ballast water from ships, aircraft and satellite launches,
undertake under each of the guiding principles. There is no sequence
and non sustainable resource use". Pacifi c Island countries must also
or order but the Strategic Actions present some of the activities that
guard against resource depletion that threatens the natural state of
can be undertaken to achieve the policy's vision.
equilibrium in the world's Ocean.
The strategic actions are directly related to the guiding principles and
Pacifi c Island countries must eff ectively control outsiders' activities in the
should provide guidelines for regional and national activities. Pacifi c
region. This may require innovative policies and strategies that pass more
Island countries can identify and prioritise their needs and then identify
responsibility for surveillance and control to their external partners.
their appropriate action plans.
Principle 4 ş Promoting the peaceful use of the Ocean
For more information contact
Peaceful uses of the Ocean "means discouraging unacceptable,
Mr John Low
illicit or criminal activities' that contradict regional and international
(Natural Resources Advisor) of the Pacifi c Islands Forum Secretariat,
agreements". Pacifi c Island countries have to exercise control and
Private Bag, Suva, Fiji
enforcement over their maritime zones. They must also seek the
JohnL@forumsec.org.fj
support of other users such as the shipping nations, distant water
fi shing nations and naval powers. Again, it will not be possible to do
this alone. International collaboration and partnership will be required.
The uses of technology such as satellite monitoring system that is now
used by the FFA will provide more eff ective options.
Educating the people to support the policies and strategies can be a
useful tool. People will act properly if they know what is occurring and
understand what they need to do. The peaceful use of the Ocean can
be a polemic debate to settle but the strategies should spell out the
appropriate course of action in a given situation.
3 Petersen, E. (2002). Economic policy, institutions and fisheries development in the Pacific. Resource Management in Asia-Pacific Working Papers No.31:33.
ANNEXES
81
The Global International
Waters Assessment
This report presents the results of the Global International Waters
Adequately managing the world's aquatic resources for the benefi t of
Assessment (GIWA) of the transboundary waters of the Pacifi c
all is, for a variety of reasons, a very complex task. The liquid state of
Islands region. This and the subsequent chapter off er a background
the most of the world's water means that, without the construction
that describes the impetus behind the establishment of GIWA, its
of reservoirs, dams and canals it is free to fl ow wherever the laws of
objectives and how the GIWA was implemented.
nature dictate. Water is, therefore, a vector transporting not only a
wide variety of valuable resources but also problems from one area
to another. The effl
uents emanating from environmentally destructive
activities in upstream drainage areas are propagated downstream
The need for a global
and can aff ect other areas considerable distances away. In the case of
international waters
transboundary river basins, such as the Nile, Amazon and Niger, the
assessment
impacts are transported across national borders and can be observed
in the numerous countries situated within their catchments. In the case
of large oceanic currents, the impacts can even be propagated between
Globally, people are becoming increasingly aware of the degradation of
continents (AMAP 1998). Therefore, the inextricable linkages within
the world's water bodies. Disasters from fl oods and droughts, frequently
and between both freshwater and marine environments dictates that
reported in the media, are considered to be linked with ongoing global
management of aquatic resources ought to be implemented through
climate change (IPCC 2001), accidents involving large ships pollute public
a drainage basin approach.
beaches and threaten marine life and almost every commercial fi sh stock
is exploited beyond sustainable limits - it is estimated that the global
In addition, there is growing appreciation of the incongruence
stocks of large predatory fi sh have declined to less that 10% of pre-
between the transboundary nature of many aquatic resources and the
industrial fi shing levels (Myers & Worm 2003). Further, more than 1 billion
traditional introspective nationally focused approaches to managing
people worldwide lack access to safe drinking water and 2 billion people
those resources. Water, unlike laws and management plans, does not
lack proper sanitation which causes approximately 4 billion cases of
respect national borders and, as a consequence, if future management
diarrhoea each year and results in the death of 2.2 million people, mostly
of water and aquatic resources is to be successful, then a shift in focus
children younger than fi ve (WHO-UNICEF 2002). Moreover, freshwater
towards international cooperation and intergovernmental agreements
and marine habitats are destroyed by infrastructure developments,
is required (UN 1972). Furthermore, the complexity of managing the
dams, roads, ports and human settlements (Brinson & Malvßrez 2002,
world's water resources is exacerbated by the dependence of a great
Kennish 2002). As a consequence, there is growing public concern
variety of domestic and industrial activities on those resources. As a
regarding the declining quality and quantity of the world's aquatic
consequence, cross-sectoral multidisciplinary approaches that integrate
resources because of human activities, which has resulted in mounting
environmental, socio-economic and development aspects into
pressure on governments and decision makers to institute new and
management must be adopted. Unfortunately however, the scientifi c
innovative policies to manage those resources in a sustainable way
information or capacity within each discipline is often not available or
ensuring their availability for future generations.
is inadequately translated for use by managers, decision makers and
GLOBAL INTERNATIONAL WATERS ASSESSMENT
i
policy developers. These inadequacies constitute a serious impediment
The Global Environment Facility (GEF)
to the implementation of urgently needed innovative policies.
The Global Environment Facility forges international co-operation and fi nances actions to address
six critical threats to the global environment: biodiversity loss, climate change, degradation of
international waters, ozone depletion, land degradation, and persistent organic pollutants (POPs).
Continual assessment of the prevailing and future threats to aquatic
The overall strategic thrust of GEF-funded international waters activities is to meet the incremental
ecosystems and their implications for human populations is essential if
costs of: (a) assisting groups of countries to better understand the environmental concerns of
their international waters and work collaboratively to address them; (b) building the capacity
governments and decision makers are going to be able to make strategic
of existing institutions to utilise a more comprehensive approach for addressing transboundary
policy and management decisions that promote the sustainable use of
water-related environmental concerns; and (c) implementing measures that address the priority
transboundary environmental concerns. The goal is to assist countries to utilise the full range of
those resources and respond to the growing concerns of the general
technical, economic, fi nancial, regulatory, and institutional measures needed to operationalise
public. Although many assessments of aquatic resources are being
sustainable development strategies for international waters.
conducted by local, national, regional and international bodies, past
United Nations Environment Programme (UNEP)
assessments have often concentrated on specifi c themes, such as
United Nations Environment Programme, established in 1972, is the voice for the environment
biodiversity or persistent toxic substances, or have focused only on
within the United Nations system. The mission of UNEP is to provide leadership and encourage
partnership in caring for the environment by inspiring, informing, and enabling nations and
marine or freshwaters. A globally coherent, drainage basin based
peoples to improve their quality of life without compromising that of future generations.
assessment that embraces the inextricable links between transboundary
UNEP work encompasses:
freshwater and marine systems, and between environmental and
Assessing global, regional and national environmental conditions and trends;
Developing international and national environmental instruments;
societal issues, has never been conducted previously.
Strengthening institutions for the wise management of the environment;
Facilitating the transfer of knowledge and technology for sustainable development;
Encouraging new partnerships and mind-sets within civil society and the private sector.
International call for action
University of Kalmar
University of Kalmar hosts the GIWA Co-ordination Offi ce and provides scientifi c advice and
administrative and technical assistance to GIWA. University of Kalmar is situated on the coast of
The need for a holistic assessment of transboundary waters in order to
the Baltic Sea. The city has a long tradition of higher education; teachers and marine offi cers have
been educated in Kalmar since the middle of the 19th century. Today, natural science is a priority
respond to growing public concerns and provide advice to governments
area which gives Kalmar a unique educational and research profi le compared with other smaller
universities in Sweden. Of particular relevance for GIWA is the established research in aquatic and
and decision makers regarding the management of aquatic resources
environmental science. Issues linked to the concept of sustainable development are implemented
was recognised by several international bodies focusing on the global
by the research programme Natural Resources Management and Agenda 21 Research School.
environment. In particular, the Global Environment Facility (GEF)
Since its establishment GIWA has grown to become an integral part of University activities.
The GIWA Co-ordination offi ce and GIWA Core team are located at the Kalmarsund Laboratory, the
observed that the International Waters (IW) component of the GEF
university centre for water-related research. Senior scientists appointed by the University are actively
suff ered from the lack of a global assessment which made it diffi
cult
involved in the GIWA peer-review and steering groups. As a result of the cooperation the University
can offer courses and seminars related to GIWA objectives and international water issues.
to prioritise international water projects, particularly considering
the inadequate understanding of the nature and root causes of
environmental problems. In 1996, at its fourth meeting in Nairobi, the
causes of degradation of the transboundary aquatic environment and
GEF Scientifi c and Technical Advisory Panel (STAP), noted that: "Lack of
options for addressing them. These pro cesses led to the development
an International Waters Assessment comparable with that of the IPCC, the
of the Global International Waters Assessment (GIWA) that would be
Global Biodiversity Assessment, and the Stratospheric Ozone Assessment,
implemented by the United Nations Environment Programme (UNEP) in
was a unique and serious impediment to the implementation of the
conjunction with the University of Kalmar, Sweden, on behalf of the GEF.
International Waters Component of the GEF".
The GIWA was inaugurated in Kalmar in October 1999 by the Executive
Director of UNEP, Dr. Klaus T÷pfer, and the late Swedish Minister of the
The urgent need for an assessment of the causes of environmental
Environment, Kjell Larsson. On this occasion Dr. T÷pfer stated: "GIWA
degradation was also highlighted at the UN Special Session on
is the framework of UNEP┤s global water assessment strategy and will
the Environment (UNGASS) in 1997, where commitments were
enable us to record and report on critical water resources for the planet for
made regarding the work of the UN Commission on Sustainable
consideration of sustainable development management practices as part of
Development (UNCSD) on freshwater in 1998 and seas in 1999. Also in
our responsibilities under Agenda 21 agreements of the Rio conference".
1997, two international Declarations, the Potomac Declaration: Towards
enhanced ocean security into the third millennium, and the Stockholm
The importance of the GIWA has been further underpinned by the UN
Statement on inter action of land activities, freshwater and enclosed
Millennium Development Goals adopted by the UN General Assembly
seas, specifi cally emphasised the need for an investigation of the root
in 2000 and the Declaration from the World Summit on Sustainable
ii
REGIONAL ASSESSMENTS
Development in 2002. The development goals aimed to halve the
International waters and transboundary issues
proportion of people without access to safe drinking water and basic
The term "international waters", as used for the purposes of the GEF Operational Strategy,
sanitation by the year 2015 (United Nations Millennium Declaration
includes the oceans, large marine ecosystems, enclosed or semi-enclosed seas and estuaries, as
well as rivers, lakes, groundwater systems, and wetlands with transboundary drainage basins
2000). The WSSD also calls for integrated management of land, water and
or common borders. The water-related ecosystems associated with these waters are considered
living resources (WSSD 2002) and, by 2010, the Reykjavik Declaration on
integral parts of the systems.
The term "transboundary issues" is used to describe the threats to the aquatic environment
Responsible Fisheries in the Marine Ecosystem should be implemented
linked to globalisation, international trade, demographic changes and technological advancement,
by all countries that are party to the declaration (FAO 2001).
threats that are additional to those created through transboundary movement of water. Single
country policies and actions are inadequate in order to cope with these challenges and this makes
them transboundary in nature.
The international waters area includes numerous international conventions, treaties, and
agreements. The architecture of marine agreements is especially complex, and a large number
The conceptual framework
of bilateral and multilateral agreements exist for transboundary freshwater basins. Related
conventions and agreements in other areas increase the complexity. These initiatives provide
and objectives
a new opportunity for cooperating nations to link many different programmes and instruments
into regional comprehensive approaches to address international waters.
Considering the general decline in the condition of the world's aquatic
the large-scale deforestation of mangroves for ponds (Primavera 1997).
resources and the internationally recognised need for a globally
Within the GIWA, these "non-hydrological" factors constitute as large
coherent assessment of transboundary waters, the primary objectives
a transboundary infl uence as more traditionally recognised problems,
of the GIWA are:
such as the construction of dams that regulate the fl ow of water into
To provide a prioritising mechanism that allows the GEF to focus
a neighbouring country, and are considered equally important. In
their resources so that they are used in the most cost eff ective
addition, the GIWA recognises the importance of hydrological units that
manner to achieve signifi cant environmental benefi ts, at national,
would not normally be considered transboundary but exert a signifi cant
regional and global levels; and
infl uence on transboundary waters, such as the Yangtze River in China
To highlight areas in which governments can develop and
which discharges into the East China Sea (Daoji & Daler 2004) and the
implement strategic policies to reduce environmental degradation
Volga River in Russia which is largely responsible for the condition of
and improve the management of aquatic resources.
the Caspian Sea (Barannik et al. 2004). Furthermore, the GIWA is a truly
regional assessment that has incorporated data from a wide range of
In order to meet these objectives and address some of the current
sources and included expert knowledge and information from a wide
inadequacies in international aquatic resources management, the GIWA
range of sectors and from each country in the region. Therefore, the
has incorporated four essential elements into its design:
transboundary concept adopted by the GIWA extends to include
A broad transboundary approach that generates a truly regional
impacts caused by globalisation, international trade, demographic
perspective through the incorporation of expertise and existing
changes and technological advances and recognises the need for
information from all nations in the region and the assessment of
international cooperation to address them.
all factors that infl uence the aquatic resources of the region;
A drainage basin approach integrating freshwater and marine
systems;
A multidisciplinary approach integrating environmental and socio-
The organisational structure and
economic information and expertise; and
implementation of the GIWA
A coherent assessment that enables global comparison of the
results.
The scale of the assessment
Initially, the scope of the GIWA was confi ned to transboundary waters
The GIWA builds on previous assessments implemented within the GEF
in areas that included countries eligible to receive funds from the GEF.
International Waters portfolio but has developed and adopted a broader
However, it was recognised that a truly global perspective would only
defi nition of transboundary waters to include factors that infl uence the
be achieved if industrialised, GEF-ineligible regions of the world were
quality and quantity of global aquatic resources. For example, due to
also assessed. Financial resources to assess the GEF-eligible countries
globalisation and international trade, the market for penaeid shrimps
were obtained primarily from the GEF (68%), the Swedish International
has widened and the prices soared. This, in turn, has encouraged
Development Cooperation Agency (Sida) (18%), and the Finnish
entrepreneurs in South East Asia to expand aquaculture resulting in
Department for International Development Cooperation (FINNIDA)
GLOBAL INTERNATIONAL WATERS ASSESSMENT
iii
1
15
11
16
14
12
28
10
13
17
25
29
9
18
30
19
23
22
8
7
31
6
20
24
26
35
33
2
34
27
5
21
50
32
51
36
37
41
52
4
49
53
43
65
55
48
54
3
42
56
46
62
47
40b
40a
57
62
45b
39
59
45a
58
60
64
44
61
38
63
66
1 Arctic
12 Norwegian
Sea
(LME)
24 Aral
Sea
36
East-China Sea (LME)
46
Somali Coastal Current (LME)
58
North Australian Shelf (LME)
2 Gulf
of
Mexico
(LME)
13 Faroe
plateau
25
Gulf of Alaska (LME)
37 Hawaiian
Archipelago
(LME)
47
East African Rift Valley Lakes
59 Coral
Sea
Basin
3
Caribbean Sea (LME)
14 Iceland
Shelf
(LME)
26 California
Current
(LME)
38 Patagonian
Shelf
(LME)
48 Gulf
of
Aden
60 Great
Barrier
Reef
(LME)
4 Caribbean
Islands
15
East Greenland Shelf (LME)
27 Gulf
of
California
(LME)
39
Brazil Current (LME)
49 Red
Sea
(LME)
61 Great
Australian
Bight
5
Southeast Shelf (LME)
16
West Greenland Shelf (LME)
28 East
Bering
Sea
(LME)
40a Brazilian Northeast (LME)
50 The
Gulf
62
Small Island States
6
Northeast Shelf (LME)
17 Baltic
Sea
(LME)
29 West
Bering
Sea
(LME)
40b Amazon
51 Jordan
63 Tasman
Sea
7 Scotian
Shelf
(LME)
18 North
Sea
(LME)
30 Sea
of
Okhotsk
(LME)
41
Canary Current (LME)
52 Arabian
Sea
(LME)
64 Humboldt
Current
(LME)
8 Gulf
of
St
Lawrence
19 Celtic-Biscay
Shelf
(LME)
31 Oyashio
Current
(LME)
42 Guinea
Current
(LME)
53
Bay of Bengal S.E.
65
Eastern Equatorial Pacific
9 Newfoundland
Shelf
(LME)
20 Iberian
Coastal
(LME)
32 Kuroshio
Current
(LME)
43 Lake
Chad
54 South
China
Sea
(LME)
66 Antarctic
(LME)
10
Baffin Bay, Labrador Sea,
21 Mediterranean
Sea
(LME)
33 Sea
of
Japan/East
Sea
(LME)
44 Benguela
Current
(LME)
55 Mekong
River
Canadian Archipelago
22 Black
Sea
(LME)
34 Yellow
Sea
(LME)
45a Agulhas Current (LME)
56
Sulu-Celebes Sea (LME)
11 Barents
Sea
(LME)
23 Caspian
Sea
35 Bohai
Sea
45b Indian
Ocean
Islands
57
Indonesian Seas (LME)
Figure 1
The 66 transboundary regions assessed within the GIWA project.
(10%). Other contributions were made by Kalmar Municipality, the
Considering the objectives of the GIWA and the elements incorporated
University of Kalmar and the Norwegian Government. The assessment of
into its design, a new methodology for the implementation of the
regions ineligible for GEF funds was conducted by various international
assessment was developed during the initial phase of the project. The
and national organisations as in-kind contributions to the GIWA.
methodology focuses on fi ve major environmental concerns which
constitute the foundation of the GIWA assessment; Freshwater shortage,
In order to be consistent with the transboundary nature of many of the
Pollution, Habitat and community modifi cation, Overexploitation of fi sh
world's aquatic resources and the focus of the GIWA, the geographical
and other living resources, and Global change. The GIWA methodology
units being assessed have been designed according to the watersheds
is outlined in the following chapter.
of discrete hydrographic systems rather than political borders (Figure 1).
The geographic units of the assessment were determined during the
The global network
preparatory phase of the project and resulted in the division of the
In each of the 66 regions, the assessment is conducted by a team of
world into 66 regions defi ned by the entire area of one or more
local experts that is headed by a Focal Point (Figure 2). The Focal Point
catchments areas that drains into a single designated marine system.
can be an individual, institution or organisation that has been selected
These marine systems often correspond to Large Marine Ecosystems
on the basis of their scientifi c reputation and experience implementing
(LMEs) (Sherman 1994, IOC 2002).
international assessment projects. The Focal Point is responsible
for assembling members of the team and ensuring that it has the
Large Marine Ecocsystems (LMEs)
necessary expertise and experience in a variety of environmental
Large Marine Ecosystems (LMEs) are regions of ocean space encompassing coastal areas from river
and socio-economic disciplines to successfully conduct the regional
basins and estuaries to the seaward boundaries of continental shelves and the outer margin of the
major current systems. They are relatively large regions on the order of 200 000 km2 or greater,
assessment. The selection of team members is one of the most critical
characterised by distinct: (1) bathymetry, (2) hydrography, (3) productivity, and (4) trophically
elements for the success of GIWA and, in order to ensure that the
dependent populations.
most relevant information is incorporated into the assessment, team
The Large Marine Ecosystems strategy is a global effort for the assessment and management
of international coastal waters. It developed in direct response to a declaration at the 1992
members were selected from a wide variety of institutions such as
Rio Summit. As part of the strategy, the World Conservation Union (IUCN) and National Oceanic
and Atmospheric Administration (NOAA) have joined in an action program to assist developing
universities, research institutes, government agencies, and the private
countries in planning and implementing an ecosystem-based strategy that is focused on LMEs as
sector. In addition, in order to ensure that the assessment produces a
the principal assessment and management units for coastal ocean resources. The LME concept is
also adopted by GEF that recommends the use of LMEs and their contributing freshwater basins
truly regional perspective, the teams should include representatives
as the geographic area for integrating changes in sectoral economic activities.
from each country that shares the region.
iv
REGIONAL ASSESSMENTS
The GIWA is comprised of a logical sequence of four integrated
components. The fi rst stage of the GIWA is called Scaling and is a
Steering Group
process by which the geographic area examined in the assessment is
defi ned and all the transboundary waters within that area are identifi ed.
GIWA Partners
IGOs, NGOs,
Core
Thematic
Once the geographic scale of the assessment has been defi ned, the
Scientific institutions,
Team
Task Teams
private sector, etc
assessment teams conduct a process known as Scoping in which the
66 Regional
magnitude of environmental and associated socio-economic impacts
Focal Points
of Freshwater shortage, Pollution, Habitat and community modifi cation,
and Teams
Unsustainable exploitation of fi sh and other living resources, and Global
Figure 2
The organisation of the GIWA project.
change is assessed in order to identify and prioritise the concerns
that require the most urgent intervention. The assessment of these
predefi ned concerns incorporates the best available information and
In total, more than 1 000 experts have contributed to the implementation
the knowledge and experience of the multidisciplinary, multi-national
of the GIWA illustrating that the GIWA is a participatory exercise that
assessment teams formed in each region. Once the priority concerns
relies on regional expertise. This participatory approach is essential
have been identifi ed, the root causes of these concerns are identifi ed
because it instils a sense of local ownership of the project, which
during the third component of the GIWA, Causal chain analysis. The root
ensures the credibility of the fi ndings and moreover, it has created a
causes are determined through a sequential process that identifi es, in
global network of experts and institutions that can collaborate and
turn, the most signifi cant immediate causes followed by the economic
exchange experiences and expertise to help mitigate the continued
sectors that are primarily responsible for the immediate causes and
degradation of the world's aquatic resources.
fi nally, the societal root causes. At each stage in the Causal chain
analysis, the most signifi cant contributors are identifi ed through an
analysis of the best available information which is augmented by the
expertise of the assessment team. The fi nal component of the GIWA is
GIWA Regional reports
the development of Policy options that focus on mitigating the impacts
of the root causes identifi ed by the Causal chain analysis.
The GIWA was established in response to growing concern among the
general public regarding the quality of the world's aquatic resources
The results of the GIWA assessment in each region are reported in
and the recognition of governments and the international community
regional reports that are published by UNEP. These reports are designed
concerning the absence of a globally coherent international waters
to provide a brief physical and socio-economic description of the
assessment. However, because a holistic, region-by-region, assessment
most important features of the region against which the results of the
of the condition of the world's transboundary water resources had never
assessment can be cast. The remaining sections of the report present
been undertaken, a methodology guiding the implementation of such
the results of each stage of the assessment in an easily digestible form.
an assessment did not exist. Therefore, in order to implement the GIWA,
Each regional report is reviewed by at least two independent external
a new methodology that adopted a multidisciplinary, multi-sectoral,
reviewers in order to ensure the scientifi c validity and applicability of
multi-national approach was developed and is now available for the
each report. The 66 regional assessments of the GIWA will serve UNEP
implementation of future international assessments of aquatic resources.
as an essential complement to the UNEP Water Policy and Strategy and
UNEP's activities in the hydrosphere.
UNEP Water Policy and Strategy
The primary goals of the UNEP water policy and strategy are:
(a) Achieving greater global understanding of freshwater, coastal and marine environments by
Global International Waters Assessment
conducting environmental assessments in priority areas;
(b) Raising awareness of the importance and consequences of unsustainable water use;
(c) Supporting the efforts of Governments in the preparation and implementation of integrated
management of freshwater systems and their related coastal and marine environments;
(d) Providing support for the preparation of integrated management plans and programmes for
aquatic environmental hot spots, based on the assessment results;
(e) Promoting the application by stakeholders of precautionary, preventive and anticipatory
approaches.
GLOBAL INTERNATIONAL WATERS ASSESSMENT
v
References:
AMAP (1998). Assessment Report: Arctic Pollution Issues. Arctic
Monitoring and Assessment Programme (AMAP), Oslo, Norway.
Barannik, V., Borysova, O. and Stolberg, F. (2004). The Caspian Sea Region:
Environmental Change. Ambio, 33:45-51.
Brinson, M.M. and Malvßrez, A.I. (2002). Temperate freshwater wetlands:
types, status, and threats. Environmental Conservation, 29:115-133.
Daoji, L. and Daler, D. (2004). Ocean Pollution from Land-based Sources:
East China Sea, China. Ambio, 33:98-106.
FAO (2001). Reykjavik conference on responsible fi sheries in the marine
ecosystem. Iceland, 1-4 October 2001.
IOC (2002). IOC-IUCN-NOAA Consultative Meeting on Large Marine
Ecosystems (LMEs). Fourth Session, 8-9 January 2002, Paris,
France.
IPCC (2001). Climate Change 2001: The Scientifi c Basis. Contribution
of Working Group I to the Third Assessment Report of the
Intergovernmental Panel on Climate Change. In: Houghton,
J.T., Ding, Y., Griggs, D.J., Noguer, M., van der Linden, P.J., Dai, X.,
Maskell, K. and Johnson, C.A. (eds). Cambridge University Press,
Cambridge, United Kingdom and New York, NY, USA.
Kennish, M.J. (2002). Environmental threats and environmental future of
estuaries. Environmental Conservation, 29:78-107.
Myers, R.A. and Worm, B. (2003). Rapid worldwide depletion of predatory
fi sh communities. Nature, 423:280-283.
Primavera, J.H. (1997) Socio-economic impacts of shrimp culture.
Aquaculture Research, 28:815-827.
Sherman, K. (1994). Sustainability, biomass yields, and health of coastal
ecosystems: an ecological perspective. Marine Ecology Progress
Series, 112:277-301.
United Nations conference on the human environment (1972). Report
available on-line at http://www.unep.org
United Nations Millennium Declaration (2000). The Millennium
Assembly of the United Nations, New York.
WHO-UNICEF (2002). Global Water Supply and Sanitation Assessment:
2000 Report.
WSSD (2002). World Summit on Sustainable Development.
Johannesburg Summit 2002. Key Outcomes of the Summit,
UN Department of Public Information, New York.
vi
REGIONAL ASSESSMENTS
The GIWA methodology
The specifi c objectives of the GIWA were to conduct a holistic and globally
The assessment integrates environmental and socio-economic data
comparable assessment of the world's transboundary aquatic resources
from each country in the region to determine the severity of the
that incorporated both environmental and socio-economic factors
impacts of each of the fi ve concerns and their constituent issues on
and recognised the inextricable links between freshwater and marine
the entire region. The integration of this information was facilitated by
environments, in order to enable the GEF to focus their resources and to
implementing the assessment during two participatory workshops
provide guidance and advice to governments and decision makers. The
that typically involved 10 to 15 environmental and socio-economic
coalition of all these elements into a single coherent methodology that
experts from each country in the region. During these workshops, the
produces an assessment that achieves each of these objectives had not
regional teams performed preliminary analyses based on the collective
previously been done and posed a signifi cant challenge.
knowledge and experience of these local experts. The results of these
analyses were substantiated with the best available information to be
The integration of each of these elements into the GIWA methodology
presented in a regional report.
was achieved through an iterative process guided by a specially
Table 1 Pre-defi ned GIWA concerns and their constituent issues
convened Methods task team that was comprised of a number of
addressed within the assessment.
international assessment and water experts. Before the fi nal version
of the methodology was adopted, preliminary versions underwent
Environmental issues
Major concerns
an extensive external peer review and were subjected to preliminary
1. Modification
of
stream
flow
testing in selected regions. Advice obtained from the Methods task
2. Pollution of existing supplies
I Freshwater shortage
3. Changes in the water table
team and other international experts and the lessons learnt from
preliminary testing were incorporated into the fi nal version that was
4. Microbiological
5. Eutrophication
used to conduct each of the GIWA regional assessments.
6. Chemical
7. Suspended
solids
II Pollution
8. Solid
wastes
Considering the enormous diff erences between regions in terms of the
9. Thermal
10. Radionuclide
quality, quantity and availability of data, socio-economic setting and
11. Spills
environmental conditions, the achievement of global comparability
12. Loss of ecosystems
required an innovative approach. This was facilitated by focusing
III Habitat and community
13. Modification of ecosystems or ecotones, including community
modification
structure and/or species composition
the assessment on the impacts of fi ve pre-defi ned concerns namely;
Freshwater shortage, Pollution, Habitat and community modifi cation,
14. Overexploitation
15. Excessive by-catch and discards
IV Unsustainable
Unsustainable exploitation of fi sh and other living resources and Global
16. Destructive fishing practices
exploitation of fish and
change, in transboundary waters. Considering the diverse range of
17. Decreased viability of stock through pollution and disease
other living resources
18. Impact on biological and genetic diversity
elements encompassed by each concern, assessing the magnitude of
19. Changes in hydrological cycle
the impacts caused by these concerns was facilitated by evaluating the
20. Sea level change
V Global change
impacts of 22 specifi c issues that were grouped within these concerns
21. Increased uv-b radiation as a result of ozone depletion
22. Changes in ocean CO source/sink function
(see Table 1).
2
THE GIWA METHODOLOGY
vii

political boundaries but were instead, generally defi ned by a large but
T
r
ansboundar
The GIWA approach
discrete drainage basin that also included the coastal marine waters into
which the basin discharges. In many cases, the marine areas examined
1
Scaling
st
W
orkshop
Detailed
during the assessment coincided with the Large Marine Ecosystems
y
D
(LMEs) defi ned by the US National Atmospheric and Oceanographic
iagnostic
A
ssessment
Scoping
Administration (NOAA). As a consequence, scaling should be a
relatively straight-forward task that involves the inspection of the
Analy
boundaries that were proposed for the region during the preparatory
Causal Chain
2
sis
nd
Analysis
phase of GIWA to ensure that they are appropriate and that there are
W
orkshop
no important overlaps or gaps with neighbouring regions. When the
Policy Option
proposed boundaries were found to be inadequate, the boundaries of
Analysis
the region were revised according to the recommendations of experts
from both within the region and from adjacent regions so as to ensure
that any changes did not result in the exclusion of areas from the GIWA.
Once the regional boundary was defi ned, regional teams identifi ed all
SAP
the transboundary elements of the aquatic environment within the
SAP
region and determined if these elements could be assessed as a single
Figure 1
Illustration of the relationship between the GIWA
coherent aquatic system or if there were two or more independent
approach and other projects implemented within the
systems that should be assessed separately.
GEF International Waters (IW) portfolio.
The GIWA is a logical contiguous process that defi nes the geographic
Scoping ş Assessing the GIWA concerns
region to be assessed, identifi es and prioritises particularly problems
Scoping is an assessment of the severity of environmental and socio-
based on the magnitude of their impacts on the environment and
economic impacts caused by each of the fi ve pre-defi ned GIWA concerns
human societies in the region, determines the root causes of those
and their constituent issues (Table 1). It is not designed to provide an
problems and, fi nally, assesses various policy options that addresses
exhaustive review of water-related problems that exist within each region,
those root causes in order to reverse negative trends in the condition
but rather it is a mechanism to identify the most urgent problems in the
of the aquatic environment. These four steps, referred to as Scaling,
region and prioritise those for remedial actions. The priorities determined
Scoping, Causal chain analysis and Policy options analysis, are
by Scoping are therefore one of the main outputs of the GIWA project.
summarised below and are described in their entirety in two volumes:
GIWA Methodology Stage 1: Scaling and Scoping; and GIWA Methodology:
Focusing the assessment on pre-defi ned concerns and issues ensured
Detailed Assessment, Causal Chain Analysis and Policy Options Analysis.
the comparability of the results between diff erent regions. In addition, to
Generally, the components of the GIWA methodology are aligned
ensure the long-term applicability of the options that are developed to
with the framework adopted by the GEF for Transboundary Diagnostic
mitigate these problems, Scoping not only assesses the current impacts
Analyses (TDAs) and Strategic Action Programmes (SAPs) (Figure 1) and
of these concerns and issues but also the probable future impacts
assume a broad spectrum of transboundary infl uences in addition to
according to the "most likely scenario" which considered demographic,
those associated with the physical movement of water across national
economic, technological and other relevant changes that will potentially
borders.
infl uence the aquatic environment within the region by 2020.
Scaling ş Defining the geographic extent
The magnitude of the impacts caused by each issue on the
of the region
environment and socio-economic indicators was assessed over the
Scaling is the fi rst stage of the assessment and is the process by which
entire region using the best available information from a wide range of
the geographic scale of the assessment is defi ned. In order to facilitate
sources and the knowledge and experience of the each of the experts
the implementation of the GIWA, the globe was divided during the
comprising the regional team. In order to enhance the comparability
design phase of the project into 66 contiguous regions. Considering the
of the assessment between diff erent regions and remove biases
transboundary nature of many aquatic resources and the transboundary
in the assessment caused by diff erent perceptions of and ways to
focus of the GIWA, the boundaries of the regions did not comply with
communicate the severity of impacts caused by particular issues, the
viii
REGIONAL ASSESSMENTS
results were distilled and reported as standardised scores according to
Table 2
Example of environmental impact assessment of
Freshwater shortage.
the following four point scale:
Weight
0 = no known impact
Environmental
Environmental issues
Score
Weight %
averaged
concerns
1 = slight impact
score
2
=
moderate
impact
1. Modification of stream flow
1
20
Freshwater shortage
1.50
3 = severe impact
2. Pollution of existing supplies
2
50
The attributes of each score for each issue were described by a detailed
3. Changes in the water table
1
30
set of pre-defi ned criteria that were used to guide experts in reporting
Table 3
Example of Health impacts assessment linked to one of
the results of the assessment. For example, the criterion for assigning
the GIWA concerns.
a score of 3 to the issue Loss of ecosystems or ecotones is: "Permanent
Criteria for Health impacts
Raw score
Score
Weight %
destruction of at least one habitat is occurring such as to have reduced their
Very small
Very large
surface area by >30% during the last 2-3 decades". The full list of criteria is
Number of people affected
2
50
0 1 2 3
presented at the end of the chapter, Table 5a-e. Although the scoring
Minimum
Severe
Degree of severity
2
30
0 1 2 3
inevitably includes an arbitrary component, the use of predefi ned
Occasion/Short
Continuous
Frequency/Duration
2
20
0 1 2 3
criteria facilitates comparison of impacts on a global scale and also
Weight average score for Health impacts
2
encouraged consensus of opinion among experts.
The trade-off associated with assessing the impacts of each concern
After all 22 issues and associated socio-economic impacts have
and their constituent issues at the scale of the entire region is that spatial
been scored, weighted and averaged, the magnitude of likely future
resolution was sometimes low. Although the assessment provides a
changes in the environmental and socio-economic impacts of each
score indicating the severity of impacts of a particular issue or concern
of the fi ve concerns on the entire region is assessed according to the
on the entire region, it does not mean that the entire region suff ers
most likely scenario which describes the demographic, economic,
the impacts of that problem. For example, eutrophication could be
technological and other relevant changes that might infl uence the
identifi ed as a severe problem in a region, but this does not imply that all
aquatic environment within the region by 2020.
waters in the region suff er from severe eutrophication. It simply means
that when the degree of eutrophication, the size of the area aff ected,
In order to prioritise among GIWA concerns within the region and
the socio-economic impacts and the number of people aff ected is
identify those that will be subjected to causal chain and policy options
considered, the magnitude of the overall impacts meets the criteria
analysis in the subsequent stages of the GIWA, the present and future
defi ning a severe problem and that a regional action should be initiated
scores of the environmental and socio-economic impacts of each
in order to mitigate the impacts of the problem.
concern are tabulated and an overall score calculated. In the example
presented in Table 4, the scoping assessment indicated that concern III,
When each issue has been scored, it was weighted according to the relative
Habitat and community modifi cation, was the priority concern in this
contribution it made to the overall environmental impacts of the concern
region. The outcome of this mathematic process was reconciled against
and a weighted average score for each of the fi ve concerns was calculated
the knowledge of experts and the best available information in order
(Table 2). Of course, if each issue was deemed to make equal contributions,
to ensure the validity of the conclusion.
then the score describing the overall impacts of the concern was simply the
arithmetic mean of the scores allocated to each issue within the concern.
In some cases however, this process and the subsequent participatory
In addition, the socio-economic impacts of each of the fi ve major
discussion did not yield consensus among the regional experts
concerns were assessed for the entire region. The socio-economic
regarding the ranking of priorities. As a consequence, further analysis
impacts were grouped into three categories; Economic impacts,
was required. In such cases, expert teams continued by assessing the
Health impacts and Other social and community impacts (Table 3). For
relative importance of present and potential future impacts and assign
each category, an evaluation of the size, degree and frequency of the
weights to each. Afterwards, the teams assign weights indicating the
impact was performed and, once completed, a weighted average score
relative contribution made by environmental and socio-economic
describing the overall socio-economic impacts of each concern was
factors to the overall impacts of the concern. The weighted average
calculated in the same manner as the overall environmental score.
score for each concern is then recalculated taking into account
THE GIWA METHODOLOGY
ix
Table 4
Example of comparative environmental and socio-economic impacts of each major concern, presently and likely in year 2020.
Types of impacts
Environmental score
Economic score
Human health score
Social and community score
Concern
Overall score
Present (a)
Future (b)
Present (c)
Future (d)
Present (e)
Future (f)
Present (g)
Future (h)
Freshwater shortage
1.3
2.3
2.7
2.8
2.6
3.0
1.8
2.2
2.3
Pollution
1.5
2.0
2.0
2.3
1.8
2.3
2.0
2.3
2.0
Habitat and community
2.0
3.0
2.4
3.0
2.4
2.8
2.3
2.7
2.6
modification
Unsustainable exploitation of fish
1.8
2.2
2.0
2.1
2.0
2.1
2.4
2.5
2.1
and other living resources
Global change
0.8
1.0
1.5
1.7
1.5
1.5
1.0
1.0
1.2
the relative contributions of both present and future impacts and
should be regarded as a framework to guide the analysis, rather than
environmental and socio-economic factors. The outcome of these
as a set of detailed instructions. Secondly, in an ideal setting, a causal
additional analyses was subjected to further discussion to identify
chain would be produced by a multidisciplinary group of specialists
overall priorities for the region.
that would statistically examine each successive cause and study its
links to the problem and to other causes. However, this approach (even
Finally, the assessment recognises that each of the fi ve GIWA concerns
if feasible) would use far more resources and time than those available
are not discrete but often interact. For example, pollution can destroy
to GIWA1. For this reason, it has been necessary to develop a relatively
aquatic habitats that are essential for fi sh reproduction which, in turn,
simple and practical analytical model for gathering information to
can cause declines in fi sh stocks and subsequent overexploitation. Once
assemble meaningful causal chains.
teams have ranked each of the concerns and determined the priorities
for the region, the links between the concerns are highlighted in order
Conceptual model
to identify places where strategic interventions could be applied to
A causal chain is a series of statements that link the causes of a problem
yield the greatest benefi ts for the environment and human societies
with its eff ects. Recognising the great diversity of local settings and the
in the region.
resulting diffi
culty in developing broadly applicable policy strategies,
the GIWA CCA focuses on a particular system and then only on those
Causal chain analysis
issues that were prioritised during the scoping assessment. The
Causal Chain Analysis (CCA) traces the cause-eff ect pathways from the
starting point of a particular causal chain is one of the issues selected
socio-economic and environmental impacts back to their root causes.
during the Scaling and Scoping stages and its related environmental
The GIWA CCA aims to identify the most important causes of each
and socio-economic impacts. The next element in the GIWA chain is
concern prioritised during the scoping assessment in order to direct
the immediate cause; defi ned as the physical, biological or chemical
policy measures at the most appropriate target in order to prevent
variable that produces the GIWA issue. For example, for the issue of
further degradation of the regional aquatic environment.
eutrophication the immediate causes may be, inter alia:
Enhanced nutrient inputs;
Root causes are not always easy to identify because they are often
Increased
recycling/mobilisation;
spatially or temporally separated from the actual problems they
Trapping of nutrients (e.g. in river impoundments);
cause. The GIWA CCA was developed to help identify and understand
Run-off and stormwaters
the root causes of environmental and socio-economic problems
in international waters and is conducted by identifying the human
Once the relevant immediate cause(s) for the particular system has
activities that cause the problem and then the factors that determine
(have) been identifi ed, the sectors of human activity that contribute
the ways in which these activities are undertaken. However, because
most signifi cantly to the immediate cause have to be determined.
there is no universal theory describing how root causes interact to
Assuming that the most important immediate cause in our example
create natural resource management problems and due to the great
had been increased nutrient concentrations, then it is logical that the
variation of local circumstances under which the methodology will
most likely sources of those nutrients would be the agricultural, urban
be applied, the GIWA CCA is not a rigidly structured assessment but
or industrial sectors. After identifying the sectors that are primarily
1 This does not mean that the methodology ignores statistical or quantitative studies; as has already been pointed out, the available evidence that justifies the assumption of causal links should
be provided in the assessment.
x
REGIONAL ASSESSMENTS
responsible for the immediate causes, the root causes acting on those
The policy options recommended by the GIWA are only contributions
sectors must be determined. For example, if agriculture was found to
to the larger policy process and, as such, the GIWA methodology
be primarily responsible for the increased nutrient concentrations, the
developed to test the performance of various options under the
root causes could potentially be:
diff erent circumstances has been kept simple and broadly applicable.
Economic (e.g. subsidies to fertilisers and agricultural products);
Legal (e.g. inadequate regulation);
Global International Waters Assessment
Failures in governance (e.g. poor enforcement); or
Technology or knowledge related (e.g. lack of aff ordable substitutes
for fertilisers or lack of knowledge as to their application).
Once the most relevant root causes have been identifi ed, an
explanation, which includes available data and information, of how
they are responsible for the primary environmental and socio-economic
problems in the region should be provided.
Policy option analysis
Despite considerable eff ort of many Governments and other
organisations to address transboundary water problems, the evidence
indicates that there is still much to be done in this endeavour. An
important characteristic of GIWA's Policy Option Analysis (POA) is that
its recommendations are fi rmly based on a better understanding of
the root causes of the problems. Freshwater scarcity, water pollution,
overexploitation of living resources and habitat destruction are very
complex phenomena. Policy options that are grounded on a better
understanding of these phenomena will contribute to create more
eff ective societal responses to the extremely complex water related
transboundary problems. The core of POA in the assessment consists
of two tasks:
Construct policy options
Policy options are simply diff erent courses of action, which are not
always mutually exclusive, to solve or mitigate environmental and
socio-economic problems in the region. Although a multitude of
diff erent policy options could be constructed to address each root
cause identifi ed in the CCA, only those few policy options that have
the greatest likelihood of success were analysed in the GIWA.
Select and apply the criteria on which the policy options will be
evaluated
Although there are many criteria that could be used to evaluate any
policy option, GIWA focuses on:
Eff ectiveness (certainty of result)
Effi
ciency (maximisation of net benefi ts)
Equity (fairness of distributional impacts)
Practical
criteria
(political
acceptability,
implementation
feasibility).
THE GIWA METHODOLOGY
xi
Table 5a: Scoring criteria for environmental impacts of Freshwater shortage
Issue
Score 0 = no known impact
Score 1 = slight impact
Score 2 = moderate impact
Score 3 = severe impact
Issue 1: Modification
No evidence of modification of stream
There is a measurably changing trend in
Significant downward or upward trend
Annual discharge of a river altered by more
of stream flow
flow.
annual river discharge at gauging stations
(more than 20% of the long term mean) in
than 50% of long term mean; or
"An increase or decrease
in a major river or tributary (basin >
annual discharges in a major river or tributary Loss of >50% of riparian or deltaic
in the discharge of
40 000 km2); or
draining a basin of >250 000 km2; or
wetlands over a period of not less than
streams and rivers
There is a measurable decrease in the area
Loss of >20% of flood plain or deltaic
40 years (through causes other than
as a result of human
of wetlands (other than as a consequence
wetlands through causes other than
conversion or artificial embankment); or
interventions on a local/
of conversion or embankment
conversion or artificial embankments; or
Significant increased siltation or erosion
regional scale (see Issue
construction); or
Significant loss of riparian vegetation (e.g.
due to changing in flow regime (other than
19 for flow alterations
There is a measurable change in the
trees, flood plain vegetation); or
normal fluctuations in flood plain rivers);
resulting from global
interannual mean salinity of estuaries or
Significant saline intrusion into previously
or
change) over the last 3-4
coastal lagoons and/or change in the mean
freshwater rivers or lagoons.
Loss of one or more anadromous or
decades."
position of estuarine salt wedge or mixing
catadromous fish species for reasons
zone; or
other than physical barriers to migration,
Change in the occurrence of exceptional
pollution or overfishing.
discharges (e.g. due to upstream
damming.
Issue 2: Pollution of
No evidence of pollution of surface and
Any monitored water in the region does
Water supplies does not meet WHO or
River draining more than 10% of the basin
existing supplies
ground waters.
not meet WHO or national drinking water
national drinking water standards in more
have suffered polysaprobic conditions, no
"Pollution of surface
criteria, other than for natural reasons; or
than 30% of the region; or
longer support fish, or have suffered severe
and ground fresh waters
There have been reports of one or more
There are one or more reports of fish kills
oxygen depletion
supplies as a result of
fish kills in the system due to pollution
due to pollution in any river draining a
Severe pollution of other sources of
point or diffuse sources"
within the past five years.
basin of >250 000 km2 .
freshwater (e.g. groundwater)
Issue 3: Changes in
No evidence that abstraction of water from Several wells have been deepened because Clear evidence of declining base flow in
Aquifers are suffering salinisation over
the water table
aquifers exceeds natural replenishment.
of excessive aquifer draw-down; or
rivers in semi-arid areas; or
regional scale; or
"Changes in aquifers
Several springs have dried up; or
Loss of plant species in the past decade,
Perennial springs have dried up over
as a direct or indirect
Several wells show some salinisation.
that depend on the presence of ground
regionally significant areas; or
consequence of human
water; or
Some aquifers have become exhausted
activity"
Wells have been deepened over areas of
hundreds of km2;or
Salinisation over significant areas of the
region.
Table 5b: Scoring criteria for environmental impacts of Pollution
Issue
Score 0 = no known impact
Score 1 = slight impact
Score 2 = moderate impact
Score 3 = severe impact
Issue 4:
Normal incidence of bacterial related
There is minor increase in incidence of
Public health authorities aware of marked
There are large closure areas or very
Microbiological
gastroenteric disorders in fisheries product
bacterial related gastroenteric disorders
increase in the incidence of bacterial
restrictive advisories affecting the
pollution
consumers and no fisheries closures or
in fisheries product consumers but no
related gastroenteric disorders in fisheries
marketability of fisheries products; or
"The adverse effects of
advisories.
fisheries closures or advisories.
product consumers; or
There exists widespread public or tourist
microbial constituents of
There are limited area closures or
awareness of hazards resulting in
human sewage released
advisories reducing the exploitation or
major reductions in the exploitation or
to water bodies."
marketability of fisheries products.
marketability of fisheries products.
Issue 5:
No visible effects on the abundance and
Increased abundance of epiphytic algae; or
Increased filamentous algal production
High frequency (>1 event per year), or
Eutrophication
distributions of natural living resource
A statistically significant trend in
resulting in algal mats; or
intensity, or large areas of periodic hypoxic
"Artificially enhanced
distributions in the area; and
decreased water transparency associated
Medium frequency (up to once per year)
conditions, or high frequencies of fish and
primary productivity in
No increased frequency of hypoxia1 or
with algal production as compared with
of large-scale hypoxia and/or fish and
zoobenthos mortality events or harmful
receiving water basins
fish mortality events or harmful algal
long-term (>20 year) data sets; or
zoobenthos mortality events and/or
algal blooms; or
related to the increased
blooms associated with enhanced primary
Measurable shallowing of the depth range
harmful algal blooms.
Significant changes in the littoral
availability or supply
production; and
of macrophytes.
community; or
of nutrients, including
No evidence of periodically reduced
Presence of hydrogen sulphide in
cultural eutrophication
dissolved oxygen or fish and zoobenthos
historically well oxygenated areas.
in lakes."
mortality; and
No evident abnormality in the frequency of
algal blooms.
xii
REGIONAL ASSESSMENTS
Issue 6: Chemical
No known or historical levels of chemical
Some chemical contaminants are
Some chemical contaminants are above
Chemical contaminants are above
pollution
contaminants except background levels of
detectable but below threshold limits
threshold limits defined for the country or
threshold limits defined for the country or
"The adverse effects of
naturally occurring substances; and
defined for the country or region; or
region; or
region; and
chemical contaminants
No fisheries closures or advisories due to
Restricted area advisories regarding
Large area advisories by public health
Public health and public awareness of
released to standing or
chemical pollution; and
chemical contamination of fisheries
authorities concerning fisheries product
fisheries contamination problems with
marine water bodies
No incidence of fisheries product tainting;
products.
contamination but without associated
associated reductions in the marketability
as a result of human
and
catch restrictions or closures; or
of such products either through the
activities. Chemical
No unusual fish mortality events.
If there is no available data use the following
High mortalities of aquatic species near
imposition of limited advisories or by area
contaminants are
criteria:
outfalls.
closures of fisheries; or
here defined as
If there is no available data use the following
Some use of pesticides in small areas; or
Large-scale mortalities of aquatic species.
compounds that are
criteria:
Presence of small sources of dioxins or
If there is no available data use the following
toxic or persistent or
No use of pesticides; and
furans (e.g., small incineration plants or
criteria:
If there is no available data use the following
bioaccumulating."
No sources of dioxins and furans; and
bleached kraft/pulp mills using chlorine);
Large-scale use of pesticides in agriculture
criteria:
No regional use of PCBs; and
or
and forestry; or
Indications of health effects resulting
No bleached kraft pulp mills using chlorine Some previous and existing use of PCBs
Presence of major sources of dioxins or
from use of pesticides; or
bleaching; and
and limited amounts of PCB-containing
furans such as large municipal or industrial Known emissions of dioxins or furans from
No use or sources of other contaminants.
wastes but not in amounts invoking local
incinerators or large bleached kraft pulp
incinerators or chlorine bleaching of pulp;
concerns; or
mills; or
or
Presence of other contaminants.
Considerable quantities of waste PCBs in
Known contamination of the environment
the area with inadequate regulation or has
or foodstuffs by PCBs; or
invoked some public concerns; or
Known contamination of the environment
Presence of considerable quantities of
or foodstuffs by other contaminants.
other contaminants.
Issue 7: Suspended
No visible reduction in water transparency; Evidently increased or reduced turbidity
Markedly increased or reduced turbidity
Major changes in turbidity over wide or
solids
and
in streams and/or receiving riverine and
in small areas of streams and/or receiving
ecologically significant areas resulting
"The adverse effects of
No evidence of turbidity plumes or
marine environments but without major
riverine and marine environments; or
in markedly changed biodiversity or
modified rates of release
increased siltation; and
changes in associated sedimentation or
Extensive evidence of changes in
mortality in benthic species due to
of suspended particulate No evidence of progressive riverbank,
erosion rates, mortality or diversity of flora
sedimentation or erosion rates; or
excessive sedimentation with or without
matter to water bodies
beach, other coastal or deltaic erosion.
and fauna; or
Changes in benthic or pelagic biodiversity
concomitant changes in the nature of
resulting from human
Some evidence of changes in benthic or
in areas due to sediment blanketing or
deposited sediments (i.e., grain-size
activities"
pelagic biodiversity in some areas due
increased turbidity.
composition/redox); or
to sediment blanketing or increased
Major change in pelagic biodiversity or
turbidity.
mortality due to excessive turbidity.
Issue 8: Solid wastes
No noticeable interference with trawling
Some evidence of marine-derived litter on
Widespread litter on beaches giving rise to
Incidence of litter on beaches sufficient
"Adverse effects
activities; and
beaches; or
public concerns regarding the recreational
to deter the public from recreational
associated with the
No noticeable interference with the
Occasional recovery of solid wastes
use of beaches; or
activities; or
introduction of solid
recreational use of beaches due to litter;
through trawling activities; but
High frequencies of benthic litter recovery
Trawling activities untenable because of
waste materials into
and
Without noticeable interference with
and interference with trawling activities;
benthic litter and gear entanglement; or
water bodies or their
No reported entanglement of aquatic
trawling and recreational activities in
or
Widespread entanglement and/or
environs."
organisms with debris.
coastal areas.
Frequent reports of entanglement/
suffocation of aquatic species by litter.
suffocation of species by litter.
Issue 9: Thermal
No thermal discharges or evidence of
Presence of thermal discharges but
Presence of thermal discharges with large
Presence of thermal discharges with large
"The adverse effects
thermal effluent effects.
without noticeable effects beyond
mixing zones having reduced productivity
mixing zones with associated mortalities,
of the release of
the mixing zone and no significant
or altered biodiversity; or
substantially reduced productivity or
aqueous effluents at
interference with migration of species.
Evidence of reduced migration of species
noticeable changes in biodiversity; or
temperatures exceeding
due to thermal plume.
Marked reduction in the migration of
ambient temperature
species due to thermal plumes.
in the receiving water
body."
Issue 10: Radionuclide No radionuclide discharges or nuclear
Minor releases or fallout of radionuclides
Minor releases or fallout of radionuclides
Substantial releases or fallout of
"The adverse effects of
activities in the region.
but with well regulated or well-managed
under poorly regulated conditions that do
radionuclides resulting in excessive
the release of radioactive
conditions complying with the Basic Safety
not provide an adequate basis for public
exposures to humans or animals in relation
contaminants and
Standards.
health assurance or the protection of
to those recommended under the Basic
wastes into the aquatic
aquatic organisms but without situations
Safety Standards; or
environment from
or levels likely to warrant large scale
Some indication of situations or exposures
human activities."
intervention by a national or international
warranting intervention by a national or
authority.
international authority.
Issue 11: Spills
No evidence of present or previous spills of
Some evidence of minor spills of hazardous Evidence of widespread contamination
Widespread contamination by hazardous
"The adverse effects
hazardous material; or
materials in small areas with insignificant
by hazardous or aesthetically displeasing
or aesthetically displeasing materials
of accidental episodic
No evidence of increased aquatic or avian
small-scale adverse effects one aquatic or
materials assumed to be from spillage
from frequent spills resulting in major
releases of contaminants
species mortality due to spills.
avian species.
(e.g. oil slicks) but with limited evidence of
interference with aquatic resource
and materials to the
widespread adverse effects on resources or
exploitation or coastal recreational
aquatic environment
amenities; or
amenities; or
as a result of human
Some evidence of aquatic or avian species
Significant mortality of aquatic or avian
activities."
mortality through increased presence of
species as evidenced by large numbers of
contaminated or poisoned carcasses on
contaminated carcasses on beaches.
beaches.
THE GIWA METHODOLOGY
xiii
Table 5c: Scoring criteria for environmental impacts of Habitat and community modification
Issue
Score 0 = no known impact
Score 1 = slight impact
Score 2 = moderate impact
Score 3 = severe impact
Issue 12: Loss of ecosystems or
There is no evidence of loss of
There are indications of fragmentation Permanent destruction of at least one
Permanent destruction of at least one
ecotones
ecosystems or habitats.
of at least one of the habitats.
habitat is occurring such as to have
habitat is occurring such as to have
"The complete destruction of aquatic
reduced their surface area by up to 30
reduced their surface area by >30%
habitats. For the purpose of GIWA
% during the last 2-3 decades.
during the last 2-3 decades.
methodology, recent loss will be
measured as a loss of pre-defined
habitats over the last 2-3 decades."
Issue 13: Modification of
No evidence of change in species
Evidence of change in species
Evidence of change in species
Evidence of change in species
ecosystems or ecotones, including
complement due to species extinction
complement due to species extinction
complement due to species extinction
complement due to species extinction
community structure and/or species
or introduction; and
or introduction
or introduction; and
or introduction; and
composition
No changing in ecosystem function
Evidence of change in population
Evidence of change in population
"Modification of pre-defined habitats
and services.
structure or change in functional group
structure or change in functional group
in terms of extinction of native species,
composition or structure
composition or structure; and
occurrence of introduced species and
Evidence of change in ecosystem
changing in ecosystem function and
services2.
services over the last 2-3 decades."
2 Constanza, R. et al. (1997). The value of the world ecosystem services and natural capital, Nature 387:253-260.
Table 5d: Scoring criteria for environmental impacts of Unsustainable exploitation of fish and other
living resources
Issue
Score 0 = no known impact
Score 1 = slight impact
Score 2 = moderate impact
Score 3 = severe impact
Issue 14: Overexploitation
No harvesting exists catching fish
Commercial harvesting exists but there One stock is exploited beyond MSY
More than one stock is exploited
"The capture of fish, shellfish or marine
(with commercial gear for sale or
is no evidence of over-exploitation.
(maximum sustainable yield) or is
beyond MSY or is outside safe
invertebrates at a level that exceeds the
subsistence).
outside safe biological limits.
biological limits.
maximum sustainable yield of the stock."
Issue 15: Excessive by-catch and
Current harvesting practices show no
Up to 30% of the fisheries yield (by
30-60% of the fisheries yield consists
Over 60% of the fisheries yield is
discards
evidence of excessive by-catch and/or
weight) consists of by-catch and/or
of by-catch and/or discards.
by-catch and/or discards; or
"By-catch refers to the incidental capture
discards.
discards.
Noticeable incidence of capture of
of fish or other animals that are not the
endangered species.
target of the fisheries. Discards refers
to dead fish or other animals that are
returned to the sea."
Issue 16: Destructive fishing
No evidence of habitat destruction due Habitat destruction resulting in
Habitat destruction resulting in
Habitat destruction resulting in
practices
to fisheries practices.
changes in distribution of fish or
moderate reduction of stocks or
complete collapse of a stock or far
"Fishing practices that are deemed to
shellfish stocks; or
moderate changes of the environment;
reaching changes in the environment;
produce significant harm to marine,
Trawling of any one area of the seabed
or
or
lacustrine or coastal habitats and
is occurring less than once per year.
Trawling of any one area of the seabed
Trawling of any one area of the seabed
communities."
is occurring 1-10 times per year; or
is occurring more than 10 times per
Incidental use of explosives or poisons
year; or
for fishing.
Widespread use of explosives or
poisons for fishing.
Issue 17: Decreased viability of
No evidence of increased incidence of
Increased reports of diseases without
Declining populations of one or more
Collapse of stocks as a result of
stocks through contamination and
fish or shellfish diseases.
major impacts on the stock.
species as a result of diseases or
diseases or contamination.
disease
contamination.
"Contamination or diseases of feral (wild)
stocks of fish or invertebrates that are a
direct or indirect consequence of human
action."
Issue 18: Impact on biological and
No evidence of deliberate or accidental Alien species introduced intentionally
Measurable decline in the population
Extinction of native species or local
genetic diversity
introductions of alien species; and
or accidentally without major changes
of native species or local stocks as a
stocks as a result of introductions
"Changes in genetic and species diversity No evidence of deliberate or accidental
in the community structure; or
result of introductions (intentional or
(intentional or accidental); or
of aquatic environments resulting from
introductions of alien stocks; and
Alien stocks introduced intentionally
accidental); or
Major changes (>20%) in the genetic
the introduction of alien or genetically
No evidence of deliberate or accidental
or accidentally without major changes
Some changes in the genetic
composition of stocks (e.g. as a result
modified species as an intentional or
introductions of genetically modified
in the community structure; or
composition of stocks (e.g. as a result
of escapes from aquaculture replacing
unintentional result of human activities
species.
Genetically modified species
of escapes from aquaculture replacing
the wild stock).
including aquaculture and restocking."
introduced intentionally or
the wild stock).
accidentally without major changes in
the community structure.
xiv
REGIONAL ASSESSMENTS
Table 5e: Scoring criteria for environmental impacts of Global change
Issue
Score 0 = no known impact
Score 1 = slight impact
Score 2 = moderate impact
Score 3 = severe impact
Issue 19: Changes in hydrological
No evidence of changes in hydrological Change in hydrological cycles due
Significant trend in changing
Loss of an entire habitat through
cycle and ocean circulation
cycle and ocean/coastal current due to
to global change causing changes
terrestrial or sea ice cover (by
desiccation or submergence as a result
"Changes in the local/regional water
global change.
in the distribution and density of
comparison with a long-term time
of global change; or
balance and changes in ocean and coastal
riparian terrestrial or aquatic plants
series) without major downstream
Change in the tree or lichen lines; or
circulation or current regime over the
without influencing overall levels of
effects on river/ocean circulation or
Major impacts on habitats or
last 2-3 decades arising from the wider
productivity; or
biological diversity; or
biodiversity as the result of increasing
problem of global change including
Some evidence of changes in ocean
Extreme events such as flood and
frequency of extreme events; or
ENSO."
or coastal currents due to global
drought are increasing; or
Changing in ocean or coastal currents
change but without a strong effect on
Aquatic productivity has been altered
or upwelling regimes such that plant
ecosystem diversity or productivity.
as a result of global phenomena such
or animal populations are unable to
as ENSO events.
recover to their historical or stable
levels; or
Significant changes in thermohaline
circulation.
Issue 20: Sea level change
No evidence of sea level change.
Some evidences of sea level change
Changed pattern of coastal erosion due Major loss of coastal land areas due to
"Changes in the last 2-3 decades in the
without major loss of populations of
to sea level rise has became evident; or
sea-level change or sea-level induced
annual/seasonal mean sea level as a
organisms.
Increase in coastal flooding events
erosion; or
result of global change."
partly attributed to sea-level rise
Major loss of coastal or intertidal
or changing prevailing atmospheric
populations due to sea-level change or
forcing such as atmospheric pressure
sea level induced erosion.
or wind field (other than storm
surges).
Issue 21: Increased UV-B radiation as No evidence of increasing effects
Some measurable effects of UV/B
Aquatic community structure is
Measured/assessed effects of UV/B
a result of ozone depletion
of UV/B radiation on marine or
radiation on behavior or appearance of
measurably altered as a consequence
irradiation are leading to massive loss
"Increased UV-B flux as a result polar
freshwater organisms.
some aquatic species without affecting
of UV/B radiation; or
of aquatic communities or a significant
ozone depletion over the last 2-3
the viability of the population.
One or more aquatic populations are
change in biological diversity.
decades."
declining.
Issue 22: Changes in ocean CO
No measurable or assessed changes
Some reasonable suspicions that
Some evidences that the impacts
Evidences that the changes in
2
source/sink function
in CO source/sink function of aquatic
current global change is impacting the
of global change have altered the
source/sink function of the aquatic
2
"Changes in the capacity of aquatic
system.
aquatic system sufficiently to alter its
source/sink function for CO of aquatic
systems in the region are sufficient to
2
systems, ocean as well as freshwater, to
source/sink function for CO .
systems in the region by at least 10%.
cause measurable change in global CO
2
2
generate or absorb atmospheric CO as a
balance.
2
direct or indirect consequence of global
change over the last 2-3 decades."
THE GIWA METHODOLOGY
xv