


Global International
Waters Assessment
Regional assessments
Other reports in this series:
Russian Arctic Ł GIWA Regional assessment 1a
Caribbean Sea/Small Islands Ł GIWA Regional assessment 3a
Caribbean Islands Ł GIWA Regional assessment 4
Barents Sea Ł GIWA Regional assessment 11
Baltic Sea Ł GIWA Regional assessment 17
Caspian Sea Ł GIWA Regional assessment 23
Gulf of California/Colorado River Basin Ł GIWA Regional assessment 27
Yellow Sea Ł GIWA Regional assessment 34
East China Sea Ł GIWA Regional assessment 36
Patagonian Shelf Ł GIWA Regional assessment 38
Brazil Current Ł GIWA Regional assessment 39
Amazon Basin Ł GIWA Regional assessment 40b
Canary Current Ł GIWA Regional assessment 41
Guinea Current Ł GIWA Regional assessment 42
Lake Chad Basin Ł GIWA Regional assessment 43
Benguela Current Ł GIWA Regional assessment 44
Indian Ocean Islands Ł GIWA Regional assessment 45b
East African Rift Valley Lakes Ł GIWA Regional assessment 47
South China Sea Ł GIWA Regional assessment 54
Indonesian Seas Ł GIWA Regional assessment 57
Pacifi c Islands Ł GIWA Regional assessment 62


Global International
Waters Assessment
Regional assessment 56
Sulu-Celebes (Sulawesi) Sea
GIWA report production
Series editor: Ulla Li Zweifel
Editorial assistance: Johanna Egerup, Monique Stolte, Kristin Bertilius
Maps & GIS: Rasmus G÷ransson
Design & graphics: Joakim Palmqvist
Global International Waters Assessment
Sulu-Celebes (Sulawesi) Sea, GIWA Regional assessment 56
Published by the University of Kalmar on behalf of
United Nations Environment Programme
® 2005 United Nations Environment Programme
ISSN 1651-940X
University of Kalmar
SE-391 82 Kalmar
Sweden
United Nations Environment Programme
PO Box 30552,
Nairobi, Kenya
This publication may be reproduced in whole or in part and
in any form for educational or non-profi t purposes without
special permission from the copyright holder, provided
acknowledgement of the source is made. No use of this
publication may be made for resale or for any other commercial
purpose whatsoever without prior permission in writing from the
United Nations Environment Programme.
CITATIONS
When citing this report, please use:
UNEP 2005. De Vantier, L., Wilkinson, C., Souter, D., South, R.,
Skelton, P. and D. Lawrence. Sulu-Celebes (Sulawesi) Sea, GIWA
Regional assessment 56. University of Kalmar, Kalmar, Sweden.
DISCLAIMER
The views expressed in this publication are those of the authors
and do not necessarily refl ect those of UNEP. The designations
employed and the presentations do not imply the expressions
of any opinion whatsoever on the part of UNEP or cooperating
agencies concerning the legal status of any country, territory,
city or areas or its authority, or concerning the delimitation of its
frontiers or boundaries.
This publication has been peer-reviewed and the information
herein is believed to be reliable, but the publisher does not
warrant its completeness or accuracy.
Contents
Executive summary
9
Acknowledgements 12
Abbreviations and acronyms
13
Regional defi nition
17
Boundaries of the region
17
Physical characteristics
18
Socio-economic characteristics
21
Assessment 29
Freshwater shortage
29
Pollution
33
Habitat and community modifi cation
37
Unsustainable exploitation of fi sh and other living resources
42
Global change
47
Priority concerns
49
Causal chain analysis
52
System description
52
Methodology
53
Causal chain analysis
53
Conclusions
58
Policy options
59
Defi nition of the problem
59
Construction of policy options
60
Recommended policy options
60
Performance of the chosen alternatives
63
Conclusions
65
References 66
Annexes 71
Annex I List of contributing authors and organisations involved
71
Annex III List of important water-related programmes and assessments
76
Annex IV List of conventions and specifi c laws that aff ect water use
81
Annex V Sulu-Celebes Sea Large Marine Ecosystem
82
Annex VI Criteria for scoring environmental impacts
84
CONTENTS
Annex VII Marine protected areas and benefi ts to the fi shery
85
Annex VIII Coral reef initiatives in the Philippines
87
Annex IX Models for development of a fully integrated PA network for Sulu-Celebes (Sulawesi) Sea
88
Annex X Small versus large protected areas in tropical developing nations
97
Annex XI Managing overfi shing in Indonesia
98
The Global International Waters Assessment
i
The GIWA methodology
vii
Executive summary
The GIWA region 56 Sulu-Celebes (Sulawesi) Sea includes some of the
The population of the region, some 34 million (approximately
land and sea areas of three nations; the Philippines, Indonesia (North
25 million Filipinos, less than 2 million Malaysians in Sabah and
Sulawesi and East Kalimantan) and Malaysia (Sabah), and forms part
7 million Indonesians in East Kalimantan and North Sulawesi), is
of the Philippine-Malay Archipelago, which lies at the centre of global
expected to increase at approxiamtely 2.5% per year to 50 million
biodiversity. The marine waters of the region form a Large Marine
in 2020, with a doubling by 2035. There is expected to be increasing
Ecosystem (LME), bounded on most of its western and northern extent
urbanisation, industrialisation and reliance on extractive industries;
by the islands of the Philippines and GIWA region 54 South China Sea,
mining, plantation agriculture and industrial fi shing. Total pressures are
on its southern extent by the Islands of Borneo and Sulawesi and GIWA
likely to increase moderately over the next 20 years, being driven by the
region 57 Indonesian Seas and eastern extent by GIWA region 62 Pacifi c
continued population growth, causing signifi cant deterioration in the
Islands.
environment and socio-economy. The widespread overexploitation and
use of inappropriate technologies raises serious concerns as to even the
Severe environmental impacts to national and international waters are
medium-term sustainability of the production systems, with additional
caused by deforestation and other forms of land clearing in many of
limits to development likely to result from complex linkages between
the approximately 300 drainage basins, with estimated loss of some
freshwater shortage, habitat loss, fi sheries and global change.
1 billion m3 of sediment annually, and siltation rates among the highest
on Earth. Approximately 80% of original vegetation cover has been lost
The Causal chain analysis focused on Habitat loss and community
or altered, including more than 60% of the mangrove resources in the
modifi cation, and considered the strong linkages with Pollution
Philippines. Destructive fi shing, muro-ami, blast and poison fi shing has
(suspended solids) and Unsustainable exploitation of fi sh and other
damaged or destroyed more than 70% of coral reefs, while benthic
living resources. The key root causes are population growth coupled
trawling no longer produces signifi cant by-catch or discards; rather,
with widespread poverty and international market trends. Population
virtually all of the highly diminished catch is kept, including rare and
growth is impacting on migration, urbanisation, lack of employment
endangered marine mammals and turtles. About 70% of coral reefs are
and poverty, all of which, in turn, place greater pressure on services
heavily overfi shed, producing less than 5 tonnes/km2/year, with clear
provided from the environment (e.g. fi sh resources) and contribute to
indications of trophic overfi shing, in comparison with the remaining
increased pollution and damage to habitats. The near-total dependence
30% of reefs that produce 15-20 tonnes/km2/year. There is steadily
of millions of poor people on natural resources for their subsistence is
decreasing catch per unit eff ort, indicative of ecosystem overfi shing,
so strong that every available resource is being extracted at all cost.
and population pressures are leading to Malthusian overfi shing. Priority
Economics and international market trends, including the insatiable
concerns for the future are the same as those for the present: Habitat
international demand for seafood, also drive the unsustainable use of
and community modifi cation, and Unsustainable exploitation of fi sh
resources, and foster corruption and illegal practices. Coupled with the
and other living resources. Environmental and socio-economic impacts
burgeoning population, poverty, and migration to coastal and urban
of Pollution and Freshwater shortage are also expected to be severe
areas, market trends create a dangerous mix of driving forces that do
by 2020. Freshwater shortage is a major food security issue impacting
not augur well for the future. Most importantly, the resource owners
millions of people in the region.
themselves must be persuaded that long-term sustainability is a much
EXECUTIVE SUMMARY
9
better option for the future than short-terms gains presently being
Improved integration of local, provincial, and national laws and
made at the expense of irreversible damage to the environment.
regulations, and tri-lateral integration to maximise eff ectiveness of
obligations under international conventions and treaties;
The Policy options analysis was predicated on the tri-lateral geo-politics
Training programmes to build additional long-term capacity
of the Sulu-Celebes (Sulawesi) Seas, with the Philippines, Indonesia and
among government, NGOs, and communities.
Malaysia each having their own cultural, religious, socio-economic and
political systems, goals and objectives. There are many transboundary
Diffi
culties in establishing strong tri-lateral support for interventions,
issues, and actions by any one nation have the potential to impact on
such as those being developed by the Global Environment Facility
the jurisdictions of another. Yet, at both international and national levels
(GEF), WWF and partners in the Sulu-Sulawesi Marine Ecoregion
there is generally suffi
cient legislation addressing resource management
Programme (SSME), and others are beginning to be overcome. The
and protection, the three nations having ratifi ed most of the relevant
SSME provides a useful model for policy implementation, with a two-
international treaties and conventions and with numerous national laws
pronged approach: (i) conservation planning in the long-term; and (ii)
in place. However, there is little eff ective implementation, with serious
implementation of immediate conservation actions in key sites, with
ineffi
ciencies relating to the transfer and application of international
interventions in fi ve priority areas:
and national legislation at provincial and local levels, compounded
Bio-physical and socio-economic research to provide the necessary
by a lack of awareness and/or acceptance of most laws among local
information for sound management;
populations. National and provincial laws relevant to diff erent sectors
Establishment of an eff ective integrated network of protected
- fi sheries, mining, forestry and environmental protection - are not fully
areas, to play dual key roles in biodiversity conservation and
integrated, causing uncertainty in application of legislative instruments,
fi sheries restoration;
and confusion over which laws have priority, responsibilities for
Development of sustainable livelihoods, e.g. AIG, to relieve pressure
management, and the rights of stakeholders.
on natural resources;
Information/education/communication to raise public awareness;
Key government departments are hampered by a lack of qualifi ed
Institution and capacity building, including establishment of inter-
and experienced staff , and also by funding shortfalls and cutbacks.
governmental mechanisms to best use limited funds.
Despite considerable recent progress, there is insuffi
cient capacity for
eff ective alleviation, in part related to currency depreciation and shifts
Improved management and expansion of the protected areas network
in government spending. There are, however, many national, regional
is the key recommended policy option arising from this analysis, in light
and international "players" actively pursuing sustainable development
of the strong linkages between habitat loss and overexploitation of
initiatives, and best use of this developing network should be made
fi sh, the ameliorative role of protected areas in both regards cannot
during future policy implementation. Improved integration among
be overemphasised. Specifi c policy recommendations for improving
government departments, international donor agencies and NGOs,
the management and coverage of the Protected Areas (PAs) network
better allocation and use of government funds, as well as continuing
include:
international donor assistance are urgently required in the short-term. In
Review the current administrative frameworks and design strategies
particular, population and development policies require urgent review if
to resolve overlapping legal authority and jurisdiction in protected
growth over the next several decades is to be managed eff ectively and
areas;
the present rapid rate of increase of impacts is to be curbed.
Identify which protected areas are working, which are not and
why, and document successful case histories of protected area
More extensive and intensive intervention should be focused through:
management;
Direct on-the-ground community-based conservation programmes,
Where necessary, design management plans that include identifi ed
particularly focused on family planning and poverty alleviation, with
source(s) of operational funding;
alternative or supplemental income generation (AIG) for locals;
Retain fl exibility in management approach, recognising the value
Improved management of existing protected areas, in relation to
of small-scale local, community-based and co-management
both biodiversity conservation and fi sheries restoration;
approaches and large-scale internationally-supported management
Continued expansion and improved integration of the protected
initiatives;
areas network, with assessment programmes for identifi cation of
Design and foster implementation of a system whereby each
additional critical areas;
municipality or village (e.g. Barangay in the Philippines) is
10
GIWA REGIONAL ASSESSMENT 56 SULUCELEBES SULAWESI SEA
empowered to assist in management of (or manage) the local
management. A national policy on protected areas conservation
protected area;
fi nancing should ensure local collection and distribution of a
Conduct strategic assessment of human resource requirements,
majority of user fees, with only a minority going to the central
including day-to-day management, surveillance and enforcement
government. All fi nances should be accounted for and booked
on a case-by-case basis;
at the national level. Transparent third party monitoring and
Encourage government and private sector to carry out integrated
evaluation on fi nancial management as well as conservation
coastal zone planning and management (including watersheds),
management impact is essential.
and incorporate protection of critical land areas within the parks
Clear guidelines and standard operating procedures are
or as buff er zones;
necessary for both joint patrol systems and participatory zonation
Set aside as much as practicable (at least 20%) of marine protected
processes.
areas as `no take' zones for biodiversity conservation and fi sheries
replenishment;
The above recommended policy options should assist in the
Ensure Environmental Impact Asssessments (EIAs) are conducted
establishment of well-planned, well-funded, and well-implemented
prior to any development in or adjacent to protected areas, and
protected areas encompassing major habitats and serving as
wherever practicable, minimise all future development of land
models (coastal and marine examples include Tubbutaha, Bunaken
within and adjacent to protected areas to maintain buff er zones;
and Turtle Island) for future marine park development. These policy
Establish/refi ne monitoring programmes and re-evaluate research
recommendations will impact the entire range of civil society, and place
priorities to best address bio-physical and socio-economic
major responsibilities on governments, NGOs, educational institutions
management concerns;
and the private sector, if the most problematical issues of habitat loss
Work through Association of South East Asian Nations (ASEAN)
and overexploitation are to be ameliorated in the coming decades.
and other multi-lateral, international agencies and organisations
The refi nement of these policy options will emerge during continuing
to develop joint programmes, including innovative sources of
development of the SSME and GEF programmes.
ongoing funding.
Without doubt, Sulu-Celebes (Sulawesi) Sea must be a priority region
In particular, it is crucial that the relevant government agencies in the
for future GEF initiatives. The region is at the centre of the world's
Philippines, Indonesia and Malaysia provide:
marine biodiversity with many species of global signifi cance and it is
Clear written policy in support of site-specifi c co-management
surrounded by a rapidly growing population and rapidly deteriorating
of National Parks and other protected areas. Such policy should
marine ecosystems. The very recent discovery of the Indonesian
delegate clear support and responsibility to all National Park
Coelacanth (Latimera manadoensis), demonstrates the need to
directors to develop fl exible co-management structures that refl ect
improve marine ecosystem protection so that other yet undiscovered
the site-specifi c opportunities and constraints of their National Park.
but potentially valuable species are not eliminated. The challenge
Criteria for co-management include excellence in technical service
of securing the necessary national and international, transboundary
delivery, professionalism and fl exibility.
cooperation necessary for the sustainable development of this critical
Relevant conservation user fee policies assessed and revised
region is great, but not insurmountable.
in order to clearly support local self-fi nancing for conservation
EXECUTIVE SUMMARY
11
Acknowledgements
The authors gratefully acknowledge the expert contributions of (in
alphabetical order): Achmad Abdullah (deceased), Heni Augustina,
Angel Alcala, Porfi rio Alino, Imam Bachtiar, Ronald Bonifacio, Annadel
Cabanban, Catherine Cheung, Chua Thia-Eng, Laura David, Rili Djohani,
Mark Erdmann, Miguel Fortes, Ed Gomez, Kevin Hiew, Jose Ingles, Gil
Jacinto, Roger Juliano, Teng Seh Keng, Hugh Kirkman, Maarten Kuijper,
David Lawrence, Al Licuanan, Medel Limsuan, Evangeline Miclat,
Peter Mous, Cleto Nanola, Jos Pet, Lida Pet-Soede, Nicolas Pilcher,
Srihartiningsih Purnomohadi, Ketut Sarjana Putra, Jan Steff an, and
Romeo Trono, and others forming the GIWA regional Task team.
The authors also thank Dag Daler, Olof Linden, Niklas Holmgren,
Johanna Egerup and the GIWA Co-ordination Offi
ce in Kalmar
University, Sweden; Prof. Russell Reichelt and staff of the Cooperative
Research Centre for the Great Barrier Reef World Heritage Area; the
Australian Institute of Marine Science; and the International Ocean
Institute (Australia) for support. We also thank the reviewers Prof. Helen
Yap and Prof. Loke Ming Chou.
12
GIWA REGIONAL ASSESSMENT 56 SULUCELEBES SULAWESI SEA
Abbreviations and acronyms
AIG
Alternative Income Generation
IUU
Illegal Unreported and Unregulated
ASEAN
Association of South East Asian Nations
LME Large
Marine
Ecosystem
BAPEDAL Indonesia's Environmental Impact Management Agency
LWUA
Local Water Utilities Administration
BNP Bunaken
National
Park
MARPOL International Convention on Prevention of Marine Pollution
BOD Biological
Oxygen
Demand
from ships
BRS
Bureau of Research and Standards
MEA
Millennium Ecosystem Assessment
BSWM
Bureau of Soils and Water Management
MMAF Ministry
for
Martine
Aff air & Fisheries
BTNB Bunaken
National
Park
Offi
ce
MOH
Ministry of Health
CBD
Conservation on Biological Diversity
MPA Marine
Protected
Area
CI Conservation
International
MRIIS
Magat River Integrated Irrigation System
CIS
Communal Irrigation Systems
MSY
Maximum Sustainable Yields
CITES
Convention on International Trade in Endangered Species
MWSS
Metropolitan Waterworks and Sewerage System
CPUE Catch
Per
Unit
Eff ort
NEA
National Electrifi cation Administration
DANIDA Danish International Development Agency
NGO Non-Governmental
Organisation
DENR
Philippines Department of Environment and Natural Resources
NIA National
Irrigation
Administration
DGF
Indonesian Directorate General of Fisheries
NIA
Department of Agriculture
DGWRD Directorate General of Water Resources Development
NIS
National Irrigation Systems
DID
Department of Irrigation and Drainage
NP National
Park
DOA
Department of Agriculture
NPC National
Power
Corporation
DOE
Department of Environment
NRMP
Natural Resources Management Project
DPWH
Department of Public Works and Highways
NRWB
National Water Review Board
EEZ Exclusive
Economic
Zone
NRWC National
Water
Resources
Council
EIA
Environmental Impact Assessment
NWRB
National Water Resources Board
FAO
Food and Agriculture Organization of the United Nations
PA
Protected Areas
FMB Forest
Management
Bureau
PAGASA Philippine Atmospheric, Geophysical and Astronomical
GEF Global
Environment
Facility
Services
Administration
GDP Gross
Domestic
Product
PEMSEA GEF/UNDP/IMO Regional Programme on Partnerships in
GNP Gross
National
Product
Environmental Management for the Seas of East Asia
HYV
High Yielding Varieties
PHKA
Indonesian Department of Nature Conservation
ICLARM
International Center for Living Aquatic Resources Management
PMO
Project Management Offi
ce
ICRAN
International Coral Reef Action Network
PROPER-PROKASIH Indonesian Programme for Pollution Control,
IOC
Intergovernmental Oceanographic Commission
Evaluation
and
Rating
IUCN
The World Conservation Union
PWD
Public Works Department
ABBREVIATIONS AND ACRONYMS
13
SAP Strategic
Action
Programme
UNESCO United
Nations
Educational
Scientifi c and Cultural Organization
SSME
Sulu-Sulawesi Marine Ecoregion Programme
UNFCCC United Nations Framework Convention on Climate Change
SST Sea
Surface
Temperature
UPRIIS
Upper Pampanga River Integrated Irrigation System
SWIM
Small Water Impounding Management
USAID US
Agency
for
International
Development
TDA
Transboundary Diagnostic Analysis
WCMC
World Conservation Monitoring Centre
TNC Nature
Conservancy
WESTPAC Sub-Commission for the Western Pacifi c
TSS
Total Suspended Solids
WHA World
Health
Assembly
ULCC
Ultra Large Crude Carriers
WRI World
Resources
Institute
UNCLOS UN Convention on the Law of the Sea
WUA Water
Users
Association
UNDP
United Nations Development Programme
WWF
World Wildlife Fund
UNEP
United Nations Environment Programme
14
GIWA REGIONAL ASSESSMENT 56 SULUCELEBES SULAWESI SEA
List of figures
Figure 1
Boundaries of the Sulu-Celebes (Sulawesi) region. . . . . . . . . . . . . . . . . . . . . . . . . . . . . . . . . . . . . . . . . . . . . . . . . . . . . . . . . . . . . . . . . . . . . . . . . . . . . . . . . . . . . . . . . . . . . . . . . . . . . . . . . . . . . . 18
Figure 2
International and national marine protected areas in the Sulu-Celebes (Sulawesi) region. . . . . . . . . . . . . . . . . . . . . . . . . . . . . . . . . . . . . . . . . . . . . . . . . . . . . . . . . . . . . . . . . . . . . . 21
Figure 3
Population density in the Sulu-Celebes (Sulawesi) region. . . . . . . . . . . . . . . . . . . . . . . . . . . . . . . . . . . . . . . . . . . . . . . . . . . . . . . . . . . . . . . . . . . . . . . . . . . . . . . . . . . . . . . . . . . . . . . . . . . . . . 22
Figure 4
Land cover in the Sulu-Celebes (Sulawesi) region.. . . . . . . . . . . . . . . . . . . . . . . . . . . . . . . . . . . . . . . . . . . . . . . . . . . . . . . . . . . . . . . . . . . . . . . . . . . . . . . . . . . . . . . . . . . . . . . . . . . . . . . . . . . . . . 23
Figure 5
Fish market in Sandakan, Malaysia. . . . . . . . . . . . . . . . . . . . . . . . . . . . . . . . . . . . . . . . . . . . . . . . . . . . . . . . . . . . . . . . . . . . . . . . . . . . . . . . . . . . . . . . . . . . . . . . . . . . . . . . . . . . . . . . . . . . . . . . . . . . 24
Figure 6
Reefs at risk due to sedimentation in the Sulu-Celebes (Sulawesi) region. . . . . . . . . . . . . . . . . . . . . . . . . . . . . . . . . . . . . . . . . . . . . . . . . . . . . . . . . . . . . . . . . . . . . . . . . . . . . . . . . . . . . . . 35
Figure 7
Altered land cover in the Sulu-Celebes (Sulawesi) region. . . . . . . . . . . . . . . . . . . . . . . . . . . . . . . . . . . . . . . . . . . . . . . . . . . . . . . . . . . . . . . . . . . . . . . . . . . . . . . . . . . . . . . . . . . . . . . . . . . . . . . 38
Figure 8
Reefs at risk due to overfishing in the Sulu-Celebes (Sulawesi) region.. . . . . . . . . . . . . . . . . . . . . . . . . . . . . . . . . . . . . . . . . . . . . . . . . . . . . . . . . . . . . . . . . . . . . . . . . . . . . . . . . . . . . . . . . . 38
Figure 9
Reefs at risk due to coastal development in the Sulu-Celebes (Sulawesi) region.. . . . . . . . . . . . . . . . . . . . . . . . . . . . . . . . . . . . . . . . . . . . . . . . . . . . . . . . . . . . . . . . . . . . . . . . . . . . . . . . 39
Figure 10
Local fisherman with bag of sea urchin, Olango Islands, Philippines. . . . . . . . . . . . . . . . . . . . . . . . . . . . . . . . . . . . . . . . . . . . . . . . . . . . . . . . . . . . . . . . . . . . . . . . . . . . . . . . . . . . . . . . . . . 41
Figure 11
Catches of various fish resources in the Sulu-Celebes (Sulawesi) region. . . . . . . . . . . . . . . . . . . . . . . . . . . . . . . . . . . . . . . . . . . . . . . . . . . . . . . . . . . . . . . . . . . . . . . . . . . . . . . . . . . . . . . . 42
Figure 12
Skipjack tuna (Katsuwonus pelamis). . . . . . . . . . . . . . . . . . . . . . . . . . . . . . . . . . . . . . . . . . . . . . . . . . . . . . . . . . . . . . . . . . . . . . . . . . . . . . . . . . . . . . . . . . . . . . . . . . . . . . . . . . . . . . . . . . . . . . . . . . . 43
Figure 13
Yellowfin tuna (Thunnus albacares). . . . . . . . . . . . . . . . . . . . . . . . . . . . . . . . . . . . . . . . . . . . . . . . . . . . . . . . . . . . . . . . . . . . . . . . . . . . . . . . . . . . . . . . . . . . . . . . . . . . . . . . . . . . . . . . . . . . . . . . . . . 43
Figure 14
Reefs at risk due to destructive fishing practices in the Sulu-Celebes (Sulawesi) region.. . . . . . . . . . . . . . . . . . . . . . . . . . . . . . . . . . . . . . . . . . . . . . . . . . . . . . . . . . . . . . . . . . . . . . . . . 44
Figure 15
Sharks in a market, Sandakan, Malaysia. . . . . . . . . . . . . . . . . . . . . . . . . . . . . . . . . . . . . . . . . . . . . . . . . . . . . . . . . . . . . . . . . . . . . . . . . . . . . . . . . . . . . . . . . . . . . . . . . . . . . . . . . . . . . . . . . . . . . . . 45
Figure 16
Sea surface temperature anomalities during 1998 in the Sulu-Celebes (Sulawesi) region. . . . . . . . . . . . . . . . . . . . . . . . . . . . . . . . . . . . . . . . . . . . . . . . . . . . . . . . . . . . . . . . . . . . . . . 48
Figure 17
Typhoon Kujiraoff the coast of the Philippines, April 19, 2003. . . . . . . . . . . . . . . . . . . . . . . . . . . . . . . . . . . . . . . . . . . . . . . . . . . . . . . . . . . . . . . . . . . . . . . . . . . . . . . . . . . . . . . . . . . . . . . . . . 49
Figure 18
Causal chain diagram illustrating the causal links for habitat and community modification in the Sulu-Celebes region.. . . . . . . . . . . . . . . . . . . . . . . . . . . . . . . . . . . . . . . 53
Figure 19
Nudibranches, Mabul Island, Malaysia.. . . . . . . . . . . . . . . . . . . . . . . . . . . . . . . . . . . . . . . . . . . . . . . . . . . . . . . . . . . . . . . . . . . . . . . . . . . . . . . . . . . . . . . . . . . . . . . . . . . . . . . . . . . . . . . . . . . . . . . . 55
List of tables
Table 1
Physical characterstics of the Sulu-Celebes (Sulawesi) region. . . . . . . . . . . . . . . . . . . . . . . . . . . . . . . . . . . . . . . . . . . . . . . . . . . . . . . . . . . . . . . . . . . . . . . . . . . . . . . . . . . . . . . . . . . . . . . . . . . 19
Table 2
Population in the Sulu Celebes Sea region.. . . . . . . . . . . . . . . . . . . . . . . . . . . . . . . . . . . . . . . . . . . . . . . . . . . . . . . . . . . . . . . . . . . . . . . . . . . . . . . . . . . . . . . . . . . . . . . . . . . . . . . . . . . . . . . . . . . . . 22
Table 3
The GDP and economic growth of each of the three countries that share the Sulu-Celebes (Sulawesi) region. . . . . . . . . . . . . . . . . . . . . . . . . . . . . . . . . . . . . . . . . . . . . . . . . . . 23
Table 4
Total added value to GDP from the agricultural, industrial and service sectors. . . . . . . . . . . . . . . . . . . . . . . . . . . . . . . . . . . . . . . . . . . . . . . . . . . . . . . . . . . . . . . . . . . . . . . . . . . . . . . . . 25
Table 5
Scoring table for the Sulu-Celebes (Sulawesi) region. . . . . . . . . . . . . . . . . . . . . . . . . . . . . . . . . . . . . . . . . . . . . . . . . . . . . . . . . . . . . . . . . . . . . . . . . . . . . . . . . . . . . . . . . . . . . . . . . . . . . . . . . . . 29
Table 6
Water withdrawal in the Sulu-Celebes (Sulawesi) region. . . . . . . . . . . . . . . . . . . . . . . . . . . . . . . . . . . . . . . . . . . . . . . . . . . . . . . . . . . . . . . . . . . . . . . . . . . . . . . . . . . . . . . . . . . . . . . . . . . . . . . 30
Table 7
Hydropower in the Sulu-Celebes (Sulawesi) region. . . . . . . . . . . . . . . . . . . . . . . . . . . . . . . . . . . . . . . . . . . . . . . . . . . . . . . . . . . . . . . . . . . . . . . . . . . . . . . . . . . . . . . . . . . . . . . . . . . . . . . . . . . . . 30
List of boxes
Box 1
Institutions involved in water resources management in the Sulu-Celebes (Sulawesi) region. . . . . . . . . . . . . . . . . . . . . . . . . . . . . . . . . . . . . . . . . . . . . . . . . . . . . . . . . . . . . . . . . . . 26
Box 2
Trends in water resource management in the Sulu-Celebes (Sulawesi) region. . . . . . . . . . . . . . . . . . . . . . . . . . . . . . . . . . . . . . . . . . . . . . . . . . . . . . . . . . . . . . . . . . . . . . . . . . . . . . . . . . 33
Box 3
Planned Minahasan container port. . . . . . . . . . . . . . . . . . . . . . . . . . . . . . . . . . . . . . . . . . . . . . . . . . . . . . . . . . . . . . . . . . . . . . . . . . . . . . . . . . . . . . . . . . . . . . . . . . . . . . . . . . . . . . . . . . . . . . . . . . . . 36
Box 4
Socio-economic costs of destructive fishing. . . . . . . . . . . . . . . . . . . . . . . . . . . . . . . . . . . . . . . . . . . . . . . . . . . . . . . . . . . . . . . . . . . . . . . . . . . . . . . . . . . . . . . . . . . . . . . . . . . . . . . . . . . . . . . . . . . . 40
Box 5
The Bunaken National Park, Indonesia.. . . . . . . . . . . . . . . . . . . . . . . . . . . . . . . . . . . . . . . . . . . . . . . . . . . . . . . . . . . . . . . . . . . . . . . . . . . . . . . . . . . . . . . . . . . . . . . . . . . . . . . . . . . . . . . . . . . . . . . . 41
Box 6
Increase in coral cover in the Bunaken National Park. . . . . . . . . . . . . . . . . . . . . . . . . . . . . . . . . . . . . . . . . . . . . . . . . . . . . . . . . . . . . . . . . . . . . . . . . . . . . . . . . . . . . . . . . . . . . . . . . . . . . . . . . . . 42
Box 7
Illegal fishing by foreign vessels in Indonesia. . . . . . . . . . . . . . . . . . . . . . . . . . . . . . . . . . . . . . . . . . . . . . . . . . . . . . . . . . . . . . . . . . . . . . . . . . . . . . . . . . . . . . . . . . . . . . . . . . . . . . . . . . . . . . . . . . . 56
Box 8
Lack of financial support for protected areas in Indonesia: Bunaken National Park. . . . . . . . . . . . . . . . . . . . . . . . . . . . . . . . . . . . . . . . . . . . . . . . . . . . . . . . . . . . . . . . . . . . . . . . . . . . 57
Box 9
Lack of control of illegal fishing by foreign vessels in Indonesia.. . . . . . . . . . . . . . . . . . . . . . . . . . . . . . . . . . . . . . . . . . . . . . . . . . . . . . . . . . . . . . . . . . . . . . . . . . . . . . . . . . . . . . . . . . . . . . . . 57
Box 10
The need for improved management and cooperation in conserving and protecting the Sulu-Celebes LME. . . . . . . . . . . . . . . . . . . . . . . . . . . . . . . . . . . . . . . . . . . . . . . . . . . . 59
Box 11
Benefits of MPAs in Fisheries Management . . . . . . . . . . . . . . . . . . . . . . . . . . . . . . . . . . . . . . . . . . . . . . . . . . . . . . . . . . . . . . . . . . . . . . . . . . . . . . . . . . . . . . . . . . . . . . . . . . . . . . . . . . . . . . . . . . . . . 61
Box 12
Policy for collaborative management of Indonesia's National Parks. . . . . . . . . . . . . . . . . . . . . . . . . . . . . . . . . . . . . . . . . . . . . . . . . . . . . . . . . . . . . . . . . . . . . . . . . . . . . . . . . . . . . . . . . . . 62
ABBREVIATIONS AND ACRONYMS
15
16
GIWA REGIONAL ASSESSMENT 56 SULUCELEBES SULAWESI SEA
Regional defi nition
This section describes the boundaries and the main physical and
To the east, the region includes the drainage basins feeding streams
socio-economic characteristics of the region in order to defi ne the
and rivers fl owing south and west on Samar, all the Visayan Islands
area considered in the regional GIWA Assessment and to provide
and Visayan and Camotes seas. Further south, the boundary includes
suffi
cient background information to establish the context within
the Bohol Sea, passing along the Diuata mountain range of eastern
which the assessment was conducted.
Mindanao to include drainage basins, rivers and urban areas of western
and southern Mindanao and the Davao and Moro gulfs. The boundary
continues through the Philippine and Indonesian island chains
(Kepuluan Karakaralong and Kepuluan Sangihe) between Mindanao
Boundaries of the region
and Sulawesi.
The GIWA region 56 Sulu-Celebes (Sulawesi) Sea region contains
On its southern extent, the boundary includes the catchments and
most of the Philippine islands (excluding northern Luzon, the north
streams of northern Sulawesi emptying into the Celebes (Sulawesi)
and eastern part of Samar and east Mindanao to the east of Diuata
Sea, crosses the northern entrance to Makassar Strait at its narrowest
Mountains), the most northern islands of Indonesia (Kepuluan Sangihe,
point and extends inland into northeast Borneo to include catchments
northern Sulawesi and east Kalimantan) and Malaysian Sabah. Of the
and rivers of East Kalimantan and Sabah, notably the Sandakan River
7 000 islands that comprise the Philippines, only 3 144 islands are
Basin. On its western extent, the region extends from the northern tip of
named. There are also thousands of small islets grouped with the larger
Sabah to Palawan, to include the catchments of eastern Palawan, then
islands. The Philippines is divided into three major island groups: Luzon,
north to include the Calamianes Island group, Busuanga and Mindoro,
with an area of 142 000 km2 (the southern portion of which is included
joining the northern boundary in Luzon.
in the region); Visayas, with an area of 56 000 km2; and Mindanao, with
an area of 102 000 km2 (both included in the region).
The Mahakam River Basin and major population centres of East
Kalimantan province of Balikpapan and Samarinda are excluded,
The northern boundary of the GIWA region 56 Sulu-Celebes (Sulawesi)
as the river discharges into the generally south-fl owing Makassar
on Luzon Island (Philippines) follows the drainage basin boundary and
Strait (GIWA region 57 Indonesian Seas). The rivers in the western
south-fl owing streams and rivers of Batangas province to near the town
part of Sabah and Sarawak are also excluded, as these mainly drain
of San Pablo, continuing to the east along the central mountains of
into the South China Sea, and their impact is seasonal in the Sulu
eastern Luzon to include the southern part of the Island. The boundary
Sea, when ocean currents may transport sediment-laden waters
excludes Manila Bay and Laguna de Bay and the catchments and
around the northern coast of Sabah. The boundaries exclude parts
rivers that feed into South China Sea or Pacifi c Ocean. The boundary
of the South China Sea west of Palawan and Luzon (in GIWA region 54
includes the drainage basins of Batangas province and southern parts
South China Sea), the Pacifi c Ocean east of Mindanao (GIWA region 62
of Quezon, Masbate, Camarines Sur, Albay and Sorsogon Provinces and
Pacifi c Islands) and Makassar Strait between Sulawesi and Borneo (East
Bicol Region, with Balayan, Batangas, Tayabas and Caima bays, Ragay
Kalimantan, included in region 57 Indonesian Seas). These boundaries
Gulf, Sorsogo Bay and the Sibuyan Sea.
conform well with the WWF defi nition of the boundaries of the Sulu-
REGIONAL DEFINITION
17


Luzon
Manila
Elevation/
Depth (m)
Naga
4 000
2 000
Mindoro
S I B U YA N S E A
1 000
500
Samar
Calamian
100
V I S AYA N S E A
Tacloban
P
0
A
Iloilo
-50
Bacolod
C I
Visayan islands
A
F
-200
E
Philipinnes
Cebu
I
S
-1 000
an
Puerto Princesa
C
A
-2 000
Palaw
O
N
I
Ag
C
H
S U L U S E A
u
BOHOL SEA
san
E
C
Sin
A
dan
H
gang
Li
N
Mindanao
bu
T
gano
U
ao
n
O
an
dn
S
Mi
Zamboanga
Davao
Sandakan
Sulu Archipelago
Ses
Sabah
aya
n
(Malaysia)
/
Se
sa
yap
?
Sembakung
C E L E B E S S E A
East Kalimantan
(Indonesia)
n
ya
Ka
rau
Be
Manado
Sulawesi (Indonesia)
M A K A S S A R
S T R A I T
0
200 Kilometres
I N D O N E S I A N S E A S
® GIWA 2004
Figure 1
Boundaries of the Sulu-Celebes (Sulawesi) region.
Sulawesi Marine Ecoregion (WWF 2003) except for GIWA's inclusion of
the Philippines, and the seas themselves, are subject to more tectonic
the drainage basins. Figure 1 shows the boundaries of the Sulu-Celebes
activity and volcanic instability (with several active volcanoes). The total
(Sulawesi) region.
area of the region is 333 200 km2 of which 50% lays in the Philippines,
almost 20% in Malaysia and 32% in Indonesia (Table 1).
The Philippines has a varied topography with highlands and numerous
Physical characteristics
valleys. Its four major lowland plains are the central plain and the
Cagayan valley in Luzon, the Agusan valley and the Cotabato valley
The region is oceanographically, geologically and topographically
in Mindanao. These lowlands contrast sharply with the adjacent high
diverse. The Island of Borneo, the northeastern portion of which
mountain areas of the central and east Cordilleras and the Zambales
Indonesian East Kalimantan and Malaysian Sabah forms the
mountains. The highest peaks reach almost 3 000 m above sea level at
southwestern corner of the region, lies on the Asian continental shelf
less than 30 km from the sea. In Indonesia, most of the major islands
and is physically stable. The remaining islands of northern Indonesia and
have a mountain range running their entire length. The mountains are
18
GIWA REGIONAL ASSESSMENT 56 SULUCELEBES SULAWESI SEA
Table 1
Physical characterstics of the Sulu-Celebes (Sulawesi)
high frequency of tropical cyclones. The main air streams that aff ect the
region.
Philippines are the northeast monsoon from late October to March, the
Percentage
Percentage
Country area in
Country area
southwest monsoon from May to October and the North Pacifi c trade
of country in
of region in
Country
the region
total
region
country
winds, dominant during April and early May (FAO AQUASTAT 2003).
(km2)
(km2)
(%)
(%)
Many of the larger islands of the Philippines have high mountain ranges,
Indoensia
106 900
1 826 440
32.1
5.9
most of which lie along a generally north-south axis across the paths of
Malaysia
60 220
328 550
18.1
18.3
movement of the important air streams. Thus, apart from temperature
Philippines
166 080
298 170
49.8
55.7
eff ects due to elevation, the orographic eff ects of mountains have
Total
333 200
important infl uences on regional rainfall patterns by causing increased
(Source: EROS Data Center 2003, ESRI 2002)
precipitation on windward slopes and rain shadows in their lee during
the monsoon periods.
of volcanic origin and, in some cases, are still active. The elevations of
the islands range from 0 to 5 030 m above sea level. In Malaysia, the
The average annual rainfall in the Philippines between 1961 and 1990
interior of Sabah is criss-crossed by a series of mountain ranges and
was 2 373 mm, but this fi gure varies from 961 mm (General Santos City
hills, the most prominent of which is the Crocker Range with the highest
in southeast Mindanao) to more than 4 051 mm (Infanta in central
point at Gunung Kinabalu (4 101 m).
Luzon). The rainfall pattern and annual amount are infl uenced mainly
by altitude and wind. The northwest of the Philippines has a dry season
International waters
from November to April and a wet season during the rest of the year
International waters include all of the coastal and marine waters of the
(i.e. the southwest monsoon) (FAO AQUASTAT 2003). The southeast
Sulu Sea and Celebes (Sulawesi) Sea and the smaller adjacent seas, as
receives rainfall all year round, but with a pronounced maximum from
these are all potential sources or recipients of transboundary impacts,
November to January during the northeast monsoon. In the areas not
primarily from shipping, fi sheries and riverine discharges, and the
directly exposed to the winds, rainfall is evenly distributed throughout
transport of waters in ocean currents.
the year, or there are two seasons but not very pronounced; from
November to April, the weather is relatively dry while it is relatively wet
Climate
the rest of the year. The lowest rainfall occurs in the provinces of Cebu,
The region lies within the sub-equatorial and equatorial zones (from
Bohol and Cotabato in the centre of the country. The archipelago lies
latitudes 1-14░ N), with annual rainfall exceeding 1 000 mm in most areas
in the typhoon belt, and many islands are liable to extensive fl ooding
and annual minimum temperatures of more than 20░C, except in the
and damage during the typhoon season from June to December.
highlands. Rainfall is highest on the upland areas, notably of central and
The frequency of typhoons is greater in the northern portion of the
northern Borneo, central Palawan, and central and eastern Mindanao.
archipelago than in the south. Usually, two or three typhoons reach the
These areas receive more than 3 000 mm of rain annually. Some parts of
country each year. The Philippines' annual average run-off is estimated
the lowlands, coastal areas and other areas in rain-shadows receive far
at 444 km3. In 9 years out of 10, the annual run-off exceeds 257 km3
less rain (less than 500 mm per year), and may experience severe water
(FAO AQUASTAT 2003).
shortages. The northern and central parts of the region are aff ected by
revolving tropical storms (typhoons) during the southwest monsoon
Compared with the Philippines, data describing climatic patterns in the
months, bringing intense rains and destructive winds to coastal
Indonesian and Malaysian portions of the region, particularly Sabah and
areas. Passing from the Pacifi c into the South China Sea through the
East Kalimantan, are sparse and, in many cases, inaccessible or diffi
cult to
Philippines Archipelago, typhoons can deliver in excess of 1 000 mm
disaggregate from national statistics. In Indonesia, there are two seasons,
of rain in less than 1 week, causing extensive fl ooding and loss of life
the dry season and the wet season. The dry season lasts from March to
in worst aff ected areas.
August and the wet season from September to March with the heaviest
rainfall usually from November to February. The temperature ranges
The climate of the Philippines is tropical and monsoonal. It is
from 21░ to 33░C, but at higher altitudes the climate is cooler. Humidity
characterised by uniformity of temperature (average temperature
varies between 60 and 80%. Like Indonesia, Malaysia lies entirely within
of 27░C throughout the year), high relative humidity (above 70%
the equatorial zone, and the climate is governed by the regime of the
everywhere throughout the year except in southern Tagalog where it
northeast and southwest monsoons. The northeast monsoon blows
falls to 65% in March/April), low solar radiation, diversity of rainfall and
from October to March, and is responsible for the heavy rains that
REGIONAL DEFINITION
19
frequently cause widespread fl oods during the wettest season in Sabah.
In Malaysia, major river basins in the east tend to be larger than those
The southwest monsoon period occurs between May and September,
on the Malaysian Peninsula. From an annual rainfall volume of 990 km│,
and is a drier period for the whole country. The period between these
360 km│ (36%) are lost through evapotranspiration (FAO AQUASTAT
two monsoons is marked by heavy rainfall. The average temperature
2003).
throughout the year is very stable (26░C), and the mean annual rainfall
is 3 000 mm. Regional variations in temperature and rainfall are mainly
Coastal and marine ecosystems
due to topographic relief. In general, Sabah experiences more rainfall
The Sulu-Celebes (Sulawesi) region lies within the global centre of
(3 000-4 000 mm annually) than the Malaysian Peninsula. The humidity
biodiversity for both terrestrial and marine species with, for example,
is high (80%) due to the high evaporation rate (FAO AQUASTAT 2003).
more than 400 species of reef-building corals and 2 500 species of
marine fi shes present (Chou 1997, Veron 2000). The ecosystems that
River basins and water resources
sustain this rich biodiversity are under severe threat in much of the
According to FAO AQUASTAT (2003) there are more than 300 major
region (e.g. Chia & Kirkman 2000). The coast under the immediate
drainage basins in the region, with the major river systems being:
infl uence of the major river systems is mostly devoid of fringing coral
The Sandakan and other river catchments of Sabah;
reefs, although small fringing and patch reefs are present in some
The Kayan, Ketai, Berau, Sesayan and Sembakung rivers of East
places. Fringing reefs are very well developed away from the major
Kalimantan;
river estuaries. Off shore, series of large platform reefs and atolls are
The Mindanao River and tributaries, the Agusan River and
developed, as exemplifi ed by the Tubbataha reefs of the Sulu Sea. All
tributaries, the Libuganon and Sindangang rivers of Mindanao.
major reef types; fringing, patch, platforms (including `barrier') and atolls
occur, with a total estimated reef area of more than 20 000 km2. As with
There are numerous smaller rivers and streams fl owing from the
the coastal habitats, reefs of the region have been damaged through
mountainous interiors of most of the islands. Much of the protected
destructive fi shing, sedimentation and other forms of human use. Many
coastlines were originally fringed by mangrove forests and seagrass
of the region's reefs are at extremely high risk of further damage from
beds. However, extensive cutting for timber, conversion for aquaculture
human activities (e.g. Bryant et. al. 1998, Burke et al. 2002).
and other forms of coastal development and sedimentation have caused
major fragmentation and reduction in the area of these habitats.
Most of the coastal waters, particularly around the Visayas Islands, are
shallow (less than 200 m deep) and infl uenced by both marine and
In the Philippines as a whole, there are 421 rivers, excluding small
river/terrestrial inputs. By contrast, the central Sulu Sea has depths
mountain streams that sometimes swell to three times their size during
exceeding 4 000 m and the Celebes (Sulawesi) Sea has depths greater
rainy months (FAO AQUASTAT 2003). The rivers are an important means
than 5 000 m. The region receives an infl ux of surface oceanic water
of transportation and a valuable source of water for irrigation for the
from the North Equatorial Current, fl owing into the area from the
fi elds and farms through which they pass. There are also 59 natural lakes
northeast through corridors in the Visayas and northern Mindanao,
and more than 100 000 ha of freshwater swamps. The two principal
with sub-surface fl ow in the opposite direction. Additionally, waters
river basins (more than 5 000 km2) in the Philippines part of the region
from the South China Sea may fl ow seasonally into the Sulu Sea around
are the Mindanao River Basin (23 169 km2) and the Agusan River Basin
the northern coast of Sabah, transporting sediment-laden waters from
(10 921 km2), both on the Island of Mindanao. Overall, only 18 river basins
northwest Sabah (Bate 1999). Surface waters of Sulu-Celebes (Sulawesi)
have an area greater than 1 000 km2: eight of them are on Mindanao,
Sea fl ow south out of the region through the Makassar Strait and
seven on the Island of Luzon, two on Panay and one on Negros. The
also between Sulawesi and Morotai-Halmahera, contributing to the
smallest river basins are frequently under 50 km2.
Indonesian through-fl ow. Local current patterns form complex eddies
and counter-currents, particularly in the vicinity of the Visayas Islands.
Indonesia has over 5 590 rivers, of which only the Mahakam River of
East Kalimantan plays a signifi cant role in the region. Although water
The region forms a Large Marine Ecosystem (LME); comprised of two
resources are abundant, the seasonal and spatial variation in the
large seas, Sulu and Celebes (Sulawesi) and several smaller seas, the
rainfall pattern and the lack of adequate storage create competition
Sibuyan, Visayan and Camotes seas in the northeast and the Bohol
and confl icts among users. Municipal and industrial wastewater is
Sea further south between Bohol and Mindanao. There is a deeper
discharged virtually untreated into the waterways causing rapid
area (>3 000 m) and a chain of islands known as the Sulu Archipelago,
deterioration in the quality of river water (FAO AQUASTAT 2003).
separating the two seas. These seas can be characterised as `marginal
20
GIWA REGIONAL ASSESSMENT 56 SULUCELEBES SULAWESI SEA
seas', being mostly enclosed by island landmasses, and with oceanic
National Marine Protected areas (65)
input as through-fl ow from the Pacifi c in corridors among the Visayas
Luzon
International Marine Protected areas (1)
and between Mindanao and Sulawesi. The Sulu-Celebes Sea LME has an
area of about 900 000 km2 (LME 2003). The Sulu Sea's surface currents
Mindoro SIBUYAN SEA
come from the south in the summer, whereas the winter currents follow
Samar
Calamian
VISAYAN SEA
a counter-clockwise gyre. The Celebes Sea's strong currents, its deep
Philippines
sea trenches, seamounts and active volcanic islands result in a complex
Visayan islands
n
oceanography. For more information see Annex V.
lawa Tubbataha Reef Marine Park
Pa
BOHOL SEA
Protected areas
Mindanao
S
U
L
U
S
E
A
The Philippines, Indonesia and Malaysia have legally designated
protected areas including coastal and marine habitats. The Philippines
Turtle Islands
has gazetted 19 terrestrial protected areas (IUCN Categories I-V)
Sulu Archipelago
Sabah
covering an area of 1 454 000 ha, representing some 4.8% of the total
(Malaysia)
land area of 300 000 km2. The Philippines also has 159 gazetted Marine
Protected Areas (MPAs) (areas unknown), two biosphere reserves
East Kalimantan
C
E
L
E
B
E
S
S
E
A
(1 174 000 ha), two World Heritage sites (53 000 ha) and 4 wetlands
(Indonesia)
Bunaken
of international importance (68 000 ha) (WRI 2003). Indonesia has
gazetted 331 terrestrial protected areas covering some 19 253 000 ha
Sulawesi (Indonesia)
MAKASSAR
and representing about 10% of total land area of 1.8 million km2.
STRAIT
Indonesia also has 102 gazetted MPAs (areas unknown), fi ve biosphere
reserves (1 329 000 ha), three World Heritage sites (2 845 000 ha) and
® GIWA 2004
Figure 2
International and national marine protected areas in
two wetlands of international importance (Ramsar sites) (243 000 ha).
the Sulu-Celebes (Sulawesi) region.
Malaysia has gazetted more than 150 terrestrial and marine parks. The
(Source: UNEP/WCMC 2003)
terrestrial parks cover more than 1 500 000 ha, representing more than
5% of the land area of 329 800 km2. Areas of MPAs are unknown. Malaysia
for conservation of marine turtles, with the establishment of the
also has one wetland of international importance.
Turtle Island protected area. This agreement represents one of very
few examples of transboundary management between these two
In total, there are more than 200 MPAs in the region of which 66 are
neighbouring countries. At the largest spatial scale, the entire coastal
indicated in Figure 2. Many of the MPAs contain coral reefs (Spalding
and sea area between Malaysian Sabah, Indonesian East Kalimantan
et al. 2001, Cheung et al. 2002), although the eff ectiveness of many
and the Philippines is recognised as a special management area; Sulu-
MPAs is limited at present by insuffi
cient resources for management
Sulawesi Marine Ecoregion (SSME) by WWF, ranked as one of their top
and enforcement of regulations. The Tubbataha Reef Marine Park is a
four global priority sites (number one in Asia-Pacifi c) (Trono, Miclat pers.
World Heritage site in the Sulu Sea, comprising some 33 200 ha and
comm.) for coastal and marine management).
situated inside the Palawan Man and Biosphere Reserve (1 150 000 ha).
The Tubbataha Marine Park is a unique example of an atoll with high
diversity and density of tropical marine biota, is among the most
biologically diverse coral reef system in the Philippines, and is of
Socio-economic characteristics
great importance for maintenance and replenishment of harvested
species in the greater Sulu Sea. The reef areas around Bunaken and
Large gaps remain in reliable socio-economic data at the scale of
Manado in North Sulawesi are also recognised as being of exceptional
the region. This is in part because of the inherent inaccuracies in
conservation value, and the area also supports a recently discovered
disaggregating the more readily available national statistics to the
population of a second species of the `living fossil' fi sh Coelacanth
smaller Philippines, Indonesian and Malaysian components of the
(Latimeria manadoensis) (Erdmann et al. 1999). Indonesia has established
region, in part because of government restrictions on data access, which
the marine protected area Bunaken National Park and Nature Reserve.
is compounded by the transboundary nature of the area, and in part
The Philippines and Malaysia have established bi-national agreements
because of the lack of accurate census information from the widespread
REGIONAL DEFINITION
21
Table 2
Population in the Sulu Celebes Sea region.
Population in the country(million)
Population in the
Annual population growth (%)
Population density
Country
region
(inhab./km2)
1997
2003
(million)
1999
2001
2003
Indonesia
198.2
214.5
7.0
1.34
1.31
1.29 105
Malaysia
21.7
24.8
<2.0
2.36 2.26
1.91
63
Philippines
71.5
81.5
25
2.30
2.18
1.93
231
(Source: ORNL 2003, World Bank 2003a, 2003b, 2004)
human populations. Where possible, data specifi c to the area of each
Population density
country comprising the region has been made. However, in cases where
(persons/km2)
Luzon
this was not feasible, national statistics have been provided as a guide.
<1
1 - 2
3 -5
Mindoro SIBUYAN SEA
The region's human population is represented by ethnic groups of
6 - 10
Samar
Calamian
three nations: Philippines, Malaysia (Sabah) and Indonesia (North
VISAYAN SEA
11 - 100
Sulawesi and East Kalimantan) and is comprised predominantly of
>100
Visayan islands
peoples of Indo-Malay origin. Peoples of other ethnic origins are also
Philippines
an
law
present, some forming ancestral tribal groups, particularly in Borneo,
Pa
S
U
L
U
S
E
A
others of more recent arrival (e.g. Chinese and Indian traders). Within
BOHOL SEA
Mindanao
these broad ethnic groups, there are substantial cultural diff erences
and various forms of religious belief, principally Christianity and
Islam. The Philippines is mostly Christian (Roman Catholic) with the
Sulu Archipelago
exception of areas in Mindanao, which practice Islam. Indonesia and
Sabah
(Malaysia)
Malaysia are mostly Islamic. There is a broad acceptance of diff erent
religious viewpoints in parts of the region, although racial, cultural and
C
E
L
E
B
E
S
S
E
A
East Kalimantan
religious tensions have been building in recent times, concomitant
(Indonesia)
with the economic diffi
culties of the late 1990s. For example, southern
Mindanao has an Islamic separatist movement, the MNLF/MILF, that has
Sulawesi (Indonesia)
been involved in civil and political instability in the area.
MAKASSAR
STRAIT
Population
® GIWA 2004
In the Philippines in 1996, the total population was estimated at
Figure 3
Population density in the Sulu-Celebes (Sulawesi) region.
(Source: ORNL 2003)
69.3 million (45% rural). This had risen to 81.5 million in 2003 (World Bank
2003a, 2004). The average population density is 231 inhabitants/km2 and
the average annual population growth in 2003 was 1.9%. In Indonesia in
the 1980s, but the rate has since slowed to the current 1.9% (World
1997, the total population was about 198.2 million people (63.6% rural),
Bank 2004). Table 2 shows some population characterstics of the Sulu-
rising to 214.5 million in 2003, with a growth rate of 1.3% (World Bank
Celebes (Sulawesi) region and Figure 3 shows the population density
2003a, 2004). The average population density was 105 inhabitants/km2.
The population is unevenly distributed with about 60% living on the
Disaggregation of the national statistics suggests that the total
Island of Java (outside the region) and another 20% of the population
population of the region is approximately 34 million, of which about
live on the Island of Sumatra (also outside the region). In Malaysia in
75% are in the Philippines (25 million), 21% in Indonesia (7 million in East
1996, the population was estimated at 20.58 million inhabitants (45.5%
Kalimantan and North Sulawesi) and 4% are in Malaysian Sabah (less
rural), increasing to 24.77 million in 2003 (World Bank 2003a, 2004).
than 2 million) (WWF 2001, ORNL 2003). The population is distributed
The population is concentrated along the west coast of the Malaysian
in the larger urban settlements and throughout hundreds of villages
Peninsula and in the capital city, Kuala Lumpur (outside the region).
spread along the coast, across the lowlands and into the highlands.
The average population density in Malaysia is 63 inhabitants/km2.
The larger urban centres include Davao City (> 2 million and the
The Malaysian population grew at an average annual rate of 2.8% in
administrative and commercial hub of Mindanao), Zamboanga City
22
GIWA REGIONAL ASSESSMENT 56 SULUCELEBES SULAWESI SEA
(more than 2 million, West Mindanao), Manado (North Sulawesi),
Land cover
Sandakan (Sabah), Puerto Princesa (less than 1 million, Palawan), Cebu
Forest
Luzon
City (Cebu), Bacolod City (Negros), Iloilo City (Panay), Tacloban City
Shrubland
(Leyte) and Naga City (southeast Luzon).
Savannah
Mindoro SIBUYAN SEA
Cropland
Samar
Calamian
Populations are increasing at between 1.3 to 1.9% annually and Sabah is
Urban®ar
eas
VISAYAN SEA
Water®bodies
also experiencing substantial immigration, of the order of 4% annually.
Visayan islands
Peat®swamp
An annual growth rate of 5.3% is occurring in the Malaysian part of the
n
Philippines
lawa
region, due to immigration from Indonesia and the Philippines (WWF
Pa
S
U
L
U
S
E
A
BOHOL SEA
2001), through a previous bi-lateral transmigration project developed to
Mindanao
ease population pressures in Indonesian Java. There is also substantial
emigration to overseas countries, but much of this is for extended work
periods (1-5 years), rather than as permanent migration. It is predicted
Sulu Archipelago
that the population of the region will double by 2035. Many of the
Sabah
(Malaysia)
region's people live in poverty, with the poverty rate for the Philippines
estimated at 36.8%, but with illiteracy declining from 6 to 5% from 1997
C
E
L
E
B
E
S
S
E
A
East Kalimantan
to 2001 (World Bank 2003b). Illiteracy rates are higher in Indonesia and
(Indonesia)
Malaysia (both at 12% in 2001).
Sulawesi (Indonesia)
Economic activities
MAKASSAR
STRAIT
®GIWA®2004
The region supports a full gamut of economic activities, from subsistence
Figure 4
Land cover in the Sulu-Celebes (Sulawesi) region.
agriculture and artisanal fi sheries to high technology industries. Rapid
(Source: based on USGS 2002)
economic expansion during the 1980s has slowed recently, and GDP
and economic growth for the three nations has declined and stabilised
over the past several years (Table 3). Subsistence farming and fi shing
need to fi sh in order to survive. Population pressure in the local fi shing
are the major activities of large numbers of people outside of the main
communities, poverty, and a lack of economic alternatives all contribute
urban centres (LME 2003). The coastal areas of the Sulu-Celebes Sea,
to the problem. The resources of the sea are a source of hard currency
while serving as important spawning grounds for the entire region, also
for the debt-burdened government. Other economic activities in
provide a livelihood for the fi shing communities crowding its shores.
the region are oil and gas production from off shore areas as well as
The uncontrolled exploitation is wrecking the habitats and at the same
tourism. Tourism increases every year and contributes both to the local
time, it is asking a lot to close these areas to fi shing when communities
and to the national economy. Figure 4 shows the land cover in the Sulu-
Celebes (Sulawesi) region.
Table 3
The GDP and economic growth of each of the three
countries that share the Sulu-Celebes (Sulawesi) region.
Agriculture
1999
2001
2003
In the Philippines, agriculture is the prime mover of the country's
economy, being at present the least import-dependent activity. From
Indonesia
1988 to 1990, the agriculture sector's contribution to GNP fl uctuated
GDP (billion USD)
140 000
141 254
208 310
around 17%. It provided about 30% of GDP and generated more than
GDP growth (%)
0.79
3.44
4.12
60% of total export earnings. Between 1997 and 2001, the agriculture
Malaysia
sector's contribution to the GDP ranged from 18.9 to 15.2%. It employed
GDP ( billion USD)
79 148
87 976
103 161
about 41.5% of the labour force in 1996. The total cultivated area is
GDP growth (%)
6.14
0.30
5.2
estimated at 9.5 million ha, of which 56% is used for annual crops. The
Philippines
average farm size is 2.2 ha (FAO AQUASTAT 2003).
GDP (million USD)
76 157
72 043
80 574
GDP growth (%)
3.40
2.96
4.52
In Indonesia, agricultural crop production and livestock contribute
(Source: World Bank 2004)
approximately 18% of GDP. The agriculture sector provides employment
REGIONAL DEFINITION
23
for 49% of the population. In 1995, the total cultivated area was estimated
to be 35.5 million ha (FAO AQUASTAT 2003). Of the cultivated area,
13.8 million ha were under permanent crops such as rubber, coconut,
coff ee, cocoa and palm oil. Annual crops such as rice, maize, soybean,
sugar cane and tobacco were grown on 21.7 million ha. Farm-holdings
in Indonesia are relatively small: 34% are less than 0.25 ha and a further
25% are between 0.25 and 0.5 ha. In total, the contribution to the GDP
from agriculture in Indonesia averaged approximately 16-17% from 1997
to 2001 (FAO AQUASTAT 2003).
In Malaysia, the contribution of agriculture to GDP has progressively
declined from 18.7% in 1990 to 13.6% in 1995, 11% in 1997 and to 8.5%
in 2001. In 1995, the agriculture sector contributed 19.1% of export
earnings. Palm oil, rubber and saw logs accounted for more than
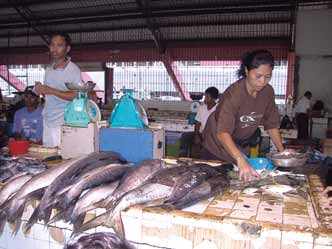
Figure 5
Fish market in Sandakan, Malaysia.
58% of total agricultural exports. In 1996, the total arable area was
(Photo: S. Palaniappan, ReefBase)
14.17 million ha, or 43% of the total land area. About 5.1 million ha,
or 36%, was cultivated. Permanent crops occupied 91% of this
expanding international, national, and local markets. Live reef fi sh export
cultivated area, while the remaining 9% (445 700 ha) was under annual
operations to Hong Kong and the Chinese mainland have burgeoned
crops, mainly rice. The agriculture sector is divided into large-scale
since the 1980s, with removal of large numbers (totalling thousands of
plantations concentrating on three crops (rubber, palm oil and cocoa),
tonnes) of demersal coral reef fi shes, mostly through poison fi shing,
and smallholders who constitute the majority of the farming population
initially using cyanide but more recently using locally-produced and
(FAO AQUASTAT 2003).
inexpensive vegetable poisons.
Fisheries
Destructive fi shing activities, such as dynamite and poison fi shing,
The Philippines, Indonesia and Malaysia obtain 60-70% of their animal
are widespread and have caused severe damage (Cabanban 1998).
protein from marine fi shes (McManus 2000). In the Indonesian areas
Benthic trawling occurs in close proximity to coral reefs, with adverse
of the region in 1998, there were more than 43 000 boats operating in
direct eff ects on reef community structure. Trawl fi shermen now retain
North Sulawesi and more than 26 000 in East Kalimantan alone (Kahn
virtually all the catch, and so by-catch and discards are no longer an
& Fauzi 2001). In North Sulawesi, dominant gear types were hook
issue. Collecting of ornamental reef fi shes and other organisms for the
and line (77%), gill nets (16%), and lift nets (2.4%). By contrast, in East
global aquarium market is also widespread and continues to expand in
Kalimantan, gill nets are more widely used (46%), with traps (15%) and
the region, and has already caused serious damage to reefs, through use
lift nets (14%). The marine fi shery of the region contributes signifi cantly
of destructive techniques of poison fi shing and/or coral breakage.
to the economies of Indonesia and the Philippines, and to a lesser extent
to Malaysia. In Indonesia for example, the estimated contribution of
There have been massive increases in aquaculture in all three nations,
fi sheries sector to the national GDP is about 2%. However, a signifi cant
notably mariculture, mostly of shrimps (and to a lesser extent reef fi sh
proportion of total catch is illegal and unreported. Indonesia's relevant
and lobster) in coastal ponds, and also Tilapia in lakes and inland waters.
government minister Sarwono recently suggested that the losses in
This supplies increasing local demand and the live fi sh trade to Hong
revenue suff ered by the Indonesian economy as a result of poaching of
Kong, China and Japan. At present, fi sh mariculture is largely dependent
fi sh by foreign fi shers may exceed 4 billion USD. In North Sulawesi, the
on capture of wild stocks for grow-out, although hatcheries are being
total volume of export fi shery products in 1997 was some 50 000 tonnes
developed.
(worth around 70 million USD), increasing in 1998 to more than
81 000 tonnes (worth around 76 million USD) (Kahn & Fauzi 2001).
Forestry
Forestry is also a major industry in parts of East Kalimantan and Sabah,
Reef fi sheries provide essential sustenance to artisanal fi sherman and
and less so in the Philippines, where much of the harvestable forests
their families throughout the region, and also play an important role in
have already been exploited or are now protected. Much of the land
supplying commercial quantities of high value products for export to
area of the region was originally covered by tropical forest. However,
24
GIWA REGIONAL ASSESSMENT 56 SULUCELEBES SULAWESI SEA
substantial deforestation has taken place since the colonial era and, with
Governance
some notable exceptions (e.g. Palawan, Philippines) (Annexes III and IV),
The region has various forms of traditional land-ownership customs
continuing logging is further reducing the original forest cover. Fertile
and systems of natural resource use. Recently, the three nations
lowlands and hill areas have been extensively developed for rice
have taken steps at local, community, provincial and national levels,
production, as rice paddies and upland terraces. Lowland areas and
including implementation of legislation, to provide a modern
river fl ood plains also support mixed agriculture. Overall, this has
framework for sustainable resource management (Chua pers. comm.)
resulted in alteration to some 80% of the original vegetation cover in
(Annexes III and IV). With their neighbours, the three nations form part of
the Philippines (e.g. Burke et al. 2002). The Philippines has in total just
the Association of South East Asian Nations (ASEAN), with strong multi-
58 000 km2 of forests remaining, with an annual deforestation rate of
lateral links at political and trade levels. The nations are all constitutional
1.4% (1990-2000). In total, Indonesia and Malaysia have 1 million km2
democracies. In the Philippines, the President is elected for three-year
and 192 800 km2 of forests remaining respectively, and deforestation
terms and based in Manila. The Philippines has a three-tiered system of
of 1.2% (World Bank 2003a).
government, with national, provincial and local levels. In total there are
52 provinces defi ned by cultural aspects, population and location.
Exports
In the region generally, the major export earners include: commercial
Malaysia is a federal country, divided into 13 states plus the federal
exploitation of natural resources; particularly fi sheries, aquaculture;
territories of Kuala Lumpur and Labuan Island. The Prime Minister
mariculture; palm oil and other forms of plantation agriculture; and
is elected for four-year terms and is based in Kuala Lumpur on the
mining. The value added to GDP from exports in the Philippines averaged
Malaysian Peninsula. Malaysia has a three-tiered system of government,
49% from 1997-2001, and ranged from 28% to 42% in Indonesia. Much of
with national, state and local levels. The state of Sabah is governed from
the exports (and imports) are transported by ship. The Makassar Strait and
Kota Kinabalu on the west coast of the Island of Borneo, outside the
Celebes (Sulawesi) Sea is a major oil tanker route (the ULCC - Ultra Large
regional boundary.
Crude Carriers - route) between Japan and the greater Pacifi c Ocean and
the Indian Ocean, west Asia and Europe, with associated risks of collisions
In the Republic of Indonesia, the President is elected for fi ve-year terms
and spills (Etkin 1997, MPP-EAS 1998).
and is based in Jakarta. Indonesia also has a three-tiered system of
government, with national, provincial and local levels. East Kalimantan
Industries
province is governed from Balikpapan on the southeast coast outside
The industries involve mostly resource processing and light
the regional boundary, while North Sulawesi province is governed from
manufacturing, and are of growing importance. The total value added
Manado, within the region.
to GDP from the industrial sector in 2003 was 32% in the Philippines,
44% in Indonesia and 49% in Malaysia (Table 4) (World Bank 2004).
None of the three national capitals or major political centres is located
Service industries, including tourism, were expanding during the
within the region, and much of the political life is focused in the
1990s and make a substantial contribution to GDP. Tourism has been
provinces, cities, towns and villages. In the Philippine portion of the
increasing at 5% annually from 1987-1995 in the Philippines. However,
region, major urban centres include Davao City and Zamboanga City
tourist kidnap and murder, and growing civil unrest in Mindanao and
(Mindanao), Cebu City (Cebu), Peurto Princesa (Palawan), Batangas City
also in Indonesia have caused a recent major decline in international
and Lucena (Luzon), Bacalod and Daumagete City (Negros) and Iloilo
tourism. This is expected to be exacerbated over the next few years by
(Panay). In the Indonesian section, the major urban centres are Manado
the unstable global situation.
(North Sulawesi) and Tarakan (East Kalimantan). In Sabah the major
centre is Sandakan. For more information on the institutions involved
Table 4
Total added value to GDP from the agricultural,
in the water resources management see Box 1.
industrial and service sectors.
Agriculture
Industry
Services etc.
Irrigation and drainage development
Country
(% of GDP)
(% of GDP)
(% of GDP)
According to FAO AQUASTAT (2003), the irrigation potential in the
1999
2003
1999
2003
1999
2003
Philippines was estimated at 3.1 million ha in 1990. It corresponds to the
Indonesia
20
17
43
44
37
40
area where irrigation facilities can easily be provided by the Department
Malaysia
11
9
46
49
43
42
of Agriculture (NIA).
Philippines
17
14
31
32
52
53
(Source: World Bank 2004)
REGIONAL DEFINITION
25
Box 1
Institutions involved in water resources management in the Sulu-Celebes (Sulawesi) region.
Philippines
Indonesia
Malaysia
In the Philippines, the 1976 Water Code of - The Philippine Atmospheric, Geophysical In Indonesia, the 1945 constitution de- In Malaysia, the responsibility for water re-
the Philippines revised and consolidated the
and Astronomical Services Administration clared national water and land resources sources planning and development is shared
laws governing the ownership, appropria-
(PAGASA), which conducts monitoring, to be controlled by the State and that they by various government agencies. Malaysia
tion, utilisation, exploitation, development,
data gathering and maintenance of should be utilised in an equitable manner has no single water resources authority for an
conservation and protection of water re-
information on rainfall and evaporation;
for the benefit of the people. The respon- overall coordinated planning and integrated
sources which are subject to government
sibilities for the development and man-
- The National Power Corporation (NPC),
river management approach, and water sup-
control and regulation through the National
agement of water resources and irrigation
which conducts water resources monitor-
ply is undertaken by government agencies
Water Resources Council (NRWC). The NRWC
schemes are specified in laws, presidential
ing, research and hydropower genera-
and privatised water companies. The cover-
divided the country into 12 water resources
instructions and government regulations.
tion;
age for water supply is 99% for urban areas
regions in order to have manageable units
The most important are:
and 77% in the rural areas. The Department
for comprehensive planning of water re- - The Bureau of Research and Standards - Presidential Instruction No. 1 (1969), on of Irrigation and Drainage (DID), under the
sources. In this regionalisation, the major
(BRS) of the DPWH, which is engaged in
the management of irrigation water and Ministry of Agriculture, is responsible for the
considerations were hydrological boundar-
monitoring and studies of water resources
maintenance of irrigation networks;
planning, implementing and operation of ir-
ies defined by physiographic features and
as well as water research and quality stan-
rigation, drainage and flood control projects
dards. The DPWH is also responsible for - The law on water resources development
homogeneity in climate of the different
throughout the country. The Department of
flood control.
No. 11 (1974);
parts of the country. Nonetheless, the water
Agriculture (DOA) is responsible for provid-
resources regions generally correspond to (iii) In irrigation:
- The government regulations on: ben- ing advice and extension services to the
the existing political regions in the coun-
eficiaries contribution for maintenance farmers.
- The Bureau of Soils and Water Manage-
try. Minor deviations dictated basically by
cost of water resources facilities No. 6
ment (BSWM) of the Department of
In the water supply sector, the Public Works
hydrography affected only northern Luzon
(1981); water management No. 6 (1982);
Agriculture, which handles, through its
Department (PWD), under the Ministry of
(outside the region) and northern Mindanao.
irrigation No. 23 (1982); rivers (1991); and
Project Management Office (PMO), the
Public Works, is responsible for the plan-
The NWRC coordinates the activities of the
swamps (1991);
construction and maintenance of Small
ning, implementation and operation of urban
different agencies involved in the water sec-
Water Impounding Management (SWIM) - The Decree of the Minister of Mining water supply projects. However, in line with
tor: irrigation, hydropower, flood control,
projects;
and Energy concerning underground the Government's privatisation policy, many
navigation, pollution, water supply, waste
water resources management (1983).
water supply projects have already been
disposal, watershed management, etc.
- The National Irrigation Administration
taken over by water supply companies or
(NIA) of the Department of Agriculture, Numerous institutions are presently involved
The others main agencies in the Philippines
privatised. The Ministry of Health (MOH)
which was created in 1974 with the in water resources management. Their tasks
involved in water resources management
provides untreated but drinkable water to
mandate to initiate an `irrigation age'. Its and responsibilities are clearly stated in
are:
rural communities not served by the local
tasks include the development, operation national legislation:
(i) In water supply and wastewater:
water authorities. The MOH also monitors
and maintenance of irrigation systems - The Ministry of Public Works, with its water quality at water treatment plant in-
- The Metropolitan Waterworks and Sewer-
throughout the country. In particular, it
Directorate General of Water Resources takes as well as the quality of water within
age System (MWSS) of the Department
has been responsible for the construction
Development, is responsible for plan- the distribution system for compliance with
of Public Works and Highways (DPWH),
of National Irrigation Systems (NIS), and
ning, design, construction, equipment, national drinking water standards.
which is responsible for water supply,
is now responsible for the recovery of
operations and maintenance, and guid-
storage, treatment, research, design,
irrigation fees.
The control of water pollution is the respon-
ance in water resources development;
construction and maintenance of
sibility of the Department of Environment
The SWIM projects have been implemented - The Ministry of Forestry is responsible
water supply and sewage systems in
(DOE), which is empowered to enforce
by the Philippines Government to mitigate
for catchment area development;
the national capital region and outly-
compliance with effluent standards for
damage brought about by insufficient water - The Ministry of Environment is re-
ing service areas in nearby provinces;
point sources of pollution. The Ministry of
supply during the dry season and the fre-
sponsible for environmental quality Housing and Local Government is respon-
- The Local Water Utilities Administration quent floods during the rainy season. The
development and management;
sible for compliance with regulations and
(LWUA) of the Department of Public objectives might differ from one project
standards on sewerage works which have
to another, and the following agencies are - The Environmental Impact Management
Works and Highways (DPWH), which
been privatised to a national sewerage com-
involved: the DPWH, for water supply, inland
Agency is responsible for environmental
is responsible for the development and
pany. Although either directly or indirectly
fishing and mini-hydropower; the NIA, for
impact control.
improvement of water and sewerage
much legislation touches on water resources,
systems in areas not covered by the irrigation; the Forest Management Bureau
most of the existing laws are considered out-
MWSS.
(FMB), for watershed management with an
dated. The Water Act of 1920 is inadequate
incidental purpose of flood control; and the
(ii) In water resources monitoring and
for dealing with the current complex issues
National Electrification Administration
development:
related to water abstraction, pollution and
(NEA), for mini-hydropower generation .
river basin management.
(Source: Excerpted from FAO AQUASTAT 2003)
Irrigation development in the Philippines was undertaken by rural
(High Yielding Varieties), particularly for rice. The main irrigated crop
communities (Banawe terraces, cooperative irrigation societies (zinjara)
is rice, which is cultivated throughout the Philippines during the wet
and lowland schemes near Manila) in earlier centuries. However, the
season and in some areas during the dry season when other crops with
major irrigation investment periods have been the 1920s, the post-war
higher added value are also grown. In 1992, almost 45% of the total rice
period, and the 1970s and early 1980s when public involvement in the
harvested area was irrigated, generating about 57% of output. The yields
irrigation sub-sector was at its maximum. In this respect, the creation
are much lower (30-40%) in the communal schemes than in the national
of the NIA in 1964 has been decisive. In 1992, the area of land equipped
schemes, because the water supplies are more uncertain in the small
for full/partial control irrigation was estimated at 1 532 751 ha (FAO
catchment areas where communal schemes are located. On average,
AQUASTAT 2003). Irrigation water is generally supplied by river diversion.
the 1992 yield for irrigated rice was estimated at 3.34 tonnes/ha/season,
There are three types of irrigation systems in the Philippines: national
which was 2.9 times the average yield of irrigated rice in 1961. For rain-
irrigation systems (NIS), communal irrigation systems (CIS) and private
fed rice, the 1992 average yield was estimated at 2.07 tonnes/ha, which
schemes. The development of irrigation has resulted in substantial
is twice the 1961 average yield (FAO AQUASTAT 2003).
increases in crop yields, as it has coincided with the introduction of HYVs
26
GIWA REGIONAL ASSESSMENT 56 SULUCELEBES SULAWESI SEA
In Indonesia, the development of community irrigation systems started
In Malaysia, the area that could potentially be irrigated accounts for
more than 2 000 years ago. Modern irrigation systems were introduced
about 413 700 ha. Irrigation development dates back to the end of the
in the middle of the 19th century. In 1969, with the launching of the fi ve
18th century. The Kerian irrigation schemes were the fi rst large schemes
year development plan (Repelita), the Government started a major
to be constructed in 1892. Since the formation of the Department of
programme in irrigation development which included:
Irrigation and Drainage in 1932, irrigated areas for rice cultivation have
Rehabilitation of existing irrigation works;
progressively increased. By 1960, about 200 000 ha had been developed,
Expansion of service areas in existing schemes;
the emphasis then being on supplementing rainfall for single crop
Construction of new irrigation systems;
cultivation. During the 1960s and early 1970s, the introduction of
Upgrading of semi-technical irrigation systems to technical level;
double cropping of rice required the development of adequate water
Introduction of special maintenance to upgrade the physical
resources for the second cropping season. During the 1980s, the priority
infrastructure;
for irrigation took on a new dimension with the need to rationalise rice
Implementation of effi cient operations and maintenance for
cultivation and increase its productivity. The Government developed
launching sustainable operations and maintenance programmes;
a policy to concentrate eff orts in irrigation development in eight large
A credit programme;
irrigated areas, designated as granary areas of the country and totalling
Strengthening of Water Users Associations (WUA).
210 500 ha (FAO AQUASTAT 2003).
In the fi rst 25 years of development, spanning fi ve Repelitas (1969-1993),
Malaysia has over 932 irrigation schemes covering an area of 340 633 ha,
termed `Pembangunan Jangka Panjang I' (PJP I), or fi rst phase of long-
comprising the eight granary schemes (210 500 ha), 74 mini-granary
term development, water resources policies were directed to support
schemes (29 500 ha) and 850 non-granary schemes (100 633 ha). The
the development of diff erent sectors with the primary emphasis being
non-granary schemes are scattered all over the country and their size
on agriculture. During PJP I, about 1.44 million ha were provided with new
varies between 50 and 200 ha. In addition, there are 21 967 ha which
irrigation systems, whilst 3.36 million ha of existing irrigation systems were
are inundation and control drainage schemes (1994 estimates). The total
rehabilitated or upgraded through special maintenance. The success of
irrigation area was estimated at 362 600 ha in 1994.
this development is demonstrated by the country having achieved food
self-suffi
ciency, particularly in rice, since 1984. Another result of Indonesia's
Irrigation is predominately for rice cultivation and to a minor extent
development was the reduction of poverty from 44% of the population
for vegetables and cash crops. Rice cultivation is mostly carried out by
(54 million people) in 1969 to 13% (26 million people) in 1993.
individual farmers working on small plots of about 1-1.5 ha. Irrigation
facilities for double cropping are mainly focused on the eight main
Indonesia has now embarked on the second 25 year development
granary schemes and the 74 mini-granary schemes, with an average
period (1994-2019), termed PJP II, which started in April 1993 with
cropping intensity of 150%. The current irrigation effi
ciency is around
Repelita VI. Here the emphasis is on sustainable development and
35-45% with a water productivity index for rice of about 0.2 kg/m│.
management of water resources. Water resources have now been
The average yield for irrigated rice was 4 tonnes/ha in 1995. In the
elevated to a full sector level and policies are directed to promoting
major irrigation schemes, fl ooding irrigation is practised on rice fi elds,
a more eff ective and effi
cient management of water resources in an
and the water depth is controlled individually by the farmers. Major
integrated manner. Greater emphasis is placed on sustaining self-
irrigation schemes are designed with proper farm roads to cater for
suffi
ciency in rice and on the operations and maintenance of water
farm mechanisation especially for ploughing and harvesting. Most of
resources infrastructure. In addition, the Government is implementing
the irrigation schemes are provided with separate drainage facilities.
a crash programme in Repelita VI to improve 1.0 million ha of village
The issues of salinity, waterlogging and water-borne diseases are not
irrigation systems and to develop a 600 000 ha rice estate by swamp
reported as being signifi cant. Farmers pay nominal irrigation charges
reclamation in central Kalimantan (FAO AQUASTAT 2003).
which vary from 3 to 15 USD/ha/year. It is estimated that fees collected
In total, Indonesia has an estimated 39.0 million ha of coastal and inland
from farmers cover only 10-12% of the actual operational cost. The
swamps. The extent of arable swampland has not been assessed in
Government does not seek full cost recovery because the farming
detail but is estimated to be 7.5 million ha. In 1996, the tidal and
community is considered a low income group. A total of 917 million USD
non-tidal swamp area used for irrigation (mainly for rice) was about
have been spent on irrigation development by the Government since
1.18 million ha (FAO AQUASTAT 2003).
1970 (FAO AQUASTAT 2003).
REGIONAL DEFINITION
27
The long-term objectives of irrigation development are:
The Global Environment Facility (GEF) and United Nations Development
To provide infrastructure for 74 secondary granary areas in order to
Programme (UNDP) has funded a PDF-A for development of a
raise the cropping intensity from 120% to 170% by 2010;
Transboundary Diagnostic Analysis (TDA) and preliminary framework
To provide infrastructure for the main granary areas in order to raise
of a Strategic Action Programme (SAP) for the Sulu-Celebes Large
the cropping intensity from 160% to 180% by 2010;
Marine Ecosystem (also see Annexes III and V). Notably, the International
To convert 120 small rice schemes to other crops by 2010;
Waters grant proposal for Sulu-Sulawesi Sea has not received support
To develop 20 small reservoirs, 100 groundwater tube-wells and four
at present, at least in part because of diffi
culties in gaining tri-
dams by 2010 in order to provide reliable irrigation by introducing
lateral government support, and considerable challenges remain in
new technologies and modern management to increase crop
engendering and coordinating government support among the three
production.
nations and across the diff erent levels - national, provincial, and local.
There is, however, increasing regional capacity for science and policy
In 1994, the total drained area in Malaysia was 940 633 ha. About
development and conservation measures, including the establishment
600 000 ha were drained for oil palm cultivation, using public funding
and management of protected areas. A developing `critical mass' of
for smallholders.
regional expertise now resides in inter-government and government
agencies such as:
International treaties and conventions
United Nations Environment Programmes (UNEP) Regional Seas
The Philippines, Indonesia and Malaysia are signatory to most of the key
programme;
international conventions and have enacted various national laws and
United Nations Educational Scientifi c and Cultural Organization -
regulations that are relevant to water-related issues in the region (see
Intergovernmental Oceanographic Commission - Sub-Commission
Annex IV for details). For example, the three nations have ratifi ed the:
for the Western Pacifi c (UNESCO/IOC/WESTPAC);
Conservation on Biological Diversity (CBD);
GEF/UNDP/IMO Regional Programme on Partnerships in
Convention on International Trade in Endangered Species (CITES);
Environmental Management for the Seas of East Asia (PEMSEA);
Ramsar wetlands convention;
Indonesia's Environmental Impact Management Agency
United Nations Framework Convention on Climate Change
(BAPEDAL);
(UNFCCC);
Department of Environment and Natural Resources, Philippines
World Heritage Convention.
(DENR);
Research and Development Centre for Oceanography, Indonesian
The Philippines and Malaysia have also ratifi ed the UN Convention
Institute of Science.
on the Law of the Sea (UNCLOS). The three nations have sovereign
rights to the 12 nautical mile limit and have also declared the 200 mile
Considerable expertise also resides in academic institutions and NGOs,
Exclusive Economic Zone (EEZ). The Philippines and Indonesia
including:
unilaterally use the `Archipelagic Doctrine' to defi ne their territorial
The Marine Science Institute of the University of the Philippines;
waters. Several government sectors concerned with use of natural
University of the Philippines Visayas, College of Fisheries;
resources have proposed policies or legislation relevant to obligations
University of Malaysia, Sabah (Borneo Marine Research Unit);
under the various international conventions. However, it is apparent
Coastal Management Center, Philippines;
that despite the ratifi cations, there has been little progress to date
World Wide Fund for Nature (WWF);
in implementation and the resolution of related problems. This has
The Nature Conservancy (TNC);
been attributed to the lack of action by the various governments
Conservation International (CI).
in addressing their obligations under the conventions. A recently
developed `Environmental Strategy for the Seas of East Asia' provides
many pertinent recommendations and solutions to these problems
(Chua pers. comm.) (Annex III).
28
GIWA REGIONAL ASSESSMENT 56 SULUCELEBES SULAWESI SEA
Assessment
Table 5
Scoring table for the Sulu-Celebes (Sulawesi) region.
This section presents the results of the assessment of the impacts
Assessment of GIWA concerns and issues according
The arrow indicates the likely
of each of the fi ve predefi ned GIWA concerns i.e. Freshwater
to scoring criteria (see Methodology chapter).
direction of future changes.
T
T
C
C
Increased impact
shortage, Pollution, Habitat and community modifi cation,
A
A
0 No
known
impact
2 Moderate
impact
IMP
IMP
T
T
No changes
C
C
Unsustainable exploitation of fi sh and other living resources,
A
A
1 Slight
impact
3 Severe
impact
IMP
IMP
Decreased impact
Global change, and their constituent issues and the priorities
t
a
l
*
*
a
c
t
s
e
n
p
y
identifi ed during this process. The evaluation of severity of each
Sulu-Celebes
m
i
c
n
i
m
Score
c
t
s
m
o
c
t
s
c
t
s
r
i
t
y
***
v
i
r
o
n
e
r
issue adheres to a set of predefi ned criteria as provided in the
o
a
l
t
h
h
erall
r
i
o
En
impa
Ec
impa
He
Ot
communit
impa
Ov
P
chapter describing the GIWA methodology. In this section, the
Freshwater shortage
2*
2
1
1
1.9
4
scoring of GIWA concerns and issues is presented in Table 5.
Modification of stream flow
2
Pollution of existing supplies
2
Changes in the water table
2
Pollution
2*
2
2
2
2.5
3
T
Microbiological pollution
1
C
A
Freshwater shortage
IMP
Eutrophication
2
Chemical
1
Suspended solids
3
Of the more than 300 drainage basins in the region, the major systems
Solid waste
2
include the Sandakan and tributaries of Sabah; the Kayan, Ketai, Berau,
Thermal 1
Radionuclide
0
Sesayan and Sembakung rivers of East Kalimantan; the Mindanao
Spills
1
River and its tributaries; the Agusan River and its tributaries; and the
Habitat and community modification
3*
3
2
3
2.9
2
Libuganon and Sindangang rivers of Mindanao. Numerous smaller
Loss of ecosystems
3
rivers and streams fl ow from the mountainous interiors of most of
Modification of ecosystems
3
the islands in the region. Many of these rivers have been extensively
Unsustainable exploitation of fish
3*
3
3
3
3.0
1
modifi ed, primarily through loss of riparian vegetation, major clearing
Overexploitation of fish
3
Excessive by-catch and discards
3
of catchments, with resulting loss of soils as sedimentation into rivers
Destructive fishing practices
3
and streams (also see Suspended solids, and Loss and modifi cation of
Decreased viability of stock
1
ecosystems or ecotones).
Impact on biological and genetic diversity
3
Global change
1*
1
1
1
1.1
5
Changes in hydrological cycle
1
Water withdrawal
Sea level change
1
In the Philippines in 1995, the total water withdrawal was estimated at
Increased UV-B radiation
0
55.4 km3 on the basis of the water rights issued by the National Water
Changes in ocean CO source/sink function
0
2
Changes in sea surface temperature
1
Resources Board (NWRB), of which 88% is for agricultural purposes, 8%
*
This value represents an average weighted score of the environmental issues associated
for domestic and 4% for industry (Table 6). Other sectors using water
to the concern. For further details see Detailed scoring tables (Annex II).
** This value represents the overall score including environmental, socio-economic and
(non-consumptive use of water) included hydropower (89 km3), fi sheries
likely future impacts. For further details see Detailed scoring tables (Annex II).
*** Priority refers to the ranking of GIWA concerns.
(498 million m3) and recreation (93 million m3) (FAO AQUASTAT 2003).
ASSESSMENT
29
Table 6
Water withdrawal in the Sulu-Celebes (Sulawesi) region.
and Upper Pampanga River Integrated Irrigation System (UPRIIS) for
Total water
Water withdrawal by sector (%)
a total capacity of 3.2 km3). The remaining large dam (La Mesa) is
Country
withdrawal
(km3)
Agriculture
Domestic
Industry
managed by the Metropolitan Waterworks and Sewerage System,
Indonesia
74.34
93
6
1
which is also responsible for the management of a small dam (Ipo).
Malaysia
12.73
76
11
13
The NPC is also in charge of three small dams (Agus II, IV and V for
Philippines
55.42
88
8
4
a total capacity of 27.7 million m3) while all other small dams have
(Source: FAO AQUASTAT 2003)
been created with various objectives within the framework of the
small water impounding management (SWIM) projects, which are
Production of wastewater in the national capital region and nearby
implemented by several agencies. A survey of surface water storage
provinces is estimated at 74 million m3, while the volume of treated
potential has identifi ed sites for 438 major dams and 423 smaller dams
wastewater reached 10 million m3 in 1994 at the Ayala and Dagat-
(FAO AQUASTAT 2003).
Dagatan pond. Disposal of wastewater is expected to increase as new
sewer lines are being built every year (FAO AQUASTAT 2003).
In Indonesia and Malaysia, most major dams are situated outside the
regional boundaries. In Indonesia in 1995, there were 82 dams, with large
In Indonesia in 1990, total water withdrawals were 74.3 m3 (Table 6).
dam capacity of 15.83 km3 (Table 7) (FAO AQUASTAT 2003). Malaysia has a
As the nation has started to implement development programmes in
total of 56 dams, of which 32 are more than 15 m high. The gross theoretical
order to meet the sharply increasing needs for irrigation, safe drinking
hydropower potential of the Malaysian Peninsula is 123 000 GWh/year,
water, industrial water, energy, etc., the demand on water resources
and that of Sabah and Sarawak together is 107 000 GWh/year. In 1995, the
has increased rapidly. It is estimated that between 1990 and 2020, the
total hydropower generation was about 5 800 GWh, or 30% of all power
demand will increase by about 220%. More than 50% of all irrigation
production in Malaysia (FAO AQUASTAT 2003).
water is consumed in Java (in the neighbouring GIWA region Indonesian
Seas) (FAO AQUASTAT 2003).
Groundwater
In the Philippines, the total groundwater resources are estimated at
In Malaysia in 1995, the total water withdrawal was 12.7 km3 (Table 6).
180 km3/year, of which 80% (145 km3/year) would constitute the base
About 32% of the water produced is lost in the distribution system
fl ow of the river systems (FAO AQUASTAT 2003). The total internal water
due to several factors such as pipe leakage, under-metering, and other
resources would therefore amount to 479 km3/year. There are four major
unaccounted water losses. The total water demand increased from
groundwater reservoirs (Cagayan, 10 000 km2; Central Luzon, 9 000 km2;
8.7 km3 in 1980 to 12.7 km3 in 1995. Irrigation currently accounts for
Agusan, 8 500 km2; Cotobato, 6 000 km2) which, when combined with
about 9.7 km3 or about 76% of the total water consumption. However,
smaller reservoirs, aggregate to an area of about 50 000 km2. Private
irrigation demand is expected to taper off as no further expansion in
wells are extensively used in rural areas for domestic purposes.
irrigated rice cultivation is envisaged (FAO AQUASTAT 2003).
Municipal waterworks wells are drilled by the Local Water Utilities
Administration for domestic purposes and deep wells have been drilled
Dams
by the National Irrigation Administration (NIA) for irrigation purposes
In the Philippines, the total dam capacity in 1995 was 4 753 million m3
(FAO AQUASTAT 2003).
(Table 7) (FAO AQUASTAT 2003). Three of the large dams are managed
by the National Power Corporation (NPC) (Angat, Ambuklao and
In Indonesia, groundwater resources are estimated at 455 km│/year,
Palangui IV for a total capacity of 1.5 km3), the two largest dams being
although most (an estimated 90%) return as base fl ow to the rivers.
managed by the NIA (Magat River Integrated Irrigation System (MRIIS),
The groundwater potential in Indonesia is, therefore, limited and can
meet only part of the urban and rural needs for water supply, while
Table 7
Hydropower in the Sulu-Celebes (Sulawesi) region.
providing irrigation water for very limited areas in the eastern part of
Dam
Hydropower
Total installed
Electricity
Country
capacity
Dams
potential
power capacity
generated by
Indonesia. In some places, overexploitation of groundwater has led to
(km3)
(GW/h)
(MW)
hydropower (%)
critical problems (FAO AQUASTAT 2003).
Indonesia
15.8
82
3 388
2 061
16.3
Malaysia
ND
56
5 800
ND
30
In Malaysia, the total surface run-off is 566 km│, and about 64 km│ (7% of
Philippines
4.75
60
ND
ND
ND
the total annual rainfall) contribute to groundwater recharge. However,
Note: ND = No Data.
(Source: FAO AQUASTAT 2003)
about 80% of the groundwater fl ow returns to the rivers and is therefore
30
GIWA REGIONAL ASSESSMENT 56 SULUCELEBES SULAWESI SEA
not considered an additional resource. The total internal water resources
Socio-economic impacts
of Malaysia are estimated at 580 km│/year (FAO AQUASTAT 2003).As
Socio-economic impacts range from slight (health and other social
surface water is readily available throughout the year, it is abstracted
and community) to moderate (economic) at present. Most of the
mainly for irrigation and domestic uses. Groundwater resources are
major socio-economic impacts are concentrated in the Philippines
limited to some pockets of the coastal region and is generally exploited
areas of the Sulu Sea, Visayan Islands and Mindanao and in Indonesian
by rural people to supplement their piped water supply. Surface water
East Kalimantan. For large numbers of people in the region, there is no
represents 97% of the total water use, while groundwater represents
secure access to potable drinking water from wells or piped supply.
3%. About 60-65% of groundwater utilisation is for domestic and/or
According Lins (pers. comm.) speaking at the 10th Annual Philippine
municipal purposes, 5% for irrigation and 30-35% for industry.
Water Conference and Exhibition on Water Resource Management
(Philwater) September 2001, many Filipinos, especially the poor, lack
Environmental impacts
safe, potable drinking water to meet even their basic survival needs.
Modifi cation of stream fl ow
About one third of the Philippines population of 81 million people
Modifi cation of stream fl ow is having moderate environmental impact
devise their own ways of obtaining water because they have no access
in the region as a whole at present, but with severe local eff ects in
to formal sources such as deep wells or reticulated water. Half of the
some areas of the Philippines (Mindanao and the Visayan Islands) and
poor and rural households consume less than 30 litres per person
northeast Borneo. Major dam construction has altered river fl ows
per day, barely meeting normal requirements. Many poor people are
in many Philippines rivers (see above). Here also, signifi cant loss of
required to buy water, with the daily consumption levels averaging
riparian vegetation has occurred through eff ects of logging and other
just 15 litres per day, dangerously close to the survival minimum. Of
destructive land use practices. This has been most severe in the small
the 25 million Filipinos whose water supply is self-provided, many are
islands of the Sulu Sea and Visayas, and also signifi cant on the larger
getting water from sources contaminated by human, agricultural and
scales of Mindanao, Negros, Cebu, East Kalimantan and Sabah. On
industrial wastes, particularly in Mindanao where the need for safe
Negros, the 50% of original forest that remained in the 1930s has been
and adequate water remains is often not met. Some of the surface
reduced to approximately 4% today. Overall, there has been greater
water does not meet WHO drinking water criteria because of human
than 80% loss of original land cover in most of the Philippines area of the
inputs, particularly in Mindanao. The Philippines population aff ected by
region, with some 40-60% loss in the Malaysian (Sabah) areas of Borneo
water-related diseases in 1989 was 782 000 and include gastro-enteritis,
(Burke et al. 2002). By contrast, much of the original forest remains in
schistosomiasis and hepatitis (FAO AQUASTAT 2003).
Indonesian East Kalimantan and North Sulawesi.
Even in some areas with reticulated water, there are interruptions to
Pollution of existing supplies
supply. Despite its moderate score for the region as a whole, freshwater
Pollution of existing supplies has caused moderate environmental
shortage is already a food-security concern, and is the focus of national
impact, but with highly localised severe damage. There have been
and international interventions. Expanded programmes targeting both
reports of fi sh kills from various chemical inputs, notably from a
rural and urban water supplies, with the goal of delivering a reliable
nematocide in banana pesticides used in Compostela Valley province,
potable supply, will be necessary to achieve signifi cant alleviation. In
Mindanao. There have also been increases in nutrient loads to lakes from
parts of the region (e.g. Mindanao), civil unrest caused by separatist
aquaculture activities, with likely increases in other inputs.
movements is likely to contribute to diffi
culties in eff ectively
implementing remedial interventions. In Indonesia in 1990, just 35% of
Changes in the water table
the urban population and 33% of the rural population were supplied
Changes in the water table have also caused moderate environmental
with water (FAO AQUASTAT 2003).
impact in the region as a whole, with severe impact in small islands
of the Sulu Sea, Visayan Islands, Mindanao and Cebu. Wells have been
Additional economic impacts accrue from costs in supplying water
deepened over hundreds of square kilometres in these areas of the
for irrigation. In the Philippines, under the National Irrigation System
Philippines. On Cebu, deforested since the 1880s, saline intrusion has
(NIS) schemes, the average cost of irrigation development is estimated
occurred up to 11 km from the coast, and there is little or no potable
at 3 800 to 7 600 USD/ha for new schemes, while the cost for the
water available from traditional coastal sources. By contrast, on Palawan,
rehabilitation of existing schemes varies from 1 000 to 1 600 USD/ha
where logging was halted in 1992 and 40% of the monsoon forests
(FAO AQUASTAT 2003). Although the cost of the system is borne entirely
remain, there has been relatively little salt intrusion.
by the Department of Agriculture (NIA), often poor farmers have to pay
ASSESSMENT
31
fees to cover operations and maintenance expenditure. There are also
present pump systems are no longer economically viable if devoted
about 6 200 communal schemes. In Mindanao, these schemes are
solely to rice irrigation.
generally large, many of them being implemented by the government
settlement programmes and then transferred to farmer groups. The
Thus, socio-economic impacts from Freshwater shortage in the Sulu-
association bears 10% of the direct cost of construction, and pays back
Celebes (Sulawesi) region include:
the balance within 50 years at a 10% interest rate. Private schemes
Loss/interruptions to human drinking water supplies particularly in
(about 152 100 ha in 1992) are generally supplied through pumping.
rural areas of the Philippines;
They fi nd their origin in publicly assisted river lift and groundwater
Increased costs of irrigation and alternative water supplies, with
development projects. In 1980, public involvement in this sector
one-third of the Philippines population having no secure access to
ceased because of the high cost of energy needed to operate these
potable water;
systems. Most of the schemes have been abandoned or are now
Reduction in future use options;
inoperable. For example, of the 379 public tube-wells constructed in
Human health impacts from lack of regular supply of potable water,
1971, only 22 were still in operation in 1990. Pump schemes located
as noted above;
along rivers have also been developed by private owners serving up
Future costs of improving supply, both reticulated and through
to about 20 ha. Although this can be successful when supporting
deepening wells and pumping;
high value crops, many are no longer used, largely due to the high
Potential damage to infrastructure;
cost of operations and maintenance, particularly for rice paddies (FAO
Increased potential for upstream/downstream confl icts, or confl icts
AQUASTAT 2003).
among urban and squatter groups. The water authorities presently
do not have adequate capacity for eff ective enforcement, and
On all NIS schemes, the fees collected by the NIA should cover the
much of the infrastructure dates from colonial times.
costs for operation, maintenance and even the investment cost within
a reasonable period of time to an extent consistent with government
Conclusions and future outlook
policy. However, in practice, capital cost recovery is confi ned to the
Freshwater shortage has caused moderate environmental impact at
communal sector and the fees collected covered only 80% of operations
present and is expected to deteriorate markedly, becoming severe
and maintenance expenditure in 1989. The fees can be paid either in rice
by 2020. Impacts to health and other social and community aspects
or in cash. For crops other than rice, the fees are calculated on the basis
are expected to deteriorate from slight to moderate by 2020 although
of 60% of the rate given for rice fees. In Indonesia, the main objective
the economic situation is expected to improve slightly over the next
of irrigation development is to expand the cultivation of rice, the staple
20 years, remaining at a moderate level of impact.
food. The major crops cultivated under controlled irrigation are rice and
palawija (dry season crops, e.g. corn, soybean). In 1992, the average cost
Major forcing factors on freshwater shortage include widespread
of developing a surface irrigation scheme was 3 645 USD/ha while the
increases in human populations, with a doubling expected by 2035,
average operations and maintenance cost of a surface irrigation system
compounding problems of poor water supply and contamination.
was 8.4 USD/ha/year.
Despite the best eff orts of government (as outlined in Box 2) and
NGOs, a continuing lack of eff ective regulation and little environmental
There is also growing water competition among the users; water
control is expected to contribute to the further deterioration in socio-
supply, hydropower, environment, fi shing and watershed management
economic aspects of freshwater shortage. For example, in both
are competing with irrigation for water. In the Philippines, the National
Indonesia and the Philippines, with the sharply increasing needs
Water Review Board (NRWB) was established in order to coordinate
for irrigation, safe drinking water, industrial water, energy, etc., the
the use of water for diff erent purposes, but its action is hampered, in
demand on water resources has increased rapidly. In 1990, just 35%
part, by a lack of reliable data on present water resources and water
of Indonesia's urban population and 33% of the rural population is
use. Erosion and siltation of the canals have resulted in high costs for
supplied with water, and it is estimated that between 1990 and 2020,
the operation and maintenance of irrigation schemes, and many are
the demand will increase by about 220%. Notably, the actual rate
thus in need of frequent rehabilitation. The conversion of agricultural
of deterioration will depend largely on the success of the planned
lands for industrial or residential use has signifi cantly reduced the area
interventions (see Annexes III and IV).
that can actually be used for irrigated agriculture. The high cost of
energy hampers the development of pump irrigation systems. The
32
GIWA REGIONAL ASSESSMENT 56 SULUCELEBES SULAWESI SEA
Box 2
Trends in water resource management in the Sulu-Celebes (Sulawesi) region.
Phlilippines
Indoneisa
Malaysia
The majority of the population depends on The Ministry of Public Works through its
carrying capacities are continuously Agriculture will remain the main user of
agriculture for its livelihood and irrigation is Directorate General of Water Resources
changing due to sediment problems, water in the future. However, its importance
considered a crucial element in agricultural Development (DGWRD) has identified
large variations in flow, and human en- will decline from the present 76% to about
production. With the potential irrigable area four main missions in water resources
croachment. In order to protect invest- 70% of total water consumption by 2020.
of 3.1 million ha, irrigation development is sector programming as part of Repelita VI
ment and economic activity as well as to In the irrigation sector, future efforts will
only at the halfway stage. Self-sufficiency (1994-999). They are:
ensure the availability of surface water focus on demand management through
in food has been set as a target by the Gov- - Maintenance of self-sufficiency in rice
resources close to demand centres, improved water management rather than
ernment. Agricultural development through
production to achieve long-term food
the DGWRD direct its programming to on supply management. Future trends in rice
irrigation, therefore, still remains a priority
security. Although Indonesia achieved
continuously improve flood protection cultivation will focus on group farming as
on the Government's agenda.
self-sufficiency in rice production in 1984,
and drainage, through both structural practised in the Trans Perak Area Integrated
The Irrigation Crisis Act (Republic Act No.
demographic growth, land use changes,
and non-structural measures, and to Agriculture Development Scheme.
6978) signed into law in January 1991,
variations in rainfall, climatic changes,
manage water bodies such as ponds, In the long-term, sustainable rice cultiva-
mandated the NIA to develop the remain-
drought, flooding, drainage problems
lakes and reservoirs.
tion will depend on the establishment
ing 1.5 million ha of irrigable lands within
in low-lying areas and urbanisation have - Water resources development, conserva- of effective farmers' organisations. More
10 years through the construction of irriga-
resulted in rice shortages requiring the
tion and management. The archipelagic business-oriented rice farming is seen as
tion projects including other related project
importation of rice and the building up
nature of the country, variations in rain- a way to reduce government subsidies to
components. Irrigation, soil and water man-
of costly rice buffer stocks. The DGWRD
fall, large fluctuations in river flows and small farmers. Owing to the high cost of rice
agement have been set as a priority on the
directs its programming towards activities
lack of proper storage sites have hindered production, the National Agriculture Policy
agenda of the Department of Agriculture.
that support the continued increase in rice
the nation's ability to meet the increasing (1992-2010) aims to gradually reduce the
The Medium Term Philippine Development
production to maintain self-sufficiency.
water demands. The gradual degrada- country's self-sufficiency in rice from the
Plan (1994-1998) also envisages rapid irri- - Provision of water to meet increasing water
tion of upper basins, poor groundwater current 80 to 65%.
gation development. However, there are
supply demands. Rapid industrialisation,
resources, increasing water quality prob- In the water resources sector, there is a need
numerous economic and environmental
increasing urbanisation and the need to
lems in the lower reaches of the rivers, to review the planning and development
problems, as described above. In address-
supply the nation's population with safe
and the inefficient use of water require of dams. Most of the existing dams were
ing these challenges, the NIA, together with
drinking water have necessitated the de-
a greater focus on water resources, generally designed for one single purpose by
the Department of Environment and Natural
velopment and maintenance of adequate
conservation and prevention. Thus, in various government agencies and privatised
Resources, is expected to:
water sources and supplies of proper qual-
order to ensure the continued avail- utility companies.
- Fully enforce existing laws on environ-
ity water in many regions of the country.
ability of water resources, the DGWRD Future dams will be designed with consid-
mental protection and conservation, in
Often, the water is required at locations far
direct its programming towards steps eration for multipurpose usage through
order to reduce erosion.
away from good quality water sources, so
to improve water resources availability
through appropriate conservation and improved coordination and the optimisa-
- Establish
institutional
arrangements
large capital investments for conveyance
management measures.
tion of resources. There is also an urgent
with the NPC, the NEA and the electric
infrastructures are needed. The water
need to address the issue of water pollu-
cooperatives to reduce power rates for
sources are continuously subjected to The four missions directed by the DGWRD tion, which could have a serious economic
pumps as a government subsidy to small
water quality degradation due to urban, are being implemented through a num- impact if left unchecked. The Government
farmers.
industrial and upper watershed pollution. ber of major and support programmes. is studying the feasibility of setting up a
The DGWRD directs its programming to The water resources sector now has two
- Work with the Department of Agrarian
national body to manage the rivers as well
develop sources of good quality water major sub-sectors:
Reform, under the Comprehensive Agrar-
as the creation of a national water council
and supply to demand centres in order
ian Reform Law, to approve or disapprove
- Water resources development, with three to improve cooperation between federal
to meet the needs for water.
the transformation of agricultural lands
major programmes:Water resources and state governments in water resources
for non-agricultural uses.
- Flood alleviation and river manage-
development and conservation; sup- management.
ment. Many of Indonesia's agricultural
ply and management of water; and
and urban areas are located in the
management of rivers, lakes and other
lowlands. The majority of rivers flood
water resources;
frequently due to the high intensity - Irrigation with, two major programmes:
rainfall in the watersheds and influx of
development and management of irri-
sediment, particularly in lowland areas.
gation networks; and development and
In addition, the river morphology and
management of swamp areas.
(Source: Excerpted from FAO AQUASTAT 2003)
T
C
A
Pollution
IMP
Total emissions of organic water pollution have remained relatively
Industrial forms of water pollution are focused in the major urban
steady in the Philippines from 1980 (estimated at 182 000 kg per day)
centres, include Davao City and Zamboanga City (Mindanao), Cebu
to 1993 (181 700 kg per day) with an average input per worker of 0.19 kg
City (Cebu), Peurto Princesa (Palawan), Batangas City and Lucena
per day sector's share of organic water pollution was mostly contributed
(Luzon), Bacalod and Daumagete City (Negros), Iloilo (Panay), Tarakan
by food (53% of the total) (World Bank 2003b). In Indonesia by contrast,
(East Kalimantan), Manado (North Sulawesi) and Sandakan (Sabah,
there has been a rapid increase in emissions, from some 214 000 kg per
Malaysia). Here also, sewage treatment is superfi cial at best, with raw
day in 1980 to more than 537 000 kg per day in 1993. Here food is the
and/or primary treated sewage discharged directly into water courses.
major industrial contributor (59%). Similarly in Malaysia, emissions of
Agricultural pollution is also widespread, through leaching of fertilisers
organic water pollution have increased, from 77 200 kg per day in 1980
and pesticides into water courses, massive loss of soils following land
to 136 100 kg per day in 1993, again with food being the major industrial
clearing and forestry and increasing aquaculture activities.
contributor (32%) (World Bank 2003b).
ASSESSMENT
33
Environmental impacts
problem in worst aff ected areas such as Batangas Bay (heavy metals),
Microbiological
urban areas of Mindanao, the Visayas Islands and other industrial, urban
Despite its slight environmental impact overall, microbiological
(e.g. all larger cities and towns) and major agricultural areas.
pollution is a locally signifi cant problem in the major urban centres,
notably Davao and Zamboanga cities (Mindanao) from inadequate
Some water contamination also occurs from manufacturing, metal
sewage disposal and treatment. There are also elevated levels of
fabrication, ship repair and agricultural and food processing industries
faecal coliform contamination and in the Visayan Islands there has
(oil milling, sugar refi ning, and meat and fi sh processing) and from
been a slight increase in incidence of bacterial-related gastro-enteric
mining, with contaminant loads concentrated near the discharges.
disorders in fi sheries product consumers (aff ecting hundreds of people),
Pargal et al. (In prep) noted that in the case of Indonesia, the textiles,
but no fi sheries closures or advisories. Blooms of toxic dinofl agellates
leather tanning, food products and pulp and paper industries are more
have caused paralytic shellfi sh poisoning in parts of the region
BOD-intensive than other manufacturing sectors. Pulp and paper is
(Maclean 1989).
signifi cantly more intensive in organic water pollution (BOD) than food
products, although textiles and leather tanning are also relatively BOD-
There is only rudimentary sewage treatment for much of the region,
intensive; metal and machinery industries are the least BOD-intensive.
where most sewage is treated by settlement and most primary
Pulp and paper and miscellaneous manufacturing are most intensive
treatment consists of screening, particularly in the urban areas (e.g.
in total suspended solids (TSS), while the machinery industry is least
Davao City, Mindanao). For example, the production of wastewater in
intensive.
the Manila region and nearby provinces (part of GIWA region 54 South
China Sea) is estimated at 74 million m3 in 1994, while the volume
Philippine coastal waters off Luzon, Negros, Cebu, Samar, Balabac
of treated wastewater reached just 10 million m3 at the Ayala and
and the Calamian group have suff ered from chemical pollution
Dagat-Dagatan pond (FAO AQUASTAT 2003). Disposal of wastewater
due to mining activities. Releases of chemical and to a lesser extent
is expected to increase as new sewer lines are being built every year. In
microbiological pollution from shipping in harbours are also common
Indonesia, municipal and industrial wastewater is discharged virtually
and widespread, as regulations and controls relating to ship-derived
untreated into the waterways causing rapid deterioration in the quality
pollution are rarely enforced. Pesticide use is widespread, particularly in
of river water. In Malaysia, although much legislation touches on water
plantation agriculture (e.g. nematocides in banana farms). For example,
resources either directly or indirectly, most of the existing laws are
chlorinated residues from pesticides used on rice paddies, such as
considered outdated. For example, the Water Act of 1920 is inadequate
Aldrin, Dieldrin, Lindane and Endrin, are found in the water column
for dealing with the current complex issues related to water abstraction,
and sediments in Manila Bay and Segara Anakan, with levels exceeding
pollution and river basin management (FAO AQUASTAT 2003).
allowable limits set by national agencies (Ludwig 1985, Gunnerson &
Cuellar 1988). As noted above, fi sh kills have occurred from various
Eutrophication
chemical inputs, notably from a nematocide in banana pesticides
The present level of environmental impact from eutrophication in
used in Compostela Valley province, Mindanao. Nonetheless, there are
the region as a whole is moderate. Impacts are most signifi cant in
no indications that pollution from agricultural run-off is a signifi cant
enclosed bays, harbours and lagoons with limited water circulation,
problem at the scale of the region at present.
and particularly where sewage or industrial discharges are present,
notably in areas of southern Luzon and the Visayan Islands. As noted in
Suspended solids
the assessment of the impacts of microbiological pollution, blooms of
Environmental impacts from suspended solids are severe, especially
toxic dinofl agellates have caused paralytic shellfi sh poisoning in parts
in the coastal waters of the Philippines, the result of extensive
of the region (Maclean 1989).
deforestation (e.g. Chia & Kirkman 2000, Hodgson & Dixon 1988, 1992,
Burke et al. 2002). This is compounded by high rates of erosion and
Chemical
siltation rates that are among the highest on Earth. For example, in the
Chemical pollution is causing only slight environmental impact in the
Philippines, it is estimated that approximately 1 billion m3 of sediment
region as a whole, in part related to the lack of major industrial centres
is lost to coastal waters annually (Burke et al. 2002), carrying high loads
in the region (all national capitals and most major industrial areas are
of particle-bound nutrients. Additional transboundary impacts result
outside the regional boundaries), and to the physical oceanography of
from sediment-laden waters fl owing seasonally into the region around
the Sulu-Sulawesi (Celebes) Sea. Nonetheless, this is a locally signifi cant
the northern coast of Sabah and to the south of Palawan from the
34
GIWA REGIONAL ASSESSMENT 56 SULUCELEBES SULAWESI SEA
(Palawan), Batangas City and Lucena (Luzon), Bacalod and Daumagete
Estimated threat level
Luzon
City (Negros), Iloilo (Panay), Tarakan (East Kalimantan), Manado (North
High
Sulawesi) and Sandakan (Sabah, Malaysia). Here, waste management is
Medium
Low
generally poor or non-existent. There is widespread litter on beaches
Mindoro SIBUYAN SEA
giving rise to public concerns regarding recreational use. There are high
Samar
Calamian
VISAYAN SEA
frequencies of benthic litter recovery and interference with trawling
activities, and there are also frequent reports of entanglement/
Visayan islands
Philippines
suff ocation of species by litter.
an
Palaw
S
U
L
U
S
E
A
BOHOL SEA
Thermal
Mindanao
Thermal pollution has only negligible and at most slight impact, being
notable only in the immediate vicinity (less than 1 km2) of the few power
plants where ocean discharge of cooling waters occurs.
Sulu Archipelago
Sabah
(Malaysia)
Radionuclide
There is no known environmental impact of radionuclide pollution at
C
E
L
E
B
E
S
S
E
A
East Kalimantan
present. There are no nuclear power plants in the region, although there
(Indonesia)
may be some episodic minor discharge from nuclear-powered ships
navigating through the area.
Sulawesi (Indonesia)
MAKASSAR
STRAIT
Spills
Spills have caused only slight environmental impact at present, despite
® GIWA 2004
Figure 6
Reefs at risk due to sedimentation in the
the southeastern Celebes Sea forming part of the major ULCC oil tanker
Sulu-Celebes (Sulawesi) region.
route between the Indian and Pacifi c Oceans. International trade is
(Source: Burke et al. 2002)
expected to triple by 2020, and much of this trade will be transported
by sea. Increased tanker traffi
c using the ULCC route has the potential
South China Sea (Bate 1999). At present, eff ects of the nutrients are
for spills to occur that could damage oceanic and coastal habitats;
uncertain and are partly dependent on rates of mineralisation and
mangroves and coral reefs. Major oil production is being carried out
retention of the dissolved nutrients. There is little evidence of visible
in northwest Palawan, Erb West and Samarang off west Sabah, and the
eff ects on the abundance and distributions of biota, of increased
potential for oil spills to aff ect adversely marine and coastal ecosystems
frequency of hypoxic conditions, reduced levels of dissolved oxygen,
in the region is high. Overall, Southeast Asia produces about 3.5% of the
or fi sh or zoobenthos mortality other than in some enclosed bays (e.g.
world's crude oil and 2.5% of its natural gas (Valencia 1989), and oil spills
in southern Luzon and Visayas) and in the immediate vicinity of river
in neighbouring regions could also potentially aff ect the ecosystems of
mouths. Blooms of toxic dinofl agellates have caused paralytic shellfi sh
the Sulu-Celebes Sea, especially if occurring during monsoon season.
poisoning (Maclean 1989). The extent and level of threat posed by
Caution and good management practices must be exercised in current
sedimentation to coral reefs of the region ranges from low to high
and future exploration initiatives, including the Shell Company's multi-
(Figure 6). High threat sites include much of the northern coast of
billion dollar Malampaya Gas Project (in Palawan province, Philippines),
Mindanao, several smaller areas of northern Sulawesi and northern
which was scheduled to begin operation in 2002-2003 (Werner & Allen
Borneo (Sabah, Malaysia) and much of southern Luzon (Burke et al.
2000). The Philippines and Malaysia have ratifi ed the UN Convention
2002).
on the Law of the Sea (UNCLOS) and the International Convention on
Prevention of Marine Pollution from ships (MARPOL). These nations have
Solid wastes
taken some steps towards developing oil spill contingency planning,
Solid wastes have caused moderate environmental impact in the
yet little spill control equipment is in place and emergency procedures
region. However, there has been severe impact locally, particularly
are not well established.
around the larger cities, towns and villages, including Davao City
and Zamboanga City (Mindanao), Cebu City (Cebu), Peurto Princesa
ASSESSMENT
35
Socio-economic impacts
Box 3
Planned Minahasan container port.
The three indicators of socio-economic impacts of pollution have
The proposed project would involve reclamation of approximately 8 ha of fringing
reef in the Pasir Panjang area southwest of Manado, just a few kilometres from the
moderate impacts at present. Most impacts are related to poverty
southern section of Bunaken National Park. The proposed reclamation follows six
years of reclamation activities in Manado Bay that have been largely opposed by
and are concentrated in the major urban centres, the Visayas Islands,
the general public but that have continued in a relatively non-transparent and
non-accountable manner.
Mindanao, East Kalimantan and Sabah. The GIWA experts conclude that
The social impacts of such a development range from the loss of fishing grounds
there have also been signifi cant health issues in these areas, including
for local artisanal fishers to the likely increase in container truck traffic, bars,
brawling and prostitution that often accompany port development. Issues
cases of mercury poisoning, although the total number of cases is
discussed included environmental impacts of the proposed plan on both the local
reefs and those in nearby Bunaken National Park as a result of reclamation and
unknown. The key socio-economic impacts include:
sedimentation during construction and oil spills, ballast water dumping and other
marine pollution during port operation, and the related negative economic and
Increased risks to human health;
health effects on locals.
Increased costs of human health protection;
The hearing was concluded without any specific commitments other than that due
to the large number of issues raised, the Minahasan government would re-evaluate
Loss of water supplies (e.g. potable water, see Freshwater
the plan. While the eventual outcome of this debate is not yet clear, the fact that the
project is being openly discussed prior to construction is a huge step forward for
shortage);
natural resources management in North Sulawesi and for principles of transparent
Increased costs of water treatment (see Freshwater shortage and
and accountable governance. The public hearing on the port was successful in
bringing together a large number of relevant stakeholders (both pro and contra)
Regional defi nition, Socio-economic characteristics);
and in facilitating focused and informed debate on the project.
Costs of preventive medicine (mostly future cost);
(Source: Excerpted from NRM Headline News 2002a)
Costs of medical treatment (e.g. blooms of toxic dinofl agellates
have caused paralytic shellfi sh poisoning in parts of the region)
because of the predicted major increase in population (doubling
(Maclean 1989);
by 2035) without suffi
cient major improvements in infrastructure to
Costs of clean-up;
compensate.
Loss in fi sheries (see Unsustainable exploitation of fi sh and other
living resources);
The three nations are adopting industrial water pollution control
Change
in
fi sheries value (see Unsustainable exploitation of fi sh and
standards similar to those in developed countries. However, formal
other living resources);
regulation in the region has been greatly hampered by the absence
Costs of reduced fi sh marketability due to aesthetic perceptions
of clear and legally binding regulations; limited institutional capacity;
(see Unsustainable exploitation of fi sh and other living resources);
lack of appropriate equipment and trained personnel; and inadequate
Reduction in options of other uses of freshwater (see Freshwater
information on emissions (Hettige et al. 1996). Indonesia began
shortage);
formal regulation in 1992 (Pargal et al. in prep.), with establishment
Damage to equipment (e.g. particle impacts);
of maximum allowable volumes and concentrations (in kg/tonnes
Avoidance of amenities and products due to perceptions of eff ects
of output) for emissions of BOD and other water pollutants from
of contamination;
14 broadly-defi ned industry sectors (e.g. textiles, wood pulping).
Costs of preventative measures;
Although self-reported BOD emissions are now mandated by law,
Costs of contingency measures.
reporting was extremely sparse until recently. Until 1995, the only
consistent programme of monitoring and pressure for compliance was
A typical local scale case study in socio-economic impact is provided by
a voluntary arrangement instituted in 1989. This PROKASIH or `Clean
recent and future proposed port reclamation in North Sulawesi, close
Rivers,' programme, covers about 5% of Indonesian manufacturing
to the city of Manado and the regionally signifi cant Bunaken National
facilities in 11 river basins on the islands of Java, Sumatra (in the
Park (Box 3).
neighbouring GIWA region Indonesian Seas) and Kalimantan. While
it has succeeded in eliciting signifi cant pollution reductions from
Conclusions and future outlook
some of Indonesia's largest polluters, PROKASIH represents only the
For the GIWA concern of Pollution as a whole, present level of
fi rst stage of regulation.
environmental impact is moderate. However, environmental impact of
suspended solids is already severe, primarily resulting from deforestation
Yet, despite weak or non-existent formal regulation, there are many
over the past century and a half (Burke et al. 2002). Over the next years,
clean industrial plants in these countries. However, there are also many
environmental impacts from pollution in streams and rivers, the
plants that are among the world's most serious polluters (Hettige et al.
intertidal zone, and waters deeper than 200 m are likely to deteriorate
1996). The analysis of Hettige et al. (1996) demonstrated that pollution
markedly. Overall impact in 2020 is expected to be severe, primarily
intensity was negatively associated with scale, productive effi
ciency,
36
GIWA REGIONAL ASSESSMENT 56 SULUCELEBES SULAWESI SEA
T
C
A
and the use of new process technology. It was strongly and positively
Habitat and community
IMP
associated with public ownership, but foreign ownership had no
modification
signifi cant eff ect once other plant characteristics were taken into
account. Among external sources of pressure, community action, or
The region is located in the Indo-West Pacifi c centre of diversity and
informal regulation, emerged as a clear source of interplant diff erences.
supports mega-diversity, located near the junction of three major
The results suggested that local income and education are powerful
biogeographic zones (Roberts et al. 2002, Cheung et al. 2002). The
predictors of the eff ectiveness of informal regulation. They also showed
warm clear waters of the Sulu-Celebes Sea, its currents and upwellings,
that existing formal regulation had measurably benefi cial eff ects, even
its active underwater volcanoes, its seamounts, trenches, corals and inter-
when it was quite weakly developed. Abatement is generally subject
island passages, constitute an exceptionally rich marine life hot spot. The
to signifi cant scale economies; within-country variations in labour and
region supports a signifi cant proportion of the total coral reef area of
energy prices have little impact on pollution intensity; and community
the Philippines, with some 20 000 km2 of coral reefs, and forms part of
incomes have a powerful negative association with pollution intensity
the `coral triangle' of highest coral diversity with Indonesia and New
(Pargal et al. in prep.). Although the plant and fi rm characteristics are
Guinea (with more than 500 reef-building species) (Burke et al. 2002).
important in Indonesia (and other Asian developing economies),
community income is particularly important, since this suggests a
The Sulu-Celebes Large Marine Ecosystem support around 400 species
powerful role for informal regulation whether or not formal regulation
of algae, 5 species of sea turtles, 22 species of marine mammals and over
is in place.
450 types of coral (LME 2003). More than 2 500 species of fi sh occur in
the region, many of which are exploited using a large variety of diff erent
Indonesia's Environmental Impact Management Agency (BAPEDAL)
gears and methods. The fi shery is comprised predominantly of pelagic
has recently initiated PROPER-PROKASIH. This programme gives
species, mostly tuna (Thunus spp.), skipjack (Katsuanus sp.), scads and
participating industrial and other manufacturing plants colour-coded
sharks, representing some 80% and 60% of total production of North
grades indicating their compliance with pollution regulations. PROPER-
Sulawesi and East Kalimantan respectively. Five species of sea turtles
PROKASIH is in its second year and preliminary results suggest it has had
(Green, Chelonia mydas; Hawksbill, Eretmochelys imbricate; Olive ridley,
a positive impact on polluter behaviour as well as BAPEDAL's capacity
Lepidochelys olivacea; Loggerhead, Caretta caretta; and Leatherback,
for regulation. In the Philippines, the Department of Environment and
Dermochelys coriacea) and 22 species of marine mammal have been
Natural Resources (DENR) is introducing a public disclosure programme
recorded (Jacinto et al. 2000). Dugongs (Dugong dugon) are still present
called EcoWatch, modelled on Indonesia's PROPER programme. Despite
in Palawan and Sarangani provinces (Philippines), and to the south of
these and other pollution mitigation initiatives, future deterioration is
the region in areas of Sulawesi and Flores (GIWA region 57 Indonesian
expected in all three indicators, such that the socio-economic prognosis
Seas), although these were once common in suitable seagrass habitat
for 2020 is for severe impacts to economy, health and other social and
throughout the entire region. .
community aspects from water pollution issues, despite regulatory and
other interventions.
Environmental impacts
Loss of ecosystems or ecotones
Addressing water security alone is a major challenge (as noted in
There is already severe loss of ecosystems in the region, with
Freshwater shortage above), and little progress is being made in
permanent destruction having reduced the surface area of marshes,
addressing the other major forms of water pollution at present. For
swamps, riparian belts and forest catchments by more than 30%
example, river and coastal aquaculture projects are growing rapidly,
between the 1850s and the 1970s. As noted above, signifi cant loss of
with little regulation or enforcement. In Indonesia, up to 1 million ha
riparian vegetation has occurred through eff ects of logging and other
of land, mostly mangrove forests, were allocated by the government
destructive land use practices. This has been most severe in the small
for the shrimp hatchery industry during the 1980s and 1990s. By 2001,
islands of the Sulu Sea and Visayas, and also signifi cant at larger scales
about 70% of the shrimp farms had been abandoned, because the
on Mindanao, Negros, Cebu, East Kalimantan and Sabah. On Negros, the
operators found them unsustainable due to the high concentrations
50% of original forest that remained in the 1930s has been reduced to
of chemicals and the destruction of the mangrove habitat.
approximately 4% today. Overall, there has been greater than 80% loss
of original land cover in most of the Philippine area of the region, with
some 40-60% loss in the Malaysian (Sabah) areas of Borneo (Figure 7)
(Burke et al. 2002). By contrast, much of the original forest cover remains
ASSESSMENT
37
Altered land cover (%)
Estimated threat level
Luzon
0 - 20
Luzon
High
21 - 40
Medium
41 - 60
Low
Mindoro SIBUYAN SEA
Mindoro SIBUYAN SEA
61 - 80
Samar
Samar
81 - 100
Calamian
Calamian
VISAYAN SEA
VISAYAN SEA
Visayan islands
Visayan islands
Philippines
n
Philippines
an
lawa
Palaw
Pa
S
U
L
U
S
E
A
BOHOL SEA
S
U
L
U
S
E
A
BOHOL SEA
Mindanao
Mindanao
Sulu Archipelago
Sulu Archipelago
Sabah
Sabah
(Malaysia)
(Malaysia)
C
E
L
E
B
E
S
S
E
A
East Kalimantan
C
E
L
E
B
E
S
S
E
A
East Kalimantan
(Indonesia)
(Indonesia)
Sulawesi (Indonesia)
Sulawesi (Indonesia)
MAKASSAR
MAKASSAR
STRAIT
STRAIT
® GIWA 2004
® GIWA 2004
Figure 7
Altered land cover in the Sulu-Celebes (Sulawesi) region.
Figure 8
Reefs at risk due to overfi shing in the
(Source: Burke et al. 2002)
Sulu-Celebes (Sulawesi) region.
(Source: Burke et al. 2002)
in Indonesian East Kalimantan (Borneo) and North Sulawesi. There is
at least 60 of the 1 400 freshwater fi sh species are threatened with
also extensive evidence of human-induced fragmentation of coastal
extinction. In the Philippines, at least 26 of the 230 freshwater species
and marine habitats from siltation, development and destructive
are similarly threatened, whereas in Malaysia some 14 species of a total
fi shing practices. It is estimated that 60-80% or possibly more of the
of 449 freshwater fi sh species are threatened (WRI 2003).
mangrove resources in the Philippines has been lost (Atmadja & Man
1994). Development of most ports has resulted in foreshore reclamation
Overfi shing has caused changes in population structures and/or
and channel dredging, while muro-ami, (Hopley & Suharsono 2000,
functional group composition (e.g. coral reef fi shes) and major
Pilcher & Cabanban 2000), blasting (Cabanban 1998) and poison fi shing
changes in ecosystem services (e.g. reef fi sheries, mangrove resources).
(Pratt 1996) has damaged or destroyed more than 70% of coral reefs
For example, about 70% of coral reefs have been degraded in terms
throughout the region. Muro-ami involves setting a net over a coral reef
of destructive and overfi shing and the important fi sheries `nursery
into which a group of 10-30 swimmers drive the fi shes. The swimmers
ground' roles of large sections of mangroves and seagrass beds have
are equipped with weighted (usually rocks) lines that are bounced up
been seriously depleted (Figure 8).
and down on the reef in an eff ort to drive out the fi shes (Werner & Allen
2000). Seagrass beds, muddy and sand-gravel bottoms and fringing
The major causes of loss and modifi cation of the freshwater, coastal and
coral reefs are also impacted by trawling.
marine habitats include:
Siltation, conversion for aquaculture, agriculture, industrial
Modifi cation of ecosystems or ecotones
development aff ecting marshes, swamps, rice paddies and riparian
There is also severe modifi cation of habitats, with changes to riverine
belts, notably in northern Mindanao, eastern Palawan, Visayas
habitats (fast fl owing stony bottomed streams and slow fl owing
Islands, southern Luzon and Sabah (Figure 9);
sandy/muddy fl oodplain rivers) and their natural species compliment
Deforestation, siltation, damming and waste disposal aff ecting rice
from introductions (e.g. Tilapia and African catfi sh). In Indonesia,
paddies and rivers (most of the Philippines area of the region);
38
GIWA REGIONAL ASSESSMENT 56 SULUCELEBES SULAWESI SEA
the highest birth rates, from reductions in animal protein. Additional
Estimated threat level
economic impacts have occurred from loss of mangrove habitats,
Luzon
High
notably near Zamboanga (Mindanao), and strip mining.
Medium
Low
Mindoro SIBUYAN SEA
Major economic costs are accruing from loss and modifi cation of coral
Samar
Calamian
VISAYAN SEA
reef habitats, which are of immense economic value. In Southeast Asia
generally, reefs are estimated to be worth some 2 400 million USD
Visayan islands
n
Philippines
per year, based on their value in food security, employment, tourism,
lawa
Pa
pharmaceutical research and shoreline protection (Burke et al. 2002).
S
U
L
U
S
E
A
BOHOL SEA
The reefs of Indonesia and the Philippines provide annual economic
Mindanao
benefi ts of 1.6 billion and 1.1 billion USD per year in 2002, however,
over the next 20 years, human impacts, notably overfi shing, destructive
fi shing and sedimentation could cost Indonesia and the Philippines
Sulu Archipelago
Sabah
some 2.6 billion USD and 2.5 billion USD respectively (Burke et al. 2002).
(Malaysia)
As noted above in the Pollution section, up to 1 million ha of land in
C
E
L
E
B
E
S
S
E
A
Indonesia, mostly mangrove forests, were allocated by the government
East Kalimantan
(Indonesia)
for the shrimp hatchery industry. By 2001, about 70% of the shrimp
farms had been abandoned because the operators found them
unsustainable due to the high concentrations of chemicals and the
Sulawesi (Indonesia)
MAKASSAR
STRAIT
destruction of the mangrove habitat. Local NGOs claim that the donor
agencies (including the World Bank) should be held accountable for
® GIWA 2004
environmental destruction caused by shrimp farming and that the
Figure 9
Reefs at risk due to coastal development in the Sulu-
government should establish clear criteria for sustainable shrimp
Celebes (Sulawesi) region.
farming and ways to rehabilitate damaged mangroves. In other parts
(Source. Burke et al. 2002)
of the region, similar habitat modifi cation and destruction has occurred,
and this has also led to human confl ict.
Silica mining and solid wastes aff ecting sandy foreshores (southern
Luzon, Mindanao and Sabah);
Progress in managing human use of habitats is not expected to be
Aquaculture conversion and timber collecting aff ecting mangroves
suffi
cient to fully mitigate the damaging eff ects of population growth,
(many areas);
causing:
Sediment
run-off - siltation and dredging aff ecting seagrass beds
Reduced capacity to meet basic human needs (e.g. fi sheries) for
and coral reefs (many areas of the Philippines, notably northern
local populations;
Mindanao and parts of eastern Palawan) (Figure 6);
Changes in employment opportunities for local populations and
Destructive
fi
shing
aff ecting coral reefs (much of the region, and
associated changes in social structures (e.g. through loss of future
notably at the World Heritage Tubbataha);
employment opportunities related to degradation of habitats);
Trawling
aff ecting soft-bottom habitats (much of the region,
Loss of existing income and foreign exchange from fi sheries,
notably Sabah);
tourism (see Box 4);
Mid-water trawling, drift netting and other forms of pelagic
Loss of opportunity for investment income and foreign exchange;
fi sheries, oil and gas exploration and pipelines aff ecting oceanic
Human confl icts, national and international, particularly related to
habitats (Sulu Sea).
fi sheries exploitation;
Increased risks to capital investment;
Socio-economic impacts
Costs of controlling invasive species;
Socio-economic impacts of habitat and community modifi cation are
Costs of restoration of modifi ed ecosystems;
already moderate (health) to severe (economic and other social and
Inter-generational inequity, particularly in relation to loss of
community impacts). The GIWA experts conclude that there are serious
ecosystem services from coastal and marine habitats of coral reefs,
economic and health issues in subsistence fi shing communities with
seagrass beds and mangrove forests.
ASSESSMENT
39
Box 4
Socio-economic costs of destructive fi shing.
Conclusions and future outlook
Fish bombs, usually constructed from soda bottles stuffed with explosive
For the GIWA concern of Habitat and community modifi cation as
potassium nitrate, detonate underwater, killing or stunning fish so that they
are easy to net. For the fisherman, the short-term gains from bombing may be
a whole, present level of environmental impact is already severe,
impressive, with a 1-2 USD investment returning up to 15-40 USD in profit on the
local market. Moreover, given the ease with which fish bombs are assembled
and future levels of environmental impact are expected to remain
- potassium nitrate is a common component of fertiliser - fishermen seldom
severe, with continuing deterioration over the next 20 years, because
want to make the switch to more sustainable, but time-consuming, technology
like spears and hooks. As a result, in coastal areas like Manado, North Sulawesi,
population growth and related exploitation of habitats and target
bombed reef fish often dominate local markets. But the practice has a devastating
effect on coral reefs, which may take more than 50 years to recover.
species will more than counter ameliorative interventions (see Causal
According to Burke et al. (2002), destructive fishing practices are the single largest
chain and Policy option analyses).
threat to Indonesia's and the region's reefs. While the benefits to an individual
fisherman may be high in the short-term, the costs as a whole are staggering. The
WRI report estimates that the cost from fish bombing alone over the next 20 years
will be at least 570 million USD. That sum is more than 10% of the debts recently
At present, most habitats are only poorly represented in protected areas
rescheduled with Indonesia's international lenders.
and, of those, most are poorly managed. For example, approximately
Cyanide use can be nearly as destructive, but its focus is often the international
market. Prized reef fish like grouper and Napoleon wrasse (Cheilinus undulatus)
4% of Philippine reefs are listed as being protected, although most of
are chased into corals, where the diver uses cyanide-filled squirt bottles to stun
the fish for capture and sale on the live reef fish market, often shipping their
these are being degraded at increasing rates from destructive fi shing,
specimens aboard large cargo ships to discerning diners in Hong Kong, Singapore,
and Taiwan, where the fish are picked out of aquariums just prior to cooking. The
sedimentation and pollution, and a lack of enforcement (Cheung et al.
cyanide does more than stun the fish, though. Coral is killed as well, particularly
since the divers often have to tear apart the coral structure with crowbars to pull
2002, Spalding et al. 2001). Coastal development also poses a serious
the fish out.
threat to coastal habitats (mangroves, seagrass beds and fringing coral
Burke et al. (2002) puts the cost
to Indonesia from cyanide use
reefs). The `Reefs at Risk' analysis for Southeast Asia (Burke et al. 2002)
at 46 million USD annually.
By comparison, the report
identifi ed areas of North Mindanao, Cebu, the Visayas Islands, Palawan
estimates the annual economic
and North Sulawesi as high threat (Figure 9).
benefit to Indonesia from it's
reefs - which not only harbour
valuable fish, but protect
shorelines from erosion and
International NGOs including WWF, The Nature Conservancy and
facilitate the growth of coastal
mangroves and seagrass beds
Conservation International, among others, are presently working
- at 1.6 billion USD.
towards assessment and management of critical biodiversity sites in
(Source: NRM Headline News 2002b. Photo: T. Heeger, ReefBase)
the region. A key strategy in slowing the rate of deterioration is the
successful implementation of marine protected areas, many of which
Notably, local businessmen involved in the live reef fi sh trade, upset
are already gazetted but lack adequate management. Improvements in
at the heightened enforcement in some MPAs (e.g. Bunaken National
management capacity are occurring, at both local scale (e.g. Apo Island
Park), began lobbying to have eff ective MPA Director's reassigned, but
and Danjugan Island, Philippines; Bunaken National Park, Indonesia;
in the case of Bunaken National Park, a concerted media campaign
Turtle Island, Malaysia) and the larger scale of the coastal and marine
has stemmed those eff orts for the time being. While surveillance and
areas of the region as a whole (e.g. WWF Sulu-Sulawesi Marine Ecoregion
enforcement may be stemming destructive fi shing in the few MPAs like
programme). The entire coastal and sea area between Malaysian Sabah,
Bunaken, the situation around Indonesia is far less promising. In areas
Indonesian East Kalimantan and Philippines is recognised as a special
like West Nusa Tenggara in the GIWA region Indonesian Seas, marine
management area named Sulu-Sulawesi Marine Ecoregion (SSME) by
police have been the subject of death threats, and fi sh bombs have
WWF, ranked as one of their top four global priority sites (number one
been thrown at police boats that dare to approach illegal fi shermen.
in Asia-Pacifi c) (Trono and Miclat pers. comm.) for coastal and marine
Moreover, the scale of Indonesia's territory, including over 9 500 km of
management. Objectives of the WWF programme are to conserve the
coastline, makes uniform enforcement and protection all but impossible.
outstanding biodiversity of the area through improved implementation
For example, the WRI `Reefs at Risk in Southeast Asia' report (Burke et al.
of ecologically sustainable forms of development that allow traditional
2002) estimates that up to 50% of Indonesia's 51 000 km2 of reef have
communities to practice customary fi shing rights, while also providing
already been degraded, with 85% threatened by human activities, which
for commercial fi sheries and seabed management. There are a total of
includes coastal development, overfi shing, and marine-based pollution.
16 gazetted protected seascapes measuring at least 10 000 ha within
Exact fi gures are diffi
cult to gauge, however, because of the paucity of
the Philippine territory of the WWF SSME. A 17th MPA was proposed as
long-term monitoring and data. Eff orts to improve existing data are
a network of small protected areas in the Visayas. At present, levels of
continuing, particularly in areas like Bunaken, but conservationists worry
funding for these initiatives are not assured, which adds an additional
that the damage being done outside national parks is far worse than that
degree of uncertainty in assessing the likely situation in the region in
which occurs within view of park offi
cials and police.
the future.
40
GIWA REGIONAL ASSESSMENT 56 SULUCELEBES SULAWESI SEA
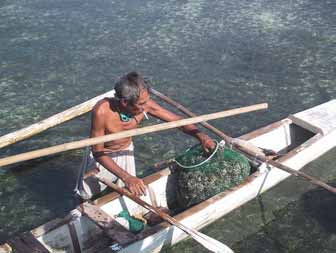
In total, some 100 marine protected areas have already been gazetted
Box 5
The Bunaken National Park, Indonesia.
in the region, including:
The Bunaken National Park is divided
into a southern mainland section (the
Pulau Sangalaki and Pulau Semama (East Kalimantan);
Arakan-Wowontulap coast, set aside
primarily for its old-growth mangrove
Bunaken National Park (North Sulawesi);
forests and dugong population) and
a northern island section (with five
Benkoka Peninsula, Elopura, Gum Gum, Kuala Segama and Kuala
islands famous for their drop-off
fringing coral reefs). Management
Maraup, Pulau Penyu (Turtle Island), Sibyte, Pulau Berhala, Pulau
authority for the park is vested in
Batik, Lahad Datu, Selangan Island, Tanjong Nagas, Semporna,
the Bunaken National Park Office
(BTNB), which is controlled by the
Trusan Kinabatangan and others in Sabah;
national-level Department of Nature
Conservation (PHKA). Today, BNP
Caohagen, Malampaya Sound, Cagayan Island, Ursula Island, Calauit
supports almost 30 000 villagers living in 22 villages within the park's borders, as
well as an active marine tourism industry with over 20 dive operators that service
Island, Davao Gulf, Panglao Island, Guindolman, Guiuan, Carbin Reef,
approximately 20 000 visitors to the park on an annual basis. Besides its high
Lassuan, Tulapos and others in the Philippines.
conservation value as an MPA in the epicentre of global marine biodiversity, BNP
contributes roughly 3.8 million USD per year in fisheries and seaweed aquaculture
production and 4.4 million USD per year in tourism revenues to the North Sulawesi
economy. Given the strong potential for conflicts of interest between conservation,
At the larger spatial scale, the Tubbataha Reefs of the Sulu Sea is the
fisheries and tourism values of the park, a multiple-use zonation system is the
centrepiece of the BTNB's park management plan (see Policy options). This
only World Heritage site conserving coral reef habitats in the region,
zonation scheme is legally mandated in Indonesia's 1990 Biodiversity Conservation
Act, which requires that management of Indonesia's national park system be
despite the conservation of representative habitats and communities
based upon zonation plans. Since the establishment of the park, USAID's Natural
through development of protected areas being a global priority (e.g.
Resources Management Project (NRM) has provided technical assistance for the
development of the park management plan (including zonation system) and the
International Coral Reef Initiative `Call to Action' and `Renewed Call
eventual zonation revision process.
(Source: Excerpted from Erdmann & Merill 2003. Photo: ® 2004, www.ecoreefs.com)
to Action'). As noted above, the Tubbataha Reef National Marine Park
comprises some 33 200 ha, inside the Palawan Man and Biosphere
Reserve (1 150 000 ha). The Tubbataha Marine Park includes the North
Indo-West Pacifi c) (Box 5). The BNP covers some 90 000 ha of coral
and South Atolls and is a unique example of atolls with high diversity
reefs, mangrove forests and seagrass beds surrounding fi ve islands
and density of tropical marine biota. The site is recognised as the most
and the northern coastal area of Sulawesi, and supports a population
biologically diverse coral reef system in the Philippines, and of great
of some 30 000 people. Bunaken National Park has become one
importance for maintenance and replenishment of harvested species
of Indonesia's most well known marine ecotourism destinations
in the greater Sulu Sea. In Indonesia, the reef areas around Bunaken
(Erdmann & Merrill 2003).
and Manado in North Sulawesi are of exceptional conservation value.
Bunaken National Park (BNP), founded in 1991, is one of the most
Integrity of the natural ecosystem of the Bunaken National Park, and
strategically important marine protected areas in the world, located
indeed parks throughout the region generally, is threatened by human
near the centre of the world's highest marine biodiversity region
activities that are both marine and land-based, such as resource
(`coral triangle' of New Guinea, Indonesia, and Philippines, the central
overexploitation, destructive fi shing practices and unsustainable
tourism. Coupled with, and contributing to, these threats is the lack
of awareness among villagers, and the lack of human resources for
management within the Park and the region generally. The low capacity
among Park personnel in the marine sector is demonstrated by the fact
that in the late 1990s the majority of recruits had forestry background
with no marine related training. These and other shortcomings
continue to hinder adequate management, although recent advances
are beginning to address some of these issues (also see Policy options
and Annex IX). For example, living coral cover (a simple and widely
used index of reef condition) was recovering following impacts from
destructive fi shing and to a lesser extent coral bleaching in the 1990s
(Box 6).
At the smaller spatial scale, the region has many community-
Figure 10 Local
fi sherman with bag of sea urchin, Olango Islands,
based MPAs, particularly in the Philippines. These have had mixed
Philippines.
(Photo: J. Oliver, ReefBase)
success in relation to management eff ectiveness, particularly in
ASSESSMENT
41
T
C
A
Box 6
Increase in coral cover in the Bunaken National Park.
Unsustainable exploitation of
IMP
A recent re-survey in 2001 of reefs around Bunaken Island in Bunaken National Park,
North Sulawesi, has shown an average increase of 6.56% live hard coral cover in the
fish and other living resources
past 8 months (with an overall average live hard coral cover of 47.5%). Such a rapid
increase in hard coral cover is extremely encouraging and provides strong evidence
that recent management initiatives assisted by NRM and its partners (the Bunaken
According to LME (2003) the Sulu-Celebes Seas Large Marine Ecosystem
National Park Office, the Bunaken Management Advisory Board, the North Sulawesi
Watersports Association, WWF Wallacea and others) are having an immediate and
is considered an ecosystem with low productivity (<150 gC/m2/year),
very positive effect upon the reefs within the park. Besides the excellent physical
based on SeaWiFS global primary productivity estimates. A major
conditions for coral growth in Bunaken (deep, clean water, frequent nutrient
upwellings and strong currents), specific management initiatives that have likely
marine export industry is supplied by the coastal trawling for prawns,
contributed to the rapid recovery include a ban on anchoring by all tourism boats,
a participatory zonation revision that includes very specific rules on activities that
while diff erent artisanal fi shing techniques are used locally to catch fi sh
are allowed within individual zones, and a 24 hour community joint patrol system
that enforces the zonation system and has virtually eliminated destructive fishing
which is the primary food resource in the region. The off shore waters
practices like cyanide fishing around Bunaken Island.
are mainly unexploited while a majority of the fi shing occurs in coastal
Increases in live hard coral cover were different among the various zones; the
tourism use zones showed an average increase of 5.9% to reach 49.4% average live
areas (LME 2003). In Indonesia as well as in the Philippines most of the
cover, while the community use zones showed the highest average increase of 7.7%
to reach 45.2% average live hard coral cover. The core conservation zone (where
landings are from small-scale artisanal fi sheries. Many fi shing techniques
no tourism or fishing activities are allowed) showed an average increase of 6.3% to
reach 46.3% average live hard coral cover. Anecdotal evidence from repeat divers
are highly destructive; for example dynamite and cyanide is used when
suggests that fish populations are also staging a comeback.
fi shing on the reefs of the Philippines. Few countries in the region have
(Source: NRM Headline News 2001)
implemented fi sheries management plans and the exploitation of the
resources of the reef is steadily increasing from the escalating number
regards to controlling fi shing pressure including destructive fi shing.
of illegal fi shermen. There is indications that the total catches from the
Examples include Apo Island (Russ & Alcala 1996a,b) and Danjugan
Sulu-Celebes LME have increased rapidly from about 30 000 tonnes in
Island (Sherwood 2002). The history of development of Danjugan
the 1950s to approximately 500 000 tonnes by 1975. The total cath of
Island Marine Reserve, the Philippines `Best Managed Reef' in
today is fl uctuating around 800 000 tonnes annually (Figure 11). The
2002 (Philippine Council of Marine and Aquatic Research Award) is
catch of molluscs, crustaceans, sharks/rays and other fi nfi shes, however,
noteworthy. In the early 1990s, the local community, Barangay Bulata,
have shown relatively modest increase, remaining relatively stable or
was suff ering from deteriorating marine resources, with declining fi sh
declining since the 1950s (LME 2003).
catches related to destructive and overfi shing. With the help of local
and international NGOs (Coral Cay Conservation Ltd. and World Land
More than 2 500 species of fi sh occur in the region, many of which
Trust) the local community improved their own self-government,
are exploited using a large variety of diff erent gears and methods.
developed conservation programmes (mangrove planting and shore
For the Indonesian areas, government statistics indicate that North
clean-ups), alternative livelihoods (mud crab (Scylla serrata) and pig
Sulawesi and East Kalimantan provide some 11% of the total national
farming), and encouraged conservation through education and
marine fi shery landings (Kahn & Fouzi 2001). The fi shery is comprised
awareness raising. This has been a largely successful process and has
predominantly of pelagic species, mostly tuna (Thunnus spp.), skipjack
encouraged other local communities to establish their own reserves
(Sherwood 2002).
900 000
Flatfishes
800 000
Molluscs
Thus, a variety of approaches to ameliorate habitat loss are being
Sharks & rays
700 000
Crustaceans
developed in the region, including initial attempts at improving the
Other fishes & inverts
Anchovies
600 000
legislative framework, and implementation of large internationally
onnes)
Tuna & billfishes
(t
Herring -likes
funded protected areas and small community-based protected
500 000
t
ch
Perch -likes
a
areas. These initiatives have a long way to go, and it is predicted
C 400 000
that the environmental and socio-economic impacts of habitat
300 000
loss will continue to deteriorate to 2020. Yet a considerable amount
200 000
of expertise now resides in the region and with improved support
100 000
there are also strong opportunities for future success (also see Policy
0
options).
1950
1955
1960
1965
1970
1975
1980
1985
1990
1995
2000
Year
Figure 11 Catches of various fi sh resources in the Sulu-Celebes
(Sulawesi) region.
(Source: University of British Columbia Fisheries Centre 2003)
42
GIWA REGIONAL ASSESSMENT 56 SULUCELEBES SULAWESI SEA
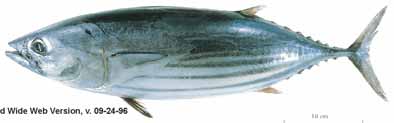
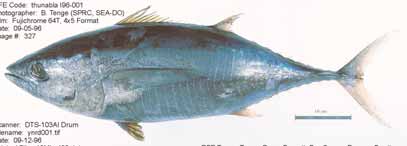
(Katsuanus sp.), scads and sharks, representing some 80%
and 60% of total production of North Sulawesi and East
Kalimantan respectively.
Environmental impacts
Overexploitation
Overexploitation is having severe environmental impact with many
demersal reef fi sh, holothurian, mollusc and crustacean stocks heavily
Figure 13 Yellowfi n tuna (Thunnus albacares).
overfi shed. About 70% of Philippine coral reefs are heavily overfi shed,
(Photo: B. Tenge, Regulatory Fish Encyclopedia)
producing less than 5 tonnes/km2/year, with clear indications of
`trophic overfi shing', in comparison with the remaining 30% of reefs
which produce in the order of 15-20 tonnes/km2/year (Licuanan &
market-sized fi shes, including a notable lack of large piscivorous species
Gomez 2000). There is also overexploitation of sharks, tuna, bill-fi sh and
such as groupers, barracudas, jacks and sharks. Crayfi sh appear to have
other pelagic species. Sharks are also caught as by-catch of the trawl
been fi shed to the brink of local extinction.
fi sheries and the tuna long-line fi shery. Benthic invertebrate fi sheries,
particularly sedentary species of holothurian sea-cucumbers (mostly
At present, neither the status nor the future viability of the fi sheries are
Holothuria spp. (also known as `trepang' or `beche-de-mer'), trochus
well understood, and for many fi sheries, their status may be summarised
(Trochidae), green snails (Turbo marmoratus) and clams (Tridacna spp.),
as being illegal, unreported and unregulated (IUU). There have been
are overfi shed, mostly around the major coastal population centres.
increases in biomass of Skipjack tuna (Figure 12) of the order of 400 000
Crayfi sh (Panulirus spp.) are also overexploited in oceanic waters, sandy
tonnes according to the Philippines Department of Agriculture Bureau,
reef lagoons and fl ats and mangrove areas.
but this is in part related to reduction in biomass of Bluefi n and
Yellowfi n tuna (Figure 13) stocks that previously occupied the niche in
Large-scale commercial operations have targeted beche-de-mer and
western and central Pacifi c, and possibly to ENSO eff ects also. Clearly,
shark, and poison fi shing for demersal reef fi sh to supply the live fi sh
there are serious discrepancies in the diff erent data available, with a
food trade in Hong Kong and China have burgeoned in the 1990s,
total catch of some 500 000 tonnes for all marine products (as cited in
with prices increasing but catch per unit eff ort (CPUE) declining
the paragraph above) on the one hand, yet some 400 000 tonnes for
sharply (Cesar et al. 2000). There has also been a signifi cant increase in
Skipjack tuna alone. Notably, the Philippines Department of Agriculture
eff ort in the pelagic fi sheries, with more than 500 boats working from
Bureau statistics suggests that yields of some species have continued to
Indonesian waters.
increase, but that catch per unit eff ort has declined steadily, suggestive
of `Ecosystem Overfi shing'. A similar situation exists for some Indonesian
Surveys of the Calamianes Islands (northernmost section of Palawan
Government statistics, particularly in relation to Maximum Sustainable
province) found only one octopus from 38 sites surveyed over 16 days
Yields (MSY), in part related to diff erent assessment criteria and areas.
(Werner & Allen 2000). There were also very low numbers of spider shells
(Lambis spp.), conchs (Strombidae) and abalone shells (Haliotus spp.),
As noted by Kahn and Fauzi (2001): "Overall, the state of (environmental
which indicates extraordinarily high fi shing pressure. There were only
and socio-economic) assessment of Sulu-Sulawesi Sea...fi sheries
a few commercially exploited seashells found and severe depletion of
resources is not very accurate and there is a great amount of uncertainty.
Based on the limited data available it can be concluded that
some of the fi sheries have already reached or surpassed their
limits. For others, the total lack of information indicates that
further expansion would be inappropriate.... It is estimated that
90% of the fi shery eff ort in Indonesia is carried out by artisanal
and subsistence fi shermen whose catches go unrecorded by
offi
cial government statistics and it is partly for this reason
that government estimates of annual catches...are considered
to be gross under-estimates".
Figure 12 Skipjack tuna (Katsuwonus pelamis).
(Photo: B. Tenge, Regulatory Fish Encyclopedia)
ASSESSMENT
43
Excessive by-catch or discard
Estimated threat level
There is little or no by-catch or discards in the region, as virtually all of
Luzon
High
the much-diminished catch, including turtles, sharks and even whales,
Medium
is kept and eaten by local fi shermen. Two exceptions to this are the by-
Low
Mindoro SIBUYAN SEA
catch produced by distant-waters fl eets and through use of blast fi shing
Samar
Calamian
and poisons. Discards from the foreign fl eets include shark carcasses
VISAYAN SEA
without fi ns; sharks are a major feature of by-catch in fi sheries targeting
Visayan islands
tuna, swordfi sh, shrimp and squid; and carcasses are discarded after
n
Philippines
lawa
the removal of their fi ns (FAO 1998). There is also signifi cant by-catch of
Pa
BOHOL SEA
rare and endangered species of turtles and marine mammals, such that
S
U
L
U
S
E
A
Mindanao
the environmental impact of the issue is severe. Massive destruction of
marine mammals, sea turtles and fi sh has been reported from trap nets
placed in a pelagic migratory channel at Tangkoko Nature Reserve in
Sulu Archipelago
the Manado area, North Sulawesi, Indonesia. Between March 1996 and
Sabah
(Malaysia)
February 1997, it is estimated that catches included some 1 424 Manta
rays, 18 Whale sharks, 312 other sharks, 4 Minke whales, 326 dolphins,
C
E
L
E
B
E
S
S
E
A
East Kalimantan
577 Pilot whales, 789 Marlins, 84 turtles and 9 dugongs (Rossiter 2002).
(Indonesia)
The illegal fi shing is believed to be operated by a joint Taiwanese/
Indonesian venture, and has caused outrage among local people.
Sulawesi (Indonesia)
MAKASSAR
STRAIT
Destructive fi shing practices
Destructive fi shing is also having a severe impact in the region (Pilcher
GIWA 2004
& Cabanban 2000). There is widespread habitat destruction of coral
Figure 14 Reefs at risk due to destructive fi shing practices in the
Sulu-Celebes (Sulawesi) region.
reefs from blast and poison fi shing and damage to soft-bottom
(Source: Burke et al. 2002)
communities from trawling is extensive in the region; with widespread
use of explosives (reef bombing), notably in the Tubbataha reefs south
of Palawan, and use of cyanide for fi shing (Figure 14). Increases in reef
Impact on biological and genetic diversity
bombing have been attributed to increasing competition among
The present environmental impact on biological and genetic diversity
fi shers and corresponding declines in catches. Many reefs in the region
is also severe because there have been extinctions of native species
have also been targeted for the lucrative live fi sh food trade in Hong
and local stocks as a result of introductions of Tilapia and African
Kong and mainland China (with prime live reef fi sh worth 100 USD/kg).
catfi sh and a clear decrease in heterozygosity in cultured fi sh stocks.
Fish were collected initially using potassium cyanide or sodium cyanide
The introduced fi shes are eating and displacing endemic fi shes in
and more recently also using poisons derived locally from plants (e.g.
Lake Buhi and other areas, with corresponding changes in community
Johannes & Riepen 1995). Poison fi shing has also been used in collection
structure and diversity.
of ornamental reef fi shes for the international aquarium trade (Johannes
& Riepen 1995).
Socio-economic impacts
Socio-economic impacts related to unsustainable exploitation of
Decreased viability of stocks
fi sh are already severe, particularly in the smaller islands and internal
Decreased viability of stocks through contamination and disease has
waters. In the Philippines, the fi shing sector has the highest birth
caused only slight environmental impact. However, there are some
rate and population increase (more than 4%) and highest levels of
developing problems arising from the increased occurrence of `red
poverty. In many areas, children within fi sher families are malnourished
tides', diseases in pilchards and diseases spreading from aquaculture
as most fi sh are exported and fi sh consumption has declined from
farms in the Philippines. Tilapia culturing is being conducted in
approximately 36 to 24 kg per/person/year, with concomitant decline in
approximately 10% of the lakes in the Philippines, although there has
local rice production in recent times. There are few alternative options,
been a marked decline in aquaculture production in some lakes.
particularly on the small islands, and the levels of poverty are such that
many children are `trapped' into becoming fi shermen. There is currently
44
GIWA REGIONAL ASSESSMENT 56 SULUCELEBES SULAWESI SEA
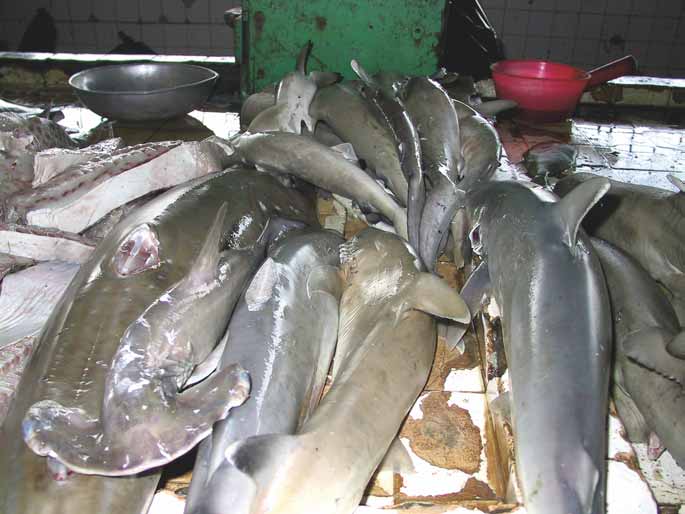
Figure 15 Sharks in a market, Sandakan, Malaysia.
(Photo: S. Palaniappan, ReefBase)
decreased catch per unit eff ort with most fi shers having to spend longer
There are important gaps in socio-economic data, particularly in relation
hours to obtain the same catch (Cesar et al. 2000).
to commercial connections among population centres and peripheries
in terms of resource extraction, traditional village engagement with the
Commercial fi shing boomed between 1970 and 1980 in the Philippines,
marine environment and the extent to which police and military are
with about 400 fi shing units in Calamianes, which declined rapidly to
involved in resource extraction, both legally and illegally (Kahn & Fauzi
only 10 units (Ingles 2000) due primarily to decreasing low returns from
2001). Severe socio-economic impacts are also posed by foreign fl eets
fi shing. In the artisanal sector, the demand for seafood has led to an
that continue to threaten the region, both within and outside MPAs. For
increase in small-scale commercial fi sheries. In the Calamianes Islands,
example, local fi shermen in Bunaken National Park increasingly report
the growth in the number of fi shers is much higher than that of the
confl icts with foreign tuna fi shermen, and are now actively vandalising
agricultural or other sectors (Ingles 2000). In Manila Bay (in GIWA region
foreign fi shing gears when they encounter them (such as long line radio
57 Indonesian Seas), there are 246 fi shers per km of coastline (Armada
buoys, fi sh aggregating devices etc.). The Bunaken fi shermen face a
1994). The socio-economic costs of destructive blast and poison fi shing
double socio-economic impact, with Filipino boats actively poaching
in Indonesia have been documented by WRI (2003) which estimates
the waters just northwest of the park, while Taiwanese, Korean and
the cost to Indonesia from cyanide use at 46 million USD annually.
Hong Kong boats (with offi
cial licenses) work the seas to the north
By comparison it is estimated that the annual economic benefi t to
and east of the park. The latter have greatly increased in number since
Indonesia from its reefs are 1.6 billion USD.
the spread of violence in Ambon, when a number of foreign fl eets
ASSESSMENT
45
relocated from Maluku to Bitung as their home port. Unfortunately,
Sulu and Celebes Seas, are at high level of threat from overfi shing
as these bigger and more technologically advanced foreign fl eets
(Figure 8). Evidence over the past several decades from the region
decimate North Sulawesi's stocks, the Bunaken fi shermen must travel
and elsewhere has changed the once widespread belief that reef and
further and further to catch fi sh (often 3-5 hours travel outwards by
other fi sheries were virtually inexhaustible. As Jackson et al. (2001) point
wooden speedboat from the island), and now increasingly resort to
out: "Overfi shing is not a recent phenomenon. Ecological extinction
spear fi shing and gillnetting on Bunaken's heavily touristed reefs in
caused by overfi shing precedes all other pervasive human disturbance
order to catch fi sh to feed their families. Tourism and fi shing, once
to coastal ecosystems, including pollution, degradation of water
compatible, are now increasingly at odds due largely to the activities
quality, and anthropogenic climate change. Historical abundances of
of foreign fi shing fl eets.
large consumer species were fantastically large in comparison with
recent observations. Paleoecological, archaeological, and historical
Thus the key socio-economic impacts of unsustainable exploitation of
data show that time lags of decades to centuries occurred between
living resources in the region include:
the onset of overfi shing and consequent changes in ecological
Reduced subsistence food supply through reduced CPUE to
communities, because unfi shed species of similar trophic level assumed
small-scale local village fi shermen throughout the Philippines and
the ecological roles of overfi shed species until they too were overfi shed
Indonesia;
or died of epidemic diseases related to overcrowding".
Reduced economic returns to small-scale local village fi shermen
throughout the Philippines and Indonesia;
Many of the fringing coral reefs have been chronically overfi shed over
Loss of employment/livelihood among local village fi shermen
the past several centuries, with major loss of production and serious
throughout the Philippines and Indonesia;
adverse `cascading' eff ects to other components of the ecosystems
Confl ict between user groups for shared resources (e.g. among
(Ormond et al. 1990, Hughes 1994, Jackson 1997, Carlton 1998, Jackson
local village subsistence fi shermen in Philippines and outsiders,
et al. 2001). In addition to the reduction in population sizes (e.g.
notably foreign vessels and those involved in the live reef fi sh
major declines in Bluefi n and Yellowfi n tuna populations) and local
export trade);
extinctions, overfi shing has led to:
Loss of food sources (e.g. sources of protein) for human and animal
Decreased Catch per Unit Eff ort (CPUE);
consumption, throughout many parts of the Philippines;
Smaller size fi shes and reduced catch sold at markets;
Reduced earnings in one area by destruction of juveniles and brood
High by-catch of rare and endangered species;
stock in other areas (migrating populations and/or life history
Decrease in commercially exploited seashells (e.g. spider shells);
stages);
Degraded habitats through use of destructive fi shing methods.
Loss of protected species (e.g. widespread local extinction
of dugong from much of their traditional feeding grounds in
As noted above, about 70% of Philippine reefs are heavily overfi shed,
Philippines);
producing less than 5 tonnes/km2/year, with clear indications of trophic
Increased risks of disease in commercially valuable stocks, including
overfi shing, in comparison with the remaining 30% of reefs which
introduced diseases through increases in aquaculture;
produce of the order of 15-20 tonnes/km2/year (Licuanan & Gomez
Inter-generational equity issues (access to resources) among poor
2000). Some 64% of coral reefs are at medium or higher risk from
local fi sher families;
overfi shing, with 20% at high risk. Similarly, high levels of threat exist
Potential for human health impacts.
for destructive fi shing, particularly around Palawan, other Philippine
islands and northeast Sabah (Burke et al. 2002).
Conclusions and future outlook
For the GIWA concern of Unsustainable exploitation of fi sh as a whole,
Data from reefs of the Philippines indicate that carnivorous families
the present level of environmental impact is severe. Because of the
of reef fi sh will not fully recover their pre-fi shed levels of biomass for
increasing coastal population, greater commercialisation, decline
20-40 years after eff ective protection has been implemented, when
in resources, lack of eff ective regulation and poor or non-existent
20-25 kg of catch may be taken from 1 000 m2 of reef area annually
enforcement, there is expected to be signifi cant deterioration in all
(equivalent to 20-25 tonnes per km2) (Alcala pers. comm.). It is estimated
fi ve issues by 2020, and environmental impact is expected to remain
that a 50% reduction in fi shing eff ort will be needed to restore many
severe. Most coastal coral reef areas of the Philippines, particularly
fi sheries to sustainable levels, particularly in the municipal coastal
those fringing the northern Sulu Sea and those separating the
fi sheries which, at present, are 90% artisanal and 10% commercial
46
GIWA REGIONAL ASSESSMENT 56 SULUCELEBES SULAWESI SEA
(e.g. Kahn & Fauzi 2001). It is also predicted that there will be a 10-30%
assessment and monitoring. These need to be founded in an improved
defi cit in wild-caught fi sh production by 2010, to be supplemented by
understanding of the population biology of the target species and
aquaculture.
issues of ecological scale and connectivity in relation to replenishment.
In particular, there is a lack of reliable data on:
All socio-economic indicators are also expected to deteriorate by 2020,
Catch volumes and CPUE;
with severe environmental, economic, social and community impacts
Traditional knowledge (e.g. locations of spawning aggregation
associated with overexploitation of fi sh. This prediction may be
sites of major commercial species), for development of protection
ameliorated to some degree by improved enforcement of regulations
measures;
(e.g. Philippines Fisheries Code) and through successful interventions by
Natural changes in diversity, distribution and abundance of major
government and NGOs (see Policy options and Annexes III, IV). There is
commercial species, in relation to seasonality eff ects, predator-prey
also strong potential for well-planned mariculture of some ornamental
relationships and recruitment fl uctuations (Kahn & Fauzi 2001).
and food species, with the need for development of appropriate policy
and legislation.
T
C
A
The management of fi sh stocks in the Indonesian parts of the region is
Global change
IMP
overseen by the Directorate General of Fisheries under the Ministry of
Fisheries and Marine Aff airs (Kahn & Fauzi 2001) (see Annexes III-V), and
At present, annual rainfall is greater than 1 000 mm in most parts of
is in accordance with national policies and objectives:
the region and annual minimum temperatures are less than 20░C other
To raise income and standard of living of small-scale fi shermen and
than in the highlands. Rainfall is highest on the upland areas, notably
fi sh farmers;
of central and northern Borneo, central Palawan, and central and
To increase productivity of fi shing eff ort and to boost national fi sh
eastern Mindanao, with more than 3 000 mm of rain annually. Some
production;
parts of the lowlands, coastal areas and other areas in rain shadows
To increase fi sh consumption;
(less than 1 000 mm per year) may experience severe water shortages.
To increase export of fi sheries products;
The northern and central parts of the region are aff ected by revolving
To have better control of the utilisation and management of fi shery
tropical storms (typhoons), bringing intense rains and destructive winds
resources.
and swells to coastal areas. Passing from the Pacifi c into the South China
Sea through the Philippines Archipelago, typhoons can deliver in excess
In North Sulawesi, cooperation and coordination for managing marine
of 1 000 mm of rain in less than one week, causing extensive fl ooding
resources were established through a dialogue forum, primarily to avoid
and loss of life in worst aff ected areas.
confl ict among user groups (Kahn & Fauzi 2001). In order to address
overfi shing and biologically critical areas, management is directed
The region receives an infl ux of surface oceanic water from the North
towards limiting entry and to development of non-marine activities
Equatorial Current, fl owing into the area from the northeast through
(e.g. mariculture and brackish water ponds). Some regulations have
corridors in the Visayas and northern Mindanao, with sub-surface fl ow
been implemented including:
in the opposite direction. Additionally, waters from the South China Sea
Selective
fi
shing
gears;
may fl ow seasonally into the Sulu Sea around the northern coast of Sabah,
Establishment of fi shing zones;
transporting sediment-laden waters from northwestern Sabah (Bate
Extension services for the utilisation of mangrove forest;
1999). Surface waters of Sulu-Celebes (Sulawesi) Sea fl ow south out of
Enforcement of regulations controlling illegal fi shing;
the region through the Makassar Strait and also between Sulawesi and
Establishment of no-take zones in MPAs (e.g. Bunaken National
Morotai-Halmahera, contributing to the Indonesian through-fl ow.
Park).
The GIWA Task team identifi ed the need to include an additional issue
Despite these management measures, the region's fi sheries stocks
with major implications for coral reefs in the region: Changes in sea
remain in urgent need of careful stewardship if their sustainable
surface temerature. Criteria used for scoring this issue are appended in
future utilisation is to be assured. This will primarily require a high
Annex VI.At the time of the assessment in 2001, there were no known
degree of local intervention and community-based support,
environmental impacts associated with increased UV-B radiation and
eff ective enforcement of fi sheries regulations, and also reliable stock
changes in ocean CO source/sink function in the region.
2
ASSESSMENT
47


Environmental impacts
since 1983, notably during mid-1998 around Santa Cruz Island, Mindanao
Changes in hydrological cycle and ocean circulation
and Balayan Bay in the Philippines. Sea surface temperatures between
Changes in hydrological cycle and ocean circulation has had slight
May and August 1998 were up to 2░C above average (29-30░C) in areas of
environmental impact, as expressed through changes in the local/
the Sulu-Celebes Sea and adjacent South China Sea (Figure 16), causing
regional water balance in recent decades, and increased variability of
extensive bleaching in worst aff ected reefs. In Tubbataha National Park,
current regimes (including those caused by changes in ENSO events).
mean live coral cover decreased by approx. 19% after bleaching in 1998,
There is oceanographic evidence for changes in internal waves in the
and has remained stable through 1999 to 2001 (Chou et al. 2002). There
Sulu Sea.
was good recovery of most other bleached areas and, on average, the
bleaching events appear to have been less severe than those from some
Sea level change
other countries (Wilkinson 2002), with the caveat that some of the data
Sea level change has also had slight environmental impact, with limited
are anecdotal.
evidence of recent and unprecedented fl ooding of Turtle Island and
Tubbataha World Heritage Park.
Socio-economic impacts
The socio-economic impacts associated with Global change are slight at
Changes in sea surface temperature
present, although there have already been some economic and health
Considering the abundance and importance of coral reefs to the
eff ects. These have been caused by freshwater shortage and fl ooding,
region, an additional issue: Changes in sea surface temperature (also
the former clearly linked with the ENSO. For example, major fl oods in
see Annex VII), was added to the assessment because of the major
Malaysia occurred in 1967, 1971, 1973 and 1983. Some 29 000 km▓ are
implications this factor has for these ecosystems.
considered as fl ood-prone areas, aff ecting about 2.7 million people. The
average annual economic damage caused by fl oods was estimated at
Changes in sea surface temperature has had slight impact already, with
40 million USD in 1980 (FAO AQUASTAT 2003). Other socio-economic
changes in the structure of coral reef communities from elevated Sea
problems include overextraction of freshwaters and salinisation of wells;
Surface Temperatures (SSTs) during various coral reef bleaching events
and with linkages to habitat loss (clearing and forest fi res). These key
socio-economic indicators are adversely aff ected to greater or lesser
SST anomaly during 1998 (░C)
degree, particularly into the future:
Normal temperature
Freshwater availability which is a food security issue, with some 20
1-2
million Filipinos having little or no access to secure potable water
2-3
supply);
More than 3
Increased costs of human health care, particularly related to lack of
Bleaching observation 1998-1999
water;
Changes in productivity of agriculture, fi sheries and forestry,
particularly in relation to loss of terrestrial habitats through
continued clearing and drought-induced forest fi res, and coastal
and marine habitats through land reclamation and destructive
fi shing;
Changes in resources distribution and political jurisdiction;
Response costs for extreme events, with potential increase in
frequency and intensity of typhoons and droughts in diff erent
parts of the region (Figure 17);
Loss of income and employment related to all of the above;
Loss of income and foreign exchange from fi sheries, as destructive
and overfi shing deplete resources (e.g. some 70% of Philippines
coral reefs are already overfi shed) (see Unsustainable explitation
® GIWA 2004
of fi sh and other living resources);
Figure 16 Sea surface temperature anomalities during 1998 in
Loss of opportunity for investments (both domestic and foreign).
the Sulu-Celebes (Sulawesi) region.
(Source: NOAA/NESDIS 2003)
48
GIWA REGIONAL ASSESSMENT 56 SULUCELEBES SULAWESI SEA
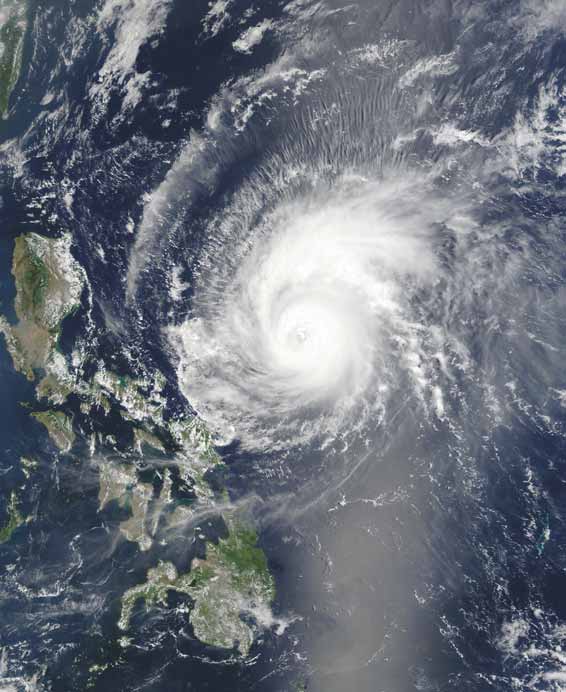
and overfi shing. Given these uncertainties,
environmental impacts of global change
are expected to remain slight until 2020.
There are, however, likely to be global
change eff ects on freshwater shortage
and oceanography (through predicted
changes in frequency and intensity of
ENSO), and on coral reef ecosystems
through predicted changes in ocean
chemistry (CO source-sink function)
2
and SST. Corresponding socio-economic
aspects are expected to deteriorate over
the next 20 years, with moderate levels of
economic impact and slight health and
other social and community impacts by
2020. The socio-economic impacts are
likely to be similar those listed above.
Priority concerns
Future scenarios for the region suggest a
human population increase of between
2-3% per year to approximately 50 million
by 2020, with increasing urbanisation
and increasing reliance on extractive
industries. International trade is expected
to triple by 2020 (Chua pers. comm.), with
major expansion of international shipping
through the ULCC route. There are likely to
Figure 17 Typhoon
Kujiraoff the coast of the Philippines,
April 19, 2003.
be signifi cant increases in both artisanal and industrial fi shing, mining
(Photo: NASA)
and various forms of plantation agriculture and forestry, and limits on
other sectors from freshwater shortage and other concerns.
Conclusions and future outlook
The GIWA concern of Global change has had only slight overall
There are trends of increasingly large-scale forestry, by both national
environmental impact at present. There is increasing per capita release
and international commercial operators, increasing industrial fi sheries
of carbon dioxide and the increasing populations in both the Philippines
and commercial agriculture. Large areas of the `loggable (harvestable)
and Indonesia will exacerbate local production of greenhouse gases over
forests' have already been logged and other areas have been assigned
the next 20 years. However, there is considerable uncertainty in climate
for logging, contributing to severe soil erosion. Large-scale sediment
model predictions of changes in temperature and sea level. Additional
mobilisation from unregulated forestry and agriculture has already
uncertainty is caused by the region's complex geological dynamics,
impacted on water quality of streams and rivers and ultimately on
and also by the capacity for an unknown degree of acclimation and
estuarine and coastal habitats (e.g. fringing reefs) and processes in
adaptation of species and ecosystems (e.g. see Done 1999 for coral
much of the region. In the Philippines, of the order of 1 billion m3
reefs, and also Pilcher & Cabanban 2000). The climate change eff ects
of sediment is lost to coastal waters annually, carrying high loads of
are and will be obscured by the continued eff ects of habitat destruction
particle-bound nutrients (e.g. see Burke et al. 2002). This is of particular
ASSESSMENT
49
concern given that the timber industry has traditionally suff ered from
There are already serious health issues arising from episodic freshwater
mismanagement and corruption, although there have been some
shortage in the Philippines. The rate of deterioration can be minimised
recent improvements. Nonetheless, implementation of `best-practice'
by on-going and future planned interventions, including those
forestry management, such as the retention of buff er zones along
at multi-lateral, national, provincial and local government levels
watercourses, is rarely enforced and violations are common. One
and through the concerted eff orts of several international NGOs.
exception is Palawan (Philippines), where logging was halted through
Nonetheless, continuing international assistance will be required in
eff ective implementation of legislation in the early 1990s (Annex V),
the short-term for major improvement in water-related issues and
providing a major reduction in sediment loss from the catchments and
concerns.
much needed protection for the fringing coral reefs and other coastal
and marine habitats (Hodgson & Dixon 1992).
There was an unambiguous overall prioritiation of the fi ve GIWA
concerns, when assigning equal weight to environmental, economic,
There is already signifi cant off shore oil and mineral exploration, with
human health and social and community impacts. The GIWA concerns
potential for substantial expansion in coming decades. Exploitation
are prioritised as follows:
of commercial pelagic fi sheries for tuna and billfi sh is expected to
1. Unsustainable exploitation of fi sh and other living resources
increase by 2020. The industrial fi shing fl eets are expected to expand
2. Habitat and community modifi cation
across the various ownership types, including private companies, joint
3. Pollution
corporations and state-owned enterprises, with currently more than
4. Freshwater
shortage
1 000 large foreign vessels operating in the Indonesian EEZ (Kahn &
5. Global
change
Fauzi 2001). There are also plans to expand aquaculture and mariculture
operations substantially. In Indonesia, up to 1 million ha of land, mostly
Unsustainable exploitation of fi sh and other living resources has the
mangrove forests, were allocated by the government for the shrimp
highest priority, with severe present levels of environmental, economic,
hatchery industry in the 1980s to 1990s. The World Bank was one of
health and other social and community concerns. Habitat loss and
the major donors to the programme. By 2001, more than 70% of the
community modifi cation is an equal priority from an environmental,
shrimp farms had been abandoned, because the operators found
economic and other social and community impacts perspective, but
them unsustainable due to the high concentrations of chemicals
of slightly less priority in terms of health impacts. Pollution is the third
and the destruction of the mangrove habitat. Future protection of
priority, with moderate levels of environmental and socio-economic
the remaining coastal habitats and adjacent coral reef areas will be
impact. Freshwater shortage is the fourth priority, with moderate
important if these key habitats at the global centre of biodiversity are
levels of environmental and economic impact, but only slight health
to be sustained.
and other social and community impacts at present. Global change
is the fi fth priority, with only slight present environmental and socio-
Total pressures on international water resources are likely to increase
economic impacts.
moderately, causing signifi cant deterioration in both the environment
and socio-economic structures, despite improved regulation. The
It is clear that the international waters environment and socio-economy
worst aff ected coastal areas in the Philippines face moderate to severe
of much of the region is already under severe impact, requiring
environmental impacts causing severe socio-economic hardship by
continued concerted international intervention for any chance of
2020. There is a lack of capacity for eff ective policing or enforcement of
amelioration in the short to medium-term. There is expected to be
regulations or for developing measures for alleviation of existing water-
moderate to severe deterioration in most concerns, with consequent
related problems, primarily because of low fi nance and a relatively
diffi
culties in prioritising those of most importance. With equal
small taxation base. For example, the Sulu-Celebes (Sulawesi) Sea is a
weighting applied to the four indicators, Unsustainable exploitation
tempting target for illegal fi shing activities, including commercial fi shers
of fi sh and other living resources, Habitat loss and community
from throughout Southeast Asia and foreign fl eets, many of which do
modifi cation and Pollution all scored the maximum value, and are
not carry legal permits. Unfortunately, accurate data on the extent,
all expected to have severe environmental and socio-economic
number of vessels and their mode of operations are rare, although it is
impacts by 2020. Freshwater shortage is expected to have moderate
thought that such illegal activities have signifi cant environmental and
environmental and socio-economic impact and Global change slight
socio-economic impacts (Kahn & Fauzi 2001).
to moderate impact.
50
GIWA REGIONAL ASSESSMENT 56 SULUCELEBES SULAWESI SEA
Habitat loss and community modifi cation received highest priority
shortages in some parts of the region and fl ooding in others during the
ranking for the future, followed closely by Unsustainable exploitation of
1990s, and future predicted increases in ENSO are likely to have major
fi sh and other living resources and then Pollution. Freshwater shortage,
environmental and socio-economic impact, particularly given that the
the fourth priority, is expected to be under moderate environmental
human population is expected to double by 2035. Global change eff ects
threat by 2020, with the possibility of an improving economic situation
on habitats are predicted to be manifested through both freshwater
but deteriorating health and other social and community concerns.
shortages and fl ooding, particularly in lowland stream, river, marshland
This concern is already being addressed at international and national
and riparian communities. Potentially severe global change eff ects are
levels (e.g. PhilWater Conference 2001), which may contribute to its
also expected for coral reef habitats, through the synergistic eff ects
amelioration by 2020.
of changes in ocean alkalinity aff ecting reef calcifi cation processes
(Kleypas et al. 1999), and through elevated SSTs causing widespread reef
Future impacts from Global change were suffi
ciently uncertain for
bleaching and death (Hoegh-Guldberg 1999). There are also expected
it to be ranked as the least of the GIWA concerns for 2020, although
to be severe consequences from complex linkages between habitat
potentially strong linkages with Freshwater shortage and Habitat
loss and fi sheries, and pollution and fi sheries. The fi shing industry also
loss and community modifi cation were identifi ed, complicating the
interacts directly with other resource industries, including forestry,
prioritisation analysis. Global change eff ects on Freshwater shortage
farming, mining and tourism, and these industries may also threaten
are likely to be manifested through changes in the frequency and
the productivity of fi shing grounds (Kahn & Fauzi 2001).
intensity of ENSO events, typhoons and droughts. ENSO caused water
ASSESSMENT
51
Causal chain analysis
This section aims to identify the root causes of the environmental
System description
and socio-economic impacts resulting from those issues and
concerns that were prioritised during the assessment, so that
The key aspects of the system are described in detail in the Regional
appropriate policy interventions can be developed and focused
defi nition and Assessment above. The Sulu-Celebes (Sulawesi) region is
where they will yield the greatest benefi ts for the region. In order
located in the Indo-West Pacifi c centre of diversity and supports mega-
to achieve this aim, the analysis involves a step-by-step process
diversity, located near the junction of three major biogeographic zones
that identifi es the most important causal links between the
(Roberts et al. 2002, Cheung et al. 2002). The warm clear waters of the
environmental and socio-economic impacts, their immediate
Sulu-Celebes Sea, its active underwater volcanoes, its seamounts,
causes, the human activities and economic sectors responsible
trenches, corals and inter-island passages, its currents and upwellings,
and, fi nally, the root causes that determine the behaviour of
constitute an exceptionally rich marine life hot spot. The region
those sectors. The GIWA Causal chain analysis also recognises
supports a signifi cant proportion of the total coral reef area of the
that, within each region, there is often enormous variation in
Philippines, with some 20 000 km2 of coral reefs, and forms part of
capacity and great social, cultural, political and environmental
the `coral triangle' of highest coral diversity with Indonesia and New
diversity. In order to ensure that the fi nal outcomes of the GIWA
Guinea containing more than 500 reef-building species. The Sulu-
are viable options for future remediation, the Causal chain
Celebes Large Marine Ecosystem support around 400 species of algae,
analyses of the GIWA adopt relatively simple and practical
5 species of sea turtles, 22 species of marine mammals and over 450
analytical models and focus on specifi c sites within the region.
types of coral (LME 2003). More than 2 500 species of fi sh occur in the
For further details on the methodology, please refer to the GIWA
region, many of which are exploited using a large variety of diff erent
methodology chapter.
gears and methods. The fi shery is comprised predominantly of pelagic
species, mostly tuna (Thunus spp.), skipjack (Katsuanus sp.), scads and
Strong linkages were identifi ed in the Assessment between Pollution
sharks, representing some 80% and 60% of total production of North
(suspended solids) and Habitat and community modifi cation, as well
Sulawesi and East Kalimantan respectively.
as between Habitat and community modifi cation and Unsustainable
exploitation of fi
sh and other living resources (particularly
For more than 10 000 years, the indigenous population of the region
overexploitaiton and destructive fi shing practices), via benthic trawling
has harvested the sea's seemingly unlimited supply of marine life. The
and blast and poison fi shing (with strong transboundary links through
Tubbataha Reef and other coastal areas of the Sulu-Celebes Sea, while
the live reef fi sh export trade to East Asia). The Causal chain analysis
serving as important spawning grounds for the entire region, also
for Habitat loss and community modifi cation thus focuses on these
provide a livelihood for the fi shing communities crowding its shores.
strong linkages.
Population pressure in the local fi shing communities, poverty, and a lack
of economic alternatives all contribute to the problem. The resources
of the region are a source of hard currency for the debt-burdened
government. Tourism increases every year and contributes both to the
local and to the national economy (LME 2003).
52
GIWA REGIONAL ASSESSMENT 56 SULUCELEBES SULAWESI SEA
Methodology
Increased siltation, with severe levels of suspended solids in coastal
waters (Hodgson & Dixon 1988, Cesar 1996, Bate 1999, White
The Causal chain analysis was based on the extensive background
et al. 1999, Talaue-McManus 2000, Chia & Kirkman 2000, Burke et al.
knowledge and publications of the GIWA Task team and additional
2002);
information provided by various government agencies, academic
Increased nutrients in run-off , with blooms of toxic dinofl agellates,
institutions, NGOs and other agencies, as cited herein. Some large gaps
linked with sediment-bound nutrient enrichment (Ludwig 1985,
in information remain. In particular, there is a serious lack of long-term
Gunnerson & Cuellar 1988, Werner & Allen 2000);
socio-economic data on human resource use patterns.
Ecosystem productivity change including resource depletion,
reduction in ecosystem services (e.g. forestry, fi sheries), and
depletion of targeted and non-targeted species (Atmadja & Man
1994);
Causal chain analysis
Change in community structure (Chou et al. 1994, Werner & Allen
2000);
Figure 18 shows the causal links for habitat modifi cation in the Sulu-
Excessive take of protected species e.g. marine mammals, turtles
Celebes (Sulawesi) region.
and giant clams (Rossiter 2002);
Confl ict among resource users (Rossiter 2002).
Environmental and socio-economic impacts
The key environmental and socio-economic indicators of Habitat loss
Immediate causes
and community modifi cation are:
Modifi cation of terrestrial and coastal habitats
Loss and/or fragmentation of forest cover (Drigo & Marcoux 1999,
Suspended solids
Burke et al. 2002);
Habitat loss and community modifi cation caused by suspended solids
Loss and/or fragmentation of riparian vegetation and rivers, rice
are severe in rivers, streams and coastal waters throughout most of the
paddies;
region (Hodgson & Dixon 1988, 1992, Bate 1999, Talaue-McManus 2000,
Loss and/or fragmentation of coastal habitats such as mangroves
Chia & Kirkman 2000, Burke et al. 2002). This may be attributed to severely
and seagrasses (Chou et al. 2002);
altered land cover, especially in the southern Philippines. This has been
Loss and/or fragmentation of coral reefs (Alcala & Gomez 1987,
modelled by the Reefs at Risk in Southeast Asia Project (Burke et al. 2002),
Chou et al. 2002, Wilkinson 2002, Burke et al. 2002);
which estimated sediment risks (relative erosion rates) impacting coral
Issues
Immediate causes
Sectors/Activities
Root causes
Habitat and
Modification of terrestrial and
community
Agriculture
Governance and legal
coastal habitats
modification
Suspended solids
Use of fertilisers and other
chemicals
Forestry
Technology
Land reclamation
Industrial waste
Oil and gas exploration
Industry
Economic
Unsustainable exploitation of
living resources
Overfishing
By-catch by trawling and
Demographic
Urbanisation
long-line
fishing
Destructive fishing practices
Illegal fishing
Knowledge
Infrastructure
development
Natural variations and
climate change
Aquaculture
Fishery
Figure 18 Causal chain diagram illustrating the causal links for habitat and community modifi cation in the Sulu-Celebes region.
CAUSAL CHAIN ANALYSIS
53
reefs, including observations from ReefCheck database, and ICLARM
Mangrove forests, which are important nursery habitats, have been
ReefBase (Figures 6 and 7 in the Assessment). Constructions on some
cleared for timber collecting and for use in prawn farming operations
shoreline areas, such as those along Alona Beach and other locations in
(Chua et al. 1989, FAO 2000). Aquaculture, including the shrimp farming
Pangalo (Philippines), are causing shoreline erosion (White et al. 1999).
industry (covering 500 000 ha) (Chua et al. 1989), has been one of the
The removal of portions of the structure of fringing reefs (e.g. corals for
major causes of habitat modifi cation and destruction in the region
lime in cement production, dredging of lagoons etc.) has also resulted in
(Down to Earth 2001). In the Philippines, less than one-third of the
greater erosion and sedimentation on a local basis (Cesar 1996). Excessive
original mangrove forests are now left (Chua et al. 1989). In Indonesia,
sedimentation (e.g. Sapian Bay, Philippines) has also been attributed to
up to 1 million ha of land, mostly mangrove forests, were allocated by
extensive mussel and oyster culture (Young & Serna 1982).
the government for the shrimp hatchery industry. By 2001, about 70%
of the shrimp farms had been abandoned because the operators found
The common practice of slash and burn agriculture has depleted much
them unsustainable due to the high concentrations of chemicals and
natural forest, particularly in low-lying and coastal areas, exacerbating
the destruction of the mangrove habitat.
the impacts of land-based activities on coastal areas (FAO/UNDP/
UNEP 1994). More than 80% of the original forest has been destroyed
Industrial waste
in large areas of the Philippines (Figure 7 in the Assessment) resulting
Industrial development aff ects marshes, swamps, rice paddies and
in increased soil erosion and nutrient run-off .
riparian belts, and have led to more wastes being dumped into
critical habitats, such as mangrove forests, contributing to the loss and
The lack of balance between logging and replanting of trees, ultimately
fragmentation of 60-80% of Philippine mangroves.
results in soil erosion and run-off , leading to increased suspended
particulate matter in the waterways. The logging of rainforests (Drigo &
Oil and gas exploration
Marcoux 1999) has contributed to major reduction in their cover, species
Although not a major impact at present the potential for oil spills to
population sizes and soil erosion, the latter leading to increased
adversely aff ect the ecosystems in the region is high. Caution and
sediments and suspended particulate matter in waterways. In the
good management practice must be exercised in current and future
Philippines, the loss of coral reefs was caused by huge quantities of silt
exploration initiatives, including the Shell Company's multi-billion dollar
linked directly to deforestation (Werner & Allen 2000). It is estimated that
Malampaya Gas Project (on Palawan province, Philippines) (Werner &
60-80% or possibly more of the mangrove resources in the Philippines
Allen 2000).
is lost (Atmadja & Man 1994).
Unsustainable exploitation of living resources
Use of fertilisers and other chemicals
Overfi shing
A related problem is chemical pollution, with chemical transported with
Overfi shing impacts on habitat loss include widespread changes
sediments into waterways. The indiscriminate use of chemicals in the
in community structure, widespread removal of brood stocks (FAO
agricultural sector, including chlorinated pesticide residues from rice
2000), local extinctions, and has also contributed to fi shers' incentive
paddies such as Aldrin, Dieldrin, Lindane and Endrin, have led to high
to use destructive methods (e.g. bombing) to catch the remaining fi shes
levels in the water column and sediments in Manila Bay (GIWA region
(Chou et al. 1994, Werner & Allen 2000). Most stocks have already been
54 South China Sea) and Segara Anakan (GIWA region 57 Indonesian
exploited beyond their maximum sustainable yield (Burke et al. 2002,
Seas), exceeding allowable limits set by national agencies (Gunnerson &
FAO 2000, Wilkinson 2000). Sharks are also caught, erroneously depicted
Cuellar 1988, Ludwig 1985).
as by-catch, in trawling and long-line fi sheries.
Land reclamation
By-catch from trawling and long-line fi shing
Continuing developments along the watersheds and coastal zones are
Although trawling was banned in Indonesia in 1980 (Sardjono 1980),
causing the loss of natural communities with permanent destruction
with the ban successfully reducing overall fi shing eff ort in western
having reduced the surface area of original land cover by more than
Indonesia and reallocating some of the inshore resources toward small-
80% (Burke et al. 2002). Ports and harbour developments usually
scale fi sheries (Pauly 1989), it still is widely practiced in the region. This
involves reclamation and channel dredging. Coastal reclamation and
has caused extensive direct damage to rare and endangered species
associated mangrove destruction are among the primary causes of loss
of marine mammals, including dugong, and turtles.
of coastal habitats (Cesar 1996, White et al. 1999).
54
GIWA REGIONAL ASSESSMENT 56 SULUCELEBES SULAWESI SEA
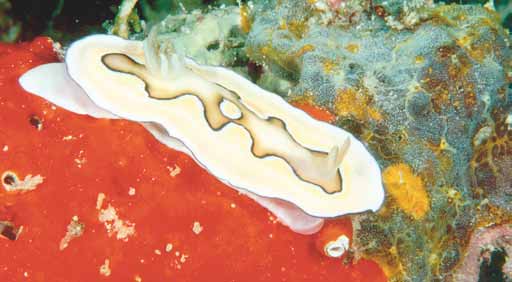
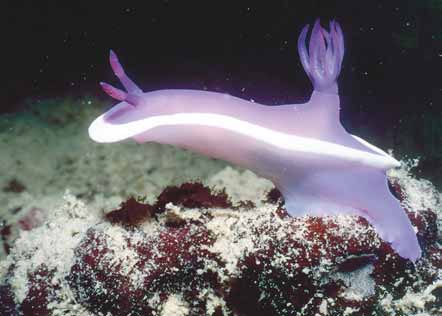


Figure 19 Nudibranches, Mabul Island, Malaysia.
Upper left: Chromodoris coi. Lower left: Glossodoris stellata. Upper right: Hypselodoris sp. Lower right: Hypselodoris bullocki.
(Photo: N. Coleman, ReefBase)
Destructive fi shing practices
Blast fi shing is widespread (Alcala & Gomez 1987), and has reduced coral
The widespread and repeated use of destructive material and
cover by 50-80% in Indonesia (Chou 2000). Similarly, in the Philippines,
equipment to fi sh for marine resources has caused severe ecosystem
the strong decline in Acropora sp. coral is thought to be due primarily to
fragmentation, and has obliterated much of the marine life in many
human impacts, particularly blast fi shing (Alcala 2000). A similar situation
areas in the region (Johannes & Riepen 1995, Burke et al. 2002). The
has occurred in Malaysia, where there may be more than four bomb
readily available material used to manufacture bombs and other
blasts per hour in many off shore reef areas (Chou 2000). Reef bombing
destructive methods have contributed to their widespread use.
occurs regularly, and has been attributed to increasing competition
Many fi shers feel obligated to use dynamite and other destructive
among fi shers and corresponding declines in catches. Alcala (2000) has
methods to catch the remaining fi shes (Ming et al. 1994, Werner &
provided an overview of blast fi shing in the Philippines.
Allen 2000). Trawling has negatively impacted seagrass beds, muddy
and sand-gravel bottoms and fringing coral reefs. On Coron Island in
The full extent of poison fi shing in the region is unknown (Johannes
the Calamain group (Philippines) over two-thirds of the island's coral
& Riepen 1995, Burke et al. 2002), because it targets some of the
reefs have been damaged by cyanide fi shing, resulting in the people
most pristine and isolated coral reefs where observations are limited.
increasing their consumption of birds, monkeys and wild pigs (Werner
However, it is clear that many reefs in the region have been targeted
& Allen 2000). The impacts of reef degradation on coral biodiversity
for the live fi sh food trade in Hong Kong and mainland China, initially
have been documented by Edinger et al. (1998). The negative eff ects
using potassium cyanide or sodium cyanide and more recently using
of muro-ami, blasting and poison fi shing, have destroyed large areas
poisons derived locally from plants. Weber (1998) assessed the status of
of coral reef throughout the region (Pet-Soede & Erdmann 1999, Pet &
some 200 fi sheries around the world and concluded that the live reef
Pet-Soede 1999, Burke et al. 2002).
fi shery of Southeast Asia is one of the most threatened fi sheries on the
CAUSAL CHAIN ANALYSIS
55
planet. Live reef food fi sh trade is a lucrative industry where reef fi sh can
Box 7
Illegal fi shing by foreign vessels in Indonesia.
fetch prices of up to 100 USD/kg. According to unpublished data from
For decades now, Indonesia's rich and extensive marine natural resources have
been plundered at will by foreign fishing vessels. Some operate under official
the International MarineLife Alliance, cyanide is widely used to capture
licenses (purchased from Indonesian middlemen) and even fly the Indonesian
flag, while others simply poach the vast archipelagic seas, bolstered by the slim
both live reef food and ornamental aquarium fi sh. The ornamental and
chances of encountering Indonesian Navy vessels and the knowledge that they
can usually pay their way out of any inconvenient situations that might arise if
aquarium trade is an international, multi-million dollar industry with
they do. Many are said to simply work with the various enforcement agencies
36% of the global trade coming from Southeast Asia (Burke et al. 2002).
that should be preventing their activities. As fish wars erupt between nations all
over the world, Indonesia must realise and protect what is potentially its most
Between 1996 and 1999, the share of the United States ornamental
sustainable and valuable natural resource, its fisheries. In acknowledgement of
the importance of this issue, Minister Sarwono recently suggested that the losses
fi sh market coming from Southeast Asia increased from 67% to 78%
in revenue accrued to the Indonesian economy as a result of foreign fish stealing
may top 4 billion USD. In the case of North Sulawesi, while the Taiwanese trap net
(unpublished data from US Fish & Wildlife Custom declarations). The
was eventually taken down (due to the actions of Minister Sarwono, then Minister
of Environment), foreign fleets continue to threaten Bunaken National Park, albeit
current harvesting practice of the trade is unsustainable (Burke et al.
in a less direct manner. The Bunaken fishermen increasingly report conflicts with
2002). Cyanide fi shing remains the predominant technique for fi sh
foreign tuna fishermen, and are now actively vandalising foreign fishing gears
when they encounter them (such as long line radio buoys, fish aggregating devices,
capture in Southeast Asian countries. The economic benefi ts for fi shers
etc). The Bunaken fishermen face a double whammy, with Filipino boats actively
poaching the waters just northwest of the park, while Taiwanese, Korean and Hong
are minimal. In the Philippines, for example, fi shers who supply the
Kong boats (with official licenses) work the seas to the north and east of the park.
The latter have greatly increased in number since the spread of violence in Ambon,
aquarium trade typically earn only about 50 USD per month (Spalding
when a number of foreign fleets relocated from Maluku to Bitung as their home
port. Unfortunately, as these bigger and more technologically advanced foreign
et al. 2001). Less destructive techniques, such as net capture, are on
fleets decimate North Sulawesi's stocks, the Bunaken fishermen must travel further
the rise as a result of retraining eff orts but they have not yet overtaken
and further to catch fish (often 3-5 hours travel outwards by wooden speedboat
from the island), and now increasingly resort to spear fishing and gill netting
cyanide fi shing as the practice of choice (Burke et al. 2002).
on Bunaken's heavily touristed reefs in order to catch fish to feed their families.
Tourism and fishing, once compatible, are now increasingly enemies. In large part
due to the activities of foreign fishing fleets.
Illegal fi shing
(Excerpted from: NRM Headline News 2000)
Illegal tours by collectors have resulted in the marine environment being
`picked clean' of turtle eggs, giant clams and seashells. The Tubbataha
Reef are not free from intrusion and destruction. Both Tubbataha Reef
Adequate policy but inadequate implementation/management, resources
and Turtle Island have fallen prey to the destructive practices of people
and capacity to execute the law
selling turtle eggs, thereby endangering the continuing existence of
In Indonesia, Malaysia and the Philippines, marine resource management
these turtles. Local extinction, according to the WWF, is imminent.
and exploitation are, in theory, already controlled by extensive policy
In 1995, the Philippines Department of Environment and Natural
and regulatory frameworks. However, several recent reviews have
Resources (DENR) revealed that coral cover and fi sh density in the reef
all indicated that the major problem is not lack of policy but lack of
are "decreasing at an alarming rate" despite the site's offi
cial status as a
implementation, worsened by lack of coordination among agencies,
protected National Marine Park.
ambiguity in policy statements and lack of a clear framework or
Massive destruction of marine mammals, sea turtles and fi sh has been
support mechanisms to enable policies to be implemented eff ectively
reported from trap nets placed in the Manado area, North Sulawesi,
(e.g. Kahn & Fauzi 2001). This problem is common throughout many
Indonesia. The illegal fi shing was believed to be operated by a joint
of the developing countries of Southeast Asia (Chua 1989), where
Taiwanese/Indonesian venture. Between March 1996 and February 1997,
regulating protected areas, forestry and fi shery operations, including
it is estimated that catches included some 1 424 Manta rays, 18 Whale
implementing sound management policies, is often hindered by lack
sharks, 312 other sharks, 4 Minke whales, 326 dolphins, 577 Pilot
of fi nancial and human resources support for on-site management,
whales, 789 Marlins, 84 turtles and 9 Dugongs (Rossiter 2002). For more
surveillance/enforcement. Bunaken National Park off ers a classic case-
information on illegal fi shing in Indonesia see Box 7.
study (Box 8).
Root causes
The typical chronic lack of surveillance and enforcement resources is
Governance and legal
exacerbated by the fact that many destructive activities are carried
Lack of stewardship
out in remote places, whereas enforcement capability is often based
Although the `tragedy of the commons' (Hardin 1968) is understood by
in urban areas. This has led to unregulated land-clearing, illegal use of
regulators, the issue of property rights is unresolved in most areas and
pesticides and other chemicals in the agricultural sector, and to large-
so the problems inherent in common property resource use remain
scale illegal commercial fi shing operations, including those targeting
unsolved, especially in remote areas. This is compounded by the next
reef fi sh, beche-de-mer and shark for cash sales to satisfy an increasing
root cause.
global market demand (Johannes & Riepen 1995, Cesar 2000).
56
GIWA REGIONAL ASSESSMENT 56 SULUCELEBES SULAWESI SEA
Box 8
Lack of fi nancial support for protected areas in
Box 9
Lack of control of illegal fi shing by foreign vessels in
Indonesia: Bunaken National Park.
Indonesia.
After its establishment as a park, Bunaken National Park enjoyed initial support
Although the issue of foreign fleets either operating under license or poaching in
for five years (1992-1996) from the USAID-funded Natural Resources Management
Indonesian waters has been acknowledged as a problem for years, it seems that
Project (NRMP). This initial support included development of a park management
neither officials nor academics took this problem seriously until recently. This lack
plan, stakeholder consultations, mooring buoy installation, several baseline
of concern apparently stems from a number of common misconceptions that many
biological and socio-economic surveys, and limited procurement including an
officials seem to harbour, including: Indonesian fishermen are too poor and ignorant
office automobile and several patrol boats. The park has a management office
and their fishing gears not advanced enough to effectively harvest fish stocks,
with a staff of approximately 40 (including the park head, park rangers and
Indonesian fishermen are ineffectual seamen and do not have what it takes to stay at
administrative staff), and is under the authority of the Indonesian Department
sea and really fish; and Indonesian fishing boats are not advanced enough.
of Nature Conservation (PHKA) in the Ministry of Forestry. As a national park, it
Combined with the idea that Indonesia's fisheries resources are underexploited,
receives an annual operating budget that averages 75 000 USD per year, enough
many fisheries officers and government officials seemed to feel that Indonesia
to pay for salaries, office operational costs and at most one water-borne patrol
might as well have foreign vessels help with fishing lest all those extra fish go to
per month. Unfortunately, enforcement funding from the national park office was
waste. These misconceptions were reinforced by consecutive Suharto-era Repelitas
virtually non-existent during the latter half of the 1990s; the annual budget for the
(five year plans) that inevitably called for more intensive fishing effort and official
park included funding for a single half-day patrol per month. Despite the park's
fisheries statistics that predictably showed a perfect increase in catches in line with
conservation status as a national park, it has continued to suffer a slow degradation
the demands of the Repelitas. While it is not true that Indonesia's fishermen are
over the last decade for a variety of reasons. As with almost all reefs in Indonesia,
unable to effectively harvest Indonesia's fisheries, it is true that they are generally
the park's reefs continue to be damaged by blast and cyanide fishing, destructive
at a great competitive disadvantage compared to foreign fleets who use high
net fishing, live coral collection for house foundations, plastic trash accumulation,
technology, unsustainable (and often illegal) fishing gears such as trawl nets, drift
and anchoring. Additional enforcement problems in the park include tourist
nets and massive long-lines to decimate pelagic and demersal fisheries throughout
damage from reef walking and poor diving practices, mangrove cutting for sale of
the archipelago.
firewood, and violations of the zonation system (e.g. fishing in core conservation
Corruption, greed and government short sightedness has meant that foreign fleets
zones).
are generally given the green light to plunder Indonesia's most valuable stocks
( Source: Excerpted from Erdmann & Toengkagie 2003, Erdmann et al. 2003)
(sharing a miniscule portion of their profits with a few corrupt government officials),
while Indonesia's traditional fishermen are increasingly marginalised and left to
fight for the scraps. This in turn has led to increased environmental degradation and
a decreasing quality of life in many coastal villages as fishermen turn to destructive
techniques to make a living and put some fish on their collective plates.
Unresolved issues regarding access to living resources
The grave situation in relation to illegal fishing of the region's fish stocks,
The views of local fi shermen and foreign fi shing fl eets are often counter
particularly by foreign vessels occasionally utilising poor local fishers, has led to
policy recommendations for total closure of Indonesia's seas to foreign fishers:
to those actions deemed necessary by government regulators, such
close Indonesia's seas completely to foreign fleets and allow Indonesian fishermen
only to catch Indonesian fish. After five years, the situation can certainly be
as restricting license numbers, areas for fi shing activities, and total
reassessed. If there is strong scientific evidence for surplus fish production (i.e.
underexploited stocks), then the issue of exports can be re-examined. But only in a
allowable catch limits. Given the regional nature of the industry,
sustainable manner in which Indonesian fishermen catch the fish that are exported.
There is simply no justification for foreign fleets to operate in Indonesian waters.
restrictions by regulation can take considerable political will and
Bigger, more technologically advanced fishing fleets are not better only more
stakeholder agreement on the scientifi c advice before they can be
efficient at speeding the collapse of a fishery.
( Source: Excerpted from: NRM Headline News 2000)
implemented. Again taking Bunaken National Park as an example, the
majority of local fi shermen are today small pelagics fi shers, a situation
that augurs well for conservation eff orts within the park. Since these
assessment systems, deeper towing of demersal trawl nets, and
fi shermen are not targeting reef fi sheries, there is great potential for
access to better meteorological information, both aerial and acoustic
coexistence of fi shing and marine ecotourism. Unfortunately, foreign
searching for fi sh schools and GPS position fi xing. In some fi sheries,
fi shing operations are threatening to damage both of these important
such as long-lining, the practice of cooperative (or `pack') fi shing is
sectors of the North Sulawesi economy. In 1997 and 1998, the now
also common.
infamous `Curtain of Death' Taiwanese trap net that stretched across
the Lembeh Strait decimated migratory pelagic fi sh and marine
Knowledge
mammal stocks in North Sulawesi (as discussed above). Not only did
Lack of education/awareness, conservation ethics and perceptions
Bunaken fi shermen see the eff ect in their daily catches, tourism also
Those who participate in habitat destruction often lack awareness and
suff ered with the number of sightings of dolphins, manta rays and other
appreciation of the environment and its renewable services, attributable
diver favourites plummeting. This led some of the local fi shermen to
to both a lack of education, poverty, and/or desperation. In relation to
an increased focus on reef fi sheries and the use of illegal destructive
destructive fi shing, there is often a perception amongst fi shers that the
methods. See also Box 9.
use of destructive methods is better because it yields a bigger catch for
the least amount of eff ort. This has resulted in an increase of bombing,
Technology
poison and other destructive methods. Alternatively, at the other end
Technology developments
of the fi nancial scale, extremely wealthy, unscrupulous persons and
There have been major improvements in the technology available
international fi shing organisations are able to fl out the law because
for commercial fi shers, particularly foreign fl eets, to increase eff ective
of corruption, usually employing poor fi shers to conduct the illegal
fi shing eff ort and exploit a wider range of marine habitats. These
activities. See also Box 9.
include employing more powerful vessels, better depth and bottom
CAUSAL CHAIN ANALYSIS
57
Inadequate investment in scientifi c assessments and management
of poor people in the region on their natural resources is so strong that
As with most regions world-wide, there has traditionally been
every available resource will be extracted at all cost. Providing additional
inadequate historical fi eld data, particularly on fi sheries impacts to
and/or alternative livelihoods is crucial but can be diffi
cult as the people
ecosystems, CPUE, stock recruitment relationships and the life history
need to be convinced that they would get a better deal with a new
characteristics of the target species and their role in the ecosystem, the
initiative. An example of this is blast-fi shing, whereby the fi shers need to
`synecology' of the fi sheries (e.g. see Jackson et al. 2001). Coupled with
be convinced that a new (less destructive) method will yield the same
the lack of fi eld data have been serious inadequacies in the theory of
if not better catch than blast fi shing. Thus, extreme poverty has forced
both ecosystem and fi sheries management, which are only now
people to continue fi shing despite resource depletion. As the situation
beginning to be addressed through an ecosystem based management
worsens, fi shers will resort to use of all methods to catch the remaining
approach.
fi shes, indicative of Malthusian overfi shing (Pauly et al. 1998).
Economic
Natural variations and climate change
Market demand
Major shifts in climate, such as ENSO, can cause changes of several
The ready available market demand for seafood may inadvertently
orders of magnitude in breeding and recruitment success for many
create a group of willing fi shers who will use any fi shing methods
species, including commercial species. As global climate change
to achieve goals of maximum yield at the minimal eff ort. Similarly,
accelerates, it is predicted that there will be wider fl uctuations in climate
forest logging of tropical rainforest timbers is a highly lucrative export
with more intense drought periods followed by more intensive rain and
industry, bringing large amounts of foreign currency, and with high
storm events. Also, there is the possibility of shifts in ocean currents that
potential for misconduct among corrupt offi
cials. This is in some cases
could disrupt many breeding cycles.
also closely linked to urban and residential developments. As such, new
buildings (commercial and residential) will often put demands on the
industry to log more. The lack of accountability and responsibility in all
parties exacerbates the situation.
Conclusions
The market demand for more fi shes has also led to a change of focus
The most signifi cant root causes aff ecting Habitat loss and community
for artisanal fi shers, where they once concentrated on sustenance, they
modifi cation in the region are population growth, poverty, economics
now rely on small-scale commercial fi sheries for their livelihood (Ingles
and market trends. Population growth is impacting on migration,
2000), with positive and negative impacts on the environmental and
urbanisation, lack of employment and poverty, all of which, in turn,
socio-economic aspects of habitat loss and community modifi cation.
place greater pressure on services from the environment (e.g. fi sheries)
Economic growth
and contribute to increased pollution and damage to habitats. Lack
Governments and private sector, particularly in developing nations, are
of policies supporting sustainable development and/or lack of
often driven by the need for faster economic growth but at the expense
enforcement of those that are in place as well as corrupt and/or illegal
of natural resources and the environment.
practices also follow from population growth.
Demographic
Economics and market trends drive the burgeoning and unsustainable
Population growth and poverty
use of resources and also infl uence corruption and illegal practices.
When coupled with other issues, such as rural `landlessness', population
Coupled with the population boom and migration to coastal and
growth will erode the gains obtained from conservation measures, such
urban areas, market trends create a dangerous mix of driving forces
as banning illegal land clearing and fi shing methods, within a few years if
that do not augur well for the future. Most importantly, the resource
no provisions are made to provide for alternative income opportunities.
owners themselves must be persuaded that long-term sustainability is
Population growth has also increased coastal developments leading to
a much better option for the future development of the region, than
beach erosion and high sedimentation (Burke et al. 2002), and needs to
short-term gains that are being made at the expense of irreversible
be addressed across all sectors.
damage to the environment.
Poverty, often associated with overpopulation, is a major root cause that
drives most issues identifi ed in this analysis. The dependence of millions
58
GIWA REGIONAL ASSESSMENT 56 SULUCELEBES SULAWESI SEA
Policy options
This section aims to identify feasible policy options that target
severe depletion of fi sh stocks, with associated habitat modifi cation, in
key components identifi ed in the Causal chain analysis in order to
most areas of the region (e.g. 80% modifi cation of original vegetation
minimise future impacts on the transboundary aquatic environment.
cover, 60% loss of mangroves, 50% of reefs degraded). As part of the
Recommended policy options were identifi ed through a pragmatic
three nations' international obligations under tri-lateral and United
process that evaluated a wide range of potential policy options
Nations Conventions and Treaties (e.g. Biological Diversity, World
proposed by regional experts and key political actors according
Heritage, MARPOL), the respective national governments, with
to a number of criteria that were appropriate for the institutional
international assistance, recognise the need to address these impacts
context, such as political and social acceptability, costs and benefi ts
in a coordinated manner. However, implementation of eff ective
and capacity for implementation. The policy options presented in
interventions is hampered by lack of capacity, corruption and ineff ective
the report require additional detailed analysis that is beyond the
legislation and/or enforcement. See also Box 10.
scope of the GIWA and, as a consequence, they are not formal
recommendations to governments but rather contributions to
The overall present situation and future prognosis for the Sulu-Celebes
broader policy processes in the region.
(Sulawesi) Sea is that:
There are already severe environmental and socio-economic
impacts from habitat loss and community modifi cation and
unsustainable exploitation of fi sh and other living resources;
These impacts are expected to continue to worsen over the next
Definition of the problem
20 years, with additional signifi cant deterioration in impacts of
The foremost consideration is the tri-lateral, transboundary nature
Box 10
The need for improved management and cooperation
of the Sulu-Celebes (Sulawesi) Sea, with three diff erent national
in conserving and protecting the Sulu-Celebes LME.
There is a pressing need for improved management and cooperation between
jurisdictions, many transboundary issues, and many national, regional
countries in conserving and protecting the Sulu-Celebes Sea Large Marine
Ecosystem. Enforcement, education and research are necessary measures, as are
and international "players" actively pursuing initiatives concerned with
efforts to curb illegal fishing. In 1988, Tubbataha Reef was declared as the first
sustainable development of the region (see Annexes III and V). Further,
National Marine Park in the Philippines. In 1993, the United Nations Educational
Scientific and Cultural Organization (UNESCO) declared the reef a World Heritage
signifi cant transboundary impacts can also originate from outside the
Site. Turtle Island has also been declared a protected area. These declarations
indicate the government's commitment to conserve the areas and have increased
region, such as from the GIWA regions South China Sea and Indonesian
international awareness and support for their protection. When the government
ran out of funds to carry out an action plan, international agencies such as
Seas. The present analysis is predicated on the fact that actions by one
the World Wildlife Fund (WWF) and GEF initiated some projects. It is clear that
country invariably impact on the jurisdictions of another.
engaging the public is necessary, as well as developing livelihood alternatives
for those communities that are affected. WWF's plan is to raise the communities'
awareness level of the existing laws on fisheries and environmental protection.
Other international groups that have committed to projects in the area are ASEAN
On land, massive land-clearing and conversion has destroyed or
and Conservation International. In 1996, an agreement was signed by Malaysia
and the Philippines to protect two endangered turtle species, the Hawksbill and
fragmented much of the original vegetation cover, with severe loss and
the Green Turtle. Although the Malaysian-Philippine agreement is a vital first step,
all three governments in the region need to enforce sustainable ways of earning a
modifi cation of catchments and loss of sediments to coastal waters. In
living from the sea.
the sea, major overexploitation and destructive fi shing have caused
(Source: Excerpted from LME 2003)
POLICY OPTIONS
59
pollution (becoming severe) and freshwater shortage (moderate);
Construction of policy options
The human population is growing steadily with an expected
doubling by 2035, although growth may slow slightly in the coming
As noted above, the Philippines, Malaysia and Indonesia have adequate
decades;
legislation to address most of the key issues and concerns raised in
Many people are at subsistence levels of agriculture and fi sheries
the Assessment (see Annex IV). These nations are also parties to most
for survival, with approximately 60% of population at or below the
of the key international conventions and treaties. What is currently
poverty level;
lacking is multi-lateral coordination and capacity to apply the existing
There is widespread continued use of inappropriate technologies
legislation and to review and amend the legislation to improve its
and concern for the longer term sustainability of the production
functionality, particularly cross-sectorally (Chua pers. comm.). There is
systems;
a clear and pressing need for an integrated multi-national conservation
Most laws and regulations are not well implemented or accepted
and development approach for the Sulu-Celebes (Sulawesi) Sea,
by local populations;
complemented by implementation of an eff ective strategy to
It will be possible to slow down the rate of increase of impacts,
address multi-lateral and international obligations under the various
although, at present, environmental concerns are less important
conventions and treaties (see Annex IV) (Chua pers. comm.).
than development pressures, many of which have inappropriate
environmental eff ects;
Consolidation of national laws and multi-lateral agreements to
The political situation is focused on the short-term (3-5 year cycles)
encompass all sectors, with better coordination in management
with changes in offi
cials, rather than on developing longer term
and much improved enforcement, with ongoing and expanded
strategies;
community education programmes are also needed. National and
There are concomitant signifi cant defi ciencies in vision, planning
international surveillance strategies, with participation from all levels
and implementation at political levels;
of government, NGOs and local communities may be the best way of
A `critical mass' of expertise and framework for change are
bridging the gaps between formulation, legislation and enforcement
developing, involving science, policy, private sector and
of regulations. Towards some of these goals, UNEP and GEF have
government;
formulated a Transboundary Diagnostic Analysis and preliminary
There is a need to better integrate ocean-related sectors in policy,
framework for a strategic action programme for the Sulu-Celebes LME
with linkages among food security, poverty, natural resources,
(GEF 1999). The PDF-A has been completed and the PDF-B is currently
environment pressures, market forces and governance;
in draft form. The success or otherwise of the PDF will greatly depend
There is misallocation of signifi cant amounts of local and
on how the participating governments engage.
international funds;
There is a rapidly changing global situation with changes in funding
Rather than re-evaluating the many and various options that have
priorities;
already received substantial analysis by these governments, donors,
There are major opportunities for improvement in both the political
academia and NGOs in the region and elsewhere, a subset of
situation and from private sector and national/international
recommended policy options are presented, arising from the various
NGOs;
analyses conducted to date that were considered most appropriate.
Better allocation of local funds and continued international donor
These options are focused initially at the broadest policy levels,
funds are needed to alleviate present situation and to work towards
becoming increasingly directed to fi ner scale policy and interventions.
improving future scenarios;
Relevant case studies are presented throughout.
Local and/or regional scale interventions by government,
communities and NGOs (e.g. community-based management at
Apo Island and Danjugan Island - WWF Sulu-Sulawesi Ecoregion
programme) have the potential to slow the rate of deterioration
Recommended policy options
signifi cantly, provided these receive adequate political, fi scal and
logistic support.
Given that the region lies at the centre of global biodiversity with
adjacent GIWA regions of Indonesian Seas and South China Sea, more
extensive and intensive intervention is required immediately. At the
broadest policy levels, recommended options include:
60
GIWA REGIONAL ASSESSMENT 56 SULUCELEBES SULAWESI SEA
Programmes to address population growth;
Box 11
Benefi ts of MPAs in Fisheries Management
Programmes to reduce poverty, including signifi cant focus on
Marine Protected Areas have the potential to play a much bigger role in the
successful management and sustainable use of fisheries resources on coral reefs
alternative and/or additional income generation programmes
and associated ecosystems. In particular, participatory development of no-take
zones and protection of essential fisheries habitat in the context of an ecosystem
(AIG);
management approach should be encouraged, where appropriate, at both the
community level and for larger areas. The designation of no-take marine reserves
Direct on-the-ground community-based conservation may be necessary for sustaining fishery yields over the long-term, due to their
programmes, particularly focused on improving management of
ability to preserve genetic variation in the expression of fish size and growth
rates. This is because in exploited situations, the fishery selectively removes larger
and further development of protected areas, including AIG for
individuals, giving smaller, less fertile individuals a selective advantage.
Marine protected areas are most effective when they are established where
locals, linked with:
vulnerable species usually live, breed, or feed, the committee said. Creating these
- Assessment programmes for identifi cation of critical areas for
areas has quickly restored populations of fish, snails, and crabs, reduced pollution,
and provided habitats for other marine organisms in some regions, including the
biodiversity (e.g. through government agencies and NGOs;
Philippine islands. Less than 0.25% of coastal sea areas are designated as marine
protected areas. To ensure the greatest benefit to depleted fish stocks, many
- Training programmes to build additional long-term capacity
more protected areas should be set aside that are or once were active, productive
fishing areas. Moreover, fishermen should be involved in planning and designating
among government, NGOs, and communities;
protected areas.
- Multi-lateral integration to maximise eff ectiveness of obligations
( Source: Dight et al. 1999, NRM Headline News 2002c, Roberts et al. 2002,
The National Academies 1998)
under international conventions and treaties (e.g. CBD, WHA,
UNCLOS, MARPOL, Ramsar, PEMSEA).
In the protected zones around Apo Island (Philippines), CPUE has
The Sulu-Sulawesi Marine Ecoregion (SSME) approach being developed
increased in two key families of reef fi sh, in response to eff ective
by WWF and partners provides a useful model for policy development
protection and decreasing fi shing eff ort (Russ & Alcala 1996 a,b). This is
and implementation. The approach is two-pronged: conservation
an excellent example of community-based management, but to date,
planning in the long-term, and implementation of immediate
despite good intentions by the relevant government agencies and
conservation actions in key sites. The SSME recognises that immediate
NGOs, there has been a lack of implementation in many other areas.
interventions should be implemented in fi ve priority areas:
The Nature Conservancy has recently conducted a detailed analysis of
Bio-physical (biodiversity) and socio-economic research;
the benefi ts of MPAs in fi sheries management (see Annex VII) (Mous
Establishment of a network of protected areas;
and Pet-Soede pers. comm.). The major recommendation is included
Development of sustainable livelihoods;
in Box 11.
Information/education/communication;
Institution and capacity building including establishment of inter-
Expansion and improved management of
governmental mechanisms.
protected areas
There are several hundred protected areas already designated in the
At the fi ner scale of this GIWA analysis, the key recommended policy
region, representing a wide range of terrestrial, coastal and marine
option is improved management and expansion of the protected
habitats and over 100 more are currently being gazetted (Spalding
areas network. In light of the strong linkages between Habitat loss
et al. 2001, Cheung et al. 2002, Uychiaoco et al. 2002, WRI 2003). Most
and community modifi cation and Unsustainable exploitation of fi sh
protected areas are in the Philippines, notably the large Tubbutaha
and other living resources concerns, the ameliorative role of protected
Marine Park. East Kalimantan in particular is under-represented in
areas in both regards cannot be overemphasised.
terms of MPAs, with only two small areas gazetted in the Berau barrier
complex (total area of 500 ha), and several Nature Reserves on the coasts
There are insuffi
cient resources for management and enforcement
of Pulau Laut and the adjacent mainland (Kahn & Fauzi 2001). North
of fi sheries and other regulations in many MPAs, which limit their
Sulawesi has just the one marine park, Bunaken National Park, and a
eff ectiveness. By contrast, several small community-based management
few coastal terrestrial reserves.
initiatives have proven very successful at protecting coral reefs and
facilitating replenishment of reef-based fi sheries e.g. Apo Island (Russ
Specifi c policy recommendations for improving the management and
1985, Russ & Alcala 1996a,b) and Danjugan Island (Sherwood 2002).
coverage of the MPA network in the region include (after Alino et al.
Thus, several key examples of the successes, failures and lessons learned
2000, Cheung et al. 2002):
from previous attempts at improving management and expanding the
Review the current administrative frameworks and design strategies
MPA network in the region already exist (Annex X).
to resolve overlapping legal authority and jurisdiction in MPAs;
Identify which MPAs are working, which are not and why, and
POLICY OPTIONS
61
document successful case histories of MPA management (see
Box 12
Policy for collaborative management of Indonesia's
Annex IX);
National Parks.
The Ministry of Forestry's PHKA worked with NRM, TNC and WWF to bring together
Where necessary, design management plans that include identifi ed
more than 120 government, non-government and community stakeholders
from the national to local level to strengthen and clarify its policy in support of
source(s) of operational funding (see Annex IX);
decentralised collaborative management of Indonesia's National Parks. Specifically
Retain fl exibility in management approach, recognising the
regarding the legal aspects of collaborative national park management policy,
PHKA will focus on short-, medium- and long-term targets. PHKA will facilitate
value of co-management through small-scale local, community-
the development of a ministerial decree supporting decentralised collaborative
management. This will strengthen the impact of PHKA SK No. 1633/IV/KK-6/02, in
based approaches and larger scale internationally-supported
effect since November 2002. Over the next two to three years, PHKA will facilitate
the development of a presidential decree (Kepres) and joint ministerial decree
management initiatives (see Annexes IX and X);
(SKB) between Ministries of Forestry and Home Affairs. Finally, over the next five
years, PHKA will facilitate a review and possible revision of Law 5/1990 (UU 5/90) on
Design and foster implementation of a system whereby each
biodiversity and ecosystem conservation, then draft an implementing regulation
municipality or village (e.g. Barangay in the Philippines) is
for decentralised collaborative management of national parks. This strategy
balances immediate policy creation with the timing to create the strongest possible
empowered to assist in the management of (or manage) the local
legal basis for collaborative management. The Ministry of Forestry's commitment
to decentralised collaborative management is a significant and broadly welcomed
MPA;
policy shift from its previously highly centralised approach to national park
management. Experience showed that a centralised approach to conservation
Conduct strategic assessment of human resource requirements,
management was ineffective and costly. Innovative field approaches clearly
including day-to-day management, surveillance and enforcement
demonstrated that collaborative management - the bringing together of relevant
government, non-government, community and private-sector stakeholders
on a case-by-case basis;
- was more efficient in harnessing technical and financial resources as well as
commitment for effective conservation management in the context of regional
Encourage government and private sector to carry out integrated
development.
( Source: Excerpted from NRM Headline News 2003)
coastal zone planning and management (including watersheds),
and incorporate protection of critical land areas within the parks
or as buff er zones;
management. A national policy on protected areas conservation
Set aside as much as practicable (at least 20%) of MPA areas
fi nancing should ensure local collection and distribution of a
as `no take' zones for biodiversity conservation and fi sheries
majority of user fees, with only a minority going to the central
replenishment;
government. All fi nances should be accounted for and booked
Ensure Environmental Impact Assessments (EIAs) are conducted
at the national level. Transparent third party monitoring and
prior to any development in or adjacent to MPAs, and wherever
evaluation on fi nancial management as well as conservation
practicable, minimise all future development of land within and
management impact is essential.
adjacent to MPAs;
- Clear guidelines and standard operating procedures are
Establish and/or refi ne monitoring programmes and re-evaluate
necessary for both joint patrol systems and participatory
research priorities to best address bio-physical and socio-economic
zonation processes.
management concerns;
Work through ASEAN and other multi-lateral, international agencies
Importance of co-management
and organisations to develop joint programmes, including innovative
Policy recommendations to better support approaches toward
sources of ongoing funding (see Annex IX). Merill (2001) states
decentralised co-management include guidelines for co-management,
recommendations specifi cally for Indonesia's Protected Areas, but
conservation fi nancing, joint patrolling and zonation (see Box 11).
with relevance to the region as a whole, include development of:
Co-management strengthens service delivery for conservation
- Clear written policy in support of site-specifi c co-management
management. It enables national park managers to tap into the rich
of national parks and other protected areas in Indonesia
and diverse technical and fi nancial resources available locally. Co-
provided by the Ministry of Forestry's Director General for
management off ers fl exibility. Site-specifi c in nature, co-management
Forest Protection and Nature Conservation. Such policy should
effi
ciently links available resources to address local constraints. From a
delegate clear support and responsibility to all national park
fi nancing standpoint, co-management provides fl exibility for reaching
directors to develop fl exible co-management structures that
beyond regular budget processes to tap necessary fi nancial resources
refl ect the site-specifi c opportunities and constraints of their
for unplanned problems. Financing co-management is possible though
national park. Criteria for co-management include excellence
accessing into a range of local, site-specifi c fi nancing opportunities. But
in technical service delivery, professionalism and fl exibility.
such local self-fi nancing mechanisms can only be sustained when there
- Relevant conservation user fees policies assessed and revised
is a clear link to user fee collection with local conservation management
by the Ministry of Forestry and Ministry of Finance in order
initiatives. Joint patrol systems, including relevant government
to clearly support local self-fi nancing for conservation
and community stakeholders, are eff ective in reducing illegal and
62
GIWA REGIONAL ASSESSMENT 56 SULUCELEBES SULAWESI SEA
ecologically damaging activities in and around a protected area. Local
First, the claim that the majority of (terrestrial) parks in tropical countries
stakeholders have a keen knowledge about the organisation of such
are "paper parks" (i.e. parks in name only) is not substantiated. Tropical
activities. Local stakeholders appreciate the cessation of illegal activities
parks have been surprisingly eff ective at protecting the ecosystems and
as it supports their sustainable livelihoods. Participatory zonation
species within their borders in the context of chronic underfunding
is an eff ective strategy for balancing stakeholder aspirations with
and signifi cant land use pressure. They have been especially eff ective
conservation management objectives of a national park. There should
in preventing land clearing, arguably the most serious threat to
be monitoring and evaluation of participatory zonation agreements to
biodiversity. Second, despite their successes, there is a clear need to
ensure both objectives are met. (Merill 2001).
increase support for parks to improve eff ectiveness against all threats,
perhaps especially against hunting.
Notably, in a major boost of support for decentralised co-management
of Indonesia's national parks, the Ministry of Forestry announced 2002
Finally, these fi ndings suggest that parks should remain a central
its support for the establishment of site-specifi c co-management
component of conservation strategies. Both creating new parks and
forums for all the country's national parks. This policy announcement
addressing the tractable problem of making existing parks perform
is also an indication of the growing importance of iterative, fi eld-driven
better will make a signifi cant contribution to long-term biodiversity
policy reform for decentralised natural resources management. Rather
conservation in the tropics. Clearly, developing additional protected
than relying on extensive academic studies and technical analysis,
areas must include extensive community and stakeholder consultation,
the Ministry of Forestry has taken on-going, Indonesian-based fi eld
education and regulations off ering real protection, with agreement and
initiatives to support national policy. Over the past few years, Ministry
strong support from the customary resource owners and users."
of Forestry offi
cials have been able to learn about and witness positive
conservation management changes, for example, in and around
Bunaken National Park (Merrill pers. comm.). Ministry offi
cials were
thus able to recognise the value of supportive co-management policy
Performance of the chosen
in achieving their objectives of enhanced conservation management.
alternatives
This is a major, positive step in ensuring responsible decentralisation of
Indonesia's protected areas and forest resources (see Box 9).
The above policy recommendations should assist in the establishment
of well-planned, well-funded, and well-implemented protected areas
In the related case of the Philippines, the President of the Philippines
representing major terrestrial, coastal and marine habitats to serve as
noted in an address to the Second International Tropical Marine
models (potential immediate coastal and marine examples include
Ecosystem Management Symposium 2003 (also see Annex IV and VIII):
Tubbutaha, Bunaken and Turtle Island) for future protected area
"A signifi cant Philippines national strategy is devolving management
development.
responsibility to the municipality and `barangay' level under the Local
Government Code passed by Congress in 1991... When communities
Improved management and expansion of the protected area network
are given the responsibility of managing their own resources with a
is, however, only one of a suite of possible policy options that might
little help from government and scientists, the damage to the reefs can
be used to achieve conservation and fi sheries management objectives
be reversed... The Philippines Government is increasing sustainable
(Rudd et al. 2003). Other options in relation to fi sheries include
management assistance to people who have a large dependence on
eff ective licensing and quota systems, closed seasons, size and catch
these reef resources."
limits among many others. However, these and the multitude of other
options are less likely to achieve success in the Sulu-Sulawesi (Celebes)
In light of the strong linkages between terrestrial habitat loss and land
Sea region in the short-term, largely because of the lack of capacity for
clearing, and sedimentation and suspended solids in Sulu-Celebes
their implementation and enforcement.
(Sulawesi) Sea, the ameliorative role of terrestrial protected areas also
cannot be overemphasised. Bruner et al. (2001) found that the majority
It is nonetheless crucial that further rigorous policy analyses that
of parks are successful at stopping land clearing and, to a lesser degree,
consider a full range of environmental and socio-economic costs
eff ective at mitigating logging, hunting, fi re and grazing. The fi ndings
and benefi ts, including the transaction costs of management be
of this study suggest three basic conclusions.
undertaken (e.g. see Annex IX). If credible analyses are not undertaken
throughout the region and elsewhere, there is a danger that current
POLICY OPTIONS
63
enthusiasm for protected areas may wane as economic performance
of social capital that a society possesses and the level of uncertainty
fails to meet presumed potential. As Rudd et al. (2003) note, fully
in ecological and social systems will also impact the appropriate level
accounting for the value of ecological services fl owing from protected
of devolution or decentralisation of fi sheries governance. Determining
areas requires consideration of increased size and abundance of focal
the proper balance of the state and the community in tropical fi sheries
species within reserve boundaries, emigration of target species from
governance will require broad comparative studies of marine reserves
reserves to adjacent fi shing grounds, changes in ecological resilience,
and alternative policy tools".
and behavioural responses of fi shers to spatially explicit closures.
These analyses are in their infancy, and are only now beginning to
Equity
be undertaken globally. Nonetheless, the data available generally do
Low to medium, with increasing stakeholder involvement and
support the eff ectiveness, effi
ciency, equity, political feasibility and
major education and awareness campaigns occurring. The special
implementation capacity of protected areas in mitigating both habitat
circumstances of local subsistence fi shers are being addressed explicitly
loss and overexploitation of fi sh (e.g. Roberts et al. 2002 and references
in policy.
therein). For the Sulu-Celebes (Sulawesi) Sea region, the policy option
is considered to have:
Political feasibility
Low, with unresolved confl icts and gaps in jurisdiction among the
Effectiveness
various government levels placing serious impediments on resolution
Low to medium, as the levels of environmental and socio-economic
of some of the key environmental and socio-economic issues. These
impact to habitats are expected to increase to 2020, despite presently
key issues are only now beginning to be addressed in a coordinated
planned interventions. Notably, the key root causes of overpopulation,
tri-lateral, national, state and local manner.
poverty and market demand, compounded herein by intra- and
international diff erences in cultural/religious beliefs, must be addressed.
Implementation capacity
Eff ectiveness can be improved markedly with more equitable use
Medium, with developing capacity among the three national
of funds and continuing donor, government and NGO support.
governments, NGO and community groups for eff ecting change, and
Eff ectiveness correlates with basic management activities such as
with considerable international donor support. There is also increasing
enforcement, boundary demarcation and direct compensation to
recognition among the communities themselves that interventions
local communities, suggesting that even modest increases in funding
are crucial to their longer-term sustainability. However, the area is very
would directly increase the ability of protected areas to protect tropical
large and poorly known, with insuffi
cient biodiversity and fi sheries
biodiversity and restore harvested species.
assessments and monitoring undertaken to date. There remain serious
defi ciencies in capacity in on-the-ground implementation, including
Efficiency
unresolved diffi
culties in eff ective surveillance and policing (see
Medium, with clearly prioritised objectives and goals and the
Annex IX), providing challenges for implementation and, at present,
development of transparent systems for funding and implementation,
levels of funding for these initiatives are not assured.
but with major remaining impediments of corruption across all levels
from local to national, and unresolved political instability (e.g. separatist
WWF's Sulu-Sulawesi Marine Ecoregion Programme (SSME) programme
movements) in parts of the region. Effi
ciency clearly is linked closely
is receiving some support from the governments of Indonesia (through
with eff ectiveness, and thorough evaluation of effi
ciency will require
their Ministry for Marine Aff air and Fisheries (MMAF) coordinated by the
expansion of future policy assessments beyond standard cost-benefi t
MMAF Director General), and is also supported by the governments
analysis, particularly considering the impact of social capital on the
of the Philippines and Malaysia. Other global initiatives, including
costs of managing fi sheries.
the International Coral Reef Action Network (ICRAN) and Millennium
Ecosystem Assessment (MEA) have potential benefi ts for developing
As Rudd et al. (2003) conclude: "In the short term, the amount of social
an integrated functional protected areas network in the region. ICRAN
capital that communities possess and the capacity of the state to
has chosen Bunaken National Park and Komodo National Park (in
support the rights of individuals and communities will aff ect the relative
adjacent Indonesian Seas) as demonstration sites, while MEA (Sub-
effi
ciency of marine reserves. Reserves may be the most effi
cient policy
Global periodical meeting for 2003) has proposed two demonstration
option when both community and state capacity is high, but may not
sites: Bunaken National Park and the Jakarta Bay Area (GIWA region
be when one and/or the other is weak. In the longer term, the level
Indonesian Seas). Bunaken National Park has already received substantial
64
GIWA REGIONAL ASSESSMENT 56 SULUCELEBES SULAWESI SEA
support from the Government of Indonesia, USAID, WWF-Wallacea and
based support, success will require eff ective enforcement, particularly
other donors, and has been selected as one of four MPAs to participate
of poaching and fi sheries regulations, and reliable biodiversity and
in a pilot study to develop business plans for Asian MPAs under the
harvested stock assessment and monitoring. These need to be founded
auspices of the World Commission on Protected Areas South East Asia
in an improved understanding of the population biology of the target
Marine (WCPA SEA Marine) working group. Its proposed selection
species and issues of ecological scale and connectivity in relation to
as a demonstration site by MEA and ICRAN is also in accordance
replenishment. There is strong potential for well-planned mariculture
with the goals of the SSME Programme, providing a high degree of
of some ornamental and food species, with the need for continuing
complimentarity in these policy initiatives. Bunaken National Park is
development of appropriate policy and legislation.
providing a useful model for innovative self-funding mechanisms,
among other management initiatives, likely to be applicable in other
The refi nement of these policy options will emerge during continuing
protected areas (Annex IX).
development of the Sulu-Sulawesi Marine Ecoregion Program and GEF
initatives. The identifi cation of the issues and options above, however,
may provide guidance beyond that already gathered in the GEF process.
Without doubt, the Sulu-Celebes (Sulawesi) Sea must be a priority
Conclusions
area for future GEF initiatives, including those of the International
Waters community. The region is at the centre of the world's marine
When eff ectively implemented and managed, a fully integrated
and terrestrial biodiversity, and is surrounded by a rapidly growing
network of protected areas can play a key role in minimising future
population and rapidly deteriorating ecosystems. The challenge of
habitat loss and restoring the region's fi sheries stocks, which are in
gathering the national and international, transboundary cooperation
urgent need of careful stewardship if their sustainable future utilisation
necessary for the sustainable development of this critical region is great,
is to be assured. In addition to a high degree of local community-
but not insurmountable.
POLICY OPTIONS
65
References
Alcala, A.C. (2000). Blast fi shing in the Philippines, with notes on two
Cabanban, A.S. (1998). Impacts of fi sh-bombing on the coral reef fi sh
destructive fi shing activities. Workshop on the Status of Philippine
community of the Semporna Reef Complex, Sabah, Malaysia:
Reefs 24, January. Marine Science Institute, University of the
Preliminary Results. p 89-93 In: Proceeding of APEC Workshop
Philippines.
on the Impacts of Destructive Fishing Practices on the Marine
Alcala, A.C. and Gomez, E.D. (1987). Dynamiting coral reefs for fi sh: a
Environment, 16-18 December 1997. Hong Kong.
resource-destructive fi shing method. p 50-61 In: Salvat, B. (ed.)
Carlton, J.T. (1998). Apostrophe to the Ocean. Conservation Biology 12:
Human Impacts on Coral Reefs: Facts and Recommendations.
1165-1167.
Antenne Museum, E.P.H.E., French Polynesia.
Cesar, H.S.J. (1996). Economic Analysis of Indonesia Coral Reefs. World
Alino, P.M., Arceo, H.O., Palomar, N. and Uychiaoco, A.J. (2000).
Bank, Washington, DC.
Challenges and opportunities for community participation for the
Cesar, H.S.J. (ed.) (2000). Collected Essays on the Economics of Coral
management of marine protected areas (MPAs) in the Philippines.
Reefs. CORDIO, Department of Biology and Environmental Sciences,
Proceedings 9th International Coral Reef Symposium, Bali.
Kalmar University, Sweden.
Armada, N. (1994). The fi sheries of Manila Bay. The Bureau of Fisheries
Cesar, H.S.J., Warren, K.A., Sadovy, Y., Lau, P., Meijer, S. and van Ierland, E.
and Aquatic Resources, Philippines.
(2000). Marine market transformation of the live reef fi sh food trade
Atmadja, W. and Man, A. (1994). Threats and pressures on mangroves
in Southeast Asia. p 137-157 In: Cesar, H.S.J. (ed.) Collected Essays on
and current management practices. p 62-70 In: Wilkinson, C.R. (ed.)
the Economics of Coral Reefs. CORDIO, Department of Biology and
Living coastal resources of Southeast Asia: Status and Management.
Environmental Sciences, Kalmar University, Sweden.
Report of the Consultative forum third ASEAN-Australia Symposium
Cheung, C.P.S., Alino, P.M., Uychiaoco, A.J. and Arceo, H.O. (2002).
on Living Coastal Resources. Chulalongkorn University Bangkok,
Marine Protected Areas in Southeast Asia. ASEAN Regional Centre
Thailand. May 1994. Australian Institute of Marine Science.
for Biodiversity Conservation, Department of Environment and
Bate, E. (1999). Biophysical assessment of the Sulu-Sulawesi Large Marine
Natural Resources.
Ecosystem: Geology module. A report prepared for the Sulu-
Chia, L.S. and Kirkman, H. (2000). Overview of land-based sources and
Sulawesi Marine Ecoregion Conservation Program Development,
activities aff ecting the marine environment in the East Asian Seas.
WWF-Philippines.
UNEP/GPA Coordination Offi
ce and EAS/RCU. Regional Seas Report
Bruner, A.G., Gullison, R.E., Rice, R.E. and da Fonseca, G.A.B. (2001).
and Studies Series 173.
Eff ectiveness of parks in protecting tropical biodiversity. Science
Chou, L.M. (1997). Southeast Asia as the global center of marine
291:125-128.
biodiversity. Tropical Coasts 4:4-8.
Bryant, D., Burke, L., McManus, J. and Spalding, M. (1998). Reefs at Risk.
Chou, L.M. (2000). Southeast Asian reefs - status update: Cambodia,
A map based indicator of threats to the world's coral reefs. WRI,
Indonesia, Malaysia, Philippines, Singapore, Thailand and Viet Nam.
ICLARM, WCMC and UNEP, Washington D.C.
p 117-129 In: Wilkinson, C.R. (ed.) Status of coral reefs of the world:
Burke, L., Selig, E. and Spalding, M. (2002). Reefs at Risk in Southeast Asia.
2000. Australian Institute of Marine Science.
World Resources Institute.
66
GIWA REGIONAL ASSESSMENT 56 SULUCELEBES SULAWESI SEA
Chou, L.M., Wilkinson, C.R., Gomez, E. and Suraphol, S. (1994). Status
Erdmann, M.V. and Toengkagie, A. (2003). The Bunaken National Park
of coral reefs in the ASEAN region. p 8- 17 In: Wilkinson, C.R. (ed.).
Joint Patrol System: Lessons Learned from a Multistakeholder
Living coastal resources of Southeast Asia: Status and Management.
Enforcement Initiative. Proceedings Second International Tropical
Report of the Consultative forum third ASEAN-Australia Symposium
Marine Ecosystems Management Symposium, Manila, Philippines,
on Living Coastal Resources. Chulalongkorn University Bangkok,
April, 2003.
Thailand. May 1994. Australian Institute of Marine Science.
Erdmann, M.V., Merrill, P.R. and Arsyad, I. (2003). Developing a
Chou L.M., Yuan V.S., Yeemin T., Cabanban A., Suharsono and Kessna,
Decentralized User Fee System for Sustainable Conservation
I. (2002). Status of the southeast Asia coral reefs. p 123-152 In:
Financing of Bunaken National Marine Park. Proceedings Second
Wilkinson, C.R. (ed.) Status of coral reefs of the world: 2002.
International Tropical Marine Ecosystems Management Symposium,
Australian Institute of Marine Science.
Manila, Philippines, April, 2003.
Chua, T.E. (1989). Will coastal area management programmes work in
Erdmann, M.V., Caldwell, R.L. and Moosa, M.K. (1998). Indonesian `King
Southeast Asia? p 231-240. In: Chua, T.E. and Pauly, D. (eds.) Coastal
of the Sea' Discovered. Nature 395:335.
area management in Southeast Asia: Policies, Management
EROS Data Center (2002). Hydro 1K. Retrieved Nov. 2003 from: http://
Strategies and Case studies. Association of Southeast Asian
edcdaac.usgs.gov/gtopo30/hydro/
Nations/United States Coastal Resources Management project.
ESRI (2002). Country borders. Data & Map CD-rom. Environmental
Conference Proceedings 2.
Systems Research Institute, Inc.Redlands, California, US.
Chua, T.E., Paw, J.N. and Tech, E. (1989). Coastal Aquaculture development
Etkin, D.S. (1997). Oil spill in East Asia: Over 220 million gallons spilled
in ASEAN: the need for planning and environmental management.
since 1965. Oil Spill Intelligence Report.
p 57-70 In: Chua, T.E. and Pauly, D. (eds.) Coastal Area Management in
FAO (1998). FAO concerned about severe declines in shark stocks -
Southeast Asia: Policies, Management Strategies and Case Studies.
international plan of action calls for sustainable management. FAO
Association of Southeast Asian Nations/United States Coastal
Press Release 98/61.
Resources Management Project Conference Proceedings 2.
FAO (2000). Fishery Country Profi le, Indonesia. Retrieved Aug. 2003 from:
DeVantier L., Alcala, A. and Wilkinson, C. (2004). The Sulu-Sulawesi Sea:
http://www.fao.org/fi /fcp/FICP_IDN_E.asp
Environmental and Socioeconomic status, future prognosis and
FAO AQUASTAT (2003). United Nations Food and Agricultural
ameliorative policy options. Ambio 33:8-97.
Organization, Database. Retrieved Aug. 2003 from: http://
Dight, I., Kenchington, R., and Baldwin, J. (eds.) (1999). Proceedings of the
www.fao.org/waicent/faoinfo/agricult//AGL/AGLW/aquastat/
International Tropical Marine Ecosystems Management Symposium.
dbase/index.stm
November 1998. Published by the Great Barrier Reef Marine Park
FAO/UNDP/UNEP (1994). Land degradation in South Asia: its severity,
Authority, Townsville, Australia.
causes and eff ects upon the people. World Soil Resources Report
Done, T.J. (1999). Coral community adaptability to environmental
No. 78. United Nations Food and Agricultural Organization, Rome,
change at the scales of regions, reefs, and reef zones. American
Italy.
Zoologist 39:66-79.
GEF (1999). Formulation of a TDA and preliminary framework of strategic
Down to Earth (2001). The shrimp industry. No. 51, Nov. 2001. Retrieved
action programme for the Sulu-Sulawesi LME. Global Environmental
Aug. 2003 from: http://www.dte.gn.apc.org/51srp.htm
Facility.
Drigo, R. and Marcoux, A. (1999). Population dynamics and the
Gunnerson, C.G. and Cuellar, M. (1988). Case studies: Manila Bay. p 307-
assessment of land use changes and deforestation. Sustainable
317 In: Gunnerson, C.G. (ed.) Wastewater management for coastal
Development Department, United Nations Food and Agricultural
cities. The ocean disposal option. World Bank Technological Paper
Organization, Rome, Italy.
No. 77. World Bank, Washington, D.C.
Edinger, E.N., Jompa, J., Limmon, G.V., Widjatmoko, W. and Risk, M.J.
Hardin, G. (1968). The Tradgedy of the Commons. Science 162:1243-
(1998). Reef degradation and coral biodiversity in Indonesia: land-
1248.
based pollution, destructive fi shing practices and changes over
Hettige, H., Huq, M., Pargal, S. and Wheeler, D. (1996). Determinants of
time. Marine Pollution Bulletin 36:617-630.
pollution abatement in developing countries: Evidence from South
Erdmann, M.V. and Merrill, P. (2003). Multiple-use Zoning in Marine
and Southeast Asia. World Development 24 (12):1891-1904.
Protected Areas: Bunaken National Park case study (Indonesia).
Hodgson, G., and Dixon, J.A. (1988). Logging versus fi sheries and tourism
Proceedings Second International Tropical Marine Ecosystems
in Palawan. East-West Environment and Policy Institute. Occasional
Management Symposium, Manila, Philippines, April, 2003.
Paper No. 7.
REFERENCES
67
Hodgson, G. and Dixon, J.A. (1992). Sedimentation damage to marine
LME (2003). Large Marine Ecosystems of the World. LME #37: Sulu-
resources: Environmental and economic analysis. p 421-446 In:
Celebes. Retrieved Aug. 2003 from: http://www.edc.uri.edu/lme/
Marsh, J.B. (ed.) Resources and Environment in Asia's Marine Sector.
text/sulu-celebes-sea.htm
Taylor and Francis, Washington.
Maclean, J.L. (1989). An overview of Pyrodinium red tides in the western
Hoegh-Guldberg, O. (1999). Climate change, coral bleaching and the
Pacifi c. p 1-8 In: Hallegraeff , G.M. and Maclean, J.L. (eds.) Biology,
future of the world's coral reefs. Marine and Freshwater Research
epidemiology and management of Pyrodinium red tides. ICLARM
50:839-866.
Conf. Proc. 21: Fisheries Department, Ministry of Development,
Hopley, D. and Suharsono. (2000). The status of Coral Reefs in Eastern
Brunei Darussalam, and International Centre of Living Aquatic
Indonesia. Australian Institute of Marine Science.
Management, Manila, Philippines.
Hughes, T.P. (1994). Catastrophes, phase-shifts and large scale
McManus, L.T. (2000). Transboundary Diagnostic Analysis of the South
degradation of a Caribbean coral reef. Science 265:1547-1551.
China Sea. UNEP/EAS/RCU, Bangkok, Thailand.
Ingles, J. (2000). Fisheries of the Calamianes Islands, Palawan Province,
Merrill, R. (2001). Workshop among NRM/EPIQ, The Nature Conservancy,
Philippines. p 45-64 In: Werner, T.B. and Allen, G.R. (2000). A Rapid
World Wide Fund for Nature Indonesia and the Ministry of Forestry's
Marine Biodiversity Assessment of the Calamianes Islands, Palawan
Director General for Forest Protection and Nature Conservation.
Province, Philippines. RAP Bulletin of Biological Assessment 17.
Ming, C.L., Wilkinson, C., Gomez, E. and Sudara, S. (1994). Status of coral
Washington DC. Conservation International.
reefs in the ASEAN region. p 8-12 In: Wilkinson, C.R. (ed.) Living
Jacinto, G.S., Alino, P.M., Villanoy, C.L., Talaue-McManus, L. and Gomez,
coastal resources of Southeast Asia: Status and Management.
E.D. (2000). The Philippines. In: Sheppard, C.R.C. (ed.) Seas at the
Report of the Consultative forum third ASEAN-Australia Symposium
Millenium: An Environmental Evaluation. Vol. II Regional Chapters:
on Living Coastal Resources. Chulalongkorn University Bangkok,
The Indian Ocean to the Pacifi c. Pergamon Press, Elsevier.
Thailand. May 1994. Australian Institute of Marine Science.
Jackson, J.B.C. (1997). Reefs since Columbus. Coral Reefs 16:S23-S32.
MPP-EAS (1998). Marine pollution management in the Malacca/
Jackson, J.B.C., Kirby, M.X., Berger, W.H., Bjorndal, K.A., Botsford,
Singapore Straits: Lessons learned. MPP-EAS/Info99/195. GEF/UNDP/
L.B., Bourque, B.J., Bradbury, R.H., Cooke, R., Erlandson, J., Estes,
IMO Regional Programme for the Prevention and Management of
J.A., Hughes, T.P., Kidwell, S., Lange, C.B., Lenihan, H.S., Pandolfi ,
Marine Pollution in the East Asian Seas. Quezon City, Philippines.
J.M., Peterson, C.H., Steneck, R.S., Tegner, M.J. and Warner, R.R.
NOAA/NESDIS (2003). NOAA Satellites and information. Retrieved
(2001). Historical Overfi shing and the Recent Collapse of Coastal
Aug. 2003 from: http://www.osdpd.noaa.gov/PSB/EPS/SST/
Ecosystems. Science 293:629-638.
climohot.html
Johannes, R.E. and Riepen, M. (1995). Environment, economic and social
NRM Headline News (2000). Natural Resources Management Headline
implications of the live fi sh trade in Asia and the western Pacifi c.
News. Information courtesy M. Erdmann, Bunaken National Park.
Report to the Nature conservancy and Forum Fisheries Agency.
Issue 12. Available at http://www.bunaken.info/nrm_news.html
Kahn, B. and Fauzi, A. (2001). Fisheries in the Sulu Sulawesi Seas -
NRM Headline News (2001). Natural Resources Management Headline
Indonesian Country Report. Assessment of the state of biophysical,
News. Information courtesy M. Erdmann, Bunaken National Park.
socio-economic, and institutional aspects of coastal and pelagic
Issue 33. Available at http://www.bunaken.info/nrm_news.html
fi sheries in the Indonesian part of the Sulu-Sulawesi Seas. WWF
NRM Headline News (2002a). Natural Resources Management
Sulu-Sulawesi Marine Ecoregion Fisheries Project.
Headline News. Information courtesy Sri Hardiyanti Gunadi, Kim
Kleypas, J.A., Buddemeier, R.W., Archer, D., Gattuso, J-P., Langdon, C.
J. deRidder and Mark V. Erdmann. Issue 10. Available at http://
and Opdyke, B.N. (1999). Geochemical consequences of increased
www.bunaken.info/nrm_news.html
atmospheric carbon dioxide on coral reefs. Science 284:118-120.
NRM Headline News (2002b). Natural Resources Management Headline
Licuanan, W.Y., and Gomez, E.D. (2000). Philippine coral reefs, and
News. Information courtesy William Faries. Issue 11. Available at
associated fi sheries status and recommendations to improve their
http://www.bunaken.info/nrm_news.html
management. Global Coral Reef Monitoring Network. Australia
NRM Headlines (2002c). Natural Resources Management Program
Institute of Marine Science.
Headline News. Issue 4. Available at http://www.bunaken.info/
Ludwig, H.F. (1985). Final report of the consultant (phase I report). Segara
nrm_news.html
Anakan Environmental Monitoring and Optimal Use Planning
Project, Institute of Hydraulic Engineering, Bandung, Indonesia.
68
GIWA REGIONAL ASSESSMENT 56 SULUCELEBES SULAWESI SEA
NRM Headline News (2003). Natural Resources Management
Rossiter, W.W. (2002). Fisheries conservation crisis in Indonesia. Massive
Headline News. Information courtesy of Idham Arsyad, NRM III
destruction of marine mammals, sea turtles and fi sh reported
Protected Areas Management Specialist and Reed Merrill, NRM III
from trap nets in pelagic migratory channel. Retrieved Sept.
Protected Areas & Agriculture Advisor. Issue 4. Available at http://
2003 from: http://darwin.bio.uci.edu/~sustain/bio65/indonesia/
www.bunaken.info/nrm_news.html
indon97e.htm
Ormond, R.F.G., Bradbury, R., Bainbridge, S., Fabricus, K., Keesing, J.,
Rudd, M.A., Tupper, M.H., Folmer, H. and van Kooten, G.C. (2003). Policy
De Vantier, L., Medley, P. and Steven, A. (1990). Test of a model
analysis for tropical marine reserves: challenges and directions. Fish
of regulation of crown-of-thorns starfi sh by fi sh predators. In:
and Fisheries 4(1):65.
Bradbury, R.H. (ed.) Acanthaster and the Coral Reef: A Theoretical
Russ, G. and Alcala, A. (1996a). Marine reserves: rates and patterns
Perspective, Lecture Notes in Biomathematics 88. Springer-Verlag,
of recovery and decline in abundance of large predatory fi sh.
New York.
Ecological Applications 6:947-961.
ORNL (2003). Landscan 2002. Oak Ridge National Laboratory. Retrieved
Russ, G. and Alcala, A. (1996b). Do marine reserves export adult fi sh
Nov. 2003 from: http://www.ornl.gov/gist
biomass? Evidence from Apo Island, central Philippines. Marine
Pargal, S., Hettige, H., Singh, M. and Wheeler, D. (In preparation). Formal
Ecology Progress Series 132:1-9.
and informal regulation of industrial pollution: Comparative
Russ, G. (1985). Eff ects of protective management on coral reef fi shes
Evidence from Indonesia and the US. PRD Working Paper # 1797.
in the central Philippines. Proceedings 5th International Coral Reef
World Bank Policy Research Working Paper Series.
Congress 4:219-224.
Pauly, D. (1989). Fisheries resources management in southeast Asia:
Sardjono, I. (1980). Trawlers banned in Indonesia. ICLARM Newsletter,
Why bother? p 1-9 In: Chua, T.E. and Pauly, D. (eds.) Coastal area
3(4):3.
management in Southeast Asia: Policies, management strategies
Sherwood, K. (2002). Local commitment to conservation: A Philippine
and case studies. Proceedings of the ASEAN/US Policy Workshop on
success story. p 143 In: Wilkinson, C. (ed.) Status of Coral Reefs of the
Coastal Area Management Johore Bahru, Malaysia. 25-27 October
World: 2002. Australian Institute of Marine Science.
1988.
Spalding, M., Ravilious, C. and Green, E.P. (2001). World Atlas of Coral
Pauly, D., Saeger, J. and Prein, M. (1998). Malthus und die Kuestenfi scherei
Reefs. United Nations Environment Programme World Conservation
der Tropen: eine philippinische Fallstudie. Entwickl. Laendlicher
Monitoring Centre.
Raum 32(2):17-20. (In German)
Talaue-McManus, L. (2000). Transboundary Diagnostic Analysis for the
Pet, J. and Pet-Soede, L. (1999). A note on cyanide fi shing in Indonesia.
South China Sea. EAS/RCU Technical Report Series No. 14, UNEP,
SPC Live Reef Fish Bulletin 5:21-22.
Bangkok, Thailand.
Pet-Soede, L. and Erdmann, M. (1999). An overview and comparison
The National Academies (1998). Fishing should be reduced substantially
of destructive fi shing practices in Indonesia. SPC Live Reef Fish
to protect marine ecosystems. Retrieved July 2002 from http://
Bulletin 4:28-36.
www4.nas.edu/news.nsf/isbn/0309055261?OpenDocument
Pilcher, N. and Cabanban, A. (2000). The status of coral reefs in eastern
UNEP/WCMC (2003). World Database on Protected Areas. UNEP Geo Data
Malaysia. Australian Institute of Marine Science.
Portal. Retrieved Nov. 2003 from: http://geodata.grid.unep.ch
Pratt, V.R. (1996). The growing threat of cyanide fi shing in the Asia
University of British Columbia Fisheries Centre (2003). Large
Pacifi c Region, and the emerging strategies to combat it. Coastal
marine ecosystems. Retrieved Aug. 2003 from: http://
Management in Tropical Asia 5:9-11.
www.seaaroundus.org/lme/summaryinfo.aspx?lme=37#
Roberts, C.M. and Hawkins, J.P. (2000). Fully-protected marine reserves:
USGS (2002). Global GIS database: Global Land Cover Characteristics.
A guide. WWF in Washington DC, US, University of York, York, UK.
CD-rom. US Department of the Interior, US Geological Survey,
Roberts, C.M., Colin, J.M., Veron, J.E.N., Hawkins, J.P., Allen, G.R., McAllister,
Flagstaff , USA.
D.E., Mittermeier, C.G., Svhueller, F.W., Spalding, M., Wells, F., Vynne,
Uychiaoco, A.J., Alino, P.M. and White, A.T. (2002). Marine Protected Areas
C. and Werner, T.B. (2002). Marine biodiversity hotspots and
in the Philippines: Towards harmonizing goals and strategies. 4th
conservation priorities for tropical reefs. Science 295:1280-1284.
IUCN/WCPA-East Asia Conference.
REFERENCES
69
Valencia, M.J. (1989). Petroleum and minerals: Policy Issues. p 27-41
WRI (2003). World Resources Institute. Retrieved Aug. 2003 from: http:
In: Chua, T.E. and Pauly, D. (eds.) Coastal Area Management in
//www.wri.org/
Southeast Asia: Policies, Management Strategies and Case Studies.
WWF (2001). Sulu-Sulawesi Seas Ecoregion: Users, Uses and Threats.
Association of Southeast Asian Nations/United States Coastal
A report integrated by Raoul Cola for the Sulu-Sulawesi Marine
Resources Management Project Conference Proceedings 2.
Ecoregion Program, WWF.
Veron, J.E.N. (2000). Corals of the World. 3 Vols. Australian Institute of
WWF (2003). WWF International corals initiative - Sulu Sulawesi marine
Marine Science.
ecoregion. Retrieved Aug. 2003 from: http://www.panda.org/
Weber, M.L. (1998). A Global Assessment of Major Fisheries at Risk,
downloads/marine/wwfssme2.pdf
Relevant Management Regimes, and Non-Governmental Young, A. and Serna, E. (1982). Country report: Philippines. p 16-19 In:
Organizations. Prepared for the Pew Charitable Trusts.
Davy, B.F. and Graham, M. (eds.) Proceedings of the workshop
Werner, T.B. and Allen, G.R. (2000). A Rapid Marine Biodiversity
on bivalve culture in Asia and the Pacifi c, 16-19 February
Assessment of the Calamianes Islands, Palawan Province,
1982. International Development Research Centre of Canada.
Philippines. RAP Bulletin of Biological Assessment 17. Washington
Singapore.
DC. Conservation International.
White, A.T., Christie, P., Divinagracia, M.F., Apurado, J., Alvarado, A.
and White E. (1999). Summary fi eld report: coral reef surveys for
Personal communication
conservation in southwest Bohol, Earthwatch Expedition to the
Alcala, A. (SUAKCREM Marine Laboratory, Dumaguete City, Philippines)
Philippines, May 1-22, 1999. Coastal Resource Management Project,
Chua, T.E. (PEMSEA (GEF/UNDP/IMO Regional Programme on
Sulu Fund and Earthwatch Institute, Cebu City.
Partnerships in Environmental Management for the Seas of East
Wilkinson, C. (ed.) (2000). Status of Coral Reefs of the World: 2000.
Asia), Philippines)
Australian Institute of Marine Science, Townsville, Australia.
Lina, J. (Interior and Local Government Secretary, Philippines)
Wilkinson, C. (ed.) (2002). Status of Coral Reefs of the World: 2002.
R. Merrill (Protected Areas & Agriculture Advisor NRM III, Jakarta,
Australian Institute of Marine Science, Townsville, Australia.
Indonesia)
World Bank (2003a). World bank data and statistics. Retrieved Aug.
Miclat, E. (SSME Program, WWF, Quezon City, Philippines)
2003 from: http://www.worldbank.org/data/countrydata/
Mous, P. (The Nature Concervancy, Indonesia)
countrydata.html
Pet-Soede, L. (Fisheries Program Manager, WWF Indonesia - Wallacea
World Bank (2003b). World bank's health, nutrition and population
Program, Indonesia)
data. Retrieved Aug. 2003 from http://devdata.worldbank.org/
Trono, R. (WWF-Philippines and SSME Program, WWF, Quezon City,
hnpstats/
Philippines)
World Bank (2004). World Development Indicators Database. Retrieved
Jan. 2005 from: http://devdata.worldbank.org/data-query/
70
GIWA REGIONAL ASSESSMENT 56 SULUCELEBES SULAWESI SEA
Annexes
Annex I
List of contributing authors and organisations involved
Name
Institutional affiliation
Country
Field of work
Dr. Achmad Abdullah
Past Director for Conservation and Marine National Parks, Ministry of Marine Affairs and
Indonesia
Natural resources management and protected areas policy
(deceased)
Fisheries, Jakarta
Directorate for Marine and Coastal Degradation Control, Environment Impact Management
Ms. Heni Augustina
Indonesia
Coastal and marine pollution, health and EIA policy
Agency, (BAPEDAL), Jakarta
Dr. Angel Alcala
SUAKCREM Marine Laboratory, Dumaguete City
Philippines
Coral reef ecosystems, fisheries assessment and management
Dr. Porfirio Alino
Marine Science Institute, University of the Philippines, Diliman, Quezon City
Philippines
Coral reef ecosystems -assessment and management, global change
Dr. Imam Bachtiar
Biology Dept., FKIP, Mataram University
Indonesia
Coral reef ecosystems, global change and fisheries
Mr. Ronald Bonifacio
Coastal Management Center, Manila
Philippines
Natural resources management
Tropical coastal and marine ecosystems assessment and
Dr. Annadel Cabanban
Borneo Marine Research Unit, University Malaysia, Sabah
Malaysia
management
Terrestrial and marine protected areas - assessment, planning,
Ms. Catherine Cheung
International Conservation Union, Hanoi, Vietnam
Australia
management and policy
Dr Laura David
World Fish Center (ICLARM), Penang, Malaysia
Philippines
Tropical coastal and marine ecosystems Ł connectivity, management
Dr. Lyndon DeVantier
International Marine Projects Activities Centre and CRC Reef Research Centre, Townsville, Qld Australia
Coral reef ecosystems and marine protected areas
Marine protected areas and fisheries - assessment, planning,
Ms. Rili Djohani
The Nature Conservancy Coastal and Marine Program Indonesia, Denpasar
Indonesia
management and policy
Marine protected areas and coral reef biodiversity - assessment,
Dr. Mark Erdmann
Conservation International, Denpasar, Bali, Indonesia
Indonesia
planning, management and policy
Tropical coastal and marine ecosystems - assessment and
Dr. Miguel Fortes
Marine Science Institute, University of the Philippines, Diliman, Quezon City
Philippines
management
Tropical coastal and marine ecosystems - assessment and
Dr. Ed Gomez
Marine Science Institute, University of the Philippines, Diliman, Quezon City
Philippines
management
Dr. Kevin Hiew
National Programme Director, WWF Malaysia, Petaling Jaya Selangor
Malaysia
Tropical ecosystems policy and management
Dr. Jose Ingles
Sulu-Sulawesi Marine Ecoregion Program (SSME), WWF Quezon City
Philippines
Coral reef fisheries assessment and management
Tropical coastal and marine ecosystems - assessment and
Dr. Gil Jacinto
Marine Science Institute, University of the Philippines, Diliman, Quezon City
Philippines
management
Dr. Roger Juliano
Coastal Management Center, Manila
Philippines
Coastal and marine environmental policy
Dr. Teng Seh Keng
Coastal Management Center, Manila
Philippines
Coastal and marine environmental policy
IOC/WESPAC Secretariat, Bangkok
Mr. Maarten Kuijper
Thailand
Coastal and marine environmental policy
Dr. David Lawrence
International Marine Projects Activities Centre, Townsville, Qld
Australia
Anthropology, socio-economics
Dr. Al Licuanan
Marine Science Institute, University of the Philippines, Diliman, Quezon City
Philippines
Coastal and marine environmental policy
Dr. Medel Limsuan
Department of Environment and Natural Resources, Quezon City
Philippines
Coastal and marine environmental policy
Ms. Evangeline Miclat
SSME Program, WWF, Quezon City
Philippines
Coastal and marine environmental policy
ANNEXES
71
Dr. Peter Mous
The Nature Conservancy Coastal and Marine Program Indonesia, Denpasar, Bali, Indonesia
Indonesia
Tropical marine resources management and protected areas
Assoc. Prof. Cleto Nanola
University of the Philippines, Mindanao
Philippines
Coral reefs - assessment and management
Program Manager, Southeast Asia Center for Marine Protected Areas, The Nature
Tropical natural resources management, fisheries and protected
Dr. Jos S. Pet
Indonesia
Conservancy
areas
Fisheries, tropical natural resources management and protected
Dr. Lida Pet-Soede
Fisheries Program Manager, WWF Indonesia - Wallacea Program
Indonesia
areas
Tropical coastal and marine ecosystems, Marine Turtles
Dr. Nicolas Pilcher
Technical Advisor, Community Conservation Network
Republic of Palau
Ł assessment and management
Dr. Srihartiningsih
Assistant Deputy Minister, The State Ministry for Environment, Jakarta
Indonesia
Coastal and marine environmental policy Ł socio-economics
Purnomohadi
Dr Ketut Sarjana Putra
Formerly of WWF Indonesia-Wallacea Bioregion Programme, Denpasar
Philippines
Coastal and marine environmental management
Prof. Robin South
International Ocean Institute Regional Centre for Australia, Townsville, Qld
Australia
Tropical coastal and marine ecosystems policy and management
Dr. Posa Skelton
International Ocean Institute Regional Centre for Australia, Townsville, Qld
Australia
Coral reef ecosystems Ł algal taxonomy and ecology
Dr. Jan Steffan
UNESCO, Jakarta, Indonesia
Indonesia
Tropical natural resources management, planning and policy
GEF/UNDP/IMO Regional Programme on Partnerships in Environmental Management for the
Coastal and marine environmental management Ł planning, socio-
Dr. Chua Thia-Eng
Philippines
Seas of East Asia (PEMSEA), Quezon City
economics and policy
Dr. Romeo Trono
Formerly WWF-Philippines and SSME Program, WWF, Quezon City
Philippines
Tropical natural resources management, planning and policy
Tropical coastal and marine ecosystems Ł assessment, monitoring,
Dr. Clive Wilkinson
International Marine Projects Activities Centre and CRC Reef Research Centre, Townsville, Qld Australia
management and policy
72
GIWA REGIONAL ASSESSMENT 56 SULUCELEBES SULAWESI SEA
Annex II
Detailed scoring tables
I: Freshwater shortage
II: Pollution
Weight
Weight
Environmental
Environmental
Environmental issues
Score
Weight %
averaged
Environmental issues
Score
Weight %
averaged
concern
concern
score
score
1. Modification of stream flow
2
N/a
Freshwater shortage
2
4. Microbiological
1
N/a
Pollution
2
2. Pollution of existing supplies
2
N/a
5. Eutrophication
2
N/a
3. Changes in the water table
2
N/a
6. Chemical
1
N/a
7. Suspended solids
3
N/a
Criteria for Economic impacts
Raw score
Score
Weight %
8. Solid wastes
2
N/a
Size of economic or public sectors
Very small
Very large
2
N/a
affected
0 1 2 3
9. Thermal
1
N/a
Degree of impact (cost, output changes
Minimum
Severe
2
N/a
etc.)
0 1 2 3
10. Radionuclide
0
N/a
Occasion/Short
Continuous
Frequency/Duration
2
N/a
0 1 2 3
11. Spills
1
N/a
Weight average score for Economic impacts
2
Criteria for Health impacts
Raw score
Score
Weight %
Criteria for Economic impacts
Raw score
Score
Weight %
Very small
Very large
Number of people affected
1
N/a
Size of economic or public sectors
Very small
Very large
0 1 2 3
2
N/a
affected
0 1 2 3
Minimum
Severe
Degree of severity
1
N/a
Degree of impact (cost, output changes
Minimum
Severe
0 1 2 3
2
N/a
etc.)
0 1 2 3
Occasion/Short
Continuous
Frequency/Duration
1
N/a
Occasion/Short
Continuous
0 1 2 3
Frequency/Duration
2
N/a
0 1 2 3
Weight average score for Health impacts
1
Weight average score for Economic impacts
2
Criteria for Other social and
Raw score
Score
Weight %
community impacts
Criteria for Health impacts
Raw score
Score
Weight %
Number and/or size of community
Very small
Very large
1
N/a
Very small
Very large
affected
0 1 2 3
Number of people affected
2
N/a
0 1 2 3
Minimum
Severe
Degree of severity
1
N/a
Minimum
Severe
0 1 2 3
Degree of severity
2
N/a
0 1 2 3
Occasion/Short
Continuous
Frequency/Duration
1
N/a
Occasion/Short
Continuous
0 1 2 3
Frequency/Duration
2
N/a
0 1 2 3
Weight average score for Other social and community impacts
1
Weight average score for Health impacts
2
Criteria for Other social and
Note: N/a = Not applied
Raw score
Score
Weight %
community impacts
Number and/or size of community
Very small
Very large
2
N/a
affected
0 1 2 3
Minimum
Severe
Degree of severity
2
N/a
0 1 2 3
Occasion/Short
Continuous
Frequency/Duration
2
N/a
0 1 2 3
Weight average score for Other social and community impacts
2
Note: N/a = Not applied
ANNEXES
73
III: Habitat and community modification
IV: Unsustainable exploitation of fish and other
living resources
Weight
Weight
Environmental
Environmental
Environmental issues
Score
Weight %
averaged
Environmental issues
Score
Weight %
averaged
concern
concern
score
score
Habitat and community
12. Loss of ecosystems
3
N/a
3
Unsustainable
modification
14. Overexploitation
3
N/a
3
exploitation of fish
13.Modification of ecosystems or
15. Excessive by-catch and
3
N/a
ecotones, including community
discards
3
N/a
structure and/or species
composition
16. Destructive fishing practices
3
N/a
17. Decreased viability of stock
1
N/a
through pollution and disease
Criteria for Economic impacts
Raw score
Score
Weight %
18. Impact on biological and
3
N/a
genetic diversity
Size of economic or public sectors
Very small
Very large
3
N/a
affected
0 1 2 3
Degree of impact (cost, output changes
Minimum
Severe
3
N/a
etc.)
0 1 2 3
Criteria for Economic impacts
Raw score
Score
Weight %
Occasion/Short
Continuous
Frequency/Duration
3
N/a
0 1 2 3
Size of economic or public sectors
Very small
Very large
3
N/a
affected
0 1 2 3
Weight average score for Economic impacts
3
Degree of impact (cost, output changes
Minimum
Severe
3
N/a
etc.)
0 1 2 3
Criteria for Health impacts
Raw score
Score
Weight %
Occasion/Short
Continuous
Frequency/Duration
3
N/a
0 1 2 3
Very small
Very large
Number of people affected
2
N/a
0 1 2 3
Weight average score for Economic impacts
3
Minimum
Severe
Degree of severity
2
N/a
0 1 2 3
Criteria for Health impacts
Raw score
Score
Weight %
Occasion/Short
Continuous
Frequency/Duration
2
N/a
0 1 2 3
Very small
Very large
Number of people affected
3
N/a
0 1 2 3
Weight average score for Health impacts
2
Minimum
Severe
Degree of severity
3
N/a
0 1 2 3
Criteria for Other social and
Raw score
Score
Weight %
Occasion/Short
Continuous
community impacts
Frequency/Duration
3
N/a
0 1 2 3
Number and/or size of community
Very small
Very large
3
N/a
affected
0 1 2 3
Weight average score for Health impacts
3
Minimum
Severe
Degree of severity
3
N/a
Criteria for Other social and
0 1 2 3
Raw score
Score
Weight %
community impacts
Occasion/Short
Continuous
Frequency/Duration
3
N/a
0 1 2 3
Number and/or size of community
Very small
Very large
3
N/a
affected
0 1 2 3
Weight average score for Other social and community impacts
3
Minimum
Severe
Degree of severity
3
N/a
0 1 2 3
Note: N/a = Not applied
Occasion/Short
Continuous
Frequency/Duration
3
N/a
0 1 2 3
Weight average score for Other social and community impacts
3
Note: N/a = Not applied
74
GIWA REGIONAL ASSESSMENT 56 SULUCELEBES SULAWESI SEA
V: Global change
Weight
Environmental
Environmental issues
Score
Weight %
averaged
concern
score
19. Changes in the hydrological
1
N/a
Global change
1
cycle
20. Sea level change
1
N/a
21. Increased UV-B radiation as a
0
N/a
result of ozone depletion
22. Changes in ocean CO 2
0
N/a
source/sink function
23. Increase in sea surface
1
N/a
temperature
Criteria for Economic impacts
Raw score
Score
Weight %
Size of economic or public sectors
Very small
Very large
1
N/a
affected
0 1 2 3
Degree of impact (cost, output changes
Minimum
Severe
1
N/a
etc.)
0 1 2 3
Occasion/Short
Continuous
Frequency/Duration
1
N/a
0 1 2 3
Weight average score for Economic impacts
1
Criteria for Health impacts
Raw score
Score
Weight %
Very small
Very large
Number of people affected
1
N/a
0 1 2 3
Minimum
Severe
Degree of severity
1
N/a
0 1 2 3
Occasion/Short
Continuous
Frequency/Duration
1
N/a
0 1 2 3
Weight average score for Health impacts
1
Criteria for Other social and
Raw score
Score
Weight %
community impacts
Number and/or size of community
Very small
Very large
1
N/a
affected
0 1 2 3
Minimum
Severe
Degree of severity
1
N/a
0 1 2 3
Occasion/Short
Continuous
Frequency/Duration
1
N/a
0 1 2 3
Weight average score for Other social and community impacts
1
Note: N/a = Not applied
Comparative environmental and socio-economic impacts of each GIWA concern
Types of impacts
Environmental score
Economic score
Human health score
Social and community score
Overall
Concern
Rank
score
Present (a)
Future (b)
Present (c)
Future (d)
Present (e)
Future (f)
Present (g)
Future (h)
Freshwater shortage
2
3
2
2
1
2
1
2
1.9
4
Pollution
2
3
2
3
2
3
2
3
2.5
3
Habitat and community
3
3
3
3
2
3
3
3
2.9
2
modification
Unsustainable exploitation of fish
3
3
3
3
3
3
3
3
3.0
1
and other living resources
Global change
1
1
1
2
1
1
1
1
1.1
5
ANNEXES
75
Annex III
building partnerships with regional and regional inter-governmental
List of important water-related fora, other UN agencies, national governments, NGOs, the private sector,
programmes and assessments
academic and research institutions, civil society, and the media.
East Asian Seas Regional Coordinating Unit
Major inter-governmental agreements and actors
Information on the UNEP East Asian Seas Programme can be found on the
UN Economic and Social Commission for Asia and the Pacifi c
web site of the Coordinating Unit, which is located with ROAP. The Unit is
(ESCAP)
the coordinating body for the East Asian Seas Action Plan (see below).
Within the Water Resources Programme under its Environment and
Natural Resources Development Division, the UN ESCAP organises
Financial institutions
seminars and workshops on various issues relating to water resources,
Asian Development Bank (ADB)
including: Water resources assessment; integrated water resources
The Asian Development Bank, a multilateral development fi nance
development and management; protection of water resources,
institution, was founded in 1966 by 31 member governments to
water quality and aquatic ecosystems; river basin development
promote the social and economic progress of the Asia-Pacifi c region.
and management; promotion of infrastructure development and
It now has 58 member countries, 42 from within the region and
investment for drinking water supply and sanitation; water pricing and
16 non-regional. ADB gives special attention to the needs of the smaller
promotion of private investment in the water sector; water demand
or less-developed countries, and to regional, sub-regional, and national
management, water saving and economic use of water; and mitigation
projects and programmes. Promoting sustainable development and
of water-related natural disasters, particularly fl ood loss reduction.
environmental protection is a key strategic development objective of
the Bank. To fulfi l this objective, the Bank: (i) reviews the environmental
Association of Southeast Asian Nations (ASEAN)
impacts of its projects, programmes and policies; (ii) encourages DMC
ASEAN was established in 1967 and has 10 member countries: Brunei,
governments and executing agencies to incorporate environmental
Cambodia, Indonesia, Laos, Malaysia, Myanmar, Philippines, Singapore,
protection measures in their project design and implementation
Thailand and Vietnam. The ASEAN Declaration states that the aims and
procedures, and provides technical assistance for this purpose; (iii)
purposes of the Association are: to accelerate the economic growth,
promotes projects and programmes that will protect, rehabilitate, and
social progress and cultural development in the region through
enhance the environment and the quality of life; and (iv) trains Bank and
joint endeavours in the spirit of equality and partnership in order to
DMC staff in, and provides documentation on, environmental aspects
strengthen the foundation for a prosperous and peaceful community
of economic development. The Asian Development Fund (ADF) is the
of Southeast Asian nations, and to promote regional peace and stability
concessional lending window of the Bank.
through abiding respect for justice and the rule of law in the relationship
among countries in the region and adherence to the principles of
Action programmes, strategies and research
the United Nations Charter. In 1995, the ASEAN Heads of States and
ASEAN Strategic Plan of Action on the Environment
Government re-affi
rmed that "Cooperative peace and shared prosperity
The Strategic Plan of Action on the Environment for 1994-1998 has the
shall be the fundamental goals of ASEAN." See also ASEAN work on
following fi ve objectives:
water conservation (incl. ANWRA) and seas and marine environment;
To respond to specifi c recommendations of Agenda 21 requiring
ASEAN Network of Water Resources Agencies (ANWRA); the Strategic
priority action in ASEAN;
Plan of Action for the Environment (see below), adopted by the ASEAN
To introduce policy measures and promote institutional
Ministers of Environment; and ASEAN 1997 Jakarta Declaration on
development that encourage the integration of environmental
Environment and Development.
factors in all developmental processes both at the national and
regional levels;
UNEP Regional Offi
ce for Asia and the Pacifi c (ROAP)
To establish long-term goals on environmental quality and work
Working closely with the Division of Regional Co-operation and
towards harmonised environmental quality standards for the
Representation in UNEP's Nairobi-based headquarters, the Regional
ASEAN region;
Offi
ce for Asia and the Pacifi c (ROAP) looks to adopt global environmental
To harmonise policy directions and enhance operational and
policy to regional priorities and needs. It acts as a catalyst, coordinator,
technical cooperation on environmental matters, and undertake
facilitator and mobiliser of resources. It puts particular emphasis on
joint actions to address common environmental problems;
76
GIWA REGIONAL ASSESSMENT 56 SULUCELEBES SULAWESI SEA
To study the implications of AFTA on the environment and take
East Asian Seas Action Plan
steps to integrate sound trade policies with sound environmental
On the initiative of the fi ve states of the East Asian region; Indonesia,
policies.
Malaysia, Philippines, Singapore and Thailand, the Governing Council
of UNEP in 1977 decided that "steps are urgently needed to formulate
Despite the impacts of the recent economic crisis on the natural
and establish a scientifi c programme involving research, prevention
resources and environmental conditions, the ASEAN Environment
and control of marine pollution and monitoring" for a regional action
Ministers at their Fifth Informal Meeting in April 2000 discussed the
plan in East Asia. An Action Plan for the Protection and Sustainable
importance of keeping their commitment to environmental protection
Development of the Marine Environment and Coastal Areas of the East
and sustainable development. Hence, to move forward towards the
Asian Region was adopted in 1981, with a decision making body, the
future goals and directions that the ASEAN leaders expressed in
Coordinating Body on the Seas of East Asia (COBSEA). A revised Action
ASEAN Vision 2020 and the Hanoi Plan of Action (adopted in 1997 and
Plan and a Long-term Strategy for the COBSEA for the 1994-2000
1998 respectively) the Ministers adopted the ASEAN Strategic Plan of
period were developed in 1994 and Australia, Cambodia, China, Korea
Action on the Environment (SPAE) for 1999-2004. It consists of the key
and Vietnam joined the Action Plan. A new East Asian Seas Action Plan
activities to be implemented by ASOEN (ASEAN Senior Offi
cials on the
"Leading the EAS Action Plan to the 21st Century" has been elaborated
Environment) and its subsidiary bodies over the next fi ve years, including
for the period 2000-2009.
the areas of coastal and marine environment, nature conservation and
biodiversity, multilateral environmental agreements, management of
State of the regional environment
land and forest fi res and haze, and other environmental activities.
GEO 2000 State of the Environment: Asia and the Pacifi c
Global Environment Outlook (GEO) is a global environmental assessment
Partnership in Environmental Management for the Seas of East
process, the GEO Process, that is cross-sectoral and participatory. It
Asia (PEMSEA)
incorporates regional views and perceptions, and builds consensus
A GEF project, focusing on "building partnerships within and among
on priority issues and actions through dialogue among policy-makers
governments of the region, as well as across public and private sectors
and scientists at regional and global levels. GEO outputs, in printed and
of the economy. The goal is to reduce or remove barriers to eff ective
electronic formats, including the GEO Report series. This series makes
environmental management, including inadequate or inappropriate
periodic reviews of the state of the world's environment, and provides
policies, disparate institutional and technical capabilities and limited
guidance for decision-making processes such as the formulation of
investment in environmental facilities and services". PEMSEA is based
environmental policies, action planning and resource allocation. Other
on two management frameworks developed and tested in an earlier
outputs include technical reports, a web site and a publication for
GEF Project: integrated coastal management, addressing land-water
young people.
interactions and the impacts of human activity in coastal areas; and risk
assessment/risk management, applying to sub-regional sea areas and
GEF Projects in the region
the impacts of human activities on marine ecosystems. PEMSEA web
Projects under implementation/UNDP - GEF - International waters:
resources include Virtual ICM, a Legal Information Database Reference
Building Partnerships for the Environmental Protection and
Catalogue, and a Directory of Research and Management Institutions in
Management of the East Asian Seas
Southeast Asia, and a database of Good Practices. See also the PEMSEA
The objective of the project is to assist the riparian countries of the East
Updates, a free online newsletter.
Asian Seas to collectively protect and manage their heavily stressed
coastal and marine environments through inter-governmental and
UNEP Regional Seas Programme
inter-sectoral partnerships. These countries include the Republic
The Regional Seas Programme was initiated in 1974 as a global
of Korea which for the fi rst time is a GEF recipient. Building upon
programme implemented through regional components. The Regional
the methodologies, approaches, typologies, networks and lessons
Seas Programme is UNEP's main framework in the fi eld of the coastal and
learned from the pilot phase, the project would enhance and
marine environment. It includes 14 regions and three partner seas, involves
complement national and international eff orts by removing or
more than 140 coastal states, and focuses on sustainable development of
lowering critical barriers regarding policy, investment, capacity, which
coastal and marine areas. Each regional action plan is formulated according
are having negative eff ects on the management of the coastal/marine
to the needs and priorities of the region as perceived by the Governments
environment in the region. Together with several water body-based
concerned. Regional conventions are in place for several areas.
projects in the area, these projects constitute GEF's programmatic
ANNEXES
77
approach to these coastal and marine waters with globally signifi cant
Project concepts in the pipeline / UNDP - GEF - Biodiversity:
ecosystems that are experiencing severe degradation.
Conservation of the Ecological Balance of the Sulu-Sulawesi
Marine Ecosystems
Prevention and Management of Marine Pollution in the East
The overall objective of the project is to ensure that the shared marine
Asian Seas
resources and key biological features and processes are conserved in the
Development of policies and plans to control marine pollution from
long-term. The PDF-B phase will focus on four components: (i) establish
land-based and sea-based sources, upgrading of national and regional
coordination and consultation mechanisms; (ii) undertake a preliminary
infrastructures and technical skills, and establishment of fi nancing
diagnostic analysis of transboundary problems; (iii) prepare a full project
instruments for project sustainability. Project will include selection
brief and project document; and (iv) secure co-fi nancing for the full
of demonstration sites, establishment of regional monitoring and
project.
information network, and involvement of regional association of
marine legal experts to improve capacity to implement relevant
Other actors, initiatives and resources
conventions.
WorldFish Center (formely ICLARM)
An international research organisation "devoted to improving the
World Bank - GEF - Biodiversity:
productivity, management and conservation of aquatic resources
Coastal and Marine Biodiversity Conservation in Mindanao,
for the benefi t of users and consumers in developing countries".
Philippines
ICLARM is one of the research centres of CGIAR, Consultative Group
In this project, the GEF would aim to fi nance the incremental costs
on International Agricultural Research. ICLARM, in collaboration with
of promoting coastal and marine biodiversity conservation and
the Food and Agriculture Organization of the United Nations (FAO)
sustainable use in the coastal waters of Mindanao, Philippines. Mindanao
and other partners, and with support from the European Commission,
has received little attention to date with regard to conservation of its
has developed FishBase, a global information system on fi shes for
marine biodiversity resources. The GEF-assisted Coastal and Marine
research scientists, fi sheries managers, zoologists and many more.
and Biodiversity Conservation Component (CMBC) of the proposed
FishBase contains full information on 23 500 species. ICLARM has also
Mindanao Rural Development Project (MRDP) will remove the barriers
developed similar systems on coral reefs and their resources (ReefBase)
to mainstreaming marine and coastal biodiversity conservation in
and management of fi sh stocks in Asia (TrawlBase).
coastal zone development by: (a) establishing community-based
management of marine sanctuaries; (b) strengthening local capacity
International Coral Reef Initiative (ICRI)
to address marine ecosystem management issues; (c) enhancing the
An environmental partnership that brings stakeholders together
knowledge base for sound ecosystem management and decision-
with the objective of sustainable use and conservation of coral reefs
making, including monitoring and evaluation for sustainable long-
for future generations. ICRI is an informal mechanism that allows
term marine ecosystem management; and (d) developing policy and
representatives of over 80 developing countries with coral reefs to
action plans for marine biodiversity conservation and mainstreaming
sit in equal partnership with major donor countries and development
it into coastal development plans.
banks, international environmental and development agencies,
scientifi c associations, the private sector and NGOs to decide on the
The concept is based on the precept and the experiences that show
best strategies to conserve the world's coral reef resources.
that good marine management can simultaneously conserve and
protect biodiversity and increase fi sheries productivity. These activities
Coral Health and Monitoring Programme
would have considerable replication potential in Mindanao as part of
The mission of the NOOA Coral Health and Monitoring Program is
the MRDP that would be an Adaptable Lending Program of 10-12 year
to provide services to help improve and sustain coral reef health
duration. The lessons learned during the fi rst three-year phase would
throughout the world.
be applied to subsequent phases when additional coastal provinces
Long-term goals:
would be included under the MRDP with the cumulative experience
Establish an international network of coral reef researchers for the
strengthening implementation of the CMBC. These lessons would also
purpose of sharing knowledge and information on coral health and
have applicability in other regions of the Philippines and other tropical
monitoring.
countries.
Provide near real-time data products derived from satellite images
and monitoring stations at coral reef areas.
78
GIWA REGIONAL ASSESSMENT 56 SULUCELEBES SULAWESI SEA
Provide a data repository for historical data collected from coral reef
In support of MPAs in Indonesia:
areas.
TNC will be supporting an environmental policy expert to
Add to the general fund of coral reef knowledge.
participate and to then present the outcomes of the state-of-the-
art of MPA design at a Pre-KONAS III Symposium on MPAs, as well
See also Global Coral Reef Monitoring Network (GCRMN).
as the presence of their staff who chairs the WPCA/Asia team;
WWF is supporting the writing of a technical paper to summarise
The Sulu-Celebes Sea Large Marine Ecosystem
the most current knowledge on the economics of MPAs;
A Large Marine Ecosystem, LME, is a region of ocean space encompassing
NRM/EPIQ Program is supporting their coral reef expert to attend,
coastal areas from river basins and estuaries to the seaward boundary of
present the economic paper and work with the Indonesian team;
continental shelves and the seaward margins of coastal current systems.
Proyek Pesisir is supporting an Indonesian marine resource
It is a relatively large region characterised by distinct bathymetry,
economist from IPB to attend the meeting, learn the newest
hydrography, productivity, and trophically dependent populations. See
information on economics, and report back at the Pre-KONAS III
also Rhode Island University map of LMEs.
Symposium. In addition, they are supporting two of their technical
experts and four technical experts from the Ministry of Marine
Recent International meetings relevant to
Aff airs and Fisheries (DKP) to participate in the conference for
Marine Conservation and Integrated Coastal
Indonesia.
Management in Indonesia and the region
(information courtesy of Stacey A. Tighe, Senior Technical Advisor
Coastal Zone Asia-Pacifi c
Proyek Pesisir)
The objective of this fi rst regional coastal meeting was to share
information and to develop research and policy priorities for the
World Commission on Protected Areas (Bangkok, May 9-11, 2002),
regional scale issues. Approximately 250 coastal professionals from
Coastal Zone Asia-Pacifi c (Bangkok, May 12-16, 2002)
the region will attend. In support of Indonesia's new marine ministry,
National Coastal Conference (KONAS III) (Bali, May 20-24, 2002)
approximately 15 technical experts from DPK, including the Minister will
World Summit on Sustainable Development Prep Commission (Bali,
be supported by Proyek Pesisir to attend. The DKP and Proyek Pesisir
May 27-June 7, 2002)
team of 4 staff and 3 regional counterparts will work with a facilitator
to capture the information presented and its relevance to DKP and
The Nature Conservancy (TNC), the World Wildlife Fund (WWF), and
Indonesia's programmes. Five presentations from the Task team will
the U.S. Agency for International Development (through its Natural
be made at CZAP.
Resources Management Project and Proyek Pesisir) are collaborating
and joining their eff orts with their Indonesian partners to maximise
National Coastal Conference (KONAS III) and Pre-Conference
the benefi ts and impacts for marine conservation derived from the
Symposiums
conferences above. Indonesia has an excellent opportunity to make
The objective of the KONAS 4-day Conference is to share information
major advances in its strategic planning and capabilities in marine
on new developments in coastal zone management. All of the partners
conservation and integrated coastal management by using the
(CI, TNC, WWF, NRM/EPIQ Project and Proyek Pesisir) will be supporting
synergy and momentum of these four international conferences to
several of their counterparts to attend and present papers at KONAS
focus attention on and support for evolving Indonesia's policies on
III. In addition, just prior to the Conference, there will be two half-day
these issues.
symposiums for national and regional decision-makers attending the
Conference: one on Marine Protected Areas Science and Strategies,
World Commission on Protected Areas
and the second on the new Coastal Zone Law under development.
The objective of this meeting was to discuss the design and
The objective of this half-day MPA symposium will be: to present the
coordination of a regional network of marine protected areas (defi ned
latest information on the science, economics and policies of MPAs to
here as any offi
cially designated marine area in which resource use is
the audience of coastal decision-makers; to present a request from the
limited by specifi c regulations) for Southeast Asia. Experts from the
WCPA for Indonesia to participate in a regional MPA network; and to
region will share information on the economics, ecology, management,
present a Call to Action by the government lead agencies (Forestry,
design and enforcement of MPAs and develop recommendations for a
DKP) to expand and revise the national MPA strategy. Proyek Pesisir will
regional MPA network.
be providing the venue for both Symposiums, WWF and NRM will be
ANNEXES
79
moderating the meeting, TNC and Proyek Pesisir will be supporting
speakers as a joint co-hosting. An output from the MPA Symposium
will be a briefi ng document based on the presentations and discussions
developed by the Task team. An additional event at KONAS will be the
selection and announcement of Indonesia's new ICM logo, developed
by an inter-agency and NGO team with support from Proyek Pesisir.
World Summit on Sustainable Development- Prep Commission
This event was a preparatory meeting for the World Summit on
Sustainable Development (WSSD or Rio Plus 10) held in South Africa
in September 2002. Environmental Ministers from around the world
will be attending to discuss the text and policies to be fi nalised at Rio
Plus 10. For this event, TNC will be supporting two initiatives that will
be announced by DKP, a National Marine Whale Sanctuary proposal
and the String of Pearls MPA programme. The MPA briefi ng document
from the Pre-KONAS Symposium will be available for distribution, and
the ICM Logo and Campaign can be presented and launched as well.
WWF and ICRAN are presenting a coral reef exhibit in connection with
the WSSD. Minister Rokhmin Dahuri of the Ministry of Marine Aff airs and
Fisheries will be hosting an event at their exhibit.
80
GIWA REGIONAL ASSESSMENT 56 SULUCELEBES SULAWESI SEA
Annex IV
1992: Strategic Environment Plan for Palawan Act
List of conventions and specific
1995: Guidelines on Biological and Genetic Resources
laws that affect water use
1995: Philippine Mining Act
1995: The Water Crisis Act
1996: Preferential Treatment of Small Fisher folks
Key international conventions and treaties 1
1997:
Agriculture
and
Fisheries
Modernization
Act
The Philippines, Indonesia and Malaysia are signatory to several
1997: Philippine Environment Policy
international conventions and have enacted various national laws and
1998:
Philippine
Fisheries
Code
regulations that are relevant to water-related issues in the region. For
1999: Philippine Clean Air Act
example, the three nations have ratifi ed:
2001: Wildlife Resources Conservation and Protection Act
Conservation on Biological Diversity (CBD);
Convention on International Trade in Endangered Species (CITES);
Environmental legislation in Indonesia
Ramsar
Wetlands
Convention;
1932 & 1941: Colonial Nature Protection Ordinances
United Nations Framework Convention on Climate Change
1945:
Constitution
(UNFCCC);
1949:
Independence
World
Heritage
Convention.
1971: Establishment of the Directorate of Nature Conservation and
The Philippines and Malaysia have also ratifi ed the UN Convention on the
Wildlife
Law of the Sea. The three nations have sovereign rights to the 12 nautical
1980: Trawling Ban (Sardjono 1980)
mile limit and have also declared 200-mile Exclusive Economic Zones. The
1982: Basic Environmental Law
Philippines and Indonesia unilaterally use the `Archipelagic Doctrine' to
1985: Directorate General for Fisheries Law No. 9
defi ne their territorial waters. Several government sectors concerned with
1990: Conservation of Living Natural Resources and their Ecosystems
use of natural resources have proposed policies or legislation relevant
Act
to obligations under the various International Conventions. However, it
1992: (Act No. 24) Spatial Planning Act
is apparent that despite the ratifi cations, there has been little progress
1997: (Act No. 23) The Management of the Living Environment
to date in implementation and the resolution of related problems. This
1999: (Act No. 22) Decentralisation of authority from central
has been attributed to the lack of action by the various governments in
government to provincial and district governments
addressing their obligations under the Conventions. A recently developed
1999: Creation of the Ministry of Marine Aff airs and Fisheries
`Environmental Strategy for the Seas of East Asia' provides many pertinent
recommendations and solutions to these problems
Environmental legislation in Malaysia and Sabah
1954: (Act 134, revised 1974) Aboriginal Peoples Act
Key national legislation 2
1959: (Act 298, revised 1983) Protected Areas and Protected Places Act
Environmental legislation in the Philippines
1963: (Act 210, amended 1985 by Act 317) Fisheries Act
1964: National Water and Air Pollution Control Commission Act
1972: (Act 76, revised 1976 and 1991) Protection of Wildlife Act
1974: Revised Coast Guard Law
1974: (Act 127, amended 1985 by Act A636 and 1996 by Act A953)
1976:
Marine
Pollution
Decree
Environmental Quality Act
1976: National Pollution Control Commission
1976: (Act 171) Local Government Act
1978: The Water Code of the Philippines
1980: (Act 226 amended in 1983) National Parks Act
1979: Environmental Impact Statement System
1984: (Act 313) National Forestry Act
1980: Regulations for the Conservation of Marine Turtles
1981: The Coral Resources Development and Conservation Decree
Environmental legislation in Sabah
1984: Environmental Impact Statement System-Areas/Types of Projects
1962: (amended 1996) National Parks Ordinance replaced by the
1988: Small Scale Mining Law
National Parks Enactment (1977) and by Parks Enactment (1984)
1990:
Philippine
Environment
Code
1963: (amended 1979) Fauna Conservation Ordinance
1991:
Local
Government
Code
1968: (amended 1984) Forests Enactment (Classifi ed forests - Class
1992: National Integrated Protected Areas System
V mangrove forest)
1992: Toxic Substances and Hazardous and Nuclear Wastes Control Act
1997:
Wildlife
Conservation
Enactment
1 Cheung et al. 2002 2 Chua Thia-Eng, PEMSEA pers. comm.
ANNEXES
81
Annex V
local consumption, constituting a primary food resource for the region.
Sulu-Celebes Sea Large Marine The species fi shed include whale sharks, manta rays, billfi sh, prawns,
Ecosystem
yellowfi n tuna, grouper and clams. Most of the fi shing occurs in coastal
areas, while the off shore waters are largely unexploited. Coastal trawling
is aimed at prawn, a major export. Most of the landings in Indonesia and
(Excerpted from: http://www.edc.uri.edu/lme/text/sulu-celebes-sea.htm)
in the Philippines are from small-scale artisanal fi sheries, using a variety
of artisanal fi shing methods to catch mostly fi nfi sh. This is a primary food
The GEF/UNDP has funded a PDF-A for development of a Transboundary
resource for the region. Traditional fi shing techniques include spider
Diagnostic Analysis and preliminary framework of a Strategic Action
web fi shing. Many fi shing techniques are highly destructive: there is
Programme for the Sulu-Celebes Large Marine Ecosystem.
dynamite and cyanide fi shing on the reefs of the Philippines, with
fi shermen coming from nearby Taiwan and Hong Kong. The number
Brief description
of illegal fi shermen exploiting the resources of the reef is steadily
The Sulu-Celebes Sea Large Marine Ecosystem is a semi-enclosed sea
increasing. Few countries in the region have implemented fi sheries
bounded by northern Borneo (Malaysia), the southwest coast of the
management plans. The University Of British Columbia Fisheries Center
Philippines, and Sulawesi Island (northern coast of Indonesia). It has an
has detailed fi sh catch statistics for this LME.
area of about 900 000 km2, and is comprised of the Sulu Sea and the
Celebes Sea (sometimes referred to as the Sulawesi Sea). Much of the
Pollution and ecosystem health
LME has a depth greater than 3 000 m. The LME is oceanographically
Years of dynamite and cyanide fi shing have taken their toll on the
well defi ned, by the Palawan trough to the north, and by a promontory
coral reefs of the Philippines. The country's marine resources are
from Sulawesi Island to the south. There is a deeper area, and a chain
overstretched, as evidenced by the recent decline in tuna exports.
of islands known as the Sulu Archipelago, separating the two seas. The
The export and domestic markets continue to take no account of
Sulu Sea's surface currents come from the south in the summer, whereas
the ecological limits of the ecosystem. Damage to coral communities
the winter currents follow a counterclockwise gyre. The Celebes' strong
is caused by careless divers and by boat anchors. Illegal tours by
currents, its deep sea trenches, seamounts and active volcanic islands
collectors see the marine environment picked of turtle eggs, giant
result in a complex oceanography.
clams and seashells. The Tubbataha Reefs are not free from intrusion
and destruction. Both Tubbataha Reef and Turtle Island have fallen
Productivity
prey to the destructive practices of people selling turtle eggs, thereby
The Sulu-Celebes Seas LME is considered a Class III, low productivity
endangering the continuing existence of these turtles. Local extinction,
(<150 gC/m2/year), ecosystem based on SeaWiFS global primary
according to the World Wildlife Fund, is imminent. In 1995, the
productivity estimates. There are 1 800 species of fi sh, 400 species
Philippines Department of Environment and Natural Resources (DENR)
of algae, 5 species of sea turtles, 22 species of marine mammals
revealed that coral cover and fi sh density in the reef are "decreasing at
and over 450 types of coral. There are orcas, whales, dolphins, and
an alarming rate" despite the site's offi
cial status as a protected National
pelagic species such as tuna and marlin. In the Sulu Sea, Apo Reef and
Marine Park.
Tubbataha Reef have been shown to be at the centre of a system of
currents distributing fi sh and lobster larvae throughout the area. For
Socio-economics
detailed information on the importance of coral reefs in this LME, see
For more than 10 000 years, the indigenous population of this area has
data collected by the University of British Columbia Fisheries Center. The
harvested the sea's seemingly unlimited supply of marine life. But today
warm clear waters of the Celebes Sea, its active underwater volcanoes,
the LME is under threat. The Tubbataha Reef and other coastal areas of
its seamounts, trenches, corals and inter-island passages, its currents
the Sulu-Celebes Sea, while serving as important spawning grounds for
and upwellings, constitute an exceptionally rich marine life hot spot. It
the entire region, also provide a livelihood for the fi shing communities
is home to whales, sharks, dolphins, sea turtles, manta rays, marlin and
crowding its shores. Short-term gain in the guise of uncontrolled
other pelagic fi sh.
exploitation is wrecking a habitat. At the same time, it is asking a lot to
close these areas to fi shing when communities need to fi sh in order to
Fish and fisheries
survive. Population pressure in the local fi shing communities, poverty,
Coastal trawling for prawn supplies a major marine export industry,
and a lack of economic alternatives all contribute to the problem.
while a variety of artisanal fi shing methods are used to catch fi sh for
The resources of the LME are a source of hard currency for the debt-
82
GIWA REGIONAL ASSESSMENT 56 SULUCELEBES SULAWESI SEA
burdened government. Other economic activities are oil and gas
production from off shore areas and tourism. Tourism increases every
year and contributes both to the local and to the national economy.
Governance
There is a pressing need for improved management and cooperation
between countries in conserving and protecting the Sulu-Celebes
Sea Large Marine Ecosystem. Enforcement, education and research
are necessary measures, as are eff orts to curb illegal fi shing. In 1988,
Tubbataha Reef was declared as the fi rst National Marine Park in the
Philippines. In 1993, the United Nations Educational Scientifi c and
Cultural Organization (UNESCO) declared the reef a World Heritage Site.
Turtle Island has also been declared a protected area. These declarations
indicate the government's commitment to conserve the areas and have
increased international awareness and support for their protection.
When the government ran out of funds to carry out an action plan,
international agencies such as the World Wildlife Fund (WWF) and GEF
initiated some projects. It is clear that engaging the public is necessary,
as well as developing livelihood alternatives for those communities
that are aff ected. WWF's plan is to raise the communities' awareness
level of the existing laws on fi sheries and environmental protection.
Other international groups that have committed to projects in the area
are ASEAN and Conservation International. In 1996 an agreement was
signed by Malaysia and the Philippines to protect two endangered turtle
species, the Hawksbill and the Green turtle. Although the Malaysian-
Philippine agreement is a vital fi rst step, all three governments in the
region need to enforce sustainable ways of earning a living from the sea.
Several species of whales are endangered. The GEF/UNDP has funded
a PDF-A for development of a Transboundary Diagnostic Analysis and
preliminary framework of a Strategic Action Programme for the Sulu-
Celebes Large Marine Ecosystem.
ANNEXES
83
Annex VI
Criteria for scoring environmental impacts
Issue 23: Changes in ocean surface temperature
This refers to the impact on populations, species, and communities from changes in Sea Surface Temperature as a result of global change.
Score 0 = No known impact
No measurable or assessed effects of SST increase.
Slight impact is determined when one or more of the following criteria are met or exceeded:
Score 1 = Slight
Measured assessed effects of SST are causing a behavioral change in some species without affecting the viability of the population
Moderate impact is determined when one or more of the following criteria are met or exceeded:
Score 2 = Moderate
Community structure is measurably altered as a consequence of changes in SST.
Populations are declining.
Severe impact is determined when one or more of the following criteria are met or exceeded:
Score 3 = Severe
Measured/assessed effects of changed SST are leading to massive loss of communities or a change in biological diversity.
84
GIWA REGIONAL ASSESSMENT 56 SULUCELEBES SULAWESI SEA
Annex VII
species, associated or dependent species and non-target species and
Marine protected areas and
their environment (FAO 1995).
benefits to the fishery
In principle, the objectives, policies and activities of the (Indonesian)
Ministry of Marine Aff airs and Fisheries are compatible with the
(Excerpted from a compilation provided by GIWA Task team members
development of a network of Marine Protected Areas.
Dr. Jos Pet and Dr. Peter J. Mous .The Nature Conservancy, Indonesia
Coastal and Marine Program)
Objectives are:
Optimisation of the catch to increase welfare of the Indonesian
Our relative inexperience in using marine reserves to manage living
people;
resources should not serve as an argument against their use. Rather,
Conservation
of
fi
shery
resources.
it argues that implementation of reserves should be incremental and
adaptive, through the design of areas that will not only conserve marine
Policies are:
resources, but also will help us learn how to manage marine species
Control of fi shing activities,
more eff ectively. The dual realities that the Earth's resources are limited
Development of aquaculture,
and that demands made on marine resources are increasing, will
Improvement of quality.
require some compromise among users to secure greater benefi ts for
the community as a whole. Properly designed and managed marine
Control of fi shing activities is to take place through re-registration of
reserves and protected areas off er the potential for minimising short-
fi shing licenses and development of surveillance and law-enforcement
term sacrifi ce by current users of the sea and maximising the long-
capabilities (Undated leafl et from Ministry of Marine Aff airs and
term health and productivity of the marine environment. Based on
Fisheries).
evidence from existing marine area closures in both temperate and
tropical regions, marine reserves and protected areas will be eff ective
A recent report to the Indonesian Ministry of Marine Aff airs and Fisheries
tools for addressing conservation needs as part of integrated coastal
says the following on Marine Protected Areas: It is defi nitively in the
and marine area management (Committee on the Evaluation, Design,
country's economic and environmental interests to set aside at least
and Monitoring of Marine Reserves and Protected Areas in the United
10% of its 81 000 km coastline and 5.8 million km2 marine territory
States, National Research Council 2001).
as marine sanctuary or marine protected area and marine park to
conserve and protect its remaining rich marine bio-diversity. There are
Even at a global level, it seems that fi shery statistics should be
clear benefi ts to be gained from investment in identifying, declaring
interpreted with extreme care. It is shown that misreporting by countries
and establishing more marine protected areas in Indonesian waters, not
with large fi sheries, combined with the large and widely fl uctuating
only as a tool to manage and conserve the fi sheries and its rich genetic
catch of species such as the Peruvian Anchoveta, can cause globally
resources but also equally for aquaculture, in particular mariculture or
spurious trends. Such trends infl uence unwise investment decisions by
sea farming as a source of seed and broodstock (Pacifi c Consultants
fi rms in the fi shing sector and by banks, and prevent the eff ective global
International 2001).
management of international fi sheries (Watson & Pauly 2001).
Marine reserves and protected areas have received inadequate
Given the uncertainty in fi shery statistics and the status of fi sh
attention from fi sheries managers in the region, at least they do not
stocks, MPAs may provide a last line of defence against overfi shing.
feature clearly in formal arrangements (Msiska et al. 2001).
It is important to consider the FAO code of conduct for responsible
fi sheries in this light. States and sub-regional and regional fi sheries
According to Roberts and Hawkins (2000) Fully protected reserves: (i)
management organisations should apply a precautionary approach
enhance the production of off spring which can restock fi shing grounds;
widely to conservation, management and exploitation of living
(ii) allow spill-over of adults and juveniles into fi shing grounds; (iii)
aquatic resources in order to protect them and preserve the aquatic
provide a refuge for vulnerable species; (iv) reserves prevent habitat
environment, taking account of the best scientifi c evidence available.
damage; (v) promote development of natural biological communities
The absence of adequate scientifi c information should not be used as
which are diff erent from communities in fi shing grounds; and (vi)
a reason for postponing or failing to take measures to conserve target
facilitate recovery from catastrophic human and natural disturbances.
ANNEXES
85
There is compelling, irrefutable evidence that protecting areas from
References
fi shing leads to rapid increases in abundance, average body size, and
AAAS (2001). Press release. The Annual American Association for the
biomass of exploited species. It also leads to increased diversity of
Advancement of Science meeting, February 2001.
species and recovery of habitats from fi shing disturbance. Reserves are
Committee on the Evaluation, Design, and Monitoring of Marine
often portrayed as working only on coral reefs. In fact, they have been
Reserves and Protected Areas in the United States, National Research
successful in a wide range of habitats in environments ranging from
Council (2001). Marine Protected Areas. Tools for sustaining ocean
tropical to cool temperate zones. Reserves are a valuable tool globally
ecosystems. National Academy Press, Washington, D.C.
(Roberts & Hawkins 2000).
Conover, D.O and Munch, S.B. (2002). Sustaining Fisheries Yields Over
Evolutionary Time Scales. Science 94-96.
There is now compelling scientifi c evidence that marine reserves
Dight, I., Kenchington, R. and Baldwin, J. (eds.) (1999). Proceedings of the
conserve both biodiversity and fi sheries, and could help to replenish
International Tropical Marine Ecosystems Management Symposium.
the seas, says a scientifi c consensus statement signed by 150 of the
November 1998. Published by the Great Barrier Reef Marine Park
world's leading marine scientists (AAAS 2001).
Authority, Townsville, Australia.
FAO (1995). Code of Conduct for Responsible Fisheries. Article 6,
"It's asking a lot to close areas to fi shing when communities need to
General Principles of the FAO code of conduct. Adopted by the
fi sh to survive, but it may be the only hope we have to replenish reefs
Twenty-eighth Session of the FAO Conference on 31 October
that have been overfi shed for so many years." Commercial fi sherman,
1995. Retrived August 2003 from: http://www.fao.org/fi /agreem/
Philippines (WWF N.d).
codecond/fi conde.asp#6
Msiska, O.V., Jiddawi, N. and Sumaila, U.R. (2001). The potential role of
Major recommendation (Dight et al.1999): marine protected areas
marine reserves in selected countries in East and Southern Africa.
(MPAs) have the potential to play a much bigger role in the successful
p 121-130 In: Sumaila, U.R. and Alder, J. (eds.) Economics of Marine
management and sustainable use of fi sheries resources on coral reefs
Protected Areas. Papers, Discussions and Issues: A Conference held
and associated ecosystems. In particular, participatory development of
at the UBC Fisheries Centre July 2000. Published by The Fisheries
no-take zones and protection of essential fi sheries habitat in the context
Centre, University of British Columbia, Vancouver, Canada.
of an ecosystem management approach should be encouraged, where
Pacifi c Consultants International (2001). Study on Fisheries Development
appropriate, at both the community level and for larger areas.
Policy Formulation. Volume I. White Paper. Report by Pacifi c
Consultants International under Jakarta Fishing Port/Market
The designation of no-take marine reserves may be necessary for
Development Project (Phase IV: JBIC Loan No. IP-403).
sustaining fi shery yields over the long-term, due to their ability to
Roberts, C.M. and Hawkins, J.P. (2000). Fully-protected marine reserves:
preserve genetic variation in the expression of fi sh size and growth
A guide. WWF in Washington DC, US, University of York, York, UK.
rates (Conover & Munch 2002). This is because in exploited situations,
The National Academies (1998). Fishing should be reduced substantially
the fi shery selectively removes larger individuals, giving smaller, less
to protect marine ecosystems. Retrieved July 2002 from: http://
fertile individuals a selective advantage. Marine protected areas are
www4.nas.edu/news.nsf/isbn/0309055261?OpenDocument
most eff ective when they are established where vulnerable species
Watson, R. and Pauly, D. (2001). Systematic distortions in world fi sheries
usually live, breed, or feed. Creating these areas has quickly restored
catch trends. Nature 414:536-538.
populations of fi sh, snails, and crabs, reduced pollution, and provided
WWF (N.d). Marine Reserves: Like Money in the Bank. WWF Endangered
habitats for other marine organisms in some regions, including the
Seas Campaign, Washington DC (no date).
Florida Keys, the Philippine Islands, and the coast of Japan. Less than a
quarter of 1% of coastal sea areas are designated as marine protected
areas. To ensure the greatest benefi t to depleted fi sh stocks, many
more protected areas should be set aside that are or once were active,
productive fi shing areas. Moreover, fi shermen should be involved in
planning and designating protected areas (The National Academies
1998).
86
GIWA REGIONAL ASSESSMENT 56 SULUCELEBES SULAWESI SEA
Annex VIII
is ecologically sustainable, and not damaging the reefs of Southeast
Coral reef initiatives in the
Asia and the Pacifi c.
Philippines
The Government of the Philippines, one of the founding countries of
ICRI, hosted the fi rst ICRI international workshop in Dumaguete City,
(Source: The President of the Philippines at the Second International
Philippines in 1995, which outlined the pioneering global strategy for
Tropical Marine Ecosystem Management Symposium 2003)
coral reefs through the ICRI Call to Action and Framework for Action.
In March 2003, the Philippines hosted the 2nd International Tropical
The Government of the Philippines, with assistance from the
Marine Ecosystem Management Symposium (ITMEMS2) in Manila,
Government of Sweden and other sources, has responded to the
another milestone conference to identify strategies on coral reef and
plight of coral reefs outlined since the United Nations Conference on
associated ecosystems management when strong resolve is needed
Environment and Development in 1992, and reiterated in Johannesburg
to respond to the WSSD Plan of Implementation. Then and now, the
at the World Summit on Sustainable Development in 2002. The
Philippines continues to be instrumental in bringing forth strategies and
Philippines and Sweden have combined to guide the Secretariat of the
actions for implementation at global and national levels.
International Coral Reef Initiative (ICRI) in 2001 and 2002 with the goal
of bringing developing and developed countries together to conserve
A signifi cant Philippines national strategy is devolving management
coral reefs.
responsibility to the municipality and `barangay' level under the Local
Government Code passed by Congress in 1991. When communities are
Coral reefs are being damaged by both natural and human pressures
given the responsibility of managing their own resources with a little
and unless we act now, it is predicted that over half of the world's coral
help from government and scientists, the damage to the reefs can be
reefs could be destroyed within a generation. Coral reefs can recover
reversed. In addition, the Philippine Government has been proud to
from natural threats, but recovery is slow from the direct and indirect
declare the large Tubbataha National Marine Park as a World Heritage
damage that people do to reefs. Often that damage is inadvertent as
Site. It is jointly managed by the Palawan Council for Sustainable
people seek food or cultural items from the reefs, but unfortunately
Development and the WWF Philippines. Even more rewarding is the
some of the damage is deliberate through constructing airports, ports
proof of the genuine concern that the Filipino people have to conserve
and dredging channels. Damage is caused indirectly through poor land
and manage these reefs. Unfortunately, the same beauty is not seen in
use practices that result in sediments and excess nutrients pouring over
other Philippine reef areas that have the same potential. The Philippines
the reefs and through the release of sewage and industrial wastes that
Government is increasing sustainable management assistance to
cause eutrophication. Even our excessive use of plastic bags ends up
people who have a large dependence on these reef resources.
damaging coral reefs. The responses to these alarm calls have been
the establishment of ICRI, the Global Coral Reef Monitoring Network,
CORDIO (Coral Degradation in the Indian Ocean), Reef Check, ReefBase
and the World Resources Institute Reefs at Risk project, to mention just
some.
All people in the world are `stakeholders' in coral reefs as we have
inherited their wealth of biodiversity and natural beauty, therefore we
all share the responsibility for conserving them. We now understand
what damages coral reefs and the critical measures that users, local and
national governments, international agencies and NGOs have to do in
partnership to conserve reefs. There are many global and local initiatives
being implemented to arrest and conserve coral reefs and establish
more protected areas. One example is Apo Island, in the Philippines
where the local university and the community have worked together
to conserve their resources for the benefi t of all. Another initiative is to
ensure that the trade in live fi sh for restaurants and the aquarium trade
ANNEXES
87
Annex IX
Codifi cation of the roles and responsibilities of the Park Management
Advisory Board with regard to conservation of Bunaken National Park
Models for development of a
is an essential Best Practice to eff ective decentralised co-management.
fully integrated PA network for The document, Basic Regulations for the Bunaken National Park
Management Advisory Board clarifi es this eff ort. While it guides the
Sulu-Celebes (Sulawesi) Sea
day-to-day functioning of the Park Management Advisory Board, it
is also of value to others exploring decentralised co-management of
Marine Protected Area case study: Bunaken
protected areas in Indonesia.
National Park, North Sulawesi, Indonesia
The continuing development of Bunaken NP provides important lessons
As with most Protected Areas in the Sulu-Celebes (Sulawesi) Sea, Bunaken
for implementation of the recommended policy option in several key
NP is a multiple-use MPA, with diff erent zones allowing and regulating
areas. For example, improved management capacity is crucial for overall
diff erent levels of exploitation and conservation. Initial diffi
culties in
success. Management of Bunaken NP has recently been reviewed and
management arose from the initially complex zoning scheme, with a
provides several useful case-studies.
major revision recently undertaken. The rezoning provides useful lessons
for policy implementation in the region.
Improving the capacity of the management advisory board
(from NRM Headline News 2002)
Co-management
In late December 2000, the North Sulawesi government passed a
(from NRM Headline News 2001)
Governor's Decree (SK Gubernor No 233/200) mandating the formation of
One of the most important initiatives has been the establishment of the
the Bunaken National Park Management Advisory Board (BNPMAB). The
Dewan Pengelolaan Taman Nasional Bunaken/DPTNB (Bunaken National
main purposes of the board are: to manage the new entrance-fee system
Park Management Board), whose primary functions are to coordinate
of the Bunaken National Park; to assist the Balai Taman Nasional Bunaken
the policies and activities of all stakeholders with jurisdiction within
in developing, coordinating and funding conservation programmes; to
the park and to plan and fi nance several conservation programmes at
facilitate and encourage community awareness and participation in the
BNP, such as, a patrol system and a trash management system. In order
park management activities; and to instil sense of ownership by the local
to achieve these functions most eff ectively, the DPTNB is comprised of
communities. The board was created with 15 equal seats, including seven
representatives from all major stakeholders in the park, including the
government representatives and eight non-government representatives.
local community, tourism sector, Balai Taman Nasional Bunaken (BTNB),
This is an innovative system for managing and coordinating activities in
environmental NGOs, universities, North Sulawesi province, Manado city
a national park in Indonesia and the region. If successful, it will provide
and Minahasa regency government institutions. The DPTNB is the fi rst
a best-practices example for coordinated multi-stakeholder marine park
of its kind in Indonesia, and is considered a two-year pilot project by
management in Indonesia and South East Asia. The board was granted
the Ministry of Forestry.
a two-year trial period.
Besides the DPTNB, a number of organisations are now helping with
Long standing management challenges for Bunaken National Park
management issues in BNP. The Forum Masyarakat Peduli Taman
include: cultural confl icts and mistrust amongst local stakeholders and
Nasional Bunaken (FMPTNB) was established in October 2000 as a
managers; damaging fi shing and land use practices; rapid and poorly
means of connecting and representing the management aspirations
planned coastal development; unethical business and political practices;
of the approximately 30 000 residents of the park. With three districts
corrupt law enforcement systems; and unorganised management
(north, south and surrounding islands) and representatives in all
strategies. Since the boards inception, management processes have
21 villages within the park, the FMPTNB is slowly becoming an eff ective
become more transparent and participatory, and management outputs
voice for the community in the management of TNB. Additionally,
have increased dramatically. Despite the initial successes of the board
several environmental NGOs, including Yayasan Kelola, Forum Petuan
and the new entrance-fee system, many management challenges
Ketoupan, Yayasan Kendage URuata, WWF, and Yayasan Suara Nurani
remain. The current evaluation of the board will contribute signifi cantly
are working within the park on a range of environmental issues.
to its capacity and potential for improving management processes,
Within the tourism sector, the North Sulawesi Watersports Association
coordinating management and conservation activities in the park and
(NSWA) and Himpunan Pengelola Wisata Lokal Bunaken represent dive
raising stakeholder awareness and participation in management.
operators and cottage owners who are concerned about management
88
GIWA REGIONAL ASSESSMENT 56 SULUCELEBES SULAWESI SEA
of BNP. The increasing cooperation within and between these groups
multi-stakeholder co-management of a national marine park which
is supporting the concept of a Bunaken National Park big family that
will thereby serve as a marine protected area (MPA) center of excellence
supports sustainable natural resources management and utilisation.
for Indonesia and SE Asia. The key to achieving this goal has been a
massive socialisation eff ort to draw the various stakeholders from the
Another exciting development for the management of Bunaken has
park (including 30 000 villagers, an active marine tourism industry, local
been the introduction of a revolutionary new entrance fee system
conservation NGO's, academia, and three tiers of government agencies)
- the fi rst in Indonesia. Unlike other national park entrance fees in
into a single "community" with a strong sense of awareness and
Indonesia (where all money collected goes into the National Treasury),
ownership of the valuable but threatened marine resources in the park.
80% of the Bunaken entrance fees are managed by the DPTNB to fund
conservation programmes in the park. Since April 2001, over 8 000 local
Components of the co-management initiative
and international tourists have paid the entrance fee, amounting to over
Participatory zonation revision of BNP. NRM is assisting the BNP
360 million Rp in income for conservation programmes. The DPTNB has
Offi
ce (BTNB) to work with the two primary park user groups
also received grants from WWF-Indonesia and USAID to help fi nance its
(local villagers and the marine tourism sector) to revise the park's
conservation programmes. An example of an important programme
zonation system, realising that a well-designed, easy to understand
currently being managed by the DPTNB is a joint patrol system. The patrol
and thoroughly socialised zonation system is the foundation for
system is currently based on Bunaken Island and includes jagawana BTNB
eff ective management of the park.
(rangers), SATPOLAIRUD, and community members who can be on a 24-
Improved villager involvement in BNP management decisions
hour patrol per day. This patrol system successfully apprehended more
through institutional development of the BNP Concerned Citizen's
than seven groups of cyanide and bomb fi shers who were operating
Forum (FMPTNB). The FMPTNB is now active in all 22 villages in
illegally in the park. The patrol team also regularly conducts sweeping
BNP and serves to represent the aspirations of ~30 000 villagers in
operations to ensure that all visitors have paid their entrance fees. Until
management decisions, as well as serving to socialise management
now, much of focus of these programmes has been on Bunaken and
policy to its constituents.
the surrounding islands of Manado Tua, Mantehaga, Siladen and Nain.
Fostering private sector involvement in BNP management. NRM
However, the DPTNB realises that it is extremely important to also
provides technical assistance to the North Sulawesi Watersports
include the northern and southern mainland sections of the park,
Association (NSWA) and actively fosters the involvement of
including Tiwohu, Tongkeina, Meras, Molas, Teling, Kumu, Poopoh,
other private sector groups (cottage owners, traditional fi shers'
Pinasingkulan, RapRap, Sondaken, Popareng dan Wowontulap.
association, and charter boat operators) in BNP management.
Facilitation of multi-stakeholder co-management of BNP via
Co-management initiative
institutional development of the BNP Management Advisory Board
(from Erdmann et al. 2003)
(DPTNB). NRM provides development support to the executive
Since 1998, USAID's Natural Resources Management Program (NRM) has
secretariat of the DPTNB, which consists of representatives
been working actively to implement a co-management initiative in the
from national, provincial and local government agencies,
Bunaken National Park. Prior to this initiative, the management of BNP was
village stakeholders, the private tourism sector, academia, and
centralistic and legally under the authority of the Ministry of Forestry's
environmental NGO's. The "crown jewel" of the Bunaken co-
Bunaken National Park Offi
ce (BTNB). Local park users (particularly the
management initiative, the DPTNB represents a drastic departure
fi sher folk and the dive tourism industry) were not eff ectively involved
from the traditional Indonesian model of top-down management of
in park management, and local government agencies were highly
MPAs, and strives to make decentralised, participatory, transparent
resentful of the management authority vested in the BTNB. Funding for
and accountable MPA management a reality.
conservation and management activities in the park was minimal, the
Development of a portfolio of sustainable conservation fi nancing
enforcement system ineff ectual, and the park zonation system was largely
mechanisms for BNP. A ground-breaking decentralised park entrance
misunderstood and ignored by the local populace. In most respects,
fee system has now placed the DPTNB on the road to fi nancial self-
Bunaken National Park qualifi ed as a "paper park".
reliance. Other components in the developing fi nancing portfolio
include an international volunteers system to lower management
Objective of initiative
costs, diversifi ed government agency support, in-kind support from
The goal of the Bunaken National Park co-management initiative is to
the local dive tourism sector, national and international grant support,
develop an eff ective and sustainably-fi nanced Indonesian model of
visitor centre merchandising and a possible endowment fund.
ANNEXES
89
Development of an eff ective 24-hour patrol system for BNP. An
Selected lessons learned
experimental joint patrol system involving park rangers, water
Over the past fi ve years, a number of important lessons have been
police offi
cers and local villagers has proven highly eff ective in
learned in attempts to strengthen decentralised co-management of
decreasing destructive fi shing practices in the park.
Bunaken National Park. While it is beyond the scope of this executive
Institutionalisation of a scientifi c monitoring programme to monitor
summary to discuss these in detail, the most important of these lessons
eff ects of management activities on park resources. In conjunction
learned in the hopes that they may be of interest to other tropical MPA
with WWF Wallacea, NRM is supporting park stakeholders in
managers currently utilising or considering a co-management approach
monitoring coral condition (using manta tows and line intercept
are listed below:
transects) and reef fi sh stocks (visual census of select reef species
It is necessary to balance ecological values with socio-economic
and monitoring of grouper and Napoleon wrasse spawning
values to generate essential stakeholder political support for
aggregation sites).
conservation of protected areas in regions with population pressures
and/or priorities on economic growth and development.
Select accomplishments to date
Building informed participation is a long-term process, requiring
Participatory zonation revision completed for Bunaken, Manado Tua,
extensive capacity building and facilitation. Villagers, government
Mantehage and Siladen Islands and ongoing in 14 remaining villages.
and non-government stakeholders with long-term involvement in
Institutionalisation of the 15 seat multi-stakeholder BNP
conservation management provide more innovative solutions and
Management Board (DPTNB) and the 22 village BNP Concerned
productive support for conservation management.
Citizen's Forum (FMPTNB) and widespread socialisation of these
Park managers and the rangers tasked with fi eld management of
two institutions.
the park commonly lack the community facilitation skills critical
Strong participation of private sector in management via the NSWA,
to ensuring broad stakeholder support and understanding of park
which has instituted a programme of "three E's" (employment,
management objectives. Training in facilitation skills for these park
education and enforcement) within the park
management personnel is an essential capacity-building measure
Development of a decentralised park entrance fee system
before co-management can be eff ectively implemented.
whereby 80% of the revenues are earmarked for BNP management
Co-management starts with the development of constituency-
programmes. The system succeeded in raising 42 000 USD in its fi rst
based partnerships, and then evolves to true co-management when
year of operation (2001) and 109 000 USD in 2002, and is eventually
the constituency-based partnerships then start working with each
targeting up to 250 000 USD per year.
other. The evolution to co-management results in collaboration
Implementation of a joint patrol system that includes villagers
among often competing constituencies. Strong constituency
and that has virtually eradicated blast and cyanide fi shing from
partnerships provide a solid foundation for co-management.
the park and greatly limited illegal coral mining and mangrove
Community conservation campaigns through schools, mosques
cutting.
and churches can build eff ective local support for and pride in
Multimedia park socialisation campaign to instil a sense of
conservation initiatives. People will support conservation of their
BNP community using posters, zonation calendars, town hall
environment if they take pride in it. Of course, pride alone will not
meetings, community information billboards, a 30 base station
achieve conservation. Also important are economic incentives and
VHF community radio network, local television shows and local,
enforcement of rules and regulations.
national and international newspaper and magazine articles.
Decentralisation
of
conservation
management
works
when
roles
Sharing of lessons learned from Bunaken with MPA managers from
and responsibilities are clear, and when there is a shared vision of
Bali Barat NP, Komodo NP, Wakatobi NP, Cenderawasih NP, Berau
goals and objectives. Decentralisation does not work when there is
Islands and Tomini Bay in Indonesia and Hon Mun Marine Reserve
competition over management authority or signifi cant divergence
in Vietnam.
in goals and objectives. Decentralisation also stimulates stronger
Recorded an 11% increase in live coral cover in a one and a half
grass-roots democracy and principles of good governance.
year period on the reefs which have already completed zonation
Co-management requires active involvement of all relevant
revision and are protected by patrol system
stakeholders. This is site-specifi c in nature. In Bunaken it includes dive
Selection as the Asian MPA ecotourism demonstration site for the
operators, communities, diff erent levels of government, universities
International Coral Reef Action Network (ICRAN).
and NGOs. Co-management must be inclusive, and must provide for
reasonably equal voices for relevant stakeholder groups.
90
GIWA REGIONAL ASSESSMENT 56 SULUCELEBES SULAWESI SEA
The composition of multi-stakeholder co-management boards
Funding for conservation management needs to be diverse.
is absolutely critical to their success. The optimal ratio of
Reliance on a single source like user fees is dangerous. This is
governmental to non-governmental representatives and those
demonstrated by the sudden drop-off in revenues from the
advocating diff erent functions of the protected area (economic
Bunaken entrance fee system after September 11 and the Bali
development, conservation, sustainable resource use) will vary
Bombing. Long-term sustainability requires signifi cant fi nancial
from site to site, but will have profound consequences for the
diversifi cation.
eff ectiveness of these multi-stakeholder boards. There must be a
Monitoring and evaluation are key to ensuring on-going success
balance between the competing interests represented, and this
of conservation management interventions. This is important for
will not always entail equal numerical representation; in many cases
convincing stakeholders that interventions are working and/or
the stakeholder group(s) that are the most hesitant to advocate
providing guidance on how to adapt interventions if they are
strong positions may require a larger allocation of seats on a multi-
not working well. This includes the use of both ecological as
stakeholder board to achieve truly equal representation.
well as socio-economic indicators in an integrated management
Community stakeholders support patrol and enforcement
eff ectiveness monitoring system
programmes, as they are directly linked to increased livelihoods.
Multiple-use MPA zonation plans are valuable management tools
Many illegal activities within protected areas come from outsiders.
for mitigating confl ict among stakeholders and balancing eff ective
Communities with a stake in conservation management or
conservation with sustainable development in developing country
sustainable utilisation of park resources have a strong and rational
MPAs with large population pressures. These plans are most
interest in seeing rules and regulations enforced so natural
eff ective if based upon a combination of scientifi c/ecological
resources are sustained.
considerations and input from a range of primary user groups
"Alternative livelihood programmes" aimed at stakeholders
who have received facilitation in understanding and accepting
currently involved in destructive activities in the coastal zone are
compromise.
ineff ective and largely rejected by local communities. Community
Zonation schemes should use a minimal number of zone types, with
conservation/improvement programmes should focus on
names that clearly indicate their purpose, explicit rules for allowed
rewarding those that have chosen sustainable livelihoods, while
and disallowed activities, and clearly demarcated borders that utilise
those that persevere with destructive activities should be dealt with
natural or otherwise well-known landmarks whenever possible.
by a strong enforcement system.
The use of focal interest group meetings instead of relying only
Local self-fi nancing mechanisms are key to providing local
on large village meetings is essential for ensuring broad-based
stakeholders with the fuel to manage local conservation
community participation and equitable decision making. This
interventions. Decentralised co-management requires the capacity
ensures the involvement of many of the more marginalised or
to generate and then manage fi nances locally.
traditionally quiet community members.
Development-oriented stakeholders, particularly from government,
Representation of larger groups (villages, the private sector, etc.)
support conservation when it can be linked to regional economic
in marine resource management decision-making is a new and
development. Conservation of protected areas is better described
poorly-understood concept in Indonesia. The individuals chosen
within the context or regional economic development than altruism.
to represent larger groups often neglect their responsibility to
Involvement of the private sector in co-management of MPAs
communicate actively with their constituents, while constituent
can be highly benefi cial. Once potential business competitors
groups often resent those chosen to represent them. This
focus upon the benefi ts of cooperating to protect the resources
democratic principle needs continuous facilitation.
in the MPA upon which their income depends, they become one
Decentralised co-management supports the principles of good
of the strongest proponents of good management and bring
governance. Although it must be carefully managed (and well-
considerable fi nancial and human resources to the table.
designed at the outset in order to prevent dominance by any
Tourists are willing to pay reasonably high entrance fees as
one stakeholder group), one of the greatest strengths of the co-
long as they see their money is resulting in visible conservation
management approach is in utilising the diverse interests and
management. Willingness-to-pay for eff ective conservation
motivations of various stakeholder groups to prevent corruption,
management is high, but can only be sustained when tourists see
collusion or nepotism.
results from their payments.
Establishment of a sense of pride and ownership of local
marine resources is a key step in generating strong support for
ANNEXES
91
conservation measures. Even in the absence of traditional or
commercially valuable fi sh species in the two years since the zonation
legal marine tenure systems (where communities directly own
plan was agreed upon (Erdmann, unpub. data). This success has
resources), ownership of the management of those resources
encouraged Indonesia's Department of Nature Conservation to use the
engenders strong conservation support.
Bunaken experience as a basis for their new national technical guidance
Human resource development and institutional strengthening is
paper on MPA zonation (PHKA 2002) (see Usher & Merrill 2000).
best achieved through long-term, learning-by-doing mentoring
processes rather than short-term, highly specifi c technical training
Lessons learned from the rezoning
programmes. Technical training can meet specifi c needs, but
(from Ermann & Merrill 2003).
broad-based capacity building for conservation is best achieved
A number of useful lessons learned that may have wider applicability
through long-term, medium-input mentoring.
(especially to developing country tropical MPAs) can be drawn from the
Bunaken zonation experience. These include:
More information on the Bunaken National Park co-management
1. Multiple-use MPA zonation plans are an incredibly valuable
initiative can be found at www.bunaken.or.id and www.bunaken.info
management tool for mitigating confl ict among stakeholders
(e.g., tourism operators and local fi shers) and balancing eff ective
Revised zoning
conservation with sustainable development in developing country
(from Erdmann & Merrill 2003)
MPAs with large population pressures. These plans are most eff ective
Clearly a balance between inputs from science and stakeholder
if based upon a combination of scientifi c/ecological considerations
participation is necessary in producing a functional and enforceable
and input from a range of primary user groups who have received
multiple-use zonation plan. One additional element of the Bunaken
facilitation in understanding and accepting compromise.
zonation revision process that is strongly in need of improvement is
2. Zonation schemes should use a minimal number of zone types, with
the involvement of local park managers and/or rangers in the zonation
names that clearly indicate their purpose, explicit rules for allowed
facilitation process. Unfortunately, the participatory zonation process
and disallowed activities, and clearly demarcated borders that utilise
relies strongly upon excellent facilitation skills that are generally lacking
natural or otherwise well-known landmarks whenever possible.
in park management staff ; training opportunities to acquire these skills
3. The process of creating a multiple use zonation plan (including wide
are also noticeably absent. It is highly likely that this situation is endemic
stakeholder participation, facilitated compromise between groups,
to developing country MPAs, and conservation and development aid
and widespread socialisation of the eventual zonation plan) is as
organisations interested in promoting eff ective MPAs should pay
important as the actual details of the eventual zonation system in
particular notice to this widespread need for better community
terms of building support for and compliance with the system.
facilitation skills in park managers.
However, an adequately participatory process is often long (measured
in years) and requires signifi cant fi nancial commitments and excellent
The actual location of individual zones was based upon a combination of
facilitation skills on behalf of the implementing agency(s).
scientifi c and stakeholder input and a commitment to include at least 20%
4. While stakeholder participation is essential, there is no one single
of each island's reef area in "no-take" zones where fi shing is not allowed (in
best participatory approach to involving stakeholder groups in
accordance with the US Coral Reef Initiative and a number of other MPA
zonation plan development. The best participatory approach is one
design guidance papers). Both the strict conservation and tourism use
that has been carefully crafted to achieve maximum stakeholder
zones are "no-take", and were sited to include known reef fi sh spawning
involvement and acceptance based upon knowledge of the social
aggregation sites, unique reef features and long-established dive sites.
dynamics of the individual user group targeted (which is often best
Village fi shers were persuaded to agree to these 20% closures using careful
gained from direct feedback from members of that group).
explanations of the fi sheries enhancing benefi ts of no-take zones.
5. Widespread socialisation of zonation schemes using a variety of
media is absolutely essential to their success, but is not suffi
cient
In 2002, these revised zonation plans have been extremely successful in
to ensure compliance. A strong enforcement system is critical to an
terms of compliance and the overarching objective of allowing multiple
eff ective multiple-use zonation system.
uses of this highly valuable national asset while preventing stakeholder
6. A system which utilises relatively large contiguous zones rather
confl ict. The resource base has also shown marked improvements; on
than a series of many small zones is both easier to enforce and, in
Bunaken Island alone, the reefs have shown an incredible 11.3% increase
the case of no-take zones, likely provides greater conservation and
in live coral cover and signifi cant increases in size and abundance of
fi shery benefi ts.
92
GIWA REGIONAL ASSESSMENT 56 SULUCELEBES SULAWESI SEA
7. The zonation process is best viewed as an iterative process that
Benefi ts include:
needs evaluation and revision on a regular basis.
Villagers are on the scene 24 hours/day, and have a vested
interest in protecting "their" reefs for the future use of their
Surveillance and enforcement
children and grandchildren;
(from Erdmann & Toengkagie 2003)
Village patrol members have intimate knowledge of local
Additional diffi
culties associated with surveillance and enforcement
reefs and the people exploiting them (both sustainably and in
were addressed in early 2001, when the Bunaken National Park
a destructive manner), allowing them to quickly and eff ectively
Management Advisory Board (DPTNB) initiated a joint patrol system
target those activities/user groups that cause most damage to
that placed community members side-by-side with professional
the reefs, and allowing them to resolve resource use confl icts
enforcement offi
cers, to increase eff ectiveness of the patrol system.
in a more consensual manner than rangers or police might;
Alternative employment for fi shers who would otherwise
Forty fi ve villagers, 16 park rangers and 5 water police offi
cers constitute
depend on reef resources;
the core of this multi-stakeholder patrol system, which is focused upon
Extraordinarily
eff ective socialisation of the conservation and
4 primary activities: 24 hour routine water-borne patrols, entrance fee
sustainable use goals of the park - village patrol team members
enforcement, socialisation of the park's rules to villagers and visitors, and
"socialise" the park even during their free time when interacting
routine beach cleanups. While the involvement of civilians in patrols has
with other villagers on a social basis.
been at times controversial and posed a number of unique challenges,
2. Involvement of a range of stakeholders (e.g. rangers, police, and
the joint patrol system has proven a tremendous improvement to the
villagers from several villages) in joint patrol teams can greatly decrease
previous system and has resulted in a dramatic decrease in destructive
the likelihood of corruption, collusion or confl icts of interest in dealing
resource uses such as blast and cyanide fi shing, mangrove cutting and
with violations committed by friends and family members.
endangered wildlife capture.
3. When developing an MPA multi-stakeholder patrol system that
involves local community members, equal representation of all
The increased patrolling and stepped-up enforcement has led to a
villages (and cultures/religions) within the MPA is an important
signifi cant reduction in illegal fi shing activities within the boundaries of
precursor to acceptance and success of the patrols.
the National Park. Live coral cover has increased by more than 11% over
4. Most MPA stakeholders (villagers, tourism operators, and others)
2000 to 2002. Park communities are enjoying community development
support rules and regulations as long as they are clear and equitably
support from conservation revenues. This success is only possible through
enforced. Clear rules are easily understood and clearly posted.
the commitment of Park Management Advisory Board members to good
Equitable enforcement means that all those that break the rules
governance principles of transparency and accountability.
are treated the same way.
5. Community stakeholders support patrol and enforcement
Lessons learned from a multistakeholder enforcement initiative
programmes, as they are directly linked to increased livelihoods.
While the adaptive management process for the Bunaken joint patrol
Many illegal activities within protected areas come from outsiders.
system is ongoing, already there have been a number of important
Communities with a stake in conservation management or
lessons learned that may prove useful to MPA managers considering the
sustainable utilisation of park resources have a strong and rational
involvement of community members in joint patrol systems. Among
interest in seeing rules and regulations enforced so natural resources
the more important are:
are sustained. The overwhelming majority of villagers in BNP has
1. Involvement of villagers in a joint patrol system has associated costs
voiced support for a strong patrol system, and actively assist the
and benefi ts, but benefi ts generally far outweigh the costs.
system as "reef watchers" using the park-wide VHF radio system.
Costs include:
6. Park managers and the rangers tasked with fi eld management of
Village patrol members require signifi cant initial training;
the park commonly lack the community facilitation skills critical
Village patrol members have no authority to arrest or carry
to ensuring broad stakeholder support and understanding of park
weapons;
management objectives. Training in facilitation skills for these
Social jealousies can arise from villagers not involved in patrol
park management personnel is an essential capacity-building
system;
measure.
Occasional confl icts of interest arise when violations are
7. When building a multi-stakeholder patrol system, it is imperative to
committed by friends or family members.
appoint a strong leader who respects the other stakeholder groups
ANNEXES
93
but maintains a clear vision for the overall patrol team. This lesson was
It is important to note that while the overall percentage of the DPTNB
abundantly clear when comparing the northern and southern patrol
budget devoted to the patrol system has dropped from over 50% in
teams; the northern patrol team, while receiving the larger amount
2001 to roughly 15% in 2003, the costs have actually risen and there is
of funding and facilities, was continuously hampered by poor
no indication that these costs will decrease in the future. Unfortunately,
leadership from the fi eld coordinator - leading to infi ghting and less
even though broad socialisation of park rules has resulted in increased
than optimal performance. By comparison, the southern team, while
compliance, the economic incentive to illegally extract resources in the
operating on a smaller budget in an area with more hardened bomb
park only increases over time (as resources are overexploited outside
fi shermen, was highly successful, in large part due to an excellent
of the park), necessitating a continuously vigilant patrol system. BNP
fi eld coordinator from the BTNB who maintained and nurtured the
experienced this fi rsthand in January 2003, when a temporary work strike
enthusiasm and commitment of the village patrol members.
by village patrol members resulted in an immediate spike in blasting and
8. It is extremely important to declare and treat marine resource crimes
cyaniding activities within the park, in the space of two weeks.
as serious off ences, and to apply enforcement evenly across all
levels of society (including villagers, tourists, outside military/police/
Development and results of Bunaken entrance fee system
government offi
cials, etc). Public support for patrols will rapidly
(2001-2002)
decline if powerful individuals are given "special treatment".
(from Erdmann et al. 2003)
9. Indonesian courts typically treat destructive fi shing and other
Since 2000, USAID's Natural Resources Management Program has been
marine resource crimes as light off ences. Education of all levels
assisting the multi-stakeholder Bunaken National Park Management
of the enforcement/prosecution system is required to provide
Advisory Board in developing a model entrance fee system under special
understanding that marine resource crimes rob future generations
"pilot project" status granted by the Indonesian national government.
of their livelihoods and must be punished severely.
Based upon the highly successful Bonaire Marine Park entrance fee
10. Enforcement is a continuous, ongoing need, there will always be
system, the Bunaken system successfully raised nearly 42 000 USD in
individuals ready to engage in illegal (and profi table) activities if
its fi rst year of operation in 2001. With the strong support of the local
enforcement activities are decreased below eff ective levels.
tourism sector, the fee for international tourists was doubled in 2002,
raising ~110 000 USD from over 8 000 international and 17 000 Indonesian
Since its inception, the joint patrol system has consistently ranked
visitors. Revenues from the fee system now fund a park-wide joint ranger/
the most expensive programme in the DPTNB annual budget. In
police/villager patrol system, environmental education programmes, and
2001, the patrol system recorded 222.16 million Rp (~22 500 USD) in
village-level conservation and development programmes.
operational costs (including salaries for village patrol members and
bonuses for rangers/police, as well as fuel, equipment maintenance,
In its inaugural year, the BNP entrance fee system was quite successful,
criminal investigation and court costs, and training), plus an additional
with total entrance fee receipts of 418 187 500 Rp (~42 000 USD)
9 000 USD in equipment procurement (2 wooden boats with
recorded during the period of 15 March to 31 December 2001. These
outboard engines). In 2002, with both northern and southern patrols
fees were collected from a total of 15 055 visitors to the park (including
operational for the entire calendar year, overall operational costs
5 183 foreign guests, 8 387 adult Indonesians and 1 485 Indonesian
totalled 531 million Rp (~59 000 USD), plus an additional 29 000 USD
students). Taking into account the late start of the entrance fee system
in equipment procurement (VHF radio system, 2 engines and 1 boat).
and the eff ects of the 11 September 2001 terrorist attacks on tourism,
The 2003 DPTNB annual budget includes 673 million Rp (~76 500 USD)
the overall visitation for the park for 2001 was projected at the level of
for patrol operational costs plus an additional 22 000 USD in equipment
25 000 visitors (15 000 Indonesians and 10 000 foreigners). Although
procurement (polyethylene hull speedboats with environmentally-
they represented only 34% of visitor numbers, international guests
friendly four-stroke engines). For all three years, operational costs
generated almost 95% of the entrance fee receipts. In total, 37 countries
were funded by entrance fee receipts and two grants from WWF-
were represented in the entrance fee database, with the top country
Wallacea, while equipment procurement was funded by USAID's NRM
of origin being the UK, followed closely by the USA, Italy, Holland, and
programme. While it is envisioned that equipment costs should be
Germany. A second tier was comprised of Singapore, Japan, France,
minimal in the foreseeable future, operational costs are projected to
Taiwan, Hong Kong, Switzerland, and Spain.
stabilise at the 2003 level. Using this projection, the BNP joint patrol
system costs approximately 0.85 USD/ha/year.
Of the revenue collected, 20% was distributed to the various levels of
government as per provincial law. Approximately 50% of the proceeds
94
GIWA REGIONAL ASSESSMENT 56 SULUCELEBES SULAWESI SEA
were used to fund the joint ranger/police/villager patrol system for BNP,
Table 1 Entrance fee schedule for Bunaken National Park as
while another 10% was used to purchase and install village information
prescribed by North Sulawesi Provincial Law No. 9/2002.
Fee category
Indonesian (Rp)
International (Rp)
billboards in all 30 settlements within the park. The remaining 20% was
Visitor
set aside for use in the following year's BNPMAB budget.
Yearly tag
No Data
150 000
Daily ticket
2 500
50 000
Based upon the overall success of the fee system in 2001 and broad
Student/child
1 000
No Data
support from the tourism industry, the annual fee for international
Researcher
1-7 days
45 000
100 000
visitors was doubled in 2002, becoming 150 000 Rp (~17 USD). It is
8-30 days
75 000
200 000
interesting to note that such a rapid raise in the fee is quite unusual
1-6 months
125 000
400 000
for most MPAs and underlines the importance of working closely with
.5-1 year
200 000
600 000
the tourism sector; De Meyer and Simal (these proceedings) report
>1 year
250 000
800 000
Commercial Filmmaker
that Bonaire tour operators have resisted a fee raise for over a decade.
Documentary film
2 000 000
3 000 000
Additionally, a one-day ticket (50 000 Rp) for international guests was
Documentary video
500 000
1 000 000
introduced at the request of the local cottage owners (see below).
Researcher and Commercial Filmmaker fees are charged in addition to applicable visitor fee.
Residents of the 22 villages in the park and their Indonesian house guests are exempt from paying
Despite a drastic decrease in international visitors following the Bali
the visitor fee, while researchers from local provincial universities and institutions are exempt
from the researcher fee
bombing incident on 12 October 2002, the BNPMAB managed to record
total yearly receipts of 983 750 500 Rp (~110 000 USD). These revenues
were generated from a total of 25 697 paying guests, composed of
for continuous socialisation of the fee system and full transparency
approximately 2/3 local Indonesian guests and 1/3 international visitors.
regarding results. The BNPMAB regularly updates FAQ sheets and
Of the 17 435 Indonesian guests, most were adult guests (14 525),
posts the results of the entrance fee system (monthly revenues and
while 2 910 students also were recorded. By contrast, a total of 8 262
expenditures, etc) on websites, bulletin boards throughout the park,
international guests were recorded from 48 countries. Most of these
and via email lists. Brief updates on entrance fee results are also
international guests (5 294) purchased one-year waterproof entrance
submitted to international dive and nature magazines. Another key area
tags, while an additional 2 968 visitors purchased single-day entrance
of improvement suggested by the tourism industry (and highlighted
tickets. Taiwan, Italy and the United Kingdom were the top three
by the detailed statistics collected by the entrance fee system) was
countries of origin for international visitors to BNP during 2002, with
a new focus on meeting the demands of local Indonesian tourists.
1 431, 1 075, and 793 guests, respectively. The notable predominance
During the fi rst year of the entrance fee system, the BNPMAB focused
of the Taiwanese and the signifi cant drop in American visitors can be
on foreign divers and snorkellers as primary customers, devoting most
attributed to the introduction of direct international fl ights to Manado
management eff orts towards improving patrols and other activities to
from Taiwan in early 2002 and the American reluctance to travel
maintain and improve the quality of the reefs. However, it soon became
internationally in the wake of the 11 September 2001 terrorist attacks.
evident that local tourists are far more numerous, and that they have
quite diff erent demands for a "quality MPA experience": clean beaches
As with the 2001 revenues, 20% were allocated to national, provincial
and public picnic and toilet facilities, with reef quality being largely
and local governments, with an additional 40% of the revenues spent on
irrelevant. More recently, the large increase in day-tripping Taiwanese
support for the joint patrol system. New in 2002 was an expenditure of
snorkel tourists has required yet another management paradigm
over 30% of total revenues on village-level conservation and development
shift; unlike BNP's "normal" clientele of relatively experienced (and
programmes (including a 30-station park-wide VHF radio system, beach
environmentally-enlightened) divers, this type of tourist requires
cleanups, construction of public toilet and water facilities and paved
specifi c education and patrol programmes to prevent reef trampling.
footpaths, and mangrove rehabilitation programmes). Additional
With both of these situations, close monitoring of entrance fee data
expenditures for 2002 included support for a nascent biological
combined with continuous engagement with the tourism community
monitoring programme and villager environmental education.
has allowed adaptive management changes.
A key factor in the continued success of the BNP entrance fee system
Yet another improvement to the fee system suggested by the tourism
has been continuous engagement with all levels of the tourism sector to
sector was the provision for an incentive system for tag sales to
obtain feedback and adapt the system to any perceived shortcomings.
further prod uncooperative operators to participate willingly. Under
One clear requirement from the tourism community has been the need
this agreement, a 5% "commission" (7 500 Rp/tag) is off ered by the
ANNEXES
95
BNPMAB on all entrance tag sales. However, to promote institutional
system (which is subject to potentially large disturbances to international
strengthening of the tourism sector and better cooperation, this
tourism). Specifi c targets include an international volunteers system to
incentive is not paid directly to individual tourism operators, but rather
lower management costs, diversifi ed government agency support,
to the trade association of their choice (including the NSWA, the local
in-kind support from the local dive tourism sector, and national and
cottage-owner association, the charter boat association, and the travel
international grant support. Two additional sources of funding that are
agents' association). Moreover, the commission is only paid on yearly
currently under development include visitor center merchandising and
entrance tags, in order to encourage operators to sell the tags instead
a possible endowment fund. Finally, BNP has been selected as one of
of one-day tickets. This system has also improved compliance and
four MPAs to participate in a pilot study to develop business plans for
cooperation, and allowed some interesting initiatives to develop; the
Asian MPAs under the auspices of the World Commission on Protected
NSWA uses the proceeds of these commissions to fund a scholarship
Areas South East Asia Marine (WCPA SEA Marine) working group. With
fund for local high school students from within the park, and the
these initiatives well underway, the BNPMAB is targeting fi nancial
cottage owner association uses their commissions to fund weekly
sustainability by 2005.
beach cleanups by local villagers.
References
A fi nal improvement suggested by the tourism community was
Erdmann, M.V. and Merrill, P. (2003). Multiple-use Zoning in Marine
the introduction of an entrance tag design contest open to all
Protected Areas: Bunaken National Park case study (Indonesia).
guests visiting the park. For the fi rst two years, the tag design was
Proceedings Second International Tropical Marine Ecosystems
decided internally within the BNPMAB. While the tag designs were
Management Symposium, Manila, Philippines, April, 2003.
enthusiastically received and the tags have in fact become a collector's
Erdmann, M.V. and Toengkagie, A. (2003). The Bunaken National Park
item (the BNPMAB received several requests from abroad to purchase
Joint Patrol System: Lessons Learned from a Multistakeholder
tags without visiting the park!), members of NSWA suggested that
Enforcement Initiative. Proceedings Second International Tropical
a tag design contest would only further promote the entrance fee
Marine Ecosystems Management Symposium, Manila, Philippines,
system. The 2003 tag design contest was announced in June 2002,
April, 2003.
with a deadline of October 2002 to provide ample time to select and
Erdmann, M.V., Merrill, P.R., Mongdong, M., Wowiling, M., Pangalila,
print the winning tag design by December 2002. Participants were
R. and Arsyad, I. (2003). The Bunaken National Marine Park Co-
allowed to submit up to three photographs or graphic designs each
Management Initiative. Proceedings Second International Tropical
for consideration, with the winning prize being a return airfare from
Marine Ecosystems Management Symposium, Manila, Philippines,
Singapore to Manado (donated by Silk Air) and a 5 day all-inclusive
April, 2003.
diving package at one of 6 participating dive resorts. Importantly, any
NRM Headline News (2001). Natural Resources Management Program
submitted photos or designs become the non-exclusive property of the
Headline News Issue 30, 2001. Available at http://www.bunaken.info/
BNPMAB for use in printed conservation materials (posters, brochures,
nrm_news.html
and calendars) for the park. The contest has proven very popular and
NRM Headline News (2002). Natural Resources Management Program
is now in its second year.
Headline News Issue 17, 2002, information courtesy of Nancy Dahl-
Tacconi and Mark Erdmann. Available at http://www.bunaken.info/
Future plans
nrm_news.html
In the long run, the BNPMAB is targeting up to 250 000 USD per year from
PHKA (2002). Technical Guidance on Zonation of Indonesia's Marine
the entrance fee system. The projected increase in revenues is assumed
National Park System (In Indonesian; Pedoman Penataan Zona
to come from a combination of increased visitor numbers and eventual
Taman Nasional Perairan Laut). Jakarta. 42 pp.
fee raises (both for local and international visitors). At the same time, NRM
Usher, G. and Merrill, R. (2000). Bunaken National Park: Participatory
is now working with the BNPMAB and the tourism sector to set visitor
Management in Zoning. p 247-252 In: Salm RV and Clark JR (eds)
carrying capacity limits and legislate these limits to prevent the onset of
Marine and Coastal Protected Areas: A guide for planners and
mass tourism. Increased user fees will likely be one tool that will be used
Managers. 3rd Edition. IUCN.
in the future to limit visitor numbers to a sustainable level.
At the same time, the BNPMAB is also working to further diversify the
BNP funding portfolio to prevent overdependence on the entrance fee
96
GIWA REGIONAL ASSESSMENT 56 SULUCELEBES SULAWESI SEA
Annex X
It would seem appropriate that the debate raised at the Kota Kinabalu
workshop should be revisited in Indonesia for the purpose of
Small versus large protected
formulating this country's future MPA network strategy. The current
areas in tropical developing
focus on small community reserves is certainly important and should
nations
continue to be encouraged - but not to the exclusion of large reserves.
These large MPAs, while often presenting a much more complex
(From NRM Headline News (2001). Natural Resources Program Headline
management situation, are an essential component of Indonesia's
News Issue 35, November 2001, courtesy M. Erdmann, Bunaken National
marine conservation eff orts.
Park).
Considerable recent debate has centred on the relative merits and
drawbacks of small (less than 2 ha) community-based MPAs versus large
(tens to hundreds of thousands of hectares), often centrally-managed
MPAs, the marine equivalent of the well-known SLOSS (Single Large
Or Several Small) debate in terrestrial conservation circles. This debate
has particular relevance to Indonesia and the region as a whole at this
time, when several large institutions appear to be favouring the small
community marine reserve approach based upon an apparent belief
that large MPAs are much more diffi
cult to manage and often face
signifi cant public opposition. A good case study for Indonesia is the
Philippines, where there are reportedly almost 100 small municipal
MPAs and relatively few larger MPAs (with Tubbataha being a notable
example). Indeed, the increasing prevalence of Philippines fi sh poachers
in Indonesian waters suggests that the Philippines MPA strategy has not
been altogether eff ective.
Several Philippines representatives at the UNEP-sponsored Workshop
on Networking of MPAs in the East Asian Seas held in Kota Kinabalu,
Malaysia from 8-12 October 2001 argued strongly for the small
community reserve approach, citing the strong community support
that is often achieved and the resulting effi
cacy of management.
On the other hand, many marine scientists present at the meeting
pointed out that current ecological theory on reef organism life
histories and recruitment dynamics suggest that such small reserves,
even if relatively high in number, cannot maintain viable populations
of many important reef species. While small community reserves are
an excellent MPA marketing tool to increase village awareness and
participation in marine conservation and possibly to increase local fi sh
catches, networks of large reserves (on the scale of tens of thousands
of hectares) are critical for the survival of rare, widely-spaced or highly
mobile reef species. A commonly-cited example are groupers (fi sh),
which can travel up to 10 km or more to spawn in large aggregation
sites. Without large reserves that include the entire home range of such
groupers (including the spawning aggregation sites), there can be no
eff ective protection of grouper stocks
ANNEXES
97
Annex XI
A challenge for eff ective fi shery management is that policy makers still
perceive Illegal Unreported and Unregulated Fishing (there is even an
Managing overfishing in
acronym for this, IUUF) as the main concern, rather than overexploitation
Indonesia
by `legal' fi shers. There is a strong focus within the Ministry of Marine Aff airs
and Fisheries to deal with this problem, whereas the establishment of Marine
(Excerpted from Pet & Mous (1999), with direct quotes from their cited
Protected Areas is not on the political agenda. For example, the Ministry did
sources in normal font and the article conclusions in italics)
not even propose a single project in support of marine protected areas in
its project portfolio presented at PrepCom IV. Hence, there is a niche for a
Already in the mid-nineties, there was a call for a change in the objective
conservation alliance to carry the concept of marine protected areas forward
in fi shery management: The major conclusion of this study is that a
(Ministry of Marine Aff airs and Fisheries 2002).
shift of objectives of fi sheries management should occur. To assure
that maximum benefi ts accrue from the fi sheries, the objectives must
Although overfi shing is mentioned as a real problem in general terms, one
change from increasing landings to assuring sustainable exploitation
does get the impression that the main agenda remains to expand the fi shery,
(Gillett 1996).
in combination with curbing illegal fi shing and making the domestic fi shery
more capital-intensive. It is also noteworthy that the Government of Indonesia
The tragedy is that Indonesian government offi
cials misinterpret the
formulates clear benchmarks for development of the fi shery, whereas there is
conclusions from fi shery scientists on the maximum sustainable yield.
nothing concrete on conservation and how sustainability is being ensured.
Whereas fi shery scientists state that the current state of the fi shery is at 60% of
The following is an excerpt from a speech by the Minister of Marine Aff airs
the maximum sustainable yield because the fi shing eff ort is too high, many
and Fisheries: Indonesia's contribution of the fi sheries sector to the
policy makers think that the fi shery can be further optimised by increasing
national GDP is only about 2%, although the total length of the coastal
the eff ort. (Undated leafl et from the Indoensian Research Centre of
line in South Korea and Japan is only 2 731 and 34 386 km respectively,
Marine Technology, Ministry of Marine Aff airs and Fisheries).
the contribution of the fi sheries sector to the national GDP already fetch
37% and 54% respectively. Likewise, although the total length of the
Whereas the concept of maximum sustainable yield is widely used in
coastal line in Thailand is only about 2 600 km, they manage to tap more
Indonesia, even a basic understanding of the rationale behind the concept
then 5 billion USD of foreign-exchange earnings from fi sheries export
is lacking with policy makers. Fishery scientists fall short in explaining the
annually. For these obvious reasons, the Indonesian Government has
uncertainties, applicability and the take-home message in their reports.
decided to launch an integrated fi sheries management programme to
The following are excerpts from the recommendations in a recent FAO
optimise the use of fi sheries resources on a sustainable basis. Under this
report: A major problem is the working concept that the diff erence
scheme, the contribution of fi sheries export to the foreign-exchange
between present fi sh catches and the potential yield represents a
earnings is projected to reach 5 billion USD and the share of the fi sheries
surplus which is available for harvesting by additional fi shing eff ort.
sector to the national GDP is expected to reach 5%. One of the main
Although the concept of maximum sustainable yield (MSY) is widely
constraints to achieve the above objectives is the fact that artisanal
used in Indonesia, as the fi sheries develop and eff ort increases, the
fi shermen, characterised as small-scale, low capital and labour intensive
MSY concept becomes less relevant and information from the fi shery
in nature, mostly dominate the Indonesian fi sheries.
assumes a greater importance in determining any remaining potential.
Those individuals that make the resource estimates should also take on
The widespread increase of llegal, Unreported and Unregulated fi shing
the responsibility of conveying to the users of the information an idea
has also been incriminated for the severe damage of fi sheries resources
of how accurate the information is (Gillett 2000).
in the Indonesian waters as well as excessive loss of revenue. We need
to work together to strengthen our capacity building and technical
The Indonesia/FAO/DANIDA Workshop (Venema 1996) and the DGF/
know-how. I would like to take this opportunity to seek the indulgence
FAO Workshop on Strengthening Marine Resource Management (Gillett
and cooperation of all stakeholders to assist Indonesia to overcome
1996) found that the system which is presently used to calculate the
and gradually minimise illegal unreported and unregulated fi shing. In
optimum eff ort in terms of numbers of licences (= number of active
this juncture, I would like to re-emphasise our desire to strengthen our
vessels per year) is incorrect and the expected eff ects are alarming to
capability and policy instruments and law enforcement against IUU
say the least.
fi shing. (Offi
cial transcript of the keynote speech by the Minister for
Marine Aff airs and Fisheries at the International Seminar on Sustainable
98
GIWA REGIONAL ASSESSMENT 56 SULUCELEBES SULAWESI SEA
Development in the EEZ and the EEZ as an Institutional for Cooperation
into account the needs of the vulnerable poor as well as to implement
or Confl ict. Denpasar, Bali, June 4, 2002).
the Precautionary Approach to Management and the Code of Conduct
for Responsible Fisheries, to which the country subscribes.
A recent address by the President of Indonesia shows that the Government
of Indonesia seeks to expand the fi shery in Indonesia's seas: President
Today, management of Indonesian fi sheries is no longer a matter of
Megawati Soekarnoputri, while expressing concern about the
choice. There is no choice. Management is inevitable if the remaining
environment, called on local businessmen to make more of Eastern
fi sheries are to be sustained for the present and future generations.
Indonesia's waters, home to an abundance of fi sh and other marine
With fi sheries facing certain depletion and imminent collapse, not only
life. "Most businessmen have been reluctant to open new ventures in
in Indonesia but also throughout the world, a continuing emphasis on
this unexplored and rich marine resource area because they consider
uncontrolled or unmanaged development and expanded production
it technically and economically unfeasible," said the President.
as had been pursued in the country over the last 30 years is clearly
Participating in the conference and expo were delegates and fi shing
ill advised. To check further uncontrolled expansion and reverse
companies from 22 foreign countries, including Australia, the United
overfi shing, a diff erent set of fresh policies and strategies is needed.
States, Germany and France. "We now have to start thinking about how
to wisely explore our rich and diverse marine resources, as well as to
The country and its policy-makers and planners, as also its fi sheries
boost agriculture," she said (Widiadana 2002).
managers and fi shers must rid themselves of their mental trap that
every available resource in the country is still underutilised and huge
In a recent report to the Ministry of Marine Aff airs and Fisheries, the need for
potentials remain for its expanded exploitation and production. In
better management rather than further expansion was noted again. More
a country as vast as Indonesia is and with over 200 million people
investments are needed to produce more fi sh. But such investments
and with a structurally-centralised governance system concentrated
must not expand fi shing capacity but to complement and supplement
in Jakarta and Java, it cannot be that its natural resources are still
eff ort to manage the remaining fi sheries resources (Pacifi c Consultants
underutilised. For Indonesian fi sheries and its future sustainable
International 2001).
development, we would like that our Study be on the list of `must
read' reports for as many Indonesians as possible, especially those
A recent report to the Ministry of Marine Aff airs and Fisheries listed the
responsible for making policies, which provide the broad thrusts and
following policy recommendation: Create, build and arouse awareness to
direction, goals, signals, incentives, nuances and its wherewithals on
change the perception and mindset of the people to stop romanticising
how these remaining resources are used for nation building (Pacifi c
that the country's seas have over-abundant or overfl owing resources, in
Consultants International 2001).
particular fi sheries resources (Pacifi c Consultants International 2001).
In a report prepared by the Food and Agricultural Organization of the
It is not clear how the Government of Indonesia translates the advice off ered
United Nations, the danger of the government focusing on increasing
through costly consultancies into management action, given the ubiquitous
production is highlighted: Both individuals and the private sector can
call for reduction of the fi shery among experts and the equally ubiquitous
and do carry out action leading to increased production from fi sheries
call for intensifi cation of the fi shery among policy makers. Even consultants
resources. However, in many respects only the government can serve
seem to have concerns about this issue, see the appeal at the end of the
as a guardian of the fi sheries resources to prevent overexploitation. If
following excerpt from a recent three volume report commissioned by the
the staff of DGF (Indonesian Directorate General of Fisheries) are largely
Ministry of Marine Aff airs and Fisheries to Pacifi c Consultants International:
preoccupied with increasing fi sheries production, there appears to be
The former Directorate General of Fisheries, now restructured into the
no government agency which has as its major concern the protection
Directorate General of Capture Fisheries and Directorate General of
of fi sheries resources (Gillett R. 2000).
Culture Fisheries, had tasked a project, Study on Fisheries Development
Policy Formulation, as an integral part of the Jakarta Fishing Port/ Market
To restore fi sh populations and protect ecosystems, fi shery managers
Development Policy Formulation, as an integral part of the Jakarta
should develop policies aimed toward substantially reducing fi shing,
Fishing Port/Market Development Project Phase IV under the Japan
says Sustaining Marine Fisheries, a new report by a committee of the
Bank for International Cooperation (JBIC Loan No. IP-403) to evolve
National Research Council. Management plans should include not
and formulate a new and bold policy for Indonesian fi sheries and
only commercial fi shing but also recreational and subsistence fi shing.
aquaculture based on the principles of equity and sustainability, taking
More coastal and ocean areas should be designated as protected,
ANNEXES
99
where fi shing would not be permitted. In addition, managers should
consider taking action such as assigning exclusive fi shing rights to
individuals or communities, to discourage overfi shing (The National
Academies 1998).
References
Gillett, R. (1996). Marine fi sheries resources and management in
Indonesia with emphasis on the extended economic zone.
Workshop Presentation Paper 1, Workshop on Strengthening
Marine Resource Development in Indonesia, TCP/INS/4553.).
Gillett, R. (2000). FAO Technical Cooperation Programme. Assistance in
marine fi sheries legislation - Indonesia. Report reference TCP/INS/
8922. FAO, Rome. 98 p.
Ministry of Marine Aff airs and Fisheries (2002). Partnership/Initiative
under World Summit on Sustainable Development, presented at
PrepCom IV, Bali Indonesia, May 24-June 7, 2002.
The National Academies (1998). Fishing should be reduced
substantially to protect marine ecosystems. 22 October.
Retrieved July 2003 from http://www4.nas.edu/news.nsf/isbn/
0309055261?OpenDocument
Pacifi c Consultants International (2001). Study on Fisheries Development
Policy Formulation. Volume I. White Paper. Report by Pacifi c
Consultants International under Jakarta Fishing Port/Market
Development Project (Phase IV: JBIC Loan No. IP-403).
Pet J.S. and Mous P.J. (1999). Status of the coral reefs in and around
Komodo National Park 1996-1998. Monitoring report by the Nature
Conservancy Indonesia Coastal and Marine Program, Jakarta
Indonesia.
Venema S. (1996). Resuls of surveys for pelagic resources in Indonesian
waters with the RVLemuru December 1972 to May 1976. In: Pauly D.
and Martosubroto P. (eds.)The fi sh resources of western Indonesia
DGF, Indonesia, GTZ, Germany and international centre for living
and aquatic resources management, Manila. ICLARM Stud. Rev. 23
Widiadana R.A. (2002). Businessmen urged to exploit RI's eastern waters.
The Jakarta Post, July 18.
100
GIWA REGIONAL ASSESSMENT 56 SULUCELEBES SULAWESI SEA
The Global International
Waters Assessment
This report presents the results of the Global International Waters
Adequately managing the world's aquatic resources for the benefi t of
Assessment (GIWA) of the transboundary waters of the Sulu-Celebes
all is, for a variety of reasons, a very complex task. The liquid state of
(Sulawesi) Sea. This and the subsequent chapter off er a background
the most of the world's water means that, without the construction
that describes the impetus behind the establishment of GIWA, its
of reservoirs, dams and canals it is free to fl ow wherever the laws of
objectives and how the GIWA was implemented.
nature dictate. Water is, therefore, a vector transporting not only a
wide variety of valuable resources but also problems from one area
to another. The effl
uents emanating from environmentally destructive
activities in upstream drainage areas are propagated downstream
The need for a global
and can aff ect other areas considerable distances away. In the case of
international waters
transboundary river basins, such as the Nile, Amazon and Niger, the
assessment
impacts are transported across national borders and can be observed
in the numerous countries situated within their catchments. In the case
of large oceanic currents, the impacts can even be propagated between
Globally, people are becoming increasingly aware of the degradation of
continents (AMAP 1998). Therefore, the inextricable linkages within
the world's water bodies. Disasters from fl oods and droughts, frequently
and between both freshwater and marine environments dictates that
reported in the media, are considered to be linked with ongoing global
management of aquatic resources ought to be implemented through
climate change (IPCC 2001), accidents involving large ships pollute public
a drainage basin approach.
beaches and threaten marine life and almost every commercial fi sh stock
is exploited beyond sustainable limits - it is estimated that the global
In addition, there is growing appreciation of the incongruence
stocks of large predatory fi sh have declined to less that 10% of pre-
between the transboundary nature of many aquatic resources and the
industrial fi shing levels (Myers & Worm 2003). Further, more than 1 billion
traditional introspective nationally focused approaches to managing
people worldwide lack access to safe drinking water and 2 billion people
those resources. Water, unlike laws and management plans, does not
lack proper sanitation which causes approximately 4 billion cases of
respect national borders and, as a consequence, if future management
diarrhoea each year and results in the death of 2.2 million people, mostly
of water and aquatic resources is to be successful, then a shift in focus
children younger than fi ve (WHO-UNICEF 2002). Moreover, freshwater
towards international cooperation and intergovernmental agreements
and marine habitats are destroyed by infrastructure developments,
is required (UN 1972). Furthermore, the complexity of managing the
dams, roads, ports and human settlements (Brinson & Malvßrez 2002,
world's water resources is exacerbated by the dependence of a great
Kennish 2002). As a consequence, there is growing public concern
variety of domestic and industrial activities on those resources. As a
regarding the declining quality and quantity of the world's aquatic
consequence, cross-sectoral multidisciplinary approaches that integrate
resources because of human activities, which has resulted in mounting
environmental, socio-economic and development aspects into
pressure on governments and decision makers to institute new and
management must be adopted. Unfortunately however, the scientifi c
innovative policies to manage those resources in a sustainable way
information or capacity within each discipline is often not available or
ensuring their availability for future generations.
is inadequately translated for use by managers, decision makers and
GLOBAL INTERNATIONAL WATERS ASSESSMENT
i
policy developers. These inadequacies constitute a serious impediment
The Global Environment Facility (GEF)
to the implementation of urgently needed innovative policies.
The Global Environment Facility forges international co-operation and fi nances actions to address
six critical threats to the global environment: biodiversity loss, climate change, degradation of
international waters, ozone depletion, land degradation, and persistent organic pollutants (POPs).
Continual assessment of the prevailing and future threats to aquatic
The overall strategic thrust of GEF-funded international waters activities is to meet the incremental
ecosystems and their implications for human populations is essential if
costs of: (a) assisting groups of countries to better understand the environmental concerns of
their international waters and work collaboratively to address them; (b) building the capacity
governments and decision makers are going to be able to make strategic
of existing institutions to utilise a more comprehensive approach for addressing transboundary
policy and management decisions that promote the sustainable use of
water-related environmental concerns; and (c) implementing measures that address the priority
transboundary environmental concerns. The goal is to assist countries to utilise the full range of
those resources and respond to the growing concerns of the general
technical, economic, fi nancial, regulatory, and institutional measures needed to operationalise
public. Although many assessments of aquatic resources are being
sustainable development strategies for international waters.
conducted by local, national, regional and international bodies, past
United Nations Environment Programme (UNEP)
assessments have often concentrated on specifi c themes, such as
United Nations Environment Programme, established in 1972, is the voice for the environment
biodiversity or persistent toxic substances, or have focused only on
within the United Nations system. The mission of UNEP is to provide leadership and encourage
partnership in caring for the environment by inspiring, informing, and enabling nations and
marine or freshwaters. A globally coherent, drainage basin based
peoples to improve their quality of life without compromising that of future generations.
assessment that embraces the inextricable links between transboundary
UNEP work encompasses:
freshwater and marine systems, and between environmental and
Assessing global, regional and national environmental conditions and trends;
Developing international and national environmental instruments;
societal issues, has never been conducted previously.
Strengthening institutions for the wise management of the environment;
Facilitating the transfer of knowledge and technology for sustainable development;
Encouraging new partnerships and mind-sets within civil society and the private sector.
International call for action
University of Kalmar
University of Kalmar hosts the GIWA Co-ordination Offi ce and provides scientifi c advice and
administrative and technical assistance to GIWA. University of Kalmar is situated on the coast of
The need for a holistic assessment of transboundary waters in order to
the Baltic Sea. The city has a long tradition of higher education; teachers and marine offi cers have
been educated in Kalmar since the middle of the 19th century. Today, natural science is a priority
respond to growing public concerns and provide advice to governments
area which gives Kalmar a unique educational and research profi le compared with other smaller
universities in Sweden. Of particular relevance for GIWA is the established research in aquatic and
and decision makers regarding the management of aquatic resources
environmental science. Issues linked to the concept of sustainable development are implemented
was recognised by several international bodies focusing on the global
by the research programme Natural Resources Management and Agenda 21 Research School.
environment. In particular, the Global Environment Facility (GEF)
Since its establishment GIWA has grown to become an integral part of University activities.
The GIWA Co-ordination offi ce and GIWA Core team are located at the Kalmarsund Laboratory, the
observed that the International Waters (IW) component of the GEF
university centre for water-related research. Senior scientists appointed by the University are actively
suff ered from the lack of a global assessment which made it diffi
cult
involved in the GIWA peer-review and steering groups. As a result of the cooperation the University
can offer courses and seminars related to GIWA objectives and international water issues.
to prioritise international water projects, particularly considering
the inadequate understanding of the nature and root causes of
environmental problems. In 1996, at its fourth meeting in Nairobi, the
causes of degradation of the transboundary aquatic environment and
GEF Scientifi c and Technical Advisory Panel (STAP), noted that: "Lack of
options for addressing them. These pro cesses led to the development
an International Waters Assessment comparable with that of the IPCC, the
of the Global International Waters Assessment (GIWA) that would be
Global Biodiversity Assessment, and the Stratospheric Ozone Assessment,
implemented by the United Nations Environment Programme (UNEP) in
was a unique and serious impediment to the implementation of the
conjunction with the University of Kalmar, Sweden, on behalf of the GEF.
International Waters Component of the GEF".
The GIWA was inaugurated in Kalmar in October 1999 by the Executive
Director of UNEP, Dr. Klaus T÷pfer, and the late Swedish Minister of the
The urgent need for an assessment of the causes of environmental
Environment, Kjell Larsson. On this occasion Dr. T÷pfer stated: "GIWA
degradation was also highlighted at the UN Special Session on
is the framework of UNEP┤s global water assessment strategy and will
the Environment (UNGASS) in 1997, where commitments were
enable us to record and report on critical water resources for the planet for
made regarding the work of the UN Commission on Sustainable
consideration of sustainable development management practices as part of
Development (UNCSD) on freshwater in 1998 and seas in 1999. Also in
our responsibilities under Agenda 21 agreements of the Rio conference".
1997, two international Declarations, the Potomac Declaration: Towards
enhanced ocean security into the third millennium, and the Stockholm
The importance of the GIWA has been further underpinned by the UN
Statement on inter action of land activities, freshwater and enclosed
Millennium Development Goals adopted by the UN General Assembly
seas, specifi cally emphasised the need for an investigation of the root
in 2000 and the Declaration from the World Summit on Sustainable
ii
REGIONAL ASSESSMENTS
Development in 2002. The development goals aimed to halve the
International waters and transboundary issues
proportion of people without access to safe drinking water and basic
The term "international waters", as used for the purposes of the GEF Operational Strategy,
sanitation by the year 2015 (United Nations Millennium Declaration
includes the oceans, large marine ecosystems, enclosed or semi-enclosed seas and estuaries, as
well as rivers, lakes, groundwater systems, and wetlands with transboundary drainage basins
2000). The WSSD also calls for integrated management of land, water and
or common borders. The water-related ecosystems associated with these waters are considered
living resources (WSSD 2002) and, by 2010, the Reykjavik Declaration on
integral parts of the systems.
The term "transboundary issues" is used to describe the threats to the aquatic environment
Responsible Fisheries in the Marine Ecosystem should be implemented
linked to globalisation, international trade, demographic changes and technological advancement,
by all countries that are party to the declaration (FAO 2001).
threats that are additional to those created through transboundary movement of water. Single
country policies and actions are inadequate in order to cope with these challenges and this makes
them transboundary in nature.
The international waters area includes numerous international conventions, treaties, and
agreements. The architecture of marine agreements is especially complex, and a large number
The conceptual framework
of bilateral and multilateral agreements exist for transboundary freshwater basins. Related
conventions and agreements in other areas increase the complexity. These initiatives provide
and objectives
a new opportunity for cooperating nations to link many different programmes and instruments
into regional comprehensive approaches to address international waters.
Considering the general decline in the condition of the world's aquatic
the large-scale deforestation of mangroves for ponds (Primavera 1997).
resources and the internationally recognised need for a globally
Within the GIWA, these "non-hydrological" factors constitute as large
coherent assessment of transboundary waters, the primary objectives
a transboundary infl uence as more traditionally recognised problems,
of the GIWA are:
such as the construction of dams that regulate the fl ow of water into
To provide a prioritising mechanism that allows the GEF to focus
a neighbouring country, and are considered equally important. In
their resources so that they are used in the most cost eff ective
addition, the GIWA recognises the importance of hydrological units that
manner to achieve signifi cant environmental benefi ts, at national,
would not normally be considered transboundary but exert a signifi cant
regional and global levels; and
infl uence on transboundary waters, such as the Yangtze River in China
To highlight areas in which governments can develop and
which discharges into the East China Sea (Daoji & Daler 2004) and the
implement strategic policies to reduce environmental degradation
Volga River in Russia which is largely responsible for the condition of
and improve the management of aquatic resources.
the Caspian Sea (Barannik et al. 2004). Furthermore, the GIWA is a truly
regional assessment that has incorporated data from a wide range of
In order to meet these objectives and address some of the current
sources and included expert knowledge and information from a wide
inadequacies in international aquatic resources management, the GIWA
range of sectors and from each country in the region. Therefore, the
has incorporated four essential elements into its design:
transboundary concept adopted by the GIWA extends to include
A broad transboundary approach that generates a truly regional
impacts caused by globalisation, international trade, demographic
perspective through the incorporation of expertise and existing
changes and technological advances and recognises the need for
information from all nations in the region and the assessment of
international cooperation to address them.
all factors that infl uence the aquatic resources of the region;
A drainage basin approach integrating freshwater and marine
systems;
A multidisciplinary approach integrating environmental and socio-
The organisational structure and
economic information and expertise; and
implementation of the GIWA
A coherent assessment that enables global comparison of the
results.
The scale of the assessment
Initially, the scope of the GIWA was confi ned to transboundary waters
The GIWA builds on previous assessments implemented within the GEF
in areas that included countries eligible to receive funds from the GEF.
International Waters portfolio but has developed and adopted a broader
However, it was recognised that a truly global perspective would only
defi nition of transboundary waters to include factors that infl uence the
be achieved if industrialised, GEF-ineligible regions of the world were
quality and quantity of global aquatic resources. For example, due to
also assessed. Financial resources to assess the GEF-eligible countries
globalisation and international trade, the market for penaeid shrimps
were obtained primarily from the GEF (68%), the Swedish International
has widened and the prices soared. This, in turn, has encouraged
Development Cooperation Agency (Sida) (18%), and the Finnish
entrepreneurs in South East Asia to expand aquaculture resulting in
Department for International Development Cooperation (FINNIDA)
GLOBAL INTERNATIONAL WATERS ASSESSMENT
iii
1
15
11
16
14
12
28
10
13
17
25
29
9
18
30
19
23
22
8
7
31
6
20
24
26
35
33
2
34
27
5
21
50
32
51
36
37
41
52
4
49
53
43
65
55
48
54
3
42
56
46
62
47
40b
40a
57
62
45b
39
59
45a
58
60
64
44
61
38
63
66
1 Arctic
12
Norwegian Sea (LME)
24 Aral
Sea
36 East-China
Sea
(LME)
46
Somali Coastal Current (LME)
58 North
Australian
Shelf
(LME)
2
Gulf of Mexico (LME)
13 Faroe
plateau
25
Gulf of Alaska (LME)
37
Hawaiian Archipelago (LME)
47
East African Rift Valley Lakes
59 Coral
Sea
Basin
3
Caribbean Sea (LME)
14
Iceland Shelf (LME)
26
California Current (LME)
38
Patagonian Shelf (LME)
48
Gulf of Aden
60 Great
Barrier
Reef
(LME)
4 Caribbean
Islands
15
East Greenland Shelf (LME)
27
Gulf of California (LME)
39 Brazil
Current
(LME)
49
Red Sea (LME)
61 Great
Australian
Bight
5
Southeast Shelf (LME)
16
West Greenland Shelf (LME)
28
East Bering Sea (LME)
40a Brazilian Northeast (LME)
50 The
Gulf
62
Small Island States
6
Northeast Shelf (LME)
17
Baltic Sea (LME)
29
West Bering Sea (LME)
40b Amazon
51 Jordan
63 Tasman
Sea
7
Scotian Shelf (LME)
18 North
Sea
(LME)
30
Sea of Okhotsk (LME)
41
Canary Current (LME)
52
Arabian Sea (LME)
64 Humboldt
Current
(LME)
8
Gulf of St Lawrence
19
Celtic-Biscay Shelf (LME)
31
Oyashio Current (LME)
42
Guinea Current (LME)
53
Bay of Bengal S.E.
65 Eastern
Equatorial
Pacific
9
Newfoundland Shelf (LME)
20 Iberian
Coastal
(LME)
32 Kuroshio
Current
(LME)
43 Lake
Chad
54 South
China
Sea
(LME)
66 Antarctic
(LME)
10
Baffin Bay, Labrador Sea,
21 Mediterranean
Sea
(LME)
33
Sea of Japan/East Sea (LME)
44 Benguela
Current
(LME)
55 Mekong
River
Canadian Archipelago
22 Black
Sea
(LME)
34
Yellow Sea (LME)
45a Agulhas Current (LME)
56
Sulu-Celebes Sea (LME)
11
Barents Sea (LME)
23 Caspian
Sea
35 Bohai
Sea
45b Indian Ocean Islands
57 Indonesian
Seas
(LME)
Figure 1
The 66 transboundary regions assessed within the GIWA project.
(10%). Other contributions were made by Kalmar Municipality, the
Considering the objectives of the GIWA and the elements incorporated
University of Kalmar and the Norwegian Government. The assessment of
into its design, a new methodology for the implementation of the
regions ineligible for GEF funds was conducted by various international
assessment was developed during the initial phase of the project. The
and national organisations as in-kind contributions to the GIWA.
methodology focuses on fi ve major environmental concerns which
constitute the foundation of the GIWA assessment; Freshwater shortage,
In order to be consistent with the transboundary nature of many of the
Pollution, Habitat and community modifi cation, Overexploitation of fi sh
world's aquatic resources and the focus of the GIWA, the geographical
and other living resources, and Global change. The GIWA methodology
units being assessed have been designed according to the watersheds
is outlined in the following chapter.
of discrete hydrographic systems rather than political borders (Figure 1).
The geographic units of the assessment were determined during the
The global network
preparatory phase of the project and resulted in the division of the
In each of the 66 regions, the assessment is conducted by a team of
world into 66 regions defi ned by the entire area of one or more
local experts that is headed by a Focal Point (Figure 2). The Focal Point
catchments areas that drains into a single designated marine system.
can be an individual, institution or organisation that has been selected
These marine systems often correspond to Large Marine Ecosystems
on the basis of their scientifi c reputation and experience implementing
(LMEs) (Sherman 1994, IOC 2002).
international assessment projects. The Focal Point is responsible
for assembling members of the team and ensuring that it has the
Large Marine Ecocsystems (LMEs)
necessary expertise and experience in a variety of environmental
Large Marine Ecosystems (LMEs) are regions of ocean space encompassing coastal areas from river
and socio-economic disciplines to successfully conduct the regional
basins and estuaries to the seaward boundaries of continental shelves and the outer margin of the
major current systems. They are relatively large regions on the order of 200 000 km2 or greater,
assessment. The selection of team members is one of the most critical
characterised by distinct: (1) bathymetry, (2) hydrography, (3) productivity, and (4) trophically
elements for the success of GIWA and, in order to ensure that the
dependent populations.
most relevant information is incorporated into the assessment, team
The Large Marine Ecosystems strategy is a global effort for the assessment and management
of international coastal waters. It developed in direct response to a declaration at the 1992
members were selected from a wide variety of institutions such as
Rio Summit. As part of the strategy, the World Conservation Union (IUCN) and National Oceanic
and Atmospheric Administration (NOAA) have joined in an action program to assist developing
universities, research institutes, government agencies, and the private
countries in planning and implementing an ecosystem-based strategy that is focused on LMEs as
sector. In addition, in order to ensure that the assessment produces a
the principal assessment and management units for coastal ocean resources. The LME concept is
also adopted by GEF that recommends the use of LMEs and their contributing freshwater basins
truly regional perspective, the teams should include representatives
as the geographic area for integrating changes in sectoral economic activities.
from each country that shares the region.
iv
REGIONAL ASSESSMENTS
The GIWA is comprised of a logical sequence of four integrated
components. The fi rst stage of the GIWA is called Scaling and is a
Steering Group
process by which the geographic area examined in the assessment is
defi ned and all the transboundary waters within that area are identifi ed.
GIWA Partners
IGOs, NGOs,
Core
Thematic
Once the geographic scale of the assessment has been defi ned, the
Scientific institutions,
Team
Task Teams
private sector, etc
assessment teams conduct a process known as Scoping in which the
66 Regional
magnitude of environmental and associated socio-economic impacts
Focal Points
of Freshwater shortage, Pollution, Habitat and community modifi cation,
and Teams
Unsustainable exploitation of fi sh and other living resources, and Global
Figure 2
The organisation of the GIWA project.
change is assessed in order to identify and prioritise the concerns
that require the most urgent intervention. The assessment of these
predefi ned concerns incorporates the best available information and
In total, more than 1 000 experts have contributed to the implementation
the knowledge and experience of the multidisciplinary, multi-national
of the GIWA illustrating that the GIWA is a participatory exercise that
assessment teams formed in each region. Once the priority concerns
relies on regional expertise. This participatory approach is essential
have been identifi ed, the root causes of these concerns are identifi ed
because it instils a sense of local ownership of the project, which
during the third component of the GIWA, Causal chain analysis. The root
ensures the credibility of the fi ndings and moreover, it has created a
causes are determined through a sequential process that identifi es, in
global network of experts and institutions that can collaborate and
turn, the most signifi cant immediate causes followed by the economic
exchange experiences and expertise to help mitigate the continued
sectors that are primarily responsible for the immediate causes and
degradation of the world's aquatic resources.
fi nally, the societal root causes. At each stage in the Causal chain
analysis, the most signifi cant contributors are identifi ed through an
analysis of the best available information which is augmented by the
expertise of the assessment team. The fi nal component of the GIWA is
GIWA Regional reports
the development of Policy options that focus on mitigating the impacts
of the root causes identifi ed by the Causal chain analysis.
The GIWA was established in response to growing concern among the
general public regarding the quality of the world's aquatic resources
The results of the GIWA assessment in each region are reported in
and the recognition of governments and the international community
regional reports that are published by UNEP. These reports are designed
concerning the absence of a globally coherent international waters
to provide a brief physical and socio-economic description of the
assessment. However, because a holistic, region-by-region, assessment
most important features of the region against which the results of the
of the condition of the world's transboundary water resources had never
assessment can be cast. The remaining sections of the report present
been undertaken, a methodology guiding the implementation of such
the results of each stage of the assessment in an easily digestible form.
an assessment did not exist. Therefore, in order to implement the GIWA,
Each regional report is reviewed by at least two independent external
a new methodology that adopted a multidisciplinary, multi-sectoral,
reviewers in order to ensure the scientifi c validity and applicability of
multi-national approach was developed and is now available for the
each report. The 66 regional assessments of the GIWA will serve UNEP
implementation of future international assessments of aquatic resources.
as an essential complement to the UNEP Water Policy and Strategy and
UNEP's activities in the hydrosphere.
UNEP Water Policy and Strategy
The primary goals of the UNEP water policy and strategy are:
(a) Achieving greater global understanding of freshwater, coastal and marine environments by
Global International Waters Assessment
conducting environmental assessments in priority areas;
(b) Raising awareness of the importance and consequences of unsustainable water use;
(c) Supporting the efforts of Governments in the preparation and implementation of integrated
management of freshwater systems and their related coastal and marine environments;
(d) Providing support for the preparation of integrated management plans and programmes for
aquatic environmental hot spots, based on the assessment results;
(e) Promoting the application by stakeholders of precautionary, preventive and anticipatory
approaches.
GLOBAL INTERNATIONAL WATERS ASSESSMENT
v
References:
AMAP (1998). Assessment Report: Arctic Pollution Issues. Arctic
Monitoring and Assessment Programme (AMAP), Oslo, Norway.
Barannik, V., Borysova, O. and Stolberg, F. (2004). The Caspian Sea Region:
Environmental Change. Ambio, 33:45-51.
Brinson, M.M. and Malvßrez, A.I. (2002). Temperate freshwater wetlands:
types, status, and threats. Environmental Conservation, 29:115-133.
Daoji, L. and Daler, D. (2004). Ocean Pollution from Land-based Sources:
East China Sea, China. Ambio, 33:98-106.
FAO (2001). Reykjavik conference on responsible fi sheries in the marine
ecosystem. Iceland, 1-4 October 2001.
IOC (2002). IOC-IUCN-NOAA Consultative Meeting on Large Marine
Ecosystems (LMEs). Fourth Session, 8-9 January 2002, Paris,
France.
IPCC (2001). Climate Change 2001: The Scientifi c Basis. Contribution
of Working Group I to the Third Assessment Report of the
Intergovernmental Panel on Climate Change. In: Houghton,
J.T., Ding, Y., Griggs, D.J., Noguer, M., van der Linden, P.J., Dai, X.,
Maskell, K. and Johnson, C.A. (eds). Cambridge University Press,
Cambridge, United Kingdom and New York, NY, USA.
Kennish, M.J. (2002). Environmental threats and environmental future of
estuaries. Environmental Conservation, 29:78-107.
Myers, R.A. and Worm, B. (2003). Rapid worldwide depletion of predatory
fi sh communities. Nature, 423:280-283.
Primavera, J.H. (1997) Socio-economic impacts of shrimp culture.
Aquaculture Research, 28:815-827.
Sherman, K. (1994). Sustainability, biomass yields, and health of coastal
ecosystems: an ecological perspective. Marine Ecology Progress
Series, 112:277-301.
United Nations conference on the human environment (1972). Report
available on-line at http://www.unep.org
United Nations Millennium Declaration (2000). The Millennium
Assembly of the United Nations, New York.
WHO-UNICEF (2002). Global Water Supply and Sanitation Assessment:
2000 Report.
WSSD (2002). World Summit on Sustainable Development.
Johannesburg Summit 2002. Key Outcomes of the Summit,
UN Department of Public Information, New York.
vi
REGIONAL ASSESSMENTS
The GIWA methodology
The specifi c objectives of the GIWA were to conduct a holistic and globally
The assessment integrates environmental and socio-economic data
comparable assessment of the world's transboundary aquatic resources
from each country in the region to determine the severity of the
that incorporated both environmental and socio-economic factors
impacts of each of the fi ve concerns and their constituent issues on
and recognised the inextricable links between freshwater and marine
the entire region. The integration of this information was facilitated by
environments, in order to enable the GEF to focus their resources and to
implementing the assessment during two participatory workshops
provide guidance and advice to governments and decision makers. The
that typically involved 10 to 15 environmental and socio-economic
coalition of all these elements into a single coherent methodology that
experts from each country in the region. During these workshops, the
produces an assessment that achieves each of these objectives had not
regional teams performed preliminary analyses based on the collective
previously been done and posed a signifi cant challenge.
knowledge and experience of these local experts. The results of these
analyses were substantiated with the best available information to be
The integration of each of these elements into the GIWA methodology
presented in a regional report.
was achieved through an iterative process guided by a specially
Table 1 Pre-defi ned GIWA concerns and their constituent issues
convened Methods task team that was comprised of a number of
addressed within the assessment.
international assessment and water experts. Before the fi nal version
of the methodology was adopted, preliminary versions underwent
Environmental issues
Major concerns
an extensive external peer review and were subjected to preliminary
1. Modification of stream flow
testing in selected regions. Advice obtained from the Methods task
2. Pollution of existing supplies
I Freshwater shortage
3. Changes in the water table
team and other international experts and the lessons learnt from
preliminary testing were incorporated into the fi nal version that was
4. Microbiological
5. Eutrophication
used to conduct each of the GIWA regional assessments.
6. Chemical
7. Suspended
solids
II Pollution
8. Solid
wastes
Considering the enormous diff erences between regions in terms of the
9. Thermal
10. Radionuclide
quality, quantity and availability of data, socio-economic setting and
11. Spills
environmental conditions, the achievement of global comparability
12. Loss of ecosystems
required an innovative approach. This was facilitated by focusing
III Habitat and community
13. Modification of ecosystems or ecotones, including community
modification
structure and/or species composition
the assessment on the impacts of fi ve pre-defi ned concerns namely;
Freshwater shortage, Pollution, Habitat and community modifi cation,
14. Overexploitation
15. Excessive by-catch and discards
IV Unsustainable
Unsustainable exploitation of fi sh and other living resources and Global
16. Destructive fishing practices
exploitation of fish and
change, in transboundary waters. Considering the diverse range of
17. Decreased viability of stock through pollution and disease
other living resources
18. Impact on biological and genetic diversity
elements encompassed by each concern, assessing the magnitude of
19. Changes in hydrological cycle
the impacts caused by these concerns was facilitated by evaluating the
20. Sea level change
V Global change
impacts of 22 specifi c issues that were grouped within these concerns
21. Increased uv-b radiation as a result of ozone depletion
22. Changes in ocean CO source/sink function
(see Table 1).
2
THE GIWA METHODOLOGY
vii

political boundaries but were instead, generally defi ned by a large but
T
r
ansboundar
The GIWA approach
discrete drainage basin that also included the coastal marine waters into
which the basin discharges. In many cases, the marine areas examined
1
Scaling
st
W
orkshop
Detailed
during the assessment coincided with the Large Marine Ecosystems
y
D
(LMEs) defi ned by the US National Atmospheric and Oceanographic
iagnostic
A
ssessment
Scoping
Administration (NOAA). As a consequence, scaling should be a
relatively straight-forward task that involves the inspection of the
Analy
boundaries that were proposed for the region during the preparatory
Causal Chain
2
sis
nd
Analysis
phase of GIWA to ensure that they are appropriate and that there are
W
orkshop
no important overlaps or gaps with neighbouring regions. When the
Policy Option
proposed boundaries were found to be inadequate, the boundaries of
Analysis
the region were revised according to the recommendations of experts
from both within the region and from adjacent regions so as to ensure
that any changes did not result in the exclusion of areas from the GIWA.
Once the regional boundary was defi ned, regional teams identifi ed all
SAP
the transboundary elements of the aquatic environment within the
SAP
region and determined if these elements could be assessed as a single
Figure 1
Illustration of the relationship between the GIWA
coherent aquatic system or if there were two or more independent
approach and other projects implemented within the
systems that should be assessed separately.
GEF International Waters (IW) portfolio.
The GIWA is a logical contiguous process that defi nes the geographic
Scoping Ł Assessing the GIWA concerns
region to be assessed, identifi es and prioritises particularly problems
Scoping is an assessment of the severity of environmental and socio-
based on the magnitude of their impacts on the environment and
economic impacts caused by each of the fi ve pre-defi ned GIWA concerns
human societies in the region, determines the root causes of those
and their constituent issues (Table 1). It is not designed to provide an
problems and, fi nally, assesses various policy options that addresses
exhaustive review of water-related problems that exist within each region,
those root causes in order to reverse negative trends in the condition
but rather it is a mechanism to identify the most urgent problems in the
of the aquatic environment. These four steps, referred to as Scaling,
region and prioritise those for remedial actions. The priorities determined
Scoping, Causal chain analysis and Policy options analysis, are
by Scoping are therefore one of the main outputs of the GIWA project.
summarised below and are described in their entirety in two volumes:
GIWA Methodology Stage 1: Scaling and Scoping; and GIWA Methodology:
Focusing the assessment on pre-defi ned concerns and issues ensured
Detailed Assessment, Causal Chain Analysis and Policy Options Analysis.
the comparability of the results between diff erent regions. In addition, to
Generally, the components of the GIWA methodology are aligned
ensure the long-term applicability of the options that are developed to
with the framework adopted by the GEF for Transboundary Diagnostic
mitigate these problems, Scoping not only assesses the current impacts
Analyses (TDAs) and Strategic Action Programmes (SAPs) (Figure 1) and
of these concerns and issues but also the probable future impacts
assume a broad spectrum of transboundary infl uences in addition to
according to the "most likely scenario" which considered demographic,
those associated with the physical movement of water across national
economic, technological and other relevant changes that will potentially
borders.
infl uence the aquatic environment within the region by 2020.
Scaling Ł Defining the geographic extent
The magnitude of the impacts caused by each issue on the
of the region
environment and socio-economic indicators was assessed over the
Scaling is the fi rst stage of the assessment and is the process by which
entire region using the best available information from a wide range of
the geographic scale of the assessment is defi ned. In order to facilitate
sources and the knowledge and experience of the each of the experts
the implementation of the GIWA, the globe was divided during the
comprising the regional team. In order to enhance the comparability
design phase of the project into 66 contiguous regions. Considering the
of the assessment between diff erent regions and remove biases
transboundary nature of many aquatic resources and the transboundary
in the assessment caused by diff erent perceptions of and ways to
focus of the GIWA, the boundaries of the regions did not comply with
communicate the severity of impacts caused by particular issues, the
viii
REGIONAL ASSESSMENTS
results were distilled and reported as standardised scores according to
Table 2
Example of environmental impact assessment of
Freshwater shortage.
the following four point scale:
Weight
0 = no known impact
Environmental
Environmental issues
Score
Weight %
averaged
concerns
1 = slight impact
score
2
=
moderate
impact
1. Modification of stream flow
1
20
Freshwater shortage
1.50
3 = severe impact
2. Pollution of existing supplies
2
50
The attributes of each score for each issue were described by a detailed
3. Changes in the water table
1
30
set of pre-defi ned criteria that were used to guide experts in reporting
Table 3
Example of Health impacts assessment linked to one of
the results of the assessment. For example, the criterion for assigning
the GIWA concerns.
a score of 3 to the issue Loss of ecosystems or ecotones is: "Permanent
Criteria for Health impacts
Raw score
Score
Weight %
destruction of at least one habitat is occurring such as to have reduced their
Very small
Very large
surface area by >30% during the last 2-3 decades". The full list of criteria is
Number of people affected
2
50
0 1 2 3
presented at the end of the chapter, Table 5a-e. Although the scoring
Minimum
Severe
Degree of severity
2
30
0 1 2 3
inevitably includes an arbitrary component, the use of predefi ned
Occasion/Short
Continuous
Frequency/Duration
2
20
0 1 2 3
criteria facilitates comparison of impacts on a global scale and also
Weight average score for Health impacts
2
encouraged consensus of opinion among experts.
The trade-off associated with assessing the impacts of each concern
After all 22 issues and associated socio-economic impacts have
and their constituent issues at the scale of the entire region is that spatial
been scored, weighted and averaged, the magnitude of likely future
resolution was sometimes low. Although the assessment provides a
changes in the environmental and socio-economic impacts of each
score indicating the severity of impacts of a particular issue or concern
of the fi ve concerns on the entire region is assessed according to the
on the entire region, it does not mean that the entire region suff ers
most likely scenario which describes the demographic, economic,
the impacts of that problem. For example, eutrophication could be
technological and other relevant changes that might infl uence the
identifi ed as a severe problem in a region, but this does not imply that all
aquatic environment within the region by 2020.
waters in the region suff er from severe eutrophication. It simply means
that when the degree of eutrophication, the size of the area aff ected,
In order to prioritise among GIWA concerns within the region and
the socio-economic impacts and the number of people aff ected is
identify those that will be subjected to causal chain and policy options
considered, the magnitude of the overall impacts meets the criteria
analysis in the subsequent stages of the GIWA, the present and future
defi ning a severe problem and that a regional action should be initiated
scores of the environmental and socio-economic impacts of each
in order to mitigate the impacts of the problem.
concern are tabulated and an overall score calculated. In the example
presented in Table 4, the scoping assessment indicated that concern III,
When each issue has been scored, it was weighted according to the relative
Habitat and community modifi cation, was the priority concern in this
contribution it made to the overall environmental impacts of the concern
region. The outcome of this mathematic process was reconciled against
and a weighted average score for each of the fi ve concerns was calculated
the knowledge of experts and the best available information in order
(Table 2). Of course, if each issue was deemed to make equal contributions,
to ensure the validity of the conclusion.
then the score describing the overall impacts of the concern was simply the
arithmetic mean of the scores allocated to each issue within the concern.
In some cases however, this process and the subsequent participatory
In addition, the socio-economic impacts of each of the fi ve major
discussion did not yield consensus among the regional experts
concerns were assessed for the entire region. The socio-economic
regarding the ranking of priorities. As a consequence, further analysis
impacts were grouped into three categories; Economic impacts,
was required. In such cases, expert teams continued by assessing the
Health impacts and Other social and community impacts (Table 3). For
relative importance of present and potential future impacts and assign
each category, an evaluation of the size, degree and frequency of the
weights to each. Afterwards, the teams assign weights indicating the
impact was performed and, once completed, a weighted average score
relative contribution made by environmental and socio-economic
describing the overall socio-economic impacts of each concern was
factors to the overall impacts of the concern. The weighted average
calculated in the same manner as the overall environmental score.
score for each concern is then recalculated taking into account
THE GIWA METHODOLOGY
ix
Table 4
Example of comparative environmental and socio-economic impacts of each major concern, presently and likely in year 2020.
Types of impacts
Environmental score
Economic score
Human health score
Social and community score
Concern
Overall score
Present (a)
Future (b)
Present (c)
Future (d)
Present (e)
Future (f)
Present (g)
Future (h)
Freshwater shortage
1.3
2.3
2.7
2.8
2.6
3.0
1.8
2.2
2.3
Pollution
1.5
2.0
2.0
2.3
1.8
2.3
2.0
2.3
2.0
Habitat and community
2.0
3.0
2.4
3.0
2.4
2.8
2.3
2.7
2.6
modification
Unsustainable exploitation of fish
1.8
2.2
2.0
2.1
2.0
2.1
2.4
2.5
2.1
and other living resources
Global change
0.8
1.0
1.5
1.7
1.5
1.5
1.0
1.0
1.2
the relative contributions of both present and future impacts and
should be regarded as a framework to guide the analysis, rather than
environmental and socio-economic factors. The outcome of these
as a set of detailed instructions. Secondly, in an ideal setting, a causal
additional analyses was subjected to further discussion to identify
chain would be produced by a multidisciplinary group of specialists
overall priorities for the region.
that would statistically examine each successive cause and study its
links to the problem and to other causes. However, this approach (even
Finally, the assessment recognises that each of the fi ve GIWA concerns
if feasible) would use far more resources and time than those available
are not discrete but often interact. For example, pollution can destroy
to GIWA1. For this reason, it has been necessary to develop a relatively
aquatic habitats that are essential for fi sh reproduction which, in turn,
simple and practical analytical model for gathering information to
can cause declines in fi sh stocks and subsequent overexploitation. Once
assemble meaningful causal chains.
teams have ranked each of the concerns and determined the priorities
for the region, the links between the concerns are highlighted in order
Conceptual model
to identify places where strategic interventions could be applied to
A causal chain is a series of statements that link the causes of a problem
yield the greatest benefi ts for the environment and human societies
with its eff ects. Recognising the great diversity of local settings and the
in the region.
resulting diffi
culty in developing broadly applicable policy strategies,
the GIWA CCA focuses on a particular system and then only on those
Causal chain analysis
issues that were prioritised during the scoping assessment. The
Causal Chain Analysis (CCA) traces the cause-eff ect pathways from the
starting point of a particular causal chain is one of the issues selected
socio-economic and environmental impacts back to their root causes.
during the Scaling and Scoping stages and its related environmental
The GIWA CCA aims to identify the most important causes of each
and socio-economic impacts. The next element in the GIWA chain is
concern prioritised during the scoping assessment in order to direct
the immediate cause; defi ned as the physical, biological or chemical
policy measures at the most appropriate target in order to prevent
variable that produces the GIWA issue. For example, for the issue of
further degradation of the regional aquatic environment.
eutrophication the immediate causes may be, inter alia:
Enhanced nutrient inputs;
Root causes are not always easy to identify because they are often
Increased
recycling/mobilisation;
spatially or temporally separated from the actual problems they
Trapping of nutrients (e.g. in river impoundments);
cause. The GIWA CCA was developed to help identify and understand
Run-off and stormwaters
the root causes of environmental and socio-economic problems
in international waters and is conducted by identifying the human
Once the relevant immediate cause(s) for the particular system has
activities that cause the problem and then the factors that determine
(have) been identifi ed, the sectors of human activity that contribute
the ways in which these activities are undertaken. However, because
most signifi cantly to the immediate cause have to be determined.
there is no universal theory describing how root causes interact to
Assuming that the most important immediate cause in our example
create natural resource management problems and due to the great
had been increased nutrient concentrations, then it is logical that the
variation of local circumstances under which the methodology will
most likely sources of those nutrients would be the agricultural, urban
be applied, the GIWA CCA is not a rigidly structured assessment but
or industrial sectors. After identifying the sectors that are primarily
1 This does not mean that the methodology ignores statistical or quantitative studies; as has already been pointed out, the available evidence that justifies the assumption of causal links should
be provided in the assessment.
x
REGIONAL ASSESSMENTS
responsible for the immediate causes, the root causes acting on those
The policy options recommended by the GIWA are only contributions
sectors must be determined. For example, if agriculture was found to
to the larger policy process and, as such, the GIWA methodology
be primarily responsible for the increased nutrient concentrations, the
developed to test the performance of various options under the
root causes could potentially be:
diff erent circumstances has been kept simple and broadly applicable.
Economic (e.g. subsidies to fertilisers and agricultural products);
Legal (e.g. inadequate regulation);
Global International Waters Assessment
Failures in governance (e.g. poor enforcement); or
Technology or knowledge related (e.g. lack of aff ordable substitutes
for fertilisers or lack of knowledge as to their application).
Once the most relevant root causes have been identifi ed, an
explanation, which includes available data and information, of how
they are responsible for the primary environmental and socio-economic
problems in the region should be provided.
Policy option analysis
Despite considerable eff ort of many Governments and other
organisations to address transboundary water problems, the evidence
indicates that there is still much to be done in this endeavour. An
important characteristic of GIWA's Policy Option Analysis (POA) is that
its recommendations are fi rmly based on a better understanding of
the root causes of the problems. Freshwater scarcity, water pollution,
overexploitation of living resources and habitat destruction are very
complex phenomena. Policy options that are grounded on a better
understanding of these phenomena will contribute to create more
eff ective societal responses to the extremely complex water related
transboundary problems. The core of POA in the assessment consists
of two tasks:
Construct policy options
Policy options are simply diff erent courses of action, which are not
always mutually exclusive, to solve or mitigate environmental and
socio-economic problems in the region. Although a multitude of
diff erent policy options could be constructed to address each root
cause identifi ed in the CCA, only those few policy options that have
the greatest likelihood of success were analysed in the GIWA.
Select and apply the criteria on which the policy options will be
evaluated
Although there are many criteria that could be used to evaluate any
policy option, GIWA focuses on:
Eff ectiveness (certainty of result)
Effi
ciency (maximisation of net benefi ts)
Equity (fairness of distributional impacts)
Practical
criteria
(political
acceptability,
implementation
feasibility).
THE GIWA METHODOLOGY
xi
Table 5a: Scoring criteria for environmental impacts of Freshwater shortage
Issue
Score 0 = no known impact
Score 1 = slight impact
Score 2 = moderate impact
Score 3 = severe impact
Issue 1: Modification
No evidence of modification of stream
There is a measurably changing trend in
Significant downward or upward trend
Annual discharge of a river altered by more
of stream flow
flow.
annual river discharge at gauging stations
(more than 20% of the long term mean) in
than 50% of long term mean; or
"An increase or decrease
in a major river or tributary (basin >
annual discharges in a major river or tributary Loss of >50% of riparian or deltaic
in the discharge of
40 000 km2); or
draining a basin of >250 000 km2; or
wetlands over a period of not less than
streams and rivers
There is a measurable decrease in the area
Loss of >20% of flood plain or deltaic
40 years (through causes other than
as a result of human
of wetlands (other than as a consequence
wetlands through causes other than
conversion or artificial embankment); or
interventions on a local/
of conversion or embankment
conversion or artificial embankments; or
Significant increased siltation or erosion
regional scale (see Issue
construction); or
Significant loss of riparian vegetation (e.g.
due to changing in flow regime (other than
19 for flow alterations
There is a measurable change in the
trees, flood plain vegetation); or
normal fluctuations in flood plain rivers);
resulting from global
interannual mean salinity of estuaries or
Significant saline intrusion into previously
or
change) over the last 3-4
coastal lagoons and/or change in the mean
freshwater rivers or lagoons.
Loss of one or more anadromous or
decades."
position of estuarine salt wedge or mixing
catadromous fish species for reasons
zone; or
other than physical barriers to migration,
Change in the occurrence of exceptional
pollution or overfishing.
discharges (e.g. due to upstream
damming.
Issue 2: Pollution of
No evidence of pollution of surface and
Any monitored water in the region does
Water supplies does not meet WHO or
River draining more than 10% of the basin
existing supplies
ground waters.
not meet WHO or national drinking water
national drinking water standards in more
have suffered polysaprobic conditions, no
"Pollution of surface
criteria, other than for natural reasons; or
than 30% of the region; or
longer support fish, or have suffered severe
and ground fresh waters
There have been reports of one or more
There are one or more reports of fish kills
oxygen depletion
supplies as a result of
fish kills in the system due to pollution
due to pollution in any river draining a
Severe pollution of other sources of
point or diffuse sources"
within the past five years.
basin of >250 000 km2 .
freshwater (e.g. groundwater)
Issue 3: Changes in
No evidence that abstraction of water from Several wells have been deepened because Clear evidence of declining base flow in
Aquifers are suffering salinisation over
the water table
aquifers exceeds natural replenishment.
of excessive aquifer draw-down; or
rivers in semi-arid areas; or
regional scale; or
"Changes in aquifers
Several springs have dried up; or
Loss of plant species in the past decade,
Perennial springs have dried up over
as a direct or indirect
Several wells show some salinisation.
that depend on the presence of ground
regionally significant areas; or
consequence of human
water; or
Some aquifers have become exhausted
activity"
Wells have been deepened over areas of
hundreds of km2;or
Salinisation over significant areas of the
region.
Table 5b: Scoring criteria for environmental impacts of Pollution
Issue
Score 0 = no known impact
Score 1 = slight impact
Score 2 = moderate impact
Score 3 = severe impact
Issue 4:
Normal incidence of bacterial related
There is minor increase in incidence of
Public health authorities aware of marked
There are large closure areas or very
Microbiological
gastroenteric disorders in fisheries product
bacterial related gastroenteric disorders
increase in the incidence of bacterial
restrictive advisories affecting the
pollution
consumers and no fisheries closures or
in fisheries product consumers but no
related gastroenteric disorders in fisheries
marketability of fisheries products; or
"The adverse effects of
advisories.
fisheries closures or advisories.
product consumers; or
There exists widespread public or tourist
microbial constituents of
There are limited area closures or
awareness of hazards resulting in
human sewage released
advisories reducing the exploitation or
major reductions in the exploitation or
to water bodies."
marketability of fisheries products.
marketability of fisheries products.
Issue 5:
No visible effects on the abundance and
Increased abundance of epiphytic algae; or
Increased filamentous algal production
High frequency (>1 event per year), or
Eutrophication
distributions of natural living resource
A statistically significant trend in
resulting in algal mats; or
intensity, or large areas of periodic hypoxic
"Artificially enhanced
distributions in the area; and
decreased water transparency associated
Medium frequency (up to once per year)
conditions, or high frequencies of fish and
primary productivity in
No increased frequency of hypoxia1 or
with algal production as compared with
of large-scale hypoxia and/or fish and
zoobenthos mortality events or harmful
receiving water basins
fish mortality events or harmful algal
long-term (>20 year) data sets; or
zoobenthos mortality events and/or
algal blooms; or
related to the increased
blooms associated with enhanced primary
Measurable shallowing of the depth range
harmful algal blooms.
Significant changes in the littoral
availability or supply
production; and
of macrophytes.
community; or
of nutrients, including
No evidence of periodically reduced
Presence of hydrogen sulphide in
cultural eutrophication
dissolved oxygen or fish and zoobenthos
historically well oxygenated areas.
in lakes."
mortality; and
No evident abnormality in the frequency of
algal blooms.
xii
REGIONAL ASSESSMENTS
Issue 6: Chemical
No known or historical levels of chemical
Some chemical contaminants are
Some chemical contaminants are above
Chemical contaminants are above
pollution
contaminants except background levels of
detectable but below threshold limits
threshold limits defined for the country or
threshold limits defined for the country or
"The adverse effects of
naturally occurring substances; and
defined for the country or region; or
region; or
region; and
chemical contaminants
No fisheries closures or advisories due to
Restricted area advisories regarding
Large area advisories by public health
Public health and public awareness of
released to standing or
chemical pollution; and
chemical contamination of fisheries
authorities concerning fisheries product
fisheries contamination problems with
marine water bodies
No incidence of fisheries product tainting;
products.
contamination but without associated
associated reductions in the marketability
as a result of human
and
catch restrictions or closures; or
of such products either through the
activities. Chemical
No unusual fish mortality events.
If there is no available data use the following
High mortalities of aquatic species near
imposition of limited advisories or by area
contaminants are
criteria:
outfalls.
closures of fisheries; or
here defined as
If there is no available data use the following
Some use of pesticides in small areas; or
Large-scale mortalities of aquatic species.
compounds that are
criteria:
Presence of small sources of dioxins or
If there is no available data use the following
toxic or persistent or
No use of pesticides; and
furans (e.g., small incineration plants or
criteria:
If there is no available data use the following
bioaccumulating."
No sources of dioxins and furans; and
bleached kraft/pulp mills using chlorine);
Large-scale use of pesticides in agriculture
criteria:
No regional use of PCBs; and
or
and forestry; or
Indications of health effects resulting
No bleached kraft pulp mills using chlorine Some previous and existing use of PCBs
Presence of major sources of dioxins or
from use of pesticides; or
bleaching; and
and limited amounts of PCB-containing
furans such as large municipal or industrial Known emissions of dioxins or furans from
No use or sources of other contaminants.
wastes but not in amounts invoking local
incinerators or large bleached kraft pulp
incinerators or chlorine bleaching of pulp;
concerns; or
mills; or
or
Presence of other contaminants.
Considerable quantities of waste PCBs in
Known contamination of the environment
the area with inadequate regulation or has
or foodstuffs by PCBs; or
invoked some public concerns; or
Known contamination of the environment
Presence of considerable quantities of
or foodstuffs by other contaminants.
other contaminants.
Issue 7: Suspended
No visible reduction in water transparency; Evidently increased or reduced turbidity
Markedly increased or reduced turbidity
Major changes in turbidity over wide or
solids
and
in streams and/or receiving riverine and
in small areas of streams and/or receiving
ecologically significant areas resulting
"The adverse effects of
No evidence of turbidity plumes or
marine environments but without major
riverine and marine environments; or
in markedly changed biodiversity or
modified rates of release
increased siltation; and
changes in associated sedimentation or
Extensive evidence of changes in
mortality in benthic species due to
of suspended particulate No evidence of progressive riverbank,
erosion rates, mortality or diversity of flora
sedimentation or erosion rates; or
excessive sedimentation with or without
matter to water bodies
beach, other coastal or deltaic erosion.
and fauna; or
Changes in benthic or pelagic biodiversity
concomitant changes in the nature of
resulting from human
Some evidence of changes in benthic or
in areas due to sediment blanketing or
deposited sediments (i.e., grain-size
activities"
pelagic biodiversity in some areas due
increased turbidity.
composition/redox); or
to sediment blanketing or increased
Major change in pelagic biodiversity or
turbidity.
mortality due to excessive turbidity.
Issue 8: Solid wastes
No noticeable interference with trawling
Some evidence of marine-derived litter on
Widespread litter on beaches giving rise to
Incidence of litter on beaches sufficient
"Adverse effects
activities; and
beaches; or
public concerns regarding the recreational
to deter the public from recreational
associated with the
No noticeable interference with the
Occasional recovery of solid wastes
use of beaches; or
activities; or
introduction of solid
recreational use of beaches due to litter;
through trawling activities; but
High frequencies of benthic litter recovery
Trawling activities untenable because of
waste materials into
and
Without noticeable interference with
and interference with trawling activities;
benthic litter and gear entanglement; or
water bodies or their
No reported entanglement of aquatic
trawling and recreational activities in
or
Widespread entanglement and/or
environs."
organisms with debris.
coastal areas.
Frequent reports of entanglement/
suffocation of aquatic species by litter.
suffocation of species by litter.
Issue 9: Thermal
No thermal discharges or evidence of
Presence of thermal discharges but
Presence of thermal discharges with large
Presence of thermal discharges with large
"The adverse effects
thermal effluent effects.
without noticeable effects beyond
mixing zones having reduced productivity
mixing zones with associated mortalities,
of the release of
the mixing zone and no significant
or altered biodiversity; or
substantially reduced productivity or
aqueous effluents at
interference with migration of species.
Evidence of reduced migration of species
noticeable changes in biodiversity; or
temperatures exceeding
due to thermal plume.
Marked reduction in the migration of
ambient temperature
species due to thermal plumes.
in the receiving water
body."
Issue 10: Radionuclide No radionuclide discharges or nuclear
Minor releases or fallout of radionuclides
Minor releases or fallout of radionuclides
Substantial releases or fallout of
"The adverse effects of
activities in the region.
but with well regulated or well-managed
under poorly regulated conditions that do
radionuclides resulting in excessive
the release of radioactive
conditions complying with the Basic Safety
not provide an adequate basis for public
exposures to humans or animals in relation
contaminants and
Standards.
health assurance or the protection of
to those recommended under the Basic
wastes into the aquatic
aquatic organisms but without situations
Safety Standards; or
environment from
or levels likely to warrant large scale
Some indication of situations or exposures
human activities."
intervention by a national or international
warranting intervention by a national or
authority.
international authority.
Issue 11: Spills
No evidence of present or previous spills of
Some evidence of minor spills of hazardous Evidence of widespread contamination
Widespread contamination by hazardous
"The adverse effects
hazardous material; or
materials in small areas with insignificant
by hazardous or aesthetically displeasing
or aesthetically displeasing materials
of accidental episodic
No evidence of increased aquatic or avian
small-scale adverse effects one aquatic or
materials assumed to be from spillage
from frequent spills resulting in major
releases of contaminants
species mortality due to spills.
avian species.
(e.g. oil slicks) but with limited evidence of
interference with aquatic resource
and materials to the
widespread adverse effects on resources or
exploitation or coastal recreational
aquatic environment
amenities; or
amenities; or
as a result of human
Some evidence of aquatic or avian species
Significant mortality of aquatic or avian
activities."
mortality through increased presence of
species as evidenced by large numbers of
contaminated or poisoned carcasses on
contaminated carcasses on beaches.
beaches.
THE GIWA METHODOLOGY
xiii
Table 5c: Scoring criteria for environmental impacts of Habitat and community modification
Issue
Score 0 = no known impact
Score 1 = slight impact
Score 2 = moderate impact
Score 3 = severe impact
Issue 12: Loss of ecosystems or
There is no evidence of loss of
There are indications of fragmentation Permanent destruction of at least one
Permanent destruction of at least one
ecotones
ecosystems or habitats.
of at least one of the habitats.
habitat is occurring such as to have
habitat is occurring such as to have
"The complete destruction of aquatic
reduced their surface area by up to 30
reduced their surface area by >30%
habitats. For the purpose of GIWA
% during the last 2-3 decades.
during the last 2-3 decades.
methodology, recent loss will be
measured as a loss of pre-defined
habitats over the last 2-3 decades."
Issue 13: Modification of
No evidence of change in species
Evidence of change in species
Evidence of change in species
Evidence of change in species
ecosystems or ecotones, including
complement due to species extinction
complement due to species extinction
complement due to species extinction
complement due to species extinction
community structure and/or species
or introduction; and
or introduction
or introduction; and
or introduction; and
composition
No changing in ecosystem function
Evidence of change in population
Evidence of change in population
"Modification of pre-defined habitats
and services.
structure or change in functional group
structure or change in functional group
in terms of extinction of native species,
composition or structure
composition or structure; and
occurrence of introduced species and
Evidence of change in ecosystem
changing in ecosystem function and
services2.
services over the last 2-3 decades."
2 Constanza, R. et al. (1997). The value of the world ecosystem services and natural capital, Nature 387:253-260.
Table 5d: Scoring criteria for environmental impacts of Unsustainable exploitation of fish and other
living resources
Issue
Score 0 = no known impact
Score 1 = slight impact
Score 2 = moderate impact
Score 3 = severe impact
Issue 14: Overexploitation
No harvesting exists catching fish
Commercial harvesting exists but there One stock is exploited beyond MSY
More than one stock is exploited
"The capture of fish, shellfish or marine
(with commercial gear for sale or
is no evidence of over-exploitation.
(maximum sustainable yield) or is
beyond MSY or is outside safe
invertebrates at a level that exceeds the
subsistence).
outside safe biological limits.
biological limits.
maximum sustainable yield of the stock."
Issue 15: Excessive by-catch and
Current harvesting practices show no
Up to 30% of the fisheries yield (by
30-60% of the fisheries yield consists
Over 60% of the fisheries yield is
discards
evidence of excessive by-catch and/or
weight) consists of by-catch and/or
of by-catch and/or discards.
by-catch and/or discards; or
"By-catch refers to the incidental capture
discards.
discards.
Noticeable incidence of capture of
of fish or other animals that are not the
endangered species.
target of the fisheries. Discards refers
to dead fish or other animals that are
returned to the sea."
Issue 16: Destructive fishing
No evidence of habitat destruction due Habitat destruction resulting in
Habitat destruction resulting in
Habitat destruction resulting in
practices
to fisheries practices.
changes in distribution of fish or
moderate reduction of stocks or
complete collapse of a stock or far
"Fishing practices that are deemed to
shellfish stocks; or
moderate changes of the environment;
reaching changes in the environment;
produce significant harm to marine,
Trawling of any one area of the seabed
or
or
lacustrine or coastal habitats and
is occurring less than once per year.
Trawling of any one area of the seabed
Trawling of any one area of the seabed
communities."
is occurring 1-10 times per year; or
is occurring more than 10 times per
Incidental use of explosives or poisons
year; or
for fishing.
Widespread use of explosives or
poisons for fishing.
Issue 17: Decreased viability of
No evidence of increased incidence of
Increased reports of diseases without
Declining populations of one or more
Collapse of stocks as a result of
stocks through contamination and
fish or shellfish diseases.
major impacts on the stock.
species as a result of diseases or
diseases or contamination.
disease
contamination.
"Contamination or diseases of feral (wild)
stocks of fish or invertebrates that are a
direct or indirect consequence of human
action."
Issue 18: Impact on biological and
No evidence of deliberate or accidental Alien species introduced intentionally
Measurable decline in the population
Extinction of native species or local
genetic diversity
introductions of alien species; and
or accidentally without major changes
of native species or local stocks as a
stocks as a result of introductions
"Changes in genetic and species diversity No evidence of deliberate or accidental
in the community structure; or
result of introductions (intentional or
(intentional or accidental); or
of aquatic environments resulting from
introductions of alien stocks; and
Alien stocks introduced intentionally
accidental); or
Major changes (>20%) in the genetic
the introduction of alien or genetically
No evidence of deliberate or accidental
or accidentally without major changes
Some changes in the genetic
composition of stocks (e.g. as a result
modified species as an intentional or
introductions of genetically modified
in the community structure; or
composition of stocks (e.g. as a result
of escapes from aquaculture replacing
unintentional result of human activities
species.
Genetically modified species
of escapes from aquaculture replacing
the wild stock).
including aquaculture and restocking."
introduced intentionally or
the wild stock).
accidentally without major changes in
the community structure.
xiv
REGIONAL ASSESSMENTS
Table 5e: Scoring criteria for environmental impacts of Global change
Issue
Score 0 = no known impact
Score 1 = slight impact
Score 2 = moderate impact
Score 3 = severe impact
Issue 19: Changes in hydrological
No evidence of changes in hydrological Change in hydrological cycles due
Significant trend in changing
Loss of an entire habitat through
cycle and ocean circulation
cycle and ocean/coastal current due to
to global change causing changes
terrestrial or sea ice cover (by
desiccation or submergence as a result
"Changes in the local/regional water
global change.
in the distribution and density of
comparison with a long-term time
of global change; or
balance and changes in ocean and coastal
riparian terrestrial or aquatic plants
series) without major downstream
Change in the tree or lichen lines; or
circulation or current regime over the
without influencing overall levels of
effects on river/ocean circulation or
Major impacts on habitats or
last 2-3 decades arising from the wider
productivity; or
biological diversity; or
biodiversity as the result of increasing
problem of global change including
Some evidence of changes in ocean
Extreme events such as flood and
frequency of extreme events; or
ENSO."
or coastal currents due to global
drought are increasing; or
Changing in ocean or coastal currents
change but without a strong effect on
Aquatic productivity has been altered
or upwelling regimes such that plant
ecosystem diversity or productivity.
as a result of global phenomena such
or animal populations are unable to
as ENSO events.
recover to their historical or stable
levels; or
Significant changes in thermohaline
circulation.
Issue 20: Sea level change
No evidence of sea level change.
Some evidences of sea level change
Changed pattern of coastal erosion due Major loss of coastal land areas due to
"Changes in the last 2-3 decades in the
without major loss of populations of
to sea level rise has became evident; or
sea-level change or sea-level induced
annual/seasonal mean sea level as a
organisms.
Increase in coastal flooding events
erosion; or
result of global change."
partly attributed to sea-level rise
Major loss of coastal or intertidal
or changing prevailing atmospheric
populations due to sea-level change or
forcing such as atmospheric pressure
sea level induced erosion.
or wind field (other than storm
surges).
Issue 21: Increased UV-B radiation as No evidence of increasing effects
Some measurable effects of UV/B
Aquatic community structure is
Measured/assessed effects of UV/B
a result of ozone depletion
of UV/B radiation on marine or
radiation on behavior or appearance of
measurably altered as a consequence
irradiation are leading to massive loss
"Increased UV-B flux as a result polar
freshwater organisms.
some aquatic species without affecting
of UV/B radiation; or
of aquatic communities or a significant
ozone depletion over the last 2-3
the viability of the population.
One or more aquatic populations are
change in biological diversity.
decades."
declining.
Issue 22: Changes in ocean CO
No measurable or assessed changes
Some reasonable suspicions that
Some evidences that the impacts
Evidences that the changes in
2
source/sink function
in CO source/sink function of aquatic
current global change is impacting the
of global change have altered the
source/sink function of the aquatic
2
"Changes in the capacity of aquatic
system.
aquatic system sufficiently to alter its
source/sink function for CO of aquatic
systems in the region are sufficient to
2
systems, ocean as well as freshwater, to
source/sink function for CO .
systems in the region by at least 10%.
cause measurable change in global CO
2
2
generate or absorb atmospheric CO as a
balance.
2
direct or indirect consequence of global
change over the last 2-3 decades."
THE GIWA METHODOLOGY
xv