Global International
Waters Assessment
Regional assessments
Global International
Waters Assessment
Regional assessment 55
Mekong River
GIWA report production
Series editor: Ulla Li Zweifel
Editorial assistance: Matthew Fortnam,
Russell Arthurton, Kristin Bertilius
Maps & GIS: Rasmus Göransson
Design & graphics: Joakim Palmqvist
Global International Waters Assessment
Mekong River, GIWA Regional assessment 55
Published by the University of Kalmar on behalf of
United Nations Environment Programme
© 2006 United Nations Environment Programme
ISSN 1651-940X
United Nations Environment Programme
PO Box 30552,
Nairobi, Kenya
This publication may be reproduced in whole or in part and
in any form for educational or non-profi t purposes without
special permission from the copyright holder, provided
acknowledgement of the source is made. No use of this
publication may be made for resale or for any other commercial
purpose whatsoever without prior permission in writing from the
United Nations Environment Programme.
CITATIONS
When citing this report, please use:
UNEP, 2006. Snidvongs, A. and S-K. Teng. Mekong River, GIWA
Regional assessment 55. University of Kalmar, Kalmar, Sweden.
DISCLAIMER
The views expressed in this publication are those of the authors
and do not necessarily refl ect those of UNEP. The designations
employed and the presentations do not imply the expressions
of any opinion whatsoever on the part of UNEP or cooperating
agencies concerning the legal status of any country, territory,
city or areas or its authority, or concerning the delimitation of its
frontiers or boundaries.
This publication has been peer-reviewed and the information
herein is believed to be reliable, but the publisher does not
warrant its completeness or accuracy.
Publishing house: Kirjastusaktsiaselts MATS, Tallinn
Printed in Estonia by Tallinna Raamatutrükikoda, 2006
Contents
Preface 9
Executive summary
11
Acknowledgements 14
Abbreviations and acronyms
15
Regional defi nition
16
Boundaries of the Mekong River region
16
Physical characteristics
17
Socio-economic characteristics
22
Assessment 27
Freshwater shortage
27
Pollution
30
Habitat and community modifi cation
32
Unsustainable exploitation of fi sh and other living resources
34
Global change
36
Priority GIWA concerns/issues and their transboundary implications
36
Causal chain analysis
38
Policy relevant conclusions
41
References 43
Annexes 46
Annex I List of contributing authors and organisations
46
Annex II Detailed scoring tables
47
Annex III Functions and activities of the regional institutions and agencies involved in addressing and managing
water-related environmental issues and problems in the GIWA Mekong River region
49
Annex IV List of conventions and specifi c laws that aff ect water use in the GIWA Mekong River region
52
Annex V Impact Assessment for GIWA Mekong River region:
54
Annex VI Alien species introduced to the Mekong River Basin
56
The Global International Waters Assessment
i
The GIWA methodology
vii
CONTENTS
List of figures
Figure 1
Boundaries of the Mekong River region . . . . . . . . . . . . . . . . . . . . . . . . . . . . . . . . . . . . . . . . . . . . . . . . . . . . . . . . . . . . . . . . . . . . . . . . . . . . . . . . . . . . . . . . . . . . . . . . . . . . . . . . . . . . . . . . . . . . . . . . 16
Figure 2
Major watersheds in the Lower Mekong River region . . . . . . . . . . . . . . . . . . . . . . . . . . . . . . . . . . . . . . . . . . . . . . . . . . . . . . . . . . . . . . . . . . . . . . . . . . . . . . . . . . . . . . . . . . . . . . . . . . . . . . . . . . . 17
Figure 3
Bio-geographical zones of the Mekong River region . . . . . . . . . . . . . . . . . . . . . . . . . . . . . . . . . . . . . . . . . . . . . . . . . . . . . . . . . . . . . . . . . . . . . . . . . . . . . . . . . . . . . . . . . . . . . . . . . . . . . . . . . . . . 17
Figure 4
Precipitation in the Mekong River region . . . . . . . . . . . . . . . . . . . . . . . . . . . . . . . . . . . . . . . . . . . . . . . . . . . . . . . . . . . . . . . . . . . . . . . . . . . . . . . . . . . . . . . . . . . . . . . . . . . . . . . . . . . . . . . . . . . . . . 20
Figure 5
Mekong Giant catfish. . . . . . . . . . . . . . . . . . . . . . . . . . . . . . . . . . . . . . . . . . . . . . . . . . . . . . . . . . . . . . . . . . . . . . . . . . . . . . . . . . . . . . . . . . . . . . . . . . . . . . . . . . . . . . . . . . . . . . . . . . . . . . . . . . . . . . . . . . . 21
Figure 6
Land cover in the Mekong River region . . . . . . . . . . . . . . . . . . . . . . . . . . . . . . . . . . . . . . . . . . . . . . . . . . . . . . . . . . . . . . . . . . . . . . . . . . . . . . . . . . . . . . . . . . . . . . . . . . . . . . . . . . . . . . . . . . . . . . . . 22
Figure 7
Population density in the Mekong River region.. . . . . . . . . . . . . . . . . . . . . . . . . . . . . . . . . . . . . . . . . . . . . . . . . . . . . . . . . . . . . . . . . . . . . . . . . . . . . . . . . . . . . . . . . . . . . . . . . . . . . . . . . . . . . . . . 23
Figure 8
Location and elevation of the existing and proposed dams in Lancang River . . . . . . . . . . . . . . . . . . . . . . . . . . . . . . . . . . . . . . . . . . . . . . . . . . . . . . . . . . . . . . . . . . . . . . . . . . . . . . . . . . 23
Figure 9
Location of the completed hydro-dams along the Mekong River region . . . . . . . . . . . . . . . . . . . . . . . . . . . . . . . . . . . . . . . . . . . . . . . . . . . . . . . . . . . . . . . . . . . . . . . . . . . . . . . . . . . . . . . 24
Figure 10
Extent of flooding in Cambodia and Mekong Delta . . . . . . . . . . . . . . . . . . . . . . . . . . . . . . . . . . . . . . . . . . . . . . . . . . . . . . . . . . . . . . . . . . . . . . . . . . . . . . . . . . . . . . . . . . . . . . . . . . . . . . . . . . . . 29
Figure 11
Network diagram showing the interrelationships between the five GIWA concerns . . . . . . . . . . . . . . . . . . . . . . . . . . . . . . . . . . . . . . . . . . . . . . . . . . . . . . . . . . . . . . . . . . . . . . . . . . . . 37
List of tables
Table 1
Areas of the major watersheds in the Mekong River region. . . . . . . . . . . . . . . . . . . . . . . . . . . . . . . . . . . . . . . . . . . . . . . . . . . . . . . . . . . . . . . . . . . . . . . . . . . . . . . . . . . . . . . . . . . . . . . . . . . . . . 17
Table 2
General statistics relating to the Mekong River Basin . . . . . . . . . . . . . . . . . . . . . . . . . . . . . . . . . . . . . . . . . . . . . . . . . . . . . . . . . . . . . . . . . . . . . . . . . . . . . . . . . . . . . . . . . . . . . . . . . . . . . . . . . . 18
Table 3
Key characteristics of the various bio-geographical zones . . . . . . . . . . . . . . . . . . . . . . . . . . . . . . . . . . . . . . . . . . . . . . . . . . . . . . . . . . . . . . . . . . . . . . . . . . . . . . . . . . . . . . . . . . . . . . . . . . . . . . 19
Table 4
Contribution of discharges to Mekong River Basin . . . . . . . . . . . . . . . . . . . . . . . . . . . . . . . . . . . . . . . . . . . . . . . . . . . . . . . . . . . . . . . . . . . . . . . . . . . . . . . . . . . . . . . . . . . . . . . . . . . . . . . . . . . . . 20
Table 5
Availability of water resources and withdrawals . . . . . . . . . . . . . . . . . . . . . . . . . . . . . . . . . . . . . . . . . . . . . . . . . . . . . . . . . . . . . . . . . . . . . . . . . . . . . . . . . . . . . . . . . . . . . . . . . . . . . . . . . . . . . . . 21
Table 6
Land cover in the Mekong River region . . . . . . . . . . . . . . . . . . . . . . . . . . . . . . . . . . . . . . . . . . . . . . . . . . . . . . . . . . . . . . . . . . . . . . . . . . . . . . . . . . . . . . . . . . . . . . . . . . . . . . . . . . . . . . . . . . . . . . . . 22
Table 7
Total water demand per capita and domestic-industrial demand in the Mekong River region . . . . . . . . . . . . . . . . . . . . . . . . . . . . . . . . . . . . . . . . . . . . . . . . . . . . . . . . . . . . . . . . . 25
Table 8
National initiatives for managing the environment of the Mekong River region . . . . . . . . . . . . . . . . . . . . . . . . . . . . . . . . . . . . . . . . . . . . . . . . . . . . . . . . . . . . . . . . . . . . . . . . . . . . . . . 25
Table 9
Scoring table for the Mekong River region.. . . . . . . . . . . . . . . . . . . . . . . . . . . . . . . . . . . . . . . . . . . . . . . . . . . . . . . . . . . . . . . . . . . . . . . . . . . . . . . . . . . . . . . . . . . . . . . . . . . . . . . . . . . . . . . . . . . . . 27
Table 10
Total suspended solid loads in the mainstream and tributaries of Mekong River . . . . . . . . . . . . . . . . . . . . . . . . . . . . . . . . . . . . . . . . . . . . . . . . . . . . . . . . . . . . . . . . . . . . . . . . . . . . . . . 30
Table 11
Examples of alien species introduced to the Mekong River Basin . . . . . . . . . . . . . . . . . . . . . . . . . . . . . . . . . . . . . . . . . . . . . . . . . . . . . . . . . . . . . . . . . . . . . . . . . . . . . . . . . . . . . . . . . . . . . . 34
Preface
This report presents the output of the Global International Waters
The boundaries as well as the main physical and socio-economic char-
Assessment for the Mekong River carried out by the Southeast Asia
acteristics of the Mekong River region were deliberated by the regional
START Global Change Regional Center (SEA START RC), Environmental
experts in order to provide suffi
cient background information and to
Research Institute of Chulalongkorn University, Bangkok, Thailand, in
defi ne the area within which the impact assessment studies were con-
collaboration with the Global International Waters Assessment (GIWA) of
ducted. Environmental and socio-economic impacts of the region were
the United Nations Environment Programme (UNEP). Assessment studies
studied, based on the GIWA Scaling and Scoping Methodology.
were undertaken in accordance with the methodology developed by
GIWA (GIWA 2001) and by conducting Scaling and Scoping Workshops
The aims of this report is to present, in a single document, the available
organised by GIWA in collaboration with the SEA START RC. The
information on environmental and socio-economic impacts in the
workshops were attended by specialists with diverse expertise (see
Mekong River region.
Annex I for a list of workshop experts and other contributing authors
to this report).
PREFACE
9
Executive summary
The 4 900 km long Mekong River is an international water body having
is estimated to be about 60 million mł per day. In the MRB as a whole,
its source in China's Qinghai province from where it fl ows southwards
fi sh are the principal aquatic living resource. It is estimated that there
through the Tibet Autonomous region and Yunnan province of
are 1 200 to 2 000 fi sh species, the majority of them freshwater and
China, the eastern portion of Myanmar and the four countries of the
many of them migratory species travelling far in search of food and
Southeast Asian peninsula. It discharges to the South China Sea through
spawning grounds. Other important natural resources include minerals
the Mekong Delta to the south of Ho Chi Minh City in Vietnam. The
and timber.
Mekong River and its network of tributaries form the Mekong River
Basin (MRB), draining parts of six countries: Cambodia, China, Lao PDR,
The population of the MRB in 2000 was estimated to be approximately
Myanmar, Thailand, and Vietnam. The boundary of this region includes
65 million people. About 80% of this population live in rural areas, the
the entire Mekong River Basin and the coastal area surrounding the
great majority being farmers and fi shermen. Crop cultivation is the main
Mekong Delta.
livelihood, with rice and other food crops grown primarily for household
consumption. There are 71 cities with populations in excess of 100 000
The part of the MRB in China and eastern Myanmar are known as the
with Phnom Penh in Cambodia and Vientiane in Lao PDR being the two
Lancang or Upper Mekong River Basin (UMRB), and the lower part, the
largest urban centres. The population density is generally low, about
Lower Mekong River Basin (LMRB). The LMRB covers about 70% of
59 person/km˛ in the UMRB and 88 person/km˛ in the LMRB. The MRB
the entire MRB and is more important, both socio-economically and
is home to more than 70 ethnic groups, most practicing subsistence
environmentally, than the UMRB. The terrain of the UMRB is largely
agriculture.
mountainous while in the LMRB there are vast areas of lowland and
fl oodplain. The coastline of the Mekong Delta extends to around
Hydropower is the major energy resource in the MRB. Large amounts
650 km, of which about 350 km fl ank the South China Sea, and 300 km
of surface water are utilised to irrigate rice cultivation. However, water
the Gulf of Thailand. The associated coastal area is characterised by large
resources are still under-exploited. Groundwater resources in the region
estuaries, sand dunes, tidal marshes, and mangrove forests.
are used mainly for domestic and industrial consumption, with some
used for irrigation. Almost all sections of the Mekong River and its
The climate of the region ranges from cold temperate and tundra in
associated main tributaries are navigable during the rainy season with
the UMRB to tropical, monsoonal in the LMRB. The southwest monsoon
the exception of the Khone Falls in southern Laos PDR.
(May to October) provides the rainy season, and the northeast monsoon
(November to March), the dry season. The total water catchment area
The GIWA Task team selected Freshwater shortage, Pollution, Habitat
of the region is 795 000 km˛. Surface water resources are abundant with
and community modifi cation, and Unsustainable exploitation of fi sh
run-off amounting to approximately 475 billion mł in the rainy season
and other living resources as the priority environmental concerns
and 78.8 billion mł in the dry season. Flooding occurs almost every year,
aff ecting the transboundary waters of the region. This decision
particularly in the LMRB, when heavy rainfall prevails. Groundwater is
was justifi ed by the assessment of their impacts on environmental,
an important resource in the alluvial deposits of northeast Thailand
economic, social and health issues both as currently reported and
and in the Delta. The total potential capacity of groundwater resources
anticipated for the future.
EXECUTIVE SUMMARY
11
Currently, freshwater shortage per se does not appear to be a signifi -
water for irrigation, industrial development and human settlements.
cant problem for the region. However, the impact of the Modifi cation of
Deforestation in the catchments is the principal cause of increased rates
stream fl ow has been considered severe. This is evidenced by changes
of surface water run-off that is increasing the frequency and intensity of
in the fl ow volume of the Mekong River and its tributaries caused not
fl ooding. Locally, the built environment is also causing increased rates of
only by changes in rainfall but also by development activities, notably
run-off . The raising of embankments or levées along the Mekong River
the construction of dams for hydropower development, the improve-
and its tributaries is resulting in a signifi cant reduction in the volume of
ment of river navigation routes and the diversion of river water for irriga-
fl oodplain storage, causing increased rates of river discharge and high
tion. Economic development and population growth will increase water
fl ood levels. The increased rates of surface water run-off resulting from
demand, and the extensive development of hydropower schemes will
deforestation and land clearance in upland areas of the MRB are causing
signifi cantly alter the hydrological cycle.
increased soil erosion and the consequent entrainment of suspended
and bed-load sediments into water courses. Except where they are
The impacts of pollution due to suspended solids have been considered
trapped in reservoirs or deposited on fl oodplains and riverbeds, the
to be severe. Development activities during the past decade including
sediments are transported through the basin to the Mekong Delta,
deforestation, mining, grazing and urbanisation have caused extensive
where they are deposited in mangrove forests or discharged to the sea.
soil erosion in many parts of the MRB resulting in high contents of
Suspended sediments are also being introduced to water courses from
total suspended solids (mainly suspended sediment) in the Mekong
land disturbance through mining or urbanisation, for example.
River and its major tributaries. The suspended solids are transported
through the basin, altering channels and habitats and accreting in
The principal root causes of the modifi cation of the water and
the Mekong Delta. The impacts of the loss and/or modifi cation of
suspended solid fl ow regimes through the MRB are population and
ecosystems, categorised under the GIWA concern of Habitat and
economic growth. The population has grown rapidly in the past decade,
community modifi cation, have been considered to be severe and
and, by the year 2010, it is expected to have increased to 75-90 million
are becoming major issues in the region. Modifi cation or loss of the
people. Population growth has led to deforestation, increasing erosion
ecosystems has been found to deplete the living resources on which
rates and surface run-off , thus modifying the sediment loads and fl ow
the rural communities depend for their subsistence. The impacts of
volume of the region's rivers. Over the next 20-30 years, demand for
Overexploitation and Impact on biological and genetic diversity have
water and the pressure on natural resources will continue to increase in
been evaluated as severe. The fi sheries resources in the region have
parallel with rapid population growth. Economic growth is a key driver
shown evidence of overexploitation, indicated by declining catches
of the changes aff ecting river fl uxes in the MRB. Urbanisation, human
per fi sherman and the great increase in the number of fi shermen. The
settlement and industrial development activities have substantially
increasing population of the region also adds to the fi shery pressure
increased water demand, while agriculture is a dominant economic
causing overexploitation. As with loss of ecosystems, these issues also
sector and the largest consumer of water. Demand for electricity has
deplete the resources on which rural communities depend.
surged in the last two decades in response to the rapid economic
development experienced in the riparian countries of the MRB and
Habitat modifi cation was selected by the GIWA Task team as the main
elsewhere in Southeast Asia. Although at present, per capita electricity
priority concern for the Mekong River region. Changes in habitats
consumption in the riparian countries of MRB is generally low except
and the modifi cation of communities are being caused by changes
in Thailand, demand is increasing rapidly. The great hydropower
in the fl uxes of water and sediment, particularly suspended solids,
potential in Lao PDR, Myanmar and Yunnan province of China, and the
by increased pollution from point and diff use sources, and by the
increasing market demand for electricity in neighbouring countries
introduction of new species into the aquatic environment. The Causal
including Thailand, Vietnam, Malaysia and Singapore, are promoting
chain analysis of the Mekong River region in this report focuses on two
the development of lucrative hydroelectricity schemes in the MRB. To
of the factors causing habitat modifi cation, stream fl ow modifi cation
date, only 11 hydropower facilities have been constructed in the MRB,
(Freshwater shortage) and suspended solids (Pollution).
representing just 5% of its estimated hydropower potential. Many
more facilities are planned. Economic development has also led to
The fl ow regime of the Mekong River and its tributaries has been
deforestation for timber or fuelwood supplies, agricultural expansion
modifi ed by changes in precipitation patterns and by human activities,
and urban development, all contributing to increased erosion and,
particularly the construction of dams for hydropower development, the
consequently, sediment loads in the aquatic environment.
modifi cation of rivers to improve navigation, and the diversion of river
12
GIWA REGIONAL ASSESSMENT 55 MEKONG RIVER
The importance of governance in addressing the transboundary
The main policy relevant conclusions of the GIWA Mekong River Task
environmental issues of the region is now widely appreciated and
team highlight the transboundary nature of the concerns and issues
major steps have been taken in this regard. Various institutions and
aff ecting, and forecast to aff ect, the region. Some environmental issues
government agencies are involved in addressing and managing
imply direct impacts on communities across national borders. Others
the water-related environmental issues and problems. Over recent
are associated with decisions made at the regional scale, such as the
decades all the riparian countries of the MRB have developed
development of transport and energy networks. With appropriate
strategies, policies, laws, legislation and action plans, while numerous
regional cooperation among the riparian countries, the transboundary
national and international donors, funding agencies and NGOs
impact of hydropower and other water-use development in the MRB
have initiated study programmes and assessments to facilitate and
can be limited by adopting integrated, multi-objective planning
support the management of the region. External support agencies
in order to optimise the utilisation of the region's water and living
have contributed signifi cantly to this process, providing support for
resources. Protected areas have been identifi ed as a practical measure
capacity building, human resource development and technical studies
for conserving sensitive habitats and maintaining essential ecological
related to environmental management. One agency, the Mekong River
processes. The GIWA Task team has recommended developing strategic
Commission, is a regional body responsible for the overall management
action programs or policies based on further investigation of the driving
of the MRB with the participation of four LMRB riparian countries,
forces behind the environmental problems in the region.
Thailand, Cambodia, Lao PDR and Vietnam.
EXECUTIVE SUMMARY
13
Acknowledgements
The authors would like to acknowledge the following experts, scientists
Ge, Ministry of Water Resources, China; Nicholaas van Zalinge, Mekong
and specialists, as well as their affi
liated institutions from the riparian
River Commission, Cambodia; Sansanee Choowaew, Mahidol University,
countries of the Mekong River Basin, who have signifi cantly contributed
Thailand; Sein Mya, Mekong River Commission; Somrudee Nicro,
to the preparation of this report:
Thailand Environmental Institute; Thavivongse Sriburi, Chulalongkorn
University, Thailand; Wijarn Simachaya, Pollution Control Department,
Chaiyuth Suksri and David Coates, Mekong River Commission; David
Thailand; and Ruud Corsel, Mekong River Commission.
Jezeph, United Nations Economic and Social Commission for Asia and
the Pacifi c (UNESCAP); Hans Friederich, The World Conservation Union
The authors are also grateful to the Global International Waters Assess-
(IUCN); Ian Campbell, Mekong River Commission; Ing Try, Department
ment (GIWA) of the United Nations Environment Programme (UNEP) for
of Fisheries, Cambodia; John Dore, World Resources Institute (WRI); Le
their fi nancial and technical support in conducting the assessment of
Huu Ti, United Nations Economic and Social Commission for Asia and
the Mekong River Basin and in the preparation of this report.
the Pacifi c (UNESCAP); Le Quang Minh, Can Tho University, Vietnam; Li
14
GIWA REGIONAL ASSESSMENT 55 MEKONG RIVER
Abbreviations and acronyms
ADB
Asian Development Bank
JICA
Japan International Cooperation Agency
AIRC Asian
International
Rivers
Center
LMRB
Lower Mekong River Basin
AMRC
Australian Mekong Resource Centre
MOC Ministry
of
Culture
CIDA Canadian
International
Development
Agency
MOSTE Ministry of Science, Technology and Environment
CPUE
Catch Per Unit Eff ort
MRB
Mekong River Basin
DANIDA Danish International Development Agency
MRC
Mekong River Commission
DDT dichlorodiphenyltrichloroethane
MRCS
Mekong River Commission Secretariat
DWT Deadweight
Tonnes
MW Mega
Watt
EIA
Environmental Impact Assessment
NGO Non-Governmental
Organisation
ENSIC
Environmental Systems Information Center
SEA START RC
ENSO
El Nińo Southern Oscillation
Southeast Asia START Regional Center
ESA
External Support Agency
Sida Swedish
International
Development
Agency
ESCAP
Economic and Social Commission for Asia and the Pacifi c
START
global change SysTem for Analysis, Research and Training
ESCAP
Economic and Social Commission for Asia and the Pacifi c
TSS
Total Suspended Solids
FAO
Food and Agriculture Organisation of the United Nations
UMRB
Upper Mekong River Basin
GDP
Gross Domestic Product
UN United
Nations
GEF
Global Environment Facility
UNCED United Nations Conference on Environment and Sustainable
GIWA
Global International Waters Assessment
Development
GWh
Giga Watt hour
UNEP
United Nations Environment Programme
HCMPC Hydropower
Construction
Management
USAID
United States Agency for International Development
Professional
Committee
USD
United States Dollar
IUCN The
World
Conservation
Union
WRI
World Resource Institute
ABBREVIATIONS AND ACRONYMS
15
Regional defi nition
This section describes the boundaries and the main physical
and socio-economic characteristics of the region in order to
defi ne the area considered in the regional GIWA Assessment
and to provide suffi
cient background information to
Lanca
establish the context within which the assessment was
ng
conducted.
Upper M
ekon
Boundaries of the Mekong
g River B
River region
L
asin
ancan
China
g
The Mekong River and its network of tributaries form the vast
Mekong River Basin, draining parts of six riparian countries:
Cambodia, China, Lao PDR, Myanmar, Thailand and Vietnam. The
river is an international water body which fl ows from its source in
the Tanggula mountain range in Qinghai province, China (MOC/
China 2004) for 2 161 km through Qinghai province, the Tibet
Myanmar
Autonomous region and Yunnan province of China, and another
2 719 km through countries of the Southeast Asian peninsula to
Laos
Lo
the south of Ho Chi Minh City in Vietnam, where it discharges
wer M
to the South China Sea (MRC 1997a). Its total length is about
ekon
4 900 km.
M
g
Thailand
e
R
ko
iv
ng
er B
asin
The boundary of the Mekong River region includes the entire
Elevation/
Mun
Depth (m)
Mekong River Basin (MRB) and the coastal area adjacent to
the Mekong Delta (Figure 1). The total catchment area is
4 000
r
2 000
gke
about 795 000 km˛, producing a run-off of approximately
an
Cambodia
1 000
Me
Ph.S
ko
500
475 000 millionł during the rainy season (MRC 1997a). The part of
ng
Ton
100
le Sap
the MRB within China and the eastern end of Myanmar is known
0
-50
Phnom Penh
-200
Ho Chi Minh City
Figure 1
-1 000
Boundaries of the Mekong River region
-2 000
0
500 Kilometres
Vietnam
(Source: Elevation based on USGS 2003)
© GIWA 2006
16
GIWA REGIONAL ASSESSMENT 55 MEKONG RIVER
as the Lancang or Upper Mekong River Basin (UMRB), and the lower
Table 1
Areas of the major watersheds in the Mekong River region
part, the Lower Mekong River Basin (LMRB). The UMRB is predominantly
Name of watershed
Area (km˛)
Name of watershed
Area (km˛)
mountainous, whereas lowlands and fl oodplains prevail in the LMRB.
Lancang River (Yunnan province)
89 320
Nam Mun
70 900
The LMRB covers about 70% of the whole basin and is its most
Nam Ou
25 830
Se Kong
28 710
important part both environmentally and economically. Its population
Nam Mae Kok
10 780
St Sreng
10 380
is largely rural and employed mostly in agriculture or related activities,
Nam Ngum
17 170
Se San
18 710
with rice as the major crop (Chu et al. 2003).
Nam Cadinh
14 860
St. Mongkol Borey
11 350
Nam Songkhram
13 090
Sre Pok
31 11
Se Bang Fai
10 240
St. Sen
16 250
Physical characteristics
Nam Chi
49 100
Mekong Delta
49 520
Se Bang Hieng
19 340
The Mekong River Basin comprises a large network of tributaries,
(Source: Hirsch & Cheong 1996, MRC 1997a, Puustjarvi 2004)
forming many sub-basins. While the watersheds of the UMRB are
contiguous (Figure 1), those of the LMRB are much more complex
with around 125 small and large watersheds (MRC 1997a). Watersheds
with areas of more than 10 000 km˛ are shown in Figure 2 and their
Upper Mekong
areas listed in Table 1. The watersheds harbour large areas of forest,
paddy fi elds, streams and creeks forming a complex, rich and diverse
ecosystem supporting over 65 million people.
Fangcheng Gang
Nam Ou
Hanoi
Haiphong
Nam Mae Kok
Nam Ngum
Nam Cadinh
Nam Songkhram
n
Se Bang Fai
Northern Highlands
Nam Chi
Se Bang Hieng
Da Nang
Nam Mun
Se Kong
Eas
Se San
tern H
Bangkok
St. Mongkol Borey
igh
Sre Pok
Korat Plateau
la
St. Sen
nds
Phnom Penh
Ho Chi Minh City
Mekong Delta
Lowlands
Southern
Uplands
Figure 2
Major watersheds in the Lower Mekong River region
(Source: Redrawn from MRC 1997a, MRC 2004)
Delta
The Mekong River Basin is divided into six bio-geographical zones or
landforms as shown in Figure 3 and Table 2:
Figure 3
Bio-geographical zones of the Mekong River region
Lancang River Basin (UMRB) (parts of Qinghai province, the Tibet
(Source: MRC 1997a, MRC 2004)
Autonomous region and Yunnan province in China);
REGIONAL DEFINITION
17
Table 2
General statistics relating to the Mekong River Basin
rising to over 2 000 m and valley fl oors more than 600 m below the
Basin (catchment) area (2004)
795 000 km˛
mountain crests. The rough terrain is largely uninhabitable, thus human
Area above 3 000 m altitude (2004)
62 000 km˛ (7.8% total basin area)
population is sparse. Agricultural activities are limited to rice production
Mean annual run-off (2004)
560 mm
in the narrow valley fl oors and shift cultivation on the mountainsides.
Discharge volume (2004):
The greatest development potential of this area is for hydropower. Some
Rainy season
475 000 million mł
large-scale hydropower schemes are already established in Myanmar,
Dry season
78 800 million mł
Phnom Penh (Cambodia); Vientiane (Lao
Thailand and Lao PDR (Hirsch & Cheong 1996).
Major cities in the MRB (2004)
PDR); Luang Phrabang (Lao PDR); in Vietnam:
Cao Tho, Nong Khai and Khon Khean
Loss of original forest area (up to 1998)
69%
Korat-Sakon Plateau
Deforestation rate (1998)
16%
The Korat-Sakon Plateau extends over northern Thailand and the
Eroded area (1998)
21% of total basin area
fl oodplains of southern Lao PDR. It is surrounded by the northern
Large dams (>1 500 MW) in operation (2003):
and eastern highlands in Lao PDR and the Petchabun and Phnom
UMRB
4
Dangrek mountain ranges in Thailand and northern Cambodia (MRC
LMRB
0
Small dams (<1 500 MW) in operation (2003):
1997a). The plateau is drained mainly by the Nam Mun, Nam Chi and
UMRB
4
Nam Songkhram rivers (tributaries of the Mekong River) in the north
LMRB
11
Wetlands (1998)
9% of total basin area
of Thailand (Figure 2). These rivers are generally incised several meters
Protected areas (1998)
5% of total basin area
below the predominantly sandstone plateau. The Plateau is the driest
Population density (1998)
78 people per km˛ (average for entire MRB)
part of the MRB. It has low rainfall and most of its soils have a poor
(Sources: ADB/UNEP 2004, WRI 2004)
capacity for moisture retention (Hirsch & Cheong 1996). Despite low
soil fertility agriculture is extensive and there is potential for further
Northern Highlands (parts of Yunnan province in China, Lao PDR,
agricultural development by installing fl ood controls, drainage and
Myanmar and Thailand);
irrigation as well as taking measures to reduce salinsation (MRC
Korat-Sakon Plateau (parts of northern Thailand and southern Lao
1997a).
PDR);
Eastern Highlands (parts of Lao PDR and Vietnam);
Eastern Highlands
Southern Uplands (part of Cambodia); and
The Eastern Highlands cover the mountain ranges extending over
Lowlands (parts of Cambodia, Lao PDR and Vietnam including the
eastern Lao PDR and central Vietnam, spanning an area of approximately
Mekong Delta and its associated coastal area).
300 km long and 50 km wide (Hirsch & Cheong 1996, MRC 1997a).
Networks of tributary rivers draining the Highlands are numerous, the
Lancang River Basin
large ones are the Nam Cadinh, Se Bang Fai, Se Bang Hieng, Se Kong,
The watershed of the Lancang River is typifi ed by high mountains and
Se San and Sre Pok (Figure 2). Rainfall is the highest in the MRB with its
deep gorges. The northern part of the river valley lies at some 2 000 m
tributaries contributing about two-fi fths of the total water volume in
and is fl anked by mountains of 3 500 to 5 000 m (MRC 1997a). The central
the Mekong River (Hirsch & Cheong 1996). It is the most heavily forested
part of the catchment comprises medium-sized mountains and wide,
area of the entire MRB and rich in biodiversity. Rotational farming is the
fertile valleys above 1 000 m. This is the most habitable and populated
commonest crop production method practiced by a wide range of
part where relatively large-scale agricultural, industrial and urban
indigenous communities in this area (Evans 1992). The upper part of the
development has taken place. The southern part of the catchment is
Highlands, generally of high relief, has a high potential for hydropower
characterised by medium to low mountains and valleys below 1 000 m,
development; several large projects are already underway or imminent
with limited arable land and small population centres. The high fl ow
in the Laos and Vietnamese sections (Hirsch & Cheong 1996).
relief of the Lancang River (average 6.5 m/km) provides potential for
hydropower development (Hirsch & Cheong 1996, MRC 1997a).
Southern Uplands
The Southern Uplands are extensions of the Northern Highlands and
Northern Highlands
include the Cardamom and Elephant ranges in southeastern Cambodia
The Northern Highlands cover parts of southern Yunnan in China,
(MRC 2003). They are drained by the Tonle Sap River which fl ows
eastern Myanmar, northern Thailand and northern Lao PDR (Figures 1-
northward into the Tonle Sap, the great lake of Cambodia (see below),
3). The MRB here is characterised by high mountains with several peaks
and by the Prek Thont River into the Basaac River (Hirsch & Cheong
18
GIWA REGIONAL ASSESSMENT 55 MEKONG RIVER
1996). The uplands, including the mountain ranges, are still densely
South China Sea and the remaining 300 km fl anks the Gulf of Thailand
forested. They have low population densities and are considered
(MRC 1997a). The coastal area is characterised by large estuaries, sand
signifi cant areas for nature conservation.
dunes, tidal marshes and mangrove forest (MRC 1997a).
Lowlands
The Mekong Delta has three major water and land resource problems.
The Lowlands cover a large part of the northern half of Cambodia and
Acute fl ooding occurs during the wet season when fl ood waters can
areas in southern Lao PDR, eastern Thailand and southern Vietnam, as
rise more than four metres in much of southern Cambodia and the
well as the Mekong Delta and its associated coastal area (Figure 3). The
upper Delta (Hirsch & Cheong 1996). Another problem is the occurrence
Mekong River fl ows from the highlands of the Korat-Sakon Plateau to the
of acid sulphate soils in several areas, making them unsuitable for
northern part of this vast lowland area where it is broken by the Khone
agriculture. Actual and potential acid sulphate soils, covering an area
Falls (Figure 3), which form an obstruction to navigation. Surrounding
of about 1.6 million ha, occur mainly in the Dong Thap Muoi and Long
habitats have great aquatic biodiversity signifi cance (Hirsch & Cheong
Xuyen quadrangles (Cao 2004). The third problem is that of saline water
1996). Two landforms of great importance in these Lowlands are the
intrusion. During the dry season, the river fl ows are so low that sea water
lake Tonle Sap on the fl oodplain in Cambodia and the Mekong Delta
intrudes the lower reaches; this produces brackish water conditions that
mainly in Vietnam. The Tonle Sap is the largest lake in Southeast Asia. It
are unsuitable for rice production (White et al. 2004).
serves as a natural reservoir storing fl ood waters from the surrounding
watersheds and regulating river fl ows in the dry season, thus helping
The climate
to relieve droughts in southern Cambodia and the Mekong Delta (MRC
The climate ranges from cold temperate and tundra in the UMRB to
2003). The lake's area can increase from 250 000 to 300 000 ha in the
typically tropical monsoonal in the LMRB. In the UMRB, the peaks of the
dry season to as much as 1.3 million ha in the rainy season (MRC 1997a,
higher mountains in the catchment of the Tibet Plateau are almost per-
MRC 2003).
manently snow-capped. The climate is cold without any clear summer
season and rainfall is generally low (Liu 2004). At lower elevations in
The Mekong Delta is a triangular area at the southern tip of the
Yunnan province, the climate is predominantly sub-tropical with higher
Lowlands (Figure 3). It covers around 49 520 km˛ with 74% of this area in
rainfall (as high as 1 700 mm annually) and clearly demarcated seasons
Vietnam and the rest in Cambodia (MRC 1997a). The Delta is historically
(Chu et al. 2003). Elsewhere in the LMRB, the climate is largely tropical
the most densely populated area of the MRB with large areas of fertile
monsoonal. The southwest monsoon usually begins in the latter half of
agricultural lands (Snidvongs et al. 2003). It can be divided into three
May and continues to early October. The northeast monsoon starts in
sections: upper, middle and lower. The upper section has strong natural
early November and continues to early March.
levées embankments built on either side of the river by accumulated
deposits of silt. Behind the levées there are wide depressions. The
In the LMRB the southwest monsoon brings high rainfall resulting in the
middle section includes well drained arable land as well as poorly
onset of the rainy or wet season while the northeast monsoon has low
drained areas. The lower section is formed by the river distributaries
rainfall and forms the dry season. Air temperature is remarkably uniform
and their associated sediments (Tuvy 2004). The coastline along the
due to the area's maritime infl uence and generally low elevation. High
Delta is around 650 km in length of which around 350 km borders the
temperatures occur except during part of the northeast monsoon when
Table 3
Key characteristics of the various bio-geographical zones
Population density
Bio-geographical zone/landform
Rainfall (mm/year) Type of vegetation & land
Main economic activities
Environmental problems
(person/km˛)
Variable:
Mountain brush, meadow, pine forest, mixed
Agriculture
Erosion, forest degradation and
Lancang River Basin (UMRB)
Low to moderate: 7-145
600-2 700
evergreen & broad-leaved; some arable land
(frequently shifting)
natural disasters
Wet:
Agriculture
Northern Highlands
Hill evergreen and mountain forest; grassland
Low: 8-15
Erosion and forest degradation
2 000-2 800
(frequently shifting)
Limited water resources, floods,
Relatively dry:
Agriculture (irrigated and
Korat-Sakon Plateau
Scrubs; grassland & arable land
Moderate: 80-160
drought, salinization and low soil
1 000-1 600
rain-fed)
fertility
Wet:
Erosion, soil degradation, forest
Eastern Highlands
Upland savannah & rain forest
Low: 6-33
Agriculture (shifting)
2 000-3 200
degradation
Moderate to dense in
Agriculture in Lowlands (rice
Flooding, acid-sulphate soils, salinity
Variable:
Lowlands
Arable lowland and dense upland
Lowlands: 10-570
cultivation)
intrusion, drought in lowland and
1 100-2 400
Very low in Upland: less than 8
Small development in Upland
forest degradation in upland
(Source: Snidvongs et al. 2003)
REGIONAL DEFINITION
19


cool winds blow from Central Asia. Lowest temperatures occur between
November and February (MRC 2003). The hottest months are at the
beginning of the dry season with average air temperatures of 30-38°C.
Lancang
Precipitation in the region varies with location. Rainfall is low on the
Tibet Plateau and increases southwards through the MRB, being the
highest in the Mekong Delta (Figure 4). As indicated in Table 3, rainfall
ranges from 600 to 3 200 mm per year. Cyclonic disturbances during
the rainy season may cause widespread rainfall of long duration during
July-September, resulting in fl ooding (Chu et al. 2003). With the onset
Lancang
of the southwest monsoon in May, the level of the Mekong River rises
reaching its peak in mid-August or early September in the upper part
of the LMRB, and in mid-September or early October in the Delta (MRC
2003). Flooding in the Cambodian and Vietnamese parts of the MRB is
China
usually disastrous with up to 4 million ha of Cambodia's lowland areas
and up to 1.8 million ha in the Delta inundated annually.
Myanmar
Water resources
Laos
The total water catchment area of the region is large (795 000 km˛). The
Lao PDR catchment accounts for 25% of this total, Thailand 23%, Yunnan
21% and Cambodia 20%, while Vietnam accounts for 8% and Myanmar
Me
Thailand
kon
3%. The region's catchment produces abundant surface water resources
g
with discharge amounting to approximately 475 000 million mł in the
Mun
Precipitation
rainy season and 78 800 million mł in the dry season (Table 4). About 17-
(mm/year)
19% of this discharge is contributed by the Cambodian catchments, 32-
200
er
400
35% by Lao PDR's, only around 2% by Myanmar's, 15-17% by Thailand's,
.Sangk
600
Cambodia
Ph
Me
k
Ton
o
10-11% by Vietnam's, and 16-25% by Yunnan's. Discharges in the dry
1 000
ng
le Sap
1 400
season are 4 to 7 times lower than those in the rainy season (Table 4).
Phnom Penh
2 000
2 800
Ho Chi
Minh City
4 000
The availability of surface water resources in terms of the amount
0
500 Kilometres
Vietnam
5 600
© GIWA 2006
internally renewable annually also varies widely by country. Around
Figure 4
Precipitation in the Mekong River region
97% of the land area of Lao PDR and 86% of Cambodia as well as
(Source: ESRI 1997)
Table 4
Contribution of discharges to Mekong River Basin
Riparian country/province
Description
MRB
Yunnan, China
Myanmar
Lao PDR
Thailand
Cambodia
Vietnam
Catchment
Area (km˛)
165 000
24 000
202 000
184 000
155 000
65 000
795 000
Contribution to MRB total (%)
21
3
25
23
20
8
100
% of total area of country/province
38
4
97
36
86
20
Average discharge (million mł)
In rainy season
76 128
9 416
166 195
80 732
90 193
52 350
475 014
In dry season
19 032
1 419
24 929
12 110
13 529
7 852
78 871
Average discharge as % of total MRB:
Rainy season
16
2
35
17
19
11
100
Dry season
24.1
1.8
31.6
15.4
17.2
9.9
100
(Sources: ENSIC 1999, Ringler 2001, MRC 2003)
20
GIWA REGIONAL ASSESSMENT 55 MEKONG RIVER
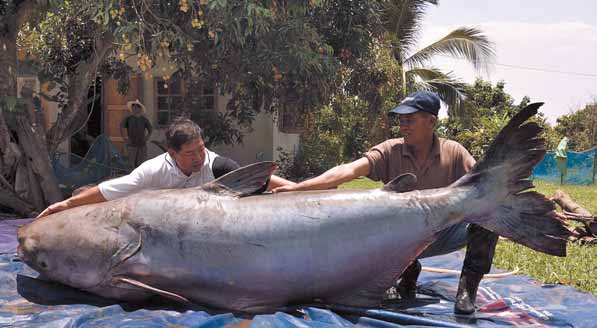
Table 5
Availability of water resources and withdrawals
the famous Eastern saurus crane (Grus antigone sharpii), Giant ibis
Availability*
Withdrawal
(Pseudibis gigantea), White-shouldered ibis (Pseudibis davisoni) and
Riparian
Withdrawal to
country or
Estimated
availability in
Bengal fl orican (Eupodotis bengalensis) (Friederich 2004). Aquatic
Total Per capita
Total Per capita
province
per capita
1995 (%)
1995 (mł)
1995 (mł)
1995 (mł)
1995 (mł)
biodiversity is also high. A recent study by IUCN lists the MRB as one of
2020 (mł)**
Yunnan
the nine richest habitats for fi sh biodiversity globally, with 298 recorded
province,
2 800 000
2 292
5 171
500 000
407
18
species, including the endemic Giant catfi sh (Pangasianodon gigas), the
China
Myanmar
606 000
13 024
13 366
4 000
86
0.7
Giant Mekong barb (Catlocarpio siamensis) and several species of giant
Lao PDR
270 000
55 305
20 345
1 000
205
0.4
stingray (Dasyatis sp.). More recent estimates have raised this to over
Cambodia
88 000
8 585
4 811
1 000
98
1
480 species (Coates et al. 2003). The LMRB is considered a biodiversity
Thailand
210 000
3 559
2 392
33 000
559
16
hot-spot for molluscs, with 160 endemic species. The river also harbours
Vietnam
318 000
4 479
1 647
65 000
915
20
an endangered population of Snubfi n dolphins (Orcaella brevirostris) and
* Availability refers to the amount internally renewable annually (** Sokhem pers. comm.).
the Siamese crocodile (Crocodylus siamensis).
(Source: ESCAP 1998)
Aquatic living resources represent signifi cant biological value in terms
large areas of Thailand and Vietnam derive their water needs from the
of species composition and diversity (MRC 1997a). Fish represents the
Mekong River Basin. In Yunnan province, China, the major source of
major aquatic living resource in the MRB with 1 200 to 2 000 species,
supply comes from the MRB, but Myanmar is not dependent on basin
the majority of which are freshwater species (Ringler 2001). Many of
waters (Table 5). As indicated in Table 5, in 1995 Lao PDR had the largest
these are migratory and may travel far in search of food and spawning
per capita availability of water resources while the availability in Yunnan
grounds. For instance, the Giant catfi sh (Pangasianodon gigas) (Figure 5)
province was the lowest. At the same time, Vietnam had the highest
has been reported to migrate from Cambodia to its spawning grounds
per capita withdrawal rate of the MRB's water resources, followed by
in Yunnan province (McElwee & Horowitz 1999).
Thailand and Yunnan province. Vietnam also has the highest ratio of
withdrawals to availability, followed by Yunnan province, while low
The MRB's wetlands play a critical role as staging posts in the fl yways
ratios were observed for Lao PDR, Myanmar and Cambodia (Table 5).
for migratory birds. The Tram Chim National Park in Vietnam hosts
almost the entire world population of Eastern sarus crane during the
There are believed to be extensive groundwater resources in the
dry season. The freshwater wetlands are also important for migratory
region although these have not been adequately assessed (MRC
egrets and shorebirds, and the intertidal coastal areas, for shorebirds
1997a). Aquifers of recent alluvium fl ank the mainstream Mekong
from northeast Asia (Friederich 2004). The total area of wetlands in
River in northeast Thailand and the Mekong River Delta. These
the Cambodian part of the MRB is around 36 500 km˛, in Lao PDR
aquifers are recharged mainly through rainwater seepage. More than
2 200 km˛ and in Thailand 2 000 km˛. The wetlands in the Mekong
6 000 groundwater wells are reported to have been
drilled in these aquifers and in other parts of the MRB
since 1980. Total potential capacity of the groundwater
resources in the region is estimated to be around
60 million mł/day (Chu et al. 2003).
Biodiversity, critical habitats and
land cover
The Mekong River Basin possesses immense
biodiversity of exceptional international signifi cance,
including many unique ecosystems and a wide array
of globally-threatened species (GEF 2004). These
include new genera of large mammals (Pseudoryx,
Megamuntiacus, Pseudonovibos) discovered in the past
decade and many bird species identifi ed as globally
Figure 5
Mekong Giant catfi sh.
threatened or globally near-threatened, including
(Photo: Suthep Kritsanavarin/U.S. Newswire Photography, 2005)
REGIONAL DEFINITION
21
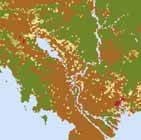
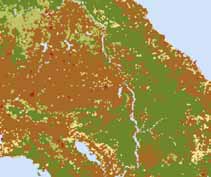
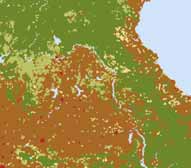
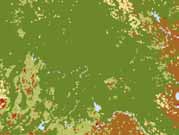
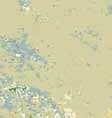


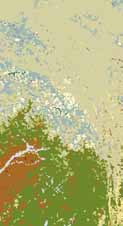


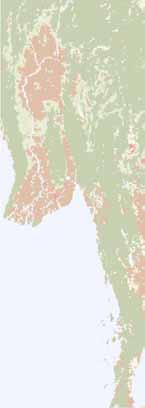
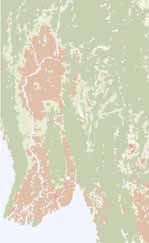

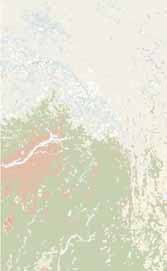


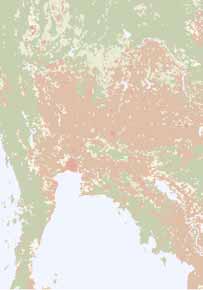


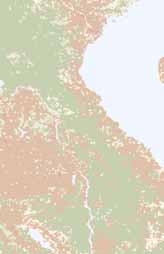


Table 6
Types and areas of land-cover in the Mekong River
Delta in Vietnam cover an area of 20 000 km˛. Within the UMRB, the
region
largest known wetland is the 250 km˛ Er Hai lake in Yunnan province
Area (km˛)
% of total MRB area
Type of land-cover
(ADB/UNEP 2004).
1992-1993
2003
1992-1993
2003
1. Forest land
340 620
242 475
42.8
30.5
Forest coverage in the MRB has declined from over 70% to below 30%
2. Grassland, savanna & shrubland
140 754
136 740
17.7
17.2
in the past fi fty years due to destruction by logging, uncontrolled shift
3. Wetlands rivers & lakes
11 643
69 165
1.5
8.7
cultivation, the encroachment of forest reserves for human settlements,
4. Crop land or agricultural land
227 518
323 565
28.6
40.7
Non-irrigated cropland
277 455
uncontrolled farming and infrastructure development (MRC 1997a).
Irrigated cropland
23 055
Types of land-cover and changes over the period 1992/3-2003 are
5. Dry land or semi-desert land
70 644
6 360
8.9
0.8
shown in Table 6 and Figure 6.
6. Urban & industrial centres
438
16 695
0.1
2.1
7. Tundra (treeless plain with frozen subsoil)
3 383
-
0.4
-
Total
795 000
795 000
100
100
Socio-economic characteristics
Landuse
La
Population and health
nca
Barren
ng
The Mekong River Basin had a population of approximately 65 million
Cropland
people in 2000, of whom about 55 million live in the LMRB. In 2000, the
Forest
average proportion of the MRB's population living in urban areas was
Developed
around 29%, an increase of about 6% over that in 1990. This proportion
Grassland
is likely to increase signifi cantly due to rapid urbanisation over the next
Tundra
decades. The great majority of the MRB's inhabitants are farmers and
Wetland
fi shermen, as illustrated in Figure 7 by the high population densities
in arable lands. About 80% of the MRB's population live in rural areas.
Savanna
There are 71 large cities with populations in excess of 100 000 (IUCN
Shrubland
China
2004b). The average population density is generally low, around
Unclassified
59 person/km˛ for UMRB and 88 person/km˛ for LMRB. The density
Water
is highest (260 person/km˛) in the Vietnamese part and lowest in Lao
PDR, around 24 person/km˛. In 1995, life expectancy, at 49-50 years, was
Myanmar
lowest in the Cambodian and Lao PDR areas, but higher, at 64-67 years,
Laos
in the Thai and Vietnamese areas.
The region is characterised by a rich cultural diversity with more than
Mekong
70 ethnic groups living in localised communities and having their
own languages and traditions. These ethnic groups use knowledge,
traditions and land use systems that are closely interwoven with the
Thailand
Me
surrounding local environment and natural resources to sustain their
kong
daily life (MRC 2003).
Cambodia
Health conditions for children and women are among the poorest in the
world, particularly in less developed areas of the LMRB. In 1993, infant
Phnom Penh
Vietnam
mortality rates in Cambodia and Lao PDR were high, about 3-4 times
Ho Chi Minh City
higher than those of Thailand and Vietnam. Due to economic growth in
0
500
Kilometres
© GIWA 2006
the 1990s, infant mortality rates fell in many parts of the LMRB and there
Figure 6
Land cover in the Mekong River region
will be further improvements in less developed areas if women have
(Source: IUCN 2004a)
better access to education and health services (MRC 2003). In the MRB,
22
GIWA REGIONAL ASSESSMENT 55 MEKONG RIVER


Population density
Myanmar
(persons/km˛)
<1
Xiaowan
L
L
a
a
1-2
n
n
c
China
c
Gongguoquiao
a
a
n
n
g
g
3-5
Manwan
6-10
11-100
>100
Dachaoshan
gncan
La
Nuozhadu
Jinghong
Ganlanba
China
Mengsong
1 400
Gongguoquiao
1 300
Laos
Xiaowan
1 200
l
e 1 100
Myanmar
Manwan
1 000
Laos
sea lev
e
Dachaoshan
900
v
M
Nuozhadu
e
ko
800
ng
es abo
700
Metr
600
500
800
700
600
500
400
300
Kilometres
Thailand
Figure 8
Location and elevation of the existing and proposed
Mekon
dams in Lancang River
g
(Source: McCormack 2000)
Cambodia
(MRC). In the Lancang River Basin (UMRB), development is typifi ed
Phnom Penh
Vietnam
by the Lancang Cascade project which aims to construct and operate
dams for hydropower development. The project is creating a cascade
Ho Chi Minh City
0
500
Kilometres
of dams, taking advantage of a 700 m elevation drop occurring over
© GIWA 2006
750 m-stretch of the middle and lower reaches of Lancang River
Figure 7
Population density in the Mekong River region.
(Source: data from ORNL 2003)
(Figure 8). Construction of the dams began in 1986 with the Manwan
Dam followed ten years later by the Dachaoshan Dam. In 2000, a total
malaria and HIV/AIDS are the two leading public health problems. Cam-
of eight dams were reported as constructed or planned (Figure 8),
bodia has the highest and fastest growing rates of HIV/AIDS, although
and, according to a recent report from the Hydropower Construction
recent data suggest that the situation is stabilising. HIV/AIDS rates in
Management Professional Committee (HCMPC) of China Hydropower
Thailand have fallen due to the implementation of eff ective prevention
Engineering Association, the number of dams along the Lancang River
programmes. However, women in the general population and their un-
is to be increased to 15, with a total installed capacity of 25 605 MW,
born children are also at risk because so many men migrate to urban
construction is expected to be completed by the year 2020 (Xu &
centres in search of work (MRC 2003).
Moller 2004).
Hydropower
In the LMRB, most of the planned dam projects are located on
The region has a large potential for hydropower development, with
tributaries in Lao PDR. A concession agreement for the development
some dams already in commission (AMRC 2003). Over the past ten years,
of 23 hydropower projects, having a combined installed capacity
more than 100 large dams have been proposed by, for example, the
of around 6 800 MW and with an annual generation capacity of
Asian Development Bank (ADB) and the Mekong River Commission
38 000 GWh, has been signed (MRCS 1997). No new hydropower
REGIONAL DEFINITION
23
al. 2003). For generations farmers in the MRB have used waters
La
Power plant
nca
from the Mekong River and its tributaries to irrigate their crops.
ng
Installed capacity (MW)
Manwan
In 1999 in Cambodia, Vietnam and Lao PDR respectively about
Dachaogshan
China
7%, 30% and 40% of their total agricultural areas were irrigated
by farmers using waters from the Mekong River and its tributaries
Lanca
Myanmar
ng
(FAOSTAT 2004).
Vietnam
Manwan, 1 500 MW
About 10% of the Korat-Sakon Plateau in northeast Thailand has
Laos
been reported as irrigated, mainly supplementary wet season
Dachaoshan, 1 350 MW
Nam Ngum
Nam Leuk
irrigation, with a total irrigated area estimated at 450 000 to
900 000 ha. In the dry season, less than 100 000 ha are irrigated
Theun Hinboun
M
by means of a series of reservoirs deriving water from the
Thailand
ekon
Chulabhorn
Ubolratana g
tributaries of the Mekong River (MRC 1997b). In Cambodia in
Xeset
Pak Mun
1993, the total irrigated agricultural area was estimated to be
un
Houay Ho
Yaly, 720 MW
390 500 ha, of which 70% were provided with fully or partially
Yaly
Sirindhorn
controlled irrigation, the remainder being used largely for fl oating
er
ngk
Sa
Cambodia
Mek
Ph.
Dray Ling
rice production (FAO 1999). In the Mekong Delta of Vietnam,
ong
Ton
le S
irrigation has been of particular importance in view of the rapid
Theun Hinboun, 210 MW
a
Nam Ngum, Houay Ho, 150 MW
p
Pak Mun, 136 MW
agricultural development in this area. The total cultivated area in
Phnom Penh
Nam Leuk, 60 MW
Xeset, 45 MW
Ho Chi Minh City
Sirindhorn, 36 MW
1990 was estimated to be around 2.4 million ha, of which about
Chulabhorn, 15 MW
Ubolratana, 25 MW
1.0 million ha were irrigated. The introduction of fully or partially
Dray Ling, 13 MW
© GIWA 2006
controlled irrigation has tripled food production, mainly of
Figure 9
Location of the completed hydro-dams along the Mekong
River region
rice, from 4.5 million tonnes to 13 million tonnes between 1975
(Source: MRC 2003)
and 1995 (Phan 1996). In the Lowlands of the MRB, irrigation is
projects have been planned in the Thai part of the MRB since the
increasingly used to enable a second, and even a third, rice crop
most suitable sites have been developed. Although the tributaries in
as well as dry season or perennial cash-crops to expand rainy season
Cambodia have considerable potential for hydropower development,
production. The total irrigated area in the Chinese part of the UMRB in
no new projects have commenced since 2000. Vietnam has plans for
1990 was estimated to be 291 000 ha, 90% of which were located in
several hydropower projects along tributaries in the Central Highlands.
Yunnan province (Ringler 2001). Although large irrigation schemes have
Among them, the Yali dam with a capacity of 720 MW has been
been constructed on the Chi and Mun watersheds of the MRB, local
completed for operation (Chu el al. 2003). In addition, the MRC has
opposition to construction has slowed additional irrigation schemes.
plans to develop up to 13 run-of-the-river hydropower projects in the
In the Central Highland areas of the MRB, irrigation is limited and used
LMRB including nine sites with a total capacity of 14 000 MW, which are
primarily for rice and coff ee production (Ringler 2001).
considered to be priority projects by the MRC (MRCS 1994, MRCS 1995).
The existing hydropower dams in the MRB are shown in Figure 9.
Fisheries
Fish is the major source of low-cost and high quality protein for the
Agriculture and irrigation
people in the Mekong River Basin. Fisheries also provide income-
Agriculture is a dominant economic sector in the Mekong River Basin.
earning opportunities for the unemployed and under-employed local
About 75% of the population in the MRB is dependent on agriculture
communities. The Mekong River and its associated tributaries and
and fi sheries. In 1996, agriculture contributed 11% of Thailand's national
wetland habitats provide 70-80% of fi sh and other aquatic animals
income and 52% of Lao PDR's national income. During 1987 to 1997,
consumed by the LMRB's inhabitants (Hortle & Bush In prep.). The
growth in the agricultural GDP was largest in Vietnam at 5.4% per year
MRB, mostly the LMRB, supports one of the richest river fi sheries in the
and slowest in Cambodia at 3.6% per year. In 1996, at least one-third
world. Catches from the capture fi sheries constitute around 90% of the
of the economically active population in the MRB was reported to be
total fi sh production in LMRB. In 1998, total production of the capture
employed in agriculture. Cambodia has the largest share of labour
fi sheries from the MRB as a whole was around 1.16 million tonnes. Aqua-
employed in agriculture at 41% of basin's total labour force (Chu et
culture production comes mainly from the LMRB (Coates et al. 2003),
24
GIWA REGIONAL ASSESSMENT 55 MEKONG RIVER
where there are at least 2 million rural households involved in cultur-
Minerals and energy
ing fi sh. Total freshwater aquaculture production in the LMRB rose from
There are high geological and economic potentials for the development
60 000 tonnes in 1990 to 255 000 tonnes, valued at 244.6 million USD
of mineral commodities in the region (ADB/UNEP 2004). Mineral
per year in 2001 (MRC 2003).
resources include gemstones, alluvial gold, alluvial cassiterite, silica,
bauxite, calcite and construction materials. In addition to hydropower,
Navigation
energy resources include fuelwood, oil, natural gas, coal and lignite.
Inland water transport by boats and vessels navigating the Mekong
Oil, natural gas and coal occur in Myanmar, Cambodia and Yunnan
River and its tributaries is an important mode of transport particularly
province. The reserves are probably suffi
cient to meet future domestic
for bulk cargo. The Mekong River is navigable in various sections
needs (MRC 1997a, ADB/UNEP 2004). Fuelwood is a vital resource in
from Nandeba, in Yunnan province, to the Mekong Delta and into
most areas of the MRB and is used in 80-90% of the households in
the South China Sea. Almost all sections of the Mekong River and its
Cambodia (Sokhem pers. comm.).
associated tributaries are navigable during the rainy season when the
river water level is high, with the exception of a 14 km-long section
Legal and institutional frameworks
which contains the impassable barrier of the Khone Falls, just north
Various institutions and government agencies in the region are involved
of the border between Cambodia and Lao PDR (MRC 2003). Water
in addressing and managing water-related environmental issues and
transport in the MRB, particularly the LMRB, has traditionally been
problems. The functions and activities of these institutions/agencies are
the principal means of travel for much of the population, especially
illustrated in Annex III. Over recent decades, all the riparian countries of
for those in remote areas (Chu et al. 2003). It has been estimated that
the MRB have developed strategies, policies, laws, legislation and action
some 1.4 million Cambodians depend totally on inland waterways
plans (Table 8), while numerous national and international donors,
for transport, while in Lao PDR around 320 000 people depend on
funding agencies and NGOs have initiated study programmes and
water transportation for most of the year. In Vietnam about 73% of the
assessments to facilitate and support the management of the region.
country's cargo tonnage and 27% of its passengers travel by water, while
The programmes and initiatives as well as specifi c laws and legislation
Thailand makes the least use of water transport because the country
related to the environmental management of the region are provided
has the benefi t of extensive all-season roads (MRC 2003).
in Annex IV. These initiatives form a strong legal and institutional
framework playing vital roles in ensuring the environmental well-
Urbanisation and industrial development
being of the region.
Urban centres and industries in the Mekong River Basin depend very
much on the Mekong River and its tributaries for their water supply. For
Table 8
National initiatives for managing the environment of
the Mekong River region
example, around 60% and 30% of the population respectively of Phnom
State of
National
National
Sector action plans for
Penh in Cambodia and Vientiane in Lao PDR are connected to public
Riparian
UNCED
environ-
conser-
environ-
country/
national
Protected
Bio-
Tropical Wet-
water supply systems which draw waters from the Mekong River and its
ment
vation
mental
province
report
report
strategy action plan
areas
diversity forestry lands
tributaries. The total water demand per capita and domestic-industrial
Cambodia
1995
1995
1995
water demands in 1990 and 2020 are presented in Table 7.
Lao PDR
1995
1992
1993
1993
1995
1995
Under
Myanmar
1995
1992
Table 7
Total water demand per capita and domestic-industrial
Prep.
demand in the Mekong River region
Yunnan
1995
1991
1990
1995
Total demand
Domestic-industrial
Under
Thailand
1995
1992
Riparian country or province
per capita (mł)
demand (million mł)
prep.
1990
1990
2020
Vietnam
1995
1991
1985
1995
1993
1991
Yunnan province, China
250
121
328
(Source: MRC 1997a)
Thailand
350
725
1 467
Lao PDR
280
70
168
Cambodia
150
78
187
Regional cooperation and external
Vietnam
550
899
1 994
support agencies
Total
1 893
4 144
External support agencies (ESAs) have contributed signifi cantly
(Source: Ringler 2001)
to environmental management in the MRB, through supporting
bilateral and multilateral assistance in environmental management
REGIONAL DEFINITION
25
or assessment programmes (MRC 1997a). These programmes provide
and coordinate sustainable management and development of water
very signifi cant infl ows of foreign capital for capacity building, human
and related resources for the countries' mutual benefi t and the people's
resource development and technical studies related to environmental
well being by implementing strategic programs and activities and
management, totalling more than 800 million USD in 1995. They provide
providing scientifi c information and policy advice" (MRC 2003).
not only funding but also technical expertise. Multilateral programmes
are delivered by UN agencies, the World Bank, ADB, international
Transboundary issues and implications in
NGOs and others. Bilateral programs are often facilitated through
managing the Mekong River Basin
government international assistance agencies such as CIDA, DANIDA,
The Mekong River is a transboundary international waterway that
JICA, Sida and USAID. ESAs have funded environmental activities for
traverses six countries. The land, water, forest and fi sh resources are
almost 40 years. Recently, ADB has funded projects for strengthening
shared in a number of senses and at a number of scales among the
environmental institutions in the areas of training, NGO support,
riparian countries in the region (Hirsch 2004). Thus, water used by an
establishing legislation and regional standards and EIA. Some ESAs
upstream country may become unavailable to a downstream country
promote interest in technologies and services while others promote
on a temporary, seasonal or even permanent basis. Many transboundary
development initiatives such as infrastructure and energy development
environmental issues, such as the upstream-downstream watershed
(MRC 1997a, Chu et al. 2003).
dynamics of water quantity, quality and timing, the trade in timber and
non-timber forest products, and air pollution, have begun to receive
The MRC is a regional agency responsible for the overall management
attention as regional issues. Similarly, some actors and decision-
of the MRB with the participation of four LMRB riparian countries
makers in the region have begun to consider issues such as livestock
Thailand, Cambodia, Lao PDR and Vietnam. The MRC has the
movements, labour migration and public health as being of importance
vision of promoting "an economically prosperous, socially just and
to the regional environment.
environmentally sound Mekong River Basin" with a mission to "promote
26
GIWA REGIONAL ASSESSMENT 55 MEKONG RIVER
Assessment
Table 9
Scoring table for the Mekong River region.
This section presents the results of the assessment of the impacts
Assessment of GIWA concerns and issues according to
The arrow indicates the likely
of each of the fi ve predefi ned GIWA concerns i.e. Freshwater
scoring criteria (see Methodology chapter)
direction of future changes.
T
T
shortage, Pollution, Habitat and community modifi cation,
C
C
Increased impact
A 0
No known impacts
A 2
Moderate impacts
IMP
IMP
T
T
No changes
C
C
Unsustainable exploitation of fi sh and other living resources,
A 1
Slight impacts
A 3
Severe impacts
IMP
IMP
Decreased impact
Global change, and their constituent issues and the priorities
ts
ts
identifi ed during this process. The evaluation of severity of each
core**
Mekong River
ts
ts
issue adheres to a set of predefi ned criteria as provided in the
vironmental
t
her community
v
erall S
chapter describing the GIWA methodology. In this section, the
En
impac
E
c
onomic impac
Health impac
O
impac
O
Priority***
Freshwater shortage
2*
1
1
2
1.7
3
scoring of GIWA concerns and issues is presented in Table 9.
Modification of stream flow
3
Pollution of existing supplies
1
Changes in the water table
1
Pollution
2*
1
2
2
1.8
4
T
C
A
Freshwater shortage
IMP
Microbiological pollution
1
Eutrophication
2
Chemical
1
Modification of stream flow
Suspended solids
3
The fl ow volume of the Mekong River and its tributaries has been
Solid wastes
0
Thermal
0
modifi ed by changes in precipitation patterns and development
Radionuclides
0
activities, such as the construction of dams for hydropower, the
Spills
1
improvement of river navigation, and the diversion of river water for
Habitat and community modification
3*
3
1
2
2
1
irrigation, industrial development and human settlements.
Loss of ecosystems
3
Modification of ecosystems
3
Unsustainable exploitation of fish
3*
3
0
2
2.3
2
Urbanisation, human settlement and industrial development activities
Overexploitation
3
are increasing the water demand in the basin. Ringler (2001) estimated
Excessive by-catch and discards
1
that domestic and industrial water demand would increase more than
Destructive fishing practices
2
Decreased viability of stock
ND
two-fold from 1.89 billion mł in 1990 to 4.1 billion mł in 2020. The
Impact on biological and genetic diversity
3
majority of this demand will be met using water from the Mekong
Global change
ND
ND
ND
ND
ND
5
River and its major tributaries, with groundwater supplying a smaller
Changes in hydrological cycle
ND
proportion.
Sea level change
ND
Increased UV-B radiation
ND
Changes in ocean CO source/sink function
ND
2
In terms of the ratio of withdrawal to availability of water resources,
*
This value represents an average weighted score of the environmental issues associated to
the concern.
Vietnam has the highest ratio followed by the Yunnan province of China
**
This value represents the overall score including environmental, socio-economic and likely
while low ratios are observed for Lao PDR, Myanmar and Cambodia.
future impacts.
*** Priority refers to the ranking of GIWA concerns.
Although water resources in the MRB are currently considered to be
ASSESSMENT
27
under-exploited, per capita water availability is expected to decrease
southern Lao PDR. Modifi cation of the fl ow regime by dams and weirs
considerably in all of the riparian countries by 2020, except in Yunnan
has disrupted fi sh migration and spawning, resulting in a reduction in
province and Myanmar (Table 5).
the productivity of the fi sheries (Sverdrup-Jensen 2002, MRC 2003, ADB/
UNEP 2004). The next two dam projects, Xiaowan and Nuozhadu, will
The largest user of water is irrigated agriculture. It is estimated that
have much larger reservoirs and could further change river fl ow on a
water withdrawals for irrigated agriculture account for 94% of total
seasonal basis (MRC 2003).
withdrawals in Cambodia, 82% in Lao PDR, 91% in Thailand and 86%
in Vietnam (Chu et al. 2003). Over the past decade, the expansion of
Improvements to navigational routes will also permanently modify the
agriculture and the development of medium- and large-scale irrigation
course and volume of water fl ow in the Mekong River Basin (Sverdrup-
schemes in the region has led to the increased diversion of river water
Jensen 2002). In the UMRB, 11 major rapids and shoals and 10 scattered
to meet the demand. Urban centres and industries depend mainly on
reefs are being removed to allow the navigation of large vessels up to
the Mekong River and its tributaries for their supply. Total water supply
300 DWT. This will not only destroy important habitats, and spawning
to Phnom Penh in Cambodia and Vientiane in Lao PDR is expected to
and feeding grounds for fi sh, but will also modify downstream habitats
have increased from 155 000 mł/day in 1993 to 272 000 mł/day by 2010
due to changes in the fl ow regime and increased riverbank erosion
(Chea 1998). Water withdrawals for industrial and agricultural uses in
(Sverdrup-Jensen 2002). This will negatively aff ect fi sheries production
Yunnan province, Thailand, and Vietnam are close to 20% of total annual
in the region (MRC 2003, ADB/UNEP 2004). The increasing number of
internally renewable resources. All these development activities have
embankments in the basin is reducing the volume of fl oodplain storage.
been found to greatly modify the hydrological cycle, thus the fl ow
This is likely to result in increased discharge and high fl ood levels, both
volume of the Mekong River and its tributaries (MRC 1997a).
in the upstream and downstream parts of the basin (MRC 2003).
The construction of dams for hydropower development in the region
Further, deforestation and land clearance in upland areas is increasing
has also altered the fl ow regime in the basin. Hydropower development
the volume and speed of surface run-off which, in turn, is likely to
in the Lancang River Basin (UMRB) is typifi ed by the Lancang Cascade
increase the intensity and frequency of fl oods. The rapid expansion of
project. By 2020, up to 15 hydro-electric dams will be constructed along
urban settlements and infrastructure which replaces natural vegetation
the Lancang River with a total installed capacity of 25 605 MW (Xu &
with sealed surfaced structures including roads and buildings, could: (i)
Moller 2004). In the LMRB, most of the planned dam projects are located
reduce the time that intense rainfall takes to reach the streams, resulting
on the Mekong River's tributaries in Lao PDR.
in greater peak fl ows and a higher risk of sudden fl oods; and (ii) contribute
to fl ooding if they impede natural drainage patterns (MRC 2003).
The Lancang Cascade project is enhancing economic development in
the region by providing cheap electricity. It is also helping to relieve
Pollution of existing supplies
the severity of droughts and fl oods by regulating the river fl ow whilst
In general, water throughout the Mekong River Basin is of good quality
providing a suffi
cient volume of water for downstream hydropower
and well oxygenated. However, irrigation, the extraction of rock salt,
schemes (Chapman & He 2004, Liu 2004, He & Chen 2004). However,
and poor drainage has caused salinisation of the topsoil leading to
the current and planned dam construction and water diversion schemes
the deterioration of ground and surface water quality, in addition to
along the Mekong River and its tributaries, together with the fl ood
reducing agricultural productivity and degrading the soil (MRC 1997a,
control schemes in the Mekong Delta, are likely to substantially modify
Chu et al. 2003).
the annual fl oods and dry season fl ow levels in the future (MRC 1997a,
MRC 2003).
Although groundwater quality is generally good, in some areas it may
be contaminated by acids, mineral salts, nutrients (such as nitrates and
Since the completion of the Manwan and Dachaoshan dams, the
nitrites) and toxic chemicals due to the intrusion of saline water, and
Mekong River's fl ow pattern has changed, sediments are trapped
leaching from soils and pit latrines. While in northeast Thailand the
behind the dams and there have been a number of associated
groundwater salinity is often high due to the presence of rock salt, in
environmental impacts, including the degradation of wetlands
the Vietnamese Mekong Delta the groundwater is contaminated by
(Roberts 2001, Snidvongs et al. 2003). The reduction in suspended
salt water intrusion from the coastal sea, acid sulphate leaching from
sediment concentrations resulting from sediment being trapped
soils, and the infi ltration of agricultural run-off (Chu et al. 2003). There
behind the Manwan Dam is apparent as far downstream as Pakse in
are 750 000 ha of arable agricultural land in the Vietnamese part of the
28
GIWA REGIONAL ASSESSMENT 55 MEKONG RIVER
Delta aff ected by saltwater intrusion during the dry season, rendering
the area unsuitable for crop production. Eff orts have been made to
er
Cambodia
control saltwater intrusion by blocking seawater using sea dikes and
Sangk
Ph.
water-gate systems. Although these measures have facilitated the
Me
expansion of agricultural land, they have also led to adverse impacts,
kong
such as a deterioration in the quality of freshwater used for domestic
Tonle
consumption and animal husbandry (MRC 1997a, Chu et al. 2003).
Sap
Phnom Penh
Vietnam
Even though the impact of this GIWA issue was considered to be slight,
the expansion of development activities will increase pollution levels
Ho Chi Minh City
in the water supplies of the basin (MRC 1997a).
Changes in the water table
Overextraction of groundwater for use in the production of high-value
crops, such as coff ee, has led to a severe drop in groundwater levels
in many areas of the Vietnamese highlands. Over the past decade,
Figure 10 Extent of fl ooding in Cambodia and Mekong Delta
(Source: MRC 2003)
groundwater has been extensively abstracted for domestic consumption
and agricultural use in the Cambodian part of the basin. The rate of
the problem of acid sulphate soils, limited freshwater supply during the
extraction has increased from 120 000 mł/day in 1997 to 290 000 mł/
dry season is a constraint for agricultural and aquacultural development
day in 2000 (Chu et al. 2003). However, the current rate of groundwater
in the Plain. A Mekong Delta Master Plan which aims to address the
extraction has not caused any signifi cant lowering of the water table
acid sulphate soil and limited freshwater supply problems has been
in the majority of the basin (Chu et al. 2003). The impact is therefore
prepared by the MRC (MRC 1997a, MRC 2003).
considered slight. Although total potential capacity of the groundwater
resources in the region is high (60 million mł/day), the intensifi cation of
The heavy rainfall that predominates during the rainy season usually
agricultural activities in the highland areas of the MRB may result in the
causes fl ooding in the lowland areas of the basin, resulting in negative
overextraction of groundwater for crop production, which is likely to
socio-economic impacts. The recurrent fl oods cause varying degrees
deplete groundwater resources in the future (Chu et al. 2003).
of damage to agricultural production, rural infrastructure and human
settlements, and loss of life and property. They also disrupt people's
Socio-economic impacts
social and economic activities throughout the basin (FAO 1999, MRC
Currently, freshwater shortage per se does not appear to pose any
2003). For instance, a severe fl ood that occurred in 2000 (Figure
signifi cant socio-economic problems to the region. However, economic
10) aff ected (i) 22 of the 24 provinces of Cambodia involving over
development and population growth will increase water demand, and
3.4 million people with a death toll of 347, 80% of them being children,
the extensive development of hydropower schemes will signifi cantly
and causing physical damage totalling 161 million USD; (ii) 1 200 villages
alter the hydrological cycle.
in seven provinces of Lao PDR involving 395 600 people, causing
widespread damage to irrigation systems, rural road infrastructure
Negative socio-economic eff ects of changes in the fl ow regime caused
and large parts of provincial towns, as well as the loss of around 10%
by hydropower development include: (i) a reduction in alluvial deposition
of the wet rice production totalling 20 million USD; and (iii) 5 million
causing a decline in agricultural productivity unless substituted with
people in the Delta in Vietnam, with over 500 deaths, 825 000 homes
chemical fertiliser and increased irrigation; and (ii) a decrease in fi sheries
and thousands of kilometres of national and provincial roads damaged
productivity due to water level fl uctuations, the deterioration of water
or destroyed, where the total cost of fl ood damage amounted to
quality, and the impediment of migratory fi sh (MRC 1997a). Navigation
285 million USD. In 2001, the fl ood in the LMRB inundated about
improvements may result in loss of environmental aesthetics due to the
47 350 km˛ of farmland, aff ected the livelihoods of 2.8 million people
disappearance of rocks and rapids.
and damaged 5 300 km of roads. Flood management and mitigation
has thus become a priority issue at the national and regional levels,
The Plain of Reeds, the north-western extension of the Mekong Delta,
especially in the aftermath of the disastrous fl oods which occurred in
is generally productive in agriculture, forestry and fi sheries. Apart from
2000 and 2001 (MRC 2003).
ASSESSMENT
29
T
C
A
Pollution
IMP
campaign of agricultural intensifi cation will increasingly contaminate
surface and ground waters in the basin with agro-chemicals (MRC
Microbiological
1997a, Chu et al. 2003).
In water, faecal micro-organism indicators reach medium to high levels
in all the surface waters of the Mekong River as well as in its tributaries,
The soil on around 1.6 million ha of land in the Plain of Reeds, Long
canals and ponds. Surveys showed that 98.5% of dug-well water
Xuyen Quadrangle, and the Ca Mau peninsula in Vietnam are highly
samples were contaminated. Consequently, there is a high prevalence
acidic, have high levels of potentially toxic aluminium and iron sulphide,
of diarrhoea and intestinal parasites in densely populated parts of
and low levels of phosphorous. Run-off from land with acid sulphate
the basin. Generally, the major urban centres have limited sewage
soils which have been converted for agriculture (e.g., rice fi elds) has
treatment services, resulting in the discharge of raw or inadequately-
harmed aquatic life, including fi sh cultured in the converted rice fi elds.
treated sewage (ADB/UNEP 2004). The situation of microbiological
Although farmers can mitigate the problem of acid sulphate soils by
pollution in the region is, however, still localised and insignifi cant
using more water and fertilisers in their crop production, the method
(Fedra et al. 2004). The impact of this GIWA issue is considered slight.
increases water consumption and nutrient build-up which is unlikely to
Although the situation is unlikely to change much in the future, the
be environmentally sustainable (MRC 2003).
implementation of the Mekong Basin Development Plan (MBDP) by
the MRC may improve sanitary conditions in the forthcoming decade
Mining activities, such as gemstone mining in Thailand and Myanmar,
(MRC 2003).
copper mining in Yunnan province of China, lignite mining in Lao PDR,
as well as the paper factories in Thailand and around Phnom Penh, also
Eutrophication
contribute to chemical pollution in localised areas of the region (MRC
With increasing population densities and the intensifi cation of
1997a, MRC 2003, Li 2004). However, the toxic contamination of water
agricultural crop production, increasing amounts of domestic
and fi sh does not appear to have reached critical levels (Try pers. comm.).
wastewater and agricultural run-off with a high nutrient content have
The situation is unlikely to change signifi cantly in the foreseeable
been discharged into the Mekong River and its tributaries during the
future as mining activity in the region is unlikely to expand. In addition,
past two decades. Tributaries in northeastern Thailand have shown
measures are being taken by the Vietnamese government and MRC to
signs of eutrophication. In the Mekong Delta, where population density
restrict and eff ectively manage the use of chemical fertilisers by farmers
is the highest, eutrophication events occur every year (Fedra et al. 2004).
in the Delta as well as in other areas of the basin (MRC 2003), this may
Although eutrophication of the water bodies in the region is common,
help to alleviate future chemical pollution in these areas. The impact of
its occurrence is still localised. The impact is considered to be moderate.
chemical pollution is considered to be slight.
Unless eff ective measures are taken to control the excessive use of
agricultural fertilisers, particularly those with a high phosphate content,
Suspended solids
and the discharge of untreated or inadequately treated domestic and
In the past decade, development activities, such as deforestation,
industrial wastes from urban centres, eutrophication will become more
mining, grazing and urbanisation, have caused extensive erosion in
frequent and widespread.
Table 10
Total suspended solid loads in the mainstream and
Chemical
tributaries of Mekong River
Chemical pollution in the region mainly originates from agricultural
Monitoring stations
Total suspended solid (tonnes/km˛)
run-off containing the residual contents of pesticides and chemical
(A) Mainstream Mekong River
fertilisers. The Mekong Delta and the lake Tonle Sap are hot spots where
Chiang Saem
356
Vientiane
221
chemical pollution often occurs. Agricultural activities are extensive in
Nakhon Phanom
183
these two areas. In the Delta, chemical fertilisers are extensively used
Pakse
249
Average for mainstream Mekong River
252.2
to enhance rice production. The Vietnam Ministry of Agriculture and
(B) Tributaries of Mekong River
Rural Development estimated that the quantity of agrochemicals used
Nam Mae Kok
77
by farmers in the Delta has increased three-fold between the late 1980s
Nam Karn
15
Nam Ngum
72
and mid-1990s (Petersen 2003). Promotion of the cultivation of more
Nam Mun
14
Se Done
249
cash crops and intensive farming methods by the governments of the
Average for Mekong River tributaries
85.4
riparian countries has led to the increased use of agro-chemicals. This
(Source: MRC 1997, Chu et al. 2003)
30
GIWA REGIONAL ASSESSMENT 55 MEKONG RIVER
many parts of the basin, resulting in high loads of total suspended
habitats for fi sh spawning and feeding have been altered as a result of
solids. This is indicated by high turbidity levels in the mainstream
increased siltation. This has aff ected the productivity of the fi sheries.
and tributaries of the Mekong River (Table 10). For instance, in the
Eff orts by the riparian countries to enhance reforestation and protect
upland steep slopes of Cambodia and Yunnan province as well as in
ecosystems in the region are likely to make some progress in controlling
the shoals of lake Tonle Sap's river system, the turbidity has exceeded
erosion in the future (MRC 2003).
1 000 mg/l, while in the mainstream of the Mekong River it has exceeded
400 mg/l. In Cambodia, at the merging point of the Tonle Sap River and
Solid wastes
the Mekong River there are high Total Suspended Solid (TSS) loads and
Solid waste pollution resulting from tourism development and the
the same is true in the Delta, at the confl uence of the Bassac River and
proliferation of urban centres in the basin is mainly localised and
the Mekong River. Poor management of land in the Yunnan highlands,
the issue is still insignifi cant (MRC 2003, Leksakundilok 2004) and it
where the average slope is 33%, has caused signifi cant erosion in about
is considered to have no transboundary consequences. The situation
29% of the Lancang River Basin (MRC 2003).
may deteriorate with the increased generation of solid wastes as a
consequence of higher living standards, increased urbanisation and
The average turbidity of the Mekong River (294 mg/l) is considered to
enhanced tourism development. However, increased public awareness
be high but not as high as that of the Irrawaddy River (607 mg/l) and
of the need for environmental protection, combined with eff orts taken
Ganges River (1.13 mg/l) (MRC 1997a). The impact of this GIWA issue was
by the governments of the riparian countries to develop sanitary
considered to be severe.
landfi lls, recycle wastes and to develop waste incineration plants in
urban centres and tourist areas, may avert any future threats from the
All countries in the basin contribute to the sediment loads of the
increased generation of solid wastes (MRC 2003).
Mekong River. Deforestation for timber or fuelwood supplies, and
the conversion of the basin's forestland to agricultural use and human
Thermal
settlements is leading to increased erosion and higher suspended solid
Thermal pollution due to discharges from nuclear power plants or other
concentrations in the freshwater environment.
turbine energy generation plants is insignifi cant, as most of the power
supply within the region comes from hydropower generation (Chu et
Shift cultivation for economic crops is widely practiced in the upland
al. 2003). The issue is considered to have no impact and this is unlikely to
areas of the basin. It can be sustainable but population growth and
change much in the future. Although demand for energy in the region
increased food demand has led to more farmers in the upland areas
is expected to increase with economic development, the region has a
practicing this method, resulting in the shortening of the fallow
high hydropower development potential (Chu et al. 2003).
period and the clearance of more forest. This has led in turn to forest
degradation and soil erosion which contributes further sediment into
Radionuclides
the aquatic environment (MRC 1997a, Chu et al. 2003).
This GIWA issue is considered to have no environmental impact at the
moment, as there is no nuclear power plant in the region (Chu et al.
The sediment trapping dynamics of the river system are diff erent in
2003). Future developments are unknown.
the two types of hydro-dams the storage dams and run-of-the-river
dams proposed or already built in the basin. The storage dams have a
Spills
potential to trap large amounts of sediment as compared to the run-of-
The impact of spills is considered to be slight as some oil spills do
the-river dams. Such sediment trapping could disrupt the biodiversity
occur in the Mekong Delta area where there is busy shipping traffi
c.
and productivity of downstream river ecosystems (MRC 1997a). The
Otherwise, the situation is currently insignifi cant in the basin. No
productivity of the lake Tonle Sap and its river system in Cambodia is
chemical spills have been recorded (Petersen 2003, Fedra et al. 2004).
threatened by the changes in sediment transport caused by upstream
The risks of spills may increase if improvements to the navigation routes
dam construction, deforestation, gem mining, land conversion and
in the mainstream of the Mekong River, particularly along its upper
improper irrigation development (MRC 2003).
reaches, lead to increased shipping traffi
c (Fedra et al. 2004).
Although mining activities in the basin are relatively limited, some of
Socio-economic impacts
these operations have caused erosion and reduced water quality in
Pollution from non-point sources, including the run-off from agriculture,
parts of northeast Thailand and western Cambodia (MRC 1997a). Critical
mining, logging and land-clearing as well as residential and commercial
ASSESSMENT
31
development, has adversely aff ected the habitats of economically
A recent study by MRC indicated that this deforestation rate means
important fi sh species. The consequential reduction in fi sheries
that much of the forest cover in the MRB is likely to be lost over the
production has decreased the income of the local communities who
next century (MRC 2003). With the population growing quickly, the
depend on these fi sheries for their livelihood.
demand for wood products is likely to increase, accelerating the rate
of deforestation.
There has been an increasing incidence of gastro-intestinal diseases due
to the consumption of polluted water from the Mekong River during the
Large areas of mangrove forest, a critical coastal habitat, have been
past decade (ADB 2004). Diarrhoea is prevalent throughout Lao PDR,
destroyed during the past two to four decades due to wartime
Cambodia and Vietnam, especially in the densely populated Mekong
hostilities and post-war agricultural expansion, as well as conversion
Delta where the sanitary standards are low.
to shrimp ponds. Nowadays, the total area of mangrove forest in the
Mekong Delta amounts to only 120 000 ha (Snidvongs et al. 2003).
Because water pollution can exert profound impacts on the economic,
social and health aspects of communities, it has generated wide interest
Considerable areas (over 10 000 ha) of the following habitats were
and concern amongst the governments and public of the region. Eff orts
reported to be lost to development over the last two decades: peat
aimed at combating pollution problems are being made by the riparian
bogs and marshlands in the Mekong Delta; running-water wetlands
countries and the MRC (MRC 2003).
in parts of the MRB in Thailand, Lao PDR, Yunnan province, Cambodia
and Vietnam; fl ooded forests in the Cambodian part of the MRB; and
estuaries around the Mekong Delta (Torell et al. 2001, Snidvongs et al.
2003, Friederich 2004). Widespread destruction of mangrove wetlands
T
C
A
Habitat and community
IMP
has caused numerous adverse environmental impacts such as excessive
modification
sediment transport, shoreline erosion and the destruction of nursery
and breeding grounds for fi sh and shrimps (MRC 1997a). Uncontrolled
Loss of ecosystems or ecotones
deforestation in the MRB is resulting in a loss of biodiversity and critical
Numerous critical habitats in the MRB have been lost over the past
habitats (MRC 2003, ADB/UNEP 2004). Shoreline development, such
decades, due primarily to increased development activities. The
as port development, and navigation improvements could result in
spraying of defoliants and napalm during the Vietnam War of the late
the loss of habitats for terrestrial wildlife. The impact of the loss of
1960s and the development of paddy fi elds has reduced the total area
ecosystems or ecotones is considered to be severe.
of the Melaleuca Forest from 174 000 ha in 1972 to 110 000 ha in 1985.
The area increased slightly to 120 000 ha at the beginning of the 1990s
Governments of the riparian countries in the MRB are aware of the
following some rehabilitation (Le 2004). In the province of An Giang in
implications of unsustainable logging and the associated loss of
the Delta area, the extent of the Melaleuca forest is reported to have
forestland. Regulatory measures to control logging and timber trades
declined from 40 000 ha to 4 000 ha, from about 16% to 1.6% of the
have thus been imposed by the riparian governments to curtail the
provincial area, since the 1980s (MRC 1997a). Apart from its commercial
eff ects of a previously uncontrolled timber industry (Oxfam 2004).
value of providing valuable timber for construction, the forest also plays
These measures may help to arrest the loss of forestlands in the future.
an important role in maintaining the well-being of the Mekong Delta's
The situation for other types of habitat in the region may slightly
ecosystem (MRC 1997a) by:
improve as a result of eff orts being made by the MRC, NGOs, donor
Preventing acidifi cation of the topsoil and surface water;
agencies and the governments of the riparian countries (MRC 2003).
Storing freshwater for human and wildlife uses;
Reducing water velocity during the fl ooding season, thus
Modification of ecosystems or ecotones,
minimising fl ood damage;
including community structure and/or species
Helping in sedimentation and storage of silt, thus enriching soil
composition
fertility;
Several ecosystems or habitats in the region have been modifi ed
Providing suitable nursery and breeding grounds for fi sh; and
or degraded resulting in various degrees of change in biodiversity,
Supporting high biodiversity and other benefi ts similar to those
species composition and community structure. The degradation of
provided by mangrove forest.
the ecosystems, thus the critical habitats therein, has become one of
the main concerns in recent years. For instance, millions of hectares of
32
GIWA REGIONAL ASSESSMENT 55 MEKONG RIVER
valuable forests have been degraded to inferior scrub, grasslands or
arising from outside the fi sheries sector. Fisheries activities that
savannah, or have been encroached upon by subsistence agriculture.
can impose direct threats to aquatic biodiversity include: (i) the
As a result, soil conditions have deteriorated, with increased water
use of destructive fi shing methods such as explosives, poisons and
discharge and erosion (Fedra et al. 2004). In the Lancang River Basin
electrocution; (ii) exploitation of fi sh at vulnerable stages, such as at
(UMRB) in Yunnan province about 70% (3.5 million ha) of the total
spawning times; and (iii) fi shing in sensitive areas such as spawning
grassland area has been degraded by the spread of inferior shrubs or
grounds. Impacts on aquatic biodiversity arising from outside the
bushes due to development activities (Zhou 1999).
fi sheries sector involve changes in the environment and habitats of
rivers resulting from development, including:
Wetlands in the MRB face many threats including: aquaculture and
Destruction of local spawning grounds or dry season refuges as a
the increased practice of destructive fi shing methods; introduced fi sh
result of stream-bed dredging, removal or alteration of vegetation,
species; deforestation; weed infestation (e.g. by Mimosa pigra); use of
and bank modifi cation;
DDT and other persistent organochlorine pesticides; saline intrusion
Local changes in the quality (e.g. pollution) and quantity of water
and pollution; acid sulphate soils; loss of wetland wildlife from hunting
available as a result of storage in dams and abstraction for irrigation;
and habitat destruction; reclamation schemes, drainage, dredging and
and
fi lling; irrigation leading to salinisation; sedimentation and erosion; and
Construction of barriers (dams, weirs, diversions) which, apart from
fl ood control and hydropower development.
creating local environmental disturbances, act as physical barriers
to fi sh migration.
In the Tri Ton area of the Mekong Delta, more than 350 000 ha of
Melaleuca wetlands have been degraded with extensive outgrowth
The impacts may signifi cantly reduce aquatic productivity and
of inferior shrubs (Le 2004). It has also been reported that large areas
biodiversity. Industrialisation and urbanisation in the MRB are currently
of (i) peat bogs and marshlands in Vietnam and Cambodia have been
relatively limited, and so far have had little environmental impact, except
altered due to infestation by bugs; (ii) fl ood forests around the lake Tonle
locally. But as populations grow and development pressures increase,
Sap have been severely modifi ed by outgrowth of a shrub, Mimosa; (iii)
aquatic life is likely to be aff ected. Also, the negative consequences of
rice fi elds have been substantially modifi ed by the farming of diff erent
deforestation, inappropriate agriculture, road construction, hydropower
varieties of rice or other economic crops; (iv) Alpine wetlands in
and other forms of development are already evident (Coates et al.
Yunnan province have been greatly modifi ed by the extensive grazing
2003).
of farmed animals; and (v) mangrove swamps around the Mekong
Delta have changed where pollution has promoted colonisation by
The introduction of alien species to the MRB was undertaken for
diff erent species of mangrove (Lacoursiere et al. 1998, Torell et al. 2001,
four major purposes: aquaculture, stocking of lakes and reservoirs,
Friederich 2004).
pest control (e.g., mosquito) and the aquarium trade (Welcomme &
Vidthayanom 2003). Annex VI provides a table listing the species that
In recent years, the water quality of the lake Er Hai has deteriorated
have been introduced to the region and describes the status of their
mainly because of the mismanagement of waste from the wood
introduction. Many of these species have now become established in
pulp factories and sedimentation from timber harvesting, as well as
the ecosystems and some have even become the major aquaculture
the impact of marble quarrying. Increases in non-point run-off from
species. Welcomme & Vidthayanom (2003) have reported that about
agriculture, animal husbandry and fi sh farming have further degraded
seventeen of the species introduced into the MRB have either formed
the lake's water quality over the past 10 to 15 years (ADB/UNEP 2004).
established populations or have strong possibilities of doing so, and a
large number of species are also moving within the MRB as part of the
The increased reclamation of fl oodplains and wetlands has decreased
aquarium fi sh trade.
their water storage capacity, thus increasing the intensity of fl oods.
Some unusually severe fl oods (e.g., those of 2000) have also greatly
Currently, the impacts of introduced species appear to be relatively
modifi ed several aquatic habitats in the region, changes which may be
minor and the positive impacts of the introductions have far outweighed
irreversible (MRC 2003, Chu et al. 2003).
any negative eff ects (Welcomme & Vidthayanom 2003). Table 11 gives
some examples of introduced alien species and describes some of their
Threats to the aquatic biodiversity of the MRB arise from two main
benefi ts and negative eff ects. Established species such as Nile tilapia
sources: the impacts of fi sheries activities themselves and impacts
(Oreochromis niloticus), Black sucker catfi sh (Hypostomus plecostomus),
ASSESSMENT
33
Table 11
Examples of alien species introduced to the Mekong
further due to increased pressure on ecosystems from economic
River Basin
development and population growth.
Introduced/exotic
Description of the introduction
species
The African catfish was first introduced into Vietnam from the Central African
Socio-economic impacts
Republic in 1974 for aquaculture, and into other riparian countries by internal
A number of human and development activities (e.g., population
African catfish
transfer. A wild population of the fish has established itself throughout the
(Clarias gariepinus)
MRB. The fish and its hybrids are highly tolerant of poor water quality and
growth, deforestation, urbanisation, dam construction, irrigation)
deoxygenated conditions. This tolerance gives the species and the hybrid a
competitive advantage over native clariid catfish.
have threatened the existence of wetlands and their critical habitats
It was introduced from China and Hong Kong to Thailand in 1932, to Vietnam
in the MRB which, subsequently, have greatly impacted the social and
Grass carp
in 1958 and to Lao PDR at an undetermined date. It has been used to stock
(Ctenopharyngodon
reservoirs, ditches and canals as a control for invasive aquatic vegetation. The
economic well-being of local communities. The livelihood of many
idella)
species does not breed naturally in any part of MRB.
inhabitants in the MRB depends on wetland resources (Snidvongs et
The species was introduced into Thailand from China, Japan, Israel and
Germany from 1913 onwards, into Lao PDR from Thailand and India in
al. 2003). The socio-economic impacts include (Fedra et al. 2004):
1977, and into Vietnam from Hungary during the period 19691975. The Com-
Economic losses of rural communities who subsist on the services
mon carp has been the keystone species of many aquaculture development
projects in the MRB. The species complex is widely established in the wild and
or output of habitats such as rice fi elds, rivers and mangroves;
Common carp
in many areas is regarded as a permanent element of the fauna. Common carp
(Cyprinus carpio)
are notorious for the way their populations rapidly increase following envi-
for instance, Cambodia used to export large amounts of fi sh but
ronmental disturbances by dams. Their habit of digging around in the bottom
nowadays local consumption for certain species of fi sh has to be
and muddying the water can seriously alter the environment to the detriment
of other species. Given that the species is now firmly established, there seems
met by imports;
little that can be done to eradicate this potentially troublesome fish.
Economic losses in tourism due to habitat disturbance through loss
The species was introduced into drainage ditches throughout the MRB at an
unknown date for mosquito control, escaping later into the main tributaries of
or modifi cation, and the costs infl icted by coastal erosion resulting
Mosquito fish
the Mekong River. It is now found at the margins of most water bodies includ-
(Gambusia affinis)
ing rice fields and floodplain lakes. The species is tolerant of high salinity and
from reduced shoreline protection from the loss of mangrove,
it is not regarded as detrimental although its habit of eating eggs and larvae of
grasslands, forestland, etc;
other fish may do some damage to fish stocks.
This introduced species is one of the most popular for aquaculture and for
Impact on the food security of rural communities who have to fi nd
stocking into dams and reservoirs. It was introduced into Thailand from Japan
alternative food sources due to the loss or modifi cation of habitats;
in 1965, into Vietnam in 1973 and 1994 from Taiwan, the Philippines and
Nile tilapia
Thailand, and into Lao PDR and Cambodia at an unknown date. The species
for instance, 85% of the rural communities of Cambodia rely on fi sh
(Oreochromis niloticus)
is not known to have any detrimental environmental impact throughout its
introduced range. It is one of the few species that can readily digest blue green
as their main source of food nutrition and, therefore, a shift in the
algae and as such is of value in the control of eutrophication.
type of food they consume (due to decreased fi sh catch) to other
These species have been introduced from various sources into Thailand for
aquaculture from 1988 onwards. Apple snails have now established in the wild
less nutritious foods would cause malnutrition;
and have had a major impact on aquatic habitats, including rice fields, because
Loss or modifi cation of habitats would force the rural communities
Apple snails
they destroy the bases of growing aquatic plants, causing enormous economic
(Pomacea
losses for rice farmers and the degradation of natural wetland habitats by
to change their livelihood which may disrupt their social structure
canaliculatus, P. gagas)
stripping vegetation. In addition, the introduced snails compete with endemic
species of snails, such as Pila spp., which are relatively benign in their effect,
and social coherence, and result in migration to urban areas in
since they feed only on moribund plants. Apple snails are tolerant of salinity
search of employment; and
and are thus able to penetrate coastal habitats.
(Welcomme & Vidthayanom 2003)
Loss of cultural heritage sites may aff ect the social integrity of rural
communities.
Guppy (Poecilia reticulate) and Mosquito fi sh (Gambusia affi
nis) appear
to have no notable adverse consequences. However, some impacts to
Ecosystems are likely to be degraded further in the future. Due to the
the environment of the MRB have been reported. For instance, there
reliance of the inhabitants of the MRB on the natural environment, this will
are some suggestions that hybrid African catfi sh (Clarias gariepinus)
exacerbate the negative socio-economic impacts highlighted above.
are contributing to the decline in native Catfi sh (Clarias batrachus) and
that established populations of Rohu carp (Labeo rohita) may damage
native species of the same genus (Welcomme & Vidthayanom 2003).
T
C
A
Aquaculture in the MRB relies heavily on the introduced species and will
Unsustainable exploitation of
IMP
probably continue to do so unless satisfactory alternatives are found
fish and other living resources
among the native species.
Overexploitation
The impact of the modifi cation of ecosystems or ecotones is considered
Studies show that catches per fi sherman have declined by about
to be severe. The damaged ecosystems in the MRB are unlikely to be
44% between the 1940s and 1995. But over the same period, the
restored in the next two to three decades. Instead, they may deteriorate
total fi sh yield in the lake Tonle Sap area has increased by 84% from
34
GIWA REGIONAL ASSESSMENT 55 MEKONG RIVER
125 000 tonnes to 230 000 tonnes. Catches per fi sherman have declined
Decreased viability of stock through pollution
because the number of fi shermen has greatly increased. Population
and disease
growth has also increased demand for fi sh products and has, thus,
There is no conclusive evidence or suffi
cient data to demonstrate
intensifi ed fi shing eff ort (MRC 2003). Destructive fi shing practices and
that the viability of fi sh stocks has decreased because of pollution
the steady loss of fl ooded forests have had an negative eff ect on the
and diseases. The pollution load of the aquatic environment has
abundance of fi sheries resources, which has led to middle-scale and
increased due to urbanisation, industrialisation and greater agricultural
family fi shermen in the region complaining about decreasing Catch
production. Although water pollution is currently not believed to be a
Per Unit Eff ort (CPUE) (van Zalinge et al. 1998). According to Sverdrup-
threat to the fi sheries, pollution from agricultural run-off and industrial/
Jensen (2002) the changes in the species composition and the decline
domestic wastes high in nutrients and other harmful pollutants
in the abundance of larger, slower growing species indicates that
could become a concern in the future as governments promote the
the present exploitation rate is too high. Future increases in annual
commercialisation of agriculture and industrialisation (Sverdrup-Jensen
catches in heavily exploited areas would be unsustainable. In less
2002, MRC 2003, ADB/UNEP 2004).
exploited areas, there is some scope for modest catch increases. Other
living resources are also extensively hunted and traded in all the MRB
Impact on biological and genetic diversity
countries by many vendors, middlemen and international dealers. There
The introduction of foreign or alien species for aquaculture, biological
is signifi cant cross-border trade in wildlife (MRC 1997a).
pest control and the aquarium trade has become a common practice in
the region since the early 1960s (Welcomme & Vidthayanom 2003). Alien
The impact of overexploitation is considered to be severe. The situation
species such as Mrigal (Cirrhinus cirrhosus), North African catfi sh (Clarias
may improve as result of the Fisheries management programme of the
gariepinus), Mosquitofi sh (Gambusia affi
nis), Albino strain (Helostoma
MRC and the governments of the riparian countries strengthening
temminki), Rohu (Labeo rohita), Mozambique tilapia (Oreochromis
capture fi sheries management (Sverdrup-Jensen 2002).
mossambicus), Nile tilapia (Oreochromis niloticus), Guppy (Poecilia
reticulate), Suckermouth catfi sh (Pterygoplichthys plecostomus) (more
Excessive by-catch and discards
than one species may be present) seem to have established breeding
The by-catch and discards of fi sh are insignifi cant in the region because
populations in much of the MRB. Other introduced species such as the
almost all fi sh caught, no matter how small, are either consumed or sold
Grass carp (Ctenopharyngodon idella), Catla (Gilbelion catla) and numerous
in the markets (Sverdrup-Jensen 2002). Discards of small and low-value
aquarium species are used widely for aquaculture but have not shown
fi sh are rare. The impact of this issue is slight and the situation is unlikely
any evidence of having become established (Welcomme & Vidthayanom
to change in the future.
2003). The practice of introducing alien species for aquaculture and other
purposes has substantially replaced indigenous fi sh species, reduced
Destructive fishing practices
biodiversity, introduced disease and parasites as well as resulting in
The most common destructive fi shing practices employed in the
hybridisation and loss of genetic diversity (MRC 2003).
region include the use of fi ne-mesh nets to capture Catfi sh fry for
raising in cages and ponds (such nets also capture the fry of 160 species
Given the chaotic nature of current practices for species introductions and
unwanted for aquaculture), and the use of electricity, poison and
species movements within the MRB, the risk of spreading diseases within
explosives to kill fi sh (MRC 2003). Such practices extensively destroy
the aquaculture sector and degrading the genetic quality of wild and
fi sh spawning grounds and decrease fi sh recruitment, thus aff ecting the
aquaculture stocks is becoming a concern (Welcomme & Vidthayanom
overall productivity of the fi sheries. The use of destructive practices has
2003). The impact of this GIWA issue is considered to be severe.
become increasingly common over the last decade (Sverdrup-Jensen
2002).
Socio-economic impacts
Many people are employed in the capture fi sheries sector in the MRB,
The impact of this issue is considered to be moderate. Regulatory
especially at the small-scale and household level. Virtually all farming
measures to control the destructive fi shing practices in the region are
households fi sh part-time or on a seasonal basis, and captured fi sh make
being, or will be, implemented by the riparian countries (MRC 2003).
a signifi cant contribution to their food security. According to the Lao
With sound enforcement of the regulatory measures, the situation may
PDR 1998 agricultural census, 71% of all the country's farm households
gradually improve.
were engaged in fi shing, equivalent to 2.9 million people dependent
to varying degrees on the fi sheries. Statistics from the northeast Thai
ASSESSMENT
35
part of the MRB show even higher levels of participation. Throughout
Chu et al. (2003) reported the predicted global climate impacts in the
the LMRB at least 40 million rural dwellers are active in the fi shery and
region based on other prediction models:
for most rural households fi sh are important for family nutrition and
As a result of the seasonal shifts in weather, the MRB will experience
income generation (Sverdrup-Jensen 2002). Reduced catches as a result
more annual fl oods, droughts, and tropical cyclones;
of the overexploitation of stocks has aff ected the income, health and
Geographically,
the
eff ects of the El Nińo Southern Oscillation
overall livelihood of rural communities. Consequently, there has been
(ENSO) phenomenon will be much more extensive. The ENSO has
increased migration from rural populations to urban centres. This has
an especially important infl uence on the weather and inter-annual
disrupted the economic and social well-being of rural communities
variability of climate and sea level, particularly in the western Pacifi c
(Sverdrup-Jensen 2002). In the next two decades, fi sh stocks will
Ocean and the South China Sea adjoining the MRB;
continue to decline and this will increase rural unemployment and the
There will be signifi cant eff ects on agriculture in many parts of the
severity of associated social problems (Sverdrup-Jensen 2002).
MRB, particularly impacting low-income populations that depend
on isolated agricultural systems; and
Water shortages in Thailand's part of the MRB and salinity intrusion
in the Mekong Delta will be exacerbated.
Global change
The workshop participants unanimously agreed that the overall impact
of global change is far reaching, aff ecting every ecosystem in the region.
Priority GIWA concerns/issues
Presently, there is insuffi
cient data to demonstrate conclusively the
and their transboundary
current impacts of this concern. Thus, the environmental and socio-
implications
economic impacts of this concern have been scoped as unknown.
Some studies have made theoretical predictions of the likely impacts
Priority GIWA concerns/issues
that could be expected for the region. For instance, Chinvanno (2004)
Based on the impact assessment results, the GIWA concerns and issues
and Snidvongs et al. (2003) projected using a prediction model, based
which were assessed as having severe impacts in the region are:
on the assumption that CO will rise to twice today's level (from 350 ppm
2
GIWA Concern
GIWA Issue
to 700 ppm), that the future impacts of global climate change will be
I. Freshwater shortage
Modifi cation of stream fl ow
as follows:
II. Pollution
Suspended
solids
The daily maximum temperature will be higher by 1-3°C in January-
III. Habitat and community
Loss of ecosystems
May and lower by 1-3°C in the last four months of the year;
modifi
cation
Modifi cation of ecosystems
The seasons will shift and change their pattern with the dry season
IV. Unsustainable exploitation of Overexploitation
being dryer and longer and the rainy season starting one month
fi sh & other living resources
Impact on biological and re-
later in June and lasting until November with a short break in
sources genetic diversity
August;
The hydrology of the Mekong River and its tributaries will not be
The environmental and socio-economic impacts of these priority GIWA
signifi cantly changed except for the discharge of the UMRB which
concerns and issues, and the possible causes of these impacts are
may be reduced;
presented in Annex V. The interrelationships of the fi ve GIWA concerns
More severe fl oods may be expected in areas such as the Korat-
are illustrated in Figure 11.
Sakon Plateau and the Southern Lowlands of the MRB;
None of the natural wetlands may be signifi cantly aff ected except
Based on the results of the assessment and the network diagram shown
for the Melaleuca forests in Mekong Delta which may be further
in Figure 11, ranking of the fi ve GIWA concerns has been concluded as
degraded; and
follows:
Crop production, especially rain-fed rice cultivation, will be strongly
Priority 1: Habitat and community modifi cation
aff ected. The varieties of rice and other crops currently grown in
Priority 2: Unsustainable exploitation of fi
sh and other living
each area may not be suitable in future due to the eff ects of a
resources
shorter and more intense rainy season.
Priority 3: Freshwater shortage
36
GIWA REGIONAL ASSESSMENT 55 MEKONG RIVER
The fi gure also indicates that the Unsustainable exploitation of fi sh
I. Freshwater
and other living resources has a close relationship with the concern of
shortage
Freshwater shortage, particularly the issue of stream fl ow modifi cation.
Modifi cation of the hydrological cycle or fl ow volume and pattern of
the Mekong River and its tributaries is likely to infl uence the availability
of aquatic living resources and their subsequent status of exploitation
III. Habitat and
II. Pollution
community
in the MRB.
modification
The transboundary issues of the region arising from human and
development activities are related to:
Utilisation of water resources for hydropower development;
IV. Unsustainable
Pollution in association with the increased use of agricultural
exploitation of living
V. Global change
resources
chemicals;
Cross-border trade of logs and timber related to the utilisation of
Figure 11 Network diagram showing the interrelationships
forest resources; and
between the fi ve GIWA concerns
Exploitation of fi sheries in various parts of the MRB.
Priority 4: Pollution
These issues closely resemble the priority GIWA issues that were
Priority 5: Global change (possible relationship indicated by dotted
assessed as having severe impacts. Almost all the priority GIWA
lines in Figure 11)
concerns and issues for the region have transboundary implications.
ASSESSMENT
37
Causal chain analysis
This section aims to identify the root causes of the environmental and socio-economic impacts resulting from those issues and concerns
that were prioritised during the assessment, so that appropriate policy interventions can be developed and focused where they will
yield the greatest benefi ts for the region. In order to achieve this aim, the analysis involved a step-by-step process that identifi ed the
most important causal links between the environmental and socio-economic impacts, their immediate causes, the human activities
and economic sectors responsible and, fi nally, the root causes that determine the behaviour of those sectors. The GIWA Causal chain
analysis recognises that, within each region, there is often enormous variation in capacity and great social, cultural, political and
environmental diversity. The Causal chain analysis uses a relatively simple and practical analytical model. For further details on the
methodology, please refer to the GIWA methodology chapter.
Habitat modifi cation was identifi ed as a priority concern for the GIWA
tributaries of the Mekong River is resulting in a signifi cant reduction
Mekong River region. Changes in habitats and the modifi cation of
in the volume of fl oodplain storage, causing increased rates of river
communities are being caused by changes in the fl uxes of water and
discharge and high fl ood levels.
sediment, particularly suspended solids, by increased pollution from
diff use and point sources, and by the introduction of new species into
Deforestation in the catchments is the principal cause of increased rates
the aquatic environment. The Causal chain analysis of the Mekong
of surface water run-off that may increase the frequency and intensity
River region focuses on two of the prioritised GIWA issues which have
of fl ooding in the basin. Locally, the built environment of urbanisation
caused habitat modifi cation in the MRB - stream fl ow modifi cation
is also causing increased rates of run-off . The increased erosion caused
(Freshwater shortage) and suspended solids (Pollution). For details of
by deforestation and land clearance in upland areas of the MRB is caus-
the environmental and socio-economic impacts of these prioritised
ing the entrainment of suspended and bed-load sediments into water
issues, please refer to the Assessment section, and for background
courses. Except where they are trapped in reservoirs or deposited on
information on the sectors responsible for the immediate causes, please
fl oodplains and riverbeds, the sediments are transported through the
refer to the Regional defi nition.
basin to the Delta, where they are deposited in mangrove forests or
discharged to the sea.
Stream flow modification (Freshwater shortage)
and suspended solids (Pollution)
Root causes
Immediate causes
Population growth
The fl ow regime of the Mekong River and its tributaries has been modi-
The population of the MRB has experienced rapid growth in the
fi ed by changes in precipitation patterns and by human activities, par-
past decade, ranging from 1.4% per year in Myanmar's Shan state (a
ticularly the construction of dams for hydropower development, the
Myanmar state that lies within the MRB) to 2.8% per year in Cambodia,
modifi cation of rivers to improve navigation, and the diversion of river
with growth averaging about 2% per year. By the year 2010, the
water for irrigation, industrial development and human settlements.
population in MRB is expected to increase to 75-90 million people
The raising of embankments or levées along the mainstream and
(MRC 1997a, MRC 2003). A growing population uses more drinking
38
GIWA REGIONAL ASSESSMENT 55 MEKONG RIVER
water and consumes more food which, in turn, requires larger volumes
the excessive use of fuelwood contributing to deforestation and further
of water. Population growth has led to the colonisation of forests,
watershed degradation.
which has increased erosion rates and surface run-off , thus modifying
the sediment loads and fl ow volume of the region's rivers. Over the next
Technical
20-30 years, demand for water and the pressure on natural resources will
Currently the irrigation schemes in the MRB face some technical prob-
continue to increase in parallel with rapid population growth, despite
lems. Irrigation reservoirs are 3-5 times larger than necessary due to
the fact that birth rates are falling.
the overuse of water by farmers, and there is currently a lack of effi
cient
mechanisms to control and measure water use by farmers (MRC 2003).
Economic development
Because most irrigation systems were designed for rice production,
Urbanisation, human settlement and industrial development activities
switching their use for the production of less water-intensive crops is
have substantially increased water demand in the MRB. Ringler (2001)
diffi
cult (MRC 2003). In the Mekong Delta of Vietnam there is extensive
estimated that domestic and industrial water demand in the MRB would
irrigated agriculture. Despite more than half of the land in the delta
double from 1.89 billion mł in 1990 to 4.1 billion mł in 2020. Agriculture
being fl ooded during the rainy season, farmers are unable to store water
is a dominant economic sector and the largest consumer of water in the
for intensive rice cropping after the fl oods recede (Ringler 2001).
MRB. In the economic development strategies of the riparian countries
agriculture is always considered as one of the key sectors and therefore
Governance
is allocated increasing quantities of water.
Even though all the riparian countries in the MRB develop strategies
and action plans for environmental management, the development
Demand for electricity has surged in the past two decades in response
goals diff er between countries. In the past, the needs of civil society
to the rapid economic development experienced in the riparian
groups were rarely incorporated into governmental policy. The impact
countries of the MRB and elsewhere in Southeast Asia. Although at
on the human well-being of communities downstream of hydropower
present, per capita electricity consumption in the riparian countries
schemes was often not considered during the planning process. How-
of MRB is generally low, except for Thailand, demand is increasing
ever, the MRC has recognised that, in the planning of policies, strategies
rapidly. In the Thai portion of the MRB, demand is expected to reach
and development plans for managing the MRB, it is necessary to involve
about 411 300 GWh per year by 2020, representing more than a six-fold
all stakeholders. Consequently, the Basin Development Plan project as
increase over its 1993 level. Demand in parts of the MRB in Vietnam and
developed by MRC is a recent initiative that is working to develop an
Yunnan province is expected to increase to 72 300-93 000 GWh per year
inclusive planning process (MRC 2003).
in 2020 but in Cambodia and Lao PDR demand is likely to remain low at
around 1 800-4 900 GWh per year.
Government institutions and agencies often lack the institutional ca-
pacity to control water use and eff ectively manage the rivers of the
Lao PDR, Myanmar and Yunnan province, China, are planning to harness
MRB. For example, in Thailand, the Ministry of Science, Technology and
their great hydropower potential by developing hydroelectricity
Environment has to share the implementation of environmental man-
schemes to meet the increasing market demand for electricity in
agement policies with other agencies, such as the Ministry of Industry
neighbouring countries including Thailand, Vietnam, Malaysia and
and Ministry of Interior. This dilutes its power of implementation. The
Singapore (Crousillat 1998). To date, only 11 hydropower facilities have
current sectoral approaches of the riparian governments hinder cross-
been constructed in the MRB, representing only 5% of the hydropower
sectoral integration, as does the lack of coordination between donors.
potential. An additional 240 000 GWh per year could be exploited to
Further, ecosystem protection measures aimed at controlling erosion
meet the increasing demand.
in the region appear to be relatively weak.
Economic development has also led to deforestation for timber or
Generally, cooperation between government agencies and NGOs is
fuelwood supplies, agricultural expansion and urban development, all
limited. In the Lao PDR, Yunnan province in China, and Vietnam, apart
contributing to increased erosion and, consequently, sediment loads
from international NGOs which are increasing rapidly in number, there
in the aquatic environment. Forest reserves and agricultural lands
are very few national NGOs that are clearly independent from the gov-
occupied by illegal squatters create environmental problems such as
ernment. Instead, there are some parastatal or mass organisations which
forest destruction and land degradation, (MRC 1997a, Chu et al. 2003).
are more or less attached to the government, such as the Women's
The lack of alternative energy supplies for rural communities results in
Union in Vietnam. However, increasingly they provide opportunities
CAUSAL CHAIN ANALYSIS
39
for cooperation on environmental management initiatives as trust has
these riparian countries are being planned expressly for this purpose. In
been fostered between these organisations and their governments.
exchange for the economic benefi ts they receive, the exporting coun-
tries suff er from the impacts associated with the development of hy-
Lack of public awareness
dropower projects, such as the resettlement of people, the inundation
Public awareness of environmental issues and the willingness to address
of land and reduced fi sheries productivity (ADB/UNEP 2004).
them varies between the riparian countries of the MRB. Environmental
awareness is relatively high in Thailand as a result of public information
Prices, subsidies and taxes often inadvertently discourage effi
cient
campaigns at all levels of society throughout the country (MRC 1997a).
water use. Fees charged for irrigation water are too low to encourage
In other riparian countries of the MRB, public engagement is limited,
effi
ciency or to generate suffi
cient revenues to invest in new, and
particularly in environmental assessment activities.
maintain existing, water distribution and irrigation systems (MRC
2003). In Thailand, water management is dominated by command-
Economic
and-control instruments with limited use of market-based incentives
The utilisation of water resources for hydropower is a key transbound-
to encourage water effi
ciency. The current legal framework in Vietnam
ary issue in the MRB. In terms of cross-border trade in energy, vast
also lacks economic incentives to encourage compliance with environ-
energy resources (mainly from hydropower development) in Yunnan
mental regulations.
province, Lao PDR and Myanmar can be developed for export, with
Thailand being the most likely importer. Many hydropower projects in
40
GIWA REGIONAL ASSESSMENT 55 MEKONG RIVER
Policy relevant conclusions
The GIWA Mekong River region is a large river basin with distinct
varying degrees of damage to agricultural production, rural infrastruc-
physical characteristics and complex socio-economic conditions. The
ture and human settlements, as well as a loss of human life throughout
Mekong River and its network of tributaries drain parts of six riparian
the MRB each year. Flood management and mitigation has thus become
countries China, Myanmar, Lao PDR, Thailand, Cambodia and Viet-
a priority issue at national and regional levels in the MRB.
nam. The region is vulnerable to environmental changes arising from
human and development activities, as well as climatic fl uctuations. The
Although pollution is becoming increasingly prevalent, it is generally
major aquatic concerns studied by the GIWA Task team were found to
not at critical levels. However, development activities, such as deforesta-
be highly inter-connected.
tion, mining, grazing and urbanisation, have caused extensive erosion
in many parts of the MRB resulting in high concentrations of total sus-
Habitat and community modifi cation was considered to be the most
pended solids in the mainstream and tributaries of the Mekong River.
severe water-related problem, but it is mainly the consequence of the
The suspended solids are blocking channels, destroying or modifying
other transboundary issues studied by GIWA, such as stream fl ow modi-
habitats and forming deltas at the river mouths. This has profound
fi cation, changes in the sediment fl ux, and diff use and point sources
environmental and socio-economic impacts, both detrimental and
of pollution, as well as the introduction of alien species. The loss of
benefi cial.
habitat has depleted the living resources which the rural communi-
ties in the region depend on for their subsistence. Currently, freshwater
There is evidence that the fi sheries resources of the region have been
shortage does not appear to impose any signifi cant socio-economic
overexploited in recent years. Increasing numbers of fi shermen, the
and environmental problems on the region. In the future, the exten-
widespread use of destructive fi shing practices and the steady loss
sive hydropower development, and fl ood control and water diversion
of fl ooded forests have negatively aff ected the abundance of fi sheries
schemes may provide signifi cant benefi ts for humans but will transform
resources. Middle-scale and family fi shermen are concerned about their
the hydrological cycle in the region when altering the nature of annual
decreasing catches. The chaotic and uncontrolled nature of species
fl ooding and dry season low fl ow levels. These impacts have substan-
introductions and movements within the MRB has increased the risk of
tial transboundary implications in that they are aff ecting most of the
the spread of disease within the aquaculture sector and the degradation
region's riparian countries.
of the genetic quality of wild and aquaculture stocks.
Heavy rainfall during the rainy season results in fl ooding in the lowland
Migratory fi sh constitute a signifi cant proportion of the 1 200 to
areas of the Mekong River Basin. The frequency and intensity of fl ooding
2 000 species of icthyofauna that inhabit the MRB. Therefore, if spawn-
is exacerbated by increased rates of surface water run-off caused mainly
ing habitats are destroyed by the clearing of fl ooded forests in one
by deforestation and the increased extent of man-made impermeable
country, or if migration routes are obstructed by a dam in another, fi sh
surfaces in the Basin. Embankments or levées along the mainstream and
are less abundant elsewhere in the Mekong River Basin. Thus, the man-
tributaries of the Mekong River are resulting in a signifi cant reduction
agement of these shared resources requires holistic approaches that
in the volume of fl oodplain storage, causing increased rates of river
transcend both national and resource sector boundaries.
discharge and high fl ood levels. The recurrent fl ooding events causes
POLICY RELEVANT CONCLUSIONS
41
The transboundary aquatic concerns can be traced back to a number
of the Mekong River Basin. Others are associated with development
of root causes that will continue to present many challenges to the
decisions made at the regional scale, such as the development of
Mekong River Basin in the future. The region is experiencing rapid
transport and energy networks, and may result in localised impacts
economic development and population growth, which are increasing
across the region. To address these transboundary concerns regional
demand for water, energy, and fi sheries and agricultural products. The
cooperation is required. With appropriate regional cooperation among
population in the LMRB alone is expected to increase to 120 million by
the riparian countries, the impact of hydropower development in the
2025. This will increase the demand for energy and food, necessitat-
MRB can be limited by adopting integrated, multi-objective planning
ing more hydro-dams and the intensifi cation of agricultural produc-
in order to optimise the utilisation of the region's water resources. The
tion. Industrial development is being stimulated by increasing foreign
risks arising from introduced species can be reduced by establishing
investment in several parts of the MRB. Although these demographic
harmonised policies among the MRB countries and adopting eff ective
and economic trends will create employment and income opportuni-
measures for controlling the introduction and transfer of these species.
ties, thereby making an important contribution to poverty alleviation,
In order to implement regional and integrated water management, the
it is likely to increase the pressure on the ecosystems of the Mekong
capacity of national institutions should be strengthened.
River Basin.
The creation of protected areas can conserve sensitive habitats. The
Hydropower is seen as a cheap means of meeting surging electricity
wetlands of the MRB are commonly outside of protected areas as they
demand in Southeast Asia, and will provide valuable cross-border trade
are often intensively developed and there is little appreciation of their
for countries exporting the electricity. However, the environmental and
economic value. The environmental benefi ts of protected areas are the
socio-economic cost of such schemes on downstream communities
maintenance of essential ecological processes; the provision of eco-
could be substantial. Water is used ineffi
ciently, particularly in the ir-
nomically and non-economically valuable resources; the conservation
rigated agriculture sector, due to both technical constraints and inap-
of species; and the preservation of cultural and spiritual heritage.
propriate water prices. Public awareness of environmental issues and
the willingness to address them varies between the riparian countries
There is a need to ensure that environmental management issues re-
of the MRB, and civil society groups are seldom consulted during the
ceive prominent attention at the highest levels of political decision-
decision-making process. Government agencies often lack the institu-
making within the riparian countries. This report, which has prioritised
tional capacity to control water use and manage the rivers of the MRB
environmental and socio-economic issues facing the region, can be
eff ectively.
used for this purpose. The root causes of these priority issues require
further investigation so that strategic action programs or policies can
Some environmental issues imply direct impacts on communities
be formulated to address the emerging transboundary water-related
across national borders, such as changes in the hydrological cycle
problems of the MRB.
42
GIWA REGIONAL ASSESSMENT 55 MEKONG RIVER
References
ADB (2004). Environmental setting and priority areas for environmental
Chu, T.H., Guttnam, H., Droogers, P. and Aerts, J. (2003). Water, climate,
action. p 7-47 In: Environments in Transition Cambodia, Lao
food and environment in the Mekong basin in Southeast Asia
PDR, Thailand, Vietnam. Asian Development Bank, Manila, the
Final report. International Water Management Institute, Mekong
Philippines.
River Commission Secretariat, Institute of Environmental Studies.
ADB/UNEP (2004). Greater Mekong River subregion, Atlas of the
Retrieved August, 2004 from: http://www.geo.vu.nl/~ivmadapt/
Environment. Asian Development Bank, Manila, Philippines and
downloads/Mekong_FinalReport.pdf
United Nations Environment Programme, Regional Center for Asia
Coates, D., Ouch Poeu, Ubolratana Suntomratana, Thanh Tung, N.
and the Pacifi c, Pathumthani, Thailand.
and Sinthavong Viravong (2003). Biodiversity and fi sheries in the
AIRC (2004). Lancang-Mekong River watershed. Asian International
Mekong River Basin. Mekong Development Series No. 2. Mekong
Rivers Center, Yunnan University, Yunnan province, China.
River Commission, Phnom Penh, Cambodia.
AMRC (2003). Wider plans in the Mekong River Basin. Australian
Crousillat, E. (1998). Developing international power markets in East
Mekong Resource Centre, Sydney, Australia. Retrieved August,
Asia. Public Policy for the Private Sector Note No. 143. Retrieved
2004 from: http://www.mekong.es.usyd.edu.au/case_studies/
August, 2004 from: http://rru.worldbank.org/Documents/
sesan/widerplans/mekongplans.htm
PublicPolicyJournal/143crous.pdf
Cao, H-V. (2004). The Mekong River Basin development plan (BDP):
ENSIC 1999. Directions to sustainable water management: Mekong river
Perspectives of Mekong Delta in the basin-wide context. Industrial
basin. Environmental Systems Information Center, Asian Institute of
Development Bank of South Vietnam, Hanoi, Vietnam. Retrieved
Technology, Bangkok, Thailand.
October, 2004 from: http://www.mekongriver.org/hobdproj.htm
ESCAP (1998). Sources and nature of water quality problems in Asia
Chapman, E.C. and He, D. (2004). Downstream implications of China's
and the Pacifi c. Economic and Social Commission for Asia and the
dams on the Lancang Jiang (Upper Mekong) and their potential
Pacifi c. Report ST/ESCAP/1874. United Nations, New York, United
signifi cance for greater regional cooperation basin-wide. The
States.
Australian National University, Australia.
Evans, G. (1992). Internal colonisation in the central highlands of
Chea, V. (1998). Water supply in Phnom Penh. In: Towards effi
cient water
Vietnam. Sojourn 7(2):274-304.
use in urban areas in Asia and the Pacifi c. United Nations Economic
FAO (1999). Irrigation in Asia in fi gures. Water Report No. 18. Food and
and Social Commission for Asia and the Pacifi c. ST/ESCAP/1874.
Agriculture Organization of the United Nations, Rome, Italy.
United Nations, New York, United States.
FAOSTAT (2004). FAO Statistical database. Food and Agriculture
Chinvanno, S. (2004). Information for sustainable development in light
Organization of the United Nations, Rome, Italy. Retrieved
of climate change in Mekong River Basin. Southeast Asia START
September, 2004 from: http://faostat.fao.org
Regional Center, Bangkok, Thailand. Retrieved July, 2004 from:
Fedra, K., Winkelbauer, L. and Pantulu, V.R. (2004). Environmental
http://203.159.5.16/digital_gms/Proceedings/A77_SUPPAKORN_
problems of water resources development in the Lower Mekong
CHINAVANNO.pdf
Basin. International Institute for Applied Systems Analysis, A-
2361, Laxenburg, Austria. Retrieved September, 2004 from: http:
//www.ess.co.at/EIA/rr04.html
REFERENCES
43
Friederich, H. (2004). The biodiversity of the wetlands in the Lower
Leksakundilok, A. (2004). Ecotourism and community-based ecotourism
Mekong River Basin. The World Commission on Dams, Cape Town,
in the Mekong Region. Working Paper No. 10. Australian Mekong
South Africa. Retrieved August, 2004 from: http://www.dams.org/
Resource Centre, University of Sydney, Australia.
docs/kbase/submissions/env148.pdf
Li, K. (2004). The perspectives of Lancangjian River Basin. Wetlands
GEF (2004). Mekong River Basin wetland biodiversity conservation and
International China Programme, Beijing, China. Retrieved October,
sustainable use programme, Phase I. Project Proposal PIMS No. 992.
2004 from: http://www.ecolife.ru/jornal/ereg/2001-2-1eng.shtml
Global Environment Facility, Washington D.C., United States.
Liu, H. (2004). Water resources simulation model of the Lancang River.
GIWA (2001). GIWA methodology Stage 1: Scaling and scoping
Retrieved September, 2004 from: http://airc.ynu.edu.cn/English_
Guidance to the methodology and its use. United Nations
site/Eng_publicat/Water%20Resources.pdf
Environmental Programme Global International Waters
McElwee, P. and Horowitz, M.M. (1999). Environment and society in the
Assessment. Retrieved from: http://www.giwa.net/methodology/
Lower Mekong Basin: A landscaping review. Mekong River Basin
RevScalScop_Meth_10July2001.PDF
Research and Capacity Building Initiative, Oxfam America SEA
He, D. and Chen, L. (2004). Hydropower cascade development and
15 197-99, Boston, United States.
its impact in Lancang-Mekong. Asian International Rivers Center,
McCormack, G. (2000). Water margins Development and sustainability
Yunnan University, Kumming, China. Retrieved September, 2004
in China. Working paper No. 2. Australian Mekong Resource Centre,
from: airc.ynu.edu.cn/English_site/Eng_publicat/ HYDROPOWER%
Sydney University, Australia.
20CASCAD%20AND%20ITS%20IMPACTS%20IN%20LANCANG.pdf
MOC/China (2004). Lancang River. Ministry of Culture, Beijing, China.
Hirsch, P. (2004). Holding and managing resources in common: Issues of
Retrieved July, 2004 from: http://www.chinaculture.org/gb/en_
scale in Mekong development. Retrieved October, 2004 from: http:
travel/2003-09/24/content_34164.htm
//www.indiana.edu/~iascp/Drafts/hirsch.pdf
MRC (1997a). Mekong River Basin diagnostic study Final report. Report
Hirsch, P. and Cheong, G. (1996). Natural resource management in the
No. MKG/R. 97010. Mekong River Commission, Bangkok, Thailand.
Mekong River Basin: perspectives for Australian Development
MRC (1997b). Mekong Basin Development Plan: Phase I. A Country
Cooperation Final overview report to AusAID. School of
Report: Thailand Final Report. Mekong River Commission,
Geoscience, University of Sydney, Sidney, Australia.
Bangkok, Thailand.
Hook, J., Novak, S. and Johnston, R. (2003). Social atlas of the Lower
MRC (2003). State of the Basin report. The Mekong River Commission,
Mekong Basin. Mekong River Commission, Phnom Penh,
Phnom Penh, Cambodia.
Cambodia.
MRC (2004). Catchment areas of the Lower Mekong River Basin. Mekong
Hortle, K.G. and Bush, S.R. (In prep.). Consumption of fi sh and other
River Commission, Bangkok, Thailand. Retrieved July, 2004 from:
aquatic animals in the Lower Mekong Basin. MRC Technical
http://www.mrcmekong.org/programmes/AIFP/catch_area_
Series. Mekong River Commission, Phnom Penh, Cambodia. (In
map.htm
preparation)
MRCS (1994). Mekong mainstream run-of-river hydropower. Mekong
IUCN (2004a). Land cover and use variables of the Mekong River Basin.
River Commission Secretariat, Bangkok, Thailand.
World Resource eAtlas, The World Conservation Union, Gland,
MRCS (1995). Hydropower programme for the Lower Mekong Basin.
Switzerland.
Report No. MKG/R.95059 Programme Proposal. Environment Unit,
IUCN (2004b). Population density in the Mekong River Basin.
Mekong River Commission Secretariat, Bangkok, Thailand.
World Resource eAtlas. The World Conservation Union, Gland,
MRCS (1997). Mekong Basin development plan: Lao economic
Switzerland.
development, policies, strategies in national and Mekong
Kite, G. (2000). Developing a hydrological model for the Mekong Basin.
cooperation context Final Report. Mekong River Commission
Impacts of basin development on fi sheries productivity. Working
Secretariat, Bangkok, Thailand.
Paper 2. International Water Management Institute, Colombo, Sri
Oxfam (2004). Mekong profi le. Oxfam, London, UK.
Lanka.
Petersen, E. (2003). Valuing environmental water demands in the
Lacoursiere, J.O., Torell, M. and Choowaew, S. (1998). Inventory and
Mekong River Basin. Australian National University, Australia.
management of wetlands in the Lower Mekong River Basin. Report
Phan, S.K. (1996). Water resources development in Vietnam. Paper
No. MKG/R. 98017. Mekong River Commission, Bangkok, Thailand.
presented at the International Seminar of 1996 World Day for Water,
Le, D.D (2004). Wise use in the Mekong Delta, Vietnam. University of
20-25 March, Korea.
Hanoi, Hanoi, Vietnam.
44
GIWA REGIONAL ASSESSMENT 55 MEKONG RIVER
Puustjarvi, E. (2004). Review of policies and institutions related to
van Zalinge, N., Thuok, N., Tana, T.S. and Nuov, S. (1998). It's big, unique
management of upper watershed catchments, Yunnan, China.
and important: Fisheries of the Lower Mekong Basin as seen from
Retrieved September, 2004 from: http://www.mekonginfo.org/
a Cambodian perspective. Mekong Fish Catch and Culture Vol.
mrc_en/doclib.nsf/0/F9F74B743C94D72EC725682E0016A597/
4(2):5-8.
$FILE/FULLTEXT.html
Welcomme, R. and Vidthayanom, C. (2003). The impacts of introductions
Ringler, C. (2001). Optimal water allocation in the Mekong River Basin.
and stocking of exotic species in the Mekong Basin and policies for
Centre for Development Research, Bonn University, Germany.
their control. MRC Technical Paper No. 9. Mekong River Commission,
German Discussion Paper on Development Policy No. 38.
Phnom Penh, Cambodia.
Roberts, T. (2001). Downstream ecological implications of China's
White, I., Melville, M. and Sammunt, J. (2004). Possible impacts of saline
Lancang hydropower and Mekong navigation project. International
water intrusion fl oodgates in Vietnam's Lower Mekong Delta. School
Rivers Network. News Release 2001. Retrieved September, 2004
of Geography, The University of New South Wales, Sydney, Australia.
from: http://www.irn.org/programs/lancang/index.php?id=02111
Retrieved September, 2004 from: http://coombs.anu.edu.au/~vern/
2.ecoimplications.html
env_dev/papers/pap07.html
SEA-BASINS (2004). Mekong Basin precipitation. SEA-BASINS, SEA-
WRI (2004). Mekong watershed. World Resources Institute, Washington
START, University of Washington, Seattle, United States. Retrieved
D.C., United States. Retrieved August, 2004 from: http://
August, 2004 from: http://boto.ocean.washington.edu/basins/sea/
earthtrends.wri.org/pdf_library/maps/p2_92mekong.pdf
activebasins/active-mekong-basin.html
Xu, A. and Moller, D. (2004). Hydropower development plan set for
Snidvongs, A., Choowaew, S. and Chinvanno, S. (2003). Background
Lancang River. Retrieved September, 2004 from: http://china.org.cn/
paper: Impact of climate change on water and wetland resources
english/2003/Dec/82505.htm
in Mekong River Basin: directions for preparedness and action.
Zhou, B. (1999). Use and management of wetlands by local people in
Regional Centre Report No 12. Southeast Asia START, Bangkok,
Lancangjian-Mekong RiverBasin in PR China. p 25-29 In: Bernard
Thailand.
O'Callaghan (ed). Proceeding of the workshop on wetlands,
Sverdrup-Jensen, S. (2002). Fisheries in the Lower Mekong Basin:
awareness, local people and the Ramsar Convention in the Mekong
Status and perspectives. MRC Technical Paper No 6. Mekong River
River Basin Can local community plays a role in the wise use of
Commission, Phnom Penh, Cambodia.
wetlands? 12th-14th September 1999, Phnom Penh, Cambodia.
Torell, M., Salamanca, A.M. and Ahmed, M. (2001). Management of
wetland resources in the Lower Mekong River Basin: Issues and
Personal communication
future directions. Naga Quarterly Vol. 24(3&4):4-10.
Sokhem, P. (Mekong River Commission, Phnom Penh, Cambodia)
Truong, T.V. and Tin, N.T. (1997). Water quality problems in the Lower
Try, I. (Department of Fisheries Ministry of Agriculture, Forestry and
Mekong Basin. Sub-Institute of Water Resources Planning, Ministry
Fisheries, Phnom Penh, Cambodia)
of Agriculture and Rural Development, Ho Chi Minh City, Vietnam.
Tuvy (2004). Mekong River. Tuvy Resource Centre, Bangkok, Thailand.
Retrieved September, 2004 from: http://www.tuvy.com/Countries/
vietnamese/land/mekong_river.htm
REFERENCES
45
Annexes
Annex I
List of contributing authors and organisations
Name
Institutional affiliation
Country
Field of work
Anond Snidvongs
Southeast Asia START Regional Center
Thailand
Oceanography; Global Climate Change
(Task Team Leader)
Seng-Keh Teng
Life Science Bio-Technology Ventures
Singapore
Fisheries
Chaiyuth Suksri
Mekong River Commission
Cambodia
Environmental governance
David Coates
Mekong River Commission
Lao PDR
Biodiversity, fisheries management
David Jezeph
Economic and Social Commission for Asia and The Pacific, UN
Thailand
Water resources management, policies and strategies
Hans Friedrich
Regional Wetlands and Water Resources Programme, IUCN
Thailand
Water resources management
Ian Campbell
Mekong River Commission
Cambodia
Ecology
Ing Try
Department of Fisheries
Cambodia
Fisheries biology and management
John Dore
Social Research Institute
Thailand
Environmental governance, political economy
Huu Ti Le
Economic and Social Commission for Asia and The Pacific, UN
Thailand
Hydrology
Quang Minh Le
Can Tho University
Vietnam
Water resources management
Ge Li
Department of International Cooperation, Ministry of Science and Technology
China
Water resources management
Nicholaas van Zalinge
Mekong River Commission
Cambodia
Fisheries
Environmental planning, wetland conservation & management,
Sansanee Choowaew
Faculty of Environment & Resource Studies, Mahidol University
Thailand
social & economic aspects of fisheries
Sein Mya
Mekong River Commission
Cambodia
Environmental information management
Somrudee Nicro
Urbanisation and Environment Program, Thailand Environment Institute
Thailand
Sociology
Thavivongse Sriburi
Environmental Research Institute, Chulalongkorn University
Thailand
Water resources planning and management
Wijarn Simachaya
Pollution Control department
Thailand
Coastal/freshwater quality management
Ruud Corsel
Mekong River Commission
Cambodia
Water utilisation
46
GIWA REGIONAL ASSESSMENT 55 MEKONG RIVER
Annex II
Detailed scoring tables
I: Freshwater shortage
II: Pollution
Weight
Weight
Environmental
Environmental
Environmental issues
Score
Weight
averaged
Environmental issues
Score
Weight
averaged
concern
concern
score
score
1. Modification of stream flow
3
60
Freshwater shortage
2.2
4. Microbiological
1
15
Pollution
2.0
2. Pollution of existing supplies
1
20
5. Eutrophication
2
20
3. Changes in the water table
1
20
6. Chemical
1
15
7. Suspended solids
3
40
Criteria for Economics impacts
Raw score
Score
Weight %
8. Solid wastes
0
0
Very small
Very large
Size of economic or public sectors affected
N/a
N/a
0 1 2 3
9. Thermal
0
0
Minimum
Severe
Degree of impact (cost, output changes etc.)
N/a
N/a
10. Radionuclides
0
0
0 1 2 3
Occasion/Short
Continuous
Frequency/Duration
N/a
N/a
11. Spills
1
10
0 1 2 3
Weight average score for Economic impacts
N/a
Criteria for Economics impacts
Raw score
Score
Weight %
Criteria for Health impacts
Raw score
Score
Weight %
Very small
Very large
Very small
Very large
Size of economic or public sectors affected
N/a
N/a
Number of people affected
N/a
N/a
0 1 2 3
0 1 2 3
Minimum
Severe
Minimum
Severe
Degree of impact (cost, output changes etc.)
N/a
N/a
Degree of severity
N/a
N/a
0 1 2 3
0 1 2 3
Occasion/Short
Continuous
Occasion/Short
Continuous
Frequency/Duration
N/a
N/a
Frequency/Duration
N/a
N/a
0 1 2 3
0 1 2 3
Weight average score for Economic impacts
N/a
Weight average score for Health impacts
N/a
Criteria for Health impacts
Raw score
Score
Weight %
Criteria for Other social and
Raw score
Score
Weight %
community impacts
Very small
Very large
Number of people affected
N/a
N/a
Very small
Very large
0 1 2 3
Number and/or size of community affected
N/a
N/a
0 1 2 3
Minimum
Severe
Degree of severity
N/a
N/a
Minimum
Severe
0 1 2 3
Degree of severity
N/a
N/a
0 1 2 3
Occasion/Short
Continuous
Frequency/Duration
N/a
N/a
Occasion/Short
Continuous
0 1 2 3
Frequency/Duration
N/a
N/a
0 1 2 3
Weight average score for Health impacts
N/a
Weight average score for Other social and community impacts
N/a
Criteria for Other social and
N/a=Not applied
Raw score
Score
Weight %
community impacts
Very small
Very large
Number and/or size of community affected
N/a
N/a
0 1 2 3
Minimum
Severe
Degree of severity
N/a
N/a
0 1 2 3
Occasion/Short
Continuous
Frequency/Duration
N/a
N/a
0 1 2 3
Weight average score for Other social and community impacts
N/a
N/a=Not applied
ANNEXES
47
III: Habitat and community modification
IV: Unsustainable exploitation of fish
Weight
and other living resources
Environmental
Environmental issues
Score
Weight
averaged
concern
score
Weight
Environmental
Environmental issues
Score
Weight %
averaged
Habitat and community
concern
12. Loss of ecosystems
3
3
score
modification
13. Modification of ecosystems or
Unsustainable
14. Overexploitation
3
50
2.7
ecotones, including community
3
exploitation of fish
structure and/or species composition
15. Excessive by-catch and
1
5
discards
16. Destructive fishing practices
2
20
Criteria for Economics impacts
Raw score
Score
Weight %
Very small
Very large
17. Decreased viability of stock
Size of economic or public sectors affected
N/a
N/a
N/a
N/a
0 1 2 3
through pollution and disease
Minimum
Severe
18. Impact on biological and
Degree of impact (cost, output changes etc.)
N/a
N/a
3
25
0 1 2 3
genetic diversity
Occasion/Short
Continuous
Frequency/Duration
N/a
N/a
0 1 2 3
Criteria for Economics impacts
Raw score
Score
Weight %
Weight average score for Economic impacts
N/a
Very small
Very large
Size of economic or public sectors affected
N/a
N/a
Criteria for Health impacts
Raw score
Score
Weight %
0 1 2 3
Minimum
Severe
Very small
Very large
Degree of impact (cost, output changes etc.)
N/a
N/a
Number of people affected
N/a
N/a
0 1 2 3
0 1 2 3
Occasion/Short
Continuous
Minimum
Severe
Frequency/Duration
N/a
N/a
Degree of severity
N/a
N/a
0 1 2 3
0 1 2 3
Occasion/Short
Continuous
Weight average score for Economic impacts
N/a
Frequency/Duration
N/a
N/a
0 1 2 3
Criteria for Health impacts
Raw score
Score
Weight %
Weight average score for Health impacts
N/a
Very small
Very large
Criteria for Other social and
Number of people affected
N/a
N/a
Raw score
Score
Weight %
0 1 2 3
community impacts
Minimum
Severe
Very small
Very large
Degree of severity
N/a
N/a
Number and/or size of community affected
N/a
N/a
0 1 2 3
0 1 2 3
Occasion/Short
Continuous
Minimum
Severe
Frequency/Duration
N/a
N/a
Degree of severity
N/a
N/a
0 1 2 3
0 1 2 3
Occasion/Short
Continuous
Weight average score for Health impacts
N/a
Frequency/Duration
N/a
N/a
0 1 2 3
Criteria for Other social and
Raw score
Score
Weight %
Weight average score for Other social and community impacts
N/a
community impacts
Very small
Very large
N/a=Not applied
Number and/or size of community affected
N/a
N/a
0 1 2 3
Minimum
Severe
Degree of severity
N/a
N/a
0 1 2 3
Occasion/Short
Continuous
Frequency/Duration
N/a
N/a
0 1 2 3
Weight average score for Other social and community impacts
N/a
N/a=Not applied
Presently, there is insuffi
cient data to demonstrate conclusively the current impacts of Global Change.
Comparative environmental and socio-economic impacts of each GIWA concern
Types of impacts
Environmental score
Economic score
Human health score
Social and community score
Concern
Overall score
Rank
Pr
esent (a)
F
uture (b)
Pr
esent (a)
F
uture (b)
Pr
esent (a)
F
uture (b)
Pr
esent (a)
F
uture (b)
Freshwater shortage
2
3
1
0
1
2
2
1
1.71
3
Pollution
2
2
1
1
2
2
2
2
1.75
4
Habitat and community
3
2
3
2
1
1
2
2
2.00
1
modification
Unsustainable exploitation of fish
3
3
3
2
0
0
2
1
2.33
2
and other living resources
Global change
N/a
N/a
N/a
N/a
N/a
N/a
N/a
N/a
N/a
5
N/a=Not applied
48
GIWA REGIONAL ASSESSMENT 55 MEKONG RIVER
Annex III
Functions and activities of the regional institutions and
agencies involved in addressing and managing water-related
environmental issues and problems in the GIWA Mekong River
region
Asian International Rivers Center (AIRC)
through joint endeavours in the spirit of equality and partnership in order
AIRC was established in October, 2000 and headed by Professor He Dam-
to strengthen the foundation for a prosperous and peaceful community of
ing. The Center is primarily engaged in basic and applied research, infor-
Southeast Asian nations; and (ii) to promote regional peace and stability
mation development and capacity building related to the study of inter-
through abiding respect for justice and the rule of law in the relationship
national rivers in China and Asia. It is located in the campus of Yunnan
among countries in the region and adherence to the principles of the
University in Kunming City, Yunnan province, China. The AIRC provides
United Nations Charter.
necessary research for addressing issues related to the conservation of
natural resources and is meeting the growing demand for high quality
Greater Mekong Subregion Academic and Re-
information and analysis on which environmental management decisions
search Network (GMSARN)
should be based. Studies related to the well-being of ecosystems in the
GMSARN carries out activities related to human resources development,
Upper Mekong River Basin, or the Lancang River Basin, are undertaken by
joint research, and dissemination of information and intellectual assets
the program entitled "Ecosystem Changes in Longitudinal Range-Gorge
generated in the Greater Mekong Subregion (GMS). The Network seeks
Region and Transboundary Ecological Security in Southwest China, 2004-
to ensure that the holistic intellectual knowledge and assets generated,
2008".
developed and maintained are shared by organisations within the re-
gion. Primary emphasis is placed on complementary linkages between
Australian Mekong Resource Centre (AMRC)
technological and socio-economic development issues. An agreement
AMRC is a resource centre established in 1997 and based at the School of
among the founding GMS country institutions was signed on 26 January
Geosciences, University of Sydney, Australia. AMRC defi nes the Mekong
2001, based on resolutions reached at the Greater Mekong Subregional
Region into two levels, the fi rst level is the Mekong Basin proper, i.e. the
Development Workshop convened earlier. The GMSARN member institu-
catchment of the Mekong River and its tributaries, covering an area of 795
tions are the Asian Institute of Technology; the Institute of Technology of
000 km˛ and providing home to 65 million people in six diff erent coun-
Cambodia; the Kunming University of Science and Technology, Yunnan
tries; the second level has a broader geographical framework including
province, China; the National University of Laos; the Yangon Technologi-
what has become known as the Greater Mekong Subregion (GMS). GMS
cal University, Myanmar; the Khon Kaen University, Thailand; Thamma-
comprises an area that is home to some 250 million people and is based
sat University, Thailand; the Hanoi University of Technology, Vietnam,
on fi ve of the countries through which the Mekong River fl ows Myan-
and the Ho Chi Minh City University of Technology as well as the Royal
mar, Thailand, Lao PDR, Cambodia and Vietnam - plus Yunnan province in
University of Phnom Penh in Cambodia and Yunnan University in Yun-
southern China. The Centre promotes research, discussion and debate on
nan province, China. The agreement commenced on the date of signing
development and environmental issues in the Mekong Region, focusing
and will remain in eff ect for four years, subject to extension by the GM-
on the role that Australia plays in the region as a near neighbour, donor
SARN member institutions. Objectives of the GMSARN are (i) To enhance
and major trading partner. The Centre is a focal point for information, dia-
the roles and functions of regional academics in project evaluation and
logue and activities in support of an equitable and sustainable develop-
development planning in order to achieve the region's truly self-reliant
ment path for the Region. By fostering a deeper and wider understanding
and sustainable development; (ii) to foster multi-disciplinary research
of contemporary changes in the Mekong Region, the AMRC aims to sup-
and academic development within and among academic and research
port development paths that maintain the integrity, diversity and symbio-
institutions in the GMS through relevant joint activities; (iii) to formulate
sis of local livelihoods, cultures and ecosystems.
and resolve, scientifi cally and objectively, complex problems covering
both cross-border issues and issues that are common to GMS countries;
Association of Southeast Asian Nations (ASEAN)
and (iv) to take stock of intellectual assets developed for the GMS so as
ASEAN was established on 8 August 1967 in Bangkok by the fi ve original
to ensure transparently accessible reference and utilisation among the
Member Countries: Indonesia, Malaysia, Philippines, Singapore, and Thai-
GMS countries.
land. Brunei Darussalam joined on 8 January 1984, Vietnam on 28 July
1995, Laos and Myanmar on 23 July 1997, and Cambodia on 30 April 1999.
Greater Mekong Subregion Program of the Asian
The ASEAN region has a population of about 500 million, a total area of
Development Bank
4.5 million km˛, a combined gross domestic product of 737 billion USD,
The Program was created by the Asian Development Bank (ADB) in 1992
and a total trade of 720 billion USD. ASEAN functions in accordance to the
to enhance economic cooperation among the Greater Mekong Subregion
ASEAN Declaration as the guiding principles. The Declaration states that
(GMS) countries including Cambodia, Lao PDR, Myanmar, Thailand, Viet-
the aims and purposes of the Association are: (i) to accelerate the eco-
nam, and Yunnan province in China. The Program has contributed to the
nomic growth, social progress and cultural development in the region
development of infrastructure to enable the development and sharing of
ANNEXES
49
the resource base, and promote the freer fl ow of goods and people in the
gramme; Agriculture, Irrigation and Forestry Programme; Water Resources
subregion. It has also led to the international recognition of the subregion
Management Programme; Flood Management Programme; and Naviga-
as a growth area. In addition, the Program has produced a comprehensive
tion Programme.
"Atlas of the Environment" for the GMS that describes in detail the profi le,
environmental and natural resources, people and environment, sustain-
Oxfam International
able development, remote sensing images of ecoregions and information
Oxfam International is an international non-governmental organisation
resources of the subregion.
(NGO) which seeks increased worldwide public understanding that eco-
nomic and social justices are crucial to sustainable development. It strives
International Rivers Network (IRN)
to be a global campaigning force promoting the awareness and motiva-
IRN is an international non-governmental organisation (NGO) that sup-
tion that comes with global citizenship whilst seeking to shift public opin-
ports local communities working to protect their rivers and watersheds.
ion in order to make equity the same priority as economic growth. Oxfam's
Eff orts of IRN are to halt destructive river development projects, and to en-
goal is to enable people to exercise their rights and manage their own
courage equitable and sustainable methods of meeting needs for water,
lives. From long-term programmes to short-term emergency relief and im-
energy and fl ood management. IRN also seeks a world in which rivers and
mediate campaign action, Oxfam believes in empowering people. Oxfam
their watersheds are valued as living systems and are protected and nur-
strives to work with local partners and takes a rights based approach to
tured for the benefi t of the human and biological communities that de-
development work. Oxfam International has conducted several projects
pend on them. Overall vision of IRN is to develop worldwide understand-
relating to the impacts of hydropower development on the environment
ing of the importance of rivers and their essential place in the struggle
and ecosystems of the Mekong River Basin over the past decade.
for environmental integrity, social justice, and human rights. Its mission
is to halt and reverse the degradation of river systems; to support local
Partnership in Environmental Management for
communities in protecting and restoring the well-being of the people,
the Seas of East Asia (PEMSEA)
cultures and ecosystems that depend on rivers; to promote sustainable,
PEMSEA is a GEF project which aims to build partnership within and
environmentally sound alternatives to damming and channelling rivers;
among governments as well as with the public and private sectors of the
to foster greater understanding, awareness and respect for rivers; to sup-
East Asian Seas region in environmental management and to reduce or
port the worldwide struggle for environmental integrity, social justice and
remove barriers to eff ective environmental management such as inad-
human rights; and to ensure that our work is exemplary of responsible
equate or inappropriate policies, disparate institutional and technical ca-
and eff ective global action on environmental issues. IRN has initiated a
pabilities and limited investment in environmental facilities and services.
Mekong Campaign project that watches over the development activities
PEMSEA is based on two management frameworks, namely, the integrated
for instance, the hydropower development, improvement of the naviga-
coastal management (ICM) framework for coastal area management and
tion routes, etc., which could induce adverse impacts on the ecosystems
the risk assessment/management framework for assessing the impacts of
of the Mekong River Basin.
human activities on marine ecosystems in sub-regional sea areas. Six ICM
demonstration sites (one in each of Vietnam, Cambodia, Indonesia, Thai-
Mekong River Commission
land, DPR Korea and Malaysia) and two sub-regional sea environmental
The Mekong River Commission (MRC) was founded under the "Agreement
management demonstration sites, in the Gulf of Thailand and the Bohai
on the Cooperation for the Sustainable Development of the Mekong River
Sea, were established to test and validate the implementation of PEMSEA's
Basin" signed by Cambodia, the Lao PDR, Thailand and Vietnam on the
environmental management frameworks. The ICM demonstration sites in
5th of April 1995 in replacement of the Committee for Coordination of
Cambodia and Vietnam established by PEMSEA also conduct studies that
Investigation of the Lower Mekong Basin (the Mekong Committee) and
have some direct relation with the Mekong River Basin.
the Interim Mekong Committee, which were established earlier in 1957
and 1978, respectively. The purpose of the 1995 Agreement is to optimise
Southeast Asia START Regional Center (SEA
the use and minimise the waste of the Basin's water resources. The MRC
also holds an offi
cial dialogue with the two other states of the Mekong
START RC)
River Basin, China and Myanmar, which are not signatories of the 1995
Southeast Asia START Regional Center is one of the regional research
Agreement. The MRC enjoys the status of an international body and it has
nodes of the Southeast Asia Regional Committee for START (SARC).
signed several agreements and holds obligations with the donors and the
Southeast Asia is one of eight regions in the Global Change SysTem for
international community. There are three permanent bodies in the MRC:
Analysis, Research and Training (START) network, initiated jointly by the
Council, Joint Committee and Secretariat. Acting as focal points for the
International Geosphere-Biosphere Programme (IGBP), the International
Commission in each of the member countries are the National Mekong
Human Dimension Programme (IHDP), and the World Climate Research
Committees (NMCs). The MRC is the lead agency which deals with every
Programme (WCRP). START is a global network aimed at encouraging mul-
aspect (from environment and natural resources to socio-economic man-
tidisciplinary research on the interactions of humans and the environment
agement) relating to the management of the Mekong River Basin. The
which are aff ecting and being aff ected by global changes. The START re-
MRC Secretariat is the executive arm of the MRC with its headquarters
gional networks cover areas in Pan-Africa, Southeast Asia, South Asia, Tem-
in Phnom Penh, Cambodia. The Commission has formal agreements for
perate East Asia, Mediterranean, and Oceania. SEA START RC represents
cooperation with regional and international organisations, e.g. ADB, AIT,
geographically: Australia, Brunei Darussalam, Cambodia, China-Taipei, In-
and ICLARM. Current programs carried out by MRC include: Water Utili-
donesia, Lao, Malaysia, Philippines, Singapore, Thailand and Vietnam.
sation Programme (WUP); Basin Development Plan (BDP); Environment
Programme (EP); Integrated Capacity Building Programme; Fisheries Pro-
50
GIWA REGIONAL ASSESSMENT 55 MEKONG RIVER
SEA START RC was established in 1996 under a Memorandum of Under-
8. Coordinating UNESCAP activities with those of the major departments/
standing among Chulalongkorn University (CU), National Research Coun-
offi
ces of the United Nations at Headquarters and specialised agencies
cil of Thailand (NRCT), and International START. The Center is located on
and intergovernmental organisations.
the Chulalongkorn Campus in Bangkok, Thailand. Its operational objec-
tives are:
Water-related activities in Asia and the Pacifi c Region are carried out under
1. To develop integrated scientifi c and socio-economic approaches to
ESCAP's Water Resources Programme in the Environment and Natural Re-
reduce uncertainties of forecasting and assessing impacts of environ-
sources Development Division. The UNESCAP organises seminars and
mental change in the Southeast Asia region;
workshops in tackling various issues including those related to: (a) Water
2. To provide recommendations and expert advise to governments and
resources assessment; (b) Integrated water resources development and
the private sector on coping with long-term environmental changes;
management; (c) Protection of water resources, water quality and aquatic
3. To encourage and support the sharing and exchange of environmental
ecosystems; (d) River basin development and management; (e) Promotion
data and information within and between regions , and;
of infrastructure development and investment for drinking water supply
4. To promote public awareness on global environmental issues
and sanitation; (f) Water pricing and promotion of private investment in
the water sector; (g) Water demand management, water saving and eco-
Strategic environmental framework (SEF) for the
nomic use of water; and (h) Mitigation of water-related natural disasters,
particularly fl ood loss reduction. UNESCAP also undertakes studies relating
Greater Mekong Subregion (GMS)
to the environment and sustainable development, and provides a statisti-
The Strategic Environmental Framework (SEF) Project was created to
cal database for the riparian countries of the Mekong River Basin.
help the Asian Development Bank (ADB) make funding decisions about
infrastructure projects in the Greater Mekong Subregion (GMS) which
includes Cambodia, Lao PDR, Myanmar, China (Yunnan province), Thai-
UNEP Regional Office for Asia and the Pacific
land and Vietnam. The Project was implemented with consulting inputs
(ROAP)
from the Stockholm Environment Institute (SEI), in collaboration with the
ROAP reports directly to the Division of Regional Cooperation and Repre-
UNEP Regional Resource Centre for Asia and the Pacifi c (UNEP RCC AP)
sentation of UNEP's headquarters in Nairobi. It was established to adopt
and the Mekong River Commission (MRC). The project employs analytical,
global environmental policies to meet the regional priorities and needs,
participatory and policy oriented processes to develop a strategic envi-
putting particular emphasis on building partnerships with regional and
ronmental framework for guiding investment decisions in the transport,
sub-regional and intergovernmental agencies, other UN agencies, national
water resources development and environmental sectors in the GMS. Its
governments, NGOs, the private sector, academic and research institu-
ultimate goal is to ensure these investments are environmentally and so-
tions, civil society and the media. ROAP also acts as a catalyst, coordinator,
cially sustainable, and that environmental and social aspects, as well as
facilitator and mobiliser of resources to support these activities.
cumulative impacts, are considered at an earlier stage in the planning
process than currently takes place. It involved four broad phases: 1. Incep-
World Resources Institute (WRI)
tion Phase (November 1998 - September 1999); 2. Analysis Phase (October
WRI is an independent non-profi t organisation based in Washington D.C.,
1999 - July 2000); 3. Production Phase (August 2000 - December 2000);
United States. The organisation has more than 100 scientists, economists,
and 4. Communication Phase (January 2001- April 2001). These phases
policy experts, business analysts, statistical analysts, mapmakers and com-
involved a broad range of consultations with a spectrum of stakeholders
municators working to protect the Earth and improve people's lives. Stud-
and decision-makers in the region. The project has been completed and
ies on the biodiversity, protected areas and watersheds of the Mekong
a fi nal report of the project prepared.
River Basin are being undertaken by two of its core programs: Biodiversity
and Protected Areas and Water Resources and Freshwater Ecosystems.
United Nations Economic and Social Commission
for Asia and the Pacific (UNESCAP)
The regional arm of the United Nations Secretariat for the Asian and Pacifi c
region is the United Nations Economic and Social Commission for Asia and
the Pacifi c (UNESCAP). The functions of UNESCAP have been defi ned by
the Secretary General as follows:
1. Promoting economic and social development through regional and
subregional cooperation and integration;
2. Serving as the main economic and social development forum within
the United Nations system for the UNESCAP region;
3. Formulating and promoting development assistance activities and proj-
ects commensurate with the needs and priorities of the region while
acting as an executing agency for relevant operational projects;
4. Providing substantive and secretariat services and documentation for
the Commission and its subsidiary bodies;
5. Carrying out studies, research and other activities within the terms of
reference of the Commission;
6. Providing advisory services to governments at their request;
7. Developing and executing programmes of technical cooperation;
ANNEXES
51
Annex IV
List of conventions and specific laws that affect water use in the
GIWA Mekong River region
(A) List of Convention, Treaties and Agreements
Conventions/Treaties/Agreements
Year
Conventions/Treaties/Agreements
Year
(1) Cambodia
(4) Myanmar
- Ramsar Convention
1999
- United Nations Convention on the Law of the Sea
1996
- International Trade of Endangered Species of Wild Flora and Fauna
1997
- Framework Convention on Climate Change
1995
- Framework Convention on Climate Change
1996
- Convention for the Protection of the Ozone Layer
1994
- Convention on the Prevention of Marine Pollution
1996
- Montreal Protocol for CFC Control
1994
- Convention on Biological Diversity
1995
- Convention on Biological Diversity
1995
- Coordinate Body of Southeast Asia Seas Agreement
1996
- Convention on the Protection of World Heritage
1994
- International Convention for the Prevention of Pollution from Ships
1995
- International Tropical Timber Agreement
1994
- International Convention on Civil Liability for Oil Pollution Damage
1995
- Agreement for the Establishment of Network of Aquaculture Centers in Asia and the Pacific
1990
- International Tropical Timber Agreement
1994
- International Convention for the Prevention of Pollution from Ships
1988
- Convention on the Protection of World Heritage
1993
- Statutes of the International Center for the Study of the Preservation and Restoration of
- Plant Protection Agreement for Asia and the Pacific Region
1969
Cultural Property
1987
- Convention on the Fishing and Conservation of the Living Resources of the High Seas
1966
- Convention on the International Maritime Organisation
1963
- Convention on Road Traffic
1956
- Agreement for the Establishment of the Asia Pacific Fishery Commission
1949
- International Plant Protection Convention
1952
(5) Thailand
(2) Yunnan province of China
- Framework Convention on Climate Change
1995
- United Nations Convention on the Law of the Sea
1996
- Convention for the Protection of the Ozone Layer
1989
- Framework Convention on Climate Change
1994
- Protocol on Substances that Deplete the Ozone Layer
1989
- International Convention for the Prevention of Pollution from Ships, 1973 (MARPOL) Annex III
- Montreal Protocol for CFC Control
1989
(Optional): Hazardous Substances Carried in Packaged Form
1994
- International Tropical Timber Agreement
1997
- Convention on Biological Diversity
1993
- Agreement on the Cooperation for the Sustainable Development of the Mekong River Basin
1995
- Agreement for the Establishment of the Asia Pacific Fishery Commission
1993
- Agreement for the Establishment of Network of Aquaculture Centers in Asia and the Pacific
1994
- Convention on Wetlands of International Importance Especially as Waterfowl Habitat
1992
- Agreement for the Establishment of the Asia Pacific Fishery Commission
1948
- Convention on the Control of Transboundary Movements of Hazardous Wastes and their
- Convention on the Protection of World Heritage
1987
Disposal
1992
- Convention on International Trade of Endangered Species of Wild Flora and Fauna
1983
- Montreal Protocol for CFC Control
1991
- International Plant Protection Convention
1978
- Plant Protection Agreement for Asia and the Pacific Region
1990
- Convention on the International Maritime Organisation
1973
- Agreement for the Establishment of Network of Aquaculture Centers in Asia and the Pacific
1990
- Convention on the Fishing and Conservation of the Living Resources of the High Seas
1968
- Convention for the Protection of the Ozone Layer
1989
- Agreement on Establishing the Southeast Asian Fisheries Development Center
1967
- Protocol to the International Convention on Civil Liability for Oil Pollution Damage
1986
- Statutes of the International Center for the Study of the Preservation and Restoration of
- Convention on Protection of World Heritage
1986
Cultural Property
1967
- International Tropical Timber Agreement
1986
- Convention on Road Traffic
1962
- Convention on the Prevention of Marine Pollution by Dumping of Wastes and Other Matter
1985
- Plant Protection Agreement for Asia and the Pacific Region
1956
- Amendments to the Annexes to the Convention on the Prevention of Marine Pollution by
- Convention on Biological Diversity
1989
Dumping of Wastes and Other Matter
1985
(6) Vietnam
- International Convention for the Prevention of Pollution from Ships (as modified by the
- Framework Convention on Climate Change
1995
Protocol of 1978)
1983
- Convention for the Protection of the Ozone Layer
1994
- Convention on International Trade of Endangered Species of Wild Flora and Fauna
1981
- Montreal Protocol for CFC Control
1994
- International Convention on Civil Liability for Oil Pollution Damage
1980
- United Nations Convention on the Law of the Sea
1994
- Convention on Road Traffic
1957
- Convention on Biological Diversity
1995
(3) Lao PDR
- Convention on the Control of Transboundary Movements of Hazardous Wastes and their
- Convention for the Protection of the Ozone Layer
1998
Disposal
1995
- United Nations Convention on the Law of the Sea
1998
- Agreement on the Cooperation for the Sustainable Development of the Mekong River Basin
1995
- Montreal Protocol for CFC Control
1998
- Convention on International Trade of Endangered Species of Wild Flora and Fauna
1994
- Convention on Biological Diversity
1996
- Amendment to the Convention on International Trade of Endangered Species of Wild Flora
- Framework Convention on Climate Change
1995
and Fauna (Art XI)
1994
- Agreement on Cooperation for the Sustainable Development of the Mekong River Basin
1995
- International Convention for the Prevention of Pollution from Ships
1991
- Convention on the Protection of World Heritage
1987
- Agreement for the Establishment of Network of Aquaculture Centers in Asia and the Pacific
1990
- Convention on Road Traffic
1959
- Convention on Wetlands of International Importance Especially as Waterfowl Habitat
1989
- Plant Protection Agreement for Asia and the Pacific Region
1950
- Convention on the Protection of World Heritage
1988
- International Plant Protection Convention
1955
- Convention on the International Maritime Organisation
1984
- Statutes of the International Center for the Study of the Preservation and Restoration of
Cultural Property
1972
- Agreement on Establishing the Southeast Asian Fisheries Development Center
1968
(Source: ADB/UNEP 2004)
- Plant Protection Agreement for Asia and the Pacific Region
1956
- Agreement for the Establishment of the Asia Pacific Fishery Commission
1951
(Source: ADB/UNEP 2004)
52
GIWA REGIONAL ASSESSMENT 55 MEKONG RIVER
(B) List of Policies, Laws, Decrees, Rules and Regulations
Policy/Law/Decree/Rule/Regulation
Year
Policy/Law/Decree/Rule/Regulation
Year
(1) Cambodia
(4) Thailand
1.1. Policies
4.1. Policies
- Natural Environmental Action Plan
1998 - 2003
- Policy and Prospective Plan for National Environmental Quality Enhancement and Protection
1997 2017
1.2. Laws, Decrees, Rules & Regulations
- Environmental Quality Management Plan
1999 - 2006
- Sub-Decree on Water Pollution Control
1999
4.2. Laws, Decrees, Rules & Regulations
- Sub-Decree on Solid Waste Management
1999
- National Environmental Quality Enhancement and Protection Act
1992
- Sub-Decree on Environmental Impact Assessment (EIA)
1999
- Factories Act
1992
- Law on Environmental Protection and Natural Resources Management
1996
- Public Health Act
1992
- Royal Decree on Protected Areas
1993
- Cleanliness and Orderliness of the Country Act
1992
- Hazardous Substances Act
1992
(2) Yunnan province of China
- Poisonous Substances Act
1967
2.1. Policies
- Energy Conservation Promotions Act
1992
- 9th 5-Year Plan and Long-term Environmental Protection Plan for 2010 for Yunnan province
1996-2010
- Wildlife Conservation and Protection Act
1992
2.2. Laws, Decrees, Rules & Regulations
- Forest Plantation Act
1992
- Forestry Law of the People's Republic of China
1998
- Forest Reserve Act
1964
- Law of the People's Republic of China on Conserving Energy
1997
- National Park Act
1961
- Flood Control Law of the People's Republic of China
1997
- Forestry Act
1947
- Mineral Resources Law of the People's Republic of China
1996
- Conservation of Wild Elephants Act
1921
- Law of the People's Republic of China on the Coal Industry
1996
- Fishery Act
1945
- Law of the People's Republic of China on Prevention and Control of Water Pollution
1996
- Mineral Act
1967
- Law of the People's Republic of China on Prevention and Control of Environmental Pollution
- Groundwater Act No. 2
1992
by Solid Waste
1995
- Prevention of Ships Collision Act
1979
- Law of the People's Republic of China on Water and Soil Conservation
1991
- Groundwater Act
1977
- Law of the People's Republic of China on the Protection of Wildlife
1988
- Navigation in Thai Waterways Act
1913
- Environmental Protection Law of the People's Republic of China
1989
(5) Myanmar
- Water Law of the People's Republic of China
1988
5.1. Policies
- Fisheries Law of the People's Republic of China
1986
- Myanmar Agenda 21
1997
- Grassland Law of the People's Republic of China
1985
- National Environmental Policy
1994
- Law of the People's Republic of China on the Protection of Cultural Relics
1982
- Forest Policy
1995
- Circular on Strengthening Environmental Protection in the Tourism Area
1995
- Regulation on Examining an Environmental Protection Facility along with Construction
5.2. Laws, Decrees, Rules & Regulations
Projects
1994
- Draft Environmental Law
2000
- Regulation on Environmental Pollution Prevention from the Electrical Facility and Wastes
- Protection of Wildlife and Wild Plants and Conservation of Natural Areas Law
1994
involved with PCBs
1991
- Mines Law
1994
- Ordinance on Radioactive Safeguards for Radioactive Isotope and Radiation
1989
- Plant Pest Quarantine Law
1993
- Regulation on Undertaking an Environmental Impact Assessment for the Construction Project
1989
-Forestry Law
1992
- Circular on Strengthening the Supervision to the Wastewater Discharge from Pesticide
- Freshwater Fisheries Law
1991
Production
1997
- Pesticide Law
1990
- Provisional Regulations on Environmental Control for Economic Zones Open to Foreigners
1986
- Law on Aquaculture
1989
- Regulations on Management of the Environmental Protection Standards
1983
- Law on Fishing Rights of Foreign Fishing Vessels
1989
- Irrigation Laws and Regulations
1982
(3) Lao PDR
- Factory Act
1950
3.1. Policies
(6) Vietnam
- Environmental Action Plan
1993
6.1. Policies
3.2. Laws, Decrees, Rules & Regulations
- National Plan for Environmental and Sustainable Development
1991 - 2000
- Prime Minister's Decree on Vientiane Urban Development and Administration Authority
2000
- Draft National Strategy for Environment Protection
2001 - 2010
- Formalised Environmental Impact Assessment (EIA)
2000
- Environmental Protection Law
1999
6.2. Laws, Decrees, Rules & Regulations
- President's Decree on Urban Planning Law
1999
- Instruction No. 490/1998/TT-BKHCNMT on Environmental Impact Assessments
1998
- Mining Law
1997
- Decree No. 28/CP on Sanctions against Administrative Violations on Environmental Protection
1996
- President's Decree on Historical, Cultural and National Heritage Protection
1997
- Law on Minerals
1996
- Prime Minister's Decree on Urban Development and Administration Authority (UDAA)
1997
- Decree No. 02/CP on Toxic Chemicals and Radioactive Substances
1995
- Prime Minister's Decree on Management and Use of Forest and Forestland
1993
- Instruction No.1420/QD-MTg for Guiding Environmental Impact Assessment to the Operating
- Water and Water Resources Law
1996
Units
1994
- Land Law
1997
- Decree 09/CP of the Government on Organising and Managing the Tourist Enterprise
1994
- Forest Law
1996
- Law on Environmental Protection
1993
- Prime Minister's Decree on the Protection of Sites and Buildings of National Importance
1994
- Law on Land
1993
- Decree on Logging Ban
1991
- Decree 14/CP on Administrative Fines in the Management and Protection of Forests
1992
- Decree on Adoption of Tropical Forest Programme
1991
- Precious and Rare Wild Plants and Animals Regulating their Management and Protection
1992
- Decree on Wild Animals, Fisheries, Hunting and Fishing
1989
- Law on Forest Protection and Development
1991
- Provisions on Discharge of Wastewater from Factories
1994
- Vietname Maritime Code
1990
- Regulations of Environmental Assessment in Lao PDR
2000
- Law on the Protection of People's Health
1989
- Law on Fisheries (draft)
- Law on Water Resources (draft)
- Vietnam Standards, Water Quality Maximum Allowable Pesticide Residues in the Soil, TCVN
5941
1995
- Vietnam Standards, Water Quality Surface Water Quality Standard, TCVN 5942
1995
- Vietnam Standards, Water Quality Coastal Water Quality Standard, TCVN 5943
1995
- Vietnam Standards, Water Quality Ground Water Quality Standard, TCVN 5944
1995
- Vietnam Standards, Water Quality Discharge Standard, TCVN 5945
1995
(Source: ADB/UNEP 2004)
ANNEXES
53
Annex V
Impact Assessment for GIWA Mekong River region:
Environmental & socio-economic impact statements and causes of priority GIWA concerns and envi-
ronmental issues
Priority GIWA Concern
Priority GIWA Environmental Issue
Impact Statement (environmental & socio-economic)
Possible Causes
Concern
Overall
Socio-economic Issue
Overall
Environmental Impact Scores*
Score
Impact Score
III. Habitat and
3
2-3-1
12. Loss of ecosystems
3
1) The area of forestland decreased by 98 145 km˛ between
1) The loss was largely due to excessive logging,
community
1993 and 2003; a loss of around 12% of the total forestland
uncontrolled shift cultivation, encroachment of forest
modification
area.
reserves by human settlements, and uncontrolled farming
and infrastructure development, as well as the increasing
use of wood fuel and inappropriate land occupation.
2) Large areas of mangrove forests around the Mekong
2) The loss was due to wartime hostilities and post-war
Delta have been destroyed over the past 2-3 decades; around
agricultural expansion as well as the conversion of
120 000 ha remain today.
mangroves to shrimp ponds.
3) The livelihood of the population in the MRB has been
3) Because the rural communities in the region depend
affected by the loss of forestland and mangrove forests.
on the natural resources of the ecosystems to subsist, the
loss of ecosystems will reduce their income and quality
of life.
4) The loss of ecosystems in the region has substantial
4) Most of the fish species in the MRB are migratory; the
transboundary implications.
destruction of spawning or breeding habitats in one
riparian country affects the recruitment and harvest of
fish in other riparian countries.
13. Modification of
3
1) Millions of hectares of valuable forestland in the region
1) The degradation is caused by unsustainable human
ecosystems
have been degraded to inferior shrub, grassland or savannah.
and development activities, e.g. population growth,
deforestation, urbanisation, dam construction, irrigation,
etc.
2) The aesthetic and recreational values of the habitats have
2) The modification of habitats has reduced the number
been greatly reduced.
of goods and services that they provide.
3) Cost of controlling alien species and restoring ecosystems.
3) The introduction of alien species for aquaculture, the
stocking of lakes and reservoirs and the aquarium trade.
4) Employment opportunities, particularly in the fisheries
4) Modifications or loss of habitats indirectly influences
sector, have substantially declined.
fisheries production which, in turn, changes the
employment opportunities for fishers.
5) Modification of ecosystems, e.g. the Melaleuca forest land,
5) Some of these forests are transboundary in that they
has substantial transboundary implications for environmental
cover more than one territory.
management.
IV.
3
2-3-0
14. Overexploitation
3
1) Catches per fisheman have declined by approximately 44%
1) The number of fishermen has greatly increased and
Unsustainable
between the 1940s and 1995.
the larger population places additional pressure on the
exploitation
fisheries.
of fish & other
living resources
2) The abundance of fish resources in the region has declined
2) The building and operation of dams and weirs has
over the past decade.
disrupted fish migration and spawning, thus reducing
fisheries productivity; habitat loss and deforestation
have modified or destroyed habitats that fish require
for spawning and feeding; the use of destructive fishing
practices has reduced fish recruitment.
3) Employment opportunities in the fisheries sector have
3) Overexploitation has led to a reduced catch per unit
decreased.
effort, which has affected employment opportunities in
the fisheries sector.
4) The livelihood strategies of local communities have
4) The loss of commercially valuable fish species and
significantly changed.
the destruction of habitats has forced fishers to seek
alternative livelihoods.
5) Competition among fishermen from different countries due 5) Migratory fish constitute a significant proportion of the
to them fishing the same migratory stocks.
some 1 500 species of ichtyofauna in the MRB. Conflicts
arise from foreign fishers operating in the fishing grounds
of their neighbouring country.
* Scores for: Social & Community Economic Human Health, respectively.
54
GIWA REGIONAL ASSESSMENT 55 MEKONG RIVER
Priority GIWA Concern
Priority GIWA Environmental Issue
Impact Statement (environmental &
Possible Causes
socio-economic)
Concern
Overall
Socio-economic
Issue
Overall Score
Environmental
Impact Scores*
Impact Score
IV. Unsustainable
3
2-3-0
18. Impact on biological & 3
1) Current practices used for the
1) Such practices are chaotic and uncontrolled,
exploitation of fish &
genetic diversity
introduction and movement of alien fish in
particularly in the aquaculture sector; alien
other living resources
the MRB have resulted in the degradation of fish species that are established in the local
- continued
the genetic quality of wild stocks.
environment have replaced endemic species and
reduced the biodiversity of wild stocks.
2) The degradation of the genetic quality of 2) Most of the fish species in the region are
fish stocks has transboundary implications
migratory species. There is evidence that
for fisheries management.
the biological and genetic diversity of some
of these species has changed as a result of
overexploitation.
II. Pollution
2
2-1-2
7. Suspended solids
3
1) High TSS loads in the mainstream and
1) Development activities such as deforestation,
the tributaries of Mekong.
mining, grazing and urbanisation have caused
extensive erosion in many parts of the MRB.
2) High TSS loads in the Mekong River
2) High TSS loads destroy or modify critical
system have affected the well-being of the
habitats, particularly spawning and breeding
population in the MRB.
grounds of fish, resulting in a reduction in
ecosystem products and services.
3) TSS pollution has transboundary
3) Suspended solids are carried from one
implications for management.
part of the MRB to another, from upstream to
downstream of the Mekong River, blocking
channels, destroying or modifying habitats and
forming deltas at the river mouths.
I. Freshwater shortage
2
2-1-1
1. Modification of stream
3
1) The hydrological cycle of the Mekong
1) Heavy rainfall during the rainy season results
flow
River and its tributaries is altered
in the flooding of lowland areas in the MRB.
periodically.
2) Human and development activities, such as
2) The course and flow volume of the
the construction of dams, improvement of river
Mekong River and its tributaries has
navigation routes, diversion of river water for
changed.
irrigation etc., have greatly modified the flow
regime of the Mekong River and its tributaries.
3) Changes in the hydrological cycle
3) The Mekong River is an international river
and the flow volume of the Mekong
that traverses six countries. The upstream
River and its tributaries have imposed
modification of stream flow affects downstream
substantial transboundary implications for
environmental conditions.
environmental management.
4) The well-being of the population in
4) Flooding causes varying degrees of damage
the MRB has been affected by changes in
to agricultural production, rural infrastructure
the course and flow volume of the Mekong
and human settlements, as well as causing a
River and its tributaries.
loss of life.
* Scores for: Social & Community Economic Human Health, respectively.
ANNEXES
55
Annex VI
Alien species introduced to the Mekong River Basin
(Source: Welcomme & Vidthayanom 2003)
Introduced/alien Description of the introduction
species
1. Arapaima
This species has been introduced to the MRB through the aquarium fish trade. Some experiments have been made for its aquaculture development. Escaped individuals have
(Arapaima gigas)
occasionally been found in natural waters in central Thailand. The species is long-lived and can grow to a very large size. It is a voracious predator and a mouth brooder.
It has been introduced to Thailand as an ornamental fish from China around 1300 AD and to Vietnam at an unknown date. The species reproduces naturally in captivity but
2. Goldfish
does not apparently do so in the natural waters of Thailand. More recently, a variety of this species was recorded in the MRB; these are probably escapees from the Red River
(Carassius auratus)
Basin in Vietnam and from the river network in Lao PDR, and they are presumed to be breeding naturally. Goldfish is a generalised feeder and sticks its spawned eggs onto
aquatic plants.
This species is one of the Indian major carps introduced from India into Lao PDR (1977) and Thailand (1979), and later from Lao PDR into Vietnam (1984) for aquaculture.
3. Mrigal carp
The species is also used for stocking dams. It is thought to be breeding naturally within the basin, since its fry have been found in the mainstream of the Mekong River in
(Cirrhinus cirrhinus)
northeast Thailand. There are two native or endemic species of Cirrhinus, which have better eating qualities, but do not respond well to culture in ponds. The species is used for
aquaculture throughout the MRB, where it is regarded as generally beneficial. The Mrigal carp lays demersal eggs and feeds on detritus and periphyton.
The African catfish was first introduced into Vietnam from the Central African Republic in 1974 for aquaculture. It has since been introduced into other riparian countries of
the MRB by internal transfer. It has been widely used for aquaculture and has been hybridised with the native Clarias macrocephalus (C. gariepinus male x C. macrocephalus
4. African catfish
female). A wild population of the fish has been reported to be established throughout the MRB. However, no immediate detrimental environmental effects have been noted in
(Clarias gariepinus)
the MRB or in other areas to which the species has been introduced. The species has a wide range of feeding habits from predation to generalised benthic feeders, and migrates
to shallow flooded areas to spawn large quantities of adhesive eggs. The fish and its hybrids are highly tolerant of poor water quality and deoxygenated conditions. This
tolerance gives the species and the hybrid a competitive advantage over native clariid catfish.
5. Grass carp
It is one of the first species introduced to the MRB. It was introduced from China and Hong Kong to Thailand in 1932, to Vietnam in 1958 and to Lao PDR at an undetermined
(Ctenopharyngodon date. The species is used for aquaculture throughout the MRB and is highly appreciated by consumers. It has also been stocked in reservoirs, ditches and canals to control
idella)
invasive aquatic vegetation. The species does not breed naturally in any part of the MRB and its aquaculture is normally maintained by artificial reproduction and continuous
stocking. As its name suggests, the grass carp is one of the few fish to feed primarily on higher vegetation.
6. Common carp
The species was introduced into Thailand from China, Japan, Israel and Germany from 1913 onwards, into Lao PDR from Thailand and India in 1977, and into Vietnam from
(Cyprinus carpio)
Hungary during the period 1969-1975. A complex of variant species has established themselves since the introduction of the species to the MRB. They can be differentiated into
two groups: the silver varieties originating from southern China and northern Vietnam, and the yellow varieties originating from eastern Europe. The Common carp has been
the keystone species for many aquaculture development projects in the MRB. The species complex is widely established in the wild and in many areas, and is now regarded
as a permanent element of the fauna in the MRB. Common carp are notorious for the way their populations rapidly increase following environmental disturbances by dams.
Their habit of digging around in the bottom and muddying the water can seriously alter the environment to the detriment of other species. Given that the species is now
firmly established, there seems little that can be done to eradicate this potentially troublesome fish. Common carp are basically detritus and mud feeders. They breed on the
vegetated margins of lakes and rivers where they deposit their adhesive eggs on submerged vegetation.
7. Mosquito fish
The species was introduced into drainage ditches throughout the MRB at an unknown date for mosquito control, escaping later into the main tributaries of the Mekong River.
(Gambusia affinis)
It is now found at the margins of most water bodies including rice fields and floodplain lakes. The species is tolerant of high salinity and it is not regarded as detrimental
although its habit of eating eggs and larvae of other fish may do some damage to fish stocks. The species feeds on surface-living insects and other particulate matter falling on
the surface, and it is a live-bearer.
8. Catla carp (Catla
The species was introduced into Lao PDR from India in 1977 and Thailand in 1979. Subsequently, some of Lao PDR's stock was introduced to Vietnam for aquaculture in 1984.
catla)
It is also used for stocking dams and has been recorded as breeding naturally within the waters of MRB but no natural stocks have been reported. Due to its slow growth
rate, culture of this species has been largely abandoned in Thailand and Vietnam. The Catla carp feeds on phytoplankton and detritus and normally lays demersal eggs in the
mainstream of a river.
9. Silver carp
The species was introduced from China into Thailand in 1913 and Vietnam in 1958 for aquaculture. It is widely used for aquaculture throughout the MRB and is artificially
(Hypothalmichythys bred for this purpose. The species is recorded as having established itself in the Saigon River. Fry of the species have been reported in tributaries of the Mekong River in LMRB,
molitrix)
indicating that it has possibly established there. The species feeds on detritus and phytoplankton and may compete with species of similar habit in the MRB.
10. Bighead carp
Bighead carp were introduced from China into Thailand in 1932 and Vietnam in 1958 for aquaculture. This species does not breed naturally in ponds and continues to be
(Hypothalmichthys
artificially reproduced. However, fry of the species have been found in the Red River and Saigon River indicating that it has possibly established in those rivers as well. The
nobilis)
species feeds primarily on phytoplankton.
11. Black sucker
Black sucker catfish were introduced throughout the MRB countries for the aquarium fish trade. They have been found in rice fields in northeast Thailand for at least ten years
catfish (Hypostomus and in small urban water bodies. The natural environment where the species dwells ranges from rapids to floodplain pools. Therefore, it can be anticipated that it will spread
plecostomus)
throughout the MRB.
12. Rohu carp
This is another species of the Indian major carp group that was introduced from India into Thailand in 1968, Lao PDR in 1977 and Vietnam in 1982-1984 for aquaculture.
(Labeo rohita)
Nowadays, the species is widely used for aquaculture throughout the MRB countries. It is preferred more than the native species because it is easier to breed artificially and
responds better to handling. Its fry are occasionally found in the mainstream of the Mekong River, indicating that the species is breeding naturally although some fry may be
released from culture installations. The Rohu carp are generally periphyton and detritus feeders and lay semi-pelagic eggs.
13. Black carp
Black carp were introduced from China into Thailand for aquaculture as early as 1913. But since 1980, the species has not been aquacultured; the reason for the disappearance
(Mylopharyngodon
of the species is not known.
aureus)
14. Green tilapia
This species was introduced into Thailand in 1970 from Israel. Although the species has not been popular for aquaculture, it appears to have established itself in reservoirs
(Oreochromis
in tributaries of the Mekong River in northern Thailand. These populations are still in existence and the spread of the species further downstream cannot be excluded. The
aureus)
species is a generalised feeder with a preference for detritus and decanted phytoplankton. It also eats small fish and fish larvae. The species is a maternal mouth brooder that
constructs nests in shallow water for breeding and fertilisation.
15. Red throat
This is one of the most widespread tilapia species used for aquaculture and stocking of reservoirs in the MRB. It was first introduced to Thailand in 1949 from Malaysia, and into
tilapia (O.
Vietnam from Africa and the Philippines during the period of 1951-1955, into Lao PDR in 1955 from Thailand, and into Cambodia at an unknown date. The species may form
mossambicus)
established stocks in the MRB, particularly in saline environments, such as Lake Nont Bo in northeast Thailand, as well as throughout the Mekong Delta. Red throat tilapis is
notorious for forming dense populations of stunted fish, particularly in brackish water areas and small canals and lakes, as has happened in the Mekong Delta. The species is a
maternal mouth brooder that constructs nests in shallow water for breeding and fertilisation.
56
GIWA REGIONAL ASSESSMENT 55 MEKONG RIVER
16. Nile tilapia (O.
This introduced species is one of the most popular for aquaculture and for stocking dams and reservoirs throughout the tropical world, including the LMRB. It was introduced
niloticus)
into Thailand from Japan in 1965, into Vietnam in 1973 and 1994 from Taiwan, the Philippines and Thailand, and into Lao PDR and Cambodia at an unknown date. The species is
not known to have any detrimental environmental impact throughout its introduced range and has become one of the pan-tropical species. It is one of the few species that can
readily digest blue green algae and as such is of value in the control of eutrophication. It also eats detritus and can feed on small fish and fish larvae. The species is a maternal
mouth brooder that constructs nests in shallow water for breeding and fertilisation. The GIFT strain of O. niloticus is now reared in and distributed from the Government
hatchery in Khon Kaen (Thailand), which is further developing the strain to meet local conditions. Several private hatcheries are licensed to produce this fish for sale to both
pond and cage culture locations. The Khon Kaen hatchery maintains the Egyptian Manzalla strain of O. niloticus.
17. Red tilapia
Red tilapia is in fact the variant species formed from hybrids between O.niloticus and O. mossambicus. This variant hybrid is saline tolerant and is popular in Thailand and Lao
PDR for aquaculture in ponds and cages.
18. Red cheek
Red cheek tilapia was introduced from Belgium into Thailand in 1955 for aquaculture. Established populations of this species exist in reservoirs around Sakhon Nakhon in
tilapia (Oreochromis northeast Thailand. It is a parental guarder that lays its eggs in a series of small pit-like nests.
rendalli)
19. Guppy (Poecilia
This species has been introduced into Thailand as an ornamental fish for the aquarium trade as well as for mosquito control. It has established itself in the wild in small streams
reticulate)
and ditches, rice fields and other shallow, still water habitats throughout the LMRB. The species is a live bearer and feeds mainly on surface material, including small insects.
20. Sailfin molly
The Sailfin molly was first introduced from Taiwan into Thailand for the aquarium fish trade around 1970. The species is also found in the Mekong Delta in Vietnam. It is a live
(Poecilia velifera)
bearer and is a microphagous omnivore.
21. Apple snails
These species have been introduced from various sources into Thailand for aquaculture from 1988 onwards. Apple snails have now established in the wild and have shown
(Pomacea
a major impact on aquatic habitats, including rice fields because they have the habit of destroying the bases of growing aquatic plants, causing enormous economic losses
canaliculatus, P.
for rice farmers and the degradation of natural wetland habitats by stripping vegetation. The snails have a very broad spectrum of feeding habits, using most aquatic plants
gagas)
including water hyacinths. In addition, the introduced snails compete with the endemic species of snails such as Pila spp., which are relatively benign in their effect, since they
feed only on already moribund plants. Apple snails are tolerant of salinity and are thus able to penetrate coastal habitats. This is an example of the disastrous consequences
that can follow an inappropriate introduction of an alien species.
22. Louisiana
It has been introduced into Thailand from an unknown source for aquaculture. The species has established itself in the wild where it is regarded as a nuisance.
crayfish
(Procambarus
charkii)
23. Chinese
Chinese soft-shell turtle was introduced into Thailand on several occasions since 1977. It is now regularly reproduced in captivity and has formed natural populations. These
soft-shell turtle
have impacted on native turtle species.
(Pelodiscus
chinensis)
24. American
This turtle species was introduced to Thailand in 1975 for the aquarium trade. It is now bred in captivity and has formed natural populations in Central Thailand. It is probably
painted turtle
found in the Mekong River watersheds because there is a tendency on the part of owners to release them when they have grown beyond an acceptable size.
(Pseudemys
scriptac)
25. American
The American bullfrog was introduced into Thailand for aquaculture in the 1980s. It has become established in the wild and its ecological impact is unknown. The species
bullfrog (Rana
is apparently already found in the Vietnamese part of the MRB; probably having been released by farmers when it was apparent that the culture of this species was not
catesbiana)
profitable.
26. Japanese eel
Although the species was introduced into Thailand in 1973 for the purpose of aquaculture, commercial aquaculture of this species was not popular. There is no indication that
(Anguilla japonicus)
this species has established itself in the MRB.
27. Channel
Channel catfish was first introduced from the United States into Thailand in 1989 for aquaculture. It was also introduced into central and northern Thailand where it was
catfish (Ictalurus
cultured experimentally. All fish escaped during the great flood of 1995 and were later found in the natural habitat. However, there are no further records of the impact of this
punctatus)
introduction. This species is a generalised bottom feeder that can adopt predatory habits. It builds nests for its eggs, which are later guarded by the parents.
28. Rainbow trout
This species was introduced from Canada into Thailand in 1963 for the purpose of establishing a sport fishery in the mountainous areas in the north of the country. The
(Onchorhynchus
introduction was unsuccessful and did not affect the Mekong River system. However, similar proposals surface from time to time in the interests of tourism and some eggs
mykiss)
have been introduced into Northern Thailand for experimental culture. It is doubtful that this species would establish in the lower reaches of the river but may do so in the high
mountainous tributaries of the UMRB in Yunnan province, China.
ANNEXES
57
58
GIWA REGIONAL ASSESSMENT 55 MEKONG RIVER
The Global International
Waters Assessment
This report presents the results of the Global International Waters
Adequately managing the world's aquatic resources for the benefi t of
Assessment (GIWA) of the transboundary waters of the Mekong
all is, for a variety of reasons, a very complex task. The liquid state of
River region. This and the subsequent chapter off er a background
the most of the world's water means that, without the construction
that describes the impetus behind the establishment of GIWA, its
of reservoirs, dams and canals it is free to fl ow wherever the laws of
objectives and how the GIWA was implemented.
nature dictate. Water is, therefore, a vector transporting not only a
wide variety of valuable resources but also problems from one area
to another. The effl
uents emanating from environmentally destructive
activities in upstream drainage areas are propagated downstream
The need for a global
and can aff ect other areas considerable distances away. In the case of
international waters
transboundary river basins, such as the Nile, Amazon and Niger, the
assessment
impacts are transported across national borders and can be observed
in the numerous countries situated within their catchments. In the case
of large oceanic currents, the impacts can even be propagated between
Globally, people are becoming increasingly aware of the degradation of
continents (AMAP 1998). Therefore, the inextricable linkages within
the world's water bodies. Disasters from fl oods and droughts, frequently
and between both freshwater and marine environments dictates that
reported in the media, are considered to be linked with ongoing global
management of aquatic resources ought to be implemented through
climate change (IPCC 2001), accidents involving large ships pollute public
a drainage basin approach.
beaches and threaten marine life and almost every commercial fi sh stock
is exploited beyond sustainable limits - it is estimated that the global
In addition, there is growing appreciation of the incongruence
stocks of large predatory fi sh have declined to less that 10% of pre-
between the transboundary nature of many aquatic resources and the
industrial fi shing levels (Myers & Worm 2003). Further, more than 1 billion
traditional introspective nationally focused approaches to managing
people worldwide lack access to safe drinking water and 2 billion people
those resources. Water, unlike laws and management plans, does not
lack proper sanitation which causes approximately 4 billion cases of
respect national borders and, as a consequence, if future management
diarrhoea each year and results in the death of 2.2 million people, mostly
of water and aquatic resources is to be successful, then a shift in focus
children younger than fi ve (WHO-UNICEF 2002). Moreover, freshwater
towards international cooperation and intergovernmental agreements
and marine habitats are destroyed by infrastructure developments,
is required (UN 1972). Furthermore, the complexity of managing the
dams, roads, ports and human settlements (Brinson & Malvárez 2002,
world's water resources is exacerbated by the dependence of a great
Kennish 2002). As a consequence, there is growing public concern
variety of domestic and industrial activities on those resources. As a
regarding the declining quality and quantity of the world's aquatic
consequence, cross-sectoral multidisciplinary approaches that integrate
resources because of human activities, which has resulted in mounting
environmental, socio-economic and development aspects into
pressure on governments and decision makers to institute new and
management must be adopted. Unfortunately however, the scientifi c
innovative policies to manage those resources in a sustainable way
information or capacity within each discipline is often not available or
ensuring their availability for future generations.
is inadequately translated for use by managers, decision makers and
GLOBAL INTERNATIONAL WATERS ASSESSMENT
i
policy developers. These inadequacies constitute a serious impediment
The Global Environment Facility (GEF)
to the implementation of urgently needed innovative policies.
The Global Environment Facility forges international co-operation and fi nances actions to address
six critical threats to the global environment: biodiversity loss, climate change, degradation of
international waters, ozone depletion, land degradation, and persistent organic pollutants (POPs).
Continual assessment of the prevailing and future threats to aquatic
The overall strategic thrust of GEF-funded international waters activities is to meet the incremental
ecosystems and their implications for human populations is essential if
costs of: (a) assisting groups of countries to better understand the environmental concerns of
their international waters and work collaboratively to address them; (b) building the capacity
governments and decision makers are going to be able to make strategic
of existing institutions to utilise a more comprehensive approach for addressing transboundary
policy and management decisions that promote the sustainable use of
water-related environmental concerns; and (c) implementing measures that address the priority
transboundary environmental concerns. The goal is to assist countries to utilise the full range of
those resources and respond to the growing concerns of the general
technical, economic, fi nancial, regulatory, and institutional measures needed to operationalise
public. Although many assessments of aquatic resources are being
sustainable development strategies for international waters.
conducted by local, national, regional and international bodies, past
United Nations Environment Programme (UNEP)
assessments have often concentrated on specifi c themes, such as
United Nations Environment Programme, established in 1972, is the voice for the environment
biodiversity or persistent toxic substances, or have focused only on
within the United Nations system. The mission of UNEP is to provide leadership and encourage
partnership in caring for the environment by inspiring, informing, and enabling nations and
marine or freshwaters. A globally coherent, drainage basin based
peoples to improve their quality of life without compromising that of future generations.
assessment that embraces the inextricable links between transboundary
UNEP work encompasses:
freshwater and marine systems, and between environmental and
Assessing global, regional and national environmental conditions and trends;
Developing international and national environmental instruments;
societal issues, has never been conducted previously.
Strengthening institutions for the wise management of the environment;
Facilitating the transfer of knowledge and technology for sustainable development;
Encouraging new partnerships and mind-sets within civil society and the private sector.
International call for action
University of Kalmar
University of Kalmar hosts the GIWA Co-ordination Offi ce and provides scientifi c advice and
administrative and technical assistance to GIWA. University of Kalmar is situated on the coast of
The need for a holistic assessment of transboundary waters in order to
the Baltic Sea. The city has a long tradition of higher education; teachers and marine offi cers have
been educated in Kalmar since the middle of the 19th century. Today, natural science is a priority
respond to growing public concerns and provide advice to governments
area which gives Kalmar a unique educational and research profi le compared with other smaller
universities in Sweden. Of particular relevance for GIWA is the established research in aquatic and
and decision makers regarding the management of aquatic resources
environmental science. Issues linked to the concept of sustainable development are implemented
was recognised by several international bodies focusing on the global
by the research programme Natural Resources Management and Agenda 21 Research School.
environment. In particular, the Global Environment Facility (GEF)
Since its establishment GIWA has grown to become an integral part of University activities.
The GIWA Co-ordination offi ce and GIWA Core team are located at the Kalmarsund Laboratory, the
observed that the International Waters (IW) component of the GEF
university centre for water-related research. Senior scientists appointed by the University are actively
suff ered from the lack of a global assessment which made it diffi
cult
involved in the GIWA peer-review and steering groups. As a result of the cooperation the University
can offer courses and seminars related to GIWA objectives and international water issues.
to prioritise international water projects, particularly considering
the inadequate understanding of the nature and root causes of
environmental problems. In 1996, at its fourth meeting in Nairobi, the
causes of degradation of the transboundary aquatic environment and
GEF Scientifi c and Technical Advisory Panel (STAP), noted that: "Lack of
options for addressing them. These pro cesses led to the development
an International Waters Assessment comparable with that of the IPCC, the
of the Global International Waters Assessment (GIWA) that would be
Global Biodiversity Assessment, and the Stratospheric Ozone Assessment,
implemented by the United Nations Environment Programme (UNEP) in
was a unique and serious impediment to the implementation of the
conjunction with the University of Kalmar, Sweden, on behalf of the GEF.
International Waters Component of the GEF".
The GIWA was inaugurated in Kalmar in October 1999 by the Executive
Director of UNEP, Dr. Klaus Töpfer, and the late Swedish Minister of the
The urgent need for an assessment of the causes of environmental
Environment, Kjell Larsson. On this occasion Dr. Töpfer stated: "GIWA
degradation was also highlighted at the UN Special Session on
is the framework of UNEP´s global water assessment strategy and will
the Environment (UNGASS) in 1997, where commitments were
enable us to record and report on critical water resources for the planet for
made regarding the work of the UN Commission on Sustainable
consideration of sustainable development management practices as part of
Development (UNCSD) on freshwater in 1998 and seas in 1999. Also in
our responsibilities under Agenda 21 agreements of the Rio conference".
1997, two international Declarations, the Potomac Declaration: Towards
enhanced ocean security into the third millennium, and the Stockholm
The importance of the GIWA has been further underpinned by the UN
Statement on inter action of land activities, freshwater and enclosed
Millennium Development Goals adopted by the UN General Assembly
seas, specifi cally emphasised the need for an investigation of the root
in 2000 and the Declaration from the World Summit on Sustainable
iI
REGIONAL ASSESSMENTS
Development in 2002. The development goals aimed to halve the
International waters and transboundary issues
proportion of people without access to safe drinking water and basic
The term "international waters", as used for the purposes of the GEF Operational Strategy,
sanitation by the year 2015 (United Nations Millennium Declaration
includes the oceans, large marine ecosystems, enclosed or semi-enclosed seas and estuaries, as
well as rivers, lakes, groundwater systems, and wetlands with transboundary drainage basins
2000). The WSSD also calls for integrated management of land, water and
or common borders. The water-related ecosystems associated with these waters are considered
living resources (WSSD 2002) and, by 2010, the Reykjavik Declaration on
integral parts of the systems.
The term "transboundary issues" is used to describe the threats to the aquatic environment
Responsible Fisheries in the Marine Ecosystem should be implemented
linked to globalisation, international trade, demographic changes and technological advancement,
by all countries that are party to the declaration (FAO 2001).
threats that are additional to those created through transboundary movement of water. Single
country policies and actions are inadequate in order to cope with these challenges and this makes
them transboundary in nature.
The international waters area includes numerous international conventions, treaties, and
agreements. The architecture of marine agreements is especially complex, and a large number
The conceptual framework
of bilateral and multilateral agreements exist for transboundary freshwater basins. Related
conventions and agreements in other areas increase the complexity. These initiatives provide
and objectives
a new opportunity for cooperating nations to link many different programmes and instruments
into regional comprehensive approaches to address international waters.
Considering the general decline in the condition of the world's aquatic
the large-scale deforestation of mangroves for ponds (Primavera 1997).
resources and the internationally recognised need for a globally
Within the GIWA, these "non-hydrological" factors constitute as large
coherent assessment of transboundary waters, the primary objectives
a transboundary infl uence as more traditionally recognised problems,
of the GIWA are:
such as the construction of dams that regulate the fl ow of water into
To provide a prioritising mechanism that allows the GEF to focus
a neighbouring country, and are considered equally important. In
their resources so that they are used in the most cost eff ective
addition, the GIWA recognises the importance of hydrological units that
manner to achieve signifi cant environmental benefi ts, at national,
would not normally be considered transboundary but exert a signifi cant
regional and global levels; and
infl uence on transboundary waters, such as the Yangtze River in China
To highlight areas in which governments can develop and
which discharges into the East China Sea (Daoji & Daler 2004) and the
implement strategic policies to reduce environmental degradation
Volga River in Russia which is largely responsible for the condition of
and improve the management of aquatic resources.
the Caspian Sea (Barannik et al. 2004). Furthermore, the GIWA is a truly
regional assessment that has incorporated data from a wide range of
In order to meet these objectives and address some of the current
sources and included expert knowledge and information from a wide
inadequacies in international aquatic resources management, the GIWA
range of sectors and from each country in the region. Therefore, the
has incorporated four essential elements into its design:
transboundary concept adopted by the GIWA extends to include
A broad transboundary approach that generates a truly regional
impacts caused by globalisation, international trade, demographic
perspective through the incorporation of expertise and existing
changes and technological advances and recognises the need for
information from all nations in the region and the assessment of
international cooperation to address them.
all factors that infl uence the aquatic resources of the region;
A drainage basin approach integrating freshwater and marine
systems;
A multidisciplinary approach integrating environmental and socio-
The organisational structure and
economic information and expertise; and
implementation of the GIWA
A coherent assessment that enables global comparison of the
results.
The scale of the assessment
Initially, the scope of the GIWA was confi ned to transboundary waters
The GIWA builds on previous assessments implemented within the GEF
in areas that included countries eligible to receive funds from the GEF.
International Waters portfolio but has developed and adopted a broader
However, it was recognised that a truly global perspective would only
defi nition of transboundary waters to include factors that infl uence the
be achieved if industrialised, GEF-ineligible regions of the world were
quality and quantity of global aquatic resources. For example, due to
also assessed. Financial resources to assess the GEF-eligible countries
globalisation and international trade, the market for penaeid shrimps
were obtained primarily from the GEF (68%), the Swedish International
has widened and the prices soared. This, in turn, has encouraged
Development Cooperation Agency (Sida) (18%), and the Finnish
entrepreneurs in South East Asia to expand aquaculture resulting in
Department for International Development Cooperation (FINNIDA)
GLOBAL INTERNATIONAL WATERS ASSESSMENT
iII
1b
1c
1d
16
15
11
14
12
1a
13
17
28
10
18
25
30
9
19
23
7
22
8
31
6
24
33
20
34
26
2
5
27
50
51
32
21
36
37
41
52
4
49
53
43
54
55
65
42
3
56
42
46
42
47
62
40b
57
40a
40a
47
47
45b
59
39
45a
58
64
60
44
38
61
63
66
GIWA 2006
1a Russian Arctic (4 LMEs)
8 Gulf of St Lawrence
17 Baltic
Sea
(LME)
26 California Current (LME)
38 Patagonian Shelf (LME)
45b Indian Ocean Islands
52 Arabian
Sea
(LME)
61 Great
Australian
Bight
1b Arctic
Greenland
(LME)
9 Newfoundland
Shelf
(LME)
18 North
Sea
(LME)
27 Gulf of California (LME)
39 Brazil
Current
(LME)
46 Somali Coastal
53 Bay of Bengal
62 Pacifi c Islands
1c Arctic
European/Atlantic
10 Baffi
n Bay, Labrador Sea,
19 Celtic-Biscay
Shelf
(LME)
28 Bering Sea (LME)
40a Northeast Brazil
Current (LME)
54 South China Sea (2 LMEs)
63 Tasman
Sea
1d Arctic North American
Canadian Archipelago
20 Iberian Coastal Sea (LME)
30 Sea of Okhotsk (LME)
Shelf (2 LMEs)
47 East
African
Rift
55 Mekong
River
64 Humboldt Current (LME)
2
Gulf of Mexico (LME)
11 Barents
Sea
(LME)
21 North
Africa
and
31 Oyashio
Current
(LME)
40b Amazon
Valley Lakes
56 Sulu-Celebes
Sea
(LME)
65 Eastern Equatorial
3 Caribbean
Sea
(LME)
12 Norwegian
Sea
(LME)
Nile River Basin (LME)
32 Kuroshio
Current
(LME)
41 Canary
Current
(LME)
49 Red Sea and
57 Indonesian
Seas
(LME)
Pacifi c (LME)
4 Caribbean
Islands
(LME)
13 Faroe
plateau
22 Black Sea (LME)
33 Sea
of
Japan
(LME)
42 Guinea Current (LME)
Gulf of Aden (LME)
58 North Australian
66 Antarctic (LME)
5 Southeast
Shelf
(LME)
14 Iceland
Shelf
(LME)
23 Caspian
Sea
34 Yellow Sea (LME)
43 Lake
Chad
50 Euphrates and
Shelf (LME)
6 Northeast
Shelf
(LME)
15 East
Greenland
Shelf
(LME)
24 Aral Sea
36 East China Sea (LME)
44 Benguela Current (LME)
Tigris River Basin
59 Coral
Sea
Basin
7 Scotian
Shelf
(LME)
16 West
Greenland
Shelf
(LME)
25 Gulf of Alaska (LME)
37 Hawaiian
Archipelago
(LME)
45a Agulhas Current (LME)
51 Jordan
60 Great Barrier Reef (LME)
Figure 1
The 66 transboundary regions assessed within the GIWA project.
(10%). Other contributions were made by Kalmar Municipality, the
Large Marine Ecocsystems (LMEs)
University of Kalmar and the Norwegian Government. The assessment of
Large Marine Ecosystems (LMEs) are regions of ocean space encompassing coastal areas from river
regions ineligible for GEF funds was conducted by various international
basins and estuaries to the seaward boundaries of continental shelves and the outer margin of the
major current systems. They are relatively large regions on the order of 200 000 km2 or greater,
and national organisations as in-kind contributions to the GIWA.
characterised by distinct: (1) bathymetry, (2) hydrography, (3) productivity, and (4) trophically
dependent populations.
The Large Marine Ecosystems strategy is a global effort for the assessment and management
In order to be consistent with the transboundary nature of many of the
of international coastal waters. It developed in direct response to a declaration at the 1992
world's aquatic resources and the focus of the GIWA, the geographical
Rio Summit. As part of the strategy, the World Conservation Union (IUCN) and National Oceanic
and Atmospheric Administration (NOAA) have joined in an action program to assist developing
units being assessed have been designed according to the watersheds
countries in planning and implementing an ecosystem-based strategy that is focused on LMEs as
of discrete hydrographic systems rather than political borders (Figure 1).
the principal assessment and management units for coastal ocean resources. The LME concept is
also adopted by GEF that recommends the use of LMEs and their contributing freshwater basins
The geographic units of the assessment were determined during the
as the geographic area for integrating changes in sectoral economic activities.
preparatory phase of the project and resulted in the division of the
world into 66 regions defi ned by the entire area of one or more
The global network
catchments areas that drains into a single designated marine system.
In each of the 66 regions, the assessment is conducted by a team of
These marine systems often correspond to Large Marine Ecosystems
local experts that is headed by a Focal Point (Figure 2). The Focal Point
(LMEs) (Sherman 1994, IOC 2002).
can be an individual, institution or organisation that has been selected
on the basis of their scientifi c reputation and experience implementing
Considering the objectives of the GIWA and the elements incorporated
international assessment projects. The Focal Point is responsible
into its design, a new methodology for the implementation of the
for assembling members of the team and ensuring that it has the
assessment was developed during the initial phase of the project. The
necessary expertise and experience in a variety of environmental
methodology focuses on fi ve major environmental concerns which
and socio-economic disciplines to successfully conduct the regional
constitute the foundation of the GIWA assessment; Freshwater shortage,
assessment. The selection of team members is one of the most critical
Pollution, Habitat and community modifi cation, Overexploitation of fi sh
elements for the success of GIWA and, in order to ensure that the
and other living resources, and Global change. The GIWA methodology
most relevant information is incorporated into the assessment, team
is outlined in the following chapter.
members were selected from a wide variety of institutions such as
iV
REGIONAL ASSESSMENTS
an assessment did not exist. Therefore, in order to implement the GIWA,
Steering Group
a new methodology that adopted a multidisciplinary, multi-sectoral,
multi-national approach was developed and is now available for the
implementation of future international assessments of aquatic resources.
GIWA Partners
IGOs, NGOs,
Core
Thematic
The GIWA is comprised of a logical sequence of four integrated
Scientific institutions,
Team
Task Teams
private sector, etc
components. The fi rst stage of the GIWA is called Scaling and is a
66 Regional
process by which the geographic area examined in the assessment is
Focal Points
defi ned and all the transboundary waters within that area are identifi ed.
and Teams
Once the geographic scale of the assessment has been defi ned, the
Figure 2
The organisation of the GIWA project.
assessment teams conduct a process known as Scoping in which the
magnitude of environmental and associated socio-economic impacts
universities, research institutes, government agencies, and the private
of Freshwater shortage, Pollution, Habitat and community modifi cation,
sector. In addition, in order to ensure that the assessment produces a
Unsustainable exploitation of fi sh and other living resources, and Global
truly regional perspective, the teams should include representatives
change is assessed in order to identify and prioritise the concerns
from each country that shares the region.
that require the most urgent intervention. The assessment of these
predefi ned concerns incorporates the best available information and
In total, more than 1 000 experts have contributed to the implementation
the knowledge and experience of the multidisciplinary, multi-national
of the GIWA illustrating that the GIWA is a participatory exercise that
assessment teams formed in each region. Once the priority concerns
relies on regional expertise. This participatory approach is essential
have been identifi ed, the root causes of these concerns are identifi ed
because it instils a sense of local ownership of the project, which
during the third component of the GIWA, Causal chain analysis. The root
ensures the credibility of the fi ndings and moreover, it has created a
causes are determined through a sequential process that identifi es, in
global network of experts and institutions that can collaborate and
turn, the most signifi cant immediate causes followed by the economic
exchange experiences and expertise to help mitigate the continued
sectors that are primarily responsible for the immediate causes and
degradation of the world's aquatic resources.
fi nally, the societal root causes. At each stage in the Causal chain
analysis, the most signifi cant contributors are identifi ed through an
analysis of the best available information which is augmented by the
expertise of the assessment team. The fi nal component of the GIWA is
GIWA Regional reports
the development of Policy options that focus on mitigating the impacts
of the root causes identifi ed by the Causal chain analysis.
The GIWA was established in response to growing concern among the
general public regarding the quality of the world's aquatic resources
The results of the GIWA assessment in each region are reported in
and the recognition of governments and the international community
regional reports that are published by UNEP. These reports are designed
concerning the absence of a globally coherent international waters
to provide a brief physical and socio-economic description of the
assessment. However, because a holistic, region-by-region, assessment
most important features of the region against which the results of the
of the condition of the world's transboundary water resources had never
assessment can be cast. The remaining sections of the report present
been undertaken, a methodology guiding the implementation of such
the results of each stage of the assessment in an easily digestible form.
Each regional report is reviewed by at least two independent external
UNEP Water Policy and Strategy
reviewers in order to ensure the scientifi c validity and applicability of
The primary goals of the UNEP water policy and strategy are:
each report. The 66 regional assessments of the GIWA will serve UNEP
(a) Achieving greater global understanding of freshwater, coastal and marine environments by
as an essential complement to the UNEP Water Policy and Strategy and
conducting environmental assessments in priority areas;
(b) Raising awareness of the importance and consequences of unsustainable water use;
UNEP's activities in the hydrosphere.
(c) Supporting the efforts of Governments in the preparation and implementation of integrated
management of freshwater systems and their related coastal and marine environments;
(d) Providing support for the preparation of integrated management plans and programmes for
aquatic environmental hot spots, based on the assessment results;
Global International Waters Assessment
(e) Promoting the application by stakeholders of precautionary, preventive and anticipatory
approaches.
GLOBAL INTERNATIONAL WATERS ASSESSMENT
v
References:
AMAP (1998). Assessment Report: Arctic Pollution Issues. Arctic
Monitoring and Assessment Programme (AMAP), Oslo, Norway.
Barannik, V., Borysova, O. and Stolberg, F. (2004). The Caspian Sea Region:
Environmental Change. Ambio, 33:45-51.
Brinson, M.M. and Malvárez, A.I. (2002). Temperate freshwater wetlands:
types, status, and threats. Environmental Conservation, 29:115-133.
Daoji, L. and Daler, D. (2004). Ocean Pollution from Land-based Sources:
East China Sea, China. Ambio, 33:98-106.
FAO (2001). Reykjavik conference on responsible fi sheries in the marine
ecosystem. Iceland, 1-4 October 2001.
IOC (2002). IOC-IUCN-NOAA Consultative Meeting on Large Marine
Ecosystems (LMEs). Fourth Session, 8-9 January 2002, Paris,
France.
IPCC (2001). Climate Change 2001: The Scientifi c Basis. Contribution
of Working Group I to the Third Assessment Report of the
Intergovernmental Panel on Climate Change. In: Houghton,
J.T., Ding, Y., Griggs, D.J., Noguer, M., van der Linden, P.J., Dai, X.,
Maskell, K. and Johnson, C.A. (eds). Cambridge University Press,
Cambridge, United Kingdom and New York, NY, USA.
Kennish, M.J. (2002). Environmental threats and environmental future of
estuaries. Environmental Conservation, 29:78-107.
Myers, R.A. and Worm, B. (2003). Rapid worldwide depletion of predatory
fi sh communities. Nature, 423:280-283.
Primavera, J.H. (1997) Socio-economic impacts of shrimp culture.
Aquaculture Research, 28:815-827.
Sherman, K. (1994). Sustainability, biomass yields, and health of coastal
ecosystems: an ecological perspective. Marine Ecology Progress
Series, 112:277-301.
United Nations conference on the human environment (1972). Report
available on-line at http://www.unep.org
United Nations Millennium Declaration (2000). The Millennium
Assembly of the United Nations, New York.
WHO-UNICEF (2002). Global Water Supply and Sanitation Assessment:
2000 Report.
WSSD (2002). World Summit on Sustainable Development.
Johannesburg Summit 2002. Key Outcomes of the Summit,
UN Department of Public Information, New York.
v I
REGIONAL ASSESSMENTS
The GIWA methodology
The specifi c objectives of the GIWA were to conduct a holistic and globally
The assessment integrates environmental and socio-economic data
comparable assessment of the world's transboundary aquatic resources
from each country in the region to determine the severity of the
that incorporated both environmental and socio-economic factors
impacts of each of the fi ve concerns and their constituent issues on
and recognised the inextricable links between freshwater and marine
the entire region. The integration of this information was facilitated by
environments, in order to enable the GEF to focus their resources and to
implementing the assessment during two participatory workshops
provide guidance and advice to governments and decision makers. The
that typically involved 10 to 15 environmental and socio-economic
coalition of all these elements into a single coherent methodology that
experts from each country in the region. During these workshops, the
produces an assessment that achieves each of these objectives had not
regional teams performed preliminary analyses based on the collective
previously been done and posed a signifi cant challenge.
knowledge and experience of these local experts. The results of these
analyses were substantiated with the best available information to be
The integration of each of these elements into the GIWA methodology
presented in a regional report.
was achieved through an iterative process guided by a specially
Table 1 Pre-defi ned GIWA concerns and their constituent issues
convened Methods task team that was comprised of a number of
addressed within the assessment.
international assessment and water experts. Before the fi nal version
of the methodology was adopted, preliminary versions underwent
Environmental issues
Major concerns
an extensive external peer review and were subjected to preliminary
1. Modification
of
stream
flow
testing in selected regions. Advice obtained from the Methods task
2. Pollution of existing supplies
I Freshwater shortage
3. Changes in the water table
team and other international experts and the lessons learnt from
preliminary testing were incorporated into the fi nal version that was
4. Microbiological
5. Eutrophication
used to conduct each of the GIWA regional assessments.
6. Chemical
7. Suspended
solids
II Pollution
8. Solid
wastes
Considering the enormous diff erences between regions in terms of the
9. Thermal
10. Radionuclide
quality, quantity and availability of data, socio-economic setting and
11. Spills
environmental conditions, the achievement of global comparability
12. Loss of ecosystems
required an innovative approach. This was facilitated by focusing
III Habitat and community
13. Modification of ecosystems or ecotones, including community
modification
structure and/or species composition
the assessment on the impacts of fi ve pre-defi ned concerns namely;
Freshwater shortage, Pollution, Habitat and community modifi cation,
14. Overexploitation
15. Excessive by-catch and discards
IV Unsustainable
Unsustainable exploitation of fi sh and other living resources and Global
16. Destructive fishing practices
exploitation of fish and
change, in transboundary waters. Considering the diverse range of
17. Decreased viability of stock through pollution and disease
other living resources
18. Impact on biological and genetic diversity
elements encompassed by each concern, assessing the magnitude of
19. Changes in hydrological cycle
the impacts caused by these concerns was facilitated by evaluating the
20. Sea level change
V Global change
impacts of 22 specifi c issues that were grouped within these concerns
21. Increased uv-b radiation as a result of ozone depletion
22. Changes in ocean CO2 source/sink function
(see Table 1).
THE GIWA METHODOLOGY
vii

political boundaries but were instead, generally defi ned by a large but
T
ransboundar
The GIWA approach
discrete drainage basin that also included the coastal marine waters into
which the basin discharges. In many cases, the marine areas examined
1
Scaling
st
W
o
D
e
during the assessment coincided with the Large Marine Ecosystems
rkshop
tailed
y
D
(LMEs) defi ned by the US National Atmospheric and Oceanographic
iagnostic
A
s
Scoping
sessment
Administration (NOAA). As a consequence, scaling should be a
relatively straight-forward task that involves the inspection of the
Analysis
boundaries that were proposed for the region during the preparatory
Causal Chain
2 nd
Analysis
phase of GIWA to ensure that they are appropriate and that there are
W
orkshop
no important overlaps or gaps with neighbouring regions. When the
Policy Option
proposed boundaries were found to be inadequate, the boundaries of
Analysis
the region were revised according to the recommendations of experts
from both within the region and from adjacent regions so as to ensure
that any changes did not result in the exclusion of areas from the GIWA.
Once the regional boundary was defi ned, regional teams identifi ed all
SAP
the transboundary elements of the aquatic environment within the
SAP
region and determined if these elements could be assessed as a single
Figure 1
Illustration of the relationship between the GIWA
coherent aquatic system or if there were two or more independent
approach and other projects implemented within the
systems that should be assessed separately.
GEF International Waters (IW) portfolio.
The GIWA is a logical contiguous process that defi nes the geographic
Scoping Assessing the GIWA concerns
region to be assessed, identifi es and prioritises particularly problems
Scoping is an assessment of the severity of environmental and socio-
based on the magnitude of their impacts on the environment and
economic impacts caused by each of the fi ve pre-defi ned GIWA concerns
human societies in the region, determines the root causes of those
and their constituent issues (Table 1). It is not designed to provide an
problems and, fi nally, assesses various policy options that addresses
exhaustive review of water-related problems that exist within each region,
those root causes in order to reverse negative trends in the condition
but rather it is a mechanism to identify the most urgent problems in the
of the aquatic environment. These four steps, referred to as Scaling,
region and prioritise those for remedial actions. The priorities determined
Scoping, Causal chain analysis and Policy options analysis, are
by Scoping are therefore one of the main outputs of the GIWA project.
summarised below and are described in their entirety in two volumes:
GIWA Methodology Stage 1: Scaling and Scoping; and GIWA Methodology:
Focusing the assessment on pre-defi ned concerns and issues ensured
Detailed Assessment, Causal Chain Analysis and Policy Options Analysis.
the comparability of the results between diff erent regions. In addition, to
Generally, the components of the GIWA methodology are aligned
ensure the long-term applicability of the options that are developed to
with the framework adopted by the GEF for Transboundary Diagnostic
mitigate these problems, Scoping not only assesses the current impacts
Analyses (TDAs) and Strategic Action Programmes (SAPs) (Figure 1) and
of these concerns and issues but also the probable future impacts
assume a broad spectrum of transboundary infl uences in addition to
according to the "most likely scenario" which considered demographic,
those associated with the physical movement of water across national
economic, technological and other relevant changes that will potentially
borders.
infl uence the aquatic environment within the region by 2020.
Scaling Defining the geographic extent
The magnitude of the impacts caused by each issue on the
of the region
environment and socio-economic indicators was assessed over the
Scaling is the fi rst stage of the assessment and is the process by which
entire region using the best available information from a wide range of
the geographic scale of the assessment is defi ned. In order to facilitate
sources and the knowledge and experience of the each of the experts
the implementation of the GIWA, the globe was divided during the
comprising the regional team. In order to enhance the comparability
design phase of the project into 66 contiguous regions. Considering the
of the assessment between diff erent regions and remove biases
transboundary nature of many aquatic resources and the transboundary
in the assessment caused by diff erent perceptions of and ways to
focus of the GIWA, the boundaries of the regions did not comply with
communicate the severity of impacts caused by particular issues, the
viii
REGIONAL ASSESSMENTS
results were distilled and reported as standardised scores according to
Table 2
Example of environmental impact assessment of
Freshwater shortage.
the following four point scale:
Weight
0 = no known impact
Environmental
Environmental issues
Score
Weight %
averaged
concerns
1 = slight impact
score
2 = moderate impact
1. Modification of stream flow
1
20
Freshwater shortage
1.50
3 = severe impact
2. Pollution of existing supplies
2
50
The attributes of each score for each issue were described by a detailed
3. Changes in the water table
1
30
set of pre-defi ned criteria that were used to guide experts in reporting
Table 3
Example of Health impacts assessment linked to one of
the results of the assessment. For example, the criterion for assigning
the GIWA concerns.
a score of 3 to the issue Loss of ecosystems or ecotones is: "Permanent
Criteria for Health impacts
Raw score
Score
Weight %
destruction of at least one habitat is occurring such as to have reduced their
Very small
Very large
surface area by >30% during the last 2-3 decades". The full list of criteria is
Number of people affected
2
50
0 1 2 3
presented at the end of the chapter, Table 5a-e. Although the scoring
Minimum
Severe
Degree of severity
2
30
0 1 2 3
inevitably includes an arbitrary component, the use of predefi ned
Occasion/Short
Continuous
Frequency/Duration
2
20
0 1 2 3
criteria facilitates comparison of impacts on a global scale and also
Weight average score for Health impacts
2
encouraged consensus of opinion among experts.
The trade-off associated with assessing the impacts of each concern
After all 22 issues and associated socio-economic impacts have
and their constituent issues at the scale of the entire region is that spatial
been scored, weighted and averaged, the magnitude of likely future
resolution was sometimes low. Although the assessment provides a
changes in the environmental and socio-economic impacts of each
score indicating the severity of impacts of a particular issue or concern
of the fi ve concerns on the entire region is assessed according to the
on the entire region, it does not mean that the entire region suff ers
most likely scenario which describes the demographic, economic,
the impacts of that problem. For example, eutrophication could be
technological and other relevant changes that might infl uence the
identifi ed as a severe problem in a region, but this does not imply that all
aquatic environment within the region by 2020.
waters in the region suff er from severe eutrophication. It simply means
that when the degree of eutrophication, the size of the area aff ected,
In order to prioritise among GIWA concerns within the region and
the socio-economic impacts and the number of people aff ected is
identify those that will be subjected to causal chain and policy options
considered, the magnitude of the overall impacts meets the criteria
analysis in the subsequent stages of the GIWA, the present and future
defi ning a severe problem and that a regional action should be initiated
scores of the environmental and socio-economic impacts of each
in order to mitigate the impacts of the problem.
concern are tabulated and an overall score calculated. In the example
presented in Table 4, the scoping assessment indicated that concern III,
When each issue has been scored, it was weighted according to the relative
Habitat and community modifi cation, was the priority concern in this
contribution it made to the overall environmental impacts of the concern
region. The outcome of this mathematic process was reconciled against
and a weighted average score for each of the fi ve concerns was calculated
the knowledge of experts and the best available information in order
(Table 2). Of course, if each issue was deemed to make equal contributions,
to ensure the validity of the conclusion.
then the score describing the overall impacts of the concern was simply the
arithmetic mean of the scores allocated to each issue within the concern.
In some cases however, this process and the subsequent participatory
In addition, the socio-economic impacts of each of the fi ve major
discussion did not yield consensus among the regional experts
concerns were assessed for the entire region. The socio-economic
regarding the ranking of priorities. As a consequence, further analysis
impacts were grouped into three categories; Economic impacts,
was required. In such cases, expert teams continued by assessing the
Health impacts and Other social and community impacts (Table 3). For
relative importance of present and potential future impacts and assign
each category, an evaluation of the size, degree and frequency of the
weights to each. Afterwards, the teams assign weights indicating the
impact was performed and, once completed, a weighted average score
relative contribution made by environmental and socio-economic
describing the overall socio-economic impacts of each concern was
factors to the overall impacts of the concern. The weighted average
calculated in the same manner as the overall environmental score.
score for each concern is then recalculated taking into account
THE GIWA METHODOLOGY
ix
Table 4
Example of comparative environmental and socio-economic impacts of each major concern, presently and likely in year 2020.
Types of impacts
Environmental score
Economic score
Human health score
Social and community score
Concern
Overall score
Present (a)
Future (b)
Present (c)
Future (d)
Present (e)
Future (f)
Present (g)
Future (h)
Freshwater shortage
1.3
2.3
2.7
2.8
2.6
3.0
1.8
2.2
2.3
Pollution
1.5
2.0
2.0
2.3
1.8
2.3
2.0
2.3
2.0
Habitat and community
2.0
3.0
2.4
3.0
2.4
2.8
2.3
2.7
2.6
modification
Unsustainable exploitation of fish
1.8
2.2
2.0
2.1
2.0
2.1
2.4
2.5
2.1
and other living resources
Global change
0.8
1.0
1.5
1.7
1.5
1.5
1.0
1.0
1.2
the relative contributions of both present and future impacts and
should be regarded as a framework to guide the analysis, rather than
environmental and socio-economic factors. The outcome of these
as a set of detailed instructions. Secondly, in an ideal setting, a causal
additional analyses was subjected to further discussion to identify
chain would be produced by a multidisciplinary group of specialists
overall priorities for the region.
that would statistically examine each successive cause and study its
links to the problem and to other causes. However, this approach (even
Finally, the assessment recognises that each of the fi ve GIWA concerns
if feasible) would use far more resources and time than those available
are not discrete but often interact. For example, pollution can destroy
to GIWA1. For this reason, it has been necessary to develop a relatively
aquatic habitats that are essential for fi sh reproduction which, in turn,
simple and practical analytical model for gathering information to
can cause declines in fi sh stocks and subsequent overexploitation. Once
assemble meaningful causal chains.
teams have ranked each of the concerns and determined the priorities
for the region, the links between the concerns are highlighted in order
Conceptual model
to identify places where strategic interventions could be applied to
A causal chain is a series of statements that link the causes of a problem
yield the greatest benefi ts for the environment and human societies
with its eff ects. Recognising the great diversity of local settings and the
in the region.
resulting diffi
culty in developing broadly applicable policy strategies,
the GIWA CCA focuses on a particular system and then only on those
Causal chain analysis
issues that were prioritised during the scoping assessment. The
Causal Chain Analysis (CCA) traces the cause-eff ect pathways from the
starting point of a particular causal chain is one of the issues selected
socio-economic and environmental impacts back to their root causes.
during the Scaling and Scoping stages and its related environmental
The GIWA CCA aims to identify the most important causes of each
and socio-economic impacts. The next element in the GIWA chain is
concern prioritised during the scoping assessment in order to direct
the immediate cause; defi ned as the physical, biological or chemical
policy measures at the most appropriate target in order to prevent
variable that produces the GIWA issue. For example, for the issue of
further degradation of the regional aquatic environment.
eutrophication the immediate causes may be, inter alia:
Enhanced
nutrient
inputs;
Root causes are not always easy to identify because they are often
Increased
recycling/mobilisation;
spatially or temporally separated from the actual problems they
Trapping of nutrients (e.g. in river impoundments);
cause. The GIWA CCA was developed to help identify and understand
Run-off and stormwaters
the root causes of environmental and socio-economic problems
in international waters and is conducted by identifying the human
Once the relevant immediate cause(s) for the particular system has
activities that cause the problem and then the factors that determine
(have) been identifi ed, the sectors of human activity that contribute
the ways in which these activities are undertaken. However, because
most signifi cantly to the immediate cause have to be determined.
there is no universal theory describing how root causes interact to
Assuming that the most important immediate cause in our example
create natural resource management problems and due to the great
had been increased nutrient concentrations, then it is logical that the
variation of local circumstances under which the methodology will
most likely sources of those nutrients would be the agricultural, urban
be applied, the GIWA CCA is not a rigidly structured assessment but
or industrial sectors. After identifying the sectors that are primarily
1 This does not mean that the methodology ignores statistical or quantitative studies; as has already been pointed out, the available evidence that justifies the assumption of causal links should
be provided in the assessment.
x
REGIONAL ASSESSMENTS
responsible for the immediate causes, the root causes acting on those
The policy options recommended by the GIWA are only contributions
sectors must be determined. For example, if agriculture was found to
to the larger policy process and, as such, the GIWA methodology
be primarily responsible for the increased nutrient concentrations, the
developed to test the performance of various options under the
root causes could potentially be:
diff erent circumstances has been kept simple and broadly applicable.
Economic (e.g. subsidies to fertilisers and agricultural products);
Legal (e.g. inadequate regulation);
Global International Waters Assessment
Failures in governance (e.g. poor enforcement); or
Technology or knowledge related (e.g. lack of aff ordable substitutes
for fertilisers or lack of knowledge as to their application).
Once the most relevant root causes have been identifi ed, an
explanation, which includes available data and information, of how
they are responsible for the primary environmental and socio-economic
problems in the region should be provided.
Policy option analysis
Despite considerable eff ort of many Governments and other
organisations to address transboundary water problems, the evidence
indicates that there is still much to be done in this endeavour. An
important characteristic of GIWA's Policy Option Analysis (POA) is that
its recommendations are fi rmly based on a better understanding of
the root causes of the problems. Freshwater scarcity, water pollution,
overexploitation of living resources and habitat destruction are very
complex phenomena. Policy options that are grounded on a better
understanding of these phenomena will contribute to create more
eff ective societal responses to the extremely complex water related
transboundary problems. The core of POA in the assessment consists
of two tasks:
Construct policy options
Policy options are simply diff erent courses of action, which are not
always mutually exclusive, to solve or mitigate environmental and
socio-economic problems in the region. Although a multitude of
diff erent policy options could be constructed to address each root
cause identifi ed in the CCA, only those few policy options that have
the greatest likelihood of success were analysed in the GIWA.
Select and apply the criteria on which the policy options will be
evaluated
Although there are many criteria that could be used to evaluate any
policy option, GIWA focuses on:
Eff ectiveness (certainty of result)
Effi
ciency (maximisation of net benefi ts)
Equity (fairness of distributional impacts)
Practical criteria (political acceptability, implementation feasibility).
THE GIWA METHODOLOGY
xi
Table 5a: Scoring criteria for environmental impacts of Freshwater shortage
Issue
Score 0 = no known impact
Score 1 = slight impact
Score 2 = moderate impact
Score 3 = severe impact
Issue 1: Modification
No evidence of modification of stream
There is a measurably changing trend in
Significant downward or upward trend
Annual discharge of a river altered by more
of stream flow
flow.
annual river discharge at gauging stations
(more than 20% of the long term mean) in
than 50% of long term mean; or
"An increase or decrease
in a major river or tributary (basin >
annual discharges in a major river or tributary Loss of >50% of riparian or deltaic
in the discharge of
40 000 km2); or
draining a basin of >250 000 km2; or
wetlands over a period of not less than
streams and rivers
There is a measurable decrease in the area
Loss of >20% of flood plain or deltaic
40 years (through causes other than
as a result of human
of wetlands (other than as a consequence
wetlands through causes other than
conversion or artificial embankment); or
interventions on a local/
of conversion or embankment
conversion or artificial embankments; or
Significant increased siltation or erosion
regional scale (see Issue
construction); or
Significant loss of riparian vegetation (e.g.
due to changing in flow regime (other than
19 for flow alterations
There is a measurable change in the
trees, flood plain vegetation); or
normal fluctuations in flood plain rivers);
resulting from global
interannual mean salinity of estuaries or
Significant saline intrusion into previously
or
change) over the last 3-4
coastal lagoons and/or change in the mean
freshwater rivers or lagoons.
Loss of one or more anadromous or
decades."
position of estuarine salt wedge or mixing
catadromous fish species for reasons
zone; or
other than physical barriers to migration,
Change in the occurrence of exceptional
pollution or overfishing.
discharges (e.g. due to upstream
damming.
Issue 2: Pollution of
No evidence of pollution of surface and
Any monitored water in the region does
Water supplies does not meet WHO or
River draining more than 10% of the basin
existing supplies
ground waters.
not meet WHO or national drinking water
national drinking water standards in more
have suffered polysaprobic conditions, no
"Pollution of surface
criteria, other than for natural reasons; or
than 30% of the region; or
longer support fish, or have suffered severe
and ground fresh waters
There have been reports of one or more
There are one or more reports of fish kills
oxygen depletion
supplies as a result of
fish kills in the system due to pollution
due to pollution in any river draining a
Severe pollution of other sources of
point or diffuse sources"
within the past five years.
basin of >250 000 km2 .
freshwater (e.g. groundwater)
Issue 3: Changes in the No evidence that abstraction of water from Several wells have been deepened because Clear evidence of declining base flow in
Aquifers are suffering salinisation over
water table
aquifers exceeds natural replenishment.
of excessive aquifer draw-down; or
rivers in semi-arid areas; or
regional scale; or
"Changes in aquifers
Several springs have dried up; or
Loss of plant species in the past decade,
Perennial springs have dried up over
as a direct or indirect
Several wells show some salinisation.
that depend on the presence of ground
regionally significant areas; or
consequence of human
water; or
Some aquifers have become exhausted
activity"
Wells have been deepened over areas of
hundreds of km2;or
Salinisation over significant areas of the
region.
Table 5b: Scoring criteria for environmental impacts of Pollution
Issue
Score 0 = no known impact
Score 1 = slight impact
Score 2 = moderate impact
Score 3 = severe impact
Issue 4:
Normal incidence of bacterial related
There is minor increase in incidence of
Public health authorities aware of marked
There are large closure areas or very
Microbiological
gastroenteric disorders in fisheries product
bacterial related gastroenteric disorders
increase in the incidence of bacterial
restrictive advisories affecting the
pollution
consumers and no fisheries closures or
in fisheries product consumers but no
related gastroenteric disorders in fisheries
marketability of fisheries products; or
"The adverse effects of
advisories.
fisheries closures or advisories.
product consumers; or
There exists widespread public or tourist
microbial constituents of
There are limited area closures or
awareness of hazards resulting in
human sewage released
advisories reducing the exploitation or
major reductions in the exploitation or
to water bodies."
marketability of fisheries products.
marketability of fisheries products.
Issue 5:
No visible effects on the abundance and
Increased abundance of epiphytic algae; or
Increased filamentous algal production
High frequency (>1 event per year), or
Eutrophication
distributions of natural living resource
A statistically significant trend in
resulting in algal mats; or
intensity, or large areas of periodic hypoxic
"Artificially enhanced
distributions in the area; and
decreased water transparency associated
Medium frequency (up to once per year)
conditions, or high frequencies of fish and
primary productivity in
No increased frequency of hypoxia1 or
with algal production as compared with
of large-scale hypoxia and/or fish and
zoobenthos mortality events or harmful
receiving water basins
fish mortality events or harmful algal
long-term (>20 year) data sets; or
zoobenthos mortality events and/or
algal blooms; or
related to the increased
blooms associated with enhanced primary
Measurable shallowing of the depth range
harmful algal blooms.
Significant changes in the littoral
availability or supply
production; and
of macrophytes.
community; or
of nutrients, including
No evidence of periodically reduced
Presence of hydrogen sulphide in
cultural eutrophication
dissolved oxygen or fish and zoobenthos
historically well oxygenated areas.
in lakes."
mortality; and
No evident abnormality in the frequency of
algal blooms.
xii
REGIONAL ASSESSMENTS
Issue 6: Chemical
No known or historical levels of chemical
Some chemical contaminants are
Some chemical contaminants are above
Chemical contaminants are above
pollution
contaminants except background levels of
detectable but below threshold limits
threshold limits defined for the country or
threshold limits defined for the country or
"The adverse effects of
naturally occurring substances; and
defined for the country or region; or
region; or
region; and
chemical contaminants
No fisheries closures or advisories due to
Restricted area advisories regarding
Large area advisories by public health
Public health and public awareness of
released to standing or
chemical pollution; and
chemical contamination of fisheries
authorities concerning fisheries product
fisheries contamination problems with
marine water bodies
No incidence of fisheries product tainting;
products.
contamination but without associated
associated reductions in the marketability
as a result of human
and
catch restrictions or closures; or
of such products either through the
activities. Chemical
No unusual fish mortality events.
If there is no available data use the following
High mortalities of aquatic species near
imposition of limited advisories or by area
contaminants are
criteria:
outfalls.
closures of fisheries; or
here defined as
If there is no available data use the following
Some use of pesticides in small areas; or
Large-scale mortalities of aquatic species.
compounds that are
criteria:
Presence of small sources of dioxins or
If there is no available data use the following
toxic or persistent or
No use of pesticides; and
furans (e.g., small incineration plants or
criteria:
If there is no available data use the following
bioaccumulating."
No sources of dioxins and furans; and
bleached kraft/pulp mills using chlorine);
Large-scale use of pesticides in agriculture
criteria:
No regional use of PCBs; and
or
and forestry; or
Indications of health effects resulting
No bleached kraft pulp mills using chlorine Some previous and existing use of PCBs
Presence of major sources of dioxins or
from use of pesticides; or
bleaching; and
and limited amounts of PCB-containing
furans such as large municipal or industrial Known emissions of dioxins or furans from
No use or sources of other contaminants.
wastes but not in amounts invoking local
incinerators or large bleached kraft pulp
incinerators or chlorine bleaching of pulp;
concerns; or
mills; or
or
Presence of other contaminants.
Considerable quantities of waste PCBs in
Known contamination of the environment
the area with inadequate regulation or has
or foodstuffs by PCBs; or
invoked some public concerns; or
Known contamination of the environment
Presence of considerable quantities of
or foodstuffs by other contaminants.
other contaminants.
Issue 7: Suspended
No visible reduction in water transparency; Evidently increased or reduced turbidity
Markedly increased or reduced turbidity
Major changes in turbidity over wide or
solids
and
in streams and/or receiving riverine and
in small areas of streams and/or receiving
ecologically significant areas resulting
"The adverse effects of
No evidence of turbidity plumes or
marine environments but without major
riverine and marine environments; or
in markedly changed biodiversity or
modified rates of release
increased siltation; and
changes in associated sedimentation or
Extensive evidence of changes in
mortality in benthic species due to
of suspended particulate No evidence of progressive riverbank,
erosion rates, mortality or diversity of flora
sedimentation or erosion rates; or
excessive sedimentation with or without
matter to water bodies
beach, other coastal or deltaic erosion.
and fauna; or
Changes in benthic or pelagic biodiversity
concomitant changes in the nature of
resulting from human
Some evidence of changes in benthic or
in areas due to sediment blanketing or
deposited sediments (i.e., grain-size
activities"
pelagic biodiversity in some areas due
increased turbidity.
composition/redox); or
to sediment blanketing or increased
Major change in pelagic biodiversity or
turbidity.
mortality due to excessive turbidity.
Issue 8: Solid wastes
No noticeable interference with trawling
Some evidence of marine-derived litter on
Widespread litter on beaches giving rise to
Incidence of litter on beaches sufficient
"Adverse effects
activities; and
beaches; or
public concerns regarding the recreational
to deter the public from recreational
associated with the
No noticeable interference with the
Occasional recovery of solid wastes
use of beaches; or
activities; or
introduction of solid
recreational use of beaches due to litter;
through trawling activities; but
High frequencies of benthic litter recovery
Trawling activities untenable because of
waste materials into
and
Without noticeable interference with
and interference with trawling activities;
benthic litter and gear entanglement; or
water bodies or their
No reported entanglement of aquatic
trawling and recreational activities in
or
Widespread entanglement and/or
environs."
organisms with debris.
coastal areas.
Frequent reports of entanglement/
suffocation of aquatic species by litter.
suffocation of species by litter.
Issue 9: Thermal
No thermal discharges or evidence of
Presence of thermal discharges but
Presence of thermal discharges with large
Presence of thermal discharges with large
"The adverse effects
thermal effluent effects.
without noticeable effects beyond
mixing zones having reduced productivity
mixing zones with associated mortalities,
of the release of
the mixing zone and no significant
or altered biodiversity; or
substantially reduced productivity or
aqueous effluents at
interference with migration of species.
Evidence of reduced migration of species
noticeable changes in biodiversity; or
temperatures exceeding
due to thermal plume.
Marked reduction in the migration of
ambient temperature
species due to thermal plumes.
in the receiving water
body."
Issue 10: Radionuclide
No radionuclide discharges or nuclear
Minor releases or fallout of radionuclides
Minor releases or fallout of radionuclides
Substantial releases or fallout of
"The adverse effects of
activities in the region.
but with well regulated or well-managed
under poorly regulated conditions that do
radionuclides resulting in excessive
the release of radioactive
conditions complying with the Basic Safety
not provide an adequate basis for public
exposures to humans or animals in relation
contaminants and
Standards.
health assurance or the protection of
to those recommended under the Basic
wastes into the aquatic
aquatic organisms but without situations
Safety Standards; or
environment from
or levels likely to warrant large scale
Some indication of situations or exposures
human activities."
intervention by a national or international
warranting intervention by a national or
authority.
international authority.
Issue 11: Spills
No evidence of present or previous spills of
Some evidence of minor spills of hazardous Evidence of widespread contamination
Widespread contamination by hazardous
"The adverse effects
hazardous material; or
materials in small areas with insignificant
by hazardous or aesthetically displeasing
or aesthetically displeasing materials
of accidental episodic
No evidence of increased aquatic or avian
small-scale adverse effects one aquatic or
materials assumed to be from spillage
from frequent spills resulting in major
releases of contaminants
species mortality due to spills.
avian species.
(e.g. oil slicks) but with limited evidence of
interference with aquatic resource
and materials to the
widespread adverse effects on resources or
exploitation or coastal recreational
aquatic environment
amenities; or
amenities; or
as a result of human
Some evidence of aquatic or avian species
Significant mortality of aquatic or avian
activities."
mortality through increased presence of
species as evidenced by large numbers of
contaminated or poisoned carcasses on
contaminated carcasses on beaches.
beaches.
THE GIWA METHODOLOGY
xiii
Table 5c: Scoring criteria for environmental impacts of Habitat and community modification
Issue
Score 0 = no known impact
Score 1 = slight impact
Score 2 = moderate impact
Score 3 = severe impact
Issue 12: Loss of ecosystems or
There is no evidence of loss of
There are indications of fragmentation Permanent destruction of at least one
Permanent destruction of at least one
ecotones
ecosystems or habitats.
of at least one of the habitats.
habitat is occurring such as to have
habitat is occurring such as to have
"The complete destruction of aquatic
reduced their surface area by up to 30
reduced their surface area by >30%
habitats. For the purpose of GIWA
% during the last 2-3 decades.
during the last 2-3 decades.
methodology, recent loss will be
measured as a loss of pre-defined
habitats over the last 2-3 decades."
Issue 13: Modification of
No evidence of change in species
Evidence of change in species
Evidence of change in species
Evidence of change in species
ecosystems or ecotones, including
complement due to species extinction
complement due to species extinction
complement due to species extinction
complement due to species extinction
community structure and/or species
or introduction; and
or introduction
or introduction; and
or introduction; and
composition
No changing in ecosystem function
Evidence of change in population
Evidence of change in population
"Modification of pre-defined habitats
and services.
structure or change in functional group
structure or change in functional group
in terms of extinction of native species,
composition or structure
composition or structure; and
occurrence of introduced species and
Evidence of change in ecosystem
changing in ecosystem function and
services2.
services over the last 2-3 decades."
2 Constanza, R. et al. (1997). The value of the world ecosystem services and natural capital, Nature 387:253-260.
Table 5d: Scoring criteria for environmental impacts of Unsustainable exploitation of fish and other
living resources
Issue
Score 0 = no known impact
Score 1 = slight impact
Score 2 = moderate impact
Score 3 = severe impact
Issue 14: Overexploitation
No harvesting exists catching fish
Commercial harvesting exists but there One stock is exploited beyond MSY
More than one stock is exploited
"The capture of fish, shellfish or marine
(with commercial gear for sale or
is no evidence of over-exploitation.
(maximum sustainable yield) or is
beyond MSY or is outside safe
invertebrates at a level that exceeds the
subsistence).
outside safe biological limits.
biological limits.
maximum sustainable yield of the stock."
Issue 15: Excessive by-catch and
Current harvesting practices show no
Up to 30% of the fisheries yield (by
30-60% of the fisheries yield consists
Over 60% of the fisheries yield is
discards
evidence of excessive by-catch and/or
weight) consists of by-catch and/or
of by-catch and/or discards.
by-catch and/or discards; or
"By-catch refers to the incidental capture
discards.
discards.
Noticeable incidence of capture of
of fish or other animals that are not the
endangered species.
target of the fisheries. Discards refers
to dead fish or other animals that are
returned to the sea."
Issue 16: Destructive fishing
No evidence of habitat destruction due Habitat destruction resulting in
Habitat destruction resulting in
Habitat destruction resulting in
practices
to fisheries practices.
changes in distribution of fish or
moderate reduction of stocks or
complete collapse of a stock or far
"Fishing practices that are deemed to
shellfish stocks; or
moderate changes of the environment;
reaching changes in the environment;
produce significant harm to marine,
Trawling of any one area of the seabed
or
or
lacustrine or coastal habitats and
is occurring less than once per year.
Trawling of any one area of the seabed
Trawling of any one area of the seabed
communities."
is occurring 1-10 times per year; or
is occurring more than 10 times per
Incidental use of explosives or poisons
year; or
for fishing.
Widespread use of explosives or
poisons for fishing.
Issue 17: Decreased viability of
No evidence of increased incidence of
Increased reports of diseases without
Declining populations of one or more
Collapse of stocks as a result of
stocks through contamination and
fish or shellfish diseases.
major impacts on the stock.
species as a result of diseases or
diseases or contamination.
disease
contamination.
"Contamination or diseases of feral (wild)
stocks of fish or invertebrates that are a
direct or indirect consequence of human
action."
Issue 18: Impact on biological and
No evidence of deliberate or accidental Alien species introduced intentionally
Measurable decline in the population
Extinction of native species or local
genetic diversity
introductions of alien species; and
or accidentally without major changes
of native species or local stocks as a
stocks as a result of introductions
"Changes in genetic and species diversity No evidence of deliberate or accidental
in the community structure; or
result of introductions (intentional or
(intentional or accidental); or
of aquatic environments resulting from
introductions of alien stocks; and
Alien stocks introduced intentionally
accidental); or
Major changes (>20%) in the genetic
the introduction of alien or genetically
No evidence of deliberate or accidental
or accidentally without major changes
Some changes in the genetic
composition of stocks (e.g. as a result
modified species as an intentional or
introductions of genetically modified
in the community structure; or
composition of stocks (e.g. as a result
of escapes from aquaculture replacing
unintentional result of human activities
species.
Genetically modified species
of escapes from aquaculture replacing
the wild stock).
including aquaculture and restocking."
introduced intentionally or
the wild stock).
accidentally without major changes in
the community structure.
xiv
REGIONAL ASSESSMENTS
Table 5e: Scoring criteria for environmental impacts of Global change
Issue
Score 0 = no known impact
Score 1 = slight impact
Score 2 = moderate impact
Score 3 = severe impact
Issue 19: Changes in hydrological
No evidence of changes in hydrological Change in hydrological cycles due
Significant trend in changing
Loss of an entire habitat through
cycle and ocean circulation
cycle and ocean/coastal current due to
to global change causing changes
terrestrial or sea ice cover (by
desiccation or submergence as a result
"Changes in the local/regional water
global change.
in the distribution and density of
comparison with a long-term time
of global change; or
balance and changes in ocean and coastal
riparian terrestrial or aquatic plants
series) without major downstream
Change in the tree or lichen lines; or
circulation or current regime over the
without influencing overall levels of
effects on river/ocean circulation or
Major impacts on habitats or
last 2-3 decades arising from the wider
productivity; or
biological diversity; or
biodiversity as the result of increasing
problem of global change including
Some evidence of changes in ocean
Extreme events such as flood and
frequency of extreme events; or
ENSO."
or coastal currents due to global
drought are increasing; or
Changing in ocean or coastal currents
change but without a strong effect on
Aquatic productivity has been altered
or upwelling regimes such that plant
ecosystem diversity or productivity.
as a result of global phenomena such
or animal populations are unable to
as ENSO events.
recover to their historical or stable
levels; or
Significant changes in thermohaline
circulation.
Issue 20: Sea level change
No evidence of sea level change.
Some evidences of sea level change
Changed pattern of coastal erosion due Major loss of coastal land areas due to
"Changes in the last 2-3 decades in the
without major loss of populations of
to sea level rise has became evident; or
sea-level change or sea-level induced
annual/seasonal mean sea level as a
organisms.
Increase in coastal flooding events
erosion; or
result of global change."
partly attributed to sea-level rise
Major loss of coastal or intertidal
or changing prevailing atmospheric
populations due to sea-level change or
forcing such as atmospheric pressure
sea level induced erosion.
or wind field (other than storm
surges).
Issue 21: Increased UV-B radiation as No evidence of increasing effects
Some measurable effects of UV/B
Aquatic community structure is
Measured/assessed effects of UV/B
a result of ozone depletion
of UV/B radiation on marine or
radiation on behavior or appearance of
measurably altered as a consequence
irradiation are leading to massive loss
"Increased UV-B flux as a result polar
freshwater organisms.
some aquatic species without affecting
of UV/B radiation; or
of aquatic communities or a significant
ozone depletion over the last 2-3
the viability of the population.
One or more aquatic populations are
change in biological diversity.
decades."
declining.
Issue 22: Changes in ocean CO
No measurable or assessed changes
Some reasonable suspicions that
Some evidences that the impacts
Evidences that the changes in
2
source/sink function
in CO source/sink function of aquatic
current global change is impacting the
of global change have altered the
source/sink function of the aquatic
2
"Changes in the capacity of aquatic
system.
aquatic system sufficiently to alter its
source/sink function for CO of aquatic
systems in the region are sufficient to
2
systems, ocean as well as freshwater, to
source/sink function for CO .
systems in the region by at least 10%.
cause measurable change in global CO
2
2
generate or absorb atmospheric CO as a
balance.
2
direct or indirect consequence of global
change over the last 2-3 decades."
THE GIWA METHODOLOGY
xv