

(1,1) -1- Cover 45b.indd 2004-08-30, 08:39:23
Global International
Waters Assessment
Indian Ocean Islands
GIWA Regional assessment 45b
Payet, R.A., Soogun, N., Ranaivoson, E., Payet, R.J. and F. Ali Abdallah
Global International
Waters Assessment
Regional assessments
Global International
Waters Assessment
Regional assessment 45b
Indian Ocean Islands
GIWA report production
Series editor: Ulla Li Zweifel
Report editor: David Souter
Editorial assistance: Johanna Egerup and Malin Karlsson
Maps & GIS: Niklas Holmgren
Design & graphics: Joakim Palmqvist
Global International Waters Assessment
Indian Ocean Islands, GIWA Regional assessment 45b
Published by the University of Kalmar on behalf of
United Nations Environment Programme
© 2004 United Nations Environment Programme
ISSN 1651-940X
University of Kalmar
SE-391 82 Kalmar
Sweden
United Nations Environment Programme
PO Box 30552,
Nairobi, Kenya
This publication may be reproduced in whole or in part and
in any form for educational or non-profit purposes without
special permission from the copyright holder, provided
acknowledgement of the source is made. No use of this
publication may be made for resale or for any other commercial
purpose whatsoever without prior permission in writing from the
United Nations Environment Programme.
CITATIONS
When citing this report, please use:
UNEP, 2004. Payet, R.A., Soogun, N., Ranaivoson, E., Payet, R.J. and
Ali Abdallah, F. Indian Ocean Islands, GIWA Regional assessment
45b. University of Kalmar, Kalmar, Sweden.
DISCLAIMER
The views expressed in this publication are those of the authors
and do not necessarily reflect those of UNEP. The designations
employed and the presentations do not imply the expressions
of any opinion whatsoever on the part of UNEP or cooperating
agencies concerning the legal status of any country, territory,
city or areas or its authority, or concerning the delimitation of its
frontiers or boundaries.
This publication has been peer-reviewed and the information
herein is believed to be reliable, but the publisher does not
warrant its completeness or accuracy.
Printed and bound in Kalmar, Sweden, by Sunds Tryck Öland AB.
CONTENTS
Contents
Executive summary
9
Abbreviations and acronyms
11
Regional definition
13
Boundaries of the Indian Ocean Islands region
13
Physical characteristics
14
Socio-economic characteristics
22
Assessment
30
Freshwater shortage
30
Pollution
33
Habitat and community modification
36
Unsustainable exploitation of fish and other living resources
39
Global change
41
Priority concerns
43
Causal chain analysis
50
Introduction
50
Methodology
51
The immediate causes of solid waste
52
Sector activities that generate solid waste
52
Root cause analysis
52
Policy options
58
Problem definition
58
Construction of policy options
59
Identification of the recommended policy option
61
Performance of the chosen alternatives
63
Conclusions and recommendations
68
References
70
Annexes
75
Annex I List of contributing authors and organisations
75
Annex II Detailed scoring tables
76
Annex III List of important water-related programmes and assessments in the region
80
Annex IV List of conventions that affect water use in the region
81
The Global International Waters Assessment
i
The GIWA methodology
vii
CONTENTS
Acknowledgements
The Regional Task Team would like to acknowledge the following:
The Governments of Comoros, Madagascar, Mauritius and the Seychel es for
facilitating access to the information and data used in this assessment;
The peer reviewers of this report, including the GIWA Core team, regional
coordinators and advisors;
The secretariat of the Nairobi Convention Regional Coordinating Office for
their administrative and logical support;
The GEF, University of Kalmar, the GIWA team, UNEP and SIDA for providing the
additional funding and technical support required to undertake this study.
Executive summary
The Indian Ocean Islands region comprises the island states of Comoros,
in the region. The assessment concluded that Pollution was the most
Mauritius, Madagascar and Seychel es which are situated in the Western
significant GIWA concern for the region, fol owed by Global change.
Indian Ocean (WIO). The combined total Exclusive Economic Zone (EEZ)
of the Island States within the region is approximately 4.1 million km2.
Global change is indeed very complex and much more research is
This provides the approximate limits of the region (between latitudes
required before conclusive statements can be made. However, as
5° N and 30° S and extending as far as 70° E). In terms of economic
concluded by IPCC (2001) there is now clear and discernible evidence
development, Mauritius and Seychelles appear to have met the basic
of changes in the climate which are likely to cause serious modifications
conditions for sustainable human development, but considerable work
to the Earth's functioning over the next 50 to 100 years. The report
is required in Madagascar and Comoros.
concludes that those most affected will be the island states, including
those in the Indian Ocean Islands region, and countries that are least
The most salient features of the region in the context of the Global
developed.
International Waters Assessment (GIWA) is the very low proportion of
land to sea, and the smal er size of Comoros, Mauritius and Seychel es
Pol ution in terms of improper disposal of solid wastes and
in relation to Madagascar. However, Madagascar shows the vulnerability
eutrophication as a result of poor treatment facilities, was singled out
of an island state and is also biogeographical y, hydrological y, and
as being the most severe concern in the region. The risk of oil spills
economical y linked to the rest of the region.
in the region is also considered significant, since there is high tanker
traffic from the oil rich countries of the Middle East. Other issues such
The large size of the EEZs in the region means that the GIWA issues are
as overexploitation of fish and habitat modification also received
mostly oceanic which are influenced by activities that happen on land.
attention, implying that those impacts are very much linked to the
The assessment of transboundary issues is therefore done in a special
presence of humans.
context, as the Island States are separated by large expanses of ocean
and do not share any coastal marine environments nor freshwater
The problem of solid waste is indeed far-reaching. Although the
resources. However, long-range transport of pollutants, movement of
majority of solid wastes are generated on land, a huge proportion
human pressure across boundaries and the impacts of global change
ends up in the coastal and ocean environment causing degradation
are all significant issues that need to be considered in an international
of ecosystems and economic impacts. The main impacts of solid
waters and transboundary context.
waste in the region are: (i) pol ution of groundwater, surface water,
and wetlands; (i ) risks for human health; (i i) degradation of coastal
The impact assessment showed that the levels of human impacts on
marine environments (including coral reefs) and tourist attractions
natural systems and resources have increased. This human pressure on
such as beaches; (iv) possible disease outbreaks and the destruction
existing ecosystems and limited resources threatens several endemic
of fisheries; (vi ) accumulation and toxic effects of leachates; and (vi i)
and migratory marine species. Growth in fisheries and tourism are likely
eventual y impact on the economy.
to be the most significant economic forces in the region in the next
20 years. However, impacts of global change, such as coastal erosion
and coral bleaching, seem to be the biggest threat to development
EXECUTIVE SUMMARY
9
The causal chain analysis identified four root causes:
14. Establish an education programme to increase awareness and
Root cause 1: Lack of investment planning and priorities.
action.
Root cause 2: Lack of effective mechanisms, inadequate institutional
structure, laws and capacity.
Major data gaps exist in several areas, including the key economic
Root cause 3: Lack of adequate facilities, services for col ection and
sectors. Several global assessments have not included this very small
management of wastes.
part of the world, for example, there are no census reports for the many
Root cause 4: Lack of education and awareness.
threatened species in the region.
Although some of these root causes may not be considered the
absolute root cause of the problem, they are appropriate targets
for policy interventions. Factors that are more widely recognised as
root causes, such as population growth and increased consumption,
can take years to redress and therefore, are less amenable to policy
interventions.
The policy options analysis resulted in more than 30 possible policy
options. However, when these were evaluated in their regional context
for efficiency, equitability and practicality, only a few could be feasibly
implemented, although in some cases local conditions wil need to
be taken into consideration. Further analysis of these selected policy
options generated a series of recommendations as the key output of
this report. These outputs are:
1. To perform a national survey of products/wastes that will form part
of a refundable deposit system.
2. Reduce taxes on waste separation and treatment technologies.
3. Tax the disposal of solid wastes by industry.
4. Implement tax incentives to improve the quality and encourage
use of recycled products.
5. Subsidies are provided (a) to the municipality to commence a
waste col ection service, and (b) to the private sector to facilitate
investment in waste minimisation/treatment.
6. Establishment of a regulatory framework.
7. Development of emissions standards for landfil s, etc.
8. Improve compliance through stakeholder involvement.
9. Training in legal enforcement.
10. Put in place an efficient solid waste col ection service of the entire
territory.
11. Governments should al ocate a sizeable proportion of their national
budget for solid waste management and use that for counterpart
fund-raising.
12. Citizens should be given a constitutional right to a clean and safe
environment, as wel as a clear definition of existing property rights.
13. Explore opportunities for increasing revenue and employment
from solid wastes.
10
GIWA REGIONAL ASSESSMENT 45B INDIAN OCEAN ISLANDS
Abbreviations and acronyms
ACP
African-Caribbean-Pacific
NGO
Non-Government Organisation
AEO
African Environment Outlook
PAE
Plan d'Action Environnementales
AUE
Associations des usagers de l'eau
PNE
Politique Nationale de L'Environnement
BOD
5-day Biochemical Oxygen Demand
POA
Policy Options Analysis
5
CCA
Causal Chain Analysis
SARS
Severe Acute Respiratory Syndrome
CICE
Comite Interministeriel Consultatif pour L'Environnement
SEC
South Equatorial Current
CNE
Conseil National pour L'Environment
SECC
South Equatorial Counter-Current
COAP
Code of Protected Areas
SGRH
Service de Gestion des Réseaux Hydroagricoles
DGE
Direction General de L'Environnement
SWAC
Solid Waste and Cleaning Agency
DGR
Direction du génie rural
UNDP
United Nations Development Programme
DGTP
Direction de Generale Travaux Publics
UNEP
United Nations Environment Programme
EEZ
Exclusive Economic Zone
WIO
Western Indian Ocean
EIA
Environment Impact Assessments
EPA
Environment Protection Act
EQ
Equatorial Current
FAO
Food and Agriculture Organization
FCPFD
Fish Catch per Fisherman Day
GEF
Global Environment Facility
GELOSE Gestion Locale Securisee
GIWA
Global International Waters Assessment
GST
General Service Tax
ICZM
Integrated Coastal Zone Management
IOTC
The Indian Ocean Tuna Commission
IRA
Acute Respiratory Infections
ITZC
Inter-tropical Convergence Zone
IUCN
World Conservation Union
IWC
International Whaling Commission
MARPOL The International Convention for the Prevention of Pollution
from Ships
MPA
Marine Protected Area
MSY
Maximum Sustainable Yield
NEAC
Seycel es the National Environment Advisory Council
NEC
North Equatorial Current
ABBREVIATIONS AND ACRONYMS
11
List of figures
Figure 1
Boundaries of the Indian Ocean Islands region.. . . . . . . . . . . . . . . . . . . . . . . . . . . . . . . . . . . . . . . . . . . . . . . . . . . . . . . . . . . . . . . . . . . . . . . . . . . . . . . . . . . . . . . . . . . . . . . . . . . . . . . . . . . . . . . . . 14
Figure 2
Areas within the Indian Ocean influenced by monsoons . . . . . . . . . . . . . . . . . . . . . . . . . . . . . . . . . . . . . . . . . . . . . . . . . . . . . . . . . . . . . . . . . . . . . . . . . . . . . . . . . . . . . . . . . . . . . . . . . . . . . . . . 15
Figure 3
Characteristics of the monsoon in the Indian Ocean . . . . . . . . . . . . . . . . . . . . . . . . . . . . . . . . . . . . . . . . . . . . . . . . . . . . . . . . . . . . . . . . . . . . . . . . . . . . . . . . . . . . . . . . . . . . . . . . . . . . . . . . . . . . 15
Figure 4
Currents, upwelling, convergence and divergence areas in the Indian Ocean during the Northeast and Southwest monsoon seasons. . . . . . . . . . . . . . . . . . . . . . . . . . 16
Figure 5
Monthly discharge for selected rivers in Madagascar and Mauritius. . . . . . . . . . . . . . . . . . . . . . . . . . . . . . . . . . . . . . . . . . . . . . . . . . . . . . . . . . . . . . . . . . . . . . . . . . . . . . . . . . . . . . . . . . . 18
Figure 6
Trends in female Hawksbills nesting per season at Cousin Island, Seychelles.. . . . . . . . . . . . . . . . . . . . . . . . . . . . . . . . . . . . . . . . . . . . . . . . . . . . . . . . . . . . . . . . . . . . . . . . . . . . . . . . . . . 20
Figure 7
Indian Ocean whale sanctuary.. . . . . . . . . . . . . . . . . . . . . . . . . . . . . . . . . . . . . . . . . . . . . . . . . . . . . . . . . . . . . . . . . . . . . . . . . . . . . . . . . . . . . . . . . . . . . . . . . . . . . . . . . . . . . . . . . . . . . . . . . . . . . . . . . 21
Figure 8
Trend in the relative rate of increase of landings in all marine waters. . . . . . . . . . . . . . . . . . . . . . . . . . . . . . . . . . . . . . . . . . . . . . . . . . . . . . . . . . . . . . . . . . . . . . . . . . . . . . . . . . . . . . . . . . 23
Figure 9
Freshwater fish landings in Madagascar (1970-1999) . . . . . . . . . . . . . . . . . . . . . . . . . . . . . . . . . . . . . . . . . . . . . . . . . . . . . . . . . . . . . . . . . . . . . . . . . . . . . . . . . . . . . . . . . . . . . . . . . . . . . . . . . . 24
Figure 10 Catch of tuna and tuna like species, e.g. Spearfish (Tetrapturus pfluegeri) and Bil fishes (Scomberesox saurus scombroides) in the Western Indian Ocean (1990-1999) . 24
Figure 11 Tourism arrivals (1980-1999). . . . . . . . . . . . . . . . . . . . . . . . . . . . . . . . . . . . . . . . . . . . . . . . . . . . . . . . . . . . . . . . . . . . . . . . . . . . . . . . . . . . . . . . . . . . . . . . . . . . . . . . . . . . . . . . . . . . . . . . . . . . . . . . . . . 26
Figure 12 Fertiliser consumption in Mauritius and Madagascar (1961-1999). . . . . . . . . . . . . . . . . . . . . . . . . . . . . . . . . . . . . . . . . . . . . . . . . . . . . . . . . . . . . . . . . . . . . . . . . . . . . . . . . . . . . . . . . . . . . . 33
Figure 13 Imports of insecticides in Madagascar, Mauritius and Seychelles (1990-1998). . . . . . . . . . . . . . . . . . . . . . . . . . . . . . . . . . . . . . . . . . . . . . . . . . . . . . . . . . . . . . . . . . . . . . . . . . . . . . . . . . 34
Figure 14 Giant Tortoise on the beach of the World Heritage Site Aldabra. . . . . . . . . . . . . . . . . . . . . . . . . . . . . . . . . . . . . . . . . . . . . . . . . . . . . . . . . . . . . . . . . . . . . . . . . . . . . . . . . . . . . . . . . . . . . . . . 35
Figure 15 Indicator-based map of reefs at risk. . . . . . . . . . . . . . . . . . . . . . . . . . . . . . . . . . . . . . . . . . . . . . . . . . . . . . . . . . . . . . . . . . . . . . . . . . . . . . . . . . . . . . . . . . . . . . . . . . . . . . . . . . . . . . . . . . . . . . . . . . . 36
Figure 16 Land reclamation in Small Islands States such as Seychelles provides opportunity for housing, hotel and industry developments.. . . . . . . . . . . . . . . . . . . . . . . . . . . . . 37
Figure 17 Bluestriped snapper.. . . . . . . . . . . . . . . . . . . . . . . . . . . . . . . . . . . . . . . . . . . . . . . . . . . . . . . . . . . . . . . . . . . . . . . . . . . . . . . . . . . . . . . . . . . . . . . . . . . . . . . . . . . . . . . . . . . . . . . . . . . . . . . . . . . . . . . . . . . 40
Figure 18 Solid waste on the beach in Grande Comores. . . . . . . . . . . . . . . . . . . . . . . . . . . . . . . . . . . . . . . . . . . . . . . . . . . . . . . . . . . . . . . . . . . . . . . . . . . . . . . . . . . . . . . . . . . . . . . . . . . . . . . . . . . . . . . . . . 44
Figure 19 Marine debris landed on Cosmoledo Atoll.. . . . . . . . . . . . . . . . . . . . . . . . . . . . . . . . . . . . . . . . . . . . . . . . . . . . . . . . . . . . . . . . . . . . . . . . . . . . . . . . . . . . . . . . . . . . . . . . . . . . . . . . . . . . . . . . . . . . . 45
Figure 20 Solid waste sources in Seychelles.. . . . . . . . . . . . . . . . . . . . . . . . . . . . . . . . . . . . . . . . . . . . . . . . . . . . . . . . . . . . . . . . . . . . . . . . . . . . . . . . . . . . . . . . . . . . . . . . . . . . . . . . . . . . . . . . . . . . . . . . . . . . . . 52
Figure 21 Causal chain diagram for solid waste. . . . . . . . . . . . . . . . . . . . . . . . . . . . . . . . . . . . . . . . . . . . . . . . . . . . . . . . . . . . . . . . . . . . . . . . . . . . . . . . . . . . . . . . . . . . . . . . . . . . . . . . . . . . . . . . . . . . . . . . . . 56
List of tables
Table 1
Geographical characteristics of the Indian Ocean Islands. . . . . . . . . . . . . . . . . . . . . . . . . . . . . . . . . . . . . . . . . . . . . . . . . . . . . . . . . . . . . . . . . . . . . . . . . . . . . . . . . . . . . . . . . . . . . . . . . . . . . . . 13
Table 2
Discharge and precipitation. . . . . . . . . . . . . . . . . . . . . . . . . . . . . . . . . . . . . . . . . . . . . . . . . . . . . . . . . . . . . . . . . . . . . . . . . . . . . . . . . . . . . . . . . . . . . . . . . . . . . . . . . . . . . . . . . . . . . . . . . . . . . . . . . . . 16
Table 3
Mangrove distribution. . . . . . . . . . . . . . . . . . . . . . . . . . . . . . . . . . . . . . . . . . . . . . . . . . . . . . . . . . . . . . . . . . . . . . . . . . . . . . . . . . . . . . . . . . . . . . . . . . . . . . . . . . . . . . . . . . . . . . . . . . . . . . . . . . . . . . . . . . 19
Table 4
Estimated coral cover and species number. . . . . . . . . . . . . . . . . . . . . . . . . . . . . . . . . . . . . . . . . . . . . . . . . . . . . . . . . . . . . . . . . . . . . . . . . . . . . . . . . . . . . . . . . . . . . . . . . . . . . . . . . . . . . . . . . . . . . . 19
Table 5
Number of marine fish species. . . . . . . . . . . . . . . . . . . . . . . . . . . . . . . . . . . . . . . . . . . . . . . . . . . . . . . . . . . . . . . . . . . . . . . . . . . . . . . . . . . . . . . . . . . . . . . . . . . . . . . . . . . . . . . . . . . . . . . . . . . . . . . . . 20
Table 6
Number of freshwater fish species. . . . . . . . . . . . . . . . . . . . . . . . . . . . . . . . . . . . . . . . . . . . . . . . . . . . . . . . . . . . . . . . . . . . . . . . . . . . . . . . . . . . . . . . . . . . . . . . . . . . . . . . . . . . . . . . . . . . . . . . . . . . . 20
Table 7
Characteristics of Marine Protected Areas. . . . . . . . . . . . . . . . . . . . . . . . . . . . . . . . . . . . . . . . . . . . . . . . . . . . . . . . . . . . . . . . . . . . . . . . . . . . . . . . . . . . . . . . . . . . . . . . . . . . . . . . . . . . . . . . . . . . . . 21
Table 8
Economic indicators. . . . . . . . . . . . . . . . . . . . . . . . . . . . . . . . . . . . . . . . . . . . . . . . . . . . . . . . . . . . . . . . . . . . . . . . . . . . . . . . . . . . . . . . . . . . . . . . . . . . . . . . . . . . . . . . . . . . . . . . . . . . . . . . . . . . . . . . . . . 22
Table 9
Trade conditions and vulnerability index.. . . . . . . . . . . . . . . . . . . . . . . . . . . . . . . . . . . . . . . . . . . . . . . . . . . . . . . . . . . . . . . . . . . . . . . . . . . . . . . . . . . . . . . . . . . . . . . . . . . . . . . . . . . . . . . . . . . . . . 23
Table 10
Changes in GDP by economic sector. . . . . . . . . . . . . . . . . . . . . . . . . . . . . . . . . . . . . . . . . . . . . . . . . . . . . . . . . . . . . . . . . . . . . . . . . . . . . . . . . . . . . . . . . . . . . . . . . . . . . . . . . . . . . . . . . . . . . . . . . . . 23
Table 11
Water resource use in agriculture. . . . . . . . . . . . . . . . . . . . . . . . . . . . . . . . . . . . . . . . . . . . . . . . . . . . . . . . . . . . . . . . . . . . . . . . . . . . . . . . . . . . . . . . . . . . . . . . . . . . . . . . . . . . . . . . . . . . . . . . . . . . . . 25
Table 12
Water consumption.. . . . . . . . . . . . . . . . . . . . . . . . . . . . . . . . . . . . . . . . . . . . . . . . . . . . . . . . . . . . . . . . . . . . . . . . . . . . . . . . . . . . . . . . . . . . . . . . . . . . . . . . . . . . . . . . . . . . . . . . . . . . . . . . . . . . . . . . . . . 26
Table 13
Scoring table for the Indian Ocean Islands region. . . . . . . . . . . . . . . . . . . . . . . . . . . . . . . . . . . . . . . . . . . . . . . . . . . . . . . . . . . . . . . . . . . . . . . . . . . . . . . . . . . . . . . . . . . . . . . . . . . . . . . . . . . . . . 30
Table 14
Main diseases by province in Madagascar . . . . . . . . . . . . . . . . . . . . . . . . . . . . . . . . . . . . . . . . . . . . . . . . . . . . . . . . . . . . . . . . . . . . . . . . . . . . . . . . . . . . . . . . . . . . . . . . . . . . . . . . . . . . . . . . . . . . . 32
Table 15
Summary of projected changes in temperature and precipitation for Smal Island States in the Indian Ocean over the next 50 to 100 years as inferred from AOGCMs. . 42
Table 16
Estimated annual amount of solid waste . . . . . . . . . . . . . . . . . . . . . . . . . . . . . . . . . . . . . . . . . . . . . . . . . . . . . . . . . . . . . . . . . . . . . . . . . . . . . . . . . . . . . . . . . . . . . . . . . . . . . . . . . . . . . . . . . . . . . . 46
Table 17
Costs associated with waste management. . . . . . . . . . . . . . . . . . . . . . . . . . . . . . . . . . . . . . . . . . . . . . . . . . . . . . . . . . . . . . . . . . . . . . . . . . . . . . . . . . . . . . . . . . . . . . . . . . . . . . . . . . . . . . . . . . . . . 48
Table 18
Economic costs of solid waste deposited along river banks, beaches and in the sea. . . . . . . . . . . . . . . . . . . . . . . . . . . . . . . . . . . . . . . . . . . . . . . . . . . . . . . . . . . . . . . . . . . . . . . . . . . . 48
Table 19
Proxy indicators developed to facilitate and ensure comparability of the assessment in the region. . . . . . . . . . . . . . . . . . . . . . . . . . . . . . . . . . . . . . . . . . . . . . . . . . . . . . . . . . . . . 51
Table 20
Characteristics of sites selected for the Causal chain analysis . . . . . . . . . . . . . . . . . . . . . . . . . . . . . . . . . . . . . . . . . . . . . . . . . . . . . . . . . . . . . . . . . . . . . . . . . . . . . . . . . . . . . . . . . . . . . . . . . . 51
Table 21
Population growth.. . . . . . . . . . . . . . . . . . . . . . . . . . . . . . . . . . . . . . . . . . . . . . . . . . . . . . . . . . . . . . . . . . . . . . . . . . . . . . . . . . . . . . . . . . . . . . . . . . . . . . . . . . . . . . . . . . . . . . . . . . . . . . . . . . . . . . . . . . . . 53
Table 22
Changes in urban population . . . . . . . . . . . . . . . . . . . . . . . . . . . . . . . . . . . . . . . . . . . . . . . . . . . . . . . . . . . . . . . . . . . . . . . . . . . . . . . . . . . . . . . . . . . . . . . . . . . . . . . . . . . . . . . . . . . . . . . . . . . . . . . . . 54
Table 23
Economic indicators. . . . . . . . . . . . . . . . . . . . . . . . . . . . . . . . . . . . . . . . . . . . . . . . . . . . . . . . . . . . . . . . . . . . . . . . . . . . . . . . . . . . . . . . . . . . . . . . . . . . . . . . . . . . . . . . . . . . . . . . . . . . . . . . . . . . . . . . . . . 54
Table 24
Likely changes in private and government consumption. . . . . . . . . . . . . . . . . . . . . . . . . . . . . . . . . . . . . . . . . . . . . . . . . . . . . . . . . . . . . . . . . . . . . . . . . . . . . . . . . . . . . . . . . . . . . . . . . . . . . . . 54
Table 25
Expected output change to the year 2020. . . . . . . . . . . . . . . . . . . . . . . . . . . . . . . . . . . . . . . . . . . . . . . . . . . . . . . . . . . . . . . . . . . . . . . . . . . . . . . . . . . . . . . . . . . . . . . . . . . . . . . . . . . . . . . . . . . . . . 54
Table 26
Summary of possible areas to explore in the Policy option analysis.. . . . . . . . . . . . . . . . . . . . . . . . . . . . . . . . . . . . . . . . . . . . . . . . . . . . . . . . . . . . . . . . . . . . . . . . . . . . . . . . . . . . . . . . . . . . 58
Table 27
Rapid screening of policy options based upon the main criteria for Policy option analysis.. . . . . . . . . . . . . . . . . . . . . . . . . . . . . . . . . . . . . . . . . . . . . . . . . . . . . . . . . . . . . . . . . . . . . 62
12
GIWA REGIONAL ASSESSMENT 45B INDIAN OCEAN ISLANDS
Regional definition
This section describes the boundaries and the main physical and
The combined Exclusive Economic Zone (EEZ) of the island states in
socio-economic characteristics of the region in order to define the
the region covers an ocean area of approximately 3.8 million km2. The
area considered in the regional GIWA assessment and to provide
total land cover is only 586 250 km2, of which Madagascar constitutes
sufficient background information to establish the context within
about 99 % (Table 1).
which the assessment was conducted.
The island states of the region show some similar characteristics as
wel as important differences. The most important difference in the
context of this report is the dwarfing of the smal er island issues by
Boundaries of the
Madagascar, which in fact can be considered as a micro-continent.
Indian Ocean Islands region
However, Madagascar shows the vulnerability of an island state and is
also biogeographical y, hydrological y, and economical y linked to the
The Indian Ocean is the third largest ocean on Earth with a surface
rest of the region.
area of 73 million km2, bounded to the north by the Arabian Peninsula,
to the west by Africa, east by the Malay Peninsula and to the south by
The percentage of land to sea area in the region is very low, meaning
Antarctica. The Indian Ocean Islands region is located in the western
that the states in the region have large expanses of the ocean under
Indian Ocean between 5° North and 30° South, and between 42° East
their jurisdiction as specified in the Convention on the Law of the Sea,
to as far as 70° (Figure 1). The region comprises of the island states of
with respect to territorial waters, continental shelves and EEZs. This
Comoros, Madagascar, Mauritius and Seychel es.
places the assessment of the transboundary issues in a special context
as the island states are separated by large expanses of the ocean and
do not share any coastal marine environments or freshwater resources.
Table 1
Geographical characteristics of the Indian Ocean
However, long-range transport of pol utants, movement of human
Islands.
pressure across boundaries and the impacts of global change are all
Land area
Coastline
Territorial
Continental
EEZ
Countries
(km2)
(km)
waters (km2)
Shelf (km2)
(mil ion km2)
issues which need to be assessed in a transboundary context.
Comoros
2 230
469
12 684
1 416
0.161
The human pressure on existing limited resources is also an issue shared
by all States of the region, and several endemic and migratory marine
Madagascar
581 540
9 935
124 938
96 653
1.079
species are especially threatened. Growth in fisheries and tourism are
likely to be the most significant economic forces in the region in the
next 20 years.
Mauritius
2 030
496
16 840
27 373
1.274
Key data gaps exist in several areas, including the key economic sectors.
Seychel es
450
747
45 411
31 479
1.288
Several global assessments have not included this smal part of the
world, for example there are no census reports for the main threatened
Note: The figures may differ from various reports published for the region, but to ensure
concistency all data was extracted from the same source. (Source: GEO Data Portal 2003)
species in the region.
REGIONAL DEFINITION
13
Physical characteristics
Characteristic of the Indian Ocean Islands region is the abundance of
relatively shal ow ridges and plateaus that are free from earthquake
Geophysical characteristics
activity. These aseismic ridges or plateaus run predominantly north
The Indian Ocean harbours both seismic (ridges) and aseismic (banks
to south and divide the ocean into separate basins. They differ from
and plateaus) formations. The seismically active Central Indian Ridge
the mid-ocean ridge in that they have a smoother topography, are
fol ows the north-south direction from the earthquake epicentres at the
commonly linear or angular in arrangement, are often bounded by
equator to 21° S where it intersects with the east-west running Rodriguez
faults, and are covered with sedimentary formations. The basement
Ridge. Both these formations (aseismic and seismic) contribute to the
rocks are in most areas oceanic and in the case of the Seychel es Bank,
diversity of islands in the region: Madagascar and part of the Seychelles
continental.
are continental, and Comoros and Mauritius are volcanic in origin.
Figure 1
Boundaries of the Indian Ocean Islands region.
14
GIWA REGIONAL ASSESSMENT 45B INDIAN OCEAN ISLANDS
REGIONAL DEFINITION
15
The Mascarene Plateau
The Mascarene Plateau extends as a fault composite arc for 2 300 km
with a depth range from 0 to 100 m (Figure 1). The Precambrian granitic
micro-continent of the Seychel es Bank extends southward through
the coral reef capped volcanic structures of Saya de Malha, Nazareth
Bank, and Cargados Carajos Banks to the Island of Mauritius. The granitic
rocks of the Seychel es bank are unique on the mid-oceanic islands and
have been described by Braithwaite (1984) and dated at 650 mil ion
years. Further south, the structure of Saya de Malha consists of a coral
layer 1.5 km thick, which covers the oceanic type crust and similarly
the Nazareth and Cargados banks. The Saya de Malha bank is part of
the high seas and part of the Mascarene Plateau. The bank is subjected
to numerous human activities ranging from fishing to aquaculture.
Figure 2
Areas within the Indian Ocean influenced by
monsoons.
Close to the granitic Seychel es bank is also the Amirantes bank. The
(Source: Redrawn from Ramage 1969)
Amirantes Plateau has depths ranging from 5 to 60 m abruptly dropping
down to over 1 000 m in certain areas.
In areas that are affected by the monsoon (for example Seychel es,
Comoros and northern Madagascar) three climatic situations are
Mozambique and Madagascar Ridges
observed. First, there is the Northeast monsoon, which blows from
Little is known of the structure of the Mozambique and Madagascar
December to March fol owing a north-south pressure gradient with
Ridges. Both extend southward continuously from continental blocks,
the northeast winds prevailing at 2-3 m/s on average. Crossing the
at depths between 1 000 and 2 000 m. At the southern ends they
Equator, the northeasterly winds change to a northwesterly direction.
approach the Southwest Indian Ridge; the Madagascar Ridge joins it
Secondly, the Southwest monsoon, north of the equator, is an extension
at the 3 000 m level. Both ridges have steep and linear scarps on their
of the southeast trade winds. It lasts from June to September fol owing
eastern side. The continental shelf ranges from 25 to 50 km in width
a steep pressure gradient situated between the southern anticyclone
offshore Somalia to 100 km offshore Madagascar and is terminated
and the low pressure areas of the northern Indian Ocean. Final y, the
seaward by a shelf/slope break (Tomczak & Godfrey 2001).
inter-monsoon period is dominant from April to May and from October
to November. During these transitions a strong westerly flux dominates
Climate
in the equatorial areas. A summary of these three climatic phenomena
The climate regime of monsoon and trade winds in the Indian Ocean
is shown in Figure 3.
is influenced by its geography. The monsoon regime occurs when the
direction of average prevailing winds changes more than 90° from
Conditions for coastal upwelling are also influenced by the monsoonal
summer to winter (Ramage 1969). The monsoon regime dominates the
shifts. Along the eastern coastline, winds favourable for upwelling are
northern part of the Indian Ocean and in the south such occurrences
weak during the Northeast monsoon season and absent during the
are mainly at the east and west extremes. Figure 2 indicates the regions
affected by monsoons. There is no specific climatic description for the
Indian Ocean Islands region, so a description of the climate of western
Indian Ocean is provided.
Atmospheric pressure in January ranges from 1 010 to 1 012 mil ibars
(mb), extending from the southern anticyclonic high pressure areas
(30° - 40° S). In July, the southern anticyclone reaches its most
northerly position at 25° S and is much stronger than in January.
During that period, the atmospheric pressure ranges from 1 021 to
1 000 mb.
Figure 3
Characteristics of the monsoon in the Indian Ocean.
(Source: Tomzak & Godfrey 2001)
14
GIWA REGIONAL ASSESSMENT 45B INDIAN OCEAN ISLANDS
REGIONAL DEFINITION
15
Figure 4
Currents, upwel ing, convergence and divergence areas in the Indian Ocean during the Northeast and Southwest monsoon seasons.
(Source: Redrawn from Marsac & Stequert 1989, Tomczak & Godfrey 2001)
Southwest monsoon season. However, the strongest upwelling of the
(Table 2). There is a marked difference in rainfall between the east coast,
Indian Ocean occurs along its western coastline when the Southwest
which is exposed to the trade winds, and the west coast of Madagascar,
monsoon produces strong Ekman transport away from the coasts of
bordering the Mozambique Channel. The west coast receives more
Somalia and Arabia (Figure 4).
than 1 700 mm annual y in the northwest, 700 mm in the middle west
and less than 500 mm in the southwest.
During the Northeast monsoon, wind bursts can occur when the
atmospheric pressure gets very low in association with the Inter-
Mauritius has a moderate tropical climate, mainly because of its
tropical Convergence Zone (ITZC). Cyclones are thus formed in areas
topographical relief and prevailing southeast winds. Two seasons
of atmospheric depression. Active cyclone formations last from
prevail over the Island, with summer from November to April and
December to April peaking around January and February. The cyclones
winter from May to October. Mean monthly temperature is 22 to 28°C
usual y travel westward of 8° S. The vulnerable areas are the Islands
on the coast and 17 to 22°C on the inland central plateau. Rainfall
of Madagascar, Mauritius and to some extent the Comoros. Except
varies over the year such that December to April is the wet season
for some outlying islands, such as Cosmoledo and Aldabra Atolls,
with February and March being the wettest months, especial y when
Seychel es is situated to the north of cyclonic trajectories and general y
tropical cyclones may bring 200 mm to 1 000 mm of rain in a few days.
escape the influence of cyclones.
September to November is the dry season with droughts occurring
during that period. The graph of annual rainfall varies in an erratic saw-
Tropical rainfal levels are usual y greatest in the central Indian Ocean with
tooth pattern. Mean annual precipitation is of the order of 800 mm/year
high levels on the east coast of Madagascar, averaging 2 000 mm/year
on the western coast and 3 800 mm/year on the central plateau. The
potential evapotranspiration varies from 2 000 mm/year on the coast
Table 2
Discharge and precipitation.
to 1 400 mm/year on the central plateau.
Annual river discharge
Average annual rainfall (mm)
Country
(m3/s)
Comoros has a tropical climate characterised by two seasons; a warm
min.
max.
mean
season and a wet season similar to Mauritius (CIA World Fact Book
Comoros
ND
ND
6 000
900
2002). The Northeast monsoon sometimes brings heavy precipitation
Madagascar
2 267
400
3 000
1 700
and cyclones. The climate varies over a few kilometres by the wind
Mauritius
19
700
4 000
2 180
fronts and altitude. The annual rainfal is wel over 2 000 mm marked
Seychel es
23
1 290
2 370
1 740
by a microclimate similar to mountainous islands.
Note: ND = No Data. (Source: World Bank 1992, FAO 1989, BDPA 1991, Voromarthy et al. 1998)
16
GIWA REGIONAL ASSESSMENT 45B INDIAN OCEAN ISLANDS
REGIONAL DEFINITION
17
The climate of Seychel es consists of the Northwest monsoon from mid-
Two western boundary currents, one along eastern Madagascar and
November to mid-March fol owed by an inter-monsoon period of light
one along the coast of Mozambique, create a subtropical gyre in the
variable winds and frequent calms; the South East Trade Winds from the
southern part of the region. The bifurcation east of Madagascar and
end of May to October, which average 6 m/s and frequently limit fishing
again near the African coast is also seen in the Sverdrup flow, as is the
activity; and a second inter-monsoon during October to November.
joining of the Mozambique and East Madagascar Currents into the
Temperature and humidity usual y remains high throughout the year
Agulhas Current. However, further research is required to determine its
with a mean temperature of 26.9°C and humidity of 80%. Seychel es
relevance to the Agulhas Current (Bryden & Beal 2001).
receives, on average, 193 mm of rain per month with the maximum
occurring around January and February.
An anticyclone gyre is situated in the northern basin associated
with a water convergence in the centre with an average mixed layer
Currents
depth of 100 m (July to September) coinciding with the cool season
Surface currents are often induced in areas of convergence or
of the northern winter monsoon. The 20°C isotherm is found at a
divergence (Figure 4). Divergence areas are the most productive and
depth of 180 to 200 m. A converging eddy has also been observed in
consequently, these are often considered the most favourable areas to
the channel's southern basin. At 16° to 18° S, an inverted circulation
find tuna, swordfish and small pelagic species. In the equatorial Indian
(cyclonic) is formed during the southern summer separating the two
Ocean, surface currents exhibit strong temporal and spatial variability.
eddies. In the southern winter, the northern eddy would spread towards
Inter-annual flow and direction variations of the main currents as well
the southern part as a cyclonic circulation dissipating slowly. These
as seasonal changes (due to winds) on the surface strata and eddy type
currents induce seasonal upwelling west of Grande Comoros, west of
situations have been recorded (Stequert & Marsac 1989).
Cap d'Ambre and Juan de Nova (Madagascar), and south of Madagascar
(25° and 40° S) and Ford Dauphin.
A number of current systems have been observed in the Indian Ocean
(Nguta 1998), the most important in the region being the Equatorial
High primary production is observed in the Mozambique Channel near
Current (EC) and the South Equatorial Counter-Current (SECC).
Cap St Andre and Juan de Nova (Madagascar). Along this convergence
the average chlorophyll a level is 0.4 mg/l. Lower concentrations have
The Equatorial Current
been observed in Tulčar compared with Nosy Be where the continental
The change in surface currents through the seasons is shown in
shelf is wider. Around the Seychel es, during the more suitable periods
Figure 4. The North Equatorial Current (NEC) is dominant during
for the formation of upwel ing along the plateau, chlorophyl a levels
January to March at the peak of the Northeast monsoon. This current
in the first 100 m depth layer have been found to be greater than
runs from the Malacca Strait, westwards at a speed of about 0.3 m/s as
40 mg/m2 compared to 20 mg/m2 measured offshore (Cushing 1973).
far as Sri Lanka, where it bends southward to about 2° S and accelerates
to reach 0.5-0.8 m/s. Also flowing westwards is the South Equatorial
Water catchments
Current (SEC), which is dominant in the area south of 8° S with velocities
The characteristics of the water catchments within the region vary from
rarely exceeding 0.3 m/s.
the large continental landmass of Madagascar to the smal granitic
islands of the Seychel es, the steep volcanic islands of Comoros and
The South Equatorial Counter-Current
Mauritius, and the flat coral islands. Pol ution and effects of land use
The SECC flows eastwards between the westward flowing NEC and
change, such as sediments, are discharged into the coastal area as a
SEC with a velocity ranging from 0.5-0.8 m/s, which decreases as it
result of terrestrial run-off. This has implications for the evaluation of
moves to the east. In January, the SECC does not reach beyond 70° E,
transboundary issues discussed in later sections of the report. River
being opposed in the east by weak westward flow (Tomczak & Godfrey
discharge is highest in Madagascar and lowest in the smal islands
2001).
(Table 2) (Vorosmarty et al. 1998).
Mozambique and East Madagascar Currents
Comoros
The dynamics of the subsurface induces very important enrichment
Being a volcanic group of islands, the Comoros, especially on Grande
processes vital for the fisheries of the region. Two of these processes
Comores, have no perennial streams since the soils are too thin and
are found within the Indian Ocean Islands region.
permeable. As a consequence, water is col ected in rain catchment
16
GIWA REGIONAL ASSESSMENT 45B INDIAN OCEAN ISLANDS
REGIONAL DEFINITION
17
tanks, although there is an underground reservoir of freshwater floating
Ocean. Rainfall in Madagascar varies from that of tropical rainforest to
over salty water, which has seeped in from the sea (World Bank 1979).
near desert conditions (Bensaid 1992). Water areas, which include lakes,
are estimated to have a combined volume of over 40 km3. The rivers,
Comoros' major catchment is Lake Dziani Boundouni, which is situated
which run over 3 000 km when combined, are more dominant on the
in the Djando region, on the Island of Mohéli (Global Wetlands Database
west than on the east coast of Madagascar. The most important rivers
2003). The closest main vil age is Itsamia off Chissioua M'chaco islet. It is a
and their associated water catchments are, from the west; Betsiboka
crater lake, one of the few freshwater lakes in Comoros. The remarkable
River with a catchment area of 49 000 km˛, Tsiribihina with a catchment
limnological characteristics of the site, with upwel ing that have led
area of 49 800 km˛, Mangoky with a catchment area of 55 750 km˛, the
to local belief in a monster, suggest interesting subterranean volcanic
Onilahy with a catchment area of 32 000 km˛, and the Sofia with a
phenomena. The ancient Crater Lake may have some connection with
catchment area of 27 300 km˛. In the east, the largest catchment is the
the ocean and the fauna that live in these extreme conditions could
Mangoro River with an area of 17 175 km˛. There are also about 1 300
be of great scientific interest. There are no large animal species but
lakes on the Island, with a combined surface area of 2 000 km˛. The
the lake supports a rich and varied bird population. Observed species
largest are; the Alaotra Lake (220 km˛) and Les Pangalanes (150 km˛)
include Ardeola idea, Butorides striatus, Bubulcus ibis, Egretta alba, Ardea
in the east, the Kinkony Lake (139 km˛) and the Loza Lake (45.6 km˛) in
cinerea, Gal inula chloropus, Tringa nebularia and Actitis hypoleucos. Up
the northwest, the Ihotry Lake (97 km˛) and the Tsimanampetsoka Lake
to 450 Tachybaptus ruficollis occur there but their breeding site remains
(30 km˛) in the southwest, and the Itasy Lake (35 km˛) in the central
a mystery. Outside the site, the steep, rocky and unvegetated islet of
part of the Island. Several lakes formed within volcanic craters are also
Chissioua M'chaco, is inhabited by marine birds, which are protected
found. Figure 5 shows the monthly discharge from selected rivers in
by virtue of the inaccessibility of the place.
Madagascar.
Madagascar
Mauritius
The island of Madagascar is of granitic origin, estimated to be around
The island of Mauritius is divided into 25 major river basins and 21
1 500 mil ion years, and encompasses a wide range of environments
minor ones (ERM 1999). The largest basin is the Grand River South
from semi-desert to tropical rainforests in the north. The Island also
East (166 km2), fol owed by Grand River North West (113 km2), and
has isolated volcanic formations. Due to its topography and size, the
then Riviere du poste (87 km2 ). Al these rivers empty into the Indian
eastern al uvial plain, granite faults, the central highlands and various
Ocean, discharge is estimated to be 0.5 km3/year (Figure 5) (World
areas of geological subsidence, Madagascar has the largest and most
Bank 1992). The surface water system is served by 92 rivers and 232
extensive terrestrial water system in the region. Madagascar can be
rivulets, which radiate from the centre of the Island through a dense
divided into two major basin groups - one draining to the west into the
and heterogeneous network. Most of the rivers are perennial with a few
Mozambique Channel and the other draining to the east into the Indian
linking directly to the aquifers either by recharging the latter or draining
Figure 5
Monthly discharge for selected rivers in Madagascar and Mauritius.
(Source: Global River Discharge database 2002)
18
GIWA REGIONAL ASSESSMENT 45B INDIAN OCEAN ISLANDS
REGIONAL DEFINITION
19
it. The surface water system has been subdivided into 48 river basins,
largest being on the island of Moehli (91 ha). In Mauritius, mangrove
which range from 3 to 164 km˛. It has been found that the average water
stands (especial y Rhizophora mucronata and Bruguiera gymnorhiza)
resources potential in Mauritius is adequate to meet demands at least
occur along 50 km of the southeast coast.
up to the year 2040. However, the random distribution of water in time
Table 3
Mangrove distribution.
and space results in periodical deficiencies.
Country
Mangrove area (ha)
Number of species
Seychelles
Comoros
100
6
The water catchment on Mahe, the main island in the Seychel es group,
Madagascar
330 000
9
is very smal due to the size of the Island and its topography. The granite
Mauritius
700
2
of Mahe (Plummer 1995) weathers deeply to a reddish brown lateritic
Seychel es
1 000
7
soil, which can often be seen as a distinct brown colouring of the coastal
(Source: Ranaivoson 1998, Taylor et al. 2003, Scetauroute 1999)
waters after heavy rains. The slopes are very steep, some as much as
1:4. Numerous streams, originating from the central mountain ridge, flow
Seagrass beds
down boulder-choked "U" and "V" shaped catchments before discharging
The seagrass beds, which occur throughout the region, are a common
into the sea. Consequently, the granitic island is characterised by many
feature of intertidal mud and sand flats, coastal lagoons, and sandy
smal , steep watercourses, most of them having only ephemeral flows.
areas around the bases of shal ow fringing and patch reefs (Gul ström
Because of the steep topography, low retention capacity of the soil, and
et al. 2002). Seagrass beds are commonly found adjacent to coral reefs
the relatively high density of urbanisation, high intensity rainfal has in
and mangroves. Seagrass beds are among the most productive aquatic
the past caused large downhil water and mud movements and severe
ecosystems and, of the 50 global y described species, only 13 are found
flooding along the coast for short periods (FAO 1989).
in the region. Extensive seagrass beds are found in the Toliara Lagoon
area (Madagascar), and in many areas along the coast, including Nosy
Main biotopes
Be (Cooke 1993). In Seychel es, they are dominant in Platte, Coetivy,
The Western Indian Ocean is characterised by rich, diverse and distinct
Amirante Banks and in the Lagoon of Aldabra Atol (Salm 1994). The
marine and coastal ecosystem. Common coastal and marine habitats
most common species are Thalassia hemprichi and Thalassodendron
include reefs, seagrass beds, lagoons, mangroves and the numerous
ciliatum.
shal ow banks of the Mahe Plateau and Saya de Malha (Kel eher et al.
1995). Deep ocean habitats are as yet poorly documented. Of the 38
Coral reefs
designated marine and coastal habitats, at least one third are found
Significant areas of coral reefs occur in the region (Table 4) (UNEP/IUCN
within each country of the region (UNEP 1984). These ecosystems
1988). Madagascar has the largest reef cover in the region and the reefs
sustain a great diversity of marine life and represent an important food
are most common along the east coast (McClanahan et al. 2000). Also,
source for most coastal communities (Gabriel et al. 2000).
there are a number of emergent fossil reefs along some parts of the
coast. A submerged and fragmented barrier reef has been described off
Mangrove forests
Toamasina. Most of the granitic islands of the Seychel es are encircled
The most significant stands of mangroves in the region occur in
by discontinuous, fringing reefs. Along the east coast of Mahe, reef
Madagascar (Table 3), and the main species are Rhizophora mucronata,
flats exceeding 2 km in width and terminating in a high algal ridge are
Ceriops tagal, and Bruguiera gvmnorhiza (Lebigre 1990). Other species
fol owed by a reef slope descending to a floor typical y at 8 to 12 m.
include Avicennia marina, Avicennia officionalis, Heritiera littolaris,
Table 4
Estimated coral cover and species number.
Lumnitzera racemosa, Sonneratia alba, Xylocarpus granatum, and
Xylocarpus moluccensis. Most mangrove stands in Madagascar exceed
Estimated coral cover
Country
Number of species
Number of genera
(km2 )
500 ha in size with Mangoky, Tsiribihina, Ranobe (Besalampy), Betsiboka,
Comoros
432 (Anjouan)
ND
ND
Mahajamba and Mahavavy (Baie d'Ambaro) having stands of more than
20 000 ha (Taylor et al. 2003). In Seychel es, significant stands are found
Madagascar
2 000
112
57
on both the granitic and coral islands. Twelve sites are found around
Mauritius
500
133
47
Mahe Island, but the largest stands are found on the islands of Aldabra,
Seychel es
577
174
55
Cosmoledo and Astove. In Comoros, the stands are very smal , the
Note: ND = No Data. (Source: McClanahan et al. 2000)
18
GIWA REGIONAL ASSESSMENT 45B INDIAN OCEAN ISLANDS
REGIONAL DEFINITION
19
Table 5
Number of marine fish species.
Table 6
Number of freshwater fish species.
Reef-
Other (including
Country
Total
Endemic
Native
Other
Country
Total
Endemic
Native
associated
introduced)
Comoros
446
294
ND
445
1
Comoros
11
1
10
ND
Madagascar
893
441
2
866
25
Madagascar
135
36
65
34
Mauritius
938
596
8
899
31
Mauritius
44
1
21
22
Seychel es
1 159
749
1
1 091
67
Seychel es
17
1
15
1
Note: ND = No Data. (Source: Fishbase 2003)
Note: ND = No Data. (Source: Fishbase 2003, Vanden Bossche & Bernacsek 1990)
The reefs on which the coral islands are situated exhibit a number of
(spiny lobsters, crabs, prawns), and echinoderms (sea cucumbers). The
different morphologies including true atolls, raised atolls, submerged
coconut crab (Birgus latro) which used to be abundant in the region is
and partial y submerged atolls. Mauritius is almost completely
now global y threatened and found on Aldabra (Seychel es) and some
encircled by fringing reefs, with substantial lagoon and barrier reef
other inhabited islands, but extinct throughout much of the region
development on the east and southwest coasts (Salm 1976). Rodrigues
(IUCN/UNEP 1984).
Island (Mauritus) is total y encircled by reefs, with wide shal ow reef
flats extending out from the shore, with its widest extent reaching
Freshwater life
10 km in the west (Spalding et al. 2001). The main types of reefs in the
Freshwater life is especial y important in Madagascar (Stiassny &
Comoros are discontinuous fringing reefs, ranging from 15 m to several
Raminosoa 1994). The freshwater ichthyofauna of Madagascar is not
kilometres from the coastline. In Comoros, reef cover is most extensive
unique in its large number of species, but they exhibit a very high
on the Island of Anjouan (Scetauroute 1999).
level of endemism (Table 6). In Madagascar, the second largest family
of freshwater fishes is Bedoti dae, which includes the genus Bedotia.
Marine life
An aquatic mammal, the Web-footed tenrec, lives along the banks
The FAO Fishbase (2003) suggests 5 375 species of fish, in 330 families
of streams and the shores of marshes and lakes, at altitudes of 600
occur in the Indian Ocean. At least 1 607 species are commercial y
to 2 000 m. A freshwater turtle, Eretmochelys madagascariensis, is also
exploited. Table 5 shows the number of marine fish species within the
present. Freshwater fish species are poorly documented in the region
Indian Ocean Island region. Coral reefs and mangroves are the most
and many are yet to be identified.
commonly associated biotopes. Seychel es has the highest diversity in
both fish species and coral reef associated species (GEF 1992), whilst
Mauritius demonstrates the highest endemism in fish species (Briggs
1974). Madagascar is also an area showing high diversity of fish species
(McAllister et al. 1993). The Comoros, and now parts of Kenya, Tanzania,
South Africa and Indonesia, is home to the coelacanth (Latimeria
chalumnae), described as a living fossil thought to have existed about
400 million years ago. A population of coelacanths not exceeding 200
individuals (currently protected under CITES Convention) lives at depths
of 700 m off the Island of Grand Comores (Fricke & Hissmann 2000).
The region also supports several species of marine invertebrates
including crustaceans, coelenterates, sponges, echinoderms, molluscs,
and cephalopods (Matthes & Kapetsky 1988). Certain groups, such as
molluscs, are reasonably well known. A number of endemic molluscs
are known from Mauritius, such as the Double harp (Harpa costata)
and the Violet spider conch (Lambis violacea),. Commercial y valuable
Figure 6
Trends in female Hawksbills nesting per season at
species include molluscs (green snail (Turbo marmoratus), pearl oysters
Cousin Island, Seychelles.
(Isognomon spp.)), cephalopods (octopus and squid), crustaceans
(Source: Adapted from Salm et al, 2000)
20
GIWA REGIONAL ASSESSMENT 45B INDIAN OCEAN ISLANDS
REGIONAL DEFINITION
21
Dugongs (Dugong dugon) are listed as vulnerable to extinction on a
global scale by The World Conservation Union (IUCN), and existing
studies show that they are likely to become extinct in the region
(Dutton 1998). Thought to have occurred in al four island states
(Marsh et al. 2002), few individuals now remain in Seychel es (Aldabra),
Comoros archipelago (Mayotte) and Madagascar (limited to the central,
northwestern and northeastern coasts), with no reports of any sightings
from Mauritius (Cockcroft & Young 1998).
At least 15 cetacean (whale) species have been recorded in the Indian
Ocean. Commercial whaling (in particular Sperm whales) has been
practiced since the 19th century but in 1979 The International Whaling
Commission (IWC) declared the Indian Ocean (north of 55° S) a sanctuary
(Figure 7), fol owing an initiative by the Seychel es (WWF 2002).
Other marine populations which are threatened include sharks and
Figure 7
Indian Ocean whale sanctuary.
(Source: WWF 2002)
sea cucumbers. However, data on the status of those species is very
sparse.
Threatened species
Many of the islands in the region are important areas for biodiversity and
Marine Protected Areas
have high levels of endemism. For example Madagascar is regarded as
In total, there are 15 Marine Protected Areas (MPAs) in the region,
the most endemic-rich country in Africa and the sixth in the world, with
covering over 800 km2 of the ocean within the Indian Ocean Islands
almost 700 endemic vertebrate species. Seychel es, on the other hand,
region (Table 7). The MPAs in the region are mostly coastal with no
exhibits one of the highest levels of endemism per square kilometre,
high seas MPAs present. MPAs are managed by a variety of institutions,
especial y in amphibians and reptiles (UNEP 1999).
including governments, semi-autonomous government bodies, NGOs
and the private sector.
The region is home to a number of important marine species such as
whales, dolphins, the unique coelacanth, rare dugong species, and
Table 7
Characteristics of Marine Protected Areas.
turtles. Many of these marine animals that live in the Indian Ocean are
Year
Country
Name
Size (km2)
now endangered, including dugongs, turtles and whales (Kel eher et
established
Comoros
Moheli Marine Park
2001
404
al. 1995).
Madagascar
Nosy Atafana Marine Park
1989
10
Four species of marine turtle are found in the region, namely the Green
Masoala Marine Park
1997
81
Fishing Reserves (Port Louis, Grand Port, Black River,
(Chelonia mydas), Hawksbil (Eretmochelys imbricata), Loggerhead
Mauritius
1983
63
Poudre d'Or, Poste Lafayette, & Trou d'Eau Douce
(Caretta caretta), and the Leatherback (Dermochelys coriacea). In most
Blue Bay Marine Park
1997
3.5
areas, marine turtles are at risk from exploitation and disturbance of and
Balaclava Marine Park
1997
5
damage to their nesting beaches and feeding grounds (Kel eher, 1995).
Seychel es
Aldabra Special Nature Reserve/World Heritage Site
1981
190
In Seychelles, during the period 1979-1986, Hawksbil turtles were legal y
Aride Island Special Reserve
1979
0.1
exploited, particularly for their shel s which were converted into artisanal
Baie Ternay Marine National Park
1979
1
products. However, with signs of seriously diminishing populations, stiff
Cousin Island Special Reserve
1979
1
protection laws were established which, in conjunction with an artisan
Curieuse Marine National Park
1979
16
compensation/retraining programme, eliminated domestic trade by
Port Launay Marine National Park
1979
1.5
1994 (Mortimer 1999). Consequently, there has been a subsequent
Silhouette Marine National Park
1987
20
increase in nesting activity on numerous islands (Figure 6) (Mortimer
St Anne Marine National Park
1973
14
& Bresson 1999).
(Source: UNEP 2001)
20
GIWA REGIONAL ASSESSMENT 45B INDIAN OCEAN ISLANDS
REGIONAL DEFINITION
21
The Continental Shelf
trade (Davenport 2001). The problems encountered by islands states
The average depth of the Indian Ocean Continental Shelf is about
include small and narrow domestic markets, transport problems within
3 960 m (excluding adjacent seas) compared with the Atlantic, which
islands, between islands and with the rest of the world, shortage of
is 3 300 m, and the Pacific at 4 200 m. The average width of the Shelf
arable land, and over-dependence on north-south trade flows. Exports
is about 200 km. Historical y, the Indian Ocean's has been strategical y
still centre on a few basic products, even though some diversification
important for trade and the military, but fisheries is a growing sector.
is now noticeable. Many consumer goods and virtual y all intermediate
Opportunistic exploration for seabed minerals (such as polymetal ic
products have to be imported (Peretz et al. 2001).
nodules and sand) and hydrocarbons has been conducted, but no
commercial deposits have been found so far. The species of fish
Economy
found on the Continental Shelf are less researched and only catch data
Mauritius, Seychel es and Comoros have very small economies (Table 8)
indicates which fish can be found there (Cushing 1973).
and resources are limited to fisheries and tourism, which are both very
volatile markets. There is also a high dependence upon custom duties,
Total marine fishery catches for the entire western Indian Ocean
which can be as high as 60% in Comoros, 40% in Seychel es and about
increased from a 1950s catch of about 0.5 million tonnes to nearly
32% in Mauritius (Salmon 2002).
3.8 mil ion tonnes in 1992. Coastal fisheries in the region are substantial
and are dominated by the local fishers whereas the more lucrative
When ranked according to the vulnerability index, and other indices,
oceanic fisheries are mainly operated by foreign vessels. Shrimp
the smal islands appear to be much more vulnerable than Madagascar.
catches are also one of the most important components of landings
In fact, within the region Seychel es is ranked the highest on both the
in Madagascar because of their importance to foreign exchange
Briguglio's and UN (CDP) Vulnerability Indexes (Table 9) (Briguglio 1995,
earnings (Ranaivoson 1997). Roughly 70% of total production of finfish
CDP 2000).
and invertebrates in the region comes from the sea and about 95%
from the EEZ (FAO 1997).
The structure of the lslands' economies is equal y varied. In Comoros
and Madagascar, agriculture employs 80% of the working population
and produces 40% of GNP. Annual average economic growth for the
period 1986-1996 was negative for Comoros (-1.5%) and Madagascar
Socio-economic characteristics (-2.0%) and positive for Mauritius (4.5%) and Seycheles (3.5%) (World
Bank 2000b). Tourism is expected to grow with significant implications
The Indian Ocean carries half of the world's container ships, 30% of its
for coastal quality, density and resource use conflicts (Table 10). In the
bulk cargo traffic, and about 60% of the world's oil shipments. Before
Seychel es, the tertiary sector dominates, with 18% of GNP coming from
the construction of the Suez Canal, it was, and probably stil is, the
tourism. The Mauritian economy is more evenly balanced between
most important trade route between Europe and Asia. The economies
agriculture, industry, tourism and services, and is the only country that
of the countries in the region are smal and vulnerable (with the
does not have a chronic lack of foreign exchange.
exception of Madagascar), and constitue less than 0.04% of world
Table 8
Economic indicators.
Share of the main
GDP 2000
GDP per capita 2000
Share of the global
Population 2000
exported good of
Services/goods
Tourism revenue
Country
(Atlas method)
(Atlas method)
trade in goods
(mil ions)
the total export,
export ratio, 2000
(mil ion USD)
(bil ion USD)
(USD)
1996-1998 (%)
1998 (%)
Comoros
0.56
0.21
380
0.0002
59, vanil a
1.5
16
Madagascar
15.5
3.9
250
0.0056
17, coffe
0.75
ND
Mauritius
1.2
4.5
3 800
0.0308
57, textile, clothing
0.55
503
Seychel es
0.08
0.59
7 310
0.0023
45, canned tuna
2.48
111
Note: ND = No Data. (Source: Adapted from Salmon 2002)
22
GIWA REGIONAL ASSESSMENT 45B INDIAN OCEAN ISLANDS
REGIONAL DEFINITION
23
Table 9
Trade conditions and vulnerability index.
1
2
3
4
5
6
7
Economic
Custom duties/
Commonwealth
Export concentration
Export instability
Briguglio vulnerability
UN (CDP) vulnerability
Country
diversification
fiscal resources,
Secretariat vulnerability
ratio, 1998
index, 1990-1998
index, 1995
1999 (%)
index
rank
index
rank
index
rank
Comoros
0.60
0.913
18.2
60
0.602
17th
55.36
24th
5.425
43rd
Madagascar
0.269
0.825
ND
17
0.428
62nd
26.75
105th
4.772
90th
Mauritius
0.318
0.858
3.8
32
0.614
14th
35.21
86th
6.510
27th
Seychel es
0.824
0.896
19.5
41
0.756
3rd
57.02
14th
6.375
28th
(Sources: Adapted from Salmon 2002, Atkins et al 2001, Briguglio 1995, CDP 2000)
Notes: ND = No Data.
1: Export concentration ratio is the combined percentage of total industry output accounted for by the largest producers in the industry.
2: Economic diversification index is a composite index comprising the following indicators: (i) manufacturing and modern services as a share of GDP; (ii) concentration of goods and services exports;
(iii) annual per capita electricity consumption; (iv) vulnerability to natural disasters (this indicator is under construction).
3: Export instability index is a derived measurment of the observed volume and value of exports against fitted values.
5-7: Vulnerability index provides a composite and comparative measure of the economic, environmental and social status of Small Island Developing States (SIDS), and provide means to integrate
ecological fragility and economic vulnerability . The vulnerability ranking is given in decreasing order.
Table 10 Changes in GDP by economic sector.
Fisheries of the western Indian Ocean are known to be nearly ful y
exploited but localised overfishing may have already occurred in many
Value added of GDP in
Value added of GDP in
Value added of GDP in
Country
agriculture (%)
industry (%)
services (%)
coastal areas (Figure 8). Coastal fish production has continued to rise
1997
2000
2001
1997
2000
2001
1997
2000
2001
over the past decade reaching over 1 million tonnes.
Comoros
40.9
40.9
40.9
11.9
11.9
11.1
47.2
47.2
48.0
Madagascar
31.5
29.1
29.8
13.4
14.5
14.5
55.0
56.4
55.7
Fish production in Madagascar rose from 86 000 tonnes in 1994
to 105 000 tonnes in 1999 (MPRH 1999) and Mauritius recorded a
Mauritius
9.7
5.9
6.3
31.7
31.6
31.2
58.6
62.5
62.5
drop from 18 000 tonnes in 1994 to 14 000 tonnes in 1999 (Pierre de
Seychel es
3.2
2.9
2.9
23.1
26.3
24.8
73.7
70.8
72.3
Bouchervil e 1997). The Seychel es recorded a rise from 4 500 tonnes in
(Source: World Bank country profiles database 2003)
1994 to 12 000 tonnes in 1999 (SFA 2000) and the Comoros level ed at
Population growth has hovered around 1% in Mauritius and Seychel es,
12 000 tonnes per year over the past five years. These coastal fisheries
stabilised at around 3% in Madagascar and risen in Comoros, from 2.8%
are important socio-economic activities of the region. The continuing
in the 1980s to 3.75% in 1996. The proportion of the population living
growth of population along the coast implies intensive resource use
on the coast varies throughout the region. The coastal population
and high values for coastal resources. It is believed that most of the
density is expected to increase in al countries; in Comoros from
223 persons/km2 in 1995 to 648 persons/km2 by 2020, in Madagascar
from 20 persons/km2 in 1995 to about 45 persons/km2 by 2020, in
Mauritius from 548 persons/km2 in 1995 to 699 persons/km2 by 2020,
and in Seychel es from 161 persons/km2 in 1995 to 203 persons/km2 by
2015 (Payet 2002). Coastal population density increases are likely to be
concentrated within 100 m from the coastline in the case of the small
islands.
Fisheries
Fisheries contribute significantly to the economies of the countries in
the region. They also have positive spin-off effects on employment
Figure 8
Trend in the relative rate of increase of landings in all
opportunities, income generation, food security, foreign exchange
marine waters.
earning, as wel as on other economic sectors and government revenue.
(Source: Grainger & Garcia 1996)
22
GIWA REGIONAL ASSESSMENT 45B INDIAN OCEAN ISLANDS
REGIONAL DEFINITION
23
coastal fisheries are being exploited beyond the Maximum Sustainable
Yield (MSY). One important aspect is growing fishing capacity leading to
overcapitalisation of the fishing industries. In the region, approximately
36 000 vessels are operating on the continental shelves with 165 000
fishers exploiting the different fish stocks (FAOSTATS 2002). Loss of jobs
in the fishing sector is seen as a great concern to this region, especial y
in the col apse of fisheries since alternative employment opportunities
seldom exist.
Freshwater fisheries are most significant in Madagascar (Figure 9),
although some angling activities have been reported in the small
Figure 9
Freshwater fish landings in Madagascar (1970-1999).
reservoirs in Mauritius (Vanden Bossche & Bernacsek 1990). Inland
(Source: Vanden Bossche & Bernacsek 1990)
fisheries in Madagascar occur primarily in the large lakes and lagoons.
Seven of those lakes are heavily exploited with extractions of the order
the local fishing industry. The fisheries are exploited both on an industrial
of 22 500 tonnes over an area of about 630 km2 (1984 data), involving
scale (purse seiners and longliners) and an artisanal scale (line fishing)
over 17 740 fishermen. Signs of overfishing are evident in two lakes
(Stequert & Marsac 1989). The latter is however, considerably smal er.
(Alaotra and Itasy). Inland fish species include the common carp
(Cyprinus carpio) and Tilapia (Oreochromis spp.) and at least 70% of the
The Indian Ocean Tuna Commission (IOTC) is the body under FAO for the
catch is for local consumption (Rabelahatra 1988).
management of tuna fisheries in the Indian Ocean, set up in Seychelles
in 1997. Total catch (pelagic) from the western Indian Ocean in 1999 was
Aquaculture is also a growing industry (Coche et al. 1994), most
estimated at 987 000 tonnes, a rise of approximately 240 000 tonnes from
prominent in Madagascar where production rose from 128 tonnes in
1990 (Figure 10). There are concerns on the status of tuna and tuna like
1991 to 6 900 tonnes in 1998 (Rabelahatra 1988). The most commonly
species stocks. Studies revealed that stock indicators for Yellow fin tuna
farmed species are Cyprinus carpio, Tilapia spp., Cyprinus auratus,
(Thunnus albacares), which have more or less stabilised since 1993, could
Penaeus indicus, Penaeus monodon, Bedotia marojejy, Oncorhynchus
be interpreted as a sign of overexploitation with catch of this species
mykiss, Ptychochromoides vondrozo, and Rheocles derhami. Seychel es'
above MSY since that year. Similarly, Bigeye tuna (Thunnus obesus) has
production from aquaculture was 678 tonnes (mostly tiger prawns,
been exploited wel over its MSY for the last five years and potential y,
Penaeus monodon) in 1996 (SMB 2000), whilst Mauritius produces
should it continue to rise, the spawning stock biomass wil fal . Overal
around 87 tonnes per year where mostly Macrobrachium rosenbergi ,
fishing effort is on the increase and considered as very high although
Penaeus monodon, and Rhabdosargus sarba are farmed (Bhikajee 1997).
it is at present difficult to indicate the optimum fishing capacity for
Comoros does not have any aquaculture activities. In most cases, the
sustainable exploitation of the resources (IOTC 2002). Unregulated Il egal
areas of high density of cultivation and reduced water exchange has
and Unreported catches (IUU) are stil a concern in the Western Indian
provoked problems such as benthic enrichment and hypoxic water
conditions. In Madagascar, the extensive conversion of coastal wetlands
and mangrove areas to fish and shrimp pond culture has significantly
reduced replenishment of the natural shrimp population, which uses
these areas as nursery grounds. In addition, this has led to coastal
erosion in numerous areas. However, the level of such destruction is
undocumented.
Tuna fishing is a major activity occurring in the oceanic and international
waters of the region (Payet 1997). It is a very important economic activity
and most of the countries in the region manage it through access
Figure 10 Catch of tuna and tuna like species, e.g. Spearfish
(Tetrapturus pfluegeri) and Billfishes (Scomberesox saurus
agreements with developing states (mainly within the European Union).
scombroides) in the Western Indian Ocean (1990-1999).
These agreements are based on financial compensation and other aid to
(Source: IOTC 2002)
24
GIWA REGIONAL ASSESSMENT 45B INDIAN OCEAN ISLANDS
REGIONAL DEFINITION
25
Tuna Fisheries. Many vessels stil neglect to report or underreport their
Steep slopes and continuous cultivation without the provision of fallow
catch and also, many vessels fish under the flag of convenience.
fields have led to the impoverishment of the soil and serious incidents
of soil erosion and siltation of the coral reefs with deleterious effects on
Agriculture
fisheries. Agricultural run-off is also considered to have led to pollution
Agriculture is an important sector for Mauritius, Madagascar and
of groundwater although no data have been reported on which an
Comoros. In Seychel es, the shift to tourism has reduced the agricultural
assessment of the problem can be based.
sector to about 4% of the GDP, with a focus on poultry, vegetables and
fruits for local consumption.
Water use in agriculture varies according to the level of agriculture and
extent of irrigation in each of the Island States (Table 11). In Seychel es,
The area under cultivation in Mauritius is 90 100 ha or 48% of the
water is abstracted directly from rivers so there are only extremely small
total land available. About 90% of this land is occupied by sugarcane
irrigation schemes for areas no greater than 2 to 5 ha (e.g. on La Digue
cultivation. Approximately 1 153 tonnes of pesticides (13 kg/ha)
Island). In contrast, the irrigation potential on the three main islands of
are imported annually into Mauritius, out of which 59% represents
Comoros is about 303 ha (Grand Comores, negligible; Anjouan, 203 ha;
herbicides, 31% insecticides and 8% fungicides (MCA 1998). The annual
and Moehli, 100 ha), while in 1987 the area equipped for irrigation
import of fertilisers for the period 1979-1989 averaged 57 500 tonnes
was only 130 ha (Banque Mondiale 1993). Information on the actual
(640 kg/ha).
agricultural water use is not known. Irrigation potential in Madagascar
is vast, an estimated 1.5 million ha or 19% of agricultural potential area.
In contrast, cattle-rearing and rice production are the main agricultural
About 82% of the potential agricultural land has already been irrigated.
activities in Madagascar, although there are also smal areas of intensive
Rice cultivation occupies at least 50% of cultivated lands. Access to
production of sugarcane and cotton in the southwest of the country.
irrigation water is higher in the highlands where almost 93% of farmers
The application of fertilisers in intensive agricultural areas was reported
have access as compared to 50% of the coastal farmers. Irrigation
to be as high as 163 kg/ha in 1990, and has been linked to localised
works suffer from periodical flooding from heavy rainfall and cyclones
algal blooms and reduced fish catches in lagoons (Toliara). The clearing
(Bensaid 1992). In Mauritius, irrigation is extensive and used primarily
of forests in Madagascar, resulting in sediment mobilisation, siltation
for sugarcane cultivation (about 17 500 ha), extending over 83% of
and the destruction of coral reef habitats has been identified as a
the agricultural areas (mainly sprinkler irrigation technique). Irrigation
major problem (Lundin & Linden 1995), particularly along the western
sources include primarily surface water, but groundwater is also used.
coastline. The causes include bush-fires, harvesting of forests for
production of charcoal and clear-felling for agriculture purposes.
Tourism
Tourism is increasingly becoming important for the Islands in the
Agricultural production occupies approximately 67% of land on the
region, in particular Seychel es and Mauritius (Figure 11). Madagascar
Comoros, employs between 70% and 80% of the total population, and
and Comoros also have great potential for tourism.
accounts for 98% of export revenue. The main export crops include
vanil a, ylang-ylang and cloves. Cereals, rice, potatoes, fruits and
In the Seychelles, tourism is a significant activity described as "the
legumes are also grown for local consumption. The total quantity of
mainstay of the Seychelles economy today" (Lundin & Linden 1995).
pesticides used between 1991 and 1993 was approximately 70 tonnes.
Direct revenue from tourism stands at 18% of the GDP, compared to 4%
Table 11 Water resource use in agriculture.
Water resources
Water use
Arable &
permanent
Average
Average
Internal
Groundwater
Surface water
Agricultural
Country
Irrigation
crops in 2000
precipitation
precipitation
renewable
produced
produced
water use
potential
FAOSTAT (ha)
1961-1990 IPCC 1961-1990 IPCC water resources
internally
internally
in 2000
(ha)
(mm/year)
(km3/year)
(km3/year)
(km3/year)
(km3/year)
(km3/year)
Comoros
128 000
1 754
3.91
1.20
1.00
0.20
ND
303
Madagascar
3 500 000
1 513
888
337
55
332
14.31
1 500 000
Mauritius
106 000
2 041
4.16
2.21
0.68
2.03
0.37
ND
Seychel es
7 000
1 970
3.17
0.88
0.1
0.7
ND
ND
Note: ND = No Data. (Source: FAO Aquastat 2003)
24
GIWA REGIONAL ASSESSMENT 45B INDIAN OCEAN ISLANDS
REGIONAL DEFINITION
25
are reported at 88 mil ion USD, roughly just over half of the earnings
from exports.
In Madagascar, tourism is the primary earner of foreign exchange, with
earnings growing from 44.6 mil ion USD in 1996 to over 135.5 mil ion USD
in 2001. This also coincided with an increase in the number of visitors
from 86 681 to about 200 000 during the same period. There are over
220 hotels, which directly employ over 18 000 persons (2001 data).
However, Madgascar's tourism economy suffered during the domestic
political crisis of 2002.
The water sector
Figure 11 Tourism arrivals (1980-1999).
In Mauritius and Seychel es, less than 1% of the population do not have
(Source: GEO Data Portal 2003)
direct access to potable water. However, in Comoros and Madagascar, at
from agriculture, fishing and forestry, amounting to 120 mil ion USD per
least 55% and 53% of the population, respectively, do not have access to
year. Tourism also accounts for 70% of total foreign exchange earnings
potable freshwater (Table 12). Consequently, effects on the freshwater
and provide 20% employment on the labour market. The most intensely
resources will affect the population as a whole, particularly those living
developed parts of the coast on Mahe are the northwest coast, and,
within highly urbanised areas. For example, in Madagascar, potable
more recently, the southwest. On the island of Praslin, the east coast
water supply is available to 12% of the rural population, 73% of the
is most developed in terms of tourism infrastructure. Currently, there
urban population and 1.5% of the coastal population.
are over 5 400 hotel beds, with a maximum of about 130 000 tourists
expected every year. There are development plans to increase this to
Key industries that are affected by water scarcity include tourism,
200 000 per year by 2010. Tourism development on other smal er granitic
agriculture, and industries. Tourism is particularly affected through
islands and some outlying coral islands has also taken precedence over
restrictions in water supply and low quality of water. In rural areas,
the last 10 years, with highly luxurious hotels being built on Fregate and
especial y in Mauritius and Madagascar which have extensive agriculture
Alphonse Islands. Already, four five-star hotels have been built and a
areas, modification of streamflow has a serious impact on this sector
number of existing hotels are upgrading to that level (Payet 2003).
(Banque Mondiale 1992). In Madagascar and Comoros, freshwater
scarcity has led to population movements across the country. Food
Mauritius is less dependent on tourism because of the dominance of
processing industries, in particular, are affected by water shortage due
sugar production and processing activities. It has three main tourist
to restrictions and low quality.
zones (a) the northern zone from Balaclava to Grand Gaube, (b) the
eastern zone from Roche Noire to Trout d'eau Douce, and (c) the
Cost of treated water is somewhat similar in each country ranging
southwestern zone from Flic-en-Flac to Le Morne. Tourist arrivals in
from 0.4 USD/m3 in Mauritius, 0.44 USD/m3 in Comoros, 0.45 USD/m3 in
1997 had reached 536 125, representing and increase of 9.3% per year,
Seychel es, and 0.46 USD/m3 in Madagascar. However, noting that the
while foreign exchange revenues had reached nearly 461 million USD
purchasing power is very different between countries, the cost of water
in 1997, an increase of 17% per year since 1992 (ERM 1999). Tourist
accommodation is 6 000 rooms plus 2 000 rooms in the informal
Table 12 Water consumption.
sector. Hotels offer employment to about 14 000 people, total tourism-
Comoros
Madagascar
Mauritius
Seychelles
induced employment reaches over 51 000 accounting for 10% of total
1990
2000
1990
2000
1990
2000
1990
2000
employment.
Population with access to
ND
45
44
47
100
100
82
99
treated water (%)
Tourism in Comoros is limited. Arrivals in 1993 were 24 000, representing
Total water use
ND
ND
ND
15
ND
ND
8
ND
(mil ion m3/year)
a smal share of only 4% of the arrivals in the countries of the West Indian
Water use per capita
Commission, totalling 600 000, while direct employment in tourism is
ND
ND
ND
937
ND
516
100
ND
(m3/year)
about 500 people and 50 in related activities. Foreign currency earnings
Note: ND = No Data. (Source: UNICEF 2003)
26
GIWA REGIONAL ASSESSMENT 45B INDIAN OCEAN ISLANDS
REGIONAL DEFINITION
27
is much more expensive in Comoros and Madagascar compared with
electricity to the capital Antananarivo and Toamasina. A reduction in the
Seychel es and Mauritius. In many instances such costs are subsidised
flow of this river will cause a reduction in the production of this clean
by national governments.
form of energy, and increase other costs such as obtaining electricity
from fossil fuel (World Bank 1998).
Water consumption and works
The total volume of water used for irrigation in Mauritius is estimated
Institutional framework
at 340 mil ion m3 per year, including 50 mil ion m3 used by the sugar
In Comoros, the environment is administered by the `Direction General
factories (WRU 1997). Although the area under sugarcane cultivation
de L'Environnement` (DGE), directed by and functioning within a national
fel from 82 000 ha in 1991 to 76 800 ha in 1996, annual production
environmental policy (la Politique Nationale de L'Environnement (PNE))
has remained constant at approximately 5.5 mil ion tonnes. This is a
and environment management plan (Plan d'Action Environnementales
result of an increase in average yields from 65.9 to 73.3 tonnes/ha due
(PAE)). A multisectoral high-level committee, (le Comite Interministeriel
to increased irrigation of the cultivated area. Therefore, a reduction in
Consultatif pour L'Environnement (CICE)) ensures co-ordination of
freshwater availability wil have an impact on the productivity of this
activities across al sectors. Water-related environment legislation in
sector, likely a decrease from 5.5 mil ion tonnes to 5 mil ion tonnes,
Seychel es operates under the Ministry of Environment but is executed
assuming a yield of 65.9 tonnes/ha as the baseline.
by the Public Utilities Corporation (Payet 2002).
Yields from boreholes in Mauritius decrease to about 25 to 40 % during
In Comoros, responsibilities for water resources management are
the dry season when the water table recedes to a range from 1 to 27 m
scattered among multiple public sector institutions, most of which
depending on the location of the boreholes.
are understaffed, have limited resources and lack technical capabilities.
However, the Directorate of Public Works (Direction de Generale Travaux
In Seychel es, the deficit between water supply and demand amounts
Publics (DGTP)) is the main agency responsible for water resources
to 3 700 m3/day (1999) and wil rise to 6 520 m3/day by the year 2005
management and development (World Bank 2000a). In Seychel es, this
(Henri 1999). However, due to abnormal y longer dry periods during
function is undertaken by the Seychel es Public Utilities Corporation.
the last four years, this deficit has increased prompting the government
Several institutions are involved in Mauritius, namely the Irrigation
to invest in desalination plants (the existing desalination project costs
Authority under the aegis of the Ministry of Agriculture, Fisheries and
29.6 million USD) to meet demand. During these extended dry periods,
Natural Resources, and the Ministry of Energy, Water Resources and
water was delivered in tankers, increasing the operating cost by a factor
Postal Service.
of five. In fact, many of the hotels in Seychel es are now resorting to
building large storage tanks to meet demand during periods of
Several institutions in Madagascar are involved in water resources
drought. Industries have also been affected. One company in 1999 had
management. These include the Ministry of Rural Development
to stop production due to lack of water. Water scarcity has therefore led
(Ministčre du développement rural et de la réforme foncičre) with
to increased operation costs.
`la Direction du génie rural' (DGR), both responsible for policy
and implementation issues. The `Service de gestion des réseaux
In Comoros, the deficit in freshwater is much higher and is cause of
hydroagricoles' (SGRH) and the `Associations des usagers de l'eau'
concern (Banque Mondiale 1993). For example, on Grande Comores
(AUE) are responsible for the maintenance of the network. Final y, the
(the largest island in the group), which has a population of 304 706, only
`Direction des eaux et foręts' is responsible for technical aspects and
5 342 m3/day (18 litres/person/day) is available, while present demand
research and the Ministry of Economic Planning for investments co-
is 15 235 m3/day (50 litres/person/day). This situation is similar in other
ordination (World Bank 1992).
islands in the group, implying that due to growth in population and
other sectors, water availability is constrained beyond supply, and any
The Governments are also advised through various inter-ministry
reduction in availability wil further exacerbate the situation.
committees; in the case of Madagascar, the `Conseil National pour
L'Environment' (CNE), in Comoros, the `Comité Interministerial
In Madagascar, of the 40 km3 of freshwater available per day
Consultafif pour L'Environnment' (CICE) and Seychel es, the National
224 m3/day is used for generating hydroelectricity. This is done at the
Environment Advisory Council (NEAC).
only hydroelectric station located on Vohitra River, which provides
26
GIWA REGIONAL ASSESSMENT 45B INDIAN OCEAN ISLANDS
REGIONAL DEFINITION
27
There are also several consultation forums, which involve the
political and constitutional level, the concept of environment is well
participation of Government, Non-Government Organisations (NGOs)
established in the region. For example, in the Seychel es, Article 38 of
and the private sector.
the constitution assigns the protection of the environment as a human
right. In Madagascar, policy is guided by a general government policy
The role and importance of NGOs in sustainable development activities
document entitled the `Document Cadre de Politique Economique'.
has increased. For example, in Seychel es, since 1996, at least seven
NGOs have increased involvement in coastal activities and projects.
In general, the legal frameworks in the region are at different stages of
Two NGOs are also involved in the management of marine protected
development, but share many important similarities, both in origin and
areas.
use of terms. There are however, considerations that are island specific;
for example, in Comoros, Islamic law exists along-side modern law and
The role of the private sector is also increasing, although more so
customary law (Ahmed & Abdou 2002). In Seychel es and Mauritius,
in Mauritius and Seychel es than in Comoros and Madagascar. In
however, the law is based upon both the British and French systems
Seychel es, the environment trust fund attracts about 1 mil ion USD
often leading to complications in the application of law. Likewise, many
per year from the private sector. Notwithstanding, voluntary actions
of the sectoral laws in the region are as old as the 1960s with poor
by the private sector are stil isolated, especial y since investments
enforcement effectiveness. Amendments are also frequent, leading to
in infrastructure, such as wastewater treatment, can be quite high.
further complications, especial y in the application of law in the coastal
Unfortunately, it is often only after significant legal pressure that the
environment. In Mauritius, laws pertaining to the coastal environment
private sector complies with environmental regulations. The ISO
are fragmented leading to sectoral conflicts, which often results in
standards are wel established in Mauritius, but less so in the other
ineffective enforcement. To facilitate legal proceedings and expedite
countries in the region. In al the states of the Indian Ocean, the
convictions made under the Environment Protection Act, Mauritius has
private sector is involved in a wide range of water and coastal-related
set up a special Environment Tribunal which was updated in 2002 to
development for both human settlement and industrial needs. The
improve enforcement (Fagoonee & Daby 1993).
Environment Management Plan framework has been the primary driver
for implementation of integrated water management: coastal zones
In Mauritius and Seychel es, the Central Water Authority Act No. 20 and
and watershed management within the region (Payet 2002).
the Public Utilities Corporation (Water Supply) Regulations S/I 26/1988
(regulate the supply of water to consumers, protection of water supply,
The most recent and legal y binding regional framework is the Nairobi
and pol ution prevention) are the main regulatory frameworks for water
Convention and its related protocols (see also Annex IV). The Nairobi
management, respectively.
Convention, related protocols and the Action Plan were adopted in
June 1985. Although Integrated Coastal Zone Management (ICZM) is
A framework for environmental law also exists in al the countries
not defined in the Convention, in Article 2 (a) specific reference is made
of the region, but they are al relatively new and only in force since
to the coastal environment, and (b) identifies activities having an impact
the early 1990s. For example, in Comoros, the EPA (Environment
on coastal habitats and resources. Due to severe constraints, the Action
Protection Act) was enacted in 1994, Mauritius in 1991, and Seychel es
Plan was reviewed in 1999, and a new programme reflecting the needs
in 1994. Important developments in the implementation of framework
of the parties was drafted in the form of a Biennial Work Programme for
environmental law included concepts such as Environment Impact
the Implementation of the Nairobi Convention. The new programme
Assessments (EIA), environment quality standards, pol ution control
focuses on coral reefs, shoreline changes, and land-based sources of
mechanisms, and designation of specific areas based upon environment
pollution, all areas of priority determined by a regional study by UNEP
criteria and dealing with environmental emergencies. In Madagascar,
(UNEP 1998). An exercise to update and review the Convention and its
al activities listed in the annex to the regulations should be subject
protocols is also ongoing and expected to be completed shortly for
to an EIA, however this legislation is being simplified to enable some
consideration by the Parties.
smal er applications to proceed faster and other larger investments to
be subject to a much larger EIA. In Mauritius, part IV of the EPA relates
In the midst of al these regional developments, many of the island states
to EIAs, and makes specific provisions for public inspection of the EIA,
have been implementing these resolutions at national level through
appeal through the Environment Tribunal, revoking of EIA license for
development of relevant policies and legal frameworks. At the highest
non-compliance (Grange & Odendaal 1999).
28
GIWA REGIONAL ASSESSMENT 45B INDIAN OCEAN ISLANDS
REGIONAL DEFINITION
29
On the other hand, the land use and land tenure legal framework
is outdated, complicated and very controversial in almost al of the
countries in the region. In Madagascar, conflicts over land tenure
arise from the problem of access by local communities to coastal
resources. These are governed by two pieces of legislation dating
back to the 1960s, which are currently being revised. GELOSE (Gestion
Locale Securisee) is a policy document, which attempts to provide
communities security of tenure and a legitimate right to access and
manage their resources (Joignerez et al. 2002). The Seychel es Town
and Country Planning Act 1970 is currently being revised and updated
to incorporate coastal and environmental issues. In Mauritius, the
Town and Country Planning Ordinance of 1954 is being superseded by
a modern Town and Country Planning Act.
Framework legislation addressing protected areas is relatively old
in countries like the Seychel es (Nature Conservancy Act, 1969) and
Madagascar (as far back as 1927). In Madagascar, a Code of Protected
Areas (COAP) has been put in place providing for three types of
protected areas: integral nature reserves, national parks and special
reserves. Comoros, on the other hand, does not have a legal framework
for protected areas, however two marine parks are planned and the
legal framework will probably be set-up.
Since pol ution from human activities cover such a wide range
of issues from water pol ution, marine pol ution and wastes, the
related legislation in the island states is dispersed and fragmented.
For example, in Madagascar, more than 60 legislative texts covering
control in use of chemicals, wastes and pesticides exist. The more
recent environment management plans also led to a proliferation in
legislation addressing water quality and to enactment of several pieces
of legislation addressing land-based activities which have implications
for the coastal integrity. Both the Mauritius and Seychel es EPA have
very detailed pol ution control provisions including provisions for
declaration of effluent and emission standards, access to industry sites,
as well as sample col ection and analysis protocols.
28
GIWA REGIONAL ASSESSMENT 45B INDIAN OCEAN ISLANDS
REGIONAL DEFINITION
29
Assessment
Table 13 Scoring table for the Indian Ocean Islands region.
This section presents the results of the assessment of the impacts
Assessment of GIWA concerns and issues according
The arrow indicates the likely
of each of the five predefined GIWA concerns i.e. Freshwater
to scoring criteria (see Methodology chapter)
direction of future changes.
T
T
C
C
Increased impact
shortage, Pollution, Habitat and community modification,
P
A 0 No known impacts
P
A 2 Moderate impacts
I
M
I
M
T
T
No changes
C
C
Overexploitation of fish and other living resources, Global
P
A 1 Slight impacts
P
A 3 Severe impacts
I
M
I
M
Decreased impact
change, and their constituent issues and the priorities identified
during this process. The evaluation of severity of each issue
Indian Ocean
p
a
c
t
s
u
n
i
t
y
e
n
t
a
l
m
p
a
c
t
s
m
i
c i
m
c
o
r
e
*
*
adheres to a set of predefined criteria as provided in the chapter
Islands
o
m
p
a
c
t
s
p
a
c
t
s
describing the GIWA methodology. In this section, the scoring
E
n
v
i
r
o
n
m
i
m
E
c
o
n
o
m
H
e
a
l
t
h i
O
t
h
e
r c
i
m
O
v
e
r
a
l
l S
P
r
i
o
r
i
t
y
*
*
*
of GIWA concerns and issues is presented in Table 13. Detailed
Freshwater shortage
1.5*
2.0
1.2
1.4
1.6
5
scoring information is provided in Annex II of this report.
Modification of stream flow
1
Pol ution of existing supplies
2
Changes in the water table
1
The assessment of the GIWA concerns is based upon available data
Pollution
1.7*
2.4
2.4
1.7
1.9
1
and the background information presented in the Regional definition.
Microbiological pol ution
1
A number of data gaps and an imbalance in the availability of data
Eutrophication
2
Chemical
1
exist, especial y in terms of long-term trend data, which makes the
Suspended solids
1
assessment speculative in some cases. For example, the recent coral
Solid waste
2
bleaching event in the region has resulted in a lot of information and
Thermal
0
Radionuclide
0
data being published, whereas data on several threatened marine
Spil s
2
species are not available. In order to adequately address the concerns,
Habitat and community modification
1.5*
2.4
1.7
2.4
1.9
3
empirical evidence from research elsewhere was used and applied to
Loss of ecosystems
1.3
the regional context. This is indicated in the text where appropriate.
Modification of ecosystems
1.8
Unsustainable exploitation of fish
1.6*
2
1
1
1.7
4
Overexploitation
2.5
Excessive by-catch and discards
0.8
T
C
Destructive fishing practices
1.8
P
A
Decreased viability of stock
0.8
Freshwater shortage
I
M
Impact on biological and genetic diversity
1.3
Global change
1.2*
2.3
0.7
1.8
1.9
2
Analysis of meteorological records and other data indicates that the
Changes in hydrological cycle
1
impacts of Freshwater shortage are most severe during the dry season.
Sea level change
2
In the region, the dry season typical y lasts about three to four months,
Increased UV-B radiation
0
Changes in ocean CO source/sink function
1
with extreme conditions reccurring every few years. Lack of data makes
2
* This value represents an average weighted score of the environmental issues associated to the
it difficult to provide an average for the region but recent records
concern. For further details see Detailed scoring tables (Annex II).
indicate that such extreme conditions occur much more frequently
** This value represents the overall score including environmental, socio-economic and likely
future impacts. For further details see Detailed scoring tables (Annex II).
than before, placing much of the resource under pressure in terms
*** Priority refers to the ranking of GIWA concerns.
of availability (Payet 2003). On the other hand, pol ution impacts on
30
GIWA REGIONAL ASSESSMENT 45B INDIAN OCEAN ISLANDS
ASSESSMENT
31
freshwater resources are localised in areas of high urbanisation, and
Changes in water table
these impacts occur every day, with daily discharges of wastewater from
Comoros is heavily dependent upon groundwater resources, with over
domestic and industrial sources.
44 wells, while Mauritius and Madagascar are less dependent. Data on
changes of the water table on the Islands of Comoros were not readily
Environmental impacts
available so the extent of the impact could not be assessed. However,
Modification of stream flow
the changes in the water table are likely to result from over-extraction
Water resources in Madagascar, Mauritius and Seychel es are primarily
during the dry season. In Madagascar, information describing the
extracted from rivers on the main inhabited islands through the
status of water tables is equally scant and not available to make any
construction of dams and reservoirs.
conclusions. However, in Mauritius, where more data is available, over-
extraction of water tables does not seem to be a problem at present.
In Mauritius, 10 man-made reservoirs with a combined total gross storage
Out of the 840 smal wel s/boreholes and 92 dug wel s, 206 are presently
capacity of 70 mil ion m3 yielding some 265 mil ion m3 per year have been
in use mainly for domestic purposes (74 million m3 per year), and
built. Likewise, in Madagascar, several large dams have been built along
agriculture (16 mil ion m3 per year). Total annual recharge is estimated
the main rivers, thus not only affecting productivity of the flood plains
at 390 mil ion m3 per year. However, since most of the boreholes are fed
but also the proper function of the numerous lakes present on this large
by superficial water bearing formations in the recent lava flow series,
island (World Bank 1998). In Seychelles, due to the topography of the
within a depth usual y not exceeding 60 m, the yields of the exploited
Island it is not feasible to build any more dams along streams. Therefore,
boreholes decrease to about 25 to 40 % during the dry season when the
modification of stream flow occurs at a very low-scale. Water extraction
water table recedes to a range from 1 to 27 m depending on the location
from streams in Comoros is not a significant issue and does not pose a
of the boreholes (WRU, 1997).
problem at this time (World Bank 2000a).
La Digue, which supports a population of 2 000, is the only island in
Pollution of existing supplies
the Seychel es that depends partly on groundwater. There are large
Lack of consistent and long-term monitoring data prevents any sort
changes in the water table during the dry season due to over-pumping
of quantitative analysis of this issue. In fact, in Comoros data on water
to meet demand.
quality is not available but it is feared that there is contamination of
existing supplies mainly from wastewater and solid waste disposal.
Due to the dependency of the Islands of Comoros on groundwater, and
as a secondary source in Madagascar and Mauritius, impacts on the
In Seychel es, the pol ution load of major rivers ranges from 25.1 kg/day
groundwater system were considered more severe than modification
in rivers located within urban areas to 10.3 kg/day in areas located on
of stream flow in the region, particularly since groundwater treatment is
the fringe of urban areas (Payet 1999). In remote areas, pollution loads
very complex and costly. With changes in rainfal patterns in the region,
are likely to be much lower.
groundwater as a potential resource is very important.
In Madagascar, the lakes and rivers are threatened by generation of
Socio-economic impacts
high levels of suspended solids resulting from continued deforestation.
The impact on health varies across the region, mainly related to the
Intensive agriculture in some areas also leads to fertiliser and pesticide
availability of health services and differences in population. For example,
pollution of some water resources (Ranaivoson 1996).
Seychel es has the lowest population (~80 000), fol owed by Comoros
(~600 000), Mauritius (~1.2 mil ion) and Madagascar (~16 mil ion). This
Although samples of surface and groundwater meet the required
problem of scale made the analysis of number of people affected biased
physiochemical standards for drinking water in Mauritius and Seychelles,
towards the relative size of the country. Overal , the number of people
many samples from a number of hotspots have occasionally failed to
whose health is affected is not very high considering that most of these
meet the required bacteriological standards. In particular, wastewater
people have access to water. However, in Madagascar and Comoros less
contamination of potable water supply is an increasing problem in
than 50% of the population has access to treated water. The most serious
some areas. In Mauritius, intensive agriculture and industrialisation has
health problem related to water is the occurrence of cholera outbreaks
led to pol ution of existing water resources, especial y within the coastal
in Comoros and Madagascar, which leads to fatalities and disruptions in
areas (ERM 1999).
the economy of the countries (Table 14) (Bergeron 2001).
30
GIWA REGIONAL ASSESSMENT 45B INDIAN OCEAN ISLANDS
ASSESSMENT
31
Table 14 Main diseases by province in Madagascar.
Conclusions and future outlook
Due to Comoros dependency on groundwater, and as groundwater
is the secondary source of freshwater in Madagascar and Mauritius,
a
s
i
n
a
a
h
a
j
a
n
g
a
impacts on the groundwater system are considered more severe than
C
o
u
n
t
r
y
A
n
t
a
n
a
n
a
r
i
v
o
A
n
t
s
i
r
a
n
a
n
a
F
i
a
n
a
r
a
n
t
s
o
a
M
T
o
a
m
T
o
l
i
a
r
a
modification of stream flow in the region. This is especial y pertinent
Malaria (%)
25.8
19.1
17.9
18.9
49.1
27.7
23.3
since groundwater treatment is very complex and costly. With changes
Diarrhoea (%)
8.5
10.1
19.3
8.2
0.2
8.1
9.5
in rainfal patterns in the region, groundwater as a potential resource
ARI* (%)
23.3
31.1
14.1
36.3
16.6
16.7
19.3
is very important.
Other (including
42.4
39.8
48.6
36.6
34.0
47.0
47.9
wounds) (%)
* Acute Respiratory Infections. (Source: Bergeron 2001)
Disease outbreaks, especial y malaria and cholera, are huge health
problems in Madagascar and Comoros and are general y related to
Occurrence of cholera in Madagascar is also responsible for stopping
unsanitary conditions.
movement within 66 of the 111 districts in the country, with over
18 000 people infected and 1 070 deaths. So far there have been three
The outlook for this concern is unfortunately not optimistic. With
epidemics of cholera in Comoros; in 1975, 1998 and 2001. The most
population growth, land use change and unpredictable rainfall
recent outbreak of cholera lead to 1 246 declared deaths (Bergeron
patterns, the availability of water resources for the populations in the
2001). The recent outbreaks, two over a period of three years, were
region does not appear to be secured. In fact, as seen in Seychel es and
closely associated with poor sanitation and pollution of freshwater.
very soon in Mauritius, there has been a move towards desalination to
meet demand. Construction of more dams is seen as having a greater
In Madagascar, occurrences of diarrhoea among children are common
impact on the environment when weighted against the economic cost
during the rainy season, affecting as many as 25% of children during
of establishing desalination plants. However, desalination increases the
a typical epidemic and leading to several deaths. This is directly
country's energy burden, and since all the energy is imported, it thus
related to the quality of water consumed, hygiene levels and sewage
affects its economic performance in the long-term. No border conflicts
contamination (Bergeron 2001). In Mauritius and Seychelles, fewer cases
are expected to arise due to the separate nature of the water systems;
of diarrhoea are reported and are probably linked to poor personal
however internal conflicts with respect to uses of water may arise.
hygiene rather than poor water quality.
This is pertinent in areas where there are multiple uses of water, such
as for agriculture (irrigation), aquaculture (ponds), and hydropower
Lack of freshwater during the dry season impacts the local communities
(damming). Adequate planning and other mechanisms will be needed
in al Island States in the region, in that they have to rely on water
to address this concern.
brought in by trucks. In many cases, especial y in the rural areas, this
service is not available and the local community resorts to untreated
water sources, leading to unsanitary conditions and social disruption
(World Bank 1998). In both Comoros and Madagascar, cholera
epidemics affect community relations and also movement. This has
impacts on schooling and performance in other economic sectors such
as agriculture and fisheries. Produce from those regions affected cannot
be sold to other regions, thereby aggravating the loss of revenue to
the community. In the case of Madagascar, a cholera epidemic caused
economic losses to the region and eventual y the country. Over a
period of three months, no goods from Madagascar could be sold or
used (World Bank 1998). A cost estimate of these losses could not be
made. In Mauritius, a link was found between decrease in fish catch and
disposal of wastewater from three outfal s. The Government eventual y
awarded compensation to about 2 000 fishermen, and each received
about 2 300 USD based upon loss in catch over a period of 10 years.
32
GIWA REGIONAL ASSESSMENT 45B INDIAN OCEAN ISLANDS
ASSESSMENT
33
T
C
P
A
Pollution
I
M
wastewater treatment, over-application of fertilisers in agriculture,
intensive animal husbandry and industrialisation. In Seychel es, a
Pol ution from land sources, especial y from urban areas and agriculture,
study of eutrophication along the east coast of Mahe revealed that
is of great concern to the region. Mauritius for example, cultivates almost
nitrate, nitrite, and phosphate levels were elevated (according to
48% of its total land area and uses high amounts of fertilisers (ERM 1999).
Seychel es published water quality standards) throughout the area,
The Island uses on average 57 500 tonnes of chemical fertilisers per
with concentrations ranging from 0.4 to 0.5 mg/l, mean ammonia
year representing around 600 kg/ha and three times that of Western
concentrations at 2.39 mg/l, and sulphide at 0.02 mg/l (Payet 1999).
Europe. Analysis of groundwater revealed nitrate concentrations as high
High ammonia concentrations were observed from samples col ected
as 45 mg/l, which is the maximum international accepted in potable
close to river mouths and the main food processing areas, such as
water. The same applies to herbicides which also pose a threat to coral
the tuna-canning factory. BOD (5-day biochemical oxygen demand)
5
reefs and mangroves. Issues such as radioactive pol ution were not
and nitrate discharges for the city of Antananarivo (Madagascar) are
treated, as these do not occur in the region.
approximately 10 368 tonnes and 2 608 tonnes per year respectively.
In Mauritius, preliminary surveys indicate damaging nutrient levels in
Environmental impacts
numerous areas, which may have caused the development of six red
Microbiological
tides in 1996 at the Trou aux-Biches area in the northern tourist zone of
No data was available for Comoros, although it was considered that
the Island. Likewise, within the tourist area of Beau Val on Bay on Mahe,
the issue of microbiological contamination as a result of sewage is a
pollution loads (BOD ) average about 72 tonnes per year. However, no
5
growing problem. In Madagascar, statistics show that only 1.8% of the
nutrient-induced tides have ever been observed in the area.
population have access to some form of sewage treatment, with over
50% of the population resorting to "natural" land disposal of sewage
Increased concentrations of harmful algae have been observed
waste. At one particular beach the total number of coliforms has been
along the coast of Madagascar and have caused contamination in
found to exceed 100 000 per 100 ml. Surveys of coliform levels in the
marine species such as shark (Carcharhinus leucas), Sardines, mol uscs
Lagoon of Bain des Dames in Mauritius indicated that less than 80%
(Strombus gibberulus) and turtles (Ertmochelys imbricata, Chelonia mydas).
of the samples met the guidelines for primary contact, i.e. swimming.
This happens principal y at the start of the rainy season (from October
As a result, swimming at this beach has not been recommended
to April) in the southwest and northeast coast of Madagascar. High
since 2001. The pol ution source is a sewage outfal just outside the
nutrient levels as a result of heavy use of inorganic fertilisers are also
reef, some 200 m from the coast. Overal , the situation in Mauritius
a serious problem in Madagascar, Mauritius and Comoros, all of which
has improved with sewerage facilities provided for the main urban
have a highly developed agricultural sector (Figure 12).
areas. Likewise, in Seychel es, at least 78% of the population have
flushing toilets and septic tanks are the most common form of sewage
Chemical
treatment, although the most urbanised part of the Island (consisting
Chemical pollution is restricted within areas of heavy industrialisation.
of over 25% of the population) is now ful y sewered (Payet 1999). Only
Mauritius is the most heavily industrialised country in the region which
2% of the population is without proper sanitation facilities. Therefore,
explains the low regional score and weighting given to the issue. In
the microbiological and eutrophication problem is only significant in
certain rural areas.
At the regional level, the issue of microbiological pol ution has few
transboundary implications since the amounts generated are relatively
small. However, the impacts within the coastal and marine environment
should not be ignored since many areas are stil devoid of proper
wastewater treatment facilities.
Eutrophication
Figure 12 Fertiliser consumption in Mauritius and Madagascar
Evaluation of eutrophication was chal enged by the lack of data in
(1961-1999).
particular countries. Eutrophication is primarily a result of improper
(Source: GEO Data Portal 2003)
32
GIWA REGIONAL ASSESSMENT 45B INDIAN OCEAN ISLANDS
ASSESSMENT
33
the Seychel es, industries are mainly oriented toward food processing.
Madagascar is experiencing growth in its industrial sector, especial y
in the mineral processing area, with potential for significant chemical
pol ution in the near future. Chemical pol ution from port activities
was also considered an important issue for all countries in the region.
Data on insecticide consumption was only obtained for Madagascar,
Mauritius and Seychel es, showing a slow decline in use (Figure 13),
although more data is needed to confirm this observation. It is not
clear why there are large fluctuations in the imports of insecticides for
Madagascar.
In Mauritius, there are over 896 large industrial operations with 48
Figure 13 Imports of insecticides* in Madagascar, Mauritius and
industries producing textiles, 59 paper products, and 28 various chemical
Seychelles (1990-1998).
Note: * mainly chlorinated hydrocarbons, organo-phosphates, carbamates-
products. In contrast, Seychelles has no textile and paper industries and
insecticides and pyrethroids.
(Source: GEO Data Portal, ERM 1999)
only two smal industries producing chemical products. Nearly al the
chemical factories (textile dyeing, soap, detergents, dry cleaning, etc.) in
Mauritius are now found within sewered areas but in many areas reefs
disposal is virtual y non-existent, and wastes are often found scattered
have been destroyed as a result of discharge of untreated industrial
throughout the city and in both public and vil age areas. There is no
effluents. In Madagascar, effluents from a refinery constitute a major
treatment of solid waste; instead it is disposed of in open dumps which
source of chromium, phenol and sulphate pol ution in the coastal waters.
are expanding with the growth of the population.
In addition, it is estimated that metal processing plants dispose of over
1 274 tonnes of toxic sludge into the ocean every year.
Only 6% of solid waste generated in Madagascar is col ected on a
routine basis, with almost 52% of the population disposing of their
The long-term persistence and migration of some trace metals and
waste anywhere convenient. Within the coastal areas, most of the
other contaminants such as PCBs will have transboundary implications
wastes are disposed of, on or close to beaches and mangrove areas.
for the region, but due to lack of any form of oceanic data on such
Within Antananarivo alone, solid waste generation is estimated to be
pollutants, the conclusion is merely speculative.
about 65 700 tonnes per year.
Suspended solids
In Mauritius, all solid wastes are disposed in a sanitary landfill at Mare
The issue of suspended solids is important in al countries in the
Chicose (ERM 1999). Old open dumps have now been converted
region. The main source of suspended solids in Madagascar result
into transfer stations where the solid wastes col ected from different
from deforestation through slash-and-burn activities to convert land
communities are compacted before being disposed of at the
or aqriculture and the subsequent surface run-off (Ranaivoson 1996).
sanitary landfil . The estimated solid waste production increased
In Comoros, intensive agriculture in some areas is the primary source of
from 243 360 tonnes per year in 1992 to 279 240 tonnes in 1995. It is
suspended solids. In Seychelles and Mauritius, the primary sources of
estimated that by 2010, the amount of solid waste per year will increase
suspended solids are from construction and food processing activities
to 477 360 tonnes. Similarly in Seychel es, a nationwide solid waste
(especial y of fish products). In Madagascar, discharges of suspended
col ection service is in operation and, upon completion of a sanitary
solids from the Toliara region are estimated to be about 6 mil ion tonnes
landfil , the open dump located on the east coast of Mahe wil be
per year. Data from other countries is lacking.
converted into a full transfer station (Hydroplan 2003). Composting of
all the green (organic) wastes, which constitute more than 50% of the
Solid wastes
waste constituent, is also done on a commercial basis for both the local
The most critical issue for the States in the region is the growing problem
and export markets. In spite of these arrangements, littering and misuse
of solid wastes. Whilst Seychel es and Mauritius have developed some
of solid waste facilities is still evident in both Mauritius and Seychel es.
organised forms of solid waste management, it still remains a problem
Furthermore, with projected growth in solid waste generation and a
for these two countries as wel . In Comoros, waste col ection and
lack of space to create new disposal areas, new problems will emerge.
34
GIWA REGIONAL ASSESSMENT 45B INDIAN OCEAN ISLANDS
ASSESSMENT
35

are very low in some states. For example, in Madagascar, only 1 to 3% of
public funds are spent on improving basic sanitation facilities. The cost
of waste management in Seychel es is about 6 mil ion USD, primarily
due to the high cost of labour and fuel. The total cost of waste col ection
in Mauritius is about 78 mil ion USD per year (ERM 1999). Disposal
costs are also quite expensive at about 200 USD per tonne, but this is
weighted against losses in tourism, which are likely to be much higher.
The building and commissioning of a wastewater treatment plant with
a capacity of 1 500 m3, comprising of an activated sludge process and
a clarifier, can cost between 50 000 and 100 000 USD.
The financial impact on industries and local government to invest in
Figure 14 Giant Tortoise on the beach of the World Heritage Site
cleaner technologies in order to abide by existing standards for discharge
Aldabra.
of effluents is an important issue in Seychel es and Mauritius. For example,
(Photo: Souter 2001)
with the construction of every new hotel, a wastewater treatment plant
A growing problem with important transboundary implications is
that meets the stringent effluent discharge conditions must be built. The
disposal of solid wastes at sea, either formal y or informal y. Recent studies
existing establishments are given time periods in which to make such
and observations indicate a growing amount of marine debris, which
investments. The costs of clean-up are also quite high. For example, in
has an impact on marine life and also on distant islands. For example,
Mauritius, it cost a group of private sector operators over 200 000 USD to
Aldabra, a World Heritage Site (Figure 14) with no local population,
clean up a site (area 0.1 km2) they had pol uted.
receives considerable quantities of solid wastes in the form of marine
debris, which washes up on the island every year. With no viable method
The occurrence of red tides (toxic algal blooms) is currently associated
to dispose of these wastes, this island sanctuary is threatened by this
with yearly seasonal patterns, but could become more pronounced if
transboundary issue. Furthermore, there are no dedicated port waste
the issue remains unaddressed. Red tides have a direct impact on both
reception facilities within the region.
fisheries, leading to loss of saleable fish catch, and tourism. The impact
of oil spil s can be catastrophic, especial y since al states are located
Spills
within this high-risk area.
Each if the four island states in the region is located within a region
of high crude oil traffic between the Gulf States, Africa and Europe,
Solid waste is the primary pol ution issue in the region that affects
but so far no major spills have been reported (GEF 1999). Tar balls
a large number of the population, especial y in those areas where
deposited on beaches in Comoros, Madagascar and Seychel es have
solid waste management is non-existent. Improper disposal of solid
been reported on a yearly basis. There have also been various local
waste creates breeding environments for vermin such as cats, dogs
spill events, especial y related to refined petroleum products and, to a
and rats which may, in turn, be vectors of deadly diseases such as the
limited extent, other dangerous cargo. The extent and impacts of these
plague, leptospirosis, scabies and other tropical scourges. In some
spills are rarely assessed and documented. However, such spills can
areas, particularly in Comoros and Madagascar, children also use such
potential y have serious consequences on the natural coastal habitats
dumps as playgrounds. An emerging danger is the disposal of hospital
and species, as well on the economies of the region.
contaminated wastes and industrial wastes within urban areas where
children and human scavengers can have access to these wastes.
Socio-economic impacts
The impacts of pol ution in the region are felt in both the short-term
Disposal of solid wastes, especial y containers, are also a source of
and long-term and some pol utants also have a transboundary context.
mosquito population explosions in al four countries of the region.
The tourism industry will be particularly affected by pollution and this
However, Madagascar and Comoros are worst affected, due to the
already constitutes a problem in Comoros. In Seychel es, much money is
presence of the malaria in those countries. In 2000, only 30.3% of
spent on public education on solid waste disposal, as tourism is critical
children in Madagascar had access to a mosquito net, and only 0.8% of
to the country. Investments in infrastructure to handle these problems
the nets are specially treated with pesticide. Countries like Seychelles
34
GIWA REGIONAL ASSESSMENT 45B INDIAN OCEAN ISLANDS
ASSESSMENT
35


and Mauritius, although not subject to the deadly disease, are at serious
development of appropriate mechanisms and adequate transfer of
risk since the mosquito vector is present in both countries.
technology. Therefore, the future outlook appears positive provided
there is political commitment. This issue is further investigated later in
Disposal of human waste on the beaches in Madagascar also creates
the report (see Priority concerns).
a serious respiratory ailment termed Acute Respiratory Infections (IRA)
and frequent skin rashes. In Mauritius, two public beaches were closed
for swimming as a result of high levels of coliform bacteria. These two
T
C
beaches were located close to effl uent outfal s.
P
A
Habitat and community
I
M
modification
In general, the social and community implications of these issues is
both diffi cult to evaluate and adequately address. The majority of the
Since there is signifi cant human pressure on the main ecosystems
population is aff ected by pollution. The universal habit of littering and
described, it was concluded that the risk of species extinction is high.
disposal of domestic wastes in every drain is one of the largest problems
The risk of introduction of invasive species is also a concern, which may
to overcome in the area. The severity of the problem is therefore far-
aggravate this situation. In many cases, it is very diffi cult to distinguish
reaching and fundamental to any potential solution in the future.
between loss and modifi cation of habitats, given the data that is
available. Thus, the most important biotopes are discussed separately
According to traditions in Madagascar, it is not acceptable to place toilets
without specifying loss versus modifi cation.
within houses and instead they are built as separate constructions. Due
to increases in population density, many of these dwel ings do not have
Environmental impacts
proper facilities and, as a result, dispose of their human wastes in other
Coral reefs
places on the beaches and in mangroves swamps. During high tides
Coral reefs, being important in both rural and national economies, are
human faeces can be observed accumulating in several areas.
severely stressed as a result of human activities, compounded by the
recent eff ects of the 1998 Indian Ocean mass coral bleaching event.
Conclusions and future outlook
A recent global survey (Bryant et al. 1998), indicated that at least 25%
Clearly, as indicated before, pol ution in the region wil probably increase
of the coral reefs in the region were at high risk of degradation from
as a function of the growth in population and the lack of appropriate
human activities (mainly within the Comoros area), 28% at medium risk
infrastructure investments to treat the pol ution to an acceptable
(mainly within the Madagascar and Mauritius areas), and 47% at low risk
standard. The analysis demonstrated clear linkages between the health
(mainly within the Seychel es area) (Figure 15).
of the population and the levels of pol ution, so it is important that
appropriate decisions are taken as this environmental issue is linked to
the al eviation of poverty in these island states.
Although there seems to be an adequate legal framework, existing
laws are not enforced, resulting in non-compliance. Besides legal
mechanisms, economic incentives wil need to be explored to
encourage private sector and public contribution to pol ution
abatement in the respective countries.
The analysis also concluded that solid wastes and its related impacts
constitute the biggest threat, in terms of social, environmental
and economic wel -being to the countries in the region. A strong
transboundary link was also deminstrated as waste is routinely dumped
into watercourses and the coastal environment where it can be carried
thousands of kilometres in the ocean, aff ecting biodiversity, fi sheries
Figure 15 Indicator-based map of reefs at risk.
and tourism. However, the problem can be addressed through the
(Source: Bryant et al. 1998)
36
GIWA REGIONAL ASSESSMENT 45B INDIAN OCEAN ISLANDS
ASSESSMENT
37
In Comoros, the skeletons of coral colonies are still used in construction
Wetlands (saline and freshwater)
of houses and sold to tourists as curios. It is estimated that a total of
Wetlands, including mangroves, are not very extensive in the region
1 200 tonnes of coral are extracted every year. Whilst the coral reef
except in Madagascar. In Comoros, the mangroves are exploited for
supports fisheries, reef-based tourism is also on the increase.
timber and other uses. Current mangrove stands exceed 3 000 ha.
In Madagascar, mangroves cover an estimated area of 340 000 ha,
Madagascar has wel developed reefs, covering over 20% of its extensive
especial y on the western side of the Island. Mangroves provide the
coastline. Surveys in 1996 identified 1 250 villages dependent upon the
community with an important food and material source. For example,
reefs for fish (FAO 1999). A total of 22 000 small boats were found to be
local people make use of its wood for cooking, construction, boats,
in operation, landing over 70 551 tonnes of reef fish in 2001. Reefs face
its leaves for medicinal purposes and as fodder, and its bark for
a number of threats in Madagascar such as high sedimentation levels
dyes. Freshwater aquaculture is an important activity in Madagascar,
from the rivers, pollution from agriculture and industries, sewage and
estimated to cover about 50 000 ha. However, these activities have not
solid waste discharges along the coast, pol ution from commercial port
been sustainable. In Toliara, for example, of the 45 500 ha of wetlands
operations, use of poison in fisheries, coral extraction for construction,
that have been described, most have been destroyed as a result of over-
and col ection as tourist souvenirs (Cesar 2000).
harvesting for wood.
The coral reefs in Mauritius are heavily used by the traditional fishing
sector and increasingly by tourism. In particular, reefs close to tourist
beaches are affected by trampling. Fishermen and tour operators also
routinely damage reefs with anchors, traps or boat poles. Pol ution
from both urban, tourism and industrial sources also affect the health
of the reefs.
Coral reefs in the Seychel es range from the inhabited granitic islands to
the isolated coral atol s. Human pressures on the granitic islands include
Figure 16 Land reclamation in Small Islands States such as
reclamation, reef damage by anchors, and in some areas impacts from
Seychelles provides opportunity for housing, hotel and
tourism and urban sewage. However, most of the distant coral islands
industry developments.
(Photo: Souter 2003)
are still free from direct human pressure, and thus much of the corals
were still in pristine state until the 1998 bleaching event.
In Seychel es, wetland areas, including mangroves cover only 150 ha.
Apart from supporting important ecosystems, they also play a role in
Bleaching occurred as a result of increased sea surface temperatures
flood control on the flat coastal plains. However, wetlands have been
that persisted for several months in 1998. Comoros experienced over
reclaimed for agricultural use, and whilst this practice has stopped
55% coral mortality, Madagascar 30% and Mauritius 1 to 15%. Seychelles
there is now increasing pressure for reclamation for housing and hotel
was perhaps the most severely affected, with live coral cover on the
development (Figure 16).
granitic islands reduced to less than 10% in some areas (Linden &
Sporrong 1999).
In view of these increasing pressures the ecosystem can be classified as
highly threatened in the region.
On the basis of this analysis, coral reefs were deemed highly vulnerable
ecosystems and continue to suffer from the devastating effect of
Standing waters
human pressure on these reefs, and also the recent 1998 bleaching
Standing waters, such as lakes, are important ecosystems in Madagascar.
event (Linden et al. 2002).
These are exploited for freshwater fish with almost 40 000 tonnes
harvested every year. Fringe vegetation is also harvested for
Information on associated ecosystems such as seagrass beds is very
construction. In view of these pressures and the constraints in water
sparse, and the ecological status in the region could not be determined
resources outlined in the assessment of Freshwater shortage, it is
(Gul ström et al. 2002).
concluded that human pressure on this ecosystem is especial y
significant in Madagascar where it serves several uses.
36
GIWA REGIONAL ASSESSMENT 45B INDIAN OCEAN ISLANDS
ASSESSMENT
37
Pelagic
The impacts on health are not direct, but rather affect food availability,
The status of pelagic fish in the region is difficult to account for since
population pressures and nutrition. However, only a medium proportion
they are usual y highly mobile species. Research in Seychel es between
of the population is affected, especial y those living below the poverty
1989 and 1994 shows fluctuations in catch rates, but with a general
line and children. The degree of severity is not deemed high, as other
trend indicating depletion of the resource (Mees et al. 1998). This is
forms of substitute food sources are available and, in some cases,
especial y critical as the pelagic fish stock not only depends upon
cheaper. For example, in Mauritius, 1 kg of fish costs 4 USD compared
the national approach to management, but also upon the regional
with 1 kg of poultry which is 2 USD. The frequency of health impacts
approach. This issue is investigated further in the assessment of
are heightened during periods of drought or rough/colder seas, which
Unsustainable exploitation of fish and other living resources.
increases fishery catch effort, pushing fish prices up, and subsequently
affecting the daily diet of poor families. An unbalanced diet can lead
Socio-economic impacts
to malnutrition.
In general, modification and loss of habitats results in economic
losses in several areas, which is sometimes neither accounted for nor
Food security in the region (being geographical y isolated) and the
observed. Taking into consideration the relative size of the population
dependence of the communities on local sources of food, such as reef
and economy of each island, the economic impacts can be rather large,
fisheries and mangrove products, implies a direct link of ecosystem
although the target of impacts is fairly specific in some areas, especial y
health to human health. This is an important issue in the region
with respect to coastal ecosystem services. The frequencies of those
as it affects economic performance in terms of productivity and
impacts were determined to be continuous, but more intense during
also leakages due to increased food imports. For example, in 1998,
certain seasons of the year. Losses of habitats in the region would
Madagascar and Comoros obtained 26 000 and 3 600 tonnes of food
result in:
aid, respectively.
Loss in tourism and related activities;
Loss of food, medical and construction resources;
Community impacts in the region are subtle and not very well
Loss of foreign investment;
documented. These impacts centre on social integrity, movement
Increase in conflicts between the communities;
and competition/conflicts. Social values is affected as a result of loss
Loss of archaeological sites;
of unique biodiversity in some areas. Loss in potential ecotourism
Increase of other problems such as erosion;
services as well as medicinal value of certain species is also an
Reduced ability of habitats to recover.
significant impact. Degradation of ecosystems and habitats also
leads to major population movements in the region, either to the
Reef fisheries contribute about 43% of Madagascar's total fish catch and
coast, into other unaffected areas, or into urban areas. Social conflicts
are an important source of food and also foreign earnings (20% of total
and competition increase with population growth, with erosion of
catch is exported). Therefore, a col apse of the reef ecosystem will have
the traditional values and most importantly reduction in output from
a huge impact on both domestic and foreign earnings from fisheries.
the ecosystem.
Continued exploitation of current mangrove stands wil lead to loss
of several ecosystem services such as food, habitats for other species,
In Comoros, more than 70% of the population uses forest wood for
construction materials and medicinal uses. It has been estimated that
cooking, mangroves for construction and boat building, coral for
direct monetary losses from loss of mangrove habitats amounts to
construction, fish as a staple food, and plants for medicinal use. In
600 USD per ha, or 204 million USD per year.
Madagascar, migrations of smal communities to more productive
areas are often the cause of social conflicts, such as access to living
Both Mauritius and Seychel es depend heavily on the tourism sector
areas and resources to sustain their livelihood. Social integration is a
for economic development and prosperity and, in turn, tourism
concern especial y with regard to custom and norms, and access to
depends on the quality of the environment. Degradation of the coral
coastal resources. This has an overal effect on the GDP per capita, as
reefs would be especial y detrimental to the diving industry. A study
almost 40% of the population depends directly on coastal resources in
in the Seychel es quantified the economic benefits of biodiversity to
Madagascar. The purchasing power decreased by 15% between 1993
Seychelles as being about 0.3 bil ion USD, compared with the economic
and 1997 among the rural people, who are heavily dependent upon
costs of 40 million USD (Shah et al. 1997).
those ecological resources.
38
GIWA REGIONAL ASSESSMENT 45B INDIAN OCEAN ISLANDS
ASSESSMENT
39
The main areas of community conflicts are:
Environmental impacts
Between local people (e.g. fishermen) and migrants;
Overexploitation
Between local (smal -scale) and industrial (large-scale) operators;
Existing trends in catch and demand for fish resources indicate a
Between traditional land access rights and new land owners/users.
continuously increasing pressure in the region. With catches declining
in some areas, fishermen are moving into other areas. The number
Costs for loss of ecosystems are not placed upon local communities,
of fishermen relative to length of the coastline is also high in some
but upon the local government or the private sector. For example, in
countries; Madagascar 17 per km, Comoros 26 per km, Mauritius 53 per
Mauritius, fishermen have in many instances won compensation for loss
km, and Seychel es 3 per km. Products from high value fisheries, such
of fisheries as a result of decrease in productivity which the fishermen
as tuna and shrimps, are exported and there is a growing trade in sea
claim was a result of other developments such as tourism.
cucumber and shark fin to East Asia which is increasing existing pressure
and also affecting the functioning of the entire marine ecosystem.
Conclusions and future outlook
The inability to monitor movement of fishermen makes it difficult to
The impacts of human activities on ecosystems are very high and
determine the level of exploitation of a resource in a particular area, but
increasing in the region as demands are placed upon these ecosystems.
fishing effort/movement as a proxy indicator can give an indication on
In Madagascar and Comoros, poverty has kept the dependency of the
the status of the fishery resource within the region.
population on the natural resources very high, whereas in other states,
other options for food, construction materials and energy exist.
Overexploitation is common for high value species, such as shrimps,
sea cucumber and some demersal species. For example, along the
Whilst fishery demands increase, growth in tourism also places additional
west coast of Madagascar, the Maximum Sustainable Yield (MSY)
pressure on these sensitive ecosystems. The region has a high biodiversity,
determined for the shrimp fishery is 12 000 tonnes (2000), but a total
but human intervention at al levels (including the catchment area and
of 11 959 tonnes was harvested in 2001, implying that the fishery is
the marine environment) has pushed such ecosystems into isolated
most likely being exploited beyond its MSY, assuming there is under-
pockets of fragmented habitats. A growing network of protected areas
reporting. Total fishing effort increased by up to five times during
may al eviate the problem in the short-term.
the period between 1977 and 1994. In Seychel es, the reef fishery is
currently ful y exploited in the granitic islands, although present catch
Existing ecosystems are also threatened by invasive species and
levels are well below the MSY. Mauritius recorded a decline in fish catch
increasingly by changes in the Earth's climate. Recent mass coral
per fisherman day (FCPFD) from 5.2 kg in 1986 to 3.6 kg in 1989. The
bleaching events have left most reefs in the region in a dilapidated
current average FCPFD for reef fish is 4 kg.
state. There is increasing evidence which indicates that such events may
occur more frequently in the future (Hoegh-Guldberg 1999).
In Comoros, export of live fish has increased to about 750 fish per week
and is growing. Overexploitation of certain species e.g. turtles, results
in a decrease in the population and may lead to a complete extinction
of the species.
T
C
P
A
Unsustainable exploitation of
I
M
fish and other living resources
Excessive by-catch and discards
By-catch is not a serious issue in Comoros, but in Madagascar, it is
This concern is probably the most variable and has the most
estimated that at least 75% of the by-catch is not landed but disposed
transboundary implications across the region, which is indicated by the
of at sea. In Seychel es, by-catch and discards are most common in the
overal score for the concern which is the regional average rather than a
industrial tuna fishery where as much as 25 to 30% of the catch is by-
regional consensus (Table 13). For example, in Comoros, overexploitation
catch. The domestic fishery does not generate by-catch or discards.
is a severe issue whereas excessive by-catch is more or less non-existent,
A growing concern in the region is the discarding of shark carcasses
in contrast to Seychelles, where overexploitation is not a major issue but
after fining. Shark flesh has little market value and is therefore often
excessive by-catch is.
discarded at sea. The issue of by-catch is therefore associated with more
industrial forms of fishing and shark fining, al of which may become
important fisheries in the region.
38
GIWA REGIONAL ASSESSMENT 45B INDIAN OCEAN ISLANDS
ASSESSMENT
39
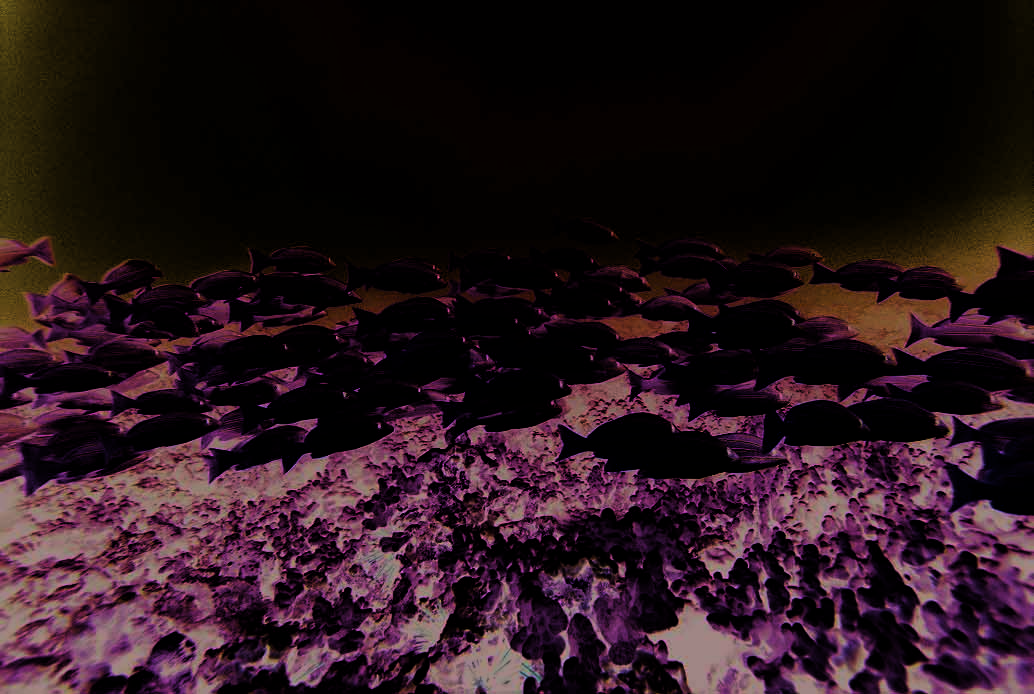
Figure 17 Bluestriped snapper.
(Photo: Getty Images)
Destructive fishing practices
Impact on biological and genetic diversity
Destructive fishing practices are causing severe impacts in some
The impact of fishing practice on biological and genetic diversity is
countries (Comoros) and much less severe in others (Seychel es). Thus,
manifested in two main areas: complete extinction of a species or
an average score was assigned to the issue as no regional consensus
complete destruction of the habitat for the species. Whilst the former
can be made (Table 13).
is unlikely to occur on a more longer term (except maybe in the case
of some species of turtles, sea cumbers, and crustaceans, which are
Destructive fishing is a common practice in Comoros despite awareness
heavily exploited and have unique life cycles), modification of habitats
campaigns. Fishing with dynamite constitutes a danger to coastal
that support the fishery critical y undermines the viability of present
ecosystems. Fishing at low tide also increases trampling of coral reefs. Cloth
fisheries, including the fish reproduction and food sources. Pol ution,
and net fishing are a threat to biodiversity as smal fish are also captured. In
which also affects organisms at the bottom of the food web, and
Madagascar, destructive fishing principal y occurs in the mangroves using
physical destruction, which destroys the habitats, is the major source of
mosquito nets, and in shal ow reef areas through trampling, dynamite
this impact. However, when considering the overall picture, only some
and poison, overturning of corals, and gear entangling and destroying
areas are affected, with potential for restoration and re-introduction of
the corals. In Mauritius, the only mode of destructive fishing practices is
lost species.
through seine netting, whereas in Seychel es, destructive fishing practices
are isolated to a few cases of fishermen using gil nets on coral reefs.
Transboundary impacts on the biological and genetic diversity include
introduction of invasive marine species, primarily from tanker bal ast
Decreased variability of stock
water.
Information linking the health of aquatic organisms and sources of pol-
lution is virtual y non-existent in the region. However, it is a relatively
Socio-economic impacts
important cause of col apsing fish stocks in the region. Recent studies
Artisanal fishing in the nearshore coastal waters and shal ow shelf seas
on the impacts of coral bleaching showed no significant decrease in
employs 80% of al people involved in fisheries, and is an essential
reef fish abundance soon after a bleaching event, but this may affect
and conservative component of coastal communities. Estuarine and
fish stocks in the long-term.
lagoon fisheries in particular, have a major socio-economic importance.
40
GIWA REGIONAL ASSESSMENT 45B INDIAN OCEAN ISLANDS
ASSESSMENT
41
Damaging fishing practices (bleaching, poison or dynamite) are still
Fishing is stil a community-based activity throughout the region, so
being used in Mauritius and Madagascar. In addition, the increasing
a negative impact on fish stocks wil affect the families involved and
demands for wood for fuel and housing has placed pressures on
also increase conflicts and fishing pressure. It is observed that many
mangrove forest in the region, mainly in Madagascar (Lebigre 1997) and
communities resort to destructive fishing practices, contrary to their
Comoros. All these factors have caused diminishing returns from these
traditional practices to reduce catching effort and also amount of
shal ow seas. The severe El Nińo event of 1998 resulted in numerous
catch. Through loss of fisheries, the fishery community wil also lack
coral reef areas bleached with little prospects of regeneration. These
the necessary funds to purchase other goods and services, and once
events raise alarming concerns for the future of the coral reefs and
again turn to other habitats for exploitation. Changes in government
the many communities that depend on these reefs to sustain their
policy, with respect to access in its attempt to control exploitation, may
livelihood. Some recovery of coral communities has been observed and
also lead to increased conflicts.
no decreases in fish catch have been reported (Linden et al. 2002).
Conclusions and future outlook
The economic impacts of overexploitation of fish in the region are
Fisheries are probably the most critical and complex transboundary
significant since the region depends on these fishery resources for
concern in the region but, due to a consistent output of the fisheries,
basic food supply, for export and also an increasing tourism activity
in contrast to the col apses observed in the Atlantic, it is not viewed as
(for fishing and for diving/snorkel ing). Although cost and revenue
being highly critical. Whilst some stocks appear to be healthy, it is clear
figures are not available for many of the uses, the size of the economic
that, in the majority of the fisheries, especial y the reef fisheries, there is
sector and also the community that is affected is large and continuous.
serious overexploitation.
Price indices indicate that the cost of fishing is increasing which may
be related to the fishing effort and limited supply of fish resources. In
Fisheries support the region from an economic perspective and any
Comoros, the main fishery is artisanal and 72% of the catch is comprised
col apse in the fisheries will seriously affect the quality of life. Efforts to
of pelagic species. In addition, the cost of fish is 0.3-0.8 USD/kg which
eliminate destructive fishing practices should increase.
is low as compared to meat, which is about 2 USD/kg. Revenue from
fisheries in 1995 was about 2 million USD.
The future of the fisheries in the region is unknown and more studies are
required to understand the viability of existing stocks and how they can
In Madagascar, 20% of the fish is exported. This includes high value
be managed sustainably. Without these options, it is likely that fisheries
fisheries such as tuna and shrimp which are exported and earned the
in the Indian Ocean wil suffer the same fate as those in other parts of
country 90 million USD in foreign exchange in 2001. However, shrimp
the world.
trawling poses a big threat to this type of fishery, thus undermining
the future sustainability of this revenue source. In both Seychel es and
Mauritius, fishermen receive special concessions such as no license fees,
T
C
cheap fuel and soft loans. However, the price of fish has increased over
P
A
Global change
I
M
the last 10 years, primarily reflecting the increase in fishing effort. In
Seychelles, fish costs about 2-8 USD/kg, and in Mauritius, 2-5 USD/kg,
The impacts of global change under present conditions are often very
depending on the species.
difficult to qualify, much less quantify. Since global change superimposes
itself on current variability, it takes sufficient data and information to
The direct health impacts of fisheries include the health benefits of fish
evaluate the real impacts of global change under present conditions.
consumption, and the assumed saving in medical costs that would arise
from consumption of other less healthy meat products. However, fish,
Environmental impacts
particularly pelagic species, are also known to have trace pol utants,
Changes in the hydrological cycle
such as DDT, and also harbour heavy metals such as mercury. Diseases
Current data are inadequate to determine whether there is a change
arising from fish consumption are not very common, except for the
in the hydrological cycle. However, the region has experienced several
toxicity in fish caused by a dinoflagel ate, ciguatera. Ciguatera is known
abnormal and extended periods of drought and weather extremes over
to occur throughout the region, but is more common in Mauritius and
the last five years, leading many to believe that there is indeed a change
Madagascar (Quod et al. 2000).
in the hydrological cycle.
40
GIWA REGIONAL ASSESSMENT 45B INDIAN OCEAN ISLANDS
ASSESSMENT
41
Paleo-climatic conditions of the Indian Ocean point to the fact that
Comoros and Seychel es, several beaches have been eroded as a
during the late Triassic, the Inter-Tropical Convergence Zone also had
result of increased wave intensity and abnormal tidal ranges. In many
an influence on climatic conditions. Furthermore, sedimentological
situations, the effect of sea level rise is to accelerate the degradation of
evidence supports the hypothesis that drier rather than wetter
coastal environments that are already affected. This is likely to be the
conditions prevailed during the late Pleistocene period. Recent coral
most serious impact since a large proportion of the population and the
reef core samples indicate a strong relationship between the El Nińo
economic sectors are located on the coastal plains and therefore wil be
phenomenon and the Indian Ocean. Historical y, occurrence of drought
worst affected by sea level rise. Table 15 provides an indication of the
in this region of the world also coincided with La Nińa years. These
expected changes in temperature and precipitation, essential indicators
events have now been correlated to reduced agricultural output and
of changes in weather and wave patterns.
scarcity in water resources, i.e. rivers exhibiting significantly reduced
flows compared with long-term averages. Consequently, it was
Changes in ocean CO2
concluded that a change in the hydrological cycle would indeed have
No information was available on CO flux and fate in the region, or even
2
a marked impact on the agriculture and water supply sector.
the Indian Ocean. However, based upon theoretical evidence, increases
in atmospheric CO concentrations will have implications for coral reef
2
Sea level change
stability and wil also disrupt fisheries and climatic patterns in the region.
Likewise, lack of appropriate long-term sea level monitoring stations in
The rate of calcification in corals and, as a consequence, reef growth
the region precludes making any informed conclusions about sea level
will decrease because of the decreasing availability of carbonate in sea
change under present conditions. However, considering increases in
water resulting from increasing levels of CO in the atmosphere (Souter
2
coastal erosion and morphological changes to the coast, which can be
& Linden 2000). This is expected to further compromise the structural
associated with natural processes, an evaluation of how sea level rise
integrity of coral reefs and cause further impacts along the coast.
would impact the region could be made.
Socio-economic impacts
Sea level rise projections of 0.5, 1.0, 1.5 and 2.0 m have been used
Since the island nations of the region are geographical y isolated, any
in case studies for Mauritius (IPCC 2001). The major impacts of sea
shortage in water will need to be met either by transport of water from
level rise in Mauritius are land loss, erosion of beaches, damage to
another location or production of water within the country. As a result
coastal infrastructure, degradation of coral reefs and loss of wetlands.
of the recent droughts, both Seychel es and Mauritius have invested in
In Madagascar, the effects of sea level rise are not observed, but in
desalination plants to meet demand during the dry season. Changes in
the hydrological cycle will also affect agricultural productivity.
Table 15 Summary of projected changes in temperature and
precipitation for Small Island States in the Indian Ocean
In August 1998, Mahe (Seychel es) recorded the highest rainfal in 26 years,
over the next 50 to 100 years as inferred from AOGCMs.
when 694.1 mm of rain fel within a 24-hour period. Two young men lost
GHG*
GHG+A**
their lives in the rainstorm and the extent of the damage was estimated
between 3 to 4 mil ion USD. The highest previous record for August was
Period
Annual mean temperature change (°C)
371.6 mm in 1985 when, again, torrential rain created widespread damage.
Whilst such changes are often described as one-off events, they indicate
2050s
2.10 (±0.43)
1.64 (±0.23)
how catastrophic changes in the hydrological cycles can be.
2080s
3.16 (±0.89)
2.61 (±0.65)
Except in Madagascar, the majority of the population in the region lives
on the coastal plateau, which is not more than 2 m above mean sea level.
Period
Annual mean precipitation change (%)
The main economic effects of sea level rise wil be loss of infrastructure,
2050s
3.1 (±4.5)
1.6 (±3.9)
services, and use of the property, which has been eroded or flooded.
2080s
5.1 (±4.3)
4.3 (±4.9)
In Madagascar, the number of sites and frequency of beach erosion
Note: Numbers in brackets show standard deviations of modell projections.
has increased considerably over the last decade (Toradec 2000). After
Atmosphere-Ocean General Circulation Model (AOGCM).*Green House Gases. **Green House
Gases and Aerosols. (Source: IPCC 2001)
the passage of cyclone Dina in January 2002, five more sites have
42
GIWA REGIONAL ASSESSMENT 45B INDIAN OCEAN ISLANDS
ASSESSMENT
43
been added to the list. Erosion up to 2 m has been recorded and, in
In the future, global change will have severe impacts, if current trends
some areas, whole beaches have been lost. Protection works currently
are not curbed by rapid and expedient interventions. Substantial
being undertaken cost approximately 0.1 to 0.2 mil ion USD per km
attention is needed to address this issue.
depending on the works required and remediation works are likely to
be even more costly.
Global change wil have several levels of impact on the region. Under
Priority concerns
present conditions, it is very difficult to relate health impacts to global
change, as the relationship is likely to be indirect, except for the case of
Based upon the analysis of the main issues, it was concluded that the
extreme weather conditions which destroy life or cause propagation of
most severe concern for the region was Pollution. The concerns were
water-related diseases. Evidence from other case studies indicate that
ranked in descending order of severity:
global change issues will cause human population displacement as a
result of the loss of coastal land, loss of jobs and economic opportunities,
1. Pollution
loss of private and public property, loss of traditional sites and memorial
2. Global change
grounds, loss of biodiversity critical to community support, and loss of
3. Habitat and community modification
livelihood (IPCC 2001). In fact, the sea already threatens some towns
4. Unsustainable exploitation of fish and other living resources
in Comoros, and coastal protection works are being undertaken. In
5. Freshwater shortage
addition, some cultural and archaeological sites have also disappeared.
Supporting evidence was obtained from the African Environment
The social impacts of sea level rise wil cause migration and
Outlook (AEO) assessment (UNEP 2002), the GEF MSP Sub-Saharan
displacement of the population. Those that can afford it will be able to
African Project: Development and Protection of the Coastal and Marine
leave the country but many wil have to seek alternative housing further
Environment in Sub-Saharan Africa (which include reports for Seychelles
inland. Since most of the economic activities are located on the coast,
and Mauritius only by Dulymamode et al. 2002 and Jones et al. 2002,
sea level rise will cause loss of jobs and economic opportunity leading
respectively), and the Nairobi Convention Transboundary Analysis
to serious social problems within the communities. Loss of property
Assessments (UNEP 1998). All these reports conclude that pollution is
wil also probably cause an increase in the value of property as available
one of the priority areas in the region. These reports also single out the
land becomes more scarce. Beach loss will have a significant impact on
issue of solid wastes as a common problem in the region, but no in-
jobs in the tourism sector.
depth analyses or policy option analyses have been conducted. Below,
the impacts of the two priority concerns (Pollution and Global change)
Conclusions and future outlook
are summarised fol owed by a comprehensive overview of the solid
Global change is indeed very complex and much more research
waste issue in the region.
is required before conclusive statements can be made. However,
as concluded by IPPC (2001), there is now clear and discernible
Pollution
evidence of changes in the climate which are likely to cause serious
The regional assessment concluded that pol ution is a priority
modifications to the Earths functioning over the next 50 to 100 years.
that should be addressed in the context of transboundary waters
The report concludes that the areas most affected will be island states
assessment. Among al of the issues considered, the problem of
and countries which are least developed. This includes al countries
solid wastes (both land-based and marine-based) was considered to
comprising the Indian Ocean Islands region.
be most critical in the Indian Ocean Islands region, with important
transboundary implications.
Because coral reefs are extremely vulnerable to increases in sea
temperature, as illustrated by recent mass bleaching events, mounting
The issue of microbiological pol ution is also important at national
research evidence points to these complex ecosystems as the litmus
level, especial y in non-urbanised and coastal areas, which tend to
test for global change. Since they are among the most diverse and
be devoid of proper wastewater treatment facilities. Linked to these
productive biological systems on Earth, the effects will be catastrophic
issues is the problem of eutrophication caused by both raw sewage
to many coastal states.
and over-application of fertiliser in agriculture, intensive animal
42
GIWA REGIONAL ASSESSMENT 45B INDIAN OCEAN ISLANDS
ASSESSMENT
43

husbandry and industrialisation. Chemical pol ution is relatively low
that this issue should not be taken lightly, as some of its effects are
and restricted within areas of heavy industrialisation. However, the
already being observed in the region.
long-term persistence and migration of some trace metals and other
contaminants such as PCBs wil have transboundary implications for
The impact of global change on the socio-economic development of
the region. The sources of suspended solids vary between countries
the countries in the region has not been calculated but is estimated
within the region, but it was concluded that they are linked to improper
to be high, with losses in infrastructure and services the most severe.
agricultural activities, slash-and-burn activities, improper construction
Furthermore, there are large concentrations of population along the
and effluent discharge. The risk of an oil spill was considered very high,
coastline that would be affected by global change.
although no major spil s have yet been reported.
Under present conditions it is very difficult to assess the health impacts
The region wil continue to be economical y affected by pol ution,
of global change, as the effects are likely to be indirect, except for
especial y in areas that are important for tourism. The financial impact
the case of extreme weather conditions which destroy life or cause
on industries and local government to invest in cleaner technologies
propagation of water-related diseases.
in order to abide by existing standards for discharge of effluents is also
an important socio-economic issue that needs to be addressed if the
The social impacts of sea level rise wil cause migration and displacement
problem is to be solved.
of the population. The prognosis for this environmental concern is
strongly negative, especial y in view of the uncertainty and the lack of
Pol ution also has significant impact on human health in the region,
adequate response by developing countries, which are responsible for
primarily through the propagation of vermin such as cats, dogs and
the generation of a considerable proportion of greenhouse gases, one
rats, which may in turn be carriers of deadly diseases such as bubonic
of the primary drivers of global climate change.
plague, leptospirosis, scabies and other tropical scourges.
Solid wastes: Context and system description
At the community level, the majority of the population is already
If solid wastes are not managed properly, there are many negative
affected by pol ution, but it seems that the social perception of the
impacts that may result. These impacts are not only restricted to
problem is not far-reaching (i.e. people continue to litter despite being
where the wastes are generated or deposited but can have far-
provided with waste col ection facilities) and fundamental to any
reaching consequences beyond national and ecosystem boundaries.
potential solution in the future
For example, waste improperly deposited on land can find its way into
the ocean and be transported for thousands of kilometres with impacts
Global change
Prioritisation of Global Change occurred primarily
because of concerns that existing anthropogenic
pressures would change the world's climate to
the detriment of vulnerable states such as those
comprising the region. Further studies are required
to indicate how islands wil be affected by this
global phenomenon. This includes a change in the
hydrological cycle, which in turn wil have a marked
impact on the agricultural productivity, the water
supply sector and with floods causing destruction
to habitats and infrastructure. The impacts of sea
level rise wil also be pronounced resulting in
land loss, erosion of beaches, damage to coastal
infrastructure, degradation of coral reefs and loss
of wetlands. Whilst there is considerable lack of
Figure 18 Solid waste on the beach in Grande Comores.
data for those issues, there is general agreement
(Photo: Payet 2002)
44
GIWA REGIONAL ASSESSMENT 45B INDIAN OCEAN ISLANDS
ASSESSMENT
45
on marine life. Secondly, the degradation components of wastes, such
Solid waste in Mauritius is found mainly in the capital and its port, but
as those coming from landfill leachates, can also seep into the marine
also in other urban areas as well as vil ages. Although there is an efficient
environment al owing toxic substances to accumulate in marine life,
solid waste col ection service, il egal disposal of rubbish and littering
for example whales.
remains the main source of solid waste that ends up in the coastal
environment. Waste from the fisheries trans-shipment port is also a
The AEO (UNEP 2002) reports that the growing populations in urban
problem. These amounts are not very high but no exact information
centres in the Western Indian Ocean Islands, together with the
is available.
growing number of tourists and patterns of increased consumption,
are producing greater and greater volumes of solid waste.
In Seychelles, whilst there is an efficient service for collection of solid
waste on the main inhabited islands, the problem arising from illegal
Geographical aspects
dumping and littering causes some impact on the environment. The
In addition to domestic waste, which is common to each country in
main areas affected are the beaches, rivers, ravines, drains and public
the region, the types of commercial waste generated is determined by
areas. Since Seychelles also has an important fishing industry, wastes
the types of economic sectors present in each country. The sources are
from this activity is also becoming a serious problem (Payet 1998).
usually restricted geographically within urban centres, industrial zones,
ports, fisheries areas and tourism areas such as beaches and dive sites.
Solid wastes that end up in the coastal marine environment not only
In most cases, these wastes are disposed of in open dumps due to lack
affect the immediate environment, but are transported off the coast,
of funds for properly engineered landfil s. Furthermore, many of these
into the open seas, and end up in remote areas where there is no
dumps are located close to the coastal areas, and through leakage, run-
significant human presence. For example, the Masaola Marine Park in
off and wind-transport pol ute the adjacent marine environment. With
Madagascar, and the Ste Anne Marine Park in Seychel es (both within
the increase in consumption patterns and industrial use, as wel as tourism
the vicinity of major commercial ports and urban centres) suffer from
(cruise tourism), the amount of wastes entering the marine environment,
the deposition of huge amounts of solid wastes transported by coastal
without concomitant action on the ground, can only get worse.
currents (Payet 1996). A clean-up exercise in April 2003 by the Ste Anne
Marine Park rangers in Seychel es resulted in the col ection of over 5 m3
In Comoros, the main sources are mainly on Grand Comores, within its
of plastic debris on the smal islands within the marine park. Remote
capital Moroni, but also along its coastal areas where solid wastes are
islands, such as Aldabra and Cosmoledo Atol s (within the Seychel es
practical y dumped onto the beaches (Figure 18) (UNEP 1998). Moroni
EEZ), are also affected by solid wastes in the form of marine debris
generates both municipal solid wastes, litter, and wastes from the port
(Figure 19). It is estimated that more than 10 m3 of wastes end up in the
and fishing vessels. The coastal marine environment is also littered with
lagoons and beaches of these distant uninhabited islands. The impact
solid waste. No estimates of the extent of the problem have been made,
although studies done in South Africa indicate that this is a problem
thorughout the entire Indian Ocean (Madzena & Lasiak 1997). In other
rural areas, the same problem persists. Discharge of solid wastes from
the major rivers is also an important source of accumulation of solid
waste within the coastal zone.
In Madagascar, the problem is most pronounced in the cities, for
example in Antananarivo (in the high lands) and Toamasina (the
most important port city on the east coast). Littering is a big problem
along the main roads and in the coastal regions. When the heavy rains
come, the litter is swept to the coast and emptied into the sea, with a
huge amount becoming stuck in the mangroves. Solid wastes are also
generated in the industrial zones on the east coast, in particular within
the vicinity of Toamasina. It is estimated that only 25% of solid waste is
Figure 19 Marine debris landed on Cosmoledo Atoll.
col ected (UNEP 1999).
(Photo: Payet 2002)
44
GIWA REGIONAL ASSESSMENT 45B INDIAN OCEAN ISLANDS
ASSESSMENT
45
on wildlife within the region is unfortunately not known, although the
Table 16 Estimated annual amount of solid waste.
likely impacts can be inferred from studies done elsewhere (Coe &
Comoros
Madagascar Mauritius
Seychelles
(tonnes/year) (tonnes/year) (tonnes/year) (tonnes/year)
Rodgers 1997).
Total
Domestic waste col ected
27 090
219 000
370 369
44 400
(tonnes/year)
Ship generated waste
ND
ND
ND
1.3
Another important geographical problem is waste from mobile sources
col ected
Domestic waste not
within the Indian Ocean such as commercial transport ships, fishing
104 000
1 095 000
65 000
2 500
1 266 500
col ected
boats and cruise ships. Wastes from commercial vessels may include
Waste col ected from
ND
9 000
4
ND
9 000
rivers and drains
packaging and domestic debris, which is discarded in the open sea.
Waste col ected in clean-
Secondly, fishing vessels also have a bad reputation of discarding
ND
ND
73
271
344
up campaigns
empty salt (plastic) bags, large amounts of nets and other fishing gear,
Waste col ected on
ND
40 000
520
120
40 640
beaches
including marker buoys (Payet 1996). Waste sources from cruise vessels
Total waste likely to end up in the sea (estimated)
1 316 484
include solid wastes (e.g. plastic, paper, wood, cardboard, food waste,
Area used for waste
ND
ND
2.5
2
disposal (ha)
cans, and glass) and even hazardous ones such as fluorescent light
ND = No Data. (Source: GIWA task team calculations 2003)
bulbs, spent oil/lubricant cans and batteries. It has been estimated that
a 3 000-passenger cruise ship (considered an average size, some carry
odours and dust are also a direct result. Aerosols and dusts can spread
5 000 or more passengers) generates on a typical one-week voyage
fungi and pathogens from uncol ected and decomposing wastes.
about 50 tonnes of garbage and solid wastes (Coe & Rodgers 1997).
Children and human scavengers are known to contract asthma, lead
An emerging problem is that of smal yachts chartered for tourism
poisoning and viral diseases as a result of foraging in such rubbish piles
purposes. As they usual y have a lack of space on board, rubbish is
for food and other items (Nriagu et al. 1997). The total amount of solid
often thrown overboard or dumped on nearby islands. Figures on the
wastes which could potential y cause these impacts and be transported
amounts involved for each of these sources are not known, although
across boundaries is about 1.3 million tonnes, with 83% of these wastes
for cruise ships this could be estimated.
originating from Madagascar (Table 16).
The transboundary implications of solid wastes is exemplified in a report
Consequently, the discharge of wastes into the coastal and marine areas,
where a buoy travel ed over two years from South Africa to Tasmania, a
either through direct discharge or transport via rivers and drains is an
distance of over several thousand miles (CSIRO 1998).
increasing problem. For instance, surveys carried out in South African
beaches five years apart, showed that the densities of all plastic debris
The environmental impacts of solid wastes within the region can be
have increased substantial y (Ryan & Moloney 1990). Increases in the
divided into three main areas: impacts from uncol ected solid wastes,
population of vermin have drastic consequences on the flora and fauna
impacts from improper disposal, and impacts from natural movement
as well. For example, increases in rat populations can have an impact
of solid waste.
on important bird areas, affecting nesting and feeding patterns. Coastal
bird populations may also be affected through ingestion of marine
Impacts from uncollected solid wastes
debris (Walker et al. 1997).
This is most prominent in Comoros and Madagascar, where there
are no proper sanitary landfills and no col ection service, except in
Open burning of wastes is also quite common in the absence of
the cities, but even there the service is not consistent. For example,
alternative measures. This is practiced throughout the region. In
in Antananarivo, about 240 tonnes of garbage remains uncol ected
Seychel es, this practice has more or less been discontinued, but on the
every day. Piles of rubbish placed by the roadside or on the beach are
Island of La Digue people stil burn their wastes. The impacts of burning
a common sight. In Mauritius and Seychel es, littering is common in
municipal wastes are air pol ution and smoke and toxic products of
urban areas and il egal dumping is limited to rural areas and in ravines
combustion such as dioxins (Yoshida et al. 2001).
where they are not seen from the roadsides. In those cases, uncol ected
and illegal stacks of waste often end up in drains, causing blockages,
Uncollected waste also degrades the aesthetic and natural beauty of
which result in flooding and unsanitary conditions. Stray dogs, cats, rats,
the environment, discouraging efforts to keep streets and open spaces
flies and other insects (especial y mosquitoes) breed in stocks of solid
in a clean and attractive condition. Plastic bags are a particular aesthetic
wastes, and these animals are often very effective disease vectors. Foul
nuisance and they can cause the death of grazing animals (especial y
46
GIWA REGIONAL ASSESSMENT 45B INDIAN OCEAN ISLANDS
ASSESSMENT
47
in Comoros, which has a high livestock population), which eat them.
Soil contamination by leachates is perhaps not ful y studied in the region,
It also known that turtles eat plastic bags mistaking them for jel yfish
but depending on where the landfill is situated, the contamination of
(Gramentz 1988).
the soil can extend beyond the simple boundary of the open pit, as
shown in the case of a sanitary landfil in the reclamation zone on Mahe
Impacts from improper disposal
Island, Seychel es (Payet 1999). Leaking of oils and other chemicals as
Impacts of improper disposal arise from poor col ection systems, and
wel as decomposing organic matter can contaminate the soil rendering
disposal in open pits. As a temporary measure (although in many
it infertile and also unsuitable for any further activity. Biochemical
cases this extends beyond 10 years), governments try to col ect the
reactions also occur in open pits, which cause a number of toxic organic
solid waste and deposit it somewhere "out of sight and out of mind".
and inorganic chemicals to leach into the environment. Such chemicals
For example, in Mauritius, five open landfills include the Poudre D'Or,
can be transported for several kilometres and accumulate in both plants
Mt St Pierre, Riche Fond, Solferino, and La Martiniere while Beaux
and animals, having an impact on the environment, the groundwater,
Songes and St. Martin have been rehabilitated for recreational use. In
agriculture and fisheries.
Seychel es, two such dumping sites exist at `La Retraite' , which is now
closed, and Providence. In Madagascar, which is a much bigger island,
Contamination of watercourses, especial y groundwater, is observed
an unaccounted number of open pits exist around the major cities. A
on several islands. For example, on La Digue (Seychel es), open
number of environmental impacts need elaboration here.
dumping of wastes has a great risk of contaminating the groundwater.
In Comoros, which depends on groundwater, the risk is even higher.
Col ection of the waste from the piles placed by the road side without
Location of landfills close to the sea is also a potential problem, e.g.
proper receptacles impose a certain degree of risk to the waste
Providence Landfil in Seychel es. Leachates from the landfil may
col ectors, as such wastes often contains sharp and broken objects. In
enter into the marine environment, accumulate in both shel fish and
some cases, the wastes, such as abandoned vehicles (seen in Mauritius
demersal fish, and could potential y affect human health. In Mauritius,
and Seychel es), are not easily removed without proper equipment and
the concentrations of six trace metals (chromium, nickel, copper, zinc,
heavy machinery (UNEP 2002).
cadmium, lead) were analysed in the freshwater system at Flic en Flac.
The results showed contamination from transport and industrial sources
Transport of the wastes in improper vehicles has two main impacts,
(Ramessur et al. 1998).
spil age of wastes during the journey and leaking of liquid/decomposing
wastes during the journey. Both these impacts have raised considerable
Impacts from natural movement of solid wastes
concern in Seychel es and Mauritius. Open-top waste trucks have been
Information available from other regions indicates that almost 60% of
observed to al ow wastes to fal off their trucks resulting in a trail of
solid wastes in countries that have no national solid waste col ection
wastes throughout streets and urban areas.
service end up in the ocean (Derraik 2002), the remainder trapped in
ravines, drains, wetlands and mangroves. This is likewise observed along
Disposal of the waste in open pits results in several short-term and long-
the east coast of Madagascar from Fort Dauphin to Tamatave, and in
term impacts and can affect the quality of the air, soil and water (Fent
Grand Comores, from Moroni to Mitsamiouli.
2003). Mixing of solid wastes can cause them to auto-ignite, setting the
landfill on fire. In Seychelles, one fire took several years to completely
In addition, derelict fishing gear (estimated to be about 5% of al marine
extinguish due the flammability and depth of the waste components
debris) is in constant movement in the ocean environment causing
in the landfil . Fires in landfills can generate toxic clouds/aerosols,
damage to marine ecosystems and species. It is estimated that ingestion
including dioxins among other chemicals, which may have an impact
of debris, entanglement, or both, affects at least 267 species worldwide,
on populations and ecosystems nearby.
including 86% of all sea turtle species, 44% of all seabird species, and
43% of all marine mammal species (Laist 1997). Throughout the Pacific
Explosive containers, batteries and other explosive materials add to
Rim, derelict fishing gear (lost or discarded at sea and made up mostly
the danger. In the medium-term, landfil gas (which is produced by
of synthetic lines from trawl, drift, seine and gil nets) has become
the decomposition of wastes) also presents an immediate danger to
an environmental concern for al nations. Information for the Indian
public safety, as it can be explosive if it is al owed to accumulate in
Ocean Island region is not available but is likely to be of the same order
confined spaces.
of magnitude because of the enormous size of and volume of waste
46
GIWA REGIONAL ASSESSMENT 45B INDIAN OCEAN ISLANDS
ASSESSMENT
47
Table 17 Costs associated with waste management.
is expected when you consider that tourists will refuse to use beaches
and recreational areas that are pol uted. Divers can also be affected and
Activity
Comoros
Madagascar
Mauritius
Seychelles
in some extreme cases debris can lead to drowning. These situations
Cost of
USD/tonnes
42
60
67
136
also lead to high maintenance costs, for example, beach cleaning
col ection
mil ion USD/year
2
ND
25
6
activities cost more than 40 USD per m2 in the Seychel es (Table 18). In
Cost of
USD/tonnes
6
0.2
ND
45
treatment/
fact, to reduce this cost the local contractor recently purchased a mobile
disposal
mil ion USD/year
0.3
ND
8
2
Note: ND=No Data. (Source: GIWA Task team calculations 2003)
beach cleaning machine to reduce effort, time and cost associate with
beach cleaning.
generated in Madagascar, as compared to the relatively small islands in
the Pacific Ocean. The east coast of Africa where similar problems exist
Entanglement of propel ers, clogging of water intakes and blocking
on an even greater scale is also an important contributing factor.
of pumping systems al contribute to additional costs of recreational
boating and fishing. The major impacts of litter on fisheries include
Entanglement and asphyxiation by common items like fishing line,
damage to nets, fouling of fishing grounds and damage to fish stocks.
strapping bands and six-pack rings are not reported in the region, but it is
However, the exact costs of these impacts could not be determined,
believed that it occurs (Mortimer, pers. comm.). Once entangled, animals
but can be very high as repair of gear is about USD 50 per m2, which
have trouble eating, breathing or swimming, al of which can have fatal
leads them to being discarded which only exacerbates the problem.
consequences. Since some plastics take hundreds of years to degrade,
Losses for fishermen can be in the time spent clearing litter from their
they wil continue to trap and kil animals year after year.
nets, loss of catch due to contamination, loss of time due to fouled
propellers including repair or replacement. Should these costs be
Solid waste also has an impact on ecosystems such as reef and seagrass
summed up for each fisherman then the economic losses can be
beds, by forming mats and nets, entangling its parts and restricting
significant (Table 18).
growth. A net, or a buoy with long trails of strings can also affect coral
reefs, as it drifts and gets entangled on the coral heads. As wave action
The majority of costs of flooding can be attributed to blocked drains
moves it back and forth, the entangled net pul s on the coral destroying
and flood protection works. In Seychel es, it is estimated that river and
it, and that can happen in successive stages on a reef. The impact of a
drain clean-up costs the country about 500 000 USD per year.
storm event can also be cumulative. Accumulation of litter in coastal
areas can also lead to smothering of benthic communities in both soft
Health aspects
and hard seabed substrates.
Vulnerable groups (school children, scavengers and waste workers)
and communities are the most at risk from improper management
Some other research has indicated that floating debris can transport
of wastes. People living close to open dumps are also at risk since the
stowaway organisms (including invasive species) over long distances
water supply may become contaminated either due to waste dumping
(Gregory 1999).
or leakage from landfill sites, and also the propagation of vermin such
as rats and mosquitoes. In particular, organic domestic waste poses a
Economic aspects
serious threat, since it ferments, creating conditions favourable to the
The economic losses resulting from improper solid waste management
survival and growth of microbial pathogens. Direct handling of solid
can be observed in al productive sectors of the economy although they
waste can result in various types of infectious and chronic diseases. Fires
are not always obvious. Poor solid waste collection services increases
environmental clean-up costs and health costs and reduces revenue
Table 18 Economic costs of solid waste deposited along river
from tourism, fisheries, aquaculture, and also affects safe navigation,
banks, beaches and in the sea.
flood defences and drains.
Sector
Madagascar
Seychelles
Cost of road cleaning (USD/km)
30.8
ND
Environmental clean-up costs are very high and often exceed proper
Cost of beach cleaning (USD/m2)
ND
40
waste col ection costs (Table 17). For example in Seychel es an average
Cost of river clearing and unblocking (USD/year)
ND
500 000
litter clean-up campaign costs around 6 000 USD per day for one island.
Cost to fishermen (engine and net repair)(USD/year)
1 000
ND
Health costs could not be quantified. Reduction of revenue from tourism
Note: ND = No Data. (Source: GIWA Task team calculations 2003)
48
GIWA REGIONAL ASSESSMENT 45B INDIAN OCEAN ISLANDS
ASSESSMENT
49
and aerial transport of wastes wil also affect those communities. Within
It is concluded that these impacts are of sufficient cost to the economy
the suburbs of Antananarivo, Madagascar, these areas are very common.
that it justifies the implementation of proper waste management
Co-disposal of industrial wastes with domestic wastes can also have
services and infrastructure. The next section explores the root causes
serious impact on human health. However, since there have been no
of this problem in detail and proposes a policy framework to address
specific studies done in the region linking the issue of solid wastes to
the problem in the long-term.
health problems, the remarks made here are merely speculative.
However, in all countries of the region uncol ected solid waste can also
obstruct stormwater run-off, resulting in stagnant water bodies that
become breeding grounds for diseases, especial y cholera and malaria,
both of which are found in Comoros and Madagascar. Waste dumped
near a water source also causes contamination of the water body or the
groundwater source, and since there are no facilities to test the water
for contaminants, the water is consumed anyway. Direct dumping of
untreated waste in rivers, seas, and lakes results in the accumulation of
toxic substances in the food chain through the plants and animals that
feed on them.
Co-disposal of hospital waste requires special attention, throughout
the region, especial y with emerging diseases such as severe acute
respiratory syndrome (SARS) and other epidemics. There are few
specialised clinical waste disposal facilities in the countries of the
region. In Seychel es, clinical wastes are incinerated in a small portable
incinerator with no flue treatment. Dangerous items (such as broken
glass, razor blades, hypodermic needles and other healthcare wastes,
aerosol cans and potential y explosive containers and chemicals from
industries) may pose risks of injury or poisoning, particularly to children
and people who sort through the waste.
Beachgoers, in particular, cut themselves on glass and metal left on
the beach. Marine debris also endangers the safety and livelihood of
fishermen and recreational boaters.
Conclusions
The problem of solid waste is indeed far-reaching as previously
expected. Although the majority of solid waste is generated on land, a
huge proportion ends up in the coastal and ocean environment causing
degradation of ecosystems and economic impacts.
In summary, the main impacts of solid waste in the region are: (i) pol ution
of groundwater, surface water, and wetlands; (ii) risks for human health;
(i i) degradation of coastal marine environment (including coral reefs)
and tourist attractions such as beaches; (iv) possible disease outbreaks
and the destruction of fisheries; (vii) accumulation and toxic effects of
leachates; and (viii) eventual y impact on the economy.
48
GIWA REGIONAL ASSESSMENT 45B INDIAN OCEAN ISLANDS
ASSESSMENT
49
Causal chain analysis
This section aims to identify the root causes of the environmental
invested over 6 to 8 mil ion USD in solid waste management over the last
and socio-economic impacts resulting from those issues and
10 years. Solid waste management is indeed very complex; for example,
concerns that were prioritised during the assessment, so that
setting up refundable deposit systems, variable taxes on col ection and
appropriate policy interventions can be developed and focused
siting of landfil s in a way that does not harm the environment or people.
where they will yield the greatest benefits for the region. In order
Developing the appropriate mechanisms and capacity to control the
to achieve this aim, the analysis involves a step-by-step process
entire process from waste generation and collection through to
that identifies the most important causal links between the
appropriate disposal requires an integrated approach.
environmental and socio-economic impacts, their immediate
causes, the human activities and economic sectors responsible
Many of the states in the region have undergone a profound shift in
and, finally, the root causes that determine the behaviour of those
consumption patterns in the past decades. One of the main drivers of
sectors. The GIWA Causal chain analysis also recognises that,
consumerism has been the flood of products from developed countries
within each region, there is often enormous variation in capacity
and newly industrialised countries, particularly in South East Asia. For
and great social, cultural, political and environmental diversity.
example, plastic packed food, polystyrene plates and aluminium cans
In order to ensure that the final outcomes of the GIWA are viable
came into fashion as fast food became popular with an increase in the
options for future remediation, the Causal chain analyses of the
purchasing power of the people. Improvements in travel, tourism and
GIWA adopt relatively simple and practical analytical models and
access to foreign markets, coupled with the influence of television have
focus on specific sites within the region. For further details, please
also had a profound impact on the consumption patterns of members
refer to the chapter describing the GIWA methodology.
of the public. The results of these changes are multifaceted, ranging
from increase in solid wastes generation to obesity which can be seen
as precursors of an affluent society. On the other hand, increase in
fisheries development has also brought about additional problems
Introduction
such as nets and buoys that are constantly being washed ashore on
many of the small islands in the archipelago.
The focus of the Causal Chain Analysis (CCA) is to determine the source,
underlying constraints and the root causes of the solid waste issue in
The reasoning behind the choice of focusing the causal chain analysis
the Indian Ocean Islands region. Solid waste management and disposal
on solid waste can be argued against, but because the extent of the
is a major environmental concern in all the four island states. Besides
problem is not the same on each island and each island suffers from
a number of unmanaged dumping sites and uncontrolled landfilling
significant amounts of solid wastes found lying in the street, some of
in Comoros and Madagascar, the dumping of solid wastes in rivers, on
which get washed up daily on beaches, the imperative to address the
beaches and in the sea is common practice. This also used to be the
issue becomes even stronger.
situation in Seychelles and Mauritius, but these activities have been
discontinued through adoption of a national solid waste management
The assumptions concerning the nature of the solid waste problem
plan and provision of the necessary infrastructure, where both countries
based upon the review in the previous section, Assessment, is
have made considerable investments. For example, Seychelles has
summarised below:
50
GIWA REGIONAL ASSESSMENT 45B INDIAN OCEAN ISLANDS
CAUSAL CHAIN ANALYSIS
51
There has been a general increase in the consumption of packaged
Table 19 Proxy indicators developed to facilitate and ensure
goods and other waste-related products in all four island states;
comparability of the assessment in the region.
The human generation of solid wastes has increased;
Linkages
Indicators
Poor solid waste col ection service is in place;
T
I
II
III IV
V
There is general y a lack of appropriate land for the location of
E1
Habitat loss the ratio of solid waste col ected/not col ected
disposal facilities;
E2
Area used for solid waste disposal
Explosion in vermin and mosquitoes, which are disease-vectors, is
common in many parts of Madagascar and Comoros;
E3
Amount of solid waste removed from rivers and drains
Overall, solid wastes have been found to clog up drains leading to
E4
Quantity col ected during Clean-up-the-World Campaign
flooding;
E5
Number of wildlife affected by marine debris
There is an overal lack of in-country capacity to deal with the disposal
E6
Quantity of solid wastes col ected on beaches
of the waste;
C1
Cost of col ection
Some solid wastes would degrade or leach chemicals over time with
long-term effects.
C2
Cost of treatment and disposal
C3
Clean-up costs
Furthermore, the impacts of wastes are also transboundary, both as
H1
Cost of pest eradication
a function of human movement and dispersal through natural forces
H2
Number of cholera cases
such as wind and ocean currents. Transboundary issues that are relevant
in this analysis include:
S1
Cost of litigation (Not in my back yard)
Waste such as marine debris which floats and affects wildlife;
S2
Proportion of population affected by location of discharge
Waste that get carried by ocean current to other islands and
S3
Bins/col ection sites per capita
countries;
Note: E = environmental indicator; C = economic indicator; H = health indicator; S = social
indicator; T = transboundary relevance; I to V = the five GIWA concerns.
Disposal of solid waste at sea;
Waste that is dumped by boats, especial y fishing vessels;
Table 20 Characteristics of sites selected for
Discarded fishing gear, which cannot be recovered, often remains
the Causal chain analysis
in the ocean affecting wildlife for many years;
Country
Sites
Area (km2)
Population
The leaching of wastes into the marine environment, including
accumulation in the food web;
Comoros
Grande Comore Island
1 025
250 000
The commercial transport of waste to be disposed or recycled in
Madagascar
Antananarivo City (mainly)
30
1.5 mil ion
another island state can be dumped on the high seas to minimise
costs of treatment.
Mauritius
Mauritius Island
1 865
1.2 mil ion
Seychel es
Mahe Island
154
60 000
(Source: GIWA Task team calculations 2003)
Methodology
series of proxy indicators were developed (see Table 19). The selection
Clearly, there has been much work done in other countries on the
of those indicators was based upon an assessment of availability of data
issue of integrated solid waste management, but it is necessary that
and adequacy of the data.
this report emphasises, where possible, the local conditions required for
the development of a suitable policy model to address the identified
The choice of a definite geographical site for the CCA is problematic
root causes.
in view of the small size of some islands, e.g. Seychel es, where data is
aggregated at national level, and large islands, e.g. Madagascar where
Based on the discussion in the previous section, Assessment, combined
data for some indicators are available in one area only. Secondly, the
with current available knowledge on the issue, the causal chain for the
transboundary impacts can extend beyond several thousand miles. The
problem of solid waste was constructed. To facilitate the assessment a
final selection of sites for the CCA is given in Table 20.
50
GIWA REGIONAL ASSESSMENT 45B INDIAN OCEAN ISLANDS
CAUSAL CHAIN ANALYSIS
51
The immediate causes
of solid waste
The immediate causes of the problem of solid wastes are linked to the
main sources generating these wastes, viz:
Municipal/industrial solid wastes i.e. solid waste generated from
urban and industrial centres. Such wastes are usual y domestic,
combined with industrial, which includes wastes from manufacturing
industries as well as service industries, such as tourism establishments.
Such wastes are mixed consisting of both organic, biodegradable and
non-biodegradable components (ITW 1994).
Discards from beach users includes solid wastes that are dumped on
the beach by users, tourists, and so on. Such waste consists of plastics,
cigarette butts, empty bottles (Payet 1996) and in some areas wastes
Figure 20 Solid waste sources in Seychelles.
(Source: ITW 1994)
similar to municipal wastes.
Sewage related debris these are mainly originating from wastewater
Industry Wil not likely increase beyond what it is now, due
treatment outfalls in the major cities. This cannot be quantified but
to emerging trade opportunities, but wil continue to generate
hypodermic needles, plastics, and other small items which have been
significant amounts of wastes. For example, growth in the industrial
observed.
base in Madagascar due to its low cost of labour, or growth of tourism
in Seychel es and Mauritius, wil al likely contribute to an increase in
Among those three listed immediate causes, the municipal and
solid wastes generated.
industrial wastes are the most significant in the region. As discussed
in the previous section, at least 2.8 mil ion tonnes of solid wastes are
Transport Wil likely increase to meet tourism and trade demands.
generated in the region, of which only 30% are col ected routinely and
Additional tourism opportunities wil be explored which may create
beach deposited rubbish is estimated to be about 40 640 tonnes.
growth in the sector. Both Madagascar and Comoros are functioning
well below normal tourism trends, implying there is great potential for
growth.
Sector activities that generate Between 30-50% of al solid waste generated comes from domestic
solid waste
sources (Figure 20). The domestic sector is therefore the primary waste
generator fol owed by industry. Due to relatively low levels of transport
Sector-based data on solid wastes is not available in the region,
in the Indian Ocean Islands region compared with many other regions,
except for Seychelles (Figure 20). However, from the analysis in the
such as the Caribbean, wastes generated by this sector are expected
previous section, and observations of the authors, the following
not to exceed 10% of total generated wastes.
sectors in order of priority are the highest generators of solid wastes
in the region.
Urbanisation and consumption As presented in the socio-economic
Root cause analysis
characteristics of the region above, coastal urbanisation is likely to
double in Comoros and Madagascar by year 2015, with moderate
The determination of root causes can be a complex task especial y
growth in Seychel es and Mauritius. An increase in human settlement
where the problem is linked to other social and economic issues. The
will lead to an increase in solid waste generation.
main root causes identified are, in order of priority:
52
GIWA REGIONAL ASSESSMENT 45B INDIAN OCEAN ISLANDS
CAUSAL CHAIN ANALYSIS
53
Root cause 1: Lack of investment planning and priorities.
budget. One of the factors that cannot be addressed in the short-term
Root cause 2: Lack of effective mechanisms, inadequate institutional
is the problem of population growth and increasing purchasing power.
structure, laws and capacity.
Although it is a root cause in itself, the problem lies at the centre of
Root cause 3: Lack of adequate facilities, services for col ection and
national planning and therefore deserves some treatment to illustrate
management of wastes.
the linkages and how the population problem affects this root cause.
Root cause 4: Lack of education and awareness.
Population changes
However, to undertake an in-depth analysis of these root causes, it is
The population growth and projections to year 2015 for the region
important that the following issues are also considered. The scope of
are given in Table 21. Madagascar, the largest country wil have the
each of these root causes is discussed in detail.
largest population, with probably the largest impact in the region.
Madagascar's population wil effectively double by 2015, but growth
Root cause 1: Lack of investment planning and
rates are expected to decline from 3% to about 2.5 %. Population
priorities
growth in both Seychel es and Mauritius will be low.
National development planning is a critical process whereby national
Table 21 Population growth.
priorities are defined, and in many countries the World Bank and various
Population
UN agencies provide support for the development and implementation
Country/
1975
1998
2015
growth rate %
Region
(mil ion)
(mil ion)
(mil ion)
of national development plans. In Seychel es, national development
(1998-2015)
planning has existed since the early 1980s, but it was only at the
Comoros
0.3
0.7
1.0
2.5
beginning of the 1990s that sustainable development issues were
Madagascar
7.8
15.1
23.4
2.6
specifical y integrated as part of national planning.
Mauritius
0.9
1.1
1.3
0.8
Seychel es
0.06
0.08
0.10
0.87
The Environment Management Plan framework has been the primary
Indian Ocean
driver for implementation of solid waste management polices within
9.06
16.98
25.8
~2.5
Islands
the national development process in al the countries in the region.
(Source: UNDP 2000)
In the case of Mauritius and Seychel es, the issue of solid waste
Solid waste generation is closely linked to the economic growth of
management was clearly identified in the Environment Management
the country and the purchasing power of its people. Considering the
Plan, and significant funding was dedicated to address the problem.
figures given on the GDP, it is likely that the amount of wastes currently
Being ACP (African-Caribbean-Pacific) countries within the European
generated wil increase (Table 23). For example, in Mauritius, about
Union Cooperation Programme, both countries benefited from
0.7 kg of solid waste per person per day is generated, which will likely
European expertise to establish integrated solid waste management
increase to 0.9 kg by the year 2010. In Seychel es, solid waste generation
programmes. This included the identification and development of
is about 0.39 kg (1994 estimate) per person per day and it is estimated
ful y engineered landfills (disposal options), improvements in the
that this will likely increase to 0.53 by 2015 (UNDP 2000). For Comoros
waste col ection service with participation from the private sector
and Madagascar per capita data is estimated to be about 0.1-0.2 and
and exploring other aspects of solid waste management such as
0.2-0.4 kg per person per day, respectively. Tourism development in the
composting, recycling and recovery. However, both Madagascar and
region will also increase solid waste generation.
Comoros are stil in the very early stages of developing integrated waste
management approaches.
Movement of the population within Comoros and Madagascar will
be mainly influenced by better job opportunities and livelihood in
In spite of this progress, as indicated in the previous section, Assessment,
the cities (Table 22). In Mauritius, the urbanisation rate has decreased
a number of problems still exist such as lack of adequate land for solid
due to government policies for providing good communication and
waste disposal, reduction of littering, and most importantly putting
services within the communities. In the case of Seychel es, urbanisation
in place a sustainable financing mechanism for finalising solid waste
is strongly influenced by the lack of land for communities to expand
management in the long-term. In Seychel es, for example, people are
in view of high conservation value of many areas, and therefore
not directly charged for solid waste col ection, but instead the annual
population centres wil be planned development on the reclaimed
budget for solid waste management is sourced from the government
areas around the city of Victoria.
52
GIWA REGIONAL ASSESSMENT 45B INDIAN OCEAN ISLANDS
CAUSAL CHAIN ANALYSIS
53
Table 22 Changes in urban population.
serve to tackle some of the ingrained problems related to ecosystem
Country/
1975
1998
2015
degradation in Madagascar. This kind of analysis is based upon expert
Region
(%)
(%)
(%)
views rather than an analysis of available data. Table 25 is a further
Comoros
21.2
32.1
42.6
extension of this analysis which considers the magnitude of changes
Madagascar
16.1
28.3
39.3
in output between now and the year 2020.
Mauritius
43.4
40.9
48.6
The size of change in output was difficult to determine due to lack of
Seychel es
33.3
56.9
67.3
data and macro-economic scenarios for the region. Based upon past
Indian Ocean
28.5
40.0
50.0
Islands
and historical data in economic growth, the proposals have been
(Source: UNDP 2000)
summarised in Table 25. Whilst it is expected that there wil be increased
Solid waste is an issue that should remain a national priority, as it is
industrialisation in Madagascar and Mauritius, Seychel es and Comoros
closely related to the performance of the economy, especial y if it
will likely become more service oriented. Imports of goods are likely to
depends upon tourism. Compared with other investments such as
generate more solid waste, and increased production will also increase
water and sewage, solid waste col ection services entail huge costs
every year, and policies aimed at reducing those costs whilst maximising
the amount of waste collected would be the optimum approach. To
Table 23 Economic indicators.
achieve this optimum, a number of policy instruments wil need to work
GDP annual
GDP 1995
growth rate
together, as discussed in the next section. However, to implement any of
(USD bil ion)
1980-1996 (%)
these policy instruments consistent political wil , national planning and
Comoros
0.2
2.0
a dedicated government budget is required every year.
Madagascar
3.2
-0.1
Whilst the role of government in solid waste management is
Mauritius
3.8
5.7
undoubtedly important, mechanisms should be put in place for private
Seychel es
0.5
3.3
sector involvement and re-investment in the sector. These could then
(Source: UNDP 2000)
create the right investment environment for recycling, deposit-on-
return, zero-packaging, green eco-labels and other schemes.
Table 24 Likely changes in private and government
consumption.
Root cause 2: Lack of effective mechanisms,
Consumption
Consumption
Country
1998 (as % of GDP)
2020
inadequate institutional structure, laws and
Private
Government
Private
Government
capacity
Comoros
93.8
11.6
+
++
Madagascar
88.6
6.1
+
+
Mechanisms
The quantity of solid waste generated is closely linked with economic
Mauritius
65.0
11.0
+
-
development. The states within the region can be conveniently divided
Seychel es
65.7
17.0
+
-
into groups depending on the economic data presented in Table 23
and also in Table 8 and 9.
Note: + =increase, - = decrease. (Source: UNDP 2000)
Table 25 Expected output change to the year 2020.
In Mauritius and Seychel es, it is envisaged that solid waste generation
Exports of goods & Imports of Goods
GDP
wil continue to increase with increases in population, consumption and
Services
& Services
development activity being pushed towards the private sector (Table
Comoros
+
+
+/-
24). However, Madagascar is expected to experience much more rapid
Madagascar
++
+
+/-
growth, depending upon political stability and reform policies being
Mauritius
++
+
+
implemented. In order to promote national unity and investments
Seychel es
+
+
+
at community level, the government is likely to become increasingly
Note: += increase, -=decrease. (Source: GIWA task team calculations 2003)
invovled to ensure better management at grass roots level and also
54
GIWA REGIONAL ASSESSMENT 45B INDIAN OCEAN ISLANDS
CAUSAL CHAIN ANALYSIS
55
solid waste as a by-product and as a product of consumption. The
Permit) Regulations has been promulgated in 2001 under the EPA. The
GDP of Madagascar and Comoros may or may not increase depending
aim of these regulations is to develop "product responsibility" among
upon political stability and economic reform. The GDP of Mauritius and
bottlers for the proper management of the bottles after distribution.
Seychel es will likely continue to increase.
Bottlers, grouped in an association, have put up a system of col ection
of used PET bottles which are exported for recycling.
Growth in the shipping industry is closely linked to the economic
prosperity and consequently the trade input/output from the country.
However, close monitoring is required and, to date, these regulations have
The countries in the region have considerable outputs in terms of
not been enforced due to lack of staff. The pol uter pays principle has been
both fisheries (Mauritius, Madagascar and Seychel es) and agriculture
adopted where the `Police de L'Environement' issue fines if somebody is
(Mauritius, Madagascar and Comoros). Marine transport being the
caught littering. This unit was created in December 2000 and is based at
cheapest and most favoured is thus the most important link between
the Ministry of Environment. Its main functions are to enforce the laws
these islands and the world trade centres. However, with this increase
(EPA, Local Government Act, Noise Prevention Act etc.). It comprises 26
in trade, an increase in marine wastes is highly probable. This is further
policemen who work in a shift system to ensure that they are available
exacerbated by ports in the region competing for the least cost.
round the clock. From 1st December 2000 to 2003, 5 897 contraventions
Competing on the basis of least cost foregoes the option of provision
have been established for il egal littering and 70 contraventions for il egal
of waste reception facilities, as these can have a high cost associated
dumping under the `Dumping and Waste Carrier's Regulations, 2003'.
with them.
However, the number of Policemen of Environment is not enough for
the 1.2 mil ion people living in Mauritius. Stil , some littering does occur,
Taxes and subsidies for solid waste management in the region are
especial y in rivers and other watercourses.
not wel developed. There are taxes on consumer products, highest
in the Seychel es, and this lowers customer purchasing power and
In Seychel es, an authority was created to manage solid wastes. The
has an effect on solid waste generation. Restrictions in availability of
authority, cal ed the Solid Waste and Cleaning Agency (SWAC), is
consumer products due to lack of convertible currencies in Seychel es,
responsible for solid wastes and hazardous wastes management in the
Madagascar and Comoros also results in less waste being generated.
country. It operates through the management of contracts for collection
and management of the landfil s. The Environment Protection Act 1994,
In Mauritius, the government spends nearly 25 mil ion USD per year
which makes specific provision for the management of solid wastes
(that is about 21 USD per person) for the col ection, transportation and
was utilised to develop subsidiary legislation to deal with solid wastes.
disposal of refuse waste. In Seychel es, spending is about 6 million USD
To date, SWAC has over 30 staff members who are engaged in various
per year or about 57 USD per person.
enforcement and supervisory work that covers public col ection points,
maintaining certain public places, beaches and some drains. SWAC also
Legal
undertakes several educational and sensitisation activities to promote
The institutional and legal framework for countries in the region is
waste reduction and recycling. Recycling fairs have also been organised
discussed in detail the first section of this report but the most salient
to show how waste materials can be recycled into productive uses.
points are worth emphaising here..
In Madagascar and Comoros, there are no dedicated solid waste
Mauritius addressed the issue of solid waste management by the
management agencies. In Madagascar, management responsibility for
creation of the Department of Environment in 1989 and the enactment
solid waste is a function of the municipality, whereas in Comoros, the
of the Environment Protection Act (EPA) in 1991 (revised in 2002). Under
Ministry of Environment is responsible to issue contracts and ensure
Section 6 of the EPA 1991, it is the duty of the Minister of Environment
col ection is done promptly. In both countries there are very few people
to propose and develop policies on al aspects of environment
who are involved in the management of solid wastes.
protection and management pursuant to national objectives and
goals set by the National Environment Commission. The Department
Al the island states in the region are signatories to MARPOL (The
of Environment of the Ministry of Environment functions as the Waste
International Convention for the Prevention of Pol ution from Ships),
Regulation Authority and it formulates policies on waste management.
and should comply to its requirements. However, due to problems
The Environment Protection (Polyethylene Terephthalate (PET) Bottle
linked to the root causes presented here, MARPOL is not at a high
54
GIWA REGIONAL ASSESSMENT 45B INDIAN OCEAN ISLANDS
CAUSAL CHAIN ANALYSIS
55
level of implementation in the region. For example, the establishment
There are no large municipal solid waste incinerators in the region. A
of reception facilities can be a sound private sector investment but,
few smal incinerators (e.g. in Seychel es and Mauritius) are used for
due to a lack of regional harmonisation, no one is willing to put in the
special wastes such as hospital wastes.
investment and risk those facilities not being used. A regional approach
and timetable may be required to resolve the issue.
In al the island states there are various levels of waste recycling, but
nothing is done on a large commercial scale, except for a few factories
Root cause 3: Lack of adequate facilities, services
in Mauritius that recycle plastics into other products and convert
for collection and management of wastes
bagass (fibrous by-product of sugar refining) into energy. In Seychel es,
The knowledge of treatment and management of wastes is most
recycling almost occurs at an artisanal scale, probably related to the
advanced in Mauritius and Seychel es. In Comoros and Madagascar,
smal quantities produced. In Comoros and Madagascar, recycling is also
solid waste dumpsites dominate with no significant technology in the
artisanal but as an alternative livelihood to avoid poverty. Recycling is
treatment of solid waste. Both Mauritius and Seychel es have one ful y
limited at national level due to the scale of economies, but at regional
engineered landfill each, but another sanitary landfill is currently being
level there is large potential.
used in Seychel es waiting for this ful y engineered landfill to open.
There are no proper reception facilities for ship-generated wastes in
In Seychel es, use of the ful y engineered landfill will depend upon the
the region. It can be concluded that a huge proportion of the solid
performance of a solid waste sorting and composting facility, which
wastes generated by the shipping industry is dumped at sea, and the
is already operating, generating compost for local use and export. At
remainder in sanitary landfil s on land.
this landfill at Anse Royale, only inert wastes, such as glass and certain
types of plastics, will be deposited with the remainder being recycled
(plastics, metal and waste oil) or converted into compost.
Figure 21 Causal chain diagram for solid waste.
56
GIWA REGIONAL ASSESSMENT 45B INDIAN OCEAN ISLANDS
CAUSAL CHAIN ANALYSIS
57
Root cause 4: Lack of education and awareness
Lack of education and awareness is a root cause that transcends all
levels of a society. Solid waste education is a specialised field but
several activities or initiatives can be launched at national and local
level to encourage reduction in waste generation, littering, il egal waste
dumping, proper use of the receptacles, recycling, etc.
In the region, some education programmes have been conducted, and
the "Clean-up the World Campaign" is held in each country every year.
Other initiatives include short programmes on national TV, exhibitions
and tips through the eco-home programme in Seychel es.
Despite all these efforts, public education is not easy and it takes years
(in some cases as long as a generation) to change habits and tendencies.
However, education programmes are done in a haphazard manner and
not linked to public responses and a measurement of the improvements
achieved is lacking. Solid waste management programmes in the region
are therefore fragmented and opportunistic.
An effective combination of mechanisms ranging from enforcement
to education and awareness can provide the tools to address this root
cause in the short- and long-term.
Conclusions
The root causes elaborated in this section include a consideration
of forces that are beyond the immediate control of governments
(population growth and urbanisation) and those that can be addressed
using a series of policy measures, such as altering consumer patterns
and generation of wastes. The conceptual model showing the root
causes in the context of the solid waste issue is depicted in Figure 21.
The root causes are closely linked to one another, and to the issues
of population growth and economic development, both of which are
rather long-term issues.
56
GIWA REGIONAL ASSESSMENT 45B INDIAN OCEAN ISLANDS
CAUSAL CHAIN ANALYSIS
57
Policy options
This section aims to identify feasible policy options that target
resulting in economic col apse of resources. The issue is transboundary
key components identified in the Causal chain analysis in order
since solid wastes are transported to sea by run-off and river discharges,
to minimise future impacts on the transboundary aquatic
and to other countries by ocean currents.
environment. Recommended policy options were identified
through a pragmatic process that evaluated a wide range of
Establishment of preliminary hypotheses
potential policy options proposed by regional experts and
The development of preliminary hypotheses was facilitated by the
key political actors according to a number of criteria that were
identification of, possible areas for implementation (Table 26) and the
appropriate for the institutional context, such as political
subsequent consolidation into the fol owing hypotheses:
and social acceptability, costs and benefits and capacity for
implementation. The policy options presented in the report
1) The increased generation and improper disposal of solid wastes has
require additional detailed analysis that is beyond the scope
caused an increase in marine debris with ecological and economic
of the GIWA and, as a consequence, they are not formal
consequences in the region.
recommendations to governments but rather contributions to
2) The situation can be reversed through the implementation of
broader policy processes in the region.
legal, economic (market) mechanisms, and proper investments/
technology transfer in the causal sectors.
The Policy options analysis (POA) present a series of policy options that
address the main root causes discussed in the previous section. Also,
Table 26 Summary of possible areas to explore in the Policy
experience from the region, e.g. Mauritius and Seychel es, shows that
option analysis.
many of these root causes can be turned into advantages to address the
Subject: Reducing the transboundary impacts of solid waste
problem of solid wastes, which is becoming an increasingly important
Issues that can be addressed:
transboundary issue since wastes are transported to and across the
Sources of solid waste
Economic approaches to solid waste management
open sea. It is important to note, however, that there are significant
Clean-up effort and costs
Legal frameworks for solid waste management
differences between all four countries in the region, and whilst some
Efficiency of col ection system
Investment policies for solid waste management
policies may work in the majority of cases, they may not necessarily
work in all instances. The analysis only attempts to provide insight into
Lack of funds for implementation
Community behaviour/change in attitudes
Waste reduction, recycling, reuse
which policy options may work and under particular conditions.
Investments in properly engineered disposal systems
policies
Monitoring of marine activities
Reducing health threats
Per capita consumption of wastes
Treatment technologies
Problem definition
Provision of solid waste management
Dealing with potential hazardous wastes and its degraded
infrastructure and support
components
The problem can be defined as:
These two preliminary hypotheses wil be vital components in the
Lack of management of solid wastes in the Indian Ocean Islands region
development of the policy options analysis. In this case, the hypothesis
leading to serious environmental and health problems on land and sea
wil be tested using a qualitative assessment of quantitative data in
58
GIWA REGIONAL ASSESSMENT 45B INDIAN OCEAN ISLANDS
POLICY OPTIONS
59
the form of proxy indicators. Whilst explanations can be given on
Modify framework of economic activity
the assumptions (also with reference to peer reviewed and published
Provide the service contract to several operators;
documents in other regions) in such a case, it is not possible to
Provide specialised services to only one operator;
quantitatively determine the relevance of these hypotheses. However,
Set the price for purchase of recyclable materials and compost;
the exercise will identify existing gaps and suggest how this additional
Increase employment opportunities.
information may be acquired in the future.
As with any environmental problem, there is a need to link the issue with
Final y, although a number of cases policy development is done in the
economic policies. These options attempt to introduce competition in
absence of hard scientific information, it is equal y important that the
the market in a structured manner: competition encouraged for certain
several principles enshrined in Agenda 21 are maintained in the review
components. Employment opportunities will be the likely outcome of
process; for example, the precautionary approach and the polluter pay
any creation of new services.
principle.
Taxes
Introduce taxes on consumer products;
Reduce taxes on waste separation and treatment technologies;
Construction of policy options
Tax the disposal of solid wastes by industry;
Reduce tax on recycled materials;
In the fol owing section, a series of policy options aimed at addressing
Introduce refundable deposits on containers.
each root cause is presented and analysed.
Taxes may provide the required funds to put in place proper waste
Root cause 1: Lack of investment planning and
management services. Introducing taxes on certain consumer products,
priorities
i.e. those that are not biodegradable and designed to be disposable,
would cause a reduction in the import of such products and also provide
Agency budgets
funds for the establishment of proper disposal facilities, assuming that a
Add/Increase budget al ocation for solid waste management;
sufficient amount continues to be imported. Reducing taxes on waste
Shift al ocation from another item in the budget to the use for solid
control technologies would provide the incentive for industries and
waste management;
consumers alike to invest in these technologies, with reduction in solid
Use budget al ocation to raise additional financing for solid waste
waste generation required for disposal. Pol uters would be made to pay
management.
for the amount of waste they generate. There are several advantages and
disadvantages in practice of this policy option. Reducing tax on recycled
The Government budget is usual y the first point of consideration
consumer products would al ow those types of products a bigger share
for any investment programme and service. Usual y, this comes out
of the market, thus encouraging producers to buy such products, as wel
of management plans or through political wil . Unfortunately, solid
as raising the awareness for more recycled products. The recycled product
wastes do not attract attention until they become an acute problem.
should also be evaluated according to its biodegradability or "recyclability"
Countries with solid waste infrastructure in place need the budgets
after use. Refundable deposits on containers such as bottles have worked
for maintenance of the facilities and also the col ection services.
for over 20 years in the Seychelles. The Seychelles Brewery uses glass
This could result in an increase in the budget (mostly unlikely, given
bottles at least 8 to 10 times through a bottle refundable deposit system.
current economic situations). In many instances, governments in the
This has brought about cuts in imports and reduction in wastes.
region are now using their budget, both capital and operating costs,
as counterpart funding to raise funding (in loan and grant form),
Subsidies and grants
particularly from the World Bank and the GEF, for development projects.
Introduce subsidies for all commercial operators that have a waste
The risks involved include tying up limited funds in project work, but
col ection service contract;
the benefits include achievable targets beyond what might be funded
Introduce subsidies to the municipality for solid waste col ection;
using annual budgets.
Provide grants for further research in the solid waste generation
and col ection.
58
GIWA REGIONAL ASSESSMENT 45B INDIAN OCEAN ISLANDS
POLICY OPTIONS
59
This option is more complicated in the context of solid wastes in the
them special powers or titles. One of the biggest hurdles in policing
region. The introduction of subsidies to encourage al commercial
regulations is building up a good enforcement team and keeping it.
operators to have waste col ection contracts wil provide some funding
Enforcement is one of the most serious problems facing countries
for a solid waste company to start operations and, through additional
the world over. Working with the judiciary is also required to improve
subsidies to the local municipality, provide funding for the col ection
effectiveness of the prosecution process and also to ensure that cases
of public wastes.
are dealt with efficiently. The public presents a good opportunity to
learn what is happening, as enforcement officers cannot always be
Grants and financial support for proper research is required to assist
present at every location al the time. However, it is important that
in the development of best col ection and disposal practices and
public complaints are taken seriously and proper fol ow-up is ensured.
strategies.
Modify structure of private rights
Root cause 2: Lack of effective mechanisms,
Re-assign/modify property rights to assign responsibility for
inadequate institutional structure, laws and
col ection of wastes;
capacity
Introduce liability duties to protect against ground water
pollution;
Regulations
Amend constitution to provide for a "right to enjoy a safe and clean
Establish waste management regulation to address: legal y
environment";
designated areas for solid waste disposal, specific environmental
Improve labour laws to ensure there are sound occupational
conditions/criteria for siting of landfills, and provide enforcement
health standards for the handling, col ection and disposal of solid
powers to officers;
wastes;
Adopt new standards for the construction of landfills, leachate
Upgrade corporate and company law to al ow companies to use
discharge, air quality at landfill sites and disposal of solid waste by
recycled waste materials in their products.
marine vessels;
Identify and close loopholes in the law to improve on enforcement
Improper al ocation of property rights is often a root cause of several
against littering and dumping of wastes at sea;
problems, including dumping of rubbish all over the place. Since solid
Explore more creative means of using the law to ensure compliance
waste management involves a degree of risk to the environment and
to existing laws/standards for solid waste disposal;
the welfare of people, introduction of liability funds (or compulsory
Improve enforcement capacity through training, more legal powers
insurance) may provide for those affected in the future by improper
and redevelop patrol strategy;
disposal of solid wastes. This may also include compensation to
Improve levels and convictions and reduce court time;
fishermen for loss of catch as a result of marine debris.
Effective fol ow-up of complaints by the public.
Root cause 3: Lack of adequate facilities, services
Command and control approaches are stil very common options
for collection and management of wastes
adopted by governments in addressing a problem. In Comoros and
Madagascar a legislative framework for solid waste management is
Financing and contracting
lacking. Standards can be adopted, noting that many countries have
Provide loans (soft or low-interest) for investment in new equipment
several years of experience in the commissioning and management of
and facilities;
landfil s. Technology transfer experience would be required especial y
Setup a public enterprise to address the problem of wastes;
with the introduction of new standards. In existing laws and regulations,
Privatise viable components of waste management;
the need to identify and address loopholes is an ongoing exercise
Reduce out-of-contract claims.
designed to improve effectiveness of the laws as wel as motivate
those who implement them. In view of the nature and complexity of
These options are the most common and are implemented in a number
the waste management problem, more creative approaches need to be
of instances, for example the creation of the Solid Waste Cleaning Agency
explored to ensure compliance; for example, reduction of enforcement
(SWAC) in Seychel es. Provision of loans to al operators in the solid waste
demand through involvement of the public in enforcement by giving
sector would allow them to prioritise areas of need and also respond
60
GIWA REGIONAL ASSESSMENT 45B INDIAN OCEAN ISLANDS
POLICY OPTIONS
61
to the improvement and performance reviews done to consistently
Education and consultation
improve the level of service. Reducing claims outside a contract is often
Education campaign to inform consumers about littering,
one of the largest sources of over-expenditure in a project.
accumulation of solid waste stockpiles along the road;
Consultation activities to obtain citizen views on how the col ection
Bureaucratic and political reforms
service should be done and how the service can be improved;
Decentralise service to the municipalities;
Develop a series of guidelines for the management of solid
Improve col ection frequency and coverage;
wastes;
Reduce time for issuance of solid waste disposal permits;
Training and capacity building programme.
Increase opening hours of landfil s.
Public education is a vital component of any solid waste management
The centralisation process is more pertinent in larger countries, but in
strategy, as the population needs to be educated in the proper use
small countries, the public can play the role in monitoring the service
of the waste receptacles, undertake home recycling schemes and so
provided by the state or a contracted company. Providing a better
on. Consultation is also vital to understand public preferences and
service with less bureaucratic loopholes would interest the private
behaviour. A solid waste management system is heavily dependent
sector and encourage foreign investment in the country.
upon the co-operation of the public. Improvements in the service
should be a continuing activity to reduce the amount of waste not
Provide a service
col ected. If a new service is being provided a dedicated training
Introduce a waste col ection service to cover the entire country, or
programme needs to be established, and existing service staff needs
add to an existing service to cover other towns;
retraining and upgrading from time to time.
Improve public use of the service by conducting outreach events;
Improve relationship among all service providers within the sector
to keep costs down and increase efficiency.
Identification of the
Providing a new service or extending on an existing service is a
recommended policy option
requirement in the region, since in some areas there is no service at
al . In some states, such as Madagascar, the best service is confined
The identification of the recommended policy options was based upon
to the capital, where less than 1% of the population lives. Activities
the analysis of the policy option against three main criteria: efficiency,
can be organised to improve public perception and effective use of
equity and practicality. The analysis is summarised in Table 27. It is once
the service. For example, in Seychel es, there is a recurrent problem
again important to stress that the analysis is based upon the views of
of how the public should use the public bins provided. Improving the
the experts involved in the GIWA Task team and not necessarily the
relationship among all operators within the sector is critical in keeping
views of the Governments, nor should it be implemented without
costs down and reducing cases where wastes are not col ected over
proper in-depth analysis of the local conditions. This exercise has
extended periods of time.
however, attempted to narrow down the potential policy areas which
may be further explored in future work.
Root cause 4: Lack of education and awareness
Twenty-six policies were selected using this initial screening process.
Information
The discussion and analysis in fol owing sections will further refine that
Monitoring and information sharing;
list to develop a feasible policy framework to address the issue of solid
Col ection of data on waste consumption, disposal (by type and
wastes in the region.
source).
The use of information in the implementation of solid waste
management is vital as it can improve understanding and management
of the solid waste issue. In fact, many studies have shown that costs
can be cut and the service improved if appropriate information for
management is obtained.
60
GIWA REGIONAL ASSESSMENT 45B INDIAN OCEAN ISLANDS
POLICY OPTIONS
61
Table 27 Rapid screening of policy options based upon the main criteria for Policy option analysis.
Evaluation
Policy options
Eff
Eq
Pr
FPO
T1
Introduce taxes on consumer products
T2
Reduce taxes on waste separation & treatment technologies
T3
Tax the disposal of solid wastes by industry
T4
Reduce tax on recycled materials
T5
Introduce refundable deposits on containers
Establish waste management regulation to address: legal y designated areas for solid waste disposal, specific environmental conditions/criteria for
R1
siting of landfil s, and provide enforcement powers to officers
R2
Adopt new standards for the construction of landfil s, leachate discharge, air quality at landfill sites and disposal of solid waste by marine vessels
R3
Identify loopholes in the law to improve on enforcement against littering and dumping of wastes at sea
R4
Explore more creative means of using the law to ensure compliance to existing laws/standards for solid waste disposal
R5
Improve enforcement capacity through training, more legal powers and redevelop patrol strategy
R6
Improve levels and convictions and reduce court time
R7
Effective fol ow-up of complaints by the public
S1
Introduce subsidies for all commercial operators for waste col ection service contract
S2
Introduce subsidies to the municipality for solid waste col ection
S3
Provide grants for further research in the solid waste generation and col ection
P1
Introduce a waste col ection service to cover the entire country, or add to an existing service to cover other towns
P2
Improve public use of the service by conducting several outreach events
P3
Improve relationship among all service providers within the sector to keep costs down and increase efficiency
B1
Add/Increase budget al ocation for solid waste management
B2
Shift al ocation from another item in the budget to use for solid waste management
B3
Use budget al ocation to raise additional financing for solid waste management
I1
Monitoring and information sharing
I2
Col ection of data on waste consumption, disposal ( by type and source)
PR1
Re-assign/modify property rights to assign responsibility for col ection of wastes
PR2
Introduce liability duties to protect against ground water pol ution
PR3
Amend constitution to provide for a `right to enjoy a safe and clean environment'
PR4
Improve labour law to ensure there are sound occupational health standards for the handling, col ection and disposal of solid wastes
PR5
Upgrade corporate and company law to al ow companies to use recycled waste materials for their use
EC1
Provide the service contract to several operators
EC2
Provide specialised services to only one operator
EC3
Set the price for purchase of recyclable materials and compost
EC4
Increase employment opportunities
ED1
Education campaign to inform consumers about littering, accumulation of solid waste stockpiles along the road
ED2
Consultation activities to obtain citizen views to improve service
ED3
Develop a series of guidelines for the management of solid wastes
ED4
Training and capacity building programme
FC1
Provide loans (soft or low-interest) for investment in new equipment and facilities
FC2
Setup a public enterprise to address the problem of wastes
FC3
Dismantle a public enterprise
FC4
Reduce out-of-contract claims
BP1
Decentralise service to the municipalities
BP2
Improve col ection frequency and coverage
BP3
Reduce time for issuance of solid waste disposal permits
BP4
Increase opening hours of landfil s
Note: Eff = economic efficiency; Eq = equitability; Pr = practicality; FPO = Favourable Policy Option; = fits policy criteria; blank = does not fit policy criteria.
62
GIWA REGIONAL ASSESSMENT 45B INDIAN OCEAN ISLANDS
POLICY OPTIONS
63
Performance of the chosen
are situations where the poverty levels are so high that they warrant
alternatives
government intervention, it is important that the financial implications
and the benefits are emphasised in awareness programmes.
In attempting to develop a policy framework to address the issue of
solid wastes in the region, it is important to emphasise two issues.
B3 - This policy option provides the best framework for capitalising on
Firstly, it is important that this framework is seen in the context of both
the use of the budget to secure additional funds that may be required at
market failure and government failure. Market failures occur due to the
the beginning to obtain solid waste collection and handling equipment.
lack of value given to water bodies, the coastal and open seas. These
Several banks, including the Asian Development Bank and the World
areas are often perceived by the public to be infinite and thus are used
Bank offer soft loans for the establishment of proper sanitary facilities. In
as human dumping grounds. Adoption of a valuation and property
Seychel es, the solid waste management plan has been financed jointly
assignment mechanism to those resources may provide some early pro-
from a grant from the Government of Seychel es and the European
active measures. Although the Government has intervened with laws
Union country programme.
and policies in an attempt to address the issue, they have not resolved
the issues which is why an analysis of government failure is also an
Evaluation
Policy options
Eff
Eq
Pr
FPO
important part of this analysis.
Add/Increase budget al ocation for solid waste
B1
management
Secondly, whilst the choice of policy instrument is based on the criteria
Shift al ocation from another item in the budget to
B2
use for solid waste management
given in the GIWA methodology for policy option analysis (and many
Use budget al ocation to raise additional financing
B3
environmental economics text books), there are nevertheless only
for solid waste management
Note: Eff = economic efficiency; Eq = equitability; Pr = practicality; FPO = Favourable Policy
three decision issues that need to be addressed in a policy design
Option; = fits policy criteria; blank = does not fit policy criteria.
process. These are (i) the choice of the appropriate target to which the
policy should be applied - emissions, production, exposure, etc.; (ii) the
Recommendation: Governments should al ocate sufficient budgetary
addressee - an individual, group of companies, the public, etc.; and (iii)
resources for solid waste management and use it for counterpart fund-
the target area - a catchment, vil age, the EEZ, a regional sea, etc. These
raising.
issues are discussed where relevant in the analysis but no specific details
are provided.
Modify framework of economic activity
Solid waste has the potential to provide revenue to government
A detailed analysis of each of the types of policy instruments as they
and employment if the national framework is designed accordingly.
apply to the issue is presented on the basis of their effectiveness,
Often, governments are occupied with such grand schemes that the
efficiency, equity, political feasibility, and implementation capacity.
potential benefits of recycling and reusing solid wastes are sidelined.
A definition of those criteria is given in the GIWA methodology
The two policies that will be considered here show that even in small
document.
economies some policy instruments can provide revenue in terms of
waste management.
Root cause 1: Lack of investment planning and
Evaluation
Policy options
priorities
Eff
Eq
Pr
FPO
EC1
Provide the service contract to several operators
Agency budgets
EC2
Provide specialised services to only one operator
Al ocation of budget resources is always the preferred approach to
Set the price for purchase of recyclable materials
EC3
and compost
financing solid waste management. Whilst this may be important in
EC4
Increase employment opportunities
the initial start-up phase, it is important that the costs of solid waste
Note: Eff = economic efficiency; Eq = equitability; Pr = practicality; FPO = Favourable Policy
col ection are passed in a transparent manner to the pol uters. If
Option; = fits policy criteria; blank = does not fit policy criteria.
the government is to pay for solid waste col ection, then the public
remain ignorant of the real costs, and thus are not inclined to take pro-
EC1 - This policy option appears conducive, but it promotes a
active measures to reduce the generation of wastes. Although there
contractual relationship, which does not include conditions for sorting
62
GIWA REGIONAL ASSESSMENT 45B INDIAN OCEAN ISLANDS
POLICY OPTIONS
63
and recycling of solid wastes. Under this arrangement, there are no
smal economies also needs to be taken into consideration, as often
incentives to the contractor to minimise on wastes, as more wastes
products are not imported in bulk and therefore do not attract the
mean more business.
same prices. Secondly, government already imposes various levels of tax
on consumer products to raise finances for government and projects.
EC 4 - The solid waste service can provide jobs in various areas of
For example, taxes on consumer products in Seychel es range from 5%
integrated solid waste management, from landfil operators, waste
(e.g. computers) to 150% (cars), with general consumption products
col ectors and operators of composting plants, sorters and so on.
such as food taxed between 10 and 40%, although this has recently
It is important however, that certain occupational health and safety
been superseded by a General Service Tax (GST) regime. In Mauritius,
procedures are put in place to safeguard the health of those workers.
a VAT system applies in view of progress towards market liberalisation.
The implementation capacity to administer a new tax is not considered
Recommendation: Explore opportunities for increasing revenue and
to be a big issue as the institutional framework is in place for the
employment from solid wastes.
management of taxes in the region.
Taxes
T2 - Reduction of taxes on imports of waste treatment technologies
Taxes are designed to target the person/organisation responsible for
was seen as a possible policy option for the region, on the basis of the
the environmental problem; in this case, the problem of solid wastes.
fol owing arguments: (i) to increase private sector investment in the
Taxes can be applied on each unit of consumption/emission (for
area of solid waste management, incentives need to be created as such
example a tax could be put on plastic bags, to reduce consumption
investments are costly; (i ) the tax foregone implies that there wil be
and hence disposal of plastic bags) or tax incentives could be provided
less waste generated and more wastes being treated cost effectively
to encourage reduction of waste generation (for example no col ection
(cost of treatment of waste may be reduced); and (iii) government can
taxes should be applicable to companies who keep their solid waste
put pressure on industries to comply with existing standards much
output at 10% of their production output). The rapid screening process
more easily. The only draw-back with this policy is that it can mainly be
identified the fol owing polices as being feasible for implementation
applied to the private sector, leaving a large proportion of those who
in the region:
are pol uting unregulated. This policy needs to be combined with other
polices in order to bring about net benefits to the country. In fact, in
Evaluation
the region (and within the international customs harmonised system),
Policy options
Eff
Eq
Pr
FPO
there is no separate category for waste minimisation technologies to
T1
Introduce taxes on consumer products
al ow this policy to be implemented easily without high administrative
Reduce taxes on waste separation & treatment
T2
overheads.
technologies
T3
Tax the disposal of solid wastes by industry
T3 - Taxes imposed on industries exceeding permissible limits
T4
Reduce tax on recycled materials
(calculated based upon their production and a benchmark for waste
T5
Introduce refundable deposits on containers
generation specific to that of industry) can be implemented based on
Note: Eff = economic efficiency; Eq = equitability; Pr = practicality; FPO = Favourable Policy
similar reasons given for T2, although the same disadvantages exist in
Option; = fits policy criteria; blank = does not fit policy criteria.
that they are restricted to large companies where administrative costs
T1 - Whilst the introduction of taxes on consumer products would have
would be low. Application of the tax to small and medium enterprises
a significant impact on reducing pol ution, since most of the population
and individuals is not feasible in terms of cost-effectiveness and
are within poor communities, and consumerism is not peaking, it was
implementation capacity. However, trials in the US, where individuals
felt that this tax would hit the poorest the hardest. In terms of equity,
were given pre-sized containers and they pay according to the number
a universal tax would impact in a similar manner both the urban and
of pre-sized containers used, have been successful in some areas and
the rural lifestyles. Political feasibility is also questionable as it implies
not in others. Experience shows that the system may cause an increase
a general rise in the cost of living, without the public understanding
in il egal dumps or cheating by consumers. Such a policy wil also
exactly why. The UNDP human development report uses an index
depend upon the environmental awareness of the community to which
cal ed public purchasing power to reflect ability, rather than the
the policy is being applied (reason why the addressee is an important
traditional GDP figures as a measure of wealth. The vulnerability of
consideration in policy development).
64
GIWA REGIONAL ASSESSMENT 45B INDIAN OCEAN ISLANDS
POLICY OPTIONS
65
T4 - A reduction of tax on recycled materials would seem to be a good
initiating a solid waste col ection/management service. Of the three
policy, but the initial screening indicated otherwise because: (i) the
subsides suggested (Table 27), only one was considered feasible for
levels of recycling are not yet sufficiently high to address the problem
implementation.
adequately, although the benefits are clearly discernible; (i ) recycled
products are usual y produced inside the country and therefore do not
S2 - Introducing subsidies for the municipality is critical to obtaining
attract a tax per se, but are protected against imports in some countries;
support from the municipality, but clear deliverables wil need to
(iii) consumer confidence in the quality of recycled products is lacking;
be specified and could be used as indicators such as, col ection
and (iv) imported recycled products (such as paper) tend to be more
service once a week, placement of receptacles within 100 m of each
expensive, implying either the production costs are still higher or the
household, etc. Provision of subsidies could also be provided to the
demand is still very low on the global market. It is clearly an area where
private sector but only in the case for the introduction of a new solid
more work needs to be done, so it is recommended that this policy
waste minimisation or treatment technology. This will also offset costs
option is modified to reflect more clearly the situation, vis:
of complying to the standards and ensure rapid implementation.
T4 (revised) - Implement tax incentives to improve the quality and
encourage use of recycled products.
Recommendation: Subsidies are provided (a) to the municipality to
commence a waste col ection service, and (b) to the private sector to
T5 - A refundable system on containers has been tried and has worked in
facilitate investment in waste minimisation/treatment.
some countries of the region. Refundable deposits require an additional
capital (for the deposit fund) and adequate technology to clean and
Root cause 2: Lack of effective mechanisms,
al ow the re-use of the container. However, in the case of PET bottles,
inadequate institutional structure, laws and
these can be returned for shredding and recycling into other plastic
capacity
products. Such a system has two basic advantages: (i) it ensures the
waste is returned to the owner who is then responsible for its disposal
Regulations
and, as a consequence, part of the disposal cost is passed on to the
Regulations have been the traditional approach adopted by
consumer, so the pol uter pays; and (i ) it saves the cost of sorting waste,
governments to address the growing problem of solid wastes, opting
as the containers have to be submitted free of other types of rubbish.
to fine those that fail to respect designated areas for solid waste
It is important that the system is not only limited to certain companies
disposal and refuse to make use of the facilities offered. On the other
or products. A nation-wide audit can yield interesting results. Having a
hand, without those facilities, government cannot enforce the law, even
huge proportion of wastes that are based upon the refundable deposit
though these are in place.
system can reduce the subsequent release of wastes into the marine
environment. The refundable deposit should also be sufficiently high to
Evaluation
Policy options
make returning the container after use worthwhile for the consumer.
Eff
Eq
Pr
FPO
Establish waste management regulation to address:
legal y designated areas for solid waste disposal,
Recommendations: On the basis of the above critical analysis, the
R1
specific environmental conditions/criteria for siting
fol owing tax instruments are proposed:
of landfil s, and provide enforcement powers to
officers
A national survey of products/wastes that wil form part of a
Adopt new standards for the construction of
refundable deposit system;
R2
landfil s, leachate discharge, air quality at landfill
sites and disposal of solid waste by marine vessels
Reduce taxes on waste separation and treatment technologies;
Identify loopholes in the law to improve on
Tax the disposal of solid wastes by industry;
R3
enforcement against littering and dumping of
Implement tax incentives to improve the quality and encourage
wastes at sea
Explore more creative means of using the law to
use of recycled products.
R4
ensure compliance with existing laws/standards for
solid waste disposal
Subsidies and grants
Improve enforcement capacity through training,
R5
more legal powers and redevelop patrol strategy
The adoption of subsidies or grants as a policy option for the
R6
Improve levels and convictions and reduce court time
management of solid wastes is important for two main reasons:
Note: Eff = economic efficiency; Eq = equitability; Pr = practicality; FPO = Favourable Policy
(i) to facilitate transfer of technology; and (i ) to reduce the cost of
Option; = fits policy criteria; blank = does not fit policy criteria.
64
GIWA REGIONAL ASSESSMENT 45B INDIAN OCEAN ISLANDS
POLICY OPTIONS
65
R1 - In Madagascar and Comoros, a framework for waste management
Evaluation
Policy options
is definitely required. Such regulations should also make the provision
Eff
Eq
Pr
FPO
for an environmental impact assessment to be undertaken prior to
Re-assign/modify property rights to assign
PR1
responsibility for col ection of wastes
establishment of the landfil .
Introduce liability duties to protect against
PR2
ground water pol ution
Amend constitution to provide for a right to enjoy
R2 - Standards to control emissions from landfil s are important to protect
PR3
a safe and clean environment
landfil workers and to reduce pol ution of the surrounding environment.
Improve labour law to ensure there are sound
PR4
occupational health standards for the handling,
Standards, however, need to be supported by an adequate monitoring
col ection and disposal of solid wastes
programme, something that is lacking in the region, except for Mauritius,
Upgrade corporate and company law to al ow
PR5
companies to use recycled waste materials for
which has advanced facilities for pol ution monitoring.
their use
Note: Eff = economic efficiency; Eq = equitability; Pr = practicality; FPO = Favourable Policy
Option; = fits policy criteria; blank = does not fit policy criteria.
R4 - Ironical y, exploration of creative legal means is not possible
without the involvement of stakeholders. Stakeholder input in the
the constitution is revised to provide a clear mandate and constitutional
legal development process is often ignored but it can be useful in
stand on issues of environmental rights.
brainstorming around potential legal problems and in many cases come
up with practical, but unorthodox, solutions to impending problems.
PR 4 - Improvements in the quality of life for those who handle solid
waste is an important consideration, but that can be considered part of
R5 - This option is a definite necessity because, without adequate
the operational procedures for the waste col ection service.
training, cases are usually not prepared very well, and successful
prosecutions are rare.
PR 5 - Al owing use of recycled products by the private sector will be an
important step forward but will not address the root cause associated
Recommendations:
with property rights.
Establishment of regulatory framework;
Development of emissions standards for landfil s, etc.;
Recommendation: Citizens should be given the constitutional right to
Improve compliance through stakeholder involvement;
a clean and safe environment, as wel as a clear definition of existing
Training in legal enforcement.
property rights.
Modify structure of private rights
The structure of property rights in the island states of the region can be
Root cause 3: Lack of adequate facilities, services
complex, since the islands were colonised by the French and British and, in
for collection and management of wastes
the case of Comoros, have a strong influence of Islamic customs and laws.
In Madagascar and Comoros, traditional precedence occurs, whereas in
Provide a service
Mauritius and Seychel es, land tenure is based upon the British system.
The provision of consistent and adequate services is the backbone of
However, a number of areas are declared as government state land or
any successful solid waste management policy. Whatever policies are
as "public domain" that is belonging to the state for the enjoyment of
put in place, solid wastes will still be generated and these will need to
the public. These include river banks, wetlands, beaches and the sea.
be disposed of in the most sustainable manner. Recycling, reuse etc.,
Consequently, solid wastes are most associated with those areas that have
can occur at local level, but residual wastes wil always remain, and
been label ed "public domain". So the dilemma is how to use existing land
those often end up in the environment. For example, on the refundable
tenure frameworks, which differ across the region to address this problem.
bottle there is a cap, and since there is no refund for the bottle caps in
A number of options are presented and briefly explored below.
Seychel es, they end up at the beaches. A bottle-top competition was
organised in 1994/1995 which resulted in the col ection of more than
PR3 - Providing a constitutional right to a clean and safe environment
500 000 bottle tops.
is one of the most important activities, especial y for small island states.
Although this policy may not be entirely feasible in the short-term in
P1 - Fol owing establishment of the municipal waste service,
some countries, it is important to have it on the agenda as and when
opportunities to extend the service to rural areas must be explored. This
66
GIWA REGIONAL ASSESSMENT 45B INDIAN OCEAN ISLANDS
POLICY OPTIONS
67
system may include col ection of wastes in a mixed state, later
Evaluation
Policy options
Eff
Eq
Pr
FPO
developments in the service would require the public to start sorting
Introduce a waste col ection service to cover the
their waste into plastic, paper and glass. Without proper education
P1
entire country, or add to an existing service to
cover other towns
this is unlikely to be successful. For example, in Seychel es, individual
waste sorting schemes are being pilot tested in one small vil age before
Improve public use of the service by conducting
P2
outreach events
the initiative is launched nationwide. Piloting wil al ow lessons to be
Improve relationship among all service providers
learned and also gauges public response to the new approach.
P3
within the sector to keep costs down and
increase efficiency
Note: Eff = economic efficiency; Eq = equitability; Pr = practicality; FPO = Favourable Policy
Evaluation
Option; = fits policy criteria; blank = does not fit policy criteria.
Policy options
Eff
Eq
Pr
FPO
Education campaign to inform consumers about
could be done through public-private sector initiatives with financial
ED1
littering, accumulation of solid waste stockpiles
support from the central government. In providing funds for the waste
along the road
Consultation activities to obtain citizen views to
col ection service, one should weigh the costs of return on tourism and
ED2
improve service
the cost of solid waste management.
Develop a series of guidelines for the
ED3
management of solid wastes
ED4
Training and capacity building programme
Recommendation: Put in place an efficient solid waste col ection
Note: Eff = economic efficiency; Eq = equitability; Pr = practicality; FPO = Favourable Policy
system for the municipalities in the first instance with plans to extend
Option; = fits policy criteria; blank = does not fit policy criteria.
the service to rural areas of the country.
Recommendation: Put in place an education programme to increase
Root cause 4: Lack of education and awareness
awareness and action.
Information
Information forms the basis of any policy development, and without
adequate information policy alternatives cannot be adequately
considered. This report identified a number of areas where data is
lacking.
Evaluation
Policy options
Eff
Eq
Pr
FPO
I1
Monitoring and information sharing
Col ection of data on waste consumption,
I2
disposal (by type and source)
Note: Eff = economic efficiency; Eq = equitability; Pr = practicality; FPO = Favourable Policy
Option; = fits policy criteria; blank = does not fit policy criteria.
I1 and I2 - Having in place a solid waste col ection, disposal and
performance of the landfil is important for policy and technical
reasons. Sharing of information is a requirement, especial y when all
stakeholders including the private sector are becoming involved in
this new type of business. The cost of implementing this policy can
be rather long-term as the impacts of awareness campaigns are not
immediately noticeable.
Education and consultation
This is neither a cost-effective nor efficient policy, but is needed to
ensure long-term involvement of stakeholders in maintaining the solid
waste management system. Whilst the initial stage of a management
66
GIWA REGIONAL ASSESSMENT 45B INDIAN OCEAN ISLANDS
POLICY OPTIONS
67
Conclusions and recommendations
In order to develop a policy framework to address one of the most
Data presented in the causal chain analysis describes the volumes of
serious international waters issue in the Indian Ocean Islands region, the
uncol ected solid waste in each of the four countries within the Indian
four step GIWA assessment process was adopted. Each of these steps
Ocean Islands region and illustrates the transboundary implications of
provided a series of insights into the main issues within the region. Most
solid waste dispersal once it ends up in the sea.
importantly, the report concluded that in contrast to many other regions,
the Indian Ocean Islands region is characterised by one large island and
The policy analysis resulted in more than 30 possible policy options
three small islands, each having very large Exclusive Economic Zones.
but when these were evaluated in their regional context for efficiency,
Although the catchments and flood plains are very small, the impact
equitability, and practicality, some were rejected. Further analysis of the
of activities on those islands are considered to be alarming, especial y
selected policy options generated a series of recommendations as key
within the coastal and shal ow marine environment.
output of this report. These recommendations are:
The impact assessment showed that the levels of human impacts
1. To perform a national survey of products/wastes that will
on natural systems and resources have increased. Impacts of global
form part of a refundable deposit system.
change, such as coastal erosion and coral bleaching, seem to be the
2. Reduce taxes on waste separation and treatment technologies.
biggest threat to development in the region. The assessment, however,
3. Tax the disposal of solid wastes by industry.
concluded that Pollution is the most significant GIWA concern for the
4. Implement tax incentives to improve the quality and
Indian Ocean Islands region, fol owed by Global Change. The improper
encourage use of recycled products.
disposal of solid wastes and eutrophication as a result of poor treatment
5. Subsidies are provided (a) to the municipality to commence
facilities were identified as the most severe issues. The risk of oil spil s
a waste collection service, and (b) to the private sector to
is also considered to be an important issue for the region, since it
facilitate investment in waste minimisation/treatment.
is located within an area of high tanker traffic. Other issues, such
6. Establishment of a regulatory framework.
as overexploitation of fish and habitat modification, also received
7. Development of emissions standards for landfills, etc.
attention, implying that those impacts are very much linked to the
8. Improve compliance through stakeholder involvement.
presence of humans.
9. Training in legal enforcement.
10. Put in place an efficient solid waste collection service of the
The causal chain analysis resulted in the identification of four root causes:
entire territory.
Lack of investment planning and priorities;
11. Governments should allocate a sizeable proportion of their
Lack of effective mechanisms, inadequate institutional structure,
national budget for solid waste management and use that for
laws and capacity;
counterpart fund-raising.
Lack of adequate facilities, services for col ection and management
12. Citizens should be given a constitutional right to a clean and
of wastes;
safe environment, as well as a clear definition of existing
Lack of education and awareness.
property rights.
13. Explore opportunities for increasing revenue and employ-
ment from solid wastes.
68
GIWA REGIONAL ASSESSMENT 45B INDIAN OCEAN ISLANDS
CONCLUSIONS AND RECOMMENDATIONS
69
14. Establish an education programme to increase awareness and
action.
In conclusion, it is important to highlight the various knowledge and
research gaps which may need to be tackled in another programme.
These include:
Lack of long-term assessment data;
No information on the status of certain marine mammals and
reptiles;
Socio-economic information is not within easy access.
68
GIWA REGIONAL ASSESSMENT 45B INDIAN OCEAN ISLANDS
CONCLUSIONS AND RECOMMENDATIONS
69
References
Ahmed, A. and Abdou, F. (2002). Integrated Coastal Zone Management
Bryant, D., Burke, L., McManus, J.W. and Spalding, M. (1998). Reefs at Risk:
in Comoros. In: Voabil, C. and Engdahl, S. (eds), The Voyage from
A map-based indicator of threats to the world's coral reefs. World
Seychel es to Maputo: Successes and Failures of Integrated Coastal
resource insitute. Retrieved June, 2003, from http://wri.igc.org/
Management in Eastern Africa and Island States, 1996-2001, Vol 2.
reefsatrisk/.
SEACAM Publication.
Bryden, H. and Beal, L.M. (2001). Role of the Agulhas Current in Indian
Atkins, J.P., Mazzi, S. and Easter, C. D. (2001). Small States: A Composite
Ocean circulation and associated heat and freshwater fluxes. Deep-
Vulnerability Index. In: Peretz, D. et al. (ed), Smal States in the Global
Sea Research, 48:1821-1845.
Economy. Commonwealth Secretariat, UK.
CDP, Committee for Development Policy (2000). CDP's Economic
Banque Mondiale (1992). Etude sectoriel e de l'agriculture irriguée.
Vulnerability Index. Explanatory Note. CDP/2000/PLEN/21, UK.
Division agriculture, Département des pays des grands lacs et de
Cesar, H. (ed) (2000). Col ected Essays on the Economics of Coral Reefs.
l'océan Indien, Région Afrique, Washington DC.
CORDIO, Kalmar, Sweden.
Banque Mondiale (1993). République fédérale islamique des Comores:
CIA World Fact Book (2002). Retrieved June 30, 2002, from http://
Stratégie pour une croissance agricole. Report No. 1151-COM,
www.cia.gov/cia/publications/factbook/geos/ma.htm.
Washington DC.
Coche, A.G., Haight, B. and Vincke, M. (1994). Aquaculture development
BDPA (1991). Etude de la stratégie agricole des Comores. BDPA - Bureau
and research in sub-Saharan Africa. Synthesis of national reviews
pour le Development de la Production Agricole, Moroni, Comores.
and indicative action plan for research. CIFA Technical Paper. No.
Bensaid, R. (1992). Amélioration de la productivité durable. Rapport
23. FAO, Rome.
consultatif de programmation du 5čme cycle du PNUD, FAO, Rome.
Cockcroft, V.G. and Young, D.D. (1998). An investigation of the status of
Bergeron, G. (2001). Food Security in Madagascar: A Situation Analysis.
coastal marine resources along the west coast of Madagascar. World
Food and Nutrition Technical Assistance Project, Academy for
Wide Fund for Nature (WWF), Gland, Switzerland, (unpublished).
Educational Development, Washington, D.C.
Coe, J.M. and Rodgers, D. (eds) (1997). Marine Debris: Sources, Impacts,
Bhikajee, M. (1997). Recent Advances In Aquaculture In Mauritius. In:
Solutions, Springer Series on Environmental Management.
The second Annual Meeting of Agricultural Scientists of Mauritius,
Cooke, A.J. (1993). Coral reefs and coastal zone of Toliara: conservation
Mauritius. University of Mauritius.
and development through ecotourism. Pre-Project. World Wide
Braithwaite, C.J.R. (1984). Geology of the Seychel es. In: Stoddart,
Fund for Nature (WWF), Gland, Switzerland.
D.R. (ed), Biogeography and Ecology of the Seychel es. Kluwer
CSIRO (1998). Two year ocean buoy drift ends on King Island. CSIRO marine
Publishers, The Netherlands.
research. Retrieved Nov., 2002, from http://www.marine.csiro.au/
Briggs, J.C. (1974). Marine Biogeography. McGraw-Hil Book Company,
PressReleasesfolder/98releases/26nov98.html.
New York.
Cushing, D.H. (1973). Production in the Indian Ocean and the transfer
Briguglio, L.P. (1995). Smal Island States and their economic
from the primary to the secondary level. In: Zeitzschel, B. (ed), The
vulnerabilities. World Development, 23.
biology of the Indian Ocean. Springer-Verlag, Berlin, p 243-255.
Davenport, M. (2001). A study of Alternative Special and Differential
Arrangements for Smal Economies. The Commonwealth
Secretariat.
70
GIWA REGIONAL ASSESSMENT 45B INDIAN OCEAN ISLANDS
REFERENCES
71
Derraik, J.G.B. (2002). The pol ution of the marine environment by plastic
Gramentz, D. (1988). Involvement of loggerhead turtle with the plastic,
debris: a review. Marine Pollution Bul etin, 44:842-852.
metal, and hydrocarbon pol ution in the Central Mediterranean.
Dulymamode, R., Bhikajee, M. and Sanassee, V. (2002). Mauritius National
Marine Pollution Bul etin, 19:11-13.
Report. GEF MSP Sub-Saharan Africa Project (GF/6010-0016):
Grange, N. and Odendaal, F. (1999). Guidelines for the Environmental
"Development and Protection of the Coastal and Marine Environment
Assessment of Coastal Tourism. SEACAM, Maputo, Mozambique.
in Sub-Saharan Africa". GEF/UNEP/UNESCO/GPA/ACOPS Report.
Gregory, M.R. (1999). Plastics and South Pacific Island shores: environmental
Dutton, P. (1998). East African dugongs disappearing. Sirenews:
implications. Ocean & Coastal Management, 42:603-615.
Newsletter of the IUCN/SSC Sirenia Specialist Group, 29.
Gul ström, M., de la Torre Castro, M., Bandeira, S.O., Björk, M., Dahlberg,
ERM (1999). National Environmental Strategies for the Republic of
M., Kautsky, N., Rönnbäck, P. and Öhman, M.C. (2002). Seagrass
Mauritius. National Environment Action Plan for the next decade.
Ecosystems in the Western Indian Ocean. AMBIO, 31:588-596.
Government of Mauritius Publication.
Henri, K. (1999). Water sector Study, Government of Seychel es. Victoria,
Fagoonee, I. and Daby, D. (1993). Coastal Zone Management in Mauritius.
Seychel es, (unpublished).
In: Linden, O (ed), Proceedings of the Workshop and Conference on
Hoegh-Guldberg, O. (1999). Climate Change, coral bleaching and the
Integrated Coastal Zone Management in Eastern Africa including
future of the world's coral reefs. Marine Freshwater Research, 50:
the Island States. SAREC.
839-866.
FAO (1989). La stratégie du secteur agricole. Report No. 88/89 TA-SEY 4,
Hydroplan (2003). Evaluation of the Anse Royale Solid Waste Disposal
FAO Centre d'Investissment, Rome.
Project (8 ACP SEY.001) - Final Report. Victoria, Seychel es.
FAO (1997). Review of the state of world fishery resources: marine
IOTC (2002). Indian Ocean Tuna Commission. Retrieved Jan., 2003, from
fisheries. FAO Fisheries Circular. No. 920. FAO, Rome.
www.iotc.org.
FAO (1999). Number of fishers 1970-1996. United Nations, Rome.
IPCC (2001). Climate Change Impacts, Vulnerability & Adaptation. IPCC
FAO-Aquastat (2003). Retrieved Jan., 2003, from http://www.fao.org/
Working Group II Report. Cambridge Univeristy Press, UK.
waicent/faoinfo/agricult//AGL/AGLW/aquastat/dbase/index.stm.
ITW (1994). Solid Waste Management Study for Mahé, Project
FAOSTATS (2002). Retrieved Dec., 2002, from http://www.fao.org.
6.ACP.SEY.015. Government of Seychel es and European Union,
Fent, K. (2003). Ecotoxicological problems associated with contaminated
Seychel es.
sites. Toxicology Letters, 140-141:353-365.
IUCN/UNEP (1984). Marine and coastal conservation in the East African
Fishbase (2003). Retrieved March, 2003, from http://www.fishbase.org.
region, UNEP Regional Seas Reports and Studies 39. Nairobi, Kenya.
Fricke, H. and Hissmann, K. (2000). Feeding ecology and survival of the
Joignerez, A., Ranaivoson, J. and Healy, T. (2002). Integrated Coastal Zone
living coelacanth. Marine Biology, 136:379-386.
Management in Madagascar. In: Voabil, C. and Engdahl, S (eds),
Gabriel, M., Marshal , S. and Jennings, S. (2000). The Seychel es. In:
The Voyage from Seychel es to Maputo: Successes and Failures of
Sheppard, C. (ed), Seas at the Mil ennium- An Environmental
Integrated Coastal Management in Eastern Africa and Island States,
Evaluation. Pergamon, UK.
1996-2001, Vol 2. SEACAM.
GEF (1992). Seychel es: Biodiversity Conservation and Marine Pollution
Jones, T., Payet, R.A., Beaver, K. and Nal etamby, M. (2002). Seychel es
Abatement Project. Project Document. World Bank, Washington.
National Report, Phase 1: Integrated Problem Analysis. (Sub-Saharan
GEF (1999). Western Indian Ocean Islands Regional Oil Spil Contingency
Africa UNEP GEF Project). Seychel es.
Planning Project. GEF (World Bank) and IPIECA, USA.
Kel eher, G., Bleakley, C. and Wells, S. (1995). A global representative
GEO Data Portal (2003). Global Environment Outlook Data Portal.
system of marine protected areas: Vol. I. Antarctic, Arctic,
Retrieved Jan., 2003, from http://geodata.grid.unep.ch/.
Mediterranean, Northwest Atlantic, Northeast Atlantic and Baltic.
Global River Discharge Database (2002). Retrieved Dec., 2002, from http:
Vol. I . Wider Caribbean, West Africa and South Atlantic; Vol. I I.
//www.daac.ornl.gov/RIVDIS/guides/rivdis.html.
Central Indian Ocean, Arabian Sea, East Africa and East Asian Seas;
Global Wetlands Database (2003). Retrieved March, 2003, from http:
Vol. IV. South Pacific and Australia/New Zealand., Great Barrier Reef
//www.wetlands.org/.
Marine Park Authority, The World Bank, The World Conservation
Grainger, R.J.R. and Garcia, S.M. (1996). Chronicles of marine Fishery
Union (IUCN), Gland, Switzerland.
Landings (1959-1994): Trend Analysis and Fisheries Potential. Report
No. 359, FAO, Rome.
70
GIWA REGIONAL ASSESSMENT 45B INDIAN OCEAN ISLANDS
REFERENCES
71
Laist, D.W. (1997). Impacts of marine debris: entanglement of marine
Mortimer, J.A. (1999). World's first turtle shell stockpile to go up in flames
life in marine debris including a comprehensive list of species with
as Miss World 1998 contestants look on. Chelonian Conservation
entanglement and ingestion records. In: Coe, J.M. and Rogers, D.B.
and Biology, 3:376-377.
(eds), Marine Debris-Sources, Impacts and Solutions. Springer-
Mortimer, J.A. and Bresson, R. (1999). Temporal distribution and
Verlag, New York, p 99-139.
periodicity in hawksbil turtles (Eretmochelys imbricata) nesting
Lebigre, J-M. (1990). Les marais maritimes du Gabon et de Madagascar.
at Cousin Island, Republic of Seychel es, 1971-1997. Chelonian
Thčse de Doctorat e'Etat, Institut de Géographie, Univ. de Bordeaux
Conservation and Biology, 3:318-325.
I I.
MPRH, Ministere de la Peche et des Ressources Halieutiques (1999).
Lebigre, J-M. (1997). Les marais ŕ mangrove du Sud-Ouest de
Rapport Activites. Madagascar.
Madagascar. Des palétuviers et des hommes au pays des épines
Nguta, N. (1998). An overview of marine pol ution in the east African
- Milieux et sociétés dans le Sud-Ouest de Madagascar. Col ection
region. In: Sherman, K., Okemwa, E.N. and Ntiba, M.J. (eds), Large
Iles et Archipe, 23:135-242.
Marine Ecosystems of the Indian Ocean- Assessment, sustainability
Linden, O., Souter, D., Wilhelmsson, D. and Obura, D. (2002). Coral Reef
and management. Blackwell science, USA, p 61-72.
Degradation in the Indian Ocean - Status Report 2002. CORDIO,
Nriagu, J., Champak, C., Naidoo, R. and Coutsoudis, A. (1997). Lead
Sweden.
poisoning of children in Africa, I . Kwazulu/Natal, South Africa. The
Linden, O. and Sporrong, N. (eds) (1999). Coral Reef degradation in
Science of The Total Environment, 197:1-11.
the Indian Ocean - Status reports and project presentations 1999.
Payet, R.A. (1996). A marine debris study on Mahe Island. WIOMSA, Seychel es.
CORDIO, Sweden.
Payet, R.A. (1998). Environment Impact Assessment for the Phase I I of the
Lundin, C.G. and Linden, O. (eds) (1995). Integrated Coastal Zone
East Coast Reclamation. Government of Seychel es, Seychel es.
Management in Seychel es. In: Proceedings from a National
Payet, R.A. (1999). Environmental Impact Assessment: East Coast Phase
Workshop, 20-24 February. Government of Seychel es/Sida.
I I. Ministry of Land Use and Habitat, Seychel es.
Madzena, A. and Lasiak, T. (1997). Spatial and temporal variations in
Payet, R. A. (2002). Integrated Coastal Zone Management in Seychel es.
beach litter on the Transkei coast of South Africa. Marine Pollution
In: Voabil, C. and Engdahl, S. (eds), The Voyage from Seychel es to
Bul etin, 34:900-907.
Maputo: Successes and Failures of Integrated Coastal Management
Marsh, H., Penrose, H., Eros, C. and Hugues, J. (2002). Dugong Status
in Eastern Africa and Island States, 1996-2001, Vol 2. SEACAM
Report and Action Plans for Countries and Territories. Early
Payet, R.A. (2003). Effectiveness of the Environmental Impact Assessment
Warning and Assessments Report Series, UNEP/DEWA/RS.02-1.
Process in Managing Tourism Development in the Seychel es. In:
UNEP, Kenya.
Chaytor, B. and Gray, K.R. (eds), International Environmental Law and
Matthes, H. and Kapetsky, J.M. (1988). Worldwide compendium of
Policy in Africa. Kluwer Academic Publishers, The Netherlands.
mangrove-associated aquatic species of economic importance.
Payet, R.J. (1997). Marine Resource Use of Seychel es. In: EEZ Technology.
FAO Fish Circular 814. FAO, Rome.
4th Edition. ICG Publishing Limited, UK.
MCA (1998). Mauritius Chamber of Agriculture, Annual Report 1996-
Peretz, D., Faruqi, R. and Kisanga, E.J. (eds) (2001). Smal States in the
1997. Port Louis, Mauritius.
Global Economy. Commonwealth Secretariat, UK.
McAl ister, D.E., Schueler, F.W., Roberts, C.M. and Hawkins, J.P. (1993).
Pierre de Boucherville, B. (1997). Marine Country Profile, Mauritius. Marine
Mapping and GIS analysis of the global distribution of coral reef
Science Association (WIOMSA) and International Oceanographic
fishes on a equal-area grid. In: Mil er, R. (ed), Mapping the Diversity
Commission (IOC).
of Nature. Chapman and Hal , UK.
Plummer, S. (1995). Ages and geological significance of the igneous
McClanahan, T.R., Sheppard, C.R.C. and Obura, D.O. (2000). Coral Reefs
rocks from Seychel es. Journal of African Earth Sciences, 20:91-101.
of the Indian Ocean. Oxford University Press, UK.
Quod, J.P., Turquet, J., Conejero, S. and Ralijaona, C. (2000). Ciguatera
Mees, C.C., Shotton, R. and Marguerite, M. (1998). An inshore fisheries
risk assessment in the Indian Ocean fol owing the 1998 coral
management strategy for Seychel es. Final Report of Project No.
bleaching event. In: Souter, D., Obura, D. and Linden, O. (eds), Coral
FAO/TCP/SEY/6713(A). Seychel es Fishing Authority, Government
Reef Degradation in the Indian Ocean, Status Report 2000. CORDIO,
of Seychel es, Seychel es.
Sweden, p 166-168.
72
GIWA REGIONAL ASSESSMENT 45B INDIAN OCEAN ISLANDS
REFERENCES
73
Rabelahatra, A. (1988). Etudes nationales pour le développement de
Spalding, M.D., Ravilious, C. and Green, E.P. (2001). World Atlas of Coral
l'aquaculture en Afrique.22. Madagascar. FAO Fisheries Circular
Reefs. Prepared at the UNEP World Conservation Monitoring Centre.
(770.22).
University of California Press, Berkeley, USA.
Ramage, C.S. (1969). Indian Ocean Surface Meteorology and
Stequert, B. and Marsac, F. (1989). Tropical Tuna - surface fisheries in the
Oceanography. Marine Biology, 7:11-30.
Indian Ocean, FAO Fisheries Technical Paper, No. 282. FAO, Rome.
Ramessur, R.T., Parry, S.J. and Jarvis, K.E. (1998). Characterisation of
Stiassny, M.L.J. and Raminosoa, N. (1994). The fishes of the inland waters
some trace metals from the export processing zone and a coastal
of Madagascar. Biological diversity in African fresh and brackish
tourist area in Mauritius using inductively coupled plasma mass
water fishes, 275:133-149.
spectrometry. Environment International, 24:773-781.
Taylor, M., Ravilious, C. and Green, E.P. (2003). Mangroove areas in East
Ranaivoson, E. (1998). Biodiversité côtičre et marine. In: Monographie
Africa. UNEP-GPA, UNEP-WCMC, UK.
Nationale sur la Biodiversité. UNEP, ONE, ANGAP, Ministčre de
Tomczak, M. and Godfrey, J.S. (2001). Regional Oceanography: An
l'Environnement, Ministčre des Eaux et Foręts, Madagascar, p 117-
Introduction. Original y published by Pergamon 1994. Retrieved
137.
Jan., 2002, from http://www.es.flinders.edu.au/~mattom/regoc/
Ranaivoson, J. (1996). Marine Pollution in Madagascar. Tropical Coasts,
pdfversion.htm.
3:July.
Toradec, R. (2000). Contribution a la lutte anti-erosive de al vil e de
Ranaivoson, J. (1997). Marine Science Country Profiles, Madagascar.
Morondava. Appui pour fiches de projects. PRE-COI/UE GREEN-
Western Indian Ocean. Marine Science Association (WIOMSA) and
OI, Madagascar.
International Oceanographic Commission (IOC), Madagascar.
UNDP (2000). Human Development Report 2000. United Nations
Ryan, P.G. and Moloney, C.L. (1990). Plastic and other artefacts on South
Development Programme. Oxford University Press, New York.
African beaches: temporal trends in abundance and composition.
UNEP (1984). Marine Coastal Conservation in the Eastern African
South African Journal of Science, 86:450-452.
Region. UNEP Regional Seas Reports and Studies No. 39. Prepared
Salm, R. (1976). The structure and successional status of three coral reefs
in cooperation with IUCN, Nairobi, Kenya.
at Mauritius. Proceedings of the Royal Society of Arts and Sciences
UNEP (1998). Western Indian Ocean Transboundary Diagnostic Analysis.
of Mauritius, 3:227-240.
Institute of Marine Sciences, University of Dar es Salaam, Tanzania.
Salm, R.V. (1994). Corals Hidden Riches. Life on the Margin. People & the
UNEP (1999). Western Indian Ocean Environment Outlook. IOC/UNEP/
Planet, 3:19-22.
EU, Nairobi, Kenya.
Salm, R.V., Clark, J. and Si rila, E. (2000). Marine and Coastal Protected
UNEP (2001). Nairobi Convention UNEP/RCU Regional Country Studies
Areas: A guide for planners and managers. IUCN., Washington DC.
on MPA Status, 2000. Nairobi, Kenya, (unpublished).
Salmon, J.M. (2002). Identification mission concerning the specific
UNEP (2002). Africa Environment Outlook: Past, present and future
themes of smal and vulnerable island economies in the
perspectives. Earthprint Limited, UK.
forthcoming negotiations of economic partnership agreements
UNEP/IUCN (1988). Coral Reefs of the World. Volume 2; Indian Ocean, Red
between the EU and ACP countries. Negotiations context and
Sea and Gulf. UNEP Regional Seas Directories and Bibliographies.
Indian Ocean Commission (IOC) Smal and Vulnerable States
IUCN, Gland, Switzerland/Nairobi, Kenya.
Peculiarities. IOC, Mauritius.
UNICEF (2003). Retrieved April, 2003, from http://www.unicef.org.
Scetauroute (1999). Comores: Infrastructure, Eau, Environnement -
Vanden Bossche, J.-P. and Bernacsek, G.M. (1990). Source book for the
Etude d'impact sur l'Environnement, Document E-388. World Bank
inland fishery resources of Africa: 1. CIFA Technical paper. Report
Publication, USA.
No. 18.1, FAO, Rome.
SFA, Seychel es Fishing Authority (2000). Annual Report. Victoria,
Vorosmarty, C. J., Fekete, B. M. and Tucker, B. A. (1998). Global River
Seychel es.
Discharge, 1807-1991. Oak Ridge National Laboratory Distributed
Shah, N.J., Payet, R.A. and Henri, K. (1997). National Biodiversity Action
Active Archive Center, Oak Ridge, Tennessee, USA. Retrieved April,
Plan. IUCN/Government of Seychel es, Victoria, Seychel es.
2003, from http://www.daac.ornl.gov.
SMB (2000). Annual Report. Seychel es Marketing Board, Seychel es.
Walker, T.R., Reid, K., Arnould, J.P.Y. and Croxal , J.P. (1997). Marine Debris
Souter, D. and Linden, O. (2000). The health and future of coral reef
Surveys at Bird Island, South Georgia 1990-1995. Marine Pol ution
systems. Ocean & Coastal Management, 43:657-688.
Bul etin, 34:61-65.
72
GIWA REGIONAL ASSESSMENT 45B INDIAN OCEAN ISLANDS
REFERENCES
73
World Bank (1979). The Comoros: Problems and Prospects of a Smal ,
Island Economy, A World Bank Country Study. Report No. 1626,
World Bank, Washington DC., USA.
World Bank (1992). Mauritius: Expanding horizons. Report No. 9685-MAS,
Washington DC. USA.
World Bank (1998). Madagascar - An Agenda for Growth and Poverty
Reduction Country Economic Memorandum. Report No. 18473-
MAG, World Bank, USA.
World Bank (2000a). Comoros-Environment, Water and Infrastructure,
Project report No. PID8012. Washington DC. USA, (unpublished).
World Bank (2000b). Statistics: Madagascar at a Glance. Washington
DC., USA.
World Bank country profiles database (2003). Retrieved Jan., 2003, from
http://devdata.worldbank.org.
WRI, World Resource Institute (2001). The Earth Trends. Environment
Information Portal (2000-2001). Retrieved Dec., 2002, from http:
//earthtrends.wri.org/.
WRU, Water Resources Unit (1997). Hydrology Databook:1991/1992-
1994/1995 (Draft) prepared by Technical Advisors under the
Government of Mauritius - UNDP-IBRP agreements. Ministry of
Environment & Land Use.
WWF (2002). Summary Briefing: Indian Ocean Whale Sanctuary. WWF.
Retrieved Jan., 2003, from http://www.panda.org/downloads/
species/IndianOceanSanctuarySummaryBriefing.doc.
Yoshida, K., Ikeda, S., Nakanishi, J. and Tsuzuki, N. (2001). Validation of
modelling approach to evaluate congener-specific concentrations
of polychlorinated dibenzo-p-dioxins and dibenzofurans in air and
soil near a solid waste incinerator. Chemosphere, 45:1209-1217.
74
GIWA REGIONAL ASSESSMENT 45B INDIAN OCEAN ISLANDS
Annexes
Annex I
List of contributing authors and organisations
Lead Author and Coordinator
Rolph Payet
Interim Coordinator Nairobi Convention
UNEP Regional Coordinating Office
P.O. Box 677, Victoria, Mahe
SEYCHELLES
Tel: +248 224644, Fax: +248 322945
E-mail: rolph@seychel es.sc or r.payet@pps.gov.sc
Contributors
Fatouma Ali Abdallah
Nashreen Soogun
Chef De Service Gestion Des Resources Naturel e
Ministry of Environment
Direction Generale De L'Environnement
3rd Floor, Ken Lee Tower, Barracks Street, Port Louis
B.P 860, Moroni
MAURITIUS
COMORES
Tel: 212 4385, Fax: 212 6671
Tel: +269 73 0018, Fax: +269 73 6849
E-mail: nsoogun@mail.gov.mu
E-mail: a_fatouma@hotmail.com or alfa@snpt.km
Dr Eulalie Ranaivoson
Rondolph J. Payet
Océan Consultant
Managing Director
B.P. 3528
Seychel es Fishing Authority
Vil age des Jeux Ankorondrano
P. O Box 449, Fishing Port, Mahe
Batiment F5, porte 8, Antananarivo 101,
SEYCHELLES
MADAGASCAR
Tel: +248 670306, Fax: +248 224508
Tel. +261 20 22 640 28/ 20 22 253 38, Fax. +261 20 22 428 06/ 20 22 253 38
E-mail: rpayet@sfa.sc or rj.payet@odinafrica.net
E-mail: ocecon@vitelcom.mg or ocecon@dts.mg
ANNEXES
75
Annex II
Detailed scoring tables
I: Freshwater shortage
II: Pollution
Weight
Weight
Environmental
Environmental
Environmental issues
Score
Weight %
averaged
Environmental issues
Score
Weight %
averaged
concerns
concerns
score
score
1. Modification of stream flow
1
20
Freshwater shortage
1.50
4. Microbiological
1
10
Pol ution
1.65
2. Pol ution of existing supplies
2
50
5. Eutrophication
2
20
3. Changes in the water table
1
30
6. Chemical
1
5
7. Suspended solids
1
20
Criteria for Economic impacts
Raw score
Score Weight %
8. Solid wastes
2
25
Size of economic or public sectors
Very small
Very large
2
50
affected
0
1
2
3
9. Thermal
0
0
Degree of impact (cost, output changes
Minimum
Severe
2
30
etc.)
0
1
2
3
10. Radionuclide
0
0
Occasion/Short
Continuous
Frequency/Duration
2
20
0
1
2
3
11. Spil s
2
20
Weight average score for Economic impacts
2.00
Criteria for Health impacts
Raw score
Score Weight %
Criteria for Economic impacts
Raw score
Score Weight %
Very small
Very large
Number of people affected
1
40
Size of economic or public sectors
Very small
Very large
0
1
2
3
2
30
affected
0
1
2
3
Minimum
Severe
Degree of severity
2
30
Degree of impact (cost, output changes
Minimum
Severe
0
1
2
3
3
40
etc.)
0
1
2
3
Occasion/Short
Continuous
Frequency/Duration
1
20
Occasion/Short
Continuous
0
1
2
3
Frequency/Duration
2
30
0
1
2
3
Weight average score for Health impacts
1.20
Weight average score for Economic impacts
2.40
Criteria for Other social and
Raw score
Score Weight %
community impacts
Criteria for Health impacts
Raw score
Score Weight %
Number and/or size of community
Very small
Very large
1
40
Very small
Very large
affected
0
1
2
3
Number of people affected
2
30
0
1
2
3
Minimum
Severe
Degree of severity
2
40
Minimum
Severe
0
1
2
3
Degree of severity
3
40
0
1
2
3
Occasion/Short
Continuous
Frequency/Duration
2
20
Occasion/Short
Continuous
0
1
2
3
Frequency/Duration
2
30
0
1
2
3
Weight average score for Other social and community impacts
1.40
Weight average score for Health impacts
2.40
Criteria for Other social and
Raw score
Score Weight %
community impacts
Number and/or size of community
Very small
Very large
2
30
affected
0
1
2
3
Minimum
Severe
Degree of severity
1
30
0
1
2
3
Occasion/Short
Continuous
Frequency/Duration
2
40
0
1
2
3
Weight average score for Other social and community impacts
1.70
76
GIWA REGIONAL ASSESSMENT 45B INDIAN OCEAN ISLANDS
ANNEXES
77
III: Habitat and community modification
IV: Unsustainable exploitation of fish
Weight
Weight
Environmental
Environmental
Environmental issues
Score
Weight %
averaged
Environmental issues
Score
Weight %
averaged
concerns
concerns
score
score
Habitat and Community
12. Loss of ecosystems
1.25
60
1.45
Unsustainable
Modification
14. Overexploitation
2.5
25
1.59
exploitation of fish
13.Modification of ecosystems or
15. Excessive by-catch and
0.75
5
ecotones, including community
discards
1.75
40
structure and/or species
composition
16. Destructive fishing practices
1.75
30
17. Decreased viability of stock
0.75
20
through pol ution and disease
Criteria for Economic impacts
Raw score
Score Weight %
18. Impact on biological and
1.25
20
genetic diversity
Size of economic or public sectors
Very small
Very large
3
40
affected
0
1
2
3
Degree of impact (cost, output changes
Minimum
Severe
2
30
etc.)
0
1
2
3
Criteria for Economic impacts
Raw score
Score Weight %
Occasion/Short
Continuous
Frequency/Duration
2
30
0
1
2
3
Size of economic or public sectors
Very small
Very large
2
40
affected
0
1
2
3
Weight average score for Economic impacts
2.40
Degree of impact (cost, output changes
Minimum
Severe
2
40
etc.)
0
1
2
3
Criteria for Health impacts
Raw score
Score Weight %
Occasion/Short
Continuous
Frequency/Duration
2
20
0
1
2
3
Very small
Very large
Number of people affected
2
40
0
1
2
3
Weight average score for Economic impacts
2.00
Minimum
Severe
Degree of severity
1
30
0
1
2
3
Criteria for Health impacts
Raw score
Score Weight %
Occasion/Short
Continuous
Frequency/Duration
2
30
0
1
2
3
Very small
Very large
Number of people affected
1
30
0
1
2
3
Weight average score for Health impacts
1.70
Minimum
Severe
Degree of severity
1
40
0
1
2
3
Criteria for Other social and
Raw score
Score Weight %
Occasion/Short
Continuous
community impacts
Frequency/Duration
1
30
0
1
2
3
Number and/or size of community
Very small
Very large
3
40
affected
0
1
2
3
Weight average score for Health impacts
1.00
Minimum
Severe
Degree of severity
2
30
Criteria for Other social and
0
1
2
3
Raw score
Score Weight %
community impacts
Occasion/Short
Continuous
Frequency/Duration
2
30
0
1
2
3
Number and/or size of community
Very small
Very large
1
30
affected
0
1
2
3
Weight average score for Other social and community impacts
2.40
Minimum
Severe
Degree of severity
1
40
0
1
2
3
Occasion/Short
Continuous
Frequency/Duration
1
30
0
1
2
3
Weight average score for Other social and community impacts
1.00
76
GIWA REGIONAL ASSESSMENT 45B INDIAN OCEAN ISLANDS
ANNEXES
77
V: Global change
Weight
Environmental
Environmental issues
Score
Weight %
averaged
concerns
score
19. Changes in the hydrological
1
20
Global Change
1.20
cycle
20. Sea level change
2
40
21. Increase UV-B radiation as a
0
20
result of ozone depletion
22. Changes in ocean CO 2
1
20
source/sink function
Criteria for Economic impacts
Raw score
Score Weight %
Size of economic or public sectors
Very small
Very large
3
50
affected
0
1
2
3
Degree of impact (cost, output changes
Minimum
Severe
2
30
etc.)
0
1
2
3
Occasion/Short
Continuous
Frequency/Duration
1
20
0
1
2
3
Weight average score for Economic impacts
2.30
Criteria for Health impacts
Raw score
Score Weight %
Very small
Very large
Number of people affected
1
50
0
1
2
3
Minimum
Severe
Degree of severity
0
30
0
1
2
3
Occasion/Short
Continuous
Frequency/Duration
1
20
0
1
2
3
Weight average score for Health impacts
0.70
Criteria for Other social and
Raw score
Score Weight %
community impacts
Number and/or size of community
Very small
Very large
2
30
affected
0
1
2
3
Minimum
Severe
Degree of severity
2
50
0
1
2
3
Occasion/Short
Continuous
Frequency/Duration
1
20
0
1
2
3
Weight average score for Other social and community impacts
1.80
78
GIWA REGIONAL ASSESSMENT 45B INDIAN OCEAN ISLANDS
ANNEXES
79
Comparative environmental and socio-economic impacts of each GIWA concern
Types of impacts
Environmental score
Economic score
Human health score
Social and community score
Concern
Overall score
Present (a)
Future (b)
Present (c)
Future (d)
Present (e)
Future (f)
Present (g)
Future (h)
Freshwater shortage
1.5
2
2
2
1.2
1
1.4
2
1.6
Pol ution
1.7
2
2.4
2
2.4
2
1.7
1
1.9
Habitat and community
1.5
2
2.4
2
1.7
1
2.4
2
1.9
modification
Unsustainable exploitation of fish
1.6
3
2
2
1
2
1
1
1.7
and other living resources
Global change
1.2
3
2.3
3
0.7
1
1.8
3
2
If the results in this table were not giving a clear prioritisation, the scores were weighted by assigning different relative importance to present/future
and environmental/socio-economic impacts in the fol owing way:
Weight averaged environmental and socio-economic impacts of each GIWA concern
Present (%) (i)
Future (%) (j)
Total (%)
60
40
100
Other social and
Environmental (k)
Economic (l)
Health (m)
Total (%)
community impacts (n)
40
20
20
20
100
Types of impacts
Time weight averaged
Time weight averaged
Time weight averaged
Time weight averaged
Time weight averaged overall
Social and community
Environmental score (o)
Economic score (p)
Human health score (q)
score
Concern
score (r)
Rank
(a)x(i)+(b)x(j)
(c)x(i)+(d)x(j)
(e)x(i)+(f)x(j)
(g)x(i)+(h)x(j)
(o)x(k)+(p)x(l)+(q)x(m)+(r)x(n)
Freshwater shortage
1.7
2
1.12
1.64
1.63
5
Pol ution
1.82
2.24
2.24
1.42
1.91
1
Habitat and community
1.7
2.24
1.42
2.24
1.86
3
modification
Unsustainable exploitation of fish
2.16
2
1.4
1
1.74
4
and other living resources
Global change
1.92
2.58
0.82
2.28
1.90
2
78
GIWA REGIONAL ASSESSMENT 45B INDIAN OCEAN ISLANDS
ANNEXES
79
Annex III
List of important water-related programmes
and assessments in the region
Cost
Country
Project Name
Region
Focal Area
Agency
Project Type
Donor
(million USD)
Addressing Land-based
Regional
Activities in the Western Indian AFR
International Waters
UNEP
Full Size Project
4.511
GEF
Ocean (WIO-LaB)
Coral Reef Monitoring Network
in Member States of the Indian
Medium Size
Regional
Ocean Commission (COI), within AFR
Biodiversity
IBRD/COI
0.737
GEF
Project
the Global Reef Monitoring
Network (GCRMN)
Western Indian Ocean Islands
Regional
AFR
International Waters
IBRD/COI
Full Size Project
3.164
GEF
Oil Spill Contingency Planning
Development and Protection
Regional (Excluding
of the Coastal and Marine
Medium Size
AFR
International Waters
UNEP/ACOPS
0.750
GEF
Madagascar)
Environment in Sub-Saharan
Project
Africa
Reduction of Environmental
Impact from Coastal Tourism
Regional (Excl. Madagascar, through Introduction of Policy AFR
International Waters
UNEP
Full Size Project
5.000
GEF (in pipeline)
Comoros)
Changes and Strengthening
Public-Private Partnerships
Regional (excluding
Southwest Indian Ocean
AFR
International Waters
IBRD
Full Size Project
6.350
GEF (drafting)
Mauritius & Seychel es)
Fisheries Project (SIOFP)
Institutional Strengthening
and Resource Mobilization for
Regional (Excl. Seychel es,
Mainstreaming Integrated
Medium Size
AFR
Multiple Focal Areas
IBRD
1.000
GEF
Comoros, Mauritius)
Land and Water Management
Project
Approaches into Development
Programs in Africa
Global (Excl. Seychel es,
Biodiversity Country Studies
CEX
Biodiversity
UNEP
Enabling Activity
2.000
GEF
Comoros, Mauritius)
- Phase II
(Source: http://www.gefonline.org/projectList.cfm )
80
GIWA REGIONAL ASSESSMENT 45B INDIAN OCEAN ISLANDS
ANNEXES
81
Annex IV
List of conventions that affect water use
in the region
No.
Convention
o
r
o
s
a
d
a
g
a
s
c
a
r
a
u
r
i
t
i
u
s
C
o
m
M
M
S
e
y
c
h
e
l
l
e
s
1.
The Nairobi Convention 1985 and Protocols
2.
The Arusha Resolution 1993
3.
Convention on Biological Diversity
4.
UN Framework Convention on Climate change.
5.
UN Law of the Sea Convention
6.
The Ramsar Convention on Wetlands
7.
International Convention for the Prevention of Pol ution from Ship (MARPOL)
The Bamako Convention on the Ban of the import into Africa and the control of Transboundary movement
9.
and Management of Hazardous Waste within Africa.
10.
Basel Convention on the control of Transboundary movement of hazardous wastes and their disposal.
(Note: Data as at 1st March 1999)
80
GIWA REGIONAL ASSESSMENT 45B INDIAN OCEAN ISLANDS
ANNEXES
81
The Global International
Waters Assessment
This report presents the results of the Global International Waters
Adequately managing the world's aquatic resources for the benefit of
Assessment (GIWA) of the transboundary waters of the Indian
al is, for a variety of reasons, a very complex task. The liquid state of
Ocean Islands. This and the subsequent chapter offer a background
the most of the world's water means that, without the construction
that describes the impetus behind the establishment of GIWA, its
of reservoirs, dams and canals it is free to flow wherever the laws of
objectives and how the GIWA was implemented.
nature dictate. Water is, therefore, a vector transporting not only a
wide variety of valuable resources but also problems from one area
to another. The effluents emanating from environmental y destructive
activities in upstream drainage areas are propagated downstream
The need for a global
and can affect other areas considerable distances away. In the case of
international waters
transboundary river basins, such as the Nile, Amazon and Niger, the
assessment
impacts are transported across national borders and can be observed
in the numerous countries situated within their catchments. In the case
of large oceanic currents, the impacts can even be propagated between
Global y, people are becoming increasingly aware of the degradation of
continents (AMAP 1998). Therefore, the inextricable linkages within
the world's water bodies. Disasters from floods and droughts, frequently
and between both freshwater and marine environments dictates that
reported in the media, are considered to be linked with ongoing global
management of aquatic resources ought to be implemented through
climate change (IPCC 2001), accidents involving large ships pol ute public
a drainage basin approach.
beaches and threaten marine life and almost every commercial fish stock
is exploited beyond sustainable limits - it is estimated that the global
In addition, there is growing appreciation of the incongruence
stocks of large predatory fish have declined to less that 10% of pre-
between the transboundary nature of many aquatic resources and the
industrial fishing levels (Myers & Worm 2003). Further, more than 1 bil ion
traditional introspective national y focused approaches to managing
people worldwide lack access to safe drinking water and 2 bil ion people
those resources. Water, unlike laws and management plans, does not
lack proper sanitation which causes approximately 4 billion cases of
respect national borders and, as a consequence, if future management
diarrhoea each year and results in the death of 2.2 mil ion people, mostly
of water and aquatic resources is to be successful, then a shift in focus
children younger than five (WHO-UNICEF 2002). Moreover, freshwater
towards international cooperation and intergovernmental agreements
and marine habitats are destroyed by infrastructure developments,
is required (UN 1972). Furthermore, the complexity of managing the
dams, roads, ports and human settlements (Brinson & Malvárez 2002,
world's water resources is exacerbated by the dependence of a great
Kennish 2002). As a consequence, there is growing public concern
variety of domestic and industrial activities on those resources. As a
regarding the declining quality and quantity of the world's aquatic
consequence, cross-sectoral multidisciplinary approaches that integrate
resources because of human activities, which has resulted in mounting
environmental, socio-economic and development aspects into
pressure on governments and decision makers to institute new and
management must be adopted. Unfortunately however, the scientific
innovative policies to manage those resources in a sustainable way
information or capacity within each discipline is often not available or
ensuring their availability for future generations.
is inadequately translated for use by managers, decision makers and
GLOBAL INTERNATIONAL WATERS ASSESSMENT
i
policy developers. These inadequacies constitute a serious impediment
The Global Environment Facility (GEF)
to the implementation of urgently needed innovative policies.
The Global Environment Facility forges international co-operation and finances actions to address
six critical threats to the global environment: biodiversity loss, climate change, degradation of
international waters, ozone depletion, land degradation, and persistent organic pol utants (POPs).
Continual assessment of the prevailing and future threats to aquatic
The overal strategic thrust of GEF-funded international waters activities is to meet the incremental
ecosystems and their implications for human populations is essential if
costs of: (a) assisting groups of countries to better understand the environmental concerns of
their international waters and work col aboratively to address them; (b) building the capacity
governments and decision makers are going to be able to make strategic
of existing institutions to utilise a more comprehensive approach for addressing transboundary
policy and management decisions that promote the sustainable use of
water-related environmental concerns; and (c) implementing measures that address the priority
transboundary environmental concerns. The goal is to assist countries to utilise the full range of
those resources and respond to the growing concerns of the general
technical, economic, financial, regulatory, and institutional measures needed to operationalise
public. Although many assessments of aquatic resources are being
sustainable development strategies for international waters.
conducted by local, national, regional and international bodies, past
United Nations Environment Programme (UNEP)
assessments have often concentrated on specific themes, such as
United Nations Environment Programme, established in 1972, is the voice for the environment
biodiversity or persistent toxic substances, or have focused only on
within the United Nations system. The mission of UNEP is to provide leadership and encourage
partnership in caring for the environment by inspiring, informing, and enabling nations and
marine or freshwaters. A globally coherent, drainage basin based
peoples to improve their quality of life without compromising that of future generations.
assessment that embraces the inextricable links between transboundary
UNEP work encompasses:
freshwater and marine systems, and between environmental and
Assessing global, regional and national environmental conditions and trends;
Developing international and national environmental instruments;
societal issues, has never been conducted previously.
Strengthening institutions for the wise management of the environment;
Facilitating the transfer of knowledge and technology for sustainable development;
Encouraging new partnerships and mind-sets within civil society and the private sector.
International call for action
University of Kalmar
University of Kalmar hosts the GIWA Co-ordination Office and provides scientific advice and
administrative and technical assistance to GIWA. University of Kalmar is situated on the coast of
The need for a holistic assessment of transboundary waters in order to
the Baltic Sea. The city has a long tradition of higher education; teachers and marine officers have
been educated in Kalmar since the middle of the 19th century. Today, natural science is a priority
respond to growing public concerns and provide advice to governments
area which gives Kalmar a unique educational and research profile compared with other smal er
and decision makers regarding the management of aquatic resources
universities in Sweden. Of particular relevance for GIWA is the established research in aquatic and
environmental science. Issues linked to the concept of sustainable development are implemented
was recognised by several international bodies focusing on the global
by the research programme Natural Resources Management and Agenda 21 Research School.
environment. In particular, the Global Environment Facility (GEF)
Since its establishment GIWA has grown to become an integral part of University activities.
The GIWA Co-ordination office and GIWA Core team are located at the Kalmarsund Laboratory, the
observed that the International Waters (IW) component of the GEF
university centre for water-related research. Senior scientists appointed by the University are actively
suffered from the lack of a global assessment which made it difficult
involved in the GIWA peer-review and steering groups. As a result of the cooperation the University
can offer courses and seminars related to GIWA objectives and international water issues.
to prioritise international water projects, particularly considering
the inadequate understanding of the nature and root causes of
environmental problems. In 1996, at its fourth meeting in Nairobi, the
causes of degradation of the transboundary aquatic environment and
GEF Scientific and Technical Advisory Panel (STAP), noted that: "Lack of
options for addressing them. These processes led to the development
an International Waters Assessment comparable with that of the IPCC, the
of the Global International Waters Assessment (GIWA) that would be
Global Biodiversity Assessment, and the Stratospheric Ozone Assessment,
implemented by the United Nations Environment Programme (UNEP) in
was a unique and serious impediment to the implementation of the
conjunction with the University of Kalmar, Sweden, on behalf of the GEF.
International Waters Component of the GEF".
The GIWA was inaugurated in Kalmar in October 1999 by the Executive
Director of UNEP, Dr. Klaus Töpfer, and the late Swedish Minister of the
The urgent need for an assessment of the causes of environmental
Environment, Kjel Larsson. On this occasion Dr. Töpfer stated: "GIWA
degradation was also highlighted at the UN Special Session on
is the framework of UNEP´s global water assessment strategy and will
the Environment (UNGASS) in 1997, where commitments were
enable us to record and report on critical water resources for the planet for
made regarding the work of the UN Commission on Sustainable
consideration of sustainable development management practices as part of
Development (UNCSD) on freshwater in 1998 and seas in 1999. Also in
our responsibilities under Agenda 21 agreements of the Rio conference".
1997, two international Declarations, the Potomac Declaration: Towards
enhanced ocean security into the third mil ennium, and the Stockholm
The importance of the GIWA has been further underpinned by the UN
Statement on interaction of land activities, freshwater and enclosed
Mil ennium Development Goals adopted by the UN General Assembly
seas, specifical y emphasised the need for an investigation of the root
in 2000 and the Declaration from the World Summit on Sustainable
ii
REGIONAL ASSESSMENTS
GLOBAL INTERNATIONAL WATERS ASSESSMENT
iii
Development in 2002. The development goals aimed to halve the
International waters and transboundary issues
proportion of people without access to safe drinking water and basic
The term "international waters", as used for the purposes of the GEF Operational Strategy,
sanitation by the year 2015 (United Nations Millennium Declaration
includes the oceans, large marine ecosystems, enclosed or semi-enclosed seas and estuaries, as
wel as rivers, lakes, groundwater systems, and wetlands with transboundary drainage basins
2000). The WSSD also cal s for integrated management of land, water and
or common borders. The water-related ecosystems associated with these waters are considered
living resources (WSSD 2002) and, by 2010, the Reykjavik Declaration on
integral parts of the systems.
Responsible Fisheries in the Marine Ecosystem should be implemented
The term "transboundary issues" is used to describe the threats to the aquatic environment
linked to globalisation, international trade, demographic changes and technological advancement,
by al countries that are party to the declaration (FAO 2001).
threats that are additional to those created through transboundary movement of water. Single
country policies and actions are inadequate in order to cope with these chal enges and this makes
them transboundary in nature.
The international waters area includes numerous international conventions, treaties, and
agreements. The architecture of marine agreements is especial y complex, and a large number
The conceptual framework
of bilateral and multilateral agreements exist for transboundary freshwater basins. Related
conventions and agreements in other areas increase the complexity. These initiatives provide
and objectives
a new opportunity for cooperating nations to link many different programmes and instruments
into regional comprehensive approaches to address international waters.
Considering the general decline in the condition of the world's aquatic
the large-scale deforestation of mangroves for ponds (Primavera 1997).
resources and the international y recognised need for a global y
Within the GIWA, these "non-hydrological" factors constitute as large
coherent assessment of transboundary waters, the primary objectives
a transboundary influence as more traditional y recognised problems,
of the GIWA are:
such as the construction of dams that regulate the flow of water into
To provide a prioritising mechanism that al ows the GEF to focus
a neighbouring country, and are considered equal y important. In
their resources so that they are used in the most cost effective
addition, the GIWA recognises the importance of hydrological units that
manner to achieve significant environmental benefits, at national,
would not normal y be considered transboundary but exert a significant
regional and global levels; and
influence on transboundary waters, such as the Yangtze River in China
To highlight areas in which governments can develop and
which discharges into the East China Sea (Daoji & Daler 2004) and the
implement strategic policies to reduce environmental degradation
Volga River in Russia which is largely responsible for the condition of
and improve the management of aquatic resources.
the Caspian Sea (Barannik et al. 2004). Furthermore, the GIWA is a truly
regional assessment that has incorporated data from a wide range of
In order to meet these objectives and address some of the current
sources and included expert knowledge and information from a wide
inadequacies in international aquatic resources management, the GIWA
range of sectors and from each country in the region. Therefore, the
has incorporated four essential elements into its design:
transboundary concept adopted by the GIWA extends to include
A broad transboundary approach that generates a truly regional
impacts caused by globalisation, international trade, demographic
perspective through the incorporation of expertise and existing
changes and technological advances and recognises the need for
information from al nations in the region and the assessment of
international cooperation to address them.
all factors that influence the aquatic resources of the region;
A drainage basin approach integrating freshwater and marine
systems;
The organisational structure and
A multidisciplinary approach integrating environmental and socio-
economic information and expertise; and
implementation of the GIWA
A coherent assessment that enables global comparison of the
results.
The scale of the assessment
Initial y, the scope of the GIWA was confined to transboundary waters
The GIWA builds on previous assessments implemented within the GEF
in areas that included countries eligible to receive funds from the GEF.
International Waters portfolio but has developed and adopted a broader
However, it was recognised that a truly global perspective would only
definition of transboundary waters to include factors that influence the
be achieved if industrialised, GEF-ineligible regions of the world were
quality and quantity of global aquatic resources. For example, due to
also assessed. Financial resources to assess the GEF-eligible countries
globalisation and international trade, the market for penaeid shrimps
were obtained primarily from the GEF (68%), the Swedish International
has widened and the prices soared. This, in turn, has encouraged
Development Cooperation Agency (Sida) (18%), and the Finnish
entrepreneurs in South East Asia to expand aquaculture resulting in
Department for International Development Cooperation (FINNIDA)
ii
REGIONAL ASSESSMENTS
GLOBAL INTERNATIONAL WATERS ASSESSMENT
iii
1
15
11
16
14
12
28
10
13
25
17
29
9
18
19
30
23
22
8 6 7
31
20
24
26
35
33
2
34
27
5
21
50
32
51
36
37
41
52
4
49
53
43
65
55
3
48
54
42
56
46
62
47
40b
40a
57
62
45b
39
59
45a
58
60
64
44
61
38
63
66
1
Arctic
12
Norwegian Sea (LME)
24 Aral Sea
36 East-China Sea (LME)
46 Somali Coastal Current (LME)
58 North Australian Shelf (LME)
2
Gulf of Mexico (LME)
13
Faroe plateau
25 Gulf of Alaska (LME)
37
Hawaiian Archipelago (LME)
47
East African Rift Valley Lakes
59 Coral Sea Basin
3
Caribbean Sea (LME)
14
Iceland Shelf (LME)
26 California Current (LME)
38 Patagonian Shelf (LME)
48 Gulf of Aden
60 Great Barrier Reef (LME)
4
Caribbean Islands
15
East Greenland Shelf (LME)
27 Gulf of California (LME)
39 Brazil Current (LME)
49 Red Sea (LME)
61
Great Australian Bight
5
Southeast Shelf (LME)
16
West Greenland Shelf (LME)
28 East Bering Sea (LME)
40a Brazilian Northeast (LME)
50 The Gulf
62 Small Island States
6
Northeast Shelf (LME)
17
Baltic Sea (LME)
29 West Bering Sea (LME)
40b Amazon
51
Jordan
63 Tasman Sea
7
Scotian Shelf (LME)
18
North Sea (LME)
30 Sea of Okhotsk (LME)
41
Canary Current (LME)
52 Arabian Sea (LME)
64 Humboldt Current (LME)
8
Gulf of St Lawrence
19
Celtic-Biscay Shelf (LME)
31
Oyashio Current (LME)
42 Guinea Current (LME)
53 Bay of Bengal S.E.
65 Eastern Equatorial Pacific
9
Newfoundland Shelf (LME)
20 Iberian Coastal (LME)
32 Kuroshio Current (LME)
43 Lake Chad
54 South China Sea (LME)
66 Antarctic (LME)
10
Baffin Bay, Labrador Sea,
21
Mediterranean Sea (LME)
33 Sea of Japan/East Sea (LME)
44 Benguela Current (LME)
55 Mekong River
Canadian Archipelago
22 Black Sea (LME)
34 Yellow Sea (LME)
45a Agulhas Current (LME)
56 Sulu-Celebes Sea (LME)
11
Barents Sea (LME)
23 Caspian Sea
35 Bohai Sea
45b Indian Ocean Islands
57 Indonesian Seas (LME)
Figure 1
The 66 transboundary regions assessed within the GIWA project.
(10%). Other contributions were made by Kalmar Municipality, the
Considering the objectives of the GIWA and the elements incorporated
University of Kalmar and the Norwegian Government. The assessment of
into its design, a new methodology for the implementation of the
regions ineligible for GEF funds was conducted by various international
assessment was developed during the initial phase of the project. The
and national organisations as in-kind contributions to the GIWA.
methodology focuses on five major environmental concerns which
constitute the foundation of the GIWA assessment; Freshwater shortage,
In order to be consistent with the transboundary nature of many of the
Pol ution, Habitat and community modification, Overexploitation of fish
world's aquatic resources and the focus of the GIWA, the geographical
and other living resources, and Global change. The GIWA methodology
units being assessed have been designed according to the watersheds
is outlined in the fol owing chapter.
of discrete hydrographic systems rather than political borders (Figure 1).
The geographic units of the assessment were determined during the
The global network
preparatory phase of the project and resulted in the division of the
In each of the 66 regions, the assessment is conducted by a team of
world into 66 regions defined by the entire area of one or more
local experts that is headed by a Focal Point (Figure 2). The Focal Point
catchments areas that drains into a single designated marine system.
can be an individual, institution or organisation that has been selected
These marine systems often correspond to Large Marine Ecosystems
on the basis of their scientific reputation and experience implementing
(LMEs) (Sherman 1994, IOC 2002).
international assessment projects. The Focal Point is responsible
for assembling members of the team and ensuring that it has the
Large Marine Ecocsystems (LMEs)
necessary expertise and experience in a variety of environmental
Large Marine Ecosystems (LMEs) are regions of ocean space encompassing coastal areas from river
and socio-economic disciplines to successful y conduct the regional
basins and estuaries to the seaward boundaries of continental shelves and the outer margin of the
major current systems. They are relatively large regions on the order of 200 000 km2 or greater,
assessment. The selection of team members is one of the most critical
characterised by distinct: (1) bathymetry, (2) hydrography, (3) productivity, and (4) trophical y
elements for the success of GIWA and, in order to ensure that the
dependent populations.
The Large Marine Ecosystems strategy is a global effort for the assessment and management
most relevant information is incorporated into the assessment, team
of international coastal waters. It developed in direct response to a declaration at the 1992
members were selected from a wide variety of institutions such as
Rio Summit. As part of the strategy, the World Conservation Union (IUCN) and National Oceanic
and Atmospheric Administration (NOAA) have joined in an action program to assist developing
universities, research institutes, government agencies, and the private
countries in planning and implementing an ecosystem-based strategy that is focused on LMEs as
sector. In addition, in order to ensure that the assessment produces a
the principal assessment and management units for coastal ocean resources. The LME concept is
also adopted by GEF that recommends the use of LMEs and their contributing freshwater basins
truly regional perspective, the teams should include representatives
as the geographic area for integrating changes in sectoral economic activities.
from each country that shares the region.
iv
REGIONAL ASSESSMENTS
GLOBAL INTERNATIONAL WATERS ASSESSMENT
v
The GIWA is comprised of a logical sequence of four integrated
components. The first stage of the GIWA is cal ed Scaling and is a
process by which the geographic area examined in the assessment is
defined and al the transboundary waters within that area are identified.
Once the geographic scale of the assessment has been defined, the
assessment teams conduct a process known as Scoping in which the
magnitude of environmental and associated socio-economic impacts
of Freshwater shortage, Pol ution, Habitat and community modification,
Unsustainable exploitation of fish and other living resources, and Global
Figure 2
The organisation of the GIWA project.
change is assessed in order to identify and prioritise the concerns
that require the most urgent intervention. The assessment of these
predefined concerns incorporates the best available information and
In total, more than 1 000 experts have contributed to the implementation
the knowledge and experience of the multidisciplinary, multi-national
of the GIWA il ustrating that the GIWA is a participatory exercise that
assessment teams formed in each region. Once the priority concerns
relies on regional expertise. This participatory approach is essential
have been identified, the root causes of these concerns are identified
because it instils a sense of local ownership of the project, which
during the third component of the GIWA, Causal chain analysis. The root
ensures the credibility of the findings and moreover, it has created a
causes are determined through a sequential process that identifies, in
global network of experts and institutions that can col aborate and
turn, the most significant immediate causes fol owed by the economic
exchange experiences and expertise to help mitigate the continued
sectors that are primarily responsible for the immediate causes and
degradation of the world's aquatic resources.
final y, the societal root causes. At each stage in the Causal chain
analysis, the most significant contributors are identified through an
analysis of the best available information which is augmented by the
expertise of the assessment team. The final component of the GIWA is
GIWA Regional reports
the development of Policy options that focus on mitigating the impacts
of the root causes identified by the Causal chain analysis.
The GIWA was established in response to growing concern among the
general public regarding the quality of the world's aquatic resources
The results of the GIWA assessment in each region are reported in
and the recognition of governments and the international community
regional reports that are published by UNEP. These reports are designed
concerning the absence of a global y coherent international waters
to provide a brief physical and socio-economic description of the
assessment. However, because a holistic, region-by-region, assessment
most important features of the region against which the results of the
of the condition of the world's transboundary water resources had never
assessment can be cast. The remaining sections of the report present
been undertaken, a methodology guiding the implementation of such
the results of each stage of the assessment in an easily digestible form.
an assessment did not exist. Therefore, in order to implement the GIWA,
Each regional report is reviewed by at least two independent external
a new methodology that adopted a multidisciplinary, multi-sectoral,
reviewers in order to ensure the scientific validity and applicability of
multi-national approach was developed and is now available for the
each report. The 66 regional assessments of the GIWA will serve UNEP
implementation of future international assessments of aquatic resources.
as an essential complement to the UNEP Water Policy and Strategy and
UNEP's activities in the hydrosphere.
UNEP Water Policy and Strategy
The primary goals of the UNEP water policy and strategy are:
(a) Achieving greater global understanding of freshwater, coastal and marine environments by
conducting environmental assessments in priority areas;
Global International Waters Assessment
(b) Raising awareness of the importance and consequences of unsustainable water use;
(c) Supporting the efforts of Governments in the preparation and implementation of integrated
management of freshwater systems and their related coastal and marine environments;
(d) Providing support for the preparation of integrated management plans and programmes for
aquatic environmental hot spots, based on the assessment results;
(e) Promoting the application by stakeholders of precautionary, preventive and anticipatory
approaches.
iv
REGIONAL ASSESSMENTS
GLOBAL INTERNATIONAL WATERS ASSESSMENT
v
References:
AMAP (1998). Assessment Report: Arctic Pol ution Issues. Arctic
Monitoring and Assessment Programme (AMAP), Oslo, Norway.
Barannik, V., Borysova, O. and Stolberg, F. (2004). The Caspian Sea Region:
Environmental Change. Ambio, 33:45-51.
Brinson, M.M. and Malvárez, A.I. (2002). Temperate freshwater wetlands:
types, status, and threats. Environmental Conservation, 29:115-133.
Daoji, L. and Daler, D. (2004). Ocean Pol ution from Land-based Sources:
East China Sea, China. Ambio, 33:98-106.
FAO (2001). Reykjavik conference on responsible fisheries in the marine
ecosystem. Iceland, 1-4 October 2001.
IOC (2002). IOC-IUCN-NOAA Consultative Meeting on Large Marine
Ecosystems (LMEs). Fourth Session, 8-9 January 2002, Paris,
France.
IPCC (2001). Climate Change 2001: The Scientific Basis. Contribution
of Working Group I to the Third Assessment Report of the
Intergovernmental Panel on Climate Change. In: Houghton,
J.T., Ding, Y., Griggs, D.J., Noguer, M., van der Linden, P.J., Dai, X.,
Maskel , K. and Johnson, C.A. (eds). Cambridge University Press,
Cambridge, United Kingdom and New York, NY, USA.
Kennish, M.J. (2002). Environmental threats and environmental future of
estuaries. Environmental Conservation, 29:78-107.
Myers, R.A. and Worm, B. (2003). Rapid worldwide depletion of predatory
fish communities. Nature, 423:280-283.
Primavera, J.H. (1997) Socio-economic impacts of shrimp culture.
Aquaculture Research, 28:815-827.
Sherman, K. (1994). Sustainability, biomass yields, and health of coastal
ecosystems: an ecological perspective. Marine Ecology Progress
Series, 112:277-301.
United Nations conference on the human environment (1972). Report
available on-line at http://www.unep.org
United Nations Mil ennium Declaration (2000). The Mil ennium
Assembly of the United Nations, New York.
WHO-UNICEF (2002). Global Water Supply and Sanitation Assessment:
2000 Report.
WSSD (2002). World Summit on Sustainable Development.
Johannesburg Summit 2002. Key Outcomes of the Summit,
UN Department of Public Information, New York.
vi
REGIONAL ASSESSMENTS
The GIWA methodology
The specific objectives of the GIWA were to conduct a holistic and global y
The assessment integrates environmental and socio-economic data
comparable assessment of the world's transboundary aquatic resources
from each country in the region to determine the severity of the
that incorporated both environmental and socio-economic factors
impacts of each of the five concerns and their constituent issues on
and recognised the inextricable links between freshwater and marine
the entire region. The integration of this information was facilitated by
environments, in order to enable the GEF to focus their resources and to
implementing the assessment during two participatory workshops
provide guidance and advice to governments and decision makers. The
that typical y involved 10 to 15 environmental and socio-economic
coalition of al these elements into a single coherent methodology that
experts from each country in the region. During these workshops, the
produces an assessment that achieves each of these objectives had not
regional teams performed preliminary analyses based on the col ective
previously been done and posed a significant chal enge.
knowledge and experience of these local experts. The results of these
analyses were substantiated with the best available information to be
The integration of each of these elements into the GIWA methodology
presented in a regional report.
was achieved through an iterative process guided by a special y
Table 1
Pre-defined GIWA concerns and their constituent issues
convened Methods task team that was comprised of a number of
addressed within the assessment.
international assessment and water experts. Before the final version
of the methodology was adopted, preliminary versions underwent
Environmental issues
Major concerns
an extensive external peer review and were subjected to preliminary
1. Modification of stream flow
testing in selected regions. Advice obtained from the Methods task
2. Pol ution of existing supplies
I Freshwater shortage
team and other international experts and the lessons learnt from
3. Changes in the water table
preliminary testing were incorporated into the final version that was
4. Microbiological
5. Eutrophication
used to conduct each of the GIWA regional assessments.
6. Chemical
7. Suspended solids
II Pollution
8. Solid wastes
Considering the enormous differences between regions in terms of the
9. Thermal
10. Radionuclide
quality, quantity and availability of data, socio-economic setting and
11. Spil s
environmental conditions, the achievement of global comparability
12. Loss of ecosystems
required an innovative approach. This was facilitated by focusing
III Habitat and community
13. Modification of ecosystems or ecotones, including community
modification
the assessment on the impacts of five pre-defined concerns namely;
structure and/or species composition
Freshwater shortage, Pollution, Habitat and community modification,
14. Overexploitation
15. Excessive by-catch and discards
IV Unsustainable
Unsustainable exploitation of fish and other living resources and Global
16. Destructive fishing practices
exploitation of fish and
change, in transboundary waters. Considering the diverse range of
17. Decreased viability of stock through pol ution and disease
other living resources
18. Impact on biological and genetic diversity
elements encompassed by each concern, assessing the magnitude of
the impacts caused by these concerns was facilitated by evaluating the
19. Changes in hydrological cycle
20. Sea level change
V Global change
impacts of 22 specific issues that were grouped within these concerns
21. Increased uv-b radiation as a result of ozone depletion
22. Changes in ocean CO source/sink function
(see Table 1).
2
THE GIWA METHODOLOGY
vii


political boundaries but were instead, general y defi ned by a large but
discrete drainage basin that also included the coastal marine waters into
which the basin discharges. In many cases, the marine areas examined
during the assessment coincided with the Large Marine Ecosystems
(LMEs) defi ned by the US National Atmospheric and Oceanographic
Administration (NOAA). As a consequence, scaling should be a
relatively straight-forward task that involves the inspection of the
boundaries that were proposed for the region during the preparatory
phase of GIWA to ensure that they are appropriate and that there are
no important overlaps or gaps with neighbouring regions. When the
proposed boundaries were found to be inadequate, the boundaries of
the region were revised according to the recommendations of experts
from both within the region and from adjacent regions so as to ensure
that any changes did not result in the exclusion of areas from the GIWA.
Once the regional boundary was defi ned, regional teams identifi ed all
the transboundary elements of the aquatic environment within the
region and determined if these elements could be assessed as a single
Figure 1
Illustration of the relationship between the GIWA
coherent aquatic system or if there were two or more independent
approach and other projects implemented within the
GEF International Waters (IW) portfolio.
systems that should be assessed separately.
The GIWA is a logical contiguous process that defi nes the geographic
Scoping Assessing the GIWA concerns
region to be assessed, identifi es and prioritises particularly problems
Scoping is an assessment of the severity of environmental and socio-
based on the magnitude of their impacts on the environment and
economic impacts caused by each of the fi ve pre-defi ned GIWA concerns
human societies in the region, determines the root causes of those
and their constituent issues (Table 1). It is not designed to provide an
problems and, fi nal y, assesses various policy options that addresses
exhaustive review of water-related problems that exist within each region,
those root causes in order to reverse negative trends in the condition
but rather it is a mechanism to identify the most urgent problems in the
of the aquatic environment. These four steps, referred to as Scaling,
region and prioritise those for remedial actions. The priorities determined
Scoping, Causal chain analysis and Policy options analysis, are
by Scoping are therefore one of the main outputs of the GIWA project.
summarised below and are described in their entirety in two volumes:
GIWA Methodology Stage 1: Scaling and Scoping; and GIWA Methodology:
Focusing the assessment on pre-defi ned concerns and issues ensured
Detailed Assessment, Causal Chain Analysis and Policy Options Analysis.
the comparability of the results between diff erent regions. In addition, to
General y, the components of the GIWA methodology are aligned
ensure the long-term applicability of the options that are developed to
with the framework adopted by the GEF for Transboundary Diagnostic
mitigate these problems, Scoping not only assesses the current impacts
Analyses (TDAs) and Strategic Action Programmes (SAPs) (Figure 1) and
of these concerns and issues but also the probable future impacts
assume a broad spectrum of transboundary infl uences in addition to
according to the "most likely scenario" which considered demographic,
those associated with the physical movement of water across national
economic, technological and other relevant changes that wil potential y
borders.
infl uence the aquatic environment within the region by 2020.
Scaling Defining the geographic extent
The magnitude of the impacts caused by each issue on the
of the region
environment and socio-economic indicators was assessed over the
Scaling is the fi rst stage of the assessment and is the process by which
entire region using the best available information from a wide range of
the geographic scale of the assessment is defi ned. In order to facilitate
sources and the knowledge and experience of the each of the experts
the implementation of the GIWA, the globe was divided during the
comprising the regional team. In order to enhance the comparability
design phase of the project into 66 contiguous regions. Considering the
of the assessment between diff erent regions and remove biases
transboundary nature of many aquatic resources and the transboundary
in the assessment caused by diff erent perceptions of and ways to
focus of the GIWA, the boundaries of the regions did not comply with
communicate the severity of impacts caused by particular issues, the
viii
REGIONAL ASSESSMENTS
THE GIWA METHODOLOGY
ix
results were distil ed and reported as standardised scores according to
Table 2
Example of environmental impact assessment of
the fol owing four point scale:
Freshwater shortage.
Weight
0 = no known impact
Environmental
Environmental issues
Score
Weight %
averaged
concerns
1 = slight impact
score
2 = moderate impact
1. Modification of stream flow
1
20
Freshwater shortage
1.50
3 = severe impact
2. Pol ution of existing supplies
2
50
The attributes of each score for each issue were described by a detailed
3. Changes in the water table
1
30
set of pre-defined criteria that were used to guide experts in reporting
Table 3
Example of Health impacts assessment linked to one of
the results of the assessment. For example, the criterion for assigning
the GIWA concerns.
a score of 3 to the issue Loss of ecosystems or ecotones is: "Permanent
Criteria for Health impacts
Raw score
Score Weight %
destruction of at least one habitat is occurring such as to have reduced their
Very small
Very large
surface area by >30% during the last 2-3 decades". The full list of criteria is
Number of people affected
2
50
0
1
2
3
presented at the end of the chapter, Table 5a-e. Although the scoring
Minimum
Severe
Degree of severity
2
30
0
1
2
3
inevitably includes an arbitrary component, the use of predefined
Occasion/Short
Continuous
Frequency/Duration
2
20
criteria facilitates comparison of impacts on a global scale and also
0
1
2
3
Weight average score for Health impacts
2
encouraged consensus of opinion among experts.
The trade-off associated with assessing the impacts of each concern
After al 22 issues and associated socio-economic impacts have
and their constituent issues at the scale of the entire region is that spatial
been scored, weighted and averaged, the magnitude of likely future
resolution was sometimes low. Although the assessment provides a
changes in the environmental and socio-economic impacts of each
score indicating the severity of impacts of a particular issue or concern
of the five concerns on the entire region is assessed according to the
on the entire region, it does not mean that the entire region suffers
most likely scenario which describes the demographic, economic,
the impacts of that problem. For example, eutrophication could be
technological and other relevant changes that might influence the
identified as a severe problem in a region, but this does not imply that all
aquatic environment within the region by 2020.
waters in the region suffer from severe eutrophication. It simply means
that when the degree of eutrophication, the size of the area affected,
In order to prioritise among GIWA concerns within the region and
the socio-economic impacts and the number of people affected is
identify those that will be subjected to causal chain and policy options
considered, the magnitude of the overal impacts meets the criteria
analysis in the subsequent stages of the GIWA, the present and future
defining a severe problem and that a regional action should be initiated
scores of the environmental and socio-economic impacts of each
in order to mitigate the impacts of the problem.
concern are tabulated and an overall score calculated. In the example
presented in Table 4, the scoping assessment indicated that concern I I,
When each issue has been scored, it was weighted according to the relative
Habitat and community modification, was the priority concern in this
contribution it made to the overal environmental impacts of the concern
region. The outcome of this mathematic process was reconciled against
and a weighted average score for each of the five concerns was calculated
the knowledge of experts and the best available information in order
(Table 2). Of course, if each issue was deemed to make equal contributions,
to ensure the validity of the conclusion.
then the score describing the overal impacts of the concern was simply the
arithmetic mean of the scores al ocated to each issue within the concern.
In some cases however, this process and the subsequent participatory
In addition, the socio-economic impacts of each of the five major
discussion did not yield consensus among the regional experts
concerns were assessed for the entire region. The socio-economic
regarding the ranking of priorities. As a consequence, further analysis
impacts were grouped into three categories; Economic impacts,
was required. In such cases, expert teams continued by assessing the
Health impacts and Other social and community impacts (Table 3). For
relative importance of present and potential future impacts and assign
each category, an evaluation of the size, degree and frequency of the
weights to each. Afterwards, the teams assign weights indicating the
impact was performed and, once completed, a weighted average score
relative contribution made by environmental and socio-economic
describing the overal socio-economic impacts of each concern was
factors to the overal impacts of the concern. The weighted average
calculated in the same manner as the overall environmental score.
score for each concern is then recalculated taking into account
viii
REGIONAL ASSESSMENTS
THE GIWA METHODOLOGY
ix
Table 4
Example of comparative environmental and socio-economic impacts of each major concern, presently and likely in year 2020.
Types of impacts
Environmental score
Economic score
Human health score
Social and community score
Concern
Overall score
Present (a)
Future (b)
Present (c)
Future (d)
Present (e)
Future (f)
Present (g)
Future (h)
Freshwater shortage
1.3
2.3
2.7
2.8
2.6
3.0
1.8
2.2
2.3
Pol ution
1.5
2.0
2.0
2.3
1.8
2.3
2.0
2.3
2.0
Habitat and community
2.0
3.0
2.4
3.0
2.4
2.8
2.3
2.7
2.6
modification
Unsustainable exploitation of fish
1.8
2.2
2.0
2.1
2.0
2.1
2.4
2.5
2.1
and other living resources
Global change
0.8
1.0
1.5
1.7
1.5
1.5
1.0
1.0
1.2
the relative contributions of both present and future impacts and
should be regarded as a framework to guide the analysis, rather than
environmental and socio-economic factors. The outcome of these
as a set of detailed instructions. Secondly, in an ideal setting, a causal
additional analyses was subjected to further discussion to identify
chain would be produced by a multidisciplinary group of specialists
overall priorities for the region.
that would statistical y examine each successive cause and study its
links to the problem and to other causes. However, this approach (even
Final y, the assessment recognises that each of the five GIWA concerns
if feasible) would use far more resources and time than those available
are not discrete but often interact. For example, pollution can destroy
to GIWA1. For this reason, it has been necessary to develop a relatively
aquatic habitats that are essential for fish reproduction which, in turn,
simple and practical analytical model for gathering information to
can cause declines in fish stocks and subsequent overexploitation. Once
assemble meaningful causal chains.
teams have ranked each of the concerns and determined the priorities
for the region, the links between the concerns are highlighted in order
Conceptual model
to identify places where strategic interventions could be applied to
A causal chain is a series of statements that link the causes of a problem
yield the greatest benefits for the environment and human societies
with its effects. Recognising the great diversity of local settings and the
in the region.
resulting difficulty in developing broadly applicable policy strategies,
the GIWA CCA focuses on a particular system and then only on those
Causal chain analysis
issues that were prioritised during the scoping assessment. The
Causal Chain Analysis (CCA) traces the cause-effect pathways from the
starting point of a particular causal chain is one of the issues selected
socio-economic and environmental impacts back to their root causes.
during the Scaling and Scoping stages and its related environmental
The GIWA CCA aims to identify the most important causes of each
and socio-economic impacts. The next element in the GIWA chain is
concern prioritised during the scoping assessment in order to direct
the immediate cause; defined as the physical, biological or chemical
policy measures at the most appropriate target in order to prevent
variable that produces the GIWA issue. For example, for the issue of
further degradation of the regional aquatic environment.
eutrophication the immediate causes may be, inter alia:
Enhanced nutrient inputs;
Root causes are not always easy to identify because they are often
Increased recycling/mobilisation;
spatial y or temporal y separated from the actual problems they
Trapping of nutrients (e.g. in river impoundments);
cause. The GIWA CCA was developed to help identify and understand
Run-off and stormwaters
the root causes of environmental and socio-economic problems
in international waters and is conducted by identifying the human
Once the relevant immediate cause(s) for the particular system has
activities that cause the problem and then the factors that determine
(have) been identified, the sectors of human activity that contribute
the ways in which these activities are undertaken. However, because
most significantly to the immediate cause have to be determined.
there is no universal theory describing how root causes interact to
Assuming that the most important immediate cause in our example
create natural resource management problems and due to the great
had been increased nutrient concentrations, then it is logical that the
variation of local circumstances under which the methodology will
most likely sources of those nutrients would be the agricultural, urban
be applied, the GIWA CCA is not a rigidly structured assessment but
or industrial sectors. After identifying the sectors that are primarily
1 This does not mean that the methodology ignores statistical or quantitative studies; as has already been pointed out, the available evidence that justifies the assumption of causal links should
be provided in the assessment.
x
REGIONAL ASSESSMENTS
THE GIWA METHODOLOGY
xi
responsible for the immediate causes, the root causes acting on those
The policy options recommended by the GIWA are only contributions
sectors must be determined. For example, if agriculture was found to
to the larger policy process and, as such, the GIWA methodology
be primarily responsible for the increased nutrient concentrations, the
developed to test the performance of various options under the
root causes could potential y be:
different circumstances has been kept simple and broadly applicable.
Economic (e.g. subsidies to fertilisers and agricultural products);
Legal (e.g. inadequate regulation);
Global International Waters Assessment
Failures in governance (e.g. poor enforcement); or
Technology or knowledge related (e.g. lack of affordable substitutes
for fertilisers or lack of knowledge as to their application).
Once the most relevant root causes have been identified, an
explanation, which includes available data and information, of how
they are responsible for the primary environmental and socio-economic
problems in the region should be provided.
Policy option analysis
Despite considerable effort of many Governments and other
organisations to address transboundary water problems, the evidence
indicates that there is stil much to be done in this endeavour. An
important characteristic of GIWA's Policy Option Analysis (POA) is that
its recommendations are firmly based on a better understanding of
the root causes of the problems. Freshwater scarcity, water pol ution,
overexploitation of living resources and habitat destruction are very
complex phenomena. Policy options that are grounded on a better
understanding of these phenomena wil contribute to create more
effective societal responses to the extremely complex water related
transboundary problems. The core of POA in the assessment consists
of two tasks:
Construct policy options
Policy options are simply different courses of action, which are not
always mutual y exclusive, to solve or mitigate environmental and
socio-economic problems in the region. Although a multitude of
different policy options could be constructed to address each root
cause identified in the CCA, only those few policy options that have
the greatest likelihood of success were analysed in the GIWA.
Select and apply the criteria on which the policy options will be
evaluated
Although there are many criteria that could be used to evaluate any
policy option, GIWA focuses on:
Effectiveness (certainty of result)
Efficiency (maximisation of net benefits)
Equity (fairness of distributional impacts)
Practical criteria (political acceptability, implementation feasibility).
x
REGIONAL ASSESSMENTS
THE GIWA METHODOLOGY
xi
Table 5a: Scoring criteria for environmental impacts of Freshwater shortage
Issue
Score 0 = no known impact
Score 1 = slight impact
Score 2 = moderate impact
Score 3 = severe impact
Issue 1: Modification
No evidence of modification of stream
There is a measurably changing trend in
Significant downward or upward trend
Annual discharge of a river altered by more
of stream flow
flow.
annual river discharge at gauging stations
(more than 20% of the long term mean) in
than 50% of long term mean; or
"An increase or decrease
in a major river or tributary (basin >
annual discharges in a major river or tributary Loss of >50% of riparian or deltaic
in the discharge of
40 000 km2); or
draining a basin of >250 000 km2; or
wetlands over a period of not less than
streams and rivers
There is a measurable decrease in the area
Loss of >20% of flood plain or deltaic
40 years (through causes other than
as a result of human
of wetlands (other than as a consequence
wetlands through causes other than
conversion or artificial embankment); or
interventions on a local/
of conversion or embankment
conversion or artificial embankments; or
Significant increased siltation or erosion
regional scale (see Issue
construction); or
Significant loss of riparian vegetation (e.g.
due to changing in flow regime (other than
19 for flow alterations
There is a measurable change in the
trees, flood plain vegetation); or
normal fluctuations in flood plain rivers);
resulting from global
interannual mean salinity of estuaries or
Significant saline intrusion into previously
or
change) over the last 3-4
coastal lagoons and/or change in the mean
freshwater rivers or lagoons.
Loss of one or more anadromous or
decades."
position of estuarine salt wedge or mixing
catadromous fish species for reasons
zone; or
other than physical barriers to migration,
Change in the occurrence of exceptional
pol ution or overfishing.
discharges (e.g. due to upstream
damming.
Issue 2: Pollution of
No evidence of pol ution of surface and
Any monitored water in the region does
Water supplies does not meet WHO or
River draining more than 10% of the basin
existing supplies
ground waters.
not meet WHO or national drinking water
national drinking water standards in more
have suffered polysaprobic conditions, no
"Pol ution of surface
criteria, other than for natural reasons; or
than 30% of the region; or
longer support fish, or have suffered severe
and ground fresh waters
There have been reports of one or more
There are one or more reports of fish kil s
oxygen depletion
supplies as a result of
fish kil s in the system due to pol ution
due to pol ution in any river draining a
Severe pol ution of other sources of
point or diffuse sources"
within the past five years.
basin of >250 000 km2 .
freshwater (e.g. groundwater)
Issue 3: Changes in
No evidence that abstraction of water from Several wel s have been deepened because Clear evidence of declining base flow in
Aquifers are suffering salinisation over
the water table
aquifers exceeds natural replenishment.
of excessive aquifer draw-down; or
rivers in semi-arid areas; or
regional scale; or
"Changes in aquifers
Several springs have dried up; or
Loss of plant species in the past decade,
Perennial springs have dried up over
as a direct or indirect
Several wel s show some salinisation.
that depend on the presence of ground
regional y significant areas; or
consequence of human
water; or
Some aquifers have become exhausted
activity"
Wel s have been deepened over areas of
hundreds of km2;or
Salinisation over significant areas of the
region.
Table 5b: Scoring criteria for environmental impacts of Pollution
Issue
Score 0 = no known impact
Score 1 = slight impact
Score 2 = moderate impact
Score 3 = severe impact
Issue 4:
Normal incidence of bacterial related
There is minor increase in incidence of
Public health authorities aware of marked
There are large closure areas or very
Microbiological
gastroenteric disorders in fisheries product
bacterial related gastroenteric disorders
increase in the incidence of bacterial
restrictive advisories affecting the
pollution
consumers and no fisheries closures or
in fisheries product consumers but no
related gastroenteric disorders in fisheries
marketability of fisheries products; or
"The adverse effects of
advisories.
fisheries closures or advisories.
product consumers; or
There exists widespread public or tourist
microbial constituents of
There are limited area closures or
awareness of hazards resulting in
human sewage released
advisories reducing the exploitation or
major reductions in the exploitation or
to water bodies."
marketability of fisheries products.
marketability of fisheries products.
Issue 5:
No visible effects on the abundance and
Increased abundance of epiphytic algae; or
Increased filamentous algal production
High frequency (>1 event per year), or
Eutrophication
distributions of natural living resource
A statistical y significant trend in
resulting in algal mats; or
intensity, or large areas of periodic hypoxic
"Artificial y enhanced
distributions in the area; and
decreased water transparency associated
Medium frequency (up to once per year)
conditions, or high frequencies of fish and
primary productivity in
No increased frequency of hypoxia1 or
with algal production as compared with
of large-scale hypoxia and/or fish and
zoobenthos mortality events or harmful
receiving water basins
fish mortality events or harmful algal
long-term (>20 year) data sets; or
zoobenthos mortality events and/or
algal blooms; or
related to the increased
blooms associated with enhanced primary Measurable shal owing of the depth range
harmful algal blooms.
Significant changes in the littoral
availability or supply
production; and
of macrophytes.
community; or
of nutrients, including
No evidence of periodical y reduced
Presence of hydrogen sulphide in
cultural eutrophication
dissolved oxygen or fish and zoobenthos
historical y well oxygenated areas.
in lakes."
mortality; and
No evident abnormality in the frequency of
algal blooms.
xii
REGIONAL ASSESSMENTS
THE GIWA METHODOLOGY
xiii
Issue 6: Chemical
No known or historical levels of chemical
Some chemical contaminants are
Some chemical contaminants are above
Chemical contaminants are above
pollution
contaminants except background levels of
detectable but below threshold limits
threshold limits defined for the country or
threshold limits defined for the country or
"The adverse effects of
natural y occurring substances; and
defined for the country or region; or
region; or
region; and
chemical contaminants
No fisheries closures or advisories due to
Restricted area advisories regarding
Large area advisories by public health
Public health and public awareness of
released to standing or
chemical pol ution; and
chemical contamination of fisheries
authorities concerning fisheries product
fisheries contamination problems with
marine water bodies
No incidence of fisheries product tainting;
products.
contamination but without associated
associated reductions in the marketability
as a result of human
and
catch restrictions or closures; or
of such products either through the
activities. Chemical
No unusual fish mortality events.
If there is no available data use the fol owing High mortalities of aquatic species near
imposition of limited advisories or by area
contaminants are
criteria:
outfal s.
closures of fisheries; or
here defined as
If there is no available data use the fol owing Some use of pesticides in small areas; or
Large-scale mortalities of aquatic species.
compounds that are
criteria:
Presence of small sources of dioxins or
If there is no available data use the fol owing
toxic or persistent or
No use of pesticides; and
furans (e.g., small incineration plants or
criteria:
If there is no available data use the fol owing
bioaccumulating."
No sources of dioxins and furans; and
bleached kraft/pulp mil s using chlorine);
Large-scale use of pesticides in agriculture
criteria:
No regional use of PCBs; and
or
and forestry; or
Indications of health effects resulting
No bleached kraft pulp mil s using chlorine Some previous and existing use of PCBs
Presence of major sources of dioxins or
from use of pesticides; or
bleaching; and
and limited amounts of PCB-containing
furans such as large municipal or industrial Known emissions of dioxins or furans from
No use or sources of other contaminants.
wastes but not in amounts invoking local
incinerators or large bleached kraft pulp
incinerators or chlorine bleaching of pulp;
concerns; or
mil s; or
or
Presence of other contaminants.
Considerable quantities of waste PCBs in
Known contamination of the environment
the area with inadequate regulation or has
or foodstuffs by PCBs; or
invoked some public concerns; or
Known contamination of the environment
Presence of considerable quantities of
or foodstuffs by other contaminants.
other contaminants.
Issue 7: Suspended
No visible reduction in water transparency; Evidently increased or reduced turbidity
Markedly increased or reduced turbidity
Major changes in turbidity over wide or
solids
and
in streams and/or receiving riverine and
in small areas of streams and/or receiving
ecological y significant areas resulting
"The adverse effects of
No evidence of turbidity plumes or
marine environments but without major
riverine and marine environments; or
in markedly changed biodiversity or
modified rates of release
increased siltation; and
changes in associated sedimentation or
Extensive evidence of changes in
mortality in benthic species due to
of suspended particulate No evidence of progressive riverbank,
erosion rates, mortality or diversity of flora
sedimentation or erosion rates; or
excessive sedimentation with or without
matter to water bodies
beach, other coastal or deltaic erosion.
and fauna; or
Changes in benthic or pelagic biodiversity
concomitant changes in the nature of
resulting from human
Some evidence of changes in benthic or
in areas due to sediment blanketing or
deposited sediments (i.e., grain-size
activities"
pelagic biodiversity in some areas due
increased turbidity.
composition/redox); or
to sediment blanketing or increased
Major change in pelagic biodiversity or
turbidity.
mortality due to excessive turbidity.
Issue 8: Solid wastes
No noticeable interference with trawling
Some evidence of marine-derived litter on
Widespread litter on beaches giving rise to
Incidence of litter on beaches sufficient
"Adverse effects
activities; and
beaches; or
public concerns regarding the recreational
to deter the public from recreational
associated with the
No noticeable interference with the
Occasional recovery of solid wastes
use of beaches; or
activities; or
introduction of solid
recreational use of beaches due to litter;
through trawling activities; but
High frequencies of benthic litter recovery
Trawling activities untenable because of
waste materials into
and
Without noticeable interference with
and interference with trawling activities;
benthic litter and gear entanglement; or
water bodies or their
No reported entanglement of aquatic
trawling and recreational activities in
or
Widespread entanglement and/or
environs."
organisms with debris.
coastal areas.
Frequent reports of entanglement/
suffocation of aquatic species by litter.
suffocation of species by litter.
Issue 9: Thermal
No thermal discharges or evidence of
Presence of thermal discharges but
Presence of thermal discharges with large
Presence of thermal discharges with large
"The adverse effects
thermal effluent effects.
without noticeable effects beyond
mixing zones having reduced productivity
mixing zones with associated mortalities,
of the release of
the mixing zone and no significant
or altered biodiversity; or
substantial y reduced productivity or
aqueous effluents at
interference with migration of species.
Evidence of reduced migration of species
noticeable changes in biodiversity; or
temperatures exceeding
due to thermal plume.
Marked reduction in the migration of
ambient temperature
species due to thermal plumes.
in the receiving water
body."
Issue 10: Radionuclide No radionuclide discharges or nuclear
Minor releases or fal out of radionuclides
Minor releases or fal out of radionuclides
Substantial releases or fal out of
"The adverse effects of
activities in the region.
but with well regulated or wel -managed
under poorly regulated conditions that do
radionuclides resulting in excessive
the release of radioactive
conditions complying with the Basic Safety
not provide an adequate basis for public
exposures to humans or animals in relation
contaminants and
Standards.
health assurance or the protection of
to those recommended under the Basic
wastes into the aquatic
aquatic organisms but without situations
Safety Standards; or
environment from
or levels likely to warrant large scale
Some indication of situations or exposures
human activities."
intervention by a national or international
warranting intervention by a national or
authority.
international authority.
Issue 11: Spills
No evidence of present or previous spil s of
Some evidence of minor spil s of hazardous Evidence of widespread contamination
Widespread contamination by hazardous
"The adverse effects
hazardous material; or
materials in small areas with insignificant
by hazardous or aesthetical y displeasing
or aesthetical y displeasing materials
of accidental episodic
No evidence of increased aquatic or avian
smal -scale adverse effects one aquatic or
materials assumed to be from spil age
from frequent spil s resulting in major
releases of contaminants
species mortality due to spil s.
avian species.
(e.g. oil slicks) but with limited evidence of
interference with aquatic resource
and materials to the
widespread adverse effects on resources or
exploitation or coastal recreational
aquatic environment
amenities; or
amenities; or
as a result of human
Some evidence of aquatic or avian species
Significant mortality of aquatic or avian
activities."
mortality through increased presence of
species as evidenced by large numbers of
contaminated or poisoned carcasses on
contaminated carcasses on beaches.
beaches.
xii
REGIONAL ASSESSMENTS
THE GIWA METHODOLOGY
xiii
Table 5c: Scoring criteria for environmental impacts of Habitat and community modification
Issue
Score 0 = no known impact
Score 1 = slight impact
Score 2 = moderate impact
Score 3 = severe impact
Issue 12: Loss of ecosystems or
There is no evidence of loss of
There are indications of fragmentation Permanent destruction of at least one
Permanent destruction of at least one
ecotones
ecosystems or habitats.
of at least one of the habitats.
habitat is occurring such as to have
habitat is occurring such as to have
"The complete destruction of aquatic
reduced their surface area by up to 30
reduced their surface area by >30%
habitats. For the purpose of GIWA
% during the last 2-3 decades.
during the last 2-3 decades.
methodology, recent loss will be
measured as a loss of pre-defined
habitats over the last 2-3 decades."
Issue 13: Modification of
No evidence of change in species
Evidence of change in species
Evidence of change in species
Evidence of change in species
ecosystems or ecotones, including
complement due to species extinction
complement due to species extinction
complement due to species extinction
complement due to species extinction
community structure and/or species
or introduction; and
or introduction
or introduction; and
or introduction; and
composition
No changing in ecosystem function
Evidence of change in population
Evidence of change in population
"Modification of pre-defined habitats
and services.
structure or change in functional group
structure or change in functional group
in terms of extinction of native species,
composition or structure
composition or structure; and
occurrence of introduced species and
Evidence of change in ecosystem
changing in ecosystem function and
services2.
services over the last 2-3 decades."
2 Constanza, R. et al. (1997). The value of the world ecosystem services and natural capital, Nature 387:253-260.
Table 5d: Scoring criteria for environmental impacts of Unsustainable exploitation of fish and other
living resources
Issue
Score 0 = no known impact
Score 1 = slight impact
Score 2 = moderate impact
Score 3 = severe impact
Issue 14: Overexploitation
No harvesting exists catching fish
Commercial harvesting exists but there One stock is exploited beyond MSY
More than one stock is exploited
"The capture of fish, shel fish or marine
(with commercial gear for sale or
is no evidence of over-exploitation.
(maximum sustainable yield) or is
beyond MSY or is outside safe
invertebrates at a level that exceeds the
subsistence).
outside safe biological limits.
biological limits.
maximum sustainable yield of the stock."
Issue 15: Excessive by-catch and
Current harvesting practices show no
Up to 30% of the fisheries yield (by
30-60% of the fisheries yield consists
Over 60% of the fisheries yield is
discards
evidence of excessive by-catch and/or
weight) consists of by-catch and/or
of by-catch and/or discards.
by-catch and/or discards; or
"By-catch refers to the incidental capture
discards.
discards.
Noticeable incidence of capture of
of fish or other animals that are not the
endangered species.
target of the fisheries. Discards refers
to dead fish or other animals that are
returned to the sea."
Issue 16: Destructive fishing
No evidence of habitat destruction due Habitat destruction resulting in
Habitat destruction resulting in
Habitat destruction resulting in
practices
to fisheries practices.
changes in distribution of fish or
moderate reduction of stocks or
complete col apse of a stock or far
"Fishing practices that are deemed to
shel fish stocks; or
moderate changes of the environment;
reaching changes in the environment;
produce significant harm to marine,
Trawling of any one area of the seabed
or
or
lacustrine or coastal habitats and
is occurring less than once per year.
Trawling of any one area of the seabed
Trawling of any one area of the seabed
communities."
is occurring 1-10 times per year; or
is occurring more than 10 times per
Incidental use of explosives or poisons
year; or
for fishing.
Widespread use of explosives or
poisons for fishing.
Issue 17: Decreased viability of
No evidence of increased incidence of
Increased reports of diseases without
Declining populations of one or more
Col apse of stocks as a result of
stocks through contamination and
fish or shel fish diseases.
major impacts on the stock.
species as a result of diseases or
diseases or contamination.
disease
contamination.
"Contamination or diseases of feral (wild)
stocks of fish or invertebrates that are a
direct or indirect consequence of human
action."
Issue 18: Impact on biological and
No evidence of deliberate or accidental Alien species introduced intentional y
Measurable decline in the population
Extinction of native species or local
genetic diversity
introductions of alien species; and
or accidental y without major changes
of native species or local stocks as a
stocks as a result of introductions
"Changes in genetic and species diversity No evidence of deliberate or accidental
in the community structure; or
result of introductions (intentional or
(intentional or accidental); or
of aquatic environments resulting from
introductions of alien stocks; and
Alien stocks introduced intentional y
accidental); or
Major changes (>20%) in the genetic
the introduction of alien or genetical y
No evidence of deliberate or accidental
or accidental y without major changes Some changes in the genetic
composition of stocks (e.g. as a result
modified species as an intentional or
introductions of genetical y modified
in the community structure; or
composition of stocks (e.g. as a result
of escapes from aquaculture replacing
unintentional result of human activities
species.
Genetical y modified species
of escapes from aquaculture replacing
the wild stock).
including aquaculture and restocking."
introduced intentional y or
the wild stock).
accidental y without major changes in
the community structure.
xiv
REGIONAL ASSESSMENTS
THE GIWA METHODOLOGY
xv
Table 5e: Scoring criteria for environmental impacts of Global change
Issue
Score 0 = no known impact
Score 1 = slight impact
Score 2 = moderate impact
Score 3 = severe impact
Issue 19: Changes in hydrological
No evidence of changes in hydrological Change in hydrological cycles due
Significant trend in changing
Loss of an entire habitat through
cycle and ocean circulation
cycle and ocean/coastal current due to
to global change causing changes
terrestrial or sea ice cover (by
desiccation or submergence as a result
"Changes in the local/regional water
global change.
in the distribution and density of
comparison with a long-term time
of global change; or
balance and changes in ocean and coastal
riparian terrestrial or aquatic plants
series) without major downstream
Change in the tree or lichen lines; or
circulation or current regime over the
without influencing overall levels of
effects on river/ocean circulation or
Major impacts on habitats or
last 2-3 decades arising from the wider
productivity; or
biological diversity; or
biodiversity as the result of increasing
problem of global change including
Some evidence of changes in ocean
Extreme events such as flood and
frequency of extreme events; or
ENSO."
or coastal currents due to global
drought are increasing; or
Changing in ocean or coastal currents
change but without a strong effect on Aquatic productivity has been altered
or upwel ing regimes such that plant
ecosystem diversity or productivity.
as a result of global phenomena such
or animal populations are unable to
as ENSO events.
recover to their historical or stable
levels; or
Significant changes in thermohaline
circulation.
Issue 20: Sea level change
No evidence of sea level change.
Some evidences of sea level change
Changed pattern of coastal erosion due Major loss of coastal land areas due to
"Changes in the last 2-3 decades in the
without major loss of populations of
to sea level rise has became evident; or
sea-level change or sea-level induced
annual/seasonal mean sea level as a
organisms.
Increase in coastal flooding events
erosion; or
result of global change."
partly attributed to sea-level rise
Major loss of coastal or intertidal
or changing prevailing atmospheric
populations due to sea-level change or
forcing such as atmospheric pressure
sea level induced erosion.
or wind field (other than storm
surges).
Issue 21: Increased UV-B radiation as No evidence of increasing effects
Some measurable effects of UV/B
Aquatic community structure is
Measured/assessed effects of UV/B
a result of ozone depletion
of UV/B radiation on marine or
radiation on behavior or appearance of
measurably altered as a consequence
irradiation are leading to massive loss
"Increased UV-B flux as a result polar
freshwater organisms.
some aquatic species without affecting
of UV/B radiation; or
of aquatic communities or a significant
ozone depletion over the last 2-3
the viability of the population.
One or more aquatic populations are
change in biological diversity.
decades."
declining.
Issue 22: Changes in ocean CO
No measurable or assessed changes
Some reasonable suspicions that
Some evidences that the impacts
Evidences that the changes in
2
source/sink function
in CO source/sink function of aquatic
current global change is impacting the
of global change have altered the
source/sink function of the aquatic
2
"Changes in the capacity of aquatic
system.
aquatic system sufficiently to alter its
source/sink function for CO of aquatic
systems in the region are sufficient to
2
systems, ocean as well as freshwater, to
source/sink function for CO .
systems in the region by at least 10%.
cause measurable change in global CO
2
2
generate or absorb atmospheric CO as a
balance.
2
direct or indirect consequence of global
change over the last 2-3 decades."
xiv
REGIONAL ASSESSMENTS
THE GIWA METHODOLOGY
xv
The Global International Waters Assessment (GIWA) is a holistic, globally
comparable assessment of all the world's transboundary waters that recognises
the inextricable links between freshwater and coastal marine environment and
integrates environmental and socio-economic information to determine the
impacts of a broad suite of influences on the world's aquatic environment.
Broad Transboundary Approach
The GIWA not only assesses the problems caused by human activities manifested by
the physical movement of transboundary waters, but also the impacts of other non-
hydrological influences that determine how humans use transboundary waters.
Regional Assessment - Global Perspective
The GIWA provides a global perspective of the world's transboundary waters by assessing
66 regions that encompass all major drainage basins and adjacent large marine ecosystems.
The GIWA Assessment of each region incorporates information and expertise from all
countries sharing the transboundary water resources.
Global Comparability
In each region, the assessment focuses on 5 broad concerns that are comprised
of 22 specific water related issues.
Integration of Information and Ecosystems
The GIWA recognises the inextricable links between freshwater and coastal marine
environment and assesses them together as one integrated unit.
The GIWA recognises that the integration of socio-economic and environmental
information and expertise is essential to obtain a holistic picture of the interactions
between the environmental and societal aspects of transboundary waters.
Priorities, Root Causes and Options for the Future
The GIWA indicates priority concerns in each region, determines their societal root causes
and develops options to mitigate the impacts of those concerns in the future.
This Report
This report presents the assessment of the Indian Ocean Islands, one of two oceanic
assessments conducted by the GIWA. The region covers the Island States of Comoros,
Mauritius, Madagascar and Seychelles and the vast oceanic expanses between them.
The most important transboundary concern is pollution, particularly solid wastes, which
end up in the coastal and oceanic environments causing degradation of ecosystems and
considerable economic impacts. Policy options to address the root causes of solid waste
pollution are presented and their efficiency, equitability and practicality are discussed.