
(1,1) -1- Cover 42_only.indd 2004-08-10, 10:15:00
Global International
Waters Assessment
Guinea Current
GIWA Regional assessment 42
Abe, J., Wellens-Mensah, J., Diallo, O. S. and C. Mbuyil Wa Mpoyi
Global International
Waters Assessment
Regional assessments
Global International
Waters Assessment
Regional assessment 42
Guinea Current
GIWA report production
Series editor: Ulla Li Zweifel
Report editor: Ulla Li Zweifel
Editorial assistance: Johanna Egerup, Malin Karlsson and Monique Stolte
Maps & GIS: Niklas Holmgren
Design & graphics: Joakim Palmqvist
Global International Waters Assessment
Guinea Current, GIWA Regional assessment 42
Published by the University of Kalmar on behalf of
United Nations Environment Programme
© 2004 United Nations Environment Programme
ISSN 1651-940X
University of Kalmar
SE-391 82 Kalmar
Sweden
United Nations Environment Programme
PO Box 30552,
Nairobi, Kenya
This publication may be reproduced in whole or in part and
in any form for educational or non-profit purposes without
special permission from the copyright holder, provided
acknowledgement of the source is made. No use of this
publication may be made for resale or for any other commercial
purpose whatsoever without prior permission in writing from the
United Nations Environment Programme.
CITATIONS
When citing this report, please use:
UNEP, 2004. Abe, J., Wellens-Mensah, J., Diallo, O.S. and C. Mbuyil
Wa Mpoyi. Guinea Current, GIWA Regional assessment 42.
University of Kalmar, Kalmar, Sweden.
DISCLAIMER
The views expressed in this publication are those of the authors
and do not necessarily reflect those of UNEP. The designations
employed and the presentations do not imply the expressions
of any opinion whatsoever on the part of UNEP or cooperating
agencies concerning the legal status of any country, territory,
city or areas or its authority, or concerning the delimitation of its
frontiers or boundaries.
This publication has been peer-reviewed and the information
herein is believed to be reliable, but the publisher does not
warrant its completeness or accuracy.
Contents
Preface
9
Executive summary
11
Abbreviations and acronyms
15
Regional definition
19
Boundaries of the Guinea Current region
19
Physical characteristics
22
Socio-economic characteristics
37
Assessment
55
Comoe Basin
Freshwater shortage
56
Pollution
57
Habitat and community modification
59
Unsustainable exploitation of fish and other living resources
60
Volta Basin
Freshwater shortage
61
Pollution
63
Habitat and community modification
64
Unsustainable exploitation of fish and other living resources
65
Niger Basin
Freshwater shortage
66
Pollution
68
Habitat and community modification
69
Unsustainable exploitation of fish and other living resources
70
Congo Basin
Freshwater shortage
72
Pollution
73
Habitat and community modification
73
Unsustainable exploitation of fish and other living resources
74
Guinea Current LME
Pollution
75
Habitat and community modification
78
Unsustainable exploitation of fish and other living resources
80
CONTENTS
Global change
83
Synthesis of the Guinea Current region
84
Priority concerns for further analysis
85
Causal chain analysis
88
Modification of stream flow: Case of the Volta Basin
88
Modification and loss of ecosystem: Case of the Niger Basin
93
Eutrophication: Case of the Comoe Basin
97
Chemical pollution: Case of the Guinea Current LME
99
Overexploitation of fish: Case of the Guinea Current LME
103
Policy options
106
Modification of stream flow: Case of the Volta Basin
106
Modification and loss of ecosystems: Case of the Niger Basin
109
Eutrophication: Case of the Comoe Basin
113
Chemical pollution: Case of the Guinea Current LME
115
Overexploitation of fish: Case of the Guinea Current LME
118
Conclusions and recommendations
120
References
127
Annexes
132
Annex I How to quantify the international character of a hydrographic basin
132
Annex III GDP and other economic indicators in the countries of the Guinea Current region
145
Annex IV HDI and other socio-economic indicators in the countries of the Guinea Current region
146
Annex V Statistics related to water access and water use in the countries of the Guinea Current region
147
Annex VI Status of international conventions regarding waters in the Guinea Current region
149
The Global International Waters Assessment
i
The GIWA methodology
vii
8
GIWA REGIONAL ASSESSMENT 42 GUINEA CURRENT
Preface
The present (preprint version) report is based on the GIWA Basin Reports for Comoe, Volta, Niger and Volta. In each of these basins a team of regional
experts has conducted the GIWA assessment. UCC-Water has assisted in training workshops held for the basin teams as well as in the compilation
of the present report.
The fol owing experts have participated in the Basin teams:
Name
Institutional affiliation
Country
Field of work
Comoe Basin
Dr. Jacques Abe, Coordinator
Centre de Recherces Oceanologiques, Abidjan
Côte d'Ivoire
Oceanography, Coastal management
Dr. Bamba Siaka Barthelemy
Centre de Recherces Oceanologiques, Abidjan
Côte d'Ivoire
Hydrology
Mrs. Kaba Nassere
Ministčre de l'Environnement et du Cadre de Vie, Abidjan
Côte d'Ivoire
Legal aspects
Mr. Kouassi Aka Marcel
Centre de Recherces Oceanologiques, Abidjan
Côte d'Ivoire
Pol ution
Dr. Kouadio Alain Serges
Universite Abobo-Adjame, Abidjan
Côte d'Ivoire
Socio-economics, Environmental economics
Volta Basin
Mr. Julius Wel ens-Mensah, Coordinator
Hydrological Services Department, Accra
Ghana
Hydrology, Coastal engineering & management, EIA
Department of Oceanography and Fisheries, University of Ghana,
Mr. Ayaa Kojo Armah
Ghana
Oceanography, Fisheries, Coastal management, EIA
Lagon
Mr. Daniel Senanu Amlalo
Environmental Protection Agency, Accra
Ghana
Environmental resources, Coastal management, Institutional
Programme de Gestion Integree des Ressources en Eau,
Mr. Innocent Ouedraogo
Burkina Faso
Hydrology
Ouagadougou
Environmental economics, Socio-economics, Coastal
Mr. Kingsley Tetteh
Environmental Protection Agency, Accra
Ghana
management
Mr. Carl Fiati
Environmental Protection Agency, Accra
Ghana
Environment
Mr. Ben Ofori
Volta Basin Research Project
Ghana
Socio-economics and Natural resource management
Niger Basin
Ing. MSc. Ousmane S. Dial o, Coordinator
Niger Basin Authority
Niger
Water resources and environment
Ing. Amadou Housseini Maiga
Direction Nationale de l'Hydraulique et de l'Energie
Mali
Hydrologist
Mr. Edmond Kabore
Association pour le développement des adductions d'eau
Burkina Faso
Social and economic aspects
Dr. Emmanuel Olusegun Oyewo
Nigerian Institute for Oceanography and Marine Research, Lagos
Nigeria
Water, air, land, noise, pol ution, EIA
Congo Basin
Mr. Charles MbuyiI Wa Mpoyi, Coordinator
Ministčre de l'Energie
Democratic Republic of the Congo Water Resources
Dr. Jean Folack
Station de Recherches Halieutiques et Oceanographiques, Lime
Cameroon
Oceanography, Pol ution
Ing. Georges Gulemvuga
Ministčre de l'Energie
Democratic Republic of the Congo Marine Expert
Dr. Paul Hengue
Ministry of Environment and Forests
Cameroon
Sociology and environment
Ing. Kayembe Ditanta
Ministčre de l'Energie
Democratic Republic of the Congo Water resources
PREFACE
9
The overall Scaling and Scoping assessment of the Guinea Current region was conducted by the fol owing experts:
Name
Institutional affiliation
Country
Field of work
Mr Julius Wel ens-Mensah
Hydrological Services Department, Accra
Ghana
Hydrology, Coastal engineering & management EIA
Mr. Ayaa Kojo Armah
Department of Oceanography and Fisheries, University of Ghana, Lagon
Ghana
Oceanography, Fisheries, Coastal management EIA
Mr. Daniel Senanu Amlalo
Environmental Protection Agency, Accra
Ghana
Environmental resources, Coastal management, Institutional
Mr. Kingsley Tetteh
Environmental Protection Agency, Accra
Ghana
Environmental economics, Socio-economics, Coastal management
Dr. Jacques Abe
Centre de Recherces Oceanologiques, Abidjan
Côte d'Ivoire
Oceanography, Coastal management
Mr. Aka Marcel Kouassi
Centre de Recherces Oceanologiques, Abidjan
Côte d'Ivoire
Pol ution
Dr. Kouadio Alain Serges
Univesite Abobo-Adjame, Abidkan
Côte d'Ivoire
Socio-economics, Enviornmental economics
Dr. Emmanuel Olusegun Oyewo
Nigerian Institute for Oceanography and Marine Research, Lagos
Nigeria
Water, air, land, noise, pol ution, EIA
Dr Jean Folack
Station de Recherches Halieutiques et Oceanographiques, Lime
Cameroon
Oceanography, Pol ution
Dr. Lawrence Fojamimi Awosika
Nigerian Institute for Oceanography and Marine Research, Lagos
Nigeria
Physical, Oceanography, Marine geology
In addition to the above reports, important references for the coastal and marine part of the region was the GEF/UNIDO Transboundary Diagnostic
Analysis of Guinea Current LME.
10
GIWA REGIONAL ASSESSMENT 42 GUINEA CURRENT
Executive summary
GIWA region 42 covers the Guinea Current Large Marine Ecosystem
The region contains huge variations in hydrological conditions of
(GCLME) and the basins of the rivers flowing into it. The coastal zone
its freshwater resources; from the Sahel deserts and dryland in the
stretches over 5 560 km from the Bissagos archipelago in Guinea-Bissau
northern Niger Basin to the tropical jungles of the DR Congo. Therefore
to the mouth of the Congo River. The region includes 28 international
it was deemed necessary to carry out the GIWA assessment on the
river basins and covers entirely or partial y 27 countries with a land area
basis of the four major international river basins in the region: the Niger
of 8 340 200 km2. In spite of the differences in size and population, the
and the Volta basins, predominantly in the arid and semiarid Sahel; the
countries share many similarities in socio-economic conditions. First
Comoe, predominantly in the more humid coastal zone along the Gulf
and foremost in relation to demography, culture and history; but also
of Guinea; and the Congo, representative for equatorial Central Africa.
in relation to economy and social conditions, with the World Bank
These four entities represent 75% of the region's area and 90% of the
characterising most of the countries of the region as "Least developed
total area of international basins in the region. The marine issues are of
countries".
different nature and accordingly, the Guinea Current LME and its coastal
waters were assessed as a fifth entity.
The demand for water arises mainly from agriculture, fol owed by
domestic and industrial demands. The basic water supply and sanitation
The main water-related environmental concerns and issues were
sectors lack development and investment. Freshwater, coastal and
identified in each assessed entity. The table below gives an overview
marine areas all serve as important sources of food and protein to the
of the concerns and issues and their order of priority:
local populations.
Overall view of the priority concerns and issues in the Guinea Current region.
Basin
Concern-Issues 1
Concern-Issues 2
Concern-Issues 3
Others
Pollution
Habitat and community modification
Unsustainable exploitation of fish and
Freshwater shortage
Comoe River
· Eutrophication
· Loss of ecosystems
other living resources
· Modification of stream flow
· Microbiological (not an international issue)
· Overexploitation
Freshwater shortage
Habitat and community modification
Unsustainable exploitation of fish and
Pollution
· Modification of stream flow
· Modification of ecosystems
other living resources
· Microbiological
Volta River
· Lowering of water table
· Overexploitation
Global change1
· Changes in hydrological cycles
Habitat and community modification
Freshwater shortage
Unsustainable exploitation of fish and
Pollution
· Loss of ecosystems
· Modification of stream flow
other living resources
· Eutrophication
Niger River
· Modification of ecosystems
· Changes in water table
· Overexploitation
Global change1
· Destructive practices
· Changes in hydrological cycles
Pollution
Unsustainable exploitation of fish and
Freshwater shortage
Habitat and community modification
Congo River
· Chemical
other living resources
· Modification of stream flow
· Loss of ecosystems
· Solid wastes
· Overexploitation
· Modification of ecosystems
Pollution
Unsustainable exploitation of fish and
Habitat and community modification
Global change1
Guinea Current
· Chemical
other living resources
· Loss of ecosystems
· Sea level change
Large Marine
· Oil spil s
· Overexploitation
· Modification of ecosystems (incl. coastal
Ecosystem (GCLME)
· Destructive practices
erosion)
· By-catch
1 Changes in hydrological cycles could fall into Global change if the present assumptions become scientific evidences. This concern may become a priority for the future.
EXECUTIVE SUMMARY
11
The fol owing general conclusions may be drawn:
failure due to adverse climatic conditions.
Habitat and community modification, together with the closely
Improving water sector technology as such is a robust response
associated concern Unsustainable exploitation of fish and other
increasing the efficiency of water use: consume less water per capita,
living resources, are regional concerns that occur in al five entities.
and produce more crop value per volume of water used.
Freshwater shortage is a key concern in the river basins of the Sahel
Control the population growth in the Basin to reduce future
such as the Niger and Volta. Pollution is a general concern in the humid
increases in water demand.
basins and in the coastal and marine waters. It is particularly related to
national hotspots. International impacts are, so far, relatively limited.
Habitat and community modification in the
Niger Basin
There is scarcity of data and studies on the associated socio-economic
The immediate causes of the ecosystem depletion in the Niger Basin
impacts, but there is a general consensus, that the impacts are significant
were primarily associated with two main issues:
in relation to both public health and economic development.
Reduction in stream flow due to climatic evolution has had a
significant impact on stream flow;
Five cases were selected for Causal chain and Policy option analysis and
Increased sediment loads from soil erosion due to poor land
are briefly summarised below.
management practices have changed the water quality and the
sedimentation patterns.
Freshwater shortage in the Volta Basin
The root causes behind these immediate causes were identified as:
The immediate causes of the severe freshwater shortage in the Volta
Adverse climate evolution over the last 40 years;
Basin were primarily associated with three main impacts:
Population growth has significantly increased the per capita
Reduction in natural rainfall input to the river system over the last
pressure on the natural resources;
40 years;
Lack of technological innovation and funds, has led to unsustainable
Increased diversion and water losses to satisfy agricultural water
land management practices;
needs in the rural development sector;
Lack of efficient governance constrains the possibilities to address
Increased diversion and associated water losses to satisfy the water
the issues.
supply needs of the ongoing urbanisation and industrialisation.
The root causes behind these impacts were identified as:
The fol owing policy options were identified to address these causes:
Environmental conditions in the arid Sahel region, with decreasing
Improving water governance with emphasis on a reform of the
precipitation;
international and national policy and legislation framework by
The rapidly increasing population, creating increasing needs for
introduction of integrated land and water management. This can build
basic water supply and for agricultural production;
on existing frameworks, in particular the Niger Basin Authority, through
The lack of appropriate technology responses to the water
a comprehensive capacity development process.
shortages, such as development of water efficient agricultural
Addressing climatic evolution by establishing monitoring frame-
production systems and urban-industrial water supply systems;
works of trends and impacts on ecosystems.
The lack of an appropriate governance framework to address the
Improving agricultural and land use technology to increase
water conflicts in the Basin.
the efficiency of the land and water uses in order to minimise the
detrimental impact on ecosystems.
The fol owing policy options were identified:
Reducing poverty as it is commonly accepted that poverty is one of
Improving water governance is of crucial importance in order
the key constraints for efficient resource management and for depletion
to efficiently address the water shortages. Such governance shall
of the natural resources.
address local, national and international water management issues
Controlling the population growth because, with less people, the
in a comprehensive and transparent way by involving al appropriate
excessive pressure on natural resources would decrease.
stakeholders.
Addressing the climatic evolution in the Sahel region may be
initiated by establishing a monitoring framework of the actual trends
and by identifying their impacts on the development of the Basin, but
also by advocating robust water policies with a minimum of risk of
12
GIWA REGIONAL ASSESSMENT 42 GUINEA CURRENT
EXECUTIVE SUMMARY
13
Eutrophication in the Comoe Basin
Lack of knowledge, since the sources and the levels of chemical
The immediate causes of eutrophication in the Comoe Basin were
pollution are not well known. Also, the population is not aware of
identified as nutrient discharges into the water systems from non-
the health dangers they face.
point sources i.e. soil erosion due to deforestation, bush fires, and
Administrative practices are not efficient, since environmental laws
inappropriate land management. The sources also include human and
and regulations are not efficiently applied and enforced. Also, the
livestock excreta discharged directly along river courses. Point sources
development policies favour production at low cost rather than
are less extensive but occur in areas where agro-industrial units and
clean production.
dense human settlements use the natural water system as sewers.
Inadequate technologies, since the processes used by industry and
The root causes behind these immediate causes were identified as:
mining in Africa use heavily polluting methods and machinery.
Inefficient governance, causing insufficient integration of land and
Poverty and the weak economies are aggravating factors to
water management policy;
pol ution, since people or enterprises do not have the financial
Inappropriate land tenure regulations where lack of land ownership
means to change their practises. The market prices of their
reduces incentives to achieve sustainability in agricultural
commodities do not motivate the adoption of less harmful but
practices;
more costly techniques.
Inadequate knowledge about the effects of inappropriate land use
practises, the effects of use of fertilisers, and the effects of failures
The possible policy options for approaching these causes have been
in sewage systems.
identified as fol ows:
Improving knowledge about heavy metal contamination is
The fol owing policy options were identified:
recommended as an immediate action, being the key to better
Improving land and water governance appears to be the most
defining the other policy options. Thus, the implementation of a
urgent and appropriate policy option, in particular the introduction of
regional monitoring system for the chemical pol ution in Gulf of Guinea
integrated management of land and water within the context of the
is proposed as a first priority.
Comoe River Basin.
Improvement of the governance and management capacities
Reforming land tenure policies is recognised as a prerequisite for the
should be initiated. As a first step, needs-assessment must be
fight against land degradation.
carried out. The institutional framework should be harmonised with
Improving stakeholder knowledge and awareness is considered
legislation and designed according to the available human resources.
an important option for active involvement of the farmers concerning
The laws must be reviewed or reformulated according to the identified
the effects of poor soil management, deforestation and bushfires, and
problems.
on the appropriate use of fertilisers.
Improvement of technologies in the metal processing industry
Addressing poverty and lack of economic development constitutes
and the mining sector by introducing cleaner technologies and better
one of the important root causes, but the corresponding policy options
waste management practices.
exceed by far the authority of the water management framework.
Use of economic instruments for reduction of pol ution may be
introduced to improve the behaviour of the polluters.
Heavy metal pollution in the Guinea Current
LME
Overexploitation of fish and other living
Chemical pol ution by heavy metals is considered to be particularly
resources in the Guinea Current LME
critical as an international issue in the Guinea Current LME.
The immediate causes for overexploitation of fish were identified as
The immediate causes of chemical pol ution by heavy metals were
fol ows:
identified as fol ows:
Increased fishing effort, especial y by foreign trawlers in the offshore
Effluents from metal plating enterprises (e.g. silver, copper,
areas. The demand for high quality fish and seafood products and
chromium, cadmium);
for ornamental species has also contributed to the overexploitation
Releases from mining activities (e.g. mercury used by artisanal gold
of lagoon and coastal resources.
miners);
Environmental changes in water temperatures and coastal
Leaching from solid waste dumps and landfil s.
upwelling play an important role in coastal pelagic fish abundance
The main root causes of the land-based chemical pol ution can be
and productivity.
summarised as fol ows:
12
GIWA REGIONAL ASSESSMENT 42 GUINEA CURRENT
EXECUTIVE SUMMARY
13
The main root causes of the decline of commercial fish stocks and the
non-optimal harvesting of living resources were identified as:
Inadequate knowledge about the complex ecosystem;
Insufficient governance, such as an inadequate legal framework
at the regional and national levels and inadequate policy
implementation and enforcement.
The fol owing policy options were identified:
Improving knowledge about fish stock dynamics and their relations
to the environment is considered a key to reaching agreements among
the 16 countries bordering the GCLME on sustainable fisheries.
Improving governance to promote sustainable fishing practices by
facilitating the optimal harvesting of living resources. This includes
the creation of a formalised institutional network, specialised in the
management of living resources.
Promotion of sustainable development of mariculture and coastal
aquaculture through biological and socio-economic assessments of
potential and feasibility.
14
GIWA REGIONAL ASSESSMENT 42 GUINEA CURRENT
Abbreviations and acronyms
ABN
See NBA
EEZ
Exclusive Economic Zone
ACOPS
Advisory Committee on the Protection of the Sea
EIA
Environmental Impact Assessment
AfDB
African Development Bank
EPA
Environmental Protection Agency (Ghana)
AGIEAC
Autorité gestion intégrée des eaux en Afrique centrale
ESRI
Environmental Systems Research Institute
ALG
Autorité pour le développement du Liptako Gourma
EU
European Union
AMCOW
African Ministerial Council on Water
FAO
Food and Agriculture Organisation of the United
BNETD
Bureau National d´Etudes Techniques et de
Nations
Développment de Côte d´Ivoire (formerly DCGTx)
FCCC
United Nations Framework Convention on Climate
BOD
Biochemical Oxygen Demand
Change
CAR
Central African Republic
FCFA
Franc CFA (UEMOA and CEMAC)
CBD
Convention on Biological Diversity
FreshCo
Fresh Water and Coastal Zone Partnership
CCA
Causal Chain Analysis
FRIEND-AOC Flow Regimes from International Experimental
CEMAC
Central African Economic and Monetary Community
Network Data / Afrique de l'Ouest et Centrale
CIAPOL
Centre Ivoirien Anti-Pollution (Côte d'Ivoire)
GCLME
Guinea Current Large Marine Ecosystem
CIDA
Canadian International Development Agency
GDP
Gross Domestic Product
CIE
Compagnie Ivorienne Electricite
GNP
Gross National Product
CILSS
Comité permanent Interafricain de Lutte contre la
GEF
Global Environmental Facility
Sécheresse au Sahel
GEMS/Water Global Environment Monitoring System / Waters
CITES
Convention on International Trade of Endangered
GWP
Global Water Partnership
Species
HAB
Harmful Algal Bloom
CNCEDD
National Consultantive Commissions for the
HDI
Human Development Index (UNDP annual report)
Environment and Sustainable Development
IAEA
International Atomic Energy Agency
COMESA
Common Market for Eastern and Southern Africa
ICARM
Integrated Coastal Area and River Management
COREP
Comité Régional des Pęches du Golfe de Guinée
ICB
International Character of the Basin
CPUE
Catch Per Unit Effort
ICCARE
Identification et Conséquences d'une variabilité du
CREPA
Centre Régional pour l'Eau Potable et l'Assainissement
Climat en Afrique de l'Ouest non Sahélienne
ŕ faible coűt
ICZM
Integrated Coastal Zone Management
CWP
Country Water Partnerships (Benin)
ICOLD
International Commission on Large Dams
DHI
DHI Water & Environment
IMF
International Monetary Fond
DR Congo
Democratic Republic of Congo
IMO
International Maritime Organisation
ECOFAC
Conservation and Rational Use of Forest Ecosystems in
IOC
Intergovernmental Oceanographic Commission (of
Central Africa
UNESCO)
ECOWAS
Economic Community of West African States
IPCC
Intergovernmental Panel on Climate Change
ABBREVIATIONS AND ACRONYMS
15
IRD
Institut de Recherche pour le Développement
WAC/IWRM
West African Conference on Integrated Water
(Ex-ORSTOM)
Resources Management
ITCZ
Inter Tropical Convergence Zone
WAWP
West Africa Water Partnership (GWP)
IUCN
International Union for the Conservation of Nature
WARAP-IWRM West African Regional Action Plan on IWRM
IWRM
Integrated Water Resources Management
WCMC
World Conservation Monitoring Centre
LBTP
Laboratoire du Bâtiment et des Travaux Publics (Côte
WHO
World Health Organisation
d'Ivoire)
WMO
World Meteorological Organisation
LME
Large Marine Ecosystem
WRI
World Resources Institute
MDG
Mil ennium Development Goal
WSSD
World Summit on Sustainable Development
MFRD
Marine Fisheries Research Division (Ghana)
NBA
Niger Basin Authority (ABN, Autorité du Bassin du
Niger)
NEAP
National Environmental Action Plan
NECC
North Equatorial Counter Current
NEPAD
New Partnership for Africa Development
NGO
Non Government Organisations
NOAA
National Oceanic and Atmospheric Administration
NRC
Ex-Niger River Commission
ONEA
Office National de l'Eau et de l'Assainissement (Burkina
Faso)
ORSTOM
Ex-Office de Recherche Scientifique et Technique pour
le Développement (now IRD)
PFCM
Permanent Framework for Co-ordination and
Monitoring
POA
Policy Option Analysis
PPP
Purchasing Power Parity
RNO-CI
National Observation Network (Côte d'Ivoire)
SADC
Southern African Development Community
SCPA
Société Commerciale des Potasses d'Alsace
SISAG
Société Ivoiro-Suisse Abidjanaise de Granite (Côte
d'Ivoire)
SME
Small and Medium sized Enterprises
SODECI
Société de Distribution des Eaux de la Côte d'Ivoire
TDA
Transboundary Diagnostic Analysis
UCC-Water
UNEP Col aborating Center on Water and Environment
UEMOA
Union Economique et Monétaire Ouest Africaine
UNCED
United Nations Conference on Environment and
Development
UNDP
United Nations Development Programme
UNECA
United Nations Economic Commission for Africa
UNEP
United Nations Environment Programme
UNESCO
United Nations Educational Scientific and Cultural
Organisation
UNIDO
United Nations Industrial Development Organisation
USAID
United States Agency for International Development
WACAF
West and Central Africa
16
GIWA REGIONAL ASSESSMENT 42 GUINEA CURRENT
ABBREVIATIONS AND ACRONYMS
17
List of figures
Figure 1
Boundaries of the Guinea Current region.. . . . . . . . . . . . . . . . . . . . . . . . . . . . . . . . . . . . . . . . . . . . . . . . . . . . . . . . . . . . . . . . . . . . . . . . . . . . . . . . . . . . . . . . . . . . . . . . . . . . . . . . . . . . . . . . . . . . . . . 19
Figure 2
Outline of the spatial organisation of the Guinea Current region. . . . . . . . . . . . . . . . . . . . . . . . . . . . . . . . . . . . . . . . . . . . . . . . . . . . . . . . . . . . . . . . . . . . . . . . . . . . . . . . . . . . . . . . . . . . . . . 22
Figure 3
Simplified geological map of the region. . . . . . . . . . . . . . . . . . . . . . . . . . . . . . . . . . . . . . . . . . . . . . . . . . . . . . . . . . . . . . . . . . . . . . . . . . . . . . . . . . . . . . . . . . . . . . . . . . . . . . . . . . . . . . . . . . . . . . . 23
Figure 4
Vegetation map.. . . . . . . . . . . . . . . . . . . . . . . . . . . . . . . . . . . . . . . . . . . . . . . . . . . . . . . . . . . . . . . . . . . . . . . . . . . . . . . . . . . . . . . . . . . . . . . . . . . . . . . . . . . . . . . . . . . . . . . . . . . . . . . . . . . . . . . . . . . . . . . 25
Figure 5
Interannual variations of average rainfall and run-off indexes of sudano-sahelian Africa since the beginning of the past century.. . . . . . . . . . . . . . . . . . . . . . . . . . . . . 26
Figure 6
Standardised JJASO-mean rainfall in the Sahel, 1950-2000. . . . . . . . . . . . . . . . . . . . . . . . . . . . . . . . . . . . . . . . . . . . . . . . . . . . . . . . . . . . . . . . . . . . . . . . . . . . . . . . . . . . . . . . . . . . . . . . . . . . 26
Figure 7
The Comoe River Basin.. . . . . . . . . . . . . . . . . . . . . . . . . . . . . . . . . . . . . . . . . . . . . . . . . . . . . . . . . . . . . . . . . . . . . . . . . . . . . . . . . . . . . . . . . . . . . . . . . . . . . . . . . . . . . . . . . . . . . . . . . . . . . . . . . . . . . . . . 26
Figure 8
The Karfiguela waterfall near Banfora, Burkina Faso.. . . . . . . . . . . . . . . . . . . . . . . . . . . . . . . . . . . . . . . . . . . . . . . . . . . . . . . . . . . . . . . . . . . . . . . . . . . . . . . . . . . . . . . . . . . . . . . . . . . . . . . . . . 27
Figure 10 The Ebrié Lagoon at Abidjan. . . . . . . . . . . . . . . . . . . . . . . . . . . . . . . . . . . . . . . . . . . . . . . . . . . . . . . . . . . . . . . . . . . . . . . . . . . . . . . . . . . . . . . . . . . . . . . . . . . . . . . . . . . . . . . . . . . . . . . . . . . . . . . . . . . 27
Figure 9
The ComoeEbrié river-lagoon complex, Abidjan. . . . . . . . . . . . . . . . . . . . . . . . . . . . . . . . . . . . . . . . . . . . . . . . . . . . . . . . . . . . . . . . . . . . . . . . . . . . . . . . . . . . . . . . . . . . . . . . . . . . . . . . . . . . . . 27
Figure 11 Mean annual discharge of the Comoe River in Côte d'Ivoire. . . . . . . . . . . . . . . . . . . . . . . . . . . . . . . . . . . . . . . . . . . . . . . . . . . . . . . . . . . . . . . . . . . . . . . . . . . . . . . . . . . . . . . . . . . . . . . . . . . . 28
Figure 12 The Volta River Basin.. . . . . . . . . . . . . . . . . . . . . . . . . . . . . . . . . . . . . . . . . . . . . . . . . . . . . . . . . . . . . . . . . . . . . . . . . . . . . . . . . . . . . . . . . . . . . . . . . . . . . . . . . . . . . . . . . . . . . . . . . . . . . . . . . . . . . . . . . . 28
Figure 13 Hippopotamuses in the Bagre Reservoir along the Nakanbe (White Volta) in Burkina Faso. . . . . . . . . . . . . . . . . . . . . . . . . . . . . . . . . . . . . . . . . . . . . . . . . . . . . . . . . . . . . . . . . . . . . 29
Figure 14 A crocodile in Sabou pond (White Volta), Burkina Faso. . . . . . . . . . . . . . . . . . . . . . . . . . . . . . . . . . . . . . . . . . . . . . . . . . . . . . . . . . . . . . . . . . . . . . . . . . . . . . . . . . . . . . . . . . . . . . . . . . . . . . . . . 29
Figure 15 The Niger River Basin.. . . . . . . . . . . . . . . . . . . . . . . . . . . . . . . . . . . . . . . . . . . . . . . . . . . . . . . . . . . . . . . . . . . . . . . . . . . . . . . . . . . . . . . . . . . . . . . . . . . . . . . . . . . . . . . . . . . . . . . . . . . . . . . . . . . . . . . . . . 30
Figure 16 The Congo River Basin. . . . . . . . . . . . . . . . . . . . . . . . . . . . . . . . . . . . . . . . . . . . . . . . . . . . . . . . . . . . . . . . . . . . . . . . . . . . . . . . . . . . . . . . . . . . . . . . . . . . . . . . . . . . . . . . . . . . . . . . . . . . . . . . . . . . . . . . . . 31
Figure 17 Inga Dam on the Congo River. . . . . . . . . . . . . . . . . . . . . . . . . . . . . . . . . . . . . . . . . . . . . . . . . . . . . . . . . . . . . . . . . . . . . . . . . . . . . . . . . . . . . . . . . . . . . . . . . . . . . . . . . . . . . . . . . . . . . . . . . . . . . . . . . . 32
Figure 18 Surface currents in the Atlantic Ocean. . . . . . . . . . . . . . . . . . . . . . . . . . . . . . . . . . . . . . . . . . . . . . . . . . . . . . . . . . . . . . . . . . . . . . . . . . . . . . . . . . . . . . . . . . . . . . . . . . . . . . . . . . . . . . . . . . . . . . . . . 33
Figure 19 Mangroves and coral reefs in the Guinea Current region. . . . . . . . . . . . . . . . . . . . . . . . . . . . . . . . . . . . . . . . . . . . . . . . . . . . . . . . . . . . . . . . . . . . . . . . . . . . . . . . . . . . . . . . . . . . . . . . . . . . . . . 35
Figure 20 Map of protected areas in the Guinea Current region.. . . . . . . . . . . . . . . . . . . . . . . . . . . . . . . . . . . . . . . . . . . . . . . . . . . . . . . . . . . . . . . . . . . . . . . . . . . . . . . . . . . . . . . . . . . . . . . . . . . . . . . . . . 36
Figure 21 Map of Ramsar sites. . . . . . . . . . . . . . . . . . . . . . . . . . . . . . . . . . . . . . . . . . . . . . . . . . . . . . . . . . . . . . . . . . . . . . . . . . . . . . . . . . . . . . . . . . . . . . . . . . . . . . . . . . . . . . . . . . . . . . . . . . . . . . . . . . . . . . . . . . . 37
Figure 22 Population in Niger, Congo, Volta and Comoe basins and in Guinea Current LME. . . . . . . . . . . . . . . . . . . . . . . . . . . . . . . . . . . . . . . . . . . . . . . . . . . . . . . . . . . . . . . . . . . . . . . . . . . . . 39
Figure 23 Akosombo Dam in Ghana. . . . . . . . . . . . . . . . . . . . . . . . . . . . . . . . . . . . . . . . . . . . . . . . . . . . . . . . . . . . . . . . . . . . . . . . . . . . . . . . . . . . . . . . . . . . . . . . . . . . . . . . . . . . . . . . . . . . . . . . . . . . . . . . . . . . . 44
Figure 24 Relations between national policy, international agreements, juridical and institutional frameworks. . . . . . . . . . . . . . . . . . . . . . . . . . . . . . . . . . . . . . . . . . . . . . . . . . . . . . . . . 49
Figure 25 Water Hyacinth (Eichhornia crassipes). . . . . . . . . . . . . . . . . . . . . . . . . . . . . . . . . . . . . . . . . . . . . . . . . . . . . . . . . . . . . . . . . . . . . . . . . . . . . . . . . . . . . . . . . . . . . . . . . . . . . . . . . . . . . . . . . . . . . . . . . 58
Figure 26 Water Fern (Salvinia molesta).. . . . . . . . . . . . . . . . . . . . . . . . . . . . . . . . . . . . . . . . . . . . . . . . . . . . . . . . . . . . . . . . . . . . . . . . . . . . . . . . . . . . . . . . . . . . . . . . . . . . . . . . . . . . . . . . . . . . . . . . . . . . . . . . . 58
Figure 27 Water Lettuce (Pistia stratiotes). . . . . . . . . . . . . . . . . . . . . . . . . . . . . . . . . . . . . . . . . . . . . . . . . . . . . . . . . . . . . . . . . . . . . . . . . . . . . . . . . . . . . . . . . . . . . . . . . . . . . . . . . . . . . . . . . . . . . . . . . . . . . . . . 58
Figure 29 Evolution of annual flows of the Mouhoun (Black Volta) at Boromo. . . . . . . . . . . . . . . . . . . . . . . . . . . . . . . . . . . . . . . . . . . . . . . . . . . . . . . . . . . . . . . . . . . . . . . . . . . . . . . . . . . . . . . . . . . . . 61
Figure 28 Rainfall at Bobo-Dioulasso (Black Volta Basin), Ouagadougou (White Volta Basin), and Dori (Niger Basin) since the start of the observations.. . . . . . . . . . . . . . . . . . 61
Figure 30 Piezometric curve at Kimidougou, Pesso Sources, Aquifer GGQ, PZ5 northeast of Bobo-Dioulasso (Burkina Faso). . . . . . . . . . . . . . . . . . . . . . . . . . . . . . . . . . . . . . . . . . . . . . 62
Figure 31 Average rainfall in the Niger Basin in 1950-1967 and 1968-1995 depicting the southwards move of isohyets.. . . . . . . . . . . . . . . . . . . . . . . . . . . . . . . . . . . . . . . . . . . . . . . . . . . 66
Figure 32 Variability of annual rainfall in the Niger Basin 1950-2002. Deviation from the mean at the Niamey station.. . . . . . . . . . . . . . . . . . . . . . . . . . . . . . . . . . . . . . . . . . . . . . . . . . . 66
Figure 33 Variability of mean annual discharge in the Niger River 1950-2002. Deviation from the mean at the Niamey station. . . . . . . . . . . . . . . . . . . . . . . . . . . . . . . . . . . . . . . . . . . 67
Figure 34 Evolution of the monthly discharge of the Niger River. Comparison of three periods in Niamey and Koulikoro. . . . . . . . . . . . . . . . . . . . . . . . . . . . . . . . . . . . . . . . . . . . . . . . . . 67
Figure 35 The destiny of pollution from gold mines: from Ghana to Ghana via Côte d'Ivoire. . . . . . . . . . . . . . . . . . . . . . . . . . . . . . . . . . . . . . . . . . . . . . . . . . . . . . . . . . . . . . . . . . . . . . . . . . . . . . 77
Figure 36 Fish catch statistics in the Guinea Current Large Marine Ecosystem.. . . . . . . . . . . . . . . . . . . . . . . . . . . . . . . . . . . . . . . . . . . . . . . . . . . . . . . . . . . . . . . . . . . . . . . . . . . . . . . . . . . . . . . . . . . . 80
Figure 37 Causal chain diagram illustrating the causal links of freshwater shortage in the Volta Basin. . . . . . . . . . . . . . . . . . . . . . . . . . . . . . . . . . . . . . . . . . . . . . . . . . . . . . . . . . . . . . . . . . . 92
Figure 38 Causal chain diagram illustrating the causal links of ecosystems depletion in the Niger Basin. . . . . . . . . . . . . . . . . . . . . . . . . . . . . . . . . . . . . . . . . . . . . . . . . . . . . . . . . . . . . . . . . . 96
Figure 39 Causal chain diagram illustrating the causal links of eutrophication in the Comoe Basin.. . . . . . . . . . . . . . . . . . . . . . . . . . . . . . . . . . . . . . . . . . . . . . . . . . . . . . . . . . . . . . . . . . . . . . 99
Figure 40 Causal chain diagram illustrating the causal links of heavy metal pollution in Guinea Current LME. . . . . . . . . . . . . . . . . . . . . . . . . . . . . . . . . . . . . . . . . . . . . . . . . . . . . . . . . . . 102
Figure 41 Causal chain diagram illustrating the causal links of overexploitation in Guinea Current LME.. . . . . . . . . . . . . . . . . . . . . . . . . . . . . . . . . . . . . . . . . . . . . . . . . . . . . . . . . . . . . . . . 104
16
GIWA REGIONAL ASSESSMENT 42 GUINEA CURRENT
ABBREVIATIONS AND ACRONYMS
17
18
GIWA REGIONAL ASSESSMENT 42 GUINEA CURRENT


Regional defi nition
This section describes the boundaries and the main physical and
Boundaries of the Guinea
socio-economic characteristics of the region in order to defi ne the
Current region
area considered in the regional GIWA assessment and to provide
suffi
cient background information to establish the context within
GIWA region 42 covers the Guinea Current Large Marine Ecosystem
which the assessment was conducted.
(GCLME) and the basins of the rivers fl owing into it. It stretches from
north to south between the latitudes 25° N and 13° S and from west to
east between the longitudes 20° W and 32° E (Figure 1). The surface of
the land area is 8 340 200 km2.
Figure 1
Boundaries of the Guinea Current region.
REGIONAL DEFINITION
19
Table 1
The international basins of the Guinea Current region.
Table 2
Length of the coastline and area of the continental
Arranged according to the position of their mouths from west to east. The basins
shelf and EEZ of the countries bordering the Guinea
studied in the report are marked with blue.
Current LME.
Location of river
Area
Number of riparian countries and country
Basin
mouth
(km2)
area in the basin (km2)
Coastline Cont. shelf
EEZ
Coastline Cont. shelf
EEZ
Country
Country
Guinea-Bissau (9 000); Senegal (4 000);
(km)
(km2)
(km2)
(km)
(km2)
(km2)
Geba
Guinea Bissau
13 010
3
Guinea (10)
Guinea-
Corubal
Guinea Bissau
23 000
2
Guinea (17 000); Guinea-Bissau (6 000)
350
45 000
156 500 Nigeria
853
46 300
210 900
Bissau*
Great Scarcies Sierra Leone
12 000
2
Guinea (9 000); Sierra Leone (3 000)
Guinea
320
47 400
71 000
Cameroon
402
10 600
15 400
Little Scarcies Sierra Leone
19 000
2
Sierra Leone (13 000); Guinea (6 000)
Sierra
Rep.
Sierra Leone (11 000); Guinea (9 000); Liberia
402
25 600
165 700
169
11 300
60 000
Moa
Sierra Leone
23 000
3
Leone
Congo
(3 000)
Equatorial
Mana-Morro
S. Leone / Liberia
7 000
2
Sierra Leone (1 000); Liberia (6 000)
Liberia
579
18 400
229 700
296
14 710
293 200
Guinea
Loffa
Liberia
11 000
2
Liberia (10 000); Guinea (1 000)
Côte
Saint-Paul
Liberia
21 000
2
Liberia (12 000) Guinea (9 000)
515
10 200
104 600 Gabon
885
46 000
213 000
d'Ivoire
Liberia (13 000); Guinea (3 000);
Saint-John
Liberia
16 000
3
Ghana
539
23 700
218 100 DR Congo
37
1 150
1 000
Côte d'Ivoire (2)
Liberia (13 000); Côte d'Ivoire (2 200);
Togo
56
1 300
2 100
Angola*
1 600
51 000
330 000
Cestos
Liberia
15 200
3
Guinea (20)
Săo Tomé
Benin
121
3 100
27 100
209
1 460
160 000
Liberia / Côte
Côte d'Ivoire (16 600); Liberia (13 000); Guinea
& Príncipe
Caval y
30 6000
3
d'Ivoire
(1 000)
EEZ = Exclusive Economic Zone.
Sassandra
Côte d'Ivoire
67 000
2
Côte d'Ivoire (59 000); Guinea (8 000)
* Note on Guinea-Bissau and Angola: region 42 covers a distance from the level of the mouth of
Côte d'Ivoire (58 000); Burkina Faso (16 800);
the Geba River and Corubal River to the level of the mouth of the Congo River. About half of the
Comoe
Côte d'Ivoire
77 800
4
coast of Guinea-Bissau belongs to the GIWA region 41 (Canary Current) and almost the entire
Ghana (2 000); Mali (1 000)
Angolan coast belongs to the GIWA region 44 (Benguela Current).
Bia
Côte d'Ivoire
10 500
2
Ghana (6 000); Côte d'Ivoire (4 500)
(Source: FAO 1997, WRI 1994)
Tano
Côte d'Ivoire
16 000
2
Ghana (14 000); Côte d'Ivoire (2 000)
Burkina Faso (173 000); Ghana (165 000); Togo
The oceanic section stretches over 5 560 km of coast from the Bissagos
Volta
Ghana
411 000
6
(26 000); Mali (19 000); Benin (15 000); Côte
archipelago in Guinea-Bissau to the mouth of the Congo River.
d'Ivoire (13 000)
Mono
Togo-Benin
23 100
2
Togo (22 000); Benin (1 100)
Considering the continental shelf, the marine section has a superficial
Oueme
Benin
59 400
3
Benin (49 000); Nigeria (10 000); Togo (400)
area of around 350 000 km2 and 2 million km2 for the total of Exclusive
Nigeria (558 000); Mali (539 000); Niger
Economic Zones (EEZ) (Table 2).
(495 000); Algeria (161 000); Guinea (95 000);
Niger
Nigeria
2 101 140 11 Cameroon (87 000); Burkina Faso (82 300);
Benin (45 000); Côte d'Ivoire (22 800); Chad
(16 000); Sierra Leone (40)
The region covers 27 countries: 11 of them entirely and 16 partly
Cross
Nigeria
52 000
2
Nigeria (40 000); Cameroon (12 000)
(Table 3):
Akpa Yafi
Cameroon
5 000
2
Cameroon (3 000); Nigeria (2 000)
16 countries are coastal countries of the Guinea Current region:
Cameroon/
Cameroon (19 000); Equatorial Guinea
Ntem-Benito
45 000
3
Equatorial Guinea
(15 000); Gabon (11 000)
Guinea-Bissau, Guinea, Sierra Leone, Liberia, Côte d'Ivoire, Ghana,
Utamboni
Equatorial Guinea
7 000
2
Gabon (4 000); Equatorial Guinea (3 000)
Togo, Benin, Nigeria, Cameroon, Republic of the Congo, Equatorial
Mbe
Gabon
6 500
2
Gabon (6 000); Equatorial Guinea (500)
Guinea (including Bioko Island and four other islands), Gabon, the
221
Gabon (188 000); Rep. Congo (26 000);
Ogooue
Gabon
4
000
Cameroon (5 000); Equatorial Guinea (2 000)
Democratic Republic of Congo (DR Congo), Angola, and one island
Nyanga
Gabon
11 800
2
Gabon (11 000); Rep. Congo (800)
country: Săo Tomé and Príncipe.
DR Congo (7 500); Angola (3 700); Rep.
Chiloango
Angola (Cabinda)
11 500
3
7 countries are land-locked: Mali, Burkina Faso, Niger, Chad, the
Congo (300)
DR Congo (2 248 000); Central African
Central African Republic (CAR), Zambia and Uganda.
Republic (399 000); Angola (289 000); Rep.
4 countries have their coasts outside the region: Senegal and
Congo
DR Congo/Angola
3 401 500
9
Congo (247 000); Zambia (131 000); Cameroon
(85 000); Sudan (2 000); Gabon (400); Uganda
Mauritania to the Atlantic Ocean north of the region, Algeria to the
(100)
Mediterranean Sea and Sudan to the Red Sea. Mauritania has no
Of which basins studied: 5 991 440 km2 (90% of
Total area of international basins
6 718 070 the total)
impact on the water-balance of the Guinea Current region and is
Note: All the non-international basins of the region flow into the Guinea Current LME.
therefore not included in the analysis.
(Source: GIS analysis based on EROS DataCenter 2003 and ESRI 2002)
The region includes 28 international basins (Table 1) of which four are
In spite of the observed differences, mainly in terms of topography
studied in detail in the present report; Comoe, Volta, Niger and Congo.
and hydrology, the countries or parts of countries defined by the
These four basins represent a total area of 5 991 440 km2, corresponding
international basins of the region constitute undeniably a homogenous
to 75% of the terrestrial section and 90% of the total area of the
unit. First because of the geology, the climate and the environmental
international basins of the region.
conditions, secondly because of the populations, culture and history,
20
GIWA REGIONAL ASSESSMENT 42 GUINEA CURRENT
REGIONAL DEFINITION
21
Table 3
The 27 countries of the Guinea Current region.
Low income per capita and significant disparity;
Part in the region
Stagnation, or even recession of average revenues in a number of
Country
Basins Large river basins in each country (km2)
Area
% of
countries in the region struck by civil wars;
(km2)
country
Predominance of primary products in the national economies
Algeria
324 000
14
1
Niger (161 000)
(agriculture, timber, oil, mines);
Angola
298 000
24
2
Chiloango (3 700); Congo (289 000)
Dominance of rural population, but a rapidly urbanising society;
Mono (1 100); Niger (45 000); Oueme (49 000);
Benin
116 000
100
4
Volta (15 000)
Large population of young less than 15 years old;
Burkina Faso
272 000
100
3
Comoe (16 800); Niger (82 300); Volta (173 000)
Small population of people older than 65;
Akpa Yafi (3 000); Ntem-Benito(19 000); Congo
Cameroon
418 000
90
6
(85 000); Cross (12 000); Niger (87 000); Ogooue (5 000)
Socio-economic imbalance between men and women as shown
Central African
401 000
65
1
Congo (399 000)
by the UNDP annual reports;
Republic
Chad
16 000
1
1
Niger (16 000)
Low proportion of population having access to potable water and
DR Congo
2 260 000
97
2
Chiloango (7 500); Congo (2 248 000)
to adequate sanitation;
Chiloango (300); Congo (247 000); Nyanga (800);
Prevalence of water-related il nesses: malaria, Guinea worm, river
Rep. Congo
344 000
100
4
Ogooue (26 000)
blindness, bilharzia and other parasites, dysentery and cholera;
Bia (4 500); Caval y (16 600); Cestos (2 200); Comoe
Côte d'Ivoire
321 000
100
9
(58 000); Niger (22 800); Sassandra (59 000);
Increased infant mortality and low life expectancy at birth.
St. John (2); Tano (2 000); Volta (13 000)
Equatorial
Ntem-Benito(15 000); Mbe (500); Ogooue (2 000);
27 000
100
4
Guinea
Utamboni (3 000)
Table 4 shows that 21 countries among a total of 27 in the region, have
Ntem-Benito(11 000); Congo (400); Mbe (6 000);
Gabon
261 000
100
6
Nyanga (11 000); Ogooue (188 000), Utamboni (4 000)
a significant part of their populations living on fragile land and conflict
Bia (6 000); Comoe (2 000); Tano (14 000); Volta
Ghana
239 000
100
4
areas.
(165 000)
Caval y (1 000); Cestos (20); Corubal (17 000);
Geba (10); Great Scarcies (9 000); Little Scarcies
Table 4
Share of population living on fragile land or in conflict
Guinea
201 000
82
12
(6 000); Loffa (1 000); Moa (9 000); Niger (95 000);
areas and rural population growth.
Sassandra (8 000); St. John (3 000); St. Paul (9 000)
Guinea-Bissau
33 000
99
2
Corubal (6 000); Geba (9 000)
> 70%
50 to 70%
30 to 50%
20 to 30%
Caval y (13 000); Cestos (13 000); Loffa (10 000);
1 Country Growth 4 Countries
Growth 9 Countries
Growth 7 Countries
Growth
Liberia
96 000
100
7
Mana-Morro (6 000); Moa (3 000); St. John (13 000);
Niger
3.62%
Burkina Faso
2.47% Uganda
3.96%
Togo
2.45%
St. Paul (12 000)
Sudan
2.31% Sierra Leone
1.54%
Côte d'Ivoire
3.58%
Mali
1 019 000
81
3
Comoe (1 000); Niger (539 000); Volta (19 000)
Mali
2.47% Guinea
2.27%
Liberia
2.24%
Mauritania
197 000
19
0
DR Congo
2.00% Chad
2.35%
Ghana
2.84%
Niger
495 000
42
1
Niger (495 000)
Eq. Guinea
1.25%
Guinea-Bissau 2.01%
Akpa Yafi (2 000); Cross (40 000); Niger (558 000);
Nigeria
729 000
80
4
Cameroon
1.98%
Rep. Congo
ND
Oueme (10 000)
Săo Tomé &
Nigeria
2.38% Zambia
2.83%
1 000
100
0
Príncipe
Central Africa Rep. 1.98%
Senegal
5 000
12
1
Geba (4 000)
Benin
1.86%
Great Scarcies (3 000); Little Scarcies (13 000);
Sierra Leone
72 000
100
5
Note: ND = No Data. (Source: World Bank 2002)
Mana-Morro (1 000); Moa (11 000); Niger (40)
Sudan
2 000
0.08
1
Congo (2 000)
Another unifying characteristic is the common shoreline along the
Togo
57 000
100
3
Mono (22 000); Oueme (400); Volta (26 000)
Guinea Current LME, which is the very basis for the definition of the
Uganda
200
0.07
1
Congo (100)
region as a geographic entity. Because of this, the whole hydrographic
Zambia
133 000
18
1
Congo (131 000)
system of the region discharges elements in solution or in suspension
Total
8 340 200
- or even in flotation - to the ocean, from agricultural, domestic and
(Source: GIS analysis based on EROS DataCenter 2003 and ESRI 2002)
industrial activities. Part of the discharge takes place directly to the
and final y because of the economies and the social conditions situating
sea and part of it passes through humid coastal zones of significant
all the countries of the region among the developing countries.
economic and ecological importance. In fact, the majority of the
population of the region is concentrated in the coastal zone and lives
The countries have the fol owing characteristics:
to a certain degree on the resources of this rich environment.
Strong demographic growth due to a high fecundity index and,
moreover for the coastal countries, to migratory flux coming from
The strong unity of the region therefore justifies that it is treated as
the landlocked countries;
a single body in an analysis as the one made within the frame of the
GIWA project. However, the region has another characteristic, namely
20
GIWA REGIONAL ASSESSMENT 42 GUINEA CURRENT
REGIONAL DEFINITION
21
the expanse and the richness of its river system. The region covers in
the different riparian countries and consequently the predominance
fact more than 8 million km2 and includes 28 international basins. While
of the international problems compared to the national problems (see
stil considering the region as one single unit, it is thus legitimate at
Annex I).
the same time to carry out a sort of "sampling" of the most important
and the most representative river basins of the region in order to
Final y, four basins have been selected. These are, in descending ICB
apply the GIWA methodology on them. The objective is, through
order:
significant examples, to show the major concerns and problems of the
The Niger Basin
2 113 200 km2
11 countries
ICB = 5.21
international waters belonging to the Guinea Current region.
The Congo Basin
3 691 000 km2
13 countries
ICB = 4.19
The Volta Basin
412 800 km2
6 countries
ICB = 2.94
The selection of the international basins to be studied in detail has been
The Comoe Basin
78 100 km2
4 countries
ICB = 1.83
based on different criteria:
These four basins represent 75% of the surface area of the region and
Size of the basin (surface area and flow);
90% of the surface area of the international basins.
International character of the basin;
Position of the basins in relation to the climatic zones of the region;
Besides these four basins the fifth entity taken into consideration is the
Position of the mouth along the coast of the Guinea Current;
Guinea Current Large Marine Ecosystem (GCLME).
Human population and activities of the basin;
Access to relevant data.
Figure 2 synthesises the outline of the spatial organisation of the region.
This scheme shows that the region can be divided in two different
As for the international character of the basins, it seems that the
parts separated by the great tectonic fault of the Mount Cameroon: (i)
most simple criterion is the number of countries of the basin. But it
West Africa (flat relief, hot and dry climate, savannahs and high coastal
turns out that some of the basins have the major part of their surface
urbanisation) and (i ) Central Africa (surrounded by mountains, hot and
area situated in one country as for example Ogooue where 85% of
rainy climate, rainforests and low coastal urbanisation). These features
the Basin is situated in Gabon. Consequently, the purely Gabonese
help us to understand the difference in nature of the water issues in
problems become more important than the international problems. In
the two parts of the region: (i) predominantly quantitative issues in the
case of two basins covering the same number of countries, it has been
western part and (i ) predominantly qualitative issues in the central part.
considered that the basin presenting the most international character is
Figure 2 also shows the distribution of mangroves, corals and oil fields
the one where the basin is most equitably divided between the riparian
along the coast of the Guinea Current LME.
countries. In order to quantify this character a numeric indicator has
been invented: the so-cal ed International Character of the Basin or ICB.
This indicator takes into account not only the number of countries of the
basin but also the more or less equal distribution of the basin between
Physical characteristics
Topography
The continental section of the region is characterised by large flat
areas (plateaus, coastal plains and the Congolese basin) bordered
or intersected by strong reliefs: Fouta Djalon, Mount Cameroon
and Adamaoua, the Rift-Valley chain, the Shaba and the Angolan
plateau.
The topography of the plateaus is largely dominant, especial y in the
Sahelian area and in Angola. Subjected to erosion over a long period
of time, they often assume rounded forms. The Fouta Djalon massif,
and the Guinean ridge constituting its extension, borders the region
to the northwest. This is where the Niger River, the Senegal River and
Figure 2
Outline of the spatial organisation of the Guinea
the Gambia River, and several smal international rivers have their source
Current region.
(Source: UNEP-UCC Water)
leading to the notion of this group of mountains as "the water tower"
22
GIWA REGIONAL ASSESSMENT 42 GUINEA CURRENT
REGIONAL DEFINITION
23


of West Africa. The highest point is Mount Nimba reaching 1 752 m,
(Kivu), to the southeast (Shaba) and to the south. To the east the
situated at the border between the Côte d'Ivoire, Guinea and Liberia.
highest points of the DR Congo (5 119 m at the border with Uganda)
correspond to the shoulders of the Rift Val ey where the two African
The coastal plains are distributed al along the coast, with a width of
Great Lakes belonging to the GIWA region 47 are found: Lake Kivu
50 to 150 km. They are particularly prevalent between Liberia and the
and Lake Tanganyika. Although hydrographically belonging to the
Niger delta where the only signifi cant topography is the Atakora chain
Congo catchment, Lake Tanganyika is treated together with the other
stretching from the east of Ghana to the north of Benin passing through
Great Lakes of Rift Val ey in the GIWA Report 47. To the south, the high
the Togo mountains.
central Angolan plateau constitutes a vast unity reaching an altitude
of 1 000 to 1 500 m and giving rise to several tributaries on the left
Positioned where the coast changes direction, the Cameroon highland
bank of Congo River.
separates Central Africa from West Africa. Most of Cameroon is
mountainous. A vast peneplain having an average altitude of 400 to
Geology
700 m occupies the southern and central part of the country. North of the
The geological structure of the Guinea Current region is dominated by
fi fth latitude the plateau rises progressively to reach an altitude of more
the Precambrian formations constituting the bedrock of the African
than 1 500 m, thus forming the Adamaoua massif. But the highest ranges
plate, which outcrops over vast areas from Fouta Djalon right to the
are volcanic aligned along a great fault system directed southwest/
Angolan plateau (Figure 3). The Tertiary and Quaternary formations
northeast, of which the highest peak is Mount Cameroon, 4 070 m.
correspond to the coastal basins: Guinea-Bissau, Côte d'Ivoire, Niger
delta, Gabon-Congo-Angolan Basin, as wel as to the Inner delta of Niger
The Congolese depression is a vast fl at zone traversed by the Congo
(in Mali), and to the sediments of the Congolese depression. Final y,
River. Open to the west, the central depression is closed to all the
volcanic rocks have intruded the fault systems that traverse the African
other sides by the bordering ranges rising progressively to the east
platform: faults of Mount Cameroon, faults of the Rift Val ey, and fi ssures
Figure 3
Simplifi ed geological map of the region.
(Source: U.S. Geological Survey 2002)
22
GIWA REGIONAL ASSESSMENT 42 GUINEA CURRENT
REGIONAL DEFINITION
23
in Liberia and Côte d'Ivoire. Other volcanic formations can be observed
(rich in iron and aluminium), are divided into three large classes that
to the north of the region (Aďr mountains).
may be considered as three stages of the same process in which time
and humidity are determinant:
The continental margins of the Gulf of Guinea evolved from the
1. Fersial itisation
2. Ferruginisation
3. Ferral itisation (even
separation of Africa from South America with the opening of the
allitisation) (Table 5)
Atlantic Ocean. According to the Tectonic Classification of Coasts (Inman
Table 5
Alteration soils in the Guinea Current region.
& Nordstrom 1971), the coast of the Gulf of Guinea is a trailing edge
Increasing humidity
coast. This is a plate-imbedded coast that faces a spreading centre. The
particularity of the "Afro-trailing edge coast" is that the opposite side of
Climate
Arid
Tropical
Equatorial
the continent is also a trailing edge. The main characteristics are:
Drainage
Drained
Confined
Abundance of second order depositional features such as littoral
bars, deltas, marshes, mangrove swamps, and tidal flats;
Hydrolysis
Partial
Total
Total
Total
Deep incision by submarine canyons is restricted to the continental
Type of soil
Fersial itic soil
Ferruginous soil
Vertic soil
Ferral itic soil
slope;
(Source: Cougny 1998b)
Streams typical y drain from the interior of the continent.
Drainage basins are slightly smal er than the trailing edge coasts
The present conditions correspond mainly to the formation of
of the American continent and sediment supply is less resulting in
ferruginous soils. Currently, the ferral itic soils are found only in zones
narrower margins;
with heavy rainfal (more than 1 600 mm/year). Their generalised
Plateaus commonly back coastlines.
occurrence indicates former periods with a rainier climate. These soils
are general y moved and impoverished in clays at the surface.
A particularity of the region's coastline is the Cameroon volcanic axis.
The volcanic eruptions led to the formation of recent islands in the
The formation of a complete profile of ferruginous or ferral itic soil
Gulf of Guinea, namely Bioko (formerly Fernando Po, 1.1 mil ion years
requires a very long time scale; at least thousands of years. Once the
ago), Príncipe (24 to 38 million years ago), Săo Tomé (0.1 to 15.7 million
surface part of the profile has been removed by erosion, the soil is
years ago), and Annobon (5.1 to 24.6 mil ion years ago) (Barusseau &
no longer able to reconstitute itself, at least not on a human lifetime
Giresse 1987).
scale.
The continental shelf is general y narrow, in most places less than 100
There are also soils corresponding to particular conditions: brown
km but wider at the northwest of Liberia where the shelf reaches its
eutrophic soils on basic rocks (including volcanic rocks); hydromorphic
greatest width of about 220 km. The shelf break occurs at an average
soils in places where water is permanently present; less developed
water depth of 100 m. At least seven submarine canyons intersect the
moved soils (e.g. alluvia and colluvia); less developed climatic soils (e.g.
seaward edge of the shelf. The Congo Canyon is exceptional in that it
dunes); and less developed erosion soils (e.g. outcrops of bedrock).
crosses the entire shelf from 25 km offshore of the estuary (Veatch &
Smith 1939, Heezen et al. 1964, Shepard & Emery 1973).
Vegetation
The distribution of vegetation fol ows the climatic zoning (Figure 4).
The coast of the region general y has limited slope, and mostly sandy
It shows a distribution in paral el strips, directed east-west, with local
and surf-beaten shorelines. A review by Ibe & Ojo (1994) recognises
variations due to topography, edaphic factors and human interventions.
three broad types, namely, drowned coasts in the northern area,
Thus, on either side of the Equator is found:
sandbar or lagoon coasts between Liberia and western part of Nigeria,
Dense rainforest which is sometimes replaced by coastal savannahs
and deltas (e.g. Niger and Volta) usual y characterised by mangrove
and bordered along the coast by mangroves that are typical for the
swamps. Most of the coastal basins contain oil and gas fields that occur
lagoon environment where the water is slightly brackish. The areas
within Mesozoic or older sandstone deposits.
occupied by the dense rainforest have in fact been considerably
reduced as shown by satellite images;
Soils
A pattern of dense rainforest and Guinean savannah;
The geochemical alteration is dominant in the region. The
Sub-humid savannahs (Guinean-Sudanese and Sudanese);
corresponding soils, grouped under the name of sesquioxyde soils
Dry savannahs (Sudanese and Sudano-Sahelian);
24
GIWA REGIONAL ASSESSMENT 42 GUINEA CURRENT
REGIONAL DEFINITION
25


Figure 4
Vegetation map.
(Source: ESRI 1996)
The steppe (semi-desert) and the desert at the northern border of
(c) A coastal climate zone in eastern Ghana to Benin, where rainfall is
the Niger Basin;
low but the air is humid;
The mountainous forest at the edge of the Rift Val ey, east of the
(d) A tropical climatic region in the southwestern fringes where dry
Congo Basin.
and rainy seasons alternate.
Climate
Among the three issues of interest under Freshwater shortage,
The climate of the region is infl uenced by the northward and southward
modifi cation of stream fl ow is considered to be particularly important
movements of the Inter-Tropical Convergence Zone (ITCZ) associated
in the Sahelian part of West Africa. In this area, favourable rainfall from
with the Southwest monsoon and the Northeast trade winds. In July,
the 1950s to the mid-1960s attracted more people. Rainfall reverted to
the ITCZ and the humid southwest air masses migrate northwards to
normal low levels after 1970 (Figures 5 and 6), and by 1974 an estimated
about latitude 18° N along the coast and latitude 22° N inland. In the
250 000 people had died along with nearly all their cattle, sheep, and
equatorial zone, a double maximum rainfall pattern is experienced and
goats. Some 7 million people had to rely on emergency food aid. The
may spread over 8-12 months.
devastation prompted the United Nations to call a special conference
on desertifi cation in 1977 in Nairobi, Kenya.
Four general climatic zones are recognisable along the West African
Coast:
The possibility that the Sahel could enter another period of favourable
(a) An equatorial climatic region in Cameroon and southern Nigeria,
rainfal poses the risk of repeating the same tragedy as in the 1970s.
where rain fal s all year round and temperatures and humidity are
Scientists do not have enough information about the eff ect of
always high;
climatic disturbances on the resilience and long-term viability of "dry"
(b) A west tropical region along the Ghana to Guinea coast, which has
ecosystems; nor do they know the human and natural stress that these
heavy but seasonal rainfal , alternating with a dry season;
ecosystems can handle. One diffi culty in distinguishing between human
24
GIWA REGIONAL ASSESSMENT 42 GUINEA CURRENT
REGIONAL DEFINITION
25


Table 6
The main rivers of the Guinea Current region.
Basin
Flow
Basin
Flow
Basin
Flow
River
River
River
(km2)
(m3/s)
(km2)
(m3/s)
(km2)
(m3/s)
Congo
3 691 000
39 640
Bandama
97 500
285
Cross
52 800
1 557
Niger
2 113 200
8 500
Sassandra
80 000
360
Ntem/
45 000
288
Volta
412 800
700
Comoe
78 100
Benito
Ogooue
223 000
4 760
Oueme
59 500
182
Mono
23 400
110
Sanaga
135 000
2 060
Nyanga
12 300
511
Note: among those rivers, only Sanaga River and Bandama River are not international rivers
(see Table 1).
(Source: adapted from UNEP/UNESCO 1982, Wolf et al. 1999)
drainage axes have exceptional run-off like in the Saharan part of the
region (Algeria, northern Mali and Niger).
Figure 5
Interannual variations of average rainfall and run-off
The Comoe River Basin
indexes of sudano-sahelian Africa since the beginning
of the past century.
The Comoe Basin, located in a range of 2°45' to 5°58' W and 11°1' to 5°10'
(Source: Olivry et al. 1993)
N, is one of the largest rivers in West Africa. It has an area of 78 000 km˛
and a length of 1 160 km (Figure 7).
The Comoe River begins in Burkina Faso at 5 km north of Karfi guela at
an altitude of about 420 m and fl ows through Côte d'Ivoire from north
Figure 6
Standardised JJASO-mean rainfal in the Sahel, 1950-2000.
Note: JJASO stands for June, July, August, September and October. The averages are
standardised such that the mean and standard deviation of the series are 0 and 1.
(Source: World Bank 2002, quoting National Center for Atmospheric Research,
World Monitoring Surface Station Climatology)
and natural causes is the lack of data on the extent of grasslands before
human disturbance and the loss over time.
Main rivers of the region
In West Africa, annual run-off is greatest in areas of highest rainfall and
low evaporation such that the proportion of rainfal that becomes
run-off increases from north to south. For example, the low rainfall of
southern Ghana, Togo and Benin compared with other areas of similar
latitude is refl ected in low run-off from rivers such as the Pra, Mono and
Oueme. In Central Africa, rain is general y more intensive than in West
Africa, due to the position along the Equator and due to mountains
surrounding the Congo depression.
Table 6 lists the major rivers of the region that have a drainage area
exceeding 20 000 km2 and/or a rate of discharge greater than 100 m3/s.
Most of the river systems are international y shared basins.
The river systems are extensive and complex. A number of tributaries of
Figure 7
The Comoe River Basin.
Niger and Volta have no fl ow during parts of the year. Even more, some
(Source: data from Loveland et al. 2000)
26
GIWA REGIONAL ASSESSMENT 42 GUINEA CURRENT
REGIONAL DEFINITION
27
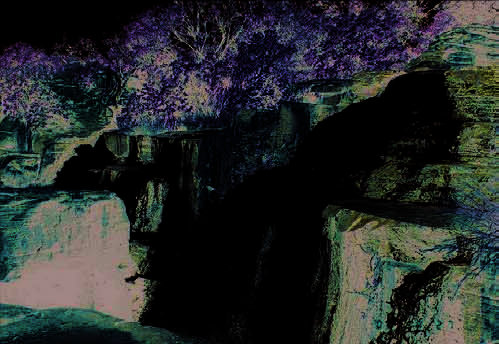
Figure 9
The ComoeEbrié river-lagoon complex, Abidjan.
The connection of the Comoe River to the Atlantic Ocean is very
Figure 8
The Karfiguela waterfall near Banfora, Burkina Faso.
complex from a hydrological point of view (Figure 9). When the Comoe
(Photo: DHI-ONEA)
arrives at Moossou, near Grand-Bassam, the flow is divided into two
parts. One part used to run directly to the Ocean through the outlet
to south where it discharges to the Atlantic Ocean at Grand-Bassam via
of Grand-Bassam (now closed). The other part enters into the Ebrié
the coastal Ebrié Lagoon and the Vridi Canal (Figure 8).
Lagoon and turns to the west, towards Abidjan, the economic capital
of Côte d'Ivoire (3.5 mil ion inhabitants). It crosses the city and arrives at
The northern part of the Basin has an altitude of between 400 and
the Ocean through the man-made channel of Vridi, opened in 1951 to
749 m while the southern part is mainly constituted of plateaus and
create the deepwater harbour of Abidjan in the Ebrié Lagoon (Figure 10).
plains characterised by a monotonous topography. Most of the area
Since this connection was opened, the waters of the Ebrié Lagoon have
of the Basin is located in a comparatively flat land of less than 300 m in
become brackish and the lagoon ecosystem has been substantially
altitude except for some mountainous zones, which are at most 500 m
modified. Moreover, the Comoe actual outlet by the Vridi canal is located
in altitude. Nearly 40% of the Basin is above 250 m and nearly 95% is
approximately 40 km west from the natural outlet of the River in Grand-
above 125 m.
Bassam. Another consequence is that the Comoe river flow now receives
the waters of four coastal rivers before arriving to the Ocean: Mé River,
In Burkina Faso the Comoe Basin covers an area of 18 326 km˛ localised
Béte River, Djibi River and Agnéby (or Agbo) River.
between 9°35' to 11°1' N and between 3°30' to 5°30' W and covers the
Comoe, Leraba, Houet, Kenedougou and Poni counties.
At the entrance of Côte d'Ivoire, the tributary Leraba River joins the
mainstream from west. The Leraba River also forms the boundary with
Burkina Faso for more than 100 km. The mainstream col ects Kolonkolo
River and Tobourougou River from the right bank and Kodoun River,
Bawe River and Boin River from the left bank before turning the general
direction to the south. After turning to the south, the Comoe River
Figure 10 The Ebrié Lagoon at Abidjan.
(Photo: DHI)
continues it's meandering but keeps the direction to the south with
some large meanders on the way.
The Comoe Basin in Burkina Faso includes three major sub-basins,
which are the Comoe itself, the Leraba and the Tiao. The main reservoirs
The river gradient is very gentle from the national boundary to a stretch
are at Karfiguela, Tourni, Lemouroudougou, Tingrela and Toumousseni.
nearly 200 km from the river mouth. From there, the gradient becomes
Data on the discharges are given in Table 7.
somewhat increased. At around 100 km from the river mouth, the
gradient becomes steep and the altitude decreases from 76 to 6 m in
The annual mean discharge at Abradinou (74 350 km˛) is 107.2 m3/s,
a zone of 14 km, where rapids consist of granite. This gives an average
which is equivalent to a specific discharge of 0.14 m3/s/100 km˛. The
slope of 5 m per km. After the rapids, the final stretch of nearly 100 km
specific discharge is 0.27 m3/s/100 km˛ at Kafalo (21 200 km˛) and 0.19
to the sea becomes gentle again.
m3/s/100 km˛ at Akakomoekro (57 000 km˛). The monthly discharge
26
GIWA REGIONAL ASSESSMENT 42 GUINEA CURRENT
REGIONAL DEFINITION
27


Table 7
Hydrological reference stations of the Comoe River in
Burkina Faso.
Reference
Inter-annual
Yearly volume
Number Name of the station
period
modulus (m3/s)
(mil ion m3)
01
Koba at Samogohiri
1996 - 1997
0.84
25
02
Comoe at K. Radier
1992 - 1998
1.22
39
03
Comoe at Diarabakoko
1992 - 1998
5.32
168
04
Comoe at Folonzo
1992 - 1999
14.10
445
05
Oriental Leraba at Douna
1988 - 1998
0.54
17
06
Occidental Leraba at Fourk
1974 - 1998
11.80
372
07
Leraba at Yendere
1988 - 1999
28.80
908
(Source: Government of Burkina Faso 2001)
varies considerably. Figure 11 displays the mean annual discharge
in three stations of Côte d'Ivoire: Kafalo (upper reach, fi g. a), Gansé
(middle reach, fi g. b) and Abradinou (lower reach, fi g. c). The decrease
of discharge during the years 1982 to 1984 can be observed.
The Volta River Basin
The Volta River system is constituted by the Black Volta (Mouhoun), the
White Volta (Nakanbe), the Red Volta (Nazinon) and the Oti River. Prior
to the construction of Lake Volta, these main tributaries of the Volta
River system combined to form the main Volta River, which empties
through the Lower Volta into the Gulf of Guinea at Ada in Ghana. The
Figure 12 The Volta River Basin.
mean annual fl ows of the main tributaries, namely, the Black Volta, the
(Source: data from Loveland et al. 2000)
White Volta, and the Oti River are respectively 8.3 million m3, 8.2 million
m3 and 12.6 million m3 (MWH 1998). The Oti River with only about 18%
than 500 m3/s. Nearly all the tributaries of Oti stop fl owing during the
of the total catchment area contributes between 30% and 40% of the
dry season recording annual average fl ow in the order of 5 m3/s (GEF/
annual fl ow of the Volta River system. The source of the Oti River is in the
UNEP 2002).
Atakora hil s of Benin at an altitude of about 600 m and it fl ows through
Table 8
Rivers of the Volta Basin.
Togo and Ghana. In Benin and Burkina Faso, the Oti River is referred to as
Basin and
Black Volta
White Volta
Daka
Oti
Lower
Total
the Pendjari River (Figure 12 and Table 8) (GEF/UNEP 2002).
area
(km2)
(km2)
(km2)
(km2)
Volta(km2)
(km2)
In Ghana
35 107
45 804
9 174
16 213
59 414
165 712
The tributaries of Oti River include the Koumongou, Keran, Kara, Mo,
Kpanle, Wawa, Menou, and Danyi rivers. Due to the regulation by the
Outside Ghana
113 908
58 945
ND
56 565
3 237
232 655
Kompienga Dam in Burkina Faso, the Oti River has a permanent fl ow
Total
149 015
104 749
9 174
72 778
62 651
398 367
with an annual average fl ow of 100 to 300 m3/s, and can reach more
Note: ND = No Data. (Source: Volta Basin GIWA Report 2003)
Figure 11 Mean annual discharge of the Comoe River in Côte d'Ivoire.
(Source: Comoe Basin GIWA Report 2003)
28
GIWA REGIONAL ASSESSMENT 42 GUINEA CURRENT
REGIONAL DEFINITION
29
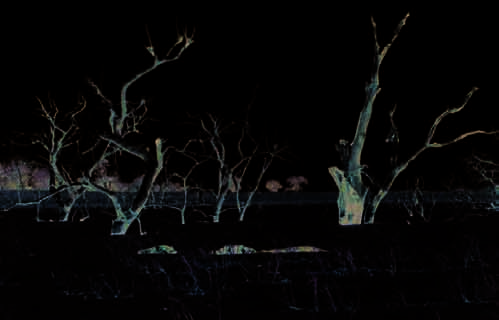
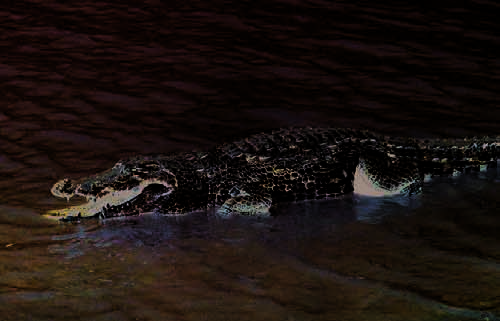
Figure 13 Hippopotamuses in the Bagre Reservoir along the
Figure 14 A crocodile in Sabou pond (White Volta), Burkina Faso.
Nakanbe (White Volta) in Burkina Faso.
(Photo: DHI)
(Photo: DHI)
The White Volta begins as the Nakanbe River in Burkina Faso
tributary of the Niger. This single purpose hydroelectric dam regulates
(Figure 13 and 14). The Red Volta, referred to as Nazinon in Burkina
approximately 5% of the average upstream flows. An important
Faso, and Sissili, are tributaries of the White Volta and they all have their
decrease in the intensity of the high flows has been observed since
source in Burkina Faso. The mean annual flow of the White Volta Basin
the 1970s. This resulted from a decrease in rainfall and scarcity of aquifer
is estimated to be about 300 m3/s (GEF/UNEP 2002).
resources.
The Sourou in Mali joins the Mouhoun in Burkina Faso and flows
The Inner delta is a vast inland-delta located in Mali. It extends over
downstream to Ghana as the Black Volta. In Burkina Faso, apart from the
an area of approximately 80 000 km˛ from Ke-Macina to Timbuktu. It
Mouhoun, all of the rivers, including the Nakanbe, Nazinon and Sissili,
comprises a complex and geographical y extensive system of influents,
dry up for approximately two months of the year. The mean annual
lakes and floodplains that have undergone significant development.
flow of the Black Volta at Bamboi is about 200 m3/s, of which about 43%
Some lakes (Debo and Horo) are classified as protected sites under the
originates from outside Ghana (GEF/UNEP 2002).
Ramsar wetland convention, particularly as habitats for water birds. The
inland-delta is subject to substantial seasonal and annual variations
Presently, Lake Volta, constructed between 1962 and 1965, has become
depending on inflows from the Upper Niger River and the Bani River.
a dominant feature of the Basin. It has a surface area of 8 500 km2 and
The inundated area has decreased 63%, from 35 000 km˛ in 1967 to
is reputed, in terms of surface area, to be one of the largest man-made
9 500 km˛ in 1984. This area plays an important role in regulating the
lakes in the world (GEF/UNEP 2002).
Table 9
Distribution of the Niger Basin and its population
among the riparian states.
The Niger River Basin
% of country area in
Population 2002
The Niger River is the third longest river in Africa (4 200 km) and the 14th
Country
% of the Basin area
the Basin
(mil ion)
longest in the world. It is the world's ninth largest basin and the second
Algeria
8.5
8.1
-
largest basin of the Guinea Current region, and covers 2.2 million km˛,
Benin
2.0
41.2
0.9
including approximately 1.5 million km˛ of active basin (Figure 15 and
Burkina Faso
3.4
28.0
2.4
Cameroon
3.9
18.8
3.1
Table 9). Based on the hydrology and the ecological diversity, four main
Chad
0.9
1.6
0.8
hydro-geographical sub-systems are identified:
Côte d'Ivoire
1.0
7.4
0.5
Guinea
4.3
39.4
1.9
Upper Niger (upstream) extends over approximately 140 000 km˛
Mali
25.5
46.7
7.9
from the source (Guinea) to Ke-Macina (Mali). It receives three main
Niger
24.8
44.5
8.7
tributaries, the Tinkisso, Milo, and Niandan rivers. Before the River enters
Nigeria
25.7
63.2
56.7
the Inner delta in Mali, at the southern edge of the Sahara Desert, its
Sierra Leone
<0.1
<0.1
-
flow averages approximately 45 million km3/year. The only significant
Total Niger Basin
82.9
control structure here is the Selingue Dam on the Sankarani River, a
(Source: UNDP 2002, GIS analysis based on ORNL 2003)
28
GIWA REGIONAL ASSESSMENT 42 GUINEA CURRENT
REGIONAL DEFINITION
29


Figure 15 The Niger River Basin.
(Source: data from Loveland et al. 2000)
fl ow of the Niger River. Of an average annual infl ow of 70 bil ion m3, only
rivers. The mean average run-off downstream of the Kainji and Jebba
50% reaches Timbuktu. The peak discharge of 6 000 m3/s at Koulikoro
dams is 1 454 mł/s and rises to 5 590 mł/s after the confl uence with the
(upper Niger) in September is not only reduced to 25% (2 350 m3/s) but
Benue River. The latter is the main tributary with a catchment area of
it is also delayed by two to three months (December-January).
450 000 km˛. Though the Benue contributes 50% of the Niger's fl ow,
the hydrological signifi cance across the Basin is lower as it only fl ows
Middle Niger covers 900 000 km˛ in Mali, Niger and partly in Benin.
through one country before joining the Niger River. From 1929 to 1970,
It is composed of a series of irrigated terraces. Upstream of the Niger
the yearly average discharge was 6 055 mł/s that is equivalent to almost
Republic, the River receives infl ow from tributaries in Burkina Faso,
200 billions of mł/year, versus a yearly average discharge of 5 066 mł/s
which include the Gorouol, Dargol and Sirba rivers.
that is equivalent to 160 billions of mł/year from 1971 to 2001.
Hydrological monitoring dating back to 1923 reveals that fl ows in the
The Congo River Basin
Middle Niger are signifi cantly aff ected by the fl ows from the Inner
The Congo River is the largest river basin of the Guinea Current region.
delta. Mean annual fl ow at Niamey (Niger) between 1971-2000 is 30%
It is the largest African river by its fl ow and the second largest in the
less compared to the fl ows between 1929-1970. This reduced fl ow has
world after the Amazon. By its length of 4 374 km it is the second largest
resulted in earlier and shorter fl oods.
African river after the Nile and is the fi fth in the world. Having a basin of
3.7 million km2, it drains 12% of the total surface of Africa and contains
Lower Niger (downstream) is located in the humid and very humid
30% of its total surface water resources (Figure 16). The position of the
zones in Nigeria with a catchment area of 450 000 km˛ and receives
Congo River and its tributaries astride the Equator (one third of the
several major tributaries including the Sokoto, Kaduna and Benue
Basin is in the northern hemisphere and two thirds in the southern
30
GIWA REGIONAL ASSESSMENT 42 GUINEA CURRENT
REGIONAL DEFINITION
31
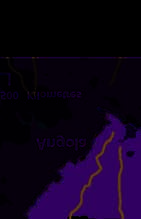
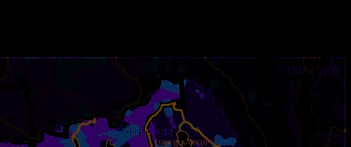


hemisphere) and the regular rainfal s make it the largest river with the
widens temporarily at the Malebo Pool (former Stanley Pool), providing
most regular fl ow in the world.
water to Kinshasa, the capital of the DR Congo on the left bank, and to
Brazzavil e, the capital of Republic of the Congo, on the right bank.
The discharge of the average low water in July is approximately 29 000
m3/s, while the discharge of the average high water in December
Downstream from Kinshasa the course of the lower Congo crosses the
reaches 60 000 m3/s. The average fl ow during the period from 1902
Livingstone rapids. The riverbed shows several narrowings resulting
to 1950 was about 41 300 m3/s. The rather important variability of the
in zones of insurmountable rapids with a diff erence in level of 265 m
precipitation results in a fl uctuation of the fl ow between a minimum of
over a distance of 300 km. At the level of Inga, 40 km from Matadi, the
23 000 m3/s and a maximum of 75 000 m3/s. The streaming coeffi cient
fl ow of the Congo River fal s 102 m over a distance of 15 km (Figure 17).
of the Congo Basin is rather limited (approximately 22.5%) due to the
Downstream from the river port of Matadi the estuary begins and the
loss of water by infi ltration into the permeable rocks of the central
River becomes navigable again for a distance of approximately 130 km
depression, as well as to the considerable evaporation from the Basin
right to its mouth. The riverbed widens: 4.6 km at Boma and 10 km at
(physical evaporation as well as evapotranspiration).
Banana where the Congo fl ows into the sea. It is so powerful that its
water is recognised as far as 45 km out in the open sea.
The Congo River has its source in the southern part of Katanga (DR
Congo), in the vil age of Musofi located at an altitude of 1 435 m. It bears
The width of the main riverbed varies greatly: 15.5 km at the confl uence
the name of Lualaba right to where it fl ows together with the Luvua at
with Ubangui, 23.4 km at Malebo Pool. At Kinshasa the riverbed narrows
Kisangani. Then the River fl ows in a northern direction to the rapids of
to not more than 1 650 m. At the river mouth the width reaches
Stanley under the Equator. At this place it begins a large arc of a circle
approximately 10 km. The fl ow of the River is scattered with more than
and turns southwest. It receives several important tributaries, among
4 000 islands, among which about 50 have a length of more than 50 km.
others the Aruwimi at the right bank and the Lomami at the left bank.
The hydrographic system of the Congo Basin includes furthermore a
It passes the Equator again and receives water from Oubangui, which
large system of tributaries and lakes. They are all located in the tropical
is a large tributary at the left bank and from Kasaď at the right bank. It
zone of the two hemispheres on both sides of the Equator.
Figure 16 The Congo River Basin.
(Source: data from Loveland et al. 2000)
30
GIWA REGIONAL ASSESSMENT 42 GUINEA CURRENT
REGIONAL DEFINITION
31
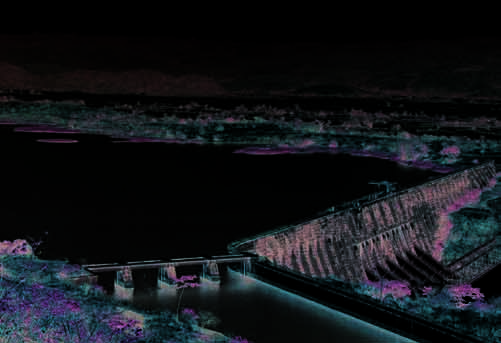
With a navigable river system of 17 285 km the Congo River Basin
constitutes the main transport link of central Africa. In several respects
the Congo River is the lifeline of DR Congo whose territory it covers by
98.2% providing the country not only with fish and electricity but also
with a vital transport link.
In the cataract zone (between the Malebo pool and the ocean zone),
the River covers 350 waterfal s through straight gorges were the altitude
drops some 300 m.
Aquifers
The aquifers are of different types (Table 10): groundwater available in
Figure 17 Inga Dam on the Congo River.
the cracks or the alteration profile of the basement, deep aquifers of
(Photo: Corbis)
the sedimentary coastal basins (Tertiary sands), and superficial layers
River sub-basins:
(fluvio-lagoon formations, littoral bars). The availability of groundwater
The Oubangui (DR Congo, CAR and Republic of the Congo), the
resources varies considerably from one type of substratum to another
longest tributary located only in the tropical zone of the northern
and, for the same geological conditions, from one region to another
hemisphere. At 2 300 km long it ranks number two by its flow next
depending on the rainfal and on infiltration which determine the
to the Kasaď. It is fed primarily by the Uele (DR Congo) and the Bomou
refilling of the aquifers.
(DR Congo and CAR). It is navigable during 7 out of 12 months.
The Kasaď (DR Congo and Angola), the most important tributary
Table 10 Overview of the hydrogeological characteristics of the
located entirely in the tropical zone of the southern hemisphere.
main subsoil units.
2 000 km long it has a flow of 12 000 m3/s. Its primary tributaries
Units
Facies
Hydrogeological properties.
are the Kwango and the Kwilu rising from Angola and the Sankuru
Normal y rather weak potentiality, except in fractured
Rock
and Lulua rising from DR Congo.
"Granitic"
environments.
Granites, gneiss,
The Sangha (Republic of the Congo, Cameroon and CAR). Water
Alterites
In general not very thick. Porosity of chinks.
migmatites
comes from the Woumo, Bok, Dja and Doume rivers in Cameroon,
Possibility of finding superficial aquifers (temporary
Laterites
and of limited extension) when the laterites underlie
from Kadéi in CAR and from Langa, Likouala and Kouyou in Republic
e
n
t
an impermeable substratum of deterioration clay.
of the Congo.
B
a
s
e
m
"Schistose"
General y very thick, clayey, heterogeneous, and
Schists, sandstone,
anisotropic. Limited resources. The presence of
The Lomami (DR Congo), rising from Mount Mitumba and running
arkoses, quartzites,
Altered zone
intercalations of detrital rocks functioning as drains
paral el to the River right to the confluence.
conglomerates,
improves the quality of the reservoir.
graywakes, tuffites
The Aruwimi, Itimbiri, Mongala, Lulonga and the Ruki rivers (DR
Strong lithological heterogeneity and strong
Hard rock
anisotropy due to schistosity.
Congo), located in the central basin.
Homogeneous, thick, sub-horizontal, very consolidated formations.
The Ruzizi (DR Congo, Rwanda and Burundi), feeding water from
Sandstone
More intense and more regular fissuring than in the basement.
Circulation by fissures and hydraulic continuity.
Lake Kivu into Lake Tanganyika.
The argil ites are practical y sterile. The sandstone intercalations
Schists, pelites
The Luvua (DR Congo), feeding water from Lake Moero into the
present good aquifer conditions.
Congo River.
Limestone, dolomites
Excel ent flows in the karstic massifs.
The Lukuga (DR Congo), which forms the outlet of Lake Tanganyika.
e
n
t
a
r
y
Permeability depends on the texture. Permeability is high nearby
Alterites above
the parent rock, particularly in sandstone, while it is low in the clayey
sedimentary rocks
S
e
d
i
m
parent rocks.
Lacustrian sub-basins:
Clay-sand series of the
Thick aquifers in the sandy series (supply most of the large cities of the
sedimentary coastal
Lake Kivu, shared between DR Congo and Rwanda.
coasts). Decreasing productivity when the content of clay increases.
basins
Lake Tanganyika, shared between DR Congo, Burundi, Rwanda,
Al uvial formations
Sporadic aquifers in direct connection with the watercourses.
Tanzania and Zambia and belongs to GIWA region 47.
Littoral bars
Not very thick freshwater aquifer underlying the salted groundwater.
Lake Moero, shared between DR Congo and Zambia; the Luapula
(Source: Cougny 1998b)
(DR Congo and Zambia) connects it to Lake Banguelo (Zambia).
32
GIWA REGIONAL ASSESSMENT 42 GUINEA CURRENT
REGIONAL DEFINITION
33
t
t
January
July
rren
rren
u
u
ary C
ary C
an
an
C
C
N . E q. Current
N. Eq
N . Eq. Current
. Counter Current
Guinea Current
Guinea Current
South Equatorial current
South Equatorial Current
Benguela Cu
B
rr
e
en
n
t
guelacurren
Upwelling
t
Front
© GIWA 2003
Figure 18 Surface currents in the Atlantic Ocean.
(Source: Wauthy 1983)
Oceanography
currents fl ow toward the Equator from each hemisphere along the west
The Guinea Current Large Marine Ecosystem (GCLME), comprises all
coast of Africa, with the Canary Current in the northern hemisphere and
the countries extending from the Bissagos Islands of Guinea-Bissau
the Benguela Current in the southern hemisphere.
to Angola. It owes its unity to the Guinea Current, an eastward fl ow
that is fed by the North Equatorial Counter Current (NECC) off the
While the northern border of the Guinea Current is distinct, but
Benguela Current
Liberian coast. The steep topography of the Gulf of Guinea causes
fl uctuating over the season, the southern boundary of the Guinea
the Guinea Current to deviate back towards the west as the South
Current is less wel defi ned. It is thought to be formed by the South
Equatorial Current (Figure 18). Seasonal upwelling occurs from July to
Equatorial Current (Binet & Marchal 1993). The South Equatorial Current
late September between Cape Palmas and Cotonou-Lagos, limited at
also forms the northern limb of the South Atlantic Subtropical Gyre,
each end by the infl ux of warm, low-salinity waters originating from the
which is fed by the Benguela Current (Mann & Lazier 1996). In the
Bight of Biafra and the Guinea coast.
present context, the southern boundary of the Guinea Current region
has been defi ned to extend to the DR Congo-Angola border.
The Inter-Tropical Convergence Zone (ITCZ), a rain-generating zone
of instability on the northern coast of the Gulf of Guinea, separates
The Guinea Current is an eastward superfi cial fl ow extending only to
northern trade winds and dry, continental, heavy air masses from wet,
25 m depth with a width of about 370 km off shore along most of its
maritime, lighter, southern trade winds. Its migration generates seasons
length (Longhurst 1962, Binet & Marchal 1993, Binet 1997). It overlays
in these coastal areas of Africa.
the Guinea Under Current, which fl ows westward. The Guinea Current
is fed by the North Equatorial Counter Current and a southward in-shore
The cold currents are associated with two active fronts that shift
tongue of water from the Canary Current.
position between winter (January) and summer (July). The alternation
zone (the area swept by the passage of the front) of the Canary Current
Within the Guinea Current the most important upwelling occurs from
extends from Cape Verga (Guinea-Bissau) to Cape Blanc (Mauritania)
July to September and a minor one in December to January. Both the
and with the Benguela system, from Cape Lopez (Gabon) to Cape Frio
major and minor upwel ing drive important pelagic species into the
(Angola) (Wauthy 1983).
upper layers of the water column, thereby increasing catchability. The
zone of upwelling is usual y confi ned to the area between Côte d'Ivoire
In the Atlantic basin, the current systems are dominated by the eff ect of
and Benin.
the two gyral currents of the northern and southern hemispheres. Cold
32
GIWA REGIONAL ASSESSMENT 42 GUINEA CURRENT
REGIONAL DEFINITION
33
Table 11 Main ecosystems in the region.
Ecosystems
Location
Description
Niger and extreme northwest region of the White
This zone can be described as Sudano-Sahelian. It experiences a minimal amount of rainfall of between 150 and 500 mm
Short grass (steppe) vegetation
Volta, covering some parts of Mali, Burkina Faso
annual y. Trees and shrubs are rare in this ecosystem, but a few tree species, such as Baobab, can be found.
and Niger.
Woody and shrub savannah, open
Open forest strands with dry vegetation. The zone covers parts of the Sourou Basin, northern White Volta, Oti, Red Volta,
Northern and middle Sudan
forest of dry type
and Black Volta basins.
Woody and shrub savannah, open forest
The zone is marked by forest gal eries of thick vegetation along river channels. Occupies the southwestern region of
Covers the southern Sudanese sector
of humid type
Burkina Faso and greater parts of Ghana, Togo, and Benin. Rainfall in this zone is between 1 000-1 300 mm annual y.
Located in areas of abundant rainfal : some parts of
Dense forest
West Africa coast, central depression of Republic of
Since the vegetation is also dependent upon soils, climate, and other factors, this vegetation in the region is not uniform.
the Congo.
The afromontane ecosystems in the region are general y dominated by dense forests and open grasslands. Soil
Highland forest
Mountains and high plateaus
conditions and precipitation seldom act as limiting growth factors whereas low temperature does. The vegetation is
zoned between dense rainforests at lower altitudes over bamboo forests to moorlands at higher altitudes.
Freshwater ecosystems in the region often contain vast numbers of endemic species. Fluctuations in water quality and
Freshwater ecosystems
Rivers, natural lakes and dam reservoirs
quantity together with the introduction of foreign species have led to drastic changes in both lacustrine and fluviatile
ecosystems.
The Ebrié Lagoon, the Volta River delta, the Niger
Coastal ecosystem (incl. mangroves and
The deltas/estuaries contain both open and closed lagoons and mangrove swamps. In Ghana, construction of the
River delta and the Congo estuary contain lagoons
coral reefs)
Akosombo Dam has isolated parts of the system, causing them to behave like closed lagoons.
and mangroves.
The marine ecosystems of the region are dominated by the presence of the Guinea Current. The coastline of the region is
Marine ecosystems
Atlantic Ocean
general y low lying and interspersed with marshes, lagoons and mangrove swamps. A number of estuaries interrupt the
barrier beaches that separate the lagoons from the sea.
(Source: DHI-UCC Water)
Main ecosystems
Table 12 Status of marine turtles in the GCLME according to
Table 11 shows the main ecosystems in the region. Only the aquatic
IUCN Red List Classification.
ecosystems are described in detail in the fol owing sections.
Species
Common name
IUCN Red List Classification
Chelonia mydas
Green turtle
Endangered
Coastal ecosystems and biodiversity
Caretta caretta
Loggerhead turtle
Endangered
Five of the seven remaining species of marine turtles in the world may
be found in the Gulf of Guinea where they lay their eggs at selected
Eretmochelys imbricata
Hawksbill turtle
Critical y endangered
places along the shores. These are the Green (Chelonia mydas), the
Lepidochelys olivacea
Olive Ridley turtle
Endangered
Leatherback (Dermochelys coriacea), the Hawksbil (Eretmochelys
Dermochelys coriacea
Leatherback turtle
Critical y endangered
imbricata), Loggerhead (Caretta caretta) and the Olive Ridley
(Source: IUCN 2002)
(Lepidochelys olivacea). Green turtles are classified as endangered
and Hawksbill turtles are classified as critically endangered (Table 12).
Mangroves (under influence of the tides) exist along the whole coast
Despite international initiatives to protect these endangered species,
of the region. There are approximately 6.5 mil ion ha of mangroves
marine turtles are still secretly hunted for food throughout the Gulf of
(mainly Rhizophora spp.) along the coast of Guinea-Bissau, Sierra
Guinea. Their eggs are also col ected by humans and also destroyed by
Leone, Côte d'Ivoire, Ghana, Benin, and Nigeria, providing habitat for
dogs and pigs on the beach.
fish, crustaceans, molluscs and water birds (UNEP 2002a, Akpabli 2000).
Marine mammals that inhabit the waters of the Gulf of Guinea are
In Nigeria, near the Niger delta, mangrove forests can be up to 50 km
mainly cetaceans (whales and dolphins) and manatees (sea cows). Of
wide. Mangroves also occur in Central Africa's coastal zone, particularly
special importance are the Atlantic Humpbacked dolphin (Sousa teuszi )
in Gabon, Equatorial Guinea and at the mouth of Congo River. In several
and the African manatee (Trichecus senegalensis). Both species appear
countries, the rivers are affected by the tides far upstream. In these cases
on the IUCN Red List of endangered species (IUCN 2002). The African
the mangroves can extend along the River far from the sea. In the Niger
manatee is classified as vulnerable and the humpbacked dolphin is
delta the mangrove is bordered by freshwater swamp forests covering
classified as highly endangered under the Convention on International
1 760 000 ha (Hughes & Hughes 1992). The mangrove forest of Nigeria
Trade of Endangered Species (CITES). At the end of summer, toothed, fin
is the third largest in the world and the largest in Africa (Moffat & Linden
and humpback whales migrate to the waters of the Gulf of Guinea from
1995). Over 60% (approximately 600 000 ha) is found in the Niger delta.
Antarctica (Jefferson et al. 1993, Elder & Pernetta 1991).
Other associated vegetation in the mangrove community includes
34
GIWA REGIONAL ASSESSMENT 42 GUINEA CURRENT
REGIONAL DEFINITION
35

climbers, grasses, sedges, herbs, shrubs and trees of various species
with 16 species fol owed by 10 species of Alesti dae (African tetras), 9
(Oyewo et al. 1998). The mangrove vegetation provides sanctuaries,
of Cichlidae (cichlids) and 10 of Mormyridae (elephant fi shes). Clariidae
breeding and nursery grounds for many commercial species of fi sh
(air breathing catfi shes), Eleotridae (sleepers) and Schilbeidae (schilbid
and shel fi sh and contributes signifi cantly to the biodiversity of the
catfi shes) represent each three or four species.
Niger delta.
With 142 species described, the Ebrié Lagoon (the coastal part of
Around the mouth of Comoe River, mangroves are along the coastal
Comoe Basin) features very high diversity (Froese & Pauly 2003).
Ebrié Lagoon. The dominant species are Rhizophora racemosa,
Morphological complexity, biotope variety and simultaneous presence
Avicennia germinans and Conocarpus erectus. They are accompanied by
of marine, brackish and desalted conditions explain this diversity. Several
other species, like Drepanocarpus lunatus, Hibiscus tiliaceus, Dalbergia
species of continental origin can tolerate moderate salinity variations:
ecastaphyl um, Acrostichum aureum, Phoenix reclinata, Pandanus
Chrysychtys nigrodigitatus, C. maurus, C. auratus, (bagrid catfi shes);
candelabrum, Panicum repens and Paspalum vaginatum.
Clarias ebriensis (air breathing catfi shes); and Hemichromis fasciatus
(cichlids). Some species are dependent of specifi c environments like
The Volta River delta contains both open and closed lagoons as
Tilochromis jentenki, characteristic of estuarine condition. Most of them
droughts and reductions or cessations of fl ooding due to the Akosombo
are marine species adapted to brackish situations (Liza grandisquamis,
Dam have isolated parts of the system, causing them to behave like
Pomadasys jubelini, Ethmalosa fi mbriata, Trachinotus teraia and Pseudolitus
closed lagoons. This area contains one of Ghana's most species-diverse
elongates), with reproduction in lagoons or one development phase in
mangrove forests, which is located at the mouth of the River and serves
the ocean. Other marine fi shes can make transient incursions in brackish
as a nursery site for commercial marine fi shes and shrimps. The Volta
environments. They are accompanied by a wide panel of secondary
River, including its delta, is a global y signifi cant habitat for migrating
species observed on particular occasions or locations, which contribute
birds and, as a result, the Keta and the Songhor lagoons have been
to the community diversity.
designated as Ramsar sites.
The Niger Basin provides habitats for a wide variety of fi shes, in total
Coral formations along the Gulf of Guinea coast are poorly documented.
33 families and 256 species (Froese & Pauly 2003) of which 20 are
They occur in Sierra Leone, Liberia, Côte d'Ivoire, Ghana, and around the
endemic. The most represented families are Cyprinidae (34 species),
islands of Săo Tomé, Príncipe and Bioko. The corals are also present in
Mochokidae (squeakers or upside-down catfi shes, 28 species) and
several places along the Central Africa coast. The corals appear above
Mormyridae (31 species). Besides for these fi sh species, it is also
the 60 m isobath in Gabon. Figure 19 shows their distribution.
home for hippopotamus, crocodiles and manatees. Furthermore, the
important vegetable biomass created by the expanse of the humid
Biodiversity of rivers, lakes and reservoirs
zones along the River constitutes a unique reservoir of biodiversity and
The Comoe Basin comprises 99 species of fi sh from 23 families (Froese
an essential barrier against desert encroachment.
& Pauly 2003). The family Cyprinidae (minnows or carps) is represented
The Volta Basin comprises 165 fi sh species within 26 families (Froese &
Pauly 2003). The most represented families are general y the same as in
the Niger Basin with 28 species of Cyprinidae, 16 species of Mochokidae,
19 species of Mormyridae and 18 species of Alestiidae.
The Congo Basin is particularly rich in biodiversity thanks to a large extent
to Lake Tanganyika. Lake Tanganyika is shared between the DR Congo,
Burundi, Tanzania and Zambia. It fl ows into the Congo River (Lualaba)
through its outlet from Lukuga. This lake has the richest biodiversity in
the world (Box 1). For an in-depth study on Lake Tanganyika and the
other great lakes of Rift Val ey see GIWA Report 47.
Figure 19 Mangroves and coral reefs in the Guinea Current
region.
Lake Kivu, located at an altitude of 1 470 m, is shared between the DR
(Source: Bryant et al. 1998, Olson et al. 2001)
Congo and Rwanda. It fl ows into Lake Tanganyika through the Ruzizi
34
GIWA REGIONAL ASSESSMENT 42 GUINEA CURRENT
REGIONAL DEFINITION
35


Box 1
The exceptional biodiversity of Lake Tanganyika.
Protected areas
Lake Tanganyika is located between 3°20' and 8°50' S and 29° and 31°30' E, at an
The defi nition of a protected area adopted by IUCN is:
elevation of 773 m. It has a length of more than 670 km. Its average width is 48
"An area of land and/or sea especial y dedicated to the protection and
km. The surface of the Lake is around 33 000 km2 and the average depth is close to
700 m. The maximum depth is 1 435 m. With a volume of almost 19 000 km3, the
maintenance of biological diversity, and of natural and associated cultural
Lake is the second largest freshwater stock in the world after the Lake Baikal.
The most remarkable characteristic of Lake Tanganyika is its biodiversity. It has the
resources, and managed through legal or other eff ective means".
largest biodiversity of all the lakes on Earth (vertebrates, invertebrates and plants
combined). It contains more than 1 300 species of fish, invertebrates and plants
among which 500 species do not exist anywhere else (endemic species). There are
Although all protected areas meet the general purposes contained in
at least 300 species of fish (new species are constantly discovered) among which
two thirds are peculiar to the Lake. Several of these species and their genera do not
this defi nition, in practice the precise purposes for which protected
have close relatives outside the Lake Basin due to its long and complex history. The
complex ecosystem of the Lake in terms of number of species as well as in terms of
areas are managed diff er greatly. Moreover, the level of protection is
their complex interactions is without any doubt unique in the world.
often more theoretical than respected.
Lake Tanganyika is also a vital water resource for the riparian countries and for the
Central and Eastern Africa regions. It plays a key role in the economic activity of the
region, producing approximately 100 000 tonnes of fish annually. Fish constitutes
the principal source of animal protein in the region. The Lake also constitutes the
The Guinea Current region has a large number of protected areas
basis of an impressive fish export industry for the four countries. Furthermore, it is
an irreplaceable freshwater resource for the local populations. Less than one million
depicted in Figure 20.
persons live in the immediate vicinity of the Lake but almost 12 million persons live
on its side basin. Finally, the Lake is an essential transport link for the four bordering
countries. The Lake is a centre for tourism (particularly for nature discovering) and,
Wetlands included in the Ramsar List may be parts of protected areas or
potentially, a centre for watersports (swimming, sailing).
not. They acquire a new status at the national level and are recognised
(Source: Cougny & Ipsen 1999 for UNOPS: Mid-term evaluation of the UNDP-GEF Lake Tanganyika
biodiversity project.)
by the international community as being of signifi cant value not only
River. It presents a morphological confi guration of a dam: many bays
for the country, or the countries, in which they are located, but also
and islands - the last mentioned being absent in the northern part. It is
for humanity as a whole. The Ramsar sites of the region are depicted
the volcanoes of the Virunga chain that have blocked the south-north
in Figure 21
stream of a river system rising from the Bafulero plateau close to Mount
Mulhi. This lake contains methane and the absence of convection
currents, as a consequence of a high density gradient, makes the Lake
a real methane deposit containing an estimated reserve of more than
57 billion m3.
Figure 20 Map of protected areas in the Guinea Current region.
Note: Sites 25-30 and 32 are located in the Congo Basin but belong to GIWA region 47, East African Rift Valley Lakes.
(Source: UNEP-WCMC 2003)
36
GIWA REGIONAL ASSESSMENT 42 GUINEA CURRENT
REGIONAL DEFINITION
37


No. Name
Country
Area (ha)
1
Gueltates Afi lala
Algeria
20 900
2
Les Gueltates d'Issakarassene
Algeria
35 100
3
Lac Horo
Mali
18 900
4
La Mare d'Oursi
Burkina Faso
45 000
5
Walado Debo/Lac Debo
Mali
103 100
6
Séri
Mali
40 000
7
Complexe Kokorou-Namga
Niger
66 829
8
La Mare aux hippopotames
Burkina Faso
19 200
9
Parc National du W
Burkina Faso
235 000
10
Lagoa de Cufada
Guinea-Bissau
39 098
11
Parc National du W
Niger
220 000
12
Zone humide du moyen Niger
Niger
88 050
13
Ile Alcatraz
Guinea
1
14
Iles Tristao
Guinea
85 000
15
Niger-Niandan-Milo
Guinea
1 046 400
16
Niger-Tinkisso
Guinea
400 600
17
Tinkisso
Guinea
896 000
18
Rio Kapatchez
Guinea
20 000
19
Rio Pongo
Guinea
30 000
20
Konkouré
Guinea
90 000
21
Niger-Mafou
Guinea
1 015 450
22
Sankarani-Fié
Guinea
1 015 200
23
Nguru Lake (and Marma Channel) complex Nigeria
58 100
24
Parc National de la Keran
Togo
163 400
25
Ile Blanche
Guinea
10
26
Niger Source
Guinea
180 400
27
Sierra Leone River Estuary
Sierra Leone
295 000
Basse Vallée du Couff o, Lagune Côtiere,
28
Benin
47 500
Chenal Aho, Lac Ahémé
Basse Vallée de l'Ouémé, Lagune de Porto-
29
Benin
91 600
Novo, Lac Nokoué
30
Owabi
Ghana
7 260
31
Lake Piso
Liberia
76 091
32
Reserve de faune de Togodo
Togo
31 000
33
Densu delta
Ghana
4 620
34
Sakumo Lagoon
Ghana
1 340
35
Songor Lagoon
Ghana
28 740
36
Anlo-Keta Lagoon complex
Ghana
127 780
37
Parc national d'Azagny
Cote d'Ivorie
19 400
38
Muni Lagoon
Ghana
8 670
La Réserve Communautaire du Lac Télé/
39
Congo
438 960
Likouala-aux-Herbes
40
Wongha-Wonghé
Gabon
380 000
41
Petit Loango
Gabon
480 000
Figure 21 Map of Ramsar sites.
42
Setté Cama
Gabon
220 000
43
Parc national des Mangroves
DR Congo
66 000
(Source: UNEP-WCMC 2000a)
44
Bangweulu Swamps: Chikuni
Zambia
250 000
Socio-economic characteristics the U.S. African Growth and Opportunity Act, the European Union's
"Everything but Arms" initiative, the New Partnership for African
Almost al the statistics for the region are available by country and
Development, and the launches of the Doha Development Round and
not for each river basin. Thus the indicators mentioned in the tables
the Africa Union. Ultimately, though, Africa's future depends on how it
should not be seen as representative for the region when it comes to
addresses economic and political governance, resolves civil confl icts,
the countries having only a smal part of their territory in the region.
and responds to the need for deeper economic and social reforms."
Consequently, it is recommended not to attach more importance than
deserved to indicators regarding countries having a smal part in the
The International Monetary Fund (IMF) makes a similar assessment:
region or having their maritime coastline in other regions.
"In 2001 the world economy experienced a synchronised, widespread
slowdown after the unusual y strong expansion of the previous year,
Economy
with growth slowing in every major region except Africa." Table 13
(Sources: UNECA 2002, World Bank 2002, UNDP 2002)
shows the African data compared to the World data.
According to the UN Economic Commission for Africa (UNECA 2002)
Table 13 Economic growth in Africa compared to other regions.
"Africa (economical y red.) grew faster than any other developing
region in 2001, refl ecting better macroeconomic management,
1994
1995
1996
1997
1998
1999
2000
2001
strong agricultural production, and the cessation of confl icts in several
World output (%)
3.7
3.6
4.0
4.2
2.8
3.6
4.7
2.5
countries. But Africa's average Gross Domestic Product (GDP) growth
of more than 4% in 2001 masks wide disparities among countries.
United States (%)
4.0
2.7
3.6
4.4
4.3
4.1
4.1
1.2
Moreover, economic growth remains fragile, and at current rates of
European Union (%)
2.8
2.4
1.7
2.6
3.0
2.7
3.4
1.7
progress Africa wil not achieve any of the Mil ennium Development
Goals set by the United Nations.
Africa (%)
2.3
3.0
5.6
3.1
3.4
2.6
3.0
3.7
(Source: IMF 2002)
Stil , there are many reasons for cautious optimism about Africa's
medium-term prospects - including the opportunities created by
36
GIWA REGIONAL ASSESSMENT 42 GUINEA CURRENT
REGIONAL DEFINITION
37
This "good" result cannot hide the deep trends:
In terms of GDP per capita growth, most countries have been
Africa (even more sub-Saharan Africa) remains the poorest
experiencing positive growth rates in recent years but negative rates
continent in the world. They are also among the most unequal
in the long-term (Table 15).
(Table 14);
The role of Africa in the global trade has decreased over the years;
Equatorial Guinea has the highest growing economy with a multiplication
The economic output is erratic and highly variable from one year
by 3.5 of the GDP per capita in five years (1997-2001). Equatorial Guinea is
to another, depending on the prices of agricultural and mineral
now the richest country of the region in terms of GDP per capita. This is
products and oil. For example, the economic growth of the GDP in
due to the country's oil industry and its smal population.
Equatorial Guinea was 71% in 1997 and 1.35% in 2001, i.e. a negative
growth in terms of GDP per capita);
Table 15 shows also that the countries with the most negative growth
The disparities between the countries are striking. The average
rates in the recent years are those experiencing civil conflicts.
growth of GDP per capita in Equatorial Guinea was 18.9% (over 10
Table 15 Average annual growth of GDP per capita in the
years, 1990-2000), whereas in the Republic of the Congo the GDP
countries of the region.
per capita has decreased by 8.2% per year during the same period.
Average growth (%)
Average growth (%)
Country
Country
Table 14 Ranking of the countries by GDP per capita (USD) and
1975-2000
1990-2000
1975-2000
1990-2000
inequality index (GINI Index*).
Algeria
-0.3
-0.1
Liberia
ND
ND
GDP/capita Inequality
GDP/capita Inequality
Country
Country
Benin
0.5
1.8
Mali
-0.5
1.3
(ranking)
index
(ranking)
index
Burkina Faso
1.4
2.4
Niger
-2.1
-1.0
Algeria
5 308 (03)
35.3
Liberia
ND
ND
Cameroon
-0.6
-0.8
Nigeria
-0.7
-0.4
Benin
990 (14)
ND
Mali
797 (20)
50.5
Chad
ND
-0.8
Săo Tomé & P.
-0.9
-0.8
DR Congo
-4.7
-8.2
Senegal
-0.2
0.9
Burkina Faso
976 (15)
55.1
Niger
746 (24)
50.5
Rep. Congo
ND
-3.4
Sierra Leone
-2.6
-6.5
Cameroon
1 703 (08)
47.7
Nigeria
896 (17)
50.6
Côte d'Ivoire
-2.1
0.4
Sudan
0.6
5.6
Ghana
0.1
1.8
Togo
-1.2
-0.4
Chad
871 (18)
ND
Săo Tomé & P.
ND
ND
Guinea
1.4
1.7
Uganda
2.5
3.8
DR Congo
765 (22)
ND
Senegal
1 510 (10)
41.3
Guinea-Bissau
0.4
-1.1
Zambia
-2.3
-2.1
Equatorial Guinea
10.4
18.9
Rep. Congo
825 (19)
ND
Sierra Leone
490 (28)
62.9
Note: ND = No Data. (Source: UNDP 2002)
Côte d'Ivoire
1 630 (09)
36.7
Sudan
1 797 (07)
ND
Ghana
1 964 (06)
40.7
Togo
1 442 (11)
ND
Population and human development
Guinea
1 982 (05)
40.3
Uganda
1 208 (12)
37.4
According to United Nations Development Programme (UNDP)
statistics (Annual report 2002), seven countries of the region are
Guinea-Bissau
755 (23)
56.2
Zambia
780 (21)
52.6
classified as countries with an average level of human development,
Equatorial Guinea
15 073 (01)
ND
while 18 countries are classified as having a low level of human
Note: ND = No Data. (Source: UNDP 2002)
development. Out of these 18 countries, 7 are deemed to belong to
* The GINI Index measures the extent to which the distribution of income among individuals and
households within an economy deviates from a perfectly equal distriubtion. A GINI Index of 0
the less developed countries in the world with a Human Development
repesents perfect equality, while an index 100 implies perfect inequality.
Index (HDI) below or equal to 0.4 (Annex IV).
The data being available by country, it is not possible to obtain the exact
amount of the total GDP of the region. A rough indicative estimate
The Guinea Current region has a population of 278 mil ion people
may be calculated by combining national GDP and percentage of the
of which 248 mil ion live in the 16 countries bordering the Guinea
country in the region, and without taking into account Algeria, which
Current LME. The Niger Basin is the most populous of the four basins
has a large but desert territory in the region (in both senses: few people,
assessed with 83 million inhabitants, fol owed by the Congo Basin (61
scarce water). By this calculation, the total income is approximately
mil ion), the Volta Basin (20 mil ion) and the Comoe Basin (2 mil ion)
87 bil ion USD (297 USD at Purchasing Power Parity (PPP)) and the
(Figure 22) (GIS analysis based on ORNL 2003). Countries making
population is 260 mil ion inhabitants. That corresponds to a rough
significant contributions to the population in the region include
average GDP per capita of 336 USD (1148 USD at PPP) (Annex II ).
Nigeria, DR Congo, Ghana, Côte d'Ivoire, Cameroon and Guinea. The
38
GIWA REGIONAL ASSESSMENT 42 GUINEA CURRENT
REGIONAL DEFINITION
39
2015. Even if this decline in population growth rate is achieved, the
population in the GCLME region or area is expected to reach about 406
million by 2015 and 440 million in 2020.
Population density ranges from about 10 persons per km2 to
160 persons per km2. Săo Tomé and Príncipe though having the lowest
population of 160 000, has a population density of 160 persons per km2.
Nigeria, the most populous country, ranks second in terms of density. Of
the 278 mil ion people living in the Guinea Current region, an estimated
40% live within 200 km of the coast (GIS analysis based on ORNL 2003).
This indicates an extreme population density in the coastal zone, which
will exert direct impacts on the marine ecosystem.
Added to the above is the fact that most cities along the coast are
experiencing high population growth rates as a result of rural-urban
migration. In Ghana for example, whereas national population growth
rate in 2000 was about 2.5%, Accra alone had a population growth rate
of about 4.4%.
Compared to 1991, it has been estimated that the population in the
Niger delta in Nigeria had increased by between 40 to 60% by 2002
(Ajao 2001). The most densely populated and industrialised cities in the
Niger delta are Port Harcourt and Warri.
An estimated 20 mil ion people live in the coastal region of Nigeria
constituting about 23% of national population. Nearly 80% of the
population of Guinea-Bissau lives in the coastal capital.
Some of the large cities experiencing high population growth rates
and density include Accra (Ghana), Abidjan (Côte d'Ivoire), Douala
(Cameroon) and Port Harcourt and Lagos (Nigeria).
A World Bank estimate from 1995 quoted in ACOPS/UNEP (1998),
indicates that by 2025 urban coastal population will increase from 200
people per km2 to 500 people per km2.
Population structure
Figure 22 Population in Niger, Congo, Volta and Comoe basins
and in Guinea Current LME.
In al countries of the region an average of 45% of the population is
(Source: GIS analysis based on ORNL 2003)
under 15 years, indicating a high rate of dependence on the working age
population is growing at an average rate of 2.9% based on estimates
population. People over the age of 65 are rare. These two characteristics
from 11 countries. Ghana has the lowest growth rate of 2.7% whilst Côte
are typical for a population in strong growth and under critical health
d'Ivoire has the highest at 3.8%.
conditions. The ratio between men and women is relatively balanced,
but sex specific human development index shows, in most of the
It is however expected that growth rates wil decline as a result of
countries, strong imbalances between the status of men and women.
implementation of various population policy measures in the region.
This is especial y visible within the areas of education and labour.
An average population growth rate of 2.2% is therefore expected by
38
GIWA REGIONAL ASSESSMENT 42 GUINEA CURRENT
REGIONAL DEFINITION
39
Health and life expectancy
Civil unrest
Sanitation in the coastal zone of the region is very poor and thus
It would be difficult to understand the environment and development
brings with it health problems. Mosquito infestation and malaria is very
problems of the region without making reference to the political y
common. Malaria is the most reported disease in the health institutions
unstable situation.
of the region. Rapid population growth and lack of pace to keep up
with infrastructure development such as provision of potable water
Because of political instability in many countries of the region, it has
and sanitation facilities has led to many outbreaks of communicable
been difficult to create the institutional setting necessary for sound
and infectious diseases. Epidemics of cholera, typhoid and hepatitis
environmental management. Moreover, the region has witnessed
are common. Convery & Tutu were quoted in a World Bank report of
military conflicts, most of them originating in competition for access
1996, stating that 13 of the 36 major diseases reported in Ghana were
to the natural resources of soil and subsoil and involving neighbouring
environmental y related.
countries. However, with assistance from the international community
(which can take the form of armed interposition forces) many of the
Coupled with other factors such as HIV/AIDS and poverty, the life
states of the region are engaged in a number of regional initiatives
expectancy in the region is general y low. Life expectancy ranges from
to help the countries affected by civil unrest to achieve national
37.5 years in Sierra Leone to 58 years in Ghana. Sierra Leone incidental y
reconciliation.
has the lowest life expectancy in the world (The Economist 1998). A
similar trend exists for death rate per 1 000 population; Sierra Leone has
Up to now, the access to water resources has not been the cause of
the highest at 25.7 and Ghana has the lowest at 10.4. This apparently
conflicts. But there have been, and stil exist, various border disputes
could be due to the civil war in Sierra Leone during the period under
based on sovereignty issues regarding rivers or estuaries or the islands
review. Unless the region sees a marked improvement in the economy
that they may contain.
of the member countries, this trend may prevail for some time.
Sectors of activity
Social problems
The economies of the coastal countries are dominated by agriculture,
The rapid population growth in the coastal zone has resulted
the oil and gas industry, fisheries, manufacturing industries, mining, salt
in degradation of social values and culture, socio-economic
production and services (including tourism). The economy of the region
dislocation and conflicts in addition to the serious degradation of the
is mainly agrarian, as agriculture contributes over 50% of GDP in some
environment.
countries. Some of the crops grown include cocoa, for which the bulk
of the world's production is from West Africa particularly Côte d'Ivoire,
As in the rest of the world, many of the poor regions are densely
Ghana and Nigeria, coffee, roots and tubers, pulses, maize, rice, cotton,
populated coastal areas where the environment offers the right
pineapples and bananas.
conditions for several subsistence activities; essential y fishing, farming,
sand extraction on the beaches, salt mining in the salt marshes, and
Most of the economies are embarking on one economic reform
production of charcoal in the mangrove areas. In addition, over 60% of
or the other, which intends to increase industry's share of GDP. It is
the existing industry in the region within the GCLME is also concentrated
expected that the region will see an upsurge of industries, particularly
in the coastal cities. These industrial areas are situated in zones that are
agro-industries. Agro-processing, export and provision of service
predominantly created in major river catchments that drain into coastal
infrastructure wil eventual y increase the share of GDP for services.
wetlands especial y mangroves, lagoons and estuaries.
Tourism as a service industry is also being promoted.
In the metropolitan and urban areas, social problems include
Agriculture and irrigation
inadequate housing facilities, the poor state of educational and health
Most of the crops in the region are rain-fed. The irrigation potential is
facilities, poor public hygiene, and a high crime rate resulting from high
stil to be exploited (FAO 2003b). Accurate data are not available on
level of unemployment and poverty, especial y among the younger
agriculture in the Comoe Basin. However, it is known that the upper
generation. In the rural setting, inadequate educational facilities, poor
reaches (including Burkina Faso part) and middle reaches are mainly
health and public utilities, and poor quality of housing constitute major
covered with pastureland, agricultural land or forest. The lower reaches
problems.
are mainly covered with agricultural land and forest. A list of crops and
trees per area is displayed in Table 16.
40
GIWA REGIONAL ASSESSMENT 42 GUINEA CURRENT
REGIONAL DEFINITION
41
Table 16 List of crops and trees per area in the Comoe Basin.
Table 17 Congo Basin: Irrigation potential, water requirements
Area
% of total
Type of trees
and areas under irrigation.
Sector
Type of crops
(km2)
area
exploited
Irrigation
Gross potential irrigation water
Area under
Upper reach
Mil et, maize, yams, rice, cotton, sugarcane,
Country
potential
requirements
irrigation
34 980
47
Teak
(Sudanese)
citrus fruits, mangos, cashew nuts
(ha)
(ha)
per ha (m3/year)
total (km3/year)
Middle reach
Maize, yams, rice, cotton, sugarcane, citrus
Zambia
101 000
19 500
1.97
5 000
(pre-forested
13 226
18
ND
fruits, avocados, cashew nuts
savannah)
Tanzania
0
13 000
0
0
Mean forested
22 303
30
Maize, yams, rice, cassava, coffee, cocoa
Sipo, teak
area
Rwanda
9 000
13 000
0.18
2 000
Niangon,
Central African Rep.
1 400 000
18 000
25.20
0
Maize, yams, rice, cassava, palm oil, rubber, framire, frake,
Low forested
3 426
5
pineapples
okoume,
Cameroon
50 000
14 000
0.70
1 650
mahogany
Rep. Congo
255 000
13 000
3.32
217
Total
73 935
100
Note: ND = No Data. (Source: Comoe Basin GIWA Report 2003)
Angola
900 000
20 000
18.00
2 000
DR Congo
6 980 000
15 500
108.19
10 500
In the Volta Basin agriculture constitutes the major form of land use
Sum of countries
9 800 000
NA
158.93
35 767
Note: NA = Not Applicable. (Source: FAO 2003b)
accounting for not less than 40% of the entire economic output. In
Ghana the Basin accounts for 78% of the total national output of yams,
humid basin like Congo, where water is abundant are rather arbitrary
69% of rice, 40% of maize and 31% of cassava. In Mali, the Koro and
(Table 17) (FAO 2003b).
Bankass districts in the Basin are considered to be the granary of the
Mopti region with 85% of the population engaged in agriculture. As the
Livestock breeding
Volta Basin fal s almost entirely in the savannah agro-ecological zone, it
Livestock breeding is a very important activity in most of the countries
is noted for livestock production. The northern and coastal savannahs in
in the region and especial y in the Western Sahelian section. Mali,
Ghana account for over 90% of cattle and 70% of goats. Projections for
Burkina Faso and Niger are exporters of cattle to the coastal countries.
Togo indicate that by 2020 sheep/goats, pigs and poultry will increase
The rainforest zone is not suitable for cattle due to the prevalence of
by 52%, 189%, and 440% respectively over the 2001 figures. In Burkina
trypanosomias. Despite the importance of the livestock industry, there
Faso, cattle accounts for 10% of GDP and 19% of export earnings.
is a lack of data on this matter. Table 18 and Table 19 give some statistics
about the livestock in Comoe River Basin.
The forest and woodland vegetation is an important source of domestic
Table 18 Livestock in the Burkina Faso part of Comoe River Basin.
energy in the form of raw wood and charcoal. It also provides poles
Comoe
Leraba
Kodoun
Baoue
Iroungou
Total
for fencing and constructing traditional houses. In Togo the forest
Non-migrant
43 160
15 900
7 150
2 100
2 850
71 160
vegetation in the Volta Basin provides over half the county's sawn
timber and is threatened by overexploitation. Unlike the drier basins,
Nomad
172 260
63 610
28 590
8 410
11 390
284 620
where the irrigation potential figures should be considered as a
Total
215 420
79 510
35 740
10 510
14 240
355 780
maximum from the point of view of water resources, the figures for a
(Source: MEE/DGH 2001)
Table 19 Livestock in Comoe Basin in administrative regions of Côte d'Ivoire.
Number of livestock
Holdings (heads/household)
Grazing density
Region
Department
Area (km˛)
Cattle
Sheep and
Pigs
Poultry
Sheep and
Necessary area
Ratio to
Cattle
Pigs
Poultry
(heads)
goats (heads)
(heads)
(1 000 heads)
goats
(km˛)
total area
Abengourou
5 143
13 180
74 570
4 070
1 390
0.29
1.63
0.09
31
315
6.1
Middle Comoe Agnibilekrou
1 853
2 640
48 130
0
530
0.15
2.82
0
30
128
6.9
Bocanda
2 262
7 210
81 530
4 760
510
0.67
7.53
0.44
47
259
7.9
Nzi Comoe
Bongouanou
5 593
4 910
63 760
3 750
1 120
0.26
3.36
0.20
59
194
3.5
Daoukro
3 958
3 880
104 530
0
340
0.60
16.05
0
53
256
6.5
Bondoukou
9 844
20 600
234 640
10 690
1 560
0.34
3.89
0.18
26
738
7.5
Zanzan
Tanda
6 390
11 070
238 540
7 570
1 200
0.32
6.97
0.22
35
625
9.1
Abidjan
2 702
7 230
24 690
110 460
530
0.37
1.25
5.58
27
357
13.2
Lagunes
Alepe
2 176
8 710
29 710
132 910
630
0.31
1.07
4.79
22
430
19.1
Total
39 921
79 430
900 090
274 210
7 810
3.31
44.57
11.50
330
3 302
(Source: Comoe Basin GIWA Report 2003)
40
GIWA REGIONAL ASSESSMENT 42 GUINEA CURRENT
REGIONAL DEFINITION
41
Fisheries and aquaculture
fishery, with the triggerfish (Balistes carolinensis) increasing dramatical y
Fishing is an important activity in Comoe Basin, both in Burkina Faso and
in the 1970s fol owed by a severe decrease and the 1973 col apse of the
Côte d'Ivoire. About 260 fishermen have been inventoried in the Burkina
sardinel a fishery. The latter subsequently recovered to unprecedented
Faso part of the Basin. Traditional fishing, producing 260 tonnes of fish
levels during the 1980s (see Binet et al. 1991). The changes in fishery
per year, is practised in the dams (Bodadiougou, Moussodougou) and
patterns appear to be related to a potential y new geographical
natural lakes (Tingrela, Lemouroudougou and Kapogo).
distribution of pelagic stocks. Shifts in fish populations may be caused
by environmental factors. The respective east and west flows and
In Côte d'Ivoire, lagoon fishing and natural freshwater fishing is
position of the Guinea Current may play a role in population shifts.
conducted mostly by smal -scale fishermen with smal boats and
Acoustic surveys made between 1980 and 1990 indicated a sudden
nets. Inland fishing is composed of natural freshwater fishing and
increase in fish density on the Ivorian shelf. The shift in biomass appears
aquaculture. Aquaculture was introduced in inland waters a decade
to be related to a shift in the boundary of the Guinea Current. These
ago and expanded rapidly. Lagoon aquaculture was started at an earlier
alterations are probably linked to distant climate anomalies, such as the
stage in an enclosure of a lagoon or in a floating stage. Machoiron
southward displacement of the Inter-Tropical Convergence Zone (ITCZ)
(Silure) and tilapia are major species for aquaculture both for inland and
during Atlantic El Nińos. A greater understanding of oceanographic
lagoon areas. Actual data on fisheries in the Comoe Basin is scarce. Total
processes is needed to improve ecological forecasts.
fish catch is estimated at about 80 000 tonnes per year as an average
from 1990 to 1995. Table 20 presents aquaculture production in the
Traditional fishing gradual y gave way to trawling and tuna fishing with
Ivorian part of the Basin. Data has not been collected on aquaculture
the introduction of purse seines. In Côte d'Ivoire, the number of trawlers
for the Volta, Niger and Congo basins.
rapidly increased after the opening of the Vridi Canal in 1951: from 12 in
1954 to 40 in 1959 (Comoe Basin GIWA Report). Substantial investments
Table 20 Aquaculture production in the Comoe Basin.
were further made with the construction of ice factories, canneries, cold
Area
Production
Productivity
Project location
Fish
(ha)
(tonnes/year)
(tonnes/ha)
storage and fishmeal industries. In the lagoon the most popular fishing
Adzope
45
Tilapia
120
2.7
gear and methods found are cast nets, seine (drag) nets, various traps,
Alépé +Anyama
11
Tilapia+Silure
40
3.6
acadja (bush park fishing), hand fishing, hook and line, and trawl nets
(Koranteng et al. 1998).
Total
56
160
3.1
(Source:Comoe Basin GIWA Report 2003)
Mines and quarries
Fishing in coastal lagoons, estuaries and creeks is an important
General y the mining industry uses large quantities of water for mineral
economic activity in the Guinea Current Large Marine Ecosystem (GEF/
extraction, concentration and transport. Mining of metal sulphides brings
UNIDO-GCLME project 2003). The fishery is mainly artisanal, however
sulphides into the presence of air, where they are oxidised and react
some amount of industrial fishing occurs in the region.
with water to form sulphuric acid. This acid rock drainage impacts both
groundwater and surface water. Tailings, dams and waste rock heaps are
Throughout West Africa, utilisation and management of fishery resources
also sources of acidic drainage water, affecting surface and groundwater.
in coastal lagoons and estuaries are linked to taboos and other cultural
Large amounts of environmental y hazardous chemicals such as cyanide
practices (Koranteng et al. 1998, Entsua-Mensah et al. 1999).
are used in various phases of mineral extraction (leaching of lateritic gold
for example), and most mining activities therefore pose a threat to the
The Central African coast with its river mouths, lagoons, and mangrove
host environment and surrounding hydrosphere.
swamps, offers some highly productive habitats that serve as important
fishing spots for mainly shrimps (Penaeus notialis) and smal pelagic
Some countries in the region have abundant commercial mineral
coastal species such as "Sardinel es", shads and demersals (e.g. basses
deposits and have a huge unexploited natural potential for mining
and ray-finned fishes).
development, but at the same time have relatively few mining
activities. This is mainly due to the prevailing political instability in
The Guinea Current LME is rich with living marine resources and
these countries leading to a lack of foreign investments in the mining
commercial y valuable fish, both marine and coastal. Fish species
industry. This is particularly true for areas in the Congo Basin where
include croaker, grunts, snapper, sardinella, triggerfish and tuna. During
present environmental chal enges are mainly due to pol ution from
the last two decades there have been substantial fluctuations in the
previously active mining sites.
42
GIWA REGIONAL ASSESSMENT 42 GUINEA CURRENT
REGIONAL DEFINITION
43
Although large-scale industrial mining might be limited to the more
Industry
stable countries of the region, artisanal mining is found almost
It is estimated that 60% of al industries in the Gulf of Guinea region
everywhere. Artisanal mining might in some areas be the main cash
are located in the coastal zone. As industrial growth is promoted, this
generating activity for the rural population, but general y contributes
percentage may increase or the absolute number of industries within
very little to the national economy, and has the potential to cause
the zone wil increase. If not regulated properly, this wil exert some
considerable environmental damage, particularly when involving
cost on the economies resulting from the adverse effects of effluent
uncontrol ed use of mercury for gold fixation.
discharges. The major industries include agro-industries, textiles, leather,
food and beverage processing, oil and gas and mineral exploration. Salt
The Volta Basin is rich in mineral resources such as phosphates, uranium,
production is quite significant in the region, particularly in Côte d'Ivoire,
gold and iron which are yet to be ful y exploited. The iron in Togo is
Ghana, Togo and Benin. In Ghana about 24 salt producing companies
exploited artisanal y. Smal -scale gold prospecting has developed
operate along the coast. Apart from its domestic use, salt is important
recently in the upper east region of Ghana just like the Kaya, Bittou and
for the oil industry. Trade in salt between the coastal countries and the
Yako areas of Burkina Faso. There are plans to step up salt production
land-locked countries is significant. In 1996 and 1997 Ghana for example
in the Lower Volta Basin in Ghana (the Songhor and Keta lagoons) and
exported about 80 000 tonnes of salt to other parts of West Africa and
supplies to the huge market in the West African region, typical y, the
beyond. Efforts are being made to expand the salt industry in Ghana
petrochemical industry in Nigeria.
in order to supply the estimated 1 mil ion tonnes of salt presently
imported by Nigeria from South America.
Mining contributes only 10% to GDP of the countries sharing the Niger
Basin. There are no data concerning this activity.
The industrial activities along the Comoe Basin are located in the coastal
area of the city of Abidjan (Côte d'Ivoire) and in Banfora (Burkina Faso).
The mining resources are especial y abundant in the Congo Basin and
The opening of the Vridi canal in 1950 fol owed by the construction of
in its periphery, for example: copper, zinc, cobalt, lead, and gemstones
the port of Abidjan gave the real boost to the economy of Côte d'Ivoire.
in Zambia; uranium and manganese in Gabon; gold, diamonds, and
Today, Abidjan is the largest tuna and container port of West Africa.
uranium in the Central African Republic; diamonds in Angola; and
The construction of the port of Abidjan also led to the development of
particularly copper, cobalt, diamonds, and manganese in DR Congo.
industries with more than 60% of the industries of the country located
Certain mining areas provide the largest reserves in the world such as
in the coastal zone or near Abidjan (oil refinery and offshore oil and
the "Zambian Copper belt" which extends between Zambia and DR
gas exploration and exploitation). The port of Abidjan handles 96% of
Congo (previously sixth world producer), the Katanga for copper and
the country's imports 66% of its exports, and 90% of the sea traffic of
cobalt (leading world producer), and the Kasaď for diamonds. Many
the country. Abidjan also handles 75% and 40% respectively of the sea
other minerals of high commercial and/or strategic value are likewise
traffic of the neighbouring landlocked countries of Burkina Faso and
present in these regions, especial y zinc, gold, tin, silver, uranium,
Mali. The rest of port activities are carried out by the port of San Pedro
cadmium, tungsten and "coltan" (colombo-tantalite).
constructed in 1971.
The other countries in the Congo Basin are less endowed with mineral
Two major industries are located in Burkina Faso, the SN-SOSUCO
resources. This is the case of Rwanda, Burundi, and Tanzania, where it
with an annual production of 30 000 tonnes of sugar and the "Grands
is more agriculture than extractive industries that contributes to the
Moulins" (Great Mil s) producing wheat and maize powder.
GDP.
Manufacturing activities are largely smal -scale in character in the Volta
There are no mining activities in the Comoe Basin. However, near
Basin. They can be categorised as agro-processing which includes shea
Abidjan, along Agnéby River, quarrying of building materials takes place
butter and seed-oil extraction, grain mil ing, pito brewing and liquor
for hard rocks like granite, e.g. the SISAG plant for aggregates and the
distilling, fish smoking, bread and biscuits baking, tobacco curing and
Azaguié plant for boulders used in harbour facilities. Quarrying is still
cassava processing. Other categories are textile and leather work, mat
mostly artisanal for sand and clays. The laws in all the coastal countries
and basket weaving, metal and repair work, and woodwork.
forbade the withdrawal of beach sand because it contributes to coastal
erosion. It however remains as the main source of sand for the local
Large-scale manufacturing activities include the two textile factories
building blocks market.
located near the dams in Ghana. In Burkina Faso there are equal y
42
GIWA REGIONAL ASSESSMENT 42 GUINEA CURRENT
REGIONAL DEFINITION
43
large-scale breweries, soap and chemical factories, slaughterhouses
Energy
and textile and leather tanning factories making use of large quantities
There are two smal dams producing electricity in the upper part of
of water and discharging waste into waterways.
the Comoe Basin in Burkina Faso (Niofila and Tourny near Banfora). The
downstream part in Côte d'Ivoire is not equipped with hydropower
In the eastern part of the region, the development has been particularly
plants despite the fact that several sites investigated have been
marked after independence in 1960 around the maritime and fluviatile
considered to be suitable for micro-hydropower plants (CIE and LBTP,
harbour cities (e.g. Douala, Pointe-Noire, Matadi, Luanda and Librevil e).
pers. comm.).
The industrial activity is dominated by three sectors: the industry of
mines and petroleum, the artisanal industry (e.g. wood, agricultural
The production of hydroelectric power in the Volta Basin is important
products and fisheries industry) and the industry of import substitution
for the industrial development of riparian countries. In Ghana,
(e.g. food and construction).
the Akosombo and Kpong schemes with an instal ed capacity of
1 072 MW have a distribution network that links Cote d'Ivoire and Togo
In the western part of the region, industrial activities are concentrated
(Figure 23). The Bagré and Kompienga dams in Burkina Faso also have
in the large urban areas located near the mouths of great rivers, for
an instal ed capacity of 14.4 MW and 12.3 MW respectively. Some other
example Abidjan near the Comoe River outlets and Accra near the Volta
hydroschemes are planned in the Basin including Bui on the Black Volta
River mouth. Many other industrial concentrations are also found near
in Ghana.
the estuaries or deltas of less important rivers, for example Cotonou
near the Oueme River outlet. Finally some urban zones have developed
The major dams in the Niger Basin (including hydropower dams) are
without fluvial facilities.
listed in Table 21.
No data have been col ected for the Niger Basin.
The Congo Basin provides 99.9% of electricity consumed in the
DR Congo. In this country there are 13 hydropower dams with a total
Figure 23 Akosombo Dam in Ghana.
(Photo: Topham Picturepoint)
44
GIWA REGIONAL ASSESSMENT 42 GUINEA CURRENT
REGIONAL DEFINITION
45
Table 21 Major dams in the Niger Basin and associated
been subject to a thorough inventory, and is estimated to be around
reservoirs.
123 600 MW. The potential of the River alone is in the order of 84 000
Reservoir
Average
MW. The bulk of the potential is concentrated around Matadi Kinshasa
Year
Power
Irrigated
Country Site
River
capacity
Production
opened
(MW)
area (ha)
sluice channel. The exploitable potential of this zone is estimated
(mil ion mł)
(GWh/year)
around 56 000 MW or 45% of the River.
Guinea
Dabola
Tinkisso
1974
466
1.5
ND
ND
1929/
Mali
Sotuba
Niger
ND
6.8
40
3 000
1966
Facilities
Mali
Markala
Niger
1947
ND
ND
ND
70 000
There are about 22 major ports in the region. These ports also serve
Mali
Sélingué
Sankarani
1982
2 000
47.6
170
1 500
the land-locked countries in West and Central Africa. Other structures
Nigeria
Goronyo
Sokoto
ND
942
ND
ND
ND
include offshore oil exploration facilities and barges equipped with
Nigeria
Bakalori
Sokoto
1978
450
ND
ND
ND
large generators.
Nigeria
Jibya
Sokoto
ND
142
ND
ND
ND
Nigeria
Zobe
Sokoto
ND
177
ND
ND
ND
Tourism
Nigeria
Kantagora 2 Kantagora
ND
340
ND
ND
ND
Even if it is not a key activity sector, tourism is a significant activity in
Multiple
some parts of the region. Main tourism focus is nature or ecotourism.
Nigeria
Kainji
Niger
1966
12 000
760
2 000
uses
The coastal zone offers sandy beaches with many hotels and resorts.
Nigeria
Jebba
Niger
1984
3 880
540
1 650
ND
Important coastal country destinations for tourism include Guinea-
Nigeria
Shiroro
Kaduna
1990
7 000
600
2 000
ND
Bissau, Guinea, Côte d'Ivoire, Ghana and Benin. Some tourism activities
Nigeria
Owi
Kampe
ND
250
ND
ND
ND
being targeted include sport fishing, boat cruises, historic tourism,
Nigeria
Kiri
Gondola
1985
615
ND
ND
Agriculture
wildlife tourism and bird watching (Box 2).
Dadin
Multiple
Nigeria
Gondola
1988
2 855
ND
ND
Kowa
uses
Potential
The bulk of tourist activities are centred in the southern part of the
Cameroon Lagdo
Benoué
1985
4 000
ND
320
37 000 ha
Comoe Basin, mainly around the city of Abidjan. In the northern sector,
Note: The hydropower dams are indicated in red letters. ND = No Data.
(Source: FAO 2002b, NBA-HydroNiger)
Box 2
Tourism and nature conservation: a win-win association.
Considered from the view of nature protection, the tourism activity is double-sided.
power output of 2 523 MW. Oil production is an important activity in
In fact, tourism takes place in attractive and well conserved areas. But the presence
of tourists in these areas can also be the cause of their deterioration. The resulting
several parts of the coast of the Guinea Current LME. Nigeria is the largest
loss of interest or amenity value can lead to destruction of a resource which could
producer in the region and ranks 13th in the world. Most of Nigeria's oil
have generated the funds to use for its conservation. Thus, one can say that tourist
activities and nature conservation are closely linked and need each other (Ceballos-
is produced in the Niger delta and covers over 90 oil fields spread over
Lascurain 1996).
However, presently contrary to the situation in East and Southern Africa the
30 000 km2 of the delta (GEF/UNEP 2001). Nigeria produces over 1.8
tourism sector in West and Central Africa only contributes very slightly to the
mil ion barrels of oil per day (The Economist 1998). Oil spil in Nigeria is
national and international effort on conservation of nature:
1. The tourism activities do not generate any duties or fees directly allocated to the
estimated at 7 500 barrels per year. Other important oil producers are
maintenance of the areas of tourist interest;
2. The tourism activities only generate insignificant revenues for the local
Cameroon and Gabon. Cameroon produces 6.25 mil ion tonnes of crude
populations of the areas of tourist or ecological interest, even though the
oil annual y from the Rio Del Rey Basin also in the Niger delta.
pressure of those populations looking for resources is precisely the main cause of
nature degradation in Africa (e.g. deforestation for crops, poaching, gathering).
Tourism in the countries of the region has for a long time been a stagnating sector.
The frequency of tourists in the countries of the region is low in spite of the wide
There are huge natural gas reserves in the region. This has necessitated
array of attractions the four first being the classic ones and the three others being
the initiation of the construction of a gas pipeline from Nigeria to Ghana,
more specific:
· Beach tourism, possible along more than 5 000 km of coast;
which will also serve Benin and Togo. Tremendous economic gains are
· Cultural tourism: discovery of the history, the traditions and the rich African
expected; however there will be some environmental costs as wel .
folklore, especially the traditional villages, the dances, and the masks;
· Ecotourism focused on discovery of nature, presently limited to national parks
and mountain areas, but with potential extension to other zones of interest;
With regard to oil refineries, it must be stated that about 30% of all
· Hunting tourism in countries where this activity is permitted;
· "Family tourism" of African workers expatriated in developed countries and
refineries in the region are located in the coastal zone. The economic
people coming from developed countries visiting family members living in Africa;
implications include possible oil spill and clean-up costs.
· "Business tourism" of meetings (congresses, conferences, workshops) limited to
large cities: e.g. Accra, Ouagadougou and Abidjan before the civil conflict;
The hydroelectric potential of the Congo Basin is very important and its
· "Religious tourism" regional meetings of local religions and also the particular
exploitation began several decades ago, mainly to satisfy the need from
case of the visit of Basilica "Notre-Dame de la Paix" in Yamoussoukro.
the mining industry. The hydroelectric potential of the River Basin has
(Source: adapted from Cougny 1997)
44
GIWA REGIONAL ASSESSMENT 42 GUINEA CURRENT
REGIONAL DEFINITION
45
the Comoe National Park seems to be the only tourist site. Besides this,
Table 22 Basic indicators and land use in the major basins of the
the Basin includes many cultural sites serving as objects of worship or
region.
being considered to be abode of gods. These cultural sites (such as the
Land cover and use variables
Comoe
Volta
Niger
Congo
Tengrela Lake and the protected forest of Diéfoula and Logoniégué) also
Basin area (km2)
77 9001
407 093
2 261 741
3 730 881
Average population density (people per km2)
222
43
31
15
attract many local and some foreign tourists. Unfortunately, the situation
Number of large cities (> 100 000 people)
1
3
12
18
of civil unrest in Côte d'Ivoire has stopped the tourism activities.
Water supply per person (m3/year, 1995)
ND
2 054
4 076
22 752
Forest cover (%)
39.03
0.7
0.9
44.0
There are many potential natural and cultural tourist attractions in
Grassland, savannah and scrubland (%)
51,3
85.6
68.6
45.4
the Volta Basin. Already the Pendjari National Park of Benin receives
Wetlands (%)
0.34
4.6
4.1
9.0
between 2 000 and 2 500 visitors annual y. The Comoé National Park in
Cropland (%)
8.83
10.4
4.4
7.2
Côte d'Ivoire is the largest in West Africa.
Irrigated cropland (%)
1,15
0.1
0.1
0.0
Dryland area (%)
94.96
91.7
71.1
0.2
Along the Ghana coast, the historical forts and castles and the slave
Urban and industrial area (%)
0.017
0.5
0.5
0.2
trade landmarks offer great tourist potential. This country has 40 of
Loss of original forest cover (%)
ND
96.6
95.9
45.8
(Footnotes: 1EROS Data Center 2003, 2OARL 2002,3Loveland et al. 2000, 4UNEP-WCMC 2000b,
these forts and castles of which 24 are active and three, namely Cape
5Siebert et al. 2001, 6UNEP 1997, 7NOAA 1998) Note: ND = No Data.
Coast castle, St George's and St. Jago fort, have been designated
(Source: IUCN-IWMI-Ramsar-WRI 2003, Comoe Basin GIWA Report)
UNESCO World Heritage Sites (as for Ouidah in Benin). The Ghana
Tourism Development Master Plan has earmarked the whole 539 km
increasing faster than economic growth. It is estimated that 1% of
coastline as a tourism zone. The Government of Ghana has a projection
the demographic growth corresponds to a 2% increase in the demand
to derive an income of about 274 mil ion USD from employment of
for water (Table 22) (Cougny 1998a).
307 000 by 2010 from tourism. It further expects that net foreign
exchange earnings wil be 1 250 mil ion USD and total tourism receipts
Meeting the demand for drinking water has a first priority in al the
of 1 562 mil ion USD.
countries of the region. The ratio of people having access to safe
drinking water (at national, rural and urban level) in the countries of
The tourism in the Congo Basin is general y little developed, and
the region is indicated in Annex V. The same annex shows the potential
income is mostly generated by primary sector activities (agriculture
of irrigable land, the land actual y irrigated and the consumption of
and mining). Land use, stress on natural resources, and human conflicts
water by irrigated agriculture, which is the largest water consumer in
often act as limiting factors for the development of the large tourism
the region.
potential in the Basin.
The water demand from the industrial sector is not well documented.
No data have been col ected about tourism activities in the Niger Basin.
The consumption of the industries located in the urban areas is normal y
not distinguished from domestic consumption. Nor is it certain that
Land use and stress on natural resources
the consumption is registered when the industries have their own
Water needs and demand
extraction facilities in rivers or their own wel s or boreholes.
As for water and its uses, certain statistics are not complete or have
not been updated in the region. However, the statistics from FAO (FAO
The importance of industry in the Gross National Product (GNP) gives
2003b) and the main conclusions drawn in 1998 during the West African
an indirect idea of the countries where the industrial sector plays an
Conference on Integrated Water Resources Management have been
important role (as user or polluter).
used in this study.
The proportion of hydropower electricity varies considerably from one
In the majority of the countries, for example 13 out of 15 countries
country to another (Table 23). Ten countries of the region have more
included in the Economic Community of West African States
than 75% of their electricity generated by hydropower dams. Most of
(ECOWAS), the agricultural sector constitutes the largest water
the countries emphasise that their hydropower potential is far from ful y
consumer. A distribution in the order of 70 to 80% to agriculture,
developed. As a whole, Africa exploits less than 7% of its economical y
10 to 20% to domestic drinking water and 10% to the industry
feasible potential (Hydropower & Dams 1997).
can be maintained. In all the countries the demand for water is
46
GIWA REGIONAL ASSESSMENT 42 GUINEA CURRENT
REGIONAL DEFINITION
47
Table 23 Large dams and hydropower production.
Table 24 Dams on the Comoe River in Côte d'Ivoire and in
Burkina Faso.
Country
% HE
MW
N
Country
% HE
MW
N
Côte d'Ivoire
Burkina Faso
Angola
75
554
11
Guinea (Equat.)
11
1
ND
Number
Purpose
Dams
Lakes
Total
of dams
Sub-
Benin
ND
ND
1
Liberia
43
81
1
basin
Volume
Volume
Volume
Agriculture
2
Number
Number
Burkina Faso
39
32
2
Mali
70
50
2
(m3)
(m3)
(m3)
Drinking
Cameroon
98.5
723
9
Niger
ND
ND
ND
4
Comoe
10
56 000 000
15
6 300 000
62 300 000
water
Centr. Afr. Rep.
81
22
ND
Nigeria
41
2 341
63
Aquaculture
7
Leraba
17
52 000 000
5
300 000
52 300 000
Rep. Congo
99.5
89
1
Săo Tomé & P.
53
2
ND
Electricity
1
Kodoun
0
0
0
0
0
Côte d'Ivoire
68
895
22
Sierra Leone
1
4
1
Pastoral
80
Baoué
0
0
0
0
0
Other
Ghana
99
1 072
5
Togo
12
89
1
6
Iringou
0
0
0
0
0
activities
Guinea
32
52
5
Zambia
99.8
1 648
3
Total
100
Total
27
108 000 000
20
6 600 000
114 600 000
Key: % HE = Hydropower production compared to national production.
(Source: Côte d´Ivoire: BNETD pers. comm. Burkina Faso: MEE/DGH 2001)
MW = Number of MegaWatt installed hydrocapacity in operation.
N = Total number of dams (more than 15 m high, i.e. large dams according to ICOLD's definition)
in operation per country. Some are not hydropower dams (for example, Côte d'Ivoire has only 6
Deforestation
hydropower dams, the rest are for other purposes).
The forests of Africa cover 520 million ha and constitute more than 17%
Note: ND = No Data. (Source: Hydropower & Dams 1997)
of the world's forests. They are largely concentrated in the tropical zones
According to the same sources two very high dams (more than 60 m
of Western and Central, Eastern and Southern Africa. With more than
high) are under construction:
109 million ha of forests, DR Congo alone has more than 20% of Africa's
Bumbuna Falls in Sierra Leone. The Government of Sierra Leone
forest cover, while Northern Africa has little more than 9%, principal y
plans to restart the 50 MW Bumbuna run-of-river project work
along the coast of the western Mediterranean countries, according to
which had ceased in July 1997 because of hostilities in the country.
FAO. This stil , however, makes Africa one of the continents with the
The remaining work could go ahead by December 2003.
lowest forest cover rate.
Zungeru in Kaduna State, Nigeria. An additional 950 MW of
hydroelectric instal ed capacity at the Zungeru station was
African forests include dry tropical forests in the Sahel, Eastern and
scheduled to come on-line before the year 2000.
Southern Africa, humid tropical forests in Western and Central Africa,
afro-montane forests, diverse sub-tropical forest and woodland
Most of the dams are not high (less than 15 m high) and the reservoirs
formations in Northern Africa and the southern tip of the continent, as
are flat. As an example, Comoe River has been dammed at least in
well as mangroves in the coastal zones.
127 locations; 100 in Côte d'Ivoire and 27 in Burkina Faso (Table 24).
Construction of these dams has resulted in evaporation and in loss of
Except for the Congo Basin, Africa's frontier forests have largely been
sediment downstream, due to the effective entrapment of particles in
destroyed, primarily by loggers and by farmers clearing land for
the reservoirs.
agriculture. In West Africa, nearly 90 % of the original moist forest is
gone, and what remains is heavily fragmented and degraded. Today,
Mines and quarries are important water consumers. But it is true that
West African unspoiled forests are restricted to one patch in Côte
this sector presents more problems of discharges than of withdrawals,
d'Ivoire and another along the border between Nigeria and Cameroon
the later being more or less always redirected back to the rivers. The
(Box 3).
main issue of mining activities is chemical pollution whereas quarrying
is a source of inert sediment discharges in the rivers, resulting in high
Large blocks of intact natural forest do remain in Central Africa,
turbidity.
particularly in DR Congo, Gabon, and Republic of the Congo. In
DR Congo, which contains more than half of Central Africa's forest
The other water consuming sectors are also insufficiently documented.
cover many forests remain intact, in part because the nation's poor
In general, the national administrations in charge of water sectors do
transportation system cannot easily handle timber and mineral
not produce any data regarding water as a means of transport, nor as
exploitation. Some areas have fewer passable roads today than in 1960,
a tourist resource. Likewise, there is no mention of recreation activities,
the year the country became independent, and some frontier forests
or water sports.
have experienced a decrease in population during this period.
46
GIWA REGIONAL ASSESSMENT 42 GUINEA CURRENT
REGIONAL DEFINITION
47
Box 3
Some basic facts about deforestation in Africa.
Land degradation
· Almost 680 million ha of Africa were originally forested.
Almost 40% of the population of sub-Saharan Africa (i.e. 258 mil ion
· Over 90% of West Africa's original forest has been lost; only a small part of what
remains qualifies as frontier forest.
people) live on fragile land (World Bank 2002). Most of them live in the
· Within the Congo Basin, between 1980 and 1995, an area about the size of
Guinea Current region.
Jamaica was cleared each year (1.1 million ha).
· During 1990-95 the annual rate of deforestation in Africa was about 0.7 %, a slight
decline from 0.8 % during 1980-90, according to FAOSTAT. The highest rates were
recorded in the moist western parts of the continent.
In terms of land degradation, the region faces a double chal enge: the
· In Africa, for every 28 trees cut down, only one tree is replanted.
natural poor quality of soils is a constraining environmental factor.
· Large blocks of intact natural forest only remain in Central Africa, particularly in
DR Congo, Gabon, and Republic of the Congo.
Phosphorus deficiency, low organic content, and low water infiltration
· Since 1957, two thirds of Gabon's forests have been logged, are currently being
logged, or were slated for logging as logging concessions in 1997.
and retention capacity in most African soils have been limiting factors
· Only 8% (0.5 million km2) of Africa's original forest remains as frontier forest.
in agriculture. The anthropogenic effects are adding to the natural
· 77% of Africa's remaining frontier forests are under moderate or high threat.
conditions. The human pressure on fragile lands is nearly everywhere
(Source: WRI 1994, IUCN 2002, FAO 2003b)
exceeding the maximum load that they may sustain.
Today, most of Africa's remaining frontier forests are at risk. The two
The consequence is the degradation of the land, which has negative
major threats are logging and commercial hunting to meet growing
impacts on the development of the countries (Box 4). The problem is
urban demand for bush meat (over-hunting removes populations of key
particularly acute in the Sahelian part of West Africa, but this does not
species that help maintain natural forest ecosystems). In Central Africa
mean that it does not exist in the other parts of the region.
over 90 % of al logging occurs in primary forest, one of the highest
Box 4
Land degradation and its effects.
ratios of any region in the world. In some areas, logging itself causes
Land degradation is a human induced or natural process which negatively affects
relatively little damage because only a few high-value tree species
the ability of the land to function effectively within an ecosystem, by accepting,
are removed. Stil , logging roads open up a forest to hunters, would-
storing and recycling water, energy, and nutrients.
Desertification is land degradation occurring in the arid, semiarid and dry areas of
be farmers and other profit seekers. One region warranting special
the world. These cover 40 % of the earth's surface and put at risk more than 1 billion
people who are dependent on these lands for survival.
concern is eastern DR Congo; civil unrest in Rwanda, Burundi, Sudan,
The causes of land degradation mainly relate to agricultural activities.
and DR Congo has driven hundreds of thousands of people into this
The major causes are:
· Land clearing and deforestation
area, where they escalate stress on the forest.
· Agricultural mining of soil nutrients
· Urban conversion
· Irrigation
Forests play an important economic role in many African countries.
· Pollution
Forest products provide 6 % of GDP in Africa at large, the highest in the
The major stresses are:
· Accelerated erosion by wind and water
world. Forests also provide a range of ecological, economic, and social
· Nutrients
services to humans, including protection of water and soil resources.
· Acidity increase
· Salinisation
Forests also act as carbon sinks, much of which is released into the
· Alkalinisation
atmosphere when they are cleared, contributing to the build-up
· Soil structure
· Loss of organic matter
of greenhouse gases. In addition, forests are the main reservoir of
Severe land degradation affects a significant portion of the earth's arable lands,
decreasing wealth and economic development. The link between a degraded
terrestrial biological diversity and are a vital resource for mil ions of
environment and poverty is direct and intimate.
local communities. Forest products also provide the foundation of
As the land resource base becomes less productive, food security is compromised,
competition for dwindling resources increases and the seeds of potential conflict
many local and national economies.
are sown.
Species diversity is lessened and often lost as lands are cleared and converted to
agriculture.
In Western and Central Africa, much of the tropical humid forests have
Thus, a downward eco-social spiral is created when marginal lands are nutrient
depleted by unsustainable land management practices resulting in lost soil stability
already undergone substantial commercial harvesting. The total volume
leading to permanent damage.
of wood exploited annual y in the region is more than 200 million m3.
(Source: US Department of Agriculture, Natural Resources Conservation Service.)
According to FAO nearly 90 % is consumed as firewood and charcoal,
and only 2 % as industrial round wood. However, as it produces only a
Land degradation is directly impacting water resources (World Bank
smal proportion of the world's industrial round wood, Africa is a net
2002). The increased run-off coefficient caused by the partly or ful y
importer of industrial wood.
removed vegetation cover has several harmful impacts on the aquatic
environment and human settlements:
48
GIWA REGIONAL ASSESSMENT 42 GUINEA CURRENT
REGIONAL DEFINITION
49
Increased erosion resulting in loss of arable lands and increased load
preparation of the Conference WAC/IWRM + 5 which is scheduled by
of particles in the rivers leading to increased turbidity of the water
the end of October 2003 in Ouagadougou. It must also be noted that
as well as sedimentation in the lakes and reservoirs;
an IWRM process has started in Central Africa. A meeting of Ministers in
Eutrophication of water bodies due to intensive discharges of
charge of water for Central Africa was held in N'Djamena in 2002.
organic matter leached by the rain on the deforested land areas;
Reduced infiltration resulting in reduced recharging of the
The principal findings made in 1998 were based on the situation in West
groundwater aquifers;
Africa, but they can be easily extrapolated to the whole region. They
Worsening of peak flows in the rivers resulting in risks of increased
can be summarised as fol ows.
flooding or dam failures.
National water policies
National water policies Legal and institutional
The formalisation of national water sector policies is a recent practice.
framework
Most of the countries have policy documents on water or are in the
National policies, legal frameworks and institutional frameworks are
process of elaboration of such documents. However, some policy
closely linked together and are significantly driven by international
documents are limited to goals concerning consumption ratios,
agreements ratified by the countries, as shown in Figure 24. However
projections of future demands, or more on the needs for financing
they are presented separately in the fol owing sections.
of water infrastructure projects. Most of the documents talk about
the principles of integrated water resources management, but these
There is no general overview of the issues of water policy in relation
principles are not yet applied and the water policies most often
to legal and institutional frameworks in the region. Such an exercise
represent an overlay of sectorial policies.
needs to be done. However, a study on this question was made in 1998
within the framework of the West African Conference on Integrated
In al countries, the actual tendencies go towards democratisation,
Water Resources Management (WAC/IWRM). This study concerned the
liberalisation of the market, and disengagement of the Government
16 countries which at that time constituted the Economic Community
from the productive sector, decentralisation and administrative
of West African States (ECOWAS) and which represent 13 of the countries
decentralisation. The good governance of water is everywhere
of the Guinea Current region. A new study is foreseen in the context of
expressed as a political priority.
Figure 24 Relations between national policy, international agreements, juridical and institutional frameworks.
(Source: adapted from Cougny 2001)
48
GIWA REGIONAL ASSESSMENT 42 GUINEA CURRENT
REGIONAL DEFINITION
49
Laws and regulations of the water sectors
The control of hazardous industrial instal ations adheres sometimes
Almost al countries have already elaborated or are in the process of
to the Ministry of Mines sometimes to the Ministry of Industry and,
elaborating a "Water Code" or a framework law. In almost all countries
more and more frequently to the ministry in charge of environment.
the adopted acts are not being applied. The texts are not being applied
Prevention of natural hazards (including floods) is retained in the
because the regulation texts implied by the laws have not been made,
Ministry of Interior, but there is not enough co-ordination with the
but also due to shortage of human resources and means for enforcing
water departments in this area. Due to this, early warning and risk
the law. It happens also that the texts are in contradiction with the
management is general y inefficient.
customary laws and meet with strong opposition from the populations,
especial y in rural areas.
The hydropower sub-sector is under the Department of Energy, often
grouped with the mines and sometimes also with water ministries.
Thus, water resources are almost always managed in a legal void, or at
Final y, the other water roles (e.g. transport, tourism) are not explicitly
least legal vagueness. The texts are lacking, unclear, outdated, or not
taken into consideration as elements of the water sector.
applied. There are overlappings or gaps in the mandates of institutions.
The most "up to date" law in the region, which fol ows closely the
There is in almost all countries a co-ordinating body (most of the
"modern" principles of IWRM, is the Law of Orientation of Water
time consultative) such as a Water Technical Committee or a National
Management, adopted by Burkina Faso in February 2001. Its decrees
Water Council, but its efficiency is not being underlined. Moreover,
for application are in the process of being approved.
it is often an administrative body without participation of user
representatives.
With respect to water potability, most of the countries use the WHO
guidelines. National standards on potability are rare and, where they
National Environmental Strategies (NEAPs) have been formulated in most
exist, the legal texts making them obligatory have not been made or
countries. They are fol owed by the formulation of National Biodiversity
are not applied.
Strategies, and environmental laws and regulations. There are even
National Consultative Commissions for the Environment and Sustainable
Concerning international water law, the policy makers admit that the
Development (CNCEDD) derived from the Agenda 21 that have been
national legislations have not been subject to explicit harmonisation
constituted practical y everywhere after the Rio Conference.
with the international conventions ratified by the countries. In fact,
most of the countries have ratified the main international conventions
Around the Congo Basin, most of the countries have adopted national
related to water (Annex VI) but the procedures for the fol ow-up of their
strategies for natural resources management (forests, biodiversity,
enforcement are often lacking.
physical environment, but not specifically for water). These strategies
are at very different levels of progress from one country to another. The
National institutional framework and administration organisation
situation is the same for the concrete management mechanisms, which
Most of the countries underline the multitude of actors in the water
vary from one context to another.
sector and the insufficiency of co-ordination between these actors.
Water management is general y spread in three (sometimes more)
Regional institutions
ministerial departments:
West African countries commit themselves in a strategic way in sub-
A ministry in charge of Water, dealing primarily with drinking water
regional and continental integration frameworks in order to consolidate
supply;
and build regional and national capacities. Evidence is the existence of
A ministry in charge of Agriculture, dealing with irrigation, water for
several intergovernmental organisations. The most important are `Union
cattle and fisheries;
Economique et Monétaire Ouest Africaine' (UEMOA), the Economic
A ministry in charge of the Environment, dealing with nature
Community of West African States (ECOWAS) which will host the IWRM
protection (including aquatic ecosystems and wetlands).
Regional Co-ordination Unit, `Comité permanent Interafricain de Lutte
contre la Sécheresse au Sahel' (CILSS), Niger Basin Authority (NBA) and
Sanitation is general y under the department responsible for city planning
`Autorité pour le développement du Liptako Gourma' (ALG).
and housing, but it can also, sometimes, be attached to water or to
environment. The drainage of rainwater is not seen as a sector as such and
The Niger Basin Authority's origins are in the 1963 Niger River
fal s general y under the departments of city planning or public works.
Commission (NRC), which was created to control navigation on the
50
GIWA REGIONAL ASSESSMENT 42 GUINEA CURRENT
REGIONAL DEFINITION
51
Niger River. In 1979 the Heads of State Summit in Lagos recommended
Since 1990, regional or national water partnerships have been created
revitalising the NRC. Nine Niger Basin countries are signatories to the
as an effect of a recommendation of the West African Conference on
new Convention that established a basin organisation, on 21 November
IWRM and as a result of the activities of the Global Water Partnership.
1980 in Faranah. The Convention assigned the NBA, the central
Today, the fol owing partnerships are operational:
governing institution for the Niger River, to "promote co-operation
The West African Water Partnership (WAWP) established in Bamako
among the member countries and to ensure integrated development
in March 2002.
in al fields through development of its resources, notably in the
The Country Water Partnerships (CWP) of Benin (Sept. 2001),
fields of energy, water resources, agriculture, forestry, transport and
Burkina Faso (28 Feb. 2002), Senegal (12 Nov. 2002), Nigeria
communication and industry".
(10 Dec. 2002), Ghana (19 Dec. 2002) and Mali (April 2003). Other
national partnerships are under constitution in Côte d'Ivoire, Niger
In Central Africa, depending on the subjects, countries of the Guinea
and Togo.
Current region belong to various regional bodies. With regards to water
resources management, three countries of the region belong to the
Capacities and human resources
Southern African Development Community (SADC): Angola, DR Congo
Most of the countries do have appropriate human resources in terms
and Zambia. Concerning currencies and economic integration, all the
of quality, but the number of people is not sufficient to cover al the
six countries of the Central African Economic and Monetary Community
aspects of water management. Further, a number of the national
(CEMAC) are total y or partial y in the region: Cameroon, Chad, Republic
specialists prefer to work for the international or regional organisations
of the Congo, Equatorial Guinea, Gabon and the Central African
because they consider the work more interesting, more appreciated
Republic). Five countries of the region (Angola, DR Congo, Sudan,
and much better paid.
Uganda and Zambia) belong to Common Market for Eastern and
Southern Africa (COMESA) which has 20 member countries.
Some countries admit that their national personnel are not sufficiently
trained in the field of policy formulation, neither legislation nor
A process is ongoing in Central Africa to: (i) formulate a regional
regulation.
agreement on water resources management (inspired by the West
African initiative taken in Ouagadougou in 1998 and completing the
The scientific tolls are insufficient. Information systems need to be
SADC protocol on shared water courses for the countries member of
established or modernised. And especial y, the monitoring network
SADC) and (ii) establish a Regional Water Partnership under the Global
for surface water and groundwater resources lacks maintenance. The
Water Partnership (GWP) which supports these two initiatives.
lack of knowledge about water resources is well known as one of the
constraints for achieving a sustainable management of the water
Other stakeholders in water management
resource.
The private sector is an important operator in the field of drinking
water supply as well as sanitation. In most of the countries, the actual
Only a few countries have monitoring networks for water quality of
tendency in the Government policies is to privatise public utilities and/
the natural water resources. Côte d'Ivoire, for example, has established
or to abandon the State monopoly of public water supplies as a part of
the RNO-CI `Réseau National d'Observations de Côte d'Ivoire' which
the decentralisation policy.
continues to periodically measure the water quality in a number of
selected spots in rivers, lagoons and along the seashore (CIAPOL 2002).
he other private players are the consulting firms, the contractors, and
the equipment suppliers.
The capacity for performing micro-economic analysis is rarely
mentioned as causing problems. Nevertheless, it is known that the
The associations (e.g. NGOs) play a more and more important role in the
decisions for investments within the water sector are not always based
management of water. Associations of consumers are active in several
on all needed relevant economic data. Certain decisions are not based
countries of the region. The NGOs, working for the development of the
on relevant data, but rather on politics.
countries, are financing water supply schemes in urban areas as well as
in vil ages, smal er irrigation schemes, and health projects in relation to
Al countries agree to the principles of Integrated Water Resources
water posts (health information campaigns for example).
Management (IWRM) (according to the principles of Copenhagen-
Dublin-Rio), but those principles are not applied in the day-to-day
50
GIWA REGIONAL ASSESSMENT 42 GUINEA CURRENT
REGIONAL DEFINITION
51
management. One of the reasons is the fact that decision-makers are
The next step of the fol ow-up process wil be the West African
not aware of the IWRM and thus do not manage the principles.
Conference on Integrated Water Resources Management Plans
(Ouagadougou, 29-31 October 2003). One of the aims is to examine the
Initiatives and projects concerning international
financing of the regional and national water action plans with a view to
waters in the region
fulfilling the "Target 2005" on National IWRM and Water Efficiency Plans
Policy initiatives
fixed by the Johannesburg Summit (see below).
West African regional progress towards IWRM
In March 1998 a West African ministerial conference on Integrated
Central Africa Initiative on IWRM
Water Resources Management was held in Ouagadougou. The major
A) Intergovernmental Initiative
results of this conference were the adoption of a declaration cal ed
This initiative commenced with the first meeting of Central
the "Ouagadougou Statement" and the establishment of a Ministerial
African water ministers in November 2000 in the Republic
Fol ow-up Committee responsible for monitoring the process of fol ow-
of the Congo. One of the main results of this endeavour was
up of the implementation of the Conference recommendations.
the decision to create the IWRM authority AGIEAC (Autorite
de gestion integree des eaux en Afrique centrale). The constitution
The Ouagadougou Statement urged the governments to:
of this institution was adopted during the ministerial meeting held
1. Implement in their respective countries a process of integrated water
in N´Djamena, Chad in July 2002. The process of instal ing the
resources management based on National Water Action Plans;
institution and the initiation of its activities are ongoing.
2. Create a framework for regional co-operation on integrated water
B) The Global Water Partnership (GWP) initiative
resources management, harmonisation of policies and legislation
In April 2003, Republic of the Congo, GWP organised a workshop
on water issues and exchange of experience;
on IWRM in col aboration with the Central African water sector, the
3. Create or re-vitalise the consultative frameworks between riparian
government of Republic of the Congo, and UNECA. A major result of
countries for joint management of shared basins;
this meeting was the formation of a working group for the instal ation
4. Prepare national and regional strategies for mobilisation of financial
of a technical committee of GWP in Central Africa. This institution is
resources required for integrated water resources management.
thought to be in place and its activities launched by January 2004.
The Conference further recommended the establishment of a network
NEPAD
of the Global Water Partnership to assist the process in reforming water
The New Partnership for Africa's Development (NEPAD) framework
resources management in the region.
places importance on including environmental concerns in future
sustainable socio-economic development. This is especial y so vis-ŕ-
The fol ow-up process conducted by Burkina Faso with technical and
vis waters resources. The NEPAD objective is to create a "framework
financial support from Danida, led to two important results:
for regional co-operation in an integrated sustainable water resources
1. Adoption of a West Africa Regional Action Plan on IWRM (WARAP-
management, harmonisation of water polices and regulations".
IWRM) by the ECOWAS Heads of State and Government in Bamako
Environmental and financial governance have been identified as critical
in December 2000. The WARAP-IWRM encompasses 14 projects
strategies within the framework.
built on the four axes defined by the "Ouagadougou Statement";
2. Creation of a Permanent Framework for Co-ordination and
The significance of NEPAD is that it has received strong political
Monitoring (PFCM) also adopted by the Heads of State and
endorsement from the African Heads of State as wel as international
Government in Dakar in December 2001.
development partners, and therefore provides an important conceptual
programme framework. It aims at eradicating poverty and promoting
The PFCM will be responsible for the implementation of the Regional
sustained growth and development in Africa.
Action Plan and includes a Ministerial Committee (Ministers responsible
for water), a Regional Col aborative Council (stakeholders), a Technical
In the NEPAD Programme, water and sanitation are important
Expert Committee (officials from Governments and basin organisations),
components. The areas, which are emphasised in this sector, are:
and a Co-ordination Unit (Technical Secretariat under the Executive
integrated water resources management; promoting co-operation
Secretariat of ECOWAS). The Co-ordination Unit is being established in
between countries through the effective management of shared
Ouagadougou Burkina Faso in 2003.
river basins; mitigation of floods and droughts; effective response and
52
GIWA REGIONAL ASSESSMENT 42 GUINEA CURRENT
REGIONAL DEFINITION
53
preparation for climate change; and meeting basic needs in water
Canadian Initiative
supply and sanitation.
Fol owing the Kananaskis Summit, Canada announced a major
initiative to support African development; water management is one
AMCOW
of the focus areas. The new initiative will bring together governments,
In April 2002, African Ministers in charge of water formal y launched
the private sector and civil society to promote African innovation,
the African Ministerial Conference (later changed to Council) on Water
human development and critical infrastructure services. These will
(AMCOW) with the support of UNEP, UNESCO and WMO.
include public participation and capacity building to develop African
solutions to its chal enges. Canadian International Development
The need for AMCOW was based on the realisation of the potential
Agency (CIDA) has also expressed an interest in supporting policy/
contribution that the development of water in Africa would have on
strategy development and building capacity for the implementation
the overall economic and social development in Africa, especial y with
of policies and plans for sustainable water resources management in
the forthcoming World Summit on Sustainable Development (WSSD)
Africa. A total of 50 million Canadian dol ars over a five-year period has
in view and Africa's determination to eradicate poverty in the region.
been announced to improve water management and access to water
AMCOW wil , therefore, develop the water resources components of the
and sanitation and 10 mil ion Canadian dol ars towards col aboration
NEPAD Programme, and co-ordinate regional programmes, in particular
with the African Development Bank (AfDB) to develop financial y
those aiming at achieving the water related Mil ennium Development
viable water projects. GWP was identified as one of the organisations
Goals.
through which this support could be channel ed. Annex VI illustrates
some regional projects in the fields of environment and water resources
management.
WSSD Target 2005
The Mil ennium Development Goals (MDGs) were agreed upon by the
International Community in 2000. Access to safe drinking water and
basic sanitation is one of the 18 numerical and time bound targets.
Closely linked to the achievement of this and indeed most if not all of
the other MDGs is sustainable water resources management. IWRM will
be especial y key to eradicating extreme poverty and hunger, ensuring
environmental sustainability and improving health conditions.
The World Summit on Sustainable Development in August 2002
confirmed the importance of water and its critical relationship to all
other development issues and reinforced the importance of achieving
the MDGs. Regarding water resource management, the Conference
underlined the critical importance of this issue by agreeing on an
additional target: "Preparation of National Integrated Water Resources
Management and Water Efficiency Plans to be prepared by 2005",
known as Target 2005.
EU Water Initiative
The EU Water initiative was formal y launched at the WSSD in 2002 and
aims at facilitating and co-ordinating support from the EU member
states to the water sector. The initiative includes a large component
concerning support to sub-Saharan Africa covering water supply and
sanitation as well as integrated water resources management. Details
and modalities for implementing the initiative are currently in the
design stage.
52
GIWA REGIONAL ASSESSMENT 42 GUINEA CURRENT
REGIONAL DEFINITION
53
54
GIWA REGIONAL ASSESSMENT 42 GUINEA CURRENT
Assessment
This section presents the results of the assessment of the impacts
Table 25 Scoring table for Comoe Basin.
of each of the five predefined GIWA concerns i.e. Freshwater
Assessment of GIWA concerns and issues according
The arrow indicates the likely
to scoring criteria (see Methodology chapter)
direction of future changes.
shortage, Pollution, Habitat and community modification,
T
T
C
C
Increased impact
P
A 0 No known impacts
P
A 2 Moderate impacts
I
M
I
M
T
T
No changes
Unsustainable exploitation of fish and other living resources,
C
C
P
A 1 Slight impacts
P
A 3 Severe impacts
I
M
I
M
Decreased impact
Global change, and their constituent issues and the priorities
identified during this process. The evaluation of severity of each
p
a
c
t
s
u
n
i
t
y
e
n
t
a
l
m
p
a
c
t
s
m
c
o
r
e
*
*
issue adheres to a set of predefined criteria as provided in the
Comoe Basin
i
c i
m
o
m
chapter describing the GIWA methodology. In this section, the
p
a
c
t
s
p
a
c
t
s
E
n
v
i
r
o
n
m
i
m
E
c
o
n
o
m
H
e
a
l
t
h i
O
t
h
e
r c
i
m
O
v
e
r
a
l
l S
P
r
i
o
r
i
t
y
*
*
*
scoring of GIWA concerns and issues is presented in Tables 25 to
Freshwater shortage
2*
1
1
1
1.2
4
29. Fields left blank represent issues that could not be assessed
Modification of stream flow
2
by the GIWA Task teams, normally due to lack of data.
Pol ution of existing supplies
1
Changes in the water table
0
Pollution
3*
3
3
3
3.0
1
Note: The relations between the regional climatic evolution of the last 30-
Microbiological pol ution
3
40 years and global change are not yet scientifical y proven, even if the
Eutrophication
3
assumptions are becoming stronger and stronger with the progress of
Chemical
1
Suspended solids
1
investigations reported by the International Panel on Climate Change (IPCC
Solid waste
0
2001). For this reason, during the Task team workshop in Ouagadougou,
Thermal
0
February 2003, the authors of this report deemed that global change could
Radionuclide
0
Spil s
0
not be assessed for the time being. Nevertheless, they acknowledge that,
Habitat and community modification
2.5*
2
2
1.5
2.0
2
if the scientific relationships are established, the concern of global change
Loss of ecosystems
2
wil be of particular importance for the region. In this report, the concern
Modification of ecosystems
3
Global change has been scored for all assessed entities but is only discussed
Unsustainable exploitation of fish
2*
2
2
2
2.0
3
in relation to the assessment of the Guinea Current LME.
Overexploitation
2
Excessive by-catch and discards
1
Destructive fishing practices
2
Decreased viability of stock
0
Impact on biological and genetic diversity
0
Global change
*0.3
0.3
0.3
0.3
0.3
5
Changes in hydrological cycle
1
Sea level change
0
Increased UV-B radiation
0
Changes in ocean CO source/sink function
0
2
* This value represents an average weighted score of the environmental issues associated
to the concern.
** This value represents the overall score including environmental, socio-economic and
likely future impacts.
*** Priority refers to the ranking of GIWA concerns.
ASSESSMENT
55
Comoe Basin
Microbiological pol ution and health risks of fecal origin. It has been
recommended that the authorities prohibit the use of water from
certain wel s for human consumption (CIAPOL,1 pers. comm.).
T
C
P
A
Freshwater shortage
I
M
Industrial pollution is specifical y related to the Abidjan urban area, in
which 60% of the industrial activities of Côte d'Ivoire are concentrated.
Environmental impacts
The majority of plants being agro-industrial contribute to raising the
The three main issues related to Freshwater shortage are all observed
level of nutrients in the water. The chemical pol ution is limited to some
in the Comoe Basin with different levels of importance.
particularly pol uting activities such as surface treatment releasing
heavy metals, for example zinc, copper, chromium and cadmium.
Modification of stream flow is due to the decrease in rainfall observed
during the last 30-40 years in the Comoe Basin, as in the whole West
Changes in the water table are related essential y to three phenomena.
Africa (Figure 6). This issue is treated in more detail for the Volta Basin
The first is decrease in rainfal which is already quoted above. Besides
and the Niger Basin.
the decrease of run-off, an additional effect is the decrease of infiltration
and thus the natural lowering of water tables.
Damming is another cause of the modification of stream flow. Almost
130 smal -scale reservoirs have been created in the Basin for hydro-
The second phenomenon is excessive water withdrawal in the human
agricultural activities (Table 24). These shal ow reservoirs have the
settlements. In principle, the pumping tests made at the opening of the
potential to lose a large amount of water directly by human withdrawal
boreholes - and approved by the administration - form the basis for the
or by evaporation, and indirectly by deforestation around the dams.
permission for its exploitation. Unfortunately, most of the users do not
Although accurate information on these losses is not available, it is
respect the instructions given in the permissions and many boreholes
noteworthy that continuing construction of the shal ow artificial lakes
are out of order after a short time. It is reported that 6 000 boreholes,
in the future, without adequate planning and control, will lead to the
among 18 000, were out of order in Burkina Faso (MEE/DGH 2001). Some
unsustainable use of surface water resources in the Basin.
of these boreholes are in the Comoe Basin.
Pollution of existing supplies depends on the zones of the Basin: in the
Urbanisation is the third phenomenon and, as in Abidjan, this increases
agricultural zones of the Basin (i.e. the major part), the watercourses
the run-off and decreases the infiltration (SODECI2, pers. comm.).
receive relatively high loads of nutrients (i.e. nitrogen and phosphorus)
brought by run-off. This diffuse pol ution phenomenon has been
However, freshwater shortage is not yet a severe problem, neither for
particularly important during the years 1970-1980, the period when
the population of the Comoe Basin nor for agricultural, livestock or
the deforestation for cultivating was at the highest in Côte d'Ivoire. The
industrial needs and it is estimated that the present environmental
consequence is eutrophication of the waters and the proliferation of
impact of freshwater shortage in the Comoe Basin is moderate.
aquatic weeds (DHI Water & Environment 2002). Agro-industrial point
However, the decreasing water flow is accompanied by other
sources, such as the sugar factory of Banfora, have also been registered
environmental issues such as:
in the upper part of the Basin in Burkina Faso.
Increasing pol ution level due to concentration of nutriments
during the low water season;
In addition, domestic pol ution near the towns and the vil ages is severe.
Loss of biodiversity in the aquatic ecosystems depleted by
The lack of sanitation systems and the leaching of household wastes by
droughts;
rainwater (PNAE-CI 1994) have three effects:
Reduction of fish stocks in the rivers affected by seasonal drying;
Discharge of organic matter in the rivers including nutrients
Modification of coastal ecosystems due to the decrease of floods.
adding to the loads already coming from the diffuse pol ution of
An example is the Comoe outlet in Grand-Bassam, which has been
agricultural origin (DHI 2002);
closed for many years because of the deviation of one part of the
Nitrate pol ution of the groundwater. This phenomenon has already
flow towards the Vridi Canal since 1951 and the decrease of annual
been observed in many vil ages and in some groundwater wells
flood, inability to open the sand bar presently blocking the river
supplying Abidjan (Ebah 2000);
mouth.
56
GIWA REGIONAL ASSESSMENT 42 GUINEA CURRENT
ASSESSMENT
57
Socio-economic impacts
lack of knowledge of farmers, and pesticides used for fishing in the rivers
The socio-economic impacts of Freshwater shortage in Comoe Basin
and lakes. Moreover, close to the coast, the Comoe River crosses a large
were assessed as slight and are related to drinking water supplies by
urban area from Grand-Bassam to Abidjan, with a population estimated
exposure of the population to health hazards by using natural surface
at 3.5 million inhabitants.
waters not suitable for human consumption, economic losses related
to alternative water supply systems, and economic losses due to
Abidjan, the economic capital and the principal port of Côte d'Ivoire,
decrease in agricultural incomes (less crops, death or diseases of cattle,
is built on the shores of the Ebrié Lagoon. Al domestic sewage is
depletion of fish stocks) and industrial production because of water
discharged into the Lagoon without any treatment. About 60% of
supply failures.
the industries of the country are located in Abidjan due to facilities
including motorways, railway and access to the deepwater harbour.
Conclusions and future outlook
The industrial plants discharge their raw sewage into the Lagoon. The
Shortage of water supply in the upstream part of the Comoe Basin
environmental impacts include degradation of water quality, habitats
(both for domestic and agricultural uses) is increasing. The same trend
and community destruction, negative impact to fisheries, harmful
is observed concerning groundwater in the Abidjan area with 3.5 mil ion
effects on coastal waters and loss of biodiversity.
people to be provided with drinking water of good quality.
All the point and non-point sources of pollution quoted above, result
The most likely future scenario is that al of the root causes of water
in enrichment of the Comoe River waters by nutrients (i.e. nitrogen
shortage will persist or become more pronounced. The population is
and phosphorus) which are the cause of the proliferation of aquatic
expected to increase and will together with an intensified urbanisation
weeds. Three invading species are observed: water hyacinth (Eichhornia
create increased water demands and run-off, causing again more
crassipes), water lettuce (Pistia stratiotes) and water fern, also called Kariba
pollution to enter the waterways. As a consequence of the intensified
grass in southern Africa (Salvinia molesta) (Figure 25, 26 and 27).
urbanisation, infiltration and replenishment of the groundwater system
will decrease. Given that the weather patterns that are observed today
These three weeds have various environmental impacts listed in
continue, the evaporation from the numerous shal ow dams along the
the National UNDP/GEF Project "Control of aquatic weeds invading
River will remain high if not increase.
the water bodies of Côte d'Ivoire to enhance/restore biodiversity"
(CIAPOL 2002). The invading aquatic weeds have negative effects on
Future environmental and socio-economic impacts of freshwater
the resources available for the riparian populations. They weaken the
shortage in the Comoe basin are therefore likely to further aggravate
surface water resources as a basis of development and thereby affect all
the livelihood of the people of this basin.
water users and more general y the economy of the country in which
they occur (Box 5) (Serre & Cougny 1997).
Box 5
The impacts of invading aquatic weeds.
Alterations of the physical/chemical and biological balance
T
C
P
A
Pollution
· Shading of light, reduction of the aeration, decrease of oxygen
I
M
· Alterations in pH, fixation of phosphorus and nitrogen.
· Habitat for vectors of diseases (microorganisms, molluscs, mosquito larvae)
Environmental impacts
· Competition with local vegetal species
All the riparian countries of the Comoe Basin are agricultural countries.
· Constitution of substrate (pseudo-soils) on which other vegetation adheres and grows.
The quantity of fertilisers used is not so high in West Africa (SCPA
Alterations of the hydrological balance
· Slowing or accelerating of the currents
2001, pers. comm.) except in the cultivation of cotton, sugar cane
· Augmentation of water losses by evapotranspiration
and pineapples. For example, sugarcane fields are wel developed in
· Acceleration of sedimentation
the south of Burkina Faso near Banfora. Besides that, the sugar factory
Consequences: socio-economic losses
· Loss of hydroelectricity production
(30 000 tonnes per year of sugar production) releases organic by-
· Excessive maintenance costs and damage of installations due to corrosion
products directly into the River.
· Reduction of fish stocks, constraints for fishing activities
· Obstacles to navigation, inconvenience to transport by the waterways
· Loss of water resources
In the whole basin, some agricultural practices are harmful to the
· Increase of costs of treatment of potable water
Comoe River and its tributaries such as massive deforestation before
· Degradation of amenity of tourist sites, inconvenience to entertainment activities
cultivating, burning of vegetation, misuse of fertilisers because of the
(Source: Serre & Cougny 1997)
1 Centre Ivoirien Anti-Pollution (Côte d'Ivoire). 2 Société de Distribution des Eaux de la Côte d'Ivoire.
56
GIWA REGIONAL ASSESSMENT 42 GUINEA CURRENT
ASSESSMENT
57


Figure 25 Water Hyacinth (Eichhornia crassipes).
Figure 27 Water Lettuce (Pistia stratiotes).
(Photo: DHI)
(Photo: DHI)
There is no reported thermal or nuclear pollution in the Comoe
Basin.
Socio-economic impacts
Pol ution may cause decline in biodiversity. There are also potential
negative impacts to the productivity of fisheries as the major habitats
are impacted by pollution. This has translated to loss of earnings both
from fishing activities and from the tourism trade.
The main socio-economic impact expected from microbiological
pol ution is the effect of il ness and deaths. Epidemiological data
Figure 26 Water Fern (Salvinia molesta).
(Photo: DHI)
shows the possible implication of the Ebrié Lagoon and its hydro-
climatic variations in the endemics of some diseases such as cholera and
The release of nutrients by crops, deforestation or human settlements
typhoid. Since 1970, infectious diseases involving bacteria such as Vibrio
also has an effect on the groundwater quality. High nitrate
cholerae, V. parahaemolyticus and Aeromonas spp. occur endemical y
concentrations (up to 200 mg/l) have been observed in wells dril ed
and sporadical y among the riverine population of the Ebrié Lagoon.
into fractured aquifers lying beneath layers of weathered and decayed
Pol ution of the Ebrié Lagoon's shoreline causes olfactory nuisances
rock in the humid tropical zone of Côte d'Ivoire, where rainfal is over
to the riparian population which has borne a social cost estimated at
1 000 mm per year and where there are no notable classical sources
237 000 USD in 1998 (pers. comm.).
of pol ution (e.g. cities, fertilisers, agro-industries). The source of the
nitrates is attributed mainly to deforestation (Fail at 1990, Fail at et al.
With respect to the tourism potential of the city of Abidjan, the present
1988, 1989 and 1991).
evidence of pol ution of the Ebrié Lagoon including a shoreline covered
with wastes, septic and discoloured waters, and offensive odours
As a consequence of the urban and industrial pol ution of the city of
detract a lot from the city's attractiveness. Eutrophication results in
Abidjan, the Ebrié Lagoon has undergone eutrophication especial y
reduced tourism/recreational opportunities as it interferes with the
in the bays. Domestic pol utants also contribute to the microbial
aesthetic value of beaches. Tourism is a leading foreign exchange earner
contamination of lagoon waters and thereby increase the public
in the country and employs thousands of coastal dwel ers. Some coastal
health hazard (Kouassi et al. 1990). The Ebrié Lagoon waters have
cities developed purely from tourism revenues. Currently, some tourist
been considered as a "reservoir" of pathogenic microorganisms;
hotels have lost their beach fronts with consequent loss of tourism
Vibrio, Salmonel a and Shigel a spp. are currently isolated from this
business. This is further manifested in loss of employment to many
environment.
hotel employees.
58
GIWA REGIONAL ASSESSMENT 42 GUINEA CURRENT
ASSESSMENT
59
The coastal lagoons that used to provide fish to the people hardly
The concern of habitat modification (i.e. the issue of habitat degradation)
support any fisheries today. A classic example is the Ebrié Lagoon that
is particularly acute in the south of Côte d'Ivoire. It impacts mangroves,
is now almost devoid of fish due to pol ution and siltation. Mass fish
coastal lagoons and the former estuary of the Comoe Basin near Grand-
mortalities are frequently observed in the polluted bays of the urban
Bassam, a medium-sized city, which was the first capital of the Colony
area of the Lagoon. Additional y, the size of fish at first sexual maturity is
of Côte d'Ivoire from 1893 to 1903.
unusual y low for herrings (Ethmalosa sp.) when caught in the polluted
Bay of Bietry (Albaret & Charles-Dominique 1982). A study by the World
Coastal habitats (including lagoons, estuaries and mangroves) are
Bank indicates that the pol ution of the Ebrié Lagoon has led to a
subjected to a multitude of different uses, which may have negative
decrease in fishery production (fish and shrimp) which was estimated
impacts if not thoroughly managed and co-ordinated. In Côte d'Ivoire,
at 928 300 USD in 1998.
industrial activities, although stil low, and uncontrol ed urbanisation are
developing mainly along the coast and are posing serious problems.
There are several aquaculture ventures in the Ebrié Lagoon. There is
Other developments, such as agriculture, deforestation resulting
obviously a potential risk from sewage or industrial pol ution either
in siltation, dam and harbour constructions, tourism, and energy
directly through damage to the stocks or indirectly through adverse
production are impacting the habitats of many aquatic species. Final y,
effects on the quality of the products (Adingra & Arfi 1998). Mass fish
the environment is threatened by destructive fishing practices and oil
mortalities have been observed during an algal bloom at several
spil s originating from oil exploitation.
aquaculture stations in Côte d'Ivoire lagoons in 1999 (MFRD Tema,
pers. comm.).
Resource depletion has been accelerating in the past few decades.
Inland and coastal waters appear to be particularly threatened, as
Conclusions and future outlook
developments have occurred almost exclusively in their vicinity because
The area of Abidjan is a particular case of a large city affected by
of the traditional amenities provided by aquatic environments.
microbiological and chemical pol ution. The main pol ution issue in
the Comoe Basin is eutrophication. If nothing is done, the seriousness
Mangroves are particularly affected as they are continuously harvested
of this issue wil increase (or in the best case remain stable) affecting
for fuel wood. Mangroves in the urban areas of the Ebrié Lagoon have
nearly al activities relating to water-use in the Comoe River and its
disappeared as a result of the development of the city of Abidjan.
tributaries.
Quarrying of sand in the coastal zone is forbidden by the law, but
remains a common practice to meet the demand of concrete
aggregates used in new housing projects in Abidjan and suburbs. The
T
C
P
A
Habitat and community
I
M
removal of sand tends to destroy natural habitats such as beaches and
modification
wetlands formed between the succession of littoral sandbars.
Environmental impacts
The various habitats and in particular the coastal habitats (estuaries,
The Comoe Basin has important (but not well known) biodiversity, and
lagoons and mangrove forests) of the Comoe Basin are thus subjected
diverse habitats that are threatened by human activities. The greatest
to a whole array of different uses that al have their own negative impact
threat comes from the clearing of land for farming and cattle rearing,
on the environment, mainly as a result of poor resource management.
as well as from forestry practices. Some farmers use bushfires for land
Uncontrol ed urbanisation fol owed by increasing amounts of solid
preparation, re-growth of vegetation for cattle grazing, and for hunting
waste, lack of control of industrial emissions, nutrient loaded surface
purposes, at the expense of the environment. This practice enhances
run-off from construction sites and intensified agriculture are all factors
the destruction of habitats, loss of biodiversity, as well as deterioration
adding up to a moderate or severe impact, both environmental y and
of biotic resources.
socio-economical y.
Socio-economic impacts
The environmental impacts of habitats degradation include loss in
Modification of critical habitats is a very important issue in respect of
genetic diversity of plant and animal species, erosion, reduction of
its socio-economic impacts. Unabated degradation of ecosystems and
fisheries, and degradation of water quality.
habitats leads to their reduced capacity to support the basic human
58
GIWA REGIONAL ASSESSMENT 42 GUINEA CURRENT
ASSESSMENT
59
needs of food, fuel and shelter. The most notable degraded habitats and/
equilibrium. The assessment made by the Comoe Basin team shows
or ecosystems include forests and mangroves and the water itself. For
that overexploitation of living resources has a moderate effect on both
generations these habitats and/or ecosystems have been supporting the
the environmental and the socio-economic situation in the country.
means of livelihood for thousands of dwel ers. Modification of ecosystems
have resulted in the loss of their aesthetic value - a characteristic on which
Socio-economic impacts
tourism depends, the displacements of whole communities, and the
Overexploitation of fish and other living resources causes loss of income
intrusion of peasants into the Comoe national park.
in many coastal dwellings in Côte d'Ivoire. This is further manifested in
the loss of protein for human consumption.
Conclusions and future outlook
Some of the issues and impacts presented above seem to be national
Overexploitation and resource degradation have led to severe
ones. But it must be underlined that, for the past few decades, the Sahelian
unemployment problems along the coastal zone. The loss of fishery
landlocked countries (Mali, Burkina Faso, Niger) have experienced severe
activities has favoured the migration of rural population toward
drought. This natural disaster has caused displacement of population to
large cities like Abidjan where unemployment, juvenile delinquency
the relatively wet southern part of West Africa, particularly in Côte d'Ivoire
and prostitution are already problems. This has increased women's
for historic and economic reasons. Population pressure on the local
poverty and dependence on men. Activities undertaken by women
environment (including the Comoe Basin but also the other international
are general y fish smoking and marketing. The loss of fishery activities
catchments of Côte d'Ivoire) has accelerated the degradation of the
has also increased extensive agricultural activities and led to the
natural habitats. The local degradation of habitats al along the coast
destruction of terrestrial forests and mangroves. The overexploitation
must be considered as an international problem since the root causes
has led to a decline of the fishery resources which, in turn, has increased
and the policy options must be explored at the regional level.
the competition between the Ivorian nationals and foreign fishermen
from the neighbouring countries of Ghana, Benin, and Togo.
If the actual trend is not reverted, the south of Côte d'Ivoire wil lose
many habitats resulting in great negative impact on the biodiversity
Customary laws are designed to regulate the use of water for domestic
of the ecosystems.
needs, animals and fishing in the rural area. The disrespect of these laws
can result in conflicts among the local communities. For example, in the
rural area of the Ebrié Lagoon, the traditional management strategies
in place have helped to maintain the fisheries. The management in this
T
C
P
A
Unsustainable exploitation of
I
M
lagoon is marked by an annual ceremony and sacrifices for the opening
fish and other living resources
and closure of fishing activities. Until 1985, fishing activities started in
June and ended in September, while fishing was prohibited between
Data covering fish catches and import/export statistics is found in
October and May. Most of the foreign fishermen do not respect the
Tables 33 to 35.
customary laws used by the local population to regulate the fishing
activities. The disrespect of these laws by the foreign fishermen has
Environmental impacts
resulted in conflicts between the foreign and the Ivorian fishermen.
Data on fisheries in the parts of the Basin outside Côte d'Ivoire (Burkina
Such conflicts have occurred periodical y among the local communities
Faso, Ghana, Mali) are not available. Statistics from the Fisheries
since 1957. Some of these conflicts can have very grave consequences.
Department of the Ministry of Agriculture and Animal Resources of Côte
Human lives have been lost in many fishing vil ages as a result of such
d'Ivoire indicate that fish catches have been declining over the years.
rivalry.
Along the coast of Côte d'Ivoire, fisheries and mangroves are important
Conclusions and future outlook
livelihood sources for many of the coastal communities that depend on
No data has been col ected on trends and future outlook.
their exploitation.
The decline of some prime fish species (due to overexploitation
or for other reasons such as pol ution) disturbs the equilibrium of
fish populations in the catchment area. The ultimate stage might
be the degradation of some specific ecosystem depending on this
60
GIWA REGIONAL ASSESSMENT 42 GUINEA CURRENT
ASSESSMENT
61
Volta Basin
Table 26 Scoring table for Volta Basin.
Assessment of GIWA concerns and issues according
The arrow indicates the likely
to scoring criteria (see Methodology chapter)
direction of future changes.
T
T
C
C
Increased impact
P
A 0 No known impacts
P
A 2 Moderate impacts
I
M
I
M
T
T
No changes
C
C
P
A 1 Slight impacts
P
A 3 Severe impacts
I
M
I
M
Decreased impact
p
a
c
t
s
u
n
i
t
y
Volta Basin
e
n
t
a
l
m
p
a
c
t
s
m
i
c i
m
c
o
r
e
*
*
o
m
p
a
c
t
s
p
a
c
t
s
E
n
v
i
r
o
n
m
i
m
E
c
o
n
o
m
H
e
a
l
t
h i
O
t
h
e
r c
i
m
O
v
e
r
a
l
l S
P
r
i
o
r
i
t
y
*
*
*
Freshwater shortage
2.2*
2.3
2.0
2.0
2.3
1
Modification of stream flow
2.8
Pol ution of existing supplies
0.6
Changes in the water table
1.4
Pollution
1.3*
1.3
2.0
1.3
1.6
4
Figure 28 Rainfall at Bobo-Dioulasso (Black Volta Basin),
Microbiological pol ution
1.7
Ouagadougou (White Volta Basin), and Dori (Niger
Eutrophication
1.0
Basin) since the start of the observations.
Chemical
1.0
(Source: MEE/DGH 2001)
Suspended solids
1.0
Solid waste
1.3
observed between the periods of 1931-1960 and 1961-1990. Decreasing
Thermal
0
river flows have also been observed in the main tributaries of the Volta
Radionuclide
0
River (Figure 29).
Spil s
0
Habitat and community modification
2.4*
2.3
1.8
2.1
1.7
2
Loss of ecosystems
1.9
Observations over the past 25 years show a general tendency towards
Modification of ecosystems
2.7
lowering of the water tables in the aquifers in Burkina Faso (Figure 30).
Unsustainable exploitation of fish
2.4*
1.9
1.8
1.4
2.1
3
Overexploitation
2.4
Increased diversion, including damming, hydropower generation,
Excessive by-catch and discards
0
Destructive fishing practices
2.4
domestic/industrial water supply, agricultural production based on
Decreased viability of stock
0
irrigation, livestock watering and aquaculture account for about 50-70%
Impact on biological and genetic diversity
0
of the modification of the stream flow in the Basin. Increased diversion
Global change
1.2*
1.4
1.0
1.0
1.0
5
and damming lead to increased evaporation from water bodies and
Changes in hydrological cycle
1.2
Sea level change
0
account for 30-50% of the stream flow modification.
Increased UV-B radiation
0
Changes in ocean CO source/sink function
0
2
* This value represents an average weighted score of the environmental issues associated
to the concern. For further details see Detailed scoring tables (Annex II).
** This value represents the overall score including environmental, socio-economic and
likely future impacts. For further details see Detailed scoring tables (Annex II).
*** Priority refers to the ranking of GIWA concerns.
T
C
P
A
Freshwater shortage
I
M
Environmental impacts
Observed rainfal data from 1902 to 2000 for the upper part of the
Volta Basin (Ouagadougou and Bobo Dioulasso in Burkina Faso) show
Figure 29 Evolution of annual flows of the Mouhoun (Black Volta)
a decreasing rainfall pattern over the last 40 years (Figure 28). Over the
at Boromo.
whole of Burkina Faso, a reduction in average annual rainfal by 14% was
(Source: MEE/DGH 2001)
60
GIWA REGIONAL ASSESSMENT 42 GUINEA CURRENT
ASSESSMENT
61
modification of stream flow was considered severe by the Volta Basin
team. The major environmental impact of lowering of the water tables
through excessive pumping is the drying up in the dry season of rivers
like Poni and Bougouriba in Burkina Faso and several springs that used
to flow perennial y. Such changes in flow patterns are expected to lead
to loss of biodiversity or at least modification of habitats.
Socio-economic impacts
The economic impacts of floods caused by increased diversion and
damming are loss of farmlands, roads and infrastructural facilities as
wel as reduction in agricultural output necessitating importation of
Figure 30 Piezometric curve at Kimidougou, Pesso Sources,
food, resettlement of affected communities, and migration to other
Aquifer GGQ, PZ5 northeast of Bobo-Dioulasso (Burkina
areas. Loss of land through inundation, resettlement and migration are
Faso).
assessed as moderate and of a permanent and irreversible nature.
(Source: Ouedraogo 2002, pers. comm.)
Excessive pumping from aquifers for domestic water supply, irrigation
The combination of large arid and semi-humid areas and the general
and abstractions needed to meet urbanisation requirements account
rainfal decline has caused water stresses in the socio-economic
for 60-80% of the lowering of the water table in the aquifers - particularly
development, that are mostly likely to increase in the future, as water
in the upper reaches of the Basin (UNEP/GEF/Volta Basin Project 2002c).
demands are increasing. Water stress has been described by the Water
It is estimated that there are about 600 dams and man-made lakes in
Stress Index (Falkenmark & Lindh 1974) and the Volta Basin is below
the Basin with a total storage capacity of 4.7 km3.
the critical value of 1 700 m3 annual flow per capita. The seriousness is
further compounded by the very limited low flows in the dry season.
The environmental issues associated with modification of stream flow
through increased diversion and evaporation are inundation of lands
The health impacts are water-related diseases associated mainly with
with the attendant loss of biodiversity, flooding, and lack or shortage
construction of dams. In respect of the Akosombo dam, pre-dam
of water for domestic/industrial use at some locations within the Basin.
prevalence rate of urinary schistosomiasis was 5% among school
Construction of Akosombo, Kpong, Ziga and Kompienga dams, mainly
children compared to a post-dam rate of 90% for the period 1964 to
for hydropower generation, several dams for irrigation, and potable
1997. As of 1997, the gross prevalence rate in the lower basin stood
water supply schemes for big cities like Ouagadougou, Bobo Dioulasso
at 50% (Derban 1999). The health impacts associated with lowering
and Tamale, contribute to the increased diversion and evaporation in
of water table are due to the scarcity of clean potable water forcing
the Basin.
inhabitants to seek other sources of water, which may be pol uted
or infected causing health risks (elaborated under the section on
In the coastal area of the Basin, regulated flows from the Akosombo
Pollution). Loss of medicinal plants from inundation and loss of habitat
Dam have altered the flow regime of the Volta River in the estuarine
has also occurred.
portion, resulting in the loss of the "flushing" effect of the natural flow
and causing a reduction in sediment discharge to the coastline. The
Due to inundation of vast areas after the construction of dams
combined effect of loss of the flushing effect and the reduction in
such as Akosombo, Ziga, and Kompienga, there was a loss of roads,
sediment discharge has contributed to coastal erosion experienced
infrastructural facilities and traditional sites such as sacred groves,
in the coastal areas of the Basin. Coastal erosion, in turn, has led to
cemeteries and religious grounds. Lands that served as communal
other environmental impacts such as loss of marine biodiversity. Other
bonds were also lost. Such loss of land has led to migration and the
environmental impacts caused by regulation of the Akosombo Dam
springing up of 1 500 communities along the shores of Lake Volta.
are proliferation of aquatic weeds, high incidence of bilharzia and
The activities of these communities have a negative impact on the
col apse of fisheries for certain species such as the freshwater clam
environment (Yeboah 1999, UNEP/GEF/Volta Basin Project 2002c).
Egeria radiata in the Lower Volta downstream of the Akosombo dam.
Between 1962 and 1963 alone 20 000 people migrated from the
The overall environmental impact of freshwater shortage in the Basin
lower basin upstream (Geker 1999). Such migration has affected social
was assessed as moderate, whereas the environmental effect of the
relationships and in some cases caused conflict in land-water use.
62
GIWA REGIONAL ASSESSMENT 42 GUINEA CURRENT
ASSESSMENT
63
T
Conclusions and future outlook
C
P
A
Pollution
I
M
Until 2025, the total consumptive water demand for the Basin represents
20% of the surface water available in the entire Basin (UNEP/GEF/
The major problems associated with pol ution in the Volta Basin are
Volta Basin Project 2002a). However, taking into account the uneven
microbiological waste generation and its attendant health risks, solid
distribution of freshwater in the Basin (geographical y and over the
wastes of both domestic and industrial origin, eutrophication due
year) and the trends of rainfal and run-off, groundwater recharge is
to nutrient load, run-off of agro-chemicals into the River, and loss of
of great concern.
potable water due to high levels of suspended solids.
Freshwater shortage under present conditions is considered to have
Environmental impacts
moderate environmental impacts and is expected to deteriorate over
Available data or information within the Volta Basin identifies water
the next 20 years. The perceived deterioration wil be mainly due to
pollution as an important concern. Water pollution is caused mainly by
modification of stream flow and, to a lesser extent, pollution of existing
anthropogenic activities from either point or diffused sources. These
supplies and changes in the water table. Development requirements,
include solid waste from municipal waste and sewage-related debris;
such as the need for construction of more dams for irrigation, potable
microbiological contamination resulting from discharge of untreated
water and hydropower generation wil exert severer environmental
effluents from industrial and domestic activities; and bacteria carried
impacts. Over the next 20 years, pol ution of existing supplies is
by run-off from land-based sources.
expected to contribute to shortage of freshwater as more areas
become urbanised, more lands are put under cultivation and livestock
The environmental impact from microbiological pol ution in the region
breeding increases. The contribution from changes in the water table
was generally considered to be slight although localised occurrences
to freshwater shortage is not expected to worsen considerably by 2020.
of high microbiological pol ution exist in areas on the Kara River and
With better awareness of the adverse effects of excessive pumping or
the cities of Ouagadougou and Bobo Dioulasso (UNEP/GEF/Volta
abstraction, aquifer depths are not expected to increase further. The
Basin Project 2002c). Microbiological pollution arises mainly from poor
same awareness is expected to prevent salinisation or intrusion into
sanitation practices and facilities in communities living close to the
aquifers in the coastal areas of the Basin.
catchment area.
Given a high population growth rate of 2.54% in the Basin, future
The urban population continues to grow at 5 to 7% per year without the
economic impacts of freshwater shortage are expected to continue
corresponding provision or expansion of sanitary facilities. In big cities
to be moderate despite remedial measures that may be put in place.
like Ouagadougou, large portions of the population have no access to
Increased utilisation of freshwater to meet the needs of socio-economic
decent toilet facilities (MEE/DGH 2001). In some cases, water bodies
development in areas such as agriculture, hydropower generation
and the sea have been used as the receiving or disposal medium for
and potable water for domestic and industrial uses wil account for
untreated sewage. In the few cases where treatment plants exist, they
moderate economic impacts in 2020.
are either non-functional or poorly managed (UNEP/GEF/Volta Basin
Project 2002b, EPA Ghana 2000). During the dry season, surface waters in
Shortage of freshwater is expected to bring about moderate health
areas of high livestock population density tend to be visibly eutrophied.
impacts in some communities in the Basin. Due to projected high
Data on chlorophyl levels are however not available. In the rainy season,
population in the Basin by 2020, increased diversion and construction
eutrophication is general y not visible as a result of dilution from larger
of dams will occur. Furthermore, water supplies are likely to deteriorate.
volumes of run-off, but could nevertheless be present in localised areas
This wil lead to higher incidence of water-borne and water-related
due to the high nutrient levels during rainy seasons caused by run-off
diseases such as bilharzia, guinea worm infestation, cholera, typhoid
from agricultural land.
and malaria.
Impacts from chemical pol ution are not appreciable because of the
low level of industrial activities. The economies of al the riparian
countries are based on agriculture and production of primary
commodities. However, agro-based chemical pol ution occurs on a
limited scale through the use of pesticides and other agro-chemicals.
The environmental impact of suspended solids was assessed as slight
62
GIWA REGIONAL ASSESSMENT 42 GUINEA CURRENT
ASSESSMENT
63
for the major rivers in the region. Apart from a few locations such as in
of freshwater sources will increase the cost of water treatment, reduce
the Nakambe, Pouytenga and Ouagadougou dams, where suspended
aquaculture development and reduce income for tourism and other
solids (comprising mainly of soil material and silt) have severe impacts
recreational activities. Pol ution of freshwater wil also increase risks
on these reservoirs, total suspended solids are general y low.
to human health and raise the cost of human protection/medical
treatment. Water pollution will also increase the potential for conflicts
The impact of water pol ution in the Volta Basin was general y found
and recreational and aesthetic values of water will diminish.
to be slight to moderate. Issues like eutrophication, chemical pollution
and suspended solids are only seen to have a slight impact on the
environment mainly as a result of the relative limited geographic extent
T
C
of these issues, that rarely reach beyond the limits of point sources.
P
A
Habitat and community
I
M
There is no reported thermal or nuclear pollution in the Volta Basin.
modification
Socio-economic impacts
The present state indicates slight economic impact. The current state
The environmental, socio-economic and health impacts of Habitat and
of microbiological and solid waste pollution within the Basin has very
community modification under present conditions were each assessed
little direct constraints on economic activities, which is predominantly
to be moderate in the Volta Basin. It was found to be strongly linked to
agrarian. However, economic losses are reflected in the relatively high
modification of stream flow, il egal methods of resource exploitation,
cost of treating and delivering potable water, and reduced productivity
and pol ution due to high nutrient loading from urban activities and
due to morbidity from water-borne diseases. Any limitation imposed
livestock.
on economic activities by water pollution is mainly through the effect
on public health. In general, pol ution under present conditions was
Environmental impacts
considered to have a slight environmental impact.
Community and habitat modification has been triggered primarily by
the creation of several dams and impoundments within the Basin. Over
The impact of pol ution on health was assessed to be negative,
650 dams currently exist in the Sudano-Sahelian portions of the Basin
manifesting itself through diseases such as diarrhoea of which the
alone, and provide water for irrigation, domestic industrial supplies and
prevalence rate is about 30% (Ghana Statistical Service 2001).
hydropower generation (UNEP/GEF/Volta Basin Project 2002a).
Conclusions and future outlook
The development has brought about loss of marshes, flood plains,
In the view of the Volta Basin team, it is perceived that the impact of
proliferation of waterweeds as well as modification of wetlands. In the
pollution on the environment will deteriorate by the year 2020, mainly
Volta estuary, several hectares of mangrove strands have either been
due to increased urban activities. With increasing populations and the
cut for fuel wood or removed to make way for saltpan construction.
attendant demand for increased agricultural production, increased
Associated with these are changes in biodiversity composition and
generation of solid, municipal and industrial wastes and competing
abundance. For example, nearly 70% of the fish fauna has changed
demand for natural resources, it is likely that, in the next 20 years, the
since 1969, partly due to habitat modification (Braimah 2001).
factors listed above wil stil prevail. The increased waste generation will
therefore worsen the present problem of pollution.
Socio-economic impacts
Economic impacts include loss of over 120 000 USD worth of agriculture
Pollution could in the future lead to unavailability of potable water. The
production per year (Gordon 1999) as wel as col apse of the shrimp and
present state indicates impacts to be moderate. This state is however
jack mackerel fishery on the Volta estuary, and significant reduction in
expected to deteriorate resulting in severe impacts by year 2020.
the once vibrant freshwater clam fishery (Lawson & Kwei 1974). Another
Increased population growth, uncontrol ed urbanisation and livestock
important factor is the extensive migration of mainly men from the
production with inefficient water management and weak compliance
Lower Volta into the more productive lacustrine areas. This leads to a
enforcement and general indiscipline could aggravate the present
high number of female-headed households (GEF/UNEP/EPA 2002). The
situation.
migration again has the potential to lead to user group conflicts in the
areas receiving the migrants, an effect that is further worsened by the
The present state indicates a slight economic impact. This is however
growing original populations.
expected to increase to more severe levels in the future since pollution
64
GIWA REGIONAL ASSESSMENT 42 GUINEA CURRENT
ASSESSMENT
65
Conclusions and future outlook
user groups and intergenerational inequity. The impact is assessed to
Migration of human male population from the Lower Volta to the Lake
be slight.
region is expected to continue. However, only a few major dams are
expected to be constructed within the next two decades. Therefore,
Conclusions and future outlook
the overall future impact of community modification and habitat loss
The present state indicates environmental impacts to be moderate.
is expected to be reduced, although degradation of mangroves and
However, this state is expected to deteriorate resulting in severe impacts
beach erosion is expected to continue.
by 2020. Higher demands for fish, increased use of destructive fishing
practices and weaknesses in compliance enforcement are expected to
offset gains from aquaculture.
T
C
P
A
Unsustainable exploitation of
I
M
The present state indicates moderate economic impacts in the Volta
fish and other living resources
Basin. This state is expected to deteriorate in the future, resulting in
severe impacts. Reduced earning and economic returns from fisheries
Data covering fish catches and import/export statistics is found in
and tourism through the decimation of juveniles and gravid fish, leading
Tables 33 to 35.
to loss of livelihoods, would cause this.
Environmental impacts
The present state indicates health impacts to be low. However, this
Unsustainable exploitation of fish and other living resources is confined
is expected to deteriorate as a result of reduction in food sources,
to the lacustrine portions and the coastal deltaic zone of the Volta River.
particularly sources of protein with adverse human health impacts
The lacustrine portions are represented by the dammed reservoirs in
such as stunted growth among children.
Burkina Faso (including Kompienga, Bagré, Loumbila, Ziga and Toece)
and Lake Volta (Akosombo and Kpong) in Ghana. At the coastal zone, the
The current state could be described as low in other social and
hotspots occur between Sogakope and Ada, and the Keta Lagoon.
community impacts. This is, however, expected to deteriorate to
moderate levels by 2020. Effects include intergenerational conflicts
The environmental issues of overexploitation and destructive fishing
between resource user-groups for shared resources, which may result
practices are assessed as moderate manifested as fol ows:
in migrations.
Use of bamboo to trap gravid fish (Braimah 2001);
Introduction of active gear and small mesh size (Braimah 2001);
Landings exceeding sustainable maximum yield (Braimah 2001,
GEF/UNEP 2002, GEF/UNEP/EPA 2002);
Use of toxic chemicals in fish captures.
Socio-economic impacts
The economic impacts identified are loss of fish stocks leading to
intergenerational inequity and low returns from fishing leading to loss
of employment (Braimah 2001). The impact is assessed to be moderate.
This is interpreted to mean the impact is of medium severity, frequent
in duration and affects a large number of persons.
The health impacts assessed are perceived as moderate due to the high
level of pesticides in fish and poor nutrition especial y among children
resulting from low fish catch.
The social and community impacts identified are high number of
female-headed households resulting from migration of the men to the
lacustrine productive areas (GEF/UNEP/EPA 2002) and conflict between
64
GIWA REGIONAL ASSESSMENT 42 GUINEA CURRENT
ASSESSMENT
65
Niger Basin
Table 27 Scoring table for Niger Basin.
Assessment of GIWA concerns and issues according
The arrow indicates the likely
to scoring criteria (see Methodology chapter)
direction of future changes.
T
T
C
C
Increased impact
P
A 0 No known impacts
P
A 2 Moderate impacts
I
M
I
M
T
T
No changes
C
C
P
A 1 Slight impacts
P
A 3 Severe impacts
I
M
I
M
Decreased impact
Figure 31 Average rainfall in the Niger Basin in 1950-1967 and
1968-1995 depicting the southwards move of isohyets.
p
a
c
t
s
u
n
i
t
y
(Source: NBA HydroNiger)
Niger Basin
e
n
t
a
l
m
p
a
c
t
s
m
i
c i
m
c
o
r
e
*
*
o
m
recent studies (NBA, HydroNiger) have reported a signifi cant decline
p
a
c
t
s
p
a
c
t
s
E
n
v
i
r
o
n
m
i
m
E
c
o
n
o
m
H
e
a
l
t
h i
O
t
h
e
r c
i
m
O
v
e
r
a
l
l S
P
r
i
o
r
i
t
y
*
*
*
in rainfal in the region since the late 1960s. For almost 30 years, the
Freshwater shortage
1.9*
2.0
2.0
2.0
2.5
2
Sahel has been experiencing persistent drought which has led to a
Modification of stream flow
2
reduction of approximately 37% of average rainfall supply (1974-1994)
Pol ution of existing supplies
2
to the Niger River, as compared to the record period of 1907-1973 (NBA
Changes in the water table
2
- HydroNiger).
Pollution
1.7*
1.9
1.9
1.9
2.3
4
Microbiological pol ution
1
Eutrophication
1
The continued reduction of the renewable water resources of the Niger
Chemical
2
River and its tributaries is due to natural drought due to changes in
Suspended solids
1
Solid waste
1
hydrological cycle (Figures 31 and 32) and human factors. The human
Thermal
0
factors are notably overuse/misuse of water resources, excessive
Radionuclide
0
pumping of groundwater, pollution, removal of vegetation cover from
Spil s
3
land surfaces, massive deforestation, and evaporation (reservoirs with
Habitat and community modification
2.7*
2.2
2.2
2.2
2.7
1
Loss of ecosystems
2
large surface areas lose a large amount of water due to evaporation).
Modification of ecosystems
3
Unsustainable exploitation of fish
2.0*
1.7
1.7
1.7
2.3
3
For almost 30 years, Sahel has endured a preponderance of dry years
Overexploitation
2
with persistent drought, which has led to:
Excessive by-catch and discards
0
Destructive fishing practices
3
A decrease of about 37% of average fl ows of the Niger River for
Decreased viability of stock
0
the period 1974-1994 in comparison to the period 1907-1973 (NBA
Impact on biological and genetic diversity
2
- HydroNiger);
Global change
0.4*
0.4
5
A decrease of water table fl ows in the alluvial aquifers resulting in
Changes in hydrological cycle
1.5
Sea level change
0
a decrease of base fl ows;
Increased UV-B radiation
0
Changes in ocean CO source/sink function
0
2
* This value represents an average weighted score of the environmental issues associated
to the concern. For further details see Detailed scoring tables (Annex II).
** This value represents the overall score including environmental, socio-economic and
likely future impacts. For further details see Detailed scoring tables (Annex II).
*** Priority refers to the ranking of GIWA concerns.
Blank = no data..
T
C
P
A
Freshwater shortage
I
M
Environmental impacts
For the past three decades the Sahel area, in which the largest part of
the Niger Basin is located, has been experiencing persistent drought
Figure 32 Variability of annual rainfal in the Niger Basin 1950-2002.
caused by in drastical y changed annual rainfal patterns and a
Deviation from the mean at the Niamey station.
southward shift of rainfall zones by 100 km (Figures 5, 6 and 31). Several
(Source: NBA HydroNiger)
66
GIWA REGIONAL ASSESSMENT 42 GUINEA CURRENT
ASSESSMENT
67
in determining the availability of water resources. Water scarcity arises
as a result of diminishing precipitation, reduction in river flows, falling
water tables, and an increase in the amount of evapotranspiration
(Figures 33 and 34).
Both issues, modification of stream flow and changes in the water
table, are considered relevant while the first is more critical, leading
to water scarcity in some cases. The main environmental impacts of
these issues are:
Reduced vegetation cover with modification of riparian habitats;
Figure 33 Variability of mean annual discharge in the Niger River
Reduction in stream flows and decreased capacity of sediment
1950-2002. Deviation from the mean at the Niamey
transport;
station.
Water quality changes due to reduced dilution capacity of water
(Source: NBA HydroNiger)
bodies, causing pollution of existing supplies;
A decrease of the transportation capacity of suspended solids due
Reduced wetland areas;
to severely low flows;
Reduced groundwater recharge and reduced aquifer capacity;
A reduction of the capacity of sediment transportation caused
Depletion of fish stocks and species diversity;
by reduced water levels, while air, mechanical and hydraulic
Increased soil erosion;
erosion has been accentuated due to desertification of slopes
Risk of cessation of the flow during low water periods;
and degradation of banks resulting from the combined pressure
Silting due to erosion and invasion of aquatic weeds.
of humans and animals. This process has the effect of accrued
siltation of the affluents and the main river.
Socio-economic impacts
The most important socio-economic impacts of freshwater shortage
In the coastal area, a major issue associated with this concern is
in the Niger Basin are loss of agricultural land, reduced agricultural
modification of stream flow as a result of human interventions on a
productivity, and loss of hydroelectric power production.
local/regional scale. In this particular case, the major indices are change
in the occurrence of exceptional discharges (e.g. due to damming) and
Statistics show that the impact on human health remains slight to
to a lesser extent measurable changes in the annual mean salinity of
moderate and limited to a few locations in the Basin. In the long-term
estuaries or coastal lagoons and/or change in the mean position of
however, it was realised that the cases of human health problems will
estuarine salt wedge or mixing zone.
occur on a regular basis.
The reduction in precipitation, which is perceived - to some extent -
In addition to the above impacts, the modification of the River Niger and
to result from changes in the region's climate, thus plays a critical role
its affluents has col ateral effects on communities and on the riverside
Figure 34 Evolution of the monthly discharge of the Niger River. Comparison of three periods in Niamey and Koulikoro.
(Source: NBA-HydroNiger)
66
GIWA REGIONAL ASSESSMENT 42 GUINEA CURRENT
ASSESSMENT
67
T
C
states. The two most important impacts to be taken into consideration
P
A
Pollution
I
M
are population migration and transboundary implications.
The present economic impacts associated with the issues were assessed
Environmental impacts
as moderate.
The issue of pol ution is reflected by the changes in water quality of
the surface water and the groundwater of the aquifers located near
Conclusions and future outlook
irrigated perimeters, mining sites and human settlements. The origin
West Africa's urbanisation rate is expected to reach 65% by 2025, and
of this pollution is:
individuals living in rural areas wil have to produce enough food to
From oil spil s relating to the production and refining of oil products
meet their own needs and those of the growing urban population. In
in the Niger delta;
order to meet food demand, crop yields will have to increase through
From agriculture with the dumping and run-off or percolation of
both the intensification of farming and the expansion of irrigated
fertilisers and pesticides used in irrigated perimeters and gardens
areas.
towards the River and aquifers;
From industries as most of the factories are general y located next
Consequences of the environmental degradation will be felt more for
to the River to enable transportation and waste disposal via the
all issues related to Freshwater shortage. The present situation indicates
River;
impacts to be moderate. However, this state is expected to deteriorate
From mining, mainly in the Upper Niger in Mali and Guinea, where
resulting in severe impacts by 2020. If the current trends continue until
the treatment of ore involves chemicals that in some instances
the year 2020, the estimated problems are foreseen as a worsening of
contaminate the surface waters;
the environmental impacts due to increased potential for upstream/
From cities because of the deficiency of water supply and sanitation
downstream conflicts and between sectors, and the loss of habitats
systems since most of the urban centres are mainly situated along
thus increasing the risk of endangered species.
the River. General y, the communities do their washing, their
bathing and other domestic work near the banks of the River; the
The consequences of the economic impact wil be more acute. The
dyeing of clothes is relatively developed along watercourses and is
present situation indicates impacts to be moderate. This state is
also a source of important pol ution, particularly in the Upper Niger
expected to deteriorate in the future resulting in moderate to severe
near Bamako in Mali.
impacts by 2020. Results of the assessment show that all the concerns
wil increase, so this means deterioration in comparison with the
Oil spil s lead to the formation of large quantities of tarbal s that cause
current situation. If the current trends continue until the year 2020, the
pol ution in the marine environment. Direct oil pol ution has been
estimated problems are foreseen as fol ows:
observed in the Bay of Biaffra, Nigeria. The IPA Nigeria National Report
Reduction in future land use options;
gives the number of oil spil s between 1976 and 1996 as 4 835 resulting
Increased costs of alternative water supplies;
in the spil age of nearly 2.5 mil ion barrels of oil. The environmental
An increase in the costs of protecting the health of human and
impact of this pol ution is mainly groundwater pol ution, biodiversity
animal populations;
loss due to degradation of feeding grounds and nesting places and
Loss of water supply and consequently greater risks for the health
loss or degradation of freshwater resources. These impacts are assessed
of human and animal populations;
to have large effects on the coastal areas of the Basin, ranking higher
The attraction of rural populations towards cities wil lead to a
than chemical pol ution (moderate), eutrophication, solid waste and
major increase in urbanisation. Urbanisation also leads to greater
microbiological (slight).
consumption per capita. Global Water Partnership (GWP) estimates
that by 2025, per capita water consumption wil be 100 l/day in
There is no reported thermal or nuclear pollution in the Niger Basin.
cities (50 l/day in rural areas), including both domestic and industrial
needs, the latter of which goes hand in hand with development.
Socio-economic impacts
The impacts relating to the eutrophication of water bodies relate
to proliferation of aquatic plants, water quality degradation and
to the consequences for human and animal health. Deteriorating
environmental quality results in loss of viability of fisheries upon which
the livelihood of several communities in the region depends.
68
GIWA REGIONAL ASSESSMENT 42 GUINEA CURRENT
ASSESSMENT
69
The most important social and economic impacts found are
The acute problems relating to this concern are erosion, loss of lands and
modification of the value of fisheries, fish kil s resulting in abandonment
vegetation cover, land degradation of banks, formation of sandbanks
of fishing grounds and associated livelihood, reduction of options for
in the riverbed, rivers and waterways, and loss of biodiversity. These
other uses of freshwater, and competition for dwindling fisheries
problems result in significant losses and modifications of the Basin's
resources which could also lead to social strife.
aquatic ecosystems. The environmental impacts of these issues were each
assessed to be high. Habitat and community modification was triggered
In conclusion, most of the socio-economic impacts due to pol ution
primarily by desertification and severe droughts, and compounded
under present conditions are not considered to be critical. Pol ution has
by disturbances due to human activities such as large-scale hydraulic
moderate impacts except for health, hygiene and sanitation including
infrastructures and unsustainable exploitation of natural resources.
costs of medical treatment, costs of cleaning, costs of preventive
measures, increased risks to human health and loss of water supply
The Inner delta zone is made up of a mosaic of biotopes enduring
(e.g. drinking water). When assessing the societal costs of oil spil s one
strong seasonal inter-annual variations, which confers to the zone
has to bear in mind the huge economic dependence on the oil industry
an exceptional aquatic productivity. Therefore, fishing activities are
that sustains the economy of Nigeria with a dependence margin that
hindered by silting, proliferation of aquatic weeds such as water hyacinth
is greater than 70%.
(Eichhornia crassipes) and reeds (Typha australis). It is an important area
for several millions of birds from Europe, Asia and Africa and the second
Conclusions and future outlook
most important wetland in Africa. The Mali government has established
The future outlook as evaluated by the Niger Basin team regarding the
three protected sites under the Ramsar Wetland Convention.
environmental and economic impacts of pollution yields the fol owing
perspectives:
In addition, the Inner delta provides pasture to more than three
Wastewater from urban areas wil not be adequately treated and
millions of cattle during the dry season in the bourgou-fields
wil continue to be dumped into the River, causing increasing
(Echinochloa stignina). These cattle come from Mali, Mauritania and
concentrations of nutrients aggravating the existing eutrophication.
Burkina Faso, giving the Inner delta international importance during
Industries and mining activities wil continue to expand as a
the dry season.
consequence of the increasing population and are likely to
continue their discharge of effluents.
A river water level decrease of 30 cm (measured at Mopti) corresponds
to a reduction of 50% of the surface of the floodplain. This portion of
Results of the assessment of future conditions by the Niger Basin team
the Basin has undergone considerable development and the World
show that al these concerns wil remain at constant levels or have
Conservation Union (IUCN) believes that this highly productive
increasing effects compared to the present situation. The scores vary
ecosystem is threatened by non-sustainable development. The
from moderate to severe.
major threats to the Inner delta integrity are: recurrent droughts,
which reduce the importance and duration of the high water period;
sedimentation, which prevents flooding of several lakes located in the
north; and overexploitation of the vegetal cover by pressure from the
T
C
P
A
Habitat and community
I
M
population.
modification
In the coastal zone (Niger delta in Nigeria) the mangrove vegetation
Environmental impacts
provides sanctuaries, breeding and nursery grounds for many
The whole Niger Basin is affected at various levels by erosion,
commercial species of fish and shel fish and contributes significantly
degradation of banks and by silting, phenomena that global y threaten
to the biodiversity of the Niger delta. Natural habitat modification
the river flows, watercourses and ecosystems.
processes including erosion and sedimentation due to wave action
and strong littoral transport have contributed to the habitat loss
However, degradation is not uniform in the whole Basin. The situation
in the area. Human activities, notably settlement development,
is particularly critical in the north (Sahel and sub-Saharan zones) where
through sand extraction, exploration and exploitation of petroleum
there is an alarming progress of desertification, constituting a major risk
hydrocarbon, port construction, dredging, mangrove deforestation,
of siltation of val eys and ponds.
and alterations in flow regimes from dam construction (for irrigation
68
GIWA REGIONAL ASSESSMENT 42 GUINEA CURRENT
ASSESSMENT
69
and power generation) have exacerbated the degree of loss (UNEP
thus contributing to a degradation of the vegetation cover and soil
1989). A principal component of the landscape, which has suffered and
erosion in the exploitation areas.
wil suffer from habitat modification are the mangrove communities.
De-structuring of cattle breeding transhumance circuits leading to
Various surveys have revealed a degree of degradation of up to 33%
exploitation of the sensitive areas likely to be degraded and to the
in the Niger delta.
increase in the demand for access to al uvial plain resources, leading
to a competition for agricultural land.
Both environmental issues, loss and modification of ecosystems or
Necessity to maintain the functions of the ecosystems. This means
ecotones, are considered relevant while the latter is more important.
that in the water equation, as far as demand is concerned, one
Due to lack of information/knowledge or gaps in data col ected over
should not forget the needs for the maintenance of essential
the years, it is quite difficult to accurately quantify or determine the
functions of the aquatic ecosystems. It is not simply a matter
extent of change in community structure and/or species composition.
of nature conservation, but an acknowledgement that natural
The main environmental impacts of these issues are:
ecosystems provide "services", in addition to the provision of usable
Loss/modification of natural productivity: high rate of water body
resources.
siltation associated with high rate of erosion;
In the Sahel zone progress of desertification, major risks of drying
Loss of natural protection from erosion: loss of vegetation cover and
up of rivers and waterways and rapid drying up of ponds.
reduced water infiltration into soil and aquifers;
Loss/modification of habitats and of biodiversity;
Consequences of the economic imbalances wil likely be more acute
Impacts of estuarine system changes;
in the future. Economic impacts associated with the issues, show
Changes in ecosystem stability.
deterioration from moderate to severe. The deterioration is expected
to derive from the increase in population pressures and bad farming
Socio-economic impacts
practices, which wil lead to increase in erosion and silting of water
Three economic impacts are to be considered in the Niger Basin: costs
bodies and aquatic ecosystems. If the current trends proceed until
of restoration of modified ecosystems (severe); loss of land due to loss
the year 2020, the estimated problems are increases in the costs of
of physical protection (severe); and reduced capacity to meet basic
restoration of degraded ecosystems and of protecting the health of
human needs for local populations (moderate). The most important
human and animal populations.
health impact to be taken into consideration is reduced capacity to
meet the basic human needs of the local populations.
T
C
The other social and community impacts (moderate) to be taken into
P
A
Unsustainable exploitation of
I
M
consideration are: human conflicts, national and international; changes
fish and other living resources
in job opportunities for local populations; changes associated to social
structures; and loss of educational and scientific values.
Data covering fish catches and import/export statistics is found in
Tables 33 to 35.
Conclusions and future outlook
The present state indicates environmental impacts in the Niger
Environmental impacts
Basin to be moderate to severe. However, this state is expected to
Disturbances to the flow regime, competition with other economic
detetiorate resulting in severe impacts by 2020. Higher demands for
sectors and the pressure of overfishing has resulted in a reduction
fish, increased use of destructive fishing practices and insufficient
of fish resources and the near disappearance of certain species. The
enforcement of regulations are expected to offset gains from
use of inappropriate fishing techniques has a negative effect on the
aquaculture. If the current trends proceed until the year 2020, the
environment in the Niger Basin. The most serious inter-sectoral conflicts
estimated problems are foreseen as a worsening of the environmental
are those between the fishing, agriculture and energy sectors.
impacts as described as fol ows:
The reduction of other options for water use, the loss of refuge for
Both issues, overexploitation and destructive fishing practices are
fauna thus increasing the risk of endangered species.
considered relevant while the latter is more critical leading to a drastic
An increase of the urban population and a high demand for energy,
reduction of the size of catches and a possible loss of the fish biodiversity.
which is general y met through the use of wood and wood charcoal,
The examination of catches made by the Inner delta fishermen (Mali)
70
GIWA REGIONAL ASSESSMENT 42 GUINEA CURRENT
ASSESSMENT
71
showed that some formerly abundant fish species in this part of the
Consequences of the economic imbalances will be more acute in the
Niger River Basin are becoming rare. Some other species have not been
future. The present state indicates impacts to be slight to moderate. This
seen for some time now. The main environmental impacts of these
state is expected to deteriorate in the future, resulting in moderate to
issues are depletion of key species, increased vulnerability of protected
severe impacts by 2020. Results of the assessment show that the impact
species, changes to habitat and community structure (reduction and
of all issues will increase, so this means deterioration in comparison of
gradual degradation of fish habitat), and ecosystem degradation.
the current situation. If the current trends proceed until the year 2020,
the estimated problems are foreseen as fol ows:
The present impact of overexploitation and destructive fishing practices
An increase in the costs of protecting the health of human and
(which are considered the most significant of the major concerns) is
animal populations;
considered as moderate to severe.
Increased reduction in food sources (sources of protein) with
adverse human health effects;
Socio-economic impacts
Intergenerational conflicts for shared resources.
Reduced economic returns (and related considerations) engendered
by this concern and increased risks of predation, competition and/or
Economic impacts associated with the issues wil get worse, but not
disease for commercial y valuable species are considered the most
become severe.
critical socio-economic impacts. However, loss of employment/
livelihood and loss of protected species are slight to moderate
because the situation is thought to be less serious than that posed by
the environmental impact above. The overal appreciation suggests that
the situation is still redeemable.
Loss of food resources for human or animal consumption causes
reduction in nutrition. The implication for human health is considered
the most significant for this concern. However, the overall situation is
not considered to be severe. This is why the human health impact is
assessed as moderate.
The question of employment and the associated livelihood implications
(loss of employment and loss of income) is the most significant social
and community impact.
A decrease in fishing activities has been observed in many countries
in the Basin. The impacts of this major concern are very significant as
a large proportion of the population is affected. The fishery sector has
been suffering from reduced economic returns over the past three
decades and has led to loss of employment and conflicts between
artisanal and commercial large trawlers.
Conclusions and future outlook
Environmental problems will likely continue to increase. The present
state indicates moderate impacts. However, this state is expected to
deteriorate resulting in severe impacts by 2020. Higher demands for
fish, increased use of destructive fishing practices and insufficient
enforcement of regulations are expected to offset gains from aquaculture.
If the current trends proceed until the year 2020, the estimated problems
are foreseen as a worsening of environmental impacts.
70
GIWA REGIONAL ASSESSMENT 42 GUINEA CURRENT
ASSESSMENT
71
Congo Basin
However, the studies carried out within the framework of the FRIEND-
AOC3 Programme (Servat et al. 1998) show that important changes in the
hydrological cycles are observed in the north of Central Africa, in relation
to the general climatic evolution and the decrease of rainfal . The deficits
Table 28 Scoring table for Congo Basin.
in average flows have been recorded for all of the 103 catchments
Assessment of GIWA concerns and issues according
The arrow indicates the likely
to scoring criteria (see Methodology chapter)
direction of future changes.
studied in the frame of ICCARE4 Programme (ORSTOM5). The deficits are
T
T
C
C
Increased impact
P
A 0 No known impacts
P
A 2 Moderate impacts
I
M
I
M
very high in West Africa and exist in Central Africa. The deficit observed
T
T
No changes
C
C
P
A 1 Slight impacts
P
A 3 Severe impacts
I
M
I
M
Decreased impact
in sub-catchments of the Congo Basin range from 0 to 40%.
p
a
c
t
s
u
n
i
t
y
e
n
t
a
l
m
p
a
c
t
s
m
Moreover, modification of the river flow is seen in some places
Congo Basin
i
c i
m
c
o
r
e
*
*
o
m
in connection with human activities, for example damming and
p
a
c
t
s
p
a
c
t
s
E
n
v
i
r
o
n
m
i
m
E
c
o
n
o
m
H
e
a
l
t
h i
O
t
h
e
r c
i
m
O
v
e
r
a
l
l S
P
r
i
o
r
i
t
y
*
*
*
irrigation schemes. The major problem related to freshwater shortage
Freshwater shortage
1.5*
1.8
1.9
0.8
1.7
3
is the possible limitation of freshwater availability in the future, due to
Modification of stream flow
1
the increase of pollution (see paragraph on Pollution). This is the case
Pol ution of existing supplies
2
Changes in the water table
1
in some limited places around the larger urban centres located along
Pollution
2.4*
2.6
2.6
0.8
2.4 1
the rivers. Examples are Bangui at Oubangui, Kinshasa and Brazzavil e
Microbiological pol ution
2
for the Congo River and Bujumbura and Kigoma on Lake Tanganyika.
Eutrophication
3
Other places are located around mining plants, but the documentation
Chemical
2
Suspended solids
2
is very poor on this subject.
Solid waste
3
Thermal
0
Socio-economic impacts
Radionuclide
0
Spil s
2
Limited data is available on this subject, but freshwater shortage (even
Habitat and community modification
1.6*
0.4
0.4
0.4
1.1
4
though it is rare) forces the population to use contaminated water from
Loss of ecosystems
2
wells and rivers, resulting in people getting affected by water-borne
Modification of ecosystems
1
and water-related diseases e.g. malaria, typhoid, cholera and bilharzia.
Unsustainable exploitation of fish
2.8*
2.5
0
1.6
2.2 2
Overexploitation
3
General y for the equatorial zone, although local temporary water
Excessive by-catch and discards
2
Destructive fishing practices
2
shortages do occur, it must be stated that the socio-economic
Decreased viability of stock
1
problems are more closely related to poor water management than to
Impact on biological and genetic diversity
1
the actual availability of water.
Global change
1.0*
1.2
0.9
2.2
0.8
5
Changes in hydrological cycle
0
Sea level change
1
Conclusions and future outlook
Increased UV-B radiation
0
Freshwater shortage is expected to be maintained at a low level
Changes in ocean CO source/sink function
0
2
due to the fact that the majority of the countries of the Congo Basin
* This value represents an average weighted score of the environmental issues associated
to the concern. For further details see Detailed scoring tables (Annex II).
are located in the equatorial zone and wil continue to benefit from
** This value represents the overall score including environmental, socio-economic and
likely future impacts. For further details see Detailed scoring tables (Annex II).
abundant rainfal .
*** Priority refers to the ranking of GIWA concerns.
However, conflicts, movements of populations, the increase of the
population and the lack of sustainable technology in mining activities,
T
C
P
A
Freshwater shortage
I
M
can result in localised situations of freshwater shortage or situations
where people are pushed into situations where they have to use water
Environmental impacts
of poor quality. Much of the mining derived pollution will affect parts
Freshwater shortage is not considered to be an important concern in
of the Congo Basin for many years to come, and even if practices were
the Congo Basin. It is general y believed that there is only little variation
to be changed today into more sustainable patterns, much pol ution
of the flow in the rivers in the Congo Basin due to its location in the
would still be trapped in sediments and remain a potential danger for
equatorial humid zone, with constant rainfal .
public health.
72
GIWA REGIONAL ASSESSMENT 42 GUINEA CURRENT
ASSESSMENT
73
T
C
P
A
Pollution
I
M
everywhere in the Congo Basin and has a harmful effect on al areas
of human activity.
Environmental impacts
According to the Congo Basin team, the Pol ution concern in the Congo
More than 70% of the population (mostly urban) is suffering from
Basin is shared between the various issues as fol ows:
poor unhygienic living conditions, being exposed to various types
Solid waste (25%). Solid waste stems mainly from urban households,
of pol ution, while a large part of al diseases are linked to the
in all the urban areas along the Congo River.
environment.
Eutrophication (20%). The flat morphology of the coastal plains,
where most of the cities are situated favours stagnant surface
Social and societal effects do exist but are not always understood
waters where strong eutrophication can be observed in al wetlands
because of lack of specific data.
(proliferation of algae in the lakes, lagoons and river plains). The
environmental impact of eutrophication is assessed as severe.
Conclusions and future outlook
Spil s (15%). The majority of countries in the Basin are oil producers
In the Congo Basin most people live below the poverty line. Therefore
(Cameroon, Republic of the Congo, Gabon and Angola), and
there are insufficient financial and technological means combined with
have refineries, pipelines or storage facilities of petrochemicals
a lack of motivation to face the pollution problems. As the population
(DR Congo and Central African Republic). Moreover their coastlines
increases, problems wil become worse. Moreover, almost everywhere a
border the itineraries of tankers sailing to Europe and the Americas
tendency of inadequate legislation is seen, contempt for regulations and
some originating from the Far East. But this issue concerns more
lack of political wil to fight pol ution. Under these conditions, the trends
the Guinea Current LME than the Congo Basin. Al oil producing
of pollution evolution in the future are expected to be negative.
countries within the Basin have established units to survey and
protect the costs from hydrocarbon spills. The environmental
impact of spil s is assessed as moderate.
T
C
Microbiological (15%). The hot and humid climate of the Congo
P
A
Habitat and community
I
M
Basin supports rapid proliferation of microorganisms some causing
modification
occurrences of water-borne or water-related diseases (e.g. malaria,
typhus, cholera). The environmental impact of the microbiological
Environmental impacts
pollution is estimated to be moderate.
The loss of ecosystems or ecotones is estimated by the Congo Basin
Chemical waste (15%). Chemical waste from industrial, mining and
team to be 60% compared to the "undisturbed" situation. The eco-
agricultural activities (extensive use of pesticides and fertilisers for the
systems considered are lagoons, estuaries, tidal flats, lakes, swamps,
agro-industry often placed along the large waterways) in vulnerable
forests and other vegetated areas. A specifical y accelerated degradation
areas; mining reservoirs above wetlands; and wastes from hospitals,
of mangroves and exploited forests are impacted by pol ution and
industry and other activities in the urban areas. The environmental
overexploitation.
impact of the chemical pol ution is estimated to be moderate.
Suspended solids (10%). Because of the high rainfal , land
The modification of ecosystems or ecotones, including the community
morphology and soil erodability, the entire region experiences
structure or the species composition is evaluated at 40%. The mining
important sedimentation into its water bodies. An estimate
industry, the various types of construction work (infrastructure,
was made by the programme PIRAT GBF for the Congo River at
housing) have resulted in the destruction of habitats or the modification
Brazzavil e, which resulted in an estimate of 28-36 mil ion tonnes
of ecological niches specific to certain species, sometimes leading to
per year for the period 1987-1990. In respect to specific erosion this
the extinction of those species.
corresponds 8-10 tonnes/km2/year. The environmental impact of
sedimentation is estimated to be moderate.
Socio-economic impacts
There is no reported thermal or nuclear pollution in the Congo Basin.
The available data do not permit a proper assessment of the socio-
economic impact of this concern. However, in general it is considered
Socio-economic impacts
that the socio-economic impact of Habitat and community modification
Due to insufficient or non-existent waste treatment, lack of treatment
is insignificant in the Congo Basin.
facilities and poor legislation or waste regulation, pol ution is seen
3 Flow Regimes from International Experimental Network Data / Afrique de I'Ouest et Centrale. 4 Identification et Conséquences d'une variabilité du Climat en Afrique de I'Ouest non Sahélienne. 5 Ex-Office
de Recherche Scientifique et Technique pour le Développement (now IRD).
72
GIWA REGIONAL ASSESSMENT 42 GUINEA CURRENT
ASSESSMENT
73
Conclusions and future outlook
There is a lack of relevant data to support the assessment of the
Although negative at the moment, the future impacts are likely to
environmental impact of diminishing fish stocks (including biological
improve because of the efforts made by the countries to create or
and genetic diversity) due to pollution and diseases.
maintain protected areas and implement national environmental action
plans. Furthermore, due to the increasing stability in the countries of the
Socio-economic impacts
Congo Basin and with the aid of the international community, a series of
The economic impact of the chronic overexploitation of fish resources
development projects aiming at reducing future chemical pol ution and
and of mangroves (for smoke wood, fuel wood and building materials)
stabilising existing sediment trapped pollution have been initiated in
is the loss of resources and the need to turn to alternative and more
the Basin. Republic of the Congo is currently in the process of redefining
costly resources.
its national environmental regulations, setting new standards for the
exploitation of natural resources, mainly its forests and mineral deposits,
Due to the lack of knowledge, there is no proof that unsustainable
thus improving the state of the environment of the entire Basin. Paral el
exploitation of fish stocks and other living resources has a negative
to this, in Zambia, a large effort is currently being put into restoring
impact on human health, except in the particular case where people
the environment of the Zambian Copper Belt, al in al measures that
have consumed fish caught with toxic agents.
wil drastical y reduce the potential for future pol ution from primary
industry both in terms of siltation and chemical pol ution. Given that
Apart from the above effects, stagnation in the maritime fish production
the political situation continues on a path towards more stability, the
and the disappearance of certain commercial y important species from
future environmental and socio-economic impact of these concerns
the coastal zones is foreseen.
are likely to become less pronounced.
Conclusions and future outlook
Based on available data the main future concern for the Congo Basin
(including its coastline along the Guinea Current LME) wil be the
T
C
P
A
Unsustainable exploitation of
I
M
Unsustainable exploitation of fish and other living resources.
fish and other living resources
Data covering fish catches and import/export statistics is found in
Tables 33 to 35.
Environmental impacts
According to the Congo Basin team, the concern of unsustainable
exploitation of fish and other living resources in the Congo Basin is
shared between the various issues as fol ows:
Overexploitation (50%). Overexploitation of many species can be
observed throughout the region, due to an excessive increase in
fish catches as a result of growing demand for fish products and
income generation. This is further aggravated by inadequate
regulation and insufficient knowledge of the fishing zones.
By-catch and fish rejection (30%). Use of unsustainable fishing
practises (e.g. the use of nets with smal meshes) leads to large
unwanted catches that are later thrown back in the water (resource
waste).
Destructive fishing practises (15%). Fishing with toxic agents can
be observed in rivers, lakes and lagoons posing huge threats to the
sustained existence of species and to human health.
Other problems (5%).
74
GIWA REGIONAL ASSESSMENT 42 GUINEA CURRENT
ASSESSMENT
75
Guinea Current LME Microbiological pollution arises mainly from widespread and generaly
poor sanitation practices and facilities in communities living close to
estuaries, lagoons and other water bodies in big cities.
Table 29 Scoring table for Guinea Current LME.
In most coastal areas in the region, the rate of urban population
Assessment of GIWA concerns and issues according
The arrow indicates the likely
to scoring criteria (see Methodology chapter)
direction of future changes.
continues to grow without the corresponding provision or expansion of
T
T
C
C
Increased impact
P
A 0 No known impacts
P
A 2 Moderate impacts
I
M
I
M
sanitary facilities. In big cities like Abidjan, Accra, Lagos, Port Harcourt and
T
T
No changes
C
C
P
A 1 Slight impacts
P
A 3 Severe impacts
I
M
I
M
Decreased impact
Douala, large portions of the population have no or inadequate access
to decent toilet facilities. In some cases, the coastal waters have been
Guinea Current
p
a
c
t
s
u
n
i
t
y
e
n
t
a
l
m
p
a
c
t
s
m
used as receiving or disposal media for untreated sewage. In Abidjan
i
c i
m
c
o
r
e
*
*
o
m
for instance, 40% of the city's 3.5 million inhabitants are connected to
LME
p
a
c
t
s
p
a
c
t
s
E
n
v
i
r
o
n
m
i
m
E
c
o
n
o
m
H
e
a
l
t
h i
O
t
h
e
r c
i
m
O
v
e
r
a
l
l S
P
r
i
o
r
i
t
y
*
*
*
a sewer network, which discharges its sewage into the Ebrié Lagoon
Pollution
2.1*
2
2
2
2.5
1
without any treatment. Another 45% of the city's population are not
Microbiological pol ution
2
connected to any sewer system. Wastes from this fraction of the
Eutrophication
1
Chemical
1
population flow into the Lagoon either by surface drainage or disposal
Suspended solids
2
of night soil from pit latrines and septic tanks (Kouassi et al. 1995). This
Solid waste
3
state of affairs is found in other big cities as wel .
Thermal
1
Radionuclide
0
Spil s
2
Eutrophication, including harmful algal blooms, is considered to
Habitat and community modification
2.0*
2
1
2
1.4
3
have slight environmental impacts. Though there is evidence of
Loss of ecosystems
2
eutrophication in lagoons and certain coastal water bodies, the
Modification of ecosystems
2
incidence of this kind of pol ution is not widespread and tends to
Unsustainable exploitation of fish
2.0*
2
2
1.5
2.3
2
be episodic, lasting for a limited period. The cause of eutrophication
Overexploitation
3
Excessive by-catch and discards
2
is due to run-off from farming and deforested areas. There are
Destructive fishing practices
2
however instances of continuous and persistent sources and causes
Decreased viability of stock
0
Impact on biological and genetic diversity
0
of eutrophication in large coastal waters. Land-based activities such
Global change
0.3*
1
0
0
0.2
4
as uncontrol ed development, industrialisation, port development
Changes in hydrological cycle
0
and intense agro-chemical use have introduced fertilisers, pesticides,
Sea level change
1
garbage, sewage and industrial effluents into the Ebrié Lagoon and in
Increased UV-B radiation
0
the Ocean near Abidjan without any treatment. As a consequence, the
Changes in ocean CO source/sink function
0
2
* This value represents an average weighted score of the environmental issues associated
Ebrié Lagoon is undergoing eutrophication especial y in the bays where
to the concern. For further details see Detailed scoring tables (Annex II).
the flow of the Comoe does not have any effect.
** This value represents the overall score including environmental, socio-economic and
likely future impacts. For further details see Detailed scoring tables (Annex II).
*** Priority refers to the ranking of GIWA concerns.
Chemical pol ution is judged to have a slight impact. Although most
industries in the region are located in coastal areas, their contribution
to chemical pol ution is not appreciable because of the low level of
industrial activities. The economies of most countries in the region are
based on agriculture and production of raw materials for developed
T
C
P
A
Pollution
I
M
countries. Some chemical pol ution however enters the aquatic
environment through the use of pesticides, agro-chemicals and
Environmental impacts
industrial effluents (Table 30).
Environmental impacts from microbiological pol ution in Guinea
Current LME are considered to be moderate. Its limitation to localised
Pol ution from land-based sources, agrochemicals and the use of
areas around the big cities along the coast does not confer international
destructive fishing methods have been identified as factors that
importance. However, even if it is not an international issue, it remains a
adversely affect fishery resources in coastal lagoons and estuaries.
very important problem in terms of human health.
74
GIWA REGIONAL ASSESSMENT 42 GUINEA CURRENT
ASSESSMENT
75
Table 30 Typical levels of heavy metal pollution in some of the coastal lagoon systems in the Guinea Current LME.
Sample
Cadmium (Cd)
Chromium (Cr)
Copper (Cu)
Iron (Fe)
Mercury (Hg)
Manganese (Mn)
Lead (Pb)
Zinc (Zn)
Sediment (µg/g dry weight)
Lagos Lagoon, Nigeria
0.01-15.5
2.9-167
1.5-132
510-85 548
ND
98-2 757
0.4-483
7.8-831
Ebrié Lagoon, Côte d'Ivoire
ND
20.7-465
3.0-76.3
1.3-67.0
0.05-0.49
24.0-534
4.0-88.8
5.5-398
Aby Lagoon, Côte d'Ivoire
ND
ND
ND
ND
0.0-16.5
ND
ND
ND
Unpol uted sediments
0.2-5
ND
ND
ND
0.01-0.08
ND
8-60
ND
Water (mg/l)
Korle Lagoon, Ghana (median)
0.24
ND
0.31
ND
ND
ND
0.08
0.08
Lagos Lagoon, Nigeria (median)
0.002
ND
0.003
0.086
ND
0.021
0.009
Natural sea water levels
0.005
ND
0.003
ND
ND
ND
0.003
0.02
Shel fish (µg/g fresh weight)
Lagos Lagoon, Lagos (median)
0.18
ND
23.6
ND
ND
ND
5.1
240
Ebrié Lagoon, Côte d'Ivoire
0.35-0.95
ND
17.5-33.5
ND
0.07-0.19
ND
ND
608-2 115
WHO Guidelines
2
ND
30
ND
2
ND
2
1 000
Mercury (Hg)
Arsenic (As)
Selenium (Se)
Fish (µg/g fresh weight)
Aby Lagoon, Côte d'Ivoire
0.07-0.39
0.05-0.13
0.29-0.54
WHO Guidelines
50
ND
ND
Vegetal species (µg/g dry weight) e.g. Pistia stratiotes (Water lettuce)
Aby Lagoon, Côte d'Ivoire
0.82
7.42
4.40
Note: ND = No Data. (Source: Claon 1999)
In Abidjan, most existing industrial plants discharge their raw industrial
The environmental and socio-economic impacts from land-based
effluents into the Bietry Lagoon, a tributary of the Ebrié Lagoon, now
sources of pol ution in the region are of a transboundary nature as
(since 1951) part of the Comoe Basin. In the few cases where treatment
a result of the movement of the Guinea Current from west to east,
plants exist, they are either non-functional or poorly managed and
which transports pol utants along the coastal area from one country
uncontrol ed.
to another. For instance, the seasonal occurrence of algal blooms in
shoreline areas in the western region of Ghana, currently being studied,
Box 6
Transboundary pollution in the Aby-Bia-Tano river-lagoon-ocean system.
The coastal, lagoon and river system Aby-Bia-Tano is shared by Côte d'Ivoire and
Recent studies of water quality in the Aby Lagoon (and connected lagoons Ehy and
Ghana. Most of the lagoon system is located in Côte d'Ivoire, but the larger part of
Tendo) showed abnormal concentrations of mercury in fish (Claon 1999). Mercury
the two river basins is located in Ghana (Figure 35) and drains a region of intensive
is assumed to be released by the gold washers in Ghana and transported to the Aby
gold mining.
Lagoon by the Tano River. Moreover, deforestation and agriculture have resulted
· The Aby-Tendo-Ehy lagoons, with a total area of 424 km2, constitute the second
in erosion and nutrient enrichment of the water bodies, the latter creating signs of
lagoon system in Côte d'Ivoire, after the Ebrié Lagoon system. The Aby Lagoon
eutrophication.
constitutes the internal domain of an actual inverted delta. This domain is deep.
Since the Aby Lagoon has a permanent communication with the Ocean through the
The zones where the depth exceeds 5 m occupy 25% of the total area of the
Assinie outlet (Côte d'Ivoire), it is likely that the pollution of the Aby Lagoon also
Lagoon and represent 60% of the total volume. The salinity stays high throughout
impacts the coastal zone. However, at this time, there is no available data on water
the year (17 to 22 ). The Assinie outlet, with an average width of 300-500 m,
quality or fish quality for this section of the Gulf of Guinea seashore.
makes a permanent connection between the Lagoon and the Ocean.
The impact of the gold mines in the catchment of the Tano River result in serious
· The Bia River Basin lies approximately between 6°N to 7°18'N and 2°30'W to 3°12'W.
problems of spreading of toxic metals in the natural environment. The main
It takes its source in Ghana. Its total length is around 320 km with 190 km in Ghana
pollutant is mercury, but arsenic, cyanide and zinc are also present. Arsenic is used by
and 130 km in Côte d'Ivoire. The Bia has its mouth in Aby Lagoon, at the south of
industrial plants extracting diffuse gold from lateritic ore by leaching.
Aboisso. The Basin has a total area of 10 200 km2 split between Ghana (68.7%, 7 000
In terms of human health, the most important problem is the pollution of water
km2) and Côte d'Ivoire (31.3%, 3 200 km2). The Bia River represents around 29% of
bodies by the metals released by the gold mining plants in Ghana. This is potentially
the total water input of the Aby Lagoon. Pollution in this river is not documented.
the case in Côte d'Ivoire, if the exploitation of the Afema mine restarts, depending on
· The Tano River Basin lies between 5°00'N to 7°40'N and 1°48'W to 3°05'W. It takes
the increase of gold value on the global market.
its source from the Boyem mountain range, some 4 km from Techiman in the Brong
A project under preparation aims to solve this transboundary problem. The general
Ahafo region at an altitude of 518 m above sea level. The length in Ghana is 512 km.
goal is to establish a joint management framework of the Aby-Bia-Tano system
The total area of the catchment is around 15 000 km2 split between Côte d'Ivoire
by the two riparian countries. The project will be based on the ICARM concept,
(7%, 1 100 km2) and Ghana (93%, 14 877 km2). The last 100 km of the downstream
more precisely the FreshCo Partnership, linking Integrated Fresh Water Resources
part of the Tano River demarcates the boundary between Côte d'Ivoire and Ghana,
Management (IWRM) and Integrated Coastal Zone Management (ICZM)
before the River reaches the lagoon system of Aby-Tendo-Ehy.
(Source: UNEP/UCC Water 2003)
76
GIWA REGIONAL ASSESSMENT 42 GUINEA CURRENT
ASSESSMENT
77

is believed to originate in Côte d'Ivoire. It is assumed to be the same in
originate from urban areas and shipping lanes off shore. They come
the case of chemical pol ution, but the actual data do not al ow any
from both domestic and industrial sources, but due to the low level of
conclusion to be drawn for the time being.
industrialisation in countries of the region, domestic sources contribute
more to the pol ution. Lagos is estimated to generate 1.4 million tonnes
A particular case of chemical pol ution is the release of mercury and
of solid waste per year with a daily per capita average generation rate
arsenic by the gold mines in Ghana. The pol ution comes to Aby Lagoon
of 0.5 kg. The lack of adequate solid waste management facilities in
in Côte d'Ivoire through the Tano River (and possibly the Bia River). The
most big cities in the region is mainly responsible for pol ution from
Aby Lagoon discharges into the Atlantic through the outlet of Assinie
solid waste. For most countries, the only solid waste management
(an important tourist site) and the pol utants enter the marine
practised is removal to landfi l sites. This form of pol ution manifests
environment (Box 6). Afterwards, the pollutants are transported to the
itself in the widespread litter along beaches and the high frequency of
east (i.e. to Ghana) by the Guinea Current and literal y "come back to the
recovery of benthic litter during trawling. The litter consists mainly of
sender" as indicated by Figure 35.
plastics, cans and discarded bottles and less readily degradable forms
of household refuse. In the marine environment, solid waste causes
The environmental impact of suspended solids is considered to be
mortality to marine creatures, notably sea turtles, marine mammals and
moderate along the coast of the Guinea Current LME. In major rivers
sea birds. Their negative aesthetic impacts aff ect recreation and the
in the region, the impacts are manifested in soil loss from farms and
potential that tourism holds for some countries. The decay of organic
devegetated lands and the extensive siltation observed in lagoons and
solid wastes in water bodies contributes indirectly to eutrophication.
coastal water bodies. Although soil loss is considerable, much of the
Solid wastes also cause pol ution of groundwater sources through
silt is trapped upstream in dams and reservoirs constructed on rivers.
leachate from landfi ll sites.
Thus the impact of suspended solids in the coastal waters is reduced
to some extent.
The environmental impacts of spil s of contaminants and materials are
judged to be moderate. The main contribution to this form of pollution
Solid wastes exert a severe environmental impact across the entire
in the region is oil spil s from production points, loading and discharge
region. Solid wastes in the coastal and marine environment in the region
points and from shipping lanes. Tarball deposits observed on beaches
in the region are an indication of pol ution from oil spills. Direct oil
pol ution has been observed in the Bight of Biafra in oil-producing
Nigeria. The IPA, Nigeria National Report gives the number of oil
spills recorded between 1976 and 1996 as 4 835 resulting in the spill
of approximately 2.5 mil ion barrels of oil. As recently as 1998, 242 oil
spills were recorded. Other oil-producing countries such as Gabon
and Cameroon also contribute signifi cantly to the pol ution from oil
spills. Some negative impacts associated with oil spills include: mass
mortality and tainting of animals as wel as other aquatic resources;
abandonment of fi shing grounds and associated livelihood; loss of
biodiversity in breeding and nesting grounds; loss of potable and
industrial water sources; loss of recreational facilities and aesthetic
value of the environment; impairment of human health; the economic
burden of e.g. pol ution clean-up cost; population rehabilitation; and
contamination of groundwater (moreover the aquifers along the coast
being very thin, are particularly vulnerable to pollution).
Socio-economic impacts
In the city of Accra, the eff ect of pol ution on the Korle Lagoon is costing
the Government of Ghana nearly 65 million USD to restore the Lagoon
Figure 35 The destiny of pollution from gold mines: from Ghana
in an on-going project. A study in the Korle Lagoon catchment area
to Ghana via Côte d'Ivoire.
(Source: UCC-Water)
indicated that faecal and water-related diseases accounted for 20% of
76
GIWA REGIONAL ASSESSMENT 42 GUINEA CURRENT
ASSESSMENT
77
T
C
cases reported in the immediate catchment area of the Lagoon. Some
P
A
Habitat and community
I
M
of the diseases include cholera and typhoid. The cost of treatment of
modification
these diseases ranged from 10 to 50 USD per person depending on the
duration and intensity of the disease according to the Korle Lagoon
Environmental impacts
Ecological Restoration Project (Government of Ghana 2000).
The coastal area of the Guinea Current LME is general y low lying and
interspersed with marshes, lagoons and mangrove swamps. Nearly all
The impacts of pollution on human health are well known, but the lack
major cities, agricultural plantations, harbours, airports, industries as
of statistics in the region makes it difficult to establish the relationship
wel as other socio-economic infrastructures in countries bordering
between environmental factors and diseases (e.g. no geographical
the Guinea Current LME are located on or near the coast. UNEP (1999)
address, no control of water quality, no control of food quality). For the
subscribes the invasion of the area partly to richness of natural resources
moment, it is reasonable to consider that the degree of severity of the
and partly as a result of the history of early European contact.
health impact is moderate.
Approximately 47% of the GCLME's 248 mil ion people live in coastal areas
Other social and community impacts have not been identified.
(200 km) and are dependent on the resources therein (GIS analysis based
on ORNL 2003). Rapid expansion of coastal populations and population
Conclusions and future outlook
concentrations has resulted from high population growth and migratory
With increasing populations and the attendant demand for increased
movements between rural and urban areas (UNEP 1999).
industrial and mining production, and increased generation of solid
and liquid wastes, it is likely that, in the next 20 years, the factors listed
Two environmental issues were considered under this concern, the first
above wil stil prevail. The increased generation of wastes wil therefore
one being the ultimate stage of the second one: loss of ecosystems
worsen the present environmental impacts caused by pollution.
or ecotones this refers to complete destruction of aquatic habitats
measured as loss of known habitats; and modification of ecosystems or
The economic, human health, and social and community indicators
ecotones including community structure and/or species composition.
associated with pol ution are al expected to worsen from moderate
Due to lack of information/knowledge or gaps in data collected over the
impacts to severe impacts. For the economic indicator, the deterioration
years, it is quite difficult to accurately quantify or determine the extent
wil arise from loss of fishery resources and livelihoods and increased
of change in community structure and/or species composition.
costs of human health treatment. Factors that wil account for
worsening of the human health indicator include increased water-
The key marine habitats considered are indicated in Table 31, with the
borne and water-related diseases, a higher population coming into
reasons why they were selected as having priority.
contact with pol uted waters and competition for access to limited
Table 31 Priority habitat types and rationale for their selection.
health facilities. The social and community indicator wil be affected
Habitat/community
by possible migration from settlements due to deteriorating conditions
Reason for selection as priority
type
in the environment. Deteriorating environmental quality results in loss
High rate of erosion and impact by coastal settlements extraction of
Sandy foreshores
sand, tourism.
of viability of fisheries, which is the main livelihood of several coastal
Lagoon pol ution (agriculture, industry, run-off) considerable economic
communities in the region. This could force some inhabitants to
Lagoons
and health impact (loss of source of fish protein).
switch to other forms of livelihood to which they are not wel suited
Habitat fragmentation, modification of stream flow, biodiversity loss,
Estuaries
agriculture, run-off, modification for development.
or competent in, resulting in reduction in their personal incomes and
Overexploitation, settlement development, aquaculture, pol ution, salt
worse living conditions. Competition for dwindling fishery resources
Mangroves
extraction, loss of biodiversity, loss of spawning grounds.
could also lead to social strife. Severe pollution impacts in coastal areas
Shal ow water
Pol ution from industry, agriculture/run-off, clearing of vegetation.
will affect the aesthetics of pristine areas thereby affecting the value of
Rocky foreshore
Quarrying of rocks (urban reclamation).
properties in such areas.
Pol ution, impact by deep sea trawling and fisheries, oil exploitation and
Deep sea
transportation.
(Source: DHI-UCC Water)
It is perceived that the impact of pol ution on the environment will
deteriorate in the future from moderate to severe impact.
The selection of coastal habitats was made on the same principle and
led to selection of wetlands in estuaries and deltas. Table 32 shows the
major problems impacting the key habitats.
78
GIWA REGIONAL ASSESSMENT 42 GUINEA CURRENT
ASSESSMENT
79
Mangroves and estuaries are the ecosystems that have suffered
extraction, exploration and exploitation of petroleum hydrocarbons,
most losses. These are fol owed by sandy foreshores and lagoons in
port construction, dredging, mangrove deforestation, alterations in flow
that order. The losses suffered by muddy and rocky foreshores are
regimes from dam construction (for irrigation and power generation)
insignificant. The main stresses are related to natural processes and
have exacerbated the degree of loss (UNEP 1989).
the level of exploitation of resources within the ecosystems. The latter
stems from rapid population growth as wel as poor management
Habitat loss due to hydrocarbon exploration and exploitation in the
options including the regulation of pollutants released into the marine
region is considered significant (UNEP 1982). Many of the countries
environment. Pol utants include heavy metals, petroleum hydrocarbons,
bordering the Guinea Current LME are oil producers with Angola,
chlorinated hydrocarbons and sewage (Kouassi et al. 1995).
Cameroon, Gabon and Nigeria as net exporters. According to the
World Bank (1995) oil producing companies in Nigeria alone discharge
Natural processes including erosion and sedimentation due to wave
an estimated 710 tonnes of oil yearly. An additional 2 100 tonnes
action and strong littoral transport have contributed to habitat loss.
originate from oil spil s.
Human activities, notably settlement development, through sand
The biodiversity vulnerable to impact by oil include mammals, birds,
Table 32 Habitat and community modification in the coastal
reptiles, fish, crustaceans, mol uscs, polychaetes, zooplankton and
countries of the Guinea Current LME.
phytoplankton.
Country
Perceived major problems
Transboundary elements
Wetland ecosystem is destabilised reducing
Guinea-Bissau Loss of mangroves.
its role in the shelf ecosystem of the region.
In Ghana, 55% of the mangroves and significant marshlands around the
Loss of mangroves; encroachment on
Greater Accra area have been destroyed through pol ution and over-
wetlands and estuaries; destruction
Reduced contribution of mangrove ecosystem
Guinea
of coral reef and exploitation of sea
cutting. In other areas mangrove swamps have been cultivated for food
to the coastal ecosystem; loss of biodiversity.
grasses; degradation and loss of
crops or turned into agricultural farms or saltpans.
biodiversity.
Loss of mangroves; encroachment on Fish species associated with wetlands
Sierra Leone
wetlands; some wetland fauna are
contribute to regional resource base.
A survey conducted in six countries in the region on mangrove
endangered.
Fish species associated with wetlands
ecosystems has revealed varying degrees of degradation ranging from
Liberia
Loss of mangroves and wetlands.
contribute to regional resource base.
over-cutting to pollution. In Benin, the figure is 45% in the Lake Nokoue
Loss of mangroves; encroachment on Stocks of many fish species that use the
Cote d'Ivoire
and degradation of wetlands; loss of
wetlands at some point in their life cycle are
area, in Nigeria 33% in the Niger delta, in Cameroon 28% in Warri Estuary
critical habitats.
shared between countries in the region.
and in Côte d'Ivoire about 60% in the bay of Cocody.
Excessive loss of mangroves and
Stocks of many fish species that use the
wetlands; beachfront development
Ghana
wetlands at some point in their life cycle are
(e.g. hotels); decline of some species
shared between countries in the region.
A total of about 60% of the industries in the coastal countries in the
increase in others.
Stocks of many fish species that use the
region are located in coastal cities (UNDP 2002). Pol ution from these
Togo
Loss of mangroves.
wetlands at some point in their life cycle are
industries varying from textile, leather, food and beverage processing
shared between countries in the region.
Loss of mangroves, encroachment
Stocks of many fish species that use the
to oil and gas and mineral exploitation have significantly contributed to
Benin
on wetlands and estuaries; loss of
wetlands at some point in their life cycle are
habitat and community modification of living organisms.
marine plants.
shared between countries in the region.
Coastal erosion; loss of mangroves
Stocks of many fish species that use the
Nigeria
and encroachment on wetlands and
wetlands at some point in their life cycle are
The use of chemical fertilisers and pesticides has had a debilitating
estuaries.
shared between countries in the region.
impact on the area.
Reduced contribution of wetlands to coastal
Loss of mangroves; coastal erosion;
ecosystem and stocks of migratory fish
Cameroon
encroachment on wetlands and
species; loss of over-wintering areas for
estuaries.
migratory seashore birds.
Many wetlands along the coastal areas have been reclaimed for
An issue throughout the region; many shared
Loss of mangroves; sedimentation;
residential and commercial purposes. This has led to loss of wetland,
Gabon
resources in coastal waters depend on the
encroachment on wetlands.
wetland ecosystem.
flora and fauna.
Living aquatic resources depend on the
Loss of mangroves; encroachment on
Rep. Congo
mangroves and wetlands and constitute
wetlands and coral reef.
shared stocks in the region.
Socio-economic impacts
Loss of mangroves; destruction
Overexploitation of fishery resources, the use of destructive fishing
of critical habitats (wetlands and
Problem occurs throughout the country;
DR Congo
estuaries); some associated fauna
manatees, turtles are endangered species of
practises and destruction or modification of ecosystems can significantly
(e.g. manatee, marine turtle) are
international concern.
affect the coastal communities of the Guinea Current LME. The fisheries
endangered.
(Source: GCLME GIWA Report 2003)
sector is highly significant in the context of providing food security for
78
GIWA REGIONAL ASSESSMENT 42 GUINEA CURRENT
ASSESSMENT
79
the countries bordering the Guinea Current LME. Fish consumption is
relatively high and contributes considerably to the protein intake.
Pelagic and demersal fisheries are ful y exploited as evidenced by
declining landings. The decline in fish availability in the subsistence
sector has led to the adoption of destructive fishing practises such
as the use of undersized meshes and blast fishing. Based on present
consumption patterns and population growth rates, much of the Gulf
of Guinea region especial y the large coastal cities of Lagos, Abidjan,
Accra and Douala, wil need significantly more fish by 2010 to meet their
demands. Pressure on the coastal resources is therefore likely to increase
accordingly in the immediate future. Despite nutritional requirements
and current population growth rates, the commercial fisheries sector in
the countries of the Guinea Current LME general y export their products
thereby exacerbating the food security situation.
Figure 36 Fish catch statistics in the Guinea Current Large Marine
Ecosystem.
(Source: Large Marine Ecosystems of the World 2003)
Significant reduction in the capacity of habitats could lead to the loss
of economic activities including employment opportunities. Indirectly,
Most harvested fish species are shared between countries and straddle
elderly women and children who are the vulnerable population suffer
geopolitical boundaries. Past overexploitation of targeted fish species
as young men migrate elsewhere.
has altered the ecosystem as a whole, impacting at all levels, including
on top predators and reducing the gene pool. Some species, e.g.
Health impacts attributable to habitat modification are rather weak
sea turtles, are threatened or endangered. Exotic species have been
and indirect though habitats for vectors of water-borne diseases could
introduced into the Guinea Current. This is recognised as a global
be enhanced. Attempts have been made in some countries including
transboundary problem (Table 36).
Ghana to protect the wetlands in the coastal areas. These include
establishment of Ramsar sites, enactment of legislation, institution
Local stocks support artisanal fisheries. Transboundary and migratory
of environmental impact assessment as a planning and development
stocks attract large commercial offshore foreign fleets, which since the
regulation tool as well as active replanting of degraded areas.
1960s have exerted extreme pressure on the resources, placing the
fisheries at risk of col apse. This is exacerbated by the presence of local
Conclusions and future outlook
industrial fleets. Catch per Unit Effort (CPUE) is exceeding sustainable
Please refer to the section on unsustainable exploitation of fish and
yields in some countries (Ajayi 1994). Also, species diversity and average
other living resources of the Guinea Current LME.
size of the most important fish have declined (FAO 2003a).
Overexploitation of fish resources is the result of anthropogenic
activities, which comprise increased effort due to better technology,
T
C
P
A
Unsustainable exploitation of use of inappropriate gear including explosives and chemicals, poaching,
I
M
fish and other living resources
decreased level of recruitment and degraded habitat/nursery grounds
through industrial and oil pol ution, and ineffective implementation
Data covering fish catches and import/export statistics is found in
of polices. Apart from fish a wide variety of living organisms are
Tables 33 to 35.
now threatened and are near extinction due to the modification by
poaching.
Environmental impacts
The University of British Columbia Fisheries Center has detailed fish
The most significant changes in the abundance of fish species, according
catch statistics for the Guinea Current LME (Large Marine Ecosystems
to the GCLME Task team, are fluctuations in sardinel a species, a dramatic
of the World 2003). Graphical information is provided by Figure 36.
increase in the abundance of Triggerfish (Balistes capriscus) between
1973 and 1988 and the decline of the species since 1989. This has been
80
GIWA REGIONAL ASSESSMENT 42 GUINEA CURRENT
ASSESSMENT
81
Table 33 Marine fish catches (tonnes) in the GCLME countries 1986-1997.
Country
1986
1987
1988
1989
1990
1991
1992
1993
1994
1995
1996
1997
Angola
182
182
182
182
90
ND
912
32
ND
ND
ND
ND
Benin
7 314
6 282
6 282
8 287
7 312
6 813
5 476
5 933
6 672
6 402
7 380
10 078
Cameroon
51 980
50 529
50 529
48 644
48 644
47 350
49 975
42 251
50 000
64 740
63 984
64 000
Congo DR
2 000
2 000
2 000
2 000
2 000
3 800
3 800
4 200
3 780
3 876
3 973
3 844
Rep. Congo
17 994
17 513
22 005
21 707
21 953
18 370
18 943
18 898
17 912
18 965
19 600
19 095
Côte d'Ivoire
75 435
74 253
60 936
68 503
76 775
61 354
69 573
55 346
58 374
58 854
55 925
55 245
Equatorial Guinea
3 800
3 450
3 450
3 450
3 160
3 020
3 130
2 857
4 349
1 846
4 135
5 235
Gabon
18 244
20 285
20 191
18 600
18 000
2 000
22 000
28 289
26 515
32 777
35 232
34 595
Ghana
259 929
316 379
300 147
300 128
331 273
298 686
36 240
317 738
278 111
289 925
396 125
372 483
Guinea
30 500
32 000
35 000
38 000
41 000
46 000
51 000
56 000
60 000
64 760
60 580
58 841
Guinea-Bissau
3 620
4 000
4 540
5 200
52 000
4 800
5 000
51 000
5 750
6 079
6 750
7 000
Liberia
11 986
14 613
11 944
10 582
2 314
5 586
4 784
3 734
3 685
5 226
3 108
4 554
Nigeria
161 515
155 378
168 280
184 733
217 652
175 651
209 027
143 682
164 389
232 709
248 469
255 225
S.Tomé & Príncipe
2 833
2 798
2 900
3 116
3 583
2 221
2 094
2 334
3 391
3 565
3 980
3 338
Sierra Leone
35 703
35 596
35 663
35 591
34 500
44 114
43 583
43 990
43 991
44 402
44 020
51 263
Togo
11 288
11 510
11 937
11 908
10 824
7 559
5 211
10 928
7 900
7 171
10 083
9 189
Total
694 323
746 768
735 986
760 631
871 080
727 324
530748
787212
734 819
841 297
963 344
953 985
Note: ND = No Data. (Source: FAO 2000)
described as one of the most phenomenal episodes in the history of
suffering from reduced economic returns over the past three decades
fish population dynamics. In the survey conducted under the GCLME
and has led to loss of employment and conflicts between artisanal and
pilot project the bivalve species (Chlamys opercularis, pectinidae) was
commercial large trawlers (ACOPS/UNEP 1998).
caught in such large quantities never before recorded in the Gulf of
Guinea. It has been suggested that the bivalve species may have been
Between 1986 and 1997, marine catches ranged from 694 323 to 953 985
introduced into the region through bal ast water.
tonnes, with the highest catches in 1996 (Table 33). During the same
time period the annual fish catch of both marine and freshwaters using
Artisanal and industrial fisheries are important in the region providing
the local fleet in the Gulf of Guinea region ranged between 1 147 and
a livelihood for several fishers and foreign exchange for the countries.
1 459 million tonnes (Table 34).
The artisanal fishers account for 60% of the landings. Throughout West
Africa, use and management of fishery resources in coastal lagoons and
The figures general y show increasing trends with an occasional decline.
estuaries are linked to taboos and other cultural practices (Koranteng et
The region is general y a net importer of fish and fish products. Exports
al. 1998, Entsua-Mensah et al. 1999). Fishing in coastal lagoons, estuaries
between 1986 and 1998 ranged from 40 000 and 103 000 tonnes,
and creeks are important economic activities in the region. Although
which fetched the region between 45 million USD and 173 million USD.
the fishing is mainly artisanal, it is rather complex in terms of fishing
During the same period, the region imported between 690 000 and
gear and methods used. The most popular fishing gear and methods
960 000 tonnes worth 376 mil ion USD and 595 mil ion USD respectively
found are cast net, seine (or drag) nets, various traps, acadja (or bush
(FAO 2000, GEF/UNEP 2001).
park fishing), hand fishing, hook and line, and trawl nets (Koranteng et al.
1998). The dragnets disturb benthic organisms in the lagoons and have
Destinations of exports and sources of imports of fish and fish products
an adverse effect on the functioning of the lagoon ecosystem.
as depicted in Table 35 show that trade in fish between the region and
rest of the world is wide and significant.
Pol ution from land-based sources, agro-chemicals and the use of
harmful fishing methods, have been identified as factors that adversely
A decrease in fishery activities has been observed in some parts of the
affect fishery resources in coastal lagoons and estuaries.
region. Côte d'Ivoire reported losses of 557 mil ion FCFA6 (80 mil ion
USD) in 1998 as a result of lowering of fishing activities. This loss was
The impact of this GIWA concern is very significant as a very large
attributed to degradation of the coastal zone and its resources (GEF-
proportion of the population is affected. The fishery sector has been
MSP/ACOPS/UNESCO 2001.
80
GIWA REGIONAL ASSESSMENT 42 GUINEA CURRENT
ASSESSMENT
81
Table 34 Marine and freshwater fish catches (tonnes) in the GCLME countries 1986-1998.
Country
1986
1987
1988
1989
1990
1991
1992
1993
1994
1995
1996
1997
1998
Angola
8 182
8 182
8 182
8 182
8 090
7 000
7 912
7 032
7 000
6 000
6 000
6 000
6 000
Benin
38 753
41 903
37 267
41 860
38 234
35 083
32 488
39 221
39 932
44 379
42 175
43 771
43 153
Cameroon
72 104
70 666
70 696
69 782
70 750
69 424
72 032
65 301
75 048
91 795
92 539
94 055
97 055
Rep. Congo
32 085
32 897
41 605
45 840
48 210
45 577
40 183
46 982
42 785
45 915
45 578
38 181
40 100
Congo DR
156 500
162 000
162 000
162 000
162 000
166 550
188 570
197 489
156 647
159 377
163 760
162 961
178 791
Côte d'Ivoire
103 648
101 682
89 506
99 171
104 375
85 008
87 283
70 174
74 095
70 575
69 053
67 727
67 450
Equatorial Guinea
4 250
3 850
3 850
3 850
3 560
3 370
3 500
3 457
5 049
2 296
5 035
6 085
5 996
Gabon
20 226
22 188
22 093
20 502
20 002
22 003
24 005
31 797
31 043
40 464
45 325
44 613
53 486
Ghana
320 161
382 195
362 470
362 081
396 321
363 110
424 021
373 198
336 121
353 526
477 598
447 188
443 112
Guinea
33 002
35 002
38 001
41 001
44 001
49 501
55 005
60 605
63 805
67 864
63 364
62 441
69 764
Guinea-Bissau
3 700
4 100
4 690
5 400
5 400
5 000
5 200
5 350
6 000
6 329
7 000
7 250
7 000
Liberia
16 059
18 734
16 055
14 805
6 463
9 619
8 888
7 778
7 721
9 232
7 232
8 580
10 830
Nigeria
268 591
258 939
278 854
299 833
316 328
267 216
318 404
255 499
282 089
366 101
355 934
383 417
354 756
S.Tomé & Príncipe
2 833
2 798
2 900
3 116
3 583
2 221
2 094
2 334
3 391
3 565
3 980
3 338
3 305
Sierra Leone
52 327
52 224
52 293
52 217
50 090
60 235
60 668
61 032
62 033
62 440
61 560
68 802
62 730
Togo
14 838
15 189
15 469
16 458
15 800
12 524
10 899
17 114
13 202
12 221
15 119
14 310
16 680
Total
1 147 259
1 212 549
1 205 931
1 146 098
1 293 207
1 203 441
1 341 152
1 244 363
1 205 961
1 342 079
1 461 252
1 458 719
1 460 208
(Source: FAO 2000)
Table 35 Sources of import and destination of export of fish in
The possible human health impact of unsustainable exploitation of
GCLME countries.
fish and other living resources under present conditions would be
Country
Import from
Export to
significant since over 60% of fish protein consumed in the region is
Benin
Countries in the region.
EU Countries (mainly France, Italy, Netherlands).
from marine sources.
Cameroon
Morocco, Mauritania, Senegal.
ND
Senegal, Angola, South Africa,
Rep. Congo
Namibia, Spain, France,
EU Countries (mainly Spain and France).
The social and community impact could be described as moderate. The
Iceland, Norway.
Côte d'Ivoire
ND
EU Countries (mainly France).
impact on local society is quite considerable, as jobs would have been
Cameroon, Nigeria, Equatorial Guinea, Europe,
lost due to reduced economic returns. The problem of intergenerational
Gabon
ND
America.
equity is also exacerbated by the overexploitation of living resources.
Benin, Côte d'Ivoire, Nigeria, Senegal, Togo, Rest of
EU, Namibia, Senegal, Norway,
Ghana
Africa (Botswana, Ethiopia, South Africa), EU, Canada,
South America.
USA, Asia, Australia.
Conclusions and future outlook
Guinea
ND
Belgium, France, Spain.
At the global level, coastal areas comprise 20% of the land surface of the
Liberia
ND
Europe, North America.
Asia, EU, Iraq, South America,
earth and yet support 50% of the entire human population. It has been
Nigeria
Asia, Comoros, Europe, India, USA.
Russia.
estimated that by the year 2025, coastal populations are expected to
Belgium, France, Greece, Hol and, Senegal, UK, USA,
Sierra Leone
ND
Germany, West Indies.
account for 75% of the total world population (UNCED 1992). It is further
Benin, Mauritania, Namibia,
estimated that more than 70% of the world's mega cities (more than
Togo
China, EU, Greece, Hong Kong, Italy, Switzerland, USA.
Netherlands, Senegal.
Note: ND = No Data. (Source: GCLME GIWA Report 2003)
8 mil ion inhabitants) are located in coastal areas. In the Guinea Current
LME, the average population growth rate is currently estimated at 2.9%
Socio-economic impacts
and is expected to drop to 2.2% by 2020. Absolute population in the
The overexploitation of fish and fisheries from lack of management has
16 countries is however expected to increase with 160 mil ion by 2020.
food security implications for the 248 mil ion people of the 16 countries
bordering the Guinea Current LME. Fishery resources are important for
Large cities such as Abidjan, Accra, Lagos, Port Harcourt and Douala,
feeding local populations, and also for earning substantial foreign
currently host populations in the region of 2 to 10 mil ion. If the
exchange for countries such as Angola, Côte d'Ivoire, Ghana and
population growth rate of 4.4% for the city of Accra and the estimated
Guinea. There is increasing recognition that economic growth needs to
population increase of 40 to 60% of the Niger delta in Nigeria (which
occur in a sustainable manner with adequate protection of the coastal
includes the port cities of Port Harcourt and Warri) between 1991 and
ecosystems and the conservation of biodiversity.
2002 is extrapolated, then populations of over 20 million in for example
Lagos can be expected by 2020. More urban communities are also
6 Franc CFA (UEMOA and CEMAC)
82
GIWA REGIONAL ASSESSMENT 42 GUINEA CURRENT
ASSESSMENT
83
Table 36 Unsustainable exploitation of fish and other living
The coastal ecosystem however faces serious threats from over-
resources in the coastal countries of the Guinea Current
exploitation. The increasing dependence of populations on coastal
LME.
resources is set to increase the pressure on coastal areas and their
Country
Perceived major problems
Transboundary elements
ecosystems. Over the next 20 years, more living resources wil be
Guinea-
Most coastal fishery resources are
Migratory nature of fish in the region.
exploited to feed increasing coastal populations.
Bissau
overexploited.
Decline of fish stocks; marine
and lagoon fishery resources
The economic impacts associated with unsustainable exploitation
Migratory nature of fishery resources in the
Guinea
are overexploited; some species
region.
of fish and other living resources however show deterioration from
of ray, sharks and shel fish are
endangered.
moderate to severe impact. Increased fishing effort, low enforcement
Pelagic fishery resources are
Stocks of may fish species are shared between
and compliance with regulations due to the high cost of surveil ance,
Sierra Leone
moderately exploited; demersal
countries in the region.
fishery resources are overexploited.
as well as the use of il egal fishing methods could col apse the fishery
Marine fishery resources are
resources, thereby affecting economic activities in the coastal area.
Stocks of many fish species are shared between
Liberia
overexploited; some species are
countries in the region.
endangered.
All marine and brackish water
Pelagic resources (especial y small pelagic
For the human health impact from unsustainable exploitation of
fishery resources are overexploited, species) are shared by Ghana and to some extent
Côte d'Ivoire
fish, deterioration is due to high levels of poverty and reduction in
especial y in lagoons; Sport fishing
Togo and Benin; other resources also shared
is destroying some species.
by Liberia.
availability of fish protein supply, which will weaken human resistance
Pelagic resources (especial y small pelagic
Coastal demersal fish resources are
to diseases.
species) are shared by Côte d'Ivoire, Togo and to
seriously overexploited; pelagic
Ghana
some extent Benin; some demersal resources
resources experience boom and
are shared. Straddling fish stocks and highly
bust.
For social and community impacts, the impact of unsustainable
migratory fish stocks exist in the region.
Lagoon and brackish water fishery
Overexploitation of inner continental shelf
exploitation of living resources is expected to worsen in the future.
resources are grossly overexploited; fishery resources runs across the entire region;
Togo
The competition of more fishermen for less resources will increase the
some marine fishery resources
overexploitation of lagoons affect contribution
overexploited.
of lagoons to coastal ecosystem of the region.
risk of social conflicts and population migration.
All fishery resources overexploited
Reduced contribution of wetland ecosystem
Benin
especial y lagoon freshwater
to coastal ecosystem of migratory species in
resources.
the region.
The above ranking agrees with previous studies carried out under
Marine and lagoon resources are
WACAF7 and the Gulf of Guinea LME Project and with the IOC8/ACOPS9
Nigeria
Effect on shared fishery resources.
heavily overexploited.
Study on the Development and Protection of the Marine and Coastal
Lagoon, freshwater and marine
Most coastal resources in the region are shared
Cameroon
Environment in sub-Saharan Africa.
resources are overexploited.
and overexploited.
Marine and brackish water fishery
Migratory nature of some fish species in the
Gabon
resources are overexploited.
region.
Lagoon and marine resources
Rep. Congo
Fishery resources are migratory.
overexploited; endangered species.
T
C
P
A
(Source: GCLME GIWA Report 2003)
Global change
I
M
expected with the concentration of industries in the coastal zone. The
Of all the concerns of global change, sea level rise is general y the one
average 60% industrial holdings in the coastal area could rise to about
concern that has the largest environmental impact according to the
80% and wil attract large workforces especial y from the rural areas.
GCLME Task team. Sea level change is due to thermal expansion of
This population upsurge would be a possible result of the different
the oceanic waters as a result of an increase in global temperatures
economic recovery programmes in the region.
and melting of arctic or polar glaciers. Results from various models
on the magnitude of global warming predict an acceleration of the
Coastal ecosystems are highly productive, yielding about 90% of global
eustatic rise in sea level of 1.2-1.5 mm/year over the coming 100 years to
fisheries and producing about 25% of global biological productivity.
something between 0.56-3.68 m by the end of the 21st century. Various
The oceans and related coastal areas therefore do play a major role
studies conducted in Nigeria, conclude that in total, over 1 800 km2 or
in sustainable economic livelihoods for a sizeable proportion of the
2% of Nigeria's coastal zone and about 3.68 mil ion people wil be at
population. In the coming decades, the resources of coastal areas are
risk with a 1m rise in sea level (Awosika et al. 1992). It is further estimated
expected to contribute significantly to poverty reduction and the UN
that, with no acceleration in sea level rise (0.2 m i.e. business as usual
Mil ennium Declaration to halve, by 2015, the proportion of very poor
scenario), Nigeria could lose over 3 000 km2 of coastal land by the end of
people in the world.
the next century. Most of the losses of coastal land and the risk faced by
82
GIWA REGIONAL ASSESSMENT 42 GUINEA CURRENT
ASSESSMENT
83
coastal populations are due to the low-lying nature of the coastal area.
Synthesis of the Guinea
The land losses arise from inundation and coastal erosion. The nature of
Current region
the Nigerian coastal area is very similar in terms of elevation to those of
the other countries in the region. It can therefore be extrapolated that
Freshwater shortage
sea level rise is likely to affect the coastal areas of the other countries in
As regards Freshwater shortage, two very different parts can be
terms of land loss and vulnerability of coastal populations.
distinguished in the Guinea Current region.
Within the next 20 years however, the environmental impacts arising
On the one hand, in West Africa, freshwater shortage is a very important
from the major concern of Global change are not very clear. The
concern. The main issues are caused by the decrease of rainfall over the
economic, as wel as the social and community impacts by the year
last 40 years (Figures 5 and 6), modification of stream flow and lowering
2020 are considered to be slight based on the assessment by the Task
of the water table. These issues are well documented in the Volta Basin,
team. However, over a time scale of about 100 years, the economic,
in the Niger Basin, and to a lesser degree in the Comoe Basin. The
social and community impacts and costs wil be enormous. The IPA,
Ghanaian national report to FCCC 2001, shows that the groundwater
Nigeria National Report estimates the value at risk with a 1 m sea level
recharge in the White Volta Basin will be reduced by 22% in 2020 and
rise at 18 134 billion USD, taking into account properties, infrastructure,
by 40% in 2050 leading to further lowering of the groundwater. Climate
investments, especial y in oil production, and displacement of coastal
change scenarios and model simulation studies carried out in Ghana
communities and their livelihoods. The health impacts are not as
estimate a reduction in river flows in the White Volta Basin by 16% in
pronounced as the economic, social and community impacts.
2020 and by 37% in 2050 compared to the 1990 situation (EPA 2000).
The impacts of sea level rise in the entire region will be:
On the other hand, the situation is completely different in Central
Increased salinisation of both ground and surface waters that could
Africa where rainfall (despite a slight but measurable decrease) remains
affect potable water supply;
abundant. Moreover, the population is low and the withdrawals are
Modification or loss of flora, fauna and biodiversity in inundated
less important for surface water as well as for groundwater. Due to this,
lands and estuaries;
freshwater shortage is not a cause for concern in this part of the Guinea
Loss of economic activities such as tourism, coastal agriculture,
Current region.
fisheries and industries.
The situation is expected to become worse in the future in West Africa
IPCC (2001) reports that Africa is highly vulnerable to climate change.
if nothing is done. It will remain stable in Central Africa, where the only
Although the equatorial region and coastal areas are humid, the rest of
causes which may affect the availability of water resources could be
the continent is sub-humid, dry or arid. Global warming would reduce
concentrations of population (aggravated by civil wars) or localised
soil moisture in sub-humid zones and reduce run-off.
activities causing pollution (e.g. mining).
Already, water storage has been reduced to critical levels in some lakes
Pollution
and major dams, with adverse repercussions for industrial activity and
In the river basins of the region, the most important Pol ution issue
agricultural irrigation.
is eutrophication. The consequence of enrichment of waters with
nutrients (i.e. nitrogen and phosphorus) is the invasion of water bodies
Moreover, global change would have other effects than those
by exotic aquatic weeds.
mentioned above, for example intensification of extreme
meteorological phenomena such as storms and heavy swel s that will
In the Guinea Current LME, pol ution under present conditions was
have an aggravating effect due to the anticipated sea level rise.
considered to have a moderate environmental impact. Microbiological
pol ution is localised to the great urban areas and its effects are not
Given the diversity of constraints and the gravity of risks, the Guinea
observable far from these sources. Nutrients brought into the ocean by
Current LME wil certainly have to face some daunting chal enges in
the rivers cause eutrophication in the coastal zones. The algal blooms
adapting to the effects of climate change.
occurring in Ghana for instance, may be fed by nutrients transported by
rivers from Ghana via Côte d'Ivoire carried back towards Ghana by the
littoral drift (Figure 35). Land based chemical pol ution by heavy metals is
7 West and Central Africa. 8 International Oceanographic Commission (of UNESCO). 9 Advisory Committee on the Protection of the Sea.
84
GIWA REGIONAL ASSESSMENT 42 GUINEA CURRENT
ASSESSMENT
85
an important international problem since the contaminants are persistent
assumptions are becoming stronger and stronger with the progress
and are concentrated al along the food chain. Pol ution by solid wastes
of investigations reported by IPCC. It was deemed that Global change
has a limited extension. Spills are observed all along the coast of the
could not be considered as a concern for the time being. Nevertheless,
region, but this issue is sporadic and its impacts are moderate.
it is acknowledged that, if the scientific relationships are established, the
concern of global change wil be of particular importance for the region.
Eutrophication and chemical pol ution are two issues il ustrating the
concept of land-based pol ution impacting an LME. The root causes and
the policy options to combat eutrophication will be treated in detail for
the case of the Comoe River. The root causes and the policy options
Priority concerns for further
to combat land based chemical pollution will be treated in the case of
analysis
the Guinea Current LME.
The quantification, according to the GIWA methodology, of the
Habitat and community modification
international waters issues in the Guinea Current region al ows for
This concern is valid for the entire region: for the four river basins as
prioritising the problems occurring in the examined basins (Table 37). The
wel as for the Guinea Current LME. According to the ranking made
numbered scores of each concern and issue appear in Tables 25 to 29 and
by the GIWA Task teams, this concern is particularly important for the
are al based upon the scoring done by the five individual Task teams.
Niger Basin.
Table 37 shows the convergence between the basins in the estimated
Unsustainable exploitation of fish and other
prioritising of the concerns and issues. But it shows also the contrasts
living resources
between the different basins studied within the region. Thus,
This concern is also valid for the whole region: the four river basins as
Freshwater shortage is a major concern in the West-African basins,
well as the Guinea Current LME. According to field-teams, this is by far
which have a part in Sahel (Niger and Volta), while it is not a major
the major concern for the Guinea Current LME, however priority two in
concern in the Congo Basin that benefits from more abundant and
the GIWA assessment. It is also noted to be the second concern for the
more regular rainfal .
Congo Basin, but this is an expert evaluation which is based on limited
and not always wel -documented data.
Freshwater shortage
This is one of the most important concerns in the inland part of the
Global change
region. It is ranked as the first concern in the Volta Basin, the second
The relations between the climatic evolution of the last 30-40 years
in the Niger Basin, the third in the Congo Basin and the fourth in the
and global change are not yet scientifical y proven, even if the
Comoe Basin.
Table 37 Overall view of the priority concerns and issues in the Guinea Current region.
Basin
Concern-Issues 1
Concern-Issues 2
Concern-Issues 3
Others
Pollution
Habitat and community modification
Unsustainable exploitation of fish and
Freshwater shortage
Comoe River
· Eutrophication
· Loss of ecosystems
other living resources
· Modification of stream flow
· Microbiological (not an international issue)
· Overexploitation
Freshwater shortage
Habitat and community modification
Unsustainable exploitation of fish and
Pollution
· Modification of stream flow
· Modification of ecosystems
other living resources
· Microbiological
Volta River
· Lowering of water table
· Overexploitation
Global change1
· Changes in hydrological cycles
Habitat and community modification
Freshwater shortage
Unsustainable exploitation of fish and
Pollution
· Loss of ecosystems
· Modification of stream flow
other living resources
· Eutrophication
Niger River
· Modification of ecosystems
· Changes in water table
· Overexploitation
Global change1
· Destructive practices
· Changes in hydrological cycles
Pollution
Unsustainable exploitation of fish and
Freshwater shortage
Habitat and community modification
Congo River
· Chemical
other living resources
· Modification of stream flow
· Loss of ecosystems
· Solid wastes
· Overexploitation
· Modification of ecosystems
Pollution
Unsustainable exploitation of fish and
Habitat and community modification
Global change1
Guinea Current
· Chemical
other living resources
· Loss of ecosystems
· Sea level change
Large Marine
· Oil spil s
· Overexploitation
· Modification of ecosystems (incl. coastal
Ecosystem (GCLME)
· Destructive practices
erosion)
· By-catch
1 Changes in hydrological cycles could fall into Global change if the present assumptions become scientific evidences. This concern may become a priority for the future.
84
GIWA REGIONAL ASSESSMENT 42 GUINEA CURRENT
ASSESSMENT
85
This concern is particularly acute in West Africa where a severe drought
The issue of floating solid waste is mentioned in certain points of the
has been witnessed during the last 30 years, manifesting itself through a
Congo Basin (Kinshasa-Brazzavil e) and also in the Volta Basin and in
serious lack of rainfall and resulting in an even worse decrease of flows
GCLME. It is a very visible nuisance, localised nearby the urban zones or
in streams and rivers. Effectively, the run-off is the difference between
spread along the coast by the littoral drift. The presence of solid wastes
a distinctly decreasing rainfall and an evaporation that remains strong
denotes the lack of sanitation in general and, in freshwaters, arouses the
and more or less constant (Servat et al. 1996, 1997 and 1998, Paturel et al.
suspicion that microbiological pollution, which is less visible but much
1997, Nicholson et al. 1988, Hubert et al. 1987 and 1989).
more dangerous, may be present.
Another effect of the lack of rainfall is the lowering of the groundwater
Chemical pol ution is an important problem in the basins having mining
table due to limited infiltration.
activities and nearby certain industries (tanneries, surface treatment of
metals). The mining activities are important in the south of the Congo
In fact, according to the scores given by the teams working separately in
Basin and in the small international coastal basins (Bia River, Tano River
each basin, the concern of freshwater shortage ranks after habitat and
and Aby Lagoon) sandwiched between the Comoe and the Volta rivers,
community modification. But it was deemed by the whole group that
shared by Côte d'Ivoire and Ghana, and where wastes from Ghana gold
freshwater shortage has much more international consequences than
mines are being discharged.
habitat and community modification, which often affect localised parts of
the region. Moreover, freshwater shortage may be the cause of disputes
The chemical pol ution issue represents an il ustrative problem since it is
between riparian states, and maybe even conflicts if no action is taken.
a typical example of the impact of land-based pollution on the marine
environment and the close link between freshwater management,
The current worries about the volume of rainfall are even more serious
coastal zone management and marine environment management.
when it comes to future tendencies. It is in fact possible that a long-term
situation resulting from global change may combine with a temporary
Habitat and community modification
episode and will further reinforce the climatic evolution, which is seen
The modification or loss of ecosystems constitutes the most important
today.
concern of the region: it is classified as the first concern in the Niger
Basin, the second in the Comoe and Volta basins, the third in the Guinea
Pollution
Current LME and the fourth in the Congo Basin.
Pollution is also a major concern in the region. It is classified as the first
concern in the Comoe and Congo basins as well as in GCLME, and the
The two issues under this concern (modification of ecosystems and loss
fourth in the Volta and Niger basins.
of ecosystems) represent in fact two stages of the same process, namely
the degradation of the aquatic ecosystems. The root causes of this
Pol ution is considered to be the first concern in the marine part of
degradation are analysed in the next section but it should be noticed
the region. The main issues that have been identified in the seawater
here that they involve other concerns and problems contributing
and along the coasts of GCLME are chemical pol ution and dumping
strongly to the degradation observed:
of hydrocarbons.
Water shortage: drying up and disappearance of wetlands due to
modification of stream flows;
In the inland waters microbiological pol ution and eutrophication
Pol ution: eutrophication resulting in the proliferation of invasive
(resulting in the invasion of aquatic plants) have been identified
species and destruction of key species, which is also related to mis-
as the most important problems (see also Habitat and community
use of pesticides;
modification).
Unsustainable exploitation of fish and other living resources:
damages to the seafloor, destruction of habitats by inappropriate
The microbiological pol ution in the Comoe Basin is a particular case
fishing practices, disappearance of overfished species.
of a great river crossing a large urban zone. Since the opening of the
Vridi canal in 1951 and especial y since the recent closing of the Grand-
Unsustainable exploitation of fish and other
Bassam outlet, the mouth of the Comoe River has been moved 40 km.
living resources
Now the flow passes through Abidjan, a city of 3.5 million inhabitants
This concern is classified as the second in the Congo Basin and Guinea
of which barely one third benefits from sanitation systems.
Current LME, and the third in the other assessed systems.
86
GIWA REGIONAL ASSESSMENT 42 GUINEA CURRENT
ASSESSMENT
87
The main issues that are identified in the marine environment are the
Table 38 Priority issues for further analysis.
overexploitation of the stocks, the destructive fishing methods and the
Selected
Possible application
Concerns
Case studies
illustrative issues
of results
excessive by-catches.
Modification of
I
Freshwater shortage
Volta Basin
Niger Basin
stream flows
In the continental freshwaters the main problems are also the
Eutrophication
Comoe Basin
All other basins
I
Pol ution
Chemical
Guinea Current LME
overexploitation of stocks. Destructive fishing methods are mentioned
Loss of ecosystems
from the Niger Basin.
Habitat and community
I I
Modification of
Niger Basin
Congo Basin
modification
ecosystems
Unsustainable
The by-catches are mentioned in the GCLME offshore of the Congo
IV
exploitation of fish and Overexploitation
Guinea Current LME
Basin, without the importance of the problem being assessed through
other living resources
V
Global change
Not dealt with
reliable statistics. It is certain that the by-catch represents a large world
wide problem as the FAO estimations for 1999 indicate that at least
one quarter of the total captures in the world is thrown back into the
CCA and POA carried out according to the GIWA methodology on the
sea every year.
illustrative priority issues may be useful to address the same issues in
other basins of the region (and possibly of other regions characterised
Global change
by the same socio-economic contexts).
The title of this concern is subject to controversy. At present, the
assumptions concerning the real nature of global change are in fact
solid, but for the time being no convincing data make it possible to
attribute to global change the climatic evolution and the serious
reduction of the flow regimes that have been observed in the West-
African part of the region during the last 40 years.
Lack of knowledge about the true causes of the climatic changes has
further complicated the situation
Regarding the other issues under this concern, no data exist in the
region. Therefore, no measures have been taken in order to prevent the
effects of a rise of sea level, nor to examine the impact of the ultraviolet
radiation (particularly UV-B) on living beings.
However, despite these uncertainties, the above-mentioned problems
are considered to be very important in the future. If their consequences
are verified, they present in fact a serious risk for living beings as well
as for the economies of the African countries. The precaution principle
therefore requires actions to be taken according to relevant political
options in order to preserve the future environment.
Priority issues for further analyses
The above prioritising al ows the building of a representative sample
regarding the most important concerns and issues in the international
waters of the region (Table 38). Based on this, a limited number of
il ustrative issues have been selected with the aim: first to perform a
Causal Chain Analysis (CCA), and second, to carry out a Policy Option
Analysis (POA) to find out the appropriate political options to be taken
in order to solve the described problems.
86
GIWA REGIONAL ASSESSMENT 42 GUINEA CURRENT
ASSESSMENT
87
Causal chain analysis
This section aims to identify the root causes of the environmental
management, but Benin, Côte d'Ivoire, Mali, Togo, also have minor
and socio-economic impacts resulting from those issues and
shares in the Basin.
concerns that were prioritised during the assessment, so that
appropriate policy interventions can be developed and focused
The Causal chain analysis identified the fol owing basic root causes of
where they will yield the greatest benefits for the region. In order
freshwater shortage:
to achieve this aim, the analysis involves a step-by-step process
Climatic evolution has caused a reduction of average rainfall in the
that identifies the most important causal links between the
headwaters in the Sahel of about 30% over the last four decades.
environmental and socio-economic impacts, their immediate
During the same period, the population has multiplied by more
causes, the human activities and economic sectors responsible
than a factor of 3, and the water demand by almost a factor of 6. This
and, finally, the root causes that determine the behaviour of those
increase in water demand, in combination with the precipitation
sectors. The GIWA Causal chain analysis also recognises that,
reduction, depleted the stream flow by approximately 50% or more
within each region, there is often enormous variation in capacity
in certain catchments.
and great social, cultural, political and environmental diversity.
Inappropriate technologies for urban water supply and for water-
In order to ensure that the final outcomes of the GIWA are viable
efficient agricultural practices in both rain-fed and irrigated
options for future remediation, the Causal chain analyses of the
agriculture have further aggravated the water shortages.
GIWA adopt relatively simple and practical analytical models and
Lack of efficient governance has aggravated the situation by not
focus on specific sites within the region. For further details, please
being able to address the extremely severe water management
refer to the chapter describing the GIWA methodology.
issues efficiently.
System description
The Basin
Modification of stream flow:
The Volta Basin is described in detail in the first section of the report.
Case of the Volta Basin
The Volta River drains a catchment area of about 410 000 km2. At the
outlet, the River has an average annual flow of 700 m3/s. However, this
Introduction
average figure hides the extreme annual variation from high waters in
The Volta Basin has been selected as a typical example of an
the rainy season to low waters in the dry season. Also, it is important to
international river system facing severe freshwater shortage, partly
realise the huge difference between the arid and semiarid headwaters
due to the climatic characteristics of the Sahel region, partly due to the
in the Sahel, and the much more humid coastal conditions in the south
increased water demand caused by a rapidly growing population.
along the Atlantic coast.
The Basin is dominated by two countries: Burkina Faso in the upstream
The upper basin, primarily located in Burkina Faso and northern Ghana,
waters (42%), and Ghana in the downstream catchment (40%). They
is characterised by huge arid plains with very flat topography. To the
constitute the key players in the international aspects of water
north, the Sahara desert is encroaching on the catchments, gradual y
88
GIWA REGIONAL ASSESSMENT 42 GUINEA CURRENT
CAUSAL CHAIN ANALYSIS
89
changing into grass savannah, and eventual y into bush savannah.
About 75% are subsistence farmers and depend directly on the
The rainfall in this region is highly erratic from year to year and occurs
productivity of the natural resources in their direct neighbourhood,
during two to four months of the rainy season. The rest of the year,
in particular the water resources. Poverty is the norm, with annual
rainfal and river inflow is extremely scarce. This implies that the flow
incomes ranging from 100 to 700 USD per capita in the more fortunate
during the dry season is close or equal to zero in many tributaries. This
south. In the north, population growth and lack of rainfall has caused
is the case in White Volta and Red Volta in Burkina Faso. Only the Black
overexploitation of the resources and severe depletion of soil and
Volta (Mouhoun) has a permanent flow throughout the year (MEE/
vegetation. Agriculture is predominantly rain-fed, and only a few
DGH 2001).
percent of the land available for cultivation has access to irrigation.
Competition between pastoral herders and settled farmers over local
This general lack of run-off water is further aggravated by a marked
water resources are common.
decline in rainfal over the past 40 years (Figure 5, 6, 28 and 29). The
actual reason for this decline is not known with any certainty, and it
The lack of income opportunities has led to extensive transmigration
can be seen that the beginning of the 20th century had similar drought
from the rural areas to the towns causing a concentration of water
conditions. Three basic explanations have been proposed:
supply demand. Major urban centres are the cities of Ouagadougou
The decline is related to a natural long-term cycle, where the rainfall
(850 000 inhabitants in 2000 with a growth rate of more than 4%) and
may eventual y recover. There is no scientific documentation to
Bobo-Dioulasso (350 000 inhabitants in 2000 and with a growth rate of
explain this cycle;
almost 3%). Some other cities have less than 100 000 inhabitants. The
The decline is related to the land degradation, caused by a
industrial development is limited to smal -scale enterprises, with fairly
proposed feedback between over-grazing, land degradation and
limited water needs, except for some particular plants like the brewery
run-off;
in Ouagadougou.
The decline is related to the global change caused by emission of
greenhouse gases.
Besides the transmigration from the rural areas to the towns inside one
country, there is a migration towards the south, in particular along the
Presently, scientists have not reached consensus on the selection of a
coasts in the aim either to find more fertile lands or bigger cities. This
single specific explanation.
movement of population is facilitated by the ECOWAS10 regulations
stipulating the free movement of persons from one member country
The lower basin, primarily in southern Ghana, is in a much better
to another. The result is that the Sahelian countries are moderating their
condition with much more frequent and plentiful rainfal . Natural
population growth by emigration whereas coastal countries have an
vegetation cover is woodland savannah, deciduous forest or coastal
important foreign population e.g. more than 25% in Côte d'Ivoire.
rainforest, and as such, the southern basin does not face the same
severe water shortages and water management problems as the
Immediate causes of freshwater shortage in
north.
Volta Basin
The Causal Chain Analysis (CCA) was carried out according to the GIWA
Groundwater is an important source of water during the dry season.
guidelines, by a team of regional experts based in Accra (Ghana) and
But aquifers have low yields, particularly in the crystal ine basement.
Ouagadougou (Burkina Faso). The CCA has been validated during a
A reduced recharge due to the climate evolution, combined with
workshop held in Ouagadougou, in February 2003.
increased pumping to satisfy the water supply needs of the growing
populations, has caused a significant lowering of the groundwater table
The freshwater shortages in the Volta Basin are caused by two basic
(Figure 30).
interventions in the hydrological cycle:
First and foremost, due to its location in the Sahel region, most of the
The people
Basin suffers from arid conditions. This disadvantage has been further
The total population of the Basin is approximately 20 mil ion inhabitants
aggravated as natural stream flow has been steadily decreasing during
(GIS analysis based on ORNL 2003). This figure is expected to almost
the last decades, due to the climatic precipitation changes occurring
double to 34 mil ion by 2025. Population density varies significantly
in the Sahel region. Decreases in annual rainfall have caused significant
from a few inhabitants/km2 in the semi-arid lands in the north to about
reductions in the total run-off, but also increased its variability and the
100 inhabitants/km2 in the south.
drought and flood risks. Similarly, groundwater recharge has been
10 Economic Community Of West African States
88
GIWA REGIONAL ASSESSMENT 42 GUINEA CURRENT
CAUSAL CHAIN ANALYSIS
89
reduced due to lack of rain, and water tables have been lowered
to excessive evaporation losses in the arid climate. Lake Volta
correspondingly.
is the largest artificial lake in Africa, and evaporation losses are
substantial.
This inevitable environmental cause of a serious water deficiency in
the Basin has been further worsened by a strong increase in water
However, behind these developments in the economic sectors there
demand. In particular increased diversions to satisfy water needs of
are a number of root causes, which need to be addressed, if the issue
the rapidly increasing population and to a much less extent the
of freshwater shortage is to be solved, or at least reduced.
irrigation needs of agricultural crops, have caused shortages to the
downstream users. In addition, unproductive evaporation losses from
Root causes of freshwater shortage
reservoirs constructed to save water for the dry season are responsible
in the Volta Basin
for huge losses of water (almost 85% of the total volume of most of the
The immediate causes of the freshwater shortages were described
reservoirs in Burkina Faso according to the Volta Basin team, with the
above. However, these immediate causes are driven by underlying
exception of the deep reservoir dams like Kompienga on the Red Volta
and basic root causes which also need to be identified to achieve a
or Bagré in the White Volta.
complete understanding of the combination of environmental and
socio-economic dynamics that underlie the lack of water in the Volta
The groundwater aquifers of the region are not very productive, but
Basin.
they serve as a crucial reserve during droughts. A combination of
reduced infiltration and increased pumping to replace the dwindling
Impact of West African climatic evolution
surface waters has caused severe lowerings of the groundwater table.
The fundamental climatic constraint in the arid Sahel region is one of
the most important root causes of water shortage, and it has to be
The activities behind these impacts are related to three economic sectors:
accepted as a constraint given by nature. In desert and arid lands there
Urbanisation and industrialisation create significant increases in
will always be water shortage.
water supply demands. The urban population is increasing very
rapidly due to transmigration from the rural areas, where income
As mentioned above, the decline in rainfal in the Sahel has had a
opportunities in agriculture are extremely meagre, not least due
devastating impact on the water resources of the Volta Basin. Recent
to the drought. Towns are often located in water-limited areas, and
studies (e.g. Lebel et al. 2000), have shown that the main reason for the
they need extensive reservoirs to save water for the dry season.
decline in the rainfal is the decrease in the number of rainfal events.
The land variation in topography is small and unfavourable for the
Rainfal - and groundwater recharge - has been reduced by 30%, and
construction of deep reservoirs, so significant amounts of water
stream flow reduced by up to 50%.
are lost by evaporation from water supply reservoirs. Furthermore,
pipe systems are often old and leaking, and there are few significant
The reasons, and the future trends, for the climatic evolution are
attempts to introduce water saving activities and water recycling
unclear as no natural climatic factors for these variations have been
technology.
found. Long-term climatic variations are a common phenomenon in
The rural population needs water for basic water supply, but also for
the region, and a similar dry period occurred in the beginning of the
a safe crop production and for livestock. Direct rainfal , withdrawal
20th century. It could even be argued that the 1950s were unusually wet.
from streams, combined with the productivity of shal ow ground-
But no natural climatic factors for the variations, such as the El Nińo
water reservoirs is essential for subsistence agriculture, and even
phenomenon, have been identified.
more so for cash cropping. In some cases, governments and
donors have established irrigation systems, but the total command
The general increase in greenhouse gases and the associated global
area is limited, due to lack of funds, but also due to the difficulty
warming and climate change may also have an impact. But so far, no
in achieving a reasonable economic cost-benefit ratio for the
reliable documentation is available to demonstrate the precise impact
investments.
of human induced climate change. Some researchers have proposed
that the general destruction of vegetation has worsened the situation.
Hydropower development has been exploited as a way to
It is unquestionable that the combination of drought and population
support the economic development of the region. But due to the
pressure has significantly depleted the land and vegetation of the arid
unfavourable topography, the dams create huge lakes, vulnerable
northern parts of the Basin. But a possible feedback on the precipitation
90
GIWA REGIONAL ASSESSMENT 42 GUINEA CURRENT
CAUSAL CHAIN ANALYSIS
91
patterns has not been documented. As the climate conditions are a
Accordingly, policies addressing the demographic root causes are
paramount factor in water resources, it appears most appropriate to
essential for a successful solution to the problem of water shortages.
address the lack of knowledge about the basic processes. Until this
knowledge has improved, emphasis must be on robust and flexible water
Inefficient water technologies and wasteful uses of the scarce
policies, accounting for the risks of climate related water shortages.
water resources
Another root cause of freshwater shortage is the lack of efficient water
Rapidly growing population followed by increase in water supply
use in the present agricultural and urban water supply technologies.
In the old days, 30-50 years ago and more, when the population pattern
The civil sector development not only causes increasing demands for
and the socio-economic systems were more or less adjusted to the
water but also creates wastewater.
basic climatic conditions through centuries of adaptation by the local
people, it was possible to cope with the shortages. But when improved
Given the adverse arid conditions in most of the Volta Basin, there is
health policies and practices reduced the death rate, population grew
already a significant amount of indigenous technology for water saving
to unexpected levels, beyond the carrying capacity of the traditional
in both the rural and the urban sectors. But these techniques were
practices.
developed under conditions with much less population pressure, so
they are often not appropriate and sufficiently efficient any more. There
Thirty years ago, the population of the Basin was less than 10 million,
is an urgent need to address the potential of developing more water
which today has grown to approximately 20 million. With the present
efficient technologies and user practices:
population growth of about 2.5% it is expected to increase to nearly
Traditional farming techniques are not sufficiently intensive and
34 million by 2025. Accordingly, the fundamental per capita pressure
productive (too little crop and livestock per drop of water), and in
on the water resources and the related shortages, will increase
particular, improved water harvesting and in-field water management
correspondingly, further aggravated by the general tendency for a
practices need to be developed. A key constraint in this context is the
higher water demand per capita, when economic conditions improve.
ability of the farmers to pay for introduction of such new technology.
Already, it is very difficult to make agriculture economical y feasible in
A complete picture of the causes of population growth and its relation
the arid regions of the Basin, so any new technology must be low-cost
to water resources depletion under such adverse conditions have not
and specifical y targeted towards local conditions and practices. Also,
been wel identified (Dasgupta 2000). The only certain conclusion is
the lack of alternative, drought-resistant crops (possibly developed
that the relationships are extremely complex and highly dependent
through genetic modification) is an important reason for the
on regional and local conditions. Some basic causes for high fertility
technology gap in the agricultural sector.
rates are identified as:
Concerning investment in the irrigation sector, the decision process
Lack of education and awareness of the, often very complex,
is often based on opportunities for financial aid from donors. It
consequences of high fertility and population growth;
takes into account neither the real costs, nor the recurrent costs
Social and cultural conditions favouring large families;
(Titčcat 1998). Apart from the cost of manpower, the factor costs
Need for old-age economic security and support through a large
(e.g. concrete, steel, energy) are very high in the region and result
extended family;
in investment costs which, reported per irrigated hectare, are
Need for labour in labour-intensive subsistence agriculture;
commonly three times higher than in developed countries. The
Lack of income alternatives.
beneficiaries of irrigated parcels neither pay the investments nor
the maintenance of the instal ations, nor do they pay for the water
Perhaps surprisingly, lack of knowledge of family planning is not seen
they consume. This implies that a part of the water resource is
as an important cause.
al ocated to uses that at the end of the day are profitable to a few
people but represent a loss to the community as a whole. Moreover,
The population growth in the rural area with its very limited productivity
this situation is very inequitable since the farmers working the
has forced a significant number of the population to leave the farms and
irrigated parcels benefit from these abnormal y advantageous
migrate to the cities in search of better living conditions and income
conditions compared to others.
opportunities. The population pattern is becoming more concentrated
Urban water supply systems are most often inefficient, causing
and may, if left uncontrol ed, create critical hotspots, where it wil be
severe unproductive losses through evaporation in reservoirs and
increasingly difficult to satisfy the water demand.
leakage losses in the distribution system. Up to 30% of a reservoir
90
GIWA REGIONAL ASSESSMENT 42 GUINEA CURRENT
CAUSAL CHAIN ANALYSIS
91
volume may be lost by evaporation, and leakage losses of 20-30%
Lack of a realistic enforcement framework to make
are common, but not abnormal since the losses may reach 50% in
implementation of legal water initiatives realistic;
some cities of industrialised countries.
Lack of economic instruments to achieve a more optimal water
Heavy evaporation losses from reservoirs appear to be a problem
al ocation and demand management;
without solution in the context of West Africa (hot climate and flat
Lack of transparent and cost-efficient financing and cost-
topography). There is a need to look into alternatives for reducing
recovery of water projects;
these losses. Some attempts to cover the surface of water with
Lack of credible fora for fair and transparent solution of water
chemicals supposed to reduce evaporation have been made in
al ocation conflicts between different stakeholder groups;
the urban lakes in Ouagadougou (ONEA11, pers. comm. 2001) but
Insufficient facilities for awareness raising about water issues
the results are not convincing.
among the relevant stakeholder groups.
Lack of appropriate governance and increasing water shortages
Summary of the causes of freshwater shortage
The Volta Basin is characterised by an unusual number of severe
in the Volta Basin
conflicts and mismatches between water supply and demand. Due
The immediate causes of the severe freshwater shortage in the Volta
to the upstream-downstream character of the issues, these conflicts
Basin were primarily associated with modification of the stream flow,
are local, regional, as wel as international, and non-optimal solutions
due to three main impacts:
- based on the power of special interest groups - often increase the
Reduction in natural rainfall input to the river system over the last
already severe shortages. Specific causes are identified as deficiencies
40 years;
in:
Increased diversion - and water losses - to satisfy agricultural water
The enabling water management setting with an international y
needs in the rural development sector;
and national y binding policy framework setting the goals for water
Increased diversion and associated water losses to satisfy the water
use in the economic sectors, including protection and conservation
supply needs of the ongoing urbanisation and industrialisation.
needs. Also, the international and national legal frameworks are
inappropriate, without setting fair, transparent and equitable rules
The root causes behind these impacts were identified as:
for water rights and water al ocation to specific uses.
1) Environmental conditions in the arid Sahel region, with decreasing
The institutional framework at both national and international level
precipitation;
which is insufficiently equipped to address the shortage issues,
2) The rapidly increasing population, creating increasing needs for
due to lack of institutional authority and capacity, as well as lack of
basic water supply and for agricultural production;
efficient instruments to address these shortages, such as:
3) The lack of appropriate technological responses to the water
Lack of a comprehensive and decision-oriented water
shortages, such as development of water efficient agricultural
monitoring system, including data and indicators on both
production systems and urban-industrial water supply systems;
water supply and water demand, including monitoring of
4) The lack of an appropriate governance framework to address the
the important socio-economic links between supply and
water conflicts in the Volta Basin.
demand;
The links in the causal chains are schematical y outlined in Figure 37.
Figure 37 Causal chain diagram illustrating the causal links of freshwater shortage in the Volta Basin.
11 Office National de l'Eau et de l'Assainissement (Burkina Faso)
92
GIWA REGIONAL ASSESSMENT 42 GUINEA CURRENT
CAUSAL CHAIN ANALYSIS
93
Modification and loss of
this average figure hides the extreme annual variation from high waters
ecosystem: Case of the Niger
in the rainy season to low waters in the dry season.
Basin
A main characteristic of the Niger River is the arid character of most
of its catchment. Only the headwaters in Guinea and the Lower Niger
Introduction
have humid conditions with plenty of rainfal . This general lack of rainfal
The Niger Basin has been selected as a typical example of an international
is further aggravated by the climatic evolution. For the past three
river system in West Africa. It is characterised by significant changes in
decades the Sahel has been experiencing persistent drought resulting
the aquatic ecosystems, partly due to the stream flow changes caused
in drastical y changed annual mean rainfal patterns and a southward
by the climatic evolution observed over the last 40 years in the Sahel
shift of rainfal zones by 100 km (Figure 31). A significant decline in rainfal
region (Nicholson et al. 1988, Hubert & Carbonnel 1987), partly due
has been observed in the region since the late 1960s. Consequently, the
to the land degradation caused by unsustainable land development
Niger River and its tributaries have shown great variability over the last
practices of a rapidly growing population (ABN/GEF/UNDP/World
four decades because of the drought. It is known that since the run-off
Bank 2002). Three countries dominate the international basin: Mali and
is the difference between rainfal (variable) and evaporation + infiltration
Niger in the upstream waters (54%), and Nigeria in the downstream
(more or less constant), the reduction in rainfal is amplified in terms of
catchment (28%). They constitute the key players in the international
reduction in the discharge of the River. Thus, a reduction of 30% in rainfal
aspects of water management, but the other member countries of the
may cause a reduction of 60% in the run-off (Servat et al. 1998).
Niger Basin Authority (NBA) i.e. Benin, Burkina Faso, Cameroon, Chad,
Côte d'Ivoire and Guinea also have important interests in the water
The aquatic ecosystems in the Niger Basin
resources management of the Niger Basin.
Most aquatic ecosystems are associated to the floodplains of rivers
and watercourses of the Basin. The strongly seasonal rains cause over-
The Causal chain analysis has identified a complex pattern of causes
flowing of almost al the southern rivers and watercourses. The more
behind ecosystem modification. The most important ones comprise
important floodplains are spread out from the Gulf of Guinea border
changes in stream flow and increased sediment loads:
to Bamako, but they have to a great extent been converted into rice
Climatic variations have caused a reduction of average rainfal , and
fields. There are also many secondary floodplains in Mali, Niger, Burkina
in the seasonal distribution, in the headwaters in the Sahel of about
Faso, Benin and Cameroon. In Nigeria, a wide floodplain is spread out
30% within the last four decades. The associated change in stream
from the entry of Niger River to Nigeria as far as Yelwa and another one
flow pattern has significantly altered the fundamental balances of
upstream of the delta in Nigeria near Onitsha.
the aquatic ecosystems. Concurrently, the droughts have created
severe desertification and land degradation, leading to soil erosion
The Inner delta is a wetland of international importance and covers a
and increased sediment loads in the rivers.
land area of around 3.2 million ha (main delta and associated wetlands).
Population growth has led to significant increases in water
The wetlands support 20% of the population in Mali economical y and
diversions and depletion of the arid agricultural lands.
produce almost 100 000 tonnes of fish annual y. They form a dense
Unsustainable agricultural techniques and practices have increased
network of val eys lined with al uvial levies between which are low
soil erosion and the sediment load and sedimentation of the
plains strewn with ponds. The system of val eys or creeks conveys
ecosystems.
water towards plains during the rainy season and conversely, ensures
Poverty limits the ability of the population to address the degradation
withdrawal of water towards rivers and waterways during dry season.
by introducing and investing in more sustainable land practices.
There are several lakes; the most significant are Debo (the widest within
Lack of efficient governance has aggravated the situation by not
the delta complex), Korienze and Faguibine. In an international waters
being able to address the issues efficiently.
context, the Inner delta is highly dependent on the condition of the
humid forested headwaters in Guinea, and their impact on the inflow.
System description
The River Basin
There are also a large number of natural lakes and artificial dammed
The Niger Basin is described in detail in the first section of the report. It
reservoirs for generation of hydropower and for irrigation and water
drains a catchment area of about 2.1 million km2. At the outlet, the River
supply. These reservoirs are themselves important ecosystems and they
has an average annual flow of around 5 000 m3/s. Like the Volta Basin,
are most sensitive to changes in inflow and sediment loads. Through
92
GIWA REGIONAL ASSESSMENT 42 GUINEA CURRENT
CAUSAL CHAIN ANALYSIS
93
artisanal fishing, they provide a very important source of animal protein
been changed significantly by the climatic changes in the region. The
for the population in the Basin.
annual flows have been reduced, droughts have been extensive and
correspondingly, river plains, lakes and wetlands have been reduced
The Niger delta is an extensive wetland with an area of about
and significantly depleted, with corresponding impacts on the fish
70 000 km2 (Shel 1999). Its distinctive ecological attributes include
and water bird populations. But stream flow has also been modified
sandy ridge barriers, brackish or saline mangroves, seasonal swamps
by human actions, in the form of increased diversions to satisfy water
and lowland rainforests. The delta comprises four major ecological
needs of the rapidly growing population and - to a much less extent
zones: the barrier island complexes, the vegetated tidal flats, and the
- the irrigation needs of agricultural crops. The establishment of
lower and upper flood plains. Influences of the flood region of the Niger
reservoirs has significantly increased evaporation losses.
River and tidal inversion of the Atlantic are the principal drivers of the
hydrology. The coastal area of the Niger delta is general y low lying and
A particular impact of reduced river flow may be found in the very
interspersed with marshes, lagoons and mangrove swamps. The delta
productive brackish ecosystems in the coastal regions, in particular the
and associated wetlands of the Niger River are noted to be one of the
estuaries, lagoons and mangroves. With reduced freshwater inflow, the
largest wetlands in the world.
salinity increases and destroy the sensitive environmental balances in
fragile coastal ecosystems. Important species are unable to adjust to
The people
the new conditions and disappear. As many people depend on the
The total population of the Niger Basin was approximately 106.5 million
productivity of coastal fisheries, socio-economic impacts may be severe
inhabitants in 2002 (GIS analysis based on ORNL 2003). The average
in the affected regions.
annual growth rate is about 3% (UNDP 2002). Thus the population
figure is expected to almost double by 2020. Population density varies
Secondly, changes in the quality of the river waters have been changing
significantly from a few inhabitants/km2 in the arid lands in the north
the ecosystems. Most significant are the increases in sediments,
to more than 100 inhabitants/km2 in the south.
impacting both water quality and sedimentation patterns in the
riverbeds and flood plains. Deposition of the increased sediment
Presently, about 75% are subsistence farmers and depend directly on
loads reduces wetlands and lakes (in combination with the reduction
the productivity of the natural resources in their direct neighbourhood.
in inflows), and coastal estuaries and lagoons become silted up (Niger
Poverty is the norm, and it has been estimated that more than 50% of
Basin Authority 2002).
the population live on about 1-2 USD per day. In the central regions,
a combination of drought and population growth has caused severe
Another, so far much less important, cause is related to the losses from
overexploitation of resources and severe depletion of soil and
intensive mono-cropping farmlands. In some places, the increased use
vegetation. Agriculture is predominantly rain-fed, and only a few
of mineral fertilisers and pesticides in monoculture production such as
percent of the land used for cultivation has access to irrigation.
rice, sugar cane, cotton, and garden vegetables is the cause of increased
salinisation of soils and eutrophication of the rivers manifested in the form
The lack of income opportunities has led to extensive transmigration
of increased algal growth and invading floating aquatic weeds. Also, release
from the rural areas to the towns, including the large cities outside the
of pesticides very often so toxic that they are il egal in the industrialised
Basin (e.g. Abidjan, Accra, Lomé, Cotonou and Lagos). Urban areas in
countries can cause severe disruptions local y. Moreover, some people
the catchment presently contain about 37 million inhabitants, but are
use pesticides to catch fish in lakes and rivers, with severe consequences
expected to grow significantly by 2020.
for both human health and aquatic life. The human activities behind these
causes are primarily related to the rural, agricultural sector.
The immediate causes of ecosystem
modification in the Niger Basin
Human overexploitation of the fragile soil and water resources in the
The Causal chains have been established by a local Task team, headed
arid lands is the most important factor leading to soil degradation,
by a Niger Basin Authority expert. The CCA has been validated during
intense erosion and desertification. When populations increase, the
a workshop held in Ouagadougou, February 2003. The modifications of
old sustainable farming practices become obsolete. Current agricultural
the aquatic ecosystems are caused by two basic changes in the water
practices have abandoned crop rotation, resulting in reduced fal ow
supply to the ecosystems: water flow and water quality.
periods leading to the loss of soil fertility and less productivity of
First and foremost, the fundamental ecological factor of water flow has
cultivated land. This vicious cycle leads to a need for further bush
94
GIWA REGIONAL ASSESSMENT 42 GUINEA CURRENT
CAUSAL CHAIN ANALYSIS
95
clearing for land development, and further destruction and erosion
The present analysis wil focus on the root causes for important changes
of the fragile soils.
in water quality, in particular the increase in suspended solids. The issue
of eutrophication will be treated in the case of Comoe Basin.
Also, livestock herds can grow beyond the carrying capacity of the
rangelands, and over-grazing depletes the sparse natural vegetation
Climate change
cover and exposes the soils.
Climatic evolution has further reduced the low productivity of the
arid lands of Sahel (WCMC 1993, Awosika et al. 1992). As seen from the
Hydro-agricultural developments through large-scale irrigation projects
previous section, unsustainable land use is a key driving force behind
and semi-intensive irrigation, which are on the increase within the Basin,
the land degradation and the excessive sediment yields. Initial y, it
especial y in Mali, Nigeria and to a lesser extent Niger, include a number
should be emphasised that the basic climatic conditions in the arid
of components such as mobilisation works, regulation works, transport
Sahel region put severe strains on the productivity of the land. In the
works and network systems. The installation of these works, poor water
past, the population had adjusted itself to these adverse conditions, and
supply and poor drainage systems can have negative influences on the
when the population density was low, it was possible to provide basic
biophysical environment and the flow regime of the fluviatile area.
sustenance for everyone; settled agriculturalists, as wel as migrating
livestock herders.
It should be noted that water demand is not seen as a significant cause
of the modification of the aquatic ecosystems, in relation to the climatic
Population growth
evolution and the land use impacts.
Population growth has significantly increased the pressure on the
natural resources (WCMC 1993). The recent demographic trends have
Root causes of ecosystem modification in the
drastical y impacted the delicate balance between man and his natural
Niger Basin
resource assets. During the last 30 years, the population in the Niger
The immediate causes of ecosystem modification were described
Basin has doubled. With the current population growth rate of 3% it is
above. However, the immediate causes are driven by underlying,
estimated to double again by the year 2020 (UNDP 2002). In the same
basic root causes, which also need to be identified to achieve a full
time period, the fundamental per capita pressure on land and water
understanding of the combination of environmental and socio-
resources will increase in relation to urbanisation and rising standards
economic processes behind the depletion of the biodiversity of the
of living. Accordingly, the overall pressure on land and water resources
aquatic ecosystems in the Niger Basin (CILSS, n/d).
will increase by more than 100%. Fortunately, from the point of view of
the rural sector, many people migrate to the cities in search of better
The root causes behind the changes in stream flow have been
living conditions. But the rural population stil grows; larger families
analysed for the Volta River in the previous section. These conclusions
need more food from their lands, and there is less and less productive
apply equal y wel to the Niger Basin. Also, salinity changes in coastal
land to support the new generations. The farmers wil have to break
ecosystems belong to this category due to changes in flow. Accordingly,
new land through deforestation and bush clearance, and the herders
this analysis wil not be repeated here, but the main root causes for
will have to increase their herds. Concurrently, the water diversions for
quantitative shortage should be recal ed:
agriculture and water supply have increased.
Natural root causes:
Arid climate, reduction in rainfall
Reduction of run-off and
Lack of technology
flow in rivers.
Lack of technological innovation has led to unsustainable land
Human root causes:
management practices (Moffat & Lindén 1995). The associated land
Population increase, urban transmigration, rising standards,
degradation might have been al eviated, if farming and herding
economic sector development + Lack of appropriate water
technologies and practices had been adjusted to the new conditions.
efficient technology + Lack of appropriate water governance
Initial y, indigenous practices were, through centuries of trial and
Increase in water demand and losses.
error, sufficiently robust to negotiate the adverse conditions. But the
Consequences:
increase in demand on land and water due to the population growth
Reduction of run-off and flow in rivers + increase in water
has rendered these techniques outdated. Lack of education, awareness
demand and losses
water shortage.
and funds severely constrain the development of more appropriate
agricultural practices.
94
GIWA REGIONAL ASSESSMENT 42 GUINEA CURRENT
CAUSAL CHAIN ANALYSIS
95
Poverty constraints
this important issue of land tenure. Proper governance is particularly
Poverty limits the potential of the population to address the degradation
critical in the case of protection of the productivity of the aquatic
efficiently. This leads to the fourth root cause, the abject poverty in the
ecosystems, but is low on the national and international agenda. If the
region. The links between poverty and environmental degradation are
land resources are mismanaged, there is very little potential for water
not so straightforward and simple as many are led to believe (Reardon
resource managers to respond efficiently. Unfortunately, there is a lack
& Vosti 1995). Many wealthy people in the region also participate in
of specific documentation and monitoring of the complex interactions
environmental degradation, and most poor people wil , if properly
between the socio-economic parameters and how they impact on the
informed and equipped, definitely understand that they have a crucial
land and water resources. Also, the lack of involvement of all relevant
interest in maintaining the resource base they are living on. But it appears
stakeholders in a transparent co-operation makes it difficult to make
that investment in improved land management technologies involves
effective policy implementation, not least at the local level, where the
resources (monetary, information and education) that are not readily
need for action is the greatest.
available among poor farmers in the Sahel. When hunger threatens
a poor family, it has no capacity to consider long-term conservation.
Summary of the causes of ecosystem depletion
Also, the potential for the farmers to raise their incomes is limited, in
in the Niger Basin
particular due to the inequalities and failures in the agricultural markets.
The immediate causes of the ecosystem depletion in the Niger Basin
As such, combined with the impossibility to achieve owner right to land
were primarily associated with three main issues:
property, it is very difficult, or simply impossible, for the farmers to invest
Reduction in stream flow due to climatic change has had a
in improving their land and water efficiencies.
significant impact on one of the basic parameters in the fragile
aquatic ecosystems in the arid regions of the Basin. Also, reduction
Inefficient governance
in flow at the outlet has had impacts on the coastal ecosystems and
Lack of efficient governance constrains the possibilities for governments
their productivity;
and stakeholders to address the issues. The root causes outlined above
Increased sediment loads have changed the water quality and the
are further aggravated due to a lack of efficient governance to address
sedimentation patterns in flood plains, lakes and wetlands. Important
the causes and to overcome the problems in a comprehensive way.
species and sources for protein have been affected by this;
Wel -intended, but unfocused and uncoordinated donor projects
To a minor extent, increased nutrient levels and the occasional
have not been able to seriously reverse the downward trend. The
occurrence of pesticides have caused impacts on the aquatic
Niger Basin is characterised by severe conflicts and mismatches
environment.
between economic development and protection of the productivity
of the aquatic ecosystems. These conflicts are local, regional, as well as
The root causes behind these sector causes were identified as:
international. Under such conditions, the lack of an efficient governance
Adverse climate change has further reduced the already low
system is critical, if sub-optimal or even damaging activities are to be
productivity of the arid lands of Sahel;
control ed. In most countries of the Basin, the land is owned by the
Population growth has significantly increased the per capita
State, not by the farmers. There is an urgent need to reform and clarify
pressure on the natural resources;
Figure 38 Causal chain diagram illustrating the causal links of ecosystems depletion in the Niger Basin.
96
GIWA REGIONAL ASSESSMENT 42 GUINEA CURRENT
CAUSAL CHAIN ANALYSIS
97
Lack of technological innovation has led to unsustainable land
change is that the Comoe river flow now receives the waters of four
management practices;
coastal rivers before arriving at the ocean shore: Mé River, Bété River,
Poverty limits the populations potential to address the degradation
Djibi River and Agnéby (or Agbo) River.
efficiently;
Lack of efficient governance constrains the possibilities for
The Mé River is now a right bank tributary of the Comoe River, into
governments and stakeholders to address the issues.
which it flows after having traversed the Potou Lagoon. The Mé Basin
is a smal agricultural basin in the proximity of Abidjan. The heavily
It is apparent, that the root causes are primarily of a systems nature, and
eutrophicated waters of the Mé River are permanently invaded by water
they are to a relatively limited extent related to any perceived lack of
hyacinth (Eichhornia crassipes). The interest of this basin is that it has
project investment and funding.
been the object of a computer model of exchanges between lands and
waters in the framework of the aforementioned GEF/UNDP project.
The links in the causal chains are schematical y outlined in Figure 38.
Water quality assessments have been carried out, based on systematic
measurements in the Basin, and compared to computer calculations
with the DHI Mike Basin Model, using available information on point
Eutrophication: Case of the
sources, population, livestock, use of fertilisers, rainfal and run-off in
Comoe Basin
the Basin.
Introduction
The model includes a description of the degradation of water quality
The Comoe Basin has been selected as a typical example of an
in the River, as a function of BOD (Biochemical Oxygen Demand),
international river system in West Africa impacted by excessive
ammonium, nitrate, time and temperature.
enrichment of nutrients (i.e. phosphorus and nitrogen) in the water,
giving rise to proliferation of aquatic plants and algal blooms in the
Immediate causes of eutrophication in the
lagoons and along the shoreline, near the outlets of eutrophicated
Comoe Basin
rivers. This type of pol ution, cal ed eutrophication, was studied
Running and calibrating the Mike Basin model of the Mé Basin has
thoroughly within the frame of the GEF/UNDP biodiversity project
permitted the drawing of the fol owing conclusions regarding the
"Control of exotic aquatic weeds invading the water bodies of Côte
immediate causes of eutrophication.
d'Ivoire to enhance/restore biodiversity".
The discharges of nutrients to the water include: load from people living
It is an international problem since the algal blooms occurring in
in the Basin, load from livestock, and load from fertilisers. Additional
Ghana, are thought to be provoked by eutrophication of rivers from
short-term inputs are due to deforestation practices entailing burning
Côte d'Ivoire (Bia, Tano and Mé rivers) carried towards east by the
of vegetation fol owed by intense erosion of arable land including
coastal currents.
its organic matter. Besides eutrophication, these practices are also
responsible for turbidity.
System description
The Comoe River Basin is described in detail the first section of the
The specific quantities released by each category are well known and
report. The total catchment is 78 000 km2 and it is shared by four
used as calibration factors in the model. But the quantities arriving into
countries: Côte d'Ivoire (58 100 km2), Burkina Faso (16 900 km2), Ghana
the rivers are a function of drainage systems, agricultural practises,
(2 300 km2), and Mali (700 km2). One of the special features of the Comoe
nature of the soil in the given area and of the distance (i.e. the time)
River is the mobility and variability of its bifurcated mouth.
the nutrients have to travel from their source to the water way. Table
39 and Table 40 respectively show the factors of emission of nutrients
Since the opening of the man-made Vridi Canal in 1951, the natural
from human beings and animals, and the total loads of nitrogen and
outlet in Grand-Bassam became intermittent (it has been closed for
phosphorus calculated in the Mé catchment.
many years now). The new outlet of the Comoe River is now the Vridi
canal, which is located approximately 40 km west from the natural
No point source (such as an agro-food plant or sewage discharge from
outlet of the River in Grand-Bassam. Another consequence of this
a city) is present in the Mé catchment. However, these types of sources
96
GIWA REGIONAL ASSESSMENT 42 GUINEA CURRENT
CAUSAL CHAIN ANALYSIS
97
Table 39 Conversion factors used in the DHI Mike Basin model:
due to erosion are of the same order of magnitude as al other sources
specific nutrient loads released by humans and animals
combined. The discharge of phosphorus from newly cleared land is 6 to 7
by year in the Mé catchment.
times higher than the actual average discharge of phosphorous.
N (kg/unit)
P (kg/unit)
BOD (kg/unit)
Humans
5
0.5
14
Another conclusion of the modelling study is that for sites having the
Cattle
51
20
-
Pigs
20
7.4
-
highest concentrations of suspended solids, the content of chlorophyl a
Sheep/goats
33
7.4
-
is low. This relation indicates that the phytoplankton growth is limited
Poultry
0.43
0.23
-
by the dimming of light because of the suspended solids at many
(Source: DHI Water & Environment 2002)
stations. The suspended solids increase the turbidity and limit the
Table 40 Computed total loads in nitrogen and phosphorus in
penetration of light into the water. Without light, the phytoplankton
the Mé catchment using the DHI Mike Basin model.
cannot fix the nutrients and this thus enables invasion by waterweeds,
Fertilisers
Animals
Domestic sources
the growth of which is not limited by turbidity since they absorb light
Abidjan
455 471
7 165 751
981 211
directly from their aerial leaves.
N (kg)
Adzopé
129 279
17 978 928
336 767
Alépé
499 338
20 421 778
693 049
Abidjan
1 269
2 189 072
112 138
Root causes
P (kg)
Adzopé
101 023
5 421 627
38 488
The immediate causes of eutrophication in the Mé Basin (applicable to
Alépé
294
6 152 015
79 206
most basins in the region) are thus the fol owing:
(Source: DHI Water & Environment 2002)
Non-point sources:
are present in the Banadama River catchment (to the west of Abidjan)
Human excreta and lack or failure of sanitation systems;
and their relations to eutrophication have been studied through the
Animal excreta in proximity to river courses;
same computer model (DHI Water & Environment 2002).
There is still weak (permanent) erosion on cultivated fields, but
inputs due to erosion are significantly higher in the periods of
The fertilisers only represent a smal fraction of the nutrients in the Basin
intense deforestation or just after bush fires;
compared to animal and domestic sources. The majority of nutrients are
Misused fertilisers yielding higher inputs to the water system,
used in the growth of annual crops that fix the nutrients quite wel , as
combined with miscalculated compositions and incorrect
long as the fertilisers are not added in too large quantities and are not
spreading periods. However, the overall use of fertilisers in the
washed out just after spreading.
Guinea Current region is low since financial constraints impede
regular use as seen in the developed countries.
The model indicates that the input of nutrients increases with the
Point sources:
population density. This is particularly significant when comparing the
These are not observed in the Mé Basin but their effects have
northern with the southern parts of the Mé Basin.
been assessed in the neighbouring Bandama Basin. Here agro-
industrial units and dense human settlements use the natural
The model calculations seem to indicate that the input of nutrients
water system as sewers.
coming from non-point sources is presently limited. The transport
coefficients are not elevated. Nevertheless the discharges resulting from
The root causes can be subdivided into the fol owing categories.
human settlements and animal excreta seem to be the main source of
observed nutrient concentrations in the River. It is thought to be most
Demographic
likely that a significant part of that source is caused by direct inflow that
The eutrophication is proportional to the density of population in the
could be avoided by placing water holes away from the riverbanks and
catchment. Moreover according to the Comoe Basin team the impact
by ensuring that human excreta cannot enter the water directly.
of human excreta is aggravated by the lack (or failure) of sanitation
systems.
It is however possible that the significant nutrient load has rocketed
along with the deforestation (very intense in the late 1970s and early
Knowledge
1980s) because of erosion of formerly vegetated soils having high
Inadequate knowledge about the use of fertilisers contributes to
contents of nutrients and ashes originating from burning. Per hectare of
increasing the nutrient loads in the waters. Failures in sewage systems
deforested land, the additional discharges of nitrogen and phosphorus
have the same effects. Many awareness-raising campaigns have been
98
GIWA REGIONAL ASSESSMENT 42 GUINEA CURRENT
CAUSAL CHAIN ANALYSIS
99
organised in West Africa to combat bush fires. But, until now, the
to limit aquatic weeds proliferation) is to have sound environmental
rural populations have inadequate understanding of the causal chain
management of the catchment, fol owing IWRM (Integrated Water
starting with their agricultural practices leading to the invasion of water
Resources Management) principles. Land and water have to be
bodies by the aquatic weeds.
managed together, using a participatory approach associating all
stakeholders in the catchment: e.g. farmers, herdsmen, fishermen, heads
Poverty
of vil ages, elected representatives and industrialists. This is not the case
The method used to clear the vegetation before cultivation (bush fires)
in most of the basins of the region where IWRM is still an objective, not
is typical among poor farmers applying the most economic method
a reality. The statutes of the catchment management bodies must be
they can find. The effects are general y that: (1) the surface cleared is
embodied in the institutional framework and the opportunity for their
larger than necessary, and (2) the discharges of organic matter to the
establishment must be accommodated by law. The way the catchments
rivers provide nutrients that cause eutrophication of the waters.
have to be managed must be part of the water policy.
Socio-cultural
Summary of the causes of eutrophication in the
Clearing the vegetation by using bushfires occurs not only for economic
Comoe Basin
reasons. It is also a general practise in the region and it comes with other
Figure 39 summarises the Causal chain analysis for eutrophication in
traditional (but il egal) activities such as poaching of animals fleeing the
the Comoe Basin, linking eutrophication with immediate causes, and
fire. The presence of aquatic weeds is considered to have supernatural
immediate causes with root causes, as presented here above.
causes, while the scientific explanations are difficult to understand/
believe for rural populations.
Legal
Chemical pollution: Case of the
General y farmers in the region are not the owners of land. The
Guinea Current LME
consequence is that they do not bother about the sustainability of their
practices. The discharges from agro-industrial plants are not estimated
Introduction
in the context of Environmental Impact Assessments (EIAs) and are not
The Guinea Current Large Marine Ecosystem (GCLME) is a typical
control ed by environmental audits.
example of an international marine area impacted by land-based
pollution.
Governance
This is a key root cause since it has been assessed by the GEF/UNDP
While most impacts are localised, the problems are common to all the
Aquatic Weeds project that the best way to reduce eutrophication (and
16 countries bordering the LME and require col ective action to address
Figure 39 Causal chain diagram illustrating the causal links of eutrophication in the Comoe Basin.
98
GIWA REGIONAL ASSESSMENT 42 GUINEA CURRENT
CAUSAL CHAIN ANALYSIS
99
the pol ution from municipal, industrial and agricultural sources. For
Immediate causes of chemical pollution in the
example, eutrophication and algal blooms are a common problem in
Guinea Current LME
most of the countries (see previous sections) and require col ective (or
The immediate causes of chemical pol ution by heavy metals in the
at least co-ordinated) action.
Guinea Current LME were identified as fol ows:
Discharge of effluent from industrial or craft activities (mainly
Heavy metals originate mainly from mining and other land-based
surface treatment in urban areas, using silver, copper, chromium
industrial activities. The rivers transport them to the Ocean, either
and cadmium);
directly or via the coastal lagoons. When arriving in the Ocean,
Release from mining (e.g. mercury used by artisanal gold miners);
the pol utants drift to the east with the Guinea current and spread
Discharge of solids (e.g. batteries containing mercury or lithium
throughout the entire LME thereby contributing significantly to the
from domestic waste);
global pollution loading in international waters.
Run-off and stormwaters causing leaching of landfil s;
Leachates from landfil s, containing the solids quoted above,
This is the reason why, among the different types of pol ution
conveying the pol utants to surface waters and/or to groundwater
inventoried in the region, chemical pol ution is considered to be one
aquifers. The pol utants originating from the solid waste are mobilised
of the most critical international issues, due to its long-distance and
in the aquatic phase and enter the bio-geochemical cycle.
long-term impacts.
A study carried out on land-based polluting industries situated within
System description
the 30 to 50 km strip of the shoreline in Côte d'Ivoire, Ghana, Benin,
The studies conducted on the Guinea Current LME show significant
Nigeria and Cameroon (GEF/UNIDO-GCLME Project 2003) focused on
levels of pol ution regarding pathogens and microorganisms in sewage,
the fol owing categories of industrial plants: food manufacturing and
industrial effluents with high organic loading and hazardous chemicals,
beverages, textiles, chemicals, petroleum and petroleum products,
heavy metals, oils and hydrocarbons and tarbal s on beaches. Among
pulp and paper, the metal industry and mining, wood processing and
these issues, that of chemical pol ution by heavy metals is considered to
pharmaceuticals.
be particularly critical as an international issue for various reasons:
Heavy metals concentrate along the food chain until the final link
This study revealed the fol owing as contributing factors to pol ution
i.e. human beings. The corresponding health hazards are important
in the coastal areas:
and the consequences, in socio-economic terms, are severe.
Absence of pol ution abatement infrastructure in the region
Heavy metal pol ution has long-term and long distance impacts.
thus leading to uncontrol ed discharge of untreated effluents
Therefore, it is typical y an international issue contrary to organic
and wastes;
pollution or microbiological pollution, which remain confined.
Absence of common effluent discharge standards;
Heavy metal pollution is typical y a land-based pollution, contrary
Absence of Environmental Impact Assessments (EIAs);
to hydrocarbon pol ution that, to a great extent, has its origin in
Insufficient human and material resources assigned to
tankers emptying bal ast water and from exploitation mainly at the
monitoring of the environment;
mouth of the Niger River.
Inadequate financial resources for implementation and
compliance enforcement of regulations where they exist;
General y, environmental stress from land-based sources and activities is
Insufficient public awareness and concern about pol ution
global y considered to contribute about 70% of the coastal and marine
issues due to poverty and its related hardship.
pol ution, while maritime transport and dumping-at-sea activities
contribute about 10% each. The stresses arising as a result of interactive
Root causes of chemical pollution in the Guinea
human developments and consequential increases in harmful impacts
Current LME
on the environment and natural resources of the Guinea Current LME
The origin of immediate causes mentioned above is a matter of a number of
were identified in the GCLME Transboundary Diagnostic Analysis (TDA)
various root causes that, combined together, lead to the actual situation.
(GEF/UNIDO-GCLME Project 2003).
Technological
Often the processes used by industry and mining in Africa are not up to
date. They utilise pol uting methods and machinery. Financial constraints
100
GIWA REGIONAL ASSESSMENT 42 GUINEA CURRENT
CAUSAL CHAIN ANALYSIS
101
do not al ow replacement of old instal ations with modern more efficient
Knowing the shortcomings of the controlling administration, industry
ones. These technological causes are encouraged due to the absence
managers realise that it would be difficult to make their instal ations
of environmental controls at al levels of industry and mining (this root
compliant with the law. They often prefer to avoid the controls by
cause is also combined with some of the fol owing root causes).
paying small sums to the control ers instead of investing large sums in
new environmental y friendly instal ations.
Knowledge
Industry technicians are not trained in clean technologies and they
Environmental impact assessment studies and environmental audits
are general y incapable of relating their professional activities to the
are not systematic, even though they are inferred by law. Special
proximal or more distal environmental degradation. They have not been
procedures for delivering "priority agreements" to key investors,
trained in the understanding of the sanitary threats posed to aquatic
as they are general y seen in most of the countries of the region,
life or its dependants while on the other hand the population are not
have been designed to improve and facilitate foreign investment.
aware of the dangers they face. Environmental monitoring is weak and
These sometimes have the effect of increasing the pressures on the
systematic measurements of pol ution levels in water, sediments, fish
environment by authorising the operation of instal ations that would
and crustaceans are not practised.
be prohibited in the developed world.
In Côte d'Ivoire, where the larger part of the Comoe Basin is situated, the
The population is not associated to the EIAs and is not consulted
National Observation Network (RNO-CI), financed by Danida12 from 1990
with respect to what nuisance they may be exposed to. The only
to 1995 to establish permanent monitoring of the water quality, is not
way unsatisfied people can make their voice heard is to use physical
wel functioning since 2000. The international programme GEMS/Water
measures like blocking the entrance of a factory or a mine. This was
(Global Environmental Monitoring System) is no longer operational in
the case when the Maféré gold mine in Côte d'Ivoire caused massive
the region. Although analyses exist, there is no intercalibration between
fish-kil s in the nearby river. The artisanal gold miners deploying large
different laboratories al owing direct comparison of the results, within
quantities of mercury for the fixation of gold often manage to stay out
one country or from one country to another. Under these conditions,
of reach of the authorities. Their number is unknown as is the quantity
it is difficult to judge where the situation is the most severe and to
of mercury they disperse into the environment.
prioritise actions.
Efforts of one country are seldom co-ordinated with the neighbouring
The existing data is not brought forward to the decision makers, and
countries. Improvements gained with difficulty in country-A can
the politicians themselves are not surrounded by technical advisers
be annihilated by the transboundary pol ution resulting from the
who could be capable of: (i) interpreting the data; (i ) understanding
degradation of the situation in neighbouring country-B.
the situation; (iii) forwarding the conclusions to the level of the policy
makers; and (iv) proposing how to include this important information
Chemical pollution issues have by the way been outlined and analysed
in the decision making. At this point, root causes associated with lack
in the National Environmental Action Plans (NEAP) that al countries
of knowledge among the decision makers are closely linked with root
made during the 1990s. Measures have been proposed to suppress,
causes related to poor governance.
mitigate or compensate the identified environmental damages
(through action programmes, projects, budgets). One is forced to realise
Governance
that in the countries of the region, most of the projects suggested in
The governments of the region only devote very limited budgets
the NEAPs have not been implemented and most of the projects that
to monitoring of the environment. The taxes imposed on pol uting
have been implemented over more than 10 years are not the ones
instal ations are merged into the (often in deficit) national budget. The
proposed by the NEAPs.
corresponding incomes are not ful y al ocated towards environmental
restoration. Examples of misappropriation of funds have been
It is also well known that a number of projects aimed at protecting the
reported; payments for fraudulent invoices for lab furniture, payments
environment have not had the expected outcomes. Despite the lack of
for monitoring missions that never took place, and procurements by
results, some of them were positively evaluated. It is often the practise
institutions dealing with environmental protection of equipment or
to distribute significant daily al owances to participants in project-
material that does not serve its core function.
funded meetings. In this way meetings have often been positively
appreciated by the attendants, even though results are insignificant.
12 The Danish international development assistance
100
GIWA REGIONAL ASSESSMENT 42 GUINEA CURRENT
CAUSAL CHAIN ANALYSIS
101
Environmental laws are in place in most countries of the region, but
Poverty/Economy
they are rarely applied for reasons general y related to the absence or
Besides the societal handicaps, poverty is also an aggravating factor to
the imperfection of the implementation texts (e.g. regulations), which
pollution, since people or enterprises do not have the financial means
can present various errors:
to change their practises. They do not want to give up practises that are
The regulations have not been approved (many countries do not
harmful to the environment but less costly for them, by adopting less
have application decrees of the environment law/code);
harmful but more costly techniques (Reardon & Vosti 1995). Furthermore
The regulations are not precise (for instance by not saying who is
there are no dissuasive financial mechanisms (taxes) nor financial
in charge of filing offences);
incentives (subsidies) that wil make them change their practises.
The regulations are contradictory (for instance those dealing with
Adding to this, the prices of local products are often too low to permit
EIAs and those dealing with investments);
sufficient revenue to be reinvested in pollution reduction. For example
The regulations are incomplete, by leaving behind legislative voids;
the il egal gold-washers in the southwest of Côte d'Ivoire sel their
The regulations create overlapping responsibilities (for instance the
gold at less than half of the international market prices. Furthermore
responsibility of monitoring industrial plants is given both to the
the buyers are often local authorities that in principal ought to respect
Department of Industry and the Department of Environment);
the ban on black market mining. This clearly shows how linkages are
The regulations are in contradiction with cultural traditions (see below).
direct between socio-economic and governance root causes.
The pressure groups that could change the situations (e.g. political
Final y, as stipulated in al environmental laws, the laws do not apply
parties, media and NGOs) are close to the sphere of power. The affected
to activities related to national security or war operations. Conflicts
people (who are the first concerned) are not informed by the authorities
are thus doubly dangerous for the environment: first, environmental
about the risks that they face and have no idea of what to do to change
regulations do not apply to military activities and, second, they create
things to the better.
areas that are beyond the law.
Socio-cultural
Summary of the causes of chemical pollution in
The rules of modern societies addressing technical issues are often in
the Guinea Current LME
conflict with traditions, religions and African life-style. Scientific facts
The root causes of most of the environmental problems in the Guinea
are often in conflict with ancestral beliefs, which make the process of
Current LME have principal y to do with inadequate governance, non-
moving away from environmental y unhealthy practises very difficult.
compliance, ineffective monitoring and enforcement, inadequate
Socio-cultural constraints general y rarely constitute the root cause of
technologies, lack of community support, and lack of legislation/
pol ution but can easily create a gap in its understanding (and therefore
regulation (Figure 40).
its remediation) by those who are responsible for the situation.
Moreover, addressing these root causes is made difficult by the paucity
of reliable, detailed and historic scientific data on coastal, marine and
freshwater environment in the Guinea Current LME.
Figure 40 Causal chain diagram illustrating the causal links of heavy metal pollution in Guinea Current LME.
102
GIWA REGIONAL ASSESSMENT 42 GUINEA CURRENT
CAUSAL CHAIN ANALYSIS
103
Overexploitation of fish: Case
and variabilities; Inter Tropical Convergence Zone (ITCZ) movements,
of the Guinea Current LME
and wind forcing; as well as rainfall and drought cycles. Oil spil age and
other marine pol ution, marine debris in addition to nutrient enrichment
Introduction
and eutrophication are the major anthropogenic factors.
The rich fishery resources of the region are both locally important by
having resident stocks supporting artisanal fisheries, and international
The various studies that have been conducted in the coastal and marine
important by having migratory stocks that have attracted large
environment of the GCLME, within the framework of the UNIDO-GEF
commercial offshore foreign fishing fleets from the European Union,
GCLME PDF-B project, indicate alarming rates of decline of fisheries
Eastern Europe, Korea and Japan.
resources i.e. the State of Coastal and Marine Environment of the Gulf of
Guinea report, the Coastal Areas Profiles of the six Gulf of Guinea coastal
The Guinea Current Large Marine Ecosystem (GCLME) has been selected
states, the National Reports of the 16 countries bordering the GCLME,
as a typical example of an international marine area where the depletion
and the Regional Synthesis report summarising some of these studies.
of fish stocks is becoming critical, first for people living around the LME,
in terms of loss of income, and second for the international community,
Similarly, studies have also been conducted on marine fisheries
in terms of loss of biodiversity.
resources of the Guinea Current region by CECAF13, FAO and ORSTOM14.
Marine environmental and pol ution monitoring programmes have also
The major transboundary/international elements of the problem can
been carried out by WACAF15 in col aboration with UNEP, FAO and WHO.
be summarised as fol ows:
A review of the status of marine fisheries resources in 1994 indicates that
Loss of income from regional and global trade of marine products;
apart from offshore demersal resources, all other fisheries in the region
Region-wide decrease in biodiversity of the marine living resources,
are near to full or ful y exploited (Ajayi 1994). This has resulted in loss of
including the disappearance of critical natural resources;
food security and increased conflicts between commercial (industrial)
Region-wide destructive fishing techniques degrading habitats
and artisanal (community-based) fisheries.
(including mangroves);
Increasing catch effort on pelagic species such as tuna and
In summary, it is recognised that the coastal and the marine ecosystem
sardinel a;
of the GCLME and its resources have witnessed various environmental
Non-compliance with the FAO Code of Conduct for Responsible
stresses as a result of the increasing socio-economic and unsustainable
Fisheries.
developmental activities. All the above studies and assessments have
identified three broad coastal and marine environmental problems and
System description
issues in the GCLME region namely:
The GCLME region, of high ethno-cultural and social diversity, is
1) Fishery resources depletion and loss of marine biodiversity, treated
endowed with abundant renewable and non-renewable resources.
in this section;
The considerable natural resources of this region have not been
2) The decline of water quality due to land-based and sea-based
optimal y utilised for the enhancement of the quality of life of the
human activities;
people. Poverty, paucity of social infrastructure, disease and social
3) Physical degradation, alteration and modification of habitats/
instability are the major characteristics of this richly endowed region.
ecosystems and coastal erosion. This is not treated in this synthesis
Approximately 40% of the population in the region lives in the coastal
report but constitutes significant issues in the GCLME.
areas and depend on the ocean and the lagoons, estuaries, creeks
and associated wetlands and inshore waters surrounding them (GEF/
Immediate causes of overexploitation of fish in
UNIDO-GCLME Project 2003).
the Guinea Current LME
The immediate causes of overexploitation of fish in the Guinea Current
Several physical factors have an impact on the Guinea Current LME.
LME were identified as fol ows:
These include: hydrography, especial y temperature; salinity and other
water quality parameters; tidal ranges; upwel ing and thermocline
Increased fishing effort.
regimes; topography, nature of bottom and trawlability; primary
CECAF13 assessed the biomass of the smal pelagic species in the
and secondary productivity; associated wetlands, lagoons and their
western and central Gulf of Guinea as 392 000 tonnes. The current
estuarine products and services; terrigenous flush; climate evolution
level of exploitation in the area is about 257 000 tonnes annual y clearly
13 Fishery Committee for the Eastern Central Atlantic. 14 Ex-Office de Recherche Scientifique et Technique por le Développment (now IRD). 15 West and Central Africa
102
GIWA REGIONAL ASSESSMENT 42 GUINEA CURRENT
CAUSAL CHAIN ANALYSIS
103
showing overexploitation. Significant changes in species composition
The main root causes were identified as fol ows:
have occurred over time as a result of overexploitation of several
Knowledge
demersal and pelagic fish species, especial y by foreign trawlers in the
Inadequate knowledge of the complexity of ecosystem and high
offshore areas. Recent trawl surveys conducted in Ghana showed that
degree of variability, and insufficient capacity development (human
significant changes were occurring in the demersal fish biomass in
and infrastructure and training) contribute to overexploitation of fish.
terms of distribution, abundance and reproductive strategy (Koranteng
2001a and b). The exploitation rate applied to cuttlefish stocks has been
Governance/Legal
increasing since 1984, and by 1990 was considered to be equal to, or
Lack of efficient governance and legislation is mainly caused by:
slightly above, the optimal fishing effort. The rate of growth of these
poor legal framework at the regional and national levels; inadequate
organisms appears faster than previously estimated (FAO 1997). Such
implementation/enforcement of available regulatory instruments;
changes in fishery patterns appear, in part, to be related to overfishing,
inadequate financial mechanisms and support; insufficient public/
as evidenced by a decline of Catch per Unit Effort (CPUE), and the
stakeholder involvement, and lack of co-management.
catching of young immature fish.
Figure 41 summarises the causal chain analysis of the decline of
The demand for high quality fishery products and ornamental species
commercial fish stocks and the non-optimal harvesting of living
has also contributed to the overexploitation of lagoon and coastal
resources in the Guinea Current LME.
resources.
Summary of the causes of overexploitation of
Shift in biomass distribution.
fish in the Guinea Current LME
Environmental changes manifested a periodic variability in water
The Guinea Current LME supports significant international fisheries of
temperatures and coastal upwel ing intensities play a role in coastal
importance for food security, and as a source of export income, for the
pelagic fish abundance fluctuations. Shifts in biomass appear to be
countries bordering this region. The fisheries sector is very significant in
connected to a shift in the boundary of the Guinea Current. These
the GCLME in the context of domestic food. Fish consumption is quite
alterations have been linked to oceanographic changes including the
high in the region and contributes significantly to the protein intakes
southward displacement of the ITCZ during Atlantic El Nińo events.
of its citizens especial y in coastal communities. Pelagic and demersal
fisheries within the region are ful y exploited evidenced by declining
Root causes of overexploitation of fish in the
landings of many species. The drop in fish availability in the subsistence
Guinea Current LME
sector has led to the adoption of destructive fishing practices e.g. use
The causal chain of the decline of commercial fish stocks and the non-
of undersize meshes and blast fishing. Despite nutritional requirements
optimal harvesting of living resources in the GCLME were analysed
and current population growth rates, the industrial (commercial)
in the frame of the TDA of the GCLME project (GEF/UNIDO/GCLME
fisheries sector in the countries bordering the GCLME generally exports
2003).
the trawl fishery products exacerbating the food security situation in
the region.
Figure 41 Causal chain diagram illustrating the causal links of overexploitation in Guinea Current LME.
104
GIWA REGIONAL ASSESSMENT 42 GUINEA CURRENT
CAUSAL CHAIN ANALYSIS
105
Overexploitation of fishery resources may have impacts on the status
of the coastal communities in a number of ways similar to those of
modification/loss of ecosystems and destructive fishing practices.
The main root causes of this situation relate to the complexity of
the marine ecosystem, to the lack of knowledge, the lack of (or the
non enforcement of) legislation and regulation, and the economic
conditions.
But al these root causes lead back to lack of governance, which is
recognised as the key factor to be addressed to reverse the actual trends
of degradation. Moreover, pressure on the coastal resources is likely to
increase significantly in the immediate future since - on the basis of
present consumption patterns and population growth rates - most of
the countries (and especial y large coastal cities such as Abidjan, Accra,
Lagos, Douala) wil need significantly more fish to sustain domestic
demands.
104
GIWA REGIONAL ASSESSMENT 42 GUINEA CURRENT
CAUSAL CHAIN ANALYSIS
105
Policy options
This section aims to identify feasible policy options that target
reduction in average annual stream flow of approximately 50%;
key components identified in the Causal chain analysis in order
Demographic trends in the form of rapid population growth and
to minimise future impacts on the transboundary aquatic
extensive transmigration from rural to urban areas in search of jobs
environment. Recommended policy options were identified
and improved living conditions;
through a pragmatic process that evaluated a wide range of
Technology constraints due to lack of appropriate and innovative
potential policy options proposed by regional experts and
farming practices for rain-fed agriculture under arid conditions.
key political actors according to a number of criteria that were
Similarly, there is a lack of water saving technologies and practices
appropriate for the institutional context, such as political
in the urban sector;
and social acceptability, costs and benefits and capacity for
Governance constraints by the absence of an efficient policy
implementation. The policy options presented in the report
and legal and institutional framework for local, national and
require additional detailed analysis that is beyond the scope
international water management.
of the GIWA and, as a consequence, they are not formal
recommendations to governments but rather contributions to
Identification of possible policy options
broader policy processes in the region.
A large number of policy alternatives to address the root causes and
mitigate the freshwater shortage problem may be identified. For
convenience, the policy options have been discussed separately, seen
in relation to each of the four particular root causes. However, it should
Modification of stream flow:
be emphasised that efficient policies should be comprehensive and
Case of the Volta Basin
linked to achieve a maximum of implementation synergy.
In the previous sections, modification of stream flow was identified as
Addressing the climatic evolution in the Sahel region
one of the key international water issues in the Guinea Current region. In
The issue of climatic change is strongly related to the actual magnitude
particular, the Volta River has been singled out as a typical example of an
of the water resources, and the ultimate limits of this resource, and
international river system in the Sahel region, suffering from freshwater
correspondingly, the number of people and water-related activities
shortages, due to modification of the stream flow.
that may be sustained in the Basin.
The root causes behind modification of stream
If the causes of climatic change could be identified - and subsequently
flow in the Volta Basin
control ed by policy intervention - such a policy option might become
In the Causal chain analysis, presented in the previous section, primary
extremely promising. Some scientists propose addressing the land
root causes in relation to freshwater shortage and modification of
depletion and over-grazing issue, with the intent of achieving a positive
stream flow in the Volta Basin were identified:
feedback on rainfal . But unfortunately, there is extremely little evidence
Adverse climatic conditions, with natural average annual rainfall
to support the effect of such ideas (IPCC 2001).
reduced by 30% within the last 40 years, and a corresponding
106
GIWA REGIONAL ASSESSMENT 42 GUINEA CURRENT
POLICY OPTIONS
107
However, there are other ways of addressing the climatic changes
countries, are ful y involved in the research of innovative technologies
through policy responses. First and foremost by establishing a close
for low cost water supply and sanitation and for water saving.
monitoring framework of the actual trends and by identifying their
impacts on the development of the Basin, but also by advocating
The urban water supply sector has many policy opportunities for
robust policies with a minimum of risk of failure due to adverse climatic
technological water savings, such as:
conditions: in short, by accepting as an unchangeable fact, that a major
Minimisation of losses in distribution pipes through leakage
part of the Basin has a severe, water-related handicap as compared to
monitoring and leakage remediation. New, on-site techniques
many other regions.
for rehabilitation of water pipes are available and have been
successful y introduced in many developing countries.
Controlling the population growth in the Basin
Water recycling is a potential tool, but it is often prohibitively costly
This option includes the classical population control policies. With less
in both investment and operation for use in developing countries.
people, the water demand would decrease. And obviously - in spite of
Industries may be enticed to introduce water-saving technologies
many decades of extensive efforts on family planning, birth control,
and practices. Demand side management, such as extension
education and awareness - the continued growth pattern in the Basin
services for smal and medium-sized enterprises (SMEs) and
calls for further actions. The reason for this may be, as pointed out
selective pricing of wasteful and non-productive uses may
above, that high fertility rates are caused by many more factors than lack
serve as useful tools. As has been seen in the energy sector, such
of contraception, education and awareness (Dasgupta 2000). Policies for
technologies wil often pay for themselves, and therefore have a
control of demographic trends must address all these factors, including
high potential for sustainability.
important cultural conditions.
Construction and operation of reservoirs may be further optimised,
with respect to reducing evaporation losses through a trade-off
Correspondingly, improved control of the transmigration patterns
with supply reliability.
from farms to towns through regulation, incentives and awareness
Conjunctive use of surface- and groundwater may minimise the
campaigns, would be a valuable instrument to al eviate unforeseen
need for surface storage and thus reduce evaporation losses.
and unwanted developments in water demand in the urban sector.
Unfortunately, very limited experience is available of successful cases
Correspondingly, the important water consumers in the agricultural
from the Volta Basin. Moreover, policies for demographic control are
sector can also be addressed by promotion of technological innovations
usual y beyond the control - and competence - of the water sector. But
through the development of: more drought resistant crops through
it is important to raise political and public awareness and transparency
breeding and genetic modification; efficient water harvesting techniques,
about the intimate links between water policies and population
appropriate for local conditions; reliable dry-season water supply options
policies: people and crops need water; more people and more crops
for cattle herds, to avoid competition with settled farmers and their water
need even more water.
supply systems; and development of water-efficient, smal -scale irrigation
methods, in particular drip irrigation and sprinkler irrigation. Such
Improving water sector technology
techniques must be developed in close cooperation with local farmers
Given the very likely scenario that neither demographic, nor climatic
to ensure acceptance from the practitioners, and financial mechanisms
trends are readily control able by policy interventions within a
for investment must be established.
short term time horizon, a realistic response would be to look into
technological developments to increase the efficiency of the water
There are no limits to this list, in particular if the right environment and
use; consume less water per capita, and produce more crop value per
incentives for private sector involvement, and local farmer initiative and
volume of water used (UNCED 1992).
creativity, is being facilitated.
The situation is comparable to the energy crisis in the 1970s, where the
Improving water governance
shortages of fossil fuels gave rise to many innovative ways of saving
Numerous case histories - and the state-of-the-art consensus in the
energy.
water sector recently reconfirmed through numerous sessions and the
Third World Water Forum in Kyoto - points to the crucial importance
Some regional institutions, such as CREPA (Centre Régional pour
of efficient water governance. The creation of a favourable "enabling
l'Eau Potable et l'Assainissement ŕ faible coűt ) in the French speaking
environment" in the form of appropriate legal and policy frameworks
106
GIWA REGIONAL ASSESSMENT 42 GUINEA CURRENT
POLICY OPTIONS
107
is a first and necessary step to ensure a rational and optimal al ocation
for successful initiatives in relation to the other policy options. Also, it
of water resources, not least when these resources are scarce and
can build on existing frameworks, through a comprehensive capacity
under heavy pressure as in the Volta Basin. But equal y important is
development process.
the establishment of an institutional framework to ensure the proper
enforcement of regulations and implementation of policies and
Such a policy should comprise:
plans, and to facilitate the actual participation and cooperation of all
Establishment of an international basin agreement on shared water
stakeholders in Government, communities and the private business
resources management, specific for the Volta Basin key issues. The
sector (UNCED 1992).
agreement shall address international water allocation issues and
provide a framework for conflict mediation and resolution.
Such governance shal address local, national and international issues
Creation of a basin management institution co-managed by the
in a comprehensive and transparent way by involving al appropriate
six countries of the Basin. The experiences of the Niger Basin
stakeholders. General issues to be addressed may be:
Authority may be useful in the initial phases of this activity. The
Agreement on a joint and comprehensive water policy for the Volta
new institution shall be authorised to:
Basin, including visions, goals and targets for various players in the
Monitor all pertinent water issues related to both supply and
water sector;
demand and present critical issues for the governments of the
Establishment of a comprehensive and transparent legal framework
Basin with proposed alternatives for action;
for water al ocations and water rights at local, national and
Facilitate specific resolution of international conflicts;
international levels;
Assist national authorities in capacity building of national water
Establishment of an improved institutional framework for
authorities within a uniform framework for the entire basin;
the management of the water resources of the Basin, linking
Facilitate multidisciplinary research and development of
management issues at both international and national levels in
improved technologies for efficient water uses;
relation to user demand on a comprehensive basin scale;
Elaboration of a number of national - but international y linked
Establishing appropriate management instruments in the form of
- action plans for Integrated Water Resources Management
mapping and monitoring of available water resources, regulations for
(IWRM) in the countries of the Basin.
al ocation, incentives for efficient use, water savings initiatives, market
Funding of the priority actions, with particular emphasis on solving
based fees and charges, conflict resolution and awareness raising.
the water scarcity problems in the human settlements that face the
most critical situation (e.g. Ouahigouya in the White Volta Basin).
It is important to establish the governance framework on an
international scale, as the Volta River is an international river, i.e. with
Performance of the policy option recommended
a top-down component. But to ensure impact in the field, it is equal y
The performance of the proposed policy for improvement of water
important to ensure a stakeholder oriented involvement at the local
governance has been evaluated based on the general information
level, i.e. a bottom-up component. The resolution of these opposites in
available from corresponding initiatives in West Africa.
the particular international and socio-cultural context may pose a major
chal enge for the policy makers.
The elaboration of national IWRM plans was recognised at World
Summit on Sustainable Development in Johannesburg (WSSD 2002) as
Nevertheless, it appears obvious, that one of the most urgent policy
the best way to solve the problems of equitable sharing of the available
initiatives could - and should - be directed towards improvement of
resources in the long term. This goal was selected to be the target to
water governance. A successful implementation of this option will
obtain for all African countries in 2005 (WEHAB 2002).
be a crucial prerequisite for successful implementation of the other
proposed policy options.
The Government of Burkina Faso already approved an IWRM plan early
in 2003. The same process is under way in Ghana. An IWRM process is
Immediate policy option: Creation of a Volta
foreseen in Benin and it is envisaged in Côte d'Ivoire and Mali.
River management framework
Based on the considerations in the previous section, it is proposed to
This type of plan comprises for example the fol owing actions:
put initial emphasis on a policy for improvement of water governance.
Establishment of an enabling environment for good governance of
As mentioned above, such an initiative appears to be a prerequisite
water:
108
GIWA REGIONAL ASSESSMENT 42 GUINEA CURRENT
POLICY OPTIONS
109
Formalisation of a national IWRM policy;
The six countries sharing the Basin have a long experience of
Reform of the legal and regulatory framework with special
cooperation on water resources management. They all participate
emphasis on establishment of transparent and equitable water
in the West African Water Partnership founded in Bamako in May
rights;
2000 with the support from Global Water Partnership;
Reform of the institutional framework particularly through the
The settlement of the basin agreement wil be facilitated by:
creation of basin committees, water fora for participation and
1) the implementation of the UNEP/GEF project on the Volta Basin,
involvement of stakeholders, creation of information channels
which also has this objective included in the preparation of the
and reinforcement of the representation of women and basic
project; and 2) the coming implementation of the West African
groups.
Regional Action Plan on Integrated Water Resources Management
Continuous monitoring of the resource and utilisation of col ected
(the ECOWAS16 countries to which all the riparian countries to the
data in decision support models (quantity and quality);
Volta Basin belong);
Establishment of fiscal incentive measures (subventions) or
The funding of priority actions shows presently favourable
dissuasive measures (penalties) to direct the water demand towards
perspectives within the NEPAD17 framework as wel as other
the most profitable uses for the communities;
initiatives.
Establishment of financial mechanisms to guarantee the economic
sustainability of the water management system itself.
As always in sub-Saharan Africa, the implementation capacity is of
concern. The present water institutions definitely need re-organisation
Such an effort is expected to have a high effectiveness, through its direct
and expansion, and certainly a lot of capacity development of
impacts in the form of legal improvements, improved knowledge base
their institutional policies, strategies, structures and capacities. But
for decisions, more optimal and transparent al ocations of the limited
this development is an inherent part of the proposal. In particular,
resource, conflict resolutions, public participation, and decentralisation.
the capacity changes should be related to political commitment,
There are certainly specific risks and obstacles in the form of lack of
institutional structures, authority and staffing.
political concern, population apathy and lack of participation of the end
users. Nevertheless, due to the severe impact of the water shortages
- both now and in the future - significant improvements of the water
situation are likely to be achieved over a 10-15 year period, since the
Modification and loss of
problems wil only get worse and more socio-economical y critical, if
ecosystems: Case of the Niger
not addressed properly.
Basin
Also, the efficiency is expected to be significant, as the benefits are
related to a rational al ocation of one of the key factors of economic
In the previous sections, modification of ecosystems was identified as
development in an arid region: water. Therefore, they are directly
one of the key international water issues in the Guinea Current region.
related to improvement of economic growth of the riparian countries.
In particular, the Niger River has been singled out as a typical example
In this context, the direct costs are minimal (compared to the potential
of an international river system, suffering from deterioration in aquatic
benefits from improved water allocation and water use efficiency), as
biodiversity. To a certain degree, the results are applicable to the Volta
seen from a GNP perspective. They are basical y related to the staffing
River, and in many aspects related to land degradation to the Congo
costs of the establishment of a policy framework and an institutional
Basin.
framework.
The root causes behind modification and loss of
If the IRWM process is properly fol owed, the proposed political
ecosystems in the Niger Basin
reforms al proceed in the direction of more equity as a result of
During the past three to four decades, important aquatic ecosystems,
more transparent information and more participation by the various
such as the flood plains of the Niger, the inland delta in Mali and the
stakeholders in water resources management.
delta in Nigeria have suffered significant reductions in productivity
and biodiversity. In the Causal chain analysis, a number of primary root
And fortunately, concerning political feasibility, several factors are
causes in relation to modification of ecosystems in the Niger Basin were
currently favourable:
identified:
16 Economic Community Of West African States 17 New Partnership for Africa Development
108
GIWA REGIONAL ASSESSMENT 42 GUINEA CURRENT
POLICY OPTIONS
109
Adverse climatic changes have radical y changed the basic
Controlling the population growth
ecological factors and the stream flow within last 40 years, resulting
With less people, the excessive land pressure, and its associated impact
in reductions in average annual stream flow of up to 60%. Also,
on the aquatic ecosystems, would decrease. Evidently - in spite of many
flood and drought intensities and frequencies have been altered.
decades of extensive efforts on family planning, birth control, education
Rapid population growth has put additional pressure on the sustainable
and awareness - the continued growth pattern in the Basin cal s for
use of the scarce land and water resources in the Basin, causing land
further actions. This important option should comprise a wide framework
erosion and increased sediment loads in rivers and reservoirs.
of policies, not only the classical population control policies, in particular
Lack of appropriate and innovative farming practices for sustainable
related to improving poor farmers assets and economic security. Al
rain-fed agriculture under arid conditions further aggravates the
significant - and region specific - social, cultural and economic reasons
problems. Also destructive herding practices in the arid savannahs
for the population growth must be considered (Dasgupta 2000).
of Sahel are causes of bush clearance and desertification.
Extreme poverty levels limit the ability of the population to introduce
Improving agricultural and land use technology
and invest in more sustainable land practices. The economic
Given the very likely scenario that neither demographic, nor climatic
constraints are aggravated by the market failures in international
trends are readily control able by policy interventions within a
agricultural trade through excessive support schemes in the
short term time horizon, a realistic response would be to look into
developed countries, making sustainable economic development
technological developments to increase the efficiency of the land uses
of the crucial agricultural sector virtual y impossible.
in order to minimise the detrimental impact on ecosystems.
Governance constraints due to the absence of an efficient legal and
institutional framework for local, national and international land and
The agricultural sector may be assisted by development and promotion
water management.
of appropriate technological innovations to decrease soil erosion and
silting of aquatic ecosystems from agriculture, forestry and mining
Identification of possible policy options
activities, such as detailed by Moffat & Lindén (1995):
A large number of policy alternatives to address the root causes and
Implementation of sustainable practices in natural resources
mitigate modification and loss of ecosystems may be identified. For
exploitation by incentives and by empowerment of rural people:
convenience, the policy options have been discussed separately, seen
Low-impact rain-fed agriculture, based on rain- and dew
in relation to each of the five particular root causes. However, it should
harvesting, efficient soil conservation and low-cost irrigation;
be emphasised that efficient policies should be comprehensive and
Development of more appropriate crop varieties, adjusted to
linked to achieve a maximum of implementation synergy.
the arid conditions;
Cattle herding practices in harmony with the carrying capacity
Addressing the climatic changes
of the range lands;
The issue of climatic change is strongly related to the health and
Low-impact commercial intensive agriculture for commodity-
productivity of the ecosystems. Prolonged droughts, causing depleted
and cash crops.
wetlands, lakes and floodplains, are a significant threat.
Promotion of new energy technologies and renewable energy as
a replacement for wood fuels.
If the causes of climatic change could be identified - and subsequently
controlled by policy intervention - such a policy option may become
There are actual y no limits to this list, in particular if the right
extremely promising (IPCC 2001).
environment and incentives for private sector involvement - and for
local farmer initiative and creativity -is being facilitated.
However, this is not very likely, but stil , there are alternative ways of
addressing the climatic changes through policy responses. First and
Reducing poverty and addressing lack of investment in land
foremost by establishing a close monitoring framework of the actual
and water conservation
trends and next by identifying their impacts on the development of the
It is commonly accepted that poverty is one of the key constraints
ecosystems of the Basin. But also by advocating robust policies with a
for efficient resource management, and for depletion of the natural
minimum of risk for failure due to adverse climatic conditions: in short,
resources. The links between poverty and environmental degradation
by accepting as a unchangeable fact, that a major part of the Basin has
are complex, and often contrary to many standard perceptions (Reardon
a severe, water-related handicap as compared to many other regions.
& Vosti 1995). But it is unquestionable that improvement of income
110
GIWA REGIONAL ASSESSMENT 42 GUINEA CURRENT
POLICY OPTIONS
111
opportunities is an important prerequisite for the farming population
It is important to establish the governance framework at an international
to afford to address more than their basic day-to-day needs.
scale, as the Niger River is an international river, i.e. with a top-down
component. But it is equal y important to ensure a stakeholder oriented
In a predominantly agricultural population, income opportunities and
involvement at the local level, i.e. a bottom-up component. The
poverty reduction is strongly related to agricultural market access and
resolution of these opposites in the particular international and socio-
to product prices. African goods, sold in OECD countries, face tariffs
cultural context may pose a major chal enge for policy makers.
roughly 10 times higher than those levied on goods traded within
the OECD. And barriers are steepest in agriculture where Africa has
Immediate policy option: Introduction of
a comparative advantage due to relatively cheap labour and vast
integrated land & water management in the
amounts of land. Agricultural subsidies to the tune of 320 bil ion USD
Niger Basin
(a sum not far short of Africa's annual GDP) in the rich countries like EC
Based on the considerations in the previous section, it becomes
and the US have depressed the true market prices; and national trade
apparent, that one of the most urgent policy initiatives in a GEF
tariffs in the region have further disorted the agricultural markets (The
International Waters perspective should be directed towards
economist 2004). Also, lag of an efficient transport infrastructure limits
improvement of land use governance. Successful implementation of
market access. Accodingly, a serious consideration of these market
this option will be a crucial prerequisite for successful implementation
constraints is an important prerequisite for poverty reduction.
of many of the other proposed policy options, such as monitoring of
climatic trends and development of appropriate land use practices.
But also, the likelihood to achieve any success in this field against the
powerful farming lobbies in the north appears almost as difficult to
Moreover, the combination of decreasing amount of water and
address as the climatic issues.
increasing population (and hopeful y economic development, which
evidently wil increase demand) cannot be solved over the short
Improving water governance
term.
Numerous case histories, and the state-of-the-art consensus in the
water sector, point to the crucial importance of efficient natural resource
In these conditions, the establishment of adequate mechanisms for water
governance. The creation of a favourable "enabling environment" in
al ocation would be among the key policy issues of water management
the form of appropriate legal and policy frameworks is a first and
in the Niger Basin and other international basins facing the same
necessary step to ensure a rational and optimal use of the natural
issues. This will require appropriate information on the resources and
resource endowments, in particular land and water resources; not least
the demands (monitoring and assessment capabilities), cross-sectoral
when these resources are scarce and under heavy pressure. But equal y
policy development and allocation strategies, demand management
important is the establishment of an "institutional framework" to ensure
and appropriate management instruments (e.g. legal and economic).
the proper enforcement of regulations and implementation of policies
and plans (GWP 2001).
It is proposed to put initial emphasis on a policy and a legal framework
for introduction of integrated land and water management. As
In the case of aquatic ecosystems, the importance of land-based activities
mentioned above, such an initiative appears to be a prerequisite for
and an integration of land and water management become crucial.
successful initiatives in relation to the other policy options. Also, it can
Without addressing the erosion impacts of bad land management, the
build on existing frameworks, in particular the Niger Basin Authority,
productivity of aquatic ecosystems cannot be maintained.
through a comprehensive capacity development process.
Such governance should address local, national and international issues
The policy option recommended for immediate intervention is legal/
in a comprehensive and transparent way by involving al appropriate
regulatory reform focusing on public sector reform and improved
stakeholders. General issues to be addressed may be: mapping and
stakeholder participation. The objectives are to promote compliance and
monitoring of important aquatic ecosystems and their pressures on a
to enforce agreements and policies, taking into account environmental
comprehensive basin scale; and establishing appropriate management
considerations, and to foster real stakeholder participation. The actions
instruments in the form of regulations, incentives, water savings
recommended are (WSSD 2002, WEHAB 2002):
initiatives, market-based fees and charges, conflict resolution and
Initiation of monitoring of aquatic ecosystems including socio-
awareness raising.
economic driving forces to col ect data to support decision makers;
110
GIWA REGIONAL ASSESSMENT 42 GUINEA CURRENT
POLICY OPTIONS
111
Establishment and mobilisation of stakeholder participation
mobilisation may significantly improve the implementation capacity
frameworks;
of the present limited Government resources.
Establishment of comprehensive land-and-water management
frameworks, including specific accounting for protection of the
There are definite risks and obstacles for a successful implementation,
productivity of aquatic ecosystems in the entire basin;
in particular related to political negligence and population apathy, in
Promotion of improved technologies for erosion control and
particular because the general awareness about the importance of the
ecosystem protection;
fragile aquatic ecosystems is limited. There are also risks that a proper
Capacity development of public sector institutions;
addressing of crucial issues like land tenure may challenge important
Revision and improvement of inadequate legislation, in particular
political and cultural power structures
related to land tenure. Local responsibility and care for natural
resources is preconditioned on local ownership, to make sure the
However, the win-win situation coming out of reaping the significant
benefits of the conservation efforts return clear benefits to the
economic and social development benefits achieved through improved
involved communities.
land management will eventual y benefit the biodiversity of the rivers,
lakes, wetlands and coastal waters of the Basin. And fortunately -
Based on the consideration presented above, the fol owing options for
compared to the potential benefits - direct costs are relatively smal , as
improved policies have been identified:
they are related to establishment of "software" such as policy, legal and
Short-term options:
institutional frameworks (CBD 1992, UNCED 1992, WEHAB 2002).
Improvement of the overall natural resource management of
the Basin, including land use, water monitoring and al ocation,
As for implementation capacity, the existing Niger Basin Authority (NBA)
and ecological issues in a comprehensive framework;
is an obvious candidate as a focal point for improved governance in the
Development of more resource-efficient agricultural systems,
Basin, but there is a need to strengthen the mandate and the capacity to
appropriate for the specific climatic, agricultural and socio-
address both land management as well as ecological issues, in addition
cultural conditions.
to the present water al ocation mandate. The NBA will need expansion,
Long-term options:
and certainly a lot of capacity development in these fields of expertise,
Improved control of population growth to reduce pressures on
in institutional and political policy and authority, and in strategies,
land and water;
structures and staff capabilities. This development shall constitute an
Targeted al eviation of rural poverty with a focus on improved
inherent part of the proposal.
community-based natural resource conservation.
At this point, the necessity to have a harmonisation between one
Of these options, the improvement of the management framework is
international basin process and several national processes must be
considered the most urgent immediate initiative.
emphasised. This appropriateness wil be facilitated by the regional
West African process towards IWRM (West Africa Regional Action Plan,
Performances of the policy option recommended
WARAP-IWRM). The Heads of State and Governments of ECOWAS have
The performance of the proposed policy for improvement of water
adopted this plan. The Programme n° 1 of this plan aims to support
governance has been estimated based on the general information
the development of National IWRM Action Plans. The Programme n° 3
available from corresponding initiatives in West Africa.
aims to update the basin agreements to make them comply with IWRM
principles adopted by the member countries. The justification of super
A proper implementation can be expected to have definite impacts
national entities such as NBA is to solve the transboundary issues and
in the form of improved and coherent natural resource management
such organisations will have no impact if the countries do not develop
policies at both national and international level. Associated legal
their IWRM policy/capacity themselves. Therefore, the two processes
improvements may address land tenure issues and increase the formal
must be coordinated and must progress at the same speed.
protection of the productivity of aquatic ecosystems. Decisions may
be based on more solid evidence, and become more transparent
The ECOWAS process and the GEF project in preparation (ABN/GEF/
to stakeholders. Also, mediation and resolution efforts may reduce
UNDP/World Bank 2002) would form a good platform to introduce a
the detrimental impacts of land and water conflicts. A successful
combination of land and water management in the region.
involvement of stakeholders through public participation and
112
GIWA REGIONAL ASSESSMENT 42 GUINEA CURRENT
POLICY OPTIONS
113
Eutrophication: Case of the
Demographic
Comoe Basin
It is necessary for each country to carry out birth control policies.
However, this is a very long-term option and it wil take at least
In the previous sections, eutrophication was identified as one of
10 years before the effects wil be visible in the eutrophication of the
the key international water issues in the Guinea Current region. In
watercourses.
particular, the Comoe River has been singled out as a typical example
of an international river system, impacted by discharges of nutrients
Knowledge/Technology
(as shown by the concentration in nitrogen and phosphorus) and
The important thing is to reinforce the capacities, to explain and to
impacting the GCLME (as shown by algal blooms along the shoreline
raise awareness. The question of general education should be part
from the Vridi channel in Abidjan to the Ghana border and beyond).
of the national educational policies, while the short-term targets are
important to convince the populations of the Comoe Basin to develop
The root causes behind eutrophication in the
their cultural practices. It would be wise to make information and
Comoe Basin
awareness campaigns for the farmers concerning the appropriate
In the Causal chain analysis above, a number of primary root causes of
use of fertilisers (dosing, amounts and spreading periods) as well
eutrophication in the Comoe Basin were identified:
as the relation between an inappropriate use of fertilisers and the
Demographic: The eutrophication is proportional to the density
eutrophication of watercourses. Another technological aspect is the
of population in the catchment. Moreover, the impact of human
design and maintenance of purification systems (e.g. individual latrines,
excreta is aggravated by the lack of sanitation systems.
sewage and drainage systems). Efforts have already been made in this
Knowledge: The rural populations have no adequate understanding
respect in the countries of the Comoe Basin, primarily by the CREPA for
of the causal chain starting from their agricultural practices and
the French-speaking countries and by other operators, including the
arriving at eutrophication and its most visible symptom; the
NGOs, as for Ghana.
invasion of water bodies by aquatic weeds. Failures in sewage
systems have the same effects.
Economic
Economic: The method used to clear the vegetation before
The financial constraints constitute one of the important profound
cultivation (burning) is typical of poor farmers using the most
causes, but the corresponding policy options exceed by far the simple
economic method they can find.
water quality framework. The policies in question are primarily related
Socio-cultural: Clearing the vegetation by using burning is not
to macroeconomics at African States level, to protectionism carried out
only practised for economic reasons. It is also a lifestyle in the
by the industrialised countries on certain products (such as sugar and
region and it comes with other traditional (but il egal) activities
cotton) as well as the world trade policy as for tropical products, which
like poaching the smal animals driven away by the fire.
maintains the farmers of the third world at a level of chronic poverty
Legal: People general y do not take care of the sustainability of
and dependency.
their cultivation practices because they do not own the land. There
is no provision for the control of discharges from agro-industrial
Socio-cultural
plants.
The socio-cultural constraints constitute an important curb on the
Governance: This is the key root cause since the reduction
sound management of land. However, the means to overcome the
of eutrophication wil come through a sound environmental
constraints are to be found in the present social development during
management of the catchment, fol owing IWRM principles.
which these traditions are progressively and natural y disappearing,
particularly in the city areas. Consequently, there is no need for a specific
Identification of possible policy options
policy option in this respect.
The diversity and the complementariness of the profound causes listed
above correspond to just as many possible policy options of dealing
Legal
with the problems.
The questions of land tenure are recognised by all experts in the region
as a very important obstacle to a sustainable management of the land
The different possible policy options for attacking the causes are
as wel as to the fight against degradation of land (and as a consequence
identified below:
of water, too). Possible reforms have been studied by the countries
of the Basin, and in 1999 Côte d'Ivoire adopted a new forest policy
112
GIWA REGIONAL ASSESSMENT 42 GUINEA CURRENT
POLICY OPTIONS
113
transferring part of the property rights to the ligneous resources to the
It turned out that most of them belong under the options concerning
farmers (MEF-MPPD 1999). However, this policy of transferring property
combating the eutrophication of the seawater, which is not treated in
rights from the State to the farmers met with a strong opposition from
this report. The first option, however, is part of the specific options for
foresters and State officials and it has therefore still not come into force.
international basins flowing into the GCLME (see Box 7).
The political situation has contributed to suspending the application
of these reforms.
Immediate policy option: Establishment of a
management body for the Comoe Basin.
Governance/Political
Some of the above mentioned policy options are characterised
These two major root causes are grouped together here, as the options
by having a long-term effect. This is the case for the demographic
relating to good governance depend of the enabling environment,
limitation as well as for the reversal of the political tendencies (e.g. fight
which is the responsibility of the state authorities through the water
against poverty). Other policy options may have a short-term effect and
policy. The main policy option is the integrated management of the
priority must obviously be given to those.
land and water within the context of the River Basin. This option is
already a part of the laws of the countries of the Comoe Basin. Further,
Another criterion for selection of the best policy options is also the
the experience gained in Burkina Faso within the IWRM programme
relation between their cost and their efficiency. This means that priority
shows that the establishment of a basin management structure can
should be given to the options that are most likely to give good results
be done gradual y, by creating an advisory body at an initial stage.
and at the same time are the less expensive.
Afterwards, when the needs arise, the mandates of the body can
be progressively enlarged to consultation, technical management,
A final recommendation is to choose among the possible options those
planning, water al ocation and financial management.
which are the keys to the others, namely those that should prepare the
way for other options.
Harmful algal blooms in the Guinea Current LME
The eutrophication problem is not limited to watercourses and
The most successful option wil be the establishment of a management
lagoons. The organic matter is transported by the rivers and arrives at
body for the Comoe Basin. Such a body should have the fol owing
the Ocean through the passes of the lagoons. This is the case for the
characteristics:
Vridi Canal in relation to the Comoe-Ebrié lagoon-riversides complex
Be based on the existing technical organs of the countries such
(Mé, Bété, Djibi, Banco, Agnéby). The organic matter is transported to
as the Directorate of Water Resources and the CIAPOL (Centre
the east along the coast by the littoral current. The high amount of
Ivoirien Anti-Pol ution in the Côte d'Ivoire), the Water Resources
organic matter in the seawater, the heat, and the sunlight cause the
Commission and the Environmental Protection Agency in Ghana,
increase of algal blooms. Some algae are toxic and constitute a risk
and the DGIRH (Direction Générale de l'Inventaire des Ressources
to the marine life or to human health, which has resulted in the name
Hydrauliques ) in Burkina Faso.
HAB: Harmful Algal Blooms.
Include in equal numbers representatives from the governments,
the territorial communities and the users of the Basin. In order
The possible options of combating the HABs (or reducing their harmful
to keep the flexibility and the efficiency of the Committee it is,
effects) have been studied within the GEF/UNIDO-GCLME project (2003).
however, important that the number of members is not too high.
Have a consultative role in the start-up phase, including for example
Box 7
How to address HABs in the Guinea Current LME.
the fol owing mandates:
· Develop and implement best environment practices/best available techniques for
agriculture to reduce discharges of nutrients (see technological root causes above).
Constitute an exchange forum concerning the problems of
· Develop an HAB reporting system for the GCLME region as a whole. This is seen
integrated management of land and water resources in the
as a high priority within the GCLME. It is also essential for the development of a
sustainable mariculture industry.
Comoe Basin with the aim of identifying, estimating and
· Community awareness projects linked to national ministries of health to alert the
public to dangers associated with potential HAB as needed.
prioritising the water problems of the Basin, in particular the
· Develop national/regional HAB contingency plans, which include early warning and
eutrophication, which is considered the most serious problem;
guidelines for medical practitioners to deal with HAB and associated problems.
Seek, through awareness raising and information, the support of
· Improve national capacity to analyse for toxins and identify harmful species by
sharing expertise between countries.
the operators in the water sector for the col ective management
· Mitigation of impacts of HABs on mariculture operations (e.g. relocation of mussel
rafts, treat blooms with herbicides).
of the water resources of the Basin and for the search for the
(Source: GEF/UNIDO-GCLME 2003)
most environmental friendly agricultural practices;
114
GIWA REGIONAL ASSESSMENT 42 GUINEA CURRENT
POLICY OPTIONS
115
Identify the possible disputes that might arise concerning the
Implementation capacity
use of the shared water resources and make suggestions to the
The four riparian countries provide sufficient human resources to
national authorities on how to avoid or settle such disputes;
appoint representatives having an adequate knowledge of the
Identify the financial resources that might al ow a consistent
principles of integrated basin management and having at the same
long-term functioning of a permanent structure (for example
time the capacity to handle international matters.
application of the pol uter-pays principle, or the search for
other resources);
However, due to economic reasons and in order to avoid a permanent
Make suggestions to the competent authorities on the future
mobilisation of highly specialised human resources (for example
permanent management framework for the Comoe Basin,
modelling experts), the Basin Committee will have no technical means
possibly endowed with more wide-ranging powers.
of its own. It should base its activities on the existing technical structures
of the different countries, of which several are mentioned above.
Performances of the policy option
recommended
Effectiveness
The recommended policy option can be implemented immediately
Chemical pollution: Case of the
as provision has been made for it in the national frameworks of water
Guinea Current LME
management as wel as in the regional framework adopted by the
countries of the Basin under the auspices of ECOWAS.
The root causes behind chemical pollution in the
Guinea Current LME
Efficiency
Different types of pol ution impact the GCLME. Among the various
The recommended policy option wil be able to produce concrete
pollution issues, the land based chemical pollution is considered to be
results within a very short time: First, by creating a forum where the
one of the most severe hazards for the marine environment.
operators of the Basin can exchange problems, experiences and share
their knowledge. Secondly, by recommending immediate measures
In the Causal chain analysis, the main root causes of land-based chemical
in relation to cultural practices such as moderate use of fertilisers,
pol ution have been identified. They can be summarised as fol ows:
fight against bush burning, hygiene at vil age level, protection of
Technological: The processes used by industry and mining in
water courses against animal excrements and limitation of agro-
Africa use polluting methods and machinery. Financial constraints
industrial waste, for example from the sugar manufacturing company
do not allow the replacement of old instal ations with modern more
of the Upper Comoe Basin. Final y, by making recommendations to
efficient ones.
the authorities of the riparian countries on the future management
Knowledge: The sources and the levels of chemical pol ution are
framework that might also serve as a model for other basins (e.g.
not wel known. The technicians working at these plants are not
Sassandra, Ouémé or others).
trained in clean technologies and the control ers do not know the
industrial processes they have to monitor. The populations are not
Equity and political feasibility
aware of the dangers they face.
The proposed policy option is equitable as it aims to include, in
Governance: The budgets devoted to environmental monitoring
equal numbers, representatives from the governments, the territorial
are very limited. The administrative practices are not efficient.
communities (municipalities, districts and regions) and representatives
Corruption may be the cause of lack of control of pol uting
from the users. This is a radical change compared to the existing water
plants. The exact number of pol uting industries and the nature
management practices that are sectoral, centralised and technocratic.
of pol utants is not wel known. The pressure groups that could
change the situation do not play their roles ful y. The development
The political feasibility is high due to strong cooperativeness between
policy favours production at low cost rather than clean production.
the countries of the Comoe Basin. Three out of four of these countries
For different reasons developed in the section on Performance
(Burkina, Côte d'Ivoire and Ghana) have already cooperated in the
of the policy option recommended, environmental laws and
Volta project. The four countries are associated in the West-African
regulations (EIAs and environmental audits) are not well applied.
IWRM process and are used to col aborating on technical, legal and
Socio-cultural: Rules of modern societies for addressing technical issues
institutional problems.
are often in conflict with traditions, religions and African life-style.
114
GIWA REGIONAL ASSESSMENT 42 GUINEA CURRENT
POLICY OPTIONS
115
Poverty/Economic: Poverty is an aggravating factor to pol ution,
Governance/Political
since people or enterprises do not have the financial means to
The management capacities for the coastal area should be reinforced.
change their practises. The sel ing prices of their production do not
As a first step, needs-assessment must be carried out to improve
motivate the adoption of less harmful but more costly techniques.
coastal management expertise. The institutional framework should be
There are not enough motivating (subsidies) or dissuasive (taxes)
harmonised with the legislation (see below) and designed according to
mechanisms.
the available human resources. In addition, the problems in relation to
management of the rivers and the coastal area should be coordinated
Identification of possible policy options
with lessons learned from the UNEP-FreshCo initiative. Laws must be
The different possible policy options for approaching the profound
reviewed or reformulated according to the identified problems, the
causes listed above have been identified as fol ows:
special socio-cultural features of the region and the financial capacities
of the actors. Final y, regulations should be drawn up according to the
Technological
existing law.
The policy options in this respect should concentrate on introducing
clean technologies in the industries as well as in the mines. A particular
Socio-cultural
effort should be made in relation to the informal sector in order to
Socio-cultural traditions are progressively and natural y fading (though
put an end to the gold extraction techniques based on mercury
stil enduring) concurrently with the development of the African
amalgamation.
communities. Consequently, there is no need for a specific policy
option in this respect.
Knowledge
There is a lack of knowledge at different levels: (1) ignorance of the
Poverty/Economics
sources of pollution; (2) ignorance of the present state of pollution; (3)
As for reduction of pollution there are three levels of economic (short-
ignorance from the polluters (industry and mining) of the causal chains
term) options: development of dissuasive measures (e.g. polluter-pays
leading to the present state; and (4) ignorance of the population and
tax) in order to discourage the pol uting productions and generate
their representatives (politicians) of the risks incurred.
revenues to be reinvested in subsidies; development of subsidies or
fiscal incentives (e.g. exemptions) in order to help industries invest in
Several options are available to mitigate these shortcomings:
clean technologies; and an increase of the price of raw materials and
Cumulative impact assessment for the Guinea Current LME: an
basic products.
overal impact assessment of industries and mines is needed
(industry co-funding would be welcome).
Mitigation measures and cross-cutting policy options
Monitoring of the present state of pollution in the GCLME:
Besides the policy options addressing the root causes, other policy
The present status of chemical pollution in the GCLME and its
options have been identified by the GEF/UNIDO-GCLME project (2003)
impacts on marine ecosystems requires proper documentation,
to address the impact/symptoms of the pol ution. Most of these options
and establishment of a baseline at regional level;
can also be applied to other issues under the pollution concern (e.g. oil
Cooperative training wil be needed for the effective
spil s) and contribute to the enhancement/restoration of biodiversity
management of impacts.
in the GCLME:
Development of the capacities of the industries and mines:
Regional (GCLME) policy on aquaculture/mariculture should be
Develop mechanisms of cooperation between industries,
developed and then harmonised with those of neighbouring
mines, ministries and other stakeholders, and strengthen
countries, including the Canary and Benguela Current LME regions;
capacity to reduce sources of pollution.
Regional (and national) management plan for biodiversity
Development of sanitary awareness and of alarm/indicator
conservation must include a framework for assessment and
systems:
prediction of environmental impacts;
Establish/identify regional parameters for approaches to
Identification of marine protected areas; attention can also be
early warning systems and associated quality performance
given to possible marine protected areas that have transboundary
standards.
implications;
Identify genetic structure of populations; an essential component
of a regional biodiversity conservation management plan. This has
116
GIWA REGIONAL ASSESSMENT 42 GUINEA CURRENT
POLICY OPTIONS
117
important implications for fisheries management (do countries
companies), the local communities (the large coastal cities), and
manage the same or different stocks of individual species?).
the coastal populations (e.g. fishermen vil ages, sea farmers);
Registration and monitoring of the polluting instal ations;
Immediate policy option: Implementation
Environmental assessment of the pollution impacts and definition
of regional monitoring system for chemical
of the indicators of pol ution/water quality, including a regional
pollution of the Guinea Current LME.
examination of pollutants in the sediments and the tissue of living
The recommended policy option(s) to combat land-based sources
organisms;
of pol ution in the Guinea Current LME must address the root causes
Establishment of a specialised institutional network in the field of
identified above and must also be based on the actual institutional
water quality and aquatic environment (including ecosystems and
regional framework, the ongoing regional projects and on the options
biodiversity);
and measures already taken within these frameworks and projects.
Installation of a series of systematic observation points along the
coasts and definition of an observation frequency;
The Abidjan Convention (1981) and its "Protocol on Cooperation in
Definition of a financial mechanism for the monitoring activities. It
Combating Pol ution in Cases of Emergency" constitutes the legal
seems inevitable to start with a project based on foreign finance
components of the West and Central African (WACAF) Action Plan.
from major donors like e.g. the GEF. But eventual y the system
The Convention expresses the decision of the WACAF region (from
ought to find its own financing within the profession and aim at a
Mauritania to Angola at the time of adoption) to deal individual y and
budgetary balance in the long term.
jointly with common marine and coastal environmental problems. The
Convention also provides an important framework through which
Other policy options could already be outlined at this stage, provided
national policy makers and resource managers can implement national
that they are defined more precisely later on, based on the observations
control measures in the protection and development of the marine and
of the previous system:
coastal environment of the WACAF region.
Improvement of the technological processes of the industries and
mines;
Since its entry into force in August, 1984, parties to the Abidjan
Prohibition of environmental y harmful techniques (e.g. mercury
Convention have, with UNEP's assistance, undertaken a number of
amalgamation of gold);
activities including the development of programmes for marine
Reinforcement of the enforcement of laws and regulations,
pollution prevention, monitoring and control in cooperation with e.g.
including reinforcement of the control of polluting instal ations;
IMO, FAO, UNIDO, IOC-UNESCO, WHO and IAEA.
Introduction of encouraging mechanisms (subsidies, tax
exemptions) for the non-polluting industries;
However, despite al the efforts made in the implementation of the
Introduction of dissuasive mechanisms (taxes and penalties) for the
Abidjan Convention, a certain degree of uncertainty stil prevails in
polluting industries;
assessing the pol ution load in general, because of the paucity of
Training of main operators;
reliable, detailed and historic scientific data on coastal, marine and
Information of the coastal populations and the consumers.
freshwater environments in the GCLME region. There is an urgent need
for precise qualitative and quantitative assessment of the significant
Performances of the policy option recommended
sources of land-based pollution.
Effectiveness
Thanks to the GEF/UNIDO/GCLME Project (2003), the coastal countries
Therefore, the policy options recommended must be focused on better
are used to col aborating and therefore a monitoring system could be
knowledge of the situation that is the key to defining the other policy
implemented immediately.
options which have more probability of being successful.
Efficiency
The recommended policy option is the implementation of a regional
The extent of the monitoring system must be carefully proportioned
monitoring system for the chemical pollution in GCLME based on the
to the problems to be dealt with as wel as to the financial resources
results from the GEF/UNIDO-GCLME Project 2003:
available long term. Considering these two conditions the system will
Establishment of a convention between the 16 coastal states, the
be able to produce an annual report on the chemical pol ution situation
representatives of the pol uting industries (including the mining
of the GCLME. The permanent fol ow-up and the comparison of key
116
GIWA REGIONAL ASSESSMENT 42 GUINEA CURRENT
POLICY OPTIONS
117
indicators from one year to another will have three immediate results:
Identification of possible policy options
The possibility of alerting the local/national authorities in case of
Despite the number of countries involved, joint regional policies and
pollution;
actions would offer the best approach to the effective and efficient
Definition of the sources and impact areas to be dealt with first;
management of transboundary fish stocks. Trawl surveys in the Gulf
Evaluation of the effect of measures taken in order to suppress
of Guinea offer a possible basis for common regulatory actions. These
or reduce the pol ution sources and to restore/compensate the
would include restrictions in the licensing of fishing boats (unnecessary
affected areas.
for tuna vessels, because tuna stocks are under-exploited), a strict
application of prescribed mesh sizes, the inclusion of turtle excluder
Equity and political feasibility
devices in trawl nets, and an intensification of enforcement patrols.
The present regional institutional framework is likely to give priority to
These measures are expected to have a pronounced positive impact
the actions planned by the governments of the riparian countries of
on marine conservation and on the biodiversity in the region.
the Guinean Current region. The association between industries and
the riparian populations constitute a guarantee of the balance and
Two cooperative surveys of demersal fish populations were
openness of the process.
implemented and conducted by six Gulf of Guinea countries in 1999.
Subsequent surveys wil determine stock levels, quantify biodiversity
Implementation capacity
and assess contaminant loading in fish tissues. For an evaluation of its
Most of the countries of the GCLME have sufficient human resources
progress in reducing habitat loss, preventing overfishing and reducing
and equipment to carry out such a programme. Attention should be
sources of environmental pol ution see GOGLME (2003). The second
paid particularly to the importance of upgrading the countries that,
phase of the GCLME project is now underway and involves 16 African
until now, have not participated much in the regional efforts (e.g. Sierra
countries bordering the Guinea Current LME from Guinea-Bissau to
Leone and Guinea-Bissau).
Angola (GEF GCLME/UNDP/UNIDO 2001).
The possible policy options are quite similar to those identified in the
frame of pol ution issues in the GCLME. The main obstacle to sound
Overexploitation of fish:
environmental management of the natural resources in the GCLME is
Case of the Guinea Current LME the lack of data with its consequence i.e. the lack of understanding of
the dynamics of living resources in this particularly wide and complex
The root causes behind overexploitation of fish and
LME:
other living resources in the Guinea Current LME
Governance: Reinforcement of fishing agreements between the
In the section Causal chain analysis, the main root causes of
16 coastal states, associating the respective governments of the
overexploitation of fish and other living resources in the GCLME were
industrial fishing vessels, the industrial fishing companies and the
identified. They can be summarised as fol ows:
representatives of the non-industrial fishermen.
Assessment and monitoring of the stocks of fish.
Knowledge
Environmental evaluation of impacts of overfishing on stock
Lack of knowledge concerning the complexity of ecosystem and high
depletion and the crosscutting effects on other economic or non-
degree of variability and an insufficient capacity development (human
economic species.
and infrastructure and training) contribute to overexploitation of fish.
Linkages with the other issues and concerns (i.e. eutrophication,
chemical pollution and climatic evolution).
Governance/Legal
Creation of an institutional network specialised in the management
Lack of efficient governance and legislation is mainly caused by:
of living resources in the GCLME (including ecosystems and
poor legal framework at the regional and national levels; inadequate
biodiversity).
implementation/enforcement of available regulatory instruments;
Definition of a financing mechanism in col aboration with
inadequate financial mechanisms and support; and insufficient public/
governments of countries with a fishing fleet operating in the
stakeholder involvement, lack of co-management.
GCLME, and with the fishing companies and artisanal fishermen.
As in the case of monitoring of chemical pollution, the leverage of
an external y financed project seems inevitable.
118
GIWA REGIONAL ASSESSMENT 42 GUINEA CURRENT
POLICY OPTIONS
119
Immediate policy option: Assessment of
assessed, and the best species for development need to be
ecosystem degradation
chosen on the basis of this assessment.
The paucity of reliable, detailed and historic scientific data on coastal,
Formulate harmonised policies for the region: A crucial
marine and freshwater environments in the GCLME region also applies
component if the negative effects of one country's policy on
to fisheries. There is an urgent need for a comprehensive assessment
the economic potential of another are to be precluded.
of the state of the fisheries resources and the extent of ecosystem
Training wil be needed, particularly in terms of promoting
degradation (including status and trends analysis) in the region.
community-based mariculture, as wel as the overall
management of mariculture in the region.
Beyond this first stage of monitoring/understanding, there is an urgent
Protection of vulnerable species and habitats
need to rationalise and make the fishing practices sustainable by
Assessment of the status of vulnerable species and habitats;
facilitating the optimal harvesting of living resources, for example:
this work has started in some countries, but a holistic regional
Co-management with fishing communities and industry:
study is needed.
Co-financing from the fishing industry and other donors is a priority
Appropriate mitigation solutions need development and
for effective management.
implementation for combating beach erosion and reducing
Provision of information to facilitate regional assessments of shared
unnecessary loss and restoring lagoon productivity.
resources: A structure should be established to conduct regional
Assessment of non-harvested species and their role in the
stock assessments, ecosystem assessments, evaluate resource-
ecosystem.
environmental linkages, and facilitate post-harvest technology.
Joint dedicated surveys and assessments. Such surveys need
Joint stock assessments with the Benguela Current LME and Canary
to be dedicated to the non-harvested species because of the
Current LME should be explored and implemented.
special technology needed.
Joint surveys and assessments carried out cooperatively will
help produce enhanced management and optimal utilisation.
These joint surveys wil be offered as a 5-year demonstration of
the benefits to the individual countries of joint transboundary
assessments.
Gathering and calibration of baseline information. This should be
done for resources, potential resources before harvest, as wel as for
ecosystems.
Cooperative analysis of socio-economic consequences: Analyses
of socio-economic consequences of sub-optimal and improved
use of resources should be carried out with a view to facilitate
appropriate intervention within the framework of improving
sustainable livelihoods.
Mitigation measures and cross-cutting policy options
Besides the main policy options addressing the root causes, other
policy options have been identified by the GEF/UNIDO/GCLME project
(2003) to address or compensate the impact/symptoms/effects of the
overexploitation of fish resources within the GCLME:
Responsible development of mariculture
Socio-economic assessment of potential: A ful socio-economic
assessment needs to be conducted on the ability of mariculture
to contribute to the regional economy and the improvement in
the living conditions of coastal communities.
Feasibility assessment: The feasibility of mariculture for
particular species in certain areas of the region needs to be
118
GIWA REGIONAL ASSESSMENT 42 GUINEA CURRENT
POLICY OPTIONS
119
Conclusions and recommendations
First and foremost, the assessment of the Guinea Current region has
Population growth is high - but decreasing - and the growing
shown the extreme difficulties in speaking in general terms of a huge
population by its very numbers increases the pressures on the
land area of more than 8 mil ion km2 - plus an unspecified area of
water resources of the region. Transmigration from rural to urban
marine waters. In particular, the environmental and climatic conditions
areas is strong.
vary from the Sahara desert over the Sahel drylands to the rainforest
There is a lack of qualified human resources due to insufficient
of Western and Central Africa. Accordingly, it was found necessary to
education and training, combined with the impact of poverty.
make a further sub-division of the region. The four major international
Governance is also weak.
river basins (Congo, Niger, Volta and Comoe) covering 90% of the
Economic growth is low, and heavily dependent on development
international basins were treated as separate entities, as was the Guinea
assistance. The private sector investment contribution is limited,
Current Large Marine Ecosystem (GCLME).
and a large proportion of the population lives below the poverty
limit, dependent on subsistence agriculture and cattle herding.
As such, the basin assessments are to a large degree representative for
Large parts of the region are rich in mineral resources and in
four characteristic ecosystems of the region:
agricultural and timber productivity.
The Sahel desert and drylands, with sparse precipitation and
Exports are dominated by agricultural and mineral commodities,
vegetation (Niger and Volta basins);
since the industrial sector is undeveloped. Trade conditions -
The West African coastal regions, with more humid conditions,
national y, regional y and international y - are characterised by
woodland savannah and rainforest; and a relatively dense
significant market failures and inefficiencies.
population (Comoe Basin);
The equatorial Central Africa with tropical conditions (Congo Basin);
In the fol owing conclusions, the two priority concerns/issues, their
The Guinea Current LME.
causes and some potential policy options are given for three general
ecoregions.
Due to lack of sufficient data and information, it has been difficult to
make complete assessments, causal chain analysis and policy option
Deserts and drylands in Sahel
analysis in the Congo Basin, and it is recommended that more detailed
Deserts and drylands are characteristic of the northern parts of the
studies be focused separately on this huge and complex basin in
Niger and the Volta basins. Major countries in these areas are Mali,
the future. Nevertheless, the priority concerns of the Congo were
Burkina Faso, Niger and Ghana. Precipitation is scarce and erratic, and
established as Pol ution and Unsustainable exploitation of fish and
a significant decline in annual rainfal has caused severe impacts on
other living resources, and the conclusions from other regions on these
water resources and the natural ecosystems. As most of the population
concerns apply to a large degree to the Congo Basin as wel .
are highly dependent on the natural resource base, socio-economic
impacts of the "Sahelian drought" have been severe.
The socio-economic conditions also vary over the region, in particular
related to religious and cultural issues. But in many ways, there are
important similarities:
120
GIWA REGIONAL ASSESSMENT 42 GUINEA CURRENT
CONCLUSIONS AND RECOMMENDATIONS
121
Freshwater shortage: Case of the Volta Basin
resources, and ultimately limits this resource, and correspondingly,
An important GIWA concern in the Niger and Volta basins was
the number of people and water-related activities, that may be
identified to be Freshwater shortage, in particular related to stream
sustained in the Basin. It is highly questionable if the climatic
flow modification and to lowering of the groundwater table.
change can be reversed by human actions, but there are ways of
addressing the climatic changes through policy responses. First
Stream flows have decreased by up to 40% in the last 20 years, and
and foremost by establishing a close monitoring framework of the
the impacts of the shortages have been aggravated by the increased
actual trends and by identifying their impacts on the development
demand from a rapidly growing population, in particular in the urban
of the Basin. Robust policies with a minimum of risk of failure due
settlements. Also, the needs of agricultural irrigation projects have been
to adverse climatic conditions should also be advocated.
impacted by the stream flow depletion, and hydropower production
Control ing the population growth and the rural-urban
in both river systems have decreased due to reduced inflows to the
transmigration patterns in the Basin through incentives, awareness
reservoirs. A further impact is the modification and reduction of natural
campaigns, regulation, etc., would be a valuable instrument to
wetlands, in particular the large and important Inner delta of the Niger
al eviate unforeseen and unwanted developments increasing
River.
water demand, where water resources are scarce.
Improving water sector technology, based on the likely scenario that
Groundwater levels have also been decreasing, with impacts on
neither demographic, nor climatic trends are readily control able
wetlands, rural water supply and groundwater based irrigation
by policy interventions within a short-term time horizon, a realistic
systems.
response would be to look into technological developments to
increase the efficiency of the water uses: consume less water per
The most important immediate causes of the water shortages have
capita and produce more crop value per volume of water used.
been identified to be related to the significant climatic variations (natural
The urban water supply sector has many policy opportunities
and/or anthropogenic) which have caused substantial reductions - and
for technological water savings, such as minimisation of losses
increased variability - in annual rainfal , causing subsequent reduction
in distribution pipes through leakage monitoring and leakage
in stream flow and groundwater recharge. But also resources have
remediation. Industries may be enticed to introduce water-saving
been depleted by diversions for increased water supply needs from
technologies and practices. Demand side management, such
a rapidly growing population (increasingly concentrated in urban
as extension services for smal - and medium-sized enterprises
settlements) and from associated increases in agricultural water needs,
(SMEs) and selective pricing of wasteful and non-productive uses
most significantly in the dry periods with low flow. Evaporation from a
may serve as useful tools. Correspondingly, the important water
multitude of reservoirs also increases the water losses from the rivers.
consumers in the agricultural sector can also be addressed by
promotion of technological innovations, such as introduction
The corresponding root causes have been identified to be primarily
of more drought resistant crops through breeding and genetic
related to the natural environmental conditions in the arid Sahel region,
modification. Efficient water harvesting techniques, appropriate for
with severe climatic changes resulting in decreasing precipitation.
local conditions should be developed e.g. development of water-
This problem is compounded by the rapidly increasing population,
efficient, smal -scale irrigation methods, in particular drip irrigation
creating increasing demand for basic water supply and for agricultural
and sprinkler irrigation.
production. There is also a lack of appropriate technological responses
to the water shortages, such as development of water efficient
However, first and foremost, it is recommended that the water
agricultural production systems and urban-industrial water supply
governance framework be strengthened on both international and
systems. However, first and foremost there is a lack of an appropriate
national water issues, since such an initiative appears to be a prerequisite
governance framework to address the severe water limitations and
for successful initiatives in relation to the other policy options.
conflicts in the Volta Basin.
Such an initiative may comprise:
To address these causes, it is recommended to consider the fol owing
Establishment of an international basin agreement on shared water
initiatives and actions:
resources management, specific for the Volta Basin key issues.
Actively addressing the climatic evolution in the Sahel region,
Creation of a basin management institution co-managed by the six
which is strongly related to the actual magnitude of the water
countries of the Basin, with a mandate to:
120
GIWA REGIONAL ASSESSMENT 42 GUINEA CURRENT
CONCLUSIONS AND RECOMMENDATIONS
121
Monitor all pertinent water issues related to both supply and
Population growth has significantly increased the pressure on the
demand and present critical issues for the Governments of the
natural resources;
Basin with proposed alternatives for action;
Lack of technological innovation has led to unsustainable land
Facilitate specific resolution of international conflicts;
management practices and poverty limits the potential to address
Assist national authorities in capacity building of national water
the degradation efficiently;
authorities within a uniform framework for the entire Basin.
Lack of efficient governance constrains the possibilities for
Facilitate multidisciplinary research and development of improved
Governments and stakeholders to address the issues.
technologies for efficient water uses.
Elaboration of a number of national - but international y linked -
To address these causes, it is proposed that the fol owing initiatives and
action plans for integrated water resources management in the
actions be considered:
countries of the Basin.
Addressing the climatic changes, since the issue of climatic change is
Funding of the priority actions, with particular emphasis on solving
strongly related to the health and productivity of the ecosystems. A
the water scarcity problems in the human settlements that face the
direct control of the climatic changes appears unrealistic, but there are
most critical situations (e.g. Ouahigouya in the White Volta Basin in
stil ways and means to address the climatic changes through policy
Burkina Faso).
responses. Similarly to the Volta Basin, a close monitoring framework of
the actual trends should be established, the impacts of these trends on
Modification and loss of ecosystems: Case of the Niger Basin
the development of the ecosystems of the Basin should be identified,
Most aquatic ecosystems are associated to the floodplains of rivers
and robust policies with a minimum of risk for failure due to adverse
and watercourses of the Basin. The strongly seasonal rains cause
climatic conditions should also be advocated.
over-flowing of almost al the southern rivers and watercourses. The
Control ing the population growth and transmigration patterns,
fisheries in the rivers supply an important source of protein to the rural
because with less people, the excessive land pressure - and the
population. The "Inner delta" is a wetland of international importance
associated impact on the aquatic ecosystems - would decrease.
and covers a land area of around 3.2 million ha. The wetlands support
Evidently, in spite of many decades of extensive efforts on family
20% of the population in Mali and produce almost 100 000 tonnes
planning, birth control, education and awareness raising, the
of fish annual y. The Niger delta and its associated wetlands is one
continued growth pattern in the Basin cal s for further actions.
of the largest wetlands in the world. Here, the very productive - but
Improving agricultural and land use technology as it is a likely
also fragile - brackish ecosystems suffer from even minor changes in
scenario that neither demographic, nor climatic trends are readily
salinity. These ecosystems have been modified due to the changes in
control able by policy interventions within a short-term time
stream flow. Reduced low flow and changes in the annual variation
horizon. A realistic response would be to look into technological
have had impacts on the ecological systems, which have been unable
developments to increase the efficiency of the land uses in order
to adjust to the changes. Changes in sediment loads have also altered
to minimise the detrimental impact on ecosystems. The agricultural
river morphology and changed the transparency of the waters.
sector may be assisted by development and promotion of
appropriate technological innovations to decrease soil erosion and
The most important immediate cause of this ecosystem depletion
silting of aquatic ecosystems from agriculture, forestry and mining
has been the stream flow reduction caused by the Sahelian drought.
activities. Sustainable practices in natural resource exploitation
But equal y important has been the depletion of the soils due to
should be promoted by development of appropriate technologies
inappropriate agricultural practices, adapted to the increasing aridness
such as low-impact rain-fed agriculture and introduction of
and desertification of the Basin. Soil erosion, and associated sediment
incentives for and empowerment of rural people.
loads in the rivers, has increased, when vegetation becomes scarce,
Reducing poverty and addressing lack of investment in land and
or when lands are developed for agriculture without sufficient erosion
water conservation, as it is general y accepted that poverty is one
control.
of the key constraints for efficient resource management, and for
depletion of natural resources. The links between poverty and
The corresponding root causes have been identified as:
environmental degradation are complex, and often contrary to many
The natural climatic trends have further reduced the flows in the
standard perceptions, but it is unquestionable that improvement of
aquatic ecosystems and the low productivity of the arid lands of
income opportunities is an important prerequisite for the farmer
Sahel;
population to afford to address more than basic day-to-day needs.
122
GIWA REGIONAL ASSESSMENT 42 GUINEA CURRENT
CONCLUSIONS AND RECOMMENDATIONS
123
But first and foremost, it is recommended that the natural resource
The corresponding most important root causes have been identified
management framework be strengthened through introduction of
as fol ows:
Integrated Land & Water Management in the Basin. Such an initiative
An inappropriate framework for water governance is the key root
should be focused on public sector reform and improved stakeholder
cause since the key constraint against reduction of eutrophication is
participation. The mandates of an institution to address these issues
lack of sound environmental management of the catchment, fol owing
would include:
Integrated Water Resources Management (IWRM) principles;
Monitoring of the state and development trends of aquatic
Rapid population growth - in particular related to transmigration
ecosystems, including socio-economic driving forces;
from the more arid lands in the north - increases urban waste
Revision and improvement of inadequate legislation, in particular
emissions, but also land clearance for new farmland;
related to land tenure, as local responsibility and care for natural
Lack of ownership and commitment to promote sustainable
resources is preconditioned on local ownership;
agricultural practices, because people do not own their land
Establishment of comprehensive land-and-water management
through proper tenure and licensing procedures;
frameworks, including specific accounting for protection of the
Lack of knowledge about the links between agricultural practices,
productivity of aquatic and terrestrial ecosystems in the entire
urban waste and environmental degradation through pol ution and
Basin;
eutrophication.
Promotion of improved technologies for erosion control and
ecosystem protection;
To address these causes, it is proposed that the fol owing initiatives and
Appropriate reform and capacity development of public sector
actions be considered:
institutions;
Reducing population growth is a key prerequisite for obtaining a
Establishment and mobilisation of stakeholder participation
balance between population pressure and the carrying capacity
networks.
of natural resources. However, this is a long-term option and it
wil take at least 10 years before the effects wil be visible in the
Coastal basins throughout the region
eutrophication of the watercourses.
South of the Sahel region, along the Gulf of Guinea from Guinea in the
Improving local ownership and responsibility for appropriate land
west to Nigeria in the east, a more humid region replaces the drylands
management through reform of the tenure system and property rights.
of the north. The natural vegetation of the northern part is woodland
Developing appropriate technology and improving public
savannah, and closer to the ocean this is replaced by rainforest. Under
awareness among farmers concerning the appropriate use of
these more favourable climatic conditions, key concerns change
fertilisers (dosing, amounts and spreading periods) as wel as
from water shortage to pol ution, further aggravated by the large
the relation between an inappropriate use of fertilisers and the
transmigration of people from the less fortunate northern regions to
eutrophication of watercourses. Another technological aspect is
the costal area.
the design and the maintenance of purification systems (individual
latrines, sewage and drainage systems, etc.).
Eutrophication: Case of the Comoe Basin
Pollution has been identified as a priority concern in the Comoe Basin,
It wil , however, be very difficult to implement such activities, unless the
in particular eutrophication caused by excessive nutrient loads. Point
general management framework is improved. Accordingly, it is proposed
and non-point sources of nutrients result in enrichment of the Comoe
as the highest priority to establish an advisory management body for the
River waters, causing algal growth and a proliferation of aquatic weeds,
entire Comoe Basin. The tasks for such a body may be to:
in particular water hyacinth, water lettuce and water fern.
Constitute an exchange forum concerning the problems of
integrated management of land and water resources in the Comoe
The primary immediate sources of the nutrient loads have been
Basin with the aim of identifying, estimating and prioritising the
found to be related to livestock excreta at watering holes, fol owed by
water problems of the Basin, in particular eutrophication, which is
wastewater discharges from urban settlements. Apparently, losses from
considered the most serious problem;
fertiliser application in the agricultural sector are of minor importance. It
Seek, through awareness raising and information, the support of
has also been suggested that an important source of nutrients derives
the operators in the water sector for the col ective management of
from land clearance and the associated increase in soil erosion and
the water resources of the Basin and search for the best sustainable
ashes from burning of trees.
agricultural practices, etc.;
122
GIWA REGIONAL ASSESSMENT 42 GUINEA CURRENT
CONCLUSIONS AND RECOMMENDATIONS
123
Identify the possible disputes that might arise concerning the use
Accordingly, the root causes related to chemical pol ution of the
of shared water resources and make suggestions to the national
Guinea Current LME are primarily related to inadequate governance,
authorities on how to avoid or settle such disputes;
in particular related to ineffective monitoring, lack of proper legislation
Identify the financial resources that might al ow a consistent long-
and regulation, and lack of enforcement. Also, there is a lack of
term functioning of a permanent structure.
appropriate and affordable treatment technologies, not least in relation
to introduction of cleaner technologies. Final y, lack of knowledge and
The Guinea Current LME
awareness leads to non-compliance by the polluters and passivity by
The Guinea Current LME stretches from Guinea Bissau in the west to the
the affected communities.
Congo delta in the east. It has been selected as a typical example of an
international marine area impacted by both land-based pollution and
To address these causes, it is proposed that the fol owing immediate
overexploitation of living resources.
priority actions be considered:
Promotion of cleaner technologies in the mining sector, and in
Chemical pollution of marine waters
small-scale enterprises of for example metal plating and tanning.
Due to the presence of many uncontrol ed smal enterprises and
Such a technological program should be comprehensive and
mining activities in the river basins, heavy metal pol ution is considered
include development of appropriate technologies, but also
a priority issue. The rivers transport the metals to the Atlantic Ocean,
awareness campaigns, advisory services, capacity development
either directly or via the coastal lagoons. When arriving in the Ocean,
and training, and, if needed, economic incentives and fines.
the pol utants drift to the east with the Guinea Current and spread
Strengthening of the national and international management
throughout the entire LME thereby contributing significantly to the
framework, including introduction of efficient legislation,
pol ution of international waters. This is the reason why, among the
agreements and regulations. In particular, monitoring of chemical
different types of pol ution inventoried in the region, chemical pol ution
pol ution sources should be strengthened, and emission standards
is considered to be one of the most critical international issues, due
should be enforced.
to its long-distance and long-term impacts. In particular, heavy metal
pol ution concentrates al along the food chain until the final link i.e.
However, implementation of such initiatives is condition by an
human beings. The corresponding health hazards for the population
acceptance of the magnitude and the impact of the problems. It
in the coastal regions are important, and the consequences, in socio-
is therefore proposed as a highest priority to establish a credible
economic terms, may be severe.
monitoring system for chemical pol ution in the region. Such an
initiative may include:
The key sources of chemical pol ution by heavy metals in the Guinea
Establishment of a convention or a forum between the 16 coastal
Current LME were found to be discharge of effluents from industrial
states, the representatives of the pol uting industries, the large
or craft activities (mainly surface treatment in urban areas, using silver,
coastal cities, and the coastal populations (fishermen vil ages, sea
copper, chromium, cadmium, etc.). In certain areas, important sources
farmers, etc.);
relate to uncontrol ed release from mining (e.g. mercury used by
Establishment of a specialised institutional network in the field of
artisanal gold miners). A minor source is related to leaching of urban
water quality and aquatic environment (including ecosystems and
solid wastes.
biodiversity);
Systematic registration and monitoring of the most important
Studies have identified several causes of chemical pollution. Absence
polluters;
of common effluent discharge standards and of appropriate pollution
Installation of a series of systematic observation points along the
abatement infrastructure in the region is leading to uncontrol ed
coasts and lagoons;
discharge of untreated effluents and wastes. Also there are insufficient
Environmental assessment of the pollution impacts and definition
human and material resources assigned to monitoring of the
of the indicators of pol ution/water quality, including a regional
environment and lack of financial resources for investment in treatment
examination of pollutants in the sediments and the tissue of living
and for compliance enforcement of regulations where they exist. In
organisms, and an associated assessment of socio-economic
particular, a widespread lack of public and private sector awareness and
impacts.
concern about pollution issues exists.
124
GIWA REGIONAL ASSESSMENT 42 GUINEA CURRENT
CONCLUSIONS AND RECOMMENDATIONS
125
Overexploitation of fish
The rich fishery resources of the region are both locally important by
The key root causes of overexploitation have been related to a lack of
virtue of resident stocks supporting artisanal fisheries, and international
governance, in particular related to an inadequate legal and regulatory
important due to migratory stocks that have attracted large commercial
framework at regional and local levels. Even where such frameworks
offshore foreign fishing fleets from the European Union, Eastern Europe,
exist, lack of monitoring and enforcement makes implementation
Korea and Japan. As such, the Guinea Current LME is a typical example
inefficient. Lack of funds makes it difficult to introduce financial
of an international marine area where the depletion of fish stocks is
incentives, and a general lack of involvement by the fishermen in
becoming critical, first for people living around the LME, in terms of
the management of the marine resources further aggravates the
food security and loss of income opportunities, and second for the
situation.
international community, in terms of loss of biodiversity. Significant
changes in species composition have occurred over time as a result
Similarly, a lack of data and research into the complex marine ecosystem
of overexploitation of several demersal and pelagic fish species,
makes it difficult to introduce a rational and credible management
especial y by foreign trawlers in the offshore areas. Recent trawl surveys
framework.
conducted in Ghana showed that significant changes were occurring
in the demersal fish biomass in terms of distribution, abundance and
To address these causes, it is proposed that the fol owing initiatives and
reproductive strategy.
actions be considered:
Reinforcement - and possible adjustment - of fishing agreements
A review of the status of marine fisheries resources in 1994 indicated
between the 16 coastal states, involving the respective governments
that apart from offshore demersal resources, al other fisheries in the
of the industrial fishing vessels, the industrial fishing companies and
region were near to ful or ful y exploited. This has resulted in loss of
the representatives of the non-industrial fishermen.
food security and increased conflicts between commercial (industrial)
Creation of an institutional network, specialised in the management
and artisanal (community-based) fisheries. It is now recognised that the
of living resources in the GCLME. The mandate should not only
coastal and the marine ecosystem of the GCLME and its resources have
include marine and coastal ecosystems and biodiversity, but also
witnessed various environmental stresses as a result of increasing socio-
relevant socio-economic issues. This network could be based on
economic and unsustainable development activities.
existing institutions like the Committee for the Eastern Central
Atlantic Fisheries (CECAF).
The direct causes of the fish stock depletion can be related to an
Establishment of financing and incentive mechanisms in
increased fishing effort. The biomass of the smal pelagic species
col aboration with governments of countries with a fishing fleet
in the western and central Gulf of Guinea has been estimated to
operating in the GCLME, and with the fishing companies and
392 000 tonnes. The current level of exploitation in the area is about
artisanal fishermen.
257 000 tonnes annual y clearly showing overexploitation. Demand for
Promotion of responsible development of mariculture and coastal
high quality fish products and ornamental species have also contributed
aquaculture through biological and socio-economic assessments
to the overexploitation of lagoon and coastal resources.
of the potential and feasibility. A harmonised policy for the region
- crucial if the negative effects of one country's policy on the
Other causes are related to physical alterations of the coastal ecosystems
economic potential of another are to be precluded. Training will
due to beach erosion, hydrographic changes due to sedimentation,
be needed, particularly in terms of promoting community-based
and to mangrove depletion through intensive logging. Such changes
mariculture, as wel as the overal management of mariculture in
endanger many coastal habitats of important species and reduce
the region.
ecosystem productivity and fish stock viability.
Protection of vulnerable species and habitats through appropriate
mitigation solutions need development and implementation for
Natural environmental changes manifesting in periodic variation in
combating beach erosion and reducing unnecessary loss and
water temperatures and coastal upwelling intensities also play a role in
restoring lagoon productivity.
coastal pelagic fish abundance fluctuations. Shifts in biomass appear to
be connected to a shift in the boundary of the Guinea Current. These
However, the main obstacle to sound environmental management of
alterations have been linked to oceanographic changes during Atlantic
the fisheries resources in the region is the lack of data and information
El Ninő events.
on its consequences: the lack of understanding of the dynamics of living
124
GIWA REGIONAL ASSESSMENT 42 GUINEA CURRENT
CONCLUSIONS AND RECOMMENDATIONS
125
resources in this particularly wide and complex ecosystem. Accordingly,
Such a co-operation may ensure that proposed solutions and responses
it is proposed to prioritise a comprehensive and thorough assessment
better respond to the actual conditions in West and Central sub-Saharan
of the state of the fisheries resources and the extent of ecosystem
Africa. Themes for consideration may include:
degradation (including status and trend analyses) in the region. Beyond
Appropriate frameworks for Integrated Land and Water Resources
this first stage of monitoring/understanding, there is an urgent need to
Management;
rationalise and make sustainable the fishing practices by facilitating the
Monitoring of critical environmental, and related socio-economic,
optimal harvesting of living resources:
developments;
Co-management with fishing communities and industry. Co-
Initiation of joint research programmes on critical water issues;
financing from the fishing industry and other donors is a priority
Development of appropriate alternative technologies for water
for effective management.
management.
Provision of information to facilitate regional assessments of shared
resources. A structure should be established to conduct regional
Such a co-operation may be based on further development of existing
stock assessments, ecosystem assessments, evaluate resource-
co-operation frameworks and function with a minimum of external
environmental linkages, and facilitate post-harvest technology.
support to ensure sustainability.
Joint surveys and assessments carried out co-operatively will help
produce enhanced management and optimal utilisation.
Gathering and calibration of baseline information. This should be
carried out for resources, potential resources before harvest, as well
as for ecosystems.
Co-operative analysis of socio-economic consequences. Analyses
of socio-economic consequences of non-optimal and improved
use of resources should be carried out with a view to facilitating
appropriate intervention within the framework of improving
sustainable livelihoods.
Assessment of status of vulnerable species and habitats. Work has
started in some countries, but a holistic regional study is needed.
Assessment of non-harvested species and their role in the
ecosystem.
Regional overview
As mentioned initial y, the Guinea Current region and its associated
river basins cover such great variations that it is difficult to establish
general conclusions for the entire region. However, three overall issues
have emerged:
Lack of efficient governance in the water sector, in particular related
to sector co-ordination and stakeholder participation;
Lack of sufficient data and understanding of the water issues and
their causes;
Lack of appropriate and efficient technological responses to the
problems.
It may be argued that lack of funding is a minor constraint in comparison
to the three mentioned above.
Accordingly, there appears to be a general need for a regional co-
operation for exchange of experiences in addressing these issues.
126
GIWA REGIONAL ASSESSMENT 42 GUINEA CURRENT
References
Abidjan Convention (1981). Convention and Protocol for Cooperation
Barusseau, J. P. and Giresse, P. (1987). Evolution of the Atlantic Coastal
In the Protection and Development of the Marine and Coastal
Zone of The Quaternary. Quaternary Coastal Geology of West Africa
Environment of West and Central Africa. Abidjan, Côte d'Ivoire.
and South Africa. UNESCO Reports in Marine Science, 43:1-27.
ABN/GEF/UNDP/World Bank (2002). Reversing land and water
Berit, G.R. (1961). Contribution ŕ la connaissance des variations
degradation trends in the Niger basin. Project description.
saisonničres dans le golfe de Guinée. Observatons de surface le
ACOPS/UNEP (1998). Background Papers to the Conference on Co-
long des lignes de navigation. Cahiers Oceanographiques, 13:715-
operation for the Development and protection of the Coastal
727.
and Marine Environment in Sub-Saharan Africa, Cape Town, 30
Binet, D. (1997). Climate and Pelagic Fisheries in the Canary and Guinea
November to 4 December 1998.
Currents: 1964-1993, The role of trade winds and the southern
Adingra, A.A. and Arfi, R. (1998). Organic and bacterial pollution in the
oscil ation. Oceanologica Acta, 20:177-190.
Ebrié lagoon, Côte d'Ivoire. Marine Pollution Bul etin, 36:689-695.
Binet, D., Marchal, E. and Pezennec, O. (1991). Sardinel a aurita de Côte
Ajao, E.A. (2001). Nigeria Country Report for Guinea Current Large
d'ivoire et du Ghana: Fluctuations halieutiques et changements
Marine Ecosystem (GCLME). Stocktaking Meeting, Accra, Ghana,
climatiques. In: Cury, P. and Roy, C. (eds), Pęcheries ouest-africaines,
14-17 May 2001.
Variabilité, instabilité e et changement, Paris, p 320-342.
Ajayi, T.O. (1994). The Status of Marine Fishery Resources of the Gulf
Binet, D. and Marchal, E. (1993). The Large Marine Ecosystem of Shelf
of Guinea: In: Proc. 10th Session FAO, CECAF, Accra, Ghana, 10-13
Areas in the Gulf of Guinea: Long-Term Variability Induced by
October 1994.
Climatic Changes. In: Sherman, K., Alexander, L.M. and Gold,
Akpabli, K.R. (2000). Integrated Management of the Gulf of Guinea
B. D. (eds.), Large Marine Ecosystems: Stress, Mitigation, and
Fight Against Coastal Pollution. Paper Presented at the Sustainable
Sustainability, American Association for the Advancement of
Development for Coastal Zones and Instruments for its Evaluation,
Science, Washington, D.C., p 104-118.
October 2326, 2000, Bremerhaven, Germany.
Braimah, L.I. (2001). Volta Lake fisheries Management Plan. Fisheries Sub-
Albaret, J.J. and Charles-Dominique, E. (1982). Observation d'un phénomčne
sector Capacity Building Project.
de maturation sexuel e précoce chez l'Ethmalose Ethmalosa fimbriata,
Bryant, D., Burke, L., McManus, J.W. and Spalding, M. (1998). Reefs at Risk:
Bowdich, dans une baie pol uée de la lagune Ebrié, Côte d'Ivoire. Doc.
A map-based indicator of threats to the world's coral reefs. World
Sci. Centr. Rech. Océanogr. Abidjan, 13:23-31.
Resource Institute. Retrieved June, 2003, from http:/wri.igc.org/
Awosika, L.F., Ojo, O. and Ajayi, T.O. (1992). Implications of Climate
reefsatrisk/.
Change in the Niger Delta, Nigeria. A report for UNEP.
CBD (1992).United Nations Convention on Biological Diversity. Basic
Awosika, L.F., French, G.T., Nichol s, R.J., and Ibe, C.E. (1992). The impacts
text. Secretariat of the Convention of Biological Diversity, Montreal,
of sea level rise on the coastline of Nigeria. In: O'Cal ahan, J.
Canada.
(ed.), Global Climate Change and the Rising Chal enge of the
Cebal os-Lascurain, H. (1996). Tourism, ecotourism, and protected areas.
Sea. Proceedings of the IPCC Workshop at Margarita Island,
IVth World Congress on National Parks and Protected Areas. IUCN.
Venezuela, 913 March 1992. National Oceanic and Atmospheric
Administration, Silver Spring, MD, USA.
REFERENCES
127
CIAPOL (2002). Réseau national d'observation de la qualité des eaux de
Elder, D., and Pernetta, P. (1991). Oceans. IUCN, Mitchel Beazley
la lagune Ebrié au niveau d'Abidjan. Document de synthčse 1992-
Publishers, London, UK.
1998. Centre Ivoirien Anti-Pollution, Abidjan.
Entsua-Mensah, M., Ofori-Danson, P.K. and Koranteng, K.A. (1999).
CILSS (n/d). Mise en oeuvre du cadre stratégique de sécurité alimentaire
Management issues for sustainable use of lagoon fish resources.
durable dans une perspective de lutte contre la pauvreté au Sahel,
In: Abban, E.K., Casal, C.M.V., Falk, T.M. and Pul in, R.S.V. (eds),
Sahel 21, Secrétariat Exécutif, CILSS.
Biodiversity and Sustainable use of fish in the coastal zone, ICLARM
Claon, S. (1999). Evaluation de l'exposition au mercure, ŕ l'arsenic et au
Conference Proceedings, p 25-29.
sélénium, de l'écosystčme et des populations de la lagune Aby
EPA (2000). Report on Monitoring of Waste Water Treatment Facilities in
(Côte d'Ivoire). Impacts de l'extraction aurifčre au Ghana. Mémoire
Ghana. Environmental Protection Agency, Accra, Ghana.
DEA Université, Joseph Fourier Grenoble, France.
EROS DataCenter (2003). Hydro1K. Retrieved, Nov., 2003, from http://
Comoe Basin GIWA Report (2003). Scaling & Scoping report. Global
edcdaac.usgs.gov/gtopo30/hydro/.
International Waters Assessment. Unpublished.
ESRI (1996). ArcAtlas: our Earth. Vegetation database. Environmental
Congo Basin GIWA Report (2003). Scaling & Scoping report. Global
Systems Research Institute Inc. Redland, California, USA.
International Waters Assessment. Unpublished.
ESRI (2002). Country borders. Data & Maps CD rom, Environmental
Cougny, G. (1997). Evaluation des possibilités de contribution de
Systems Research Institute, Inc. (ESRI) Redlands, California, USA.
l'activité touristique ŕ la conservation de la nature en Côte d'Ivoire.
Fail at, J.P. (1990). Origine des nitrates dans les nappes de fissures de
Etude exploratoire pour WWF, Bureau Régional d'Abidjan.
la zone tropicale humide - Exemple de la Côte d'Ivoire. Journal of
Cougny, G. (1998a). Les principes de gestion des ressources en eau et
Hydrology, 113:231-264.
leur mise en application. MEE-Danida. Conférernce Ouest-Africaine
Fail at, J.P. and Rambaud, A. (1988). La teneur en nitrates des nappes de
sur la gestion intégrée des ressources en eau, Ouagadougou, 3-5
fissures de la zone tropicale humide en relation avec les problčmes
Mars 1998.
de déforestation. Comptes Rendus de l'Academie des Sciences
Cougny G. (1998b). Synthčse régionale et rapports de pays. Conférence
Paris, 306:1115-1120.
Ouest-Africaine sur la gestion intégrée des ressources en eau,
Fail at, J.P. and Blavoux, B. (1989). Caractčres hydrochimiques des nappes
Ouagadougou, 3-5 mars 1998. Ministčre de l'Environnement et de
des roches endogčnes fissurées en zone tropicale humide: l'exemple
l'Eau du Burkina Faso et Danida.
de la Côte d'Ivoire. Journal of African Earth Sciences, 1:31-40.
Cougny, G. (2001). Politique du secteur de l'eau et cadre institutionnel.
Fail at, J.P. and Rambaud, A. (1991). Deforestation and Leaching of
Quelques éléments de réflexion. Session de formation Principes
Nitrogen as Nitrates into Underground Water in Intertropical
de gestion intégrée des ressources en eau. CEFOC-EIER-ETSHER.
Zones: The Example of Côte d'Ivoire. Environmental Geology Water
Cotonou, 21-25 May 2000.
Science, 17:133-140.
Cougny, G. and Ipsen, N.H. (1999). Mid-term evaluation of the UNDP-GEF
Falkenmark, M. and Lindh, G. (1974). Impact of water resources on
Lake Tanganyika biodiversity project. For United Nations Office for
population. Submitted by the Swedish Delegation to the UN World
Project Services.
Population Conference, Bucharest.
Dasgupta, P. (2000). Population and resources: An exploration of
FAO (1997). Fishery Resources Division for the FAO's Committee on
Reproductive and Environmental Externalities. Population and
Fisheries (COFI), 22nd Session. Document COFI/97/Inf.6.
Development Review, 26:643-689.
FAO (2000). FISHSTAT Plus. A PC system for the extended time series of
Derban, L.K.A. (1999). Public health aspects of the Volta Lake. In: Gordon,
global catches. Prepared by Food and Agriculture Organization of
C. and Amatekpor, J. (eds), The Sustainable Integrated Development
the United Nations Fisheries Department, Rome; Italy.
of the Volta Basin in Ghana. Volta Basin Research Project, Legon,
FAO (2003a). Review of the state of World Fishery Resources: Marine
Accra.
Fisheries Eastern Central Atlantic.
DHI Water & Environment (2002). Assistance technique au CIAPOL dans
FAO (2003b). Aquastat. Retrieved Feb, 2003, from http://www.fao.org/
le cadre du projet PNUD/FEM IVC/94/G31 Lutte contre les végétaux
waicent/faoinfo/agricult/agl/aglw/aquastat/main/index.stm.
aquatiques envahissant les plans d'eau de la Côte d'Ivoire. Volets
GCLME GIWA Report (2003). Scaling & Scoping report. Global
Suivi de la qualité des eaux et Gestion intégrée des bassins. Rapport
International Waters Assessment. Unpublished.
final, January 2002.
Ebah, B. (2000). La nappe souterraine d'Abidjan. Conférence Association
Ivoirienne des Sciences de l'Eau. Abidjan.
128
GIWA REGIONAL ASSESSMENT 42 GUINEA CURRENT
REFERENCES
129
GEF GCLME/UNDP/UNIDO (2001). Global Environment Facility's Project
Hughes, R.H. and Hughes, J.S. (1992). Répertoire des zones humides
for the Biodiversity Conservation and Pol ution Control in the
d'Afrique. UICN, Gland (Suisse) et Cambridge (UK)/PNUE, Nairobi
Guinea Current Large Marine Ecosystem. Retrieved Nov., 2003,
(Kenya)/CMSC, Cambridge (UK).
from http://www.chez.com/gefgclme/.
Hydropower & Dams (1997). World Map of Large Dams published for
GEF-MSP/ACOPS/UNESCO (2001). Sub-Saharan Africa Project, National
the 19th ICOLD Congress, Florence, May 1997.
Report of Côte d'Ivoire.
Ibe, A.C. and Ojo, S.O. (1994). Implications of expected Climate Change
GEF/UNEP (2001). Development of a Strategic Action Programme (SAP)
in the West and Central African Region: an overview. UNEP Regional
for the Guinea Current Large Marine Ecosystem, Draft Regional
Seas Report and Studies, No. 148.
Report, May 2001.
IMF (2002). Rapport annuel du Conseil d'administration pour l'exercice
GEF/UNEP (2002). Volta Basin Project. Preliminary Strategic Action
clos le 30 avril 2002.
Plan.
Inman, D.L. and Nordstrom, C.E. (1971). On the tectonic and morphologic
GEF/UNEP/EPA (2002). Volta Basin Project. Ghana Country Report.
classification of coasts. Journal of Geology, 79:1-21.
GEF/UNIDO-GCLME Project (2003). Draft Transboundary Diagnostic
IPCC (2001). Climate Change 2001: The Scientific Basis. Contribution
Analysis. Regional Project Coordinating Centre, Abidjan, April 2003.
of Working Group I to the Third Assessment Report of the
With the assistance of UNDP, UNEP and US-NOAA.
Intergovernmental Panel on Climate Change. Cambridge University
Geker, J. (1999). The Effects of the Volta Dam on the People of the
Press, Cambridge, United Kingdom and New York, NY, USA.
Lower Volta. In: Gordon, C. & Amatekpor, J. K. (eds.), The Sustainable
IUCN (2002). IUCN Red List. Retrieved Nov., 2003, from http://
Integrated Development of the Volta Basin in Ghana, University
www.redlist.org/.
Press.
IUCN-IWMI-Ramsar-WRI (2003). World Resources eAtlas. Retrieved Nov.,
Ghana Statistical Service (2001). Ghana Living Standards Survey.
2003, from http://www.iucn.org/themes/wani/eatlas/.
GOGLME (2003). Gulf of Guinea Large Marine Ecosystem Project.
Jefferson, T.A., Leatherwood, S. and Webber, M.A. (1993). FAO Species
Retrieved Nov., 2003, from http://www.africaonline.co.ci/
identification guide: Marine mammals of the world. UNEP/FAO,
AfricaOnline/societes/goglme/goglme.html.
Rome.
Gordon, C. (1999). An Overview of the Fish and Fisheries of the Volta
Koranteng, K.A. (2001a). Diversity and Stability of Demersal Species
Basin. In: Gordon, C. and Amatekpor J.K. (eds.), The Sustainable
Assemblages in the Gulf of Guinea. West African Journal of Applied
Integrated Development of the Volta Basin in Ghana, University
Ecology, 2:49-63.
Press.
Koranteng, K.A. (2001b). Structure and dynamics of demersal
Government of Burkina Faso (2001). Etat des lieux des ressources en
assemblages on the continental shelf and upper slope off Ghana,
eau du Burkina Faso et de leur cadre de gestion. Government of
West Africa. Marine Ecology Progress Series, 220:1-12.
Burkina Faso, Ministry of Environment and Water, IWRM Programme,
Koranteng, K.A., Ofori-Danson, P.K. and Entsua-Mensah, M. (1998).
financed by Danida.
Comparative Study of the Fish and Fisheries of Three Coastal
Government of Ghana (2000). Korle Lagoon Ecological Restoration
Lagoons in West Africa. International Journal of Ecology and
Project, EIA (2000), Ministry of Works and Housing.
Environmental Science, 24:371-382.
GWP (2001). Global Water Partnership, IWRM Toolbox Retrieved,
Kouassi, A.M., Guiral, D. and Dosso, M. (1990). Variations saisonničres
Nov., 2003, from http://www.gwp.ihe.nl/wwwroot/GwpORG/
de la contamination microbienne de la zone urbaine d'une lagune
handler.cfm?event=home.
tropicale estuarienne. Revue d'Hydrobiologie Tropicale, 23:181-
Halcrow and Partners (1956). The Volta River Project I. Preparatory
194.
Commission Report. London.
Kouassi, A.M., Kaba, N. and Metongo, B.S. (1995). Land-Based Sources of
Hubert, P. and Carbonnel, J.P. (1987). Approche statistique de l'aridification
Pol ution and Environmental Quality of the Ebrie Lagoon Waters.
de l'Afrique de l'Ouest. Journal of Hydrology, 95:165-183.
Marine Pollution Bul etin, 30:295-300.
Hubert, P., Carbonnel, J.P. and Chaouche, A., (1989). Segmentation
Large Marine Ecosystems of the World (2003). LME No 28: Guinea
des séries hydrométéorologiques - Application ŕ des séries de
Current. Retrieved October, 2003, from: http://na.nefsc.noaa.gov/
précipitations et de débits de l'Afrique de l'Ouest. Journal of
lme/text//lme28.htm.
Hydrology, 110: 349-367.
Lawson, R. and Kwei, E. (1974). African Entrepreneurship and Economic
Growth: A Case Study of the Fishing Industry of Ghana. Ghana
Universities Press.
128
GIWA REGIONAL ASSESSMENT 42 GUINEA CURRENT
REFERENCES
129
Lebel, T., Delcaux, L. and Polcher, J. (2000). From GCM scales to
Olson, D.M., Dinerstein, E., Wikramanayake, E.D., Burgess, N.D., Powel ,
hydrological scales: rainfal variability in West Africa. Stochastic
Underwood, G.V.N.E.C., D'Amico, J.A., Strand, H.E., Morrison, J.C.,
Environment Research and Risk Assessment, 14:275-295.
Loucks, C.J., Al nutt, T.F., Lamoreux, J.F., Ricketts, T.H., Itoua, I.,
Longhurst, A.R. (1962). A review of the oceanography of the Gulf of
Wettengel, W.W., Kura, Y., Hedao, P. and Kassem, K. (2001). Terrestrial
Guinea. Institut Francais d'Afrique NoirSeries A, 14:633-663.
ecoregions of the world: A new map of life on Earth. BioScience,
Loveland, T.R., Reed, B.C., Brown, J.F., Ohlen, D.O., Zhu, Z., Yang, L.
51:933-938.
and Merchant, J. (2000). Development of a Global Land Cover
ORNL (2003). Landscan 2002. Oak Ridge National Laboratory. Retrieved
Characteristics Data base and IGBP DISCover from 1-km AVHRR data.
Nov., 2003, from www.ornl.gov/gist/.
GLCCD Version 1.2. 1998. International Journal of Remote Sensing
Oyewo, E. O., Ajayi, T.O., Dublin-Green, C.O., Ajao, E.A. and Awosika, L.F.
21:1303-1330. Data available on-line at: http://edcdaac.usgs.gov/
(1998). Anthropogenic Activities and their Impact on Aquatic Living
glcc/glcc.html.
Resources in the Nigerian Coastal Zone. In: Ndoye, M. (ed), Impact
Mann, K. and Lazier, J. (1996). Dynamics of Marine Ecosystems: Biological-
of Pollution on Aquatic Living Resources in Africa; Proceedings of
Physical Interactions in the Oceans. 2nd edition. Cambridge,
the 5th session of the Inter-African Committee on Oceanography,
Blackwell Science.
Sea and Inland Fisheries, p 79-102.
MEE/DGH (2001). Ministere de l'Environnement et de l'Eau, Direction
Paturel, J.E., Servat, E., Kouamé, B., Lubčs, H., Ouedraogo, M. and Masson,
Générale Hydrologique. Burkina Faso.
J.M. (1997). Climatic variability in humid Africa along the Gulf of
MEF-MPPD (1999). Déclaration de politique forestičre. Ministčre de
Guinea. Part two: An integrated regional approach. Journal of
l'Environnement et de la Foręt - Ministčre de la Planification et de
Hydrology, 191:16-36.
la Programmation du Développement. Abidjan. Septembre 1999.
PNAE-CI (1994). Plan National d'action environnementale de la Côte
Moffat, D. and Linden, O. (1995). Perception and reality; Assessing
d'Ivoire-PNAE-CI. Tome-I: Livre Blanc de l'Environnement en Côte
Priorities for Sustainable Development in the Niger River Delta.
d'Ivoire, aoűt 1994.
Ambio, 24:527-538.
Reardon, T. and Vosti, S.A. (1995). Links between Rural Poverty and
MWH (1998). Ghana's water resources management chal enges and
the Environment in Developing Countries: Asset Categories and
opportunities; WARM Study. Ministry of Works and Housing,
Investment Poverty. World Development, 23:1495-1506.
Accra.
Serre, C. and Cougny, G. (1997) Les végétaux aquatiques envahissants.
Nicholson, S.E., Kim, J. and Hoopingarner, J. (1988). Atlas of African rainfall
Approche technico-économique. Communication au 19e Congrčs
and its interannual variability. Department of Meteorology, Florida
de la Commission Internationale des Grands Barrages (CIGB),
State University, Tal ahassee, Florida, USA.
Florence, 26-30 May.
Niger Basin Authority (2002). Silting and Erosion - First draft study. NBA/
Servat, E., Paturel, J.E. and Lubčs, H. (1996). La sécheresse gagne l'Afrique
ADB/FAO, October 2002.
Tropicale. La Recherche, 290.
Niger Basin GIWA Report (2003). Scaling & Scoping report. Global
Servat, E., Paturel, J.E., Lubčs, H., Kouamé, B., Ouedraogo, M. and Masson,
International Waters Assessment. Unpublished.
J.M. (1997). Climatic variability in humid Africa along the Gulf of
NOAA (1998). Radiance Calibrated Lights: 1996-1997. National Oceanic
Guinea. Part one: Detailed analysis of the phenomenon in Côte
and Atmospheric Administration-National Geophysical Data
d'Ivoire. Journal of Hydrology, 191:1-15.
Center. Retrieved Nov., 2003, from: http://dmsp.ngdc.noaa.gov/
Servat, E., Paturel, J.E. and Lubčs-Niel, H. (1998). Variabilité des ressources
html/download.html.
en eau de l'Afrique de l'Ouest. Conf. Ouest-Africaine sur la gestion
OIEau (2002). Fleuves transfrontaliers africains - Bilan global. Available at:
intégrée des ressources en eau. MEE-Danida, Ouagadougou, 3-5
http://www.riob.org/transfrontalier/bilanglobal.pdf
Mars 1998.
Olivry, J.C., Briquet, J.P. and Mahe, G. (1993). Vers un Apprauvrissment
Shel (1999) People and the Environment. Annual Report, The Shell
Durable des Resources en Eau de l'Afrique Humide? IAHS
Petroleum Development Company of Nigeria.
Publication, 216:67-78.
Siebert, S., Döl , P. and Hoogeveen, J. (2001). Global map of irrigated areas
version 2.0. Center for Environmental Systems Research, University
of Kassel, Germany/Food and Agriculture Organization of the
United Nations, Rome, Italy.
The Economist (1998). World in Figures. John Wiley and Sons, Inc.
130
GIWA REGIONAL ASSESSMENT 42 GUINEA CURRENT
REFERENCES
131
The Economist (2004). How to make Africa smile. A survey of sub-
UNEP/UNESCO (1982). River inputs to the West and Central African
saharan Africa. January 17th.
marine environment. UNEP Regional Seas Reports and Studies No
Titčcat, M. (1998). Législation et réglementation en matičre d'eau et
3, UNEP, Nairobi, Kenya.
d'aménagements hydrauliques. Cadrage économique du secteur
UNEP-WCMC (2000a). Ramsar Sites. Retrieved Sept., 2003, from http:
de l'eau. MEE/DGH - Financement Danida, aoűt 1998.
//geodata.grid.unep.ch/.
Tobor, J.G. (1990). The Fishing Industry in Nigeria - Status and potential
UNEP-WCMC (2000b). Biodiversity Map Library. Cambridge, U.K.
for self sufficiency in fish production. Nigerian Institute for
UNEP-WCMC (2003). Protected Areas (IUCN Classification). Retrieved
Oceanography and Marine Research (NIOMR), Technical Paper
Sept., 2003, from http://geodata.grid.unep.ch/.
No 54.
U.S. Geological Survey (2002). International Geological Map of Africa.
UNCED (1992). United Nations Conference on Environment and
Retrieved Aug., 2003, from http://geology.cr.usgs.gov/energy/
Development. Agenda 21, the United Nations Programme of Actions
WorldEnergy/OF97-470A/.
from Rio. New York, UN Department of Public Information.
Veatch, A.C. and Smith, P.A. (1939). Atlantic Submarine Val eys of United
UNDP (2002). World report on human development. United Nations
States and Congo Submarine Val ey. Geological Society America,
Development Programme. Oxford University Press, New York.
Special Paper No 7.
UNECA (2002). Economic Report on Africa 2002; Tracking Performance
Waughty, A. (1983). Introduction a la climatologie du Golfe de Guinée.
and Progress. United Nations Economic Commission for Africa,
Oceanographie tropicale, 18:103-138.
Addis Ababa.
WEHAB (2002). WEHAB framework papers. World Summit on Sustainable
UNEP (1982). The status of oil pollution and oil pollution control in the
Development, WEHAB Working Group.
west and central African region. UNEP regional seas reports and
WCMC (1993). Ecological y Sensitive Areas in Africa, IV West Africa
studies No 4 - in cooperation with Inter-governmental Maritime
Report; V Sahel Report. Compiled by WCMC for the World Bank,
Consultative Organisation.
Washington D.C.
UNEP (1989). State of the Marine environment: West and Central Africa
Wolf, A. T., Natharius, J. A., Danielson, J. J., Ward, B. S. and Pender, J. K.
Region. UNEP Regional Seas Reports and Studies No 108, UNEP,
(1999). International River Basins of the World. Water Resources
Nairobi, Kenya.
Development, 15:387-427.
UNEP (1997). World Atlas of Desertification. 2nd edition. Middleton, N.
Volta Basin GIWA Report (2003). Scaling & Scoping report. Global
and Thomas, D. (eds). Oxford University Press, Inc.
International Waters Assessment. Unpublished.
UNEP (1999). Overview of land-based sources of and activities affecting
World Bank (1995). Defining an Environmental Development Strategy for
the marine, coastal and associated freshwater environment in the
the Niger Delta. Vol. 1, May 30, 1995, and Vol. 2, May 25, 1995.
West and Central African Region. UNEP Regional Seas Reports and
World Bank (2002). World Development Report 2003: Sustainable
Studies No 171, UNEP, Nairobi, Kenya.
Development in a Dynamic World. World Bank and Oxford
UNEP (2002a). Africa Environment Outlook: Past, present and future
University Press.
perspectives. United Nations Environment Programme (UNEP)/
WRI (1994). World Resources 1994-1995. World Resource Institute. Oxford
GRID-Arendal. EarthPrint, Hertfordshire, England.
University Press Inc, USA.
UNEP (2002b). Atlas of International Freshwater Agreements. United
WSSD (2002). World Summit on Sustainable Development,
Nations Development Programme, Kenya, Nairobi.
Johannesburg Summit 2002, Key outcome of the Summit. UN
UNEP/GEF/Volta Basin Project (2002a), Transboundary Diagnostic
Department of Public Information.
Analysis GF/1010-00-13.
Yeboah, F.K. (1999). Mitigative Actions Taken by Volta River Authority
UNEP/GEF/Volta Basin Project (2002b), Ghana Country Report. GF/1010-
(VRA) on Dam Affected Communities. In: Gordon, C. and Amatekpor,
00-13.
J. K. (eds.), The Sustainable Integrated Development of the Volta
UNEP/GEF/Volta Basin Project (2002c), National survey on the priority
Basin in Ghana, VBRP, UG.
environmental problems of the Volta Basin in Burkina Faso. GF/
1010-00-13.
UNEP/UCC Water (2003). Project brief: Joint Management by Côte
d'Ivoire and Ghana of the coastal lagoon and river system Aby-Bia-
Tanoé, Application of the ICARM concept and principles. UNEP-
UCC-Water.
130
GIWA REGIONAL ASSESSMENT 42 GUINEA CURRENT
REFERENCES
131
Annexes
Annex I
How to quantify the international character of a hydrographic
basin
Apparently, the simplest criterion for quantifying the international
Major basins of the Guinea Current region (more than
character of a basin seems to be its number of countries. But it turns
50 000 km2) classified in decreasing ICB order:
out that for some of the basins the largest part of their superficial area is
Niger Basin
2 113 200 km2
11 countries
ICB = 5.21
in fact situated in one country. In case of two basins covering the same
Congo Basin
3 691 000 km2
13 countries
ICB = 4.19
number of countries it has been considered that the one having the
Volta Basin
412 800 km2
6 countries
ICB = 2.94
most international character is the basin which is most equal y divided
Comoe Basin
78 100 km2
4 countries
ICB = 1.83
between the riparian countries. In order to quantify this character, a
Ogooue Basin
223 000 km2
4 countries
ICB = 1.67
numerical indicator has been invented, taking into consideration not
Oueme Basin
59 500 km2
3 countries
ICB = 1.45
only the number of countries of a basin but also the average and the
Cross Basin
52 800 km2
2 countries
ICB = 1.31
standard deviation of the superficial areas occupied by each country
Sassandra Basin
68 200 km2
2 countries
ICB = 1.14
of the basin.
One notes the inversion of the classification compared to a calculation
International character of the basin:
based only on the number of countries of the basin. Thus, the Niger
ICB = n x S / (S + )
Basin is equal y divided between the main riparian countries while the
m
m
where:
Congo Basin is mostly situated in the D.R. Congo. As a consequence,
n is the number of countries of the basin
the Niger Basin (11 countries) has an ICB of 5.21, which is more than the
S is the average area by country (= the total area of the basin divided
Congo Basin (13 countries) for which the ICB is 4.19.
m
by n)
is the standard deviation of the areas S in each country , compared
The same observation applies to Oueme Basin and Cross Basin
m
m
to the average value.
compared to the Sassandra Basin.
The quantity without dimension S / (S + ) is always lower than 1.
m
m
Therefore ICB is always lower than the real number of countries in the
basin. The more the basin area is divided equal y between the riparian
countries, the smal er becomes and the closer to the real number of
countries of the basin ICB will get.
The calculations of ICB for the major basins give the fol owing results.
132
GIWA REGIONAL ASSESSMENT 42 GUINEA CURRENT
ANNEXES
133
Annex II
Detailed scoring tables: Congo Basin
I: Freshwater shortage
II: Pollution
Weight
Weight
Environmental
Environmental
Environmental issues
Score
Weight %
averaged
Environmental issues
Score
Weight %
averaged
concern
concern
score
score
1. Modification of stream flow
1
25
Freshwater shortage
1.5
4. Microbiological
2
15
Pol ution
2.4
2. Pol ution of existing supplies
2
50
5. Eutrophication
3
19
3. Changes in the water table
1
25
6. Chemical
2
14
7. Suspended solids
2
12
Criteria for Economic impacts
Raw score
Score Weight %
8. Solid wastes
3
23
Size of economic or public sectors
Very small
Very large
9. Thermal
0
0
2
80
affected
0
1
2
3
Degree of impact (cost, output changes
Minimum
Severe
1
20
10. Radionuclide
0
0
etc.)
0
1
2
3
Occasion/Short
Continuous
Frequency/Duration
0
0
11. Spil s
2
17
0
1
2
3
Weight average score for Economic impacts
1.8
Criteria for Health impacts
Raw score
Score Weight %
Criteria for Economic impacts
Raw score
Score Weight %
Very small
Very large
Number of people affected
2
60
Size of economic or public sectors
Very small
Very large
0
1
2
3
2
30
affected
0
1
2
3
Minimum
Severe
Degree of severity
2
30
Degree of impact (cost, output changes
Minimum
Severe
0
1
2
3
2
10
etc.)
0
1
2
3
Occasion/Short
Continuous
Frequency/Duration
1
10
Occasion/Short
Continuous
0
1
2
3
Frequency/Duration
3
60
0
1
2
3
Weight average score for Health impacts
1.9
Weight average score for Economic impacts
2.6
Criteria for Other social and
Raw score
Score Weight %
community impacts
Criteria for Health impacts
Raw score
Score Weight %
Number and/or size of community
Very small
Very large
1
40
Very small
Very large
affected
0
1
2
3
Number of people affected
3
45
0
1
2
3
Minimum
Severe
Degree of severity
1
38
Minimum
Severe
0
1
2
3
Degree of severity
2
30
0
1
2
3
Occasion/Short
Continuous
Frequency/Duration
0
22
Occasion/Short
Continuous
0
1
2
3
Frequency/Duration
2
25
0
1
2
3
Weight average score for Other social and community impacts
0.8
Weight average score for Health impacts
2.6
Criteria for Other social and
Raw score
Score Weight %
community impacts
Number and/or size of community
Very small
Very large
1
40
affected
0
1
2
3
Minimum
Severe
Degree of severity
1
40
0
1
2
3
Occasion/Short
Continuous
Frequency/Duration
0
20
0
1
2
3
Weight average score for Other social and community impacts
0.8
132
GIWA REGIONAL ASSESSMENT 42 GUINEA CURRENT
ANNEXES
133
III: Habitat and community modification
IV: Unsustainable exploitation of fish
Weight
Weight
Environmental
Environmental
Environmental issues
Score
Weight %
averaged
Environmental issues
Score
Weight %
averaged
concern
concern
score
score
Habitat and community
12. Loss of ecosystems
2
60
1.6
Unsustainable
modification
14. Overexploitation
3
50
2.8
exploitation of fish
13.Modification of ecosystems or
15. Excessive by-catch and
3
30
ecotones, including community
discards
1
40
structure and/or species
composition
16. Destructive fishing practices
2
15
17. Decreased viability of stock
1
3
through pol ution and disease
18. Impact on biological and
Criteria for Economic impacts
Raw score
Score Weight %
1
2
genetic diversity
Size of economic or public sectors
Very small
Very large
1
40
affected
0
1
2
3
Degree of impact (cost, output changes
Minimum
Severe
0
30
etc.)
0
1
2
3
Criteria for Economic impacts
Raw score
Score Weight %
Occasion/Short
Continuous
Frequency/Duration
0
30
0
1
2
3
Size of economic or public sectors
Very small
Very large
1
10
affected
0
1
2
3
Weight average score for Economic impacts
0.4
Degree of impact (cost, output changes
Minimum
Severe
2
30
etc.)
0
1
2
3
Criteria for Health impacts
Raw score
Score Weight %
Occasion/Short
Continuous
Frequency/Duration
3
60
0
1
2
3
Very small
Very large
Number of people affected
1
40
0
1
2
3
Weight average score for Economic impacts
2.5
Minimum
Severe
Degree of severity
0
30
0
1
2
3
Criteria for Health impacts
Raw score
Score Weight %
Occasion/Short
Continuous
Frequency/Duration
0
30
0
1
2
3
Very small
Very large
Number of people affected
0
0
0
1
2
3
Weight average score for Health impacts
0.4
Minimum
Severe
Degree of severity
0
0
0
1
2
3
Criteria for Other social and
Raw score
Score Weight %
Occasion/Short
Continuous
community impacts
Frequency/Duration
0
0
0
1
2
3
Number and/or size of community
Very small
Very large
1
40
affected
0
1
2
3
Weight average score for Health impacts
0
Minimum
Severe
Degree of severity
0
30
Criteria for Other social and
0
1
2
3
Raw score
Score Weight %
community impacts
Occasion/Short
Continuous
Frequency/Duration
0
30
0
1
2
3
Number and/or size of community
Very small
Very large
1
40
affected
0
1
2
3
Weight average score for Other social and community impacts
0.4
Minimum
Severe
Degree of severity
0
0
0
1
2
3
Occasion/Short
Continuous
Frequency/Duration
2
60
0
1
2
3
Weight average score for Other social and community impacts
1.6
134
GIWA REGIONAL ASSESSMENT 42 GUINEA CURRENT
ANNEXES
135
V: Global change
Weight
Environmental
Environmental issues
Score
Weight %
averaged
concern
score
19. Changes in the hydrological
0
0
Global change
0
cycle
20. Sea level change
1
0
21. Increased UV-B radiation as a
0
0
result of ozone depletion
22. Changes in ocean CO 2
0
0
source/sink function
Criteria for Economic impacts
Raw score
Score Weight %
Size of economic or public sectors
Very small
Very large
1
60
affected
0
1
2
3
Degree of impact (cost, output changes
Minimum
Severe
2
30
etc.)
0
1
2
3
Occasion/Short
Continuous
Frequency/Duration
0
10
0
1
2
3
Weight average score for Economic impacts
Criteria for Health impacts
Raw score
Score Weight %
Very small
Very large
Number of people affected
1
40
0
1
2
3
Minimum
Severe
Degree of severity
1
50
0
1
2
3
Occasion/Short
Continuous
Frequency/Duration
0
10
0
1
2
3
Weight average score for Health impacts
Criteria for Other social and
Raw score
Score Weight %
community impacts
Number and/or size of community
Very small
Very large
1
20
affected
0
1
2
3
Minimum
Severe
Degree of severity
1
20
0
1
2
3
Occasion/Short
Continuous
Frequency/Duration
3
60
0
1
2
3
Weight average score for Other social and community impacts
2.2
134
GIWA REGIONAL ASSESSMENT 42 GUINEA CURRENT
ANNEXES
135
Comparative environmental and socio-economic impacts of each GIWA concern
Types of impacts
Environmental score
Economic score
Human health score
Social and community score
Concern
Overall score
Present (a)
Future (b)
Present (c)
Future (d)
Present (e)
Future (f)
Present (g)
Future (h)
Freshwater shortage
1.5
2
1.8
2
1.9
2
0.8
1
1.6
Pol ution
2.4
3
2.6
3
2.6
3
0.8
1
2.3
Habitat and community
1.6
2
0.4
1
0.4
1
0.4
0
0.8
modification
Unsustainable exploitation of fish
2.8
3
2.5
3
0
3
1.6
2
2.2
and other living resources
Global change
0
2
1.2
0
0.9
0
2.2
0
0.8
If the results in this table were not giving a clear prioritisation, the scores were weighted by assigning different relative importance to present/future
and environmental/socio-economic impacts in the following way:
Weight averaged environmental and socio-economic impacts of each GIWA concern
Present (%) (i)
Future (%) (j)
Total (%)
40
60
100
Other social and
Environmental (k)
Economic (l)
Health (m)
Total (%)
community impacts (n)
30
25
25
20
100
Types of impacts
Time weight averaged
Time weight averaged
Time weight averaged
Time weight averaged
Time weight averaged overall
Social and community
Environmental score (o)
Economic score (p)
Human health score (q)
score
Concern
score (r)
Rank
(o)x(k)+(p)x(l)+(q)x(m)+
(a)x(i)+(b)x(j)
(c)x(i)+(d)x(j)
(e)x(i)+(f)x(j)
(g)x(i)+(h)x(j)
(r)x(n)
Freshwater shortage
1.8
1.9
2.0
0.9
1.7
3
Pol ution
2.8
2.8
2.1
0.9
2.4
1
Habitat and community
1.8
0.8
0.8
0.2
1.1
4
modification
Unsustainable exploitation of fish
2.9
2.8
1.8
1.8
2.2
2
and other living resources
Global change
1.2
0.5
0.4
0.9
0.8
5
136
GIWA REGIONAL ASSESSMENT 42 GUINEA CURRENT
ANNEXES
137
Annex II
Detailed scoring tables: Guinea Current LME
II: Pollution
III: Habitat and community modification
Weight
Weight
Environmental
Environmental
Environmental issues
Score
Weight %
averaged
Environmental issues
Score
Weight %
averaged
concern
concern
score
score
Habitat and community
4. Microbiological
2
18
Pol ution
2.1
12. Loss of ecosystems
2
50
2.0
modification
5. Eutrophication
1
7
13.Modification of ecosystems or
ecotones, including community
2
50
structure and/or species
6. Chemical
1
10
composition
7. Suspended solids
2
13
8. Solid wastes
3
27
Criteria for Economic impacts
Raw score
Score Weight %
9. Thermal
1
5
Size of economic or public sectors
Very small
Very large
N/a
N/a
affected
0
1
2
3
10. Radionuclide
0
0
Degree of impact (cost, output changes
Minimum
Severe
N/a
N/a
etc.)
0
1
2
3
11. Spil s
2
20
Occasion/Short
Continuous
Frequency/Duration
N/a
N/a
0
1
2
3
Weight average score for Economic impacts
2
Criteria for Economic impacts
Raw score
Score Weight %
Criteria for Health impacts
Raw score
Score Weight %
Size of economic or public sectors
Very small
Very large
Very small
Very large
N/a
N/a
Number of people affected
N/a
N/a
affected
0
1
2
3
0
1
2
3
Degree of impact (cost, output changes
Minimum
Severe
Minimum
Severe
N/a
N/a
Degree of severity
N/a
N/a
etc.)
0
1
2
3
0
1
2
3
Occasion/Short
Continuous
Occasion/Short
Continuous
Frequency/Duration
N/a
N/a
Frequency/Duration
N/a
N/a
0
1
2
3
0
1
2
3
Weight average score for Economic impacts
2
Weight average score for Health impacts
1
Criteria for Other social and
Criteria for Health impacts
Raw score
Score Weight %
Raw score
Score Weight %
community impacts
Very small
Very large
Number and/or size of community
Very small
Very large
Number of people affected
N/a
N/a
N/a
N/a
0
1
2
3
affected
0
1
2
3
Minimum
Severe
Minimum
Severe
Degree of severity
N/a
N/a
Degree of severity
N/a
N/a
0
1
2
3
0
1
2
3
Occasion/Short
Continuous
Occasion/Short
Continuous
Frequency/Duration
N/a
N/a
Frequency/Duration
N/a
N/a
0
1
2
3
0
1
2
3
Weight average score for Health impacts
2
Weight average score for Other social and community impacts
2
Criteria for Other social and
Raw score
Score Weight %
N/a=Not applied
community impacts
Number and/or size of community
Very small
Very large
N/a
N/a
affected
0
1
2
3
Minimum
Severe
Degree of severity
N/a
N/a
0
1
2
3
Occasion/Short
Continuous
Frequency/Duration
N/a
N/a
0
1
2
3
Weight average score for Other social and community impacts
2
N/a=Not applied
136
GIWA REGIONAL ASSESSMENT 42 GUINEA CURRENT
ANNEXES
137
IV: Unsustainable exploitation of fish
V: Global change
Weight
Environmental
Weight
Environmental issues
Score
Weight %
averaged
Environmental
concern
Environmental issues
Score
Weight %
averaged
score
concern
score
Unsustainable
14. Overexploitation
3
40
2.0
19. Changes in the hydrological
exploitation of fish
0
25
Global change
0.25
cycle
15. Excessive by-catch and
2
25
discards
20. Sea level change
1
25
16. Destructive fishing practices
2
15
21. Increased UV-B radiation as a
0
25
result of ozone depletion
17. Decreased viability of stock
0
10
22. Changes in ocean CO 2
through pol ution and disease
0
25
source/sink function
18. Impact on biological and
0
10
genetic diversity
Criteria for Economic impacts
Raw score
Score Weight %
Criteria for Economic impacts
Raw score
Score Weight %
Size of economic or public sectors
Very small
Very large
N/a
N/a
affected
0
1
2
3
Size of economic or public sectors
Very small
Very large
Degree of impact (cost, output changes
Minimum
Severe
N/a
N/a
N/a
N/a
affected
0
1
2
3
etc.)
0
1
2
3
Degree of impact (cost, output changes
Minimum
Severe
Occasion/Short
Continuous
N/a
N/a
Frequency/Duration
N/a
N/a
etc.)
0
1
2
3
0
1
2
3
Occasion/Short
Continuous
Frequency/Duration
N/a
N/a
Weight average score for Economic impacts
1
0
1
2
3
Weight average score for Economic impacts
2
Criteria for Health impacts
Raw score
Score Weight %
Criteria for Health impacts
Raw score
Score Weight %
Very small
Very large
Number of people affected
N/a
N/a
0
1
2
3
Very small
Very large
Minimum
Severe
Number of people affected
N/a
N/a
Degree of severity
N/a
N/a
0
1
2
3
0
1
2
3
Minimum
Severe
Occasion/Short
Continuous
Degree of severity
N/a
N/a
Frequency/Duration
N/a
N/a
0
1
2
3
0
1
2
3
Occasion/Short
Continuous
Frequency/Duration
N/a
N/a
Weight average score for Health impacts
0
0
1
2
3
Weight average score for Health impacts
2
Criteria for Other social and
Raw score
Score Weight %
community impacts
Criteria for Other social and
Raw score
Score Weight %
Number and/or size of community
Very small
Very large
community impacts
N/a
N/a
affected
0
1
2
3
Number and/or size of community
Very small
Very large
Minimum
Severe
N/a
N/a
Degree of severity
N/a
N/a
affected
0
1
2
3
0
1
2
3
Minimum
Severe
Occasion/Short
Continuous
Degree of severity
N/a
N/a
Frequency/Duration
N/a
N/a
0
1
2
3
0
1
2
3
Occasion/Short
Continuous
Frequency/Duration
N/a
N/a
Weight average score for Other social and community impacts
0
0
1
2
3
Weight average score for Other social and community impacts
1.5
N/a=Not applied
N/a=Not applied
Comparative environmental and socio-economic impacts of each GIWA concern
Types of impacts
Environmental score
Economic score
Human health score
Social and community score
Concern
Overall score
Present (a)
Future (b)
Present (c)
Future (d)
Present (e)
Future (f)
Present (g)
Future (h)
Pol ution
2.1
3
2
3
2
3
2
3
2.5
Habitat and community
2.0
3
2
1
1
1
2
1
1.4
modification
Unsustainable exploitation of fish
2.0
3
2
3
2
3
1.5
2
2.3
and other living resources
Global change
0.3
0
1
0
0
0
0
0
0.2
138
GIWA REGIONAL ASSESSMENT 42 GUINEA CURRENT
ANNEXES
139
Annex II
Detailed scoring tables: Niger Basin
I: Freshwater shortage
II: Pollution
Weight
Weight
Environmental
Environmental
Environmental issues
Score
Weight %
averaged
Environmental issues
Score
Weight %
averaged
concern
concern
score
score
1. Modification of stream flow
2
40
Freshwater shortage
1.9
4. Microbiological
0.5
3
Pol ution
1.7
2. Pol ution of existing supplies
1.5
20
5. Eutrophication
1
30
3. Changes in the water table
2
40
6. Chemical
1.5
30
7. Suspended solids
0.5
2
Criteria for Economic impacts
Raw score
Score Weight %
8. Solid wastes
1
5
Size of economic or public sectors
Very small
Very large
9. Thermal
0
0
N/a
N/a
affected
0
1
2
3
Degree of impact (cost, output changes
Minimum
Severe
N/a
N/a
10. Radionuclide
0
0
etc.)
0
1
2
3
Occasion/Short
Continuous
Frequency/Duration
N/a
N/a
11. Spil s
3
30
0
1
2
3
Weight average score for Economic impacts
2.0
Criteria for Health impacts
Raw score
Score Weight %
Criteria for Economic impacts
Raw score
Score Weight %
Very small
Very large
Number of people affected
N/a
N/a
Size of economic or public sectors
Very small
Very large
0
1
2
3
N/a
N/a
affected
0
1
2
3
Minimum
Severe
Degree of severity
N/a
N/a
Degree of impact (cost, output changes
Minimum
Severe
0
1
2
3
N/a
N/a
etc.)
0
1
2
3
Occasion/Short
Continuous
Frequency/Duration
N/a
N/a
Occasion/Short
Continuous
0
1
2
3
Frequency/Duration
N/a
N/a
0
1
2
3
Weight average score for Health impacts
2.0
Weight average score for Economic impacts
1.9
Criteria for Other social and
Raw score
Score Weight %
community impacts
Criteria for Health impacts
Raw score
Score Weight %
Number and/or size of community
Very small
Very large
N/a
N/a
Very small
Very large
affected
0
1
2
3
Number of people affected
N/a
N/a
0
1
2
3
Minimum
Severe
Degree of severity
N/a
N/a
Minimum
Severe
0
1
2
3
Degree of severity
N/a
N/a
0
1
2
3
Occasion/Short
Continuous
Frequency/Duration
N/a
N/a
Occasion/Short
Continuous
0
1
2
3
Frequency/Duration
N/a
N/a
0
1
2
3
Weight average score for Other social and community impacts
2.0
Weight average score for Health impacts
1.9
N/a = Not applied
Criteria for Other social and
Raw score
Score Weight %
community impacts
Number and/or size of community
Very small
Very large
N/a
N/a
affected
0
1
2
3
Minimum
Severe
Degree of severity
N/a
N/a
0
1
2
3
Occasion/Short
Continuous
Frequency/Duration
N/a
N/a
0
1
2
3
Weight average score for Other social and community impacts
1.9
N/a = Not applied
138
GIWA REGIONAL ASSESSMENT 42 GUINEA CURRENT
ANNEXES
139
III: Habitat and community modification
IV: Unsustainable exploitation of fish
Weight
Weight
Environmental
Environmental
Environmental issues
Score
Weight %
averaged
Environmental issues
Score
Weight %
averaged
concern
concern
score
score
Habitat and community
12. Loss of ecosystems
2.5
30
2.7
Unsustainable
modification
14. Overexploitation
2
50
2
exploitation of fish
13.Modification of ecosystems or
15. Excessive by-catch and
0
2
ecotones, including community
discards
2.8
70
structure and/or species
composition
16. Destructive fishing practices
2.5
40
17. Decreased viability of stock
0
3
through pol ution and disease
18. Impact on biological and
Criteria for Economic impacts
Raw score
Score Weight %
1.5
5
genetic diversity
Size of economic or public sectors
Very small
Very large
N/a
N/a
affected
0
1
2
3
Degree of impact (cost, output changes
Minimum
Severe
N/a
N/a
etc.)
0
1
2
3
Criteria for Economic impacts
Raw score
Score Weight %
Occasion/Short
Continuous
Frequency/Duration
N/a
N/a
0
1
2
3
Size of economic or public sectors
Very small
Very large
N/a
N/a
affected
0
1
2
3
Weight average score for Economic impacts
2.2
Degree of impact (cost, output changes
Minimum
Severe
N/a
N/a
etc.)
0
1
2
3
Criteria for Health impacts
Raw score
Score Weight %
Occasion/Short
Continuous
Frequency/Duration
N/a
N/a
0
1
2
3
Very small
Very large
Number of people affected
N/a
N/a
0
1
2
3
Weight average score for Economic impacts
1.7
Minimum
Severe
Degree of severity
N/a
N/a
0
1
2
3
Criteria for Health impacts
Raw score
Score Weight %
Occasion/Short
Continuous
Frequency/Duration
N/a
N/a
0
1
2
3
Very small
Very large
Number of people affected
N/a
N/a
0
1
2
3
Weight average score for Health impacts
2.2
Minimum
Severe
Degree of severity
N/a
N/a
0
1
2
3
Criteria for Other social and
Raw score
Score Weight %
Occasion/Short
Continuous
community impacts
Frequency/Duration
N/a
N/a
0
1
2
3
Number and/or size of community
Very small
Very large
N/a
N/a
affected
0
1
2
3
Weight average score for Health impacts
1.7
Minimum
Severe
Degree of severity
N/a
N/a
Criteria for Other social and
0
1
2
3
Raw score
Score Weight %
community impacts
Occasion/Short
Continuous
Frequency/Duration
N/a
N/a
0
1
2
3
Number and/or size of community
Very small
Very large
N/a
N/a
affected
0
1
2
3
Weight average score for Other social and community impacts
2.2
Minimum
Severe
Degree of severity
N/a
N/a
N/a = Not applied
0
1
2
3
Occasion/Short
Continuous
Frequency/Duration
N/a
N/a
0
1
2
3
Weight average score for Other social and community impacts
1.7
N/a = Not applied
140
GIWA REGIONAL ASSESSMENT 42 GUINEA CURRENT
ANNEXES
141
V: Global change
Weight
Environmental
Environmental issues
Score
Weight %
averaged
concern
score
19. Changes in the hydrological
1.5
25
Global change
0.4
cycle
20. Sea level change
0
25
21. Increased UV-B radiation as a
0
25
result of ozone depletion
22. Changes in ocean CO 2
0
25
source/sink function
Criteria for Economic impacts
Raw score
Score Weight %
Size of economic or public sectors
Very small
Very large
N/a
N/a
affected
0
1
2
3
Degree of impact (cost, output changes
Minimum
Severe
N/a
N/a
etc.)
0
1
2
3
Occasion/Short
Continuous
Frequency/Duration
N/a
N/a
0
1
2
3
Weight average score for Economic impacts
N/a
Criteria for Health impacts
Raw score
Score Weight %
Very small
Very large
Number of people affected
N/a
N/a
0
1
2
3
Minimum
Severe
Degree of severity
N/a
N/a
0
1
2
3
Occasion/Short
Continuous
Frequency/Duration
N/a
N/a
0
1
2
3
Weight average score for Health impacts
N/a
Criteria for Other social and
Raw score
Score Weight %
community impacts
Number and/or size of community
Very small
Very large
N/a
N/a
affected
0
1
2
3
Minimum
Severe
Degree of severity
N/a
N/a
0
1
2
3
Occasion/Short
Continuous
Frequency/Duration
N/a
N/a
0
1
2
3
Weight average score for Other social and community impacts
N/a
N/a=Not applied
Comparative environmental and socio-economic impacts of each GIWA concern
Types of impacts
Environmental score
Economic score
Human health score
Social and community score
Concern
Overall score
Present (a)
Future (b)
Present (c)
Future (d)
Present (e)
Future (f)
Present (g)
Future (h)
Freshwater shortage
1.9
3
2.0
3
2.0
3
2.0
3
2.5
Pol ution
1.7
2
1.9
3
1.9
3
1.9
3
2.3
Habitat and community
2.7
3
2.2
3
2.2
3
2.2
3
2.7
modification
Unsustainable exploitation of fish
2.0
2.5
1.7
3
1.7
3
1.7
3
2.3
and other living resources
Global change
1.5
N/a
N/a
N/a
N/a
N/a
N/a
N/a
0.3
N/a = Not applied
140
GIWA REGIONAL ASSESSMENT 42 GUINEA CURRENT
ANNEXES
141
Annex II
Detailed scoring tables: Volta Basin
I: Freshwater shortage
II: Pollution
Weight
Weight
Environmental
Environmental
Environmental issues
Score
Weight %
averaged
Environmental issues
Score
Weight %
averaged
concern
concern
score
score
1. Modification of stream flow
2.8
70
Freshwater shortage
2.2
4. Microbiological
1.7
35
Pol ution
1.3
2. Pol ution of existing supplies
0.6
10
5. Eutrophication
1
16
3. Changes in the water table
1.4
20
6. Chemical
1
9
7. Suspended solids
1
13
Criteria for Economic impacts
Raw score
Score Weight %
8. Solid wastes
1.3
27
Size of economic or public sectors
Very small
Very large
9. Thermal
-
0
2.3
45
affected
0
1
2
3
Degree of impact (cost, output changes
Minimum
Severe
2
33
10. Radionuclide
-
0
etc.)
0
1
2
3
Occasion/Short
Continuous
Frequency/Duration
2.6
22
11. Spil s
-
0
0
1
2
3
Weight average score for Economic impacts
2.3
Criteria for Health impacts
Raw score
Score Weight %
Criteria for Economic impacts
Raw score
Score Weight %
Very small
Very large
Number of people affected
1.8
45
Size of economic or public sectors
Very small
Very large
0
1
2
3
1
34
affected
0
1
2
3
Minimum
Severe
Degree of severity
2.
33
Degree of impact (cost, output changes
Minimum
Severe
0
1
2
3
1.2
36
etc.)
0
1
2
3
Occasion/Short
Continuous
Frequency/Duration
2.3
22
Occasion/Short
Continuous
0
1
2
3
Frequency/Duration
1.7
30
0
1
2
3
Weight average score for Health impacts
2
Weight average score for Economic impacts
1.28
Criteria for Other social and
Raw score
Score Weight %
community impacts
Criteria for Health impacts
Raw score
Score Weight %
Number and/or size of community
Very small
Very large
1.6
34
Very small
Very large
affected
0
1
2
3
Number of people affected
1.3
28
0
1
2
3
Minimum
Severe
Degree of severity
2.5
32
Minimum
Severe
0
1
2
3
Degree of severity
1.5
38
0
1
2
3
Occasion/Short
Continuous
Frequency/Duration
2.5
34
Occasion/Short
Continuous
0
1
2
3
Frequency/Duration
2
34
0
1
2
3
Weight average score for Other social and community impacts
2
Weight average score for Health impacts
2
Criteria for Other social and
Raw score
Score Weight %
community impacts
Number and/or size of community
Very small
Very large
1.2
38
affected
0
1
2
3
Minimum
Severe
Degree of severity
1.2
29
0
1
2
3
Occasion/Short
Continuous
Frequency/Duration
1.5
33
0
1
2
3
Weight average score for Other social and community impacts
1.3
142
GIWA REGIONAL ASSESSMENT 42 GUINEA CURRENT
ANNEXES
143
III: Habitat and community modification
IV: Unsustainable exploitation of fish
Weight
Weight
Environmental
Environmental
Environmental issues
Score
Weight %
averaged
Environmental issues
Score
Weight %
averaged
concern
concern
score
score
Habitat and community
12. Loss of ecosystems
1.9
37
2.4
Unsustainable
modification
14. Overexploitation
2.4
49
2.4
exploitation of fish
13.Modification of ecosystems or
15. Excessive by-catch and
-
0
ecotones, including community
discards
2.7
63
structure and/or species
composition
16. Destructive fishing practices
2.4
51
17. Decreased viability of stock
-
0
through pol ution and disease
18. Impact on biological and
Criteria for Economic impacts
Raw score
Score Weight %
-
0
genetic diversity
Size of economic or public sectors
Very small
Very large
2
33
affected
0
1
2
3
Degree of impact (cost, output changes
Minimum
Severe
2.5
40
etc.)
0
1
2
3
Criteria for Economic impacts
Raw score
Score Weight %
Occasion/Short
Continuous
Frequency/Duration
2.5
27
0
1
2
3
Size of economic or public sectors
Very small
Very large
2
36
affected
0
1
2
3
Weight average score for Economic impacts
2.3
Degree of impact (cost, output changes
Minimum
Severe
1.8
40
etc.)
0
1
2
3
Criteria for Health impacts
Raw score
Score Weight %
Occasion/Short
Continuous
Frequency/Duration
1.8
24
0
1
2
3
Very small
Very large
Number of people affected
1.5
42
0
1
2
3
Weight average score for Economic impacts
1.9
Minimum
Severe
Degree of severity
2
34
0
1
2
3
Criteria for Health impacts
Raw score
Score Weight %
Occasion/Short
Continuous
Frequency/Duration
2.2
24
0
1
2
3
Very small
Very large
Number of people affected
2
50
0
1
2
3
Weight average score for Health impacts
1.8
Minimum
Severe
Degree of severity
1.2
28
Criteria for Other social and
0
1
2
3
Raw score
Score Weight %
community impacts
Occasion/Short
Continuous
Frequency/Duration
2
22
0
1
2
3
Number and/or size of community
Very small
Very large
2
39
affected
0
1
2
3
Weight average score for Health impacts
1.8
Minimum
Severe
Degree of severity
2.2
35
0
1
2
3
Criteria for Other social and
Raw score
Score Weight %
Occasion/Short
Continuous
community impacts
Frequency/Duration
2.2
26
0
1
2
3
Number and/or size of community
Very small
Very large
1.4
41
affected
0
1
2
3
Weight average score for Other social and community impacts
2.1
Minimum
Severe
Degree of severity
1.2
30
0
1
2
3
Occasion/Short
Continuous
Frequency/Duration
1.6
29
0
1
2
3
Weight average score for Other social and community impacts
1.4
142
GIWA REGIONAL ASSESSMENT 42 GUINEA CURRENT
ANNEXES
143
V: Global change
Weight
Environmental
Environmental issues
Score
Weight %
averaged
concern
score
19. Changes in the hydrological
1.2
100
Global change
1.2
cycle
20. Sea level change
0
0
21. Increased UV-B radiation as a
0
0
result of ozone depletion
22. Changes in ocean CO 2
0
0
source/sink function
Criteria for Economic impacts
Raw score
Score Weight %
Size of economic or public sectors
Very small
Very large
1.2
44
affected
0
1
2
3
Degree of impact (cost, output changes
Minimum
Severe
1.2
25
etc.)
0
1
2
3
Occasion/Short
Continuous
Frequency/Duration
2
31
0
1
2
3
Weight average score for Economic impacts
1.4
Criteria for Health impacts
Raw score
Score Weight %
Very small
Very large
Number of people affected
1.4
36
0
1
2
3
Minimum
Severe
Degree of severity
1.6
34
0
1
2
3
Occasion/Short
Continuous
Frequency/Duration
1.2
30
0
1
2
3
Weight average score for Health impacts
1
Criteria for Other social and
Raw score
Score Weight %
community impacts
Number and/or size of community
Very small
Very large
1
37
affected
0
1
2
3
Minimum
Severe
Degree of severity
1
31
0
1
2
3
Occasion/Short
Continuous
Frequency/Duration
1.2
32
0
1
2
3
Weight average score for Other social and community impacts
1
Comparative environmental and socio-economic impacts of each GIWA concern
Types of impacts
Environmental score
Economic score
Human health score
Social and community score
Concern
Overall score
Present (a)
Future (b)
Present (c)
Future (d)
Present (e)
Future (f)
Present (g)
Future (h)
Freshwater shortage
2.2
3
2.3
2.
2.0
2
2.0
2
2.3
Pol ution
1.3
2
1.3
2
2.0
2
1.3
1
1.6
Habitat and community
2.4
2
2.3
1
1.8
1
2.1
1
1.7
modification
Unsustainable exploitation of fish
2.4
3
1.9
3
1.8
1
1.4
2
2.1
and other living resources
Global change
1.2
1
1.4
1
1.0
1
1.0
0
1.0
144
GIWA REGIONAL ASSESSMENT 42 GUINEA CURRENT
ANNEXES
145
Annex III
GDP and other economic indicators in the countries of the
Guinea Current region
GDP per capita
GDP per capita
Average annual change in
GDP
GDP per capita
HDI
annual growth rate
highest value
consumer price index
Country
2000
rank
2000
PPP 2000
(PPP USD)a
1975-2000
Year of highest
1975-2000
1990-2000
1990-2000
1999-2000
(bil ion USD)
(bil ion USD)
(PPP USD)a
value
106
Algeria
53.3
161.3
5 308
-0.3
-0.1
5 997
1985
19.5
b
ND
161
Angola
8.8
28.7
2 187
-1.9
b
-1.8
3 016
b
1980
708.7
325.0
158
Benin
2.2
6.2
990
0.5
1.8
990
2000
8.7
b
4.2
169
Burkina Faso
2.2
11.0
976
1.4
2.4
980
1999
5.5
-0.3
135
Cameroon
8.9
25.3
1 703
-0.6
-0.8
2 574
1986
6.5
1.2
165
Central African Republic
1.0
4.4
1 172
-1.6
-0.5
1 646
1977
5.9
b
ND
166
Chad
1.4
6.7
871
ND
-0.8
1 025
1977
8.1
3.8
136
Congo, Rep. of the
3.2
2.5
825
ND
-3.4
1 326
1984
9.2
b
-0.9
155
Congo, Dem. Rep. of the
5.6
c
36.9
c
765
c
-4.7
b
-8.2
b
ND
ND
2 089
b
ND
156
Côte d'Ivoire
9.4
26.1
1 630
-2.1
0.4
2 717
1978
7.2
2.5
117
Gabon
4.9
7.7
6 237
-1.5
0.1
12 112
1976
5.7
b
ND
129
Ghana
5.2
37.9
1 964
0.1
1.8
1 989
1978
28.4
25.2
159
Guinea
3.0
14.7
1 982
1.4
b
1.7
1 987
b
1999
ND
ND
167
Guinea-Bissau
0.2
0.9
755
0.4
-1.1
965
1997
34.0
8.6
111
Guinea-Equatorial
1.3
6.9
15 073
10.4
b
18.9
15 073
b
2000
ND
ND
Liberia
ND
ND
ND
ND
ND
ND
ND
ND
ND
164
Mali
2.3
8.6
797
-0.5
1.3
904
1979
5.2
-0.7
172
Niger
1.8
8.1
746
-2.1
-1.0
1 267
1979
6.1
2.9
148
Nigeria
41.1
113.7
896
-0.7
-0.4
1 160
1977
32.5
6.9
119
Săo Tomé and Príncipe
ND
ND
ND
-0.9
b
-0.8
ND
ND
ND
ND
154
Senegal
4.4
14.4
1 510
-0.2
0.9
1 584
1976
5.4
0.7
173
Sierra Leone
0.6
2.5
490
-2.6
-6.5
1 002
1982
29.3
-0.8
139
Sudan
11.5
55.9
1 797
0.6
5.6
1 797
2000
81.1
b
ND
141
Togo
1.2
6.5
1 442
-1.2
-0.4
2 059
1980
8.5
1.9
150
Uganda
6.2
26.8
1 208
2.5
b
3.8
1 208
b
2000
10.5
2.8
153
Zambia
2.9
7.9
780
-2.3
-2.1
1 389
1976
80.8
b
ND
a. In theory, for the United States the value of GDP in PPP US dollars should be the same as that in US dollars, but practical issues arising in the calculation of the PPP US dollar GDP prevent this.
b. Data refer to a period shorter than that specified. c. Data refer to 1998. d. Data refer to 1999.
Column 1-3: World Bank 2002. World Development Indicators 2002. CD-ROM. Washington, DC.; aggregates calculated for the Human Development Report Office by the World Bank.
Column 4-5: World Bank 2002. Correspondence on GDP per capita annual growth rates. March. Washington, DC.; aggregates calculated for the Human Development Report Office by the World Bank.
Column 6-7: calculated on the basis of data on GDP at market prices (constant 1995 USD), population and GDP per capita (PPP USD) from World Bank 2002. World Development Indicators 2002. CD-ROM.
Washington, DC.
Column 8: calculated for the Human Development Report Office by the World Bank on the basis of data on the consumer price index from World Bank 2002. World Development Indicators 2002. CD-ROM.
Washington, DC.
Column 9: calculated on the basis of data on the consumer price index from World Bank. 2002. World Development Indicators 2002. CD-ROM. Washington, DC.
Note: ND = No Data.
(Source: UNDP 2002)
144
GIWA REGIONAL ASSESSMENT 42 GUINEA CURRENT
ANNEXES
145
Annex IV
HDI and other socio-economic indicators in the countries of the
Guinea Current region
Life
Adult literacy
Combined 1,
Human
GDP per capita
GDP per capita
Life
HDI
expectancy at
rate 2000
2 and 3 gross
Education
development
(PPP USD) rank
Country
2000
expectancy
GDP index
ranka
birth 2000
(% age 15 and
enrolment
index
index (HDI)
minus HDI
(PPP USD)
index
(years)
above)
ratio 1999 (%)b
value 2000
rankc
106
Algeria
69.6
66.7
72
5 308
0.74
0.69
0.66
0.697
-22
161
Angola
45.2
42.0
j,t
23
2 187
0.34
0.36
0.51
0.403
-36
158
Benin
53.8
37.4
45
990
0.48
0.40
0.38
0.420
-4
169
Burkina Faso
46.7
23.9
23
976
0.36
0.23
0.38
0.325
-14
135
Cameroon
50.0
75.8
43
1 703
0.42
0.65
0.47
0.512
0
165
Central African Republic
44.3
46.7
24
1 172
0.32
0.39
0.41
0.375
-15
166
Chad
45.7
42.6
31
871
0.35
0.39
0.36
0.365
-7
136
Congo, Rep. of the
51.3
80.7
63
825
0.44
0.75
0.35
0.512
27
155
Congo, Dem. Rep. of the
51.3
61.4
31
765
k
0.44
0.51
0.34
0.431
11
156
Côte d'Ivoire
47.8
46.8
38
1 630
0.38
0.44
0.47
0.428
-17
117
Gabon
52.7
71.0
i,j
86
6 237
0.46
0.76
0.69
0.637
-44
129
Ghana
56.8
71.5
42
1 964
0.53
0.62
0.50
0.548
1
159
Guinea
47.5
41.0
i,j
28
1 982
0.38
0.37
0.50
0.414
-30
167
Guinea-Bissau
44.8
38.5
37
755
0.33
0.38
0.34
0.349
0
111
Guinea-Equatorial
51.0
83.2
64
15 073
0.43
0.77
0.84
0.679
-73
Liberia
ND
ND
ND
ND
ND
ND
ND
ND
ND
164
Mali
51.5
41.5
28
797
0.44
0.37
0.35
0.386
0
172
Niger
45.2
15.9
16
746
0.34
0.16
0.34
0.277
-4
148
Nigeria
51.7
63.9
45
896
0.44
0.58
0.37
0.462
9
119
Săo Tomé and Príncipe
65.1
u
83.1
o
58
o
1 792
q,v
0.67
0.75
0.48
0.632
14
154
Senegal
53.3
37.3
36
1 510
0.47
0.37
0.45
0.431
-11
173
Sierra Leone
38.9
36.0
i,j
27
490
0.23
0.33
0.27
0.275
0
139
Sudan
56.0
57.8
34
1 797
0.52
0.50
0.48
0.499
-7
141
Togo
51.8
57.1
62
1 442
0.45
0.59
0.45
0.493
5
150
Uganda
44.0
67.1
45
1 208
0.32
0.60
0.42
0.444
-1
153
Zambia
41.4
78.1
49
780
0.27
0.68
0.34
0.433
12
Note: As a result of revisions to data and methodology, Human Development Index values are
Column 1: calculated on the basis of data on life expectancy from UN (United Nations) 2001.
not strictly comparable with those in earlier Human Development Reports. a. The HDI rank
World Population Prospects 1950-2050: The 2000 Revision. Database. Department of Economic
is determined using HDI values to the sixth decimal point. b. Preliminary UNESCO estimates,
and Social Affairs, Population Division. New York. Column 2: unless otherwise noted, UNESCO
subject to further revision. c. A positive figure indicates that the HDI rank is higher than the GDP
(United Nations Educational, Scientific and Cultural Organization) 2002. Correspondence on
per capita (PPP USD) rank, a negative the opposite. j. Data refer to year or period other than that
adult and youth literacy rates. January. Montreal. Column 3: unless otherwise noted, UNESCO
specified, differ from the standard definition or refer to only part of a country. k. Data refer to
(United Nations Educational, Scientific and Cultural Organization) 2001. Correspondence on
1998. q. Aten, Bettina, Alan Heston and Robert Summers. 2001. "Penn World Tables 6.0." University
gross enrolment ratios. March. Paris. Column 4: unless otherwise noted, World Bank 2002. World
of Pennsylvania, Center for International and Interarea Comparisons, Philadelphia. Data differ
Development Indicators 2002. CD-ROM. Washington, DC.; aggregates calculated for the Human
from the standard definition. t. UNICEF (United Nations Children's Fund). 2000. The State of the
Development Report Office by the World Bank. Column 5: calculated on the basis of data in column
World's Children 2001. New York: Oxford University Press. u. World Bank. 2002. World Development
1. Column 6: calculated on the basis of data in columns 2 and 3. Column 7: calculated on the basis
Indicators 2002. CD-ROM. Washington, DC. v. Data refer to 1997.
of data in column 4. Column 8: calculated on the basis of data in columns 5-7; see technical note 1
for details. Column 9: calculated on the basis of data presented in columns 4 and 8. ND = No Data.
(Source: UNDP 2002)
146
GIWA REGIONAL ASSESSMENT 42 GUINEA CURRENT
ANNEXES
147
Annex V
Statistics related to water access and water use in the countries
of the Guinea Current region
Physical area (ha)
Population
Water resources
)
(
h
a
)
P
C
C
P
C
C
n
a
t
u
r
a
l
)
0
0
0
e
s
o
u
r
c
e
s
a
t
e
r
(
a
c
t
ual
n 2
(
h
a
)
(
i
n
v
)
(
i
n
v
)
(
i
n
v
)
a
t
e
r r
n
t
e
r
n
a
l
l
y
n
t
e
r
n
a
l
l
y
u
r
c
es
Country
9
6
1
-
1
9
9
0 I
9
6
1
-
1
9
9
0 I
e
s
o
u
r
c
e
s (
r
o
p
s i
0
0
0
r
o
u
n
d
w
0
0
0
0
0
0
0
0
0
)
(
h
a
)
(
h
a
)
n 2
n 2
n 2
n 2
a
b
l
e w
n
d g
a
t
e
r r
a
t
e
r
r
eso
(
%
r
o
d
u
c
e
d i
r
o
d
u
c
e
d i
0
0
0
a
n
e
n
t c
0
0
0
3
-
4
r
o
p
s i
e
n
e
w
2
+
l
e
w
a
t
i
o
n 2
n 2
a
b
l
e w
e
r
m
r
e
c
i
p
i
t
a
t
i
o
n 1
ab
1
r
e
c
i
p
i
t
a
t
i
o
n 1
1
a
t
e
r
: p
a
t
e
r
: p
u
r
f
a
c
e a
2
r
e
a i
r
e
a i
o
p
u
l
a
t
i
o
n i
o
p
u
l
a
t
i
o
n i
a
n
e
n
t c
o
p
u
l
a
t
i
o
n i
t
e
r
n
a
l r
e
n
e
w
/
y
e
a
r
)
/
y
e
a
r
)
/
y
e
a
r
)
1
=
/
y
e
a
r
)
2
/
y
e
a
r
)
3
/
y
e
a
r
)
4
/
y
e
a
r
)
r
e
n
e
w
/
y
e
a
r
)
m
3
2
2
2
2
2
2
T
o
t
a
l a
A
r
a
b
l
e & p
A
r
a
b
l
e a
P
e
r
m
T
o
t
a
l p
R
u
r
a
l p
U
r
b
a
n p
A
v
e
r
a
g
e p
(
m
A
v
e
r
a
g
e p
(
k
m
T
o
t
a
l i
(
k
m
G
r
o
u
n
d
w
(
k
m
S
u
r
f
a
c
e w
(
k
m
O
v
e
r
l
a
p
: S
(
k
m
T
o
t
a
l r
(
k
m
T
o
t
al
(
k
m
D
e
p
e
n
d
e
n
c
y r
Algeria
238 174 000 8 195 000 7 675 000
520 000
30 291 000 12 033 000 18 258 000
89
211.50
13.90
1.70
13.20
1.00
14.32
14.32
3
Angola
124 670 000 3 300 000 3 000 000
300 000
13 134 000 8 643 000 4 492 000
1 010
1 258.79
184.00
72.00
182.00
70.00
184.00
184.00
0
Benin
11 262 000
2215 000 1 950 000
265 000
6 272 000 3 621 000 2 651 000
1 039
117.05
10.30
1.80
10.00
1.50
24.80
24.80
58
Burkina Faso
27 400 000 3 850 000 3 800 000
50 000
11 535 000 9 405 000 2 130 000
748
204.92
12.50
9.50
8.00
5.00
12.50
12.50
0
Cameroon
47 544 000 7 160 000 5 960 000 1 200 000
14 876 000 7 599 000 7 277 000
1 604
762.46
273.00
100.00
268.00
95.00
285.50
285.50
4
Central African
62 298 000 2 020 000 1 930 000
90 000
3 717 000 2 186 000 1 531 000
1 343
836.66
141.00
56.00
141.00
56.00
144.40
144.40
2
Republic
Chad
128 400 000 3 550 000 3 520 000
30 000
7 885 000 6 010 000 1 876 000
322
413.19
15.00
11.50
13.50
10.00
43.00
43.00
65
DR Congo
234 486 000 7 880 000 6 700 000 1 180 000
50 948 000 35 521 000 15 427 000
1 543
3 618.12
900.00
421.00
899.00
420.00
1 283.00
1 283.00
30
Rep. Congo
34 200 000
220 000
175 000
45 000
3 018 000 1 131 000 1 888 000
1 646
562.93
222.00
198.00
222.00
198.00
832.00
832.00
73
Cote d'Ivoire
32 246 000 7 350 000 2 950 000 4 400 000
16 013 000 8 590 000 7 423 000
1 348
434.68
76.70
37.70
74.00
35.00
81.00
81.00
5
Gabon
26 767 000
495 000
325 000
170 000
1 230 000
229 000 1 001 000
1 831
490.00
164.00
62.00
162.00
60.00
164.00
164.00
0
Ghana
23 854 000 5 809 000 3 609 000 2 200 000
19 306 000 11 901 000 7 405 000
1 187
283.19
30.30
26.30
29.00
25.00
53.20
53.20
43
Guinea
24 586 000 1 485 000
885 000
600 000
8 154 000 5 482 000 2 672 000
1 651
405.94
226.00
38.00
226.00
38.00
226.00
226.00
0
Guinea-Bissau
3 612 000
350 000
300 000
50 000
1 199 000
914 000
285 000
1 577
56.97
16.00
14.00
12.00
10.00
31.00
31.00
48
Guinea-Eq.
2 805 000
230 000
130 000
100 000
457 000
236 000
220 000
2156
60.48
26.00
10.00
25.00
9.00
26.00
26.00
0
Liberia
11 137 000
595 000
380 000
215 000
2 913 000 1 605 000 1 308 000
2391
266.29
200.00
60.00
200.00
60.00
232.00
232.00
14
Mali
124 019 000 4 674 000 4 630 000
44 000
11 351 000 7 941 000 3 410 000
282
349.61
60.00
20.00
50.00
10.00
100.00
100.00
40
Niger
126 700 000 4 500 000 4 490 000
10 000
10 832 000 8 604 000 2 228 000
151
190.81
3.50
2.50
1.00
0.00
33.65
33.65
90
Nigeria
92 377 000 30850 000 28200 000 2 650 000 113862 000 63775 000 50 086 000
1 150
1 062.34
221.00
87.00
214.00
80.00
286.20
286.20
23
Săo Tomé and
96 000
47 000
4 000
43 000
138 000
73 000
65 000
2 169
2.08
2.18
ND
ND
ND
2.18
2.18
0
Príncipe
Senegal
19 672 000 2 400 000 2 362 000
38 000
9 421 000 4 951 000 4 469 000
687
135.05
26.40
7.60
23.80
5.00
39.40
39.40
33
Sierra Leone
7 174 000
550 000
490 000
60 000
4 405 000 2 791 000 1 614 000
2 526
181.22
160.00
50.00
150.00
40.00
160.00
160.00
0
Sudan
250 581 000 16433 000 16233 000
200 000
31 095 000 19863 000 11 232 000
417
1 043.67
30.00
7.00
28.00
5.00
149.00
64.50
77
Togo
5 679 000 2 630 000 2 510 000
120 000
4 527 000 3 021 000 1 506 000
1 168
66.30
11.50
5.70
10.80
5.00
14.70
14.70
22
Uganda
24 104 000 6 960 000 5 060 000 1 900 000
23 300 000 20002 000 3 298 000
1 180
284.50
39.00
29.00
39.00
29.00
66.00
66.00
41
Zambia
75 261 000 5 279 000 5 260 000
19 000
10 421 000 6 293 000 4 128 000
1 020
767.44
80.20
47.00
80.20
47.00
105.20
105.20
24
Notes: 1 For some countries large discrepancies exists between national and IPCC data on rainfall average. In these cases, IPCC data were modified to ensure consistency with water resources data.
2 Aggregation of data can only be done for Internal renewable water resources and not the Total renewable water resources, as that would result in double counting of shared water resources.
ND = No Data
(Source: FAO AQUASTAT 2003b)
146
GIWA REGIONAL ASSESSMENT 42 GUINEA CURRENT
ANNEXES
147
Annex V (continued)
Statistics related to water access and water use in the countries
of the Guinea Current region
Water use (FAO estimates 2000)
Irrigation
(
h
a
)
/
y
e
a
r
)
/
y
e
a
r
)
2
)
2
/
y
e
a
r
)
(
h
a
)
4
(
k
m
(
%
/
y
e
a
r
)
2
)
2
)
(
k
m
1
Country
s
e
s
e
(
k
m
(
%
(
k
m
(
%
r
r
i
g
a
t
i
o
n
1
1
0
0
0
(
h
a
)
s
e
s
e
s
e
s
e
a
t
a
e
t
l
a
n
d
n 2
2
(
h
a
)
a
t
e
r u
a
t
e
r u
3
s
e i
o
n
t
r
o
l i
a
t
e
r u
a
t
e
r u
a
t
e
r u
a
t
e
r u
o
t
e
n
t
i
a
l
(
h
a
)
e
t
l
a
n
d
a
t
e
r u
r
r
i
g
a
t
i
o
n d
r
r
i
g
a
t
i
o
n
u
l
t
i
v
a
t
e
d w
e
s
t
i
c w
e
s
t
i
c w
f i
A
g
r
i
c
u
l
t
u
r
a
l w
A
g
r
i
c
u
l
t
u
r
a
l w
D
o
m
D
o
m
I
n
d
u
s
t
r
i
a
l w
I
n
d
u
s
t
r
i
a
l w
T
o
t
a
l w
I
r
r
i
g
a
t
i
o
n p
Y
e
a
r o
F
u
l
l
/
p
a
r
t
i
a
l c
E
q
u
i
p
p
e
d w
T
o
t
a
l i
O
t
h
e
r c
Algeria
3.94
65
1.33
22
0.80
13
6.07
730 000
1992
445 500
0
555 500
0
Angola
0.21
61
0.08
22
0.06
16
0.34
6 700 000
1974
75 000
0
75 000
350 000
Benin
0.19
74
0.04
15
0.03
11
0.25
300 000
1994
9 786
450
10 236
6 988
Burkina Faso
0.69
88
0.09
11
0
0
0.78
164 460
1992
15 430
8 900
24 330
21 400
Cameroon
0.73
74
0.18
18
0.08
8
0.99
240 000
1987
20 970
0
20 970
0
Central African Republic
0.001
4
0.02
77
0.004
19
0.02
1 900 000
1987
135
0
135
500
Chad
0.19
80
0.04
19
0.00
1
0.23
935 000
1988
14 020
0
14 020
21 400
DR Congo
0.11
31
0.19
52
0.06
16
0.36
4 000 000
1995
10 000
500
10 500
2 000
Rep. Congo
0.004
10
0.02
59
0.01
30
0.04
40 000
1993
217
0
217
0
Cote d'Ivoire
0.60
65
0.22
23
0.11
12
0.93
475 000
1994
47 750
25 000
72 750
16 250
Gabon
0.05
40
0.06
48
0.01
11
0.13
440 000
1987
3 150
1 300
4 450
0
Ghana
0.25
48
0.19
37
0.08
15
0.52
1 900 000
1994
6 374
0
6 374
0
Guinea
1.36
90
0.12
8
0.03
2
1.52
520 000
1994
15 541
77 339
92 880
0
Guinea-Bissau
0.10
91
0.01
9
0.0006
1
0.11
281 290
1994
5 110
12 005
17 115
25 322
Guinea-Equatorial
0.001
1
0.09
83
0.017
16
0.11
ND
ND
ND
ND
ND
ND
Liberia
0.06
56
0.03
28
0.02
15
0.11
600 000
1987
100
2 000
2 100
18 000
Mali
6.87
99
0.05
1
0.02
0
6.93
560 000
1994
78 620
0
78 620
3 826
Niger
2.08
95
0.09
4
0.01
1
2.19
270 000
1989
66 480
0
66 480
0
Nigeria
5.51
69
1.69
21
0.81
10
8.00
3 137 000
1991
219 621
13 200
232 821
0
Săo Tomé and Príncipe
ND
ND
ND
ND
ND
ND
ND
ND
1991
9 700
0
9 700
0
Senegal
1.43
90
0.10
6
0.06
4
1.59
400 000
1994
71 400
0
71 400
37 000
Sierra Leone
0.35
93
0.02
5
0.01
2
0.38
807 000
1992
1 000
28 360
29 360
126 000
Sudan
36.07
97
0.99
3
0.26
1
37.31
2 784 000
1995
1 900 000
0
1 946 200
0
Togo
0.08
47
0.07
45
0.01
8
0.17
180 000
1990
2 008
5 000
7 008
0
Uganda
0.12
39
0.13
45
0.05
15
0.30
202 000
1987
5 550
3 570
9 120
0
Zambia
1.32
76
0.29
16
0.13
8
1.74
520 000
1992
46 400
0
46 400
100 000
Average percentage use in the
62
28
9
different sectors
Median percentage use in the
69
21
10
different sectors
Notes: 1 The average and median calculations of water use in the different sectors do not include
Algeria, Chad, Malawi, Senegal, Sudan and Uganda. 2 Assumed zero if no value has been given for
those countries were information on Irrigation have been available. 3 Total irrigation (full partial
control are updated from FAOSTAT for those countries were no data existed. 4 Assumed zero if no
value has been given for those countries were information on water use have been available.
ND= No Data
S(ource: FAO 2003b)
148
GIWA REGIONAL ASSESSMENT 42 GUINEA CURRENT
ANNEXES
149
Annex VI
Status of international conventions regarding waters in the
Guinea Current region
River basin
Date
Treaty basin
Signatories
Treaty name
July 20, 1927
Pozo
Belgium, Portugal
Convention regarding various questions of economic interest.
Congo
General act of the conference of Berlin respecting: 1) freedom of trade in the basin
Austria-Hungary, Belgium, Denmark, France, Germany,
of the Congo; 2) the slave trade; 3) neutrality of the territories in the basin of the
February 26, 1885
Congo, Niger
Great Britain, Italy, Netherlands, Norway, Portugal, Russia, Congo; 4) navigation of the Congo; 5) navigation of the Niger; and 6) rules for
Spain, Sweden, Turkey, United States of America
future occupation of the coast of the African continent.
Guinea,
Protocol of the agreement between the Republic of Guinea and the Republi c of
Corubal
October 21, 1978
Koliba-Korubal
Guinea-Bisseau
Guinea-Bissau on the management of the Koliba-Korubal River, signed at Conakry.
Decree No. 99-120/PCRN/MAE/IA pertaining to publication of the agreement
between the Republic of Niger and the Republic of Benin relative to the realisation
January 14, 1999
Mékrou
Benin, Niger
of the hydroelectric management of the Dyondyonga site on the Mékrou river,
signed at Contonou.
Gada/Goulbi,
Agreement between the Federal Republic of Nigeria and the Republic of Niger
Komadougou-Yobe,
July 18, 1990
Niger, Nigeria
concerning the equitable sharing in the development, conservation and use of their
Maggia/Lamido,
common water resources.
Tagwai/El Fadama
Protocol of the agreement between the Republic of Niger and the Republic of Mali
July 12, 1988
Niger
Mali, Niger
relative to cooperation in the utilisation of resources in water of the Niger River.
Benin, Burkina Faso, Cameroon, Chad, Côte d'Ivoire,
Revised convention pertaining to the creationof the Niger Basin Authority, signed
October 29, 1987
Niger
Guinea, Mali, Niger, Nigeria
at N'Djamena.
Algeria, Benin, Cameroon, Chad, Guinea, Cote D'Ivoire,
October 27, 1987
Niger
Revised financial procedures of the Niger Basin Authority, done at N'Djamena.
Niger
Mali, Niger, Nigeria, Burkina Faso
Benin, Cameroon, Chad, Côte d'Ivoire, Guinea, Mali, Niger,
November 21,1980
Niger
Upper Volta Convention creating the Niger Basin Authority and protocol.
Nigeria
Benin, Burkina Faso, Cameroon, Chad, Côte d'Ivoire,
Agreement concerning the River Niger Commission and the navigation and
November 25,1964
Niger
Guinea, Mali, Niger, Nigeria
transport on the Niger River .
Cameroon, Chad, Côte d'Ivoire, Dahomey, Guinea, Mali,
Act regarding navigation and economic cooperation between the states of the
October 26, 1963
Niger
Niger, Nigeria, Upper Volta
Niger Basin.
April 20, 1921
Niger
France, Great Britain (among others)
Convention of Barcelona.
General act of the conference of Berlin respecting: 1) freedom of trade in the
Austria-Hungary, Belgium, Denmark, France, Germany,
basin of the Congo; 2) the slave trade; 3) neutrality of the territories in the basin of
February 26, 1885
Congo, Niger
Great Britain, Italy, Netherlands, Norway, Portugal, Russia, the Congo; 4) navigation of the Congo; 5) navigation of the Niger; and 6) rules for
Spain, Sweden, Turkey, United States of America
future occupation of the coast of the African continent.
Frontier or shared
Exchange of notes between France and Great Britain relative to the boundary
Volta
July 19, 1906
France, Great Britain
waters
between the Gold Coast and French Sudan.
(Source: UNEP 2002b)
148
GIWA REGIONAL ASSESSMENT 42 GUINEA CURRENT
ANNEXES
149
Annex VII
Regional projects in the fields of environment and water
management
Key: (A) Active project; (P) Project under preparation or waiting for a next phase.
Status
Title
Country
Funding / execution
Water Pol ution Control and Biodiversity Conservation in the Guinea Current Large Marine
GEF/UNIDO + NOAA + UNEP
(P)
Coastal: Guinea-Bissau to Angola
Ecosystem (Active 1994-2000; 2nd Phase in preparation)
RAF/92/G34
(A)
Developing Effective Integrated Management of the Volta basin
Benin, Burkina Faso, Côte d'Ivoire, Ghana, Mali and Togo
GEF / UNEP
West Africa Regional Action Plan for Integrated Water Resources Management (WARAP-
(P)
ECOWAS Member States and Mauritania
Danida, EU et al.
IWRM)
GEF, World Bank, UNDP, AfDB,
(P)
Reversing land and water degradation trends in the Niger basin
Niger Basin Authority (NBA) Member Countries
Netherlands, Norway, WWF
(P)
Integrated Control of Aquatic Weeds in ECOWAS Member States and Cameroon (2nd Phase) ECOWAS Member States and Cameroon
AfDB/ECOWAS
Development and Protection of the Marine and Coastal Environment in sub-Saharan Africa:
Côte d'Ivoire, Gambia, Ghana, Kenya, Mauritius, Mozambique,
GEF/UNEP
(P)
1) Mitigation of coastal erosion and restoration of degraded areas in sub-Saharan Africa
Nigeria, Senegal, Seychel es, South Africa, Tanzania
ACOPS with IOC, UNESCO and GPA
2) Supporting the Development and Implementation of Integrated Coastal Area
Côte d'Ivoire, Gambia, Ghana, Kenya, Mauritius, Mozambique,
(P)
d°
Management (ICAM) in Sub-Saharan Africa
Nigeria, Senegal, Seychel es, South Africa, Tanzania
3) Assessment of vulnerability of sub-Sahara coastal zone to the different impacts of
Côte d'Ivoire, Gambia, Ghana, Kenya, Mauritius, Mozambique,
(P)
d°
climate changes (including sea level rise)
Nigeria, Senegal, Seychel es, South Africa, Tanzania
4) Conservation of biodiversity through the enhancement and/or establishment of marine
(P)
Côte d'Ivoire, Ghana, Mozambique, Nigeria, Seychel es, South Africa
d°
protected areas in sub-Saharan Africa
5) Promoting the establishment of Ramsar sites and developing participatory and
Gambia, Ghana, Kenya, Mozambique, Nigeria, Senegal, South Africa,
(P)
d°
integrated approaches for river basin management in sub-Saharan Africa
Tanzania
Côte d'Ivoire, Gambia, Ghana, Kenya, Mozambique, Nigeria, Senegal,
(P)
6) Mangrove management in sub-Saharan Africa
d°
Tanzania
Selection of specific projects in Central Africa:
Conservation et utilisation rationnel e des écosystčmes forestiers en Afrique centrale
(A)
EU (6th FED)
(ECOFAC)
(A)
Regional Programme of Environmental Information Management (PRGIE)
GEF/World Bank, FAO, USAID
(A)
Conference on Humid Forest Ecosystemes in Central Africa (CEFDHAC)
(A)
Tropical Forestry Action Plans (PAFT) and National components (PAFN)
OIBT+Various donors
(P)
Central Africa Regional Project on Environment (CARPE)
Congo Basin countries
USAID
(A)
Sustainable Management of Rainforest Eciosystems in Central Africa
GEF, IUCN
(?)
Marine Fishing in Central Africa
FAO (in the frame of COREP)
150
GIWA REGIONAL ASSESSMENT 42 GUINEA CURRENT
ANNEXES
151
150
GIWA REGIONAL ASSESSMENT 42 GUINEA CURRENT
ANNEXES
151
The Global International
Waters Assessment
This report presents the results of the Global International Waters
Adequately managing the world's aquatic resources for the benefit of
Assessment (GIWA) of the transboundary waters of the Cuinea
al is, for a variety of reasons, a very complex task. The liquid state of
Current region. This and the subsequent chapter offer a background
the most of the world's water means that, without the construction
that describes the impetus behind the establishment of GIWA, its
of reservoirs, dams and canals it is free to flow wherever the laws of
objectives and how the GIWA was implemented.
nature dictate. Water is, therefore, a vector transporting not only a
wide variety of valuable resources but also problems from one area
to another. The effluents emanating from environmental y destructive
activities in upstream drainage areas are propagated downstream
The need for a global
and can affect other areas considerable distances away. In the case of
international waters
transboundary river basins, such as the Nile, Amazon and Niger, the
assessment
impacts are transported across national borders and can be observed
in the numerous countries situated within their catchments. In the case
of large oceanic currents, the impacts can even be propagated between
Global y, people are becoming increasingly aware of the degradation of
continents (AMAP 1998). Therefore, the inextricable linkages within
the world's water bodies. Disasters from floods and droughts, frequently
and between both freshwater and marine environments dictates that
reported in the media, are considered to be linked with ongoing global
management of aquatic resources ought to be implemented through
climate change (IPCC 2001), accidents involving large ships pol ute public
a drainage basin approach.
beaches and threaten marine life and almost every commercial fish stock
is exploited beyond sustainable limits - it is estimated that the global
In addition, there is growing appreciation of the incongruence
stocks of large predatory fish have declined to less that 10% of pre-
between the transboundary nature of many aquatic resources and the
industrial fishing levels (Myers & Worm 2003). Further, more than 1 bil ion
traditional introspective national y focused approaches to managing
people worldwide lack access to safe drinking water and 2 bil ion people
those resources. Water, unlike laws and management plans, does not
lack proper sanitation which causes approximately 4 billion cases of
respect national borders and, as a consequence, if future management
diarrhoea each year and results in the death of 2.2 mil ion people, mostly
of water and aquatic resources is to be successful, then a shift in focus
children younger than five (WHO-UNICEF 2002). Moreover, freshwater
towards international cooperation and intergovernmental agreements
and marine habitats are destroyed by infrastructure developments,
is required (UN 1972). Furthermore, the complexity of managing the
dams, roads, ports and human settlements (Brinson & Malvárez 2002,
world's water resources is exacerbated by the dependence of a great
Kennish 2002). As a consequence, there is growing public concern
variety of domestic and industrial activities on those resources. As a
regarding the declining quality and quantity of the world's aquatic
consequence, cross-sectoral multidisciplinary approaches that integrate
resources because of human activities, which has resulted in mounting
environmental, socio-economic and development aspects into
pressure on governments and decision makers to institute new and
management must be adopted. Unfortunately however, the scientific
innovative policies to manage those resources in a sustainable way
information or capacity within each discipline is often not available or
ensuring their availability for future generations.
is inadequately translated for use by managers, decision makers and
GLOBAL INTERNATIONAL WATERS ASSESSMENT
i
policy developers. These inadequacies constitute a serious impediment
The Global Environment Facility (GEF)
to the implementation of urgently needed innovative policies.
The Global Environment Facility forges international co-operation and finances actions to address
six critical threats to the global environment: biodiversity loss, climate change, degradation of
international waters, ozone depletion, land degradation, and persistent organic pol utants (POPs).
Continual assessment of the prevailing and future threats to aquatic
The overal strategic thrust of GEF-funded international waters activities is to meet the incremental
ecosystems and their implications for human populations is essential if
costs of: (a) assisting groups of countries to better understand the environmental concerns of
their international waters and work col aboratively to address them; (b) building the capacity
governments and decision makers are going to be able to make strategic
of existing institutions to utilise a more comprehensive approach for addressing transboundary
policy and management decisions that promote the sustainable use of
water-related environmental concerns; and (c) implementing measures that address the priority
transboundary environmental concerns. The goal is to assist countries to utilise the full range of
those resources and respond to the growing concerns of the general
technical, economic, financial, regulatory, and institutional measures needed to operationalise
public. Although many assessments of aquatic resources are being
sustainable development strategies for international waters.
conducted by local, national, regional and international bodies, past
United Nations Environment Programme (UNEP)
assessments have often concentrated on specific themes, such as
United Nations Environment Programme, established in 1972, is the voice for the environment
biodiversity or persistent toxic substances, or have focused only on
within the United Nations system. The mission of UNEP is to provide leadership and encourage
partnership in caring for the environment by inspiring, informing, and enabling nations and
marine or freshwaters. A globally coherent, drainage basin based
peoples to improve their quality of life without compromising that of future generations.
assessment that embraces the inextricable links between transboundary
UNEP work encompasses:
freshwater and marine systems, and between environmental and
Assessing global, regional and national environmental conditions and trends;
Developing international and national environmental instruments;
societal issues, has never been conducted previously.
Strengthening institutions for the wise management of the environment;
Facilitating the transfer of knowledge and technology for sustainable development;
Encouraging new partnerships and mind-sets within civil society and the private sector.
International call for action
University of Kalmar
University of Kalmar hosts the GIWA Co-ordination Office and provides scientific advice and
administrative and technical assistance to GIWA. University of Kalmar is situated on the coast of
The need for a holistic assessment of transboundary waters in order to
the Baltic Sea. The city has a long tradition of higher education; teachers and marine officers have
been educated in Kalmar since the middle of the 19th century. Today, natural science is a priority
respond to growing public concerns and provide advice to governments
area which gives Kalmar a unique educational and research profile compared with other smal er
and decision makers regarding the management of aquatic resources
universities in Sweden. Of particular relevance for GIWA is the established research in aquatic and
environmental science. Issues linked to the concept of sustainable development are implemented
was recognised by several international bodies focusing on the global
by the research programme Natural Resources Management and Agenda 21 Research School.
environment. In particular, the Global Environment Facility (GEF)
Since its establishment GIWA has grown to become an integral part of University activities.
The GIWA Co-ordination office and GIWA Core team are located at the Kalmarsund Laboratory, the
observed that the International Waters (IW) component of the GEF
university centre for water-related research. Senior scientists appointed by the University are actively
suffered from the lack of a global assessment which made it difficult
involved in the GIWA peer-review and steering groups. As a result of the cooperation the University
can offer courses and seminars related to GIWA objectives and international water issues.
to prioritise international water projects, particularly considering
the inadequate understanding of the nature and root causes of
environmental problems. In 1996, at its fourth meeting in Nairobi, the
causes of degradation of the transboundary aquatic environment and
GEF Scientific and Technical Advisory Panel (STAP), noted that: "Lack of
options for addressing them. These processes led to the development
an International Waters Assessment comparable with that of the IPCC, the
of the Global International Waters Assessment (GIWA) that would be
Global Biodiversity Assessment, and the Stratospheric Ozone Assessment,
implemented by the United Nations Environment Programme (UNEP) in
was a unique and serious impediment to the implementation of the
conjunction with the University of Kalmar, Sweden, on behalf of the GEF.
International Waters Component of the GEF".
The GIWA was inaugurated in Kalmar in October 1999 by the Executive
Director of UNEP, Dr. Klaus Töpfer, and the late Swedish Minister of the
The urgent need for an assessment of the causes of environmental
Environment, Kjel Larsson. On this occasion Dr. Töpfer stated: "GIWA
degradation was also highlighted at the UN Special Session on
is the framework of UNEP´s global water assessment strategy and will
the Environment (UNGASS) in 1997, where commitments were
enable us to record and report on critical water resources for the planet for
made regarding the work of the UN Commission on Sustainable
consideration of sustainable development management practices as part of
Development (UNCSD) on freshwater in 1998 and seas in 1999. Also in
our responsibilities under Agenda 21 agreements of the Rio conference".
1997, two international Declarations, the Potomac Declaration: Towards
enhanced ocean security into the third mil ennium, and the Stockholm
The importance of the GIWA has been further underpinned by the UN
Statement on interaction of land activities, freshwater and enclosed
Mil ennium Development Goals adopted by the UN General Assembly
seas, specifical y emphasised the need for an investigation of the root
in 2000 and the Declaration from the World Summit on Sustainable
ii
REGIONAL ASSESSMENTS
GLOBAL INTERNATIONAL WATERS ASSESSMENT
iii
Development in 2002. The development goals aimed to halve the
International waters and transboundary issues
proportion of people without access to safe drinking water and basic
The term "international waters", as used for the purposes of the GEF Operational Strategy,
sanitation by the year 2015 (United Nations Millennium Declaration
includes the oceans, large marine ecosystems, enclosed or semi-enclosed seas and estuaries, as
wel as rivers, lakes, groundwater systems, and wetlands with transboundary drainage basins
2000). The WSSD also cal s for integrated management of land, water and
or common borders. The water-related ecosystems associated with these waters are considered
living resources (WSSD 2002) and, by 2010, the Reykjavik Declaration on
integral parts of the systems.
Responsible Fisheries in the Marine Ecosystem should be implemented
The term "transboundary issues" is used to describe the threats to the aquatic environment
linked to globalisation, international trade, demographic changes and technological advancement,
by al countries that are party to the declaration (FAO 2001).
threats that are additional to those created through transboundary movement of water. Single
country policies and actions are inadequate in order to cope with these chal enges and this makes
them transboundary in nature.
The international waters area includes numerous international conventions, treaties, and
agreements. The architecture of marine agreements is especial y complex, and a large number
The conceptual framework
of bilateral and multilateral agreements exist for transboundary freshwater basins. Related
conventions and agreements in other areas increase the complexity. These initiatives provide
and objectives
a new opportunity for cooperating nations to link many different programmes and instruments
into regional comprehensive approaches to address international waters.
Considering the general decline in the condition of the world's aquatic
the large-scale deforestation of mangroves for ponds (Primavera 1997).
resources and the international y recognised need for a global y
Within the GIWA, these "non-hydrological" factors constitute as large
coherent assessment of transboundary waters, the primary objectives
a transboundary influence as more traditional y recognised problems,
of the GIWA are:
such as the construction of dams that regulate the flow of water into
To provide a prioritising mechanism that al ows the GEF to focus
a neighbouring country, and are considered equal y important. In
their resources so that they are used in the most cost effective
addition, the GIWA recognises the importance of hydrological units that
manner to achieve significant environmental benefits, at national,
would not normal y be considered transboundary but exert a significant
regional and global levels; and
influence on transboundary waters, such as the Yangtze River in China
To highlight areas in which governments can develop and
which discharges into the East China Sea (Daoji & Daler 2004) and the
implement strategic policies to reduce environmental degradation
Volga River in Russia which is largely responsible for the condition of
and improve the management of aquatic resources.
the Caspian Sea (Barannik et al. 2004). Furthermore, the GIWA is a truly
regional assessment that has incorporated data from a wide range of
In order to meet these objectives and address some of the current
sources and included expert knowledge and information from a wide
inadequacies in international aquatic resources management, the GIWA
range of sectors and from each country in the region. Therefore, the
has incorporated four essential elements into its design:
transboundary concept adopted by the GIWA extends to include
A broad transboundary approach that generates a truly regional
impacts caused by globalisation, international trade, demographic
perspective through the incorporation of expertise and existing
changes and technological advances and recognises the need for
information from al nations in the region and the assessment of
international cooperation to address them.
all factors that influence the aquatic resources of the region;
A drainage basin approach integrating freshwater and marine
systems;
The organisational structure and
A multidisciplinary approach integrating environmental and socio-
economic information and expertise; and
implementation of the GIWA
A coherent assessment that enables global comparison of the
results.
The scale of the assessment
Initial y, the scope of the GIWA was confined to transboundary waters
The GIWA builds on previous assessments implemented within the GEF
in areas that included countries eligible to receive funds from the GEF.
International Waters portfolio but has developed and adopted a broader
However, it was recognised that a truly global perspective would only
definition of transboundary waters to include factors that influence the
be achieved if industrialised, GEF-ineligible regions of the world were
quality and quantity of global aquatic resources. For example, due to
also assessed. Financial resources to assess the GEF-eligible countries
globalisation and international trade, the market for penaeid shrimps
were obtained primarily from the GEF (68%), the Swedish International
has widened and the prices soared. This, in turn, has encouraged
Development Cooperation Agency (Sida) (18%), and the Finnish
entrepreneurs in South East Asia to expand aquaculture resulting in
Department for International Development Cooperation (FINNIDA)
ii
REGIONAL ASSESSMENTS
GLOBAL INTERNATIONAL WATERS ASSESSMENT
iii
1
15
11
16
14
12
28
10
13
25
17
29
9
18
19
30
23
22
8 6 7
31
20
24
26
35
33
2
34
27
5
21
50
32
51
36
37
41
52
4
49
53
43
65
55
3
48
54
42
56
46
62
47
40b
40a
57
62
45b
39
59
45a
58
60
64
44
61
38
63
66
1
Arctic
12
Norwegian Sea (LME)
24 Aral Sea
36 East-China Sea (LME)
46 Somali Coastal Current (LME)
58 North Australian Shelf (LME)
2
Gulf of Mexico (LME)
13
Faroe plateau
25 Gulf of Alaska (LME)
37
Hawaiian Archipelago (LME)
47
East African Rift Valley Lakes
59 Coral Sea Basin
3
Caribbean Sea (LME)
14
Iceland Shelf (LME)
26 California Current (LME)
38 Patagonian Shelf (LME)
48 Gulf of Aden
60 Great Barrier Reef (LME)
4
Caribbean Islands
15
East Greenland Shelf (LME)
27 Gulf of California (LME)
39 Brazil Current (LME)
49 Red Sea (LME)
61
Great Australian Bight
5
Southeast Shelf (LME)
16
West Greenland Shelf (LME)
28 East Bering Sea (LME)
40a Brazilian Northeast (LME)
50 The Gulf
62 Small Island States
6
Northeast Shelf (LME)
17
Baltic Sea (LME)
29 West Bering Sea (LME)
40b Amazon
51
Jordan
63 Tasman Sea
7
Scotian Shelf (LME)
18
North Sea (LME)
30 Sea of Okhotsk (LME)
41
Canary Current (LME)
52 Arabian Sea (LME)
64 Humboldt Current (LME)
8
Gulf of St Lawrence
19
Celtic-Biscay Shelf (LME)
31
Oyashio Current (LME)
42 Guinea Current (LME)
53 Bay of Bengal S.E.
65 Eastern Equatorial Pacific
9
Newfoundland Shelf (LME)
20 Iberian Coastal (LME)
32 Kuroshio Current (LME)
43 Lake Chad
54 South China Sea (LME)
66 Antarctic (LME)
10
Baffin Bay, Labrador Sea,
21
Mediterranean Sea (LME)
33 Sea of Japan/East Sea (LME)
44 Benguela Current (LME)
55 Mekong River
Canadian Archipelago
22 Black Sea (LME)
34 Yellow Sea (LME)
45a Agulhas Current (LME)
56 Sulu-Celebes Sea (LME)
11
Barents Sea (LME)
23 Caspian Sea
35 Bohai Sea
45b Indian Ocean Islands
57 Indonesian Seas (LME)
Figure 1
The 66 transboundary regions assessed within the GIWA project.
(10%). Other contributions were made by Kalmar Municipality, the
Considering the objectives of the GIWA and the elements incorporated
University of Kalmar and the Norwegian Government. The assessment of
into its design, a new methodology for the implementation of the
regions ineligible for GEF funds was conducted by various international
assessment was developed during the initial phase of the project. The
and national organisations as in-kind contributions to the GIWA.
methodology focuses on five major environmental concerns which
constitute the foundation of the GIWA assessment; Freshwater shortage,
In order to be consistent with the transboundary nature of many of the
Pol ution, Habitat and community modification, Overexploitation of fish
world's aquatic resources and the focus of the GIWA, the geographical
and other living resources, and Global change. The GIWA methodology
units being assessed have been designed according to the watersheds
is outlined in the fol owing chapter.
of discrete hydrographic systems rather than political borders (Figure 1).
The geographic units of the assessment were determined during the
The global network
preparatory phase of the project and resulted in the division of the
In each of the 66 regions, the assessment is conducted by a team of
world into 66 regions defined by the entire area of one or more
local experts that is headed by a Focal Point (Figure 2). The Focal Point
catchments areas that drains into a single designated marine system.
can be an individual, institution or organisation that has been selected
These marine systems often correspond to Large Marine Ecosystems
on the basis of their scientific reputation and experience implementing
(LMEs) (Sherman 1994, IOC 2002).
international assessment projects. The Focal Point is responsible
for assembling members of the team and ensuring that it has the
Large Marine Ecocsystems (LMEs)
necessary expertise and experience in a variety of environmental
Large Marine Ecosystems (LMEs) are regions of ocean space encompassing coastal areas from river
and socio-economic disciplines to successful y conduct the regional
basins and estuaries to the seaward boundaries of continental shelves and the outer margin of the
major current systems. They are relatively large regions on the order of 200 000 km2 or greater,
assessment. The selection of team members is one of the most critical
characterised by distinct: (1) bathymetry, (2) hydrography, (3) productivity, and (4) trophical y
elements for the success of GIWA and, in order to ensure that the
dependent populations.
The Large Marine Ecosystems strategy is a global effort for the assessment and management
most relevant information is incorporated into the assessment, team
of international coastal waters. It developed in direct response to a declaration at the 1992
members were selected from a wide variety of institutions such as
Rio Summit. As part of the strategy, the World Conservation Union (IUCN) and National Oceanic
and Atmospheric Administration (NOAA) have joined in an action program to assist developing
universities, research institutes, government agencies, and the private
countries in planning and implementing an ecosystem-based strategy that is focused on LMEs as
sector. In addition, in order to ensure that the assessment produces a
the principal assessment and management units for coastal ocean resources. The LME concept is
also adopted by GEF that recommends the use of LMEs and their contributing freshwater basins
truly regional perspective, the teams should include representatives
as the geographic area for integrating changes in sectoral economic activities.
from each country that shares the region.
iv
REGIONAL ASSESSMENTS
GLOBAL INTERNATIONAL WATERS ASSESSMENT
v
The GIWA is comprised of a logical sequence of four integrated
components. The first stage of the GIWA is cal ed Scaling and is a
process by which the geographic area examined in the assessment is
defined and al the transboundary waters within that area are identified.
Once the geographic scale of the assessment has been defined, the
assessment teams conduct a process known as Scoping in which the
magnitude of environmental and associated socio-economic impacts
of Freshwater shortage, Pol ution, Habitat and community modification,
Unsustainable exploitation of fish and other living resources, and Global
Figure 2
The organisation of the GIWA project.
change is assessed in order to identify and prioritise the concerns
that require the most urgent intervention. The assessment of these
predefined concerns incorporates the best available information and
In total, more than 1 000 experts have contributed to the implementation
the knowledge and experience of the multidisciplinary, multi-national
of the GIWA il ustrating that the GIWA is a participatory exercise that
assessment teams formed in each region. Once the priority concerns
relies on regional expertise. This participatory approach is essential
have been identified, the root causes of these concerns are identified
because it instils a sense of local ownership of the project, which
during the third component of the GIWA, Causal chain analysis. The root
ensures the credibility of the findings and moreover, it has created a
causes are determined through a sequential process that identifies, in
global network of experts and institutions that can col aborate and
turn, the most significant immediate causes fol owed by the economic
exchange experiences and expertise to help mitigate the continued
sectors that are primarily responsible for the immediate causes and
degradation of the world's aquatic resources.
final y, the societal root causes. At each stage in the Causal chain
analysis, the most significant contributors are identified through an
analysis of the best available information which is augmented by the
expertise of the assessment team. The final component of the GIWA is
GIWA Regional reports
the development of Policy options that focus on mitigating the impacts
of the root causes identified by the Causal chain analysis.
The GIWA was established in response to growing concern among the
general public regarding the quality of the world's aquatic resources
The results of the GIWA assessment in each region are reported in
and the recognition of governments and the international community
regional reports that are published by UNEP. These reports are designed
concerning the absence of a global y coherent international waters
to provide a brief physical and socio-economic description of the
assessment. However, because a holistic, region-by-region, assessment
most important features of the region against which the results of the
of the condition of the world's transboundary water resources had never
assessment can be cast. The remaining sections of the report present
been undertaken, a methodology guiding the implementation of such
the results of each stage of the assessment in an easily digestible form.
an assessment did not exist. Therefore, in order to implement the GIWA,
Each regional report is reviewed by at least two independent external
a new methodology that adopted a multidisciplinary, multi-sectoral,
reviewers in order to ensure the scientific validity and applicability of
multi-national approach was developed and is now available for the
each report. The 66 regional assessments of the GIWA will serve UNEP
implementation of future international assessments of aquatic resources.
as an essential complement to the UNEP Water Policy and Strategy and
UNEP's activities in the hydrosphere.
UNEP Water Policy and Strategy
The primary goals of the UNEP water policy and strategy are:
(a) Achieving greater global understanding of freshwater, coastal and marine environments by
conducting environmental assessments in priority areas;
Global International Waters Assessment
(b) Raising awareness of the importance and consequences of unsustainable water use;
(c) Supporting the efforts of Governments in the preparation and implementation of integrated
management of freshwater systems and their related coastal and marine environments;
(d) Providing support for the preparation of integrated management plans and programmes for
aquatic environmental hot spots, based on the assessment results;
(e) Promoting the application by stakeholders of precautionary, preventive and anticipatory
approaches.
iv
REGIONAL ASSESSMENTS
GLOBAL INTERNATIONAL WATERS ASSESSMENT
v
References:
AMAP (1998). Assessment Report: Arctic Pol ution Issues. Arctic
Monitoring and Assessment Programme (AMAP), Oslo, Norway.
Barannik, V., Borysova, O. and Stolberg, F. (2004). The Caspian Sea Region:
Environmental Change. Ambio, 33:45-51.
Brinson, M.M. and Malvárez, A.I. (2002). Temperate freshwater wetlands:
types, status, and threats. Environmental Conservation, 29:115-133.
Daoji, L. and Daler, D. (2004). Ocean Pol ution from Land-based Sources:
East China Sea, China. Ambio, 33:98-106.
FAO (2001). Reykjavik conference on responsible fisheries in the marine
ecosystem. Iceland, 1-4 October 2001.
IOC (2002). IOC-IUCN-NOAA Consultative Meeting on Large Marine
Ecosystems (LMEs). Fourth Session, 8-9 January 2002, Paris,
France.
IPCC (2001). Climate Change 2001: The Scientific Basis. Contribution
of Working Group I to the Third Assessment Report of the
Intergovernmental Panel on Climate Change. In: Houghton,
J.T., Ding, Y., Griggs, D.J., Noguer, M., van der Linden, P.J., Dai, X.,
Maskel , K. and Johnson, C.A. (eds). Cambridge University Press,
Cambridge, United Kingdom and New York, NY, USA.
Kennish, M.J. (2002). Environmental threats and environmental future of
estuaries. Environmental Conservation, 29:78-107.
Myers, R.A. and Worm, B. (2003). Rapid worldwide depletion of predatory
fish communities. Nature, 423:280-283.
Primavera, J.H. (1997) Socio-economic impacts of shrimp culture.
Aquaculture Research, 28:815-827.
Sherman, K. (1994). Sustainability, biomass yields, and health of coastal
ecosystems: an ecological perspective. Marine Ecology Progress
Series, 112:277-301.
United Nations conference on the human environment (1972). Report
available on-line at http://www.unep.org
United Nations Mil ennium Declaration (2000). The Mil ennium
Assembly of the United Nations, New York.
WHO-UNICEF (2002). Global Water Supply and Sanitation Assessment:
2000 Report.
WSSD (2002). World Summit on Sustainable Development.
Johannesburg Summit 2002. Key Outcomes of the Summit,
UN Department of Public Information, New York.
vi
REGIONAL ASSESSMENTS
The GIWA methodology
The specific objectives of the GIWA were to conduct a holistic and global y
The assessment integrates environmental and socio-economic data
comparable assessment of the world's transboundary aquatic resources
from each country in the region to determine the severity of the
that incorporated both environmental and socio-economic factors
impacts of each of the five concerns and their constituent issues on
and recognised the inextricable links between freshwater and marine
the entire region. The integration of this information was facilitated by
environments, in order to enable the GEF to focus their resources and to
implementing the assessment during two participatory workshops
provide guidance and advice to governments and decision makers. The
that typical y involved 10 to 15 environmental and socio-economic
coalition of al these elements into a single coherent methodology that
experts from each country in the region. During these workshops, the
produces an assessment that achieves each of these objectives had not
regional teams performed preliminary analyses based on the col ective
previously been done and posed a significant chal enge.
knowledge and experience of these local experts. The results of these
analyses were substantiated with the best available information to be
The integration of each of these elements into the GIWA methodology
presented in a regional report.
was achieved through an iterative process guided by a special y
Table 1
Pre-defined GIWA concerns and their constituent issues
convened Methods task team that was comprised of a number of
addressed within the assessment.
international assessment and water experts. Before the final version
of the methodology was adopted, preliminary versions underwent
Environmental issues
Major concerns
an extensive external peer review and were subjected to preliminary
1. Modification of stream flow
testing in selected regions. Advice obtained from the Methods task
2. Pol ution of existing supplies
I Freshwater shortage
team and other international experts and the lessons learnt from
3. Changes in the water table
preliminary testing were incorporated into the final version that was
4. Microbiological
5. Eutrophication
used to conduct each of the GIWA regional assessments.
6. Chemical
7. Suspended solids
II Pollution
8. Solid wastes
Considering the enormous differences between regions in terms of the
9. Thermal
10. Radionuclide
quality, quantity and availability of data, socio-economic setting and
11. Spil s
environmental conditions, the achievement of global comparability
12. Loss of ecosystems
required an innovative approach. This was facilitated by focusing
III Habitat and community
13. Modification of ecosystems or ecotones, including community
modification
the assessment on the impacts of five pre-defined concerns namely;
structure and/or species composition
Freshwater shortage, Pollution, Habitat and community modification,
14. Overexploitation
15. Excessive by-catch and discards
IV Unsustainable
Unsustainable exploitation of fish and other living resources and Global
16. Destructive fishing practices
exploitation of fish and
change, in transboundary waters. Considering the diverse range of
17. Decreased viability of stock through pol ution and disease
other living resources
18. Impact on biological and genetic diversity
elements encompassed by each concern, assessing the magnitude of
the impacts caused by these concerns was facilitated by evaluating the
19. Changes in hydrological cycle
20. Sea level change
V Global change
impacts of 22 specific issues that were grouped within these concerns
21. Increased uv-b radiation as a result of ozone depletion
22. Changes in ocean CO source/sink function
(see Table 1).
2
THE GIWA METHODOLOGY
vii


political boundaries but were instead, general y defi ned by a large but
discrete drainage basin that also included the coastal marine waters into
which the basin discharges. In many cases, the marine areas examined
during the assessment coincided with the Large Marine Ecosystems
(LMEs) defi ned by the US National Atmospheric and Oceanographic
Administration (NOAA). As a consequence, scaling should be a
relatively straight-forward task that involves the inspection of the
boundaries that were proposed for the region during the preparatory
phase of GIWA to ensure that they are appropriate and that there are
no important overlaps or gaps with neighbouring regions. When the
proposed boundaries were found to be inadequate, the boundaries of
the region were revised according to the recommendations of experts
from both within the region and from adjacent regions so as to ensure
that any changes did not result in the exclusion of areas from the GIWA.
Once the regional boundary was defi ned, regional teams identifi ed all
the transboundary elements of the aquatic environment within the
region and determined if these elements could be assessed as a single
Figure 1
Illustration of the relationship between the GIWA
coherent aquatic system or if there were two or more independent
approach and other projects implemented within the
GEF International Waters (IW) portfolio.
systems that should be assessed separately.
The GIWA is a logical contiguous process that defi nes the geographic
Scoping Assessing the GIWA concerns
region to be assessed, identifi es and prioritises particularly problems
Scoping is an assessment of the severity of environmental and socio-
based on the magnitude of their impacts on the environment and
economic impacts caused by each of the fi ve pre-defi ned GIWA concerns
human societies in the region, determines the root causes of those
and their constituent issues (Table 1). It is not designed to provide an
problems and, fi nal y, assesses various policy options that addresses
exhaustive review of water-related problems that exist within each region,
those root causes in order to reverse negative trends in the condition
but rather it is a mechanism to identify the most urgent problems in the
of the aquatic environment. These four steps, referred to as Scaling,
region and prioritise those for remedial actions. The priorities determined
Scoping, Causal chain analysis and Policy options analysis, are
by Scoping are therefore one of the main outputs of the GIWA project.
summarised below and are described in their entirety in two volumes:
GIWA Methodology Stage 1: Scaling and Scoping; and GIWA Methodology:
Focusing the assessment on pre-defi ned concerns and issues ensured
Detailed Assessment, Causal Chain Analysis and Policy Options Analysis.
the comparability of the results between diff erent regions. In addition, to
General y, the components of the GIWA methodology are aligned
ensure the long-term applicability of the options that are developed to
with the framework adopted by the GEF for Transboundary Diagnostic
mitigate these problems, Scoping not only assesses the current impacts
Analyses (TDAs) and Strategic Action Programmes (SAPs) (Figure 1) and
of these concerns and issues but also the probable future impacts
assume a broad spectrum of transboundary infl uences in addition to
according to the "most likely scenario" which considered demographic,
those associated with the physical movement of water across national
economic, technological and other relevant changes that wil potential y
borders.
infl uence the aquatic environment within the region by 2020.
Scaling Defining the geographic extent
The magnitude of the impacts caused by each issue on the
of the region
environment and socio-economic indicators was assessed over the
Scaling is the fi rst stage of the assessment and is the process by which
entire region using the best available information from a wide range of
the geographic scale of the assessment is defi ned. In order to facilitate
sources and the knowledge and experience of the each of the experts
the implementation of the GIWA, the globe was divided during the
comprising the regional team. In order to enhance the comparability
design phase of the project into 66 contiguous regions. Considering the
of the assessment between diff erent regions and remove biases
transboundary nature of many aquatic resources and the transboundary
in the assessment caused by diff erent perceptions of and ways to
focus of the GIWA, the boundaries of the regions did not comply with
communicate the severity of impacts caused by particular issues, the
viii
REGIONAL ASSESSMENTS
THE GIWA METHODOLOGY
ix
results were distil ed and reported as standardised scores according to
Table 2
Example of environmental impact assessment of
the fol owing four point scale:
Freshwater shortage.
Weight
0 = no known impact
Environmental
Environmental issues
Score
Weight %
averaged
concerns
1 = slight impact
score
2 = moderate impact
1. Modification of stream flow
1
20
Freshwater shortage
1.50
3 = severe impact
2. Pol ution of existing supplies
2
50
The attributes of each score for each issue were described by a detailed
3. Changes in the water table
1
30
set of pre-defined criteria that were used to guide experts in reporting
Table 3
Example of Health impacts assessment linked to one of
the results of the assessment. For example, the criterion for assigning
the GIWA concerns.
a score of 3 to the issue Loss of ecosystems or ecotones is: "Permanent
Criteria for Health impacts
Raw score
Score Weight %
destruction of at least one habitat is occurring such as to have reduced their
Very small
Very large
surface area by >30% during the last 2-3 decades". The full list of criteria is
Number of people affected
2
50
0
1
2
3
presented at the end of the chapter, Table 5a-e. Although the scoring
Minimum
Severe
Degree of severity
2
30
0
1
2
3
inevitably includes an arbitrary component, the use of predefined
Occasion/Short
Continuous
Frequency/Duration
2
20
criteria facilitates comparison of impacts on a global scale and also
0
1
2
3
Weight average score for Health impacts
2
encouraged consensus of opinion among experts.
The trade-off associated with assessing the impacts of each concern
After al 22 issues and associated socio-economic impacts have
and their constituent issues at the scale of the entire region is that spatial
been scored, weighted and averaged, the magnitude of likely future
resolution was sometimes low. Although the assessment provides a
changes in the environmental and socio-economic impacts of each
score indicating the severity of impacts of a particular issue or concern
of the five concerns on the entire region is assessed according to the
on the entire region, it does not mean that the entire region suffers
most likely scenario which describes the demographic, economic,
the impacts of that problem. For example, eutrophication could be
technological and other relevant changes that might influence the
identified as a severe problem in a region, but this does not imply that all
aquatic environment within the region by 2020.
waters in the region suffer from severe eutrophication. It simply means
that when the degree of eutrophication, the size of the area affected,
In order to prioritise among GIWA concerns within the region and
the socio-economic impacts and the number of people affected is
identify those that will be subjected to causal chain and policy options
considered, the magnitude of the overal impacts meets the criteria
analysis in the subsequent stages of the GIWA, the present and future
defining a severe problem and that a regional action should be initiated
scores of the environmental and socio-economic impacts of each
in order to mitigate the impacts of the problem.
concern are tabulated and an overall score calculated. In the example
presented in Table 4, the scoping assessment indicated that concern I I,
When each issue has been scored, it was weighted according to the relative
Habitat and community modification, was the priority concern in this
contribution it made to the overal environmental impacts of the concern
region. The outcome of this mathematic process was reconciled against
and a weighted average score for each of the five concerns was calculated
the knowledge of experts and the best available information in order
(Table 2). Of course, if each issue was deemed to make equal contributions,
to ensure the validity of the conclusion.
then the score describing the overal impacts of the concern was simply the
arithmetic mean of the scores al ocated to each issue within the concern.
In some cases however, this process and the subsequent participatory
In addition, the socio-economic impacts of each of the five major
discussion did not yield consensus among the regional experts
concerns were assessed for the entire region. The socio-economic
regarding the ranking of priorities. As a consequence, further analysis
impacts were grouped into three categories; Economic impacts,
was required. In such cases, expert teams continued by assessing the
Health impacts and Other social and community impacts (Table 3). For
relative importance of present and potential future impacts and assign
each category, an evaluation of the size, degree and frequency of the
weights to each. Afterwards, the teams assign weights indicating the
impact was performed and, once completed, a weighted average score
relative contribution made by environmental and socio-economic
describing the overal socio-economic impacts of each concern was
factors to the overal impacts of the concern. The weighted average
calculated in the same manner as the overall environmental score.
score for each concern is then recalculated taking into account
viii
REGIONAL ASSESSMENTS
THE GIWA METHODOLOGY
ix
Table 4
Example of comparative environmental and socio-economic impacts of each major concern, presently and likely in year 2020.
Types of impacts
Environmental score
Economic score
Human health score
Social and community score
Concern
Overall score
Present (a)
Future (b)
Present (c)
Future (d)
Present (e)
Future (f)
Present (g)
Future (h)
Freshwater shortage
1.3
2.3
2.7
2.8
2.6
3.0
1.8
2.2
2.3
Pol ution
1.5
2.0
2.0
2.3
1.8
2.3
2.0
2.3
2.0
Habitat and community
2.0
3.0
2.4
3.0
2.4
2.8
2.3
2.7
2.6
modification
Unsustainable exploitation of fish
1.8
2.2
2.0
2.1
2.0
2.1
2.4
2.5
2.1
and other living resources
Global change
0.8
1.0
1.5
1.7
1.5
1.5
1.0
1.0
1.2
the relative contributions of both present and future impacts and
should be regarded as a framework to guide the analysis, rather than
environmental and socio-economic factors. The outcome of these
as a set of detailed instructions. Secondly, in an ideal setting, a causal
additional analyses was subjected to further discussion to identify
chain would be produced by a multidisciplinary group of specialists
overall priorities for the region.
that would statistical y examine each successive cause and study its
links to the problem and to other causes. However, this approach (even
Final y, the assessment recognises that each of the five GIWA concerns
if feasible) would use far more resources and time than those available
are not discrete but often interact. For example, pollution can destroy
to GIWA1. For this reason, it has been necessary to develop a relatively
aquatic habitats that are essential for fish reproduction which, in turn,
simple and practical analytical model for gathering information to
can cause declines in fish stocks and subsequent overexploitation. Once
assemble meaningful causal chains.
teams have ranked each of the concerns and determined the priorities
for the region, the links between the concerns are highlighted in order
Conceptual model
to identify places where strategic interventions could be applied to
A causal chain is a series of statements that link the causes of a problem
yield the greatest benefits for the environment and human societies
with its effects. Recognising the great diversity of local settings and the
in the region.
resulting difficulty in developing broadly applicable policy strategies,
the GIWA CCA focuses on a particular system and then only on those
Causal chain analysis
issues that were prioritised during the scoping assessment. The
Causal Chain Analysis (CCA) traces the cause-effect pathways from the
starting point of a particular causal chain is one of the issues selected
socio-economic and environmental impacts back to their root causes.
during the Scaling and Scoping stages and its related environmental
The GIWA CCA aims to identify the most important causes of each
and socio-economic impacts. The next element in the GIWA chain is
concern prioritised during the scoping assessment in order to direct
the immediate cause; defined as the physical, biological or chemical
policy measures at the most appropriate target in order to prevent
variable that produces the GIWA issue. For example, for the issue of
further degradation of the regional aquatic environment.
eutrophication the immediate causes may be, inter alia:
Enhanced nutrient inputs;
Root causes are not always easy to identify because they are often
Increased recycling/mobilisation;
spatial y or temporal y separated from the actual problems they
Trapping of nutrients (e.g. in river impoundments);
cause. The GIWA CCA was developed to help identify and understand
Run-off and stormwaters
the root causes of environmental and socio-economic problems
in international waters and is conducted by identifying the human
Once the relevant immediate cause(s) for the particular system has
activities that cause the problem and then the factors that determine
(have) been identified, the sectors of human activity that contribute
the ways in which these activities are undertaken. However, because
most significantly to the immediate cause have to be determined.
there is no universal theory describing how root causes interact to
Assuming that the most important immediate cause in our example
create natural resource management problems and due to the great
had been increased nutrient concentrations, then it is logical that the
variation of local circumstances under which the methodology will
most likely sources of those nutrients would be the agricultural, urban
be applied, the GIWA CCA is not a rigidly structured assessment but
or industrial sectors. After identifying the sectors that are primarily
1 This does not mean that the methodology ignores statistical or quantitative studies; as has already been pointed out, the available evidence that justifies the assumption of causal links should
be provided in the assessment.
x
REGIONAL ASSESSMENTS
THE GIWA METHODOLOGY
xi
responsible for the immediate causes, the root causes acting on those
The policy options recommended by the GIWA are only contributions
sectors must be determined. For example, if agriculture was found to
to the larger policy process and, as such, the GIWA methodology
be primarily responsible for the increased nutrient concentrations, the
developed to test the performance of various options under the
root causes could potential y be:
different circumstances has been kept simple and broadly applicable.
Economic (e.g. subsidies to fertilisers and agricultural products);
Legal (e.g. inadequate regulation);
Global International Waters Assessment
Failures in governance (e.g. poor enforcement); or
Technology or knowledge related (e.g. lack of affordable substitutes
for fertilisers or lack of knowledge as to their application).
Once the most relevant root causes have been identified, an
explanation, which includes available data and information, of how
they are responsible for the primary environmental and socio-economic
problems in the region should be provided.
Policy option analysis
Despite considerable effort of many Governments and other
organisations to address transboundary water problems, the evidence
indicates that there is stil much to be done in this endeavour. An
important characteristic of GIWA's Policy Option Analysis (POA) is that
its recommendations are firmly based on a better understanding of
the root causes of the problems. Freshwater scarcity, water pol ution,
overexploitation of living resources and habitat destruction are very
complex phenomena. Policy options that are grounded on a better
understanding of these phenomena wil contribute to create more
effective societal responses to the extremely complex water related
transboundary problems. The core of POA in the assessment consists
of two tasks:
Construct policy options
Policy options are simply different courses of action, which are not
always mutual y exclusive, to solve or mitigate environmental and
socio-economic problems in the region. Although a multitude of
different policy options could be constructed to address each root
cause identified in the CCA, only those few policy options that have
the greatest likelihood of success were analysed in the GIWA.
Select and apply the criteria on which the policy options will be
evaluated
Although there are many criteria that could be used to evaluate any
policy option, GIWA focuses on:
Effectiveness (certainty of result)
Efficiency (maximisation of net benefits)
Equity (fairness of distributional impacts)
Practical criteria (political acceptability, implementation feasibility).
x
REGIONAL ASSESSMENTS
THE GIWA METHODOLOGY
xi
Table 5a: Scoring criteria for environmental impacts of Freshwater shortage
Issue
Score 0 = no known impact
Score 1 = slight impact
Score 2 = moderate impact
Score 3 = severe impact
Issue 1: Modification
No evidence of modification of stream
There is a measurably changing trend in
Significant downward or upward trend
Annual discharge of a river altered by more
of stream flow
flow.
annual river discharge at gauging stations
(more than 20% of the long term mean) in
than 50% of long term mean; or
"An increase or decrease
in a major river or tributary (basin >
annual discharges in a major river or tributary Loss of >50% of riparian or deltaic
in the discharge of
40 000 km2); or
draining a basin of >250 000 km2; or
wetlands over a period of not less than
streams and rivers
There is a measurable decrease in the area
Loss of >20% of flood plain or deltaic
40 years (through causes other than
as a result of human
of wetlands (other than as a consequence
wetlands through causes other than
conversion or artificial embankment); or
interventions on a local/
of conversion or embankment
conversion or artificial embankments; or
Significant increased siltation or erosion
regional scale (see Issue
construction); or
Significant loss of riparian vegetation (e.g.
due to changing in flow regime (other than
19 for flow alterations
There is a measurable change in the
trees, flood plain vegetation); or
normal fluctuations in flood plain rivers);
resulting from global
interannual mean salinity of estuaries or
Significant saline intrusion into previously
or
change) over the last 3-4
coastal lagoons and/or change in the mean
freshwater rivers or lagoons.
Loss of one or more anadromous or
decades."
position of estuarine salt wedge or mixing
catadromous fish species for reasons
zone; or
other than physical barriers to migration,
Change in the occurrence of exceptional
pol ution or overfishing.
discharges (e.g. due to upstream
damming.
Issue 2: Pollution of
No evidence of pol ution of surface and
Any monitored water in the region does
Water supplies does not meet WHO or
River draining more than 10% of the basin
existing supplies
ground waters.
not meet WHO or national drinking water
national drinking water standards in more
have suffered polysaprobic conditions, no
"Pol ution of surface
criteria, other than for natural reasons; or
than 30% of the region; or
longer support fish, or have suffered severe
and ground fresh waters
There have been reports of one or more
There are one or more reports of fish kil s
oxygen depletion
supplies as a result of
fish kil s in the system due to pol ution
due to pol ution in any river draining a
Severe pol ution of other sources of
point or diffuse sources"
within the past five years.
basin of >250 000 km2 .
freshwater (e.g. groundwater)
Issue 3: Changes in
No evidence that abstraction of water from Several wel s have been deepened because Clear evidence of declining base flow in
Aquifers are suffering salinisation over
the water table
aquifers exceeds natural replenishment.
of excessive aquifer draw-down; or
rivers in semi-arid areas; or
regional scale; or
"Changes in aquifers
Several springs have dried up; or
Loss of plant species in the past decade,
Perennial springs have dried up over
as a direct or indirect
Several wel s show some salinisation.
that depend on the presence of ground
regional y significant areas; or
consequence of human
water; or
Some aquifers have become exhausted
activity"
Wel s have been deepened over areas of
hundreds of km2;or
Salinisation over significant areas of the
region.
Table 5b: Scoring criteria for environmental impacts of Pollution
Issue
Score 0 = no known impact
Score 1 = slight impact
Score 2 = moderate impact
Score 3 = severe impact
Issue 4:
Normal incidence of bacterial related
There is minor increase in incidence of
Public health authorities aware of marked
There are large closure areas or very
Microbiological
gastroenteric disorders in fisheries product
bacterial related gastroenteric disorders
increase in the incidence of bacterial
restrictive advisories affecting the
pollution
consumers and no fisheries closures or
in fisheries product consumers but no
related gastroenteric disorders in fisheries
marketability of fisheries products; or
"The adverse effects of
advisories.
fisheries closures or advisories.
product consumers; or
There exists widespread public or tourist
microbial constituents of
There are limited area closures or
awareness of hazards resulting in
human sewage released
advisories reducing the exploitation or
major reductions in the exploitation or
to water bodies."
marketability of fisheries products.
marketability of fisheries products.
Issue 5:
No visible effects on the abundance and
Increased abundance of epiphytic algae; or
Increased filamentous algal production
High frequency (>1 event per year), or
Eutrophication
distributions of natural living resource
A statistical y significant trend in
resulting in algal mats; or
intensity, or large areas of periodic hypoxic
"Artificial y enhanced
distributions in the area; and
decreased water transparency associated
Medium frequency (up to once per year)
conditions, or high frequencies of fish and
primary productivity in
No increased frequency of hypoxia1 or
with algal production as compared with
of large-scale hypoxia and/or fish and
zoobenthos mortality events or harmful
receiving water basins
fish mortality events or harmful algal
long-term (>20 year) data sets; or
zoobenthos mortality events and/or
algal blooms; or
related to the increased
blooms associated with enhanced primary Measurable shal owing of the depth range
harmful algal blooms.
Significant changes in the littoral
availability or supply
production; and
of macrophytes.
community; or
of nutrients, including
No evidence of periodical y reduced
Presence of hydrogen sulphide in
cultural eutrophication
dissolved oxygen or fish and zoobenthos
historical y well oxygenated areas.
in lakes."
mortality; and
No evident abnormality in the frequency of
algal blooms.
xii
REGIONAL ASSESSMENTS
THE GIWA METHODOLOGY
xiii
Issue 6: Chemical
No known or historical levels of chemical
Some chemical contaminants are
Some chemical contaminants are above
Chemical contaminants are above
pollution
contaminants except background levels of
detectable but below threshold limits
threshold limits defined for the country or
threshold limits defined for the country or
"The adverse effects of
natural y occurring substances; and
defined for the country or region; or
region; or
region; and
chemical contaminants
No fisheries closures or advisories due to
Restricted area advisories regarding
Large area advisories by public health
Public health and public awareness of
released to standing or
chemical pol ution; and
chemical contamination of fisheries
authorities concerning fisheries product
fisheries contamination problems with
marine water bodies
No incidence of fisheries product tainting;
products.
contamination but without associated
associated reductions in the marketability
as a result of human
and
catch restrictions or closures; or
of such products either through the
activities. Chemical
No unusual fish mortality events.
If there is no available data use the fol owing High mortalities of aquatic species near
imposition of limited advisories or by area
contaminants are
criteria:
outfal s.
closures of fisheries; or
here defined as
If there is no available data use the fol owing Some use of pesticides in small areas; or
Large-scale mortalities of aquatic species.
compounds that are
criteria:
Presence of small sources of dioxins or
If there is no available data use the fol owing
toxic or persistent or
No use of pesticides; and
furans (e.g., small incineration plants or
criteria:
If there is no available data use the fol owing
bioaccumulating."
No sources of dioxins and furans; and
bleached kraft/pulp mil s using chlorine);
Large-scale use of pesticides in agriculture
criteria:
No regional use of PCBs; and
or
and forestry; or
Indications of health effects resulting
No bleached kraft pulp mil s using chlorine Some previous and existing use of PCBs
Presence of major sources of dioxins or
from use of pesticides; or
bleaching; and
and limited amounts of PCB-containing
furans such as large municipal or industrial Known emissions of dioxins or furans from
No use or sources of other contaminants.
wastes but not in amounts invoking local
incinerators or large bleached kraft pulp
incinerators or chlorine bleaching of pulp;
concerns; or
mil s; or
or
Presence of other contaminants.
Considerable quantities of waste PCBs in
Known contamination of the environment
the area with inadequate regulation or has
or foodstuffs by PCBs; or
invoked some public concerns; or
Known contamination of the environment
Presence of considerable quantities of
or foodstuffs by other contaminants.
other contaminants.
Issue 7: Suspended
No visible reduction in water transparency; Evidently increased or reduced turbidity
Markedly increased or reduced turbidity
Major changes in turbidity over wide or
solids
and
in streams and/or receiving riverine and
in small areas of streams and/or receiving
ecological y significant areas resulting
"The adverse effects of
No evidence of turbidity plumes or
marine environments but without major
riverine and marine environments; or
in markedly changed biodiversity or
modified rates of release
increased siltation; and
changes in associated sedimentation or
Extensive evidence of changes in
mortality in benthic species due to
of suspended particulate No evidence of progressive riverbank,
erosion rates, mortality or diversity of flora
sedimentation or erosion rates; or
excessive sedimentation with or without
matter to water bodies
beach, other coastal or deltaic erosion.
and fauna; or
Changes in benthic or pelagic biodiversity
concomitant changes in the nature of
resulting from human
Some evidence of changes in benthic or
in areas due to sediment blanketing or
deposited sediments (i.e., grain-size
activities"
pelagic biodiversity in some areas due
increased turbidity.
composition/redox); or
to sediment blanketing or increased
Major change in pelagic biodiversity or
turbidity.
mortality due to excessive turbidity.
Issue 8: Solid wastes
No noticeable interference with trawling
Some evidence of marine-derived litter on
Widespread litter on beaches giving rise to
Incidence of litter on beaches sufficient
"Adverse effects
activities; and
beaches; or
public concerns regarding the recreational
to deter the public from recreational
associated with the
No noticeable interference with the
Occasional recovery of solid wastes
use of beaches; or
activities; or
introduction of solid
recreational use of beaches due to litter;
through trawling activities; but
High frequencies of benthic litter recovery
Trawling activities untenable because of
waste materials into
and
Without noticeable interference with
and interference with trawling activities;
benthic litter and gear entanglement; or
water bodies or their
No reported entanglement of aquatic
trawling and recreational activities in
or
Widespread entanglement and/or
environs."
organisms with debris.
coastal areas.
Frequent reports of entanglement/
suffocation of aquatic species by litter.
suffocation of species by litter.
Issue 9: Thermal
No thermal discharges or evidence of
Presence of thermal discharges but
Presence of thermal discharges with large
Presence of thermal discharges with large
"The adverse effects
thermal effluent effects.
without noticeable effects beyond
mixing zones having reduced productivity
mixing zones with associated mortalities,
of the release of
the mixing zone and no significant
or altered biodiversity; or
substantial y reduced productivity or
aqueous effluents at
interference with migration of species.
Evidence of reduced migration of species
noticeable changes in biodiversity; or
temperatures exceeding
due to thermal plume.
Marked reduction in the migration of
ambient temperature
species due to thermal plumes.
in the receiving water
body."
Issue 10: Radionuclide No radionuclide discharges or nuclear
Minor releases or fal out of radionuclides
Minor releases or fal out of radionuclides
Substantial releases or fal out of
"The adverse effects of
activities in the region.
but with well regulated or wel -managed
under poorly regulated conditions that do
radionuclides resulting in excessive
the release of radioactive
conditions complying with the Basic Safety
not provide an adequate basis for public
exposures to humans or animals in relation
contaminants and
Standards.
health assurance or the protection of
to those recommended under the Basic
wastes into the aquatic
aquatic organisms but without situations
Safety Standards; or
environment from
or levels likely to warrant large scale
Some indication of situations or exposures
human activities."
intervention by a national or international
warranting intervention by a national or
authority.
international authority.
Issue 11: Spills
No evidence of present or previous spil s of
Some evidence of minor spil s of hazardous Evidence of widespread contamination
Widespread contamination by hazardous
"The adverse effects
hazardous material; or
materials in small areas with insignificant
by hazardous or aesthetical y displeasing
or aesthetical y displeasing materials
of accidental episodic
No evidence of increased aquatic or avian
smal -scale adverse effects one aquatic or
materials assumed to be from spil age
from frequent spil s resulting in major
releases of contaminants
species mortality due to spil s.
avian species.
(e.g. oil slicks) but with limited evidence of
interference with aquatic resource
and materials to the
widespread adverse effects on resources or
exploitation or coastal recreational
aquatic environment
amenities; or
amenities; or
as a result of human
Some evidence of aquatic or avian species
Significant mortality of aquatic or avian
activities."
mortality through increased presence of
species as evidenced by large numbers of
contaminated or poisoned carcasses on
contaminated carcasses on beaches.
beaches.
xii
REGIONAL ASSESSMENTS
THE GIWA METHODOLOGY
xiii
Table 5c: Scoring criteria for environmental impacts of Habitat and community modification
Issue
Score 0 = no known impact
Score 1 = slight impact
Score 2 = moderate impact
Score 3 = severe impact
Issue 12: Loss of ecosystems or
There is no evidence of loss of
There are indications of fragmentation Permanent destruction of at least one
Permanent destruction of at least one
ecotones
ecosystems or habitats.
of at least one of the habitats.
habitat is occurring such as to have
habitat is occurring such as to have
"The complete destruction of aquatic
reduced their surface area by up to 30
reduced their surface area by >30%
habitats. For the purpose of GIWA
% during the last 2-3 decades.
during the last 2-3 decades.
methodology, recent loss will be
measured as a loss of pre-defined
habitats over the last 2-3 decades."
Issue 13: Modification of
No evidence of change in species
Evidence of change in species
Evidence of change in species
Evidence of change in species
ecosystems or ecotones, including
complement due to species extinction
complement due to species extinction
complement due to species extinction
complement due to species extinction
community structure and/or species
or introduction; and
or introduction
or introduction; and
or introduction; and
composition
No changing in ecosystem function
Evidence of change in population
Evidence of change in population
"Modification of pre-defined habitats
and services.
structure or change in functional group
structure or change in functional group
in terms of extinction of native species,
composition or structure
composition or structure; and
occurrence of introduced species and
Evidence of change in ecosystem
changing in ecosystem function and
services2.
services over the last 2-3 decades."
2 Constanza, R. et al. (1997). The value of the world ecosystem services and natural capital, Nature 387:253-260.
Table 5d: Scoring criteria for environmental impacts of Unsustainable exploitation of fish and other
living resources
Issue
Score 0 = no known impact
Score 1 = slight impact
Score 2 = moderate impact
Score 3 = severe impact
Issue 14: Overexploitation
No harvesting exists catching fish
Commercial harvesting exists but there One stock is exploited beyond MSY
More than one stock is exploited
"The capture of fish, shel fish or marine
(with commercial gear for sale or
is no evidence of over-exploitation.
(maximum sustainable yield) or is
beyond MSY or is outside safe
invertebrates at a level that exceeds the
subsistence).
outside safe biological limits.
biological limits.
maximum sustainable yield of the stock."
Issue 15: Excessive by-catch and
Current harvesting practices show no
Up to 30% of the fisheries yield (by
30-60% of the fisheries yield consists
Over 60% of the fisheries yield is
discards
evidence of excessive by-catch and/or
weight) consists of by-catch and/or
of by-catch and/or discards.
by-catch and/or discards; or
"By-catch refers to the incidental capture
discards.
discards.
Noticeable incidence of capture of
of fish or other animals that are not the
endangered species.
target of the fisheries. Discards refers
to dead fish or other animals that are
returned to the sea."
Issue 16: Destructive fishing
No evidence of habitat destruction due Habitat destruction resulting in
Habitat destruction resulting in
Habitat destruction resulting in
practices
to fisheries practices.
changes in distribution of fish or
moderate reduction of stocks or
complete col apse of a stock or far
"Fishing practices that are deemed to
shel fish stocks; or
moderate changes of the environment;
reaching changes in the environment;
produce significant harm to marine,
Trawling of any one area of the seabed
or
or
lacustrine or coastal habitats and
is occurring less than once per year.
Trawling of any one area of the seabed
Trawling of any one area of the seabed
communities."
is occurring 1-10 times per year; or
is occurring more than 10 times per
Incidental use of explosives or poisons
year; or
for fishing.
Widespread use of explosives or
poisons for fishing.
Issue 17: Decreased viability of
No evidence of increased incidence of
Increased reports of diseases without
Declining populations of one or more
Col apse of stocks as a result of
stocks through contamination and
fish or shel fish diseases.
major impacts on the stock.
species as a result of diseases or
diseases or contamination.
disease
contamination.
"Contamination or diseases of feral (wild)
stocks of fish or invertebrates that are a
direct or indirect consequence of human
action."
Issue 18: Impact on biological and
No evidence of deliberate or accidental Alien species introduced intentional y
Measurable decline in the population
Extinction of native species or local
genetic diversity
introductions of alien species; and
or accidental y without major changes
of native species or local stocks as a
stocks as a result of introductions
"Changes in genetic and species diversity No evidence of deliberate or accidental
in the community structure; or
result of introductions (intentional or
(intentional or accidental); or
of aquatic environments resulting from
introductions of alien stocks; and
Alien stocks introduced intentional y
accidental); or
Major changes (>20%) in the genetic
the introduction of alien or genetical y
No evidence of deliberate or accidental
or accidental y without major changes Some changes in the genetic
composition of stocks (e.g. as a result
modified species as an intentional or
introductions of genetical y modified
in the community structure; or
composition of stocks (e.g. as a result
of escapes from aquaculture replacing
unintentional result of human activities
species.
Genetical y modified species
of escapes from aquaculture replacing
the wild stock).
including aquaculture and restocking."
introduced intentional y or
the wild stock).
accidental y without major changes in
the community structure.
xiv
REGIONAL ASSESSMENTS
THE GIWA METHODOLOGY
xv
Table 5e: Scoring criteria for environmental impacts of Global change
Issue
Score 0 = no known impact
Score 1 = slight impact
Score 2 = moderate impact
Score 3 = severe impact
Issue 19: Changes in hydrological
No evidence of changes in hydrological Change in hydrological cycles due
Significant trend in changing
Loss of an entire habitat through
cycle and ocean circulation
cycle and ocean/coastal current due to
to global change causing changes
terrestrial or sea ice cover (by
desiccation or submergence as a result
"Changes in the local/regional water
global change.
in the distribution and density of
comparison with a long-term time
of global change; or
balance and changes in ocean and coastal
riparian terrestrial or aquatic plants
series) without major downstream
Change in the tree or lichen lines; or
circulation or current regime over the
without influencing overall levels of
effects on river/ocean circulation or
Major impacts on habitats or
last 2-3 decades arising from the wider
productivity; or
biological diversity; or
biodiversity as the result of increasing
problem of global change including
Some evidence of changes in ocean
Extreme events such as flood and
frequency of extreme events; or
ENSO."
or coastal currents due to global
drought are increasing; or
Changing in ocean or coastal currents
change but without a strong effect on Aquatic productivity has been altered
or upwel ing regimes such that plant
ecosystem diversity or productivity.
as a result of global phenomena such
or animal populations are unable to
as ENSO events.
recover to their historical or stable
levels; or
Significant changes in thermohaline
circulation.
Issue 20: Sea level change
No evidence of sea level change.
Some evidences of sea level change
Changed pattern of coastal erosion due Major loss of coastal land areas due to
"Changes in the last 2-3 decades in the
without major loss of populations of
to sea level rise has became evident; or
sea-level change or sea-level induced
annual/seasonal mean sea level as a
organisms.
Increase in coastal flooding events
erosion; or
result of global change."
partly attributed to sea-level rise
Major loss of coastal or intertidal
or changing prevailing atmospheric
populations due to sea-level change or
forcing such as atmospheric pressure
sea level induced erosion.
or wind field (other than storm
surges).
Issue 21: Increased UV-B radiation as No evidence of increasing effects
Some measurable effects of UV/B
Aquatic community structure is
Measured/assessed effects of UV/B
a result of ozone depletion
of UV/B radiation on marine or
radiation on behavior or appearance of
measurably altered as a consequence
irradiation are leading to massive loss
"Increased UV-B flux as a result polar
freshwater organisms.
some aquatic species without affecting
of UV/B radiation; or
of aquatic communities or a significant
ozone depletion over the last 2-3
the viability of the population.
One or more aquatic populations are
change in biological diversity.
decades."
declining.
Issue 22: Changes in ocean CO
No measurable or assessed changes
Some reasonable suspicions that
Some evidences that the impacts
Evidences that the changes in
2
source/sink function
in CO source/sink function of aquatic
current global change is impacting the
of global change have altered the
source/sink function of the aquatic
2
"Changes in the capacity of aquatic
system.
aquatic system sufficiently to alter its
source/sink function for CO of aquatic
systems in the region are sufficient to
2
systems, ocean as well as freshwater, to
source/sink function for CO .
systems in the region by at least 10%.
cause measurable change in global CO
2
2
generate or absorb atmospheric CO as a
balance.
2
direct or indirect consequence of global
change over the last 2-3 decades."
xiv
REGIONAL ASSESSMENTS
THE GIWA METHODOLOGY
xv

(1,1) -1- Cover 42_only.indd 2004-08-10, 10:25:08
GI
W
A
RE
GION
A
L
AS
SES
S
ME
The Global International Waters Assessment (GIWA) is a holistic, globally
N
T
S
comparable assessment of all the world's transboundary waters that recognises
the inextricable links between freshwater and coastal marine environment and
integrates environmental and socio-economic information to determine the
impacts of a broad suite of infl uences on the world's aquatic environment.
Broad Transboundary Approach
The GIWA not only assesses the problems caused by human activities manifested by
the physical movement of transboundary waters, but also the impacts of other non-
G
hydrological infl uences that determine how humans use transboundary waters.
UINE
Regional Assessment - Global Perspective
A
CU
The GIWA provides a global perspective of the world's transboundary waters by assessing
R
66 regions that encompass all major drainage basins and adjacent large marine ecosystems.
R
E
The GIWA Assessment of each region incorporates information and expertise from all
N
T
countries sharing the transboundary water resources.
Global Comparability
In each region, the assessment focuses on 5 broad concerns that are comprised
of 22 specifi c water related issues.
Integration of Information and Ecosystems
The GIWA recognises the inextricable links between freshwater and coastal marine
environment and assesses them together as one integrated unit.
The GIWA recognises that the integration of socio-economic and environmental
information and expertise is essential to obtain a holistic picture of the interactions
between the environmental and societal aspects of transboundary waters.
Priorities, Root Causes and Options for the Future
The GIWA indicates priority concerns in each region, determines their societal root causes
and develops options to mitigate the impacts of those concerns in the future.
This Report
This report presents the assessment of the Guinea Current region a vast region that
includes the Guinea Current Large Marine Ecosystem as well as 28 international river
basins shared by 27 countries. The region is characterised by large variations in
hydrological conditions; from the Sahel deserts and drylands in the north to the
tropical jungles of Congo in the south. This feature is refl ected in the environmental
problems of the region: Freshwater shortage was identifi ed as the most stressing concern
in the Volta and Niger basins while Pollution is a general concern in the humid basins and
in the coastal and marine waters. Causal chain analysis and Policy option analysis was
conducted for the identifi ed priority concerns in the Volta, Niger and Comoe river basins
and in the Guinea Current LME.