

Global International
Waters Assessment
Regional assessments
Other reports in this series:
Russian Arctic GIWA Regional assessment 1a
Caribbean Sea/Small Islands GIWA Regional assessment 3a
Caribbean Islands GIWA Regional assessment 4
Barents Sea GIWA Regional assessment 11
Baltic Sea GIWA Regional assessment 17
Caspian Sea GIWA Regional assessment 23
Gulf of California/Colorado River Basin GIWA Regional assessment 27
East China Sea GIWA Regional assessment 36
Patagonian Shelf GIWA Regional assessment 38
Brazil Current GIWA Regional assessment 39
Amazon Basin GIWA Regional assessment 40b
Canary Current GIWA Regional assessment 41
Guinea Current GIWA Regional assessment 42
Lake Chad Basin GIWA Regional assessment 43
Benguela Current GIWA Regional assessment 44
Indian Ocean Islands GIWA Regional assessment 45b
East African Rift Valley Lakes GIWA Regional assessment 47
South China Sea GIWA Regional assessment 54
Sulu-Celebes (Sulawesi) Sea GIWA Regional assessment 56
Indonesian Seas GIWA Regional assessment 57
Pacifi c Islands GIWA Regional assessment 62
Global International
Waters Assessment
Regional assessment 34
Yellow Sea
GIWA report production
Series editor: Ulla Li Zweifel
Editorial assistance: Johanna Egerup,
Monique Stolte, Nancy Bazilchuk
Maps & GIS: Rasmus Göransson
Design & graphics: Joakim Palmqvist
Global International Waters Assessment
Yellow Sea, GIWA Regional assessment 34
Published by the University of Kalmar on behalf of
United Nations Environment Programme
© 2005 United Nations Environment Programme
ISSN 1651-940X
University of Kalmar
SE-391 82 Kalmar
Sweden
United Nations Environment Programme
PO Box 30552,
Nairobi, Kenya
This publication may be reproduced in whole or in part and
in any form for educational or non-profi t purposes without
special permission from the copyright holder, provided
acknowledgement of the source is made. No use of this
publication may be made for resale or for any other commercial
purpose whatsoever without prior permission in writing from the
United Nations Environment Programme.
CITATIONS
When citing this report, please use:
UNEP 2005. Teng, S.K., Yu, H., Tang, Y., Tong, L., Choi, C.I., Kang, D.,
Liu, H., Chun, Y., Juliano, R.O., Rautalahti-Miettinen, E. and D. Daler.
Yellow Sea, GIWA Regional assessment 34. University of Kalmar,
Kalmar, Sweden.
DISCLAIMER
The views expressed in this publication are those of the authors
and do not necessarily refl ect those of UNEP. The designations
employed and the presentations do not imply the expressions
of any opinion whatsoever on the part of UNEP or cooperating
agencies concerning the legal status of any country, territory,
city or areas or its authority, or concerning the delimitation of its
frontiers or boundaries.
This publication has been peer-reviewed and the information
herein is believed to be reliable, but the publisher does not
warrant its completeness or accuracy.
Contents
Executive summary
9
Abbreviations and acronyms
13
Regional defi nition (Yellow Sea)
15
Boundaries of the region
15
Physical characteristics
16
Socio-economic characteristics
21
Assessment (Yellow Sea)
25
Freshwater shortage
25
Pollution
28
Habitat and community modifi cation
31
Unsustainable exploitation of fi sh and other living resources
33
Global change
36
Priority concerns for further analysis
36
Causal chain analysis (Yellow Sea)
39
Habitat and community modifi cation and freshwater shortage
39
Unsustainable exploitation of fi sh and other living resources
43
Conclusions
44
Policy options (Yellow Sea)
45
Defi nition of the problem
45
Policy options and strategic action programmes
46
References (Yellow Sea)
49
Regional defi nition (Bohai Sea)
52
Boundaries of the region
52
Physical characteristics
53
Socio-economic characteristics
56
Assessment (Bohai Sea)
61
Freshwater shortage
61
Pollution
63
Habitat and community modifi cation
64
Unsustainable exploitation of fi sh and other living resources
66
Global change
67
Priority of concerns for further analysis
68
CONTENTS
Causal chain analysis (Bohai Sea)
69
Habitat and community modifi cation and freshwater shortage
69
Unsustainable exploitation of living resources
72
Conclusions
73
Policy options (Bohai Sea)
75
Defi nition of the problem
75
Policy options and strategic action programmes
75
References (Bohai Sea)
78
Conclusions and recommendations (Yellow Sea & Bohai Sea)
79
Annexes (Yellow Sea & Bohai Sea)
81
Annex I List of contributing authors and organisations
81
Annex II Detailed scoring tables: Yellow Sea, Bohai Sea
83
Annex III List of important water-related programmes and assessments
89
Annex IV List of conventions and specifi c laws that aff ect water use
92
Annex V WHO Guidelines for drinking-water quality or standards
97
The need for a global international waters assessment
i
The GIWA methodology
vii
Executive summary
YELLOW SEA & BOHAI SEA
This report presents the results of environmental and socio-economic
from the north bank of the mouth of the Yangtze River (Changjiang)
assessment studies of the Yellow Sea (GIWA region 34a) and the
to the south side of Cheju Island, covering an area of roughly 400 000
associated water body, the Bohai Sea (GIWA region 34b). The studies,
km2. It is an important global resource for coastal and off shore fi sheries.
which were facilitated through workshops with the participation of
Fish species found in the near-shore bays and estuaries include Ocellate
international experts, included impact assessments and causal chain
spot skate (Raja kenojei), Greenling (Hexagrammos otakii), Black snapper
analyses to determine the impacts and root causes of the priority
(Lutjanus sp.), Scaled sardine (Harengula zunasi), and Spotted sardine
GIWA concerns and issues, respectively. Policy options and associated
(Clupanodon punctatus). There are approximately 1 600 species that
strategic action programmes were also identifi ed as to address the root
have been reported from marine and coastal habitats on the Korean
causes of the priority environmental problem areas of the region based
side of the region. The region is interesting because of its substantial
on the impact assessment and causal chain analysis results.
population and increasing anthropogenic pressure. Approximately
600 million people live in the areas around the Yellow Sea. The region
Yellow Sea region
contains the following large cities, with one million or more inhabitants:
The Yellow Sea region covers the following sea, river basins, watersheds
Qingdao, Tianjin, Dalian, Seoul/Inchon, and Pyongyang/Nampo. People
and their associated coastal and marine habitats:
of these large, urban areas depend on the Yellow Sea as a source of
Yellow Sea proper and its associated islands, coastal and off shore
marine resources for human nutrition, economic development,
areas;
recreation, and tourism. The main economic sectors include: fi sheries,
Yalu River (Yalujiang) and its associated coastal and marine habitats
aquaculture, oil exploitation and tourism.
at its river mouth located in the northern region of the Yellow
Sea;
The detailed assessment indicated that the environmental and socio-
Coastal river basins in the Liaodong Peninsula, which drain partially
economic impacts of the following GIWA concerns and issues in the
into the northern portion of the Yellow Sea (and partially to the
region were severe:
Bohai Sea);
Freshwater
shortage
Coastal river basins in the Shandong Peninsula, which partially
- Modifi cation of stream fl ow
drain into the middle and southern portions of the Yellow Sea
-
Pollution of existing supplies
(and partially into the Bohai Sea);
Habitat and community modifi cation
Yongsan River (Yongsan-gang), Taedong River (Taedong-gang),
-
Loss of ecosystems
Imjin River (Imjin-gang), Han River (Han-gang) and Kum River
-
Modifi cation of ecosystems
(Kum-gang) and their basins along the west coast of the Korean
Unsustainable exploitation of fi sh and other living resources
Peninsula, which drain into the Yellow Sea.
- Overexploitation
- Destructive
fi
shing
practices
The region has diverse physical and socio-economic characteristics. The
Yellow Sea is a semi-enclosed body of water bordering the Chinese
Modifi cation of stream fl ow in the major rivers on both the Chinese and
mainland to the west, the Korean Peninsula to the east, and a line running
Korean sides of the region has reduced the discharge of river water into
EXECUTIVE SUMMARY
9
the Yellow Sea. This has changed the environment and water quality of
The identifi ed root causes are;
the Yellow Sea, aff ecting the well-being of the marine living resources
Demographic: Increased population growth and mass migration
and coastal habitats in both the Chinese and Korean waters of the
to urban area.
region. Pollution of existing supplies in rivers on both the Korean and
Technology: Poor crop irrigation systems.
Chinese sides of the region has brought pollutants across national
Economic: Changes in economic structure and increased economic
boundaries with signifi cant transboundary impacts.
growth; Insuffi
cient investments in "green technology".
Knowledge: Little access to technical and scientifi c information and
Loss and modifi cation of ecosystems has depleted the living resources
low education level of the rural population. Profi t-oriented attitudes
not only on the Chinese but also the Korean side of the region,
disregarding environmental impacts.
particularly for the ecosystems that are the spawning or breeding
Legal:
Insuffi
cient enforcement of regulations and laws.
grounds of fi sh species.
Natural: Typhoons, causing storms and fl oods.
The major commercial species caught in the Yellow Sea are largely
The increased fi shing eff ort, higher effi
ciency and use of destructive
migratory species that are subject to seasonal migrations from one
fi shing practices in the region have led to unsustainable exploitation of
area of the sea to another. The catches in both the Chinese and Korean
fi sh and other living resources. The environmental and socio-economic
waters of the Yellow Sea would be seriously aff ected if overexploitation
impacts are overexploited fi sheries resources, destruction of aquatic
of these migratory species occurs. Overexploitation of fi sheries
habitats, decreased employment rates in the fi sheries sector and
resources has been found to be the most serious issue in the region.
decreased opportunities in the seafood processing industry.
Cooperative eff orts on a regional or transnational basis are required
to attain sustainable management of the fi sheries and other living
The identifi ed root causes of unsustainable exploitation of fi sh and
resources of the region.
other living resources are:
Demographic: Increased demand for food as a result of increased
Destructive fi shing practices are common in the region and can greatly
population.
impact on the viability of migratory species. Most of the fi sh species in
Economic: Profi t-oriented attitudes disregarding environmental
the region are migratory species and there is evidence of changes in
impacts and increased market demand.
biological and genetic diversity in some of these species, resulting from
Technology: Easy access to improved fi shing technologies.
overexploitation occurred.
Knowledge: Lack of public awareness.
The prioritised issues were analysed in two Causal chain analyses; the
The following policy options were formulated with regards to
fi rst one targeting habitat and community modifi cation as well as
freshwater shortage:
freshwater shortage problems in the region, and the second targeting
Integration of the development and management of agricultural
overexploitation and destructive fi shing practices in the Yellow Sea.
irrigation systems with integrated river basin management
Modifi cation of stream fl ow and pollution of existing supplies are
programmes.
important issues under the concern freshwater shortage. Habitat and
Adoption and promotion of water-saving technologies for crop
community modifi cation in the region is primarily due to reclamation
irrigation.
of coastal land, irrigation, embankments, discharges of nutrients, trace
Adoption of the Natural Forest Protection Program (NFPP) to cope
metals and organic material and the introduction of invasive species
with the uncontrolled deforestation.
and diseases.
Adoption of integrated forest management practices.
Adoption of effi
cient law enforcement mechanisms to prevent
The sectors involved in these issues are intensifi ed and expanded
illegal logging and other forest destructive practices.
agriculture; increased discharge of pollutants from a growing
Adoption of programs for raising public awareness and participation
industry as well as urbanisation, and infrastructure provisions like
in forest management and restoration.
the construction of dams and dikes for fl ood control. Moreover, both
Promotion of market incentive systems to encourage the use of
increased shipping traffi
c and modern aquaculture have raised the risk
green production technology in the industry sector.
of introducing alien species.
Enhancement of laws and enforcement mechanisms related to
pollution prevention and wastewater treatment practices.
10
GIWA REGIONAL ASSESSMENT 34 YELLOW SEA
Adoption of laws, regulations and enforcement mechanisms to
on the environmental and social consequences of the destructive
control the use and disposal of fertilisers and pesticides.
fi shing practices.
Adoption of educational and public awareness campaign programs
on good practices in agriculture.
For each of the policy options, a Strategic Action Programme is defi ned,
Adoption of sustainable soil management system(s) to improve soil
in order to give suggestions about how the policy options could be
fertility and productivity.
implemented.
Adoption of effi
cient soil fertility improvement technology and
crop irrigation systems to improve the soil productivity
Bohai Sea
The following policy options were formulated with regards to habitat
The Bohai Sea is a national sea under the jurisdiction of China. It is
and community modifi cation;
located in the northwest corner of the Yellow Sea. From an ecological
Adoption of laws, regulations and enforcement mechanisms to
perspective, the Bohai Sea is a large, shallow embayment of the Yellow
restrict population migration.
Sea. The Yellow Sea, in turn, is a shallow continental sea of the northwest
Adoption of an approach that encourages the development of
Pacifi c Ocean. These relationships are important because of the physical
small, rural-oriented urban centres in rural areas to cope with
and biological links between these systems; in particular, the fi sh and
population migration.
shellfi sh stocks in the Yellow Sea are dependent on the Bohai Sea as a
Adoption of laws, regulations and enforcement mechanisms to
reproduction and nursery area.
promote good practices in agriculture including minimisation of
the discharge of agricultural runoff high in harmful pollutants.
Given that the Bohai Sea is not a transboundary water body, the
Adoption of laws, regulations and enforcement mechanisms
assessment report of the Bohai Sea is included in this report as an
to restrict the introduction of exotic and invasive species for
appendix to be used as a reference for further understanding of the
aquaculture.
Yellow Sea's environmental problems.
Adoption of programs related to raising public awareness on and
participation in good practices in agriculture and recognising the
The Bohai Sea region covers the following sea, river basins, watersheds
environmental impact of introducing exotic and invasive species
and their associated coastal and marine habitats:
for aquaculture.
Adoption of programs to raise public aware on and participation in
Bohai Sea, which consists of three bays: the Liaodong Bay to
good practices in using fertilisers and pesticides.
the north, the Bohai Bay to the west and the Laizhou Bay to the
Adoption of sustainable agriculture production technologies that
south;
would minimise the use of fertilisers and pesticides.
Liao River (Liaohe) Basin, coastal river basins in the Liaodong
Peninsula, the Shuangtaizihe River Basin and their associated
The following policy options were formulated with regards to
coastal and marine habitats in Liaodong Bay, north of the Bohai
unsustainable exploitation of fi sh and other living resources;
Sea;
Enhancement of laws, regulations and enforcement mechanisms to
Hai River (Haihe) and Luan River (Luanhe) and their associated
restrict the entry of excessive fi shing fl eets and fi shermen into the
marine habitats in Bohai Bay west of the Bohai Sea;
fi shing industry.
Yellow River (Huanghe) Basin, coastal river basins in the Shandong
Adoption of alternative livelihood programs for fi shermen and
Peninsula and their associated coastal and marine habitats in
other fi sheries operators.
Laizhou Bay, to the south of Bohai Sea.
Adoption of public awareness and education programs on the
environmental and social consequences of over-harvesting of
The region has diverse physical and socio-economic characteristics.
fi sheries resources.
It is the historical heartland of China, and one of the most important
Adoption of the sustainable production practices to enhance
agricultural and industrial regions in the country. The Bohai Sea has
fi sheries and aquaculture production.
always been known as a "natural fi shing ground" and harbours more
Enhancement of law enforcement mechanisms to restrict the
than 1 540 species. Apart from such sea treasures as Prawn, Sea
destructive fi shing practices.
cucumber and Abalone, the Bohai Sea has over 100 species of major
Adoption of public awareness campaign and education programs
fi sh species among which the Small yellow croaker and the Hairtail
EXECUTIVE SUMMARY
11
are the fi sh species with the largest production in the Bohai Sea and
Technology: Inadequate access to technology leading to ineffi
cient
also among the four major fi sh products from China's seas. The Bohai
use of freshwater. The easy access to modern technology has a
Sea region covers an area of 1.6 million km2, 19.4% of the nation's total
propelled industrial growth that requires more use of water.
area and with a population of 343.5 million, over 22% of the nation's
Legal: Inadequate enforcement of laws and regulations to control
population. The main economic sectors of the region include: fi sheries
the use of freshwater.
and marine aquaculture, salt making, port development and marine
Economic: Increase in economic growth. Increased energy
transport, oil exploitation and tourism.
demand by industries and domestic uses. Low investment in waste
treatment facilities.
Based on the results of the assessment for the Bohai Sea region the
Knowledge: Lack of public awareness on environmental impacts.
GIWA issues that have been assessed as having severe environmental
Profi t-oriented attitudes that disregard environmental impacts
impacts were selected for further analysis. They include:
resulting in uncontrolled conversion of coastal wetlands for
Freshwater
shortage:
petrochemical plants.
- Modifi cation of stream fl ow
Natural causes. Decrease in rainfall has causing excessive extraction
-
Pollution of existing supplies
of groundwater to meet the needs for crop and industrial
- Changes
in
water
table
production.
Habitat and community modifi cation
-
Loss of ecosystems
Identifi ed root causes regarding unsustainable exploitation of fi sh and
- Modifi
cation
of
ecosystems
other living resources are:
Unsustainable exploitation of fi sh and other living resources
Demographic: Increase in population growth leading to increased
- Overexploitation
demand for food, including seafood. Shift in livelihood of fi shermen
-
Impact on biological and genetic diversity
from capture fi sheries to aquaculture.
Knowledge: Profi t-driven attitudes of fi sheries operators resulting
These issues are analysed in two causal chain analyses; the fi rst
in overexploitation of living resources. Insuffi
cient awareness of
one targeting habitat and community modifi cation as well as
the consequences of uncontrolled releases of hatchery-produced
freshwater shortage problems in the region, and the second targeting
juveniles and overexploitation of spawning fi sh.
overexploitation and destructive fi shing practices in the Bohai Sea.
Technology: Easy access to improved or new aquaculture
technologies has propelled the increased development of
The root causes for each of the problem areas have been assessed and
aquaculture, leading to unsustainable use of living resources.
prioritised. Key root causes for each of the problem areas were selected
and are as follows.
Suggested priority policy options and their associated strategic action
programs to address the priority root causes for each of the problem
Freshwater shortage and habitat and community modifi cation
areas have been formulated. Details of the policy options and their
Demographic: Increased population growth and mass migration
associated strategic action programmes are presented in this report.
to urban areas.
12
GIWA REGIONAL ASSESSMENT 34 YELLOW SEA
Abbreviations and acronyms
YELLOW SEA & BOHAI SEA
ADB Asian
Development
Bank
HP
Horse Power
ASEAN
Association of Southeast Asian Nations
IUCN International
Union
for
Conservation
of
Nature
BOD Biological
Oxygen
Demand
JICA Japanese
International
Cooperation
Agency
CIDA
Canadian International Development Agency
MDB Multilateral
Development
Bank
CITES
Convention on International Trade in Endangered Species
NGO Non-governmental
Organisation
CMC
Coastal Management Center
NOWPAP UNEP Regional Seas Programme's Northwest Pacifi c Action
DANIDA Danish International Development Agency
Plan
DPR Korea Democratic People's Republic of Korea (North Korea)
NYSAP
National Yellow Sea Action Plan
DMZ Demilitarised
Zone
PEMSEA Partnership in Environmental Management for the Seas of
DWT Dead
Weight
Tonnage
East
Asia
EA
Environmental Assessment (including IEE and EIA)
PICES
North Pacifi c Marine Science Organisation
EABRN
East Asian Biosphere Reserve Network
ROAP UNEP
Regional
Offi
ce for Asia and the Pacifi c
EIA
Environmental Impact Assessment
ROK
Republic of Korea (South Korea)
ENSO El
Nińo
Southern
Oscillation
Sida
Swedish International Development Cooperation Agency
ESCAP
Economic and Social Commission for Asia and Pacifi c
SAP
Strategic Action Programme
FAO
Food and Agriculture Organisation of the United Nations
SST
Sea Surface Temperature
GEF
Global Environment Facility
TDA Transboundary
Diagnostic
Analysis
GDP Gross
Domestic
Product
TRADP Tumen
River
Area
Development
Project
GIS
Geographic Information System
UNESCO United Nations Educational Scientifi c and Cultural
GIWA
Global International Waters Assessment
Organization
GNP Gross
National
Product
UNEP
United Nations Environmental Programme
HAB Harmful
Algal
Bloom
USAID US
Agency
for
International
Development
ABBREVIATIONS AND ACRONYMS
13
List of figures, Yellow Sea
Figure 1
Boundaries of the Yellow Sea region . . . . . . . . . . . . . . . . . . . . . . . . . . . . . . . . . . . . . . . . . . . . . . . . . . . . . . . . . . . . . . . . . . . . . . . . . . . . . . . . . . . . . . . . . . . . . . . . . . . . . . . . . . . . . . . . . . . . . . . . . . . . 15
Figure 2
Currents in the Yellow and Bohai Sea.. . . . . . . . . . . . . . . . . . . . . . . . . . . . . . . . . . . . . . . . . . . . . . . . . . . . . . . . . . . . . . . . . . . . . . . . . . . . . . . . . . . . . . . . . . . . . . . . . . . . . . . . . . . . . . . . . . . . . . . . . . 16
Figure 3
Surface temperature in Yellow Sea during February. . . . . . . . . . . . . . . . . . . . . . . . . . . . . . . . . . . . . . . . . . . . . . . . . . . . . . . . . . . . . . . . . . . . . . . . . . . . . . . . . . . . . . . . . . . . . . . . . . . . . . . . . . . . . 17
Figure 4
Surface temperature in Yellow Sea during August. . . . . . . . . . . . . . . . . . . . . . . . . . . . . . . . . . . . . . . . . . . . . . . . . . . . . . . . . . . . . . . . . . . . . . . . . . . . . . . . . . . . . . . . . . . . . . . . . . . . . . . . . . . . . . . 17
Figure 5
Flood prone areas along the main rivers in the Yellow and Bohai seas regions.. . . . . . . . . . . . . . . . . . . . . . . . . . . . . . . . . . . . . . . . . . . . . . . . . . . . . . . . . . . . . . . . . . . . . . . . . . . . . . . . . 18
Figure 6
Population density in the Yellow Sea region.. . . . . . . . . . . . . . . . . . . . . . . . . . . . . . . . . . . . . . . . . . . . . . . . . . . . . . . . . . . . . . . . . . . . . . . . . . . . . . . . . . . . . . . . . . . . . . . . . . . . . . . . . . . . . . . . . . . . 21
Figure 7
Water quality in the tributaries of Huai River, classified according the Chinese National Water Quality Standards . . . . . . . . . . . . . . . . . . . . . . . . . . . . . . . . . . . . . . . . . . . . . 26
Figure 8
Fish catch in the Yellow Sea. . . . . . . . . . . . . . . . . . . . . . . . . . . . . . . . . . . . . . . . . . . . . . . . . . . . . . . . . . . . . . . . . . . . . . . . . . . . . . . . . . . . . . . . . . . . . . . . . . . . . . . . . . . . . . . . . . . . . . . . . . . . . . . . . . . . 33
Figure 9
Catch per unit effort (horsepower) of three major fisheries on the Korean side of the region. . . . . . . . . . . . . . . . . . . . . . . . . . . . . . . . . . . . . . . . . . . . . . . . . . . . . . . . . . . . . . . . . . . . 34
Figure 10
Linkage between the GIWA concerns in the Yellow Sea region. . . . . . . . . . . . . . . . . . . . . . . . . . . . . . . . . . . . . . . . . . . . . . . . . . . . . . . . . . . . . . . . . . . . . . . . . . . . . . . . . . . . . . . . . . . . . . . . . . 36
Figure 11
Causal chain diagram illustrating the causal links for habitat and community modification and freshwater shortage in the Yellow Sea region. . . . . . . . . . . . . . . . 40
Figure 12
The Yellow Sea. . . . . . . . . . . . . . . . . . . . . . . . . . . . . . . . . . . . . . . . . . . . . . . . . . . . . . . . . . . . . . . . . . . . . . . . . . . . . . . . . . . . . . . . . . . . . . . . . . . . . . . . . . . . . . . . . . . . . . . . . . . . . . . . . . . . . . . . . . . . . . . . . 42
Figure 13
Causal chain diagram illustrating the causal links for unsustainable exploitation of living resources in the Yellow Sea region. . . . . . . . . . . . . . . . . . . . . . . . . . . . . . . . . . 43
Figure 14
Ricefield at dawn in Jiangsu Province, China. . . . . . . . . . . . . . . . . . . . . . . . . . . . . . . . . . . . . . . . . . . . . . . . . . . . . . . . . . . . . . . . . . . . . . . . . . . . . . . . . . . . . . . . . . . . . . . . . . . . . . . . . . . . . . . . . . . 47
List of tables, Yellow Sea
Table 1
Major rivers in the Korean Peninsula draining into the Yellow Sea. . . . . . . . . . . . . . . . . . . . . . . . . . . . . . . . . . . . . . . . . . . . . . . . . . . . . . . . . . . . . . . . . . . . . . . . . . . . . . . . . . . . . . . . . . . . . . . 19
Table 2
Scoring table for the Yellow Sea region.. . . . . . . . . . . . . . . . . . . . . . . . . . . . . . . . . . . . . . . . . . . . . . . . . . . . . . . . . . . . . . . . . . . . . . . . . . . . . . . . . . . . . . . . . . . . . . . . . . . . . . . . . . . . . . . . . . . . . . . . 25
Table 3
National quality standards for surface water in China. . . . . . . . . . . . . . . . . . . . . . . . . . . . . . . . . . . . . . . . . . . . . . . . . . . . . . . . . . . . . . . . . . . . . . . . . . . . . . . . . . . . . . . . . . . . . . . . . . . . . . . . . 26
Table 4
Summary of prioritised environmental and socio-economic issues in the Yellow Sea region. . . . . . . . . . . . . . . . . . . . . . . . . . . . . . . . . . . . . . . . . . . . . . . . . . . . . . . . . . . . . . . . . . . . 37
Table 5
Summary of the causal chain analysis for the Yellow Sea region. . . . . . . . . . . . . . . . . . . . . . . . . . . . . . . . . . . . . . . . . . . . . . . . . . . . . . . . . . . . . . . . . . . . . . . . . . . . . . . . . . . . . . . . . . . . . . . 44
List of boxes, Yellow Sea
Box 1
Major socio-economic and human activity centres in the Yellow Sea region. . . . . . . . . . . . . . . . . . . . . . . . . . . . . . . . . . . . . . . . . . . . . . . . . . . . . . . . . . . . . . . . . . . . . . . . . . . . . . . . . . . 22
Box 2
The South-North Water Diversion Programme in China. . . . . . . . . . . . . . . . . . . . . . . . . . . . . . . . . . . . . . . . . . . . . . . . . . . . . . . . . . . . . . . . . . . . . . . . . . . . . . . . . . . . . . . . . . . . . . . . . . . . . . . . 27
List of figures, Bohai Sea
Figure 1
Boundaries of the Bohai Sea region. . . . . . . . . . . . . . . . . . . . . . . . . . . . . . . . . . . . . . . . . . . . . . . . . . . . . . . . . . . . . . . . . . . . . . . . . . . . . . . . . . . . . . . . . . . . . . . . . . . . . . . . . . . . . . . . . . . . . . . . . . . . 52
Figure 2
Yellow River on Quinghai Plateau, China.. . . . . . . . . . . . . . . . . . . . . . . . . . . . . . . . . . . . . . . . . . . . . . . . . . . . . . . . . . . . . . . . . . . . . . . . . . . . . . . . . . . . . . . . . . . . . . . . . . . . . . . . . . . . . . . . . . . . . . 55
Figure 3
Population density in the Bohai Sea region. . . . . . . . . . . . . . . . . . . . . . . . . . . . . . . . . . . . . . . . . . . . . . . . . . . . . . . . . . . . . . . . . . . . . . . . . . . . . . . . . . . . . . . . . . . . . . . . . . . . . . . . . . . . . . . . . . . . 56
Figure 4
Flood prone areas along the main rivers in the Yellow Sea and Bohai Sea regions. . . . . . . . . . . . . . . . . . . . . . . . . . . . . . . . . . . . . . . . . . . . . . . . . . . . . . . . . . . . . . . . . . . . . . . . . . . . . . 57
Figure 5
Total catch in the Bohai Sea, 1995-1999. . . . . . . . . . . . . . . . . . . . . . . . . . . . . . . . . . . . . . . . . . . . . . . . . . . . . . . . . . . . . . . . . . . . . . . . . . . . . . . . . . . . . . . . . . . . . . . . . . . . . . . . . . . . . . . . . . . . . . . . 66
Figure 6
Catch per unit effort in the Bohai Sea. . . . . . . . . . . . . . . . . . . . . . . . . . . . . . . . . . . . . . . . . . . . . . . . . . . . . . . . . . . . . . . . . . . . . . . . . . . . . . . . . . . . . . . . . . . . . . . . . . . . . . . . . . . . . . . . . . . . . . . . . . 66
Figure 7
Causal chain diagram illustrating the causal links for habitat and community modification and freshwater shortage in the Bohai Sea region. . . . . . . . . . . . . . . . . 70
Figure 8
Oil drilling in the Bohai Sea. . . . . . . . . . . . . . . . . . . . . . . . . . . . . . . . . . . . . . . . . . . . . . . . . . . . . . . . . . . . . . . . . . . . . . . . . . . . . . . . . . . . . . . . . . . . . . . . . . . . . . . . . . . . . . . . . . . . . . . . . . . . . . . . . . . . 71
Figure 9
Causal chain diagram illustrating the causal links for unsustainable exploitation of living resources in the Bohai Sea region.. . . . . . . . . . . . . . . . . . . . . . . . . . . . . . . . . . 72
List of tables, Bohai Sea
Table 1
Scoring table for the Bohai Sea region. . . . . . . . . . . . . . . . . . . . . . . . . . . . . . . . . . . . . . . . . . . . . . . . . . . . . . . . . . . . . . . . . . . . . . . . . . . . . . . . . . . . . . . . . . . . . . . . . . . . . . . . . . . . . . . . . . . . . . . . . . 61
Table 2
Summary of environmental and socio-economic impacts of the prioritised GIWA concerns and issues in the Bohai Sea region. . . . . . . . . . . . . . . . . . . . . . . . . . . . . . . . . 68
Table 3
Summary of the causal chain analysis for the Bohai Sea region. . . . . . . . . . . . . . . . . . . . . . . . . . . . . . . . . . . . . . . . . . . . . . . . . . . . . . . . . . . . . . . . . . . . . . . . . . . . . . . . . . . . . . . . . . . . . . . . . 74
14
GIWA REGIONAL ASSESSMENT 34 YELLOW SEA


Regional defi nition
YELLOW SEA
This section describes the boundaries and the main physical and
Yalu River (Yalujiang) and its associated coastal and marine habitats
socio-economic characteristics of the region in order to defi ne the
around its river mouth located in the northern part of the region;
area considered in the regional GIWA Assessment and to provide
Coastal river basins in the Liaodong Peninsula, which drain partially
suffi
cient background information to establish the context within
into the northern portion of the Yellow Sea (and partially to the
which the assessment was conducted.
Bohai Sea);
Coastal river basins in the Shandong Peninsula, which partially
drain into the middle and southern portions of the Yellow Sea
(and partially into the Bohai Sea);
Boundaries of the region
The Huai River Basin, which includes Hongze Lake (Honzehu) and
Chao Lake (Chaohu);
The GIWA region Yellow Sea covers the following sea, river basins,
Yongsan River (Yongsan-gang), Taedong River (Taedong-gang),
watersheds and their associated coastal and marine habitats (Figure 1):
Imjin River (Imjin-gang), Han River (Han-gang) and Kum River
Yellow Sea proper and its associated islands, coastal and off shore
(Kum-gang) and their basins along the west coast of the Korean
areas;
Peninsula, which drain into the Yellow Sea.
Elevation/
Depth (m)
Xiliao He
Xar Moron He
Jilin
4 000
2 000
1 000
Fushun
500
Shenyang
Lua
e
n
100
Baotou
H
H
Huhot
Anshan
e
Liaoning
oia
0
L
-50
Nei Mongol
Beijing
Sup'ung (Shuifeng)
Y
Beijing
Sanggan He ongaing He
Sinuiju
-200
Tangshan
Yinchuan
-1 000
North Korea
Tianjin
Dalian
-2 000
Tianjin
P'yongyang
Yellow
Xining
l
Gansu
Taiyuan
Shijiazhuang
a
Ningxia
B o h a i S e a
na
Kaesong
Cdn
Seoul
Lanzhou
Hebei
ra
Inch`on
China
Y
Shanxi
G
e
ll
South Korea
Qinghai Longyangxia
o
e
Shandong
w
Taejon
ei H
W
YellowJinan
Ch'ungju
Sanmenxia
Qingdao
Chonju
Yellow
Shaanxi
We
Y e l l o w S e a
i He
Zhengzhou
Kwangju
Xi'an
Luoyang
Wei He
Sichuan
Henan
Jiangsu
Anhui
ai He
Hu
i He
San He
gta
Huai
Don
He
0
500 Kilometres
© GIWA 2005
Figure 1
Boundaries of the Yellow Sea region
REGIONAL DEFINITION
15
The Yellow Sea is neighboured by the GIWA regions Bohai Sea to the
water mass in the Yellow Sea is in continuous circulation with those of
north and East China Sea to the south. China's two large rivers, the
the Bohai Sea and the East China Sea. Water circulation in the Yellow
Yellow River in the Bohai Sea region and the Yangtze River in the East
Sea is a basin-wide cyclonic gyre, which is comprised mainly of the
China Sea region are interconnected by the Yellow Sea region's Huai
Yellow Sea Warm Current and the Yellow Sea Coastal Current. The Yellow
River and its tributaries, and thus, the Huai River Basin.
Sea Warm Current is a branch of the Tsushima Warm Current from the
Kuroshio Current, which comes from the East China Sea carrying
Three riparian states, the People's Republic of China (China), the
relatively high salinity (>33) and high-temperature (>12°C) water
Democratic People's Republic of Korea (North Korea) and the Republic
fl owing northward along the 124° E meridian and then eastward into
of Korea (South Korea), border the Yellow Sea. The Huai River Basin on the
the Bohai Sea in the winter (Figure 2). This current, together with the
Chinese side of the region occupies a total area of 174 000 km2, about 5%
southward fl owing Yellow Sea Coastal Current, plays an important role
of the land area of China and accommodates 230 million people, about
in the water exchange in this semi-enclosed Yellow Sea (Tang 2003).
18% of the nation's total (SEPA 2003a,b). The major lakes in the region
oiaL
include the Hongze Lake and Chao Lake in China while there are no
signifi cantly large natural lakes on the Korean side of the border.
Beijing
Sinuiju
Tangshan
Y
L
o
u
n
a
g
n
a
H
in
e
g H
Tianjin
e
B O H A I
Dalian
P'yongyang
S E A
North
Physical characteristics
KoreaKaesong
rand Canal
G
Inch`on
Yellow
The Yellow Sea
Sout
China
Y
Kore
The Yellow Sea is a semi-enclosed body of water bordering the
e
Jinan
l
l
o
w
Chinese mainland to the west, the Korean Peninsula to the east, and
Se
Qingdao
aW
a line running from the north bank of the mouth of the Yangtze River
Y
a
e
l
r
l
m
o
(Changjiang) to the south side of Cheju Island, covering an area of about
w
C
Y E L L O W u
S
r
e
r
a
e
S E A
400 000 km2. It has an average depth of 44 m, with most of its sea area
n
C
t
oas
shallower than 80 m (GEF/UNDP 2000, Tang 2003). It is connected to
tal
ongqu
Cu
the Bohai Sea to the north and to the East China Sea in the south, thus
r
uangai Z
rren
Subei G
t
forming a continuous circulation system among these three seas.
Figure 2
Currents in the Yellow and Bohai Sea.
The Yellow Sea receives a huge volume of sediments (around
(Source: Redrawn from Tang 2003)
1.6 billion tonnes annually) mainly from the Yellow River on its north
border and Yangtze River on its south border; both rivers forming large
deltas at their mouths. The biotic communities of the southeastern
The waters of the Yellow and Yangtze rivers fl ow across the continental
Yellow Sea are complex in terms of their species composition, spatial
shelf, discharging large quantities of sediments into the Okinawa
distribution, and community structure, possibly due to the Sea's
Trough; the rivers also form large deltas along their entrance to the
complicated oceanographic conditions. The faunal communities are
Bohai Sea and Yellow Sea, respectively. These river discharges peak in
composed of various taxonomical groups of warm and cold-water
the summer and have important eff ects on the salinity and hydrography
as well as cosmopolitan and amphi-pacifi c species. Yet the diversity
of the Yellow Sea. A monsoon regime prevails over this region and is the
and abundance of the fauna are comparatively low. All components
second force in driving biomass changes in the Sea, after fi shing.
of the biotic communities show marked seasonal variations. Turbidity
and sediment types appear to be the major parameters that aff ect the
During winter, the surface water temperatures in the Yellow Sea
distribution of planktonic and benthic organisms in the coastal waters
may decrease to the freezing point in the northern part, but with
of the Yellow Sea (Tang 1989, Zhang & Kim 1999).
temperatures gradually warming to the south (Figure 3) while during
summer, the water temperatures may rise to as high as 27-28°C
The central part of the Yellow Sea is called the Yellow Sea Basin and is
(Figure 4).
the major over-wintering ground for most fi sh and invertebrates. The
16
GIWA REGIONAL ASSESSMENT 34 YELLOW SEA
o
o
i
a
i
a
L
February
L
August
Beijing
Sinuiju
Beijing
Sinuiju
Tangshan
Y
L
Tangshan
o
u
Y
L
n
a
o
u
g
n
n
a
a
g
n
H
i
a
n
H
e
i
g
n
e
H
g
Tianjin
H
Tianjin
e
Dalian
e
Dalian
0
23
P'yongyang
P'yongyang
B O H A I 25
B O H A I
North
North
27
S E A
S E A
Korea
Korea
Kaesong
Kaesong
5
rand Canal
G
Inch`on
rand Canal
Inch`on
Yellow
Yellow
G
23
China
China
Jinan
South
Jinan
South
Korea
Qingdao
Korea
25
Qingdao
Y E L L O W S E A
Y E L L O W S E A
23
Temperature (°C)
Temperature (°C)
10
25
0
21
27
5
23
10
S
25
S
15
27
27
Figure 3
Surface temperature in Yellow Sea during February.
Figure 4
Surface temperature in Yellow Sea during August.
(Source: Lee et al. 1998 in Tang 2003)
(Source: Lee et al. 1998 in Tang 2003)
The primary productivity of the Yellow Sea varies from 68-320 gC/m2/year
as Chub mackerel (Pneumatophorus japonicus), Spanish mackerel
(GEF/UNDP 2002), and seems to vary widely depending on the location
(Scomberomorus niphonius) and Filefi sh (Stephanolepis cirrhifer) migrate
and seasons. The phytoplankton populations consist of mainly neritic
out of the Yellow Sea to the East China Sea in winter. The Yellow Sea
diatoms, dominated by species such as the Skeletonema costatum,
is one of the most intensively exploited areas in the world. About 100
Coscinodiscus sp., Melosira sulcata and Chaetoceros sp. The diatom
species of fi sh and crustaceans are commercially harvested. Among
blooms occur during late winter to early spring, and summer to early
the commercially important species are Fleshy prawn (Penaeus sp.),
autumn, concentrating along coasts of Liaoning, Shandong and Jiangsu
Southern rough shrimp (Parapaeneopsis sp.) and Japanese squid
provinces. The average phytoplankton biomass in the northern region
(Loligo japonicus). Due to overexploitation and natural fl uctuations
and the southern region of the Yellow Sea is 2.4 million cells/m3 and
in recruitment, some of the larger-sized and commercially important
950 000 cells/m3, respectively (GEF/UNDP 2000, Tang 2003).
species have been replaced by smaller, less valuable, forage fi sh (Tang
& Jin 1999). Pacifi c herring (Clupea harengus pallasi) and Chub mackerel
Fishery resources
(Pneumatophorus japonicus) became dominant in the 1970s. Anchovy
There are about 280 species of fi sh, which make up the main living
(Thrissa mystax) and Scaled sardine (Harengula zunasi), smaller-bodied
resource of the Yellow Sea. About 46% of these fi sh species are
and economically less profi table, increased in the 1980s and took a
temperate with 45% and 9% belonging to the warm-water and cold-
prominent position in the ecosystem. The Japanese anchovy (Engraulis
temperate species, respectively. The overall diversity and abundance of
japonicus) is presently believed to be the most abundant species in the
fi sh resources in the Yellow Sea are generally lower than those found in
Yellow Sea, with a potential catch of 0.5 million tonnes a year (Tang &
the East China Sea and South China Sea (Tang 2003).
Jin 1999). It appears that uncontrolled fi shing or overexploitation has
aff ected the self-regulatory mechanism of the Yellow Sea ecosystem.
The region is an important global resource for coastal and off shore
fi sheries and has well-developed multi-species and multinational
River basins
fi sheries (Tang 2003). Fish species found in the near-shore bays
The major rivers discharging directly into the Yellow Sea include Huai
and estuaries include Ocellate spot skate (Raja kenojei), Greenling
River and Yalu River in China; and Yongsan River, Taedong River, Imjin
(Hexagrammos otakii), Black snapper (Lutjanus sp.), Scaled sardine
River, Han River and Kum River along the west coast of the Korean
(Harengula zunasi) and Spotted sardine (Clupanodon punctatus).
Peninsula.
These fi sh move to deeper waters in winter. Other species such
REGIONAL DEFINITION
17
Chinese side of the region
excavated along the lower reaches of Huai River and its network of
Huai River
tributaries (e.g. Yi, Shu and Si rivers) to increase the carrying capacity
The Huai River fl ows south of the Yellow River through the Henan, Anhui
of the River Basin to 23 000 m3/s, which is three times as much as that
and Jiangsu provinces, draining the North China Plain between the
of the original. Also, 13 fl ood storage and retardation basins with a
Yellow River and the Yangtze River. It is 1 100 km long and drains an area
storage capacity of 28 billion m3 were completed in the 1960s, which
of 174 000 km2. The Huai River fl ows eastward through a very fl at plain
had helped to relieve the problems of fl ooding in the Huai River Basin
into Hongze Lake in Jiangsu Province, and from there it drains through
(Zhang & Wen 2003).
many small channels into the Yangtze River (Zhang & Wen 2003).
Nowadays, the main stream of the middle reaches of Huai River can
The Huai River Basin, a major river basin in the region, is one of the major
withstand fl oods as high as the 1954 fl ood (the highest since 1949,
fl ood-prone areas in China (Figure 5). The river basin has a mean annual
corresponding to a 40-year return period) if it is jointly operated with
run-off of 61.1 km3. The main reason for fl ood disasters is that the river
the fl ood storage and retardation basins. The lower Huai River can resist
system was destroyed by the Yellow River levees, as far back as 1194,
a 50-year fl ood but to its main tributaries, the Yi, Shu and Si rivers, can
when large amounts of sediments from these levees were deposited
only withstand 10 to 20-year fl oods (Zhang & Wen 2003).
in the lower reach of the Huai River. This is decreasing the discharge
capacity of the lower reaches of Huai River so that the River is no longer
Yalu River
able to release upstream fl ood fl ows. The lakes and depressions along
The Yalu River (Yalujiang), with a catchment of 62 630 km2, extends
the River were thus used for fl oodwater storage and fl ood retardation.
along the western boundary between China and North Korea and is
Consequently, the Huai River has changed its lower course and now
a transboundary river. The River fl ows from a temperate deciduous
fl ows into the Yangtze River (Zhang & Wen 2003).
forest source (1 500-2 500 m above sea level) through extensive areas
of agricultural land. It discharges into the Yalu River estuary on the
There are about 195 man-made large- and medium-sized reservoirs
northeast Yellow Sea coast. The Yalu River estuary comprises a main
located along the Huai River Basin, which could store a total of 23 km3 of
channel and a secondary channel, the latter being silted and with little
fl oodwater. Apart from these reservoirs, more than 50 000 km of levees
water fl ow. The estuary is generally well-mixed as a result of a semi-
were built or heightened as well as more than 20 large river channels
diurnal tide (range up to 5 m), with strong tidal currents (1.5-2.0 m/s),
which may aff ect the river waters up to 40 km inland. High turbidity
may extend up to 10 km in the upper estuary, and the total suspended
Flood-prone areas
load in the estuary can be as high as 1 000 mg/l. The estuary is shallow
Xiliao He
Xar Moron He
(<5-10 m depth range). The long-term discharge rates of Yalu River
Mongolia
averaged to 1 200 m3/s or 40 km3/year. The River's sediment load
Fushun
Shenyang
Lua
is relatively low (about 5 million tonnes/year) and concentrations
e
n He
Baotou
H
Huhot
Anshan
oiaL
of suspended matter are also often low (down to 5-10 mg/l). In the
Y
Beijing
Sanggan He ongaing He
Sinuiju
dry season, the River's nutrient profi le is relatively stable, refl ecting
China
Tangshan
North Korea
Tianjin
Dalian
groundwater and tributary inputs in the upper reaches of the River
P'yongyang
l
Taiyuan
Shijiazhuang
an
and urban/industrial waste loading from the lower reaches. Heavy
a
Kaesong
Cd
Seoul
nra
Inch`on
summer rainfall and the resultant fl ood fl ow probably results in strong
Y
G
e
ll
South Korea
o
e
w
leaching of nutrients from agricultural lands (Crossland & Crossland
Taejon
ei H
W
Yellow Jinan
Ch'ungju
Qingdao
Chonju
2000, Wikipedia 2004a).
Zhengzhou
Kwangju
Luoyang
Korean side of the region
ongqu
Most of the major rivers in the Korean Peninsula fl ow into the Yellow
uangai Z
Subei G
Sea, draining the western and southern slopes of the Peninsula. The
basin areas and total lengths of these rivers are shown in Table 1. The
© GIWA 2005
discharge of these rivers fl uctuates greatly due to the summer monsoon.
Figure 5
Flood prone areas along the main rivers in the Yellow
In the summer, rivers swell with heavy rainfalls, often fl ood valley plains.
and Bohai seas regions.
(Source: Zhang & Wen 2003)
In other seasons when the weather is relatively dry, the water level drops
18
GIWA REGIONAL ASSESSMENT 34 YELLOW SEA
Table 1
Major rivers in the Korean Peninsula draining into the
travels southward, resulting in dry and cold winter in the region. During
Yellow Sea.
summer, the monsoon wind blows into China from the ocean, bringing
River
Basin area (km2)
Length (km)
in warm and wet air currents and rain. The annual precipitation in the
Han *
34 473
481.7
Huai River Basin is around 800-900 mm, which is lower than areas in
Keum
9 810
395.9
southwest China (over 2 000 mm) but higher than areas in the northeast
Yongsan
3 371
136.0
China and along the North China Plain, where rainfall averages around
Ansung
1 700
66.4
Mankyung
1 571
74.1
400-800 mm (Zhang & Wen 2003, Wikipedia 2004b).
Sapkyo
1 612
58.6
Dongjin
1 000
40.9
The climate of Korea is characterised by four distinct seasons: spring,
Note: * Including the portion in North Korea.
summer, autumn and winter. Winter is bitterly cold and is infl uenced
(Source: MOE 1996)
primarily by the Siberian air mass. Summer is hot and humid due to the
to very low levels and much of the riverbed is exposed. Typhoons hit
maritime infl uence from the Pacifi c High. The transitional seasons, spring
the southern part of the Peninsula once every two or three years and
and autumn, are sunny and generally dry. The variation in annual mean
they bring heavy rainfalls in late summer and early autumn. The largest
temperature ranges from 10°C to 16°C, except for the mountainous areas.
river in South Korea from the perspective of basin area size and river
August is the hottest month with the mean temperature ranging from
discharge volume is the Han River (Han-gang). It has a basin area of
20°C to 26°C. January is the coldest month with the mean temperature
34 473 km2 (including the portion in North Korea) and an annual run-
ranging from -5°C to 5°C. The annual precipitation averages about
off volume of 27.7 km3, which constitutes 26% and 28%, respectively, of
1 500 mm in the central region. More than a half of the total rainfall
the nation's total run-off (MOE 1996).
amount is concentrated in the summer, while precipitation in winter is
less than 10% of the total precipitation (Asianinfo 2004).
The major characteristics of Korean rivers, most of which drain into the
Yellow Sea, are:
The prevailing winds are southeasterly in summer, and northwesterly in
River reaches are relatively short and channel slopes are relatively
winter. The winds are stronger in winter, from December to February,
steep. The river reaches are short and drainage areas are small in
than those of any other season. The land-sea breeze becomes dominant
Korea compared with other major continental rivers. The channel
with a weakened monsoon wind in the transitional months, September
slopes are relatively steep upstream because of steep mountains
and October. The relative humidity is the highest in July, at about 80-
and deep valleys in the uplands.
90% and is the lowest in January and April, averaging between 30-50%.
Floods occur quickly and peak fl ood discharges are enormous.
The monsoon front approaches the Korean Peninsula from the south in
Due to the topographical conditions and torrential rainfalls, the
late June, and moves gradually to the north. Signifi cant rainfall occurs
hydrographs of rivers in Korea are very sharp and peak fl ood
when a stationary front lies over the Korean Peninsula. There are about 28
discharges are enormous compared with other comparable rivers
typhoons in the western Pacifi c each year, of which two or three approach
on the continent.
the Korean Peninsula from June through September (Asianinfo 2004).
Flow variations are high. The coeffi
cients of Korean river regimes,
expressed by maximum discharge over minimum discharge, usually
The distribution of precipitation on the Korean Peninsula is mainly
range from 100 up to 700. This large variation in the fl ow discharge
aff ected by orography. The southern coastal and adjacent mountain
causes serious problems in river management of fl ood control and
regions have the largest amount of annual precipitation, over 1 500 mm.
water use.
The sheltered upper Yalu River Basin in the northern region, on the
other hand, experiences less than 600 mm of rainfall. Since most of the
Climate
precipitation is concentrated in the crop-growing areas in the south,
The climate on the Chinese side of the region, like other areas in
the water supply for agriculture is normally adequate. Even though
northeastern China, is under the infl uence of the Eastern Asia monsoon;
the annual mean precipitation is more than 1 200 mm, however, Korea
monsoon winds, which are caused by diff erences in the heat-absorbing
often experiences droughts due to the large fl uctuation and variation
capacity of the continent and the ocean (Zhang & Wen 2003, Wikipedia
of precipitation, making the management of water resources diffi
cult
2004b). The monsoon starts in September-October and ends in March-
(Asianinfo 2004).
April the following year. During winter the monsoon wind from Siberia
and the Mongolian Plateau blows into China and decreases in force as it
REGIONAL DEFINITION
19
General land forms
humid winds from the Pacifi c Ocean and dry winds from the interior. This
The Korean Peninsula extends for about 1 000 km southward from the
makes the North China Plain prone to both fl oods and droughts. Finally,
northeast part of the Asian continental landmass. The west coast of the
the fl atness of the North China Plain creates massive fl ooding when the
Peninsula is bordered by the Korea Bay to the north and the Yellow Sea
river's various fl ood control structures are damaged. In the opinion of
to the south; the east coast is bordered by the Sea of Japan. The 8 640 km
many historians these factors have encouraged the development of a
coastline of the Peninsula is highly indented. Some 3 580 islands lie
centralised Chinese state to manage granaries, manage hydraulic works,
adjacent to the Peninsula and most of them are found along the south
and man fortifi cations against the steppe peoples (Wikipedia 2004b).
and west coasts (Asianinfo 2004).
Biodiversity
The northern land border of the Korean Peninsula is formed by the Yalu
Approximately 1 600 species have been reported from marine and
and Tumen rivers, which separate Korea from the provinces of Jilin and
coastal habitats on the Korean side of the region. These include
Liaoning in China. The original border between the two Korean states
70 species of phytoplankton, 300 benthic diatoms, 300 marine algae,
was the 38th latitude. After the Korean War, the Demilitarised Zone (DMZ)
50 halophytes, 500 marine invertebrates, 150 fi shes, 230 water birds and
formed the boundary between the two Koreas. The DMZ is a heavily
10 marine mammals (GEF/UNDP 2000). Several species of endangered
guarded, 4 000 m wide strip of land that runs along the line of cease-fi re,
marine mammals such as the Spotted seal (Phoca largha), Black
from the east to the west coasts for a distance of 241 km (238 km of that
right whale (Eubalaena glacialis), Whitefi n dolphin (Lipotes vexillifer),
line form the land boundary with North Korea) (FAO-AQUASTAT 2004).
Kurile harbour seal (Phoca kurilensis), and Japanese sea lion (Zalophus
clifornianus japonicus) live in the region; the Striped dolphin (Stenella
The total land area of the Korean Peninsula, including the islands, is
coeruleoalba, northwest Pacifi c stock) is believed to be exploited beyond
220 847 km2. Some 44.6% (98 477 km2) of this total, excluding the area
sustainable yield (GEF/UNDP 2000).
within the DMZ, constitutes the territory of the South Korea. The largest
island, Cheju, lies off the southwest corner of the peninsula and has a
The Yellow Sea has specifi c oceanographic conditions unique for a semi-
land area of 1 825 km2. Other important islands include Ullung in the East
enclosed sea, which include the warm-temperate marine ecosystem
Sea and Kanghwa Island at the mouth of the Han River. Although the
with coastal ice covers formed in the winter, along with clear seasonal
eastern coastline of South Korea is generally unindented, the southern
changes in biotopes. It is, therefore, anticipated that endemism of
and western coasts are jagged and irregular. The diff erence is caused by
benthic invertebrates might be high; however, the diversity of endemic
the fact that the eastern coast is gradually rising, while the southern and
species has not been well studied, nor has the rate of loss of species
western coasts are subsiding (Asianinfo 2004).
diversity (NEPA 1994). There are no data on introduced species in the
Yellow Sea. Little study has been made of genetic diversity (Choi pers.
The Chinese side of the region falls within the North China Plain, formed
comm.).
from deposits from the Yellow River. It is the largest alluvial plain of the
eastern Asia. The plain is bordered on the north by the Yen mountain
Many marine animals such as Spotted seal (P. largha), Herring (Clupes
range and on the west by the Taihang mountain range. To the south it
harengus), Pacifi c cod (Gadus macrocephalus), Blue mussel (Mytilus
merges into the Yangtze River plain and from northeast to southeast it
edulis), Abalone (Haliotis discushannai), Sea snake (Ophiura sarsii) and
fronts the Bohai Sea, the highlands of the Shandong Peninsula and the
other species of the temperate zone feed and breed in the Sea. The
Yellow Sea. The plain covers an area of about 409 500 km2, most of which
main threat to these coastal habitats is land reclamation, especially in
is less than 50 m above sea level. This fl at yellow-soil plain is the main
estuaries and shallow bays. During the past few decades, many sites have
area of kaoliang, millet, maize and cotton production in China. Wheat,
been reclaimed, resulting in the loss of approximately 25% of the total
sesame seed, peanuts and tobacco are also grown there. The plain is
tidal fl ats in the region. The waste materials and pollutants from industrial
also one of the most densely populated region in the world (World Bank
complexes and cities located in along the coast, along with tourist visits
2003, Wikipedia 2004b).
to the coast also contribute to degrading habitats (GEF/UNDP 2000).
In addition, the fertile soil of the North China Plain gradually merges with
Although the region is endowed with high species biodiversity, it has
the steppes and deserts of Central Asia, and there are no natural barriers
suff ered high levels of loss. For instance, around 80 species of birds are
between these two regions. Although the soil of the North China Plain
classifi ed as threatened on both the Chinese and South Korean sides
is fertile, the weather is unpredictable, because it is at the intersection of
of the region (Baker 2002). The main threats are: (i) the introduction of
20
GIWA REGIONAL ASSESSMENT 34 YELLOW SEA
alien species that out-compete endemic species; (ii) habitat destruction;
Population density
(persons/km˛)
(iii) hunting; (iv) overexploitation; and (v) sometimes, deliberate
<1
extermination. Habitat destruction in the region is particularly signifi cant,
1-2
ng
lu Jia
3-5
Ya
arising from conversion to other uses, removal of vegetation or erosion,
Liaodong
6-10
Peninsula
North Korea
g
and/or fragmentation, in which habitat is reduced into areas too small to
11-100
edon
aT
P'yongyang
>100
support endemic species. In addition, future changes in global climate
Seoul
may further stress habitats in the region (Zarsky 2003).
Inch`on
South Korea
Qingdao
Shangdong
Taejon
To conserve biodiversity, the riparian countries of the region have
Peninsula
Chonju
adopted two approaches to conserving and restoring biodiversity. First,
Kwangju
they have attempted to protect fl agship threatened species such as the
China
East Asian tiger (Panthera tigris amoyensis), the Panda bear or Giant panda
ai He
e
Hu
gtai H
San He
Don
(Ailuropoda melanoleuca), and the common crane (Grus grus). Second,
Huai He
they have created networks of protected areas to maintain habitats. The
0
500
Kilometres
region has an extensive network of nature reserves of many diff erent
©
GIWA©
2005
Figure 6
Population density in the Yellow Sea region.
types and status, including biosphere reserves, world heritage sites,
(Source: ORNL 2003)
national parks, forest reserves and watershed reserves.
Nampo. People living in these large, urban areas are dependent on
The total protected area varies greatly between countries. Despite
the Yellow Sea as a source of marine resources for human nutrition,
current eff orts, many critical habitats for endangered plants and animals
economic development, recreation, and tourism (Zhiang & Wang
remain unprotected; and in some cases, protected areas are inadequate.
2000). Figure 6 shows the population density in the Yellow Sea region.
Moreover, some critical habitats cross national boundaries, yet protected
For more information on major socio-economic activitiy centres in the
areas either stop at the border or are managed diff erently by bordering
region see Box 1.
countries (Zarsky 2003). The habitat of the Siberian tiger (Panthera tigris
altaica), for example, extends across the borders of the Russian Far East,
Economic sectors
China and North Korea. There are only some cross border management
Fisheries
capacity and limited exchange of information through the eff orts
In the region, particularly in the Yellow Sea, fi sh stocks remained fairly
exerted by EABRN of UNESCO (Zarsky 2003).
stable during World War II. However, due to a great increase in fi shing
eff ort throughout the entire Yellow Sea, nearly all the major stocks were
One of the most signifi cant transboundary biodiversity issues is the
being heavily fi shed by the mid-1960s. Since then, the composition of the
threat to migratory species, especially birds. Birds migrate over a variety
fi sh catch has changed greatly and the catch-per-unit-square kilometre
of routes in and across Northeast Asia, respecting no national or political
has decreased to 2.3 tonnes in recent years (GEF/UNDP 2000).
boundaries, not even the tense DMZ between North and South Korea.
White-naped cranes, for example, have been tracked by satellite fl ying
The Yellow Sea is one of the most intensively exploited areas in the
from Izumi, Japan, to stopover points in South Korea, the DMZ, and North
world. The number of species commercially harvested amounts about
Korea, before fl ying on to Russia and China (Simard 1995).
100 including cephalopods and crustaceans. The abundance of most
species is relatively small, and only 23 species exceed 10 000 tonnes
in annual catch. These are the commercially important species and
account for 40 to 60% of the annual catch. Demersal species used
Socio-economic characteristics to be the major component of the resources and accounted for 65
to 90% of annual total catch. The resource populations of demersal
Population
species such as Small yellow croaker (Pseudosciaena polyctis) , Hairtail
The region is remarkably dense populated resulting in substantial
(Trichiurus haumela), Large yellow croaker (Pseudosciarna crocea), fl atfi sh
anthropogenic pressure. Approximately 110 million people live in the
(Pleuronectis sp.), and cod (Gadus sp.) declined in biomass by more than
region. Large cities in the region with 1 million or more of inhabitants
40% when fi shing eff ort increased threefold from the early 1960s to the
include Qingdao, Tianjin, Dalian, Seoul/Inchon, and Pyongyang/
early 1980s (CAFB 2003).
REGIONAL DEFINITION
21
Box 1
Major socio-economic and human activity centres in the Yellow Sea region.
Population centres (population
- Dalian and Qingdao to Middle East
Lianyungang (nuclear power plant
and foreign tourists for their sandy/
>1 million)
through Malacca Straits for crude oil
under construction, which may be
swimming beaches, Weihai and Penglai
- South Korea: Seoul, Inchon, Daejeon
shipping.
in operation between 2003-2004). In
for historical sites and beaches.
and Kwangju;
Aquaculture areas
South Korea, the industrial complexes
Major lakes and reservoirs
are mainly located in Inchon (steels
- North
Korea:
Pyongyang;
In South Korea, aquaculture is practiced
and automobiles), Kunsan (mainly
On the Korean side of the region, there
- China: Dandong, Dalian, Yantai,
in the shallow coastal waters along its
automobiles), Seosan (mainly
are no natural lakes and reservoirs of
Weihai, Qingdao, Lianyungang and
west coast; species cultured include
petrochemicals), Ansan (mechanicals
significant size but there are several
Rizhao.
shrimps, shellfish and seaweeds
and electronics) and Yaoung Kwan
large man-made reservoirs such as
(Porphyra spp.) in marine waters. In
(nuclear plant).
the Soyang, Paldang, Daechung and
Ports and shipping routes
China, large scale aquaculture farms
Yongsan. On the Chinese side, there
Major mining sites
The ports located along the coastal
for scallops and kelps (Laminaria spp.)
are two relatively large natural lakes,
areas bordering the Yellow Sea:
are found in the Sanggou Bay of the
Limestone mining along the Han
the Hongzehu in Jiangsu Province and
Shandong Peninsula; for scallops
River Basin as well as sand and gravel
Chaohu in Anhui Province; natural water
- South Korea: Inchon, Kun San and
around the Changshan Island of
mining in Inchon and Taean Peninsula
reservoirs include the Andi and Bashan
Mok Po;
Liaodong Peninsula; and for nouri
are common on the Korean side of the
in Shandong Province.
- North
Korea:
Nampo;
(Porphyra spp.), prawns and crabs in
Yellow Sea. In the Chinese side, the
Major fishing grounds
- China: Dalian, Qingdao, Rizhao and
Haizhou Bay of the Jiangsu Province.
mining activities include gold mining in
Major fishing grounds on the Korean
Lianyungang.
Industrial complexes (include power
Yantai; diamond mining (second largest
in China) in Yishu River basin; sand and
side of the region are located in the
The shipping routes found in the Yellow
plants)
gravel mining in Rizhao and Qingdao.
coastal waters around Taean (for crabs
Sea are as follows:
Major industrial complexes in China
and shrimps) and Icheon (for blue crabs
Major tourist sites
- Inchon - Qingdao;
are situated in Qingdao (beer brewery,
and shrimps). On the Chinese side,
ship building and repair, electronics,
Major tourist sites on the Korean side
the main fishing grounds are found
- Weihai - Dalian;
pharmaceuticals and power plants),
of the Yellow Sea are Inchon, Seoul,
in the coastal waters around Yanwei
- Inchon - Japan;
Dalian (ship building, sea food
Taeam Peninsula and Pyeong Yang.
(for Spanish mackerels, hairtails and
- Dalian - Inchon;
processing and textiles), Rizhao
On the Chinese side, the Dalian and
jellyfish), and Lusi and Lianqingshi,
(mainly manufacturing of cement) and
Qingdao areas are famous among local
mainly for anchovies.
- Pusan
-
Kunsan;
(Source: Zhiang & Wang 2000)
Overfi shing has also caused a decline in stock abundance for Red
(Solenus spp.), cockles (Cardium spp.), Short-necked clams (Venerupis
seabream (Pagrosomus major), Jew-fi sh (Otolithoides mijuy), Yellow
philippinarum), pearl oysters (Pinctada spp.), scallops (Pecten spp.)
croaker (Nibea albifl ora) and White croaker (Argyrosomus argenteus).
and Hard clams (Meretrix meretrix). The mariculture area in 1978 was
However, under the same fi shing pressure, the abundance of some
148 000 ha but increased to 540 000 ha in 1997. The yield of fresh meat
species such as cephalopods, skates, Dagger-tooth (Anotopterus
from bivalves was 200 000 tonnes, 44% of the total mariculture yield
pharaoh) and Pike-conger (Muraenesox lucioperca) appears to be
in 1978; in 1997 it was 300 000 tonnes. Others aquaculture species that
fairly stable. This may be due to their scattered distribution or their
grow successfully in the coastal areas of the region include: scallops
tolerant nature. Shifts in species dominance due to overfi shing in the
(Chlamys farreri, Pecten spp.), sea cucumbers (Stichopus japonicus,
Yellow Sea are striking. For instance, the dominant species in the 1950s
Stichopus spp.) and Large chinese shrimp (Penaeus orientalis). The most
and early 1960s were Small yellow croaker (P. polyctis) and Hairtail (T.
important cultivated seaweed in China is the brown variety (Laminaria
haumela), while Pacifi c herring (Clupea harengus pallasi) and Chub
japonica), also known as kelp, which was introduced from Hokkaido,
mackerel became dominant during the 1970s. Some smaller-bodied,
Japan. This cold-water kelp is now grown in more than 3 000 ha of
fast-growing, short-lived, and low-valued fi sh (e.g. Half-fi n anchovy
China's coastal waters, with a production of 10 000 tonnes per year
(Setipinna taty), anchovy and scaled-sardine) increased markedly about
in dry weight. Half of this is consumed directly and half is used for
1980 and have taken a prominent position in the ecosystem resources
extraction of alginates. There are 15 hatcheries on the north China
since. As a result of overfi shing, some larger-sized and higher trophic
coast, and the young plants are transferred to growing frames in the
level species were replaced by smaller-bodied and lower trophic level
Sea when the seawater temperature drops below 20°C. Brown kelp (L.
species, and the resources in the Yellow Sea declined in quality.
japonica) grows 3 m fronds at Qingdao and 5 m fronds at Dalian where
the water cools down more quickly in the autumn and the growing
Aquaculture
season is longer. The respective yields are 30 and 50 dry tonnes/ha/
On the Chinese side of the region, aquaculture, particularly the marine
year (CAFB 2003).
aquaculture, is commonly practiced in all the coastal provinces
bordering the Yellow Sea, with the most advanced practices in
On the Korean side of the region, the total yield of invertebrate
Shandong and Liaoning provinces. In both the Qingdao and Dalian
mariculture in 1997 was 301 873 tonnes representing 29.7% of the South
regions the same fi shery communes that culture invertebrates also
Korea's total mariculture production (more than 1 million tonnes) which
cultivate seaweeds. The major species of invertebrates cultured are
includes 200 973 tonnes of oysters (20%) and 63 572 tonnes of mussels
oysters (Ostrea spp.), mussels (Mytilus, Septifer, Brachydontes), razor clams
(6.3%) (MOMAF 1998). Major species of mariculture include oysters
22
GIWA REGIONAL ASSESSMENT 34 YELLOW SEA
(Ostrea spp.), mussels (Mytilus spp.), abalones (Haliotis discus hannai,
Bay Area covers an area of 1.86 million km2, 19.4% of the nation's total
H. discus, H. sieboldi, H. gigantean and H. japonica), Hard clam (Meretrix
area and with a population of 270 million, over 22% of the nation's total.
meretrix), Short-necked clam, Ark shell (Anadara broughtonii), Pen shell
The Bohai Bay Area sits in the centre of the Northeast Asian economic
(Atrina pectinata), and Hen clam (Mactra sulcataria). Seaweed is another
sphere. It has communication links with the Yangtze and Pearl river
important crop cultured commercially in the coastal areas of the Yellow
deltas, Hong Kong, Macao, Taiwan and the Southeast Asian countries to
Sea. Species of brown and red seaweeds cultured include Sargassum
the south, with South Korea and Japan to the east, and Mongolia, and
pallidum, Plocamium telfairiae, Pelvetia siliquosa and Bryopsis plumose. The
the Russian Far East to the north. The Bohai Bay Area is rich in mineral
Pelvetia siliquosa is found on the Shandong Peninsula, the Liaodong
resources, which are relatively evenly distributed and with favourable
Peninsula, and the Korean Peninsula. This species of seaweed grows
mining conditions. Statistics show that this area's reserves of iron, coal,
more luxuriantly in the Korean waters, and for hundreds of years the
petroleum, salt, natural gas and limestone account for 44, 40, 37, 50, 23
Koreans have exported large quantities of this seaweed to China. It was
and 16% of China's totals, respectively. The Liaohe Oilfi eld in Liaoning,
sold in North China markets under the name of deer-horn vegetable
the Dagang Oilfi eld in Tianjin and the Shengli Oilfi eld in Shandong
(CAFB 2003).
are important petroleum production bases for China. In recent years
progress has been made in off shore oil surveys in Bohai Bay, showing
Oil exploitation
that the exploitation of off shore oil has great potential. Shanxi is
Oil exploration has been successful in the Chinese and North Korean
abundant in raw coal, with its annual output accounting for 27% of the
portions of the Yellow Sea. In addition, the Sea has become more
nation's total (Zhiang & Wang 2000, MF 2003, CIA 2003).
important with the growth in trade among its bordering nations. The
main Chinese ports are Shanghai, Lu-ta, Tienjin, Qingdao, and Ch'in-
The Bohai Bay Area has well-developed agriculture, with 26.57 million ha
huang-tao. The main port in South Korea is Inch'on, the outport of
of cultivated area, over one-fourth of China's total. Its grain yield
Seoul; and that for North Korea is Namp'o, the outport for P'yongyang
accounts for more than 23% of the nation's total. In addition, the
(Zhiang & Wang 2000).
output of oil-bearing crops, aquatic products, pork, beef and mutton
also constitute substantial percentages of the nation's total. Shandong,
Tourism
Hebei and Liaoning provinces are China's important production and
Tourism is an industry in its infancy in the region. Several sites of
supply bases for agricultural and sideline products. The Inner Mongolia
picturesque beauty around the coastlines of these countries have
Autonomous Region is the largest animal husbandry production base in
been promoted as tourist attractions. As access to China and Korea has
China. In addition, the Bohai Bay Area has a solid industrial foundation,
become easier for foreign visitors, the tourist industry has expanded
where heavy and chemical industries are especially prominent. Some
in recent years. The Karst coast near Dalian, the granite mountains of
large-sized enterprises, such as the Anshan Iron and Steel Company in
the western Liaoning coast in China, and the islands and swimming
Liaoning, Capital Iron and Steel Company in Beijing, Taiyuan Iron and
beaches of South Korea, in particular Cheju Island, have become the
Steel Company in Shanxi, and Baotou Iron and Steel Company in Inner
most frequented tourist spots in the region (Zhiang & Wang 2000,
Mongolia, are located in this area. The Beijing Yanshan Petrochemical
Asianinfo 2004).
Group and Tianjin Bohai Chemical Group are China's two leading
petrochemical enterprises. In addition, Shenyang's heavy machinery
Economic characteristics
and precision machine tool building industry, Beijing and Tianjin's
The Chinese side of the region forms part of the Bohai Bay Area, which
electronic products and automobile industries, Shijiazhuang's cotton
includes provinces around the Bohai Sea and Yellow Sea. In 1995, the
spinning, Hohhot's wool spinning and Taiyuan's mining machinery
GDP of the region accounted for about 139 billion USD which constituted
industries are all well known in China (Zhiang & Wang 2000).
around 19.9% of the national GDP during the same period. Fisheries
products in the same year contributed to around 33% of the total national
After the reform and opening to the outside world China is being
production value, or around 9 billion USD (Zhiang & Wang 2000).
expanded in depth and breadth and the pace of economic
development in the Bohai Bay Area has been quickened. Currently it
In 1994, the Chinese government formulated the key points of the
is the engine of economic development in North China, and the area
Programme for Economic Development of the Bohai Bay Area up to
that has registered the third greatest economic growth, following the
the year 2000, and extended the economic development area to Shanxi
Pearl and Yangtze deltas. In the future, the Bohai Bay Area will take full
Province and the Inner Mongolia Autonomous Region. Thus, the Bohai
advantage of advanced communications, the large number of large and
REGIONAL DEFINITION
23
medium-sized cities, its strong contingents of scientifi c and technical
Legal and institutional framework
personnel and wealth of natural resources (MF 2003).
The Yellow Sea is an international water body and many of its problems
can be solved only through international cooperation. It is therefore
North Korea is a socialist country that has a centralised, planned, and
imperative that the coastal nations should realise the importance of
primarily industrialised command economy. The principal means of
regional cooperation. There are currently several agreements for bilateral
production are owned by the state through state-run enterprises
regulation or development of the Yellow and East China Seas, but none
or cooperative farms. Prices, wages, trade, budget, and banking are
of them are binding on all the coastal nations; nor is any nation a party
placed under strict government control. The growth rate in 1984-1990
to all the agreements. This means that there is insuffi
cient consultation
averaged about 3% annually. The GNP in 1991 was 22.9 billion USD, or
among the coastal nations. In addition, many of the existing national
1.04 USD per capita. Withdrawal of Soviet aid in 1991 negatively aff ected
management policies or bilateral management programmes for the
the economy (CIA 2003). The country's principal crops include rice, corn,
region have been designed and carried out with insuffi
cient attention
potatoes, soybeans, and pulses, the production of which is largely self-
to the transnational nature prevailing in the region, particularly its major
suffi
cient, although food shortages have been reported. The growth in
water body, the Yellow Sea (Kim 1998, Haas 1998).
agriculture, forestry, and the fi sheries sector accounted to 2.8% in 1991;
an increase in rice and other crops off set the decrease in fi sh products.
Cooperation among the countries in the region is possible only when
The machine industry, military products, electric power, chemicals,
each nation is convinced that it will gain more from cooperation than it
mining, metallurgy, textiles, and food processing constitute the main
would without it. However, China, South Korea and North Korea already
industrial sectors of the country. Manufacturing concentrates on heavy
cooperate in many regional initiatives such as the Northwest Pacifi c
industry; the ratio of heavy to light industry in 1990 was 8:2. In 1991
Action Plan (NOWPAP), the Tumen River Area Development Programme
oil imports fell 25%, coal production 6.5%, and electricity generation
(TRADP), the Asia-Pacifi c Economic Cooperation Forum (APEC),
5.2%. Shortages in oil, coal, and electricity in 1991 led to idled plants
Fisheries Marine Resources Conservation Working Groups, and the GEF/
and a 13.4% decrease in manufacturing output. The labour force was
UNDP/IMO East Asian Seas project (Kim 1998). These already existing
estimated at about 11.2 million people in mid-1990 (CIA 2003).
institutional structures will play a crucial role by providing umbrella
agreements between the countries. The international programmes
South Korea has achieved an incredible record of growth and
and initiatives as well as the specifi c laws related to the environmental
integration into the high-tech modern world economy. Three decades
management in the region are provided in Annex III and IV. These
ago, the GDP per capita was comparable with levels in the poorer
initiatives address the management of water-related environmental
countries of Africa and Asia. Today the country's GDP per capita is
issues and problems. They form a strong institutional framework; they
18 times of the North Korea's and equal to the lesser economies of the
themselves as well as in cooperation with the international and regional
European Union. This success through the late 1980s was achieved by
agencies/organisations play vital roles in ensuring the environmental
a system of close government/business ties, including directed credit,
well-being of the region.
import restrictions, sponsorship of specifi c industries, and a strong
labour eff ort. The government promoted the import of raw materials
The management of the Yellow Sea is especially complicated in that it
and technology at the expense of consumer goods and encouraged
is surrounded by nations that share some historical and cultural aspects
savings and investment over consumption. The Asian fi nancial crisis
but diff er in political systems, political and economic alignment, and
of 1997-1999 exposed longstanding weaknesses in South Korea's
levels of economic development. There are several agreements for
development model, including high debt/equity ratios, massive foreign
bilateral regulation or development of the Yellow Sea Large Marine
borrowing, and an undisciplined fi nancial sector. Growth plunged to a
Ecosystem, however none of them are binding on all the nations and
negative 6.6% in 1998, and then strongly recovered to 10.8% in 1999 and
nor is any nation a party to all the agreements. In addition, many of
9.2% in 2000. Growth fell back to 3.3% in 2001 because of the slowing
the existing national management policies or bilateral management
global economy, falling exports, and the perception that much-needed
programme for the region have been designed and carried out with
corporate and fi nancial reforms had stalled. Led by consumer spending
insuffi
cient attention to transnational issues (Haas 1998, Kim 1998).
and exports, growth in 2002 was an impressive 6.2%, despite anaemic
global growth, followed by moderate 2.8% growth in 2003. In 2003 the
six-day work week was reduced to fi ve days (CIA 2003).
24
GIWA REGIONAL ASSESSMENT 34 YELLOW SEA
Assessment
YELLOW SEA
Table 2
Scoring table for the Yellow Sea region.
This section presents the results of the assessment of the impacts
Assessment of GIWA concerns and issues according
The arrow indicates the likely
of each of the fi ve predefi ned GIWA concerns i.e. Freshwater
to scoring criteria (see Methodology chapter).
direction of future changes.
T
T
C
C
Increased impact
A
A
0 No
known
impact
2 Moderate
impact
shortage, Pollution, Habitat and community modifi cation,
IMP
IMP
T
T
No changes
C
C
A
A
1 Slight
impact
3 Severe
impact
Unsustainable exploitation of fi sh and other living resources,
IMP
IMP
Decreased impact
Global change, and their constituent issues and the priorities
a
c
t
s
i
t
y
n
t
a
l
p
c
t
s
u
*
*
identifi ed during this process. The evaluation of severity of each
Yellow Sea
e
n
m
m
i
c
i
m
m
n
Score
m
impa
o
issue adheres to a set of predefi ned criteria as provided in the
c
t
s
o
c
t
s
r
i
t
y
***
v
i
r
o
n
e
r
c
o
e
alth
h
erall
r
i
o
chapter describing the GIWA methodology. In this section, the
En
impa
Ec
H
Ot
impa
Ov
P
Freshwater shortage
2.6*
1
1
2
1.3
5
scoring of GIWA concerns and issues is presented in Table 2.
Modification of stream flow
3
Pollution of existing supplies
3
Changes in the water table
2
Pollution
1.9*
3
1
2
T
1.9
3
C
A
Microbiological pollution
2
Freshwater shortage
IMP
Eutrophication
3
Chemical
1
In China, although the Yangtze River and Yellow River together possess
Suspended solids
1
a huge water reserve totalling to 2 800 km3, the uneven distribution of
Solid waste
2
Thermal 1
water reserves has created severe shortages in areas within the country
Radionuclide
0
(SEPA 2003a,b). In the densely populated southern China, a relatively
Spills
1
abundant water supply has been provided by the Yangtze River and
Habitat and community modification
3.0*
1
2
3
2.1
2
Pearl river basins. The Yellow Sea and Bohai Sea regions, that account for
Loss of ecosystems
3
Modification of ecosystems
3
60% of China's land mass and half of the country's population, receive
Unsustainable exploitation of fish
2.6*
1
3
2
2.2
1
only 20% of the nation's water resources. This results in a severe shortage
Overexploitation of fish
3
of freshwater in this part of China. The situation of freshwater shortage in
Excessive by-catch and discards
1
northern China is further aggravated by serious soil erosion, deforestation,
Destructive fishing practices
3
Decreased viability of stock
1
land conversion, excessive water usage for agricultural production and
Impact on biological and genetic diversity
2
conversion of wetlands along lake shores into rice fi elds (SEPA 2003a,b).
Global change
1.4*
1
2
2
1.6
4
Compared to the Chinese side, the situation of freshwater shortage on the
Changes in hydrological cycle
2
Korean side of the region is in general less serious (Asianinfo 2004).
Sea level change
1
Increased UV-B radiation
0
Changes in ocean CO source/sink function
0
2
Environmental impacts
*
This value represents an average weighted score of the environmental issues associated
to the concern. For further details see Detailed scoring tables (Annex II).
Modifi cation of stream fl ow
** This value represents the overall score including environmental, socio-economic and
Modifi cation of stream fl ow in the major rivers on both the Chinese
likely future impacts. For further details see Detailed scoring tables (Annex II).
*** Priority refers to the ranking of GIWA concerns.
and Korean sides of the region has reduced the discharge of water into
ASSESSMENT
25
the Yellow Sea. This has changed the environment and water quality
Table 3
National quality standards for surface water in China.
of the Yellow Sea, aff ecting marine resources and coastal habitats in
Water Quality Classification 1
Parameter
the region. The transboundary implications are signifi cant. Main river
I
II
III
IV
V
basins or systems that contribute to the sources of freshwater supplies
pH
6.5-8.5
6.5-8.5
6.5-8.5
6.5-8.5
6-9
in the region include those associated with the Huai River (Huaihe),
Sulphate (mg/l)
< 250
250
250
250
250
Chloride (mg/l)
< 250
250
250
250
250
Yalu River (Yalujiang), Han River, Kum River and Yongsan River. Among
Soluble iron (mg/l)
< 0.3
0.3
0.5
0.5
1.0
them, the Yalu River Basin is the largest, and separates China from
Total manganese (mg/l)
< 0.1
0.1
0.1
0.5
1.0
North Korea with an area of 48 330 km2 (WRI 1998a). On the Chinese
Total copper (mg/l)
< 0.01
1.0 2 1.0
2
1.0
1.0
Total zinc (mg/l)
0.05
1.0 3
1.0 3
2.0
2.0
side of the region, over the past 5 years, the average fl ow in the Huai
Nitrate (mg N/l)
< 10
10
20
20
25
River has been reduced by 50% due to the intensive use of the river
Nitrite (mg N/l)
0.06
0.1
0.15
1.0
1.0
water for agricultural and industrial activities (Lu 1998, World Bank
Non-ionic nitrogen (mg/l)
0.02
0.02
0.02
0.2
0.2
2003) but the fl ow reduction over the same period in the Yalu River
Kjeldahl nitrogen (mg/l)
0.5
0.5
1
2
2
Total phosphorus (mg P/l)
0.02
0.1 4
0.1 5
0.2
0.2
was less compared to that of Huai River (Crossland & Crossland 2000).
Permanganate index
2
4
6
8
10
Measurable reductions in water fl ow, mainly due to damming upstream
Dissolved oxygen (mg/l)
> 6
6
5
3
2
in the Han River and downstream in the Kum and Yongsan rivers have
Chemical oxygen cemand (COD) (mg/l)
< 15
< 15
15
20
25
Biochemical oxygen demand (BOD ) (mg/l)
< 3
3
4
6
10
been observed (US-AEP 2003).
5
Fluoride (mg/l)
< 1.0
1.0
1.0
1.5
1.5
Selenium (four valence) (mg/l)
< 0.01
0.01
0.01
0.02
0.02
Pollution of existing supplies
Total arsenic (mg/l)
0.05
0.05
0.05
0.1
0.1
Pollution of river water on both the Korean and Chinese sides of the
Total mercury (mg/l)
0.00005
0.00005
0.0001
0.001
0.001
Total cadmium (mg/l)
0.001
0.005
0.005
0.005
0.01
region has brought pollutants across national boundaries resulting in
Total chromium (six valence) (mg/l)
0.01
0.05
0.05
0.05
0.1
transboundary impacts. More than 10% of the Huai River Basin area
Total lead (mg/l)
0.01
0.05
0.05
0.05
0.1
has been polluted causing deterioration in nearby habitats, which has
Total cyanide (mg/l)
0.005
0.05 6
0.2 6
0.2
0.2
greatly depleted the dissolved oxygen (to as low as 1-2 mg/l), making
Volatile phenol (mg/l)
0.002
0.002
0.005
0.01
0.1
Oil category (mg/l)
0.05
0.05
0.05
0.5
1.0
some water bodies unable to support fi sh (Wang et al. 2003). The
Anionic surface-active agent
< 0.2
0.2
0.2
0.3
0.3
pollution was caused by discharges from the various chemical and
Total coliform bacteria (cells/l)
ND
ND
1000
ND
ND
paper pulp factories located along the Huai River. According to a report
Benzo(a)pyrene (g/l)
0.0025
0.0025
0.0025
ND
ND
Notes: 1 Water Quality Classifications: Class I: Water from sources, and the national nature
from the State Environment Protection Agency (SEPA), the number of
reserves. Class II: First class of protected areas for centralised sources of drinking water, protected
areas for rare fishes, and spawning grounds for fish and shrimp. Class III: Second class of
polluting factories in the Huai River Basin has increased from 365 in
protected areas for centralised sources of drinking water, protected areas for common fishes
and swimming areas. Class IV: Water for industrial use and entertainment which is not in direct
1996 to 1 320 in 2002 (Wang et al. 2003). Along the west coast of the
contact with people. Class V: Water bodies for agricultural use and landscape requirement. 2
Fishery 0.01 mg/l 3 Fishery 0.1 mg/l 4 Lakes and reservoirs 0.025 mgP/l 5 Lakes and reservoirs 0.05
Korean Peninsula, mass fi sh kills involving the death of thousands of fi sh
mgP/l 6 Fishery 0.005 mg/l
ND = No Data.
each time, have occurred in river basins more than twice each summer
(Source: UNEP 2003)
due to oxygen depletion, mainly as a result of industrial discharges
and agricultural run-off (US-AEP 2003, MOE 2003). In accordance with
45
national standards for surface water quality in China (Table 3), the quality
40
of water in the Huai River tributaries was that only 10.7% of the water
35
monitored met the water quality standard for Grade I and 44.1% were
30
worse than Grade V (see also Figure 7). In the mainstream Huai River,
25
recorded values were: 38.5% met the water quality standard for Grade I
(%) 20
to III, 46.2% met Grade IV or V, and 15.3% were worse than Grade V. Thus,
15
the overall water quality in Huai River was poor and the water quality in
10
the River's tributaries was more polluted than its mainstream.
5
0
Grade I
Grade II
Grade III
Grade IV
Grade V
Changes in the water table
Water Quality Category
Salinisation of normally freshwater coastal wetland habitats in Liaodong
Figure 7
Water quality in the tributaries of Huai River, classifi ed
according the Chinese National Water Quality
Peninsula and Shangdong Peninsula on the Chinese side of the region
Standards
has occurred at the scale of tens to hundred of square kilometres over
(Source: SEPA 2004)
26
GIWA REGIONAL ASSESSMENT 34 YELLOW SEA
the past two to three decades e.g. in Qingdao area (SEPA 2003a,b). Thus,
Box 2
The South-North Water Diversion Programme in China.
in several urban centres of the region, overextraction of groundwater
China has a very disproportionate distribution of water resources. In the southern
region of China, just the Yangtze River (Changjiang) Basin alone contributes to
for industrial and domestic uses has been found to lower groundwater
more than 80% of the nation's total water resources, while the contribution from
the northwest and north regions accounts to only 12%. This issue of depleted water
tables in these areas. Lower water levels will not only aggravate water
resources has impeded the exploration and utilisation of the rich mineral resources
and oil as well as the agriculture development in northern China regions, rendering
shortages, but will also decrease water quality and increase the risk
the population in these northern areas being much poorer in living standard
of earthquakes and landslides. On the Korean side of the region,
compared to those in the southern and coastal areas of China.
To address these problems, a South-North Water Diversion Programme has been
extensive uses of underground water (extracting through wells) has
initiated by the Chinese Government in recent years. Three projects, namely the
Western Route Project (WRP), the Middle Route Project (MRP) and the Eastern Route
led to seawater intrusion but the problems were largely localised and
Project (ERP) were formulated under the South-North Water Diversion Programme.
have not appear to be too serious (US-AEP 2003).
The WRP, MRP and ERP will divert water from the upper, middle, and lower reaches
of Yangtze River respectively, to meet the water requirements for the development
of northwest and north regions of China. The WRP also aims to divert water from
the upper reach of Yangtze River to the upper and middle reaches of Yellow River
Socio-economic impacts
(Huanghe) to meet the requirements for water in the northwest region of China.
The MRP will divert water from the middle reach of Yangtze River and its tributary
Some potential socio-economic and health impacts were identifi ed
as well as Han River (Hanjiang) by gravity flow to the most parts of the northern
region of China, particularly the great Huang-Huai-Hai plain while the ERP will
in the region. These were evidenced by frequent interruptions of
divert the water from the lower reaches of Yangtze River to the northern region of
freshwater supply for several hours in several cities, e.g. Yantai and
China by pumping.
Upon successful implementation of the WRP, about 20 billion m3 of water from
Weihai, on the Chinese side of the region, which greatly aff ected the
the three rivers will be diverted to increase an irrigated area of about 2 million ha
and to supply 9 billion m3 of water for human consumption and industrial uses
urban population (Wang et al. 2003). The impacts could be further
in the provinces of the northern region of China such as Qinghai, Gansu, Shanxi
worsened by the ineffi
cient use of the region's limited water supply,
and Ningxia as well as the Hui and Nei Mongol Autonomous regions. This will
consequently enhance promotion of the economic development of these poorer
particularly in the Chinese river basins, as indicated by studies that
northwest and inland areas of China as well as improve the biological environment
of Northwest Loess Plateau. The MRP will divert water from Danjiangkou Reservoir
showed in China: (i) only 20-30% of its industrial water is recycled;
on the Hanjiang, a tributary of Changjiang, to Beijing City through canals to be
built along Funiu and Taihang mountains. In future, additional amounts of water
(ii) water consumption per unit of industrial production is 5-10 times
will be drawn from Three Gorges Dam or downstream of the dam on the Yangtze
higher than that of industrialised countries; and (iii) only 25-30% of
River. The MRP will greatly mitigate the existing crisis of water resources in northern
region of China and supply water for Tang-bai-he Plain, middle and western parts
irrigation water is eff ectively used due to poor irrigation facilities,
of Huang-Huai-Hai Plain, covering a total area of about 155 000 km2.
resulting in about 2.5 million tonnes of grain yield lost each year
(Source: MOWR 2003)
(SEPA 2003a,b).
Conclusion and future outlook
The water table situation is likely to improve on the Chinese side of the
On the Chinese side of the region, although the overall fl ow volume
region as a result of outreach programmes to introduce measures for
of the rivers is decreasing, the fl ow is likely to be improved in the
eff ective use of irrigation water as defi ned in the Chinese Agriculture
coming 10 years when the government project that aims to channel
Department's "15th Five Year Plan" (SEPA 2004), coupled with the
the abundant water resources from the southern to the water-depleted
government's ambitious project to channel abundant water resources
northern China region is realised (see Box 2). The fl ow volume for the
from the southern to the northern part of China (Box 2). Similar measures
Huai River is expected to improve while that for the Yalu River could be
have been or are being taken by the Korean governments (US-AEP 2003,
decreased further (World Bank 2003, Crossland & Crossland 2000). Flow
UNEP-RRC.AP 2003). Further deterioration of the groundwater table in
volumes of the Korean rivers are unlikely to be improved but they will be
the region is unlikely.
kept on the current level (FAO-AQUASTAT 2004, Asianinfo 2004).
In recognising the vital need to address water shortage issues in China
The Huai River Basin is at risk of further pollution with the increased
in order to maintain the nation's development, China promulgated its
economic activities and urbanisation in the northeast region of China
Law of Water Resources, which provided a legal basis for water resource
(SEPA 2004). Similarly, the water quality of river basins in the Korean
management in 1988. In 1993, further legal support to ensure effi
cient
Peninsula could also deteriorate with the increase in economic activities
water use emerged as China adopted water resource licenses. By the
in both South and North Korea (MOE 2003, UNEP-RRC.AP 2003).
end of 1995, nearly 90% of the nation's water utilities were registered
However, in view of the great eff orts on the part of both the Chinese
and licensed. Since then, China's water supply is estimated to have
and Korean governments in taking measures to control pollution, the
increased 1% per year. The Chinese government is also promoting
quality of the freshwater resources in the region is likely to improve in
wastewater recycling by increasing investments in water pollution
the future (SEPA 2003a,b, MOE 2003, UNEP-RRC.AP 2003).
prevention and treatment facilities. Finally, eff orts to tap new water
resources, such as desalination of seawater, are being initiated. Measures
ASSESSMENT
27
were also taken by the Chinese government to cope with the problem
Bureau of the Agricultural Department to control the contamination
of severe shortage of freshwater resources through restructuring the
of aquatic products, both from sea and freshwater habitats. In 1988,
pattern of development in agriculture and industries, controlling the
a serious outbreak of hepatitis A in Shanghai City, and Jiangsu and
eff ective use of water and alternative use of seawater by industries
Shandong provinces was caused due to the consumption of blood
along the coast. Implementation of the measures over the past 10 years
clams (Arca sp.) contaminated with viruses during transportation in a
have reduced the water use on the Chinese side of the region by 30-
boat containing manure (SEPA 2004). This has created a great amount
50%, yielding some economic benefi ts. Additionally, there are fewer
of concern regarding health problems in the coastal population,
cases of infectious diseases caused by the quality and quantity of the
which caused great economic losses; the whole clam fi shery collapsed
freshwater resources (World Bank 2003). Compared to the Chinese side,
for several years in localised areas. However, such incidences were
the Korean side of the region has experienced fewer socio-economic
brought under control and have not occurred since then (SEPA 2004).
impacts due to freshwater shortage problems (US-AEP 2003, UNEP-
On the Korean side of the region, seasonal incidences of diarrhoea due
RRC.AP 2003).
to consumption of raw seafood (sashimi) have occurred only during the
summer (US-AEP 2003).
Eff orts taken by both the Chinese and Korean governments in
restructuring the pattern of development may improve the economy
Eutrophication
in the region, but continued growth in economic development is
The frequency, extent, and duration of harmful algal blooms (HAB)
likely to aggravate the problem of water supply shortages in the future
have increased since the early 1970s. This has mainly been as a result of
(SEPA 2004). However, public awareness of human health issues can
eutrophication due to organic pollution caused by increased discharges
be expected to improve, coupled with the measures taken by the
of industrial, agricultural and aquaculture wastes. Natural disasters such
governments to improve the welfare of human health, which together
as typhoons or tsunamis that bring up excessive amounts of bottom
lower the chance for outbreaks of diseases due to freshwater shortages
nutrients are also a contributor (She 1999). In addition, HAB organisms
(World Bank 2003, US-AEP 2003).
may be transported by shipping traffi
c, as well as from the huge
discharge from the Yangtze River (Changjiang) during the summer
monsoon season, which sometimes reaches the southern end of
the Korean peninsula (MOE 2003). In 2002, a total of 79 HAB incidents
T
C
A
Pollution
IMP
were recorded over China's entire marine area. The total area aff ected
exceeded 10 000 km2; among these incidences, 51 HAB cases were
Pollution in the Yellow Sea originates mainly from several land- and
found in the East China Sea, with the aff ected area exceeding 9 000 km2,
sea-based sources as well as atmospheric deposition, and includes
17 HAB cases were found in the Yellow Sea and Bohai Sea, with aff ected
organic material, petroleum, metals (e.g. zinc, arsenic, chromium,
area nearly 600 km2 (SEPA 2004). Eutrophication in freshwater rivers and
mercury), and inorganic nitrogen (Zhou et al. 1995, She 1999). Major
lakes in the region also occurs frequently, causing depletion of dissolved
pollutants come from industrial wastewater, domestic sewage, coastal
oxygen content (less than 2.0 mg/l) in the water leading to fi sh kills
cities, and agriculture and aquaculture areas (Zhou et al. 1995, She
and changes in plankton species composition in coastal waters (US-
1999). The most serious source of pollution comes from the rivers that
AEP 2003, SEPA 2004).
discharge into coastal areas and harbours (She 1999). Each year about
1 500 million tonnes of industrial wastewater and 200 million tonnes of
Chemical
domestic sewage fl ow into the Yellow Sea (She 1999).
Acid rain, caused by the atmospheric transport and deposition
of sulphur and/or nitrogen compounds emitted particularly by
Environmental impacts
coal-burning power plants, is a transboundary source of chemical
Microbiological
pollution in the region. In terrestrial and aquatic ecosystems, acid
On the Chinese side of the region, incidents of gastrointestinal disorders
rain may decrease biomass productivity and thereby degrading
caused by the consumption of seafood and freshwater products have
existing forests. The main sources of acid rain are high levels of
shown a slight increase over the past several years (She 1999, SEPA
sulphur dioxide emissions from coal-burning power plants and
2003b). Although the Escheria coli counts in Jiaozhou Bay exceeded
factories in the region (Gregory & Richard 2003). In the areas adjacent
the national standard for Class III water quality (see Table 3 for the water
to the Yellow Sea, it has been estimated that the industry may emit
quality standards), depuration centres were established by the Fisheries
about 700 000 tonnes of sulphur dioxide per year, some of which
28
GIWA REGIONAL ASSESSMENT 34 YELLOW SEA
may be transported across the Yellow Sea to the Korean Peninsula
the waste such as fi shing gears might have transboundary implications
by the predominantly northwesterly winds (Shim 2003). Fortunately,
(US-AEP 2003, SEPA 2004). The impact of this GIWA issue to the region
the problem is amenable to technological controls at the source: a
is moderate.
modern power plant with fl ue-gas desulphurisation equipment can
remove more than 90% of the emissions. Countries in northeastern
Thermal
Asia are promoting the use of such equipment for their industries
There are power plants in Jiangsu and Anhui provinces, and the Huai
as well as establishing facilities to monitor acid rain deposition.
River Basin as well as along the upper reaches of Yalu River on the
However, much remains to be done in terms of establishing common
Chinese side of the region; these power plants are discharging high-
monitoring methodologies, comprehensive baseline monitoring, and
temperature cooling waters. However, the discharges have not appear
ecosystem impact studies (Sinton 2003).
to cause eff ects on the biotic structure and composition outside
the mixing zones (SEPA 2003a, Crossland & Crossland 2000). On the
Apart from acid rain, agricultural run-off and industrial discharges
Korean side of the region, some thermal diff erence around power
have also been observed to contribute to minor chemical pollution
plant discharge points has been observed, but the diff erence was not
in localised areas in both the Korean and Chinese sides of the region
signifi cant enough to cause any severe environmental impacts (US-AEP
(MOE 2003, SEPA 2004). Furthermore, the concentration of metals,
2003, MOE 2003).
pesticides, and oil in marine organisms is gradually increasing,
sometimes to levels exceeding those allowable for consumption
Radionuclides
(She 1999).
The environmental impact of this GIWA issue is unknown as, at the
moment, there are no nuclear power plants in operation in the region
Suspended solids
(US-AEP 2003, SEPA 2004).
On the Chinese side of the region, some erosion along the coastal areas
has occurred during the last two decades, which might contribute to
Spills
an increase in the suspended solids content in adjacent coastal waters
On the Chinese side of the region, there were three to four incidences
(World Bank 2003). The suspended solids concentration in rivers and
of oil spills in 1984, with amount of spilled oil as much as 3 300 tonnes
coastal waters has increased due to other human activities such as
in Jiaozhou Bay. The incidents of oil spills on the Chinese side of the
dredging of navigation channels, dam construction and conversion
region have increased substantially over the years (SEPA 2004). On
of wetlands for agriculture (SEPA 2004). Many commercial species of
the Korean side, minor spills have occurred in restricted areas and
shrimp, crab, and shellfi sh, especially in nursery and spawning areas,
their biological impacts were insignifi cant (UNEP-RRC.AP 2003, US-
as well as benthic communities, have been seriously aff ected or have
AEP 2003). Additionally, incidences of oil spills from maritime activities
disappeared due to the eff ects of high sediment concentrations (She
have come under control as a result of eff ective enforcement by both
1999). Suspended sediment problems in the coastal areas and rivers on
the Chinese and Korean governments in recent years (MOE 2003,
the Korean side of the region are localised and have not been serious
SEPA 2004). Oil and chemical spills are likely to have transboundary
(MOE 2003).
importance as spilled oils or chemicals may be carried by currents
across the state, national and international boundaries (US-AEP 2003,
Solid wastes
SEPA 2004).
Indiscriminate dumping of garbage and other solid wastes by the
aquaculture sector, residents in urban centres, and tourists has
Socio-economic impacts
greatly increased the amount of fl oating solid wastes in rivers and
Over the past few decades, increased water pollution has resulted in
coastal waters in the region (US-AEP 2003, UNEP-RRC.AP 2003, SEPA
adverse impacts on communities, particularly on the Chinese side of the
2004). These have caused public concern regarding their impacts on
region. Between 30-50% of the coastal areas were potentially open for
recreational activities and tourism. Currently, there are an insuffi
cient
recreational development, while at the same time, the water in several
number of sanitary landfi lls to handle solid waste, particularly on the
rivers such as the Huai and Han Rivers has become unfi t for swimming
Chinese side of the region (SEPA 2004). Also, wide spread of litter and
(MOE 2003, SEPA 2003a & 2004). Over the past decade, increased
fi shing gear on beaches and sea bottoms as well as in some recreational
pollution resulting in the destruction of aquatic habitats in the region
places were observed in the region. However the impact of solid wastes
has also caused: (i) drastic decreases in the production of penaeid
on the environment in the region was largely local although some of
shrimps (Penaeus spp.) and scallop (Pecten spp.); (ii) a 50% decrease in
ASSESSMENT
29
fi sheries activities due to decreased catches; and (iii) a slight increase
Incidences of oil spills are expected to increase in the region with
in the incidences of diseases from the consumption of contaminated
the on-going increase in petroleum and natural gas exploration/
seafood and aquatic organisms (Liu & He 2001, Jin 2003, US-AEP 2003).
exploitation activities in the Bohai Sea and Yellow Sea (SEPA 2004).
The accompanying growth in tanker and shipping traffi
c and
Conclusion and future outlook
other maritime activities could further add to the oil spill problem.
Microbiological pollution is expected to decrease with the
International trade is anticipated to triple in the next 20 years and
implementation of integrated waste management programmes such
between 80-90% of this is expected to move by shipping (GEF/UNDP
as the "Greening Program" in Korea (MOE 2003) and other environment
2000). The marine areas of the region are important shipping routes
awareness campaigns initiated by the Chinese government (SEPA
for oil, and with the increased economic development in China,
2004) to reduce the discharge of untreated industrial and domestic
petroleum-related traffi
c can be expected to increase. There have
sewage proposed. The culture of fi sh in fl oating cages in coastal areas
already been around 300 oil spills resulting in more than 760 000 m3 of
of the region, that has been widely encouraged by both the Chinese
oil spilled in the East Asian Seas region since the mid-1960s. Although
and Korean governments, coupled with the increase in industrial
oil spill prevention and combating measures could be adopted by
development, are likely to aggravate eutrophication in coastal
using modern equipment and technology, the majority of GIWA
areas (MOE 2003, SEPA 2004). Unless measures are taken to control
experts believed that threats from oil spills would remain high in
mariculture practices and industrial development, the eutrophication
the future.
situation may deteriorate further.
Increased economic growth over recent decades in the region has
Some improvements may be expected for the chemical pollution
generated increasing amounts of industrial and solid wastes, which
issue as a result of the eff orts on the part of both the Chinese and
are major sources of marine pollution in the region. The current
Korean governments to improve industrial waste treatment. National
level of sewage treatment in the region is generally low. Unless
programmes to combat water pollution problems have been
this is drastically improved, the sewage from increasingly densely
implemented or will be implemented by both the Chinese and Korean
settled areas will accelerate eutrophication, which may threaten
governments; the successful implementation of these programmes
public health at transboundary levels. There are increased non-
will substantially improve the environment of the region in the future
point sources of pollution, or run-off from diverse activities such as
(UNEP-RRC.AP 2003, MOE 2003, SEPA 2004).
agriculture, mining, timbering and land-clearing, and residential and
commercial development. Evidence indicates that land-based sources
Concerning suspended solids in the region, measures currently taken
are polluting localised near-shore areas and bays as well as the coastal
by both the Chinese and Korean governments to increase reforestation
habitats aff ecting the livelihood of the local population in the region
along coastal areas and riverbanks may yield some improvements in
(Zarsky 2003).
controlling erosion in the future (SEPA 2004, US-AEP 2003). Enforcement
of ecosystem protection measures in the region is relatively weak and
Water pollution may continue to seriously aff ect ecological functions
improvement is needed.
of the coastal areas in the region. The decrease in the production of
fi sh and shellfi sh due to the eff ects of water pollution would likely
The solid waste situation may worsen as a result of increased standards
be alleviated with the improvement in aquaculture technologies and
of living and urbanisation, both of which can increase the generation
other measures taken by both the Chinese and Korean governments
of solid wastes. However, with the increase in public awareness of
(US-AEP 2003, Wang and Zhiang 2003). The increase in the incidences
environmental protection, and eff orts taken by both the Chinese and
of disease outbreaks due to water pollution is likely to be low in the
Korean governments to gradually develop more sanitary landfi lls, as
future and the impact of water pollution in the region is likely to
well as to recycle wastes and develop waste incineration plants, the
remain unchanged if not improved in the future (US-AEP 2003,
situation is expected to improve somewhat in the future (UNEP-RRC.AP
SEPA 2004).
2003, SEPA 2004). Also the demand for energy in the region is expected
to increase with the growth of economic development. Consequently,
more power plants will be built to cope with the increased energy
demand, resulting in an increased volume of cooling water and
subsequent thermal pollution.
30
GIWA REGIONAL ASSESSMENT 34 YELLOW SEA
T
C
A
Habitat and community
IMP
the damaged area accounted to less than 30% of the total. The
modification
functional services of estuaries in the region have transboundary
importance in that they provide spawning and breeding grounds
Environmental impacts
for fi sh and shrimp as well as the recruitment grounds for migratory
Loss of ecosystems or ecotones
fi sh species.
Several types of habitats or ecosystems in the region have been lost to
various extents. These include the following (Simard 1995, SEPA 2001):
Heavy erosion has occurred in about 30% of the sandy foreshore area
Marshlands: More than 30% of the total area of marshlands was lost
on the Chinese side of the region. The erosion was mainly due to sand
over the past 30 years in both the Chinese and Korean sides of the
mining of the beaches, road construction, and recreational activities
region.
along the coastal plains (SEPA 2001). There is also evidence of loss of
Standing waters (lakes): A decrease of 30% of the total surface area
sandy foreshores due to road construction on the Korean side of the
of lakes has occurred over the past 30 years on the Chinese side of
Yellow Sea, but the extent of loss is not known (GEF 2001). More than
the region, while on the Korean side, there are no natural lakes.
30% of the mud bottom habitat in the region was lost over the past
Periodic waters (e.g. rice paddy fi elds): About 10% of the total area of
30 years due to increased mariculture activities, opening up of salt-
rice paddy fi elds has been lost over the past 30 years on the Chinese
pans, and increased agricultural activities, as well as land reclamation.
side, but on the Korean side of the region, more than 30% has been
Some damage also occurred to the estuaries at the mouth of Huai River
lost due to embankment, damming and diking. However, eff orts
although the damaged area was less than 30% of the total (Li 2003).
have been made by both the Chinese and Korean governments to
The Yellow Sea estuaries have transboundary importance since they
protect the rice paddy fi elds.
are the spawning and breeding grounds for fi sh and shrimps as well as
Running waters (rivers): Over the past 30 years, the total surface area
the recruitment grounds for migratory fi sh species.
of the rivers in the region (on both the Chinese and Korean sides)
has decreased by 30%. Many river tributaries have even dried up.
Modifi cation of ecosystems or ecotones
Sandy foreshores: On the Chinese side of the region, roughly 30%
Several ecosystems or habitats in the region have been modifi ed,
of the area's sandy foreshores have seen heavy erosion, mainly due
resulting in various degrees of change in biodiversity, species
to sand mining of the beaches, road construction and recreational
composition and community structures. These included the following
activities along the coastal plains. There was also evidence of loss
(Simard 1995, SEPA 2001, Zarsky 2003):
of sandy foreshores due to road construction on the Korean side of
Marshlands: There were obvious indications of the alteration of
the region, but the extent of loss was not known.
marshland ecosystems and of the goods and services that they
Lagoons: The loss of lagoons in Shandong Province was obvious,
can off er. This signifi cant alteration was the eff ect of increased
decreasing over the past 30 years from the original 29 to only 3-4
urbanisation, economic activities and accompanying pollution.
nowadays. For the whole region, over the same period, more than
Running waters (rivers): Increased economic development activities
30% of the total area of lagoons has been lost.
have caused pollution and decreased river fl ows and volumes.
Muddy foreshores: More than 30% of the mud bottoms in the
Changes in river functions (e.g. providing irrigation water and
region have been lost over the past 30 years due to increased
drinking water, fi sheries production) has occurred.
mariculture activities, opening up of salt-pans and increased
Standing waters (lakes): Persistent eutrophication of lakes has
agricultural activities as well as reclamation (e.g. reclamation in
substantially altered species structure and composition, and
northern Jiangsu Province).
contaminated water intended for human consumption.
Wetlands in saline habitats: Salt marshes are the habitats for a
Sandy foreshores: The species community structure and abundance
number of endangered species such as the red-crown crane
of aquatic life in the sandy shore areas have been greatly altered.
and reindeer. Measures (e.g. development of protected areas for
Species such as Nereidae and Lancelets, which were previously
wetlands, legislation to control the use of wetlands and saline
found in these habitats, have now become rare. Biodiversity has
habitats) to protect salt marshes were taken by the Chinese
been substantially reduced.
government. As a result of this protection, not more than 30% of
Lagoons: Production of Sea cucumbers around the Yuehu Lake
their area has been lost over the past 30 years.
area in Shandong Province used to be in thousands of kilos per
Estuaries: Some damage to habitats due to human activities
year, but now production has been greatly reduced to only tens of
has occurred in the estuaries at the mouth of Huai River, but
kilos per year. Such a tremendous decrease in the production of sea
ASSESSMENT
31
cucumbers was due to uncontrolled overexploitation. Overgrowth
development and land reclamation, especially in estuaries and shallow
and subsequent deterioration of macro algae have further modifi ed
bays. During the past decades, many sites have been reclaimed,
the ecosystems, altering the goods and services that these systems
resulting in the loss of approximately 25% of the total tidal fl ats in the
can provide.
region (Simard 1995). The waste materials and pollutants from industrial
Muddy foreshores: Substantial changes in species composition
complexes, coastal cities, and tourism and recreational activities also
and abundance of benthic organisms in the muddy foreshores
degrade coastal habitats.
of the region, such as those in the Changkou area of Shandong
Province. The benthic communities used to be comprised of
Socio-economic impacts
about 170 species in the 1950s, but this was reduced to some
Degradation of ecosystems has aff ected not only the ecological functions
70 species in 1980s, and to only a few pollution-resistant species in
and the scientifi c value but also the daily livelihood of coastal and
1990s. The introduction of salt hay (Spartina sp.) has greatly altered
riverside communities (Xie & Wang 2003). For instance, the degradation
these ecological systems, causing reductions in biodiversity and
of wetlands in the Huai River Basin has resulted in a decreased catch
habitat area for rare species such as the Acorn worm (Saccoglossus
of fi sh, destruction of coastal areas and a loss of the revenues for local
kowalevskii), and Tornaria larvae have been signifi cantly reduced.
communities during the past decade; certain cultural heritage sites
Salt marshes: Salt marshes in the Chengshantou area have been
have also been seriously destroyed (Li 2003). These impacts have greatly
well-maintained, and swans have returned. However, signs of
aff ected the local population. The impact on the socio-economic
some ecological changes have been observed in recent years, due
situation of local communities has been severe. The employment rate
to indiscriminate sewage discharges from the surrounding urban
in industries such as tourism and aquaculture has been aff ected; for
centres.
instance, in the Huai River Basin, the employment rate has been found to
Estuaries: In estuaries along the mouths of the Yalu River and the
decrease by 10% over the past decade (Wang et al. 2003). The production
Huai River, small-sized food fi sh species, which used to be abundant
of some important Chinese medicinal products from the coastal seas
in the 1950s, had disappeared by the 1980s. The number of
such as the seahorse, sea-dragon, scallop (Pina spp.), in for example the
economic species was reduced in these habitats and the ecological
Yalu estuaries has decreased by 30-50% over the past decade, due to
function of the habitats as spawning and breeding grounds for fi sh
the destruction or modifi cation of ecosystems in the region (Crossland
and shrimp have also become threatened.
& Crossland 2000, CAFB 2003). Serious confl icts in the last 10 years
Sand and gravel bottom: The sand and gravel bottom area used
have occurred over resource use for activities such as sand-mining and
to be an important habitat for an endangered species, the lancelet
aquaculture. This has resulted in some social problems (Lu 1998).
(Branchiostoma belcherii). However, lancelets cannot be found
in these habitats nowadays, and the habitats are losing their
Conclusion and future outlook
ecological functions.
Damaged ecosystems are unlikely to be restored in the next 20 years. It
Neritic systems: Ecosystem services have changed, the number
is also possible that these ecosystems may tend to deteriorate further.
of commercial species has been signifi cantly reduced, size of fi sh
This, in turn, would have profound impacts on the local population.
caught has decreased, the predator-prey relationship has been
The economic loss and loss of employment due to the damage to
altered, the food web changed, and high natural mortality of
ecosystems are unlikely to show much improvement in the coming
anchovy eggs has occurred.
20 years. With the eff orts exerted by both the Chinese and Korean
Rocky foreshores: Changes in species composition due to
governments to protect the resources, some improvements in the
contamination, reclamation and mariculture (e.g. culture of
production of the Chinese medicinal products from the coastal and
abalone) have occurred.
marine areas would be expected in the future (Li 2003, MOE 2003).
Habitat modifi cation has resulted in changes in biodiversity, species
Future prospects for habitat loss in the region are, as evaluated by the
composition, and community structures in some areas. For example,
GIWA Experts in the workshops, likely to be as follows:
species from the family Nereidae and lancelets have become rare
Marshlands: Areas will be further reduced.
and biodiversity has been substantially reduced in sandy foreshores.
Standing waters (lakes): Mitigation measures have been taken by
Substantial changes in species composition and abundance of benthic
the government, further deterioration may not be expected.
organisms in the muddy foreshores of the region have also occurred.
Periodic waters (rice paddy fi elds): Further reduction of the areas is
The main threat to the coastal habitats of the region is intensive coastal
expected due to increased economic development.
32
GIWA REGIONAL ASSESSMENT 34 YELLOW SEA
Running waters (rivers): Further reduction may be expected.
Chub mackerel (Pneumatophorus japonicus) became dominant in the
Sandy foreshores: Further area reduction is anticipated.
1970s. Anchovy (Thrissa mystax) and Scaled sardine (Harengula zunasi),
Lagoons: Further area reduction is anticipated.
smaller-bodied and economically less profi table, increased in the 1980s
Muddy foreshores: Further area reduction is anticipated.
and took a prominent position in the ecosystem. The Japanese anchovy
Wetlands of saline habitats: Further area reduction is anticipated;
(Engraulis japonicus) is presently believed to be the most abundant
irreversible changes are likely to occur.
species in the Yellow Sea, with a potential catch of 0.5 million tonnes a
Estuaries: Further area reduction is anticipated.
year. It is still under-exploited (Tang & Jin 1999). The general increase in
fi shing activities since the 1970s has depressed fi sh populations and has
Future prospects for habitat modifi cation in the region, as evaluated by
required a higher fi shing eff ort than before to sustain the same catch.
the GIWA Experts, are likely to be as follows:
Fish and invertebrates declined in biomass by over 40% from the early
Marshlands: Further deterioration in ecosystem services is
1960s to the early 1980s. Cold-water species such as the Pacifi c cod
anticipated.
(Gadus macrocephalus) are almost extinct. It appears that uncontrolled
Running waters (rivers): Thermal pollution in Yalujiang River might
fi shing or overexploitation has aff ected the self-regulatory mechanism
get worse, with further impairment of ecosystems.
of the Yellow Sea ecosystem. The commercially important species are
Standing waters (e.g. lakes): Habitat conditions may be further
Fleshy prawn (Penaeus sp.), Southern rough shrimp (Parapaeneopsis
deteriorating, largely due to eutrophication caused by aquaculture
sp.), and Japanese squid (Loligo japonicus). Total catch was about
wastes.
2.7 million tonnes in 2000 (Figure 8).
Sandy foreshores: No signifi cant changes expected.
Lagoons: Further deterioration is expected.
3 000 000
Salmon, smelts, etc
Tuna & billfishes
Muddy foreshores: There will likely be further increase in shellfi sh
Flatfishes
culture, causing further alteration and deterioration of habitats.
2 500 000
Herring-likes
Cod-likes
Salt marshes: They are mostly in protected areas. No signifi cant
Scorpion-fishes
2 000 000
Other fishes & inverts
changes are expected.
Molluscs
Estuaries: With further reduction in area, habitat conditions would
onnes)
Sharks & rays
(t 1 500 000
Crustaceans
be altered.
t
ch
a
Anchovies
C
Perch-likes
Sand and gravel bottom: The situation might be getting worse as
1 000 000
insuffi
cient attention is given to threats.
500 000
0
1950
1955
1960
1965
1970
1975
1980
1985
1990
1995
2000
T
C
A
Unsustainable exploitation of
Year
IMP
fish and other living resources
Figure 8
Fish catch in the Yellow Sea.
(Source: LME 2005)
The Yellow Sea region is an important global resource for coastal and
Many of these resources are threatened by both land- and sea-based
off shore fi sheries, has well-developed multi-species and multinational
sources of pollution and loss of biomass, biodiversity, and habitat
fi sheries and is one of the most intensively exploited areas in the world
resulting from extensive economic development in the coastal zone,
(Tang 2003). About 100 species of fi sh and crustaceans are commercially
and by the unsustainable exploitation of natural resources. Non-
harvested, including e.g. Fleshy prawn (Penaeus sp.), Southern rough
sustainable fi shing practices have also resulted in signifi cant changes
shrimp (Parapaeneopsis sp.), and Japanese squid (Loligo japonicus). Due
in the structure of the fi sheries. Overfi shing on the Korean side of the
to overexploitation and natural fl uctuations in recruitment, some of the
region is serious. Similarly, catches of major fi sh species on the Chinese
larger-sized and commercially important species have been replaced
side of the region also showed a remarkable decline, particularly for the
by smaller, less valuable, forage fi sh (Tang & Jin 1999). When bottom
Large yellow croaker (Pseudosciaena crocea) and Small yellow croaker
trawlers were introduced in the early 20th century, many stocks were
(Pseudosciaena polyactis) in the last decades (GEF/UNDP 2000). Due
intensively exploited by Chinese, Korean, and Japanese fi shermen. All
to overexploitation and natural fl uctuations in recruitment, some of
the major stocks were heavily fi shed in the 1960s, which had a signifi cant
the larger-sized and commercially important species were replaced by
eff ect on the ecosystem. Pacifi c herring (Clupea harengus pallasi) and
smaller, less valuable and forage fi sh (Tang & Jin 1999).
ASSESSMENT
33
Overexploitation of the major stocks in the 1960s has had a signifi cant
0.8
impact on the ecosystem, as refl ected by major biomass fl ips (Sherman
0.7
Large Trawl
1989). These have been documented by Tang and Jin (1999), Zhang
Medium Trawl
0.6
Large Stow
and Kim (1999), and Tang (2003). The decline in biomass of the larger
0.5
0.4
and commercially important demersal species such as Small yellow
ch per HP)
at
C
0.3
croaker (Pseudosciaena polyactis) and Hairtail (Trichiurus haumela)
(
0.2
was accompanied by an increase of about 23% in the biomass of
CPUE
0.1
smaller, less valuable fi sh between the 1950s-1980s (Tang 2003). Pacifi c
0.0
1968 1970 1972 1974 1976 1978 1980 1982 1984 1986 1988 1990 1992 1994
herring (Clupea harengus pallasi) and Chub mackerel (Pneumatophorus
Year
japonicus) became dominant in the 1970s. Anchovy and Scaled sardine
Figure 9
Catch per unit eff ort (horsepower) of three major
increased in the 1980s and species such as the Japanese anchovy,
fi sheries on the Korean side of the region.
(Source: GEF/UNDP 2000)
Spotted sardine, and Scaled sardine have nowadays become the most
abundant species in the Yellow Sea, with an estimated maximum
sustainable yield (MSY) of 0.6 million tonnes per year (Tang & Jin 1999).
resources include: (i) all major stocks had been heavily fi shed in the 1960s;
While natural environmental perturbations might have contributed
(ii) more fi shing eff ort is required to sustain the same catch because of
to the increase in the abundance of pelagic species in the Yellow Sea
increased fi shing activities since the 1970s, which has depressed fi sh
(Tang & Jin 1999), overfi shing has been found to be the primary driving
populations; (iii) the biomass of fi sh and invertebrates has declined by
force of biomass changes in the Yellow Sea (Tang 2003). The changes
40% from the early 1960s to the early 1980s; and (iv) cold-water species
in species composition were accompanied by changes in the size
such as the Pacifi c cod are now almost extinct (Tang & Jin 1999).
structure of the fi sh populations. In 1986 about 70% of the biomass
consisted of fi sh and invertebrates with a mean standard length of
Overexploitation of the fi sh resources over the past decades has
11 cm and a mean weight of 20 g (Tang 2003).
resulted in decreased quantity or biomass but also decreased catch
quality. For instance, Small yellow croaker and Hairtail were the
Environmental impacts
commercially important demersal species in the Yellow Sea, with peak
Overexploitation
catches reaching 200 000 and 64 000 tonnes in 1957, respectively.
The region is one of the most intensively exploited areas in the world;
many stocks were intensively exploited by Chinese, Korean, and Japanese
The major commercial species caught in the Yellow Sea are largely
fi shermen following the introduction of bottom trawlers in the early 20th
migratory species that are subject to seasonal migrations from one
century (Tang 2003). The increase in fi shing eff ort and its expansion has
area of the Sea to another. The catches in both the Chinese and
resulted in almost all major stocks being fully fi shed by the mid-1970s
Korean waters of the Yellow Sea would be seriously aff ected causing
and overfi shed by the 1980s (Zhang & Kim 1999, Tang 2003). From the
transboundary implications such as encroachment on fi shing grounds
early 1960s to the early 1980s, the biomass of fi sh and invertebrates
across national boundaries if overexploitation of these migratory
declined by more than 40% (Tang 1993). Dramatic declines in CPUEs of
species occurs. Overexploitation of fi sh resources has been found to be
the Korean fl eet occurred in the late 1970s (Figure 9), and the average
the most serious issue in the region. Cooperative eff orts on a regional or
CPUE in the 1990s was less than one-tenth of the highest CPUE in the
transnational basis will be required to attain sustainable management
mid-1970s (GEF/UNDP 2000). Similarly, catches of major fi sh species (e.g.
of the fi sh and other living resources of the region.
Yellow croakers, Hairtail, and Chub mackerel) on the Chinese side of the
region have also shown a remarkable decline particularly for the Large
Excessive by-catch and discards
yellow croaker and Small yellow croaker (GEF/UNDP 2000).
About 30% or less of all the fi sheries caught from the Chinese and Korean
sides of the region have been found to consist of by-catches, occasionally
Catches of the major economic species such as prawns (Metapenaeus
also seals (Jin 2003). The proportion of fi sheries by-catch in the region has
joyneri, Parapenaeopsis tenellus), Small yellow croaker (Pseudosciaena
therefore been considered to be relatively insignifi cant.
polyactis), and Hairtails (Trichiurus brevis), exceeding their Maximum
Sustainable Yield (MSY) levels has occurred in all coastal seas along the
Destructive fi shing practices
Chinese and Korean coasts of the region (GEF/UNDP 2000). Other evidence
Common destructive fi
shing practices in the region include
of overexploitation of the region's natural resources, particularly its fi sheries
indiscriminate trawling along the coastal waters of Yellow Sea, fi shing
34
GIWA REGIONAL ASSESSMENT 34 YELLOW SEA
with explosives in lakes, and use of pesticides for fi shing (Jin 2003, MOE
region. The poor catches have reduced business activities in the seafood
2003). As a result of these destructive fi shing practices, aquatic habitats
processing industries by around 10% over the past decade (Tong pers.
have been destroyed, leading to the collapse of fi sh populations and
comm.). Fish and other marine living resources form important food
loss of biodiversity. The long-term implications for the protection of the
items for the local population. Cases of infectious diseases due to the
environment and resource conservation after such destructive fi shing
consumption of contaminated seafood have been frequently reported.
practices are obvious.
A massive infection of Hepatitis A caused by the consumption of
contaminated cockles in Shanghai and the neighbouring populations
Decreased viability of stock through pollution and disease
in Jiangsu Province during the 1990s is a good example of impacts on
Pollution and diseases have caused decreases in production and species
human health (Xin 2003, SEPA 2004).
composition of bivalves, clams and cockles, but not to the extent that
they could cause resource depletion (Yuxiang pers. comm.). On the
Conclusion and future outlook
Korean side of the region, deformation of freshwater fi sh due to disease
Unsustainable exploitation of fi sh and other living resources is likely
and water pollution has occurred but without signifi cant impact on
to continue in the coming 20 years (Tong pers. comm.). This would
the fi sh stock; the situation is not serious (Shang pers. comm.). There
further aggravate the unemployment rate, which would aff ect the
is evidence that diseases originating from cultured fi sh stocks were
local population. In the past 5 years, the contribution from fi sheries
being transmitted to wild stocks (Jin 2003). This is likely to decrease the
production to the national domestic product (GDP) in the Shandong
viability of wild stocks, aff ecting overall production in the future.
Province, one of the Chinese provinces in the region, was decreasing
annually, indicating a stagnation in the fi sheries sector (Tang 2003).
Impact on biological and genetic diversity
Therefore, in the coming 20 years, capture fi sheries production is
International shipping transfers approximately 10 billion tonnes of ballast
expected to decrease by 30-50% due to the continued overfi shing and
water around the world annually. Although necessary for ship safety,
environmental degradation (CAFB 2003 ). With the increase of public
ballast water can contain marine organisms that threaten ecosystems
awareness of health aspects and measures taken by both the Chinese
and public health. For example, in some countries harmful algal bloom
and Korean governments to combat diseases, the incidents of infectious
organisms have been introduced by ballast water and have contaminated
disease outbreaks due to consumption of contaminated seafood are
shellfi sh. As ships get larger and faster, and as maritime trade increases,
likely to be kept at a low level in the future.
the problem will become more acute (SEPA 2001).
In view of the open access or common property nature of the fi sh
A decrease in genetic diversity and species composition in clams and
resources, fi shing eff orts in both the Chinese and Korean sides of the
oysters was observed due to mariculture and release of hatchery-
region are expected to intensify in order to meet market demands in
produced larvae; however it has not depleted any resources (NEPA
the future (OECD 1997, Jin 2003). Overexploitation of fi sh resources will
1994). A measurable decline of native populations due to the
worsen if measures are not taken to conserve or to encourage rational
introduction of alien species has occurred in Korean reservoirs (Choi
use of the resources.
pers. comm.). Genetic diff erences (or changes) in prawns as a result
of the mass release of hatchery-produced prawn larvae have been
Destructive fi shing practices have transboundary implications in that
observed in both Korean and Chinese waters (NEPA 1994).
the practices in one country can aff ect the viability of migratory fi sh
in another country. The destructive fi shing practices also destroy fi sh
Socio-economic impacts
spawning and breeding grounds, reducing the recruitment potential
The employment rate in the region has shown a decrease of 30-
for marine and ocean fi sh stocks, which are common resources for
50% over the past decade due to overfi shing and environmental
China and Korea (Jin 2003). Enforcement of regulatory measures to
degradation that aff ect the abundance of fi sh resources (CAFB 2003).
control destructive fi shing practices in the region have been and will
This has aff ected the overall livelihood of coastal communities and has
be implemented by both the Chinese and Korean governments in
increased migration of the coastal and rural population to urban centres
the future (MF 2003, MOE 2003). Consequently, the situation may be
in a search for employment. Although some measures have been taken
gradually improved. As evaluated by the GIWA Experts, some impacts
by the governments to protect resources, improvement is unlikely to
are expected from introduced species but the situation is unlikely to
be signifi cant in the future. As mentioned earlier, decreasing catch per
change much in the future.
unit eff ort (CPUE) has been widely experienced by fi shing fl eets in the
ASSESSMENT
35
T
C
A
Global change
IMP
improvement with measures that have been and/or will be taken by
both the Chinese and Korean governments to resolve the problems.
Environmental impacts
Although the three governments have taken and/or will take the
Changes in the hydrological cycle
necessary measures to control the outbreaks of diseases, the risks
Due to the increased eff ects of ENSO and El Nińo, the fl ow volume
of disease outbreaks brought about by the unpredictable impact of
of the warm Kuroshio Current has been observed to increase over
global climate change and the associated changes in water resources
the past decade (Yuxiang pers. comm.) and because of the close
still remains (World Bank 2003). The current situations are likely to
proximity of the Yellow Sea to the Kuroshio Current, the temperature
remain in the future. Changes in the hydrological cycle is expected to
and water circulation patterns in the Yellow Sea have been changed
improve in the future when more eff ective predictive and preventive
(Lu 1998). This may cause localised changes in the hydrological cycle
mechanisms/measures are developed and strengthened. The impacts
without strong eff ects on the productivity and biodiversity in the
of sea level change are unpredictable in the future, although preventive
region. Changes in climatic conditions, such as an increase of air
measures to cope with the consequences of sea level rise are being
temperature and sea level rise, and the observed disappearance of
taken by both the Chinese and Korean governments (Lu 1998).
fl oating ice blocks in Jiaozhou Bay on the Chinese side of the region
could also modify the hydrological cycle; the economic loss due to
these changes has been estimated to be as high as 60-80 billion USD
(Xinhuanet 2004a & 2004b, PDO 2004).
Priority concerns for further
analysis
Sea level change
Sea level rise at the rate of around 1.5-2.0 mm/year has been observed
Many environmental issues, particularly those that are water-related,
in the southern part of the Yellow Sea since 1982, but has not appeared
are increasingly of transboundary concern. For instance, land-based
to aff ect the biodiversity and species composition of the aquatic life in
pollutants discharged into the Yellow Sea may aff ect the environment in
the region (PDO 2004).
both Chinese and Korean coastal areas, creating transboundary problems
for environmental management. Similarly, the destruction of spawning
Increased UV-B radiation as a result of ozone depletion
and breeding habitats along the Korean coasts may aff ect the catches in
Both Korean and Chinese Experts believe that no evidence of increased
waters on the Chinese side of the region or vice versa, creating another
UV-B radiation has been observed in the region.
critical transboundary issue (JICA 2002). Almost all the priority GIWA
concerns and issues for the region have transboundary implications.
Changes in ocean CO source/sink function
2
Both Chinese and Korean Experts indicated that there was no clear
Based on the results of the assessment and the diagram showing the
evidence of changes in the ocean CO source/sink functions in the region,
linkages between the GIWA concerns (Figure 10) the concerns were
2
although some studies did show some changes, causing a slight increase
prioritiesed in descending order:
in primary productivity due to increased nutrient inputs (Lu 1998).
I. Freshwater
shortage
Socio-economic impacts
The retreat of coast line and the intrusion of seawater due to sea
level rise both have substantial implications for the overall economic
III. Habitat and
development in the region, but the level of impact is still low (PDO
II. Pollution
community
2004). Incidences of disease outbreaks due to changes in water quality,
modification
seawater intrusion and fl oods resulting from the sea level rise have
shown signs of increase (World Bank 2003).
IV. Unsustainable
Conclusion and future outlook
exploitation of living
V. Global change
resources
As evaluated by the GIWA Experts, in the coming 20 years, confl icts
over resource use will be expected to be aggravated and the associated
Figure 10 Linkage between the GIWA concerns in the Yellow Sea
social problems will intensify. The situation may show some limited
region.
36
GIWA REGIONAL ASSESSMENT 34 YELLOW SEA
1. Unsustainable exploitation of fi sh and other living resources
Habitat and community modifi cation:
2. Habitat and community modifi cation
-
Loss of ecosystems
3. Pollution
- Modifi
cation
of
ecosystems.
4 Global
change
Unsustainable exploitation fi sh and other living resources:
5. Freshwater shortage
- Overexploitation
- Destructive
fi
shing
practices.
The priority GIWA concerns and issues that have severe environmental
impact for the region include:
The environmental and socio-economic impacts of these priority GIWA
Freshwater shortage:
concerns and issues in the region and the possible causes for these
-
Modifi cation of stream fl ow
impacts are presented in Table 4.
-
Pollution of existing supplies.
Table 4
Summary of prioritised environmental and socio-economic issues in the Yellow Sea region.
Concern
Issue/Impact
Score
Impacts
Possible causes
More than 30% of the areas of freshwater marshlands, rice fields and
Losses due to construction of dams, dikes and embankments in areas of the freshwater marshlands,
lakes have been lost over the past 30 years.
rice fields and rivers; and reclamation sedimentation and lowering of water tables in lakes.
Muddy shores in northern Jiangsu Province in China as well as salt marshes and sandy beaches lost
Loss of
Severe losses of the areas of muddy shores, salt marshes, sandy beaches, due to erosion, mining, reclamation and road construction; severe shrinking in the areas of estuaries
3
ecosystems
estuaries and lagoons in localised areas.
of Yalujiang River between North Korea and China due to diking; loss of lagoons due to reclamation
and port development (e.g. Lianyungang Port, China).
Significant losses of seagrass beds (e.g., Zostera marina) in the South
Losses due to pollution and eutrophication.
Korea side of the Yellow Sea.
Modifications and changes in the neritic systems include: ecosystem services changed; number of
The neritic system in terms of its ecosystem services, size and
commercial species significantly reduced; size of fish caught decreased; predator-prey relationship
composition of species, food web, species mortality and predator-prey
altered; food web changed; high natural mortality of anchovy eggs occurred (reasons for intensive
relationships have been seriously modified.
studies).
Habitat and
Changes in species composition due to contamination, eutrophication, aquaculture practice and
community
Volume and biodiversity of lakes and rivers changed significantly.
overexploitation of resource occurred in lakes of China. Disappearance of indigenous species and
modification
Modification of
3
ecosystems
reduced biodiversity has occurred in rivers of South Korea and China.
Muddy shore habitats modified due to reclamation, aquaculture practice and overexploitation
Muddy shores greatly modified with increased opportunistic organisms.
leading to occurrence of increased opportunistic organisms.
Modification of estuary habitats (e.g. in South Korea) is evidenced by the dominance of red tide
Species population structure in estuaries significantly modified with
organisms (dinoflagellates) in the plankton biomass, and due to damming or diking, reduced
increased dominance of HAB organisms.
stream flow and upstream activities.
Aesthetic and recreational values of the habitats greatly reduced.
Modifications of habitats have changed the goods and services the habitats can provide.
Socio-economic
Cost of controlling alien species and restoring ecosystems substantially
3-1-21
The increase is due to restoring the damaged habitats.
impacts
increased.
Employment opportunities particularly for the fisheries sector
Modifications or loss of habitats indirectly influence the fisheries production, which, in turn,
substantially reduced.
changes the employment opportunities for fishermen.
Overexploitation
3
Fish stocks severely overexploited.
More than one stock of fish is exploited beyond MSY (e.g. Yellow croakers).
Destructive
Frequent practices of illegal fishing techniques and bottom trawls
Practicing of illegal fishing techniques and bottom trawls which can easily destroy the bottom
3
fishing practices
seriously destroyed the aquatic habitats.
habitats is common.
Unsustainable
Transboundary implications in competition for common fishing grounds
Conflicts in use or encroachments on fishing grounds by fishermen of these countries frequently
exploitation of
between Korea, China and Japan are evident.
reported.
living resources
Socio-economic
2-1-31
Overexploitation leads to reduced CPUE, lower catches, which affect employment opportunities in
impacts
Employment opportunities in fisheries sector substantially decreased.
the fisheries sector.
Livelihood of local communities significantly changed.
The change is due to loss of commercially valuable fish species and destruction of habitats.
More than 20% reduction of stream flow in the major rivers of China over the past 30 years (e.g.
Modification of
3
Water flow in major rivers significantly reduced.
Huai River). There is measurable reduction in water flow mainly due to damming in Korea (e.g.
stream flow
upstream damming in Han River and estuarine river damming in Keum and Yongan rivers).
Pollution of
Fish kills due to pollution in many drainage basins >25 000 km2 were often reported in China (e.g.,
3
Fish kills due to pollution in rivers are evident.
existing supplies
Huai River, which is the most serious). Fish kills frequently occurred in Korean rivers during summer.
Freshwater
shortage
In China, high cost (billions of USD) projects needed to divert water supply from the water-rich
Serious freshwater shortage problem is evident on the Chinese side
south to northern semi-arid areas (including the Yellow Sea area) for mitigating freshwater
of the Yellow Sea involving spending 6-7 billion USD annually for
Socio-economic
shortage. Hydroelectric power production affected (e.g. Weihai power plant in China stopped
2-1-11
mitigation.
impacts
production due to insufficient supply of water in summer).
Conflicts among local governments for use of water, migration of people Conflicts among local governments for water and migration of people as a result of water shortages
from water shortage areas and effects on human health are evident.
frequently reported.
Note: 1 Indicates overall scores for Social-Economic-Health, respectively.
ASSESSMENT
37
38
GIWA REGIONAL ASSESSMENT 34 YELLOW SEA
Causal chain analysis
YELLOW SEA
This section aims to identify the root causes of the environmental
Habitat and community
and socio-economic impacts resulting from those issues and
modification and freshwater
concerns that were prioritised during the assessment, so that
shortage
appropriate policy interventions can be developed and focused
where they will yield the greatest benefi ts for the region. In order
to achieve this aim, the analysis involves a step-by-step process
The impacts arising from the issue of modifi cation of stream fl ow are
that identifi es the most important causal links between the
serious as demonstrated by the measurable and signifi cant reduction of
environmental and socio-economic impacts, their immediate
water fl ow in the major river systems on both the Chinese and Korean
causes, the human activities and economic sectors responsible
sides of the region. The impacts resulting from the issue of pollution
and, fi nally, the root causes that determine the behaviour of those
of existing supplies include the signifi cant deterioration of habitats
sectors. The GIWA Causal chain analysis also recognises that,
along rivers in China and incidences of fi sh kills in the river systems of
within each region, there is often enormous variation in capacity
the region.
and great social, cultural, political and environmental diversity.
In order to ensure that the fi nal outcomes of the GIWA are viable
There has been signifi cant losses of habitat in the region in the past
options for future remediation, the Causal chain analyses of the
30 years, with losses covering a wide range of habitats including
GIWA adopt relatively simple and practical analytical models and
freshwater marshlands, lakes, rivers, lagoons, muddy foreshores, rice
focus on specifi c sites within the region. For further details on the
fi
elds, sandy foreshores and seagrass (Zostera marina) beds. Also,
methodology, please refer to the GIWA methodology chapter.
many habitats e.g. neritic systems, lakes, rivers, muddy shores and
estuaries in the region have been signifi cantly modifi ed as evidenced
Based on the results of the assessment for the region, the GIWA issues
by their obvious changes in biodiversity, ecological functions, species
assessed to have the severe environmental impacts have been selected
population structure and complete or partial replacement of endemic
for the following analysis. They are as follows:
with alien species (e.g., the exotic salt hay, Spartina marina) observed
Modifi cation of stream fl ow;
over the past decades.
Pollution of existing supplies;
Loss of ecosystems or ecotones;
Figure 11 illustrates the causal links for habitat and community
Modifi cation of ecosystems or ecotones;
modifi cation and freshwater shortage in the Yellow Sea region.
Overexploitation;
Destructive
fi
shing
practices.
Environmental impacts
Major impacts of freshwater shortage and habitat and community
These issues are analysed in two causal chain analyses; the fi rst
modifi cation in the region are for example (for more information and
one targeting habitat and community modifi cation as well as
references see Assessment):
freshwater shortage problems in the region, and the second targeting
The major Chinese river basins such as Huai and Yalu rivers have
overexploitation and destructive fi shing practices.
shown more than 20% reduction in stream fl ow over the past
CAUSAL CHAIN ANALYSIS
39
Concerns
Immediate causes
Sectors/Activities
Root causes
Agriculture
Natural causes
Freshwater shortage
Modification of stream flow
Industry
Demographic
Habitat and community
Pollution of existing supplies
modification
from land-based sources
Technology
Infrastructure provision
Loss and modification of
freshwater habitats
Economic
Urbanisation
Knowledge
Introduction of alien species
Transportation
Legal
Aquaculture
Figure 11 Causal chain diagram illustrating the causal links for habitat and community modifi cation and freshwater shortage in the Yellow
Sea region.
30 years. There has also been a measurable reduction in water
fl ow in the major rivers on the Korean side of the region.
Immediate causes
More than 10% of the Huai River Basin on the Chinese side of the
Modifi cation of stream fl ow
region has been polluted, causing habitat deterioration and an
The changes of stream fl ow are mainly caused by increased diversion
inability to support fi sh.
of water for irrigation, industrial and domestic uses as well as upstream
Fish kills in many drainage basins of more than 25 000 km2 have
damming and draining for fl ood control and increased agricultural
often been reported on the Chinese side of the region, e.g. Huai
activities. Main river basins or systems that contribute to the sources
River, which is the most aff ected. Fish kills frequently also occur in
of freshwater supplies in the region include those associated with the
rivers on the Korean side of the region during summer.
Huai River (Huaihe), Yalu River (Yalujiang), Han River, Kum River and
More than 30% of the total area of freshwater marshlands, lakes,
Yongsan River. Among them, the Yalu River Basin is the largest, and
rivers, lagoons and muddy foreshores and 10% of rice fi elds have
separates China from North Korea (WRI 1998a). The uneven distribution
been lost over the past 30 years.
of water reserves in China has created severe shortages, even though
More than 40% of the total area of sandy foreshores have been lost
the Yangtze and Yellow rivers together posses huge water reserves.
over the past 30 years.
For example the areas north of the Yangtze River, particularly the
Signifi cant losses of seagrass beds, e.g. Zostera marina has occurred
northwest region and the North China Plain, which account for 60%
in the Korean side of the region.
of China's land mass and half of the country's population, receive
Biodiversity and ecological functions of the neritic systems have
only 20% of the nation's water resources. The situation of freshwater
been seriously modifi ed.
shortage in northern China is further aggravated by serious soil erosion,
Volume and biodiversity of lakes and rivers have changed
deforestation, land conversion, excessive water usage for agricultural
signifi cantly.
production and conversion of wetlands along lake shores into rice fi elds
Muddy shores have been greatly modifi ed with increased number
(SEPA 2003a,b).
and species of opportunistic organisms.
Species population structure in estuaries has been greatly modifi ed
Pollution of existing supplies from land-based sources
with increased dominance of red tide organisms.
The region suff er from pollution through waste discharges high in
There has been obvious replacement of endemic with alien species
nutrients, trace metals and organics from land-based point and non-
such as the salt hay (Spartina marina) and biodiversity modifi cation
point sources that alters the overall biodiversity of the ecosystems.
through disease introduction, for example disease caused by
More than 10% of the Chinese part of the Huai River Basin is polluted,
Perkinsus sp. in clams.
mainly by discharges from various chemical and paper pulp factories
40
GIWA REGIONAL ASSESSMENT 34 YELLOW SEA
located along the River. The number of factories in the Huai River Basin
Sectors
has increased from 365 in 1996 to 1 320 in 2002 (Wang et al 2003).
Agriculture
Along the west coast of the Korean Peninsula, mass fi sh kills involving
The agricultural sector is responsible of both changes in stream fl ow,
the death of thousands of fi sh each time have occurred in river basins
pollution of existing supplies and modifi cation of ecosystems. The
more than twice each summer due to oxygen depletion, mainly as a
increased farming and expansion of farmed areas have led to increased
result of industrial discharges and agricultural run-off (US-AEP 2003,
demands and uses of waters for irrigation. There has also been an
MOE 2003).
excessive use of fertilisers and pesticides, which have polluted the
nearby water basins and lead to a degradation of freshwater habitats.
Modifi cation and loss of freshwater habitats
The increased or uncontrolled use of fertilisers and pesticides has
The main threat to the coastal habitats of the region is intensive coastal
resulted in agricultural run-off high in nutrients and organics, causing
development and land reclamation, especially in estuaries and shallow
habitat modifi cation in the region. The increased building of tidal
bays. During the past decades, many sites have been reclaimed,
embankments to protect crops and increased farming and expansion of
resulting in the loss of approximately 25% of the total tidal fl ats in the
farming areas has lead to changes in freshwater inputs and discharges,
region (Simard 1995). The waste materials and pollutants from industrial
which has modifi ed freshwater habitats in the region.
complexes, coastal cities, and tourism and recreational activities also
degrade coastal habitats. Changes in freshwater inputs and discharges
Industry
through increased diversion of stream waters for irrigation and building
The increased industrial development in the region has led to increased
of tidal embankments that change stream fl ow rates, has also lead to
reclamation of coastal land areas to be used for the establishment of
losses of freshwater habitats. For example more than 30% of the mud
factories or other industrial installations. This reclamation has destroyed
bottom habitat in the region has been lost over the past 30 years due to
a number of coastal habitats for example costal wetlands. Changes in
increased mariculture activities, opening up of salt-pans, and increased
the types of industries and increased human settlements following
agricultural activities, as well as land reclamation. Some damage also
industrial development has increased the demand of freshwater in
occurred to the estuaries at the mouth of Huai River (Li 2003). There is
the region. Increased discharges of solid wastes and untreated and/
also evidence of heavy erosion of sandy foreshores on the Chinese side
or partially treated wastewater high in trace metals and other harmful
of the region. The erosion is mainly due to sand mining of the beaches,
pollutants from factories and other industrial installations have modifi ed
road construction, and recreational activities along the coastal plains
habitats in the region.
(SEPA 2001). There has also been losses of sandy foreshores due to road
construction on the Korean side of the Yellow Sea, however the extent
Infrastructure provision
of loss is not known (GEF 2001).
The building of dams and dikes upstream in the river system for fl ood
control has lead to changes in stream fl ow.
Introduction of alien species
The introduction of alien species and diseases have modifi ed the
Urbanisation
population structures and has replaced endemic species. There has
Rapid urbanisation following the increased economic growth in the
been a decrease in genetic diversity and species composition in clams
region has led to increased reclamation of more lands for human
and oysters in the region, mainly due to aquaculture and releases of
settlements, which has destroyed many of the natural habitats.
hatchery-produced larvae, however this has not depleted the resources
(NEPA 1994). A measurable decline of native populations due to the
Transportation
introduction of alien species has occurred in Korean reservoirs (Choi
Increase in shipping traffi
c in the region has raised the risk of introducing
pers. comm.). Genetic diff erences in prawns as a result of the mass
alien species in ballast water and/or by attachment to ship hulls, which
release of prawn larvae from aquaculture prawns have been observed
can lead to changes in the endemic species population structure in
in both Korean and Chinese waters (NEPA 1994). Pollution and diseases
several habitats of the region.
have caused decreases in production and species composition of
bivalves, clams and cockles but not to the extent that they could cause
Aquaculture
resource depletion (Yuxiang pers. comm.).
Both the introduction of alien species for culture and the outbreak of
diseases have been found to alter species composition in habitats near
aquaculture facilities in the region.
CAUSAL CHAIN ANALYSIS
41
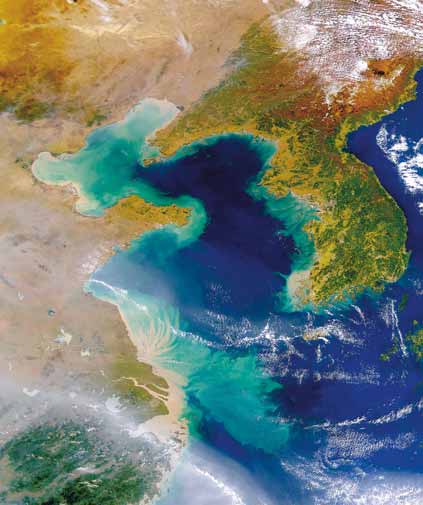
Root causes
Demographic
Increased industrialisation in the region has been found to attract
mass migration of the rural population to urban areas where more job
opportunities exist. Population growth, particularly on the Chinese side
of the region, is relatively rapid. This growth has resulted in the need
to convert more lands for human settlements. At the same time, the
increased population growth also increased the demand for food and
agricultural products, resulting in the increased use of stream water
for crop production as well as an increasing demand of fertilisers and
pesticides.
Technology
Poor systems for crop irrigation are a relatively common in the region's
agricultural sector. This has led to ineffi
cient use, often loss, of the
stream waters diverted from adjacent river systems.
Economic
Relatively fast economic growth has changed the economic structure in
the region, which has led to an increase in industrial activities resulting
in increased water demand. The increased human settlements in the
region has resulted in not only elevated consumption of water resources
but also the increased requirements for fl ood preventions. The increased
economic growth has led to rapid industrial development that increases
the needs to reclaim more coastal land areas for establishment of industrial
centres; this reclamation has destroyed several coastal habitats, such as
the coastal wetlands. The rapid industrial development has also increased
Figure 12 The
Yellow
Sea.
discharges of harmful pollutants by industries, negatively aff ecting the
(Photo: NASA)
nearby water habitats. Many industries in the region will require greater
investment in the pollution prevention and wastewater treatment
environmental impacts, which results in an excessive use of fertilisers
facilities to reduce the discharge of pollution wastes. The increased
and pesticides to enhance crop production.
trade and energy demand has led to an increase in transportation in the
region, resulting in an increased risk of introducing invasive species. The
Legal
improved the standard of living so that the market demand for cultured
The insuffi
cient enforcement of regulations and laws has resulted in
fi sh has increased, leading to increased aquaculture development.
lack of control of waste discharge by industries in the region as well as
use of fertilisers and crop farming practices. More eff orts are needed
Knowledge
to strengthen enforcementThere is also insuffi
cient regulation and
The excessive use of fertilisers and pesticides by farmers could be due
enforcement mechanisms to control the introduction of alien species,
to: (i) little access for farmers to technical and scientifi c information
both via maritime traffi
c and aquaculture.
related to the effi
cient use of fertilisers and pesticides for crop
production; and (ii) low education levels common to farmers, which in
Natural causes
turn make it diffi
cult for them to access useful information. Awareness of
Typhoons, causing storms and fl oods, occur frequently in the region.
the environmental impacts of overuse of fertilisers is still lacking in the
Increased deforestation has further aggravated fl ood problems brought
region. This can lead to indiscriminate use of fertilisers and pesticides
about by typhoons and El Nińo. As a result, more fl ood-mitigation
by farmers, thus increasing agricultural run-off high in nutrients and
infrastructure, such as the building of dams and dikes, has been
other harmful pollutants. Profi t-oriented farmers often disregard
developed for protection of human life and property.
42
GIWA REGIONAL ASSESSMENT 34 YELLOW SEA
Concerns
Immediate causes
Sectors/Activities
Root causes
Unsustainable
Overexploitation
exploitation of fish
Fishery
Demographic
and other living
resources
Economic
Technology
Destructive fishing practices
Knowledge
Figure 13 Causal chain diagram illustrating the causal links for unsustainable exploitation of living resources in the Yellow Sea region.
Unsustainable exploitation of
Destruction of aquatic habitats and excessive catch of recruitment
fish and other living resources
stocks have led to depletion of fi sh populations;
Employment rates have decreased by 30-50% due to overfi shing
The Yellow Sea region is one of the most intensively exploited areas in
and environmental degradation with substantial impact on the
the world; many stocks were intensively exploited by Chinese, Korean,
local population;
and Japanese fi shermen following the introduction of bottom trawlers
Business opportunities in the seafood processing industries have
in the early 20th century (Tang 2003). The increase in fi shing eff ort and
decreased by around 10% due to decreased catch per unit eff ort
its expansion has resulted in almost all major stocks being fully fi shed
(CPUE) experienced by fi shing fl eets.
by the mid-1970s and overfi shed by the 1980s (Zhang & Kim 1999,
Tang 2003). Catches of the major economic species such as prawns
Immediate causes
(Metapenaeus joyneri, Parapenaeopsis tenellus), Small yellow croaker
Overexploitation
(Pseudosciaena polyactis), and Hairtails (Trichiurus brevis), exceeding their
There has been an introduction of new, improved and more effi
cient
MSY (maximum sustainable yield) levels has occurred in all coastal seas
fi shing technologies in the region. The increase in fi shing eff ort and it's
along the Chinese and Korean coasts of the region (GEF/UNDP 2000).
the increasing number of fi shing fl eets have resulted in overexploitation
of living resources, with almost all major stocks being fully fi shed by
Common destructive fi
shing practices in the region include
the mid-1970s and overfi shed by the 1980s (Zhang & Kim 1999, Tang
indiscriminate trawling along the coastal waters of Yellow Sea, fi shing
2003).
with explosives in lakes, and use of pesticides for fi shing (Jin 2003, MOE
2003). As a result of these destructive fi shing practices, aquatic habitats
Destructive fi shing practices
have been destroyed, leading to the collapse of fi sh populations and
Destructive fi shing practices is common in the region and include
loss of biodiversity. The long-term implications for the protection of the
bottom trawling along the coastal waters of the Sea, use of pesticides
environment and resource conservation after such destructive fi shing
for fi shing and fi shing with dynamite in lakes. These fi shing practices are
practices are obvious.
characterised by a low input of capital and high yields.
Figure 13 illustrates the causal links for unsustainable exploitation of
Root causes
living resources in the Yellow Sea region.
Demographic
The increase in population growth has resulted in an increased demand
Environmental and socio-economic impacts
for food, including seafood, which in turn promote increased fi shing.
Overexploitation and destructive fi shing practices have led to the
Economic
following environmental and socio-economic impacts (for more
Profi t motive in fi shing, disregarding environmental consequences,
information and references see Assessment):
has led to the uncontrolled entry of fi shing vessels, resulting in
Fisheries resources have been highly overexploited, exceeding their
overexploitation of the marine resources. There has also been an
maximum sustainable yields (MSYs);
increased market demand for seafood in the region, which has led
CAUSAL CHAIN ANALYSIS
43
Table 5
Summary of the causal chain analysis for the Yellow Sea region.
GIWA Concern
Immediate causes
Sectors
Root causes
Agriculture: Increased crop farming activities and expansion in the
Demographic: Increased population growth.
Modification of stream flow:
farming areas.
Technology: Poor crop irrigation systems.
Changes in stream water inputs due to increased diversion
Industry: Changes in the types of industries and increased human
Economic: Changes in economic structures.
of stream waters for irrigation, industrial and domestic
settlements following the industrial development.
Economic: Increase in economic growth.
uses; and upstream damming/diking for flood control
and for meeting the water requirements by the increased
Natural causes: Increased deforestation and incidence of
Infrastructure provision: Building of dams and dikes upstream of the
natural disasters (e.g. typhoons and El Nino).
Freshwater
agricultural activities.
river systems for flood control.
Economic: Increase in economic growth.
shortage
Knowledge: Inadequate access to technical and scientific
Agriculture: Excessive use of fertilisers and pesticides by farmers.
information. Knomledge: Lack of awareness on environmental
Pollution of existing supplies from land-based sources:
impacts due to excessive use of fertilisers and pesticides.
Increased inputs of pollutants from land-based point and
non-point source
Economic: Insufficient investment in facilities for pollution
Industry: Increased discharge of treated and/or partially treated
prevention and wastewater treatment.
industrial wastewaters due to rapid industrial development.
Legal: Insufficient enforcement of regulations and laws.
Economic: Increased economic growth.
Loss and modification of ecosystem:
Industry: Increased industrial development leading to increased
Demographic: Increased population growth.
Reclamation of coastal land for industrial development and
reclamation of coastal land areas to be used for establishment of
Legal: Lack of or insufficient regulations, policy or enforcement
urbanisation leading to destruction of coastal habitats.
factories or other industrial installations.
mechanism.
Changes in freshwater inputs/discharges through increased
Urbanisation: Rapid urbanisation following the increased economic
diversion of stream waters for irrigation and building of
Demographic: Mass population migration to urban areas.
growth leading to increased reclamation of more lands (with natural
tidal embankments that changed the stream flow rates,
Demographic: Increased population growth.
habitats) for human settlements.
leading to loss of freshwater habitats such as the freshwater
Agriculture: Activities include: (i) increased building of tidal
Habitat and
marshlands. Pollution through waste discharges high in
embankments to protect crop production; (ii) increased or
Demographic:Increased population growth
community
nutrients, trace metals and organics from land-based point
uncontrolled uses of fertilisers and pesticides by crop farms; and (iii)
Knowledge: Profit-oriented with disregard to environmental
modification
and non-point sources which alters the overall biodiversity
of the ecosystems.
increased crop farming activities and expansion of farming areas,
impacts attitudes of farmers.
leading to increasing use of stream water for irrigation.
Transportation: Increase in shipping traffic had raised the chances
Economic: Increased trade and energy demand.
Introduction of alien species:
of introducing invasive species through ballast water and/or
Legal: Lack of or insufficient regulations, policy or enforcement
Introduction of invasive species and diseases which modifies attachment to ship hulls.
mechanism.
the species population structure and replacement of
Aquaculture: Both introduction of alien species for culture and
Economic: Increased economic growth.
endemic with alien species.
outbreak of diseases have been found to alter the species population
Legal: Lack of or insufficient regulations, policy or enforcement
structure in habitats in the premises of aquaculture facilities.
mechanism.
Overexploitation:
Fishery: Activities include the easy access to improved fishing
Deographic: Increased population growth.
Improved efficiency of fishing practices by introduction
technologies in the fisheries sector encouraging more efficient
Technology: Profit motive in disregard of the environmental
of improved fishing technology. Increased fishing efforts
fishing practices, and increased number of fishing fleets entering the consequences.
Unsustainable
leading to overexploitation of living resources.
fishing industry leading to increased fishing efforts.
Economic: Increased market demands for seafood.
exploitation of
Destructive fishing practices:
living resources
Low capital input and high yield characteristics of the
Fishery: Activities include the technology and supplies related to the
Knowledge: Lack of public awareness on the consequences of
destructive fishing practices (e.g., bottom trawling and
destructive fishing practices are readily available and of easy access
destructive fishing practices.
dynamite fishing) leading to frequent practices of such
to fishermen.
Economic: Increased market demand for seafood.
fishing gear.
to increased fi shing activities, including the use of destructive fi shing
fi shing practices has led to uncontrolled use of such destructive fi shing
practices, without regard for the consequences related to the depletion
techniques.
of marine resources.
Technology
The easy access to improved fi shing technologies has encourage
Conclusions
effi
cient and destructive fi shing practices, and has also increased the
number of fi shing fl eets in the region.
Table 5 summarise the immediate causes, sectors and root causes in
for freshwater shortage, habitat and community modifi cation as well as
Knowledge
unsustainable exploitaion of living resources in the Yellow Sea region.
The lack of public awareness of the consequences of destructive
44
GIWA REGIONAL ASSESSMENT 34 YELLOW SEA
Policy options
YELLOW SEA
This section aims to identify feasible policy options that target
The Yellow Sea has been overexploitated since the 1980s. Fishing
key components identifi ed in the Causal chain analysis in order to
with destructive methods is common throughout the region and
minimise future impacts on the transboundary aquatic environment.
many aquatic habitats in have been destroyed and fi sh stocks have
Recommended policy options were identifi ed through a pragmatic
collapsed. Common destructive fi shing practices in the region include
process that evaluated a wide range of potential policy options
indiscriminate trawling along the coastal waters of Yellow Sea, fi shing
proposed by regional experts and key political actors according
with explosives in lakes, and use of pesticides for fi shing.
to a number of criteria that were appropriate for the institutional
context, such as political and social acceptability, costs and benefi ts
The transboundary issues that need to be addressed are the
and capacity for implementation. The policy options presented in
management of marine resources, industrial pollution, and ecosystem
the report require additional detailed analysis that is beyond the
health. Progress is being made in the introduction of ecosystem-based
scope of the GIWA and, as a consequence, they are not formal
management for the LME (Zhang & Kim 1999). The GEF is supporting
recommendations to governments but rather contributions to
a Yellow Sea LME project involving China and South Korea. The long-
broader policy processes in the region.
term objective of the project is to ensure environmentally sustainable
management and use of the Yellow Sea LME and its watershed by
reducing development stress and promoting sustainable development
of the ecosystem (Yellow Sea Project Brief 2000). In order to achieve its
objective this project will prepare a Transboundary Diagnostic Analysis
Definition of the problem
(TDA), National Yellow Sea Action Plans (NYSAPs), and a regional Strategic
Action Programme (SAP). The project will also initiate and facilitate the
The assessment and Causal chain analysis have shown that the priority
implementation of the SAP. It will also build upon the institutional and
environmental concerns in the Yellow Sea region are freshwater shortage,
programmatic framework put in place by the Northwest Pacifi c Action
habitat and community modifi cation, and unsustainable exploitation of
Plan (NOWPAP), the Tumen River Area Development Programme
living resources. The region has experienced both signifi cant reduction of
(TRADP). Management of the transboundary environmental issues in
water fl ow in the major river systems on both the Chinese and Korean side,
the region may be hindered by the following problems:
as well as pollution of existing water resources, mainly from agriculture and
Ineff ective measures for the control of the overexploitation of coastal
industrial activities. There have been signifi cant losses and modifi cation of
and marine fi sheries, particularly the shared stocks in the Yellow
habitats in the region during the past 30 years. Increased industrialisation
Sea;
has attracted mass migration of the rural population to urban areas. This
Lack of strong political will on the part of riparian states bordering
rapid population growth has resulted in the need to convert more lands
the Yellow Sea to arrest the continued degradation and destruction
for human settlement as well as an increase of discharge of harmful
of coastal and marine habitats;
pollutants to the water bodies. At the same time, the population growth
Ineff ective existing national and international eff orts to prevent
has increased the demand for food and agricultural products, resulting
continued or imminent loss of endangered and threatened
in the increased use of freshwater for crop production.
species;
POLICY OPTIONS
45
Ineff ective existing national and international eff orts to arrest
Adoption of effi
cient law enforcement mechanisms to prevent
degradation of coastal water quality due to discharge of pollutants
illegal logging and other destructive practices.
from land- and sea-based activities;
Adoption of programmes for raising public awareness and
Inadequate
and/or
ineffi
cient enforcement and compliance of
participation in forest management and restoration.
national and international legal instruments/conventions such as
the United Nations Framework Convention on Climate Change,
Strategic Action Programme (SAP):
Convention on Biodiversity, Global Programme of Action (GPA);
Development, harmonisation and enforcement of a legislative
Lack of eff ective regional cooperation to address and resolve
framework for the implementation of the Natural Forest Protection
transboundary environmental issues.
Programme (NFPP).
Implementation of integrated forest management practices for
sustainable management of forest resources.
Implementation of integrated land management and integrated
Policy options and strategic
coastal management programmes to cope with the occurrence of
action programmes
natural disasters.
Development of relevant measures and practices to encourage
Suggested policy options and their associated strategic action
public participation in the planning and implementation of
programmes to address the key root causes as identifi ed in the
development activities associated with forest management and
previous section were formulated and reviewed by a panel of
restoration programmes.
experts previously involved in the GIWA scaling/scoping as well as
causal chain analysis workshops. The policy options and strategic
Economic: Insuffi
cient investment in facilities for pollution
action programmes for each of the key root causes in each of the
prevention and wastewater treatment
environmental problem areas of the region are described in the
Options:
following:
Promotion of market incentive systems to encourage the use of
green production technologies in the industry sector.
Freshwater shortage
Enhancement of laws and enforcement mechanisms related to
Technology: Poor crop irrigation systems
pollution prevention and wastewater treatment practices.
Options:
Integration of the development and management of agricultural
Strategic Action Programme (SAP):
irrigation systems with integrated river basin management
Formulation and implementation of public awareness campaign
programmes.
programmes for good practices in agriculture.
Adoption and promotion of water-saving technologies for crop
Development and implementation of market incentive programmes
irrigation.
to encourage the use of green production technologies and to
reduce discharge of polluting wastes.
Strategic Action Programme (SAP):
Implementation of relevant irrigation system(s) within the
Knowledge: Lack of awareness of environmental impacts due to
framework of integrated river basin management programmes for
excessive use of fertilisers and pesticides
crop production.
Options:
Selection and introduction of modern and water-saving irrigation
Adoption of laws, regulations and enforcement mechanisms to
technologies for crop production.
control the use and disposal of fertilisers and pesticides.
Adoption of educational and public awareness campaign
Natural causes: Increased deforestation and incidence of
programmes for good agricultural practices.
natural disasters
Adoption of sustainable soil management system(s) to improve the
Options:
soil fertility and productivity.
Adoption of the Natural Forest Protection Programme (NFPP) to
Adoption of effi
cient soil fertility improvement technology and
cope with uncontrolled deforestation.
crop irrigation systems to improve soil productivity.
Adoption of integrated forest management practices.
46
GIWA REGIONAL ASSESSMENT 34 YELLOW SEA

Figure 14 Ricefi eld at dawn in Jiangsu Province, China.
(Photo: Corbis)
Strategic Action Programme (SAP):
Habitat and community modification
Development, harmonisation and enforcement of a legal
Demographic: Mass population migration to urban areas
framework to control the use and disposal of fertilisers and
Options:
pesticides.
Adoption of laws, regulations and enforcement mechanisms to
Development and implementation of public education and
restrict the population migration.
awareness campaign programmes on good practices in
Adoption of the development of small, rural-oriented urban centres
agriculture.
in rural areas to cope with population migration.
Analysis and selection of relevant sustainable soil management
system(s) as well as development and implementation of the
Strategic Action Programme (SAP):
system(s) for improvement of soil fertility and productivity.
Development and enforcement of a suitable legal framework to
Development and implementation of suitable soil fertility
restrict mass migration of population from rural to urban areas.
and irrigation improvement technologies to enhance soil
Development and implementation of small, rural-oriented urban
productivity.
centres in rural areas to cope with population migration.
POLICY OPTIONS
47
Legal: Lack of or insuffi
cient regulations, policy or enforcement
Adoption of alternative livelihood programmes for fi shermen and
mechanism
other fi sheries operators.
Options:
Adoption of public awareness and education programmes on the
Adoption of laws, regulations and enforcement mechanisms to
environmental and social consequences of overexploitation of the
promote good practices in agriculture including minimisation of
fi sh resource.
the discharge of agricultural run-off high in harmful pollutants.
Adoption of laws, regulations and enforcement mechanisms
Strategic Action Programme (SAP):
to restrict the introduction of alien and invasive species for
Development of relevant policy and legal framework to restrict the
aquaculture.
practice of destructive fi shing methods.
Adoption of programmes related to raising public awareness of and
Development and implementation of alternative livelihood
participation in good practices in agriculture and recogniszing the
programmes to reduce the entry of excessive number of fi shermen
environmental impact of introducing exotic and invasive species
into the fi shing industry.
for aquaculture.
Development and implementation of public awareness and
education programmes on the environmental and social
Strategic Action Programme (SAP):
consequences of overexploitation of the fi sheries resource.
Development and enforcement of suitable laws and regulations
Economic: Increased market demand for seafood
to promote good practices in agriculture and to restrict the
Options:
introduction of alien and invasive species for aquaculture.
Adoption of sustainable production practices to enhance fi sheries
Creation and implementation of public awareness campaign and
and aquaculture production.
education programmes on good practices in agriculture and on
recognising the environmental impact of introducing exotic and
Strategic Action Programme (SAP):
invasive species for aquaculture.
Development and promotion of sustainable fi
sheries and
aquaculture production methods to enhance fi sheries production
Knowledge: Profi t-oriented farmers who disregard
to meet market demand for seafood.
environmental impacts
Options:
Knowledge: Lack of public awareness of the consequences of
Adoption of programmes to raise public awareness of and
destructive fi shing practices
participation in good practices in using fertilisers and pesticides.
Options:
Adoption of sustainable agriculture production technologies that
Enhancement of law enforcement mechanisms to restrict
would minimise the use of fertilisers and pesticides.
destructive fi shing practices.
Adoption of public awareness campaigns and education
Strategic Action Programme (SAP):
programmes on the environmental and social consequences of
Creation and implementation of public awareness campaign
destructive fi shing practices.
and education programmes for the eff ective use of fertilisers and
pesticides.
Strategic Action Programme (SAP):
Selection and implementation of sustainable agriculture
Development and implementation of policy and law enforcement
production technologies that could minimise the use of fertilisers
mechanisms to restrict destructive fi shing practices.
and pesticides.
Development and implementation of public awareness and
education programmes on the environmental and social
Unsustainable exploitation of living resources
consequences of destructive fi shing practices.
Knowledge: Profi t-oriented enterprises that disregard
environmental consequences
Options:
Enhancement of laws, regulations and enforcement mechanisms to
restrict the entry of excessive fi shing fl eets and fi shermen into the
fi shing industry.
48
GIWA REGIONAL ASSESSMENT 34 YELLOW SEA
References
YELLOW SEA
Asianinfo (2004). Korea's geography. AsianInfo.org, Ridgeland, USA.
JICA (2002). Country profi le on environment China. Planning and
Retrieved September 2004 from: http://www.asianinfo.org/
Development Department, Japan International Cooperation
asianinfo/korea/geography.htm
Agency (JICA), Japan.
Baker, M. (2002). Shorebirds of the Yellow Sea importance, threat and
Jin, X. (2003). Marine fi shery resources and management in China. Yellow
conservation status. Wetland International, China. International
Sea Research Institute, Qingdao, China. Retrieved September 2003
Studies 12.
from: http://www.lib.noaa.gov/china/marineresoruce.htm
CIA (2003). The World Factbook. USA Central Intelligent Agency
Kim, H.J. (1998). Marine environmental cooperation in northeast Asia.
Crossland, C. and Crossland, J.I.M. (2000). Yalujiang River estuary, China-
Harvard University, USA.
North Korea. University of Sweden, Sweden. Retrieved on June 10,
Li, L. (2003). News of China's wetlands, January 2002. Wetlands
2003 from: http://data.ecology.su.se/mnode/Asia/YalujiangRiver/
International, China. Retrieved September 2003 from: http://
yalujiang_river_estuary.htm
www.wetwonder.org
FAO-AQUASTAT (2004). Democratic People's Republic of Korea. FAO-
Liu, C. and He, X. (2001). Water problem strategy for China's 21st century.
AQUASTAT 1997 version. Food and Agriculture Organisation of
Beijing: Science Press. (in Chinese).
the Uni8ted Nations (FAO), Rome, Italy. Retrieved January 2004
LME (2005). LME 48: Yellow Sea. Large Marine Ecosystems of the
from: http://www.fao.org/ag/agl/aglw/aquastat/countries/korea_
World. Retrieved April 2005 from: http://saup.fi sheries.ubc.ca/lme/
d_p_rp/index.htm
LMEgraph.ASP?LMEgraph=48
GEF (2001). Conservation of globally signifi cant wetlands in the
Lu, X. (1998). Potential impact of global climate change on river
Republic of Korea project brief. Global Environment Facility (GEF),
discharge in China. UNU/IAS Working Paper No. 53. Commission for
Washington D.C., USA.
Integrated Survey of Natural Resources (CISNAR), Chinese Academy
GEF/UNDP (2000). Yellow Sea Large Marine Ecosystem preliminary
of Sciences (CAS), Beijing, China.
transboundary diagnostic analysis. Global Environment Facility/
MF (2003). China's ten economic hot spots. Ministry of Finance (MF),
United Nations Development Programme (GEF/UNDP), YSLME
People's Republic of China. Retrieved October 2003 from: http://
TDA Draft 9, 11/11/01.
www.iist.unu.edu/china/ChinaInBrief/17E5423p.html
Gregory, R.C. and Richard, A. (2003). Baseline assessment of acid
MOE (1996). Environmental statistics yearbook. Ministry of Environment,
deposition in Northeast Asia Region. Department of Chemical
Republic of Korea.
and Biochemical Engineering, Center for Global and Regional
MOE (2003). Green Korea 2003. Ministry of Environment (MOE), Republic
Environmental Research, USA. Retrieved October 2003 from: http:
of Korea.
//www.nautilus.org/papers/energy/carmichaelESENAY1.pdf
MOMAF (1998). Annual report of fi sheries trends 1998. Ministry of
Haas, P.M. (1998). Prospects for eff ective marine governance in the
Maritime Aff airs & Fisheries (MOMAF), Republic of Korea.
northwest Pacifi c region. Department of Political Science, University
MOWR (2003). Brief introduction of the planning for South-to-North
of Massachusetts-Amherst, USA.
Water Transfers. Ministry of Water Resources (MOWR), China.
Retrieved September 2003 from: http://www.mwr.gov.cn/english/
project_introduction/nsbd/24.htm
REFERENCES
49
NEPA (1994). China biodiversity conservation action plan. National
Tang, Q. (1989). Changes in the biomass of the Yellow Sea Ecosystem, p
Environmental Protection Agency (NEPA), Beijing, China.
7-35 In: Sherman, K. and Alexander, L.M. (eds.) Biomass yields and
OECD (1997). Towards sustainable fi sheries: country reports Korea.
geography of large marine ecosystems. AAAS Selected Symposium
p 381-391 In: OECD Report No. OCDE/GD(97)199. Organisation for
111. Boulder: Westview Press.
Economic Co-operation and Development (OECD), Paris, France.
Tang, Q. (1993). The eff ect of long-term physical and biological
ORNL (2003). Landscan 2002. Oak Ridge National Laboratory. Retrieved
perturbations on the contemporary biomass yields of the Yellow
Nov. 2003 from: http://www.ornl.gov.gist
Sea ecosystem. p 79-93 In: Sherman, K., Alexander, L.M. and
PDO (2004). Global warming accelerate China's sea level rise. People's
Gold, B.D. (eds.) Large marine ecosystems: stress, mitigation, and
Daily Online (PDO), Beijing, China. Retrieved January 2004 from:
sustainability. AAAS Symposium. AAAS Press, Washington, DC.
http://english.peopledaily.com.cn/200204/13/print20020413_
Tang, Q. and Jin, X. (1999). Ecology and variability of economically
93966.html
important pelagic fi shes in the Yellow Sea and Bohai Sea. In:
SEPA (2001). Report on the state of the environment in China 2001. State
Sherman, K. and Tang, Q. (eds.) Large marine ecosystems of the
Environmental Protection Administration (SEPA), Beijing, China
Pacifi c Rim: assessment, sustainability, and management. Blackwell
SEPA (2003a). Water resources degradation. State Environmental
Science, Inc., Malden (Mass.), USA.
Protection Administration (SEPA), People's Republic of China.
Tang, Q. (2003). The Yellow Sea LME and mitigation action. p 121-144 In:
Retrieved August 2003 from:http://www.chinaenvironment.com/
Hempel, G. and Sherman, K. (eds.). Large marine ecosystems of the
english/channel/pollution/waste/waterresource.html
world trends in exploitation, protection and research. Elsevier B.V,
SEPA (2003b). Rivers and lakes identifi ed for environmental protection.
Amsterdam, the Netherlands.
State Environmental Protection Agency (SEPA), People's Republic of
UNEP (2003). The National Standards of the People's Republic of
China. Retrieved August 2003 from: http://www.chinacp.com/eng/
China environmental quality standards for surface water. United
cppolicystrategy/cp_rivers_lakes.html
Nations Environment Programme (UNEP), Nairobi, Kenya. Retrieved
SEPA (2004). Report on the state of the environment in China 2002. State
September 2003 from: http://svrl-pek.unep.net/soechina/water/
Environmental Protection Administration (SEPA), Beijing, China.
standard.htm
Retrieved March 2004 from: http://www.zhb.gov.cn/english/SOE/
UNEP-RRC.AP (2003). DPR Korea: state of the environment 2003. United
soechina2002/index.html
Nations Environment Programme Regional Resource Center for Asia
She, J. (1999). Pollution in the Yellow Sea Large Marine Ecosystem:
and the Pacifi c (UNEP-RR.AP), Bangkok, Thailand.
monitoring, research, and ecological eff ects. p 419-426 In: Sherman,
US-AEP (2003). US-AEP country assessment: Republic of Korea.
K. and Tang, Q. (eds.) Large marine ecosystems of the Pacifi c Rim:
The United States Asia Environmental Partnership (US-AEP),
assessment, sustainability, and management. Blackwell Science,
Washington, D. C., USA. Retrieved September 2003 from: http://
Inc., Malden (Mass.), USA.
apocalypse.usaep.org/country/korea.htm
Sherman, K. (1989). Biomass fl ips in large marine ecosystems, p 327-
Wang, H., Qing, T.Y., Wang, Q.H., Luo, L. and Fei, Y. (2003). Sustainable
331 In: Sherman, K. and Alexander, L.M. (eds.) Biomass yields and
utilisation of water resources in the Yellow, Huai and Hai River Basins.
geography of large marine ecosystems. AAAS Selected Symposium
Beijing: Science Press. (in Chinese).
111. Boulder: Westview Press.
Wang, J.Y. and Zhiang, D.M. (2003). Marine management for Bohai and
Shim, S.-G. (2003). Trans-boundary air pollution in the Northeast Asian
Yellow Seas region. Beijing: Ocean Press. (in Chinese).
Region. Global Environmental Research Center, Korean Institute of
Wikipedia (2004a). Yalu River. Wikipedia Encyclopedia, World Wide Web
Science and Technology, Korea. Retrieved November 2003 from:
Find, USA. Retrieved January 2004 from: http://en.wikipedia.org/
http://www.unesco.or.kr/kor/science/data/ShimSG.doc
wiki/Yalu_River
Simard, F. (1995). Marine Region 16: Northwest Pacifi c report to World
Wikipedia (2004b). Geography of China. Wikipedia Encyclopedia,
Bank Environment Department. The World Bank, Washington D.C.,
World Wide Web Find, USA. Retrieved August 2004 from: http://
USA.
www.worldwidewebfi nd.com/encyclopedia/en/wikipedia/g/ge/
Sinton, J.E. (2003). Regional cooperation strategies to mitigate acid
geography_of_china.htm
rain in Northeast Asia: promoting energy effi
ciency in China.
World Bank (2003). China: air, land and water environmental priorities
Energy Analysis Program, Lawrence Berkeley National Library, USA.
for a new millennium. The World Bank, Washington D. C., USA.
Retrieved December 2003 from: http://www.glocom.ac.jp/eco/
esena/resource/sinton/AcidRain2.html
50
GIWA REGIONAL ASSESSMENT 34 YELLOW SEA
Xie, Y. and Wang, S. (2003). Chapter II. People and biodiversity. Institute
Zhang, C.I. and Kim, S. (1999). Living marine resources of the Yellow Sea
of Zoology, Chinese Academy of Sciences, Beijing, China. Retrieved
ecosystem in Korean waters: status and perspectives, p 163-178 In:
September 2003 from: http://www.chinabiodiversity.com/
Sherman, K. and Tang, Q. (eds.) Large marine ecosystems of the
shengwudyx2/training/chapter11.htm
Pacifi c Rim: assessment, sustainability, and management. Blackwell
Xinhuanet (2004a). Global warming to reduce glaciers, frozen soil,
Science, Inc., Malden (Mass.), USA.
snow in China. Xinhuanet, Beijing, China. Retrieved January 2004
Zhiang, D. and Wang, Z. (2000). Greater Bohai Region: sustainable
from: http://news.xinhuanet.com/english/2003-04/02/content_
oceanic economic development. Beijing: Ocean Press. (in
812777.htm
Chinese).
Xinhuanet (2004b). Sea level along Chinese coasts continues to rise.
Zhou, M., Zou, J., Wu, Y., Yan, T. and Li, J. (1995). Marine pollution and its
Xinhuanet, Beijing, China. Retrieved January 2004 from: http://
control in the Yellow Sea and Bohai Sea. The Yellow Sea, 1:9-16.
news.xinhuanet.com/english/2003-04/02/content_812777.htm
Zarsky, L. (2003). The domain of environmental cooperation in
Northeast Asiap. Portland State University, Portland, USA. Retrieved
Personal communication
September 2003 from: http://www.nautilus.org/papers/enviro/
Dr. Chung-Il Choi, September 2002
zarsky_domain.html
Dr. Tang Yuxiang, personal communication, September 2002
Zhang H.L and Wen, K. (2003). Flood control and management of large
Dr. Chen Shang, personal communication, September 2002
rivers in China: A case study of the Huaihe River basin. Nanjing
Dr. Chung-Il Choi, personal communication, September 2002
Institute of Hydrology and Water Resources. Retrieved September
Dr. Lin Tong, personal communication, September 2002
2003 from: http://www.unescap.org/esd/water/disaster/2001/
Dr. Tang Yuxiang, personal communication, September 2002
china.doc
REFERENCES
51


Regional defi nition
BOHAI SEA
This section describes the boundaries and the main physical and
and the report is therefore published as an appendix to the Yellow Sea
socio-economic characteristics of the region in order to defi ne the
regional assessment. Figure 1 shows the boundary of GIWA region Bohai
area considered in the regional GIWA Assessment and to provide
Sea. The region includes the following sea, river basins, watersheds and
suffi
cient background information to establish the context within
their associated coastal and marine habitats:
which the assessment was conducted.
Bohai Sea, which consists of three bays: Liaodong Bay to the north,
Bohai Bay to the west and Laizhou Bay to the south;
Liaohe River Basin, coastal river basins in the Liaodong Peninsula,
the Shuangtaizihe River Basin and their associated coastal and
Boundaries of the region
marine habitats in Liaodong Bay, north of the Bohai Sea;
Hai River (Haihe) and Luan River (Luanhe) and their associated
The GIWA region Bohai Sea is located in China and is bordered by
marine habitats in Bohai Bay west of the Bohai Sea;
the Yellow Sea (GIWA region 34) in the south, the Sea of Japan (GIWA
Yellow River (Huanghe) Basin, coastal river basins in the Shandong
region 33) to the east and the Sea of Okhotsk (GIWA region 30) to the
Peninsula and their associated coastal and marine habitats in
north. The Bohai Sea is not a transboundary water by GIWA defi nitions
Laizhou Bay, to the south of Bohai Sea.
Elevation/
Depth (m)
Xiliao He
Xar Moron He
Jilin
4 000
2 000
1 000
Fushun
500
Shenyang
Lua
e
n
100
Baotou
H
H
Huhot
Anshan
e
Liaoning
oia
0
L
-50
Nei Mongol
Beijing
Sup'ung (Shuifeng)
Y
Beijing
Sanggan He ongaing He
Sinuiju
-200
Tangshan
Yinchuan
-1 000
North Korea
Tianjin
Dalian
-2 000
Tianjin
P'yongyang
Yellow
Xining
l
Gansu
Taiyuan
Shijiazhuang
a
Ningxia
B o h a i S e a
na
Kaesong
Cdn
Seoul
Lanzhou
Hebei
ra
Inch`on
China
Y
Shanxi
G
e
ll
South Korea
Qinghai Longyangxia
o
e
Shandong
w
Taejon
ei H
W
YellowJinan
Ch'ungju
Sanmenxia
Qingdao
Chonju
Yellow
Shaanxi
We
Y e l l o w S e a
i He
Zhengzhou
Kwangju
Xi'an
Luoyang
Wei He
Sichuan
Henan
Jiangsu
Anhui
ai He
Hu
i He
San He
gta
Huai
Don
He
0
500 Kilometres
© GIWA 2005
Figure 1
Boundaries of the Bohai Sea region.
52
GIWA REGIONAL ASSESSMENT 34 YELLOW SEA
The Bohai Sea proper covers an area of 823 000 km2, but the river basins
(Trichiurus haumela) are the fi sh species with the largest fi sh production
that drain into it account for 1.6 million km2, comprising about 15% the
in the Bohai Sea and also among the four major fi sh products in
total land area of China, which is home to around 343.5 million people,
China's seas. Other species like Mullet (Mugil so-iyu), catfi sh (Silurus
amounting to 35% of the nation's total population (Wikipedia 2003). The
sp.), Spanish mackerel (Scomberomorus japonicus), Left-eyed fl ounder
region is part of the Bohai Bay Area , which covers the Bohai and Yellow
(Tanakius kitaharae), Genuine porgy (Pagrosomus major), Prawn (Penaeus
seas and its adjacent provinces and municipalities, namely, the Liaoning,
orientalis) and Jellyfi sh (Rhopilema esculenta) are also distributed in the
Hebei and Shandong provinces, and the cities of Beijing and Tienjin.
waters of the Bohai Sea. There are a number of fi shing grounds in the
The Bohai Bay Area is known as one of the major centres of economic
Bohai Sea, including Wanghuazai, Juhuadao and Daqinghe estuarine
development in China, and it experiences the downstream impacts
fi shing grounds in the north, Longkou and Yellow River estuarine fi shing
of the region's freshwater systems and covers an area of more than
grounds in the south, and Hai River estuarine fi shing ground in the west
36 000 km2. In 1999, the area accounted for some 22% of the nation's
(Tang and Jin 1999, Jin 2003).
GDP. It functions as an important maritime outlet for the country's
landlocked great west and northeast provinces. It is also a Euro-Asian
With a wide expanse of tidal fl ats and shallow waters, the littoral area
transportation link. The "National Economic and Social Development
of the Bohai Sea provides favourable environmental conditions for
Programme" for the next fi ve years, as recently adopted by the National
the industry of mariculture and stock enhancement, and the major
People's Congress, accords high priority to the Bohai Sea Environmental
cultured varieties are kelp (Laminaria spp.), shellfi sh and prawn, sea
Improvement and Management Project.
cucumber (Holothuria spp.) and abalone (Haliotis spp.). In 1999, the
Bohai Sea area had a mariculture area of 394 450 ha with a total yield of
1.96 million tonnes (PEMSEA 2004).
Physical characteristics
The Bohai Sea is also one of the most intensively exploited areas in the
world (Wigan 1998). According to the China Oceanic Information Centre
The Bohai Sea
(Jin 2003), the output of fi sheries and mariculture reported by the
The Bohai Sea is a large internal sea of China. It is the innermost gulf of the
surrounding provinces and cities of the region has increased in recent
Yellow Sea in northeastern China and covers an area of approximately
years. The catch from Bohai Sea reached about 1.6 million tonnes,
823 000 km2 bordering the Liaoning Peninsula to the east and the
and mariculture production was just over one tonnes in 1999. At the
Shandong Peninsula to the south. The Bohai Sea consists of three bays:
same time, the ecosystem in the Bohai Sea has degraded because
Laizhou Bay to the south; Laiodong Bay to the north; and Bohai Bay to the
of overfi shing and the adverse impacts of mariculture, in addition to
west. Three large rivers, the Yellow River, the Liao River and the Hai River
pollution from other industries and city sewage.
drain into the Bohai Sea. The provinces and municipalities bordering the
Bohai Sea include: Shandong, Laioning and Hebei provinces and Tianjin
River basins
Municipality. The major port cities surrounding the rim of Bohai Sea are:
Liao and Luan rivers
Dalian, Yingkou, Jinzhou, Qinhuangdao, Tanggu, Longkou and Yantai. In
The Liao River Basin spans the provinces of Jilin and Liaoning, has a
the past two to three decades, petroleum oil and natural gas deposits
population of around 42 million, and is rich in natural resources, particularly
have been found in and around the Bohai Sea and are being exploited
oil and gas. The water resources in the Liao River Basin have been badly
(Wikipedia 2003). The Bohai Sea is an ecologically important and stressed
depleted and polluted by heavy industries (MOWR 2001). The Liao and
body of water. Its marine resources are important to China, Japan, and
Luan river basins drains the southern part of the Liao and Sungari plains
North and South Korea.
of central Northeast China, in Liaoning Province and Inner Mongolia. The
river system is about 1 345 km long with a drainage area of 230 000 km2
Fishery resources
and has an annual run-off of 14.8 billion m3. The Liao and Luan river basins
The Bohai Sea is known as a "natural fi shing ground" and harbours
is very fl at, and fl oods frequently in the summer. It is very heavily polluted
over 1 540 species, including 29 species of prokaryotes, 653 species
from industrial sources, carrying a heavy load of silt. The Liao River Basin
of protists, 57 species of fungi, 96 species of plants and 705 species of
is the agricultural and industrial base of the Liaoning Province and is the
animals. Apart from such sea treasures as prawn, sea cucumber and
most polluted river in China, followed by the Hai River. Eff orts to control
abalone, the Bohai Sea has over 100 species of major fi shes among
pollution include the closure of many factories with obsolete technology
which the Small yellow croaker (Pseudosciaena polyactis) and the Hairtail
and the construction of wastewater treatment plants.
REGIONAL DEFINITION
53
Hai River (Haihe)
silt annually. The River then runs east through Henan and Shandong
The Hai River Basin is the historical heartland of China, and one of
provinces, through a fl at, heavily populated region. The Chinese have
the most important agricultural and industrial regions in the country.
tried to control the Yellow River's fl ooding for millennia with the use of
Spread over the four provinces of Hebei, Henan, Shandong and Shanxi,
dikes. This, combined with the settling out of the loess sediment, has
and the municipalities of Beijing and Tianjin, the Hai River Basin is home
raised the level of the river above the surrounding land; in some places
to 117 million people and accounts for 15% of China's GNP. The Hai River
as much as 20 m. The Yellow River eventually reaches the Bohai Sea,
Basin is also one of the most water-stressed basins in China and suff ers
creating a massive delta with its sediment (MOWR 2001).
from severe groundwater overdraft. The Hai River Basin covers an area
of 264 000 km2 of which 60% is mountainous and 40% plains, and has
The River is well known for its fl ood disasters, which occur mainly in its
a mean annual run-off of 22.8 billion m3.
lower reaches. There are levees with a total length of about 1 000 km
on the main stem and its tributaries. The riverbed of the lower reaches
The Hai River Basin is a network of the smaller Chao, Yungting,
of the Yellow River is suspended 5-10 m over the ground outside of its
Taching, Tzuya, Zhangwei, Tuhai and Majia rivers, coming together
two levees as a result of millennia of sedimentation. The average fl ow
at, or just upstream of, the city of Tianjin before discharging into the
of the river in its lower course is 56 km3/year and 17 km3/year is lost
Bohai Sea. The River Basin generally has low gradients and extensive
from Mongolia downstream to Zhengzhou, as a result of percolation,
dikes have built up above the level of the surrounding land for fl ood
evaporation, and diversion for irrigation. Another 10 km3/year are drawn
control. Flows in the rivers are variable because of seasonal variations
off across the North China Plain. In the Yellow River Basin more than 50%
in rainfall, with low rainfall during the dry winters when the rivers
of China's wheat, cotton, and tobacco are cultivated.
often dry up and heavy rainfall during summer when fl oods always
occur. The Hai River Basin itself is inadequate to carry the amount of
The Chinese have managed to control normal fl oods in the Yellow River
fl oodwater discharged, and for centuries, destructive fl oods occurred
Basin, but they are only buying time. The really fundamental problems
annually. Since 1963, the Hai River Basin has been the subject of a
of the Yellow River are siltation and its corollary, upstream erosion,
comprehensive water-control programme. On the upper reaches of
especially in the loess belt (Figure 2). The incredible erosion in the loess
the river and its tributaries, some 1 400 dams have been constructed,
plateau is a natural phenomenon to some extent, but it has been greatly
several of which are over 1 billion m3 and are designed as multi-purpose
increased by human activity, especially deforestation, overgrazing, and
fl ood control, hydropower, and irrigation storage reservoirs. In the plain
overcropping. The upstream reservoirs in Shanxi Province are fi lling at
itself, the major rivers have been banked, and their channels cleared
a rate of 80 million m3 of sediment per year, and are thereby losing not
and channelised using massive mobilisation of local labour. As a result,
only volume but also the ability to absorb fl ood crests. The problem is
many of the Hai River's tributaries have been directed into new channels
getting worse rather than better. Perhaps 3 000 years ago, loess erosion
and given separate outlets. The Hai River thus no longer has to carry
was 1 billion tonnes per year from the plateau; it was 1.6 billion tonnes
the entire fl ow of all these rivers during fl oods. These works have been
in the 1950s and was more than 2.2 billion in the 1970s. However, plans
integrated with large-scale construction of subsidiary drainage and
are being developed on conservation measures to reduce loess erosion
irrigation works designed to reduce fl ooding and ameliorate droughts.
suffi
ciently to mitigate the sedimentation problem.
A huge number of wells have also been sunk to provide supplemental
irrigation (MOWR 2001).
The sediment load of the Yellow River averages 37.6 kg of silt per m3
(compared with 0.07 for the Amazon and 0.6 for the Mississippi). Overall,
Yellow River (Huanghe)
the historic sediment load of the Yellow River since 1919 has been about
The Yellow River Basin covers an area of 750 000 km2 with a mean
1.6 billion tonnes of silt per year. About 1.2 billion tonnes per year have
annual run-off of 59.2 billion m3 and annual sediment transport
been swept out into the Bohai Bay, and perhaps 0.4 billion tonnes have
of 1.6 billion tonnes. The Yellow River is the second largest river in
been deposited in the river bed in an average year, raising the bed
China; 5 460 km long. It begins in the Kunlun Mountains in Qinghai
another 10 cm. In the fl ood of 1933, 3.7 billion tonnes were deposited,
Province and fl ows east, then northeast, through Gansu Province. It
and 0.9 billion tonnes in 1977. Given this background, a fi gure of only
fl ows between the Ordos and Gobi deserts, and then south through
0.2 billion tonnes deposited in 1986 can be seen either as a successful
steep valleys of yellow loamy soil (loess) between Shanxi and Shaanxi
soil conservation or as the result of a dry year (MOWR 2001).
provinces. Silt picked up here gives the river its distinctive brown
colour. It is estimated that the Yellow River picks up 1 billion tonnes of
54
GIWA REGIONAL ASSESSMENT 34 YELLOW SEA
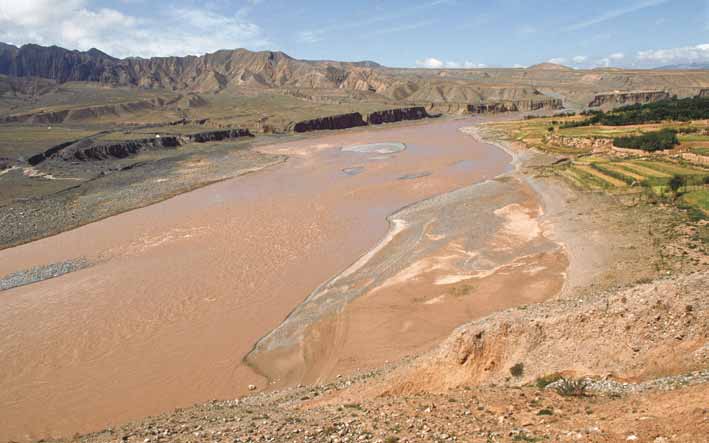
Figure 2
Yellow River on Quinghai Plateau, China.
(Photo: Corbis)
Climate
Desert and steppe climates prevail in the Mongolian Borderlands
The hinterland of the region consists of the north, northeast and
and northwest China. January temperatures average below -10°C
northwest regions of China. North China has no mountain ranges to
everywhere except in the Tarim Basin. July temperatures generally
form a protective barrier against the fl ow of air from Siberia, it thus
exceed 20°C. Annual rainfall totals less than 250 mm, and most of
experiences a cold and dry winter with temperatures that range from
the area receives less than 100 mm. Because of its high elevation,
3.9°C in the extreme south to about -10°C north of Beijing and in
the Tibetan Plateau has an arctic climate; July temperatures remain
the higher elevations to the west in January. In July the temperature
below 15°C. The air is clear and dry throughout the year with annual
generally exceeds 26.1°C and, in the North China Plain, approaches 30°C.
precipitation totals of less than 100 mm everywhere except in the
Almost all the annual rainfall occurs in summer. Annual precipitation
extreme southeast (Anon. 2003).
totals are less than 760 mm and decrease to the northwest, which has
a drier, steppe climate. Year-to-year variability of precipitation in these
General land forms
areas is great; this factor, combined with the possibility of dust storms
The land resources of the region encompass those in the northwest,
or hailstorms, makes agriculture precarious. Fog occurs on more than 40
north and northeast regions of China. The northwest region consists of
days per year in the east and on more than 80 days along the coast.
two basins; the Dzungarian Basin (Junggar Pendi) in the north and the
Tarim Basin in the south, including the lofty Tien Shan (Tian Shan). The
The climate of Manchuria is similar to, but colder than, that of north
Tarim Basin contains the vast sandy Takla Makan (Taklimakan Shamo),
China. January temperatures average -17.8°C over much of the
the driest desert in Asia. Dune ridges in its interior rise to elevations of
Manchurian Plain, and July temperatures generally exceed 22.2°C.
about 100 m. The Turfan Depression (Turpan Pendi), the largest area in
Rainfall, concentrated in summer, averages between about 510 and
China with elevations below sea level, commands the southern entrance
760 mm in the east but declines to about 300 mm west of the Greater
of a major pass through the Tien Shan. The Dzungarian Basin, although
Khingan Range.
containing areas of sandy and stony desert, is primarily a region of fertile
steppe soils and supports irrigated agriculture (Anon. 2003).
REGIONAL DEFINITION
55
The north region lies between the Mongolian Borderlands on the north
opinion of many historians these factors encouraged the development of
and the Yangtze River Basin on the south and consists of several distinct
a centralised Chinese state to manage granaries, manage hydraulic works,
topographic units. The Mongolian Borderlands is located in north central
and man fortifi cations against the steppe peoples (Anon. 2003).
China and is a plateau region consisting mainly of sandy, stony, or gravelly
deserts that grade eastward into steppe lands with fertile soils. This is a
Biodiversity
region of fl at-to-rolling plains, partitioned by several barren fl at-topped
The biodiversity in the deltas of the region is substantial, this being
mountain ranges. Along its eastern border is the higher, forested Greater
an important stopover location for the Red-crowned crane (Grus
Khingan Range (Da Hinggan Ling). The loess plateau to the northwest is
japonensis) and the Siberian crane (G. leucogeranus). The rare Saunders'
formed by the accumulation of fi ne windblown silt (loess). The loosely
gull (Larus saundersi) uses the Huang He Delta as one of its four global
packed loess is subject to erosion, and the plateau's surface is transected
breeding sites. It is estimated that at least 800 000 water birds use the
by sunken boats, vertical-walled valleys, and numerous gullies. The region
4 800 km2 coastal wetland here, including at least 15 IUCN Red Data
is extensively terraced and cultivated. The North China Plain, the largest
species. Although 1 500 km2 of coastal wetland of the region has been
fl at lowland area in China, consists of fertile soils derived from loess.
declared a nature reserve, the Dongying Huang He Sanjiaozhou has
already been severely disturbed (MacKinnon et al. 1996).
Most of the plain is under intense cultivation. Located to the east,
the Shandong Highlands on the Shandong Peninsula consist of two
More than 265 bird species have been recorded in the region with total
distinct areas of mountains fl anked by rolling hills. The rocky coast of
numbers estimated at more than 10 million. This includes seven species
the peninsula provides some good natural harbours. To the southwest
identifi ed as meriting the Chinese fi rst class of protection. There are an
are the Central Mountains, which constitute a formidable barrier to
additional 40 species listed in CITES (Convention on International Trade
north-south movement. Located in north central China, the northeast
in Endangered Species).
region comprises of all of Manchuria east of the Greater Khingan Range
and it incorporates the Manchurian Plain (Dongbei Pingyuan) and its
bordering uplands. The plain has extensive tracts of productive soils.
The uplands are hilly to mountainous, with numerous broad valleys
Socio-economic characteristics
and gentle slopes. The Liaodong Peninsula, extending to the south, is
noteworthy for its good natural harbours (Anon. 2003).
Population and main urban areas
The total population in the region amounts 343.5 million. The region
The North China Plain, which falls within the region, is made of the
is very densely populated, especially in the coastal area (Figure 3).The
deposits of the Yellow River and is the largest alluvial plain of eastern
region is the historical heartland of China, and one of the most
Asia. The plain is bordered on the north by the Yen mountain range
important agricultural and industrial regions in the country. It consists
and on the west by the Taihang mountain range. To the south it merges
of three basins: the Yellow River Basin, the Hai Basin and the Liao Basin.
into the Yangtze River plain and from northeast to southeast it fronts
The Hai Basin spreads over four provinces, the Hebei, the Henan, the
the Bohai Sea, the highlands of the Shandong Peninsula and the Yellow
Shandong and the Shanxi, and two municipalities: Beijing and Tianjin.
Sea. The plain covers an area of about 409 500 km2, most of which is less
than 50 m above sea level. This fl at yellow-soil plain is the main area of
Population density
(persons/km˛)
kaoliang, millet, maize and cotton productions in China. Wheat, sesame
<1
seed, peanuts and tobacco are also grown there. The plain is also one
1-2
He Fushun
!
3-5
!
of the most densely populated regions in the world.
L
Liao Anshan
uan He
!
6-10
Baotou
Shenyang
!
!
In addition, the fertile soil of the North China Plain gradually merges with
11-100
Yellow
Huhot
Beijing
!
Tangshan
l
!
>100
!
Tianjin
the steppes and deserts of Central Asia and there are no natural barriers
!
Ha
Dalian
China
i H
Liaodong
Shijiazhuang nd Cana
!
e
!
!
ra
Peninsula
!
between these two regions. Although the soil of the North China Plain
G
w
Xining
Taiyuan
C
!
e
Yello
H
!
!
Jinan
!
is fertile, the weather is unpredictable because of its location at the
Ye
!
llow
Wei
Shangdong
Lanzhou
Peninsula
Wei
intersection of humid winds from the Pacifi c Ocean and dry winds from
He
Wei He
Xi'an
!
!
!
Luoyang Zhengzhou
the interior. This makes the North China Plain prone to both fl ood and
©
GIWA©
2005
drought. Finally, the fl atness of the North China Plain creates massive
Figure 3
Population density in the Bohai Sea region.
fl ooding when the River's fl ood control structures are damaged. In the
(Source: ORNL 2003)
56
GIWA REGIONAL ASSESSMENT 34 YELLOW SEA
It is the home to 117 million people. The Liao Basin spans the provinces
Flood-prone areas
of Jilin and Liaoning, and has a population of around 42 million; it is
Xiliao He
rich in natural resources, particularly oil and gas (Wikipedia 2003). The
Xar Moron He
Mongolia
Yellow River Basin, with a population of about 156 million, begins in
the Qinghai Province and fl ows east, then northeast, through Gansu
Fushun
Shenyang
Lua
e
n He
H
Province. It fl ows between the Ordos and Gobi Deserts, and then south
Baotou
Huhot
Anshan
oiaL
between the Shanxi and Shaanxi provinces. Finally the river runs east
Y
Beijing
Sanggan He ongaing He
Sinuiju
Tangshan
through Henan and Shandong provinces.
China
North Korea
Tianjin
Dalian
P'yongyang
l
Taiyuan
Shijiazhuang
ana
Kaesong
Management of water resources
Cd
Seoul
nra
Inch`on
Y
G
The major fl ood-prone areas along the major river basins of the region
e
ll
South Korea
o
e
w
Taejon
ei H
are presented in Figure 4. These include the following rivers:
W
Yellow Jinan
Ch'ungju
Qingdao
Chonju
Zhengzhou
Kwangju
Luoyang
Yellow River
The Yellow River is well known for its fl oods, which occur mainly in its
ongqu
uangai Z
lower reaches. There are levees with a total length of about 1 000 km
Subei G
on the main stream and tributaries. In the lower reaches of the River, the
levees are much higher (5-10 m) than the surrounding lands because of
© GIWA 2005
sedimentation. On the upper and middle reaches of the Yellow River, 173
Figure 4
Flood prone areas along the main rivers in the
Yellow Sea and Bohai Sea regions.
large and medium-sized reservoirs have been built with a total storage
(Source: Zhang & Wen 2003)
capacity of 55.2 billion m3. Downstream of the Sanmenxia Reservoir,
two large fl ood-retardation basins, the Beijinti and the Dongpinghu,
have been constructed with a storage capacity of 2 billion m3 each and
Liao and Luan River
detention areas of 2 316 km2 and 627 km2 respectively.
The Liao and Luan river basins, which cover most of the Laioning
Province, provides fertile areas for agriculture, while the coastal areas
With regard to fl ow regulation of the River, 5 000 bank protection works
provide a good base for industries. Big fl oods in 1949, 1951, 1953 and
totalling 585 km in length were built for controlling fl oods. They can
1960 hit the basins and fl ooded 3 to 5 million ha of cultivated land,
withstand fl oods with a peak discharge of 22 000 m3/s (the 1958 fl ood) at
resulting in substantial economic losses. As of 1993, 17 large reservoirs
the Huayuankou hydrological station, corresponding to a 60-year return
have been built with a total storage capacity of 12 billion m3 and
period. A large fl ood control reservoir, the Xiaolangdi Reservoir, with a
11 000 km of levees have been strengthened or rebuilt. The levees
storage capacity of 12.65 billion m3, is under construction on the lower
along the rivers can withstand 10-to-20-year fl oods. Some important
reach of the River. Once completed, it should protect the Yellow River
cities located along the rivers such as Shenyang and Fushun are
downstream against frequent occurrence of fl oods (Zhang &Wen 2003).
protected against once-in-100-year fl oods.
Hai River
Economic sectors
The main stream of the Hai River is only 70 km long with fi ve tributaries
The region is located within the Bohai Bay Area, which includes
confl uent in the vicinity of Tianjin City, the industry centre of north
provinces around the Bohai Sea and the Yellow Sea. In 1994, the Chinese
China. Large amounts of fl oodwater from upstream along with
government developed key points of the Programme for Economic
inadequate discharge capacity in the middle and downstream sections
Development of the Bohai Bay Area to the year 2000, and extended
often result in fl ood disasters. In 1963, an unusually big fl ood caused
the area to the Shanxi Province and the Inner Mongolia Autonomous
a catastrophe in this river basin. After that, a comprehensive fl ood-
Region. The Bohai Bay Area lays in the centre of the Northeast Asian
prevention programme was implemented by the Chinese government.
economic sphere and at the meeting place of the northeast, north
Thus far, 140 large and medium-sized reservoirs have been built, with
and northwest regions. It has communications links with the Yangtze
a total storage capacity of 25.3 billion m3, equal to 92.7% of the River's
and Pearl river deltas, Hong Kong, Macao, Taiwan and Southeast Asian
annual upstream run-off . At present the Haihe River system can
countries to the south, with the Republic of Korea and Japan to the east,
withstand a once-in-a-50-year fl ood.
and Mongolia, and the Russian Far East to the north.
REGIONAL DEFINITION
57
As China's reform and opening to the outside world has expanded, the
Salt making
pace of economic development in the Bohai Bay Area has quickened.
The Bohai Sea provides an inexhaustible supply of table salt, thus
Currently it is the engine of economic development in North China, and is
making the salt industry an ancient and eternal marine industry in
the area with third largest rate economic growth in the country, following
the littoral Bohai Sea. In 2000, the littoral area of the Bohai Sea had a
the Pearl River and Yangtze deltas. In the future the Bohai Bay Area will
total of 16 salt-fi elds with a total salt-pan area of 273 470 ha, a salt-pan
benefi t from its advantages of advanced communications, large number
production area of 240 750 ha and a sea-salt output of 664.76 million
of large and medium-sized cities, strong contingents of scientifi c and
tonnes, making it the largest salt industrial production base in China.
technical personnel and wealth of natural resources. The development
Among the four major sea-salt producing areas, three are located in the
of the automobile, electronics, and new- and high-tech industries and
Bohai Sea region. These are the salt-producing areas of Liaodong Bay,
other pillar industries will be emphasised, as well as the construction of
Changlu and Shandong, of which the Changlu salt-producing area is the
energy bases and transportation channels. Relying on the coastal large
largest. The Changlu salt produced from this area has won recognition
and medium-sized cities, a comprehensive Bohai Bay economic circle will
both domestically and internationally (PEMSEA 2004).
be formed with the Liaodong and Shandong peninsulas, Beijing, Tianjin
and Hebei playing the leading role (MF 2003).
Port development and marine transport
The number of ports or harbours around the littoral area of the Bohai
Fisheries and marine aquaculture
Sea ranks fi rst in the country. In the littoral area of the Bohai Sea,
Fisheries and marine aquaculture in the Bohai Sea not only provide a
66 harbours have been completed, including 48 fi shing harbours.
source of seafood, but also sustain the livelihood of numerous fi shermen
Several key harbours in the region have a capacity greater than 31%
around the Sea. Furthermore, the Bohai Sea is an important spawning
of that of the major ports in China. Among them, the Dalian Harbour
and nursery ground for migratory species from the Yellow Sea and
is an important outlet to the sea in the three provinces of northeast
East China Sea. It is estimated that 40% of the fi sheries resources in the
China as well as a focal foreign trade port of China; the Qinhuangdao
Bohai Sea, Yellow Sea and the north area of East China Sea originate in
Harbour is the largest energy-exporting port in the world and an
the Bohai Sea. The Bohai Sea is the biggest mariculture base in China.
important integrated foreign trade port; the Tianjin Harbour is the
The ecosystem in the Bohai Sea is fragile because of its nature as an
largest artifi cial harbour in China and also an international harbour.
semi-enclosed sea with long residence times. Both the excess fi shing
Thanks to its geographic location, it has become the gateway to the sea
eff ort and the accumulating negative impacts from mariculture exert
of Beijing, the capital of China, and is the largest commercial port in the
great pressures on the ecosystem. The fi shing eff ort in terms of the
north as well as an important port for ocean transportation. In addition,
number fi shing vessels in China including the Bohai Sea has increased
the Bohai Sea region also has small and medium-sized harbours, each
dramatically over the years. Numerous unregistered or unlicensed
with an annual handling capacity of over 1 million tonnes. The shipping
fi shing vessels in a rapidly degrading ecosystem are the main problems
capacity is complemented by more than 30 local harbours as well as a
with China fi sheries. The illegal fi shing and destructive fi shing methods
number of harbours that are being planned or are under construction.
such as the use of electricity, explosives, toxins and other illegal fi shing
These concentrated harbours have led to the formation of a harbour
methods are often used because these methods usually have higher
group with the combination of large, medium-sized and small harbours
effi
ciency than conventional methods. Mariculture in the Bohai Sea, as
(PEMSEA 2004).
an alternative supply of seafood for the large population around the
Bohai Sea, is becoming more and more important (Dai 2001). At the same
In 2000, the Bohai Sea region had 13 fi rst-class water transport ports,
time, pollution from mariculture is accelerating as a result of the spatial
which can handle up to 265.4 million tonnes of cargo, accounting for
expansion of aquaculture. The construction of mariculture areas damages
28.8% of the volume of freight handled by all the coastal ports. Ocean
natural spawning grounds and habitats, which exerts more pressure on
shipping constitutes not only the leading industry in the economy
wild fi sh stocks. The species that are introduced for mariculture, including
of the Bohai Sea, but also occupies an important position in the
genetically modifi ed species, also pose a threat. Open-access fi sheries
development of national economy (PEMSEA 2004).
and unregulated mariculture in the Bohai Sea impede the economic
progress and the sustainability of the fi sheries resource. The collapse of
Oil exploitation
fi sh stocks in the Bohai Sea demonstrates that stakeholders in the fi sheries
The Bohai Sea is rich in off shore oil and gas resources. The major oilfi elds
and mariculture industries need to have a more conservation-oriented
are the Shengli, Dagang and Liaohe Oilfi elds. On the 27th February 1997
strategy in implementing their management (Jin 2003).
China made a major breakthrough in oil exploration in the Bohai Sea,
58
GIWA REGIONAL ASSESSMENT 34 YELLOW SEA
off the eastern part of China, by setting up the Chengdao Oilfi eld. The
Agriculture
new fi eld, which has an annual output of 1.05 million tonnes, is the
The Bohai Bay Area has well-developed agriculture, with 26.57 million ha
largest off shore oilfi eld in the Bohai Bay, and has huge production
of cultivated area, over one-fourth of the nation's total. Its grain yield
potential. According to the China National Petroleum Corp (CNPC),
accounts for more than 23% of the nation's total. In addition, the output
the off shore oilfi eld was diffi
cult to explore because of its complicated
of oil-bearing crops, aquatic products, pork, beef and mutton also
geological structure. To develop the Chengdao Field, a large array
constitute heavy percentages of the nation's total. Shandong, Hebei and
of new technology has been used, including a 3-D seismic survey
Liaoning provinces are China's important production and supply bases
and oil reserve tracking technology. The Bohai Sea area now has an
for agricultural and sideline products. The Inner Mongolia Autonomous
annual output of 2.12 million tonnes of oil and 367 million m3 of gas.
Region is the largest animal husbandry production base in China.
Greater progress in oil and gas exploration in the Bohai Sea area can be
expected in the coming years (PEMSEA 2004).
Industry
The Bohai Bay Area has a solid industrial foundation, where heavy
Tourism
and chemical industries are especially prominent. Some large-sized
The coastal areas of the Bohai Sea boast many beautiful natural spots,
enterprises, such as the Anshan Iron and Steel Company in Liaoning,
favourable environmental conditions, and a natural marine landscape
the Capital Iron and Steel Company in Beijing, the Taiyuan Iron and Steel
characterised by seawater, sand-beaches and islands, which provide
Company in Shanxi and the Baotou Iron and Steel Company in Inner
ideal resorts for tourism and leisure travel. There are now more than
Mongolia, are located in this area. The Beijing Yanshan Petrochemical
20 tourist sites in the coastal area, among which the more famous ones
Group and Tianjin Bohai Chemical Group are China's two leading
include the Beidaihe seaside, Shanhaiguan Pass, Dabishan Mountain,
petrochemicals enterprises. In addition, Shenyang's heavy machinery
Xingcheng City, the wetland tourist zone at the Liaohe River mouth
and precision machine tool building industry, Beijing and Tianjin's
and the Cangli Golden Coast Nature Reserve. The well-known cultural
electronic products and automobile industries, Shijiazhuang's cotton
ancient relics include the ancient Great Wall, the Penglai Dengzhou
spinning, Hohhot's wool spinning and Taiyuan's mining machinery
Aquapolis of the Ming Dynasty, the Penglai Taoist Temple of the Song
industries are all well known in China (MF 2003).
Dynasty, as well as the ruins of Emperor Qin Shi Huang's Palace, the ruins
of the Japan-Russian War and the Memorial Hall of the Liaoxi-Shenyang
Legal and institutional framework
Campaign (PEMSEA 2004).
The international programmes and initiatives as well as the specifi c
laws that form legal and institutional framework for the environmental
Many coastal cities in the Bohai Sea region have devoted major eff orts
management of the region are provided in Annex III and IV, respectively.
to developing modern commercial tourism by making the best of their
Several institutions are involved in the fl ood control of the major rivers
rich and colourful marine, natural and human landscapes. For example,
in China (Zhang & Wen 2003):
the Tianjin Municipality is visited by large tourist ships on a regular basis
which anchor alongside its shore; the City of Dalian welcomes modern
Ministry of Water Resources
commercial tourism by "performing operas of economy and commerce on
The State Council was restructured and streamlined in 1998, with
the stage put up by tourism", which has resulted in the Garment Festival,
a view to streamlining government operations and clarifying
Sophora Flower Festival and Marathon, which have been well received by
the respective responsibilities of the ministries and departments
tourists at home and abroad. In 2000, the Bohai Sea region was visited by
under it. The function and responsibilities of the Ministry of Water
947 350 tourists from abroad with foreign exchange earnings of over 600
Resources (MWR) were adjusted; the administrative role of the MWR
million USD from international tourism (PEMSEA 2004).
in hydropower development was moved to the State Economic and
Trade Commission, and groundwater management originally under the
Mineral resources
Ministry of Geology and Mineral Resources and urban fl ood control
The Bohai Bay Area is rich in mineral resources, which are relatively
originally under the Ministry of Construction were moved to the MWR.
evenly distributed and with favourable mining conditions. Statistics
The ministry was mandated to take over the responsibility of managing
show that this area's reserves of iron, coal, petroleum, salt, natural
water conservation all over the country, as well as the planning and
gas and limestone account for 44, 40, 37, 50, 23 and 16% of China's
monitoring of the water environment and recommending protection
totals, respectively. Shanxi is abundant in raw coal, its annual output
measures to the government at diff erent levels.
accounting for 27% of the nation's total (MF 2003).
REGIONAL DEFINITION
59
The MWR is appointed as the Department of Water Administration of
basins. The main responsibilities of a river basin commission are:
the State and discharges the responsibility for the unifi ed management
Execution of the Water Law, the Law of Water and Soil Conservation
of water resources. In accordance with the reform scheme of the State
and related laws, regulations and rules;
Council in 1998, the main responsibilities of the MWR are:
Mapping out strategic planning and mid- and long-term plans of
The formulation of policy, development strategy and long-term
a basin's water resource development;
plans, drafting of relevant laws and regulations, and supervision of
Working jointly with related departments and the relevant
their implementation;
provincial authorities on the integrated river basin plan, relevant
Unifi ed management of water resources including surface water nd
specialised plans and supervising their implementation;
groundwater, formulation, supervision and implementation of the
Unifi ed management of the water resources of each basin;
long-term water supply-and-demand plan and water allocation,
Unifi ed management of the rivers, lakes, estuaries, tidal fl ats and
assessment and verifi cation of the available water resources and
that of key river reaches as authorised by the central government;
fl ood control measures, and implementation of water draw permit
Coordinating fl ood control and drought management;
system and levy of a water resources fee, etc;
Mediation of water disputes;
Formulation and implementation of water conservation policy and
Comprehensive management of water and soil losses in key areas
plan;
of the basin;
Water resources protection planning, water quantity and quality
Construction and management of trans-provincial water projects.
monitoring, evaluation and examination of pollution of water
bodies;
Local water resource management agencies
Water administration supervision and enforcement; mediation of
Local water resource management is comprised of four levels, i.e.
water disputes;
provincial, prefecture, county and village or town. The main functions
Formulation of economic regulatory measures in the water sector
and responsibilities of local water management are: (i) to be the
such as water pricing, taxation or loans;
departments of the local governments at all levels responsible for water
Issuance of technical guidelines, regulations, standards in the
administration; (ii) to work out the local water resource development
water sector, examination of proposal of large and medium-sized
plan and long-term water supply-and-demand plan; (iii) to implement
projects;
local water resource development projects; (iv) to carry out fl ood
Development and management of large rivers, large lakes and key
control and drought management, water and soil preservation, water
projects crossing provincial boundaries;
resource protection and water project management, within their
Water resource development and use in rural areas including
jurisdiction; and (v) to be responsible for urban and rural water supply
hydroelectric projects and water supply;
and economical water use. It is worthy to mention that there are village
Soil and water conservation; and
(or town) water conservancy stations almost all over China. They are
Undertaking the routine work for the State Flood Fighting and
not only the agencies of the water administration, but also the water
Drought Defying Headquarters (FFDDHS).
organisations at the grass-roots level that serve and keep close ties to
the rural residents.
The river basin commissions
There are seven major river basin commissions that are agencies of
the MWR and perform the function of water administration in the river
60
GIWA REGIONAL ASSESSMENT 34 YELLOW SEA
Assessment
BOHAI SEA
Table 1
Scoring table for the Bohai Sea region.
This section presents the results of the assessment of the impacts
Assessment of GIWA concerns and issues according
The arrow indicates the likely
of each of the fi ve predefi ned GIWA concerns i.e. Freshwater
to scoring criteria (see Methodology chapter).
direction of future changes.
T
T
C
C
Increased impact
shortage, Pollution, Habitat and community modifi cation,
A
A
0 No
known
impact
2 Moderate
impact
IMP
IMP
T
T
No changes
C
C
A
A
Unsustainable exploitation of fi sh and other living resources,
1 Slight
impact
3 Severe
impact
IMP
IMP
Decreased impact
Global change, and their constituent issues and the priorities
y
a
c
t
s
t
a
l
p
c
t
s
*
*
identifi ed during this process. The evaluation of severity of each
Bohai Sea
e
n
m
i
c
i
m
impa
Score
issue adheres to a set of predefi ned criteria as provided in the
n
c
t
s
m
o
communit
c
t
s
r
i
t
y
***
v
i
r
o
n
o
e
alth
t
her
erall
r
i
o
chapter describing the GIWA methodology. In this section, the
En
impa
Ec
H
O
impa
Ov
P
scoring of GIWA concerns and issues is presented in Table 1.
Freshwater shortage
3.0*
1
1
1
1.5
3
Modification of stream flow
3
Pollution of existing supplies
3
Changes in the water table
3
T
Pollution
2.3*
2
1
2
C
1.5
4
A
Freshwater shortage
IMP
Microbiological pollution
2
Eutrophication
3
Chemical
2
The naturally uneven distribution of water resources has created severe
Suspended solids
1
freshwater shortages in parts of the country (SEPA 2003). In the densely
Solid waste
2
Thermal 1
populated southern region of China, a relatively abundant water supply
Radionuclide
0
is provided by the Yangtze River and Pearl River basins. However, the
Spills
3
areas north of the Yangtze River, particularly the northwest region
Habitat and community modification
2.6*
3
1
3
2.5
2
and the North China Plain, which account for 60% of China's land
Loss of ecosystems
2
Modification of ecosystems
3
mass and half of the country's population, only receive 20% of the
Unsustainable exploitation of fish
2.6*
3
2
3
2.7
1
nation's water resources; and there is severe freshwater shortage. The
Overexploitation of fish
3
freshwater shortage in Northern China is further aggravated by serious
Excessive by-catch and discards
1
soil erosion, deforestation, land conversion, excessive water usage for
Destructive fishing practices
2
agricultural production and conversion of lakeshore wetlands into rice
Decreased viability of stock
2
Impact on biological and genetic diversity
3
fi elds (SEPA 2003).
Global change
1.0*
3
1
2
1.5
5
Changes in hydrological cycle
1
Environmental impacts
Sea level change
1
Modifi cation of stream fl ow
Increased UV-B radiation
0
Changes in ocean CO source/sink function
0
2
The main river basins or systems that contribute to the source of
*
This value represents an average weighted score of the environmental issues associated
freshwater supplies in the region include those associated with the Liao
to the concern. For further details see Detailed scoring tables (Annex II).
** This value represents the overall score including environmental, socio-economic and
River, the Shuangtaizi River, the Hai River, the Luan River and the Yellow
likely future impacts. For further details see Detailed scoring tables (Annex II).
*** Priority refers to the ranking of GIWA concerns.
River. The Yellow River Basin is the largest among them, and covers an
ASSESSMENT
61
area of 940 065 km2 in China (WRI 2003). The annual volumes in the
important than the social impact of the problem but more important
Yellow River were greatly modifi ed over the past decades due to serious
than the human health impact. A slight increase in infectious diseases
water and soil erosion, which has led to frequent basin-wide drought
has occurred in the last decade, such as problems with teeth as a
in its upper and middle reaches, and tremendous fl ood disasters in its
result of the need to drink saline water in seawater intruded areas. The
lower reaches (WAF 2003). The impact of this issue in the region has
impact was considered to be slight. A severe reduction of stream fl ow
been considered to be severe.
in major rivers (e.g. the Liao, Hai and Yellow rivers) has occurred over
the past decades. The severe freshwater shortage has led to increased
Pollution of existing supplies
business cost by 10% and frequent interruptions in the water supply
Fish kills frequently occurred in the major water basins associated with
of the region.
the Liao River, the Hai River, the Luan River and the Yellow River, covering
a total area of 1 300 567 km2. Pollution of the river basin waters was
Conclusion and future outlook
serious as evidenced by the fact that most of the surface waters that
The trend of stream fl ow reduction in the region is unlikely to improve
include more than 30% of the surface of these river basins did not meet
much in the future. The reduction problem may be alleviated if the
WHO drinking water standards (see Annex V). The freshwater shortage
planned national project to divert water from the country's south to
situation is further worsened by ineffi
cient use of the limited water
north is implemented (See Box 2 in the Yellow Sea report). Further
supply. Studies have indicated that in China, only 20-30% of industrial
deterioration of water quality is unlikely in the future as some mitigation
water is recycled, and water consumption per industrial product is 5 to
measures (e.g. control the discharge of agricultural run-off , industrial
10 times higher than that of industrialised countries. Additionally, only
discharges, etc.) to improve water quality of the river basins were and
25-30% of irrigation water is eff ectively used due to poor irrigation
are being undertaken by the Chinese government.
facilities (SEPA 2003). It is estimated that 2.5 million tonnes of grain
yield are lost each year due to water shortages. The impact of this issue
The accelerated urbanisation and shortage of surface water resources
has been considered to be severe.
in the region are likely to exert continued pressure on the demand
of underground water. The situation is unlikely to improve much in
Changes in the water table
the future. Population growth will increase demand for freshwater.
In several urban centres in the region, overextraction of groundwater
Freshwater shortages in the region will continue, which will
for industrial and domestic uses has lowered groundwater tables. For
signifi cantly impact community welfare, much as is the case now.
example, in Beijing, water tables are dropping 1.5 to 2 m per year.
Business dependence on fresh water or its alternatives will increase,
A lower water table could not only aggravate water shortages, but
but the fresh water supply will not improve very much. This will increase
also decrease water quality and increase the risk of earthquakes and
business costs. The water resource status and water quality will improve,
landslides. Coastal aquifers are suff ering salinisation over a wide area,
reducing the occurrence of diseases.
particularly in the coastal, heavily populated cities along the coast
of the Bohai Sea such as Dalian and Tienjin, as well as the adjacent
The Chinese government has recognised the vital need to address
Hebei Province, due to the extensive use of underground water for
water shortage issues in order to maintain the nation's development.
human consumption, agricultural and industrial activities. This heavy
In 1988, China promulgated its Law of Water Resources, which
use has caused the water tables in these areas to subside, which has
provided a legal basis for water resource management. In 1993, further
led to increased seawater intrusion. The impact of this issue has been
legal support to ensure effi
cient water use emerged as China adopted
considered to be severe.
water resource licenses. By the end of 1995, nearly 90% of the nation's
water utilities were registered and licensed. Since then, China's water
Socio-economic impacts
supply is estimated to have increased 15 per year. The government
Interruptions in the water supply for a few hours per week have
is also promoting wastewater recycling by increasing investments
frequent been reported in several of the coastal cities along the
in water pollution prevention and treatment facilities. Finally, eff orts
Bohai Sea such as Tienjin and Dalian. Water supplies aff ect societal
explore new water resources, such as seawater desalination, are being
stability, which is far more signifi cant than economic and human
initiated.
health eff ects. Business costs increased over 10% as a result of using
seawater or other alternatives to off set the freshwater shortage in
satisfying business demands. This economic impact is considered less
62
GIWA REGIONAL ASSESSMENT 34 YELLOW SEA
T
C
A
Pollution
IMP
in the Bohai Sea. However, the problem of high suspended solids is
localised around river mouths and its impact in the region is considered
Environmental impacts
to be slight.
Microbiological
Incidents of bacterial gasteroenteric disorders in the population
Solid wastes
due to consumption of contaminated seafood or aquatic products
On beaches and in the tourist sites of Jinzhou, Xingchen, Qinghuangdao
caused by microbiological pollution in the coastal and inland waters
and Dalian along the coastal areas of the Bohai Sea, litter has frequently
of the region have been frequently reported over recent decades.
been reported. The environmental impact of the issue has sometimes
However, in recent years, reports of human health problems caused by
been signifi cant enough to deter the public from recreational activities
microbiological pollution have decreased due to measures taken by
and is considered to be moderate.
local governments (e.g. local government of Dalian City) to restrict the
marketing of contaminated aquatic products for human consumption.
Thermal
Additionally, more wastewater treatment facilities have established
There are localised thermal problems caused by power plant
in the large urban centres; these have greatly reduced incidences of
discharges and off shore oil production, but there is no evidence that
microbiological pollution in the waters of the region. The impact of this
the biodiversity of the region has been altered by thermal pollution.
issue has been considered to be moderate.
The impact of the issue is considered to be slight.
Eutrophication
Radionuclides
There were reports of harmful algal blooms (HAB) due to eutrophication.
The environmental impact of this GIWA issue is unknown as, at the
The dinofl agellate Gymondinium sp. dominated these reports in August-
moment, there is no nuclear power plant in operation in the region.
September 1989 in the area off shore of Huang Hua. These blooms
caused mass mortality of shrimps with heavy economic losses. A mass-
Spills
scale HAB event occurred again in 1997, covering an area of 3 000 km2
There are four oil fi elds currently in operation in the region: Shengli,
in Liaodong Bay of the Bohai Sea. High eutrophication caused by
Bohai, Dagang and Liaohe oil fi elds. Small-scale (a few hundred tonnes)
an increase of discharges of nutrient-rich sewage, agricultural and
oil spills from these oil fi elds have frequently been reported (more than
industrial wastes has resulted in frequent occurrences (e.g. more than
two to three spills per year). Oil tar balls have often been found on
5-6 times per year) of HAB events along the coastal waters of the Bohai
beaches in the coastal areas of the Bohai Sea. Avian mortality due to oil
Sea (Cui & Song 1999). Eutrophication in the region has been considered
spills has also been reported often. The impact of oil spills on the region
severe. The issue is likely to have transboundary importance as the
has therefore been considered to be severe.
HAB organisms may be transported across national and international
boundaries via ballast water and tank washing.
Socio-economic impacts
Many rivers and coastal waters in the region are now not suitable
Chemical
for swimming. Commercial and recreational fi shing activities have
Large-scale use of pesticides and insecticides in agriculture has resulted
been reduced by 30-50% due to pollution impacts, particularly in
in agricultural run-off that is high in chemical pollutants. Increased
freshwater systems. There have been reports of eye infections from
industrial waste discharges have further added to incidences of
swimming, as well as cases of PSP (paralytic shellfi sh poisoning), and
chemical pollution in the region. Heavy metal pollution in Jinzhou Bay
gastroenteric disorders attributable to consuming contaminated
sediment has signifi cantly changed benthic biodiversity. However, the
aquatic products.
impact of this issue the region has been considered to be moderate.
Conclusion and future outlook
Suspended solids
More and more wastewater treatment facilities have been built or are
There are reports of increased suspended solids in the river basins and
being planned for the region's large urban centres, such as in the cities
coastal waters of the region as a result of increased construction of
of Beijing, Tianjin and Dalian. The municipal sewage treatment rate is
coastal roads and dams, and dredging and mud discharges from salt
thus expected to grow from the current 25% to above 40% coverage
farms. For instance, the suspended solids contents were greater than
over the next 5 to 10 years. Long-term improvement in the situation
1 000 mg/l during high tides in the upper portion of the Liaodong Bay
for microbiological pollution, particularly in the population centres in
ASSESSMENT
63
the region is expected in the future. The problems with eutrophication,
industry of Dongying City. Other industries include chemical fertiliser
and subsequent HABs are likely to decrease when measures taken by
manufacturing, textile, paper-making, cement manufacturing, salt
the Chinese government to improve the management of fertiliser
chemical industry and food processing (MacKinnon et al. 1996).
and detergent uses are realised. More importantly, there are two
Threats to the Dongying-Huang He Sanjiaozhou Nature Reserve include
government-funded ongoing environmental management projects,
hunting (36 000 to 52 000 shorebirds are trapped annually), pollution
the "Bohai Sea Environmental Management Project" and the "Bohai
from nearby oil fi elds, and reclamation for the rapid commercial and
Sea Clean Water Project", which are expected to greatly improve the
industrial development that is occurring here (MacKinnon et al. 1996).
future environmental conditions in the region.
Other threats include extensive marine aquaculture, particularly pond-
rearing of shrimp.
The problem of chemical pollution is likely to be controlled with the
implementation of the ongoing "Bohai Sea Environmental Management
Environmental impacts
Project" and the "Bohai Sea Clean Water Project". No signifi cant changes
Loss of ecosystems or ecotones
in the status of the suspended solid situation are expected in the
The types of habitats or ecosystems in the region that have been lost
future. The situation with solid waste will be improved with increased
to various extents include:
public awareness, the use of degradable wrapping materials and
Marshlands: Surface area decreased by as much as 30% due to
the implementation of GEF projects. More large-scale power plants
cumulative impacts of coastal and off shore oil fi elds development,
may be constructed to meet the increased industrial development
e.g. in the Panjin area.
needs; off shore oil and gas development in the Bohai Sea will also
Wetlands related to running water: Surface area decreased by more
be expanded. These are expected to aggravate the thermal pollution
than 30% due to urbanisation and industrialisation.
problem of the region in the future. With the expansion of off shore oil
Periodic waters: Area of rice fi elds has increased but other periodic
and gas development, particularly in the Bohai Sea, incidences of oil
water areas reduced.
spills is expected to increase.
Wetlands of saline habitats: Surface area decreased by more than
30%, due to various types of development activities.
Pollution will be mitigated through the implementation of several
Running waters (rivers): Surface area decreased by up to 30% due
environmental management projects currently ongoing in the region.
to various types of development activities.
Oil pollution will continue to be a threat to recreational activities as well
Standing waters (e.g. lakes): Surface area decreased by more than
as ecosystems and habitats. Pollution will continue to aff ect species
30%, mostly due to reclamation.
of economic value. Associated economic losses may be unavoidable.
Sandy foreshores: More than 30% of the area lost to sand mining
Pollution through sediment re-suspension will continue to be a
and shrimp ponds, etc.
problem at levels similar to the present.
Estuaries: Water surface area decreased by more than 30% due to
reclamation, diking, reduction of stream fl ow and siltation.
Rocky foreshores: Area decreased by up to 30% largely due to
port development, particularly in East Liaodong Bay, northern
T
C
A
Habitat and community
IMP
Shandong Peninsula and Qinghuangdao.
modification
Mud bottom: Area decreased by some 50% due to development
of shrimp ponds, salt fi elds and ports in areas such as Huanghua,
Habitat and community modifi cation is a concern of high priority in the
Liaodong Bay, Bohai Bay and Laizhou Bay.
region. For example, the the Luan He estuary in the northeastern part
Sand and gravel bottom: Area decreased by up to 30% due to sand
of the region comprises a small area of saline meadows that has been
mining in such areas as Bayuquan and Shuizhong.
modifi ed. It supports a breeding site for Saunders' gull and passage for
Rocky bottom: Some reduction due to port development (removal
some migratory birds such as the Relict gull (Larus relictus). Otherwise
of reefs with explosives).
this section of coast has been largely converted to shrimp ponds and
salt pans.
Modifi cation of ecosystems or ecotones
The ecosystems or habitats in the region that have been modifi ed,
The Dongying-Huang He Nature Reserve houses the second largest
resulting in various degrees of changes in biodiversity, species
oil fi eld in China; the Shengli Oilfi eld and oil industry is the primary
composition and community structures include:
64
GIWA REGIONAL ASSESSMENT 34 YELLOW SEA
Marshlands: Population structure, species composition and
Conclusion and future outlook
ecosystem functions changed.
Future prospects for loss of ecosystems in the region are likely to be
Wetlands related to running water: Population structure, species
as follows:
composition and ecosystem functions changed due to pollution
Marshlands: With increased urbanisation, the loss will continue.
and overexploitation of living resources.
Wetlands related to running water: With urbanisation process, the
Periodic waters: Fish species have disappeared due to intensive use
loss will continue.
of pesticides, reduction of rainfall and stream fl ow.
Periodic waters: No signifi cant changes in the current status
Wetlands of saline habitats: Signifi cant reduction in crab abundance
expected.
in Liaodong Bay. Most crabs in the market are cultured. Some
Wetlands of saline habitats: With urbanisation process, the loss will
migratory bird species have disappeared.
continue.
Running waters (rivers): Population structure, species composition
Running waters (rivers): With urbanisation process, the loss will
and ecosystem functions changed, particularly in Liaohe River,
continue.
Haihe River and Yellow River.
Standing waters (e.g. lakes): Lake environments will be improved
Standing waters (e.g. lakes): Population structure, species
and reservoirs will increase.
composition and ecosystem functions changed in Beiyangdian
Sandy foreshores: Slight increase of sand mining is expected, but
Lake.
management will improve (e.g. alternative mining sites will be
Sandy foreshores: Massive mortality of shellfi sh found in some
found). No large-scale mining of sandy foreshores will occur.
areas, e.g. the massive mortality of the clam Meretrix meretrix
Estuaries: Despite management measures, the losses may continue
occurred in 1997 in the Golden Beaches, Hebei Province.
with continued reduction of stream fl ow.
Population structure, species composition and ecosystem
Rocky foreshores: No change in current status. A few experts
functions changed.
expected a slight loss to port development.
Estuaries: Some species, e.g. Hairtail herring (Coilia mystus), have
Mud bottom: No signifi cant change in current status.
disappeared. Survey showed that the food chain in estuaries has
Sand and gravel bottom: No signifi cant change in current status.
been shortened.
Rocky bottom: No signifi cant change in current status.
Rocky foreshores: Some species have disappeared or population
abundance has been reduced, e.g. crabs and shellfi shes, due to
Future prospects for modifi cation of ecosystems in the region are likely
pollution, overexploitation and changed ecosystem functions.
to be as follows:
Mud bottom: Bottom trawling frequent, leading to reduced
Marshlands: The situation may be getting worse. Ecosystem
population abundance, species disappearance and changed
restoration is diffi
cult, and very slow if any.
ecosystem functions, e.g. crabs, fi shes and shellfi shes.
Wetlands related to running water: Changes in population structure
Sand and gravel bottom: Changed population abundance and
and abundance will continue.
species disappearance due to artifi cial restocking of shellfi shes.
Periodic waters: No change of current status is expected.
Wetlands of saline habitats: Loss of some ecosystem functions is
Socio-economic impacts
expected due to pollution and development activities.
Aquatic products of high economic value have been signifi cantly
Running waters (rivers): Restoration of some ecosystem functions is
decreased, biodiversity has been reduced, landscapes have changed,
possible with improved management of riverine environment and
and the number of endangered species is on the increase. Many of
closure of polluting enterprises.
these changes due to habitat loss or modifi cation may be irrevocable
Standing waters (e.g. lakes): Partial improvement of lake
or threatening to the preservation of biodiversity. Aquatic resources
environments is possible, but eff ective ways to prevent lakes from
have been depleted and aquatic product processing business (e.g.
being pollutant catchment areas has yet to be found.
for shrimps and shellfi shes) aff ected. These have led to a loss of
Sandy foreshores: No signifi cant change in the current status.
employment opportunities in over 50% of the concerned processing
Estuaries: Ecosystem integrity will be impaired by coastal and
businesses. Aquatic raw materials that can be used for pharmaceutical
off shore oil and gas development.
industry have decreased by 10-20%.
Rocky foreshores: No signifi cant change of current status is
expected.
Mud bottom: No signifi cant change of current status is expected.
ASSESSMENT
65
1.8
300
1.6
Spring
1.4
250
Summer
(kg/h)
onnes) 1.2
Autumn
1
200
Winter
CPUE)
0.8
r
t
(
(million t
o
h 0.6
150
eff
0.4
Catc
100
0.2
0
1995
1996
1997
1998
1999
50
Year
t
c
h-per-unit-
a
C
Figure 5
Total catch in the Bohai Sea, 1995-1999.
0
1959
1982
1982-93
1998-99
(Source: Dai 2001)
Year
Figure 6
Catch per unit eff ort in the Bohai Sea.
(Source: Jin 2003)
Sand and gravel bottom: No signifi cant change of current status is
expected.
Rocky bottom: No signifi cant change of current status is
high value species has been accompanied by a shift towards catches
expected.
of low value pelagic species such as anchovies and sardines. The total
catch from the Bohai Sea has increased in the 1990s (Figure 5), which
The number of species of high economic value will continue to
is mostly due to the increasing fi shing eff ort in Bohai Sea. In addition
decrease. Pressure on overexploited species of high economic value
to the 75 000 locally registered fi shing vessels and 290 000 fi shermen
will remain. Restoration of damaged habitats takes time. Some
from the Bohai Sea region, fi shing vessels from other provinces further
damages are irrevocable. As natural aquatic resources are depleted,
away (mainly Jiangsu Province, 16 460 tonnes in 1999) also fi sh in the
management and enforcement will focus on reducing harvesting
Bohai Sea (Dai 2001).
eff orts. This may mean that employment opportunities in harvesting
natural aquatic resources will be reduced by 50%. Aquatic raw materials
The dominant species shifted from the late 1950s to the 1980s in the
for pharmaceutical industry will continue to decrease.
Bohai Sea; high valued, commercially important species such as Small
yellow croaker (Pseudosciaena polyactis), Large-head hairtail (Trichiurus
lepturus), and penaeid shrimps (Penaeus spp.) were replaced by low
valued, small-sized species such as Japanese anchovy (Engraulis
T
C
A
Unsustainable exploitation of
IMP
japonicus) and the Half-fi n anchovy (Engraulis sp.). Although the
fish and other living resources
dominant species has varied between years, the small pelagic fi sh, such
as anchovy (Engraulis sp.), Half-fi n anchovy (Engraulis sp.) and Gizzard
Fisheries resources in the Bohai Sea have been dramatically decreasing
fi sh (Clupanodon punctatus) have dominated the fi shery resources
since the 1980s. Compared with the fi sheries resources in the early 1980s,
since the beginning of the 1980s. However, in 1998-1999, the catch-
the biomass of invertebrate animals in the Bohai Sea was reduced by
per-unit eff ort (CPUE) of most fi sh species declined to a very low level
39% in 1992 and 1993 and the average weight of spawning fi sh reduced
(Figure 6). The CPUE of small pelagic fi sh and economically important
by 70%. The biomass of high value species such as Japanese sea perch
invertebrates have sharply decreased, with reduced distribution areas
(Lateolabrax japonicus), Chinese herring (Ilisha elongate), Genuine porgy
that directly aff ect the growth of carnivorous fi shes, such as Spanish
(Pagrosomus major), Olive fl ounder (Platichthys fl esus), Chinese prawn
mackerel (Scomberomorus japonicus) (Jin 2003).
(Penaeus chinensis) and Swimming crab (Portunus pelagicus) decreased
by 71%, and the total biomass of low value species was 2.4 times that of
Environmental impacts
the early 1980s. A survey in 1998 indicated that the total biomass of fi sh
Overexploitation
stocks had been reduced by 89% compared to 1992 (Qiao 2001). The
Yields of highly valuable fi sh in the region have drastically reduced. For
overexploited fi sheries in the Bohai Sea are the result of failure to control
instance, the annual production of Chinese prawn (Penaeus chinensis),
access to the fi sheries resource and failure to control the negative
which used to reach as high as 40 000 tonnes a decade ago, has now
environmental impacts from mariculture. Inevitably, the fall in catch of
decreased to around 500 kg annually. The highest recorded annual
66
GIWA REGIONAL ASSESSMENT 34 YELLOW SEA
production for the Threadfi n fi sh (Eleutheronema tetradactylum) was
Socio-economic impacts
around 40 000 tonnes two decades ago; it is now just 8 tonnes annually
Total catches of fi sh species with high economic value, e.g. Yellow
at current production. The catch of Yellow croaker (Pseudosciaena sp.)
croakers and prawns, has dropped by more than 50% over the past
and Hairtail (Trichiurus haumela) fi sh are now so small that no fi shing
decades. The catch per unit eff ort (CPUE) for all species has also
seasons for these fi sh have been identifi ed. The impact of this issue
decreased by more than 50%. The economic impact of this GIWA
on the region has been considered to be severe. This issue has
concern is of primary importance because any decrease in catches
transboundary importance in that many fi sh species in Bohai Sea are
means reduced employment opportunities for coastal and riverine
migrate to fi shing grounds in the territorial waters of China, Korea and
communities. Unemployment that results from depleted fi sheries
Japan.
resources may be alleviated with alternative working opportunities.
There were many cases of diseases such as gastroenteric disorders
Excessive by-catch and discards
attributed to the consumption of fi sh and other aquatic products in
There are occasional incidences of capturing protected or endangered
the past few decades. Some of these cases have caused epidemics.
species such as Spotted seals (Phoca largha) and Lancelets
(Branchiostoma belcheri) by fi shing fl eets in the region. No discards are
Conclusion and future outlook
so far known. The impact can be considered to be slight.
Measures like strict enforcement of fi sheries management laws and
restrictions on the number of fi shermen allowed to enter the fi shing
Destructive fi shing practices
industry to improve fi sheries management are being implemented by
The destructive fi shing practices that are common in the region, as
the Chinese government. Eff ective controls on overfi shing have yet
well as in the Yellow Sea region, include the indiscriminate trawling
to be undertaken. Overfi shing problems are likely to exist but some
along the coastal waters of the Bohai Sea, fi shing with explosives in
improvements may be expected in the future. Incidence of by-catch of
lakes, and the use of pesticides for fi shing. These destructive fi shing
endangered species as well as the composition and quantity of by-catch
activities have destroyed several benthic habitats, both spawning and
is unlikely to increase in the future. Destructive fi shing may decrease if
fi shing grounds, which in turn have resulted in reductions in both the
appropriate control measures are taken by the government. The future
fi sheries resource as well as the recruitment of fi sh stocks. The impact
fi sheries management in the region is likely to focus on reducing fi shing
is considered to be moderate.
eff orts, e.g. restricting the entry of fi shing boats and fi shermen to reduce
fi shing capacity to conserve the fi sheries resource. The scale of reduction
Decreased viability of stock through pollution and disease
may have to be more than 50% of the current levels in order to achieve
Several anadromous species such as the Hairtail herring (Coilia mystus)
eff ective management of the fi sheries resources. As an eff ective way to
were once commonly caught in large quantities in Liao River estuary.
solve the overfi shing problems has yet to be determined and implemented,
These fi sh have disappeared over the past two decades, which might be
overfi shing may continue and the CPUE may continue to decrease.
a result of increased pollution. The impact of this issue on the region has
been considered to be moderate. No signifi cant changes in the current
status are expected in the future.
T
C
A
Global change
IMP
Impact on biological and genetic diversity
There is evidence that the unsustainable exploitation of fi sh and other
Environmental impacts
living resources has changed the biological and genetic diversities of
Changes in the hydrological cycle
aquatic organisms in the region. For instance, population declines,
The GIWA Experts anticipate that global change has already had some
mass restocking of hatchery-produced post-larvae/fry and other
eff ect on the hydrological cycle. One example is the trend of declining
environmental factors may have changed the genetic grouping
rainfall in the region.
of the Oriental prawn (Penaeus orientalis). The number of genetic
polymorphous locations of wild oriental prawn is now just 20 as
Sea level change
compared to only 15 in the cultured species. The impact of this issue in
The GIWA Experts acknowledge that some studies had shown evidence
the region has been considered to be severe
of sea level rise in the region. For instance, the Ramsar Workshop on
the vulnerability assessment of the Yellow River Delta, held in Beijing in
January 1999, describes the threat of rising sea levels in the region as:
ASSESSMENT
67
"The estimated relative sea level rise rate in the Yellow River Delta is 8
Table 2
Summary of environmental and socio-economic
impacts of the prioritised GIWA concerns and issues in
mm per year and the sea level rise will be 48 cm by the year 2050. This
the Bohai Sea region.
will lead to critical impacts such as the frequency of storm surges and El-
Prioritised Prioritised
Environmental and socio-economic
Nińo events to strengthen hydrodynamics, beach erosion, and landward
GIWA
GIWA issue
impacts
concern
retreat, wetland loss, saltwater intrusion, and land salinisation."
Severe reduction of stream flow for major rivers (e.g.
Liaohe, Haihe and Yellow Rivers) occurred over the past
Modification of
decades. Severe freshwater shortage had led to increased
Increased UV-B radiation as a result of ozone depletion and
stream flow
business cost by 10% and frequent interruption of water
Changes in ocean CO source/sink function
supply.
2
Freshwater
More than 30% of the major river basins in the sub-region
The GIWA experts concluded that no observed evidence of increased
Pollution of existing
shortage
have been polluted with surface waters below the WHO
supplies
UV-B radiation or changes in ocean CO source/sink function could be
drinking water standards.
2
Large-scale salinisation (salt water intrusion) of coastal
found in the region.
Change in the water
aquifers was observed over the past decades, particularly
table
in some areas of the Chinese side of the sub-region (e.g.
Hebei Province, and Dalian and Tianjin cities).
Socio-economic impacts
Up to or more than 30% of the areas of critical habitats
Climate changes may cause changes in the status of various natural
such as freshwater marshlands, running water wetlands,
rivers, lakes, sandy foreshores, rocky foreshores, and sand
resources, which could result in user confl icts and disputes regarding
& gravel bottoms were lost over the past decades. Some
50% of the areas of mud bottoms were lost during the
property rights and administrative jurisdiction of those resources, thus
Loss of ecosystems
past decades. Significant loss of freshwater and brackish
aff ecting social stability. These problems are increasing. Economic
habitats as well as seasonal drying up of Yellow River and
other rivers occurred over the past decades. Significant loss
restructuring, including improvements in resource management and
of over 50% employment opportunities in the concerned
aquatic product processing industries occurred over the
use may help improve the situation.
past decades.
Habitat and
community
Population structure, species compositions and ecosystem
Conclusion and future outlook
modification
functions for habitats such as, (a) freshwater marshlands;
(b) running water wetlands; (c) periodic waters; (d) saline
No signifi cant changes in the current status of the environmental issues
habitat wetlands; (e) rivers; (f) offshore; and (f) lakes had
greatly changed over the past decades. Modifications
are expected in the future. Use confl icts and disputes over property
signified by species disappearance and reduction in
Modification of
population were obviously evidenced for habitats such
rights and administrative jurisdiction of resources may be reduced with
ecosystems
as the sandy foreshores, estuaries, rocky foreshores,
improved legislation and management actions taken by the government
mud bottoms and sand & gravel bottoms were observed.
Obvious increases in salinity (averaged 27 ppt in 1960s to
in the future. The many national and international environmental
around 31 ppt nowadays) in Bohai Sea due to decreased
freshwater inputs from Yellow River had modified several
management and protection projects that have been or will be
coastal ecosystems were observed.
implemented in the region are likely to facilitate a search for sustainable
Yields of several stocks (e.g. Penaeus chinensis,
Eleutheronema tetradactylum) drastically decreased over
environmental management and economic development in the region
the past decades. Economic values of the fisheries sectors
Overexploitation
to cope with the consequences of global environmental changes.
greatly decreased over the past decades due to decreased
Unsustainable
catch per unit efforts (CPUEs) and reduction in the total
exploitation of
catches of some commercially important fish species.
fish and other
Include indisciminate trawling along the coastal waters
living resources
Destructive fishing
of the Bohai Sea, fishing with explosives in lakes and the
practices
use of pesticides.
Impact on biological
Genetic diversity of oriental prawn (Penaeus orientalis) has
Priority of concerns for further
and genetic diversity
significantly changed over the past decades.
analysis
Based on the results of the assessment for the Bohai Sea region the
GIWA issues that have been assessed as having severe environmental
impacts were selected for further analysis and summarised in Table 2.
The GIWA concerns were ranked in descending order:
1. Unsustainable exploitation of fi sh and other lliving resources.
2. Habitat and community modifi cation.
3. Freshwater
shortage.
4. Pollution.
5. Global
change.
68
GIWA REGIONAL ASSESSMENT 34 YELLOW SEA
Causal chain analysis
BOHAI SEA
This section aims to identify the root causes of the environmental
Habitat and community
and socio-economic impacts resulting from those issues and
modification and freshwater
concerns that were prioritised during the assessment, so that
shortage
appropriate policy interventions can be developed and focused
where they will yield the greatest benefi ts for the region. In order
to achieve this aim, the analysis involves a step-by-step process
Figure 7 illustrates the causal links for habitat and community
that identifi es the most important causal links between the
modifi cation and freshwater shortage in the Bohai Sea region.
environmental and socio-economic impacts, their immediate
causes, the human activities and economic sectors responsible
Environmental and socio-economic impacts
and, fi nally, the root causes that determine the behaviour of those
Stream fl ows of the major river basin of the region such as, Liao, Luan,
sectors. The GIWA Causal chain analysis also recognises that,
Hai and Yellow rivers have been found to be severely reduced and
within each region, there is often enormous variation in capacity
business costs have increased by 10% with frequent interruption of
and great social, cultural, political and environmental diversity.
water supply. More than 30% of the major river basins in the region have
In order to ensure that the fi nal outcomes of the GIWA are viable
also been polluted with the quality of their surface water below the
options for future remediation, the Causal chain analyses of the
World Health Organization (WHO) drinking water standards and large-
GIWA adopt relatively simple and practical analytical models and
scale salinisation of coastal aquifers has occurred over the past decades,
focus on specifi c sites within the region. For further details on the
particularly in places such as the Hebei Province, Dalian and Tianjin.
methodology, please refer to the GIWA methodology chapter.
Over the past few decades, many critical ecosystems and habitats in the
Based on the assessment results, the GIWA issues considered to have severe
region have been lost mainly as a result of human activities. The extent of
environmental impacts have been selected for the following analysis:
these losses is estimated to account to 30-50% of their total area. The lost
Modifi cation of stream fl ow;
ecosystems have been found to include freshwater marshlands, running
Pollution of existing supplies;
water wetlands, saline habitat wetlands, rivers, lakes, sandy foreshores,
Changes
in
the
water
table;
rocky foreshores, sand and gravel bottoms and mud bottoms. As
Loss of ecosystems or ecotones;
a result of this loss, more than 50% of employment opportunities
Modifi cation of ecosystems or ecotones;
in aquatic product processing industries have also been lost. There
Overexploitation;
have also been losses of freshwater and brackish habitats as well as
Destructive
fi
shing
practices.
seasonal drying up of for example the Yellow River. Modifi cations of the
ecosystems in the region, in terms of changes in species population
These issues are analysed in two causal chain analyses; the fi rst one
structure and biodiversity, are also relatively severe. The ecosystems
targeting habitat and community modifi cation as well as freshwater
or habitats found to show severe modifi cations over the past decades
shortage problems, and the second targeting overexploitation and
include freshwater marshlands, periodic waters, saline habitat wetlands,
destructive fi shing practices.
lakes, sandy foreshores, estuaries, sand and gravel bottoms and mud
CAUSAL CHAIN ANALYSIS
69
Issues
Immediate causes
Sectors/Activities
Root causes
Agriculture
Natural causes
Freshwater shortage
Changes in water table
Industry
Economic
Modification of stream flow
Habitat and community
modification
Legal
Urbanisation
Pollution of existing supplies
Knowledge
Infrastructure provision
Loss of ecosystems
Technology
Energy production
Modification of ecsystems
Demographic
Figure 7
Causal chain diagram illustrating the causal links for habitat and community modifi cation and freshwater shortage in the Bohai
Sea region.
bottoms. There has been an obvious increase in salinity in the Bohai
the region and diversion of river waters for agricultural and industrial
Sea, from around 27-28 ppt in the 1960s to the present 31 ppt, which has
uses, have also led to the losses of some freshwater ecosystems.
modifi ed several coastal ecosystems in the region. This mainly is due to
Increased development of oil fi elds in the Bohai Bay has resulted in the
decreased freshwater inputs from Yellow River. Modifi cation signifi ed by
loss of coastal habitats around in the Bay.
species disappearance and reduction in population are easily observed
in habitats such as sandy foreshores, estuaries, tocky foreshores, mud
Modifi cation of ecosystems
bottoms and san and gravel bottoms.
Land use conversion has resulted in not only loss but also modifi cation
of ecosystems in the vicinity of land use conversion areas. Decreased
Immediate causes
input from the Yellow River has resulted in increase in salinity in the
Modifi cation of stream fl ow
Bohai Sea, leading to modifi cation of several coastal habitats around
The changes in stream fl ow is mainly caused by upstream damming and
the Sea. Pollution form oil, heavy metals and other pollutants has also
draining for fl ood control and the establishment of hydroelectric plants,
modifi ed several coastal habitats in the region.
and increased diversion of water from river tributaries for industry,
domestic and irrigation uses.
Sectors
Agriculture
Pollution of existing supplies
In the absence of alternative water supplies and decreases in rainfall,
There has been an increased input of pollutants of industrial and
more groundwater has been extracted for increased crop production to
domestic waste in the region, aff ecting both the freshwater supply
meet the higher demand for food as a result of the rapid economic and
and the habitats.
population growth in the region. The increase in farming activities and
expansion of farming areas in the region has led to increased demands
Changes in the water table
for water for irrigation, causing modifi cation of stream fl ow in the
The increased extraction of groundwater for agricultural and industrial
rivers. Agricultural activities have also lead to uncontrolled conversion
uses has resulted in signifi cant changes in the water table in many areas
of coastal wetlands or freshwater marshlands to rice fi elds, diversion
of the region.
of river waters for crop production, and discharge of run-off high in
chemical pollutants.
Loss of ecosystems
Land use conversion such as the change of wetlands into rice fi elds has
Industry
resulted in the loss of freshwater habitats in the region. The decreased
In the region, changes in industrial activities and increased human
input of freshwater due to seasonal drying up of major river systems in
settlements following industrial development over the past decades
70
GIWA REGIONAL ASSESSMENT 34 YELLOW SEA
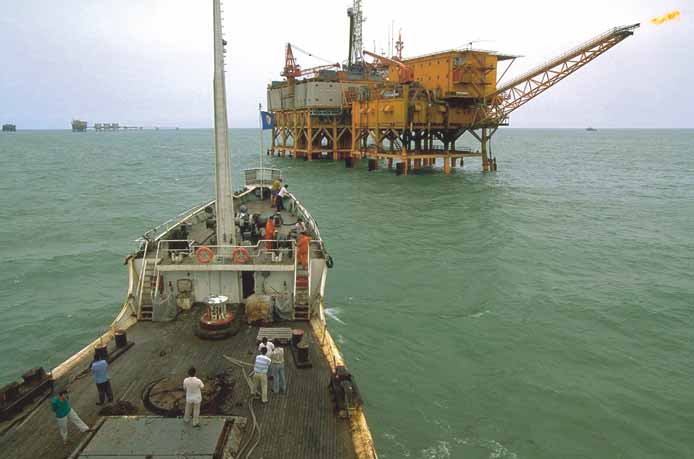
has led to increased extraction and consumption of freshwater. The
control, which has led to substantial modifi cation of stream fl ows in the
rapid industrial development in the region has consequently led to
region in the past decades. The energy production in the oil industry
an increased discharge of treated and/or partially treated industrial
has increased the exploration and production of petroleum and natural
wastewaters high in harmful pollutants into river systems and
gas in the region that has caused loss of ecosystems or habitats.
coastal areas. The increased discharge of industrial wastewater high
in chemical and oil pollutants has also substantially contributed to
Urbanisation
modifi cation of a number of habitats in the region. The petrochemical
Rapid economic growth and industrial development in the region have
industry has contributed to the conversion of coastal wetlands for the
enhanced the process of urbanisation, resulting in discharge of treated
establishment of petrochemical plants in the region and has resulted
and/or partially treated domestic sewage and storm water high in
in more conversion of coastal wetlands, leading to loss of such valuable
harmful pollutants into the river systems and coastal areas.
habitats. Figure 8 shows oil drillling in the Bohai Sea.
Root causes
Infrastructure provision
Demographic
Building of dams and dikes for fl ood control upstream on the river
The increased population growth in the region has resulted in increased
systems of the region over the past decades has increased and this has
demand for food, thus increasing agricultural activities and the demand
led to changes in stream fl ows in these river systems.
to extract more groundwater for crop production. The population
growth combined with the mass migration of population from rural
Energy production
to urban centres has burdened sewage and domestic wastewater
Building of dams and dikes upstream in the river systems, has also
treatment facilities.
been intended to establish the hydroelectric plants in addition to fl ood
Figure 8
Oil drilling in the Bohai Sea.
(Photo: Corbis)
CAUSAL CHAIN ANALYSIS
71
Technology
Natural causes
Inadequate access to crop farming technology has resulted in the
Decrease in rainfall has caused farmers and industrial operators to resort
ineffi
cient use of freshwater in the region. the easy access to modern
to excessive extraction of groundwater to meet the needs for crop and
technology has a propelled industrial growth that requires more use
industrial production.
of water.
Legal
There is inadequate enforcement of laws and regulations in the
Unsustainable exploitation of
region to control the use of freshwater, leading to an overextraction
living resources
of water resources. The current governmental policies to control
industrial, domestic and agricultural water use as well as production
Figure 9 illustrates the causal links for unsustainable exploitation of
are insuffi
cient. For example, the region lack adequate land and
living resources in the Bohai Sea region.
water policies for land use conversion and use of water resources for
agricultural activities.
Environmental and socio-economic impacts
Overexploitation of living resources in the Bohai Sea region were
Economic
identifi ed as having severe environmental impacts. Yields of several
Increase in economic growth has lead to rapid industrial development,
valuable stocks, e.g. Chinese prawn Penaeus chinensis and Threadfi n
increased energy demand and increased human settlements, all
fi sh Eleutheronema tetradactylum have drastically decreased over the
increasing the water consumption. There has also been an increased
past decades. The catch of yellow croaker (Pseudosciaena sp.) and
need to prevent fl oods for the protection of human lives and properties.
Hairtail (Trichiurus haumela) fi sh are now so small that no fi shing seasons
The increased energy demand by industries and domestic uses in
for these fi sh have been identifi ed. Economic values of the fi sheries
the region has resulted in increased production and exploration of
sector have greatly decreased over the past decades due to decreased
petroleum and natural gas. The establishment and operation of more
catch per unit eff ort (CPUE) and reduction in the total catches of some
petrol-chemical plants leads to destruction of adjacent habitats. Low
commercially important fi sh species. The impact associated with
investment in waste treatment facilities has led to increased discharge
changes on biological and genetic diversity was exemplifi ed by the
of wastewater high in pollutants by certain industries.
fact that the genetic diversity of Oriental prawn (Penaeus orientalis) has
signifi cantly changed over the past decades. The economic impacts of
Knowledge
these issues are of primary importance because any decrease in catches
A lack of public awareness on environmental impacts has led to an
means reduced employment opportunities for coastal and riverine
increase in the uncontrolled discharge of industrial and domestic
communities. Unemployment that results from depleted fi sheries
wastewater into the river systems and coastal areas of the region.
resources may be alleviated with alternative working opportunities.
A defi ciency in stakeholder participation and public awareness on
There have been many cases of diseases such as gastroenteric disorders
environmental protection is notable throughout the region. Profi t-
attributed to the consumption of fi sh and other aquatic products in
oriented attitudes in for example the petrochemical industry that
the region.
disregard environmental impacts has resulted in the consequences of
uncontrolled conversion of coastal wetlands for petrochemical plants.
Concerns
Immediate causes
Sectors/Activities
Root causes
Unsustainable
Overexploitation
exploitation of fish
Fishery
Demographic
and other living
resources
Knowledge
Aquaculture
Technology
Impact on biological and
genetic diversity
Figure 9
Causal chain diagram illustrating the causal links for unsustainable exploitation of living resources in the Bohai Sea region.
72
GIWA REGIONAL ASSESSMENT 34 YELLOW SEA
Immediate causes
Root causes
Overexploitation
Demographic
The introduction of new fi shing technologies and increase in
Increase in population growth has resulted in increased demand for
the number of fi shing fl eets and fi shermen has resulted in the
food, including seafood. This has enhanced fi shing activity, leading to
overexploitation of stocks. The uncontrolled expansion of aquaculture
overexploitation of living resources. Shift in livelihood of fi shermen from
has led to an overexploitation of spawning fi sh and prawns, which has
capture fi sheries to aquaculture because of the consistent decline in
aff ected stock recruitment.
fi sh catches has contributed to the uncontrolled or overdevelopment
of aquaculture.
Impact on biological and genetic diversity
There has been a mass restocking of hatchery-produced juveniles which
Knowledge
has resulted in changes of genetic diversity. Since 1985, 200 million
Profi t-driven attitudes of fi sheries operators that has led to uncontrolled
juvenile oriental prawns have been released to the coastal areas of
entry of fi shing boats and fi shermen into the fi sheries sector, resulting
China, signifi cantly changing the genetic diversity of the wild species.
in overexploitation of living resources. Insuffi
cient awareness of the
consequences of uncontrolled releases of hatchery-produced juveniles
Sectors
and overexploitation of spawning fi sh have aff ected the genetic
Fishery
diversity of wild stocks.
An easy access to new fi shing technologies has encouraged more
effi
cient fi shing practices in the region and an increasing number of
Technology
fi shing fl eets and fi shermen entering the fi shing industry have increased
Easy access to improved or new aquaculture technologies has propelled
fi shing eff orts. This have greatly contributed to the overexploitation of
the increased development of aquaculture, leading to unsustainable
living resources in the region.
use of living resources.
Aquaculture
On the other hand, the increased shift of fi shermen from capture
fi sheries into aquaculture due to declining fi sh catches has also
Conclusions
contributed to uncontrolled or over development of aquaculture. The
overexploitation of spawning fi sh and prawn has aff ected recruitment
Table 3 summarise the immediate causes, sectors and root causes in
and mass release of hatchery-produced juvenile fi sh and prawn has
for freshwater shortage, habitat and community modifi cation as well as
infl uenced the genetic diversity of wild stocks; both activities in the
unsustainable exploitation of living resources in the Bohai Sea region.
sector have contributed to unsustainable uses of the living resources
in the region
CAUSAL CHAIN ANALYSIS
73
Table 3
Summary of the causal chain analysis for the Bohai Sea region.
GIWA
Immediate Causes
Sectors
Root Causes
concern
Demohgraphic: Increased population growth.
Agriculture: Increased crop farming activities and expansion of farming
Technology: Inadequate accesses to crop farming technology by farmers.
areas in leading to increased needs of stream waters for irrigation
Legal: Insufficient policies and inadequate enforcement of laws and
Modification of stream flow:Changes in stream
regulations.
water inputs caused by:
Industry: Changes in industrial activities and increased human
Economic: Increase in economic growth.
-upstream damming and diking for flood
settlements following the industrial development leading to increased
Legal: Insufficient policies and inadequate enforcement of laws and
control and set-up of hydroelectric plants;
consumption of stream waters.
regulations.
- increased diversion ofwater from river
tributaries for industry, domestic and irrigation Infrastructure provision: Building of dams and dikes for flood control
Economic: Increase in economic growth.
uses.
upstream the river systems leading to changes in stream flows.
Energy production: Building of dams and dikes upstream the river
systems for setting up hydroelectric plants leading to substantial
Demographic: Increase in energy demand.
modification of the stream flows.
Demographic: Increase in economic growth.
Freshwater
Industry: Rapid industrial development leading to increased discharge
Legal: Insufficient enforcement of laws and regulations for
shortage
of the treated and/or partially treated industrial wastewaters high in
environmental protection.
Pollution of existing supplies: Increased inputs
harmful pollutants into the river systems and coastal areas.
Knowledge: Lack of public awareness and deficiency in stakeholder
of pollutants from industrial and domestic
participation on environmental protection.
waste discharges
Urbanisation: Rapid economic growth and industrial development
Demographic: Increased population growth and mass migration of
enhanced the process of urbanisation resulting in discharge of treated
population from rural to urban centers.
and/or partially treated domestic sewage and storm waters high in
Knowledge: Deficiencies in stakeholder participation and public
harmful pollutants into the river systems and coastal areas.
awareness on environmental protection.
Demographic: Increased population growth.
Agriculture: In the absence of alternative water supply and decrease in
Natural causes: Lacks of alternative water supply and decrease in rainfall.
Changes in the water table: Increased
rainfall, more groundwater had been extracted to meet the needs for
Legal: Lacks of adequate government policy, laws and regulations on
extraction of groundwater for agricultural and
increased crop production.
groundwater utilisation.
industrial uses resulting in significant changes
in the water table in many areas of the region.
Economic: Change in the economic and industrial structures.
Industry: To increased extraction of groundwater for use by certain
Legal: Lacks of adequate government policy, laws and regulations on
industries due to rapid industrial development.
groundwater utilisation.
Knowledge: Profit-oriented with disregard to environmental impacts
Loss of ecosystem: Land use conversion such
Petrochemical industry: Increased conversion of coastal wetlands for the attitudes.
as the conversion of wetlands into rice fields,
set-up of petrochemical plants.
Economic: Increased energy demand by industries and domestic uses.
resulting in the loss of the wetland habitats.
Demographic: Increased population growth.
Decreased input of freshwater due to seasonal
Agriculture: Uncontrolled conversion of coastal wetlands and/or
Legal: Lack of adequate government land and water utilisation policies,
drying up of the major river systems and
freshwater marshlands to rice fields. Diversion of river waters for crop
laws and regulations.
diversion of river waters for agricultural and
production.
Demographic: Increased population growth.
industrial uses leading to the loss of some
freshwater ecosystems. Increased (progressive) Industry: Uncontrolled diversion of river waters for industrial
Economic: Increase in economic growth.
development of oil fields in the Bohai Bay
production.
Technology: Easy access to modern technology.
resulting in the loss of coastal wetlands.
Energy production (oil industry): Increased exploration and production
Habitat and
Economic: Increased energy demand by industries and domestic uses.
of petroleum oil and natural gas causing loss of ecosystems or habitats.
community
modification
Petrochemical industry: Increased set-up of petrochemical plants
Knowledge: Profit-driven with disregard to environmental impacts
Modification of ecosystem: Land use
resulting in increased conversion of coastal wetlands leading to loss of
attitudes.
conversion resulting in not only loss but also
valuable habitats.
Economic: Increased energy demand by industries and domestic uses.
modification of the ecosystems in the vicinity
Agriculture: Uncontrolled conversion of coastal wetlands and/or
of the land use conversion areas. Decreased
Legal: Lack of adequate government land and water utilisation policies,
freshwater marshlands to rice fields. Uncontrolled diversion of river
input of freshwater particularly from Yellow
laws and regulations.
waters for crop production.
River resulting in increase in salinity in Bohai
Sea, leading to modification of several coastal
Industry: Uncontrolled diversion of river waters for use in industrial
Economic: Increase in economic growth and low investment in waste
habitats. Pollution by the presence of oil,
production. Increased discharge of industrial wastewaters high in
treatment facilities.
heavy metals and other pollutants resulting in
chemical and oil pollutants.
Technology: Easy access to modern technology.
modification of several coastal habitats.
Legal: Lack of adequate government policies, laws and regulations for
Agriculture: increased discharge of run-off high in chemical pollutants.
controlling discharge of agricultural wastes.
Fishery: Activities include easy access to new fishing technologies
Overexploitation: Increased fishing efforts by
encouraging more efficient fishing practices, and increasing number of
introduction of new fishing technologies and
Demographic: Increase in population growth.
fishing fleets and fishermen entering the fishing industry that increased
increase in the number of fishing fleets and
Knowledge: Profit driven attitudes of the fisheries operators.
the fishing efforts leading to overexploitation of the depleting living
fishermen resulting in the overexploitation of
resources.
Unsustainable living resources. Uncontrolled development
Technology: Easy access to the improved or new aquaculture
exploitation of of aquaculture resulting in overexploitation of
Aquaculture: Increased entry of fishermen from fisheries into
technologies.
fish and living fish and prawn spawners, affecting the stock
aquaculture due to declined fish catches.
Economic: Shift in livelihood of fishermen from fisheries to aquaculture
resources
recruitment.
resulting in uncontrolled or overdevelopment of aquaculture.
Impact on biological and genetic diversity:
Aquaculture: Enhancement of wild stock through mass release of
Knowledge: Insufficient awareness of fish farmers on the consequences
Mass restocking of hatchery-produced
hatchery-produced juveniles, overexploitation of wild spawners (e.g.
of uncontrolled release of hatchery-produced juveniles and
juveniles resulting in changes of genetic
spawners of Penaeus orientalis) for aquaculture use.
overexploitation of spawners, which could affect the genetic diversity of
diversity.
the wild stocks.
74
GIWA REGIONAL ASSESSMENT 34 YELLOW SEA
Policy options
BOHAI SEA
This section aims to identify feasible policy options that target
Over the past few decades, many critical ecosystems and habitats in the
key components identifi ed in the Causal chain analysis in order to
region have been lost mainly as a result of human activities. As a result
minimise future impacts on the transboundary aquatic environment.
of this loss, more than 50% of employment opportunities in aquatic
Recommended policy options were identifi ed through a pragmatic
product processing industries have been lost. There have also been
process that evaluated a wide range of potential policy options
losses of freshwater and brackish habitats as well as seasonal drying
proposed by regional experts and key political actors according
up of for example the Yellow River. Modifi cations of the ecosystems
to a number of criteria that were appropriate for the institutional
in the region, in terms of changes in species population structure
context, such as political and social acceptability, costs and benefi ts
and biodiversity, are also relatively severe. Lack of adequate land and
and capacity for implementation. The policy options presented in
water use policies, laws and regulations for land use conversion and
the report require additional detailed analysis that is beyond the
use of water resources for agricultural activities have exaggerated the
scope of the GIWA and, as a consequence, they are not formal
situation.
recommendations to governments but rather contributions to
broader policy processes in the region.
Economic values of the fi sheries sector have greatly decreased over
the past decades due to decreased catch per unit eff ort (CPUE) and
reduction in the total catches of some commercially important fi sh
species. The introduction of new fi shing technologies and increas
in the number of fl eets are among the causes for overexploitation.
Definition of the problem
The extended aquaculture industry has contributed to the change of
genetic diversity of wild populations.
The impact assessment and causal chain analysis have shown that the
priority environmental problems in the Bohai Sea region are freshwater
shortage, habitat and community modifi cation, and unsustainable
exploitation of living resources. Increased discharges of untreated or
Policy options and strategic
partially treated industrial and domestic wastewater have resulted in
action programmes
that more than one third of the major water bodies in the region are
polluted, with the quality of their surface water below World Health
Suggested policy options and their associated Strategic action
Organization's drinking water standards. Increased population growth
Programmes (SAP) to address the key root causes as identifi ed above
and urbanisation have burdened sewage treatment facilities but
were formulated and reviewed by a panel of experts who had been
also increased the demand for food which has increased agricultural
previously involved in the GIWA studies. The policy options and their
activities. Stream fl ow in the large river basins such as Liao, Luan, Hai
associated strategic action programmes for each of the key root causes
and Yellow have been severely reduced, manly due to agricultural
in each of the environmental problem areas are formulated and listed
and industrial activities, as well as building of dams for hydropower
below:
generation.
POLICY OPTIONS
75
Freshwater shortage
Demographic: Mass migration to urban areas
Legal: Insuffi
cient policies and inadequate enforcement of laws
Options:
and regulations
Adoption of policies, laws and regulations to restrict migration.
Options:
Adoption of the development of small, rural-oriented urban centres
Adoption of policies, laws, regulations and enforcement mecha-
in rural areas to cope with population migration.
nisms to (i) control and promote the effi
cient use of river water for
agricultural and industrial uses; (ii) control discharge of polluted
Strategic Action Programme (SAP):
wastewater from agricultural run-off and by the industry sector;
Strengthening the enforcement of laws and regulations to restrict
and (iii) indiscriminate extraction of ground water for agricultural
mass migration of population from rural to urban areas.
and industrial uses.
Implementation of the development of small, rural-oriented urban
Adoption of the introduction of green production technologies for
centres in rural areas to cope with population migration.
agricultural and industry sectors to reduce discharge of polluted
wastewater.
Natural causes: Lack of alternative water supplies and decreases
Adoption and integration of the management of river water use in
in rainfall
integrated river basin management programmes.
Options:
Adoption of promotional programmes on the use of green technolo-
Strategic Action Programme (SAP):
gies in the industry sector to reduce the use of groundwater.
Strengthening the enforcement of policies, laws, regulations and
Adoption of the introduction of water-saving crop irrigation tech-
enforcement mechanisms to, (i) control and promote the effi
cient
nologies in agriculture to reduce the use of groundwater for irriga-
use of river water for agricultural and industrial uses; (ii) control the
tion.
discharge of polluted wastewater from agricultural run-off and by
the industry sector; and (iii) indiscriminate extraction of ground
Strategic Action Programme (SAP):
water for agricultural and industrial uses.
Development and implementation of promotional programmes on
Promotion of the use of green production technologies in the in-
the use of green technologies in the industry sector to reduce the
dustry and agricultural sectors.
use of groundwater.
Implementation of the management of river water use with inte-
Promotion of water-saving crop irrigation technologies in agricul-
grated river basin management programmes.
ture to reduce the use of groundwater for irrigation.
Knowledge: Lack of public awareness and defi ciencies in stake-
Habitat and community modification
holder participation in environmental protection
Knowledge: Profi t-oriented attitudes that disregard environ-
Options:
mental impacts
Adoption of public awareness campaign programmes on environ-
Options:
mental and the social consequences of the uncontrolled discharge
Adoption of policies, laws, regulations and enforcement mecha-
of polluted wastewater into river systems.
nisms to restrict the conversion of coastal wetlands for industrial
Adoption of stakeholder participation and consultation pro-
development.
grammes in association with environmental management.
Adoption of public awareness campaign programmes on the en-
vironmental and social consequences of uncontrolled conversion
Strategic Action Programme (SAP):
of coastal wetlands for industrial uses.
Development and implementation of public awareness campaign
programmes on the environmental and social consequences of
Strategic Action Programme (SAP):
uncontrolled discharge of polluted wastewater into river sys-
Strengthening the enforcement of policies, laws, regulations and
tems.
enforcement mechanisms to restrict the conversion of coastal wet-
Development and implementation of stakeholder participation
lands for industrial development.
and consultation programmes in association with environmental
Development and implementation of public awareness campaign
management.
programmes on the environmental and social consequences of
uncontrolled conversion of coastal wetlands for industrial uses.
76
GIWA REGIONAL ASSESSMENT 34 YELLOW SEA
Economic: Increased energy demand by domestic and industrial
Adoption of relocation programmes for fi shermen to the aquacul-
use
ture sector in line with sustainable aquaculture development strat-
Option:
egies.
Adoption of policies, laws, regulations and enforcement
Adoption of training programmes on sustainable aquaculture pro-
mechanisms for regulating the exploration and exploitation of oil
duction technologies to educate fi shermen entering the aquacul-
and mineral resources.
ture sector.
Adoption of the programmes seeking alternative energy sources.
Strategic Action Programme (SAP):
Adoption of the introduction of technologies in the industry sector
Development and implementation of relocation programmes for
to reduce the use of petroleum.
fi shermen to the aquaculture sector in line with sustainable aqua-
culture development strategies.
Strategic Action Programme (SAP):
Strengthening the enforcement of policies, laws, regulations and
Knowledge: Insuffi
cient awareness of the consequences of the
enforcement mechanisms for regulating the exploration and ex-
uncontrolled release of hatchery-produced juveniles and over-
ploitation of oil and mineral resources.
exploitation of spawning fi sh.
Development and implementation of the programmes to seek al-
Option:
ternative energy sources.
Adoption
of
public
awareness
programmeson the environmental
Promotion
of
effi
cient technologies in the industry sector to reduce
and biotic consequences of the mass release of hatchery-produced
the use of petroleum.
juveniles for wild fi sheries stocks.
Adoption of biotechnological research programmes(e.g. develop-
Legal: Lack of adequate government land and water use poli-
ment of a gene bank; species selection and hybridisation) to sustain
cies, laws and regulations
biological and genetic diversity in aquaculture and wild fi sheries
Options:
stocks.
Adoption and development of government land and water use
Adoption of programmes that promote good practices in aquacul-
policies, laws, regulations and enforcement mechanisms.
ture.
Strategic Action Programme (SAP):
Strategic Action Programme (SAP):
Development of public awareness programmes on the environ-
Strengthening the enforcement of government land and water use
mental and biotic consequences of mass release of hatchery-pro-
policies, laws, regulations and enforcement mechanisms.
duced juveniles for wild fi sh stocks.
Development and implementation of biotechnological research
Economic: Low investment in waste treatment facilities.
programmes to sustain biological and genetic diversity of aqua-
Options:
culture and wild fi sh stocks.
Promotion of market incentive systems to encourage the industry
sector to use green production technologies.
Knowledge: Profi t-driven attitudes of fi sheries operators
Enhancement of policies and laws for pollution prevention and
Option:
wastewater treatment practices.
Adoption of alternative livelihood programmes to reduce the entry
of excessive number of fi shermen into the fi sheries sector.
Strategic Action Programme (SAP):
Adoption of fi sheries capacity reduction programmes to mitigate
Development and implementation of market incentive pro-
excessive fi shing eff orts and to reduce the entry of excessive num-
grammes to encourage the use of green production technologies
ber of fi shermen into the fi sheries sector.
to reduce discharge of polluting wastes.
Strategic Action Programme (SAP):
Strengthening the enforcement of policies and laws for pollution
Development and implementation of alternative livelihood pro-
prevention and wastewater treatment practices.
grammesto reduce the entry of excessive number of fi shermen into
the fi sheries sector.
Unsustainable exploitation of living resources
Development and implementation of fi sheries capacity reduction
Demographic: Shift in livelihoods of fi shermen
programmesto mitigate excessive fi shing eff orts and to limit the
Option:
entry of fi shermen into the fi sheries sector.
POLICY OPTIONS
77
References
BOHAI SEA
Anon. (2003). Geography of China. Ohio State University, USA. Retrieved
SEPA (2003). Water resources degradation. State Environmental
December, 2003 from: http://www.ohio-state.edu/deall/jin.3/c231/
Protection Administration (SEPA), People's Republic of China.
refs/geo.htm
Retrieved August, 2003 from: http://www.chinaenvironment.com/
Cui, Y. and Song, Y. (1999). Nutrients in the Bohai Sea, p. 376-379 In:
english/channel/pollution/waste/waterresource.html
Sherman, K. and Tang, Q.(eds.). Large Marine Ecosystems of the
Tang, Q. and Jin, X. (1999). Ecology and variability of economically
Pacifi c Rim - Assessment, Sustainability and Management.
important pelagic fi shes in the Yellow Sea and Bohai Sea. In:
Dai, W. (2001). Fisheries and mariculture management in Bohai Sea,
Sherman, K. and Tang, Q. (eds.) Large marine ecosystems of the
China - An ecosystem-based medium term strategy. Final Project
Pacifi c Rim: assessment, sustainability, and management. Blackwell
Report 2001, Dalian Fisheries University, Dalian, China.
Science, Inc., Malden (Mass.), USA.
Jin, X. (2003). Marine fi shery resources and management in China. Yellow
WAF (2003). Yellow River basin. CGIAR Challenge Programme on Water
Sea Research Institute, Qingdao, China. Retrieved September, 2003
and Food (WAF), Colombo, Sri Lanka. Retrieved September, 2003
from: http://www.lib.noaa.gov/china/marineresoruce.htm
from:http://www.waterforfood.org/BB_Yellow_River_Basin.htm
MacKinnon, J., Sha, M., Cheung, C., Carey, G., Xiang, Z. and Melville, D.
Wigan, M. (1998). The Last of the Hunter Gathers, Fisheries Crisis at Sea.
(1996). A biodiversity review of China. Worldwide Fund for Nature
Manchester: Swall Hill Press, UK.
(WWF) International, Hong Kong.
Wikipedia (2003). Geography of China. The Wikipedia Internet Library,
MF (2003). China's ten economic hot spots. Ministry of Finance (MF),
USA. Retrieved August, 2003 from: http://www.wikipedia.org/wiki/
People's Republic of China. Retrieved October, 2003 from: http://
Geography_of_China
www.iist.unu.edu/china/ChinaInBrief/17E5423p.html
WRI (2003). Yellow River Watershed. World Resources Institute (WRI),
MOWR (2001). Integrated water resources management around the Bo
Washington D. C., USA. Retrieved on September 24, 2003 from:http:
Hai Sea - GEF draft concept document. Ministry of Water Resources
//multimedia.wri.org/watersheds_2003/as10.html
(MOWR), P. R. China.
Zhang, H.-L. and Wen, K. (2003). Flood control and management
ORNL (2003). Landscan 2002. Oak Ridge National Laboratory. Retrieved
of large rivers in China: A case study of the Huaihe River basin.
Nov. 2003 from: http://www.ornl.gov.gist
Nanjing Institute of Hydrology and Water Resources, Nanjing,
PEMSEA (2004). Richly-endowed Bohai Sea. GEF/UNDP/IMO Programme
China. Retrieved September, 2003 from:http://www.unescap.org/
of Building Partnerships of Environmental Management in the
esd/water/disaster/2001/china.doc
Seas of East Asia (PEMSEA). Retrieved February, 2004 from: http:
//www.pemsea-bohai.net.cn/hjzy/hyqy01e.htm
Qiao, Z. (2001). China - state and future of China fi sheries enhancement,
management and technology development. State Oceanic
Administration, Beijing, China. Retrieved December, 2001 from:
http://www.soa.gov.cn/leader/9713a.htm
78
GIWA REGIONAL ASSESSMENT 34 YELLOW SEA
Conclusions and recommendations
YELLOW SEA & BOHAI SEA
The GIWA assessment of the Yellow and Bohai Seas aimed to identify
in the early 20th century resulted in that almost all major stocks were
actions for remedial and mitigatory actions. The report investigates the
fully fi shed by the mid-1970s and overfi shed by the 1980s. Fishing
ecological status, the causes of their degradation and the policy options
with destructive methods is common throughout the region and
available to improve their status. From an ecological perspective, the
many aquatic habitats in have been destroyed and fi sh stocks have
Bohai Sea proper is a large, shallow embayment of the Yellow Sea. The
collapsed. Common destructive fi shing practices in the region include
Yellow Sea, in turn, is a shallow continental sea of the northwest Pacifi c
indiscriminate trawling along the coastal waters of Yellow Sea, fi shing
Ocean. These relationships are important because of the physical and
with explosives in lakes, and use of pesticides for fi shing.
biological links between these systems; in particular, the fi sh and
shellfi sh stocks in the Yellow Sea are dependent on the Bohai Sea as
The transboundary issues that need to be addressed are the
a reproduction and nursery area. Given that the Bohai Sea is not a
management of marine resources, industrial pollution, and ecosystem
transboundary waterbody, the assessment report of the Bohai Sea is
health. Progress is being made in the introduction of ecosystem-based
included in this report as an appendix to be used as a reference for
management for this region.
further understanding of the Yellow Sea's environmental problems.
However, policy options involving the management of transboundary
The GIWA assessment ranked modifi cation of stream fl ow, pollution
issues in the region may be hindered by several factors such as the
of freshwater supplies, loss and modifi
cation of ecosystems,
ineff ectiveness of measures for the control of the overexploitation of
overexploitation of fi sh resources and destructive fi shing practices
shared stocks in the Yellow Sea and defi ciency of existing national and
as having severe impacts and were considered the priority issues in
international eff orts to arrest degradation of coastal water quality due
the Yellow Sea region. The region has experienced both signifi cant
to discharge of pollutants from land- and sea-based activities.
reduction of water fl ow in the major river systems on both the Chinese
and Korean side, as well as pollution of existing water resources, mainly
In the Bohai Sea region, modifi cation of stream fl ow, pollution of
from agriculture and industrial activities. There have been signifi cant
existing freshwater supplies, changes in the water table, loss and
losses and modifi cation of habitats in the region during the past 30
modifi cation of ecosystems, overexploitation of living resources and
years. Increased industrialisation has attracted mass migration of the
impact of fi sheries on biological and genetic diversity were ranked as
rural population to urban areas. This rapid population growth has
severe and were considered the priority issues in the region.
resulted in the need to convert more lands for human settlement as
well as an increase of discharge of harmful pollutants to the water
Stream fl ows of the major river basin of the Bohai Sea region have
bodies. At the same time, the population growth has increased the
been severely reduced and business costs have increased by 10% with
demand for food and agricultural products, resulting in the increased
frequent interruption of water supply. More than 30% of the major river
use of freshwater for crop production.
basins in the region have also been polluted, resulting in a quality of
their surface water that is below the World Health Organization (WHO)
The Yellow Sea is one of the most exploited areas in the world. The
drinking water standards. Moreover, large-scale salinisation of coastal
increase in fi shing eff ort following the introduction of bottom trawler
aquifers has occurred over the past decades.
CONCLUSIONS AND RECOMMENDATIONS
79
Over the past few decades, many critical ecosystems and habitats in
Development of small, rural-oriented urban centers in rural areas to
the region have been lost mainly as a result of human activities. The
cope with population migration;
extent of these losses is estimated to account to 30-50% of their total
Finding alternative energy sources to reduce the use of
area. The lost ecosystems have been found to include freshwater
petroleum;
marshlands, running water wetlands, saline habitat wetlands, rivers,
Training programmes on sustainable aquaculture production
lakes, sandy foreshores, rocky foreshores, sand and gravel bottoms and
technology, and relocation programmes for traditional fi shermen;
mud bottoms. As a result of this loss, more than 50% of employment
Alternative livelihood programmes to reduce fi sheries capacity.
opportunities in aquatic product processing industries have also been
lost.
The management of the Yellow Sea and the adjacent Bohai Sea
is especially complicated in that it is surrounded by nations that
Although policy options are defi ned for every specifi c root cause, some
share some historical and cultural aspects but diff er in political
policy options are universally applicable, and could be recommended
systems, political and economic alignment, and levels of economic
as the actions of highest priority for the Bohai Sea region. These are:
development. There are several agreements for bilateral regulation
Adoption of policies, laws, regulations and enforcement or development of the Yellow Sea Large Marine Ecosystem, however
mechanisms;
none of them are binding on all the nations and nor is any nation a
Introduction of green production technologies;
party to all the agreements. In addition, many of the existing national
Integration of river basin management;
management policies or bilateral management programme for the
Adoption of public awareness campaign and stakeholder region have been designed and carried out with insuffi cient attention
participation programmes;
to transnational issues.
80
GIWA REGIONAL ASSESSMENT 34 YELLOW SEA
Annexes
YELLOW SEA & BOHAI SEA
Annex I
List of contributing authors and organisations
Yellow Sea
Name
Institutional affiliation
Country
Field of work
Toxicology of marine fauna; technology development of seaweed culture and
Mr. Ronald Bonifacio
Coastal Management Center, Manila
Philippines
processing; Integrated coastal and marine management
Key Laboratory for Science and Engineering of Ecological Environment, First Institute of
Dr. Shang Chen
China
Marine ecosystems; Environmental modelling
Oceanography (FIO), State Oceanic Administration (SOA), Qingdao,
Dr. Chung-Il Choi
Department of Earth and Marine Sciences, Hanyang University, Seoul
Korea
Ecology; Limnology; Conservation biology
Mr. Jingyao Deng
Yellow Sea Fisheries Research Institute, Qingdao
China
Fisheries stock assessment/ management
Aquaculture & Fisheries; Coastal Resource Management; Integrated Coastal and
Dr. Rogelio O. Juliano
Coastal Management Center, Manila
Philippines
Marine Management
Systems ecology; Coastal Management; Ecological
Dr. Daeseok Kang
Korea Maritime Institute, Seoul
Korea
Economics
Dr. Dong-Young Lee
China-Korea Joint Ocean Research Center, Qingdao
China
Coastal engineering, Marine meteorology
Dr. Daoji Li
Institute of Estuarine and Coastal Research, East China Normal University, Shanghai
China
Marine Environmental Science
Mr. Fengchao Liu
Dalian Polytechnical University, Dalian
China
Regional economics
Prof. Hongbin Liu
Shandong Marine Economics Research Institute, Qingdao,
China
Socio-economics
Mr. Qiming Ma
Qingdao Ocean University, Qingdao
China
Environmental engineering
Mr. Minghui Ma
NMEMC, Dalian
China
Marine ecology
West Sea Fisheries Research Institute National Fisheries Research and Development
Marine ecosystem;
Dr. Gyung-Soo Park
Korea
Institute, Bupyung-Gu
Ecology; Marine pollution
Dr. Elina Rautalahti-
GIWA Core Team, UNEP-GIWA Co-ordination Office
Sweden
Environmental management; Coastal and marine resources management
Miettinen
Prof. Yufang Song
Shengyang Applied Ecology Institute, Chinese Academy of Sciences
China
Ecology
Prof. Gongke Tan
China
Physical Oceanography
Physical Oceanography Division, First Institute Of Oceanography (FIO), State Oceanic
Prof. Yuxiang Tang
China
Physical oceanography; Global climate change
Administration (SOA), Qingdao
Aquaculture & Fisheries; Coastal Resource Management; Integrated Coastal and
Dr. Seng-Keh Teng
Coastal Management Center, Manila
Philippines
Marine Management
Prof. Ling Tong
Yellow Sea Fisheries Research Institute, Qingdao
China
Fisheries stock assessment/management
Mr. Baodong Wang
First Institute of Oceanography, Qingdao
China
Marine chemistry
Mr. Xiulin Wang
Oingdao Ocean University, Qingdao
China
Marine chemistry
Marine Environment and Climate Change Laboratory, Korea Ocean Research &
Dr. Dong-Beom Yang
Korea
Environmental management (Yellow Sea); Marine chemistry and water quality
Development Institute
Prof. Chang-cheng Ye
Marine Fisheries Research Institute, Dalian
China
Fishery resource enhancement/ assessment
ANNEXES
81
Prof. Chun Ye
Chinese Research Academy of Environmental Sciences, Beijing
China
Ecological engineering
Dr. Huming Yu
China Institute for Marine Affairs, Beijing
China
Coastal management; fisheries management
Prof. Qingdong Yu
Qingdao University, Qingdao
China
System engineering
Dr. Yueli Yuan
First Institute of Oceanography, Qingdao
China
Physical oceanography and modelling
Ms. Shu Zhang
Dalian Water Conservancy Bureau, Dalian
China
Fresh water resources assessment
Mr. Xuelei Zhang
First Institute of Oceanography,Qingdao
China
Marine ecosystems
Key Laboratory for Science and Engineering of Marine Ecological Elements, First Institute
Dr. Mingyuan Zhu
China
Coastal resource management; marine ecology
of Oceanography, Qingdao
Prof. Kelin Zhuang
Qingdao Marine Geological Institute, Qingdao
China
Marine geology
Mr. Zhenyue Zhuang
Qingdao Ocean University, Qingdao,
China
Marine sedimentation and environment
Bohai Sea
Name
Institutional affiliation
Country
Field of work
Toxicology of marine fauna; technology development of seaweed culture and
Mr. Ronald Bonifacio
Coastal Management Center, Manila,
Philippines
processing; Integrated coastal and marine management
Mr. Zhenxing Dou
National Marine Environmental Monitoring Center, Dalian
China
Physical oceanography; water quality modeller
Mr. Zhijie Fan
NMEMC, Dalian
China
Marne pollution monitoring
Aquaculture & Fisheries; Coastal Resource Management; Integrated Coastal and
Dr. Rogelio O. Juliano
Coastal Management Center, Manila
Philippines
Marine Management
Mr. Jianguo Lin
College of Environmental Science and Engineering, Dalian Maritime University
China
Ocean dynamics, marine transportation
Ms. Xinzhen Lin
NMEMC, Dalian
China
Science and technology management
Mr. Fengchao Liu
Dalian Polytechnical University
China
Regional economics
Prof. Hongbin Liu
Shandong Marine Economics Research Institute, Qingdao,
China
Socio-economics
Prof. Guohai Liu
Liaoning Normal University, Dalian
China
Marine economics; Geography
Mr. Deyi Ma
NMEMC, Dalian
China
Marine chemistry; environmental impact assessment
Mr. Qiming Ma
Qingdao Ocean University, Qingdao
China
Environmental engineering
Mr. Minghui Ma
NMEMC, Dalian
China
Marine ecology
Dr. Elina Rautalahti-
GIWA Core Team, UNEP-GIWA Co-ordination Office
Sweden
Environmental management; Coastal and marine resources management
Miettinen
Prof. Yufang Song
Shengyang Applied Ecology Institute, Chinese Academy of Sciences
China
Ecology
Physical Oceanography Division, First Institute of Oceanography, State Oceanic
Prof. Yuxiang Tang
China
Physical oceanography; Global climate change
Administration, Qingdao
Aquaculture & Fisheries; Coastal Resource Management; Integrated Coastal and
Dr. Seng-Keh Teng
Coastal Management Center, Manila
Philippines
Marine Management
Prof. Ling Tong
Yellow Sea Fisheries Research Institute, Qingdao
China
Fisheries stock assessment/management
Mr. Jin Xia
Dalian Environmental Science Institute, Dalian
China
Water environment and resources protection
Mr. Xueren Xu
NMEMC, Dalian
China
Oil pollution monitoring and assessment
Prof. Chang-cheng Ye
Marine Fisheries Research Institute, Dalian
China
Fishery resource enhancement/ assessment
Dr. Huming Yu
Chinise Institute for Marine Affairs, Beijing
China
Coastal management; fisheries management
Dalian Water Conservancy Bureau, 32,Gorky Road, Xigang District, Dalian 116011,
Ms. Shu Zhang
China
Fresh water resources assessment
P. R. CHINA. Tel: +86 4113634098(o); +86 411 4216995(H).
Key Laboratory for Science and Engineering of Marine Ecological Elements, First
Dr. Mingyuan Zhu
China
Coastal resource management; marine ecology
Institute of Oceanography, Qingdao
Prof. Kelin Zhuang
Qingdao Marine Geological Institute, Qingdao
China
Marine geology
Mr. Zhenyue Zhuang
Qingdao Ocean University, Qingdao
China
Marine sedimentation and environment
82
GIWA REGIONAL ASSESSMENT 34 YELLOW SEA
Annex II
Detailed scoring tables: Yellow Sea
I: Freshwater shortage
II: Pollution
Weight
Weight
Environmental
Environmental
Environmental issues
Score
Weight
averaged
Environmental issues
Score
Weight
averaged
concern
concern
score
score
1. Modification of stream flow
3
40
Freshwater shortage
2.6
4. Microbiological
2
10
Pollution
1.9
2. Pollution of existing supplies
3
20
5. Eutrophication
3
35
3. Changes in the water table
2
40
6. Chemical
1
10
7. Suspended solids
1
20
Criteria for Economics impacts
Raw score
Score
Weight %
8. Solid wastes
2
10
Very small
Very large
Size of economic or public sectors affected
1
N/a
0 1 2 3
9. Thermal
1
5
Minimum
Severe
Degree of impact (cost, output changes etc.)
1
N/a
10. Radionuclides
N/a
N/a
0 1 2 3
Occasion/Short
Continuous
Frequency/Duration
1
N/a
11. Spills
1
10
0 1 2 3
Weight average score for Economic impacts
1
Criteria for Economics impacts
Raw score
Score
Weight %
Criteria for Health impacts
Raw score
Score
Weight %
Very small
Very large
Very small
Very large
Size of economic or public sectors affected
3
N/a
Number of people affected
1
N/a
0 1 2 3
0 1 2 3
Minimum
Severe
Minimum
Severe
Degree of impact (cost, output changes etc.)
3
N/a
Degree of severity
1
N/a
0 1 2 3
0 1 2 3
Occasion/Short
Continuous
Occasion/Short
Continuous
Frequency/Duration
3
N/a
Frequency/Duration
1
N/a
0 1 2 3
0 1 2 3
Weight average score for Economic impacts
3
Weight average score for Health impacts
1
Criteria for Health impacts
Raw score
Score
Weight %
Criteria for Other social and
Raw score
Score
Weight %
community impacts
Very small
Very large
Number of people affected
1
N/a
Very small
Very large
0 1 2 3
Number and/or size of community affected
2
N/a
0 1 2 3
Minimum
Severe
Degree of severity
1
N/a
Minimum
Severe
0 1 2 3
Degree of severity
2
N/a
0 1 2 3
Occasion/Short
Continuous
Frequency/Duration
1
N/a
Occasion/Short
Continuous
0 1 2 3
Frequency/Duration
2
N/a
0 1 2 3
Weight average score for Health impacts
1
Weight average score for Other social and community impacts
2
Criteria for Other social and
Note: N/a = Not applied.
Raw score
Score
Weight %
community impacts
Very small
Very large
Number and/or size of community affected
2
N/a
0 1 2 3
Minimum
Severe
Degree of severity
2
N/a
0 1 2 3
Occasion/Short
Continuous
Frequency/Duration
2
N/a
0 1 2 3
Weight average score for Other social and community impacts
2
Note: N/a = Not applied.
ANNEXES
83
III: Habitat and community modification
IV: Unsustainable exploitation of fish
Weight
and other living resources
Environmental
Environmental issues
Score
Weight
averaged
concern
score
Weight
Environmental
Environmental issues
Score
Weight %
averaged
Habitat and community
concern
12. Loss of ecosystems
3
50
3.0
score
modification
13. Modification of ecosystems or
Unsustainable
14. Overexploitation
3
50
2.6
ecotones, including community
3
50
exploitation of fish
structure and/or species composition
15. Excessive by-catch and
1
5
discards
16. Destructive fishing practices
3
20
Criteria for Economics impacts
Raw score
Score
Weight %
Very small
Very large
17. Decreased viability of stock
Size of economic or public sectors affected
1
N/a
1
5
0 1 2 3
through pollution and disease
Minimum
Severe
18. Impact on biological and
Degree of impact (cost, output changes etc.)
1
N/a
2
20
0 1 2 3
genetic diversity
Occasion/Short
Continuous
Frequency/Duration
1
N/a
0 1 2 3
Criteria for Economics impacts
Raw score
Score
Weight %
Weight average score for Economic impacts
1
Very small
Very large
Size of economic or public sectors affected
1
N/a
Criteria for Health impacts
Raw score
Score
Weight %
0 1 2 3
Minimum
Severe
Very small
Very large
Degree of impact (cost, output changes etc.)
1
N/a
Number of people affected
2
N/a
0 1 2 3
0 1 2 3
Occasion/Short
Continuous
Minimum
Severe
Frequency/Duration
1
N/a
Degree of severity
2
N/a
0 1 2 3
0 1 2 3
Occasion/Short
Continuous
Weight average score for Economic impacts
1
Frequency/Duration
2
N/a
0 1 2 3
Criteria for Health impacts
Raw score
Score
Weight %
Weight average score for Health impacts
2
Very small
Very large
Criteria for Other social and
Number of people affected
3
N/a
Raw score
Score
Weight %
0 1 2 3
community impacts
Minimum
Severe
Very small
Very large
Degree of severity
3
N/a
Number and/or size of community affected
3
N/a
0 1 2 3
0 1 2 3
Occasion/Short
Continuous
Minimum
Severe
Frequency/Duration
3
N/a
Degree of severity
3
N/a
0 1 2 3
0 1 2 3
Occasion/Short
Continuous
Weight average score for Health impacts
3
Frequency/Duration
3
N/a
0 1 2 3
Criteria for Other social and
Raw score
Score
Weight %
Weight average score for Other social and community impacts
3
community impacts
Very small
Very large
Note: N/a = Not applied.
Number and/or size of community affected
2
N/a
0 1 2 3
Minimum
Severe
Degree of severity
2
N/a
0 1 2 3
Occasion/Short
Continuous
Frequency/Duration
2
N/a
0 1 2 3
Weight average score for Other social and community impacts
2
Note: N/a = Not applied.
84
GIWA REGIONAL ASSESSMENT 34 YELLOW SEA
V: Global change
Weight
Environmental
Environmental issues
Score
Weight
averaged
concern
score
19. Changes in the hydrological cycle
2
40
Global change
1.4
20. Sea level change
1
60
21. Increased UV-B radiation as a
N/a
N/a
result of ozone depletion
22. Changes in ocean CO2
N/a
N/a
source/sink function
Criteria for Economics impacts
Raw score
Score
Weight %
Very small
Very large
Size of economic or public sectors affected
1
N/a
0 1 2 3
Minimum
Severe
Degree of impact (cost, output changes etc.)
1
N/a
0 1 2 3
Occasion/Short
Continuous
Frequency/Duration
1
N/a
0 1 2 3
Weight average score for Economic impacts
1
Criteria for Health impacts
Raw score
Score
Weight %
Very small
Very large
Number of people affected
1
N/a
0 1 2 3
Minimum
Severe
Degree of severity
1
N/a
0 1 2 3
Occasion/Short
Continuous
Frequency/Duration
1
N/a
0 1 2 3
Weight average score for Health impacts
1
Criteria for Other social and
Raw score
Score
Weight %
community impacts
Very small
Very large
Number and/or size of community affected
2
N/a
0 1 2 3
Minimum
Severe
Degree of severity
2
N/a
0 1 2 3
Occasion/Short
Continuous
Frequency/Duration
2
N/a
0 1 2 3
Weight average score for Other social and community impacts
2
Note: N/a = Not applied.
Comparative environmental and socio-economic impacts of each GIWA concern
Types of impacts
Environmental score
Economic score
Human health score
Social and community score
Concern
Overall score
Rank
Pr
esent (a)
F
uture (b)
Pr
esent (a)
F
uture (b)
Pr
esent (a)
F
uture (b)
Pr
esent (a)
F
uture (b)
Freshwater shortage
2.6
1
1
2
1
0
2
1
1.3
5
Pollution
1.9
2
3
2
1
1
2
2
1.9
3
Habitat and community
3.0
3
1
1
2
1
3
3
2.1
2
modification
Unsustainable exploitation of fish
2.6
2
1
2
3
2
2
3
2.2
1
and other living resources
Global change
1.4
2
1
2
1
1
2
2
1.6
4
ANNEXES
85
Detailed scoring tables: Bohai Sea
I: Freshwater shortage
II: Pollution
Weight
Weight
Environmental
Environmental
Environmental issues
Score
Weight
averaged
Environmental issues
Score
Weight
averaged
concern
concern
score
score
1. Modification of stream flow
3
40
Freshwater shortage
3.0
4. Microbiological
2
20
Pollution
2.3
2. Pollution of existing supplies
3
40
5. Eutrophication
3
35
3. Changes in the water table
3
20
6. Chemical
2
10
7. Suspended solids
1
10
Criteria for Economics impacts
Raw score
Score
Weight %
8. Solid wastes
2
15
Very small
Very large
Size of economic or public sectors affected
1
N/a
0 1 2 3
9. Thermal
1
5
Minimum
Severe
Degree of impact (cost, output changes etc.)
1
N/a
10. Radionuclides
N/a
N/a
0 1 2 3
Occasion/Short
Continuous
Frequency/Duration
1
N/a
11. Spills
3
5
0 1 2 3
Weight average score for Economic impacts
1
Criteria for Economics impacts
Raw score
Score
Weight %
Criteria for Health impacts
Raw score
Score
Weight %
Very small
Very large
Very small
Very large
Size of economic or public sectors affected
2
N/a
Number of people affected
1
N/a
0 1 2 3
0 1 2 3
Minimum
Severe
Minimum
Severe
Degree of impact (cost, output changes etc.)
2
N/a
Degree of severity
1
N/a
0 1 2 3
0 1 2 3
Occasion/Short
Continuous
Occasion/Short
Continuous
Frequency/Duration
2
N/a
Frequency/Duration
1
N/a
0 1 2 3
0 1 2 3
Weight average score for Economic impacts
2
Weight average score for Health impacts
1
Criteria for Health impacts
Raw score
Score
Weight %
Criteria for Other social and
Raw score
Score
Weight %
community impacts
Very small
Very large
Number of people affected
1
N/a
Very small
Very large
0 1 2 3
Number and/or size of community affected
1
N/a
0 1 2 3
Minimum
Severe
Degree of severity
1
N/a
Minimum
Severe
0 1 2 3
Degree of severity
1
N/a
0 1 2 3
Occasion/Short
Continuous
Frequency/Duration
1
N/a
Occasion/Short
Continuous
0 1 2 3
Frequency/Duration
1
N/a
0 1 2 3
Weight average score for Health impacts
1
Weight average score for Other social and community impacts
1
Criteria for Other social and
Note: N/a = Not applied.
Raw score
Score
Weight %
community impacts
Very small
Very large
Number and/or size of community affected
2
N/a
0 1 2 3
Minimum
Severe
Degree of severity
2
N/a
0 1 2 3
Occasion/Short
Continuous
Frequency/Duration
2
N/a
0 1 2 3
Weight average score for Other social and community impacts
2
Note: N/a = Not applied.
86
GIWA REGIONAL ASSESSMENT 34 YELLOW SEA
III: Habitat and community modification
IV: Unsustainable exploitation of fish
Weight
and other living resources
Environmental
Environmental issues
Score
Weight
averaged
concern
score
Weight
Environmental
Environmental issues
Score
Weight %
averaged
Habitat and community
concern
12. Loss of ecosystems
2
40
2.6
score
modification
13. Modification of ecosystems or
Unsustainable
14. Overexploitation
3
45
2.6
ecotones, including community
3
60
exploitation of fish
structure and/or species composition
15. Excessive by-catch and
1
5
discards
16. Destructive fishing practices
2
10
Criteria for Economics impacts
Raw score
Score
Weight %
Very small
Very large
17. Decreased viability of stock
Size of economic or public sectors affected
3
N/a
2
20
0 1 2 3
through pollution and disease
Minimum
Severe
18. Impact on biological and
Degree of impact (cost, output changes etc.)
3
N/a
3
20
0 1 2 3
genetic diversity
Occasion/Short
Continuous
Frequency/Duration
3
N/a
0 1 2 3
Criteria for Economics impacts
Raw score
Score
Weight %
Weight average score for Economic impacts
3
Very small
Very large
Size of economic or public sectors affected
3
N/a
Criteria for Health impacts
Raw score
Score
Weight %
0 1 2 3
Minimum
Severe
Very small
Very large
Degree of impact (cost, output changes etc.)
3
N/a
Number of people affected
1
N/a
0 1 2 3
0 1 2 3
Occasion/Short
Continuous
Minimum
Severe
Frequency/Duration
3
N/a
Degree of severity
1
N/a
0 1 2 3
0 1 2 3
Occasion/Short
Continuous
Weight average score for Economic impacts
3
Frequency/Duration
1
N/a
0 1 2 3
Criteria for Health impacts
Raw score
Score
Weight %
Weight average score for Health impacts
1
Very small
Very large
Criteria for Other social and
Number of people affected
2
N/a
Raw score
Score
Weight %
0 1 2 3
community impacts
Minimum
Severe
Very small
Very large
Degree of severity
2
N/a
Number and/or size of community affected
3
N/a
0 1 2 3
0 1 2 3
Occasion/Short
Continuous
Minimum
Severe
Frequency/Duration
2
N/a
Degree of severity
3
N/a
0 1 2 3
0 1 2 3
Occasion/Short
Continuous
Weight average score for Health impacts
2
Frequency/Duration
3
N/a
0 1 2 3
Criteria for Other social and
Raw score
Score
Weight %
Weight average score for Other social and community impacts
3
community impacts
Very small
Very large
Note: N/a = Not applied.
Number and/or size of community affected
3
N/a
0 1 2 3
Minimum
Severe
Degree of severity
3
N/a
0 1 2 3
Occasion/Short
Continuous
Frequency/Duration
3
N/a
0 1 2 3
Weight average score for Other social and community impacts
3
Note: N/a = Not applied.
ANNEXES
87
V: Global change
Weight
Environmental
Environmental issues
Score
Weight
averaged
concern
score
19. Changes in the hydrological cycle
1
50
Global change
1.0
20. Sea level change
1
50
21. Increased UV-B radiation as a
N/a
N/a
result of ozone depletion
22. Changes in ocean CO2
N/a
N/a
source/sink function
Criteria for Economics impacts
Raw score
Score
Weight %
Very small
Very large
Size of economic or public sectors affected
3
N/a
0 1 2 3
Minimum
Severe
Degree of impact (cost, output changes etc.)
3
N/a
0 1 2 3
Occasion/Short
Continuous
Frequency/Duration
3
N/a
0 1 2 3
Weight average score for Economic impacts
3
Criteria for Health impacts
Raw score
Score
Weight %
Very small
Very large
Number of people affected
1
N/a
0 1 2 3
Minimum
Severe
Degree of severity
1
N/a
0 1 2 3
Occasion/Short
Continuous
Frequency/Duration
1
N/a
0 1 2 3
Weight average score for Health impacts
1
Criteria for Other social and
Raw score
Score
Weight %
community impacts
Very small
Very large
Number and/or size of community affected
2
N/a
0 1 2 3
Minimum
Severe
Degree of severity
2
N/a
0 1 2 3
Occasion/Short
Continuous
Frequency/Duration
2
N/a
0 1 2 3
Weight average score for Other social and community impacts
2
Note: N/a = Not applied.
Comparative environmental and socio-economic impacts of each GIWA concern
Types of impacts
Environmental score
Economic score
Human health score
Social and community score
Concern
Overall score
Rank
Pr
esent (a)
F
uture (b)
Pr
esent (a)
F
uture (b)
Pr
esent (a)
F
uture (b)
Pr
esent (a)
F
uture (b)
Freshwater shortage
3.0
3
1
1
1
1
1
1
1.5
3
Pollution
2.3
1
2
2
1
1
2
1
1.5
4
Habitat and community
2.6
2
3
3
1
2
3
3
2.5
2
modification
Unsustainable exploitation of fish
2.6
3
3
3
2
2
3
3
2.7
1
and other living resources
Global change
1.0
1
3
2
1
1
2
1
1.5
5
88
GIWA REGIONAL ASSESSMENT 34 YELLOW SEA
Annex III
the ocean and sea environment shared by these four countries. The
List of important water-related goal of NOWPAP is to achieve sustainable use, development and
programmes and assessments
management of the coastal and marine environment so as to obtain
the utmost long-term benefi ts for the human populations of the
region, while protecting human health, ecological integrity and the
North Pacifi c Marine Science Organisation (PICES)
region's sustainability for future generations. In order to enhance the
PICES is an intergovernmental scientifi c organisation established in 1992
execution and implementation of the action plan, a core center, the
with Canada, People's Republic of China, Japan, Republic of Korea, the
Northwest Pacifi c Region Environmental Cooperation Center (NPEC),
Russian Federation, and the United States of America as its participating
was established in 1997 for initiating the cooperation among the
members. PICES was established to promote and coordinate marine
countries and regions involved for the environmental protection in
research in the North Pacifi c and adjacent seas at latitudes of 30 degrees
the Sea of Japan and Yellow Sea. The Center became a public service
north. Its activities are to advance scientifi c knowledge about the ocean
corporation under the Japanese Environment Agency in 1998 and was
environment, global weather and climate changes, living resources
also designated to be one of the Regional Activity Centers of Northwest
and their ecosystems, and the impacts of human activities as well as to
Pacifi c Action Plan in 1999. NPEC functions as a Special Monitoring and
promote the collection and rapid exchange of scientifi c information on
Coastal Environmental Assessment Centre for NOWPAP. Website: http:
these issues. Website: http://pices.ios.bc.ca/
//www.npec.or.jp/english/index.htm
UN Economic and Social Commission for Asia and the Pacifi c (ESCAP)
Nautilus Institute for Security and Sustainable Development
Water-related activities in Asia and the Pacifi c Region are carried out
The Nautilus Institute is a policy-oriented research and consulting
under ESCAP's "Water Resources Programme", Environment and Natural
organisation that promotes international cooperation for security and
Resources Development Division. The UN ESCAP organises seminars
ecologically sustainable development. The Institute has programmes
and workshops in tackling various issues including those related
that address both global and regional issues on marine environment,
to: (a) Water resources assessment; (b) Integrated water resources
sustainable development and environmental cooperation, focusing on
development and management; (c) Protection of water resources,
those in the Northeast Asia and Asia-Pacifi c regions. Nautilus produces
water quality and aquatic ecosystems; (d) River basin development
reports, organises seminars, and provides educational and training
and management; (e) Promotion of infrastructure development and
services for policymakers, media, researchers and community groups.
investment for drinking water supply and sanitation; (f) Water pricing
Website: http://www.nautilus.org/
and promotion of private investment in the water sector; (g) Water
demand management, water saving and economic use of water; and
Partnership in Environmental Management for the Seas of East
(h) Mitigation of water-related natural disasters, particularly fl ood loss
Asia (PEMSEA)
reduction. Website: http://www.unescap.org/
PEMSEA is a GEF project with goals of building partnership within and
among governments as well as with the public and private sectors of the
UNEP Regional Offi
ce for Asia and the Pacifi c (ROAP)
East Asian Seas region in the environmental management and in reducing
ROAP reports directly to the Division of Regional Co-operation and
or removing barriers to eff ective environmental management such as
Representation of UNEP's headquarters in Nairobi. It was established
the inadequate or inappropriate policies, disparate institutional and
to adopt global environmental policies to meet the regional priorities
technical capabilities and limited investment in environmental facilities
and needs, putting particular emphasis on building partnerships with
and services. PEMSEA is working based on two management frameworks,
regional and subregional and intergovernmental agencies, other UN
namely, the integrated coastal management (ICM) framework for coastal
agencies, national governments, NGOs, the private sector, academic
area management and the risk assessment/management framework for
and research institutions, civil society and the media. ROAP also acts as
assessing the impacts of human activities on marine ecosystems in sub-
a catalyst, coordinator, facilitator and mobiliser of resources to support
regional sea areas. Six ICM demonstration sites (one each in Vietnam,
these activities. Website: http://www.roap.unep.org/
Cambodia, Indonesia, Thailand, DPR Korea and Malaysia) and two sub-
regional sea environmental management demonstration sites, one each
Northwest Pacifi c Action Plan (NOWPAP)
in the Gulf of Thailand and the Bohai Sea were established to test and
NOWPAP was initiated by UNEP through its regional seas programme
validate the implementation of PEMSEA's environmental management
to assist China, Japan, Russia and Korea to co-operatively manage
frameworks. Website: http://www.pemsea.org/
ANNEXES
89
UNEP Regional Seas Programme
resources and environment of the Large Marine Ecosystems (LMEs)
The UNEP Regional Programme, established in 1974, is a global
worldwide. The project provides scientifi c and technical assistance to
programme for sustainable management of the coastal and marine
developing countries committed to advancing new policies and actions
environment areas on a regional basis. The Programme includes 14
for eliminating causes of trans-boundary environmental and resource-
regional seas (Mediterranean, Red Sea and Gulf of Aden, ROPME Sea
use practices leading to serious degradation of coastal environment,
Area, Wider Caribbean, East Asian Seas, South-East Pacifi c, East Africa,
linked watersheds, and losses in biodiversity and food security from
West and Central Africa, South Pacifi c, Black Sea, North-West Pacifi c,
exploitation in LMEs located around the margins of the Pacifi c, Indian
South Asian Seas, North-East Pacifi c) and fi ve partner seas (Baltic, North-
and Atlantic Oceans. The Yellow Sea has been studied by this project
East Atlantic, Arctic, Antarctic and Caspian) involving 140 coastal states
and designated as one of the global "Large Marine Ecosystems" (LME),
worldwide. Each regional sea and partner sea may have a Regional
the LME #48. Website: http://na.nefsc.noaa.gov/lme/project.htm
Action Plan, which is formulated according to the needs and priorities of
the region as perceived by the concerned governments. Regional Seas
Yellow Sea LME Project
Conventions are in place for several regional sea areas. The Regional
The Yellow Sea LME Project is a GEF project recently approved for
Seas Convention provides the legal framework for the Regional Action
implementation with the involvement of the People's Republic of
Plan. It expresses in clear terms the legal commitment and political
China and the Republic of Korea. The project was developed as a
will of governments to tackle their common environmental problems.
comprehensive response to the key environmental problems facing
Website: http://www.unep.ch/seas/rshome.html
the region with GEF helping to address the priority transboundary
issues. The long-term objective of the project is: "Ecosystem-Based,
Wetland Biodiversity Conservation and Sustainable Use
Environmentally-Sustainable Management and Use of the YSLME
Programme, China
and its Watershed: Reducing Development Stress and Promoting
The Programme and the National Wetland Conservation Action Plan
Sustainable Development of the Ecosystem from a Densely Populated,
provide the foundation for the conservation and better management
Heavily Urbanised, and Industrialised Semi-Enclosed Shelf Sea". In
of the wetland resources in China. The Programme aims to reduce
order to achieve its objective this project will prepare a Transboundary
the barriers that deter eff ective conservation of wetland biodiversity
Diagnostic Analysis (TDA), National Yellow Sea Action Plans (NYSAPs),
in China; these barriers include: i) a lack of integration of wetland
and a regional Strategic Action Programme (SAP). This project will also
management and biodiversity conservation into development
initiate and facilitate the implementation of the SAP. The SAP will consist
planning; ii) no institutional mechanisms for multi-sectoral wetland
of a series of legal, policy and institutional changes and investments
management; iii) limited awareness of wetland values and functions at
to address the priority transboundary issues identifi ed in the TDA/SAP
all levels; iv) lack of examples of sustainable development of wetland
formulation process. Website: http://www.gefweb.org
resources and involvement of local communities; and v) lack of technical
capacity at national and local levels to manage and conserve wetlands
Green Vision 21 of Republic of Korea (1995 - 2005)
and their biodiversity. The proposed project will remove these barriers
Green Vision 21 presents the policy approach to provide advanced
at four demonstration project sites (Sanjiang Plain, Ruoergai Marshes,
environmental administrative services and make the environment of
Yancheng Coast and Dongting Lakes) with high global biodiversity
the land and waters in the Republic of Korea ecologically sound for
importance. Each demonstration site represents a diff erent ecosystem.
future generations. The vision includes the idea of "Environmentally
A national coordination unit works to ensure that lessons learned
Sound and Sustainable Development (ESSD)", environmentally friendly
from this project will be appropriately transferred to other wetlands
consumption and business management.
throughout the country. Website: http://edcnts2.cr.usgs.gov/gef/
Website: http://www.me.go.kr:8080/me/environment/html/polices/
gef.asp?fi pscode=623
president.htm#seoul
Large Marine Ecosystem Project
Blue Sea Action Plan for Bohai Sea
The Large Marine Ecosystem Project is a global eff ort initiated
The action plan was ratifi ed by the State Council in 1999, when the
by the World Conservation Union (IUCN), the Intergovernmental
comprehensive treatment project of Bohai Sea was kicked off . The
Oceanographic Commission of UNESCO (IOC), other United Nations
project covers three provinces and one municipality surrounding Bohai
agencies, and the US National Oceanic and Atmospheric Administration
Sea (Hebei, Liaonin and Shandong Provinces and Tianjin Municipality)
(NOAA). The project aims to improve the long-term sustainability of
and participated by the provinces and municipalities in the economic
90
GIWA REGIONAL ASSESSMENT 34 YELLOW SEA
zone surrounding Bohai Sea. The overall targets of the project are the
natural resource exploration of Bohai Sea, sustainable development of
ecological environment and sustainable, healthy development of the
social economy in the economic zone surrounding the Bohai Sea. The
main focuses are pollution control, environmental treatment, restoration
of natural resource environment, ecological environmental remedy and
disaster prevention and control. The key actions are estuary wetland
protection and ecological remedy, pollution prevention in the bay,
healthy aquatic farming, habitat remedy in the tidal areas and warning
and prevention of red tides, oil spillage and marine ice. Website: http:
//www.zhb.gov.cn/english/SOE/soechina1999/sea/seadown.htm
Other water-related programmes
Other completed or on-going water-related programmes in the region
include:
Stock Monitoring in the Yellow Sea (1998-2000);
Yellow Sea and East China Sea GLOBEC (1999-2004);
Sino-Norway Joint "Bei Dou" Project (1998-2004);
Water Circulation of China Seas and its Impacts on Environmental
Resources (1999-2004);
Marine Biodiversity Action Plan (1999-2004);
Harmful Algal Bloom Monitoring Study (1999-2004);
Blue Sky and Clean Sea Action Plan (1999-2004);
Survey on the Marine Living Resources in the Yellow Sea
(ongoing);
Survey on the Oceanographic Conditions in the Yellow Sea
(ongoing);
Community Structure of the Fisheries Resources in the Yellow Sea
(ongoing); and
Changes in Oceanographic Conditions and Ecosystems in the
Kunsan Waters (ongoing).
Bohai
Sea
GLOBEC
(1997-2000);
Fishery Biodiversity and its Conservation in the Bohai Sea (1997-
2000);
ANNEXES
91
Annex IV
Continental Shelf generally limited to 200 nm. The statement declares
List of conventions and specific
that "in accordance with the provisions of the Convention, the People's
laws that affect water use
Republic of China proclaims that it has sovereignty and jurisdiction over
its exclusive economic zone and continental shelf of 200 nautical miles".
Additionally, the Decision states that the People's Republic of China shall
People's Republic of China
delimit a demarcation line between China's maritime jurisdiction and
Laws, regulations and rules
the maritime jurisdictions of China's neighbouring or facing countries,
Administration Law on the Use of Ocean Space of the People's Republic of
and shall have sovereignty over all archipelagos and islands listed in
China, eff ective as of January 1, 2002
article 2 of China's Law on the Territorial Sea and the Contiguous Zone
This Law seeks to use a property rights and quasi-exclusive ownership
of 25 February 1992. This text is signifi cant given the contested status
approach to manage the principal ocean uses and ocean resources
of some of the islands off the coast of China.
present in the Chinese territorial sea. The Law sets out a framework
for classifying uses of ocean space and granting licenses to use ocean
People's Republic of China Exclusive Economic Zone and Continental Shelf
space according to the functions classifi ed. Persons who wish to use
Law of 26 June 1998
ocean space may apply for a license to use such space and may have
This Law contains 16 articles and demonstrates the further
their rights of use registered in a central registry. It seeks to promote
implementation of UNCLOS norms by China. It defi nes the EEZ and
the rational development and sustainable utilisation of ocean space by
the continental shelf of PRC China and specifi es the jurisdictional
bringing the majority of ocean uses under one umbrella and employing
powers that China will exercise in these maritime areas. Article 5 states
an integrated approach to management. This is a new law with the
that foreign fi shing in the EEZ requires the approval of responsible
objective of strengthening and preserving:
authorities. The responsible authorities also have the right to conserve
Administration of the use of ocean space in China;
and manage straddling fi sh stocks, highly migratory fi sh stocks and
Ownership of the country's ocean space;
marine mammals in the EEZ. China also asserts rights over anadromous
Lawful benefi ts of the users of ocean space.
fi sh originating in rivers in China and catadromous species that spend
the greater part of their life cycle in the waters of China: Article 6. Article
Law of the People's Republic of China on the Territorial Sea and the
10 specifi es the powers of the responsible authorities with respect to
Contiguous zone, eff ective as of 25 February 1992
prevention and control of marine pollution.
This law fi xes the breadth of the territorial sea of the People's Republic of
China at 12 nautical miles as measured from the baseline of the territorial
Fisheries Law of the People's Republic of China
sea (Art. 3). It also establishes a contiguous zone adjacent to and beyond
This Law came into eff ect on 1 July 1986 and was extensively amended
the territorial sea (Art. 4). Article 2 of the law lists all the archipelagos
in October 2000 (see below). It seeks to:
and islands over which the People's Republic of China exercises its
Enhance the protection, proliferation, exploitation and rational
sovereignty. Article 6 grants innocent passage to foreign civilian
utilisation of fi shery resources,;
vessels. However, foreign military ships must seek permission from
Develop artifi cial cultivation;
the Government of China before entering the territorial sea. All foreign
Ensure the lawful rights and interests of fi shery workers; and
ships passing through the territorial sea must comply with laws and
Boost fi shery production to meet the needs of the country and the
regulations in force at the time. All international organisations, foreign
people.
organisations or individuals must also obtain approval from the Chinese
government before carrying out scientifi c research or other activities in
Decision amending the Fisheries Law of the People's Republic of China of
the territorial sea. Further provisions set out the enforcement powers of
December 2000
the Chinese authorities under this Law.
This Decision consists of 25 amendments to the Fisheries Law of the
People's Republic of China. A key amendment is in Article 9 which limits
Decision of the Standing Committee of the National People's Congress on
the commercial role of the State as follows: "'the Department of Fishery
approval of the United Nations Convention on the Law of the Sea. Date of
Administration or superintendence department or any members of the
text: 15 May 1996
Department of Fishery Administration or superintendence shall not
The Decision signifi es the full adoption of UNCLOS treaty norms by
be engaged in any fi shery production or marketing activities". Other
China, including particularly the concept of the 200 nm EEZ and a
amendments seek to modernise the rules relating to fi shing methods,
92
GIWA REGIONAL ASSESSMENT 34 YELLOW SEA
fi shing licenses, fi shing areas, and vessels. More extensive off ences and
resources in the present and the long term. Off shore oil and gas licenses
penalties refl ecting concepts of responsible fi shing are also provided for.
are granted under this Law and more detailed and specifi c production
contracts are authorised. Environmental control issues are addressed
Regulations on fi shing licence management, 1989
under the Marine Environment Protection Law. It remains to be seen
These Regulations aim to protect and rationally utilise fi shery resources,
how the new law on Use of Sea Areas will be integrated with this Law.
regulate fi shing intensity, maintain production order and safeguard the
legitimate rights and interests of fi shing operators whilst promoting
The Environmental Protection Law of the People's Republic of China of 26th
fi shery development. Three types of licences are provided for: fi shing
December 1989
licences (including licences for fi shing in coastal waters, high seas and
The Environmental Protection Law of the People's Republic of
inland waters); special fi shing licences and; temporary fi shing licences.
China came into eff ect on 26 December 1989. This Law is a general
Licensing authorities, procedures and conditions attached to each type
environmental protection statute but has implications for marine
of licence are defi ned. It still remains to be fully worked out how the
environmental protection in that it was formulated to protect and
licensing system under these Regulations relates to the Law on Use of
improve the environment, prevent and control pollution, safeguard
Ocean Space.
human health and facilitate development and modernisation. The
objectives of this Law are to protect and improve the environment,
Regulations of the People's Republic of China for the implementation of wild
to prevent and remedy pollution, to safeguard human health, and
aquatic animal protection of October 1993
to promote modern development. The Law provides for: (i) the
These Regulations aim at the management and conservation of wild
integration of environmental protection into development planning;
aquatic animal resources. The responsible Departments of Fishery
(ii) the promotion of environmental education; (iii) the obligation of
Administration at the central and local level are required to carry out
individuals and units to protect the environment; (iv) the responsibilities
surveys of wild aquatic animals on a regular basis, to support preparation
of government bodies, at the central, provincial, regional and municipal
and revision of lists of wild aquatic animals that require special protection
levels, in respect of supervision and administration of environmental
by the State or local authorities. The catching or killing of all wild aquatic
protection activities.
animals under special protection is prohibited by this Law. The Law states
that the catching of wild aquatic animals may only be allowed under
The Marine Environment Protection Law of the People's Republic of China
license and for the following purposes: scientifi c research or production
1983 (revised December 25, 1999; revision eff ective from 1st April 2000)
of medicines; education or exhibitions; domestication or breeding of
The Marine Environment Protection Law of the People's Republic of
wild aquatic animals; other special reasons. Other provisions cover inter
China fi rst came into eff ect in 1983. This Law applies to all zones under
alia: (a) applications for special licences for catching wild aquatic animals;
Chinese jurisdiction: internal waters, the territorial sea, the exclusive
(b) obligations of licence holders; (c) the sale, purchase or utilisation of
economic zone and the continental shelf and any other sea areas under
wild aquatic animals under special State protection; (e) a supervision and
the jurisdiction of China. The Law also extends to any areas beyond
inspection system; (f) the transport or carrying of wild aquatic animal or
the jurisdiction of China where activities cause pollution in areas
products thereof to be eff ected out of the county; (g) the export of wild
within China's jurisdiction. The law establishes a coordinated system
aquatic animals under special protection; (h) awards and penalties.
of pollution management between the various government ministries
charged with controlling pollution. Its overall purpose is to protect and
Law of the People's Republic of China on the Protection of Wildlife 1988
improve the marine environment, conserve marine resources, prevent
The purpose of this Law is to lay down the general principles of wildlife
pollution damage, maintain the ecological balance, safeguard human
protection and administration of wildlife in the PRC, and to provide for
health and promote sustainable economic and social development. The
the protection of species of wildlife that are rare or near extinction; the
Law also formally establishes an EIA system.
protection, development and rational use of wildlife resources and the
maintaining of ecological balances. The basic principle is that wildlife
Regulations of the People's Republic of China on the prevention of vessel-
resources are owned by the State (art. 3).
induced sea pollution of 1983
These Regulations implement provisions of the Marine Environmental
Mineral Resources Law of the People's Republic of China
Protection Law. The text consists of 56 articles divided into 12 Chapters:
This Law covers the development of the mining industry and promotes
General provisions (I); General stipulations (II); Documents and
the exploration, development, utilisation and protection of mineral
equipment (III); Oil operations and discharge of oil-polluted water by
ANNEXES
93
vessels (IV); Dangerous goods carried by vessels (V); Other polluted water
facilities is entrusted to the environmental protection department in the
from vessels (VI); Garbage from vessels (VII); Use of vessels to dump waste
place where the organisation or individual concerned is located.
(VIII); Surface and submerged projects of ship repair, ship building, ship
salvage and ship scrapping (IX); Compensation for harm from pollution
Seawater Quality Standard of the People's Republic of China entry into
accidents caused by vessels (X); Supplementary provisions (XII). These
force on July 01, 1998
Regulations are applicable to all Chinese and foreign vessels, ship
This Standard classifi es seawater quality into four grades, and gives
owners and other individuals within the sea areas and harbours under
quality standards for each grade of seawater. It implements the
the jurisdiction of the PRC (art. 2). The State fi shing administrations and
relevant provisions of the Environment Protection Law and the Marine
organs of supervision and control of fi shing harbours shall exercise the
Environment Protection Law. It provides guidance on standards to
functions and powers of the organs in charge as stipulated in these
be used to prevent and control seawater pollution, protect marine
Regulations in fi shing harbour water areas (art. 54).
biological resources and other marine resources, and preserve the
marine ecosystem generally.
Regulations of the People's Republic of China on control over dumping of
Law of the People's Republic of China on Prevention and Control of
wastes in seawater of 06 March 1985
Water Pollution of 1984
The term "dumping" as used in these Regulations refers to discharging
This Law aims at the prevention and control of pollution of rivers, lakes,
wastes and other substances into the ocean by means of vessels, aircraft,
canals, irrigation channels, reservoirs and other surface water bodies
platforms, and other manmade structures used on the sea. In addition
and groundwater. As such it is crucial to control of pollution in the
it also refers to the discharge of wastes and other substances caused
marine zone. It has seven Chapters as follows:
by submarine exploration and exploitation of mineral resources and
Chapter I - General Provisions;
related maritime processing (art. 2). These Regulations apply to: (a)
Chapter II - Establishment of Water Environment Quality Standards
dumping of wastes into the sea areas under jurisdiction of the PRC; (b)
and Pollutant Discharge Standards;
loading of wastes on land or in harbours of the PRC for the purpose
Chapter III - Supervision and Management of the Prevention and
of dumping; (c) transport and burning of wastes in sea areas under
Control of Water Pollution;
jurisdiction of the PRC (art. 3). The areas of dumping shall be designated
Chapter IV - Prevention of Surface Water Pollution;
by the National Oceanographic Bureau (art. 5). Units that wish to dump
Chapter V - Prevention of Groundwater Pollution;
waste into the ocean shall apply for permission with the Bureau or one
Chapter VI - Legal Liability;
of its agencies (art. 6). Bringing waste from foreign countries into the
Chapter VII - Supplementary provisions.
sea areas under the jurisdiction of the PRC shall be prohibited (art. 7).
Waste matters fall into three categories in view of their toxicity, content
Rules for implementation of the Law of the People's Republic of China on the
of harmful elements and impact upon the marine environment (art. 11).
prevention and control of water pollution (2000)
Dumping of wastes listed in Annex I is prohibited; dumping of wastes as
These Rules implement article 61 of the Law on the Prevention and
listed in Annex II shall require a special permit; wastes other than listed
Control of Water Pollution. Article 2 establishes the content of unifi ed
in Annex I or II require an ordinary permit. The remaining provisions deal
plans based on river basins or regions, in line with Article 10 of the
with procedures of dumping, monitoring and testing in dumping areas,
Law. Further provisions concern the supervision and management of
and off ences and penalties. (24 articles and 2 Annexes)
the prevention and control of water pollution (a) when projecting the
minimum discharge of a dam on large or medium-sized reservoirs; (b)
Regulations of the People's Republic of China on the prevention of pollution
with regard to the planning and adjustment of various water body
damage to the marine environment by land-sourced pollutants: 22 June 1990
reserves; (c) with regard to construction projects using imported
These Regulations further implement the Marine Environment Protection
technologies or equipment and discharging pollutants into water
Law. They focus on strengthening the supervision and administration
bodies; (d) in the case of discharge of pollutants in excess of the national
of land pollution sources and preventing pollution damage to the
or local pollutant discharge standards.
marine environment by land-sourced pollutants. They require that the
discharge of land-sourced pollutants into the sea by any organisation or
Decision of the State Council on several issues concerning environmental
individual be conducted in compliance with the standards for discharge
protection of 3 August 1996
of pollutants and the relevant regulations promulgated by the State or
The Decision aims at strengthening the prevention and control of water
the relevant locality. The control of pollutants discharging and treating
pollution in rivers, lakes, reservoirs and coastal waters. It deals with those
94
GIWA REGIONAL ASSESSMENT 34 YELLOW SEA
situations where attempts to control discharged water pollutants within
Chapter IV - Supervision and administration;
prescribed standards still fail to meet national prescribed standards for
Chapter V - Legal Responsibility, off ences and penalties.
water environment quality. It establishes a system of control over
Chapter VI - Supplementary Provisions.
maximum quantities major pollutants that can be discharged into
water as well as a verifi cation procedure.
Maritime Code of the People's Republic of China of 7 November 1992
This Code governs commercial transactions to do with shipping and
Law of the People's Republic of China on Water and Soil Conservation Date
navigation. It aims to regulate relations arising from maritime transport
of 29 June 1991
and those pertaining to ships, to secure and protect the legitimate
This Law supports the decrease of land-based pollution of the marine
rights and interests of the parties concerned, and to promote the
zone. It addresses a broad spectrum of concerns such as the prevention
development of maritime transport, economy and trade (art. 1).
and control of soil erosion, the protection and rational utilisation of water
and soil resources, the mitigation of disasters from fl oods, drought and
Rules of the People's Republic of China governing vessels of foreign
sandstorms, the improvement of the ecological environment and the
nationality 18 September 1979
development of production. This statute has six chapters as follows:
These Rules are formulated in order to safeguard ports and coastal
Chapter I - General Provisions;
waters, ensure the safety of navigation and prevent the pollution of
Chapter II - Prevention of erosion and other forms of damage;
waters.
Chapter III - Rehabilitation;
Conventions and treaties
Name of Convention/Treaty
Conclusion
Entry into Force
Ratification
Accession
Convention on the Liability of Operators of Nuclear Ships
25/05/1962
25/05/1962
Convention concerning the Protection of the World Cultural and Natural Heritage
16/11/1972
12/03/1986
12/12/1985
International Convention for the Safety of Life at Sea ( SOLAS )
01/11/1974
25/05/1980
20/06/1975
07/01/1980
United Nations Convention on the Law of the Sea
10/12/1982
07/07/1996
10/12/1982
07/06/1996
Protocol to amend the International Convention on Civil Liability for Oil Pollution Damage
25/05/1984
25/05/1984
Protocol relating to the International Convention for the Safety of Life at Sea (SOLAS PROT 1988)
11/11/1988
03/02/2000
11/11/1988
Convention on the Control of Transboundary Movements of Hazardous Wastes and their Disposal
22/03/1989
05/05/1992
22/03/1990
17/12/1991
Convention for establishing a marine scientific organisation for the North Pacific Region ( PICES )
12/12/1990
30/10/1992
22/10/1991
31/08/1992
Protocol to the Antarctic Treaty on Environmental Protection
04/10/1991
14/01/1998
04/10/1991
02/08/1994
Convention on Biological Diversity
05/06/1992
29/12/1993
11/06/1992
05/01/1993
Agreement relating to the Implementation of Part XI of the United Nations Convention on the Law of the Sea of 10 December 1982
28/07/1994
07/07/1996
29/07/1994
07/06/1996
Agreement for the Implementation of the Provisions of the United Nations Convention on the Law of the Sea relating to the Conservation and
04/08/1995
06/11/1996
Management of Straddling Fish Stocks and Highly Migratory Fish Stocks
Amendment to the Basel Convention on the Control of Transboundary Movements of Hazardous Wastes and their Disposal
22/09/1995
01/05/2001
Comprehensive Nuclear Test - Ban Treaty
10/09/1996
24/09/1996
Protocol to the Convention on the Prevention of Marine Pollution by Dumping of Wastes and Other Matter, 1972
07/11/1996
23/03/1998
Kyoto Protocol to the United Nations Framework Convention on Climate Change
11/12/1997
29/05/1998
Rotterdam Convention on the Prior Informed Consent Procedure for Certain Hazardous Chemicals and Pesticides in International Trade 10/09/1998
24/08/1999
Cartagena Protocol on Biosafety to the Convention on Biological Diversity
29/01/2000
08/08/2000
Stockholm Convention on Persistent Organic Pollutants
22/05/2001
23/05/2001
ANNEXES
95
Republik of Korea
Laws, regulations and rules
Law, Regulations and Rules
Date of enactment
Water Supply Act
1961.12.31
Sewerage System Act
1966. 8. 3
Act Relating to Protection of Birds, Mammals and Hunting(`67. 3.30)
1983.12.30
Waste Clean Act (`61.12.30) Waste Management Act ('86.12.31)
1991. 3. 8
Act relating to toxic and Hazardous Substance(`63.12.13) - Toxic Chemical Control Act
1996. 8. 1
Natural Park Act
1980. 1. 4
Compound Waste Treatment Corporation Act
1979.12.28
Korea Resource Recovery and Reutilisation Corporation Act
1993.12.27
Environmental Pollution Prevention Corporation Act
1983. 5.21
Environmental Management Corporation Act
1993.12.27
Social Pollution Prevention Act
1963.11.5
Environment Preservation Act
1977.12.31
Basic Environmental Policy Act
1990.8.1
Air Quality Preservation Act
1990.8.1
Water Quality Preservation Act
1990.8.1
Act Relating to Water Resources in Han River and Community Support
1999.2.8
Special Act on Nakdong River's Watershed Management
2002. 1.14
Special Act on Geum River's Watershed Management
2002. 1.14
Special Act on Yeongsan and Seomjin River's Watershed Management
2002. 1.14
Indoor Air Qualities Management Act
1996.12.30
Noise and Vibration Control Act
1990. 8. 1
Environmental Dispute and Settlement Act
1990. 8. 1
Acts Relating to Punishment for Environmental Crime
1991. 5.31
Natural Environment Preservation Act
1991.12.31
Act Relating to the Special Accounting for Environmental Improvement
1994. 1. 5
Act Relating to Environmental Technology Support and Development
1994.12.22
Special Act on the Ecosystem Preservation of Islands such as Dokdo Island
1995. 1. 5
Wetland Preservation Act
1997.12.13
Environmental Impact Assessment Act on Environment, Transportation and Natural Disaster
1999. 2. 8
Soil Environment Preservation Act
1991.12.31
Act Relating to the Treatment of Sewage, Night Soil and Livestock Wastewater
1999.12.31
Act Relating to Promotion of Resources Saving and Reutilisation
1995. 1. 5
Act Relating to Transboundary Movement of Waste and Their Disposal
1991. 3. 8
Act Promotion of Waste Treatment Facilities and Local Community
1992.12. 8
Act Relating to the Establishment and Operation of Sudokwon Landfill Site Management Corporation
1992.12. 8
Conventions and treaties
Conventions and Treaties
Date of Signature
Date of ratification/ accession(a)
Date of entry into force
International Convention for the Prevention of Pollution of the Sea by Oil, 1954(as amended in 1962 and in 1969)
-
31 07 78(a)
31 10 78
International Convention for the Prevention of Pollution from Ships, 1973 as modified by the Protocol of 1978 relating thereto
-
23 07 84(a)
23 10 84
International Regulations for Preventing Collisions at Sea,1960
-
-
-
1972 Amendments to the 1960 International Regulations for Preventing Collisions at Sea
-
29 07 77(a)
29 07 77
International Convention for the Safety of Life at Sea, London, 1974
-
31 12 80(a)
31 03 81
International Convention on Civil Liability for Oil Pollution Damage, 1969, Brussels
-
18 12 78(a)
18 03 79
International Convention on the Establishment of an International Fund for Compensation of Oil Pollution Damage, 1971, Brussels
-
08 12 92(a)
08 03 93
Convention on the Prevention of Marine Pollution by Dumping Wastes and Other Matters, 1972, London
-
21 12 93(a)
20 01 94
Convention on International Trade in Endangered Species of Wild Flora and Fauna, 1973, Washington
-
07 09 93(a)
07 10 93
United Nations Convention on the Law of the Sea, 1982, Montego Bay
14 03 83
29 01 96
28 02 96
United Nations Framework Convention on Climate Change, 1992, New York
13 06 92
14 12 93
21 03 94
Convention on Biological Diversity, 1992, Rio de Janeiro
-
03 10 94(a)
01 01 95
96
GIWA REGIONAL ASSESSMENT 34 YELLOW SEA
Annex V
WHO Guidelines for drinking-
water quality or standards
Drinking-water quality
Organic compunds
Normally found in fresh water/
Health
Element/substance
Health guideline
Group
Substance
surface water/ground water
guideline
Aluminium
Al
0.2 mg/l
Carbon tetrachloride
C Cl
2 g/l
4
< 0.2 mg/l (up to 0.3 mg/l in anaerobic
Dichloromethane
C H Cl
20 g/l
Ammonia
NH
No guideline
2
2
4
waters)
Chlorinated
1,1-Dichloroethane
C H Cl
No guideline
alkanes
2 4
2
Antimony
Sb
< 4 g/l
0.005 mg/l
1,2-Dichloroethane
Cl CH CH Cl
30 g/l
2
2
Arsenic
As
0.01 mg/l
1,1,1-Trichloroethane
CH C Cl
2000 g/l
3
3
Asbestos
No guideline
1,1-Dichloroethene
C H Cl
30 g/l
2 2
2
Barium
Ba
0.3 mg/l
Chlorinated
1,2-Dichloroethene
C H Cl
50 g/l
2 2
2
Beryllium
Be
< 1 g/l
No guideline
ethenes
Trichloroethene
C H Cl
70 g/l
2
3
Boron
B
< 1 mg/l
0.3 mg/l
Tetrachloroethene
C Cl
40 g/l
2
4
Cadmium
Cd
< 1 g/l
0.003 mg/l
Benzene
C H
10 g/l
6 6
Chloride
Cl
250 mg/l
Toluene
C H
700 g/l
7 8
Chromium
Cr+3. Cr+6
< 2 g/l
0.05 mg/l
Xylenes
C H
500 g/l
8 10
Colour
Not mentioned
Aromatic
hydrocarbons
Ethylbenzene
C H
300 g/l
8 10
Copper
Cu
2 mg/l
Styrene
C H
20 g/l
8 8
Cyanide
CN-
0.07 mg/l
C H N
Polynuclear Aromatic Hydrocarbons (PAHs)
2
3
1
0.7 g/l
Dissolved oxygen
O
No guideline
O P
2
5
1 3
Fluoride
F
< 1.5 mg/l (up to 10)
1.5 mg/l
Monochlorobenzene (MCB)
C H Cl
300 g/l
6 5
mg/l
1,2-Dichlorobenzene (1,2-DCB)
C H Cl
1000 g/l
Hardness
No guideline
6 4
2
CaCO
Chlorinated
Dichlorobenzenes
3
1,3-Dichlorobenzene (1,3-DCB)
C H Cl
No guideline
benzenes
(DCBs)
6 4
2
Hydrogen sulphide
H2S
No guideline
1,4-Dichlorobenzene (1,4-DCB)
C H Cl
300 g/l
6 4
2
Iron
Fe
0.5 - 50 mg/l
No guideline
Trichlorobenzenes (TCBs)
C H Cl
20 g/l
6 3
3
Lead
Pb
0.01 mg/l
Di(2-ethylhexyl)adipate (DEHA)
C H O
80 g/l
22 42 4
Manganese
Mn
0.5 mg/l
Di(2-ethylhexyl)phthalate (DEHP)
C H O
8 g/l
24 38 4
Mercury
Hg
< 0.5 g/l
0.001 mg/l
Acrylamide
C H N O
0.5 g/l
3 5
Molybdenum
Mb
< 0.01 mg/l
0.07 mg/l
Miscellaneous
Epichlorohydrin (ECH)
C H Cl O
0.4 g/l
3 5
Nickel
Ni
< 0.02 mg/l
0.02 mg/l
organic
Hexachlorobutadiene (HCBD)
C Cl
0.6 g/l
4
6
Nitrate and nitrite
NO . NO
50 mg/l total nitrogen
constituents
3
2
Ethylenediaminetetraacetic acid (EDTA)
C H N O
200 g/l
10 12 2 8
Turbidity
Not mentioned
Nitrilotriacetic acid (NTA)
N(CH COOH)
200 g/l
2
3
pH
No guideline
Dialkyltins
R Sn X
No guideline
2
2
Selenium
Se
< 0.01 mg/l
0.01 mg/l
Organotins
Tributil oxide (TBTO)
C H O Sn
2 g/l
24 54
2
Silver
Ag
5 50 g/l
No guideline
Sodium
Na
< 20 mg/l
200 mg/l
Sulphate
SO
500 mg/l
4
Inorganic tin
Sn
No guideline
TDS
No guideline
Uranium
U
1.4 mg/l
Zinc
Zn
3 mg/l
(Note: Are set up in Geneva, 1993 and are the international reference point for standard setting
and drinking-water safety)
ANNEXES
97
Pesticides
Disinfectants and disinfectant by-products
Health
Health
Substance
Group
Substance
guideline
guideline
Alachlor
C H Cl N O
20 g/l
Chloramines
NH Cl(3-n)
3 mg/l
14 20
2
n
Aldicarb
C H N O S
10 g/l
Chlorine
Cl
5 mg/l
7 14 2 4
Disinfectants
2
Aldrin and dieldrin
C H Cl /C H Cl O
0.03 g/l
Chlorine dioxide
ClO
No guideline
12 8
6
12 8
6
2
Atrazine
C H Cl N
2 g/l
Iodine
I
No guideline
8 14
5
2
Bentazone
C H N O S 30
g/l
Bromate
Br O -
25 g/l
10 12 2 3
3
-
Carbofuran
C H N O
5 g/l
Chlorate
Cl O
No guideline
12 15
3
3
-
Chlordane
C H Cl
0.2 g/l
Chlorite
Cl O
200 g/l
2
10 6
8
Chlorotoluron
C H Cl N O
30 g/l
2-Chlorophenol (2-CP)
C H Cl O
No guideline
6
5
10 13
2
DDT
C H Cl
2 g/l
Chlorophenols
2,4-Dichlorophenol (2,4-DCP)
C H Cl O
No guideline
6
4
2
14 9
5
2,4,6-Trichlorophenol (2,4,6-TCP)
C H Cl O
200 g/l
1,2-Dibromo-3-chloropropane
C H Br Cl
1 g/l
6
3
3
3 5
2
Formaldehyde
HCHO
900 g/l
2,4-Dichlorophenoxyacetic acid (2,4-D)
C H Cl O
30 g/l
8
6
2
3
MX (3-Chloro-4-dichloromethyl-5-hydroxy-2(5H)-
1,2-Dichloropropane
C H Cl
No guideline
C H Cl O
No guideline
3
6
2
furanone)
5
3
3
3
1,3-Dichloropropane
C H Cl
20 g/l
3
6
2
Bromoform
C H Br
100 g/l
3
1,3-Dichloropropene
CH CHClCH Cl
No guideline
3
2
Dibromochloromethane
CH Br Cl
100 g/l
2
Ethylene dibromide (EDB)
Br CH CH Br
No guideline
Trihalomethanes
2
2
Disinfectant
Bromodichloromethane
CH Br Cl
60 g/l
2
Heptachlor and heptachlor epoxide
C H Cl
0.03 g/l
10 5
7
by-products
Chloroform
CH Cl
200 g/l
3
Hexachlorobenzene (HCB)
C H Cl O
1 g/l
10 5
7
Monochloroacetic acid
C H Cl O
No guideline
2
3
2
Isoproturon
C H N O
9 g/l
Chlorinated acetic
12
18 2
Dichloroacetic acid
C H Cl O
50 g/l
acids
2
2
2
2
Lindane
C H Cl
2 g/l
Trichloroacetic acid
C H Cl O
100 g/l
6
6
6
2
3
2
MCPA
C H Cl O
2 g/l
Chloral hydrate (trichloroacetaldehyde)
C Cl CH(OH)
10 g/l
9 9
3
3
2
Methoxychlor
(C H OCH ) CHCCl
20 g/l
Chloroacetones
C H O Cl
No guideline
6 4
3 2
3
3
5
Metolachlor
C H Cl N O
10 g/l
Dichloroacetonitrile
C H Cl N
90 g/l
15
22
2
2
2
Molinate
C H N O S
6 g/l
Halogenated
Dibromoacetonitrile
C H Br N
100 g/l
9 17
2
2
Pendimethalin
C H O N
20 g/l
acetonitriles
Bromochloroacetonitrile
CH Cl CN
No guideline
13
19
4
3
2
Pentachlorophenol (PCP)
C H Cl O
9 g/l
Trichloroacetonitrile
C Cl N
1 g/l
6
5
2
3
Permethrin
C H Cl O
20 g/l
Cyanogen chloride
Cl CN
70 g/l
21
20
2
3
Propanil
C H Cl N O
20 g/l
Chloropicrin
C Cl NO
No guideline
3
2
9
9
2
Pyridate
C H ClN O S
100 g/l
19 23
2 2
Simazine
C H Cl N
2 g/l
7
12
5
Trifluralin
C H F N O
20 g/l
13
16 3
3
4
2,4-DB
C H Cl O
90 g/l
10 10
2 3
Dichlorprop
C H Cl 0
100 g/l
9
8
2
3
Chlorophenoxy
Fenoprop
C H Cl O
9 g/l
herbicides (excluding
9 7
3 3
2,4-D and MCPA)
MCPB
C H Cl O
No guideline
11
13
3
Mecoprop
C H ClO
10 g/l
10 11
3
2,4,5-T
C H Cl O
9 g/l
8
5
3
3
98
GIWA REGIONAL ASSESSMENT 34 YELLOW SEA
The Global International
Waters Assessment
This report presents the results of the Global International Waters
Adequately managing the world's aquatic resources for the benefi t of
Assessment (GIWA) of the transboundary waters of the Yellow
all is, for a variety of reasons, a very complex task. The liquid state of
Sea region. This and the subsequent chapter off er a background
the most of the world's water means that, without the construction
that describes the impetus behind the establishment of GIWA, its
of reservoirs, dams and canals it is free to fl ow wherever the laws of
objectives and how the GIWA was implemented.
nature dictate. Water is, therefore, a vector transporting not only a
wide variety of valuable resources but also problems from one area
to another. The effl
uents emanating from environmentally destructive
activities in upstream drainage areas are propagated downstream
The need for a global
and can aff ect other areas considerable distances away. In the case of
international waters
transboundary river basins, such as the Nile, Amazon and Niger, the
assessment
impacts are transported across national borders and can be observed
in the numerous countries situated within their catchments. In the case
of large oceanic currents, the impacts can even be propagated between
Globally, people are becoming increasingly aware of the degradation of
continents (AMAP 1998). Therefore, the inextricable linkages within
the world's water bodies. Disasters from fl oods and droughts, frequently
and between both freshwater and marine environments dictates that
reported in the media, are considered to be linked with ongoing global
management of aquatic resources ought to be implemented through
climate change (IPCC 2001), accidents involving large ships pollute public
a drainage basin approach.
beaches and threaten marine life and almost every commercial fi sh stock
is exploited beyond sustainable limits - it is estimated that the global
In addition, there is growing appreciation of the incongruence
stocks of large predatory fi sh have declined to less that 10% of pre-
between the transboundary nature of many aquatic resources and the
industrial fi shing levels (Myers & Worm 2003). Further, more than 1 billion
traditional introspective nationally focused approaches to managing
people worldwide lack access to safe drinking water and 2 billion people
those resources. Water, unlike laws and management plans, does not
lack proper sanitation which causes approximately 4 billion cases of
respect national borders and, as a consequence, if future management
diarrhoea each year and results in the death of 2.2 million people, mostly
of water and aquatic resources is to be successful, then a shift in focus
children younger than fi ve (WHO-UNICEF 2002). Moreover, freshwater
towards international cooperation and intergovernmental agreements
and marine habitats are destroyed by infrastructure developments,
is required (UN 1972). Furthermore, the complexity of managing the
dams, roads, ports and human settlements (Brinson & Malvárez 2002,
world's water resources is exacerbated by the dependence of a great
Kennish 2002). As a consequence, there is growing public concern
variety of domestic and industrial activities on those resources. As a
regarding the declining quality and quantity of the world's aquatic
consequence, cross-sectoral multidisciplinary approaches that integrate
resources because of human activities, which has resulted in mounting
environmental, socio-economic and development aspects into
pressure on governments and decision makers to institute new and
management must be adopted. Unfortunately however, the scientifi c
innovative policies to manage those resources in a sustainable way
information or capacity within each discipline is often not available or
ensuring their availability for future generations.
is inadequately translated for use by managers, decision makers and
GLOBAL INTERNATIONAL WATERS ASSESSMENT
i
policy developers. These inadequacies constitute a serious impediment
The Global Environment Facility (GEF)
to the implementation of urgently needed innovative policies.
The Global Environment Facility forges international co-operation and fi nances actions to address
six critical threats to the global environment: biodiversity loss, climate change, degradation of
international waters, ozone depletion, land degradation, and persistent organic pollutants (POPs).
Continual assessment of the prevailing and future threats to aquatic
The overall strategic thrust of GEF-funded international waters activities is to meet the incremental
ecosystems and their implications for human populations is essential if
costs of: (a) assisting groups of countries to better understand the environmental concerns of
their international waters and work collaboratively to address them; (b) building the capacity
governments and decision makers are going to be able to make strategic
of existing institutions to utilise a more comprehensive approach for addressing transboundary
policy and management decisions that promote the sustainable use of
water-related environmental concerns; and (c) implementing measures that address the priority
transboundary environmental concerns. The goal is to assist countries to utilise the full range of
those resources and respond to the growing concerns of the general
technical, economic, fi nancial, regulatory, and institutional measures needed to operationalise
public. Although many assessments of aquatic resources are being
sustainable development strategies for international waters.
conducted by local, national, regional and international bodies, past
United Nations Environment Programme (UNEP)
assessments have often concentrated on specifi c themes, such as
United Nations Environment Programme, established in 1972, is the voice for the environment
biodiversity or persistent toxic substances, or have focused only on
within the United Nations system. The mission of UNEP is to provide leadership and encourage
partnership in caring for the environment by inspiring, informing, and enabling nations and
marine or freshwaters. A globally coherent, drainage basin based
peoples to improve their quality of life without compromising that of future generations.
assessment that embraces the inextricable links between transboundary
UNEP work encompasses:
freshwater and marine systems, and between environmental and
Assessing global, regional and national environmental conditions and trends;
Developing international and national environmental instruments;
societal issues, has never been conducted previously.
Strengthening institutions for the wise management of the environment;
Facilitating the transfer of knowledge and technology for sustainable development;
Encouraging new partnerships and mind-sets within civil society and the private sector.
International call for action
University of Kalmar
University of Kalmar hosts the GIWA Co-ordination Offi ce and provides scientifi c advice and
administrative and technical assistance to GIWA. University of Kalmar is situated on the coast of
The need for a holistic assessment of transboundary waters in order to
the Baltic Sea. The city has a long tradition of higher education; teachers and marine offi cers have
been educated in Kalmar since the middle of the 19th century. Today, natural science is a priority
respond to growing public concerns and provide advice to governments
area which gives Kalmar a unique educational and research profi le compared with other smaller
universities in Sweden. Of particular relevance for GIWA is the established research in aquatic and
and decision makers regarding the management of aquatic resources
environmental science. Issues linked to the concept of sustainable development are implemented
was recognised by several international bodies focusing on the global
by the research programme Natural Resources Management and Agenda 21 Research School.
environment. In particular, the Global Environment Facility (GEF)
Since its establishment GIWA has grown to become an integral part of University activities.
The GIWA Co-ordination offi ce and GIWA Core team are located at the Kalmarsund Laboratory, the
observed that the International Waters (IW) component of the GEF
university centre for water-related research. Senior scientists appointed by the University are actively
suff ered from the lack of a global assessment which made it diffi
cult
involved in the GIWA peer-review and steering groups. As a result of the cooperation the University
can offer courses and seminars related to GIWA objectives and international water issues.
to prioritise international water projects, particularly considering
the inadequate understanding of the nature and root causes of
environmental problems. In 1996, at its fourth meeting in Nairobi, the
causes of degradation of the transboundary aquatic environment and
GEF Scientifi c and Technical Advisory Panel (STAP), noted that: "Lack of
options for addressing them. These pro cesses led to the development
an International Waters Assessment comparable with that of the IPCC, the
of the Global International Waters Assessment (GIWA) that would be
Global Biodiversity Assessment, and the Stratospheric Ozone Assessment,
implemented by the United Nations Environment Programme (UNEP) in
was a unique and serious impediment to the implementation of the
conjunction with the University of Kalmar, Sweden, on behalf of the GEF.
International Waters Component of the GEF".
The GIWA was inaugurated in Kalmar in October 1999 by the Executive
Director of UNEP, Dr. Klaus Töpfer, and the late Swedish Minister of the
The urgent need for an assessment of the causes of environmental
Environment, Kjell Larsson. On this occasion Dr. Töpfer stated: "GIWA
degradation was also highlighted at the UN Special Session on
is the framework of UNEP´s global water assessment strategy and will
the Environment (UNGASS) in 1997, where commitments were
enable us to record and report on critical water resources for the planet for
made regarding the work of the UN Commission on Sustainable
consideration of sustainable development management practices as part of
Development (UNCSD) on freshwater in 1998 and seas in 1999. Also in
our responsibilities under Agenda 21 agreements of the Rio conference".
1997, two international Declarations, the Potomac Declaration: Towards
enhanced ocean security into the third millennium, and the Stockholm
The importance of the GIWA has been further underpinned by the UN
Statement on inter action of land activities, freshwater and enclosed
Millennium Development Goals adopted by the UN General Assembly
seas, specifi cally emphasised the need for an investigation of the root
in 2000 and the Declaration from the World Summit on Sustainable
iI
REGIONAL ASSESSMENTS
Development in 2002. The development goals aimed to halve the
International waters and transboundary issues
proportion of people without access to safe drinking water and basic
The term "international waters", as used for the purposes of the GEF Operational Strategy,
sanitation by the year 2015 (United Nations Millennium Declaration
includes the oceans, large marine ecosystems, enclosed or semi-enclosed seas and estuaries, as
well as rivers, lakes, groundwater systems, and wetlands with transboundary drainage basins
2000). The WSSD also calls for integrated management of land, water and
or common borders. The water-related ecosystems associated with these waters are considered
living resources (WSSD 2002) and, by 2010, the Reykjavik Declaration on
integral parts of the systems.
The term "transboundary issues" is used to describe the threats to the aquatic environment
Responsible Fisheries in the Marine Ecosystem should be implemented
linked to globalisation, international trade, demographic changes and technological advancement,
by all countries that are party to the declaration (FAO 2001).
threats that are additional to those created through transboundary movement of water. Single
country policies and actions are inadequate in order to cope with these challenges and this makes
them transboundary in nature.
The international waters area includes numerous international conventions, treaties, and
agreements. The architecture of marine agreements is especially complex, and a large number
The conceptual framework
of bilateral and multilateral agreements exist for transboundary freshwater basins. Related
conventions and agreements in other areas increase the complexity. These initiatives provide
and objectives
a new opportunity for cooperating nations to link many different programmes and instruments
into regional comprehensive approaches to address international waters.
Considering the general decline in the condition of the world's aquatic
the large-scale deforestation of mangroves for ponds (Primavera 1997).
resources and the internationally recognised need for a globally
Within the GIWA, these "non-hydrological" factors constitute as large
coherent assessment of transboundary waters, the primary objectives
a transboundary infl uence as more traditionally recognised problems,
of the GIWA are:
such as the construction of dams that regulate the fl ow of water into
To provide a prioritising mechanism that allows the GEF to focus
a neighbouring country, and are considered equally important. In
their resources so that they are used in the most cost eff ective
addition, the GIWA recognises the importance of hydrological units that
manner to achieve signifi cant environmental benefi ts, at national,
would not normally be considered transboundary but exert a signifi cant
regional and global levels; and
infl uence on transboundary waters, such as the Yangtze River in China
To highlight areas in which governments can develop and
which discharges into the East China Sea (Daoji & Daler 2004) and the
implement strategic policies to reduce environmental degradation
Volga River in Russia which is largely responsible for the condition of
and improve the management of aquatic resources.
the Caspian Sea (Barannik et al. 2004). Furthermore, the GIWA is a truly
regional assessment that has incorporated data from a wide range of
In order to meet these objectives and address some of the current
sources and included expert knowledge and information from a wide
inadequacies in international aquatic resources management, the GIWA
range of sectors and from each country in the region. Therefore, the
has incorporated four essential elements into its design:
transboundary concept adopted by the GIWA extends to include
A broad transboundary approach that generates a truly regional
impacts caused by globalisation, international trade, demographic
perspective through the incorporation of expertise and existing
changes and technological advances and recognises the need for
information from all nations in the region and the assessment of
international cooperation to address them.
all factors that infl uence the aquatic resources of the region;
A drainage basin approach integrating freshwater and marine
systems;
A multidisciplinary approach integrating environmental and socio-
The organisational structure and
economic information and expertise; and
implementation of the GIWA
A coherent assessment that enables global comparison of the
results.
The scale of the assessment
Initially, the scope of the GIWA was confi ned to transboundary waters
The GIWA builds on previous assessments implemented within the GEF
in areas that included countries eligible to receive funds from the GEF.
International Waters portfolio but has developed and adopted a broader
However, it was recognised that a truly global perspective would only
defi nition of transboundary waters to include factors that infl uence the
be achieved if industrialised, GEF-ineligible regions of the world were
quality and quantity of global aquatic resources. For example, due to
also assessed. Financial resources to assess the GEF-eligible countries
globalisation and international trade, the market for penaeid shrimps
were obtained primarily from the GEF (68%), the Swedish International
has widened and the prices soared. This, in turn, has encouraged
Development Cooperation Agency (Sida) (18%), and the Finnish
entrepreneurs in South East Asia to expand aquaculture resulting in
Department for International Development Cooperation (FINNIDA)
GLOBAL INTERNATIONAL WATERS ASSESSMENT
iII
1b
1c
1d
16
15
11
14
12
1a
13
17
28
10
18
25
30
9
19
23
7
22
8
31
6
24
33
20
34
26
2
5
27
50
51
32
21
36
37
41
52
4
49
53
43
54
55
65
42
3
56
42
46
42
47
62
40b
57
40a
40a
47
47
45b
59
39
45a
58
64
60
44
38
61
63
66
© GIWA 2005
1a Russian Arctic (4 LMEs)
8 Gulf of St Lawrence
17 Baltic
Sea
(LME)
26 California Current (LME)
38 Patagonian Shelf (LME)
45b Indian Ocean Islands
52 Arabian
Sea
(LME)
61 Great
Australian
Bight
1b Arctic
Greenland
(LME)
9 Newfoundland
Shelf
(LME)
18 North
Sea
(LME)
27 Gulf of California (LME)
39 Brazil
Current
(LME)
46 Somali Coastal
53 Bay of Bengal
62 Pacifi c Islands
1c Arctic
European/Atlantic
10 Baffi
n Bay, Labrador Sea,
19 Celtic-Biscay
Shelf
(LME)
28 Bering Sea (LME)
40a Northeast Brazil
Current (LME)
54 South China Sea (2 LMEs)
63 Tasman
Sea
1d Arctic North American
Canadian Archipelago
20 Iberian Coastal Sea (LME)
30 Sea of Okhotsk (LME)
Shelf (2 LMEs)
47 East
African
Rift
55 Mekong
River
64 Humboldt Current (LME)
2
Gulf of Mexico (LME)
11 Barents
Sea
(LME)
21 North
Africa
and
31 Oyashio
Current
(LME)
40b Amazon
Valley Lakes
56 Sulu-Celebes
Sea
(LME)
65 Eastern Equatorial
3 Caribbean
Sea
(LME)
12 Norwegian
Sea
(LME)
Nile River Basin (LME)
32 Kuroshio
Current
(LME)
41 Canary
Current
(LME)
49 Red Sea and
57 Indonesian
Seas
(LME)
Pacifi c (LME)
4 Caribbean
Islands
(LME)
13 Faroe
plateau
22 Black Sea (LME)
33 Sea of Japan (LME)
42 Guinea Current (LME)
Gulf of Aden (LME)
58 North Australian
66 Antarctic (LME)
5 Southeast
Shelf
(LME)
14 Iceland
Shelf
(LME)
23 Caspian
Sea
34 Yellow Sea (LME)
43 Lake
Chad
50 Euphrates and
Shelf (LME)
6 Northeast
Shelf
(LME)
15 East
Greenland
Shelf
(LME)
24 Aral Sea
36 East China Sea (LME)
44 Benguela Current (LME)
Tigris River Basin
59 Coral
Sea
Basin
7 Scotian
Shelf
(LME)
16 West
Greenland
Shelf
(LME)
25 Gulf of Alaska (LME)
37 Hawaiian
Archipelago
(LME)
45a Agulhas Current (LME)
51 Jordan
60 Great Barrier Reef (LME)
Figure 1
The 66 transboundary regions assessed within the GIWA project.
(10%). Other contributions were made by Kalmar Municipality, the
Large Marine Ecocsystems (LMEs)
University of Kalmar and the Norwegian Government. The assessment of
Large Marine Ecosystems (LMEs) are regions of ocean space encompassing coastal areas from river
regions ineligible for GEF funds was conducted by various international
basins and estuaries to the seaward boundaries of continental shelves and the outer margin of the
major current systems. They are relatively large regions on the order of 200 000 km2 or greater,
and national organisations as in-kind contributions to the GIWA.
characterised by distinct: (1) bathymetry, (2) hydrography, (3) productivity, and (4) trophically
dependent populations.
The Large Marine Ecosystems strategy is a global effort for the assessment and management
In order to be consistent with the transboundary nature of many of the
of international coastal waters. It developed in direct response to a declaration at the 1992
world's aquatic resources and the focus of the GIWA, the geographical
Rio Summit. As part of the strategy, the World Conservation Union (IUCN) and National Oceanic
and Atmospheric Administration (NOAA) have joined in an action program to assist developing
units being assessed have been designed according to the watersheds
countries in planning and implementing an ecosystem-based strategy that is focused on LMEs as
of discrete hydrographic systems rather than political borders (Figure 1).
the principal assessment and management units for coastal ocean resources. The LME concept is
also adopted by GEF that recommends the use of LMEs and their contributing freshwater basins
The geographic units of the assessment were determined during the
as the geographic area for integrating changes in sectoral economic activities.
preparatory phase of the project and resulted in the division of the
world into 66 regions defi ned by the entire area of one or more
The global network
catchments areas that drains into a single designated marine system.
In each of the 66 regions, the assessment is conducted by a team of
These marine systems often correspond to Large Marine Ecosystems
local experts that is headed by a Focal Point (Figure 2). The Focal Point
(LMEs) (Sherman 1994, IOC 2002).
can be an individual, institution or organisation that has been selected
on the basis of their scientifi c reputation and experience implementing
Considering the objectives of the GIWA and the elements incorporated
international assessment projects. The Focal Point is responsible
into its design, a new methodology for the implementation of the
for assembling members of the team and ensuring that it has the
assessment was developed during the initial phase of the project. The
necessary expertise and experience in a variety of environmental
methodology focuses on fi ve major environmental concerns which
and socio-economic disciplines to successfully conduct the regional
constitute the foundation of the GIWA assessment; Freshwater shortage,
assessment. The selection of team members is one of the most critical
Pollution, Habitat and community modifi cation, Overexploitation of fi sh
elements for the success of GIWA and, in order to ensure that the
and other living resources, and Global change. The GIWA methodology
most relevant information is incorporated into the assessment, team
is outlined in the following chapter.
members were selected from a wide variety of institutions such as
iV
REGIONAL ASSESSMENTS
an assessment did not exist. Therefore, in order to implement the GIWA,
a new methodology that adopted a multidisciplinary, multi-sectoral,
Steering Group
multi-national approach was developed and is now available for the
implementation of future international assessments of aquatic resources.
GIWA Partners
IGOs, NGOs,
Core
Thematic
The GIWA is comprised of a logical sequence of four integrated
Scientific institutions,
Team
Task Teams
private sector, etc
components. The fi rst stage of the GIWA is called Scaling and is a
66 Regional
process by which the geographic area examined in the assessment is
Focal Points
defi ned and all the transboundary waters within that area are identifi ed.
and Teams
Once the geographic scale of the assessment has been defi ned, the
Figure 2
The organisation of the GIWA project.
assessment teams conduct a process known as Scoping in which the
magnitude of environmental and associated socio-economic impacts
universities, research institutes, government agencies, and the private
of Freshwater shortage, Pollution, Habitat and community modifi cation,
sector. In addition, in order to ensure that the assessment produces a
Unsustainable exploitation of fi sh and other living resources, and Global
truly regional perspective, the teams should include representatives
change is assessed in order to identify and prioritise the concerns
from each country that shares the region.
that require the most urgent intervention. The assessment of these
predefi ned concerns incorporates the best available information and
In total, more than 1 000 experts have contributed to the implementation
the knowledge and experience of the multidisciplinary, multi-national
of the GIWA illustrating that the GIWA is a participatory exercise that
assessment teams formed in each region. Once the priority concerns
relies on regional expertise. This participatory approach is essential
have been identifi ed, the root causes of these concerns are identifi ed
because it instils a sense of local ownership of the project, which
during the third component of the GIWA, Causal chain analysis. The root
ensures the credibility of the fi ndings and moreover, it has created a
causes are determined through a sequential process that identifi es, in
global network of experts and institutions that can collaborate and
turn, the most signifi cant immediate causes followed by the economic
exchange experiences and expertise to help mitigate the continued
sectors that are primarily responsible for the immediate causes and
degradation of the world's aquatic resources.
fi nally, the societal root causes. At each stage in the Causal chain
analysis, the most signifi cant contributors are identifi ed through an
analysis of the best available information which is augmented by the
expertise of the assessment team. The fi nal component of the GIWA is
GIWA Regional reports
the development of Policy options that focus on mitigating the impacts
of the root causes identifi ed by the Causal chain analysis.
The GIWA was established in response to growing concern among the
general public regarding the quality of the world's aquatic resources
The results of the GIWA assessment in each region are reported in
and the recognition of governments and the international community
regional reports that are published by UNEP. These reports are designed
concerning the absence of a globally coherent international waters
to provide a brief physical and socio-economic description of the
assessment. However, because a holistic, region-by-region, assessment
most important features of the region against which the results of the
of the condition of the world's transboundary water resources had never
assessment can be cast. The remaining sections of the report present
been undertaken, a methodology guiding the implementation of such
the results of each stage of the assessment in an easily digestible form.
Each regional report is reviewed by at least two independent external
UNEP Water Policy and Strategy
reviewers in order to ensure the scientifi c validity and applicability of
The primary goals of the UNEP water policy and strategy are:
each report. The 66 regional assessments of the GIWA will serve UNEP
(a) Achieving greater global understanding of freshwater, coastal and marine environments by
as an essential complement to the UNEP Water Policy and Strategy and
conducting environmental assessments in priority areas;
(b) Raising awareness of the importance and consequences of unsustainable water use;
UNEP's activities in the hydrosphere.
(c) Supporting the efforts of Governments in the preparation and implementation of integrated
management of freshwater systems and their related coastal and marine environments;
(d) Providing support for the preparation of integrated management plans and programmes for
aquatic environmental hot spots, based on the assessment results;
Global International Waters Assessment
(e) Promoting the application by stakeholders of precautionary, preventive and anticipatory
approaches.
GLOBAL INTERNATIONAL WATERS ASSESSMENT
v
References:
AMAP (1998). Assessment Report: Arctic Pollution Issues. Arctic
Monitoring and Assessment Programme (AMAP), Oslo, Norway.
Barannik, V., Borysova, O. and Stolberg, F. (2004). The Caspian Sea Region:
Environmental Change. Ambio, 33:45-51.
Brinson, M.M. and Malvárez, A.I. (2002). Temperate freshwater wetlands:
types, status, and threats. Environmental Conservation, 29:115-133.
Daoji, L. and Daler, D. (2004). Ocean Pollution from Land-based Sources:
East China Sea, China. Ambio, 33:98-106.
FAO (2001). Reykjavik conference on responsible fi sheries in the marine
ecosystem. Iceland, 1-4 October 2001.
IOC (2002). IOC-IUCN-NOAA Consultative Meeting on Large Marine
Ecosystems (LMEs). Fourth Session, 8-9 January 2002, Paris,
France.
IPCC (2001). Climate Change 2001: The Scientifi c Basis. Contribution
of Working Group I to the Third Assessment Report of the
Intergovernmental Panel on Climate Change. In: Houghton,
J.T., Ding, Y., Griggs, D.J., Noguer, M., van der Linden, P.J., Dai, X.,
Maskell, K. and Johnson, C.A. (eds). Cambridge University Press,
Cambridge, United Kingdom and New York, NY, USA.
Kennish, M.J. (2002). Environmental threats and environmental future of
estuaries. Environmental Conservation, 29:78-107.
Myers, R.A. and Worm, B. (2003). Rapid worldwide depletion of predatory
fi sh communities. Nature, 423:280-283.
Primavera, J.H. (1997) Socio-economic impacts of shrimp culture.
Aquaculture Research, 28:815-827.
Sherman, K. (1994). Sustainability, biomass yields, and health of coastal
ecosystems: an ecological perspective. Marine Ecology Progress
Series, 112:277-301.
United Nations conference on the human environment (1972). Report
available on-line at http://www.unep.org
United Nations Millennium Declaration (2000). The Millennium
Assembly of the United Nations, New York.
WHO-UNICEF (2002). Global Water Supply and Sanitation Assessment:
2000 Report.
WSSD (2002). World Summit on Sustainable Development.
Johannesburg Summit 2002. Key Outcomes of the Summit,
UN Department of Public Information, New York.
v I
REGIONAL ASSESSMENTS
The GIWA methodology
The specifi c objectives of the GIWA were to conduct a holistic and globally
The assessment integrates environmental and socio-economic data
comparable assessment of the world's transboundary aquatic resources
from each country in the region to determine the severity of the
that incorporated both environmental and socio-economic factors
impacts of each of the fi ve concerns and their constituent issues on
and recognised the inextricable links between freshwater and marine
the entire region. The integration of this information was facilitated by
environments, in order to enable the GEF to focus their resources and to
implementing the assessment during two participatory workshops
provide guidance and advice to governments and decision makers. The
that typically involved 10 to 15 environmental and socio-economic
coalition of all these elements into a single coherent methodology that
experts from each country in the region. During these workshops, the
produces an assessment that achieves each of these objectives had not
regional teams performed preliminary analyses based on the collective
previously been done and posed a signifi cant challenge.
knowledge and experience of these local experts. The results of these
analyses were substantiated with the best available information to be
The integration of each of these elements into the GIWA methodology
presented in a regional report.
was achieved through an iterative process guided by a specially
Table 1 Pre-defi ned GIWA concerns and their constituent issues
convened Methods task team that was comprised of a number of
addressed within the assessment.
international assessment and water experts. Before the fi nal version
of the methodology was adopted, preliminary versions underwent
Environmental issues
Major concerns
an extensive external peer review and were subjected to preliminary
1. Modification of stream flow
testing in selected regions. Advice obtained from the Methods task
2. Pollution of existing supplies
I Freshwater shortage
3. Changes in the water table
team and other international experts and the lessons learnt from
preliminary testing were incorporated into the fi nal version that was
4. Microbiological
5. Eutrophication
used to conduct each of the GIWA regional assessments.
6. Chemical
7. Suspended
solids
II Pollution
8. Solid
wastes
Considering the enormous diff erences between regions in terms of the
9. Thermal
10. Radionuclide
quality, quantity and availability of data, socio-economic setting and
11. Spills
environmental conditions, the achievement of global comparability
12. Loss of ecosystems
required an innovative approach. This was facilitated by focusing
III Habitat and community
13. Modification of ecosystems or ecotones, including community
modification
structure and/or species composition
the assessment on the impacts of fi ve pre-defi ned concerns namely;
Freshwater shortage, Pollution, Habitat and community modifi cation,
14. Overexploitation
15. Excessive by-catch and discards
IV Unsustainable
Unsustainable exploitation of fi sh and other living resources and Global
16. Destructive fishing practices
exploitation of fish and
change, in transboundary waters. Considering the diverse range of
17. Decreased viability of stock through pollution and disease
other living resources
18. Impact on biological and genetic diversity
elements encompassed by each concern, assessing the magnitude of
19. Changes in hydrological cycle
the impacts caused by these concerns was facilitated by evaluating the
20. Sea level change
V Global change
impacts of 22 specifi c issues that were grouped within these concerns
21. Increased uv-b radiation as a result of ozone depletion
22. Changes in ocean CO source/sink function
(see Table 1).
2
THE GIWA METHODOLOGY
vii

political boundaries but were instead, generally defi ned by a large but
T
r
ansboundar
The GIWA approach
discrete drainage basin that also included the coastal marine waters into
which the basin discharges. In many cases, the marine areas examined
1
Scaling
st
W
orkshop
Detailed
during the assessment coincided with the Large Marine Ecosystems
y
D
(LMEs) defi ned by the US National Atmospheric and Oceanographic
iagnostic
A
ssessment
Scoping
Administration (NOAA). As a consequence, scaling should be a
relatively straight-forward task that involves the inspection of the
Analy
boundaries that were proposed for the region during the preparatory
Causal Chain
2
sis
nd
Analysis
phase of GIWA to ensure that they are appropriate and that there are
W
orkshop
no important overlaps or gaps with neighbouring regions. When the
Policy Option
proposed boundaries were found to be inadequate, the boundaries of
Analysis
the region were revised according to the recommendations of experts
from both within the region and from adjacent regions so as to ensure
that any changes did not result in the exclusion of areas from the GIWA.
Once the regional boundary was defi ned, regional teams identifi ed all
SAP
the transboundary elements of the aquatic environment within the
SAP
region and determined if these elements could be assessed as a single
Figure 1
Illustration of the relationship between the GIWA
coherent aquatic system or if there were two or more independent
approach and other projects implemented within the
systems that should be assessed separately.
GEF International Waters (IW) portfolio.
The GIWA is a logical contiguous process that defi nes the geographic
Scoping Assessing the GIWA concerns
region to be assessed, identifi es and prioritises particularly problems
Scoping is an assessment of the severity of environmental and socio-
based on the magnitude of their impacts on the environment and
economic impacts caused by each of the fi ve pre-defi ned GIWA concerns
human societies in the region, determines the root causes of those
and their constituent issues (Table 1). It is not designed to provide an
problems and, fi nally, assesses various policy options that addresses
exhaustive review of water-related problems that exist within each region,
those root causes in order to reverse negative trends in the condition
but rather it is a mechanism to identify the most urgent problems in the
of the aquatic environment. These four steps, referred to as Scaling,
region and prioritise those for remedial actions. The priorities determined
Scoping, Causal chain analysis and Policy options analysis, are
by Scoping are therefore one of the main outputs of the GIWA project.
summarised below and are described in their entirety in two volumes:
GIWA Methodology Stage 1: Scaling and Scoping; and GIWA Methodology:
Focusing the assessment on pre-defi ned concerns and issues ensured
Detailed Assessment, Causal Chain Analysis and Policy Options Analysis.
the comparability of the results between diff erent regions. In addition, to
Generally, the components of the GIWA methodology are aligned
ensure the long-term applicability of the options that are developed to
with the framework adopted by the GEF for Transboundary Diagnostic
mitigate these problems, Scoping not only assesses the current impacts
Analyses (TDAs) and Strategic Action Programmes (SAPs) (Figure 1) and
of these concerns and issues but also the probable future impacts
assume a broad spectrum of transboundary infl uences in addition to
according to the "most likely scenario" which considered demographic,
those associated with the physical movement of water across national
economic, technological and other relevant changes that will potentially
borders.
infl uence the aquatic environment within the region by 2020.
Scaling Defining the geographic extent
The magnitude of the impacts caused by each issue on the
of the region
environment and socio-economic indicators was assessed over the
Scaling is the fi rst stage of the assessment and is the process by which
entire region using the best available information from a wide range of
the geographic scale of the assessment is defi ned. In order to facilitate
sources and the knowledge and experience of the each of the experts
the implementation of the GIWA, the globe was divided during the
comprising the regional team. In order to enhance the comparability
design phase of the project into 66 contiguous regions. Considering the
of the assessment between diff erent regions and remove biases
transboundary nature of many aquatic resources and the transboundary
in the assessment caused by diff erent perceptions of and ways to
focus of the GIWA, the boundaries of the regions did not comply with
communicate the severity of impacts caused by particular issues, the
viii
REGIONAL ASSESSMENTS
results were distilled and reported as standardised scores according to
Table 2
Example of environmental impact assessment of
Freshwater shortage.
the following four point scale:
Weight
0 = no known impact
Environmental
Environmental issues
Score
Weight %
averaged
concerns
1 = slight impact
score
2
=
moderate
impact
1. Modification of stream flow
1
20
Freshwater shortage
1.50
3 = severe impact
2. Pollution of existing supplies
2
50
The attributes of each score for each issue were described by a detailed
3. Changes in the water table
1
30
set of pre-defi ned criteria that were used to guide experts in reporting
Table 3
Example of Health impacts assessment linked to one of
the results of the assessment. For example, the criterion for assigning
the GIWA concerns.
a score of 3 to the issue Loss of ecosystems or ecotones is: "Permanent
Criteria for Health impacts
Raw score
Score
Weight %
destruction of at least one habitat is occurring such as to have reduced their
Very small
Very large
surface area by >30% during the last 2-3 decades". The full list of criteria is
Number of people affected
2
50
0 1 2 3
presented at the end of the chapter, Table 5a-e. Although the scoring
Minimum
Severe
Degree of severity
2
30
0 1 2 3
inevitably includes an arbitrary component, the use of predefi ned
Occasion/Short
Continuous
Frequency/Duration
2
20
0 1 2 3
criteria facilitates comparison of impacts on a global scale and also
Weight average score for Health impacts
2
encouraged consensus of opinion among experts.
The trade-off associated with assessing the impacts of each concern
After all 22 issues and associated socio-economic impacts have
and their constituent issues at the scale of the entire region is that spatial
been scored, weighted and averaged, the magnitude of likely future
resolution was sometimes low. Although the assessment provides a
changes in the environmental and socio-economic impacts of each
score indicating the severity of impacts of a particular issue or concern
of the fi ve concerns on the entire region is assessed according to the
on the entire region, it does not mean that the entire region suff ers
most likely scenario which describes the demographic, economic,
the impacts of that problem. For example, eutrophication could be
technological and other relevant changes that might infl uence the
identifi ed as a severe problem in a region, but this does not imply that all
aquatic environment within the region by 2020.
waters in the region suff er from severe eutrophication. It simply means
that when the degree of eutrophication, the size of the area aff ected,
In order to prioritise among GIWA concerns within the region and
the socio-economic impacts and the number of people aff ected is
identify those that will be subjected to causal chain and policy options
considered, the magnitude of the overall impacts meets the criteria
analysis in the subsequent stages of the GIWA, the present and future
defi ning a severe problem and that a regional action should be initiated
scores of the environmental and socio-economic impacts of each
in order to mitigate the impacts of the problem.
concern are tabulated and an overall score calculated. In the example
presented in Table 4, the scoping assessment indicated that concern III,
When each issue has been scored, it was weighted according to the relative
Habitat and community modifi cation, was the priority concern in this
contribution it made to the overall environmental impacts of the concern
region. The outcome of this mathematic process was reconciled against
and a weighted average score for each of the fi ve concerns was calculated
the knowledge of experts and the best available information in order
(Table 2). Of course, if each issue was deemed to make equal contributions,
to ensure the validity of the conclusion.
then the score describing the overall impacts of the concern was simply the
arithmetic mean of the scores allocated to each issue within the concern.
In some cases however, this process and the subsequent participatory
In addition, the socio-economic impacts of each of the fi ve major
discussion did not yield consensus among the regional experts
concerns were assessed for the entire region. The socio-economic
regarding the ranking of priorities. As a consequence, further analysis
impacts were grouped into three categories; Economic impacts,
was required. In such cases, expert teams continued by assessing the
Health impacts and Other social and community impacts (Table 3). For
relative importance of present and potential future impacts and assign
each category, an evaluation of the size, degree and frequency of the
weights to each. Afterwards, the teams assign weights indicating the
impact was performed and, once completed, a weighted average score
relative contribution made by environmental and socio-economic
describing the overall socio-economic impacts of each concern was
factors to the overall impacts of the concern. The weighted average
calculated in the same manner as the overall environmental score.
score for each concern is then recalculated taking into account
THE GIWA METHODOLOGY
ix
Table 4
Example of comparative environmental and socio-economic impacts of each major concern, presently and likely in year 2020.
Types of impacts
Environmental score
Economic score
Human health score
Social and community score
Concern
Overall score
Present (a)
Future (b)
Present (c)
Future (d)
Present (e)
Future (f)
Present (g)
Future (h)
Freshwater shortage
1.3
2.3
2.7
2.8
2.6
3.0
1.8
2.2
2.3
Pollution
1.5
2.0
2.0
2.3
1.8
2.3
2.0
2.3
2.0
Habitat and community
2.0
3.0
2.4
3.0
2.4
2.8
2.3
2.7
2.6
modification
Unsustainable exploitation of fish
1.8
2.2
2.0
2.1
2.0
2.1
2.4
2.5
2.1
and other living resources
Global change
0.8
1.0
1.5
1.7
1.5
1.5
1.0
1.0
1.2
the relative contributions of both present and future impacts and
should be regarded as a framework to guide the analysis, rather than
environmental and socio-economic factors. The outcome of these
as a set of detailed instructions. Secondly, in an ideal setting, a causal
additional analyses was subjected to further discussion to identify
chain would be produced by a multidisciplinary group of specialists
overall priorities for the region.
that would statistically examine each successive cause and study its
links to the problem and to other causes. However, this approach (even
Finally, the assessment recognises that each of the fi ve GIWA concerns
if feasible) would use far more resources and time than those available
are not discrete but often interact. For example, pollution can destroy
to GIWA1. For this reason, it has been necessary to develop a relatively
aquatic habitats that are essential for fi sh reproduction which, in turn,
simple and practical analytical model for gathering information to
can cause declines in fi sh stocks and subsequent overexploitation. Once
assemble meaningful causal chains.
teams have ranked each of the concerns and determined the priorities
for the region, the links between the concerns are highlighted in order
Conceptual model
to identify places where strategic interventions could be applied to
A causal chain is a series of statements that link the causes of a problem
yield the greatest benefi ts for the environment and human societies
with its eff ects. Recognising the great diversity of local settings and the
in the region.
resulting diffi
culty in developing broadly applicable policy strategies,
the GIWA CCA focuses on a particular system and then only on those
Causal chain analysis
issues that were prioritised during the scoping assessment. The
Causal Chain Analysis (CCA) traces the cause-eff ect pathways from the
starting point of a particular causal chain is one of the issues selected
socio-economic and environmental impacts back to their root causes.
during the Scaling and Scoping stages and its related environmental
The GIWA CCA aims to identify the most important causes of each
and socio-economic impacts. The next element in the GIWA chain is
concern prioritised during the scoping assessment in order to direct
the immediate cause; defi ned as the physical, biological or chemical
policy measures at the most appropriate target in order to prevent
variable that produces the GIWA issue. For example, for the issue of
further degradation of the regional aquatic environment.
eutrophication the immediate causes may be, inter alia:
Enhanced nutrient inputs;
Root causes are not always easy to identify because they are often
Increased
recycling/mobilisation;
spatially or temporally separated from the actual problems they
Trapping of nutrients (e.g. in river impoundments);
cause. The GIWA CCA was developed to help identify and understand
Run-off and stormwaters
the root causes of environmental and socio-economic problems
in international waters and is conducted by identifying the human
Once the relevant immediate cause(s) for the particular system has
activities that cause the problem and then the factors that determine
(have) been identifi ed, the sectors of human activity that contribute
the ways in which these activities are undertaken. However, because
most signifi cantly to the immediate cause have to be determined.
there is no universal theory describing how root causes interact to
Assuming that the most important immediate cause in our example
create natural resource management problems and due to the great
had been increased nutrient concentrations, then it is logical that the
variation of local circumstances under which the methodology will
most likely sources of those nutrients would be the agricultural, urban
be applied, the GIWA CCA is not a rigidly structured assessment but
or industrial sectors. After identifying the sectors that are primarily
1 This does not mean that the methodology ignores statistical or quantitative studies; as has already been pointed out, the available evidence that justifies the assumption of causal links should
be provided in the assessment.
x
REGIONAL ASSESSMENTS
responsible for the immediate causes, the root causes acting on those
The policy options recommended by the GIWA are only contributions
sectors must be determined. For example, if agriculture was found to
to the larger policy process and, as such, the GIWA methodology
be primarily responsible for the increased nutrient concentrations, the
developed to test the performance of various options under the
root causes could potentially be:
diff erent circumstances has been kept simple and broadly applicable.
Economic (e.g. subsidies to fertilisers and agricultural products);
Legal (e.g. inadequate regulation);
Global International Waters Assessment
Failures in governance (e.g. poor enforcement); or
Technology or knowledge related (e.g. lack of aff ordable substitutes
for fertilisers or lack of knowledge as to their application).
Once the most relevant root causes have been identifi ed, an
explanation, which includes available data and information, of how
they are responsible for the primary environmental and socio-economic
problems in the region should be provided.
Policy option analysis
Despite considerable eff ort of many Governments and other
organisations to address transboundary water problems, the evidence
indicates that there is still much to be done in this endeavour. An
important characteristic of GIWA's Policy Option Analysis (POA) is that
its recommendations are fi rmly based on a better understanding of
the root causes of the problems. Freshwater scarcity, water pollution,
overexploitation of living resources and habitat destruction are very
complex phenomena. Policy options that are grounded on a better
understanding of these phenomena will contribute to create more
eff ective societal responses to the extremely complex water related
transboundary problems. The core of POA in the assessment consists
of two tasks:
Construct policy options
Policy options are simply diff erent courses of action, which are not
always mutually exclusive, to solve or mitigate environmental and
socio-economic problems in the region. Although a multitude of
diff erent policy options could be constructed to address each root
cause identifi ed in the CCA, only those few policy options that have
the greatest likelihood of success were analysed in the GIWA.
Select and apply the criteria on which the policy options will be
evaluated
Although there are many criteria that could be used to evaluate any
policy option, GIWA focuses on:
Eff ectiveness (certainty of result)
Effi
ciency (maximisation of net benefi ts)
Equity (fairness of distributional impacts)
Practical
criteria
(political
acceptability,
implementation
feasibility).
THE GIWA METHODOLOGY
xi
Table 5a: Scoring criteria for environmental impacts of Freshwater shortage
Issue
Score 0 = no known impact
Score 1 = slight impact
Score 2 = moderate impact
Score 3 = severe impact
Issue 1: Modification
No evidence of modification of stream
There is a measurably changing trend in
Significant downward or upward trend
Annual discharge of a river altered by more
of stream flow
flow.
annual river discharge at gauging stations
(more than 20% of the long term mean) in
than 50% of long term mean; or
"An increase or decrease
in a major river or tributary (basin >
annual discharges in a major river or tributary Loss of >50% of riparian or deltaic
in the discharge of
40 000 km2); or
draining a basin of >250 000 km2; or
wetlands over a period of not less than
streams and rivers
There is a measurable decrease in the area
Loss of >20% of flood plain or deltaic
40 years (through causes other than
as a result of human
of wetlands (other than as a consequence
wetlands through causes other than
conversion or artificial embankment); or
interventions on a local/
of conversion or embankment
conversion or artificial embankments; or
Significant increased siltation or erosion
regional scale (see Issue
construction); or
Significant loss of riparian vegetation (e.g.
due to changing in flow regime (other than
19 for flow alterations
There is a measurable change in the
trees, flood plain vegetation); or
normal fluctuations in flood plain rivers);
resulting from global
interannual mean salinity of estuaries or
Significant saline intrusion into previously
or
change) over the last 3-4
coastal lagoons and/or change in the mean
freshwater rivers or lagoons.
Loss of one or more anadromous or
decades."
position of estuarine salt wedge or mixing
catadromous fish species for reasons
zone; or
other than physical barriers to migration,
Change in the occurrence of exceptional
pollution or overfishing.
discharges (e.g. due to upstream
damming.
Issue 2: Pollution of
No evidence of pollution of surface and
Any monitored water in the region does
Water supplies does not meet WHO or
River draining more than 10% of the basin
existing supplies
ground waters.
not meet WHO or national drinking water
national drinking water standards in more
have suffered polysaprobic conditions, no
"Pollution of surface
criteria, other than for natural reasons; or
than 30% of the region; or
longer support fish, or have suffered severe
and ground fresh waters
There have been reports of one or more
There are one or more reports of fish kills
oxygen depletion
supplies as a result of
fish kills in the system due to pollution
due to pollution in any river draining a
Severe pollution of other sources of
point or diffuse sources"
within the past five years.
basin of >250 000 km2 .
freshwater (e.g. groundwater)
Issue 3: Changes in
No evidence that abstraction of water from Several wells have been deepened because Clear evidence of declining base flow in
Aquifers are suffering salinisation over
the water table
aquifers exceeds natural replenishment.
of excessive aquifer draw-down; or
rivers in semi-arid areas; or
regional scale; or
"Changes in aquifers
Several springs have dried up; or
Loss of plant species in the past decade,
Perennial springs have dried up over
as a direct or indirect
Several wells show some salinisation.
that depend on the presence of ground
regionally significant areas; or
consequence of human
water; or
Some aquifers have become exhausted
activity"
Wells have been deepened over areas of
hundreds of km2;or
Salinisation over significant areas of the
region.
Table 5b: Scoring criteria for environmental impacts of Pollution
Issue
Score 0 = no known impact
Score 1 = slight impact
Score 2 = moderate impact
Score 3 = severe impact
Issue 4:
Normal incidence of bacterial related
There is minor increase in incidence of
Public health authorities aware of marked
There are large closure areas or very
Microbiological
gastroenteric disorders in fisheries product
bacterial related gastroenteric disorders
increase in the incidence of bacterial
restrictive advisories affecting the
pollution
consumers and no fisheries closures or
in fisheries product consumers but no
related gastroenteric disorders in fisheries
marketability of fisheries products; or
"The adverse effects of
advisories.
fisheries closures or advisories.
product consumers; or
There exists widespread public or tourist
microbial constituents of
There are limited area closures or
awareness of hazards resulting in
human sewage released
advisories reducing the exploitation or
major reductions in the exploitation or
to water bodies."
marketability of fisheries products.
marketability of fisheries products.
Issue 5:
No visible effects on the abundance and
Increased abundance of epiphytic algae; or
Increased filamentous algal production
High frequency (>1 event per year), or
Eutrophication
distributions of natural living resource
A statistically significant trend in
resulting in algal mats; or
intensity, or large areas of periodic hypoxic
"Artificially enhanced
distributions in the area; and
decreased water transparency associated
Medium frequency (up to once per year)
conditions, or high frequencies of fish and
primary productivity in
No increased frequency of hypoxia1 or
with algal production as compared with
of large-scale hypoxia and/or fish and
zoobenthos mortality events or harmful
receiving water basins
fish mortality events or harmful algal
long-term (>20 year) data sets; or
zoobenthos mortality events and/or
algal blooms; or
related to the increased
blooms associated with enhanced primary
Measurable shallowing of the depth range
harmful algal blooms.
Significant changes in the littoral
availability or supply
production; and
of macrophytes.
community; or
of nutrients, including
No evidence of periodically reduced
Presence of hydrogen sulphide in
cultural eutrophication
dissolved oxygen or fish and zoobenthos
historically well oxygenated areas.
in lakes."
mortality; and
No evident abnormality in the frequency of
algal blooms.
xii
REGIONAL ASSESSMENTS
Issue 6: Chemical
No known or historical levels of chemical
Some chemical contaminants are
Some chemical contaminants are above
Chemical contaminants are above
pollution
contaminants except background levels of
detectable but below threshold limits
threshold limits defined for the country or
threshold limits defined for the country or
"The adverse effects of
naturally occurring substances; and
defined for the country or region; or
region; or
region; and
chemical contaminants
No fisheries closures or advisories due to
Restricted area advisories regarding
Large area advisories by public health
Public health and public awareness of
released to standing or
chemical pollution; and
chemical contamination of fisheries
authorities concerning fisheries product
fisheries contamination problems with
marine water bodies
No incidence of fisheries product tainting;
products.
contamination but without associated
associated reductions in the marketability
as a result of human
and
catch restrictions or closures; or
of such products either through the
activities. Chemical
No unusual fish mortality events.
If there is no available data use the following
High mortalities of aquatic species near
imposition of limited advisories or by area
contaminants are
criteria:
outfalls.
closures of fisheries; or
here defined as
If there is no available data use the following
Some use of pesticides in small areas; or
Large-scale mortalities of aquatic species.
compounds that are
criteria:
Presence of small sources of dioxins or
If there is no available data use the following
toxic or persistent or
No use of pesticides; and
furans (e.g., small incineration plants or
criteria:
If there is no available data use the following
bioaccumulating."
No sources of dioxins and furans; and
bleached kraft/pulp mills using chlorine);
Large-scale use of pesticides in agriculture
criteria:
No regional use of PCBs; and
or
and forestry; or
Indications of health effects resulting
No bleached kraft pulp mills using chlorine Some previous and existing use of PCBs
Presence of major sources of dioxins or
from use of pesticides; or
bleaching; and
and limited amounts of PCB-containing
furans such as large municipal or industrial Known emissions of dioxins or furans from
No use or sources of other contaminants.
wastes but not in amounts invoking local
incinerators or large bleached kraft pulp
incinerators or chlorine bleaching of pulp;
concerns; or
mills; or
or
Presence of other contaminants.
Considerable quantities of waste PCBs in
Known contamination of the environment
the area with inadequate regulation or has
or foodstuffs by PCBs; or
invoked some public concerns; or
Known contamination of the environment
Presence of considerable quantities of
or foodstuffs by other contaminants.
other contaminants.
Issue 7: Suspended
No visible reduction in water transparency; Evidently increased or reduced turbidity
Markedly increased or reduced turbidity
Major changes in turbidity over wide or
solids
and
in streams and/or receiving riverine and
in small areas of streams and/or receiving
ecologically significant areas resulting
"The adverse effects of
No evidence of turbidity plumes or
marine environments but without major
riverine and marine environments; or
in markedly changed biodiversity or
modified rates of release
increased siltation; and
changes in associated sedimentation or
Extensive evidence of changes in
mortality in benthic species due to
of suspended particulate No evidence of progressive riverbank,
erosion rates, mortality or diversity of flora
sedimentation or erosion rates; or
excessive sedimentation with or without
matter to water bodies
beach, other coastal or deltaic erosion.
and fauna; or
Changes in benthic or pelagic biodiversity
concomitant changes in the nature of
resulting from human
Some evidence of changes in benthic or
in areas due to sediment blanketing or
deposited sediments (i.e., grain-size
activities"
pelagic biodiversity in some areas due
increased turbidity.
composition/redox); or
to sediment blanketing or increased
Major change in pelagic biodiversity or
turbidity.
mortality due to excessive turbidity.
Issue 8: Solid wastes
No noticeable interference with trawling
Some evidence of marine-derived litter on
Widespread litter on beaches giving rise to
Incidence of litter on beaches sufficient
"Adverse effects
activities; and
beaches; or
public concerns regarding the recreational
to deter the public from recreational
associated with the
No noticeable interference with the
Occasional recovery of solid wastes
use of beaches; or
activities; or
introduction of solid
recreational use of beaches due to litter;
through trawling activities; but
High frequencies of benthic litter recovery
Trawling activities untenable because of
waste materials into
and
Without noticeable interference with
and interference with trawling activities;
benthic litter and gear entanglement; or
water bodies or their
No reported entanglement of aquatic
trawling and recreational activities in
or
Widespread entanglement and/or
environs."
organisms with debris.
coastal areas.
Frequent reports of entanglement/
suffocation of aquatic species by litter.
suffocation of species by litter.
Issue 9: Thermal
No thermal discharges or evidence of
Presence of thermal discharges but
Presence of thermal discharges with large
Presence of thermal discharges with large
"The adverse effects
thermal effluent effects.
without noticeable effects beyond
mixing zones having reduced productivity
mixing zones with associated mortalities,
of the release of
the mixing zone and no significant
or altered biodiversity; or
substantially reduced productivity or
aqueous effluents at
interference with migration of species.
Evidence of reduced migration of species
noticeable changes in biodiversity; or
temperatures exceeding
due to thermal plume.
Marked reduction in the migration of
ambient temperature
species due to thermal plumes.
in the receiving water
body."
Issue 10: Radionuclide No radionuclide discharges or nuclear
Minor releases or fallout of radionuclides
Minor releases or fallout of radionuclides
Substantial releases or fallout of
"The adverse effects of
activities in the region.
but with well regulated or well-managed
under poorly regulated conditions that do
radionuclides resulting in excessive
the release of radioactive
conditions complying with the Basic Safety
not provide an adequate basis for public
exposures to humans or animals in relation
contaminants and
Standards.
health assurance or the protection of
to those recommended under the Basic
wastes into the aquatic
aquatic organisms but without situations
Safety Standards; or
environment from
or levels likely to warrant large scale
Some indication of situations or exposures
human activities."
intervention by a national or international
warranting intervention by a national or
authority.
international authority.
Issue 11: Spills
No evidence of present or previous spills of
Some evidence of minor spills of hazardous Evidence of widespread contamination
Widespread contamination by hazardous
"The adverse effects
hazardous material; or
materials in small areas with insignificant
by hazardous or aesthetically displeasing
or aesthetically displeasing materials
of accidental episodic
No evidence of increased aquatic or avian
small-scale adverse effects one aquatic or
materials assumed to be from spillage
from frequent spills resulting in major
releases of contaminants
species mortality due to spills.
avian species.
(e.g. oil slicks) but with limited evidence of
interference with aquatic resource
and materials to the
widespread adverse effects on resources or
exploitation or coastal recreational
aquatic environment
amenities; or
amenities; or
as a result of human
Some evidence of aquatic or avian species
Significant mortality of aquatic or avian
activities."
mortality through increased presence of
species as evidenced by large numbers of
contaminated or poisoned carcasses on
contaminated carcasses on beaches.
beaches.
THE GIWA METHODOLOGY
xiii
Table 5c: Scoring criteria for environmental impacts of Habitat and community modification
Issue
Score 0 = no known impact
Score 1 = slight impact
Score 2 = moderate impact
Score 3 = severe impact
Issue 12: Loss of ecosystems or
There is no evidence of loss of
There are indications of fragmentation Permanent destruction of at least one
Permanent destruction of at least one
ecotones
ecosystems or habitats.
of at least one of the habitats.
habitat is occurring such as to have
habitat is occurring such as to have
"The complete destruction of aquatic
reduced their surface area by up to 30
reduced their surface area by >30%
habitats. For the purpose of GIWA
% during the last 2-3 decades.
during the last 2-3 decades.
methodology, recent loss will be
measured as a loss of pre-defined
habitats over the last 2-3 decades."
Issue 13: Modification of
No evidence of change in species
Evidence of change in species
Evidence of change in species
Evidence of change in species
ecosystems or ecotones, including
complement due to species extinction
complement due to species extinction
complement due to species extinction
complement due to species extinction
community structure and/or species
or introduction; and
or introduction
or introduction; and
or introduction; and
composition
No changing in ecosystem function
Evidence of change in population
Evidence of change in population
"Modification of pre-defined habitats
and services.
structure or change in functional group
structure or change in functional group
in terms of extinction of native species,
composition or structure
composition or structure; and
occurrence of introduced species and
Evidence of change in ecosystem
changing in ecosystem function and
services2.
services over the last 2-3 decades."
2 Constanza, R. et al. (1997). The value of the world ecosystem services and natural capital, Nature 387:253-260.
Table 5d: Scoring criteria for environmental impacts of Unsustainable exploitation of fish and other
living resources
Issue
Score 0 = no known impact
Score 1 = slight impact
Score 2 = moderate impact
Score 3 = severe impact
Issue 14: Overexploitation
No harvesting exists catching fish
Commercial harvesting exists but there One stock is exploited beyond MSY
More than one stock is exploited
"The capture of fish, shellfish or marine
(with commercial gear for sale or
is no evidence of over-exploitation.
(maximum sustainable yield) or is
beyond MSY or is outside safe
invertebrates at a level that exceeds the
subsistence).
outside safe biological limits.
biological limits.
maximum sustainable yield of the stock."
Issue 15: Excessive by-catch and
Current harvesting practices show no
Up to 30% of the fisheries yield (by
30-60% of the fisheries yield consists
Over 60% of the fisheries yield is
discards
evidence of excessive by-catch and/or
weight) consists of by-catch and/or
of by-catch and/or discards.
by-catch and/or discards; or
"By-catch refers to the incidental capture
discards.
discards.
Noticeable incidence of capture of
of fish or other animals that are not the
endangered species.
target of the fisheries. Discards refers
to dead fish or other animals that are
returned to the sea."
Issue 16: Destructive fishing
No evidence of habitat destruction due Habitat destruction resulting in
Habitat destruction resulting in
Habitat destruction resulting in
practices
to fisheries practices.
changes in distribution of fish or
moderate reduction of stocks or
complete collapse of a stock or far
"Fishing practices that are deemed to
shellfish stocks; or
moderate changes of the environment;
reaching changes in the environment;
produce significant harm to marine,
Trawling of any one area of the seabed
or
or
lacustrine or coastal habitats and
is occurring less than once per year.
Trawling of any one area of the seabed
Trawling of any one area of the seabed
communities."
is occurring 1-10 times per year; or
is occurring more than 10 times per
Incidental use of explosives or poisons
year; or
for fishing.
Widespread use of explosives or
poisons for fishing.
Issue 17: Decreased viability of
No evidence of increased incidence of
Increased reports of diseases without
Declining populations of one or more
Collapse of stocks as a result of
stocks through contamination and
fish or shellfish diseases.
major impacts on the stock.
species as a result of diseases or
diseases or contamination.
disease
contamination.
"Contamination or diseases of feral (wild)
stocks of fish or invertebrates that are a
direct or indirect consequence of human
action."
Issue 18: Impact on biological and
No evidence of deliberate or accidental Alien species introduced intentionally
Measurable decline in the population
Extinction of native species or local
genetic diversity
introductions of alien species; and
or accidentally without major changes
of native species or local stocks as a
stocks as a result of introductions
"Changes in genetic and species diversity No evidence of deliberate or accidental
in the community structure; or
result of introductions (intentional or
(intentional or accidental); or
of aquatic environments resulting from
introductions of alien stocks; and
Alien stocks introduced intentionally
accidental); or
Major changes (>20%) in the genetic
the introduction of alien or genetically
No evidence of deliberate or accidental
or accidentally without major changes
Some changes in the genetic
composition of stocks (e.g. as a result
modified species as an intentional or
introductions of genetically modified
in the community structure; or
composition of stocks (e.g. as a result
of escapes from aquaculture replacing
unintentional result of human activities
species.
Genetically modified species
of escapes from aquaculture replacing
the wild stock).
including aquaculture and restocking."
introduced intentionally or
the wild stock).
accidentally without major changes in
the community structure.
xiv
REGIONAL ASSESSMENTS
Table 5e: Scoring criteria for environmental impacts of Global change
Issue
Score 0 = no known impact
Score 1 = slight impact
Score 2 = moderate impact
Score 3 = severe impact
Issue 19: Changes in hydrological
No evidence of changes in hydrological Change in hydrological cycles due
Significant trend in changing
Loss of an entire habitat through
cycle and ocean circulation
cycle and ocean/coastal current due to
to global change causing changes
terrestrial or sea ice cover (by
desiccation or submergence as a result
"Changes in the local/regional water
global change.
in the distribution and density of
comparison with a long-term time
of global change; or
balance and changes in ocean and coastal
riparian terrestrial or aquatic plants
series) without major downstream
Change in the tree or lichen lines; or
circulation or current regime over the
without influencing overall levels of
effects on river/ocean circulation or
Major impacts on habitats or
last 2-3 decades arising from the wider
productivity; or
biological diversity; or
biodiversity as the result of increasing
problem of global change including
Some evidence of changes in ocean
Extreme events such as flood and
frequency of extreme events; or
ENSO."
or coastal currents due to global
drought are increasing; or
Changing in ocean or coastal currents
change but without a strong effect on
Aquatic productivity has been altered
or upwelling regimes such that plant
ecosystem diversity or productivity.
as a result of global phenomena such
or animal populations are unable to
as ENSO events.
recover to their historical or stable
levels; or
Significant changes in thermohaline
circulation.
Issue 20: Sea level change
No evidence of sea level change.
Some evidences of sea level change
Changed pattern of coastal erosion due Major loss of coastal land areas due to
"Changes in the last 2-3 decades in the
without major loss of populations of
to sea level rise has became evident; or
sea-level change or sea-level induced
annual/seasonal mean sea level as a
organisms.
Increase in coastal flooding events
erosion; or
result of global change."
partly attributed to sea-level rise
Major loss of coastal or intertidal
or changing prevailing atmospheric
populations due to sea-level change or
forcing such as atmospheric pressure
sea level induced erosion.
or wind field (other than storm
surges).
Issue 21: Increased UV-B radiation as No evidence of increasing effects
Some measurable effects of UV/B
Aquatic community structure is
Measured/assessed effects of UV/B
a result of ozone depletion
of UV/B radiation on marine or
radiation on behavior or appearance of
measurably altered as a consequence
irradiation are leading to massive loss
"Increased UV-B flux as a result polar
freshwater organisms.
some aquatic species without affecting
of UV/B radiation; or
of aquatic communities or a significant
ozone depletion over the last 2-3
the viability of the population.
One or more aquatic populations are
change in biological diversity.
decades."
declining.
Issue 22: Changes in ocean CO
No measurable or assessed changes
Some reasonable suspicions that
Some evidences that the impacts
Evidences that the changes in
2
source/sink function
in CO source/sink function of aquatic
current global change is impacting the
of global change have altered the
source/sink function of the aquatic
2
"Changes in the capacity of aquatic
system.
aquatic system sufficiently to alter its
source/sink function for CO of aquatic
systems in the region are sufficient to
2
systems, ocean as well as freshwater, to
source/sink function for CO .
systems in the region by at least 10%.
cause measurable change in global CO
2
2
generate or absorb atmospheric CO as a
balance.
2
direct or indirect consequence of global
change over the last 2-3 decades."
THE GIWA METHODOLOGY
xv
