

Global International
Waters Assessment
Regional assessments
Other reports in this series:
Russian Arctic ş GIWA Regional assessment 1a
Caribbean Sea/Small Islands ş GIWA Regional assessment 3a
Caribbean Islands ş GIWA Regional assessment 4
Barents Sea ş GIWA Regional assessment 11
Baltic Sea ş GIWA Regional assessment 17
Caspian Sea ş GIWA Regional assessment 23
Aral Sea ş GIWA Regional assessment 24
Gulf of California/Colorado River Basin ş GIWA Regional assessment 27
Oyashio Current ş GIWA Regional assessment 31
Yellow Sea ş GIWA Regional assessment 34
East China Sea ş GIWA Regional assessment 36
Patagonian Shelf ş GIWA Regional assessment 38
Brazil Current ş GIWA Regional assessment 39
Amazon Basin ş GIWA Regional assessment 40b
Canary Current ş GIWA Regional assessment 41
Guinea Current ş GIWA Regional assessment 42
Lake Chad Basin ş GIWA Regional assessment 43
Benguela Current ş GIWA Regional assessment 44
Indian Ocean Islands ş GIWA Regional assessment 45b
East African Rift Valley Lakes ş GIWA Regional assessment 47
South China Sea ş GIWA Regional assessment 54
Mekong River ş GIWA Regional assessment 55
Sulu-Celebes (Sulawesi) Sea ş GIWA Regional assessment 56
Indonesian Seas ş GIWA Regional assessment 57
Pacifi c Islands ş GIWA Regional assessment 62
Humboldt Current ş GIWA Regional assessment 64
Global International
Waters Assessment
Regional assessment 30
Sea of Okhotsk
GIWA report production
Series editor: Ulla Li Zweifel
Editorial assistance: Matthew Fortnam,
Russel Arthurton, Kristin Bertilius
Maps & GIS: Rasmus G÷ransson
Design & graphics: Joakim Palmqvist
Global International Waters Assessment
Sea of Okhotsk, GIWA Regional assessment 30
Published by the University of Kalmar on behalf of
United Nations Environment Programme
ę 2006 United Nations Environment Programme
ISSN 1651-940X
University of Kalmar
SE-391 82 Kalmar
Sweden
United Nations Environment Programme
PO Box 30552,
Nairobi, Kenya
This publication may be reproduced in whole or in part and
in any form for educational or non-profi t purposes without
special permission from the copyright holder, provided
acknowledgement of the source is made. No use of this
publication may be made for resale or for any other commercial
purpose whatsoever without prior permission in writing from the
United Nations Environment Programme.
CITATIONS
When citing this report, please use:
UNEP, 2006. Alekseev, A.V., Baklanov, P.J., Arzamastsev, I.S.,
Blinov, Yu.G., Fedorovskii, A.S., Kachur, A.N., Khrapchenkov, F.F.,
Medvedeva, I.A., Minakir, P.A., Titova, G.D., Vlasov, A.V., Voronov,
B.A. and H. Ishitobi. Sea of Okhotsk, GIWA Regional assessment 30.
University of Kalmar, Kalmar, Sweden.
DISCLAIMER
The views expressed in this publication are those of the authors
and do not necessarily refl ect those of UNEP. The designations
employed and the presentations do not imply the expressions
of any opinion whatsoever on the part of UNEP or cooperating
agencies concerning the legal status of any country, territory,
city or areas or its authority, or concerning the delimitation of its
frontiers or boundaries.
This publication has been peer-reviewed and the information
herein is believed to be reliable, but the publisher does not
warrant its completeness or accuracy.
Publishing house: Kirjastusaktsiaselts MATS, Tallinn
Printed in Estonia by Tallinna RaamatutrŘkikoda, 2006
Contents
Executive summary
9
Abbreviations and acronyms
12
Regional defi nition
14
Boundaries of the Sea of Okhotsk region
14
Physical characteristics
15
Socio-economic characteristics
18
Assessment 24
Freshwater shortage
24
Pollution
25
Habitat and community modifi cation
28
Unsustainable exploitation of fi sh and other living resources
30
Global change
32
Priority concerns for further analysis
32
Causal chain analysis
33
Eutrophication
33
Oil spills
35
Overexploitation of fi sh and other living resources
36
Policy options
39
Eutrophication in the Amur River Basin sub-system
39
Oil spills in the Okhotsk Sea sub-system
40
Overexploitation of fi sh and other living resource in the Sea of Okhotsk region
42
Conclusions and recommendations
44
Recommendations
45
References 46
Annexes 49
Annex I List of contributing authors and organisations
49
Annex II Detailed scoring tables
51
The Global International Waters Assessment
i
The GIWA methodology
vii
CONTENTS
Executive summary
The GIWA Sea of Okhotsk region comprises the Okhotsk Sea and its
and unique ecosystems. The River supports more fi sh species than any
surrounding catchments, the largest of which, by far, is the Amur River
other Russian river, with more than 120 species, 18 of which are endemic
Basin ş a transboundary basin shared between China, Mongolia, Russia
and eight endangered. The Basin's territory is socially, politically and
and North Korea. Other basins draining into the Okhotsk Sea include
economically diverse, with varying development patterns. These
those of the Khabarovskiy Kray, Magadanskaya and Kamchatskaya
diff erences can be an obstacle to international cooperation in the
oblasts in Russia.
Basin.
For the purpose of this report, the Sea of Okhotsk region can be divided
The population of the Okhotsk Sea sub-system is approximately
into two sub-systems: the Okhotsk Sea (marine) and the Amur River
8.7 million, of which 2.7 million live in Russia and about 6 million
Basin (freshwater).
in Japan. The Russian coast, except for Sakhalin Island, is sparsely
populated, with a population density of approximately 1.5 people per
The Okhotsk Sea sub-system has an area of approximately 1.6 million km2
km▓. The population of the Amur River Basin sub-system fl uctuates
and a coastline 10 460 km in length. More than 95% of the coast of the
between 70 and 80 million people, 5 million of whom live in Russia, 65-
Sea lies within Russian territory, with Hokkaido Island (Japan) accounting
75 million in China and less than 50 000 in Mongolia. The North Korean
for the remainder. The Sea contains over 50% of the Russian Far East's
part of the Basin is largely unpopulated. The Basin's average population
bio-resources and is regarded as the richest fi shery region in the world,
density is 35 people/km▓, though 105 people/km▓ in the catchment
with approxi mately 340 fi sh species. Its continental shelves are rich
of the Songhua River (a tributary of the Amur River in China) which
in hydrocarbon resources. Although the majority of the Sea is within
includes large cities such as Harbin, Jilin and Mudanjiang.
Russia's exclusive economic zone (EEZ), its centre is high seas (neutral
zone), and its southeastern part, adjacent to Hokkaido Island, lies within
This report presents the results of the UNEP/Global International Waters
Japanese territorial waters. The Sea's coast is generally characterised by
Assessment for the Sea of Okhotsk region (GIWA region 30). It is based
mountainous relief which demarks the watershed ş a narrow land belt
on the outputs of three workshops, conducted in Vladivostok, Russia,
100-150 km wide.
in 2001, 2003 and 2004 respectively. The Task team consisted of local
experts with various specialist backgrounds regarding environmental
The sub-system Amur River Basin ş known in China as the Heilong Jiang
and socio-economic impact assessments in the Sea of Okhotsk region.
ş is one of the largest river systems in Asia, covering about 2 million km▓.
The results are the consensus of the team and other participants of the
The River is one of the ten longest in the world (approximately
workshops (see Annex I) and are substantiated using data obtained from
4 345 km) and its course forms the boundary between Russia and
a number of sources, including international and national programmes
China for 3 000 km. The average annual discharge of the Amur River is
and projects operating within the region. For the Amur River Basin sub-
369 km│. The Amur River Basin hosts some of the world's most diverse
system, this report assesses only the Russian territory and two of the
and productive habitats and encompasses extensive areas of complex
riparian provinces of China (Heilongjiang and Jilin).
EXECUTIVE SUMMARY
9
During the Scaling and scoping workshop, the experts prioritised the
and China, threatening biological diversity and endangered species in
GIWA major concerns in the following rank order:
the Basin, notably several migratory bird species.
1 Pollution
2
Unsustainable exploitation of fi sh and other living resources
The immediate causes of eutrophication in the Amur River Basin
3 Freshwater
shortage
sub-system were identifi ed as the considerable quantities of organic
4
Habitat and community modifi cation
matter and biogenic material in domestic and industrial wastewaters
5 Global
change
and surface run-off . Run-off of fertilisers from agricultural areas also
stimulates eutrophication. The sectors responsible for eutrophication
The priority concerns were identifi ed as Pollution, specifi cally the issue
were identifi ed as industry, urbanisation, agriculture and aquaculture. Oil
of eutrophication (for the Amur River Basin sub-system) and oil spills (for
development on the Russian Sakhalin shelf has increased the intensity
Okhotsk Sea sub-system), and the Unsustainable exploitation of fi sh and
of oil-related marine traffi
c transiting the Okhotsk Sea. Although there
other living resources (for the whole Sea of Okhotsk region).
have been relatively few incidents to date, there is always a risk of a spill
through deliberate or accidental discharges. Oil is also discharged by the
In the Okhotsk Sea sub-system, oil and gas exploitation provides
numerous fi shing vessels operating on the Sea. Overfi shing is aff ecting
economic benefi ts for the region but discharges signifi cant quantities
the ecosystems of the Sea of Okhotsk region. Fish catches have declined
of wastewater as by-products of drilling operations. Although only
by one-third due to depleted fi sh stocks. The main cause of the stock
three major oil spills have occurred in the region since the 1990s, the
depletion is overexploitation where the Total Allowable Catches (TACs)
future expansion of the oil industry in the region will increase the risk
of Russia are exceeded by 2 to 10 times.
of spills. In the Amur River Basin, eutrophication has been attributed to
nutrient enrichment caused by the discharge of domestic wastewater
In the future, these aquatic concerns will remain the most signifi cant
and surface run-off from the catchment area. It is expected to increase
anthropogenic threats to the region. Mitigatory actions should include:
in severity over the next 20 years, with the communities of the lower
waste control and treatment in the Amur River Basin sub-system; the
Amur River Basin and Songhua River Basin experiencing the greatest
prevention of oil spills and the development of emergency response
socio-economic impacts. A signifi cant proportion of chemical pollution
measures; and sustainable fi sheries management.
originates from pesticides used in the agricultural sector, as well as
heavy metals released by other human activities.
In the Amur River Basin sub-system, there are a number of
institutional weaknesses which are either promoting or failing to
Over the past 15 years, total fi sh catches in the Sea of Okhotsk have
prevent transboundary pollution. While there is limited basin-wide
drastically reduced. Catches of pollock ş the major commercial species
cooperation, there is recognition of the need to work together to
in the Okhotsk Sea sub-system ş have decreased signifi cantly, though
address transboundary issues. There is limited stakeholder involvement
estimating total catches is extremely diffi
cult. In the Amur River Basin
in the decision-making process and public awareness of pollution issues
sub-system, stocks of salmon and sturgeon have declined as a result of
is rather rudimentary. A major hindrance for policy-makers when setting
overfi shing and the degradation of spawning habitats. The problem is
priorities for remediation is the lack of knowledge of the ecological
exacerbated by inappropriate fi shing practices as well as adverse natural
characteristics and their reaction to human activities. A technical
conditions. It is expected that salmon will continue to be overfi shed for
problem is the poor condition of wastewater treatment infrastructure.
the foreseeable future.
In the Sea of Okhotsk region, overcapacity of the fi shing fl eet is a
The concern of Habitat and community modifi cation was assessed as
major factor in the overexploitation of the region's commercial stocks.
having a slight impact. In the Okhotsk Sea, human activities have altered
The introduction of auctions of fi sh quota-rights, in addition to a
the habitats of pollock, Humpback whale and the endangered Gray
burdensome tax system, has reduced the profi tability of the fi sheries,
whale, among other species. Whales are threatened by the increasing
resulting in fi shermen undertaking poaching and illegal fi shing to
exploration and extraction of marine oil and gas reserves. Habitat and
supply a black market for fi sh products. Regional cooperation in
community modifi cation is expected to increase in severity in the future
combating illegal fi shing is limited and national laws and regulations
due to further oil and gas development, which will also necessitate the
are undermined by deep-rooted corruption and weak enforcement.
development of bulk-oil complexes and harbours for large tankers. In
There is a lack of fi sheries statistics and monitoring programmes, and
the Amur River Basin, the extent of wetlands has declined in both Russia
fi shermen lack awareness of the long-term impacts of overfi shing.
10
GIWA REGIONAL ASSESSMENT 30 SEA OF OKHOTSK
Oil spills in the Okhotsk sub-system were considered to be a
The Policy options recommended to address the water-related problems
considerable future threat because, although there has been rather
of the Sea of Okhotsk region are based on the policies adopted at the
limited oil contamination to date, the extensive oil and gas development,
United Nations Conference on Environment and Development (UNCED)
particularly on the continental shelf of Sakhalin (Russia), and increased
and the World Summit on Sustainable Development (WSSD). Russian
shipment of oil across the Sea, will signifi cantly increase the risk of spills.
environmental and development legislation was also considered
While there has been considerable eff ort in rapidly developing the oil
during their formulation. The measures discussed in the conclusions
and gas industry in the region, progress in establishing emergency
and recommendations of this report not only aim to preserve and
contingency plans was considered unsatisfactory.
rehabilitate aquatic ecosystems in the region, but also to prevent future
eutrophication, oil spills and overexploitation of fi sh resources.
EXECUTIVE SUMMARY
11
Abbreviations and acronyms
BOD Biochemical
Oxygen
Demand
CCA
Causal Chain Analysis
CITES
Convention on International Trade in Endangered Species of Wild Flora and Fauna
DDT Dichlorodiphenyltrichloroethane
EEZ Exclusive
Economic
Zone
EIA
Environmental Impact Assessment
FAO
Food and Agriculture Organization of the United Nations
FEB RAS Far East Branch of Russian Academy of Sciences
GDP Gross
Domestic
Product
GEF Global
Environment
Facility
GIWA
Global International Waters Assessment
GRP Gross
Regional
Product
HCCH Hexachlorocyclohexane
IUCN
The World Conservation Union
MARPOL International Convention for the Prevention of Pollution of Sea by Oil
PICES North
Pacifi
c
Marine
Science
Organization
RSFSR
Russian Soviet Federated Socialist Republic
SOC Stable
Organic
Compounds
TAC Total
Allowable
Catch
TINRO
Pacifi c Scientifi c Research Institute of Fisheries and Oceanography
UNCED
United Nations Conference on Environment and Development
UNCLOS United Nations Convention on the Law of the Sea
UNEP
United Nations Environment Programme
USD United
States
Dollar
USSR
Union of Soviet Socialist Republics
WSSD
World Summit on Sustainable Development
WWF World
Wildlife
Fund
12
GIWA REGIONAL ASSESSMENT 30 SEA OF OKHOTSK
List of figures
Figure 1
Boundaries of the GIWA Sea of Okhotsk region.. . . . . . . . . . . . . . . . . . . . . . . . . . . . . . . . . . . . . . . . . . . . . . . . . . . . . . . . . . . . . . . . . . . . . . . . . . . . . . . . . . . . . . . . . . . . . . . . . . . . . . . . . . . . . . . . . 14
Figure 3
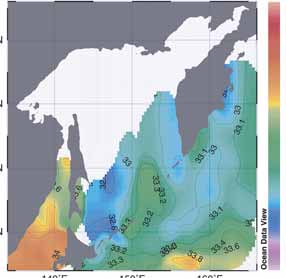
Sea surface water temperatures in February and August. . . . . . . . . . . . . . . . . . . . . . . . . . . . . . . . . . . . . . . . . . . . . . . . . . . . . . . . . . . . . . . . . . . . . . . . . . . . . . . . . . . . . . . . . . . . . . . . . . . . . . . 16
Figure 2
General water circulation. . . . . . . . . . . . . . . . . . . . . . . . . . . . . . . . . . . . . . . . . . . . . . . . . . . . . . . . . . . . . . . . . . . . . . . . . . . . . . . . . . . . . . . . . . . . . . . . . . . . . . . . . . . . . . . . . . . . . . . . . . . . . . . . . . . . . . 16
Figure 4
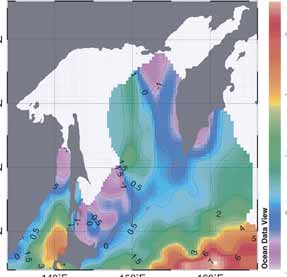
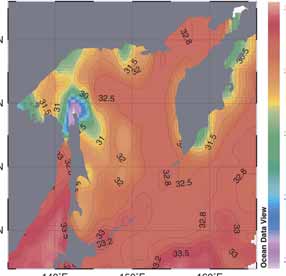
Salinity of surface water in February and August.. . . . . . . . . . . . . . . . . . . . . . . . . . . . . . . . . . . . . . . . . . . . . . . . . . . . . . . . . . . . . . . . . . . . . . . . . . . . . . . . . . . . . . . . . . . . . . . . . . . . . . . . . . . . . . . 17
Figure 5
Population density of the Sea of Okhotsk region. . . . . . . . . . . . . . . . . . . . . . . . . . . . . . . . . . . . . . . . . . . . . . . . . . . . . . . . . . . . . . . . . . . . . . . . . . . . . . . . . . . . . . . . . . . . . . . . . . . . . . . . . . . . . . . 18
Figure 6
Distribution of industries in the Sea of Okhotsk Basin. . . . . . . . . . . . . . . . . . . . . . . . . . . . . . . . . . . . . . . . . . . . . . . . . . . . . . . . . . . . . . . . . . . . . . . . . . . . . . . . . . . . . . . . . . . . . . . . . . . . . . . . . . . 19
Figure 7
Oil production volumes. . . . . . . . . . . . . . . . . . . . . . . . . . . . . . . . . . . . . . . . . . . . . . . . . . . . . . . . . . . . . . . . . . . . . . . . . . . . . . . . . . . . . . . . . . . . . . . . . . . . . . . . . . . . . . . . . . . . . . . . . . . . . . . . . . . . . . . . 20
Figure 8
Areas of prospective development of the oil and gas fields in the Sea of Okhotsk region. . . . . . . . . . . . . . . . . . . . . . . . . . . . . . . . . . . . . . . . . . . . . . . . . . . . . . . . . . . . . . . . . . . . . . . . 20
Figure 9
Natural resources of the Sea of Okhotsk sub-system.. . . . . . . . . . . . . . . . . . . . . . . . . . . . . . . . . . . . . . . . . . . . . . . . . . . . . . . . . . . . . . . . . . . . . . . . . . . . . . . . . . . . . . . . . . . . . . . . . . . . . . . . . . . . 21
Figure 10
Catches of commercial fish by the Russian fleet in the Okhotsk Sea.. . . . . . . . . . . . . . . . . . . . . . . . . . . . . . . . . . . . . . . . . . . . . . . . . . . . . . . . . . . . . . . . . . . . . . . . . . . . . . . . . . . . . . . . . . . . . 21
Figure 11
Distribution of anthropogenic pressures in the Sea of Okhotsk Basin. . . . . . . . . . . . . . . . . . . . . . . . . . . . . . . . . . . . . . . . . . . . . . . . . . . . . . . . . . . . . . . . . . . . . . . . . . . . . . . . . . . . . . . . . . . 28
Figure 12
Synergies and inter-linkages between the GIWA concerns. . . . . . . . . . . . . . . . . . . . . . . . . . . . . . . . . . . . . . . . . . . . . . . . . . . . . . . . . . . . . . . . . . . . . . . . . . . . . . . . . . . . . . . . . . . . . . . . . . . . . . 32
Figure 13
Causal chain diagram illustrating the causal links for eutrophication in the Amur River Basin. . . . . . . . . . . . . . . . . . . . . . . . . . . . . . . . . . . . . . . . . . . . . . . . . . . . . . . . . . . . . . . . . . 34
Figure 14
Causal chain diagram illustrating the causal links for oil spills in the Sea of Okhotsk. . . . . . . . . . . . . . . . . . . . . . . . . . . . . . . . . . . . . . . . . . . . . . . . . . . . . . . . . . . . . . . . . . . . . . . . . . . 36
Figure 15
Causal chain diagram illustrating the causal links for overexploitation in the Sea of Okhotsk region. . . . . . . . . . . . . . . . . . . . . . . . . . . . . . . . . . . . . . . . . . . . . . . . . . . . . . . . . . . 38
List of tables
Table 1
Basic hydrological and water quality characteristics of the Amur River . . . . . . . . . . . . . . . . . . . . . . . . . . . . . . . . . . . . . . . . . . . . . . . . . . . . . . . . . . . . . . . . . . . . . . . . . . . . . . . . . . . . . . . . . 17
Table 2
Basic economic characteristics of the administrative regions of the Sea of Okhotsk basin. . . . . . . . . . . . . . . . . . . . . . . . . . . . . . . . . . . . . . . . . . . . . . . . . . . . . . . . . . . . . . . . . . . . . . . 19
Table 3
Sectoral structure of industrial output in the Far East of Russia in 2000. . . . . . . . . . . . . . . . . . . . . . . . . . . . . . . . . . . . . . . . . . . . . . . . . . . . . . . . . . . . . . . . . . . . . . . . . . . . . . . . . . . . . . . . . 19
Table 4
Consumption of freshwater in the Russian adminstrative regions of the Okhotsk sea. . . . . . . . . . . . . . . . . . . . . . . . . . . . . . . . . . . . . . . . . . . . . . . . . . . . . . . . . . . . . . . . . . . . . . . . . . . 22
Table 5
Scoring table for Sea of Okhotsk. . . . . . . . . . . . . . . . . . . . . . . . . . . . . . . . . . . . . . . . . . . . . . . . . . . . . . . . . . . . . . . . . . . . . . . . . . . . . . . . . . . . . . . . . . . . . . . . . . . . . . . . . . . . . . . . . . . . . . . . . . . . . . . 24
Table 6
Water discharge and chemical composition of water near the mouth of the Amur River . . . . . . . . . . . . . . . . . . . . . . . . . . . . . . . . . . . . . . . . . . . . . . . . . . . . . . . . . . . . . . . . . . . . . . . 25
Table 7
Concentrations of various dissolved and suspended metals in the Amur River . . . . . . . . . . . . . . . . . . . . . . . . . . . . . . . . . . . . . . . . . . . . . . . . . . . . . . . . . . . . . . . . . . . . . . . . . . . . . . . . . 26
Table 8
Catches of commercial fish from the Sea of Okhotsk between 1992 and 2003 . . . . . . . . . . . . . . . . . . . . . . . . . . . . . . . . . . . . . . . . . . . . . . . . . . . . . . . . . . . . . . . . . . . . . . . . . . . . . . . . . . 30
ABBREVIATIONS AND ACRONYMS
13


Regional defi nition
This section describes the boundaries and the main physical and
Boundaries of the Sea of
socio-economic characteristics of the region in order to defi ne the
Okhotsk region
area considered in the regional GIWA Assessment and to provide
suffi
cient background information to establish the context within
The GIWA Sea of Okhotsk region comprises the Okhotsk Sea sub-
which the assessment was conducted.
system and its surrounding catchments (Figure 1), the largest of which,
by far, is the Amur River Basin sub-system ş a transboundary basin
Uttyakh
Chukotskiy avtonomnyy okrug
Elevation/
ve
Ev
Ev ki
kiy
y
enkiyskiy a
Penzhina
Depth (m)
Oklan
Koryakskiy avtonomnyy okrug
4 000
Krasnoyarskiy kray
Paren'
2 000
Gizhiga
Respublika Sakha(Yakutiya)
Magadanskaya oblast'
1 000
Yakutsk
500
Okh Ku
100
o
Y
k
t
a
a
h
a
m
d
t
Palana
uy U
a
n
l
0
'
Vo
b
eta
e
y
Magadan
ampolk
K
y
In
Kava
a
ya
-50
Tig
a
il'
Urak
-200
Russia
Okhotsk
l'ya
-1 000
U
Irkutsk
ts
t
rkutsk
-2 000
Respublika Buryatiya
Icha
Kamchatskaya oblast'
Ul
Ulan Ude
an Ud
Gulyuy
M
Suchboatar
Chitinskaya oblast'
ay
va
Nercha
Ze
a
Chita
A
iko
rgun'
ya
Selenge
tn
Uda
Shilka
lo
P
Darhan
Chatanga
Ze
Amurskaya
Tov
Aginskoye
Aginskiy
y
oblast'
Buryatskiy
Huma He
a
Ulaanbaatar
Amgun'
Ingoda
avtonomnyy
Selemzdha
Uldz Gol
Onon
okrug
Dzuunmod
Hentiy
G
Dornod
an
Tom'
H
T
e
g
ur
y
Ondorhaan
n
m
Choybalsan
ia
Blagoveshchensk
Khabarovskiy Am
'
J
Ty
kray
r
Dundgovi
Kerulen
xon
Hailar He
en
m
i
Kur
Sakhalinskaya
Or
Y
a
Gol
rm
a
U
oblast'
Mongolia
Bureya
N
C
l
h
u
Nemo
Baruun Urt
a
H
r He
Birobidzhan
o
e
Saynshand
Heilongjiang
r
Yevreyskaya
Suhbaatar
H
Nuyur
e
avtonomnaya oblast'
Khabarovsk
K
Dornogovi
h
China
Qiqihar
or
Hulan He
Yuzhno-Sakhalinsk
ri
Songhua Jiang
Songhua Jiang
ssu
Bikin
U
LHarbin
g
Armu
Nei Mongol
a
n
li
ia
Muling He
Primorskiy
Jilin
n
J
H
kray
Baotou
e
I
l
Changchun
udan
i
Huhot
s
M
t
ri
a
Jilin
ya
ssu
U
Er
Japan
Hebei
d aoJ
Fushun
ia
Vladivostok
Hokkaido
n
0
500 km
Liaoning
Yinma He
Shanxi
Beijing
Sapporo
Ch'ongjin
Anshan
Figure 1
Boundaries of the GIWA Sea of Okhotsk region.
14
GIWA REGIONAL ASSESSMENT 30 SEA OF OKHOTSK
100-300 km in width and shared between China, Mongolia, Russia and
Changes to the distribution and interactions of baric formations, as well
North Korea. Other basins draining into the Okhotsk Sea include those
as the Sea's position between continental Asia and the Pacifi c Ocean,
of the Khabarovskiy Kray, Magadanskaya and Kamchatskaya oblasts in
are major factors forming the monsoonal climate and Sea's hydrological
Russia.
conditions. The dominant meteorological features that determine
atmospheric circulation in the region are the Aleutian Low, North Pacifi c
The Okhotsk Sea is situated at the margin of the northwestern Pacifi c
High and Siberian anticyclone in winter, and the Far-Eastern depression
Ocean between 43░43' and 62░42' N, and 135░10' and 164░54' E. It is
and Okhotsk anticyclone in summer. The generally monsoonal climatic
separated from the open ocean by the chain of the Kuril Islands and the
conditions are often disturbed by cyclones which traverse the region
Kamchatka Peninsula. The Sea's limits are demarked by Hokkaido Island
from southwest to northeast. The winter, particularly in the northern
to the south and west, and the coast of Sakhalin and the Asian mainland
Sea, is long and severe, with frequent wind and snow storms. In the
to the east. The Sea's maximum length and width are 2 463 km and
summer, high precipitation rates, mist and fog are typical, whereas
1 500 km, respectively. It has an area of approximately 1.6 million km2, a
the spring and autumn seasons are short, cold and cloudy. The cold
coastline 10 460 km in length and a total water volume of approximately
period lasts 120-130 days in the south and 210-220 days in the north
1.3 million km3 (Arzamastsev et al. 2001). The Okhotsk Sea is connected
of the region (Rostov et al. 2002). The cool, northern air masses have
to the Pacifi c Ocean by the numerous straits of the Kuril Islands, to
greater infl uence than the warmer air masses from the south, resulting
the Sea of Japan by La Perouse Strait and to the Amur estuary by the
in a negative heat exchange on the surface. As a result of these distinct
Nevelskoy and Tatar straits. The depth of the sea averages 821 m but
meteorological characteristics, the Okhotsk Sea is the coldest of the
reaches a maximum of between 3 374 m and 3 521 m within the Kuril
Far-Eastern seas.
hollow (Alekseev & Bogdanov 1991, Dobrovol'sky & Zalogin 1982).
From May to September, light southerly winds (2-5 m/s) prevail. These
winds can intensify to over 20 m/s up to four times a year as a result
of cyclones and typhoons, with a maximum frequency from August
Physical characteristics
to September. During the cold season, strong northerly winds with
velocities of 5-10 m/s prevail. Wind speed and direction diff er markedly
Approximately 70% of the region's land is characterised by mountains
in the various areas of the Sea. Maximum wind speeds reach 25-30 m/s
1 000-2 000 m above sea level. Low-lying areas are found mainly in the
in the northeastern and western parts of the Okhotsk Sea, 30-35 m/s in
Kamchatka coastal zone, the Penzhinskaya Gulf and in the middle and
the central and eastern areas, and over 40 m/s in the south. The autumn-
lower reaches of the Amur River. In these regions of low relief there are
winter storm winds are characterised by greater strength and duration
extensive swamps and marshes. The watershed of the Sea of Okhotsk
than those in the summer. The southern and south-eastern areas of
region is formed by the Middle Ridge of the Kamchatka, Koryak and
the Okhotsk Sea are the most prone to unstable weather systems. The
Kolyma highlands, and the Dzugdzur, Stanovoi and Yablonovy ridges.
considerable spatial extent of the Sea, in combination with frequent and
The Sikhote-Alin Mountains separate the Okhotsk Sea from the
strong winds, allows intense seas and swell (waves are 4-11 m high) to
Japanese basins.
develop (Rostov et al. 2002). The hydro-meteorological characteristics
of the region create treacherous conditions for marine-based human
Okhotsk Sea sub-system
activities.
Climate and meteorological characteristics
The Okhotsk Sea sub-system is located within the monsoon climatic
Hydrology
zone of the moderate latitudes. The northern region of the Sea is
The hydrological conditions of the Okhotsk Sea are determined by the
strongly infl uenced by the Arctic climate. Average July temperatures
particularities of its geographical location; its considerable meridional
range from 8 to 16░C, while, in January, temperatures fl uctuate
extent; its vulnerability to severe climatic conditions; the nature of
between 8 and -32░C (Rostov et al. 2002). The Kamchatka coast, the
vertical and horizontal circulation; the seabed relief, and its water
western coast of the Okhotsk Sea and eastern Sakhalin form parts of
exchange with the Pacifi c Ocean and Sea of Japan. The hydrology of
the cold agroclimatic belt. The eastern portion of the Amur River Basin
the coastal waters is additionally infl uenced by continental discharges,
sub-system is within the monsoonal climate zone, whereas its western
tides and the geographic confi guration of the coastline.
portion has continental climatic features.
REGIONAL DEFINITION
15
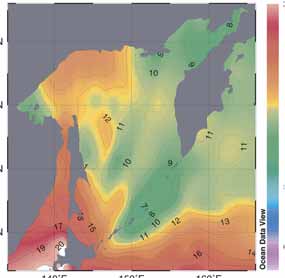
In general, the surface water temperature decreases from south to
north except during certain summer months when a more mixed
pattern is observed (August; Figure 3). Average annual temperatures
in the north and south reach 5-7░C and 2-3░C, respectively. Signifi cant
annual variations of surface water temperatures exist throughout
the Sea (10-19░C) which attenuate with depth. Between May and
Magadan
November, the average monthly water temperatures remain positive.
The warmest waters are found in the southernmost part of the sea
near the La Perouse Strait and Hokkaido Island. In October, the surface
water temperature decreases approximately two-fold and in November
changes to its winter spatial distribution. In February and March, surface
water temperatures of -1.0 to -1.8░C result in a considerable part of the
Uda
Russia
Sea being covered by ice (February; Figure 3) (Rostov et al. 2002). In the
Amgun'
southeastern area of the Sea and to the northwest of the Kuril Islands,
the water temperatures seldom register negative values (PICES 2004).
ur
Am
General cyclonic water circulation occurs around the periphery of the
Khabarovsk
Okhotsk Sea (Figure 2). In addition, there are localised gyres and smaller
Yu
n
h o akhal
k
s
eddies. Stable anti-cyclonic circulation is active over the TINRO hollow, to
ri
ssu
U
the west of the southern extremity of Kamchatka and in close proximity
to the Kuril Hollow fall. The major currents in the region include the
apan
Penzhinskoye, Yamskoye, North-Okhotsk currents and counter-currents,
and the East-Sakhalin, Middle and Soya currents.
Figure 2
General water circulation.
(Source: Arzamastsev et al. 2001)
20
the deepest, 3 000 m and 1 900 m,
February
August
6
respectively (Lapko & Radchenko
60░N
60░N
2000).
15
4
55░N
55░N
The general pattern of water
10
circulation is subject to considerable
2
seasonal variation. In autumn, the
50░N
50░N
fl ow rates of the currents increase,
5
and, in winter, currents fl owing
0
south and southwest are observed
i
ew
i
ew
45░N
V
45░N
V
ta
ta
0
in areas free from sea ice. Periodic
ean Da
ean Da
Oc
Oc
currents have greatest velocity
-2
140░N
150░N
160░N
140░N
150░N
160░N
Figure 3
Sea surface water temperatures in February and August.
in the south and around the
(Source: Arzamastsev et al. 2001)
periphery of the sea, including the
coastal belt, bays, straits and narrow
The straits connecting the Okhotsk Sea to the Sea of Japan and the
waters. Off shore tidal currents are weak, approximately 5-10 cm/s, while
Pacifi c Ocean allow water exchange. The Nevelskoy and La Perouse
tidal currents near the coast, in bays and straits, and over submerged
straits are relatively narrow and shallow, which limits water exchange
shoals are stronger (Zalogin & Kosarev 1999).
with the Sea of Japan. Conversely, the straits of the Kuril Islands ridge
facilitate greater water exchange as they are approximately 500 km wide
Severe winter frosts and sea ice cause intense cooling of sea surface
and are considerably deeper. The Bussol and Kruzenshtern straits are
waters. The sea ice is formed locally, and both stagnant and drift ice are
16
GIWA REGIONAL ASSESSMENT 30 SEA OF OKHOTSK
present. The severity of ice conditions in the Okhotsk Sea is comparable
Amur River Basin sub-system
to the Arctic seas (Lapko & Radchenko 2000). The annual ice period lasts
The sub-system Amur River Basin, known in China as the Heilong Jiang,
for a maximum of 290 days, an average of 260 days in the northwest,
is one of the largest river systems in Asia, covering about 2 million km▓.
190-200 days in the north and the Sakhalin coasts, and 110-120 days in
The River is one of the ten longest in the world (approximately
the south. During severe winters, ice cover can occupy up to 99%
4 345 km) and its course forms the
of the water area and, in milder winters, about 65%. Generally, ice
Table 1 Basic
hydrological boundary between Russia and China for
and water quality
formation begins in the northwestern part of the sea in November,
3 000 km. It originates from the Argun/
characteristics of
but as early as October in areas with considerable water freshening.
the Amur River
Urgun (Russia-China border) and Shilka
The ice cover gradually extends southwards along the western and
Characteristic
Value
(Russia) rivers, is joined by the Songhua
eastern coasts, and eventually to the open sea. In December, the
Water run-off, average,
River (China), and later meets the Ussuri/
369.1
long-term, km│
consolidated fast ice is formed in the bays and bights (Lapko &
Wusuli River (Russia-China border) and
Run-off maximum,
459.2
Radchenko 2000). In January and February, the ice fi elds occupy
annual, km│
the Zeya and Bureya Rivers (Russia). The
Run-off minimum,
the northwestern and central parts of the sea. The drift ice
135.0
Amur then fl ows north until it reaches its
annual, km│
reaches a great density and is subject to intense compression and
Maximum water
mouth on the Tatar Strait from where it
40 000
discharge, m│/s
hummocking.
fl ows into the Okhotsk Sea.
Minimum water
153
discharge, m│/s
Salinity
Average annual flow
The average discharge of the Amur River
of detritus, millions of
24.0
The salinity of the Okhotsk Sea is largely determined by the
tonnes
is 11 700 m3/s (369 km3/year). During
hydrological cycle in terms of the balance between precipitation
Average annual water
90.0
spring and summer (April-September)
turbidity, mg/dm│
and evaporation; the eff ect of sea ice formation and melting
almost 75% of the annual discharge is
Maximum water
517.0
processes; continental discharges to the coastal zone; and water
turbidity, mg/dm│
recorded, while only about 14-25% fl ows
Average annual flow
exchange with adjacent seas. The salinity of coastal surface waters
during autumn and winter (October-
of dissolved matter,
20.23
in the northwestern part of the Sea has a large annual variance of
millions of tonnes
March). Among the major tributaries
including Ca2+
2.34
20-25 to 30-33. In summer and early autumn, the salinity of the
contributing to the Amur River's total
Mg2+
0.74
Sea is less than in winter when it increases as a result of ice formation
discharge are the Zeya (17%), Ussuri/
Na+ + K+
1.60
and a reduction in continental discharge (see Figure 4). Off shore
Wusuli (12%), Bureya (7.7%), Amgun
HCO -
10.40
and in the southwestern sea, salinity variations are less pronounced
3
(5.7%), Shilka (4.7%), Tunguska (3.5%),
2-
(31.0-33.5) (Rostov et al. 2002) due to water exchange via the La
SO
2.10
4
Argun/Urgun (2.9%), Anyui (1.9%),
Perouse and Kuril straits. The seasonal fl uctuations in salinity diff er
C- 1.10
Gorin (1.6%) and Gur (1.4%). The smaller
Average annual flow of
depending on location. There is a general trend of increasing salinity
tributaries contribute between 0.1
organic matter, millions
5.3
down the water column in all seasons and there are comparably few
of tonnes
and 1.0% to the annual discharge. The
(Source: Estimates of Institute of Water and
spatial and temporal variations.
Ecological Problems, FEB RAS)
smaller river basins of Khabarovskiy Kray,
Magadanskaya and Kamchatskaya
34
February
August
34.5
oblasts also drain into the Okhotsk
60░N
60░N
Sea. Table 1 shows the basic
32
hydrological and water quality
34
characteristics of the Amur River.
55░N
55░N
33.5
30
There are more than 60 000 lakes
50░N
50░N
in the Amur River Basin sub-
33
system, the largest being Khanka,
28
Chukchagirskoye, Bolon, Udyl,
i
ew
i
ew
45░N
V
45░N
V
ta
ta
Bolshoe Kizi, Evoron, Chlya
32.5
ean Da
ean Da
26
(Voronov 2003). The Lake Khanka
Oc
Oc
140░N
150░N
160░N
140░N
150░N
160░N
Basin, known as Lake Xingkai in
Figure 4
Salinity of surface water in February and August.
(Source: Arzamastsev et al. 2001)
China, is located in the upper part
REGIONAL DEFINITION
17
of the Ussuri/Wusuli River system. It is the largest freshwater lake in East
Socio-economic characteristics
Asia ş shared by China (Heilongjiang province) and Russia (Primorskiy
Kray).
Population
The population of the Okhotsk Sea sub-system is approximately
Biodiversity and critical habitats
8.7 million, of which 2.7 million live in Russia and about 6 million in Japan.
The Amur River Basin sub-system hosts some of the world's most
The Russian coast, except for Sakhalin Island, is sparsely populated, with
diverse and productive habitats and encompasses extensive areas of
a population density of approximately 1.5 people per km2 (Figure 5).
complex and unique ecosystems. The Russian section of the Amur
The only Russian cities with a signifi cant population size (60 000-
River Basin is situated in a temperate mixed broadleaved and coniferous
200 000 inhabitants) are Yuzhno-Sakhalinsk, Magadan, Nikolaevsk-
forest zone, and forest steppe zone. The Amur River supports more fi sh
on-Amur and Okha. The majority of the rural and urban population
species than any other Russian river, with more than 120 species (WWF
lives within the permafrost zone, tolerating severe or extreme natural
2001), 18 of which are endemic and eight are endangered, including
conditions. The far eastern Russian economy experienced a severe
Kaluga sturgeon (Huso dauric). There are also seven migratory salmon
and long recession in the 1990s which led to emigration and a
species (GEF Concept paper 2005). Lake Khanka and its surrounding
decline in population. The largest decline in population out of all the
wetlands have particularly high species diversity. The Lake's basin hosts
Pacifi c coastal regions between 1991 and 2000 was observed in the
342 bird species which account for 65% of the total bird species found
Magadanskaya Oblast' (40% decline), Kamchatskaya Oblast' (20%) and
in Far-Eastern Russia and 48% in Russia. 12 species are included in the
Sakhalinskaya Oblast' (18%).
International Red Book. The variety of fi sh species in the Lake and its
infl ow and outfl ow (only Songacha) rivers represents 73% of the fi sh
Population
density
species in the Amur basin. The wetlands around the lake are used for a
(persons/km▓)
<1
spring and autumn resting place for migratory species and for spawning
1-2
grounds for commercial species, such as Predatory carp (Erythroculter
3-5
Russia
6-10
erythropterus) and Mongolian redfi n (Erythroculter mongolicus) (GEF
11-100
>100
Concept paper 2005).
About 61 species of mesopelagic fi sh belonging to 53 genera and
Mongolia
33 families have been recorded in the Okhotsk Sea sub-system (PICES
2004). There are known to be 16 species of squid ş an important
China
component of the food web of the Sea's ecosystem ş belonging to
nine genera and six families. Regarding groundfi sh, 50% are fl atfi sh, 21%
Japan
ę GIWA 2006
cods, and 11% sculpins. These three groups are a major determinant
Figure 5
Population density of the Sea of Okhotsk region.
of the fi sh productivity of the Okhotsk Sea shelf. The Sea is home
(Source: Data from ORNL 2003)
to 11 endangered species including the Western Pacifi c gray whale
which is critically endangered in this region. At least 16 species of
The population of the Amur River Basin sub-system fl uctuates between
marine mammals inhabit the Okhotsk Sea sub-system. There are four
70 and 80 million people, 5 million of whom live in Russia, 65-75 million
species of the true seal (Phocidae) and two species of eared seal. Whales
in China and less than 50 000 in Mongolia. The North Korean part of
that inhabit the Sea include, among others, Gray whales (Eschtrichtius
the Basin is largely unpopulated (Voronov 2003). The catchment of the
robustus), Southern baleen whales (Eubalaena japonica), Bowhead
Songhua River (a tributary of the Amur River) has a population density of
whales (Balaena mysticetus), Northern fi n whales (Balaenoptera physalus),
105 people/km▓ (compared to 35 people/km▓ in the whole of the Amur
Little picked whales (Minke's) (Balaenoptera acutorostrata), Humpback
Basin) and includes most of the large cities in the Amur basin, such as
whales (Megaptera novaeangliae), Baird's beaked whales (Berardius
Harbin, Jilin and Mudanjiang (GEF Concept paper 2005).
baridii) and Killer whales (Orcinus orca).
Economy
In the Russian coastal areas of the Sea of Okhotsk region there is a
developed mining industry. The fi shing industry is found in Kamchatka,
Magadan, Okhotsk, Ayan and Nikolaevsk-on-Amur (Khabarovskiy Kray).
18
GIWA REGIONAL ASSESSMENT 30 SEA OF OKHOTSK
In Sakhalin, hydrocarbon is exploited and there Table 2
Basic economic characteristics of the administrative regions of the Sea of
are coal mining, and wood and pulp-and-paper
Okhotsk basin.
Cost of basic
industries. Figure 6 shows the distribution of
Share of total
Volume of
Gross regional
Industrial
assets of
Sectors of the Sea Population in
population of
agricultural
industrial activities in the Okhotsk Sea sub-system.
product
output
economics
of Okhotsk basin
sector (people)
administrative
production
(million USD)
(million USD)
branches
In the Amur River Basin sub-system, ship building
territory (%)
(million USD)
(million USD)
and repair, carpentry, construction and coal mining
Sakhalin and Kuril
335 000
61.24
722.9
615.8
38.1
2169.4
are the predominant industries. Further, power
Magadan
125 000
68.41
286.6
244.6
8.5
1110.1
generation using coal, gas and hydroenergy is a
Khabarovsk 407
000
28.4
642.2
557.6
36.4
2931.5
major sector. The sectoral structure of industrial
Kamchatka
24 000
6.3
37.2
32.7
3.5
134.3
output in the Far East of Russia in 2000 is shown
Japanese
310 000
6.1
10 200
(Hokkaido Island)
in Table 3.
(Source: Russian Regions 2001)
Evensk
During a period of market reforms between 1990 and 1998, there was a
signifi cant decrease in investment and industrial production. Since 1999,
Palana
Yamsk
the Russian economy, including that of the Far East, has stabilised and
Magadan
Okhosk
industrial production has increased. GDP growth has averaged 5-7% for
Tigil
the period 2000-2004 (Lvov 2004).
Ayan
Ust-Kharyuzovo
S e a o f O k h o t s k
According to the GIWA regional experts, the socio-economic
Tchumikan
development of the region has been determined by the following:
Mnogovershinnoye
Kolendo
Kherpuchi
Okha
1. The collapse of economic relations with the western regions of
Oktyabrsky
Nikolayevsk-on-Amur
Russia;
Nogliky
Ozernovsky
Katangly
2. Aggravation of social problems. Transport tariff s increased by
Severo-Kurilsk
Tumovskoe
10-12 times making voyages to the western regions of Russia
Poronaisk
unaff ordable for most people;
Makarov
3. Limited market in Far-Eastern Russia for primary and manufactured
Branch of industry
Yuzhno-Sakhalinsk
Fuel
products;
Korsakov
Energy
Vakkanai
4. Factors increasing the cost of production. For example, harsh natural
Kurilsk
Abasiry
Non-ferrous metallurgy
Yuzhno-Kurilsk
conditions, remoteness of settlements and poor infrastructure
Mechanical engineering
Kitamy
Wood-working
development;
Size of industrial node
Building materials
5. Marginal location of region; it is a considerable distance from the
(thousand persons)
Light industry
industrial centres of Russia, thus increasing transportation costs;
Food industry
500-100
100-50 50-10 <10
Fish industry
6. Periodic emigration from the region; and
Figure 6
Distribution of industries in the Sea of Okhotsk Basin.
(Source: Prepared by the authors using Russian Regions 2002)
Table 3
Sectoral structure of industrial output in the Far East of Russia in 2000.
Electric power
Nonferrous Chemical and petro- Mechanical engineering including Wood, woodworking and Food-processing industry
Region
Fuel industry
Other
industry
metallurgy
chemical industry
shipbuilding and ship repair
pulp and paper industry
including fish complex
Primorsky Krai
16.4
2.1
3.7
1.0
16.3
6.8
46.7
7.0
Khabarovsk Krai
8.5
7.9
8.4
1.6
50.4
8.0
8.5
6.7
Amur Oblast
34.4
4.7
29.6
0.1
6.3
5.7
10.2
9.1
Kamchatka Oblast
20.1
0.3
8.3
0.1
4.0
0.6
63.3
3.3
Magadan Oblast
15.3
1.1
66.4
0.0
1.5
0.3
14.0
1.4
Sakhalin Oblast
6.0
60.6
0.2
0.1
1.2
3.2
27.4
1.3
Jewish Autonomous Oblast
13.5
0.2
4.7
0.5
25.4
5.5
13.3
36.9
The Far East as a whole
11.4
13.2
29.8
0.6
16.7
4.1
19.8
4.4
(Russian Regions 2001)
REGIONAL DEFINITION
19
7. The socio-economic conditions contrast with neighbouring
An evaluation of hydrocarbon resources made by Dalmorneftegeofi zika
countries in terms of population density, market characteristics
in 1994, concluded that the Sea of Okhotsk shelf has the equivalent of
and infrastructure development.
14 462 million tonnes of fuel. In Sakhalin Island and on its shelf there
are estimated to be 324 million tonnes of oil and 997 million tonnes of
The Russian section of the Amur River Basin is one of the most
gas. By 2000, 23 oil and gas-oil, and 5 gas fi elds had been developed.
developed territories in the Russian Far East. During the 18th and 19th
Figure 8 shows the areas of prospective development of the oil and gas
centuries, development was concentrated on the north side of the
fi elds in the Sea of Okhotsk region.
Amur River. Economic development was further stimulated following
the construction of the Trans-Siberian Railway in the 20th century, which
4
crosses the Amur River. The Basin has an estimated 35% of the industrial
3.5
onnes)
potential and over 75% of the agricultural potential of the Russian Far
3
East.
(million t
2.5
2
olumes
In Northeast China, the GRPs in 1999 of the Heilongjiang and Jilin
1.5
provinces totalled 2.4 billion USD (14th position out of 32 Chinese
tion v
1
provinces) and 1.4 billion USD (19th position), respectively (Baklanov
oduc
0.5
et al. 2002a). As a result of economic reforms, there has been a shift
Oil pr
0
1970
1975
1980
1985
1990
1995
2000
2002
in the employment structure of the region from the primary to the
Year
secondary and tertiary (service) economic sectors. This trend continued
Figure 7
Oil production volumes.
(Source: Russian Statistical Yearbook 2001)
in subsequent years as a result of the state funded manufacturing
industries of Northeast China (Baklanov et al. 2002a). There has
also been signifi cant investment in transport and communication
infrastructure in order to stimulate trade with regions outside Northeast
China. In Jilin, agriculture remains the largest sector, both in terms of
Magadan
production output and employment rates. There is major domestic and
foreign investment in the Heilongjiang and Jilin provinces, particularly
in agriculture, engineering and transport infrastructure.
Future economic development in the Sea of Okhotsk region will be
based upon the exploitation of the region's mineral resources, such
a
as oil, gas and coal, and possibly the development of hydropower. In
Amgun'
addition, there are abundant forest resources and considerable land
resources.
ur
Am
Economic sectors
Khabarovsk
Oil and gas industry
The Sea of Okhotsk region includes the Okhotsk oil and gas fi elds,
Yuzhno-Sakhalinsk
making its hydrocarbon resources particularly important economically.
Signifi cant reserves of oil and gas are predicted to exist in the
Japan
northeastern and northern shelves of Sakhalin, the western Kamchatka
shelf and in the middle and lower reaches of the Amur River Basin. Only
Figure 8
Areas of prospective development of the oil and gas
a small proportion of the large hydrocarbon reserves of the Russian Far
fi elds in the Sea of Okhotsk region.
(Source: Alekseev et al. 2001)
East is exploited. The dynamics of oil production is shown in Figure 7.
Although the volume of oil exploited continues to increase, with oil
Renewable resources
production reaching 3.4 million tonnes in 2004, only 20% of regional
The region's renewable energy sector also has development potential.
consumption is met by regional production.
Shelikhov Bay and the Penzhinskaya Gulf have large tidal ranges of up
20
GIWA REGIONAL ASSESSMENT 30 SEA OF OKHOTSK
to 10-12 m and are thus suitable for tidal energy projects. The Amur
Agriculture
River and its tributaries, including the Zeya, Selemdzha and Burea
The agricultural sector (mainly grain and soybean production, and
rivers, have signifi cant hydropower potential (Alekseev et al. 2001). In
cattle-breeding) has been developed primarily in the middle and
the Russian part of the watershed, there are hydroelectric plants such
lower reaches of the Amur. In other areas of the Sea of Okhotsk region,
as the Somninskaya located on the watercourse of the Amgun and the
deer-breeding, local arable farming and cattle-breeding are common,
Zeiskaya on the Zeya. Additionally, the Bureiskaya hydroelectric plant
particularly in the south of Sakhalin and southwestern Kamchatka. The
was recently constructed near the Talakan River mouth and further
Amur River Basin sub-system is a major agricultural zone of the Russian
hydro-electric projects are planned for the Selemzha and Gilyui rivers.
Far East. The most fertile agricultural lands are located on the Zeya-
The region also has an abundance and diversity of wood resources.
Bureinskaya Plain and Lake Khanka lowlands.
Mineral resources
Fisheries
The Sea of Okhotsk region contains a wealth of mineral resources.
The Okhotsk Sea sub-system is regarded as the richest fi shery region
In some of the region's mountains and river valleys, gold has been
in the world. The volume of biological resources in the Sea constitutes
discovered and ferrous and non-ferrous metals and polymetallic
46% of all marine biological resources in the northern Pacifi c. It has
ores are exploited. There is great mining potential in the coastal areas
an estimated 11 million tonnes of biological resources, including
where substantial mineral reserves, particularly of boron, antimony and
approximately 7 million tonnes of cod, 2.5 million tonnes of herring
fl uorspar, are found. Large reserves of brown and hard coal have been
and about 1.5 million tonnes of other seafood (e.g. molluscs and algae)
discovered in Sakhalin and in the Amur River Basin. In a zone adjacent
(Shuntov 2001). Approximately 340 fi sh species inhabit the Okhotsk
to the lower reaches of the Uda, Amgun and Amur rivers there are
Sea (Froese & Pauly 2005). The main fi sh products are fl ounders,
considerable phosphorite reserves. Figure 9 shows the distribution of
herring, capelin, halibut, pollock and crab. Walleye pollock (Theragra
natural resources in the region.
chalcogramma) is the most abundant commercial species in the Sea.
Catch volumes average 1.2-1.5 tonnes per km2, but in productive years
reach between 8 and 22 tonnes per km2 on the western Kamchatka
shelf. In comparison, fi sheries production is about 0.7-1.1 tonnes per km2
in the North Atlantic (The Seas 1998). Russian catches of commercial fi sh
between 1992 and 2003 in the Okhotsk Sea are given in Figure 10.
Until recently, numerous vessels from various countries fi shed intensively
Sea of Okhotsk
in the Okhotsk Sea. The Sea's non-Russian fi shery has been closed since
2003 with the exception of Japanese gill net fi shing for Pacifi c salmon.
In 2005, the foreign fl eet was not allocated any quotas for fi sh in the
Okhotsk Sea sub-system (Governmental Resolution 2004).
Types of resources
3
4
2
5
1
6
2 500
12
7
11
8
10
9
2 000
1 Coal
2 Oil and gas
3 Hydro-energy
onnes) 1 500
4 Ferrous metal
5 Non-ferrous metal
6 Chemical raw materials
7 Non-ore raw materials for
1 000
metallurgy, building materials
(thousand t
h
8 Forest
9 Non-arbareos forest
Catc
500
10 Sea (natural) resources
11 Soils
12 Reindeer pastures
C
0
B
Resource value
1992
1994
1996
1998
1999
2000
2001
2002
A
A Natural-economic micro-region
Year
B Levels of region Okhotsk
C Levels of Asia-Pacific region
Figure 10 Catches of commercial fi sh by the Russian fl eet in the
Figure 9
Natural resources of the Sea of Okhotsk sub-system.
Okhotsk Sea.
(Compiled by the authors)
(Source: Barushko 2005)
REGIONAL DEFINITION
21
In 2000, the fi shing industry contributed 1.2 billion USD to the
more than 90% of water resources are used for these purposes. Table 4
economy of the Russian Far-East. It accounted for 18.2% of gross
shows how water consumption generally decreased in the Russian
regional product (GRP) in 1999, and as much as 63.5% in the Koryak
administrative regions during the 1990s.
Autonomous Region, 49.3% in Kamchatka, 27.3% in Primorskiy Kray, and
18.3% in Sakhalinskaya Oblast'. The fi sheries industry therefore plays
Table 4
Consumption of freshwater in the Russian
an important role not only for the local economy, with one fi sherman
adminstrative regions of the Okhotsk sea.
creating 6-7 workplaces onshore, but also in the development of the
1991
1995
2000
2001
Region
(million m│)
(million m│)
(million m│)
(million m│)
social and cultural characteristics of the region and the distribution of
Khabarovsk Kray
714
558
465
467
fi shing settlements.
Kamchatka Oblast
309
276
261
252
Magadan Oblast
144
137
90
96
The riparian population of the Amur River has depended throughout
Sakhalin Oblast
455
376
275
273
history on fi shing and hunting as its major source of food supply. The
(Source: Russian Regions. 2002. Moscow, 2002.)
Amur River Basin sub-system contains one of the largest inland fi shing
industries in Russia. The most important commercial fi sh species in the
Amur are the migratory salmons (Humpback, Oncorhynchus gorbuscha
International cooperation
and Chum, O. keta), sturgeons (Amur, Acipenser schrenckii and Kaluga,
The three riparian countries of the Amur River Basin sub-system have
Huso huso), smelt, and lamprey (Lethenteron sp.). Sturgeon fi shing is an
established bilateral cooperation agreements in the fi eld of protection
important part of the regional fi sh industry but, due to the depletion of
and use of transboundary water resources. These include:
stocks, bans were enforced on Kaluga sturgeon between 1976 and 1991.
The Amur is one of the richest rivers for salmon in the world; in 1910 the
Agreement between the USSR and China on joint research
total catch of salmon was over 100 000 tonnes. The majority of catches
operations to determine the natural resources of the Amur
of salmonids consist of Humpback salmon (Novomodny et al. 2004).
River Basin and the prospects for development of its productive
potentials and on planning and survey operations to prepare a
Aquaculture
scheme for the multi-purpose exploitation of the Argun River and
In Russia, aquaculture is poorly developed. According to the GIWA
the Upper Amur River, 1956;
experts, only 40 fi sh breeding factories operate in the entire Russian
Agreement between the governments of Russia and China on
Far East which release 0.5 billion juvenile fi sh. In comparison, Japan has
cooperation in the fi eld of conservation of transboundary water
350 factories which release approximately 2 billion juvenile fi sh. Most
resources.
commonly, Chum salmon, Humpback salmon and other species of
Agreement between the governments of Russia and China on
salmon are bred, mainly in Sakhalin. Most enterprises have become
cooperating in the preservation of the environment, 1994.
obsolete as they failed to achieve their anticipated production capacities
Agreement between the governments of Russia and China on
due to poor management. Only 1% of the total output of the fi sheries
cooperating in the conservation, regulation and protection of
industry is produced by aquaculture (Baklanov et al. 2002b).
living aquatic resources in the boundary waters of the Amur and
Ussuri Rivers, 1994.
Water use
Agreement between the governments of China and Mongolia
There is an irregular distribution of water resources in the Basin between
on the protection and utilisation of transboundary waters and
the oblasts and krays of Russia and the territories of Mongolia and
environmental management (1994); and
China. The majority of freshwater originates from Khabarovskiy Kray
Agreement between the governments of Mongolia and Russia on
(34%), Amurskaya Oblast' (22%) and from China (28%). Water resources
the protection and use of transboundary waters, 1995.
in the basin are extensively used for agricultural, industrial, energy
production and domestic purposes. In Khabarovskiy and Primorskiy
International treaties relevant to the Okhotsk Sea sub-system:
krays and Priamurye, more than 80% of the total water abstracted is
The international convention for the regulation of whaling, 1946;
used for production and domestic purposes. In other regions, irrigation
The international convention for the prevention of pollution of the
and domestic supply are the most signifi cant consumers. In Chitinskaya
sea by oil, 1954;
Oblast', within the watersheds of Argun/Urgun, Onon and Ingoda rivers,
The convention on the continental shelf, 1958;
as well as practically all the administrative districts of Primorskiy Kray,
The
Ramsar
convention
on
wetlands,
1971;
22
GIWA REGIONAL ASSESSMENT 30 SEA OF OKHOTSK
The convention on international trade in endangered species of
The convention for the conservation of anadromous stocks in the
wild fauna and fl ora, (CITES), 1973;
North Pacifi c Ocean, (Russia, United States, Canada, Japan, South
The convention on the prohibition of military or any other hostile
Korea), 1992;
use of environmental modifi cation techniques, 1977;
The North Pacifi c Marine Science Organization (PICES), (Russia,
The United Nations convention on the Law of the Sea (UNCLOS),
Canada, United States, Japan, China, South Korea), 1992; and
1982; and
The agreement between the governments of Japan and Russia on
The agreement for the implementation of the United Nations
matters of cooperation in the fi eld of fi shing operations for marine
convention on the Law of the Sea of December 10, 1982, relating
living resources, 1998.
to the conservation and management of straddling fi sh stocks and
highly migratory fi sh stocks, 1995.
Protected areas ş case of Lake Khanka
The two Lake Khanka basin riparian countries, Russia and China, initiated
Regional agreements relevant to the Okhotsk Sea sub-system
specifi c measures to protect species and their habitats, particularly the
The agreement between the governments of USSR and Japan
wetland areas around the lake. Two protected areas were established
about mutual relations in the sphere of fi shery at coasts of both
for this purpose: Lake Xingkai National Nature Reserve (China) and
countries, 1984;
Khankaisky National Nature Reserve (Russia). The Russian side of the
The agreement between the governments of USSR and Japan
lakeshore wetlands have been designated as a Ramsar site. However, the
about cooperation in the sphere of fi shery, 1985;
national legislations and restricted activities applicable to them diff er,
The agreement between the governments of USSR and North Korea
and it is expected that more harmonised management and regulations
about cooperation in the sphere of fi shery, 1987;
for the protected areas will be developed between the two national
The agreement between the governments USSR and Chinese
nature parks.
about cooperation in the sphere of fi shery, 1988;
The agreement between the governments USSR and South Korea
about mutual relations in the sphere of fi shery, 1991;
REGIONAL DEFINITION
23
Assessment
Table 5
Scoring table for Sea of Okhotsk.
This section presents the results of the assessment of the impacts of
Assessment of GIWA concerns and issues according to
The arrow indicates the likely
each of the fi ve predefi ned GIWA concerns i.e. Freshwater shortage,
scoring criteria (see Methodology chapter)
direction of future changes.
T
T
Pollution, Habitat and community modifi cation, Unsustainable
C
C
Increased impact
A 0
No known impacts
A 2
Moderate impacts
IMP
IMP
T
T
No changes
C
C
exploitation of fi sh and other living resources, Global change,
A 1
Slight impacts
A 3
Severe impacts
IMP
IMP
Decreased impact
and their constituent issues and the priorities identifi ed during
ts
ts
this process. The evaluation of severity of each issue adheres to a
core**
Sea of Okhotsk
ts
ts
set of predefi ned criteria as provided in the chapter describing the
vironmental
t
her community
v
erall S
GIWA methodology. In this section, the scoring of GIWA concerns
En
impac
E
c
onomic impac
Health impac
O
impac
O
Priority***
Freshwater shortage
1*
1
1
1
1
3
and issues is presented in Table 5 and Annex II.
Modification of stream flow
1
Pollution of existing supplies
2
The Sea of Okhotsk region is a large and complex system which, for the
Changes in the water table
1
purpose of this report, can be divided into two sub-systems: the Okhotsk
Pollution
1*
2
2
1
2
1
Sea (marine) and the Amur River Basin (freshwater). Only the sub-system
Microbiological pollution
1
Eutrophication
1
most relevant to each of the GIWA concerns is assessed. For the Amur
Chemical
1
River Basin, this report assesses only the Russian section and two of the
Suspended solids
1
riparian provinces of China (Heilongjiang and Jilin). These provinces of
Solid wastes
1
Thermal
0
China impact the Okhotsk Sea sub-system via the Amur River.
Radionuclides
0
Spills
1
Habitat and community modification
1*
2
1
1
2
4
Loss of ecosystems
1
T
C
A
Freshwater shortage
Modification of ecosystems
1
IMP
Unsustainable exploitation of fish
2*
2
1
1
2
2
Overexploitation
3
2
Freshwater shortage was analysed for the Amur River Basin sub-
Excessive by-catch and discards
2
0
systems.
asin
Destructive fishing practices
2
1
Amur B
Decreased viability of stock
S
e
a of Okhotsk
2
0
Impact on biological and genetic diversity
1
1
Environmental impacts
Global change
1
2
2
1
1
5
The environmental impacts of Freshwater shortage were assessed as
Changes in hydrological cycle
1
slight. The issue of changes in the water table is not further discussed
Sea level change
0
Increased UV-B radiation
0
as there were no known impacts.
Changes in ocean CO source/sink function
0
2
*
This value represents an average weighted score of the environmental issues associated to
the concern.
Modifi cation of stream fl ow
**
This value represents the overall score including environmental, socio-economic and likely
The construction of dams and reservoirs for hydroelectricity production
future impacts.
*** Priority refers to the ranking of GIWA concerns.
has been a major factor in altering the regime of the Amur River. In the
24
GIWA REGIONAL ASSESSMENT 30 SEA OF OKHOTSK
late 1940s, the Fynman hydroelectric station was constructed on the
is occasionally aff ected by seasonal water shortages (Baklanov et al.
Songhua River (China) and, in 1975, construction began on the Zeiskaya
2002a) and there appear to be no associated health problems of great
hydroelectric station in the Zeya River Basin (Russia). Changes in stream
signifi cance. The pollution of freshwater supplies has, however, caused
fl ow have been detected (Birdlife International 2003). Hydropower
some public health concerns in urban areas. There have been reports
development has reduced the average annual water level variations by
of diarrhoea and other infections linked to the poor water quality of the
1.0-2.3 m along the Blagoveshchensk-Khabarovsk section of the river. In
Amur River system (Baklanov et al. 2002a).
addition, stream fl ow has increased during winter (Shcheka 2005); the
average minimum low water levels in winter rose by 0.3-0.6 m and in
Conclusions and outlook
the Maly Khingan by more than 1.2 metres.
The Amur River and its tributaries have been modifi ed during the 20th
century. The major hydroelectric plants on the Songhua and Zeya rivers
The water regime of the Amur River and its tributaries has also been
have altered the discharge of these tributaries into the Amur River. As
altered by the abstraction of freshwater for industrial and agricultural
a consequence, fl ow rates and seasonal discharge patterns have been
purposes as well as logging and ditching (Novomodny et al. 2004),
modifi ed, which has changed the chemical composition of water bodies
the release of water to reclaim swamps, and increased surface run-off
and altered aquatic habitats. Pollution in the Amur River has increased
due to a loss of vegetation caused by deforestation and fi res (Shcheka
water treatment costs and, in urban areas, the prevalence of diseases.
2005). As a result, downstream wetlands have been depleted (Birdlife
Freshwater shortage, however, is not presently a major problem for the
International 2003, GEF Concept paper 2005) and the frequency of
Sea of Okhotsk region. Therefore, its overall impacts were assessed as
fl ooding has increased (Jen 2003, Shcheka 2005).
slight. There is currently no agreement between China and Russia on
the fl ow rates and discharges of the transboundary rivers in the region.
Pollution of existing supplies
Economic development and population growth, particularly in China,
Urban areas are the major source of freshwater pollution in the
will result in greater demand for water resources, the further diversion
Amur River Basin but agricultural contaminants are also a concern. In
of rivers to supply human uses, and increased pollution loads.
Khabarovskiy Kray, more than 400 million m3 of wastewater is discharged
into the Amur every year, 70 million m3 of which is untreated and 173 mil-
lion m3 is inadequately treated. The Amur River suff ers from transbound-
T
C
A
ary pollution from agrochemicals, phenol, heavy metals and untreated
Pollution
IMP
wastewaters (GEF Concept paper 2005). Agricultural land use has intensi-
fi ed resulting in the increased use of fertilisers and pesticides (Jen 2003).
The following contaminants are found in the Amur River: organic
The deterioration of water quality in the Amur and its large tributaries
substances (BOD ), oil products, phenols, ammonium nitrogen, nitrate
5
has decreased the quantity of potable water in near the Amur River in Pri-
nitrogen, iron, copper, zinc and lead (Chudaeva 2002). Studies by the
amurye (Jen 2003). A considerable proportion of the population is forced
Far-Eastern Hydrometeorological Institute between 1997 and 2000
to use low quality and often contaminated water, especially during the
found that water quality had deteriorated in the lower reaches of the
summer fl oods and in winter (Baklanov et al. 2002b). The Songhua River
Amur River. Between 50% and 90% of the contaminants entering the
in China experienced a large release of benzene in 2005 which threat-
lower reaches of the Amur River are discharged by the Songhua River,
ened the freshwater supply of millions of people (UNEP 2006).
including ammonium ions, phosphates and other ions (Table 6). The
Songhua River has experienced rapid agricultural, urban and industrial
Socio-economic impacts
development which has resulted in the degradation of its water
The economic impact of Freshwater shortage was assessed as slight.
quality. There is a lack of measures aimed at reducing the quantities
Freshwater shortages have not had any signifi cant infl uence on human
of pollutants entering the Songhua River (China) despite its impact on
activities in the Basin, although the GIWA regional experts have found
the water quality of the Amur (Kondratyeva 2000, Kondratyeva 2001,
that pollution had increased the costs of water treatment. Additionally,
increased fl ooding has damaged property and human life and
Table 6
Water discharge and chemical composition of water
near the mouth of the Amur River
temporarily disturbed productive agricultural land (Shcheka 2005).
Discharge
HCO -
SO -
Cl-
Ca++
Mg++
K+
Na+
3
4
(109 m3/year)
(mg/l)
(mg/l)
(mg/l)
(mg/l)
(mg/l)
(mg/l)
(mg/l)
The health impacts associated with Freshwater shortage were
400-800
29.0
5.1
0.76
5.8
1.9
2.7
0.6
considered slight. Only a minor proportion of the regional population
(Source: Chudaeva, 2002 and Russian Hydromet Service)
ASSESSMENT
25
Shesterkin & Shesterkina 2004). The largest sources of pollution are
in summer and autumn but also during the period of ice formation. In
the cities of Khabarovsk and Komsomolsk-on-Amur, which account
March 1998, for the fi rst time, the production of aquatic plants in the
for 37% of the total wastewater discharged into the Amur. About 60%
lower reaches of the Amur was comparable to the summer and the
of the total contaminated wastes are discharged by enterprises in
water was classifi ed as `very eutrophic' (Yur'ev et al. 1999). Studies by
Khabarovskiy Kray. Monitoring performed by the state of Khabarovskiy
Shesterkin & Shesterkina (2004) from 1980 to 1997 established that the
Kray did not assess all potentially dangerous contaminants in the Amur,
water quality in the lower reaches of the Amur has been considerably
including organo-chemicals and heavy metals, and their possible
decreased as a result of changes to the composition of the benthic
impacts on aquatic ecosystems and human health.
communities. Further, the Amur River discharges 400 million tonnes per
year of organic material to the Okhotsk Sea (Schlesinger et al. in Seki et
Environmental impacts
al. 2006) with unknown consequences.
The environmental impacts associated with pollution were considered
slight. The main impacts are caused by eutrophication, chemical
Chemical pollution
pollution, suspended solids and oil spills. Solid wastes, and thermal
The Amur River has been contaminated by a range of heavy metals, as
and radionuclide pollution have not been assessed due to a lack of
shown in Table 7, and by stable organic compounds (SOC), including
information.
chlorine-containing organic substances. The polychlorinated dibenzo-
dioxins and dibenzofurans are highly toxic. These chlorinated organic
Eutrophication
substances are only formed by human controlled processes (Chudaeva
Eutrophication was assessed only in the Amur River Basin sub-system.
2002). When these substances bio-accumulate they can cause
mutagenic and carcinogenic eff ects. Minute concentrations of SOCs are
Considerable quantities of organic matter and biogenic material enter
present within the aquatic environment in the form of organic micro-
the Amur River via domestic and industrial waste waters and surface
impurities. Because they accumulate in bottom sediments, maximum
run-off from the basin (particularly during periods of heavy rainfall).
concentrations of SOC were found in benthic fi sh (e.g. bream and
The abundance of microbe communities suggests that large quantities
sheat-fi sh).
of untreated or inadequately treated industrial and domestic effl
uents
Table 7
Concentrations of various dissolved and suspended
are discharged into the River and its tributaries. Eutrophication, caused
metals in the Amur River
by the nutrient enrichment of the River basin's aquatic ecosystems,
Fe
Mn
Zn
Cu
Pb
Cd
Ni
increases the growth of phytoplankton and zooplankton. Microscopic
Dissolved forms
2-116
0.2-22
0.1-6.9
0.8-4.5
0.0-1.9
0.04-0.11
0.2-1.1
organisms (bacteria, fungi, yeast, protozoans and algae) thrive on
(g/l)
Suspended forms
the decaying plant matter and deoxygenate the freshwater. Aquatic
8 000-51 400
357-1 507
80-2 113
6-113
23-224
1.3-3.7
6-673
(ppm)
organisms are subsequently aff ected and often migrate or are
(Source: Chudaeva, 2002)
eradicated from an area. The benthic bacterial community structure
is modifi ed as the anthropogenic loads increase (Dzyuban 2002). The
There has been considerable chemical pollution resulting from the
greater biomass also increases the turbidity of freshwater ecosystems
application of pesticides in the catchment of the Amur. In 2001 and
which prevents light penetration, thus reducing the productivity of
2002, the muscle tissue of fi sh caught in the Amur contained as much
riverbed photosynthetic plants. This impacts the food web and has
as 0.0008-0.0120 Ág/kg of dichlorodiphenyl-trichloroethane (DDT) and
reduced species diversity in the Amur River Basin. According to Jen
0.0019-0.0249 Ág/kg of the gamma-isomer of hexachlorocyclohexane
(2003), fi sh in the Amur River are poisoned as a consequence of algal
(HCCH). These concentrations are comparable to fi sh caught in English
blooms.
rivers during a period of intensive and uncontrolled agro-chemical
application. Further, freshly frozen fi sh caught in the Lower Amur in
Eutrophication is most severe in the Amur River Basin during periods of
1997 exceeded the maximum permissible concentrations of cadmium,
low water in both the summer and winter. Based on the composition
mercury, zinc and arsenic.
of zoobenthos in the bed of the Lower Amur, the water quality was
classifi ed as IV-VI, i.e. contaminated, polluted or heavily polluted.
The transboundary signifi cance of chemical pollution was recently
Analysis of the long-term dynamics of benthos communities suggests
illustrated when a benzene spill in the Jilin province of northeast
an intensifi cation of eutrophication in the Amur River. The River's
China severely polluted the Songhua River. Experts estimated that
ecosystem is now being disturbed not only during periods of low water
approximately 100 tonnes of pollutants containing benzene and
26
GIWA REGIONAL ASSESSMENT 30 SEA OF OKHOTSK
nitrobenzene fl owed into the river. The water supply to millions of
The increased deforestation around the Amur River system has
people in cities along the river was interrupted. Harbin, a city with
exacerbated erosion. According to the GEF Concept paper (2005),
over 3 million inhabitants, was unable to withdraw water from the river
soil erosion is one of the major transboundary threats to the aquatic
for four days after the incident. The concentrations of nitrobenzene
environment of the Basin.
exceeded national standards by 100-fold. The polluted water in the
Songhua fl owed into the Amur aff ecting downstream communities in
Oil Spills
Russia (UNEP 2006).
There is a signifi cant risk of oil spills in the Sea of Okhotsk region
due to the increased occurrence of oil extraction and transportation
In the Okhotsk Sea sub-system, there is concern over the use of
activities. The expansion of the hydrocarbon industry and its associated
barite for oil and gas drilling due to its toxicity. Some investigations
infrastructure has the potential to cause major impacts on the ecology
suggest that it is practically non-toxic or only slightly toxic (Georg 1975,
of the region if environmental safeguards and precautionary measures
Derby & Atema 1981), whereas other studies have found barite to be
are not implemented eff ectively. So far, three major oil spills have
signifi cantly harmful. Barite increases water turbidity but is quickly
occurred in the Okhotsk Sea sub-system.
deposited on the seafl oor where it poses the greatest threat to benthic
fauna. It has been found to reduce the number of polychaetes and, to
The development of the Russian Sakhalin shelf has increased the
a lesser extent, molluscs in aff ected areas (Tagatz & Tobia 1978). Further,
intensity of oil-related marine traffi
c on the Okhotsk Sea. Although there
signifi cant quantities of wastewater are discharged as by-products of
have been relatively few incidents to date, there is always a risk of a spill
drilling operations. So far, the GIWA regional experts estimate that
through deliberate or accidental discharges. In 1999, an oil spill occurred
over 100 000 tonnes of wastewater have been discharged by such
following an accident on the Vityaz Marine Terminal which is part of
activities.
the newly operational Sakhalin-2 project. As a consequence, 3.5 tonnes
of oil were emitted (Lapko & Radchenko 2000). Oil-tolerant bacteria
Suspended solids
are becoming more abundant in the coastal areas of the Okhotsk
Although the extraction of hydrocarbons from the shelf of the Okhotsk
Sea (Zhuravel' et al. 2004), which may indicate possible increases in
Sea sub-system has caused some impacts associated with suspended
hydrocarbon concentrations.
solids, the issue was only considered slight.
Because the present level of oil development has not caused any
Oil drilling resuspends bottom sediments, thus increasing water
signifi cant problems, the environmental impacts of oil spills were
turbidity surrounding the drilling platforms. According to studies in the
assessed as slight. In the future, this issue may increase in severity due
Gulf of Mexico, these can reach 6 km in diameter and drift with currents
to the continued development of the oil industry in the region. The
for 5-7 km (Steinhauer & Grecelius 1994). Studies conducted within the
future signifi cance of this threat justifi ed its selection for the Causal
area of the planned platforms of the Chaivo fi eld (Russia) estimate that
chain analysis.
suspended material (depending on particle size) can be dispersed up
to 40 km. The environmental changes caused by the increased turbidity
Socio-economic impacts
can force fi sh to change their migration routes to more favourable
Pollution was considered to have a moderate economic impact. The
spawning grounds (Gorbunova 1988). In North Sakhalin, 40% of
deterioration in the water quality of the Amur River and its tributaries
salmon spawning grounds and 130 rivers which are important for
has aff ected fi sheries resources and, consequently, commercial and
spawning have been disturbed (Moiseychenko & Abramov 1994). The
recreational fi shing. There has also been an increase in water treatment
suspended solids reduce light penetration to the photosynthetic layer
costs, particularly in the parts of the Priamurye (Russia).
which reduces the productivity of the area's ecosystems (Sapozhnikov
1995). The fi ltration system of bivalves, molluscs and crustaceans
The GIWA regional experts assessed the health impact of pollution
are also severely impacted by higher concentrations of sediments
as moderate. A considerable proportion of the region's population
(Gorbunova 1988). According to Moiseychenko (1994), a small amount
consume freshwater of poor quality which is often contaminated with
of bentonite and atapulgite results in abortive spawning among the
bacteria. This has resulted in the spread of diseases and epidemics of
bivalves. Additionally, the changes in seabed character caused by the
dysentery and viral hepatitis, as well as an increase in non-infectious
drilling have a direct impact on the surrounding benthic fauna (Puntas
diseases (GEF Concept paper 2005). Freshwater contamination has
& Abolinsh 1989).
aff ected the physiological status of fi sh and their nutritional value. Fish
ASSESSMENT
27
caught in the Amur River during ice formation failed to meet the basic
health standards for fi sh products. Their gills had evidence of bacterial
contamination and their muscle tissue had been damaged as a result
of water contamination. The fi sh species posing the greatest risk to
humans were identifi ed as benthic fi sh (cowfi sh, burbot, sheatfi sh),
fi sh with a long life cycle (sturgeon, Great Siberian sturgeon) and
migratory species from the Amur estuary (smelt) (Kondratyeva et al.
1999, Kondratyeva & Chukhlebova 1999). The signifi cant quantities of
Magadan
heavy metals, DDT and HCCH found in fi sh caught in the lower Amur
may have adverse aff ects on the health of consumers. In addition, large-
scale pollution could aff ect the tradability of fi sh products on the export
market (Jen 2003).
S E A O F O K H O T S K
Very low urbanization,
population density,
share of ploughed-up
territory, technogenic
contaminations
Social and community impacts associated with pollution were
Low urbanization,
population density, share of
considered slight. The impacts include a loss of recreational and
ploughed-up territory and
practical absence of
aesthetic value due to a reduction in biodiversity (Baklanov et al. 2003).
technogenic contaminations
Medium urbanization,
population density, low share
of ploughed-up territory and
Conclusions and outlook
Russia
gun'
sufficient technogenic
Uda
Am
contamination
r
Overall, the GIWA regional experts considered pollution to have slight
u
Insignificant urbanization,
mA
population density and
impacts. The most signifi cant issues were identifi ed as eutrophication,
practical absence of
ploughed-up territory and
technogenic contaminations
chemical pollution and oil spills. Eutrophication in the Amur River has
Yuzhno-Sakhalinsk
Intense exploitation of
been attributed to nutrient enrichment caused by the discharge of
Khabarovsk
forests
ę GIWA 2006
domestic wastewater and surface run-off from the catchment area.
Figure 11 Distribution of anthropogenic pressures in the Sea of
It is expected to increase in severity over the next 20 years, with the
Okhotsk Basin.
communities of the lower Amur River Basin and Songhua River Basin
experiencing the greatest socio-economic impacts. A signifi cant
Environmental impacts
proportion of chemical pollution originates from pesticides used in
Loss of ecosystems
the agricultural sector, as well as heavy metals released by other human
The encroachment of humans into wetlands is concerning (GEF
activities. Heavy metals recorded in fi sh caught in the Amur River have
Concept paper 2005). As much as 2.4 million ha in Russia and 60% of the
exceeded the maximum permissible concentrations for consumption.
wetlands in the Heilongjiang province of China have been converted for
Oil and gas exploitation in the Okhotsk Sea provides economic benefi ts
agricultural use in recent decades (Shcheka 2005). The loss of wetlands,
for the region but discharges signifi cant quantities of wastewater as by-
combined with relatively high rates of deforestation, has increased the
products of drilling operations. Drilling is also increasing the quantity of
frequency of fl ooding.
suspended solids which adversely aff ects the surrounding ecosystems.
Although only three major oil spills have occurred in the region since
Modifi cation of ecosystems in the Okhotsk Sea sub-system
the 1990s, the future expansion of the oil industry in the region will
Great whales, Gray whales, Southern Baleen whales, Bowhead whales,
increase the risk of oil spills.
Northern Fin whales and Humpback whales were listed as endangered
species in the Red Book of the Russian Federation (2001). In 2000, The
World Conservation Union (IUCN) identifi ed the western Gray whale as
critically threatened due to a extremely high risk that the species may
T
C
A
Habitat and community
IMP
become extinct in the near future (Red Book of the Russian Federation
modification
2001).
There is no record of any major loss of habitat in the region but there
The western population of Gray whale is geographically and genetically
is evidence of ecosystem modifi cation (Figure ??), which is resulting in
isolated from the eastern population in the north Pacifi c. In the 1970s,
slight environmental impacts.
the entire population of Gray whales was almost extinct; only about
28
GIWA REGIONAL ASSESSMENT 30 SEA OF OKHOTSK
100 individuals from the western region remained. Since then, their
Eutrophication and the presence of suspended solids in the water
population has not increased signifi cantly. In contrast, the number of Gray
bodies of the Amur River Basin are impeding light penetration. This
whales in the eastern side of the North Pacifi c has since been restored.
has reduced the productivity of riverbed photosynthetic plant life
and impacted other aquatic species which feed on these plants.
The western population of Gray whales is concentrated in the waters of
Additionally, 130 rivers which are important for spawning have been
the northeast Sakhalin shelf, near Piltun Bay. They feed here on benthic
disturbed by anthropogenic pressures in North Sakhalin (Moiseychenko
organisms in the summer and autumn and during the crucial fattening
& Abramov 1994).
period of their life cycle. The Odoptu oilfi eld covers the central part of
this feeding zone while the Chaivo fi eld, located to the south of this,
Human activities are threatening the biodiversity of Lake Khanka and
is positioned on the migratory corridor of the whales. Since the mid
its surrounding wetlands. Seven species of bird that previously bred
1990s, the Gray whale has been threatened by the development of
in the Russian side of the basin have disappeared, including three
these oil and gas fi elds due to disturbances from seismic prospecting,
species listed in the Russian Red Book. Four other species may also
temporary drilling rigs, the increasing number of helicopter fl ights, and
disappear from the basin. One-third of the original wetlands have been
the installation of a drilling and extractive platform located only 5 to
destroyed and there are ten times fewer waterfowl. The degradation
20 km from their feeding and fattening zone. These activities can force
of the lake basin's ecosystem is attributed to agricultural development
the whales to change their migration routes, as well as their feeding and
which has encroached upon wetlands; the lowering of the water table;
reproduction grounds. The physiological stress on the whales may also
and agricultural run-off and other pollution. Forest clearance and the
reduce their immunity to disease.
destruction of biological corridors have also decreased biodiversity.
Further, untreated sewage from the city of Mishan is predominantly
In addition to Gray whales, all other species of marine mammal will be
discharged into the Muling River, and fl ood water is introduced
potentially disturbed as a result of the First Stage of the Oil Development
periodically to the lake through sluice gates (GEF Concept paper 2005).
Project, but the degree of impact will vary depending on the species.
Gray whales are thought to be at greatest risk.
Approximately 20 alien fi sh species have been introduced to the Amur
River (Novomodny et al. 2004). Among these are alien sturgeon species
Modifi cation of ecosystems in the Amur River Basin sub-system
in China (Wei et al. 2004) and several species of carp (Novomodny et al.
The aquatic ecosystems of the Amur River Basin face varying degrees
2004) which were introduced to the Amur River through aquaculture.
of pressure due to diff ering levels of urbanisation, population density,
They are seriously threatening the genetic pool of the Kaluga sturgeon
agricultural and forestry activity, and pollution discharged in the
which is on the brink of extinction, yet artifi cial propagation remains
catchment areas of the rivers.
uncontrolled (Wei et al. 2004).
Approximately 2.4 million ha of wetlands (out of the original wetland
Socio-economic and health impacts
area of 15 million ha) on the Russian side of the basin have been
The GIWA regional experts considered the socio-economic impacts
signifi cantly drained to become pastureland. In Russia, human-induced
of Habitat modifi cation to be moderate. The reduction in fi sheries
fi res frequently destroy wetland habitats. In the Heilongjiang province
productivity due to the degradation of ecosystems reduces the income
of China, approximately 60% of wetlands have been lost or degraded
of fi shing households. Catches of sturgeon have decreased in China
in recent decades. This has transboundary consequences for biological
possibly due to the introduction of alien sturgeon species (Wei et al.
diversity, and the endangered, threatened and rare species in the basin.
2004). There are some costs associated with managing the decreasing
Included in these species are several migratory bird species, such as
stocks of the Kaluga sturgeon, such as fry release, surveillance and,
Oriental white storks (95% of the global population breed in the basin),
possibly, a future restocking programme (Wei et al. 2004).
Red-crowned crane (Grus japanensis; 65%), White-naped crane (Grus
vipio; 50%), and Hooded crane (Grus monacha; 30%). The basin includes
Conclusions and future outlook
key stop-over sites for shorebirds, ducks, geese and swans along the
The GIWA regional experts assessed Habitat and community
Northeast Asian Flyway. In response, China and Russia have given
modifi cation as having a slight impact. Human activities in the Okhotsk
various levels of protection to approximately 1 million ha of wetlands
Sea sub-system have altered the habitats of pollock, Humpback whale
in the Amur River Basin, and a total of eleven natural protected areas
and the endangered Gray whale, among other species. Whales are
were designated as Ramsar sites (GEF Concept paper 2005).
threatened by the increasing exploration and extraction of marine oil
ASSESSMENT
29
and gas reserves. Habitat and community modifi cation is expected to
estimates for Japanese sardine (Sardinops sagax melanostictus), which
increase in severity in the future due to further oil and gas development,
make seasonal use of the Sea, exceeded 1 million tonnes. Catches of
which will also necessitate the development of bulk-oil complexes and
this species, however, declined considerably in the Okhotsk Sea. After
harbours for large tankers (Shcheka 2005). In the Amur River Basin sub-
1993, sardines have not been caught by the fi sheries of the region
system, the extent of wetlands has declined in both Russia and China,
(PICES 2004).
which is threatening biological diversity and endangered species in the
Basin, notably several migratory bird species.
In the area outside of the Russian Exclusive Economic Zone (EEZ),
and therefore out of Russian control, many foreign fi shing fl eets from
countries such as Japan, Taiwan, North Korea, South Korea and China
overexploit the fi sheries. Such illegal fi shing and poaching is reducing
T
C
A
Unsustainable exploitation of
IMP
the stocks of aquatic living resources and causing Russian TACs to be
fish and other living resources
exceeded by 2-10 times (Kotenev & Zaytseva 2003). Fishing products
such as sea urchin and King crab are in high demand in Japanese
This concern was evaluated for both the Amur River Basin and the
markets. Illegal fi shing to supply these markets is considered to be
Okhotsk Sea sub-systems. The GIWA regional experts considered that
responsible for the gradual disappearance of these species (Nazarov
overexploitation has a severe impact in the Amur River Basin sub-
2004, Ozolinsh & Spiridonov 2001).
system, and a moderate impact in the Okhotsk Sea sub-system.
Prior to 1968, the commercial harvesting of true seals was uncontrolled
Environmental impacts ş Okhotsk Sea sub-system
with annual catches of 66 000-102 000 animals, which resulted in
Overexploitation
a dramatic reduction in their population. Their population was
Overfi shing aff ects most of the major fi sh stocks in the Okhotsk Sea. The
restored, however, due to a reduction in sealing based upon scientifi c
volume of fi sh and sea products caught in the Sea between 1992 and
recommendations. Since the mid-1980s the harvest has increased again
2003 is given in Table 8. Since 1990, the volume of catches has reduced
to between 72 000 and 89 000 animals per year, reaching 95% of the
by one-third due to the depletion of fi sh stocks.
catch limits in the Okhotsk Sea (PICES 2004).
The maximum annual catch of Pacifi c halibut (Hippoglossus stenolepis)
Excessive by-catch and discards
was 16 200 tonnes in 1977. Overfi shing has adversely aff ected the
There are believed to be signifi cant quantities of by-catch in the Okhotsk
stocks. In 1980, the annual catch was only 2 600 tonnes and, since
Sea sub-system but there is a lack of information to substantiate this
then, catches have continued to decline. Spawning stock biomass of
claim (Shuntov 2001). During the 1990s, approximately one-third of
Walleye pollock declined in the late 1990s due to natural environmental
catches of young pollock were disposed of overboard, contributing to
variability and overexploitation (Shuntov et al. 1997, Chereshnev et al.
the severe reduction of its stock.
2001). During the most prolifi c years prior to this, annual catches were
as much as 2 million tonnes, but catches have decreased by 3-4 times.
Environmental impacts ş Amur River Basin sub-
Since 2000, when the stock biomass reached its lowest level in 20 years,
system
there have been indications that stocks are beginning and will continue
Overexploitation
to grow in the Okhotsk Sea in the next fi ve years (PICES 2004). The
The fi sh resources of the Amur River Basin sub-system have decreased
total biomass of groundfi sh, including fl atfi sh, cod and sculpins, in
over the past 100 years as a result of overfi shing, pollution, habitat
the Okhotsk Sea shelf decreased from about 3.5 million tonnes in the
degradation and hydropower development. Populations of autumn
1980s to about 1.6 million tonnes by 2000. During the 1980s, biomass
Chum salmon have decreased in the Amur due to overfi shing. In 1910,
Table 8
Catches of commercial fi sh from the Sea of Okhotsk between 1992 and 2003
1992
1994
1996
1998
1999
2000
2001
2002
2003
(thousand
(thousand
(thousand
(thousand
(thousand
(thousand
(thousand
(thousand
(thousand
tonnes)
tonnes)
tonnes)
tonnes)
tonnes)
tonnes)
tonnes)
tonnes)
tonnes)
Catches's by Russia's fleet in the Sea of
1 510.8
1 495.9
2 132.6
1 878.4
1 454.1
1 418.5
1 257.8
865.3
1 060.0
Okhotsk (according to DalRyba)
Catches by Russia's and foreign fleets in the
2 353.2
1 775.2
2 417.6
2 030.0
1 584.2
1 509.1
1 308.7
ND
ND
Sea of Okhotsk (according to Radchenko)
30
GIWA REGIONAL ASSESSMENT 30 SEA OF OKHOTSK
45 000 tonnes of autumn Chum salmon were fi shed annually, compared
Socio-economic impacts
with only 2 000 to 5 000 tonnes between 1991 and 2001.
The fi shing industry is a major determinant of the region's social
and economic characteristics. It provides an important source of
The Humpback salmon is a relatively important fi shery. Variations in
employment, with one fi sherman creating 6-7 work places onshore.
the productivity of the fi shery results in abundant catches one year
In the Russian part of the Sea of Okhotsk region the fi shing industry
followed by limited catches the next year. In the 1920s and 1930s,
accounts for 21% of GRP and in Kamchatskaya Oblast' as much as 53%.
20 million fi sh with a total weight of 10 000-14 000 tonnes were caught
every other year, while catches in the other years weighed a total of only
The fi shing industry has experienced a downturn as a result of reduced
1 200 tonnes. Catches have continued to decrease since then; today,
fi sh stocks. About 3 500 fi shermen became unemployed in the region,
total annual catches of Humpback salmon weigh between 200 and
meaning that 10 000 dependents also lost their incomes (Okey 2003).
500 tonnes (Shuntov 2001).
Indirect unemployment data confi rms that the pressure on the fi shing
labour market (number of persons applying for one job vacancy) in the
In the early 20th century the summer Chum salmon was extensively
region is over twice that of any other region in Russia. In 1999, around
fi shed in the Amur River. In 1910, average annual catches weighed a
200 000 people were estimated to be unemployed in the fi shing
maximum of 53 400 tonnes. As a result of relentless overfi shing and
sector of the region. Since then, unemployment has continued to
unfavourable spawning conditions during the winter months, stocks of
grow (Voitolovsky et al. 2003).
summer Chum salmon rapidly declined between 1914 and 1932, leading
to the near collapse of the fi shery.
The capacity of the fi shing fl eet and refrigerating vessels has decreased
by over two-thirds and the production of tinned food fi ve-fold since
At the beginning of the 20th century, catches of sturgeon in the
1990 (Barushko 2005). By 2010, only 10% of fi shing vessels (again with
Lower Amur River totalled 250-350 tonnes, 4-5 times less than catches
respect to 1990) will be operational, the number of refrigerator vessels
between 1890 and 1895. Between 1923 and 1930, sturgeon fi shing was
will decrease four-fold, and the production of tinned food eight-fold.
prohibited. In the late 1930s, catches totalled 150-190 tonnes, which
This could lead to the collapse of the fi shing industry, changes to the
decreased to 75 tonnes a decade later. Today, catches continue to
type of food consumed in the region, a downturn in the regional
decrease (Wei et al. 2004). Poaching and illegal catches of Amur and
economy, a rise in unemployment and emigration from coastal
Kaluga sturgeons are believed to occur throughout the Basin (Wei et
settlements (Zhuk et al. 2003).
al. 2004).
The fi shing industry is important for the social structure of coastal
Owing to unfavourable natural conditions and anthropogenic factors,
communities. Unemployment and reduced incomes due to the
catches of fi sh since 1996 have been relatively small. Total fi shing
downturn in the fi sheries, combined with a lack of alternative job
catches in the Lower Amur basin for 1999 have been estimated by the
opportunities, have led to the migration of the population to other
TINRO-Centre at 5 000 tonnes (Kondratyeva et al. 1999). Further, catches
regions of the country. In addition, the local population receives less
contain a higher proportion of juvenile fi sh, indicating that the average
protein as fi sh consumption per person decreased by 50% between
fi sh size has declined. Illegal fi shing in the Amur Basin is exacerbating
1990 and 2002 (The Development Concept 2003).
the situation, but has not been fully researched.
Conclusions and future outlook
In Heilongjiang province of China, fi shing and fi sh farming are
Over the past 15 years, total catches in the Okhotsk Sea sub-system
important industries. The province's population has grown rapidly in
have reduced by 2-2.5 times. Catches of pollock ş the major commercial
the past 50 years, and especially in the last 20 years. Fishing and habitat
species ş have decreased signifi cantly in recent years due to a reduction
modifi cation have led to the disappearance of sturgeons, salmon, and
in fi sh stocks caused mainly by overfi shing. Because the central area
other fi sh species in the Songhua River. In the Upper and Middle Amur,
of the Sea is outside of any country's EEZ, access to the biological
sturgeon populations have signifi cantly decreased. Fishing farming was
resources is open to international fi shing fl eets, not only from Asia but
developed as an alternative to fi shing in the mid-1960s. In 2002, fi sh
from countries as far away as the Baltic. The quantity of pollock caught
farming produced almost 90% of the entire regional fi sh harvest (over
by these fl eets makes estimating total catches extremely diffi
cult, if not
400 000 tonnes) (Novomodny et al. 2004).
impossible. However, the reduction in pollock available at local markets
is a good indication of the poor state of fi sh stocks.
ASSESSMENT
31
In the Amur River Basin, stocks of salmon and sturgeon have declined
as a result of overfi shing and the degradation of spawning habitats.
I. Freshwater
shortage
The problem is exacerbated by inappropriate fi shing practices as well
as adverse natural conditions. There has been a decrease in the size
and age of the population due to intense fi shing during the spawning
season. The GIWA regional experts expect that salmon will continue to
III. Habitat and
II. Pollution
be overfi shed for the foreseeable future.
community
modification
T
C
A
Global change
IMP
IV. Unsustainable
exploitation of living
V. Global change
There are insuffi
cient data available to accurately assess the
resources
environmental and socio-economic impacts of global changes.
Figure 12 Synergies and inter-linkages between the GIWA
concerns.
The synergies and linkages between the concerns are illustrated in
Priority concerns for further
Figure 12. The severest issue facing the Okhotsk Sea sub-system was
analysis
identifi ed as overexploitation. The fi sheries of the Sea of Okhotsk region
continue to be overfi shed despite the implementation of regulatory
The priority issues selected for further analysis by the GIWA regional
and control measures. The fi sheries industry has declined due to catches
experts were: eutrophication in the Amur River Basin sub-system; oil
declining by one-third in the last ten years.
spills in the Okhotsk Sea sub-system; and overexploitation in the entire
Sea of Okhotsk region. The GIWA concerns were prioritised as follows:
The water quality of the Okhotsk Sea sub-system appears to be better
1. Pollution
than other Pacifi c seas and does not pose any threat to human health.
2. Unsustainable exploitation of fi sh and other living resources
However, oil spills were chosen for further analysis because the risk of
3. Freshwater
shortage
them occurring will increase in future due to oil and gas development in
4. Habitat and community modifi cation
the region. Eutrophication is threatening the ecological integrity of the
5. Global
change
Amur River Basin sub-system and the well-being of its population.
According to the GIWA regional experts, the impact of the concerns is
likely to remain the same or slightly increase in severity in the future.
32
GIWA REGIONAL ASSESSMENT 30 SEA OF OKHOTSK
Causal chain analysis
This section aims to identify the root causes of the environmental and socio-economic impacts resulting
from those issues and concerns that were prioritised during the assessment, so that appropriate policy
interventions can be developed and focused where they will yield the greatest benefi ts for the region.
In order to achieve this aim, the analysis involved a step-by-step process that identifi ed the most
important causal links between the environmental and socio-economic impacts, their immediate causes,
the responsible human activities and economic sectors and, fi nally, the root causes that determine the
behaviour of those sectors. The GIWA Causal chain analysis (CCA) recognises that, within each region, there
is often enormous variation in capacity and great social, cultural, political and environmental diversity. The
CCA uses a relatively simple and practical analytical model. For further details on the methodology, please
refer to the GIWA methodology section in the end of this report.
The prioritised transboundary issues of oil spills in the Okhotsk Sea sub-
penetration in the water column and, therefore, the productivity of
system, eutrophication in the Amur River sub-system and overexploitation
photosynthetic plants;
in the whole region are studied further in the CCA in order to identify their
Increased ecological risks, including poisoning of fi sh;
root causes so that policy options and priority actions can be developed
Decreased oxygen levels due to an increase in microscopic
by decision-makers in the region to address these driving forces of
organisms which feed on decaying plant matter;
adverse environmental pressures. For further details of the environmental
Algal blooms in coastal and freshwater systems;
and socio-economic impacts, and immediate causes of the prioritised
Reduced
biodiversity;
concerns, please refer to the Assessment chapter.
Changes to the hydrological, chemical and temperature regimes;
Deterioration of reproduction and spawning conditions; and
Migration of species away from aff ected areas.
Eutrophication
Socio-economic impacts
Reduced
fi
sheries
productivity;
Environmental and socio-economic impacts
Loss of recreation amenities and unpleasant odours during the
Environmental impacts
winter;
Poor water quality and pronounced eutrophication during minimal
Decreased availability of potable water for the population in
fl ow periods in the winter and summer;
Priamurye;
The water quality of the Lower Amur is classifi ed as V-VI (i.e.
The consumption of contaminated fi sh is aff ecting the health of
contaminated, polluted, or heavily polluted);
indigenous populations, particularly those living on the banks of
The growth of phytoplankton and zooplankton has reduced light
the Amur, Nanaian, Ulchi and Niwchs rivers.
CAUSAL CHAIN ANALYSIS
33
Immediate causes
of regulations for protected areas; and (vi) lack of public awareness,
Considerable quantities of organic matter and biogenic material
and creation and mobilisation of civil communities in monitoring
enter the Amur River within domestic and industrial wastewaters and
and management of land and water in the basin (GEF Concept paper
surface run-off from the basin (particularly during periods of heavy
2005).
rainfall). The run-off of fertilisers from agricultural areas also stimulates
eutrophication.
Each riparian country explores its own economic development and/or
conservation of ecosystems. However, in the absence of a basin-wide
The sectors responsible for eutrophication were identifi ed by the GIWA
institutional mechanism, transboundary issues were not given attention
regional experts as:
in national policy and each riparian country's conservation eff orts
Industry
were not conducted in an effi
cient manner. To date, there have been
Urbanisation
limited basin-wide cooperative actions, although local governments
Agriculture
have demonstrated a willingness to work together in addressing
Aquaculture
transboundary issues. Further, stakeholders do not have platforms
to discuss and provide suggestions for decision-making institutions
Root causes
with their country or regionally. Diff erences in regulations and weak
There are a number of institutional weaknesses which are either
enforcement capacities have led to uncoordinated approaches to the
promoting or failing to prevent transboundary pollution in the Amur
management of protected areas (GEF Concept paper 2005).
River Basin. These include, among others: (i) lack of economic planning
harmonised with the need for conservation and sustainable use of
Each country has developed its own monitoring programmes to
living resources and ecosystem functions in the basin; (ii) inadequate
provide baseline environmental information. However, there is a
basin-wide legal and institutional arrangements among the riparian
serious gap in the amount of available data and their quality for the
countries in addressing transboundary environmental issues; (iii)
purpose of technically sound, policy-relevant decisions. Many of the
inadequate capacities of institutions involved in water and other
data produced by the riparian countries are not comparable in their
resource management and environmental protection, and lack of
quality, and much of the information is not accessible by the public
wider stakeholder participation; (iv) signifi cant gap in information
or decision-makers, particularly beyond the national boundaries (GEF
and monitoring activities in identifying transboundary environmental
Concept paper 2005). A major hindrance for policy-makers when
issues in the basin; (v) lack of harmonised designation of protected areas
setting priorities for remediation is the lack of knowledge of the
among the riparian countries and gap in the degree of enforcement
ecological characteristics and their reaction to human activities. The
Impacts
Issues
Immediate causes
Sectors/Activities
Root causes
Environmental:
Discharge of organic matter
Institutional weaknesses
Industry
- Deterioration of water
and biogenic material
including the lack of a
quality
within domestic and
basin-wide institutional
- Reduced biological
industrial wastewaters
mechanism
productivity and
Eutrophication
biodiversity
Urbanisation
Lack of stakeholder
- Reduced oxygen
Increased run-off of
participation
concentrations in water
artificial fertilisers
- Degradation of
reproduction and
Incompatible regulations
spawning grounds
Agriculture
and weak enforcement
- Forced migration of
Nutrient run-off from
species
catchment area
Lack of public awareness
Socio-economic:
Aquaculture
- Reduced fisheries
productivity
Defencies in policy relevant
- Loss of recreation
environmental information
amenities
- Unpleasant odours
Insufficient regional data
- Decreased availability of
exchange
potable water
- Health risks from the
consumption of
Obsolete wastewater
contaminated fish
infrastructure
Figure 13 Causal chain diagram illustrating the causal links for eutrophication in the Amur River Basin.
34
GIWA REGIONAL ASSESSMENT 30 SEA OF OKHOTSK
Khabarovsk and Amur Scientifi c Centres of the Far East Branch of the
There are plans to establish an oil and gas distribution network to
Russian Academy of Sciences have collated data on diff erent natural
supply the markets of the Asian-Pacifi c Region. Pipelines from Siberia
parameters, complexes and ecosystems. There has, however, been
and Sakhalin to Vladivostok are planned, some of which would be laid
no comprehensive assessment of this data (Voronov 2003). The true
along the Amur River. Two alternative oil pipeline routes and several
impact of pollution on freshwater ecosystems in the Basin is unclear.
transnational gas pipelines are proposed (Alekseev et al. 2001).
The public lacks awareness of the environmental issues, including
eutrophication, aff ecting freshwater ecosystems and their well-being.
The future socio-economic impacts of potential spills in the Okhotsk
Information exchange between the countries sharing the Amur River
Sea sub-system will include the cost of oil spill response and clean-up
Basin is limited and policy-makers, the public and other stakeholders
operations, the rehabilitation of habitats, and ecological protection
have insuffi
cient access to ecological databases and information. There
and monitoring, as well as the rehabilitation and treatment of rare and
is also the absence of a basin-wide monitoring system.
commercially important species (Baklanov et al. 2002a).
Wastewater treatment infrastructure is often obsolete due to insuffi
cient
Root causes
funds for maintenance and a lack of investment in new facilities.
In the Russian Far East, oil and gas exploitation is seen as a means of
Economic root causes of environmental degradation, including the
generating immediate revenues. Government authorities, international
demand for short-term economic gains, an inappropriate taxation
companies, and public fi nancial institutions have focused their attention
system and fi nancial-credit policies, inequitable development within
on developing the Sakhalin's oil and gas fi elds as rapidly as possible.
the region, and the unattractive investment climate, stem from the
Limited eff ort has been made to strengthen Sakhalin's capacity to
Russian Far East's long economic recession and the major reforms in
prevent and respond to oil spills (Lawn et. al 2001).
the economic and social structures of Russia.
There is a lack of preparedness for an environmental emergency and
The linkages between the root and immediate causes of eutrophication
insuffi
cient measures have been adopted to mitigate any possible
and their environmental and socio-economic consequences in the
impact on coastal marine and freshwater ecosystems. There is an
Amur River Basin sub-system are presented in Figure 13.
absence of a regional mechanism that evaluates the transboundary
consequences of the proposed oil and gas infrastructure and associated
economic development. Public discussion among the riparian countries
about these issues has not been initiated (GEF Concept paper 2005).
Oil spills
Currently, there is a lack of funding for environmental protection
Environmental and socio-economic impacts and
and social welfare programmes in order to avoid the negative
immediate causes
consequences of oil and gas development in the region. The region
Despite four spills occurring in the region, the overall impact of oil spills
lacks the necessary equipment for cleaning up oil spills during periods
has not been too severe. The rapid development of the Russian Sakhalin
of fast-ice consolidation. The Sakhalin Basin Agency for Emergency
shelf for oil and gas exploration, exploitation and transportation will,
Situations has insuffi
cient technical resources to decontaminate large
however, increase the probability of oil spills. Despite providing many
and/or remote oil spills. Many oil tankers operating in the region do not
economic benefi ts, oil and gas production in Sakhalin may cause
have double hulls.
ecological problems. For example, oil spills would degrade spawning
habitats of commercially important fi sh in the region. The northeastern
According to the GIWA regional experts, these root causes are
coastal waters of Sakhalin Island will be particularly vulnerable to future
determined by the poor economic development in the Russian Far East
oil spills (PICES 2004). Further, when drilling oil wells and during oil
and the dramatic social and economic changes Russia has experienced
production, poisonous waste products are produced.
over the past 20 years.
Oil and gas exploitation is likely to also commence on the northwest
The linkages between the root and immediate causes of oil spills in the
shelf of Kamchatka and in the lower reaches of the Amur River Basin. Oil
Okhotsk Sea sub-system and their environmental and socio-economic
refi ning and gas processing will be developed in Sakhalin Island and in
consequences are presented in Figure 14.
Khabarovskiy Kray, but limited amounts will be processed in Kamchatka.
CAUSAL CHAIN ANALYSIS
35
Impacts
Issues
Immediate causes
Sectors/Activities
Root causes
Environmental:
Short-term economic
Increased oil and gas
Oil and gas
- Potential degradation of
planning
exploration and extraction
industry
reproduction and
spawning grounds
Inadequate emergency
- Potential deterioration in
contingency plans
the quality of coastal
Increased marine
waters
Oil spills
transhipment of oil and gas
Absence of a regional
- Impairment or mortality of
mechanism that evaluates
aquatic and avian species
the transboundary
consequences of the
Socio-economic:
Development of inland oil
proposed oil and gas
development
- Cost of oil spill response
and gas distribution network
and clean-up operations
- Cost of rehabilitating
Lack of appropriate
habitats and treating
equipment for cleaning up
Development of oil and gas
injured organisms
oil spills
processing and refinement
- Potential reduction in
facilities
fisheries production
Many tankers do not have
- Temporary loss of
double hulls
recreation amenities
Figure 14 Causal chain diagram illustrating the causal links for oil spills in the Sea of Okhotsk.
Overexploitation of fish and
Immediate causes
other living resources
Excessive fi shing eff ort and fl eet capacity
Over the past several decades, fi shing eff ort has increased dramatically.
Environmental and socio-economic impacts
The capacity of the fi shing fl eet operating in the seas of the Russian Far
Environmental impacts
East exceeds catch limits by approximately seven-fold. Over 100 crab
The main commercial fi sh stocks have been severely depleted;
fi shing boats have the capacity to far exceed the average annual
Regional
populations
of
whales
have declined dramatically, with
allowable catch for King crab (Spiridonov 2001).
many species endangered or critically endangered;
Stocks and catches of the main commercial fi sh species ş walleye
Excessive by-catch and discards
pollock ş reduced more than two-fold within two decades;
Although there is a lack of data to verify its impact, the volume of
Species which are valuable on the international fi sh markets, such
by-catch and discards of non-target species is also believed to be
as sea urchin and king crab, are at particular risk;
a signifi cant cause of overexploitation (Spiridonov 2001, Ozolinsh &
Overfi shing of the main commercial species has destabilised the
Spiridonov 2001, Kotenev & Zaytseva 2003).
aquatic ecosystems of the Sea of Okhotsk region.
Populations of Chum and Humpback salmon, and sturgeon,
Illegal fi shing
among others species, have decreased in the Amur River due to
The uncontrolled extraction of fi sheries resources by the illegal fi shing
overfi shing.
sector is contributing to overfi shing. Account auditors of the Chamber
The average fi sh size in the Amur River Basin has decreased with
of the Russian Federation believe that greater volumes of King crab
catches containing a higher proportion of juvenile fi sh.
and sea-urchin are often supplied illegally to the Japanese market than
the entire catch limit for the Okhotsk Sea (Nazarov 2004). Poaching of
Socio-economic impacts
Walleye pollock, which has a growing demand in markets of the Pacifi c
Reduced catches has caused a downturn in the fi sheries industry;
region, exceeds established TACs by 2-3 times (Kotenev & Zaytseva
High unemployment in the fi sheries sector;
2003, Ozolinsh & Spiridonov 2001, Spiridonov 2001). Illegal fi shing is
Reduction in economic returns and investment activity;
believed to occur in the Amur River Basin sub-system but it has not
Consumption of fi sh products per capita has decreased;
been fully investigated.
Social problems and reduced quality of life for inhabitants of fi shing
communities due to a loss of household income; and
Loss of spawning habitat
Increased competition for the limited fi sheries resources has led to
The spawning habitat of salmon and other fi sh species has been
the growth of a black market in fi sh products, confl icts between
degraded due to eutrophication and other forms of pollution in the
groups of fi shermen, and greater corruption.
Amur River Basin and in the rivers of Sakhalin. Fishing and habitat
36
GIWA REGIONAL ASSESSMENT 30 SEA OF OKHOTSK
modifi cation have led to the disappearance of sturgeons, salmon and
and the Republic of Korea. The illegal export market to Japan is around
other fi sh species in the Songhua River (China).
20 times more valuable than the legal market (5-7 billion USD compared
to 300 million USD) (Okey 2003).
Root Causes
Economic
Governance
Economic policy and market trends have aggravated the problems
Fisheries management is opaque to the public and fi shermen, and
faced by the fi shing sector. The reform of Russian economic policy,
highly corrupt. Coastguards detain no more than 2% of the fi shermen
market failures, and inappropriate taxation and fi nancial credit systems
who violate the law and some even participate in poaching themselves
are causing economic hardship for fi shing communities and forcing
(Ozolinsh & Spiridonov 2001). In 2000-2001, annual illegal catches in
fi shermen to increase fi shing eff ort in order to receive suffi
cient income.
the Far East seas of Russia caused by the ineffi
cient monitoring and
As a result of these economic conditions, the social and environmental
enforcement system have been estimated at 1.5 million tonnes of
problems of the fi shery have been aggravated (Voitolovsky et al. 2003,
Walleye pollock and 27 000 tonnes of King crab (Kotenev & Zaytseva
Titova 2004).
2003). Russian fi shermen are dissuaded from landing their catches
in Russian ports due to complicated, bureaucratic procedures and
The large number of intermediaries between fi shermen and consumers
having to pay fees. Bribing of offi
cials is known to occur in the region
has led to a signifi cant rise in the prices on the domestic market which
(Voitolovsky et al. 2003). Small-scale fi sheries and coastal fi shing
has decreased consumer demand. The decline in domestic fi sh sales
associations have not been supported during the periods of political
has negatively aff ected the prosperity of fi shing communities. While
and economic reform (Belyaev et al. 2004). Alternative employment
increased demand for specifi c species on the international fi sh
opportunities are neither available nor created by the government.
market has resulted in their overexploitation, other species remain
underexploited.
Technology
Drift nets are used in the salmon fi shery of the Okhotsk Sea sub-
The excessive by-catch and discard of non-target species and small fi sh,
system. Although the number of vessels using these nets has reduced
as well as the growth of the illegal fi shery, are associated with fi shermen
considerably since the 1970s, one of these vessels can kill about
needing to increase their income in the short-term. Moreover, fi shermen
1 000 sea birds, ten dolphins and several seals in one year. Some sea
land their catches at the ports of other coastal states in order to avoid
birds are attracted to the searchlights of vessels fi shing at night for
registering their catches in Russia.
crabs and become caught in the nets. When crab traps are disposed of
overboard they pose a great danger to sea vertebrates and fi shes. The
The introduction of auctions of fi sh quota-rights, in addition to a
number of such traps left on the sea bottom continues to increase every
burdensome tax system, has reduced the profi tability of the fi sheries,
year (Ozolinsh & Spiridonov 2001).
resulting in fi shermen undertaking poaching and illegal fi shing in order
to supplement their income. For the purchase of a King crab quota to be
Stocks of invaluable fi sh species, such as Green cod, fl ounder, squid and
economically viable, it is necessary to catch 3-4 times more crabs than
various shrimp species are underexploited. The fi shing fl eet and coastal
the quota allows (Korelsky et al. 2003). The requirement of purchasing
processing plants are not equipped to process these less valuable fi sh
quotas has led to infl ated fi sh prices, increased debt and a reduced
species (Spiridonov 2001).
income for fi shing households (Zilanov 2004). Fishermen are forced to
catch more fi sh in order to maintain their profi t levels. The existing fi shing
Today, the average ages of large-capacity vessels (with an operational
auction system is perceived negatively by the majority of fi shermen. The
age of 20 years), medium capacity vessels (with an 18 year operational
reduction in economic returns and investment activity in the fi sheries
age) and small capacity vessels (with a 12 year operational age) are
sector has prevented the modernisation of the fl eet and fi shing gear.
21.6 years, 15.6 years and 18.9 years respectively. Due to the ageing of
fi shing and tinned food mother-ship vessels, many are out of service
Legal
and have not been replaced.
Russian and international fi sheries laws and regulations are undermined
by deep-rooted corruption and ineff ective enforcement (despite
Education and knowledge
vessel confi scations by the Russian coast guard). The weak legislative
According to the GIWA regional experts, there are a lack of fi sheries
framework in Russia leads to the illegal export of fi sh products to Japan
statistics and monitoring programmes. An ecosystem approach is not
CAUSAL CHAIN ANALYSIS
37
Impacts
Issues
Immediate causes
Sectors/Activities
Root causes
Environmental:
Economic and market
Excessive fishing effort and
- Depletion of major
Fishing industry
trends
fleet capacity
commercial fish stocks
- Aquatic ecosystems
Laws and regulations are
have been destabilised
undermined by deep-
- The average size of fish
Excessive by-catch and
rooted corruption and
in the Amur River Basin
Overexploitation
discards
ineffective enforcement
has decreased
Institutional
Illegal fishing
weaknesses
Socio-economic:
- Downturn in the
fisheries industry
The lack of facilities for
- High unemployment in
processing less valuable
the fisheries sector
Loss of spawning habitat
fish species
- Decreased investment
activity
Lack of fisheries statistics
- Decreased consumption
and monitoring
of fish products per
capita
- Reduced quality of life
due to a loss of
household income
- Growth of black market
and increased
corruption
Figure 15 Causal chain diagram illustrating the causal links for overexploitation in the Sea of Okhotsk region.
used to calculate TAC quotas. There is inadequate knowledge of the size
fi shing in the Sea of Okhotsk region (Ozolinsh & Spiridonov 2001,
of fi sh stocks and their maximum sustainable yield (Kotenev & Zaytseva
Novomodny et al. 2004). Additionally, environmental education and
2003). Until recently, by-catch had not been considered in fi sheries
ethics are weak and there are few research agreements between Russia,
statistics or in establishing catch quotas (PICES 2004), and fi sheries
China and Mongolia (Novomodny et al. 2004).
managers have insuffi
cient access to ecological databases. Fishermen
lack awareness of the long-term impacts of overfi shing on the viability
The linkages between the root and immediate causes, and the
of regional fi sh stocks and, consequently, their future livelihood. There
environmental and socio-economic impacts of overexploitation in the
is insuffi
cient exchange of fi sheries information between the countries
Sea of Okhotsk are presented in Figure 15.
38
GIWA REGIONAL ASSESSMENT 30 SEA OF OKHOTSK
Policy options
This section aims to identify feasible policy options that target
national actions. Much of the data produced by the riparian countries
key components identifi ed in the Causal chain analysis in order
is not presented in a format suitable for policy- makers, and information
to minimise future impacts on the transboundary aquatic
is often not accessible by the public or decision-makers, particularly
environment. Recommended policy options were identifi ed
beyond the national boundaries (GEF Concept paper 2005). Wastewater
through a pragmatic process that evaluated a wide range of
treatment infrastructure is frequently dilapidated due to insuffi
cient
potential policy options proposed by regional experts and
funds for maintenance and a lack of investment in new facilities.
key political actors according to a number of criteria that were
appropriate for the institutional context, such as political
Policy framework
and social acceptability, costs and benefi ts and capacity for
The policy options for addressing eutrophication in the Amur River Basin
implementation. The policy options presented in the report
should be based upon the principles established at the World Summit
require additional detailed analysis that is beyond the scope
on Sustainable Development (WSSD 2002). There are also several other
of the GIWA and, as a consequence, they are not formal
international conventions, as well as Chinese and Russian legislation,
recommendations to governments but rather contributions to
regarding environmental protection and sustainable development
broader policy processes in the region.
that should be considered. Asset 42 of the Constitution of the Russian
Federation gives a human right to a propitious environment and calls
for reliable information about its state to be collated.
Eutrophication in the Amur
In this respect, the policy options should aim at not only halting the
River Basin sub-system
increasing trends of eutrophication but also at gradually curtailing
nutrient enrichment processes and rehabilitating ecosystems.
Problem definition
Eutrophication in the Amur River Basin sub-system has been caused
The main objectives of the policy options should include the
by the increasing quantities of nutrients discharged in domestic and
following:
industrial wastewater, and by the run-off of chemical fertilisers from
Accurately calculate the water budget of the Amur River Basin,
cultivated land in the catchment area. Population growth, economic
including the assessment of the freshwater dynamics;
development and the intensifi cation of agriculture will exacerbate
Assessment, protection and control of water quality in the Basin;
eutrophication in the future.
Coordination of water management in the basin;
Assessment of status and changes in relation to:
A range of institutional weaknesses are either promoting or failing to
ş Forests and forest management and the connections with
prevent transboundary pollution in the Amur River Basin sub-system.
water and water management;
Economic planning does not incorporate environmental considerations
ş
Land and land use and the connections with water and water
or involve stakeholders. There is an absence of basin-wide institutional
management;
arrangements, and transboundary issues are not given attention in
Land use zoning in the basin;
POLICY OPTIONS
39
Coordination of natural resources management in the basin; and
Oil spills in the Okhotsk Sea
Development of a basin-wide management system for water
sub-system
resources.
Problem definition
Policy options
The exploitation of oil and gas fi elds in southern Sakhalin is resulting
There is a need to improve the social well-being of the population,
in the release of oil products in concentrations above maximum
restore the environment, promote the sustainable use of natural
permissible limits into shallow bays. Oil contamination has been
resources, and to develop an integrated regional policy regarding river
recorded along the northeastern coast of Sakhalin Island. Further oil and
basin management in Priamurye (Russia), and between Russia, China
gas development on the Sakhalin shelf will increase the risk of oil spills in
and Mongolia.
the future. While government authorities, international companies, and
public fi nancial institutions have focused their attention on developing
The establishment of an international monitoring programme to regularly
Sakhalin's oil and gas fi elds as rapidly as possible, they have given little
assess the current ecological status of the freshwater environment
attention to preparing the region to prevent and respond to oil spills
within the Amur River Basin involving institutions of China, Mongolia
(Lawn et al. 2001).
and Russia. The components of such a monitoring programme should
include:
Policy framework
Environmental
monitoring;
Russia has ratifi ed the International Convention for the Prevention of
Assess the resource potential of the Amur River Basin;
Pollution from Ships, 1973, as modifi ed by the Protocol of 1978 (MARPOL
Develop criteria/indicators for evaluating environmental change in
73/78). The Regulations for the Prevention of Pollution by Oil (1983)
the Basin;
provides a legislative framework for oil spill prevention. In Russia, legal
Create maps showing zones which represent the various degrees
provisions for the prevention of oil spills are found in the Law No. 2060-
of anthropogenic-induced environmental change in the Amur River
1 of 1991 of the RSFSR on Environmental Protection which guarantees
Basin; and
citizens Constitutional rights to a healthy environment.
Predict
future
environmental
changes.
The government of the Russian Federation has converted these
Conduct transboundary environmental impact assessments before
legislative provisions into concrete actions and programmes through
undertaking infrastructure development, such as hydroelectric plants,
a number of resolutions:
nuclear power plants, fl ood-control systems, and land reclamation
Resolution of the Russian Government No 613 on Immediate
schemes. The results of such assessments should be incorporated into
actions on oil spill prevention and response, 2000;
development strategies so that not only the environmental changes
Russian Government Resolution No 240 on the Order of oil spill
within a country are considered but also those in the other countries
prevention and response activities organisation on the territory of
sharing the Amur River Basin. The following should be considered:
the Russian Federation, 2002; and
Problems of water consumption, wastewater treatment, surface
Russian Government Resolution No 794 on the Unifi ed state system
run-off and changes to the hydrological regime;
of emergencies prevention and response, 2003.
Impact of agriculture, forestry and mining development;
Impact of fi shing and aquaculture on ecosystems, migrating
The fi rst of these resolutions includes technical and organisational
species and rare species of fl ora and fauna;
measures for preventing oil spills, including:
Develop a basin-wide network of protected areas;
Monitoring of potential oil spill accidents;
Multi-national and coordinated monitoring of environmental
Number of emergency services and facilities needed for clean-up
quality; and
operations following an oil spill;
Prepare and adopt an agreement between China, Mongolia and
Organisational arrangements for cooperation between emergency
Russia which establishes the principles of river basin management
services;
in the Amur River Basin.
System of control and early warning;
Securing constant readiness of all emergency services;
System of information exchange;
Procedures for immediate action after an emergency alert;
40
GIWA REGIONAL ASSESSMENT 30 SEA OF OKHOTSK
Surveillance of geographic, navigational, hydrographic, hydro-
Establish regular forums for stakeholders, such as the indigenous
meteorological and other environmental conditions of the area
population and local industries, to discuss with government
surrounding the oil spill in order to plan clean-up operations; and
authorities and oil companies their concerns over problems related
Safety of the population and provision of medical aid.
to the oil and gas development;
Create mechanisms to compensate businesses or individuals for
The following unresolved problems have been taken into consideration
damages caused by the oil and gas development;
during the formulation of the policy options:
Review operational procedures and create an operational safety
Lack of appropriate equipment for the decontamination of oil spills
system to reduce the risk of spills; and
during fast-ice consolidation;
Ensure presence of independent technical and environmental
Sakhalin Basin Agency lacks the technical equipment and facilities
inspectors at the off shore oil and gas fi elds to ensure compliance
to clean-up large and/or remote oil spills;
with Russian law.
Lack of double-hull tankers; and
While the increasing volumes of oil being transported across the
Technology
Okhotsk Sea will heighten the risk of oil spill incidents, emergency
Use surveillance technologies, such as radar, to monitor tanker
services remain under-developed.
traffi
c;
Modernise transport and oil distribution infrastructure to comply
Policy options
with highest environmental standards;
Economy
Use appropriate navigational aids to minimise the risks of spills; and
Improve economic and fi nancial mechanisms for environmental
Phase in double hulls for all vessels using the tanker ports and
protection;
off shore terminals.
Provide funds for the rehabilitation of ecosystems in the event of
an oil spill;
Education and knowledge
Evaluate the long-term environmental and socio-economic costs
Support regional scientifi
c research into the ecological
of oil and gas infrastructure development;
consequences of oil and gas operations in the region;
Compensate the local population and other economic sectors for
Build capacity in the institutions responsible for environmental
the negative eff ects of oil and gas extraction, and in the event of
monitoring;
an oil spill;
Ensure high standards of training for employees of oil companies
Accurately assess the economic value of the natural resources of
and the crews of tankers;
the Okhotsk Sea, particularly those along the coast of Sakhalin.
Conduct regular and independent (subject to peer review)
Provide economic incentives (and disincentives), such as discounted
Environmental Impact Assessments (EIAs) for the entire Sakhalin
(or increased) ports fees, to oil companies which use (or do not use)
coastline;
environmentally sound practices, like double hulled tankers.
Monitor shipping activity:
Estimate the carrying capacity of the region's ecosystems prior to
Legal
developing oil and gas fi elds;
Legislation should be comprehensive and consistent;
Carry out constant environmental monitoring during the entire
The use of regulations, restrictions and prohibitions needs to
period that the oil and gas fi elds are exploited; and
be balanced with the promotion of operational safety and
Develop environmental awareness campaigns to encourage public
environmental protection using appropriate technologies; and
engagement in the development of the region for oil and gas.
Industry self-regulation, independent monitoring and regular
auditing of internal control systems should be encouraged, in
The proposed options can be implemented on diff erent scales: (i)
addition to State control and monitoring provisions.
internationally, e.g. multi-lateral investigations into the risks of oil spills
and the adoption of internationally recognised best technologies; (ii)
Governance
nationally e.g. strengthen the enforcement of Federal laws related
Minimise the adverse eff ect of oil and gas production on other
to pollution; and (iii) locally e.g. develop operational safety and
economic sectors;
environmental protection measures based on accurate scientifi c and
technical information.
POLICY OPTIONS
41
Overexploitation of fish and
faced by the fi sheries. It is believed that the law will be fully eff ective
other living resource in the Sea only if it is further developed (Zilanov 2005).
of Okhotsk region
In addition, other international agreements and recommendations
aim to improve and better coordinate international eff orts aimed at
Problem definition
addressing overfi shing, e.g. the FAO Code of Conduct for Responsible
Overfi shing is threatening the sustainability of the most commercially
Fisheries (1995). The United Nations Conference on Environment and
valuable fi sh stocks in the Sea of Okhotsk region. The bioresources in
Development (UNCED 1992) and the World Summit on Sustainable
most demand on the global fi sheries market, such as sea urchin and
Development (WSSD 2002) also established principles regarding the
King crab, are at risk of disappearing completely from the region.
preservation of biodiversity, the protection of the marine and the
Further, the spawning grounds and habitat of salmon and other fi sh
coastal environment, and the protection and rational use of marine
have deteriorated due to eutrophication and other pollutants in the
living resources.
Amur River Basin and the rivers of Sakhalin. Overfi shing of the main
commercial species has destabilised the ecosystems of the Sea of
Despite the adoption of a number of global and regional initiatives
Okhotsk region.
aimed at addressing the problem of overfi shing, the fi sheries of the Sea
of Okhotsk region remain highly vulnerable. The following outlines the
The introduction of auctions of fi sh quota-rights, in addition to a
main achievements and obstacles facing the fi sheries sector.
burdensome tax system, has reduced the profi tability of the fi sheries,
resulting in fi shermen undertaking poaching and illegal fi shing in order
Achievements:
to supplement their income. The reduction in economic returns has also
The United Nations Fish Stocks Agreement of 1995, applying to
prevented the modernisation of the fl eet and fi shing gear. Russian and
straddling fi sh, dictates that nations shall apply the precautionary
international fi sheries laws and regulations are undermined by deep-
approach (Article 6). The principles, parameters and models used
rooted corruption and ineff ective enforcement. The illegal export
in stock assessments of the Sea of Okhotsk need to be revised
market to Japan is more valuable than the legal market (Okey 2003).
in order to execute this agreement, (Kotenev & Zaytseva 2003,
There is a lack of fi sheries statistics and monitoring programmes, and
Korelsky 2004);
fi shermen lack awareness of the long-term impacts of overfi shing.
In 2002, to reduce the negative eff ects of overfi shing, time limits
Further, the countries fi shing in the Sea of Okhotsk region insuffi
ciently
for vessels at sea and satellite monitoring of bioresources were
exchange fi sheries information and rarely conduct joint research
introduced in Russia (Bliznezov 2002);
activities (Ozolinsh & Spiridonov 2001, Novomodny et al. 2004). There is,
In 2003, the future development of the Russian fi sheries sector was
however, a growing recognition that the current trends in the fi sheries
defi ned until the year 2020 (Governmental Resolution 2003). The
sector of the region need to be halted.
resolution presented an analysis of the current status of the Russian
fi sheries sector. The policy aims to increase the sustainability of fi sh
Policy framework
stocks in the Sea of Okhotsk through:
The marine jurisdictional boundaries and hence the fi sheries boundaries
The development of a legislative and organisational framework
of Russia were determined by the United Nations Convention on the
to enable the sustainable exploitation of fi sh based on the
Law of the Sea (UNCLOS 1982), which Russia ratifi ed in 1997. The Federal
precautionary approach;
Law on the Continental Shelf of the Russian Federation (1995) defi nes
The reduction of the capacity of the fi shing fl eet to a sustainable
the status of the continental shelf of Russia in accordance with UNCLOS.
level;
The Law on Internal Seas, The Territorial Seas and Adjacent Zone of
Practical actions to implement the FAO Code of Conduct for
the Russian Federation (1998) revised Soviet-era legislation to take into
Responsible Fisheries (FAO 1995);
account the new area occupied by Russia.
The reduction of by-catch and discards;
The mitigation of socio-economic problems caused by the
In 2004, the Federal law on Fishery and Preservation of Biological
reduction of fi sh stocks in the Sea of Okhotsk;
Resources was passed. Although this may improve the status of the
The control of poaching, illegal markets and corruption; and
Russian fi shery, the new law does not resolve many of the problems
The elimination of gaps in knowledge concerning aquatic
ecosystems and the fi sheries.
42
GIWA REGIONAL ASSESSMENT 30 SEA OF OKHOTSK
Unresolved problems:
Legal
a) International (general) issues:
Enforce legislation more stringently;
Increased demand for fi sh products;
Strengthen legislation and enforcement capacity in order to
The impact of anthropogenic factors and natural variability on
eliminate corruption in the quota allocation system;
the fi sheries, which increases the fi nancial risks for the fi sheries
Improve international legislation in order to reduce poaching and
industry;
illegal landings of fi sh in other countries.
Overcapacity of the fi shing fl eet resulting in the overfi shing of
commercial stocks;
Governance
Lack of effi
cient international mechanisms and coordination
Formulate policies that promote the adoption of more sustainable
between the concerned countries to combat illegal fi shing;
fi shing practices;
Gaps in fi sheries statistics and low quality of collected data on
Implement the FAO Code of Conduct for Responsible Fisheries;
which scientifi c conclusions are based; and
Ensure economic and social sustainability in the fi sheries sector;
Gaps in knowledge needed in order to establish TACs based on an
Develop a national social strategy for the fi sheries sector aimed
ecosystem approach.
at securing optimal employment and stable incomes for those
employed in the fi sheries sector;
b) Russian issues:
Strengthen the capacity of national fi
sheries control and
Economic crisis caused by market reforms following the collapse of
enforcement agencies;
the Soviet Union.
Incorporate accurate fi sheries statistics into the decision-making
Lack of governmental support for unemployed fi shermen and
process;
the coastal fi shery which is resulting in the stagnation of social
Adjust quotas according to the capacity of fi shing vessels;
standards in coastal settlements where the fi shery is the dominant
Increase the transparency and equality of the Russian quota
economic activity;
allocation system, taking into account the fi nancial constraints of
The fi sheries industry of the region is characterised by deteriorating
the small-scale coastal fi shery; and
fi shing gear and processing facilities, an obsolete fi shing fl eet, and
Develop international sturgeon restocking programmes.
the widespread use of non-selective fi shing gear;
Increased export-oriented fi shery;
Technology
Lack of effi
cient policy to control by-catch and discards and
Provide incentives and disincentives to encourage the use of
insuffi
cient fi nancial support for the processing of fi sh with a low
selective fi shing gear; and
market value; and
Develop
alternative
fi
shing
gear.
The lack of transparency in the fi shing quota allocation system
allows corruption, illegal transactions and provokes confl ict among
Education/knowledge
fi shermen.
Improve the knowledge of fi sheries dynamics and initiate fi sh stock
assessments based on an ecosystem approach;
Policy options
Set TACs based on more accurate fi sheries statistics; and
Economy
Disseminate information to fi shermen and the local population to
Reduce the capacity of the fi shing fl eet by compensating fi shermen
build awareness of the environmental and socio-economic benefi ts
if they voluntarily decommission their fi shing vessels;
of sustainable fi shing.
Invest in facilities to process less commercially valuable fi sh caught
as by-catch, which are currently discarded; and
Review and reform the credit and taxation systems to refl ect the
specifi c characteristics of the fi sheries sector.
POLICY OPTIONS
43
Conclusions and recommendations
The Sea of Okhotsk region contains a wide range of natural resources,
decrease in the Amur River and its tributaries. At the same time, the
including one of the richest fi sheries of the world and vast hydrocarbon
habitats of many fi sh species, including important migratory fi sh, have
resources. The fi sheries industry of both the Okhotsk Sea and Amur
been destroyed or altered. Large areas of wetland have been drained to
River Basin is well developed. In the Okhotsk Sea sub-system, fi shing
form pastureland aff ecting biodiversity and threatened species in the
fl eets from not only the riparian countries of Russia and Japan but
Basin, notably several migratory bird species. The nutrient enrichment
also other parts of the world are unsustainably exploiting the Sea's
of the Amur and its tributaries by agricultural run-off containing
bioresources. Stocks of the most commercially valuable species on
artifi cial fertilisers and by the discharge of untreated wastewater is
the international market are considerably depleted. Despite a number
causing severe eutrophication. The River's ecosystems are now being
of international conventions and the adoption of national laws, the
aff ected by eutrophication not only during periods of low water in the
fi sheries remain vulnerable. The GIWA regional experts, therefore,
summer and autumn but also during the period of ice formation. The
found the overexploitation of the fi sheries to be a priority issue for
Songhua River, which has experienced rapid agricultural, urban and
the Okhotsk Sea. They also found oil spills to be a considerable future
industrial development, is the major source of pollutants in the Amur
threat to the Sea because, although there has been rather limited
River. The benzene spill in the Jilin province of northeast China in 2005
oil contamination to date, the extensive oil and gas development,
which polluted the Songhua River and later the Amur illustrated the
particularly on the continental shelf of Sakhalin (Russia), and increased
transboundary nature of the region's pollution problems.
shipment of oil across the Sea will signifi cantly increase the risk of spills.
There has been considerable eff ort made to rapidly develop the oil and
There are a number of institutional weaknesses which are either
gas industry in the region but, unfortunately, progress in establishing
promoting or failing to prevent transboundary pollution in the Amur
emergency contingency plans was considered unsatisfactory. Other
River Basin sub-system. Each riparian country explores its own economic
than spills, some of the oilfi elds encroach upon the feeding areas and
development and/or conservation of ecosystems, with limited basin-
migratory corridor of the critically threatened western Gray whale.
wide cooperation. There is, however, recognition of the need to work
Disturbances caused by hydrocarbon exploitation activities may
together to address transboundary issues. There is limited stakeholder
force the whales to change migration route and their feeding and
involvement in the decision-making process and public awareness of
reproductive behaviour.
pollution issues is rather rudimentary. A major hindrance for policy-
makers when setting priorities for remediation is the lack of knowledge
The Amur River Basin sub-system is characterised by great geographical
of the ecological characteristics and their reaction to human activities.
and cultural diversity. The Basin has experienced rapid economic
A technical problem is the poor condition of wastewater treatment
development, especially in the Chinese section, which has placed
infrastructure.
increasing pressure on its ecosystems and living resources. The GIWA
regional experts considered the overexploitation of the fi sheries and
The overcapacity of the fi shing fl eet is resulting in the overexploitation
eutrophication to be the priority issues of the Amur River Basin sub-
of the region's commercial stocks. Globally, there has been increased
system. Overfi shing has caused the populations and physical size of
demand for fi sh products which has intensifi ed the pressure on
Chum and Humpback salmon, and sturgeon, among other species, to
the region's fi sheries resources. The introduction of auctions of fi sh
44
GIWA REGIONAL ASSESSMENT 30 SEA OF OKHOTSK
quota-rights, in addition to a burdensome tax system, has reduced
Prepare and implement an intergovernmental agreement between
the profi tability of the fi sheries, resulting in fi shermen undertaking
Russia and Japan regarding the protection of the marine ecosystems
poaching and illegal fi shing to supply the large international black
of the Okhotsk Sea sub-system;
market for fi sh products. Regional cooperation in combating illegal
Prepare and enact Russian federal laws on nature conservation
fi shing is limited and national laws and regulations are undermined
and water resources management in the Amur River Basin and the
by deep-rooted corruption and weak enforcement. There is a lack of
Okhotsk Sea sub-system;
fi sheries statistics and monitoring programmes, and fi shermen lack
Establish a commission responsible for the management of
awareness of the long-term impacts of overfi shing. According to the
ecosystems within the Amur River Basin sub-system;
GIWA regional experts, many of the problems aff ecting the fi sheries of
Create inventories of the natural resources of the Amur River Basin
the Sea of Okhotsk region stem from economic hardship in the Russian
sub-system, the coastal zone and the Okhotsk Sea sub-system;
Far East and economic and social reform in Russia during the 1990s.
and
Implement research programmes.
Regional level
Recommendations
Establish a coordination committee for nature management within
the Amur River Basin sub-system;
International level
Coordinate environmental monitoring systems within the Amur
Prepare and implement an intergovernmental agreement between
River Basin sub-system and the Okhotsk Sea sub-system; and
the countries sharing the Amur River Basin's transboundary water
Carry out environmental monitoring of oil and gas production on
resources;
the Sakhalin shelf.
Establish an international system of environmental monitoring in
the Amur River Basin;
CONCLUSIONS AND RECOMMENDATIONS
45
References
Alekseev, A.V., Baklanov, P.Ya., Avdeiko, G.P., Sorokin, A.P., Romanov, M.T.
Bliznezov, V.N. (2002). Regulation of fi shery and protection of fi sh stocks:
and Moshkov, A.V. (2001). Development strategy of fuel and energy
New information technologies. Water biological resources 10:71-
resources for the Far East economy region up to 2020. Publishing
73.
House Dal'nauka, Vladivostok, Russia. (In Russian)
Chudaeva, V.A. (2002). Chemical elements migration in the waters of the
Alekseev, A.V. and Bogdanov, K.T. (1991). Sea of Okhotsk and Bering Sea.
Far East. Publishing House Dal'nauka, Vladivostok, Russia.
In: Encyclopaedia Britannica. (Revision of the articles)
Derby, C.D. and Atema, J.F. (1981). Infl uence of drilling mud on the
Arzamastzev, I.S., Yakovlev, Yu.M., Evseev, G.A., Gul'bin, V.V., Klochkova,
primary chemosensory neurons in walking legs of lobster, Homarus
N.G., Selin N.I., Rostov, I.D., Yurasov, G.I., Zhuk, A.P. and Buyanovsky,
americanus. Canadian Journal of Fisheries and Aquatic Sciences
A.I. (2001). Atlas of trade invertebrates and algaes in the Russian
38(3):268-272.
Far East Seas. Publishing House Avante, Vladivostok, Russia. (In
Dobrovol'sky, A.D. and Zalogin, B.S. (1982). Seas of the USSR. Publishing
Russian)
House Moscow State University, Moscow, Russia. (in Russian)
Baklanov, P.Ya., Arzamastsev, I.S., Kachur, A.N., Romanov, M.T., Plink, N.L.,
Dvornyakov, V.A. (2000). Fishery of Russia: On the eve of change.
Gogoberidze, G.G., Rjstov, B.D., Preobragensky, B.V., Zharikov, V.V.,
Moscow, Russia.
Vahnenko, R.V., Urasov, G.I., Svarichevsky, A.S. and Zhuk, A.P. (2003).
Dzyuban, A.N. (2002). Bacterioplankton and bacteriobenthos of three
Management of nature in a near-shore area: Problems of control on
fl oodplain lakes in the lower course of the Amur River. Microbiology
Far East of Russia. Publishing House Dal'nauka, Vladivostok, Russia.
71(4):471-478.
(In Russian)
Ecological Atlas for Russia (2003). The Geography Faculty of Moscow
Baklanov, P., Ganzey, S. and Kachur, A. (eds.) (2002a). Transboundary
University, Ministry of Natural resources, Federal Ecological
Diagnostic Analysis. /RAS/98/G31, United Nations Development
Foundation, Moscow, Russia.
Programme/Global Environmental Facility, Tumen River Strategic
FAO (1995). Code of Conduct for Responsible Fisheries. 28th FAO
Action Program, Vladivostok, Russia.
Conference, December 1995. Food and Agriculture Organization
Baklanov, P.Ya., Brovko, P.F. and Vorob'eva, T.F. (2002b). Regional
of the United Nations, Rome, Italy.
management of nature: Methods of analysis, evaluation and
Fraker, J.P. (1984). Toxicity study: Drilling fl uid chemicals on aquatic life.
control. Publishing House Logos, Moscow, Russia. (In Russian)
Canadian Journal of Fisheries and Aquatic Sciences 38.
Barushko, M.E. (2005). Fishing industry of Far East basine. Dalrubvtuz,
Froese, R. and Pauly, D. (eds.) (2006). FishBase. Retrieved January, 2006
Vladivostok, Russia.
from: http://www.fi shbase.org
Belyaev, V.A., Shevchenko, V.V., Ovsyanikov, V.P., and Nikonorov, S.I.
GEF Concept paper (2005). Integrated management of the Amur/
(2004). Bioeconomic prospects of development of fi shery and
Heilong River Basin. Global Environmental Facility, Washington
aquaculture in Khabarovsk Krai. Moscow, Russia.
D.C., United States.
Birdlife International (2003). Amur, Ussuri and Sungari River basins.
Georg R.Y. (1975). Potential eff ects of oil drilling and dumping activities
Saving Asia's threatened birds. Retrieved March, 2006 from: http:
on marine biota. p 103-110 In: Environmental aspects of chemical
//www.birdlife.org/action/science/species/asia_strategy/pdf_
use in well-drilling operations. Conference Proceedings, May 1975,
downloads/wetlandsWO3.pdf
46
GIWA REGIONAL ASSESSMENT 30 SEA OF OKHOTSK
Houston, Texas. Report N EPA-560/1-75-004, US Environmental
Lvov, D.C. (2004). Economic growth and quality of economy. In: Russian
Protection Agency, Washington D.C., United States.
book. Moscow, Russia.
Gorbunova, A.V. (1988). Infl uence of the increased turbidity on the
Makhinov, A.N. (2004). Long-term changes in the hydrological regime of
plankton fi lter-feeding organisms. p 45-46 In: Proceedings of 1st
the Amur River. p 117-123 In: Proceedings of the workshop. Climate
All-Union conference for the fi sh industry toxicology, Part 1. Riga,
variability and human activities in relation to Northeast Asian
Latvia.
land-ocean interactions and their implications for Coastal Zone
Governmental resolution (2003). The Concept of development of
Management, Nanjing, China.
the fi sh industry of the Russian Federation till the period 2020.
Moiseychenko, G.V. and Abramov, V.L. (1994). A resistance of young
Governmental Resolution of the Russian Federation No. 1265-p,
salmons and their forage reserve to the eff ect of drilling
September 2003.
components. p 126-127 In: Proceedings of 5th All-Russian
Governmental Resolution (2004). Governmental resolution of the Russia
Conference for taxonomy, biology and breeding of salmons, St.
Federation No.1668-p, December 2004.
Petersburg, Russia.
Jen, K.M. (2003). Pollution of Amur River attains crisis proportions. Erina
Moiseychenko, G.V. (1994). The infl uence of pollutions on sea while
Report 55:25-28.
prospecting and developing (exploitation) oil and deposits. p
Kondratyeva, L.M. (2000). Quality of water and ecological safety. p 4-12
23-25 In: North Pacifi c Marine Science Organization Third Annual
In: Transition of Khabarovsk Kray to model of steady development:
Meeting. Sidney, Canada.
Ecologe. Wildlife management: the collection of works NTS at
Natural resources potential (1998). Natural resources potential of
Kraykomecologe. Khabarovsk, Russia.
Primoriye region. Pacifi c Geography Institute, Far East Branch,
Kondratyeva L.M. (2001). Microbiological researches of an ecological
Russian Academy of Sciences. Publishing House Dal'nauka,
condition of the river Amur. Bulletin DVO the Russian Academy of
Vladivostok, Russia. (In Russian)
Science 1:57-71.
Nazarov, A. (2004). The auditor's conclusion about activity of fi sh
Kondratyeva, L.M. and Chukhlebova, L.M. (1999). Microbiology
industry for Accounts Chamber of the Russian Federation.
an estimation of change of quality of a fi sh at pollution of an
Novomodny, G., Sharov, P. and Zolotukhin, S. (2004). Amur fi sh: Wealth
inhabitancy. p 142-144 In: Fisheries researches of world ocean:
and crisis. WWF RFE, Vladivostok, Russia.
works of the international scientifi c conference, Part 1. Dalrybvtuz,
Okey, T. (2003). Witnessing Sea of Okhotsk changes. FishBytes 9(1):1-2.
Vladivostok, Russia.
Ozolinsh, A.V. and Spiridonov, V.A. (2001). Strategy of preservations of
Kondratyeva, L.M., Rapoport, V.L., Chukhlebova, L.M. and Sirotsky, S.E.
a biodiversity in a coastal zone of Far East ecological region. WWF,
(1999). Some aspects of quality of the Amur fi sh. p 43-45 In: Amur on
Vladivostok, Russia.
a boundary of centuries. Resources, problems, prospects: materials
Patin, S.A. (1994). Oil and gas production on the sea shelf: ecologo-
of the international scientifi c conference, Part 2. IVEP DVO RAN the
fi shing analysis. Fish industry 5:30-33.
Russian Academy of Science, Khabarovsk:, Russia.
PICES (2004). Sea of Okhotsk. p 95-111 In: Marine ecosystems of the
Korelsky, V.F. (2004). About results of 9th Conference of ministers of
North Pacifi c. PICES Special Publication 1. North Pacifi c Marine
fi shery of the countries of Northern Atlantic. Fish resources 3(8):
Science Organization, Sidney, Canada.
31-33.
Puntas, B.D. and Abolinsh, V.P. (1989). Problems of the environment
Korelsky, V.F., Gavrilov, R.V. and Romanov, E.A. (2003). Setting relations in
conservation when prospecting and developing the sea fi elds
Russian fi shery. Problems of fi shery 1(3):7-34.
of oil and gas. in: Proceedings of the inter-republican conference
Kotenev, B.N. and Zaytseva, Yu.B. (2003). The top-priority tasks in
Solution of ecological problems in the chemical and petrochemical
connection with approval of conception of fi sheries development
industry enterprises, Volgograd, Russia.
in Russian Federation (2003-2020), and on actions essential for its
Red Book of the Russian Federation (2001). Krasnaya Kniga Rossiiskoi
realisation. Fish industry 6:18-20.
Federatsii. Zhivotnye. Ast and Astrel, Balashikha, Aginskoe, Russia.
Lapko, V.V. and Radchenko, V.I. (2000). Sea of Okhotsk. p 436-472
(In Russian)
In: Sheppard, C. (ed.). Seas at the Millenium. Elsevier Science,
Rostov, I.D., Yurasov, G.I., Moroz, V.V., Dmitrieva, E.V. and Khraptchenkov,
Amsterdam, The Netherlands.
F.F. (2002). Oceanographic atlas of the Bering Sea, Sea of Okhotsk
Lawn D., Steiner R., Wills J. (2001). Sakhalin's Oil: Doing it right. Sakhalin
and Japan/East Sea. p 419-427 In: The 17th International Symposium
Environment Watch and the Pacifi c Environment & Resource Center,
on Sea of Okhotsk & Sea Ice, Abstracts, Mombetsu, Hokkaido,
Yuzhno Sakhalinsk, Russia.
Japan.
REFERENCES
47
Russian Regions (2001). Russian State Statistics Committee. Moscow,
The Development Concept (2003). The concept of development of fi sh
Russia.
facilities of the Russian Federation for the period till 2020.
Russian Regions (2002). Russian State Statistics Committee. Moscow,
The Seas (1998). Hydrometeorology and hydrochemistry of seas.
Russia.
Volume I. The Sea of Okhotsk. Issue 2. Hydrochemical conditions
Russian Regions (2003). Russian State Statistics Committee. Moscow,
and oceanological bases for formation of biological productivity.
Russia.
Publishing House Hydrometizdat, St. Peterburg, Russia. (In
Russian Statistical Yearbook (2001). Russian State Statistics Committee.
Russian)
Moscow, Russia.
Titova, G.D. (2004). The fi shery and the market: A check-up on
Russian Statistical Yearbook (2002). Russian State Statistics Committee.
compatibility. Fish resources 4:20-23.
Moscow, Russia.
UNEP (2006). Global Environmental Outlook Year Book 2006. United
Russian Statistical Yearbook (2003). Russian State Statistics Committee.
Nations Environment Programme, Nairobi, Kenya.
Moscow, Russia.
Voitolovsky, G.K., Kireev, V.A., Korzun, V.F., Ranenko, V.V., and Titova,
Sapozhnikov, V.V. (1995). Modern understanding of the functioning of
G.D. (2003). Refl ection about fi shery: Search of approaches to
the Bering Sea ecosystem. p 387-392 In: Complex studies of the
sustainable development. SOPS, Moscow, Russia.
ecosystem of the Bering Sea. VNIRO, Moscow, Russia.
Voronov, B.A. (2003). Complex surveys of the Amur River Basin. Institute
Seki, O., Yoshikawa, C., Nakatsuka, T., Kawamura, K., and Wakatsuchi,
of Water and Ecological Problems, Far Eastern Branch of Russia
M. (2006). Fluxes, source and transport of organic matter in the
Academy of Science, Vladivostok, Russia.
western Sea of Okhotsk: Stable carbon isotopic ratios of n-alkanes
Wei, Q., He, J., Yang, D., Zheng, W and Li, L. (2004). Status of sturgeon
and total organic carbon. Deep-sea Research I 53:253-270.
aquaculture and sturgeon trade in China: A review based on two
Shcheka, O.L. (2005). Amur River Basin: Regional and global importance.
recent nationwide surveys. Journal of applied ichthyology 20:321-
Paper presented at the conference Human disturbances on land-
332.
surface in the North East Asia and the impacts on ocean ecosystem.
WWF (2001). Freshwater ecoregions: Russian Far East Rivers and
March 22-24, 2005, Kyoto, Japan.
Wetlands. World Wildlife Fund. Retrieved February, 2006 from:
Shesterkin, V.P., Shesterkina, N.M. (2004). Winter hydrochemical mode
http://www.nationalgeographic.com/wildworld/profi les/g200/
and quality of waters of Amur. p 125-126 In: VI All-Russia Hydrological
g181.html
Congress. Publishing House Hydrometizdat, St Petersburg, Russia.
Yur'ev D.N., Garetova L.A., Shesterkin V.P. and Orphan S.E. (1999).
Shuntov, V.P. (2001). Biology of the Far East Seas of Russia, Volume I.
Mass development of the aqueous fungus Leptomitus lacteus in
Publishing House TINRO Centre, Vladivostok, Russia. (In Russian)
Amur River in the period of ice formation, the geochemical and
Shuntov, V.P., Radchenko, V.I., Dulepova, E.P., and Temnykh, O.S.
biogeochemical processes in the ecosystems of the Far East.
(1997). Biological resources of the Far Eastern Russian economic
Publishing House Dal'nauka, Vladivostok, Russia.
zone: Structure of pelagic and bottom communities, up-to-data
Zalogin B.S. and Kosarev A.N. (1999). The Seas. Publishing House Mysl',
status, tendencies of long-term dynamics. Izv. TINRO 122:3-15. (In
Moscow, Russia. (In Russian)
Russian)
Zhuk, A.P., Arzamastsev, I.S. and Romanov, M.T. (2003). The fi sheries
Sidorov, M.N. (ed.) (2001). Transport and communication of Russia 1990-
complex of the Far East of Russia. Fisheries 1:8-13.
2000. GOSKO, Moscow, Russia. (In Russian)
Zilanov, V.K. (2004). The sea fi shing policy of Russia in conditions of
Spiridonov, V. (2001). About fi sh quota auctions and not only about
reforming. Fish resources 2(7):4-6.
them: a view of the nature-conservative organisation. The Pacifi c
Zilanov, V.K. (2005). Commissions were executed slowly and ineffi
ciently.
bulletin 5:30.
Murmansk fi sh resources 3:183.
Steinhauer, M. and Grecelius, E. (1994). Temporal and ohag-esin the
Zuravel, E.V., Bezverbnaya, I.P. and Buzoleva, L.S. (2004). Microbian
concentrations of hydrocarbons and trace-metals in the vicinity
indication of pollution of the coastal zone of the Sea of Okhotsk
of an off shore oil-production platform. Marine Environmental
and Avacha Bay. Russian Journal of Marine Biology 30(2):121-126.
Research 37(2):129-163.
Tagatz, M.E. and Tobia, M. (1978). Eff ect of barite on development of
estuarian communities. Estuarine, Coast and Marine Science 7(7):
401-407.
48
GIWA REGIONAL ASSESSMENT 30 SEA OF OKHOTSK
Annexes
Annex I
List of contributing authors and organisations
Name
Organization/Institution
Country
Field of work
Authors
Arkady V. Alekseev
Presidium of Far East Branch of the Russian Academy of Sciences
Russia
Environmental protection
Peter Baklanov
Pacific Geographical Institute, Far East Branch Russian Academy of Sciences
Russia
Nature resource management
Ivan S. Arzamastsev
Pacific Geographical Institute, Far East Branch Russian Academy of Sciences
Russia
Nature science
Yury Blinov
TINRO-Centre
Russia
Fish ecology
Alexander V. Vlasov
Pacific Geographical Institute, Far East Branch Russian Academy of Sciences
Russia
Natural science
Boris A.Voronov
Institute for Water and Environmental Problems, Far East Branch Russian Academy of Sciences
Russia
Ecology
Anatoiy Kachur
Pacific Geographical Institute, Far East Branch Russian Academy of Sciences
Russia
Nature management
Irina A. Medvedeva
Pacific Geographical Institute, Far East Branch Russian Academy of Sciences
Russia
Natural science
Pavel A. Minakir
IEI , Far East Branch Russian Academy of Sciences
Russia
Economy
Galina D. Titova
Laboratory of Natural resources amnagement economics research centre of environmental safety, Russian Academy of Sciences
Russia
Environmental economy
Alexander S. Fedorovsky
Far East State University
Russia
Economy
The special monitoring and coastal environmental assessment regional activity centre, Action plan for the protection, management and
Hiroyuki Ishitobi
Japan
Natural science
development of the marine and coastal environment of the Northwest Pacific region; CEARAC NOWPAP
Task Team
Elina Rautalahti-
Coordinator Northern Hemisphere Global International Waters Assessment, (UNEP/GIWA)
Sweden
Miettinen
Ye Chun
Coordinator Global International Waters Assessment (UNEP/GIWA)
Sweden
Anond Snidvongs
Southeast Asia START Regional Center Research Building Number 2, Director
Thailand
Kirn Song Gun
Vice-Chairman of DPRK MAB, President of Biological Branch, Academy of Sciences of DPRK
North Korea
Choc Kwang Hun
Division of international Organizations, Bureau for international Cooperation of Science and technology Academy of Sciences of DPRK, Officer
North Korea
Pak Yong Ho
Centre for Nature Conservation, Biological Branch, Academy of Sciences of DPRK, Researcher
North Korea
Fan Zhijie
Phillips China Inc., Environment Specialist, HES
China
Hunting Yu
China Institute for Marine Affairs, State Oceanic Administration
China
Arkady V. Alekseev
Deputy Chairman
Russia
Peter Baklanov
Pacific Geographical Institute, Far East Branch, RAS, Director
Russia
Anatoiy Kachur
Pacific Geographical Institute, Far East Branch, RAS, Deputy Director
Russia
Pavel A. Minakir
Research Economic Institute, Far East Branch, RAS, Director
Russia
Boris A. Voronov
Water and Ecology Problems Institute, Far East Branch, RAS, Director
Russia
ANNEXES
49
List of contributing authors and organisations (continued)
Task Team
Galina D. Titova
Laboratory of Natural Resources Management Economics Research Center of Environmental Safety, RAS, Scientific Consultant, (UNEP/GIWA)
Russia
Evgeniya V. Terekhova
Head, Cathedra of foreign languages, FEBRAS
Russia
Fedor F. Khrapchenkov
Pacific Oceanological Institute, Far East Branch, RAS, Leading Research Fellow
Russia
BlinovYury
Pacific Institute of Fisheris and Oceanography(TINRO-CENTRE), Deputy Director
Russia
Nikolay Bortin
Far Eastern Research Institute of Complex Using and Water Resources Protection, Director
Russia
Ki-Suk Lee
Department of Geography Education Seoul National University
South Korea
Aleksandr S. Fedorovsky
Far East State University
Russia
Ivan S. Arzamastsev
Pacific Geographical Institute, Far East Branch RAS, Senior Researcher
Russia
Vladimir M. Shulkin
Head of Laboratory Pacific Geographical Institute Far East Branch RAS
Russia
Anatoly V. Moshkov
Leading Research Fellow, Pacific Geographical Institute, Far East Branch RAS
Russia
Gennady P. Skrilnik
Senior Researcher, Pacific Geographical Institute, Far East Branch RAS
Russia
Alexander V. Tkalin
Leading Researcher, Far Eastern Regional Hydrometeorological Research Institute
Russia
Tatiana A. Belan
Senior Researcher, Far Eastern Regional Hydrometeorological Research Institute
Russia
Dmitry L. Pitruk
Deputy Director, Institute of Marine Biology, FEB RAS
Russia
Irina A. Medvedeva
Researcher, Organizing Committee, Pacific Geographical Institute, Far East Branch RAS
Russia
Galina D. Dimova
Organizing Committee, Pacific Geographical Institute, Far East Branch RAS
Russia
50
GIWA REGIONAL ASSESSMENT 30 SEA OF OKHOTSK
Annex II
Detailed scoring tables
I: Freshwater shortage
II: Pollution
Weight
Weight
Environmental
Environmental
Environmental issues
Score
Weight
averaged
Environmental issues
Score
Weight
averaged
concern
concern
score
score
1. Modification of stream flow
1
N/a
Freshwater shortage
1
4. Microbiological
1
N/a
Pollution
1
2. Pollution of existing supplies
2
N/a
5. Eutrophication
1
N/a
3. Changes in the water table
1
N/a
6. Chemical
1
N/a
7. Suspended solids
1
N/a
Criteria for Economics impacts
Raw score
Score
Weight %
8. Solid wastes
1
N/a
Very small
Very large
Size of economic or public sectors affected
N/a
N/a
0 1 2 3
9. Thermal
0
N/a
Minimum
Severe
Degree of impact (cost, output changes etc.)
N/a
N/a
10. Radionuclides
0
N/a
0 1 2 3
Occasion/Short
Continuous
Frequency/Duration
N/a
N/a
11. Spills
1
N/a
0 1 2 3
Weight average score for Economic impacts
1
Criteria for Economics impacts
Raw score
Score
Weight %
Criteria for Health impacts
Raw score
Score
Weight %
Very small
Very large
Very small
Very large
Size of economic or public sectors affected
N/a
N/a
Number of people affected
N/a
N/a
0 1 2 3
0 1 2 3
Minimum
Severe
Minimum
Severe
Degree of impact (cost, output changes etc.)
N/a
N/a
Degree of severity
N/a
N/a
0 1 2 3
0 1 2 3
Occasion/Short
Continuous
Occasion/Short
Continuous
Frequency/Duration
N/a
N/a
Frequency/Duration
N/a
N/a
0 1 2 3
0 1 2 3
Weight average score for Economic impacts
2
Weight average score for Health impacts
1
Criteria for Health impacts
Raw score
Score
Weight %
Criteria for Other social and
Raw score
Score
Weight %
community impacts
Very small
Very large
Number of people affected
N/a
N/a
Very small
Very large
0 1 2 3
Number and/or size of community affected
N/a
N/a
0 1 2 3
Minimum
Severe
Degree of severity
N/a
N/a
Minimum
Severe
0 1 2 3
Degree of severity
N/a
N/a
0 1 2 3
Occasion/Short
Continuous
Frequency/Duration
N/a
N/a
Occasion/Short
Continuous
0 1 2 3
Frequency/Duration
N/a
N/a
0 1 2 3
Weight average score for Health impacts
2
Weight average score for Other social and community impacts
1
Criteria for Other social and
N/a=Not applied
Raw score
Score
Weight %
community impacts
Very small
Very large
Number and/or size of community affected
N/a
N/a
0 1 2 3
Minimum
Severe
Degree of severity
N/a
N/a
0 1 2 3
Occasion/Short
Continuous
Frequency/Duration
N/a
N/a
0 1 2 3
Weight average score for Other social and community impacts
1
N/a=Not applied
ANNEXES
51
III: Habitat and community modification
IV: Unsustainable exploitation of fish
Weight
and other living resources
Environmental
Environmental issues
Score
Weight
averaged
concern
score
Weight
Environmental
Environmental issues
Score
Weight %
averaged
Habitat and community
concern
12. Loss of ecosystems
1
N/a
1
score
modification
13. Modification of ecosystems or
Unsustainable
14. Overexploitation
3/2*
N/a
2/3*
ecotones, including community
1
N/a
exploitation of fish
structure and/or species composition
15. Excessive by-catch and
2/0*
N/a
discards
16. Destructive fishing practices
2/1*
N/a
Criteria for Economics impacts
Raw score
Score
Weight %
Very small
Very large
17. Decreased viability of stock
Size of economic or public sectors affected
N/a
N/a
2/0*
N/a
0 1 2 3
through pollution and disease
Minimum
Severe
18. Impact on biological and
Degree of impact (cost, output changes etc.)
N/a
N/a
1/1*
N/a
0 1 2 3
genetic diversity
Occasion/Short
Continuous
*Amur River Basin sub-system/Okhotsk Sea sub-system
Frequency/Duration
N/a
N/a
0 1 2 3
Criteria for Economics impacts
Raw score
Score
Weight %
Weight average score for Economic impacts
2
Very small
Very large
Size of economic or public sectors affected
N/a
N/a
0 1 2 3
Criteria for Health impacts
Raw score
Score
Weight %
Minimum
Severe
Degree of impact (cost, output changes etc.)
N/a
N/a
Very small
Very large
0 1 2 3
Number of people affected
N/a
N/a
0 1 2 3
Occasion/Short
Continuous
Frequency/Duration
N/a
N/a
Minimum
Severe
0 1 2 3
Degree of severity
N/a
N/a
0 1 2 3
Weight average score for Economic impacts
2
Occasion/Short
Continuous
Frequency/Duration
N/a
N/a
0 1 2 3
Criteria for Health impacts
Raw score
Score
Weight %
Weight average score for Health impacts
1
Very small
Very large
Number of people affected
N/a
N/a
Criteria for Other social and
0 1 2 3
Raw score
Score
Weight %
community impacts
Minimum
Severe
Degree of severity
N/a
N/a
Very small
Very large
0 1 2 3
Number and/or size of community affected
N/a
N/a
0 1 2 3
Occasion/Short
Continuous
Frequency/Duration
N/a
N/a
Minimum
Severe
0 1 2 3
Degree of severity
N/a
N/a
0 1 2 3
Weight average score for Health impacts
1
Occasion/Short
Continuous
Frequency/Duration
N/a
N/a
0 1 2 3
Criteria for Other social and
Raw score
Score
Weight %
community impacts
Weight average score for Other social and community impacts
1
Very small
Very large
Number and/or size of community affected
N/a
N/a
N/a=Not applied
0 1 2 3
Minimum
Severe
Degree of severity
N/a
N/a
0 1 2 3
Occasion/Short
Continuous
Frequency/Duration
N/a
N/a
0 1 2 3
Weight average score for Other social and community impacts
1
N/a=Not applied
52
GIWA REGIONAL ASSESSMENT 30 SEA OF OKHOTSK
V: Global change
Weight
Environmental
Environmental issues
Score
Weight
averaged
concern
score
19. Changes in the hydrological cycle
1
N/a
Global change
1
20. Sea level change
0
N/a
21. Increased UV-B radiation as a
0
N/a
result of ozone depletion
22. Changes in ocean CO2
0
N/a
source/sink function
Criteria for Economics impacts
Raw score
Score
Weight %
Very small
Very large
Size of economic or public sectors affected
N/a
N/a
0 1 2 3
Minimum
Severe
Degree of impact (cost, output changes etc.)
N/a
N/a
0 1 2 3
Occasion/Short
Continuous
Frequency/Duration
N/a
N/a
0 1 2 3
Weight average score for Economic impacts
2
Criteria for Health impacts
Raw score
Score
Weight %
Very small
Very large
Number of people affected
N/a
N/a
0 1 2 3
Minimum
Severe
Degree of severity
N/a
N/a
0 1 2 3
Occasion/Short
Continuous
Frequency/Duration
N/a
N/a
0 1 2 3
Weight average score for Health impacts
2
Criteria for Other social and
Raw score
Score
Weight %
community impacts
Very small
Very large
Number and/or size of community affected
N/a
N/a
0 1 2 3
Minimum
Severe
Degree of severity
N/a
N/a
0 1 2 3
Occasion/Short
Continuous
Frequency/Duration
N/a
N/a
0 1 2 3
Weight average score for Other social and community impacts
1
N/a=Not applied
Comparative environmental and socio-economic impacts of each GIWA concern
Types of impacts
Environmental score
Economic score
Human health score
Social and community score
Concern
Overall score
Rank
Pr
esent (a)
F
uture (b)
Pr
esent (a)
F
uture (b)
Pr
esent (a)
F
uture (b)
Pr
esent (a)
F
uture (b)
Freshwater shortage
1
1
1
1
1
1
1
1
1
3
Pollution
1
1
2
2
2
2
1
1
2
1
Habitat and community
1
1
2
2
1
1
1
1
2
4
modification
Unsustainable exploitation of fish
2
2
2
2
1
1
1
1
2
2
and other living resources
Global change
1
1
2
2
2
2
1
1
1
5
ANNEXES
53
The Global International
Waters Assessment
This report presents the results of the Global International Waters
Adequately managing the world's aquatic resources for the benefi t of
Assessment (GIWA) of the transboundary waters of the Sea of
all is, for a variety of reasons, a very complex task. The liquid state of
Okhotsk region. This and the subsequent chapter off er a background
the most of the world's water means that, without the construction
that describes the impetus behind the establishment of GIWA, its
of reservoirs, dams and canals it is free to fl ow wherever the laws of
objectives and how the GIWA was implemented.
nature dictate. Water is, therefore, a vector transporting not only a
wide variety of valuable resources but also problems from one area
to another. The effl
uents emanating from environmentally destructive
activities in upstream drainage areas are propagated downstream
The need for a global
and can aff ect other areas considerable distances away. In the case of
international waters
transboundary river basins, such as the Nile, Amazon and Niger, the
assessment
impacts are transported across national borders and can be observed
in the numerous countries situated within their catchments. In the case
of large oceanic currents, the impacts can even be propagated between
Globally, people are becoming increasingly aware of the degradation of
continents (AMAP 1998). Therefore, the inextricable linkages within
the world's water bodies. Disasters from fl oods and droughts, frequently
and between both freshwater and marine environments dictates that
reported in the media, are considered to be linked with ongoing global
management of aquatic resources ought to be implemented through
climate change (IPCC 2001), accidents involving large ships pollute public
a drainage basin approach.
beaches and threaten marine life and almost every commercial fi sh stock
is exploited beyond sustainable limits - it is estimated that the global
In addition, there is growing appreciation of the incongruence
stocks of large predatory fi sh have declined to less that 10% of pre-
between the transboundary nature of many aquatic resources and the
industrial fi shing levels (Myers & Worm 2003). Further, more than 1 billion
traditional introspective nationally focused approaches to managing
people worldwide lack access to safe drinking water and 2 billion people
those resources. Water, unlike laws and management plans, does not
lack proper sanitation which causes approximately 4 billion cases of
respect national borders and, as a consequence, if future management
diarrhoea each year and results in the death of 2.2 million people, mostly
of water and aquatic resources is to be successful, then a shift in focus
children younger than fi ve (WHO-UNICEF 2002). Moreover, freshwater
towards international cooperation and intergovernmental agreements
and marine habitats are destroyed by infrastructure developments,
is required (UN 1972). Furthermore, the complexity of managing the
dams, roads, ports and human settlements (Brinson & Malvßrez 2002,
world's water resources is exacerbated by the dependence of a great
Kennish 2002). As a consequence, there is growing public concern
variety of domestic and industrial activities on those resources. As a
regarding the declining quality and quantity of the world's aquatic
consequence, cross-sectoral multidisciplinary approaches that integrate
resources because of human activities, which has resulted in mounting
environmental, socio-economic and development aspects into
pressure on governments and decision makers to institute new and
management must be adopted. Unfortunately however, the scientifi c
innovative policies to manage those resources in a sustainable way
information or capacity within each discipline is often not available or
ensuring their availability for future generations.
is inadequately translated for use by managers, decision makers and
GLOBAL INTERNATIONAL WATERS ASSESSMENT
i
policy developers. These inadequacies constitute a serious impediment
The Global Environment Facility (GEF)
to the implementation of urgently needed innovative policies.
The Global Environment Facility forges international co-operation and fi nances actions to address
six critical threats to the global environment: biodiversity loss, climate change, degradation of
international waters, ozone depletion, land degradation, and persistent organic pollutants (POPs).
Continual assessment of the prevailing and future threats to aquatic
The overall strategic thrust of GEF-funded international waters activities is to meet the incremental
ecosystems and their implications for human populations is essential if
costs of: (a) assisting groups of countries to better understand the environmental concerns of
their international waters and work collaboratively to address them; (b) building the capacity
governments and decision makers are going to be able to make strategic
of existing institutions to utilise a more comprehensive approach for addressing transboundary
policy and management decisions that promote the sustainable use of
water-related environmental concerns; and (c) implementing measures that address the priority
transboundary environmental concerns. The goal is to assist countries to utilise the full range of
those resources and respond to the growing concerns of the general
technical, economic, fi nancial, regulatory, and institutional measures needed to operationalise
public. Although many assessments of aquatic resources are being
sustainable development strategies for international waters.
conducted by local, national, regional and international bodies, past
United Nations Environment Programme (UNEP)
assessments have often concentrated on specifi c themes, such as
United Nations Environment Programme, established in 1972, is the voice for the environment
biodiversity or persistent toxic substances, or have focused only on
within the United Nations system. The mission of UNEP is to provide leadership and encourage
partnership in caring for the environment by inspiring, informing, and enabling nations and
marine or freshwaters. A globally coherent, drainage basin based
peoples to improve their quality of life without compromising that of future generations.
assessment that embraces the inextricable links between transboundary
UNEP work encompasses:
freshwater and marine systems, and between environmental and
Assessing global, regional and national environmental conditions and trends;
Developing international and national environmental instruments;
societal issues, has never been conducted previously.
Strengthening institutions for the wise management of the environment;
Facilitating the transfer of knowledge and technology for sustainable development;
Encouraging new partnerships and mind-sets within civil society and the private sector.
International call for action
University of Kalmar
University of Kalmar hosts the GIWA Co-ordination Offi ce and provides scientifi c advice and
administrative and technical assistance to GIWA. University of Kalmar is situated on the coast of
The need for a holistic assessment of transboundary waters in order to
the Baltic Sea. The city has a long tradition of higher education; teachers and marine offi cers have
been educated in Kalmar since the middle of the 19th century. Today, natural science is a priority
respond to growing public concerns and provide advice to governments
area which gives Kalmar a unique educational and research profi le compared with other smaller
universities in Sweden. Of particular relevance for GIWA is the established research in aquatic and
and decision makers regarding the management of aquatic resources
environmental science. Issues linked to the concept of sustainable development are implemented
was recognised by several international bodies focusing on the global
by the research programme Natural Resources Management and Agenda 21 Research School.
environment. In particular, the Global Environment Facility (GEF)
Since its establishment GIWA has grown to become an integral part of University activities.
The GIWA Co-ordination offi ce and GIWA Core team are located at the Kalmarsund Laboratory, the
observed that the International Waters (IW) component of the GEF
university centre for water-related research. Senior scientists appointed by the University are actively
suff ered from the lack of a global assessment which made it diffi
cult
involved in the GIWA peer-review and steering groups. As a result of the cooperation the University
can off er courses and seminars related to GIWA objectives and international water issues.
to prioritise international water projects, particularly considering
the inadequate understanding of the nature and root causes of
environmental problems. In 1996, at its fourth meeting in Nairobi, the
causes of degradation of the transboundary aquatic environment and
GEF Scientifi c and Technical Advisory Panel (STAP), noted that: "Lack of
options for addressing them. These pro cesses led to the development
an International Waters Assessment comparable with that of the IPCC, the
of the Global International Waters Assessment (GIWA) that would be
Global Biodiversity Assessment, and the Stratospheric Ozone Assessment,
implemented by the United Nations Environment Programme (UNEP) in
was a unique and serious impediment to the implementation of the
conjunction with the University of Kalmar, Sweden, on behalf of the GEF.
International Waters Component of the GEF".
The GIWA was inaugurated in Kalmar in October 1999 by the Executive
Director of UNEP, Dr. Klaus T÷pfer, and the late Swedish Minister of the
The urgent need for an assessment of the causes of environmental
Environment, Kjell Larsson. On this occasion Dr. T÷pfer stated: "GIWA
degradation was also highlighted at the UN Special Session on
is the framework of UNEP┤s global water assessment strategy and will
the Environment (UNGASS) in 1997, where commitments were
enable us to record and report on critical water resources for the planet for
made regarding the work of the UN Commission on Sustainable
consideration of sustainable development management practices as part of
Development (UNCSD) on freshwater in 1998 and seas in 1999. Also in
our responsibilities under Agenda 21 agreements of the Rio conference".
1997, two international Declarations, the Potomac Declaration: Towards
enhanced ocean security into the third millennium, and the Stockholm
The importance of the GIWA has been further underpinned by the UN
Statement on inter action of land activities, freshwater and enclosed
Millennium Development Goals adopted by the UN General Assembly
seas, specifi cally emphasised the need for an investigation of the root
in 2000 and the Declaration from the World Summit on Sustainable
ii
REGIONAL ASSESSMENTS
Development in 2002. The development goals aimed to halve the
International waters and transboundary issues
proportion of people without access to safe drinking water and basic
The term "international waters", as used for the purposes of the GEF Operational Strategy,
sanitation by the year 2015 (United Nations Millennium Declaration
includes the oceans, large marine ecosystems, enclosed or semi-enclosed seas and estuaries, as
well as rivers, lakes, groundwater systems, and wetlands with transboundary drainage basins
2000). The WSSD also calls for integrated management of land, water and
or common borders. The water-related ecosystems associated with these waters are considered
living resources (WSSD 2002) and, by 2010, the Reykjavik Declaration on
integral parts of the systems.
The term "transboundary issues" is used to describe the threats to the aquatic environment
Responsible Fisheries in the Marine Ecosystem should be implemented
linked to globalisation, international trade, demographic changes and technological advancement,
by all countries that are party to the declaration (FAO 2001).
threats that are additional to those created through transboundary movement of water. Single
country policies and actions are inadequate in order to cope with these challenges and this makes
them transboundary in nature.
The international waters area includes numerous international conventions, treaties, and
agreements. The architecture of marine agreements is especially complex, and a large number
The conceptual framework
of bilateral and multilateral agreements exist for transboundary freshwater basins. Related
conventions and agreements in other areas increase the complexity. These initiatives provide
and objectives
a new opportunity for cooperating nations to link many diff erent programmes and instruments
into regional comprehensive approaches to address international waters.
Considering the general decline in the condition of the world's aquatic
the large-scale deforestation of mangroves for ponds (Primavera 1997).
resources and the internationally recognised need for a globally
Within the GIWA, these "non-hydrological" factors constitute as large
coherent assessment of transboundary waters, the primary objectives
a transboundary infl uence as more traditionally recognised problems,
of the GIWA are:
such as the construction of dams that regulate the fl ow of water into
To provide a prioritising mechanism that allows the GEF to focus
a neighbouring country, and are considered equally important. In
their resources so that they are used in the most cost eff ective
addition, the GIWA recognises the importance of hydrological units that
manner to achieve signifi cant environmental benefi ts, at national,
would not normally be considered transboundary but exert a signifi cant
regional and global levels; and
infl uence on transboundary waters, such as the Yangtze River in China
To highlight areas in which governments can develop and
which discharges into the East China Sea (Daoji & Daler 2004) and the
implement strategic policies to reduce environmental degradation
Volga River in Russia which is largely responsible for the condition of
and improve the management of aquatic resources.
the Caspian Sea (Barannik et al. 2004). Furthermore, the GIWA is a truly
regional assessment that has incorporated data from a wide range of
In order to meet these objectives and address some of the current
sources and included expert knowledge and information from a wide
inadequacies in international aquatic resources management, the GIWA
range of sectors and from each country in the region. Therefore, the
has incorporated four essential elements into its design:
transboundary concept adopted by the GIWA extends to include
A broad transboundary approach that generates a truly regional
impacts caused by globalisation, international trade, demographic
perspective through the incorporation of expertise and existing
changes and technological advances and recognises the need for
information from all nations in the region and the assessment of
international cooperation to address them.
all factors that infl uence the aquatic resources of the region;
A drainage basin approach integrating freshwater and marine
systems;
A multidisciplinary approach integrating environmental and socio-
The organisational structure and
economic information and expertise; and
implementation of the GIWA
A coherent assessment that enables global comparison of the
results.
The scale of the assessment
Initially, the scope of the GIWA was confi ned to transboundary waters
The GIWA builds on previous assessments implemented within the GEF
in areas that included countries eligible to receive funds from the GEF.
International Waters portfolio but has developed and adopted a broader
However, it was recognised that a truly global perspective would only
defi nition of transboundary waters to include factors that infl uence the
be achieved if industrialised, GEF-ineligible regions of the world were
quality and quantity of global aquatic resources. For example, due to
also assessed. Financial resources to assess the GEF-eligible countries
globalisation and international trade, the market for penaeid shrimps
were obtained primarily from the GEF (68%), the Swedish International
has widened and the prices soared. This, in turn, has encouraged
Development Cooperation Agency (Sida) (18%), and the Finnish
entrepreneurs in South East Asia to expand aquaculture resulting in
Department for International Development Cooperation (FINNIDA)
GLOBAL INTERNATIONAL WATERS ASSESSMENT
iii
1b
1c
1d
16
15
11
14
12
1a
13
17
28
10
18
25
30
9
19
23
7
22
8
31
6
24
33
20
34
26
2
5
27
50
51
32
21
36
37
41
52
4
49
53
43
54
55
65
42
3
56
42
46
42
47
62
40b
57
40a
40a
47
47
45b
59
39
45a
58
64
60
44
38
61
63
66
GIWA 2006
1a Russian
Arctic
(4
LMEs)
8 Gulf of St Lawrence
17 Baltic
Sea
(LME)
26 California Current (LME)
38 Patagonian Shelf (LME)
45b Indian Ocean Islands
52 Arabian
Sea
(LME)
61 Great
Australian
Bight
1b Arctic
Greenland
(LME)
9 Newfoundland
Shelf
(LME)
18 North
Sea
(LME)
27 Gulf of California (LME)
39 Brazil
Current
(LME)
46 Somali Coastal
53 Bay of Bengal
62 Pacifi c Islands
1c Arctic
European/Atlantic
10 Baffi
n Bay, Labrador Sea,
19 Celtic-Biscay
Shelf
(LME)
28 Bering Sea (LME)
40a Northeast Brazil
Current (LME)
54 South China Sea (2 LMEs)
63 Tasman
Sea
1d Arctic North American
Canadian Archipelago
20 Iberian Coastal Sea (LME)
30 Sea of Okhotsk (LME)
Shelf (2 LMEs)
47 East
African
Rift
55 Mekong
River
64 Humboldt Current (LME)
2 Gulf
of
Mexico
(LME)
11 Barents
Sea
(LME)
21 North
Africa
and
31 Oyashio
Current
(LME)
40b Amazon
Valley Lakes
56 Sulu-Celebes
Sea
(LME)
65 Eastern Equatorial
3 Caribbean
Sea
(LME)
12 Norwegian
Sea
(LME)
Nile River Basin (LME)
32 Kuroshio
Current
(LME)
41 Canary
Current
(LME)
49 Red Sea and
57 Indonesian
Seas
(LME)
Pacifi c (LME)
4 Caribbean
Islands
(LME)
13 Faroe
plateau
22 Black Sea (LME)
33 Sea
of
Japan
(LME)
42 Guinea Current (LME)
Gulf of Aden (LME)
58 North Australian
66 Antarctic (LME)
5 Southeast
Shelf
(LME)
14 Iceland
Shelf
(LME)
23 Caspian
Sea
34 Yellow Sea (LME)
43 Lake
Chad
50 Euphrates and
Shelf (LME)
6 Northeast
Shelf
(LME)
15 East
Greenland
Shelf
(LME)
24 Aral Sea
36 East China Sea (LME)
44 Benguela Current (LME)
Tigris River Basin
59 Coral
Sea
Basin
7 Scotian
Shelf
(LME)
16 West
Greenland
Shelf
(LME)
25 Gulf of Alaska (LME)
37 Hawaiian
Archipelago
(LME)
45a Agulhas Current (LME)
51 Jordan
60 Great Barrier Reef (LME)
Figure 1
The 66 transboundary regions assessed within the GIWA project.
(10%). Other contributions were made by Kalmar Municipality, the
Large Marine Ecocsystems (LMEs)
University of Kalmar and the Norwegian Government. The assessment of
Large Marine Ecosystems (LMEs) are regions of ocean space encompassing coastal areas from river
regions ineligible for GEF funds was conducted by various international
basins and estuaries to the seaward boundaries of continental shelves and the outer margin of the
major current systems. They are relatively large regions on the order of 200 000 km2 or greater,
and national organisations as in-kind contributions to the GIWA.
characterised by distinct: (1) bathymetry, (2) hydrography, (3) productivity, and (4) trophically
dependent populations.
The Large Marine Ecosystems strategy is a global eff ort for the assessment and management
In order to be consistent with the transboundary nature of many of the
of international coastal waters. It developed in direct response to a declaration at the 1992
world's aquatic resources and the focus of the GIWA, the geographical
Rio Summit. As part of the strategy, the World Conservation Union (IUCN) and National Oceanic
and Atmospheric Administration (NOAA) have joined in an action program to assist developing
units being assessed have been designed according to the watersheds
countries in planning and implementing an ecosystem-based strategy that is focused on LMEs as
of discrete hydrographic systems rather than political borders (Figure 1).
the principal assessment and management units for coastal ocean resources. The LME concept is
also adopted by GEF that recommends the use of LMEs and their contributing freshwater basins
The geographic units of the assessment were determined during the
as the geographic area for integrating changes in sectoral economic activities.
preparatory phase of the project and resulted in the division of the
world into 66 regions defi ned by the entire area of one or more
The global network
catchments areas that drains into a single designated marine system.
In each of the 66 regions, the assessment is conducted by a team of
These marine systems often correspond to Large Marine Ecosystems
local experts that is headed by a Focal Point (Figure 2). The Focal Point
(LMEs) (Sherman 1994, IOC 2002).
can be an individual, institution or organisation that has been selected
on the basis of their scientifi c reputation and experience implementing
Considering the objectives of the GIWA and the elements incorporated
international assessment projects. The Focal Point is responsible
into its design, a new methodology for the implementation of the
for assembling members of the team and ensuring that it has the
assessment was developed during the initial phase of the project. The
necessary expertise and experience in a variety of environmental
methodology focuses on fi ve major environmental concerns which
and socio-economic disciplines to successfully conduct the regional
constitute the foundation of the GIWA assessment; Freshwater shortage,
assessment. The selection of team members is one of the most critical
Pollution, Habitat and community modifi cation, Overexploitation of fi sh
elements for the success of GIWA and, in order to ensure that the
and other living resources, and Global change. The GIWA methodology
most relevant information is incorporated into the assessment, team
is outlined in the following chapter.
members were selected from a wide variety of institutions such as
iv
REGIONAL ASSESSMENTS
an assessment did not exist. Therefore, in order to implement the GIWA,
Steering Group
a new methodology that adopted a multidisciplinary, multi-sectoral,
multi-national approach was developed and is now available for the
implementation of future international assessments of aquatic resources.
GIWA Partners
IGOs, NGOs,
Core
Thematic
The GIWA is comprised of a logical sequence of four integrated
Scientific institutions,
Team
Task Teams
private sector, etc
components. The fi rst stage of the GIWA is called Scaling and is a
66 Regional
process by which the geographic area examined in the assessment is
Focal Points
defi ned and all the transboundary waters within that area are identifi ed.
and Teams
Once the geographic scale of the assessment has been defi ned, the
Figure 2
The organisation of the GIWA project.
assessment teams conduct a process known as Scoping in which the
magnitude of environmental and associated socio-economic impacts
universities, research institutes, government agencies, and the private
of Freshwater shortage, Pollution, Habitat and community modifi cation,
sector. In addition, in order to ensure that the assessment produces a
Unsustainable exploitation of fi sh and other living resources, and Global
truly regional perspective, the teams should include representatives
change is assessed in order to identify and prioritise the concerns
from each country that shares the region.
that require the most urgent intervention. The assessment of these
predefi ned concerns incorporates the best available information and
In total, more than 1 000 experts have contributed to the implementation
the knowledge and experience of the multidisciplinary, multi-national
of the GIWA illustrating that the GIWA is a participatory exercise that
assessment teams formed in each region. Once the priority concerns
relies on regional expertise. This participatory approach is essential
have been identifi ed, the root causes of these concerns are identifi ed
because it instils a sense of local ownership of the project, which
during the third component of the GIWA, Causal chain analysis. The root
ensures the credibility of the fi ndings and moreover, it has created a
causes are determined through a sequential process that identifi es, in
global network of experts and institutions that can collaborate and
turn, the most signifi cant immediate causes followed by the economic
exchange experiences and expertise to help mitigate the continued
sectors that are primarily responsible for the immediate causes and
degradation of the world's aquatic resources.
fi nally, the societal root causes. At each stage in the Causal chain
analysis, the most signifi cant contributors are identifi ed through an
analysis of the best available information which is augmented by the
expertise of the assessment team. The fi nal component of the GIWA is
GIWA Regional reports
the development of Policy options that focus on mitigating the impacts
of the root causes identifi ed by the Causal chain analysis.
The GIWA was established in response to growing concern among the
general public regarding the quality of the world's aquatic resources
The results of the GIWA assessment in each region are reported in
and the recognition of governments and the international community
regional reports that are published by UNEP. These reports are designed
concerning the absence of a globally coherent international waters
to provide a brief physical and socio-economic description of the
assessment. However, because a holistic, region-by-region, assessment
most important features of the region against which the results of the
of the condition of the world's transboundary water resources had never
assessment can be cast. The remaining sections of the report present
been undertaken, a methodology guiding the implementation of such
the results of each stage of the assessment in an easily digestible form.
Each regional report is reviewed by at least two independent external
UNEP Water Policy and Strategy
reviewers in order to ensure the scientifi c validity and applicability of
The primary goals of the UNEP water policy and strategy are:
each report. The 66 regional assessments of the GIWA will serve UNEP
(a) Achieving greater global understanding of freshwater, coastal and marine environments by
as an essential complement to the UNEP Water Policy and Strategy and
conducting environmental assessments in priority areas;
(b) Raising awareness of the importance and consequences of unsustainable water use;
UNEP's activities in the hydrosphere.
(c) Supporting the eff orts of Governments in the preparation and implementation of integrated
management of freshwater systems and their related coastal and marine environments;
(d) Providing support for the preparation of integrated management plans and programmes for
aquatic environmental hot spots, based on the assessment results;
Global International Waters Assessment
(e) Promoting the application by stakeholders of precautionary, preventive and anticipatory
approaches.
GLOBAL INTERNATIONAL WATERS ASSESSMENT
v
References:
AMAP (1998). Assessment Report: Arctic Pollution Issues. Arctic
Monitoring and Assessment Programme (AMAP), Oslo, Norway.
Barannik, V., Borysova, O. and Stolberg, F. (2004). The Caspian Sea Region:
Environmental Change. Ambio, 33:45-51.
Brinson, M.M. and Malvßrez, A.I. (2002). Temperate freshwater wetlands:
types, status, and threats. Environmental Conservation, 29:115-133.
Daoji, L. and Daler, D. (2004). Ocean Pollution from Land-based Sources:
East China Sea, China. Ambio, 33:98-106.
FAO (2001). Reykjavik conference on responsible fi sheries in the marine
ecosystem. Iceland, 1-4 October 2001.
IOC (2002). IOC-IUCN-NOAA Consultative Meeting on Large Marine
Ecosystems (LMEs). Fourth Session, 8-9 January 2002, Paris,
France.
IPCC (2001). Climate Change 2001: The Scientifi c Basis. Contribution
of Working Group I to the Third Assessment Report of the
Intergovernmental Panel on Climate Change. In: Houghton,
J.T., Ding, Y., Griggs, D.J., Noguer, M., van der Linden, P.J., Dai, X.,
Maskell, K. and Johnson, C.A. (eds). Cambridge University Press,
Cambridge, United Kingdom and New York, NY, USA.
Kennish, M.J. (2002). Environmental threats and environmental future of
estuaries. Environmental Conservation, 29:78-107.
Myers, R.A. and Worm, B. (2003). Rapid worldwide depletion of predatory
fi sh communities. Nature, 423:280-283.
Primavera, J.H. (1997) Socio-economic impacts of shrimp culture.
Aquaculture Research, 28:815-827.
Sherman, K. (1994). Sustainability, biomass yields, and health of coastal
ecosystems: an ecological perspective. Marine Ecology Progress
Series, 112:277-301.
United Nations conference on the human environment (1972). Report
available on-line at http://www.unep.org
United Nations Millennium Declaration (2000). The Millennium
Assembly of the United Nations, New York.
WHO-UNICEF (2002). Global Water Supply and Sanitation Assessment:
2000 Report.
WSSD (2002). World Summit on Sustainable Development.
Johannesburg Summit 2002. Key Outcomes of the Summit,
UN Department of Public Information, New York.
vi
REGIONAL ASSESSMENTS
The GIWA methodology
The specifi c objectives of the GIWA were to conduct a holistic and globally
The assessment integrates environmental and socio-economic data
comparable assessment of the world's transboundary aquatic resources
from each country in the region to determine the severity of the
that incorporated both environmental and socio-economic factors
impacts of each of the fi ve concerns and their constituent issues on
and recognised the inextricable links between freshwater and marine
the entire region. The integration of this information was facilitated by
environments, in order to enable the GEF to focus their resources and to
implementing the assessment during two participatory workshops
provide guidance and advice to governments and decision makers. The
that typically involved 10 to 15 environmental and socio-economic
coalition of all these elements into a single coherent methodology that
experts from each country in the region. During these workshops, the
produces an assessment that achieves each of these objectives had not
regional teams performed preliminary analyses based on the collective
previously been done and posed a signifi cant challenge.
knowledge and experience of these local experts. The results of these
analyses were substantiated with the best available information to be
The integration of each of these elements into the GIWA methodology
presented in a regional report.
was achieved through an iterative process guided by a specially
Table 1 Pre-defi ned GIWA concerns and their constituent issues
convened Methods task team that was comprised of a number of
addressed within the assessment.
international assessment and water experts. Before the fi nal version
of the methodology was adopted, preliminary versions underwent
Environmental issues
Major concerns
an extensive external peer review and were subjected to preliminary
1. Modification of stream flow
testing in selected regions. Advice obtained from the Methods task
2. Pollution
of
existing
supplies
I Freshwater shortage
3. Changes in the water table
team and other international experts and the lessons learnt from
preliminary testing were incorporated into the fi nal version that was
4. Microbiological
5. Eutrophication
used to conduct each of the GIWA regional assessments.
6. Chemical
7. Suspended
solids
II Pollution
8. Solid
wastes
Considering the enormous diff erences between regions in terms of the
9. Thermal
10. Radionuclide
quality, quantity and availability of data, socio-economic setting and
11. Spills
environmental conditions, the achievement of global comparability
12. Loss of ecosystems
required an innovative approach. This was facilitated by focusing
III Habitat and community
13. Modification of ecosystems or ecotones, including community
modification
structure and/or species composition
the assessment on the impacts of fi ve pre-defi ned concerns namely;
Freshwater shortage, Pollution, Habitat and community modifi cation,
14. Overexploitation
15. Excessive by-catch and discards
IV Unsustainable
Unsustainable exploitation of fi sh and other living resources and Global
16. Destructive fishing practices
exploitation of fish and
change, in transboundary waters. Considering the diverse range of
17. Decreased viability of stock through pollution and disease
other living resources
18. Impact on biological and genetic diversity
elements encompassed by each concern, assessing the magnitude of
19. Changes in hydrological cycle
the impacts caused by these concerns was facilitated by evaluating the
20. Sea level change
V Global change
impacts of 22 specifi c issues that were grouped within these concerns
21. Increased uv-b radiation as a result of ozone depletion
22. Changes in ocean CO2 source/sink function
(see Table 1).
THE GIWA METHODOLOGY
vii

political boundaries but were instead, generally defi ned by a large but
T
ransboundar
The GIWA approach
discrete drainage basin that also included the coastal marine waters into
which the basin discharges. In many cases, the marine areas examined
1
Scaling
st
W
o
D
e
during the assessment coincided with the Large Marine Ecosystems
rkshop
tailed
y
D
(LMEs) defi ned by the US National Atmospheric and Oceanographic
iagnostic
A
s
Scoping
sessment
Administration (NOAA). As a consequence, scaling should be a
relatively straight-forward task that involves the inspection of the
Analysis
boundaries that were proposed for the region during the preparatory
Causal Chain
2 nd
Analysis
phase of GIWA to ensure that they are appropriate and that there are
W
orkshop
no important overlaps or gaps with neighbouring regions. When the
Policy Option
proposed boundaries were found to be inadequate, the boundaries of
Analysis
the region were revised according to the recommendations of experts
from both within the region and from adjacent regions so as to ensure
that any changes did not result in the exclusion of areas from the GIWA.
Once the regional boundary was defi ned, regional teams identifi ed all
SAP
the transboundary elements of the aquatic environment within the
SAP
region and determined if these elements could be assessed as a single
Figure 1
Illustration of the relationship between the GIWA
coherent aquatic system or if there were two or more independent
approach and other projects implemented within the
systems that should be assessed separately.
GEF International Waters (IW) portfolio.
The GIWA is a logical contiguous process that defi nes the geographic
Scoping ş Assessing the GIWA concerns
region to be assessed, identifi es and prioritises particularly problems
Scoping is an assessment of the severity of environmental and socio-
based on the magnitude of their impacts on the environment and
economic impacts caused by each of the fi ve pre-defi ned GIWA concerns
human societies in the region, determines the root causes of those
and their constituent issues (Table 1). It is not designed to provide an
problems and, fi nally, assesses various policy options that addresses
exhaustive review of water-related problems that exist within each region,
those root causes in order to reverse negative trends in the condition
but rather it is a mechanism to identify the most urgent problems in the
of the aquatic environment. These four steps, referred to as Scaling,
region and prioritise those for remedial actions. The priorities determined
Scoping, Causal chain analysis and Policy options analysis, are
by Scoping are therefore one of the main outputs of the GIWA project.
summarised below and are described in their entirety in two volumes:
GIWA Methodology Stage 1: Scaling and Scoping; and GIWA Methodology:
Focusing the assessment on pre-defi ned concerns and issues ensured
Detailed Assessment, Causal Chain Analysis and Policy Options Analysis.
the comparability of the results between diff erent regions. In addition, to
Generally, the components of the GIWA methodology are aligned
ensure the long-term applicability of the options that are developed to
with the framework adopted by the GEF for Transboundary Diagnostic
mitigate these problems, Scoping not only assesses the current impacts
Analyses (TDAs) and Strategic Action Programmes (SAPs) (Figure 1) and
of these concerns and issues but also the probable future impacts
assume a broad spectrum of transboundary infl uences in addition to
according to the "most likely scenario" which considered demographic,
those associated with the physical movement of water across national
economic, technological and other relevant changes that will potentially
borders.
infl uence the aquatic environment within the region by 2020.
Scaling ş Defining the geographic extent
The magnitude of the impacts caused by each issue on the
of the region
environment and socio-economic indicators was assessed over the
Scaling is the fi rst stage of the assessment and is the process by which
entire region using the best available information from a wide range of
the geographic scale of the assessment is defi ned. In order to facilitate
sources and the knowledge and experience of the each of the experts
the implementation of the GIWA, the globe was divided during the
comprising the regional team. In order to enhance the comparability
design phase of the project into 66 contiguous regions. Considering the
of the assessment between diff erent regions and remove biases
transboundary nature of many aquatic resources and the transboundary
in the assessment caused by diff erent perceptions of and ways to
focus of the GIWA, the boundaries of the regions did not comply with
communicate the severity of impacts caused by particular issues, the
viii
REGIONAL ASSESSMENTS
results were distilled and reported as standardised scores according to
Table 2
Example of environmental impact assessment of
Freshwater shortage.
the following four point scale:
Weight
0 = no known impact
Environmental
Environmental issues
Score
Weight %
averaged
concerns
1 = slight impact
score
2
=
moderate
impact
1. Modification of stream flow
1
20
Freshwater shortage
1.50
3 = severe impact
2. Pollution of existing supplies
2
50
The attributes of each score for each issue were described by a detailed
3. Changes in the water table
1
30
set of pre-defi ned criteria that were used to guide experts in reporting
Table 3
Example of Health impacts assessment linked to one of
the results of the assessment. For example, the criterion for assigning
the GIWA concerns.
a score of 3 to the issue Loss of ecosystems or ecotones is: "Permanent
Criteria for Health impacts
Raw score
Score
Weight %
destruction of at least one habitat is occurring such as to have reduced their
Very small
Very large
surface area by >30% during the last 2-3 decades". The full list of criteria is
Number of people affected
2
50
0 1 2 3
presented at the end of the chapter, Table 5a-e. Although the scoring
Minimum
Severe
Degree of severity
2
30
0 1 2 3
inevitably includes an arbitrary component, the use of predefi ned
Occasion/Short
Continuous
Frequency/Duration
2
20
0 1 2 3
criteria facilitates comparison of impacts on a global scale and also
Weight average score for Health impacts
2
encouraged consensus of opinion among experts.
The trade-off associated with assessing the impacts of each concern
After all 22 issues and associated socio-economic impacts have
and their constituent issues at the scale of the entire region is that spatial
been scored, weighted and averaged, the magnitude of likely future
resolution was sometimes low. Although the assessment provides a
changes in the environmental and socio-economic impacts of each
score indicating the severity of impacts of a particular issue or concern
of the fi ve concerns on the entire region is assessed according to the
on the entire region, it does not mean that the entire region suff ers
most likely scenario which describes the demographic, economic,
the impacts of that problem. For example, eutrophication could be
technological and other relevant changes that might infl uence the
identifi ed as a severe problem in a region, but this does not imply that all
aquatic environment within the region by 2020.
waters in the region suff er from severe eutrophication. It simply means
that when the degree of eutrophication, the size of the area aff ected,
In order to prioritise among GIWA concerns within the region and
the socio-economic impacts and the number of people aff ected is
identify those that will be subjected to causal chain and policy options
considered, the magnitude of the overall impacts meets the criteria
analysis in the subsequent stages of the GIWA, the present and future
defi ning a severe problem and that a regional action should be initiated
scores of the environmental and socio-economic impacts of each
in order to mitigate the impacts of the problem.
concern are tabulated and an overall score calculated. In the example
presented in Table 4, the scoping assessment indicated that concern III,
When each issue has been scored, it was weighted according to the relative
Habitat and community modifi cation, was the priority concern in this
contribution it made to the overall environmental impacts of the concern
region. The outcome of this mathematic process was reconciled against
and a weighted average score for each of the fi ve concerns was calculated
the knowledge of experts and the best available information in order
(Table 2). Of course, if each issue was deemed to make equal contributions,
to ensure the validity of the conclusion.
then the score describing the overall impacts of the concern was simply the
arithmetic mean of the scores allocated to each issue within the concern.
In some cases however, this process and the subsequent participatory
In addition, the socio-economic impacts of each of the fi ve major
discussion did not yield consensus among the regional experts
concerns were assessed for the entire region. The socio-economic
regarding the ranking of priorities. As a consequence, further analysis
impacts were grouped into three categories; Economic impacts,
was required. In such cases, expert teams continued by assessing the
Health impacts and Other social and community impacts (Table 3). For
relative importance of present and potential future impacts and assign
each category, an evaluation of the size, degree and frequency of the
weights to each. Afterwards, the teams assign weights indicating the
impact was performed and, once completed, a weighted average score
relative contribution made by environmental and socio-economic
describing the overall socio-economic impacts of each concern was
factors to the overall impacts of the concern. The weighted average
calculated in the same manner as the overall environmental score.
score for each concern is then recalculated taking into account
THE GIWA METHODOLOGY
ix
Table 4
Example of comparative environmental and socio-economic impacts of each major concern, presently and likely in year 2020.
Types of impacts
Environmental score
Economic score
Human health score
Social and community score
Concern
Overall score
Present (a)
Future (b)
Present (c)
Future (d)
Present (e)
Future (f)
Present (g)
Future (h)
Freshwater shortage
1.3
2.3
2.7
2.8
2.6
3.0
1.8
2.2
2.3
Pollution
1.5
2.0
2.0
2.3
1.8
2.3
2.0
2.3
2.0
Habitat and community
2.0
3.0
2.4
3.0
2.4
2.8
2.3
2.7
2.6
modification
Unsustainable exploitation of fish
1.8
2.2
2.0
2.1
2.0
2.1
2.4
2.5
2.1
and other living resources
Global change
0.8
1.0
1.5
1.7
1.5
1.5
1.0
1.0
1.2
the relative contributions of both present and future impacts and
should be regarded as a framework to guide the analysis, rather than
environmental and socio-economic factors. The outcome of these
as a set of detailed instructions. Secondly, in an ideal setting, a causal
additional analyses was subjected to further discussion to identify
chain would be produced by a multidisciplinary group of specialists
overall priorities for the region.
that would statistically examine each successive cause and study its
links to the problem and to other causes. However, this approach (even
Finally, the assessment recognises that each of the fi ve GIWA concerns
if feasible) would use far more resources and time than those available
are not discrete but often interact. For example, pollution can destroy
to GIWA1. For this reason, it has been necessary to develop a relatively
aquatic habitats that are essential for fi sh reproduction which, in turn,
simple and practical analytical model for gathering information to
can cause declines in fi sh stocks and subsequent overexploitation. Once
assemble meaningful causal chains.
teams have ranked each of the concerns and determined the priorities
for the region, the links between the concerns are highlighted in order
Conceptual model
to identify places where strategic interventions could be applied to
A causal chain is a series of statements that link the causes of a problem
yield the greatest benefi ts for the environment and human societies
with its eff ects. Recognising the great diversity of local settings and the
in the region.
resulting diffi
culty in developing broadly applicable policy strategies,
the GIWA CCA focuses on a particular system and then only on those
Causal chain analysis
issues that were prioritised during the scoping assessment. The
Causal Chain Analysis (CCA) traces the cause-eff ect pathways from the
starting point of a particular causal chain is one of the issues selected
socio-economic and environmental impacts back to their root causes.
during the Scaling and Scoping stages and its related environmental
The GIWA CCA aims to identify the most important causes of each
and socio-economic impacts. The next element in the GIWA chain is
concern prioritised during the scoping assessment in order to direct
the immediate cause; defi ned as the physical, biological or chemical
policy measures at the most appropriate target in order to prevent
variable that produces the GIWA issue. For example, for the issue of
further degradation of the regional aquatic environment.
eutrophication the immediate causes may be, inter alia:
Enhanced nutrient inputs;
Root causes are not always easy to identify because they are often
Increased
recycling/mobilisation;
spatially or temporally separated from the actual problems they
Trapping of nutrients (e.g. in river impoundments);
cause. The GIWA CCA was developed to help identify and understand
Run-off and stormwaters
the root causes of environmental and socio-economic problems
in international waters and is conducted by identifying the human
Once the relevant immediate cause(s) for the particular system has
activities that cause the problem and then the factors that determine
(have) been identifi ed, the sectors of human activity that contribute
the ways in which these activities are undertaken. However, because
most signifi cantly to the immediate cause have to be determined.
there is no universal theory describing how root causes interact to
Assuming that the most important immediate cause in our example
create natural resource management problems and due to the great
had been increased nutrient concentrations, then it is logical that the
variation of local circumstances under which the methodology will
most likely sources of those nutrients would be the agricultural, urban
be applied, the GIWA CCA is not a rigidly structured assessment but
or industrial sectors. After identifying the sectors that are primarily
1 This does not mean that the methodology ignores statistical or quantitative studies; as has already been pointed out, the available evidence that justifies the assumption of causal links should
be provided in the assessment.
x
REGIONAL ASSESSMENTS
responsible for the immediate causes, the root causes acting on those
The policy options recommended by the GIWA are only contributions
sectors must be determined. For example, if agriculture was found to
to the larger policy process and, as such, the GIWA methodology
be primarily responsible for the increased nutrient concentrations, the
developed to test the performance of various options under the
root causes could potentially be:
diff erent circumstances has been kept simple and broadly applicable.
Economic (e.g. subsidies to fertilisers and agricultural products);
Legal (e.g. inadequate regulation);
Global International Waters Assessment
Failures in governance (e.g. poor enforcement); or
Technology or knowledge related (e.g. lack of aff ordable substitutes
for fertilisers or lack of knowledge as to their application).
Once the most relevant root causes have been identifi ed, an
explanation, which includes available data and information, of how
they are responsible for the primary environmental and socio-economic
problems in the region should be provided.
Policy option analysis
Despite considerable eff ort of many Governments and other
organisations to address transboundary water problems, the evidence
indicates that there is still much to be done in this endeavour. An
important characteristic of GIWA's Policy Option Analysis (POA) is that
its recommendations are fi rmly based on a better understanding of
the root causes of the problems. Freshwater scarcity, water pollution,
overexploitation of living resources and habitat destruction are very
complex phenomena. Policy options that are grounded on a better
understanding of these phenomena will contribute to create more
eff ective societal responses to the extremely complex water related
transboundary problems. The core of POA in the assessment consists
of two tasks:
Construct policy options
Policy options are simply diff erent courses of action, which are not
always mutually exclusive, to solve or mitigate environmental and
socio-economic problems in the region. Although a multitude of
diff erent policy options could be constructed to address each root
cause identifi ed in the CCA, only those few policy options that have
the greatest likelihood of success were analysed in the GIWA.
Select and apply the criteria on which the policy options will be
evaluated
Although there are many criteria that could be used to evaluate any
policy option, GIWA focuses on:
Eff ectiveness (certainty of result)
Effi
ciency (maximisation of net benefi ts)
Equity (fairness of distributional impacts)
Practical
criteria
(political
acceptability,
implementation
feasibility).
THE GIWA METHODOLOGY
xi
Table 5a: Scoring criteria for environmental impacts of Freshwater shortage
Issue
Score 0 = no known impact
Score 1 = slight impact
Score 2 = moderate impact
Score 3 = severe impact
Issue 1: Modification
No evidence of modification of stream
There is a measurably changing trend in
Significant downward or upward trend
Annual discharge of a river altered by more
of stream flow
flow.
annual river discharge at gauging stations
(more than 20% of the long term mean) in
than 50% of long term mean; or
"An increase or decrease
in a major river or tributary (basin >
annual discharges in a major river or tributary Loss of >50% of riparian or deltaic
in the discharge of
40 000 km2); or
draining a basin of >250 000 km2; or
wetlands over a period of not less than
streams and rivers
There is a measurable decrease in the area
Loss of >20% of flood plain or deltaic
40 years (through causes other than
as a result of human
of wetlands (other than as a consequence
wetlands through causes other than
conversion or artificial embankment); or
interventions on a local/
of conversion or embankment
conversion or artificial embankments; or
Significant increased siltation or erosion
regional scale (see Issue
construction); or
Significant loss of riparian vegetation (e.g.
due to changing in flow regime (other than
19 for flow alterations
There is a measurable change in the
trees, flood plain vegetation); or
normal fluctuations in flood plain rivers);
resulting from global
interannual mean salinity of estuaries or
Significant saline intrusion into previously
or
change) over the last 3-4
coastal lagoons and/or change in the mean
freshwater rivers or lagoons.
Loss of one or more anadromous or
decades."
position of estuarine salt wedge or mixing
catadromous fish species for reasons
zone; or
other than physical barriers to migration,
Change in the occurrence of exceptional
pollution or overfishing.
discharges (e.g. due to upstream
damming.
Issue 2: Pollution of
No evidence of pollution of surface and
Any monitored water in the region does
Water supplies does not meet WHO or
River draining more than 10% of the basin
existing supplies
ground waters.
not meet WHO or national drinking water
national drinking water standards in more
have suffered polysaprobic conditions, no
"Pollution of surface
criteria, other than for natural reasons; or
than 30% of the region; or
longer support fish, or have suffered severe
and ground fresh waters
There have been reports of one or more
There are one or more reports of fish kills
oxygen depletion
supplies as a result of
fish kills in the system due to pollution
due to pollution in any river draining a
Severe pollution of other sources of
point or diffuse sources"
within the past five years.
basin of >250 000 km2 .
freshwater (e.g. groundwater)
Issue 3: Changes in the No evidence that abstraction of water from Several wells have been deepened because Clear evidence of declining base flow in
Aquifers are suffering salinisation over
water table
aquifers exceeds natural replenishment.
of excessive aquifer draw-down; or
rivers in semi-arid areas; or
regional scale; or
"Changes in aquifers
Several springs have dried up; or
Loss of plant species in the past decade,
Perennial springs have dried up over
as a direct or indirect
Several wells show some salinisation.
that depend on the presence of ground
regionally significant areas; or
consequence of human
water; or
Some aquifers have become exhausted
activity"
Wells have been deepened over areas of
hundreds of km2;or
Salinisation over significant areas of the
region.
Table 5b: Scoring criteria for environmental impacts of Pollution
Issue
Score 0 = no known impact
Score 1 = slight impact
Score 2 = moderate impact
Score 3 = severe impact
Issue 4:
Normal incidence of bacterial related
There is minor increase in incidence of
Public health authorities aware of marked
There are large closure areas or very
Microbiological
gastroenteric disorders in fisheries product
bacterial related gastroenteric disorders
increase in the incidence of bacterial
restrictive advisories affecting the
pollution
consumers and no fisheries closures or
in fisheries product consumers but no
related gastroenteric disorders in fisheries
marketability of fisheries products; or
"The adverse effects of
advisories.
fisheries closures or advisories.
product consumers; or
There exists widespread public or tourist
microbial constituents of
There are limited area closures or
awareness of hazards resulting in
human sewage released
advisories reducing the exploitation or
major reductions in the exploitation or
to water bodies."
marketability of fisheries products.
marketability of fisheries products.
Issue 5:
No visible effects on the abundance and
Increased abundance of epiphytic algae; or
Increased filamentous algal production
High frequency (>1 event per year), or
Eutrophication
distributions of natural living resource
A statistically significant trend in
resulting in algal mats; or
intensity, or large areas of periodic hypoxic
"Artificially enhanced
distributions in the area; and
decreased water transparency associated
Medium frequency (up to once per year)
conditions, or high frequencies of fish and
primary productivity in
No increased frequency of hypoxia1 or
with algal production as compared with
of large-scale hypoxia and/or fish and
zoobenthos mortality events or harmful
receiving water basins
fish mortality events or harmful algal
long-term (>20 year) data sets; or
zoobenthos mortality events and/or
algal blooms; or
related to the increased
blooms associated with enhanced primary
Measurable shallowing of the depth range
harmful algal blooms.
Significant changes in the littoral
availability or supply
production; and
of macrophytes.
community; or
of nutrients, including
No evidence of periodically reduced
Presence of hydrogen sulphide in
cultural eutrophication
dissolved oxygen or fish and zoobenthos
historically well oxygenated areas.
in lakes."
mortality; and
No evident abnormality in the frequency of
algal blooms.
xii
REGIONAL ASSESSMENTS
Issue 6: Chemical
No known or historical levels of chemical
Some chemical contaminants are
Some chemical contaminants are above
Chemical contaminants are above
pollution
contaminants except background levels of
detectable but below threshold limits
threshold limits defined for the country or
threshold limits defined for the country or
"The adverse effects of
naturally occurring substances; and
defined for the country or region; or
region; or
region; and
chemical contaminants
No fisheries closures or advisories due to
Restricted area advisories regarding
Large area advisories by public health
Public health and public awareness of
released to standing or
chemical pollution; and
chemical contamination of fisheries
authorities concerning fisheries product
fisheries contamination problems with
marine water bodies
No incidence of fisheries product tainting;
products.
contamination but without associated
associated reductions in the marketability
as a result of human
and
catch restrictions or closures; or
of such products either through the
activities. Chemical
No unusual fish mortality events.
If there is no available data use the following
High mortalities of aquatic species near
imposition of limited advisories or by area
contaminants are
criteria:
outfalls.
closures of fisheries; or
here defined as
If there is no available data use the following
Some use of pesticides in small areas; or
Large-scale mortalities of aquatic species.
compounds that are
criteria:
Presence of small sources of dioxins or
If there is no available data use the following
toxic or persistent or
No use of pesticides; and
furans (e.g., small incineration plants or
criteria:
If there is no available data use the following
bioaccumulating."
No sources of dioxins and furans; and
bleached kraft/pulp mills using chlorine);
Large-scale use of pesticides in agriculture
criteria:
No regional use of PCBs; and
or
and forestry; or
Indications of health effects resulting
No bleached kraft pulp mills using chlorine Some previous and existing use of PCBs
Presence of major sources of dioxins or
from use of pesticides; or
bleaching; and
and limited amounts of PCB-containing
furans such as large municipal or industrial Known emissions of dioxins or furans from
No use or sources of other contaminants.
wastes but not in amounts invoking local
incinerators or large bleached kraft pulp
incinerators or chlorine bleaching of pulp;
concerns; or
mills; or
or
Presence of other contaminants.
Considerable quantities of waste PCBs in
Known contamination of the environment
the area with inadequate regulation or has
or foodstuffs by PCBs; or
invoked some public concerns; or
Known contamination of the environment
Presence of considerable quantities of
or foodstuffs by other contaminants.
other contaminants.
Issue 7: Suspended
No visible reduction in water transparency; Evidently increased or reduced turbidity
Markedly increased or reduced turbidity
Major changes in turbidity over wide or
solids
and
in streams and/or receiving riverine and
in small areas of streams and/or receiving
ecologically significant areas resulting
"The adverse effects of
No evidence of turbidity plumes or
marine environments but without major
riverine and marine environments; or
in markedly changed biodiversity or
modified rates of release
increased siltation; and
changes in associated sedimentation or
Extensive evidence of changes in
mortality in benthic species due to
of suspended particulate No evidence of progressive riverbank,
erosion rates, mortality or diversity of flora
sedimentation or erosion rates; or
excessive sedimentation with or without
matter to water bodies
beach, other coastal or deltaic erosion.
and fauna; or
Changes in benthic or pelagic biodiversity
concomitant changes in the nature of
resulting from human
Some evidence of changes in benthic or
in areas due to sediment blanketing or
deposited sediments (i.e., grain-size
activities"
pelagic biodiversity in some areas due
increased turbidity.
composition/redox); or
to sediment blanketing or increased
Major change in pelagic biodiversity or
turbidity.
mortality due to excessive turbidity.
Issue 8: Solid wastes
No noticeable interference with trawling
Some evidence of marine-derived litter on
Widespread litter on beaches giving rise to
Incidence of litter on beaches sufficient
"Adverse effects
activities; and
beaches; or
public concerns regarding the recreational
to deter the public from recreational
associated with the
No noticeable interference with the
Occasional recovery of solid wastes
use of beaches; or
activities; or
introduction of solid
recreational use of beaches due to litter;
through trawling activities; but
High frequencies of benthic litter recovery
Trawling activities untenable because of
waste materials into
and
Without noticeable interference with
and interference with trawling activities;
benthic litter and gear entanglement; or
water bodies or their
No reported entanglement of aquatic
trawling and recreational activities in
or
Widespread entanglement and/or
environs."
organisms with debris.
coastal areas.
Frequent reports of entanglement/
suffocation of aquatic species by litter.
suffocation of species by litter.
Issue 9: Thermal
No thermal discharges or evidence of
Presence of thermal discharges but
Presence of thermal discharges with large
Presence of thermal discharges with large
"The adverse effects
thermal effluent effects.
without noticeable effects beyond
mixing zones having reduced productivity
mixing zones with associated mortalities,
of the release of
the mixing zone and no significant
or altered biodiversity; or
substantially reduced productivity or
aqueous effluents at
interference with migration of species.
Evidence of reduced migration of species
noticeable changes in biodiversity; or
temperatures exceeding
due to thermal plume.
Marked reduction in the migration of
ambient temperature
species due to thermal plumes.
in the receiving water
body."
Issue 10: Radionuclide
No radionuclide discharges or nuclear
Minor releases or fallout of radionuclides
Minor releases or fallout of radionuclides
Substantial releases or fallout of
"The adverse effects of
activities in the region.
but with well regulated or well-managed
under poorly regulated conditions that do
radionuclides resulting in excessive
the release of radioactive
conditions complying with the Basic Safety
not provide an adequate basis for public
exposures to humans or animals in relation
contaminants and
Standards.
health assurance or the protection of
to those recommended under the Basic
wastes into the aquatic
aquatic organisms but without situations
Safety Standards; or
environment from
or levels likely to warrant large scale
Some indication of situations or exposures
human activities."
intervention by a national or international
warranting intervention by a national or
authority.
international authority.
Issue 11: Spills
No evidence of present or previous spills of
Some evidence of minor spills of hazardous Evidence of widespread contamination
Widespread contamination by hazardous
"The adverse effects
hazardous material; or
materials in small areas with insignificant
by hazardous or aesthetically displeasing
or aesthetically displeasing materials
of accidental episodic
No evidence of increased aquatic or avian
small-scale adverse effects one aquatic or
materials assumed to be from spillage
from frequent spills resulting in major
releases of contaminants
species mortality due to spills.
avian species.
(e.g. oil slicks) but with limited evidence of
interference with aquatic resource
and materials to the
widespread adverse effects on resources or
exploitation or coastal recreational
aquatic environment
amenities; or
amenities; or
as a result of human
Some evidence of aquatic or avian species
Significant mortality of aquatic or avian
activities."
mortality through increased presence of
species as evidenced by large numbers of
contaminated or poisoned carcasses on
contaminated carcasses on beaches.
beaches.
THE GIWA METHODOLOGY
xiii
Table 5c: Scoring criteria for environmental impacts of Habitat and community modification
Issue
Score 0 = no known impact
Score 1 = slight impact
Score 2 = moderate impact
Score 3 = severe impact
Issue 12: Loss of ecosystems or
There is no evidence of loss of
There are indications of fragmentation Permanent destruction of at least one
Permanent destruction of at least one
ecotones
ecosystems or habitats.
of at least one of the habitats.
habitat is occurring such as to have
habitat is occurring such as to have
"The complete destruction of aquatic
reduced their surface area by up to 30
reduced their surface area by >30%
habitats. For the purpose of GIWA
% during the last 2-3 decades.
during the last 2-3 decades.
methodology, recent loss will be
measured as a loss of pre-defined
habitats over the last 2-3 decades."
Issue 13: Modification of
No evidence of change in species
Evidence of change in species
Evidence of change in species
Evidence of change in species
ecosystems or ecotones, including
complement due to species extinction
complement due to species extinction
complement due to species extinction
complement due to species extinction
community structure and/or species
or introduction; and
or introduction
or introduction; and
or introduction; and
composition
No changing in ecosystem function
Evidence of change in population
Evidence of change in population
"Modification of pre-defined habitats
and services.
structure or change in functional group
structure or change in functional group
in terms of extinction of native species,
composition or structure
composition or structure; and
occurrence of introduced species and
Evidence of change in ecosystem
changing in ecosystem function and
services2.
services over the last 2-3 decades."
2 Constanza, R. et al. (1997). The value of the world ecosystem services and natural capital, Nature 387:253-260.
Table 5d: Scoring criteria for environmental impacts of Unsustainable exploitation of fish and other
living resources
Issue
Score 0 = no known impact
Score 1 = slight impact
Score 2 = moderate impact
Score 3 = severe impact
Issue 14: Overexploitation
No harvesting exists catching fish
Commercial harvesting exists but there One stock is exploited beyond MSY
More than one stock is exploited
"The capture of fish, shellfish or marine
(with commercial gear for sale or
is no evidence of over-exploitation.
(maximum sustainable yield) or is
beyond MSY or is outside safe
invertebrates at a level that exceeds the
subsistence).
outside safe biological limits.
biological limits.
maximum sustainable yield of the stock."
Issue 15: Excessive by-catch and
Current harvesting practices show no
Up to 30% of the fisheries yield (by
30-60% of the fisheries yield consists
Over 60% of the fisheries yield is
discards
evidence of excessive by-catch and/or
weight) consists of by-catch and/or
of by-catch and/or discards.
by-catch and/or discards; or
"By-catch refers to the incidental capture
discards.
discards.
Noticeable incidence of capture of
of fish or other animals that are not the
endangered species.
target of the fisheries. Discards refers
to dead fish or other animals that are
returned to the sea."
Issue 16: Destructive fishing
No evidence of habitat destruction due Habitat destruction resulting in
Habitat destruction resulting in
Habitat destruction resulting in
practices
to fisheries practices.
changes in distribution of fish or
moderate reduction of stocks or
complete collapse of a stock or far
"Fishing practices that are deemed to
shellfish stocks; or
moderate changes of the environment;
reaching changes in the environment;
produce significant harm to marine,
Trawling of any one area of the seabed
or
or
lacustrine or coastal habitats and
is occurring less than once per year.
Trawling of any one area of the seabed
Trawling of any one area of the seabed
communities."
is occurring 1-10 times per year; or
is occurring more than 10 times per
Incidental use of explosives or poisons
year; or
for fishing.
Widespread use of explosives or
poisons for fishing.
Issue 17: Decreased viability of
No evidence of increased incidence of
Increased reports of diseases without
Declining populations of one or more
Collapse of stocks as a result of
stocks through contamination and
fish or shellfish diseases.
major impacts on the stock.
species as a result of diseases or
diseases or contamination.
disease
contamination.
"Contamination or diseases of feral (wild)
stocks of fish or invertebrates that are a
direct or indirect consequence of human
action."
Issue 18: Impact on biological and
No evidence of deliberate or accidental Alien species introduced intentionally
Measurable decline in the population
Extinction of native species or local
genetic diversity
introductions of alien species; and
or accidentally without major changes
of native species or local stocks as a
stocks as a result of introductions
"Changes in genetic and species diversity No evidence of deliberate or accidental
in the community structure; or
result of introductions (intentional or
(intentional or accidental); or
of aquatic environments resulting from
introductions of alien stocks; and
Alien stocks introduced intentionally
accidental); or
Major changes (>20%) in the genetic
the introduction of alien or genetically
No evidence of deliberate or accidental
or accidentally without major changes
Some changes in the genetic
composition of stocks (e.g. as a result
modified species as an intentional or
introductions of genetically modified
in the community structure; or
composition of stocks (e.g. as a result
of escapes from aquaculture replacing
unintentional result of human activities
species.
Genetically modified species
of escapes from aquaculture replacing
the wild stock).
including aquaculture and restocking."
introduced intentionally or
the wild stock).
accidentally without major changes in
the community structure.
xiv
REGIONAL ASSESSMENTS
Table 5e: Scoring criteria for environmental impacts of Global change
Issue
Score 0 = no known impact
Score 1 = slight impact
Score 2 = moderate impact
Score 3 = severe impact
Issue 19: Changes in hydrological
No evidence of changes in hydrological Change in hydrological cycles due
Significant trend in changing
Loss of an entire habitat through
cycle and ocean circulation
cycle and ocean/coastal current due to
to global change causing changes
terrestrial or sea ice cover (by
desiccation or submergence as a result
"Changes in the local/regional water
global change.
in the distribution and density of
comparison with a long-term time
of global change; or
balance and changes in ocean and coastal
riparian terrestrial or aquatic plants
series) without major downstream
Change in the tree or lichen lines; or
circulation or current regime over the
without influencing overall levels of
effects on river/ocean circulation or
Major impacts on habitats or
last 2-3 decades arising from the wider
productivity; or
biological diversity; or
biodiversity as the result of increasing
problem of global change including
Some evidence of changes in ocean
Extreme events such as flood and
frequency of extreme events; or
ENSO."
or coastal currents due to global
drought are increasing; or
Changing in ocean or coastal currents
change but without a strong effect on
Aquatic productivity has been altered
or upwelling regimes such that plant
ecosystem diversity or productivity.
as a result of global phenomena such
or animal populations are unable to
as ENSO events.
recover to their historical or stable
levels; or
Significant changes in thermohaline
circulation.
Issue 20: Sea level change
No evidence of sea level change.
Some evidences of sea level change
Changed pattern of coastal erosion due Major loss of coastal land areas due to
"Changes in the last 2-3 decades in the
without major loss of populations of
to sea level rise has became evident; or
sea-level change or sea-level induced
annual/seasonal mean sea level as a
organisms.
Increase in coastal flooding events
erosion; or
result of global change."
partly attributed to sea-level rise
Major loss of coastal or intertidal
or changing prevailing atmospheric
populations due to sea-level change or
forcing such as atmospheric pressure
sea level induced erosion.
or wind field (other than storm
surges).
Issue 21: Increased UV-B radiation as No evidence of increasing effects
Some measurable effects of UV/B
Aquatic community structure is
Measured/assessed effects of UV/B
a result of ozone depletion
of UV/B radiation on marine or
radiation on behavior or appearance of
measurably altered as a consequence
irradiation are leading to massive loss
"Increased UV-B flux as a result polar
freshwater organisms.
some aquatic species without affecting
of UV/B radiation; or
of aquatic communities or a significant
ozone depletion over the last 2-3
the viability of the population.
One or more aquatic populations are
change in biological diversity.
decades."
declining.
Issue 22: Changes in ocean CO
No measurable or assessed changes
Some reasonable suspicions that
Some evidences that the impacts
Evidences that the changes in
2
source/sink function
in CO source/sink function of aquatic
current global change is impacting the
of global change have altered the
source/sink function of the aquatic
2
"Changes in the capacity of aquatic
system.
aquatic system sufficiently to alter its
source/sink function for CO of aquatic
systems in the region are sufficient to
2
systems, ocean as well as freshwater, to
source/sink function for CO .
systems in the region by at least 10%.
cause measurable change in global CO
2
2
generate or absorb atmospheric CO as a
balance.
2
direct or indirect consequence of global
change over the last 2-3 decades."
THE GIWA METHODOLOGY
xv